
Toward Predictive Maintenance in a Cloud Manufacturing ...
170
DOCTORAL DISSERTATION TOWARD PREDICTIVE MAINTENANCE IN A CLOUD MANUFACTURING ENVIRONMENT A population-wide approach BERNARD SCHMIDT Industrial Informatics
-
Upload
khangminh22 -
Category
Documents
-
view
0 -
download
0
Transcript of Toward Predictive Maintenance in a Cloud Manufacturing ...

D O C T O R A L D I S S E R T A T I O N
TOWARD PREDICTIVE MAINTENANCE IN A CLOUD MANUFACTURING ENVIRONMENT A population-wide approach
BERNARD SCHMIDT Industrial Informatics


TOWARD PREDICTIVE
MAINTENANCE IN A CLOUD
MANUFACTURING ENVIRONMENT
A population-wide approach


D O CT O R A L D I S S E R T A T I O N
TOWARD PREDICTIVE MAINTENANCE IN A CLOUD MANUFACTURING
ENVIRONMENT
A population-wide approach
BERNARD SCHMIDT Industrial Informatics

Bernard Schmidt, 2018
Title: Toward Predictive Maintenance in a Cloud Manufacturing Environment
A population-wide approach
University of Skövde 2018, Sweden
www.his.se
Printer: BrandFactory AB, Göteborg
ISBN 978-91-984187-2-9 Dissertation Series, No. 20 (2018)
I
ABSTRACT
The research presented in this thesis is focused on improving industrial maintenance by using better decision support that is based on a wider range of input information. The core objective is to research how to integrate information from a population of similar monitored objects. The data to be aggregated comes from multiple disparate sources including double ball-bar circularity tests, the maintenance management sys-tem, and the machine tool’s controller. Various data processing and machine learning methods are applied and evaluated. Finally, an economic evaluation of the proposed approach is presented. The work performed is presented in five appended papers.
Paper I presents an investigation of cloud-based predictive maintenance concepts and their potential benefits and challenges.
Paper II presents the results of an investigation of available and potentially useful data from the perspective of predictive analytics with a focus on the linear axes of machine tools.
Paper III proposes a semantic framework for predictive maintenance, and investigates means of acquiring relevant information from different sources (i.e., ontology-based data retrieval).
Paper IV presents a method for data integration. The method is applied to data ob-tained from a real manufacturing setup. Simulation-based evaluation is used to com-pare results with a traditional time-based approach.
Paper V presents the results from additional simulation-based experiments based on the method from Paper IV. The aim is to improve the method and provide additional information that can support maintenance decision-making (e.g., determining the op-timal interval for inspections).
The method developed in this thesis is applied to a population of linear axes from a set of similar multipurpose machine tools. The linear axes of machine tools are very im-portant, as their performance directly affects machining quality. Measurements from circularity tests performed using a double ball-bar measuring device are combined with event and context information to build statistical failure and classification mod-els. Based on those models, a decision-making process is proposed and evaluated. In the analysed case, the proposed approach leads to direct maintenance cost reduction of around 40 % compared to a time-based approach.


III
SAMMANFATTNING
Forskningen som presenteras i denna avhandling fokuserar på att förbättra industri-ellt underhåll genom att använda bättre beslutsstöd som bygger på ett bredare utbud av information. Huvudmålet är att undersöka hur man integrerar information från en population av liknande övervakade objekt. De data som ska aggregeras kommer från flera olika källor, såsom ballbarmätning, underhållssystemet och information från verktygsmaskinernas kontroller. Olika databehandlings- och maskininlärningsme-toder tillämpas och utvärderas. Slutligen presenteras en ekonomisk utvärdering av det föreslagna tillvägagångssättet. Det utförda arbetet presenteras i fem arbeten.
Papper I presenterar en undersökning av molnbaserade prediktiva underhållskoncept och deras potentiella fördelar och utmaningar.
Papper II presenterar resultaten av en undersökning av tillgängliga och potentiellt an-vändbara data för prediktiv analys med fokus på maskinverktygens linjära axlar.
I papper III föreslås ett semantiskt ramverk för förebyggande underhåll, vilket söker relevant information från olika källor (dvs. ontologi-baserad datainhämtning).
Papper IV presenterar en metod för dataintegration. Metoden tillämpas på data från ett maskinsystem i drift. Simulationsbaserad utvärdering av metoden används för att jämföra resultaten med den traditionella tidsbaserade metoden för förebyggande un-derhåll.
Papper V presenterar ytterligare resultat från simuleringsbaserade experiment baserat på metoden från papper IV. Syftet är att förbättra metoden och tillhandahålla extra information som kan stödja beslut gällande upplägg av underhåll (t.ex. definiera det optimala intervallet för inspektioner).
Metoden som utvecklats i denna avhandling tillämpas på en population av linjära axlar från en uppsättning liknande fleroperationsmaskiner. Maskinernas linjära axlar är mycket viktiga, eftersom deras prestanda direkt påverkar den producerade produk-tens kvalitet. Mätningar utförda med hjälp av en ballbarmätning kombineras med in-formation om händelser och maskinens kontext, för att definiera statistiska felbeteen-demodeller och klassificeringsmodeller. Baserat på dessa modeller föreslås en besluts-process som också utvärderas. I det analyserade fallet leder det föreslagna tillväga-gångssättet till en reduktion av direkta underhållskostnader på cirka 40 % jämfört med ett tidsbaserat förebyggande underhållsupplägg.


V
ACKNOWLEDGEMENTS
I want to express my gratitude to my main supervisor Professor Lihui Wang and my co-supervisors Professor Amos Ng, Professor Diego Galar, and Professor Ulf Sandberg for their generous help and guidance throughout this thesis.
I want also to thank my industrial supervisors Sven Wilhelmsson, Martin Asp, Roland Gustavsson, and Patrik Rempling for support in conducting this research in a real-world manufacturing setup.
I would like to thank all my colleagues in the Production and Automation Engineering Research Group at the University of Skövde for their feedback, cooperation and friend-ship. I am also grateful to all my fellow graduate students in the IPSI Research School for their support and helpful discussions.
Furthermore, I would like to gratefully acknowledge the financial support of the Uni-versity of Skövde, Volvo GTO, Volvo Cars, and the Knowledge Foundation through the IPSI Research School.
Finally, I would like to express my deepest gratitude to my dear Kasia for her under-standing and engagement. Without you this work would not have been possible.

VII
PUBLICATIONS
This list of publications for which the author is responsible is divided into those that directly contribute to this research (high relevance) and those that indirectly support it (lower relevance). Publications that are less relevant to the research but to which the author contributed during the research period are listed as “Other”.
PUBLICATIONS WITH HIGH RELEVANCE
Paper I
Schmidt, B., Wang, L. 2016. "Cloud-enhanced predictive maintenance", International
Journal of Advanced Manufacturing Technology, http://dx.doi.org/10.1007/s00170-016-
8983-8 (online ahead of print).
Paper II
Schmidt, B., Gandhi, K., Wang, L., Galar, D. 2017. "Context preparation for predictive ana-lytics: A case from manufacturing industry", Journal of Quality in Maintenance Engineer-
ing 23(3), p.341–354.
Paper III
Schmidt, B., Wang, L., Galar, D. 2017. "Semantic framework for predictive maintenance in
a cloud environment", 10th Conference on Intelligent Computation in Manufacturing En-
gineering - CIRP ICME '16, Procedia CIRP 62, p. 583–588.
Paper IV
Schmidt, B., Gandhi, K., Wang, L., Ng, A.H.C. (journal draft). "Integration of events and
offline measurement data from a population of similar entities for condition monitoring",
to be submitted to International Journal of Computer Integrated Manufacturing, Special
Issue on Smart Cyber-Physical System Applications in Production and Logistics.
Paper V
Schmidt, B., Gandhi, K., Wang, L. (Accepted). "Diagnosis of machine tools: assessment
based on double ball-bar measurements from a population of similar machines", submit-
ted to the 51st CIRP Conference on Manufacturing Systems – CIRP CMS '18, 16-18 May,
Stockholm, Sweden.
VIII
PUBLICATIONS WITH LOWER RELEVANCE
1. Schmidt, B., Wang, L. (Accepted). “Predictive maintenance of machine tool linear axes:
A case from manufacturing industry”, Submitted to FAIM2018.
2. Schmidt, B., Galar, D., Wang, L. 2016. "Big data in maintenance decision support sys-tems: Aggregation of disparate data types", Proceedings of Euromaintenance 2016
3. Schmidt, B., Galar, D., Wang, L. 2015. "Context awareness in predictive maintenance"
in Kumar, U., Ahmadi, A., Verma, A. K. and Varde, P. (Eds.), Current Trends in Relia-
bility, Availability, Maintainability and Safety, Springer International Publishing, p.
197–211.
4. Schmidt, B., Wang, L. 2015. "Predictive maintenance: Literature review and future
trends", Proceedings of FAIM 2015, 23-26 June 2015, Wolverhampton, UK.
5. Schmidt, B., Wang, L. 2015. "Cloud-based predictive maintenance", Proceedings of
FAIM 2015, 23-26 June 2015, Wolverhampton, UK.
6. Schmidt, B., Galar, D., Wang, L. 2015. "Asset management evolution: From taxono-mies toward ontologies", Proceedings of Maintenance, Condition Monitoring and Di-
agnostics, Maintenance Performance Measurement and Management, Lahdelma, S.
and Palokangas, K. ( Eds.), Oulu, Finland: POHTO, 2015
7. Schmidt, B., Sandberg, U., Wang, L. 2014. "Next generation condition based predictive
maintenance", Proceedings of the 6th International Swedish Production Symposium
2014, 16-18 September 2014, Göteborg, Sweden.
OTHER PUBLICATIONS
1. Gandhi, K., Schmidt, B., Ng, A.H.C., (Accepted) "Towards data mining based decision support in manufacturing maintenance ", submitted to the 51st CIRP Conference on
Manufacturing Systems – CIRP CMS '18, 16-18 May, Stockholm, Sweden.
2. Wang, L., Mohammed, A., Wang, X.V., Schmidt, B. 2017. “Energy-efficient robot appli-
cation towards sustainable manufacturing”, International Journal of Computer Inte-
grated Manufacturing, http://dx.doi.org/10.1080/0951192X.2017.1379099 (online
ahead of print).
3. Mohammed, A., Schmidt, B., Wang, L. 2017. “Energy-efficient robot configuration for assembly”, ASME. Journal of Manufacturing Science and Engineering 139(5).
4. Mohammed, A., Schmidt, B., Wang, L. 2017. “Active collision avoidance for human-
robot collaboration driven by vision sensors”, International Journal of Computer Inte-
grated Manufacturing 30, p. 970-980.
5. Galar, D., Kans, M., Schmidt, B. 2016. “Big data in asset management: Knowledge dis-
covery in asset data by the means of data mining” in Koskinen, T. K., Kortelainen, H.,
Aaltonen, J., Uusitalo, T., Komonen, K., Mathew, J. and Laitinen, J. (Eds.), in Proceed-
ings of the 10th World Congress on Engineering Asset Management (WCEAM 2015),
Springer International Publishing, p. 161-171.
6. Wang, L., Mohammed, A., Wang, X.V., Schmidt, B. 2016. “Recent advancements of smart manufacturing: An example of energy-efficient robot”, Proceedings of FAIM
2016, 27-30 June, Seoul, Republic of Korea.
7. Wang, L., Schmidt, B., Givehchi, M., Adamson, G. 2015. “Robotic assembly planning
and control with enhanced adaptability through function blocks”, International Jour-
nal of Advanced Manufacturing Technology 77(1), p. 705-715.

IX
8. Sandberg, U., Schmidt, B., Wang, L. 2014. “Management of factory and maintenance
information for multiple production and product life-cycle phases”, Comadem 2014
9. Schmidt, B., Wang, L. 2014. “Depth camera based collision avoidance via active robot
control”, Journal of Manufacturing Systems 33(4), p. 711-718.
10. Schmidt, B., Wang, L. 2014. “Automatic work objects calibration via a global-local
camera system”, Robotics and Computer-Integrated Manufacturing 30(6), p. 678-683.
11. Mohammed, A., Schmidt, B., Wang, L., Gao, L. 2014. “Minimising energy consumption for robot arm movement”, The 8th International Conference on Digital Enterprise
Technology (DET2014), Stuttgart, Germany 2014
12. Wang, L., Schmidt, B., Nee, A.Y.C. 2013. “Vision-guided active collision avoidance for
human-robot collaboration”, Manufacturing Letters 1, p. 5-8.
13. Schmidt, B., Mohammed A. 2013. “Minimising energy consumption for robot arm
movement”, Proceedings of the International Conference on Advanced Manufacturing
Engineering and Technology NEWTECH, 27-30 October 2013, Stockholm, Sweden,
Volume 2, p. 125-134
14. Givehchi, M., Schmidt, B., Wang, L. 2013. “Knowledge-based operation planning and
machine control by function blocks in Web-DPP”, Proceedings of FAIM 2013.
15. Urbanek, J., Barszcz, T., Uhl, T., Staszewski, W.J., Beck, S.B.M., Schmidt, B. 2012 “Leak detection in gas pipelines using wavelet-based filtering”, Structural Health Mon-
itoring, 11, p. 405-412.
16. Schmidt, B., Wang, L. 2012 “Active Collision Avoidance for Human-Robot Collabortive
Manufacturing”, Proceedings of the 5th International Swedish Production Symposium,
6-8 November 2012, Linköping, Sweden.
17. Mohammed, A., Schmidt, B., Wang, L. “Remote monitoring and controlling for robotic
path following operations”, Proceedings of the 5th International Swedish Production
Symposium, 6-8 November 2012, Linköping, Sweden.
18. Schmidt, B., Wang, L. 2012, “Automatic Robot Calibration via a Global-Local Camera
System” Proceedings of FAIM 2012, 10-13 June, 2012, Helsinki, Finland.
19. Wang, L., Givehchi, M., Schmidt, B., Adamson, G. “Robotic Assembly Planning and Control System with Enhanced Adaptability”, 45th CIRP CMS Conference 2012, Proce-
dia CIRP 3, pp.173-178, 2012

XI
CONTENTS
1. INTRODUCTION .................................................................................................. 1 1.1 Structure of the thesis .................................................................................... 1 1.2 Background ................................................................................................... 1 1.3 Problem identification .................................................................................... 4
1.3.1 Double ball-bar measurements ........................................................... 5 1.4 Purpose of thIS research ............................................................................... 5 1.5 Aim and objectives ........................................................................................ 6 1.6 Research questions ....................................................................................... 6
1.6.1 Primary research questions ................................................................ 6 1.6.2 Secondary research question ............................................................. 6
1.7 Scope and delimitation of the study ............................................................... 6 1.8 Relationship between articles ........................................................................ 7
2. RESEARCH APPROACH ................................................................................... 13 2.1 Philosophy of science .................................................................................. 13 2.2 Research methodology ................................................................................ 13 2.3 Research process ........................................................................................ 15 2.4 Rigour and relevance .................................................................................. 16
3. FRAME OF REFERENCE .................................................................................. 21 3.1 Cloud Manufacturing ................................................................................... 21 3.2 Predictive maintenance ............................................................................... 22
3.2.1 Data acquisition................................................................................. 22 3.2.2 Data processing ................................................................................ 23 3.2.3 Maintenance decision support .......................................................... 24
3.3 Population-based approach ......................................................................... 26 3.4 Ontology model ........................................................................................... 27 3.5 Machine Tool condition monitoring .............................................................. 28
3.5.1 Monitoring of linear axes ................................................................... 28 3.5.2 Ball screw lifetime ............................................................................. 31
4. SUMMARY OF INCLUDED ARTICLES ............................................................. 37 4.1 Paper I: Cloud-enhanced predictive maintenance ....................................... 37 4.2 Paper II: Context preparation for predictive analytics - a case from
manufacturing industry ................................................................................ 38

XII
4.3 Paper III: Semantic framework for predictive maintenance in a cloud environment ................................................................................................. 40
4.4 Paper IV: Integration of events and offline measurement data from a population of similar entities for condition monitoring .................................. 41
4.5 Paper V: Diagnosis of machine tools: assessment based on double ball-bar measurements from a population of similar machines ................................ 43
5. CONCLUSIONS AND DISCUSIONS ................................................................. 49 5.1 Revisiting the research questions ................................................................ 49 5.2 Research contribution .................................................................................. 50 5.3 Discussion ................................................................................................... 51
5.3.1 Validity of results ............................................................................... 51 5.3.2 Quality of data ................................................................................... 51 5.3.3 Failure model .................................................................................... 54 5.3.4 Classification evaluation.................................................................... 55
5.4 Future research ........................................................................................... 55
6. REFERENCES ................................................................................................... 59
XIII
LIST OF FIGURES
1.1: Maintenance strategies, based on EN 13306 (CEN 2001) ............................. 2 1.2: Schematic model of a machine tool ................................................................ 3 1.3: Main machine tool components and distribution of downtimes (Fleischer et al.
2009) ............................................................................................................. 3 1.4: Distribution of work order types on machines of interest in one calendar
year ............................................................................................................. 4 1.5: Maintenance time, based on Alsyouf (2009) .................................................. 6 1.6: Overview of the relationships between articles and proposed framework in
Paper III as a cloud-based predictive framework ........................................... 7 2.1: Process model of design science research methodology developed by
Peffers et al. (2007), based on (Takeda et al. 1990) .................................... 14 2.2: Information systems research framework adapted from (Hevner et al.
2004) ........................................................................................................... 14 3.1: Cloud-enabled monitoring, prognosis and maintenance (Gao et al. 2015) .. 22 3.2: Filter feature selection .................................................................................. 23 3.3: Wrapper feature selection............................................................................. 23 3.4: Prediction models classification (Schmidt and Wang 2015) ......................... 24 3.5: Artificial neural network structure .................................................................. 26 3.6: Example of results from a double ball-bar test ............................................. 28 3.7: Concept of double ball-bar measurement on a 3-axis machine ................... 29 3.8: Circular test features according to ISO 230-4 (ISO 2005) ............................ 30 3.9 Example of deviations that could be observed in the circular test, based on
(ISO 2005, Renishaw 2012) ......................................................................... 31 4.1: Potential population-based improvement in prediction ................................. 37 4.2: Correlation of acoustic emission and velocity of axis motion........................ 38 4.3: Screenshot from the developed user interface ............................................. 39 4.4: Semantic framework for data aggregation .................................................... 40 4.5: Cross-validation evaluation procedure ......................................................... 41 4.6: Comparison of different pre-processing and processing methods based on
the accuracy of several classification methods. ........................................... 42 4.7: Minimal cost for CBM policy for different clusters sizes for conditions TC1,
TC2, and TC3 that relate to long, medium and short time to failure ............. 43 5.1 Distribution of intervals of double ball-bar measurements based on 276
intervals from the case analysed .................................................................. 52 5.2 Energy per machining cycle on Machine A .................................................... 53

XIV
5.3 Energy per machining cycle on Machine B .................................................... 53 5.4 Causes of ball screw degradation.................................................................. 54 5.5: Hazard (failure) rate for two-parameter Weibull distribution with different
values of shape parameter β ........................................................................ 54

XV
LIST OF TABLES
1.1: Relationship between the publications and the research questions .............. 8 3.1: Example of features from the ball-bar diagnostics....................................... 30 3.2: Values of condition-related factor fw in the model for life expectancy .......... 32 4.1: Comparison of results from the simulation for different costs of condition
monitoring CCM, with obtained optimal TCM .................................................. 44


XVII
INTRODUCTION

18

1
CHAPTER 1
INTRODUCTION
This chapter presents the structure of the thesis, background information, the problem identification, purpose of the research and the research questions.
1.1 STRUCTURE OF THE THESIS
The thesis is divided into following chapters:
Chapter 1: Introduction – sets out the background of the research and highlights its purpose, the research objectives, and the research questions.
Chapter 2: Research Approach – describes the methodology applied in the re-search process.
Chapter 3: Frame of Reference –introduces and explains basic concepts relevant to this thesis.
Chapter 4: Summary of Included Articles – summarises the five appended pa-pers, highlighting the most important aspect of each paper.
Chapter 5: Conclusions and Discussions – presents the conclusions drawn from the research, discusses some aspects of the work, and suggests potential future work.
References – provides a list of works cited.
1.2 BACKGROUND
Maintenance of assets is important to ensure productivity, product quality, on-time delivery, and a safe working environment in the manufacturing industry. It is one of the pillars of asset management (AM), enabling the realisation of value from assets through their full life cycle (TWPL 2015).
Approaches to maintenance have evolved and continue to evolve. In earlier periods, the run-to-failure approach was used. This is also known as reactive maintenance or corrective maintenance. Later, attention turned to preventive maintenance (PM), which focused on taking action before failure occurred. This approach evolved to con-dition-based maintenance (CBM), where decisions are based on an evaluation of the machine condition through inspections or measurement systems. Predictive mainte-nance (PdM) and prognostics and health management are approaches that use condi-
CHAPTER 1 INTRODUCTION
2
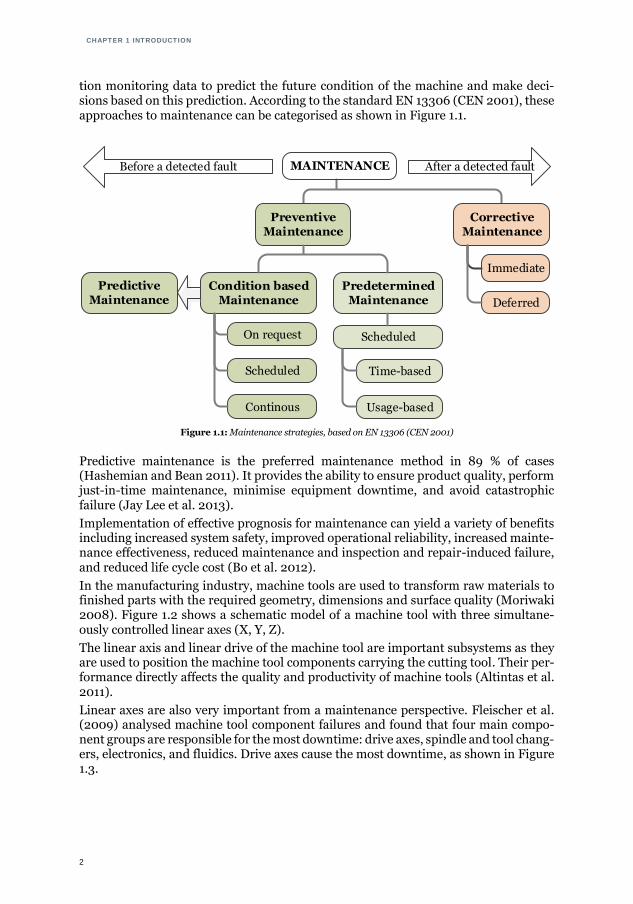
tion monitoring data to predict the future condition of the machine and make deci-sions based on this prediction. According to the standard EN 13306 (CEN 2001), these approaches to maintenance can be categorised as shown in Figure 1.1.
Figure 1.1: Maintenance strategies, based on EN 13306 (CEN 2001)
Predictive maintenance is the preferred maintenance method in 89 % of cases (Hashemian and Bean 2011). It provides the ability to ensure product quality, perform just-in-time maintenance, minimise equipment downtime, and avoid catastrophic failure (Jay Lee et al. 2013).
Implementation of effective prognosis for maintenance can yield a variety of benefits including increased system safety, improved operational reliability, increased mainte-nance effectiveness, reduced maintenance and inspection and repair-induced failure, and reduced life cycle cost (Bo et al. 2012).
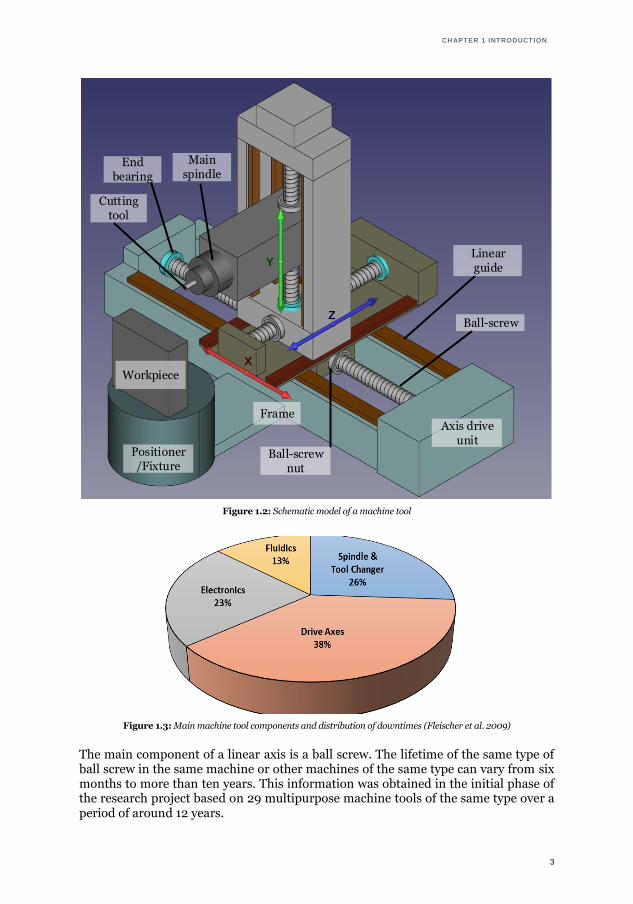
In the manufacturing industry, machine tools are used to transform raw materials to finished parts with the required geometry, dimensions and surface quality (Moriwaki 2008). Figure 1.2 shows a schematic model of a machine tool with three simultane-ously controlled linear axes (X, Y, Z).
The linear axis and linear drive of the machine tool are important subsystems as they are used to position the machine tool components carrying the cutting tool. Their per-formance directly affects the quality and productivity of machine tools (Altintas et al. 2011).
Linear axes are also very important from a maintenance perspective. Fleischer et al. (2009) analysed machine tool component failures and found that four main compo-nent groups are responsible for the most downtime: drive axes, spindle and tool chang-ers, electronics, and fluidics. Drive axes cause the most downtime, as shown in Figure 1.3.
MAINTENANCE
Preventive Maintenance
Corrective Maintenance
Condition based Maintenance
Predetermined Maintenance
Scheduled
On request
Continous
Scheduled
Deferred
Immediate
Before a detected fault After a detected fault
Usage-based
Time-based
Predictive Maintenance
CHAPTER 1 INTRODUCTION
3
Figure 1.2: Schematic model of a machine tool
Figure 1.3: Main machine tool components and distribution of downtimes (Fleischer et al. 2009)
The main component of a linear axis is a ball screw. The lifetime of the same type of ball screw in the same machine or other machines of the same type can vary from six months to more than ten years. This information was obtained in the initial phase of the research project based on 29 multipurpose machine tools of the same type over a period of around 12 years.
Ball-screw
Ball-screw nut
Linear guide
End bearing
Main spindle
Cutting tool
Workpiece
Positioner/Fixture
FrameAxis drive
unit
X
Z
Y
CHAPTER 1 INTRODUCTION
4
One of the condition monitoring methods used to assess the health of linear axes is a circularity test. This offline measurement method can be performed using an external measuring device (Kakino et al. 1987). Some modern machine tools use internal sen-sors (Siemens 2016).
The double ball-bar (DBB) measuring system from Renishaw® is one of the available measuring systems for circularity and volumetric error tests. Those measurements are usually used to detect or confirm the existence of a failure in linear axes subsystems. More details about circularity tests and DBB measurements are provided in Section 3.5.1.
1.3 PROBLEM IDENTIFICATION
The current situation in industrial maintenance is not satisfactory. In Swedish industry more than one third of maintenance time is spent on unplanned corrective work due to breakdowns (Alsyouf 2009).
Initial observation was performed over a four-week period and included observation of the following aspects of maintenance:
work of maintenance technicians
preparation of monthly and yearly maintenance reports
acquisition of condition monitoring data (vibration, double ball-bar measure-ments, and laser tracker)
analysis of condition monitoring data and report preparation.
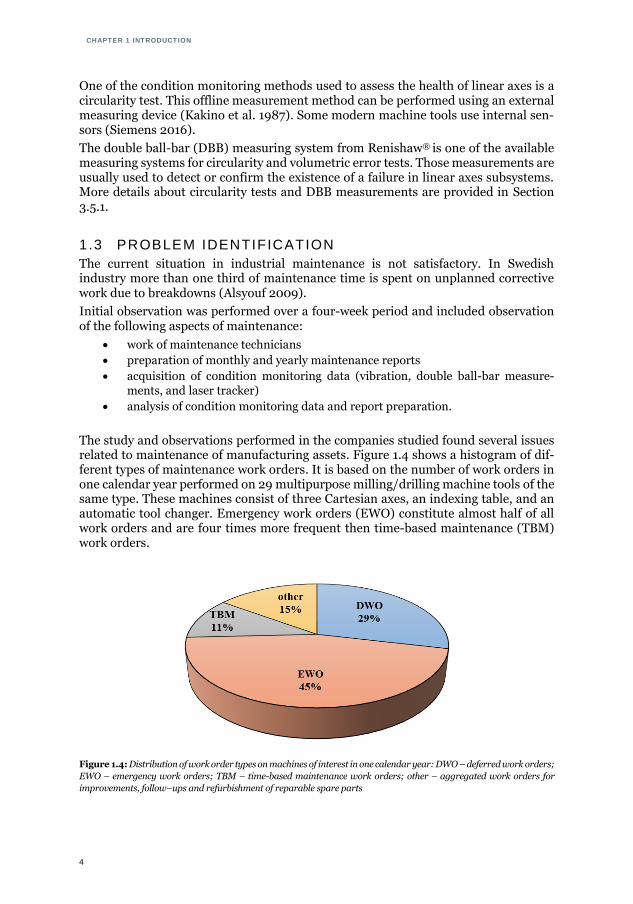
The study and observations performed in the companies studied found several issues related to maintenance of manufacturing assets. Figure 1.4 shows a histogram of dif-ferent types of maintenance work orders. It is based on the number of work orders in one calendar year performed on 29 multipurpose milling/drilling machine tools of the same type. These machines consist of three Cartesian axes, an indexing table, and an automatic tool changer. Emergency work orders (EWO) constitute almost half of all work orders and are four times more frequent then time-based maintenance (TBM) work orders.
Figure 1.4: Distribution of work order types on machines of interest in one calendar year: DWO – deferred work orders;
EWO – emergency work orders; TBM – time-based maintenance work orders; other – aggregated work orders for
improvements, follow–ups and refurbishment of reparable spare parts
CHAPTER 1 INTRODUCTION
5
There was no holistic view of the maintenance requirements for these machines due to so-called islands of knowledge. Data about assets was gathered by different func-tional units within the company such as maintenance, production, and quality. The same issue has been reported by (Bjorling et al. 2013, Diego Galar et al. 2012). Similar machines and subsystems can be distributed in different lines, units, and factories, which causes the data to be gathered and analysed independently. Therefore, a lesson learned in one place is not applied elsewhere.
Some data that could be used for maintenance decision-making, such as data from machine tool control systems, is analysed only in special cases or not at all. Yet Jay Lee et al. (2013) noted that algorithms could perform more accurately by including more information about the machine’s whole lifecycle, including system configuration, physical knowledge and working principles. Thus there is a need to systematically in-tegrate, manage, and analyse machinery or process data during different stages of the machines’ life cycle.
A literature study revealed that there is a need for some means of synthesising smaller available data sets to generate extensive, representative, historical condition monitor-ing and event data sets (Gao et al. 2015).
1.3.1 DOUBLE BALL-BAR MEASUREMENTS The advantages of DBB are its low cost, simplicity of use, and robustness (Zargarbashi and Mayer (2006). However, some problems related to double ball-bar measurements have been identified. One is that the measurement is time-consuming, as the measur-ing device needs to be installed in the machine each time. This can increase costs if production needs to be stopped to perform the measurement.
Another problem is that the measurement can only identify whether performance is within the required range. However, the challenge is to predict the progression of deg-radation once early deviations have been observed. In the case analysed in this thesis, the warning reports are created by CBM specialists, who qualitatively assess the plots and some trends based on their experience. Manual analysis of the data in each case is time-consuming. Moreover, it can be difficult to assess whether the machine will sur-vive until the next inspection time. To avoid this uncertainty, a degradation model is needed to predict machine life.
1.4 PURPOSE OF THIS RESEARCH
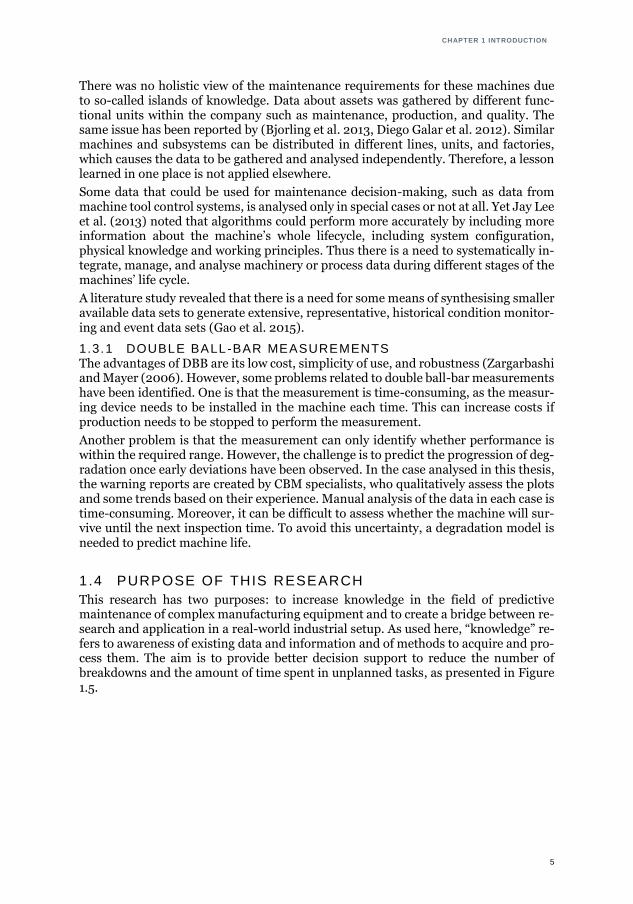
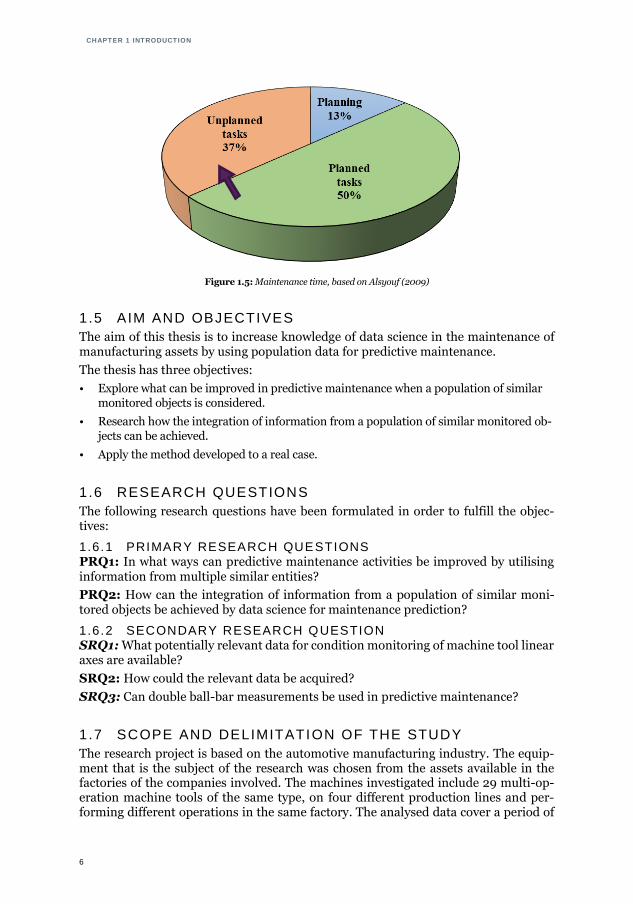
This research has two purposes: to increase knowledge in the field of predictive maintenance of complex manufacturing equipment and to create a bridge between re-search and application in a real-world industrial setup. As used here, “knowledge” re-fers to awareness of existing data and information and of methods to acquire and pro-cess them. The aim is to provide better decision support to reduce the number of breakdowns and the amount of time spent in unplanned tasks, as presented in Figure 1.5.
CHAPTER 1 INTRODUCTION
6
Figure 1.5: Maintenance time, based on Alsyouf (2009)
1.5 AIM AND OBJECTIVES
The aim of this thesis is to increase knowledge of data science in the maintenance of manufacturing assets by using population data for predictive maintenance.
The thesis has three objectives:
• Explore what can be improved in predictive maintenance when a population of similar monitored objects is considered.
• Research how the integration of information from a population of similar monitored ob-jects can be achieved.
• Apply the method developed to a real case.
1.6 RESEARCH QUESTIONS
The following research questions have been formulated in order to fulfill the objec-tives:
1.6.1 PRIMARY RESEARCH QUESTIONS PRQ1: In what ways can predictive maintenance activities be improved by utilising information from multiple similar entities?
PRQ2: How can the integration of information from a population of similar moni-tored objects be achieved by data science for maintenance prediction?
1.6.2 SECONDARY RESEARCH QUESTION SRQ1: What potentially relevant data for condition monitoring of machine tool linear axes are available?
SRQ2: How could the relevant data be acquired?
SRQ3: Can double ball-bar measurements be used in predictive maintenance?
1.7 SCOPE AND DELIMITATION OF THE STUDY
The research project is based on the automotive manufacturing industry. The equip-ment that is the subject of the research was chosen from the assets available in the factories of the companies involved. The machines investigated include 29 multi-op-eration machine tools of the same type, on four different production lines and per-forming different operations in the same factory. The analysed data cover a period of
CHAPTER 1 INTRODUCTION
7
four years. The study is focused mainly on data and data analytics rather than on ma-chine tools, physical sensing and measurement instrumentation. However, the engi-neering context of the data is important and is considered in the data analysis process.
The subsystem selected for investigation was the linear axis of the machine tool. This subsystem directly affects machining quality but, in comparison to the cutting tool and main spindle, it is not well represented in research in the field of condition-based and predictive maintenance.
Selecting which maintenance approach is most suitable in an individual case is beyond the scope of this research.
1.8 RELATIONSHIP BETWEEN ARTICLES
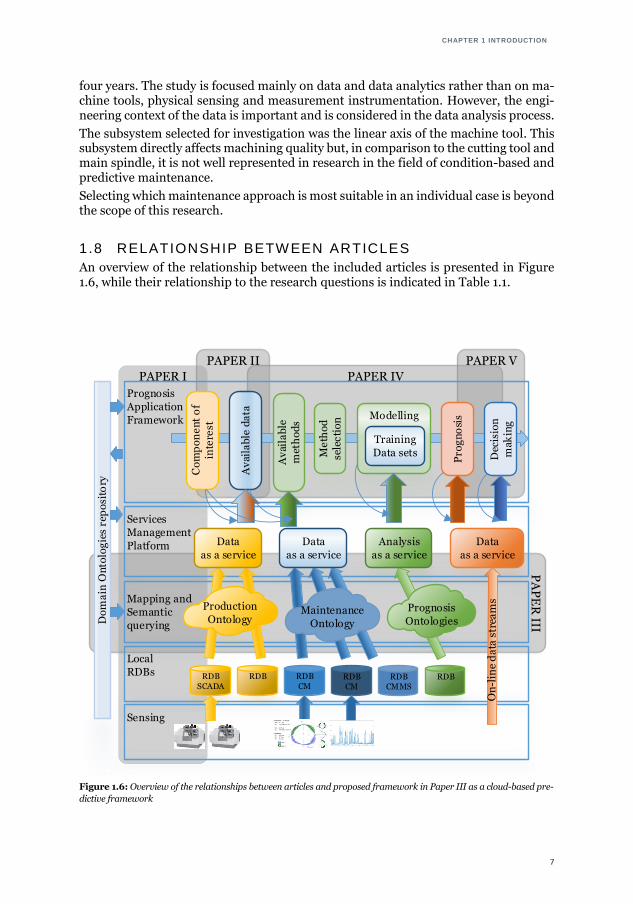
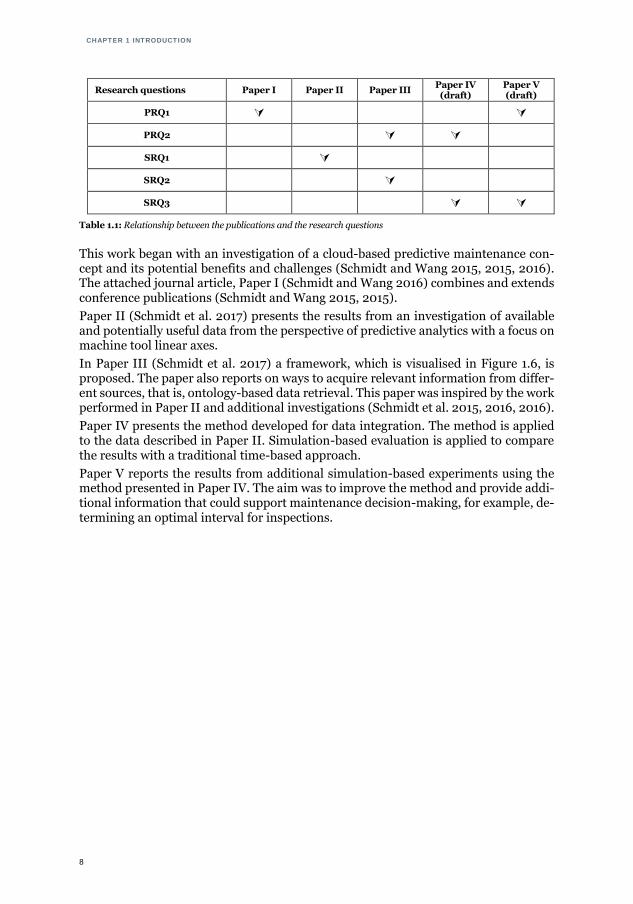
An overview of the relationship between the included articles is presented in Figure 1.6, while their relationship to the research questions is indicated in Table 1.1.
Figure 1.6: Overview of the relationships between articles and proposed framework in Paper III as a cloud-based pre-
dictive framework
PAPER I
PA
PE
R III
PAPER II
PAPER IV
PAPER V
Local
RDBs
Services
Management
Platform
Mapping and
Semantic
querying
RDBCM
RDBCM
RDBCMMS
RDBSCADA
RDB RDB
Co
mp
on
en
t o
f
inte
rest
Prognosis
Application
Framework
Av
aila
ble
da
ta
Av
aila
ble
met
ho
ds
Modelling
Me
tho
d
sele
cti
on
Training
Data setsP
rog
no
sis
Maintenance
OntologyDo
ma
in O
nto
log
ies
rep
osi
tory
Production
OntologyPrognosis
Ontologies
Data
as a service
Data
as a service
Analysis
as a service
Dec
isio
n
mak
ing
Data
as a service
Sensing
CHAPTER 1 INTRODUCTION
8
Research questions Paper I Paper II Paper III Paper IV
(draft) Paper V (draft)
PRQ1
PRQ2
SRQ1
SRQ2
SRQ3
Table 1.1: Relationship between the publications and the research questions
This work began with an investigation of a cloud-based predictive maintenance con-cept and its potential benefits and challenges (Schmidt and Wang 2015, 2015, 2016). The attached journal article, Paper I (Schmidt and Wang 2016) combines and extends conference publications (Schmidt and Wang 2015, 2015).
Paper II (Schmidt et al. 2017) presents the results from an investigation of available and potentially useful data from the perspective of predictive analytics with a focus on machine tool linear axes.
In Paper III (Schmidt et al. 2017) a framework, which is visualised in Figure 1.6, is proposed. The paper also reports on ways to acquire relevant information from differ-ent sources, that is, ontology-based data retrieval. This paper was inspired by the work performed in Paper II and additional investigations (Schmidt et al. 2015, 2016, 2016).
Paper IV presents the method developed for data integration. The method is applied to the data described in Paper II. Simulation-based evaluation is applied to compare the results with a traditional time-based approach.
Paper V reports the results from additional simulation-based experiments using the method presented in Paper IV. The aim was to improve the method and provide addi-tional information that could support maintenance decision-making, for example, de-termining an optimal interval for inspections.


10

11
RESEARCH APPROACH

12

13
CHAPTER 2
RESEARCH APPROACH
This chapter presents the research approach. Section 2.1 provides an overview of the philosophy of science, and Section 2.2 describes the applied research methodology. An overview of the research process is presented in Section 2.3, while Section 2.4 dis-cusses the rigor and relevance of the research.
2.1 PHILOSOPHY OF SCIENCE
The philosophy of science is the study, from a philosophical perspective, of the ele-ments of scientific inquiry (Kitcher 2017). A philosophical paradigm is a set of shared assumptions and ways of thinking about the nature of our world (ontology) and the ways knowledge about it can be acquired (epistemology) (Oates 2006).
Oates discussed three philosophical paradigms of research, namely positivism, inter-pretivism, and critical research. Positivism is appropriate for studying the natural world, while interpretivism and critical research are more appropriate when studying the social world as they assume that there are multiple subjective realities as social reality is created and re-created by people.
Positivism can be further subdivided into positivist and post-positivist approaches. In the positivist approach, it is assumed that the world is regular and ordered and can be investigated objectively. Research is based on the empirical hypothesis testing, leading to their confirmation or refutation. Finally, it aims to discover universal laws that can be shown to be true regardless of circumstances.
The post-positivistic approach argues that research evidence is always imperfect and fallible (Robson 2011). Therefore, reality can only be known imperfectly and probabil-istically because of researcher limitations. In contrast to the positivist approach, it ac-cepts that what is observed can be influenced by theories, hypotheses, background knowledge and the values of the researcher (Reichardt and Rallis 1994).
In my work, I hold to the positivist philosophical paradigm.
2.2 RESEARCH METHODOLOGY
In this research the guidelines presented by Hevner et al. (2004) and the methodology described by Peffers et al. (2007) have been applied.
CHAPTER 2 RESEARCH APPROACH
14
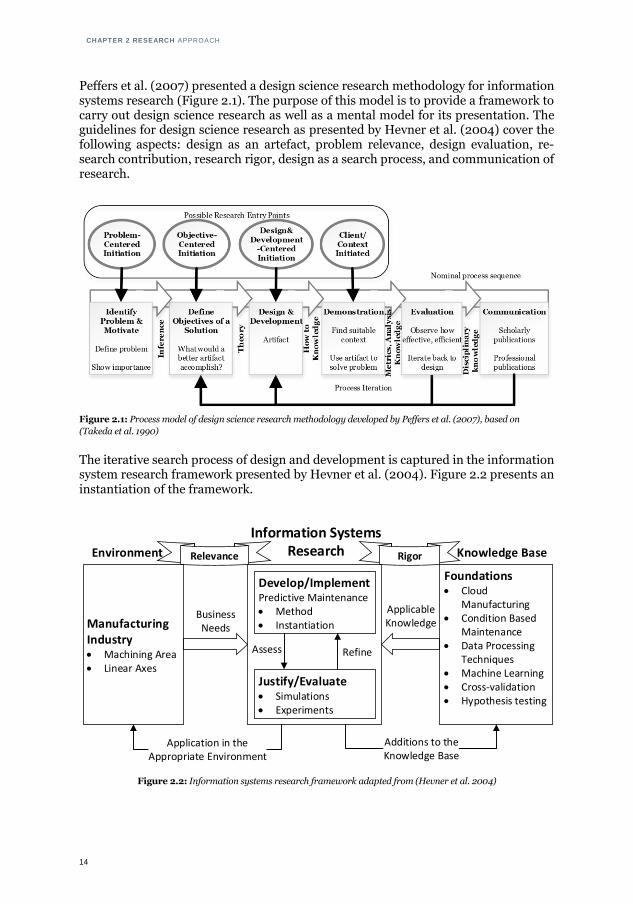
Peffers et al. (2007) presented a design science research methodology for information systems research (Figure 2.1). The purpose of this model is to provide a framework to carry out design science research as well as a mental model for its presentation. The guidelines for design science research as presented by Hevner et al. (2004) cover the following aspects: design as an artefact, problem relevance, design evaluation, re-search contribution, research rigor, design as a search process, and communication of research.
Figure 2.1: Process model of design science research methodology developed by Peffers et al. (2007), based on
(Takeda et al. 1990)
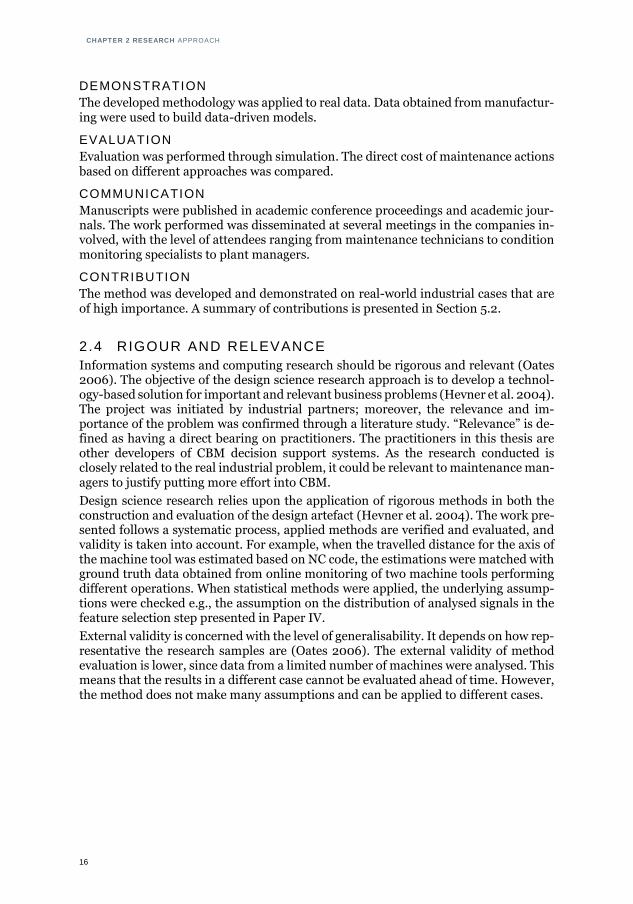
The iterative search process of design and development is captured in the information system research framework presented by Hevner et al. (2004). Figure 2.2 presents an instantiation of the framework.
Figure 2.2: Information systems research framework adapted from (Hevner et al. 2004)
Manufacturing Industry Machining Area Linear Axes
Foundations Cloud
Manufacturing Condition Based
Maintenance Data Processing
Techniques Machine Learning Cross-validation Hypothesis testing
Develop/ImplementPredictive Maintenance Method Instantiation
Justify/Evaluate Simulations Experiments
BusinessNeeds
Applicable Knowledge
Environment
Information Systems Research Knowledge BaseRelevance Rigor
Additions to the Knowledge Base
Application in the Appropriate Environment
Assess Refine

CHAPTER 2 RESEARCH APPROACH
15
The design and creation (development) research strategy is focused on developing new IT artefacts (Oates 2006). Researchers following this strategy can contribute to knowledge with a construct, model, method, instantiation, or combination of those. According to March and Smith (1995) and Oates (2006):
• construct is the concept or vocabulary used in a particular IT-related domain,
• model is a combination of constructs that represent a situation and is used to aid prob-lem understanding and solution development,
• method is guidance on the models to be produced and process stages to be followed to solve the problems using IT,
• instantiation is a working system which demonstrates that constructs, models, methods,
ideas or theories can be implemented in a computer-based system.
The main artefacts and contributions of the research are: (1) method to integrate and process disparate data from a population of entities to provide support for mainte-nance decisions; (2) instantiation of the method, applied to the machine tool linear axis.
2.3 RESEARCH PROCESS
The research process in this work is presented using the model by Peffers et al. (2007), as shown in Figure 2.1.
RESEARCH ENTRY POINT
The research project was initiated from the manufacturing side by Volvo Car Corpora-tion (VCC) and Volvo Global Trucks Operation (VGTO). Their vision was to avoid faults and disturbances and secure the process quality of the selected equipment/sub-system. To be relevant, the project had to be aligned with business strategy, which meant that it had to
• maximise value with minimum cost,
• use collected data to predict events or changes in the status of equipment/subsystems,
• aim to support maintenance actions that reduce cost and improve quality,
• acquire the data from existing equipment/subsystems within VCC and VGTO.
The specified requirements were at a high level of abstraction, and a pre-study was performed to further shape the research.
PROBLEM IDENTIFICATION AND MOTIVATION
Problem identification and justification were done through a literature study and ob-servation of maintenance work in the companies involved. This part is covered in chapter 1 of the thesis.
OBJECTIVES OF THE SOLUTION
From the company perspective, the developed artefact was required to have a positive impact (quantitative objective) on one or more key performance indicators (KPI), for example, cost, mean time to failure (MTTF), and overall equipment efficiency (OEE).
DESIGN AND DEVELOPMENT
This task was performed in an iterative way, starting with data acquisition through data processing to maintenance decision-making.
CHAPTER 2 RESEARCH APPROACH
16
DEMONSTRATION
The developed methodology was applied to real data. Data obtained from manufactur-ing were used to build data-driven models.
EVALUATION
Evaluation was performed through simulation. The direct cost of maintenance actions based on different approaches was compared.
COMMUNICATION
Manuscripts were published in academic conference proceedings and academic jour-nals. The work performed was disseminated at several meetings in the companies in-volved, with the level of attendees ranging from maintenance technicians to condition monitoring specialists to plant managers.
CONTRIBUTION
The method was developed and demonstrated on real-world industrial cases that are of high importance. A summary of contributions is presented in Section 5.2.
2.4 RIGOUR AND RELEVANCE
Information systems and computing research should be rigorous and relevant (Oates 2006). The objective of the design science research approach is to develop a technol-ogy-based solution for important and relevant business problems (Hevner et al. 2004). The project was initiated by industrial partners; moreover, the relevance and im-portance of the problem was confirmed through a literature study. “Relevance” is de-fined as having a direct bearing on practitioners. The practitioners in this thesis are other developers of CBM decision support systems. As the research conducted is closely related to the real industrial problem, it could be relevant to maintenance man-agers to justify putting more effort into CBM.
Design science research relies upon the application of rigorous methods in both the construction and evaluation of the design artefact (Hevner et al. 2004). The work pre-sented follows a systematic process, applied methods are verified and evaluated, and validity is taken into account. For example, when the travelled distance for the axis of the machine tool was estimated based on NC code, the estimations were matched with ground truth data obtained from online monitoring of two machine tools performing different operations. When statistical methods were applied, the underlying assump-tions were checked e.g., the assumption on the distribution of analysed signals in the feature selection step presented in Paper IV.
External validity is concerned with the level of generalisability. It depends on how rep-resentative the research samples are (Oates 2006). The external validity of method evaluation is lower, since data from a limited number of machines were analysed. This means that the results in a different case cannot be evaluated ahead of time. However, the method does not make many assumptions and can be applied to different cases.


18

19
FRAME OF REFERENCE

20
21
CHAPTER 3
FRAME OF REFERENCE
This chapter presents the theoretical background and provides context to the research. It begins with positioning the research with respect to recent concepts of cloud manu-facturing and industry 4.0 (Section 3.1). Section 3.2 gives an overview of predictive maintenance with a brief description of the various methods. Then the population-based approach is explained in Section 3.3. Section 3.4 explains the ontology model that was utilised in data retrieval. Finally, machine tool condition monitoring with more focus on linear axes is presented in Section 3.5.
3.1 CLOUD MANUFACTURING
The cloud manufacturing paradigm is a result of combining cloud computing, the In-ternet of Things, service-oriented technologies, and high performance computing (Zhang et al. 2014). It transforms manufacturing resources and capabilities into man-ufacturing services. It is not a simple deployment of manufacturing software tools in the computing cloud. The physical resources integrated into the manufacturing cloud are able to offer adaptive, secure, and on-demand manufacturing services over the In-ternet of Things (Lihui Wang et al. 2014). According to the Federal Ministry of Educa-tion and Research, Germany (BMBF) quoting Monostori (2014), “Industry is on the threshold of the fourth industrial revolution, frequently noted as Industry 4.0. This revolution is led by development and implementation of cyber-physical systems”. One of the services included in the cloud manufacturing concept is maintenance-as-a-ser-vice (Ren et al. 2013). Cloud manufacturing increases the level of complexity of pro-duction equipment and requires high availability and robustness (Ylipää et al. 2017). Therefore, proper maintenance plays an important role.
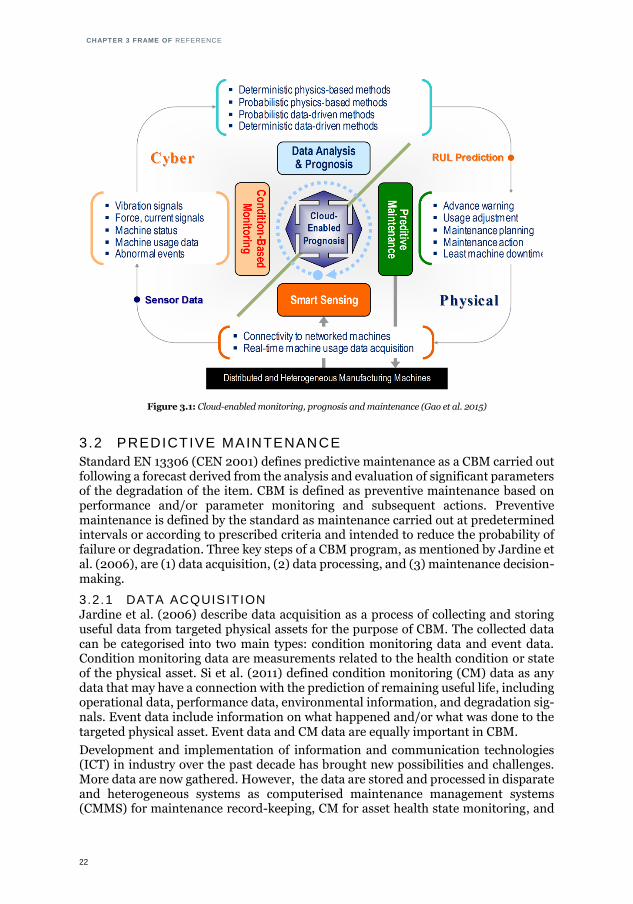
Cloud-enabled prognosis for predictive maintenance combines information from sim-ilar machines and uses the power of cloud computing to more efficiently execute the prognostic models in the distributed cloud environment for improved decision-mak-ing (Gao et al. 2015). An overview of a cloud-enabled prognostics approach within a cyber-physical concept is visualised in Figure 3.1.
CHAPTER 3 FRAME OF REFERENCE
22
Figure 3.1: Cloud-enabled monitoring, prognosis and maintenance (Gao et al. 2015)
3.2 PREDICTIVE MAINTENANCE
Standard EN 13306 (CEN 2001) defines predictive maintenance as a CBM carried out following a forecast derived from the analysis and evaluation of significant parameters of the degradation of the item. CBM is defined as preventive maintenance based on performance and/or parameter monitoring and subsequent actions. Preventive maintenance is defined by the standard as maintenance carried out at predetermined intervals or according to prescribed criteria and intended to reduce the probability of failure or degradation. Three key steps of a CBM program, as mentioned by Jardine et al. (2006), are (1) data acquisition, (2) data processing, and (3) maintenance decision-making.
3.2.1 DATA ACQUISITION Jardine et al. (2006) describe data acquisition as a process of collecting and storing useful data from targeted physical assets for the purpose of CBM. The collected data can be categorised into two main types: condition monitoring data and event data. Condition monitoring data are measurements related to the health condition or state of the physical asset. Si et al. (2011) defined condition monitoring (CM) data as any data that may have a connection with the prediction of remaining useful life, including operational data, performance data, environmental information, and degradation sig-nals. Event data include information on what happened and/or what was done to the targeted physical asset. Event data and CM data are equally important in CBM.
Development and implementation of information and communication technologies (ICT) in industry over the past decade has brought new possibilities and challenges. More data are now gathered. However, the data are stored and processed in disparate and heterogeneous systems as computerised maintenance management systems (CMMS) for maintenance record-keeping, CM for asset health state monitoring, and
CHAPTER 3 FRAME OF REFERENCE
23
supervisory control and data acquisition (SCADA) systems for monitoring processes and controlling the asset (D. Galar et al. 2012, Diego Galar et al. 2016). Bjorling et al. (2013) indicated that attempts to integrate CMMS, CM and maintenance knowledge management will be a key part of maintenance technology in the future.
3.2.2 DATA PROCESSING Data processing methods depend mainly on the type of data collected. Jardine et al. (2006) categorised CM data into three categories: value data such as oil analysis data, temperature, and pressure; waveform data such as vibration and acoustic data; and multidimensional data such as infrared and X-ray images.
Value data can be analysed using multivariate analysis techniques such as principal component analysis (PCA) and independent component analysis (ICA). For waveform data analysis, there are three main categories: time-domain analysis, frequency-do-main analysis and time-frequency analysis. The data processing step to extract useful information from raw signals is called feature extraction (Jardine et al. 2006).
3.2.2.1 FEATURE SELECTION
A wide range of features can be extracted from signals when there are multiple sources of data, but it is important to determine which features are more promising. Feature selection should be performed without operator intervention (Teti et al. 2010).
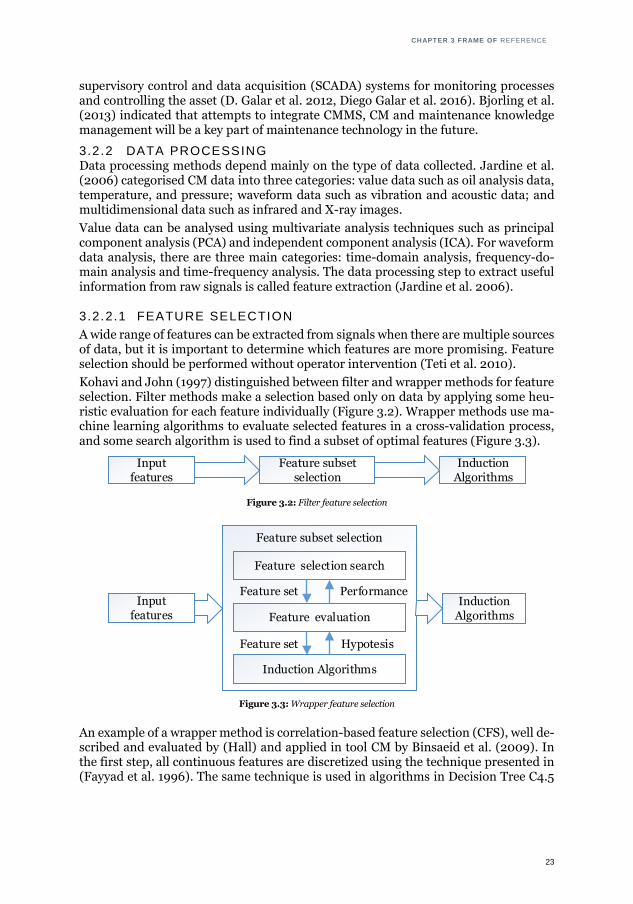
Kohavi and John (1997) distinguished between filter and wrapper methods for feature selection. Filter methods make a selection based only on data by applying some heu-ristic evaluation for each feature individually (Figure 3.2). Wrapper methods use ma-chine learning algorithms to evaluate selected features in a cross-validation process, and some search algorithm is used to find a subset of optimal features (Figure 3.3).
Figure 3.2: Filter feature selection
Figure 3.3: Wrapper feature selection
An example of a wrapper method is correlation-based feature selection (CFS), well de-scribed and evaluated by (Hall) and applied in tool CM by Binsaeid et al. (2009). In the first step, all continuous features are discretized using the technique presented in (Fayyad et al. 1996). The same technique is used in algorithms in Decision Tree C4.5
Input features
Feature subset selection
Induction Algorithms
Input features
Feature subset selection
Induction Algorithms
Feature selection search
Feature evaluation
Induction Algorithms
Feature set
Feature set
Performance
Hypotesis
CHAPTER 3 FRAME OF REFERENCE
24
to decide which branches to split. The metrics are based on mean feature-class corre-lation and mean feature-feature correlation. Then a greedy hill-climbing search algo-rithm is applied to find a feature subset that maximises the evaluation metrics.
If the degradation model is known, then model-based feature selection methods can be applied. When linear correlation can be assumed, linear techniques like the Pearson correlation coefficient can be used (Quan et al. 1998). The coefficient of determination provides a statistical measure of how well a model approximates the real data points. The coefficient of determination was used to avoid uncertain assumptions about the dependency of a feature on tool wear in (Jemielniak et al. 1998).
3.2.2.2 MACHINE LEARNING
A description of a broad range of machine learning algorithms and their statistical principles is provided by Mitchell (1997). The author describes machine learning as a multidisciplinary field that draws on artificial intelligence, probability and statistics, control theory, neurobiology, and other fields.
In this thesis machine learning is applied to a multiclass classification problem to de-termine the degradation state of a component. The set of applied methods was identi-fied based on (Kiang 2003), who assessed several classification methods. The selected distribution-free classification methods are Back Propagation Feed Forward Neural Network (FFNN), k-Nearest Neighbour (kNN) (Wong and Lane 1981), and Decision Tree C4.5 (DT) (Quinlan 1993). In addition, Random Forest and a multiclass Support Vector Machine (SVM) classifier were included based on (Binsaeid et al. 2009, Prytz et al. 2013).
3.2.3 MAINTENANCE DECISION SUPPORT In the CBM approach, techniques for maintenance decision support can be divided into diagnostics and prognostics (Jardine et al. 2006). Diagnostics is identifying and quantifying damage that has occurred, while prognostics tries to predict damage that is going to occur (Sikorska et al. 2011).
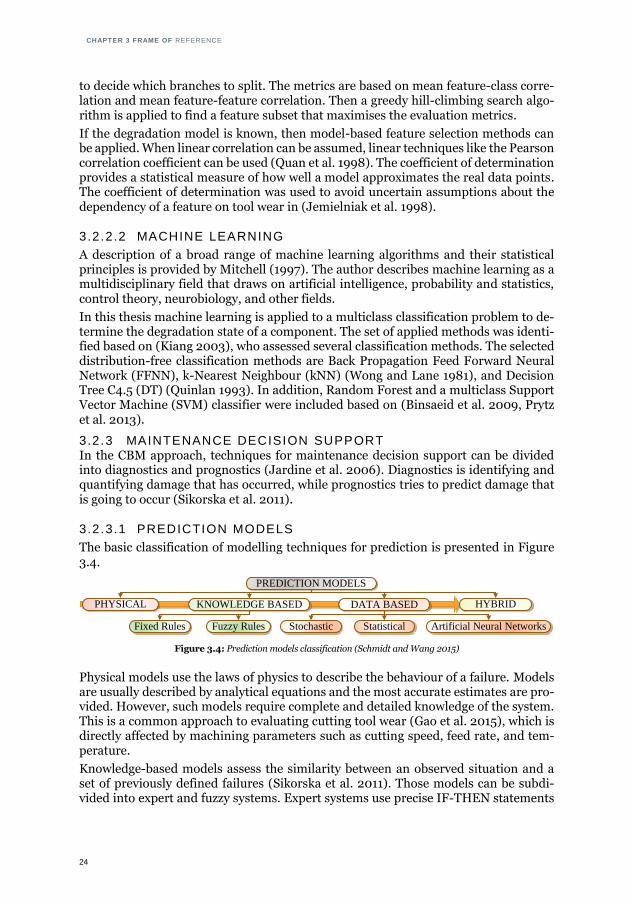
3.2.3.1 PREDICTION MODELS
The basic classification of modelling techniques for prediction is presented in Figure 3.4.
Figure 3.4: Prediction models classification (Schmidt and Wang 2015)
Physical models use the laws of physics to describe the behaviour of a failure. Models are usually described by analytical equations and the most accurate estimates are pro-vided. However, such models require complete and detailed knowledge of the system. This is a common approach to evaluating cutting tool wear (Gao et al. 2015), which is directly affected by machining parameters such as cutting speed, feed rate, and tem-perature.
Knowledge-based models assess the similarity between an observed situation and a set of previously defined failures (Sikorska et al. 2011). Those models can be subdi-vided into expert and fuzzy systems. Expert systems use precise IF-THEN statements
PREDICTION MODELS
KNOWLEDGE BASED DATA BASED PHYSICAL
Fixed Rules Fuzzy Rules Stochastic Statistical Artificial Neural Networks
HYBRID
CHAPTER 3 FRAME OF REFERENCE
25
to define rules, while fuzzy models use fuzzy rules and logic that can handle noisy or imprecise input data.
Data-driven models are based on acquired historical data. Within this type of model we can distinguish between stochastic models, statistical models, and artificial neural networks. Hybrid models use combinations of two or more modelling techniques.
3.2.3.2 STOCHASTIC MODELS
Stochastic models provide reliability-related information. One of the most common tools used by industry is aggregate reliability functions (Sikorska et al. 2011). This ap-proach analyses the time to failure of the population to determine the probability den-sity function. Various distributions can be used to model failure data, including Gauss-ian, lognormal, exponential and Weibull. Stochastic conditional probability is a sub-group of statistical models that use the Bayes theorem and are often referred as Bayes-ian models. Sikorska et al. (2011) placed Markov and semi-Markov models, hidden and semi-hidden Markov models, Kalman filters, and particle filters in this group. Markovian-based models assume that the future degradation state depends only on the current degradation state, which can be directly observed through CM (Si et al. 2011). Hidden Markov models are composed of two stochastic processes, a not directly observable Markov chain, which represents the real state of deterioration, and an ob-servable process that corresponds to the observed CM information.
3.2.3.3 STATISTICAL MODELS
Prediction of a future state is often performed by comparison of the monitoring results with a model representing behaviour in the failure-free state (Sikorska et al. 2011). The simplest form is trend extrapolation, in which a single parameter or feature is repre-sented as a function of time. Trend data are compared with configured limits to gen-erate warnings. With regression methods, data can be extrapolated to predict when the limit will be reached. Autoregressive models like autoregressive moving average (ARMA) and autoregressive moving average with exogenous inputs (ARMAX) assume that all future values are linear functions of past observations. These models need to be identified based on observation data by estimating parameters that minimise the error between model output and observed data. An application of using the ARMA method for fault prediction is presented in (Jie et al. 2007). Also, SVM can be applied as a regression model (Benkedjouh et al. 2013). Other regression models that can be applied include Wiener and Gamma processes (Gao et al. 2015).
The proportional hazard model (PHM) can also be categorised as a statistical model (Sikorska et al. 2011). It was first proposed by (Cox 1972). This model extends the ag-gregate reliability functions by using so-called covariates. The PHM assumes that the hazard rate of a system consists of two multiplicative factors: a baseline hazard func-tion and a function of covariates (Si et al. 2011). Ghodrati et al. (2017) used a Weibull distribution in a PHM to estimate the mean residual life of hydraulic systems in mining equipment.
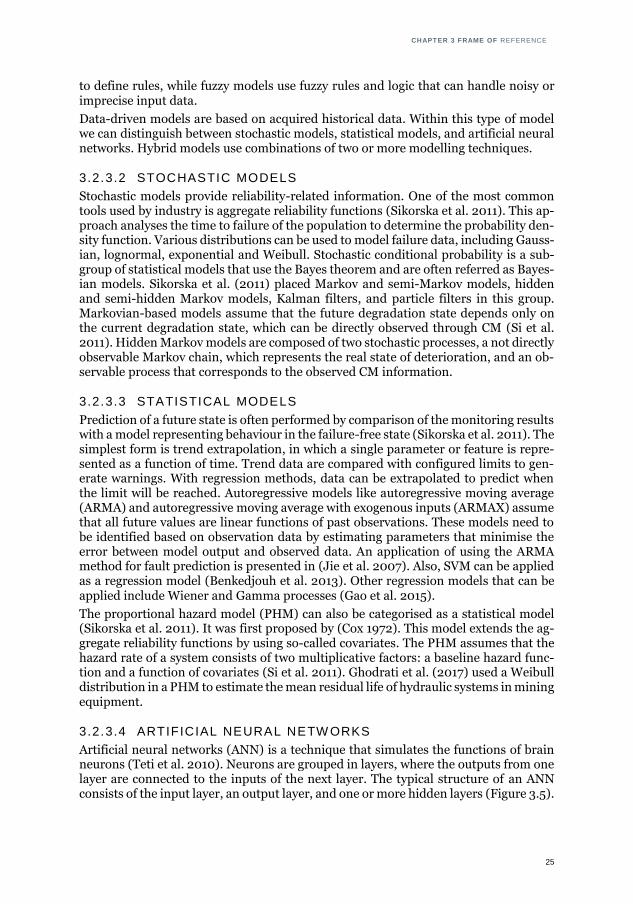
3.2.3.4 ARTIFICIAL NEURAL NETW ORKS
Artificial neural networks (ANN) is a technique that simulates the functions of brain neurons (Teti et al. 2010). Neurons are grouped in layers, where the outputs from one layer are connected to the inputs of the next layer. The typical structure of an ANN consists of the input layer, an output layer, and one or more hidden layers (Figure 3.5).
CHAPTER 3 FRAME OF REFERENCE
26
The output from the neuron depends on the chosen activation function and input val-ues modified by input weights. Input weights are automatically adjusted during the learning or training process. An ANN approach can be used when there is no previous knowledge of the system and without a physical understanding of the process. How-ever a high number of samples is required to train the network, and its performance strongly depends on the selected structure (Gao et al. 2015).
v1
v2
vout
X1
X2
X3
Y1
Inp
ut
layer
Hid
den
layer
Outp
ut
layer
w1
w2
w21
w22
w31
w32
w12
w11
Figure 3.5: Artificial neural network structure
3.3 POPULATION-BASED APPROACH
The population-based approach, also known as a fleet-wide approach, is an approach in which data from a set of entities are utilised. Three types of fleets can be distin-guished based on the similarity between entities in the fleet (Al-Dahidi et al. 2016).
• An identical fleet consists of pieces of equipment that have identical technical features
and work in the same operational conditions.
• a homogenous fleet includes a set of entities that share some technical features and work
in similar operating conditions; however, there are some differences in some features.
• a heterogeneous fleet consists of entities that undergo different usage with different op-
erational conditions and have similar and/or different technical features.
Bahga and Madisetti (2012) adapted cloud-based case-based reasoning for fault pre-diction. Case-based reasoning (CBR) is an effective way of solving problems. The ap-proach is to create cases based on fault data and sensor data retrieved from the mainte-nance database and machine sensor data respectively for a population of similar ma-chines. The sensor data used to create the case can be treated as context information for faults which occur.
G. Medina-Oliva et al. (2014), Voisin et al. (2013) present an approach to fleet-wide diagnosis and prognosis. It takes advantages of all available knowledge about a set of similar units. By adding not only data from identical units but also from similar ones, a higher volume of data can be obtained to reduce uncertainty. They indicate the need to handle the heterogeneity of the knowledge, the similarity of the components, and the operational context. The approach in their research was focused on retrieving rel-evant context information with the use of ontology-based knowledge representation.
The availability of CM data for heterogeneous fleets of equipment installed worldwide and experiencing different operational conditions drives the development of new data-driven approaches to capitalise on the information coming from the fleet in order to
CHAPTER 3 FRAME OF REFERENCE
27
improve the remaining useful life estimation (Al-Dahidi et al. 2016). Unsupervised en-semble clustering is applied to obtain a number of states in a homogeneous discrete-time finite-state semi-Markov model (HDTFSSMM). Maximum likelihood estimation (MLE) and a Fisher information matrix (FIM) are used to estimate state transition parameters and their uncertainty. Finally, direct Monte-Carlo simulation of the deg-radation progression is applied to estimate remaining useful life. The proposed ap-proach has been validated in several simulated cases:
• aluminium electrolytic capacitors (simulated): 2-dimensional data vector (1 – degrada-tion, 1– condition)
• aircraft engine turbomachinery (NASA simulated): 24-dimensional data vector (21 – degradation, 3– condition); 15 signals used.
Prytz (2014) applied machine learning methods to data from a fleet of vehicles for pre-dictive maintenance of vehicle compressors. Off-board maintenance records and on-board monitoring data were used. Prytz et al. (2013) evaluated the performance of three classifiers on the data obtained: k-Nearest Neighbour, Decision Tree, and Ran-dom Forest. Prytz et al. (2015) used a Random Forest classifier with two feature selec-tion methods were used: a statistical filter using a Kolmogorov-Smirnov test, and a wrapper-based method. Finally, the approach was evaluated by estimating profitabil-ity.
3.4 ONTOLOGY MODEL
In computer and information science, ontology is a formal specification of knowledge in a domain, explicit specification of the objects, concepts, and other entities that exist in some area of interest, and the relationships between them (Gruber 2009). An on-tology model can be described as a set O= {C, RS, I}. In this model, C is a collection of concepts also called classes, I is set of particulars (instances of classes, individuals), and RS is set of relationships between two concepts or particulars. Ontology Web Lan-guage (OWL) (McGuinness 2004) is one of the common ontology formalisation lan-guages.
(X. H. Wang et al. 2004) indicated that ontology-based modelling allows:
• knowledge sharing between computational entities by having a common set of concepts
about a concept;
• logic inference by exploiting various existing logic reasoning mechanisms to deduce high-level, conceptual context from low-level, raw context;
• knowledge reuse by reusing well-defined Web ontologies of different domains, that is, large-scale context ontology can be composed without starting from scratch.
Emmanouilidis et al. (2010) presented a generic ontology for industrial CM systems. G. Medina-Oliva et al. (2014), Gabriela Medina-Oliva et al. (2012) presented ontology model context modelling in a fleet-based approach. Sun et al. (2015) analysed the re-lationships among environmental effects, products, and reliability. They created an ontological model of environmental effects on reliability. Koukias et al. (2015) pre-sented an asset optimisation solution that applies ontology-based modelling to tech-nical documentation of engineering assets. Kai Xia et al. (2015) presented an ontology-based information representation and retrieval framework related to cloud-based re-manufacturing.
CHAPTER 3 FRAME OF REFERENCE
28
3.5 MACHINE TOOL CONDITION MONITORING
Considerable research has been conducted in the field of machine CM (Jay Lee et al. 2014). The majority of this research focuses on applications involving common rotat-ing machine components such as bearings and gears. The most popular CM technique for rotating equipment is vibration monitoring (Al-Najjar 1997, Higgs et al. 2004). Vi-bration-based CM is a very large research area with a long history, and powerful diag-nostic techniques are currently available (Randall and Antoni 2011).
3.5.1 MONITORING OF LINEAR AXES Condition monitoring of linear axes can be subdivided into online indirect measure-ment and offline direct measurements. There are a few examples of online approaches. Verl et al. (2009) proposed an approach using signals relating to position, speed, and motor current in position-controlled drives to detect wear of the drive unit. Feng and Pan (2012) developed a temperature and vibration sensor unit embedded in the ball screw nut to detect different levels of preload through supervised learning of an SVM classifier. Garinei and Marsili (2012) used a Hall-effect sensor to detect the presence of damaged balls in the ball screw. Tsai et al. (2014) used an accelerometer to monitor ball pass frequency to detect decreasing ball screw preload. Vibration signals from an accelerometer placed on the ball screw nut in a laboratory test rig was used by W. G. Lee et al. (2015) to detect artificially introduced failures in the ball screw race. Vogl et al. (2016) developed a method to use data from an inertial measurement unit (IMU) to identify changes in the axis errors due to degradation.
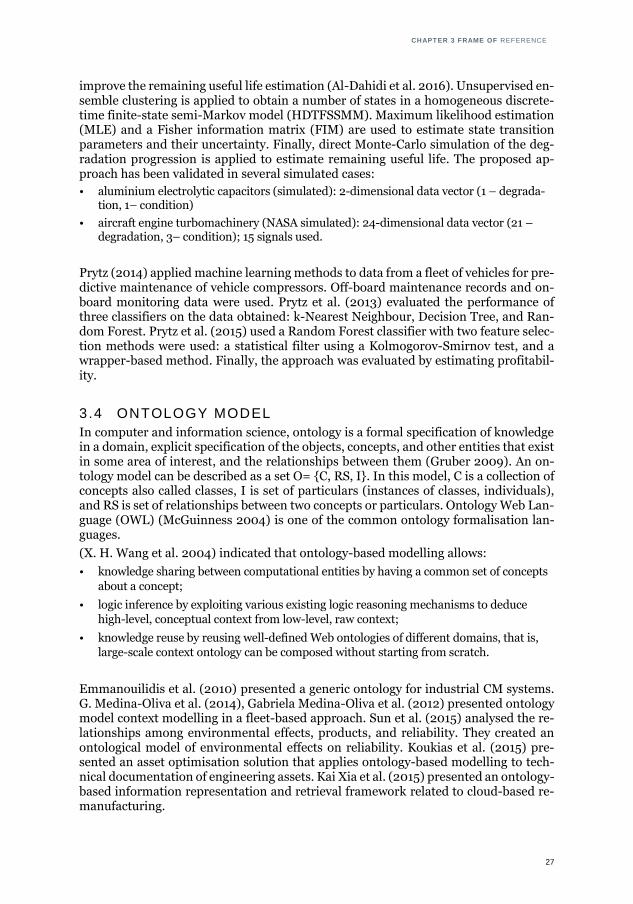
A well-established method for offline measurement of axes accuracy is the DBB meas-urement that was first presented by Bryan (1982) and later standardised in ISO 230-1 (ISO 2012). Its advantages are low cost, simplicity of use, and robustness (Zargarbashi and Mayer 2006). The DBB test is designed to perform circular trajectory interpola-tion of two prismatic axes. The test results are a good representation of the results that would be obtained on machined parts in ideal machining conditions with the same motion parameters. Figure 3.6 shows a result from machine tool with faulty X-axis. For 3-axis machines the test is performed on three planes defined by pairs of machine main axes (Figure 3.7), for both rotation directions and for two feed rates.
Figure 3.6: Example of results from a double ball-bar test
The drawback of performing double ball-bar measurement is that it is performed in an unloaded condition, without the forces and torques generated during cutting opera-tions. Moreover, it cannot be performed automatically and requires time to install the external measuring device. However, in modern machine tools, a circularity test can
20μ m/div
+X +Z +Z
+X+Y+Y
CHAPTER 3 FRAME OF REFERENCE
29
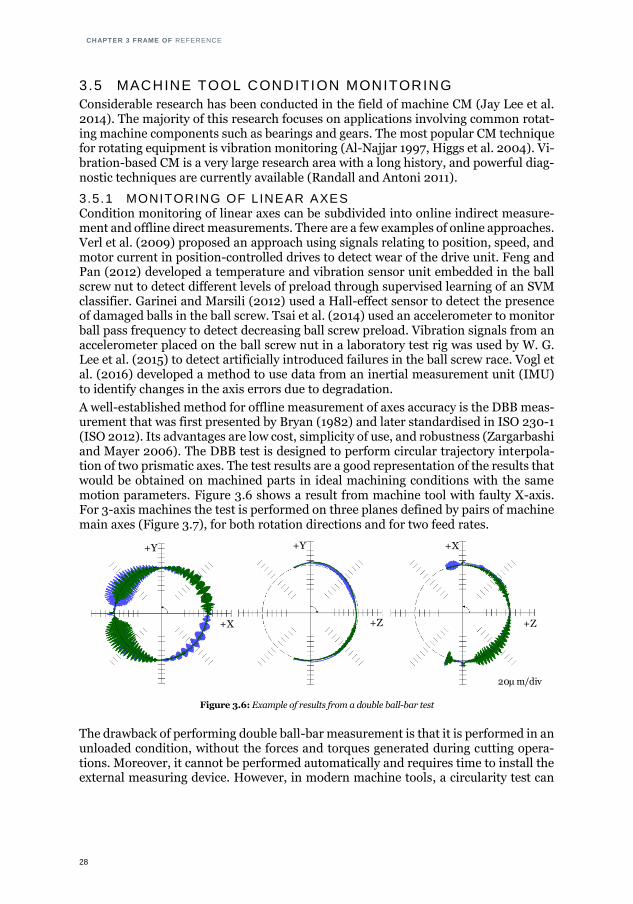
be performed automatically using internal position sensors (Siemens 2016). This pro-vides an opportunity to acquire measurements more frequently, with less disturbance to production.
Figure 3.7: Concept of double ball-bar measurement on a 3-axis machine
Most of the research using the DBB test focuses on identifying sources of deviation (Kakino et al. 1987), its application to multi-axis and/or non-prismatic axis tools (Chen et al. 2015, Uddin et al. 2009, Hong-jian Xia et al. 2017, Zargarbashi and Mayer 2006), modelling thermal deviations (Dehnavi et al. 2012, Delbressine et al. 2006, Florussen et al. 2003), improving the measurement to include dynamic conditions (Archenti et al. 2012), and prediction of the machined part accuracy (Archenti 2014). It is hard to find reported research where data from double ball-bar measurements were used for predictive maintenance. The data are mainly used to identify existing problems, not to indicate when problems could occur.
Axes accuracy can be also assessed using other measuring techniques and principles. For example, axis straightness can be measured using an autocollimator or a laser in-terferometer (ISO 2012).
3.5.1.1 CIRCULARITY TEST FEATURES
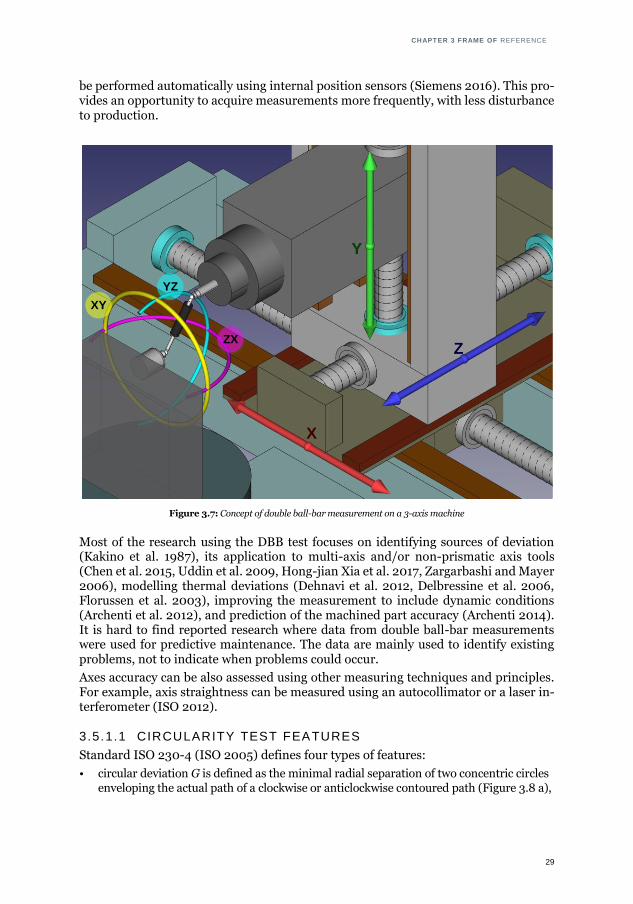
Standard ISO 230-4 (ISO 2005) defines four types of features:
• circular deviation G is defined as the minimal radial separation of two concentric circles enveloping the actual path of a clockwise or anticlockwise contoured path (Figure 3.8 a),
X
Z
Y
XY
ZX
YZ
CHAPTER 3 FRAME OF REFERENCE
30
• bi-directional circular deviation G(b) uses the radial separation of circles enveloping two
actual paths, clockwise and anticlockwise (Figure 3.8 b),
• radial deviation F is defined as the deviation between the actual path and the nominal
path and is given by the maximum value Fmax and minimum value Fmin,
• mean bi-directional radial deviation D is defined as the deviation between the radius of
the nominal path and the radius of the least squares circle of two (clockwise and anti-
clockwise) full circle actual paths.
Figure 3.8: Circular test features according to ISO 230-4 (ISO 2005)
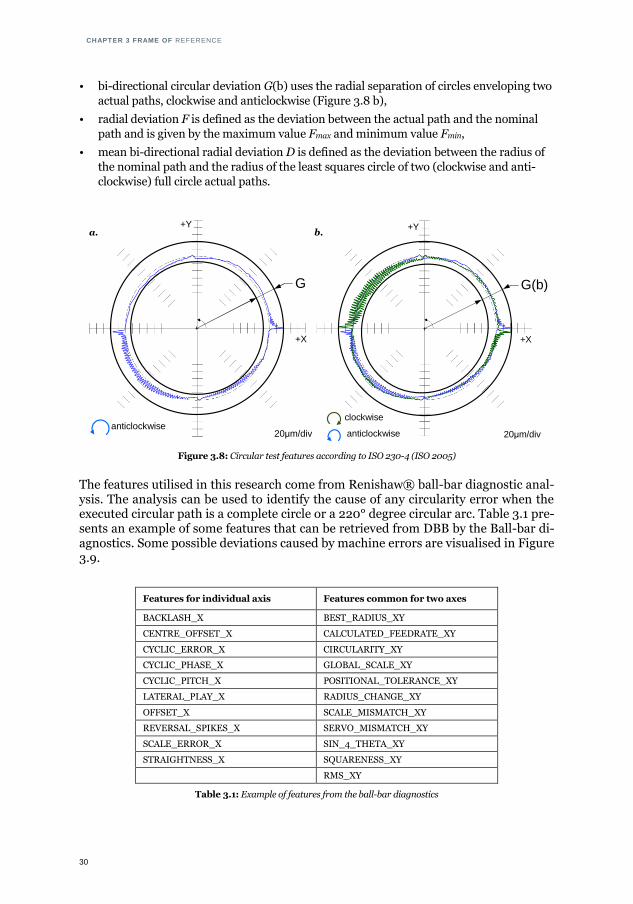
The features utilised in this research come from Renishaw® ball-bar diagnostic anal-ysis. The analysis can be used to identify the cause of any circularity error when the executed circular path is a complete circle or a 220° degree circular arc. Table 3.1 pre-sents an example of some features that can be retrieved from DBB by the Ball-bar di-agnostics. Some possible deviations caused by machine errors are visualised in Figure 3.9.
Features for individual axis Features common for two axes
BACKLASH_X BEST_RADIUS_XY
CENTRE_OFFSET_X CALCULATED_FEEDRATE_XY
CYCLIC_ERROR_X CIRCULARITY_XY
CYCLIC_PHASE_X GLOBAL_SCALE_XY
CYCLIC_PITCH_X POSITIONAL_TOLERANCE_XY
LATERAL_PLAY_X RADIUS_CHANGE_XY
OFFSET_X SCALE_MISMATCH_XY
REVERSAL_SPIKES_X SERVO_MISMATCH_XY
SCALE_ERROR_X SIN_4_THETA_XY
STRAIGHTNESS_X SQUARENESS_XY
RMS_XY
Table 3.1: Example of features from the ball-bar diagnostics
+X
+Y
G
20μm/divanticlockwise
+X
+Y
G(b)
20μm/divanticlockwise
clockwise
a. b.

CHAPTER 3 FRAME OF REFERENCE
31
Figure 3.9 Example of deviations that could be observed in the circular test, based on (ISO 2005, Renishaw 2012)
3.5.2 BALL SCREW LIFETIME According to ISO 3408 (ISO 2006) the nominal life expectancy L of a ball screw based on material fatigue can be estimated using Equations 1–3.
63
ma
a 10F
CL
(1)
2
3
pr
mprma
F3
F1FF
(2)
3
nn2211
3nnn
3222
3111
mnqnqnq
FnqFnqFnqF
(3)
A. Scaling error B. Squareness C. Servo mismatch
D. Lateral play E. Backlash F. Reversal spikes
G. Cyclic error H. Stick-slip I. Vibration
X
Y
X
Y
X
Y
X
Y
X
Y
X
Y
X
Y
X
Y
X
Y
CHAPTER 3 FRAME OF REFERENCE
32
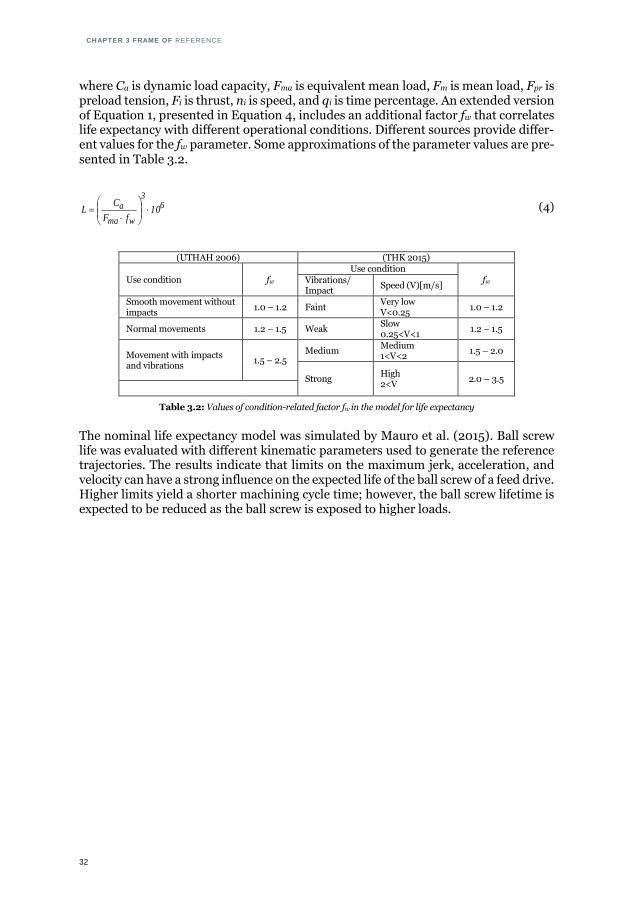
where Ca is dynamic load capacity, Fma is equivalent mean load, Fm is mean load, Fpr is preload tension, Fi is thrust, ni is speed, and qi is time percentage. An extended version of Equation 1, presented in Equation 4, includes an additional factor fw that correlates life expectancy with different operational conditions. Different sources provide differ-ent values for the fw parameter. Some approximations of the parameter values are pre-sented in Table 3.2.
63
wma
a 10fF
CL
(4)
(UTHAH 2006) (THK 2015)
Use condition fw Use condition
fw Vibrations/ Impact
Speed (V)[m/s]
Smooth movement without impacts
1.0 – 1.2 Faint Very low V<0.25
1.0 – 1.2
Normal movements 1.2 – 1.5 Weak Slow 0.25<V<1
1.2 – 1.5
Movement with impacts and vibrations
1.5 – 2.5 Medium
Medium 1<V<2
1.5 – 2.0
Strong High 2<V
2.0 – 3.5
Table 3.2: Values of condition-related factor fw in the model for life expectancy
The nominal life expectancy model was simulated by Mauro et al. (2015). Ball screw life was evaluated with different kinematic parameters used to generate the reference trajectories. The results indicate that limits on the maximum jerk, acceleration, and velocity can have a strong influence on the expected life of the ball screw of a feed drive. Higher limits yield a shorter machining cycle time; however, the ball screw lifetime is expected to be reduced as the ball screw is exposed to higher loads.


34

35
SUMMARY OF
INCLUDED ARTICLES

36
37
CHAPTER 4
SUMMARY OF INCLUDED ARTICLES
A summary of the five appended papers is provided with the most important aspects of each paper highlighted.
4.1 PAPER I : CLOUD-ENHANCED PREDICTIVE MAINTE-NANCE
Schmidt, B., Wang, L. 2016. "Cloud-enhanced predictive maintenance", International Journal of Advanced Manufacturing Technology, http://dx.doi.org/10.1007/s00170-016-8983-8 (online ahead of print). (Schmidt and Wang 2016).
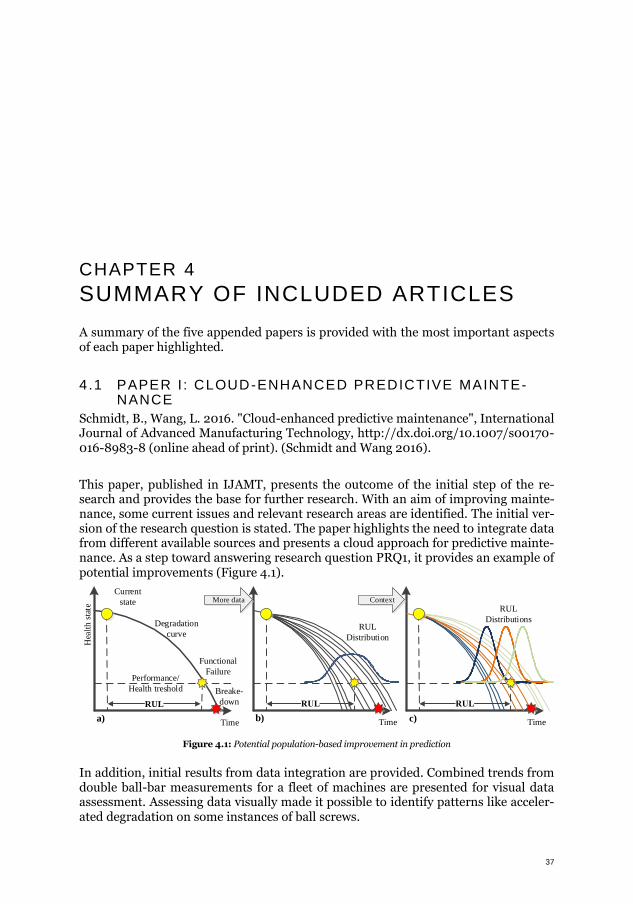
This paper, published in IJAMT, presents the outcome of the initial step of the re-search and provides the base for further research. With an aim of improving mainte-nance, some current issues and relevant research areas are identified. The initial ver-sion of the research question is stated. The paper highlights the need to integrate data from different available sources and presents a cloud approach for predictive mainte-nance. As a step toward answering research question PRQ1, it provides an example of potential improvements (Figure 4.1).
Figure 4.1: Potential population-based improvement in prediction
In addition, initial results from data integration are provided. Combined trends from double ball-bar measurements for a fleet of machines are presented for visual data assessment. Assessing data visually made it possible to identify patterns like acceler-ated degradation on some instances of ball screws.
Time
Performance/
Health treshold
Functional
Failure
Breake-
down
Current
state
Degradation
curve
RUL
Time
RUL
Distribution
Time
RUL
Distributions
More data Context
Hea
lth
sta
te
a) b) c)
CHAPTER 4 SUMMARY OF INCLUDED ARTICLES
38
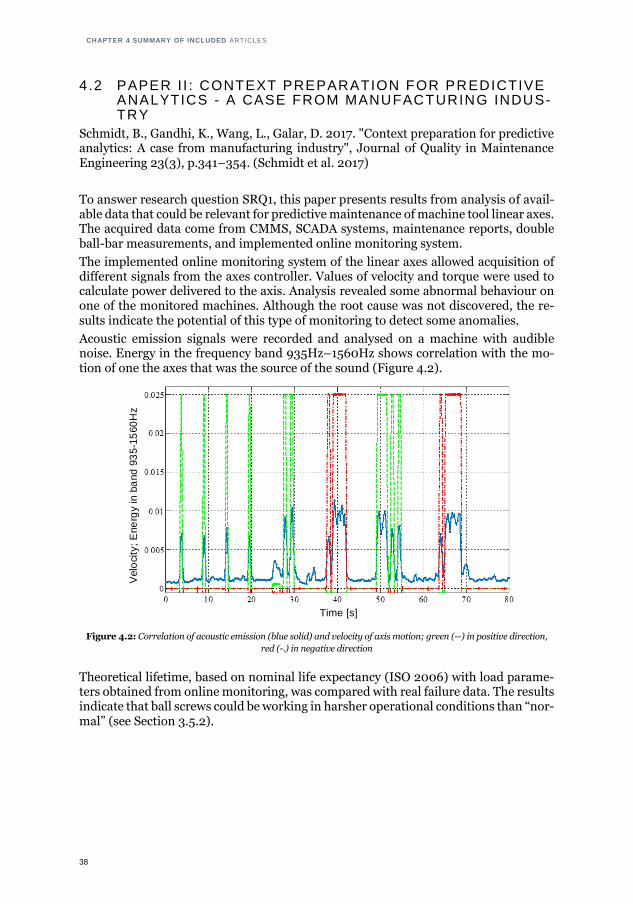
4.2 PAPER I I : CONTEXT PREPARATION FOR PREDICTIVE ANALYTICS - A CASE FROM MANUFACTURING INDUS-TRY
Schmidt, B., Gandhi, K., Wang, L., Galar, D. 2017. "Context preparation for predictive analytics: A case from manufacturing industry", Journal of Quality in Maintenance Engineering 23(3), p.341–354. (Schmidt et al. 2017)
To answer research question SRQ1, this paper presents results from analysis of avail-able data that could be relevant for predictive maintenance of machine tool linear axes. The acquired data come from CMMS, SCADA systems, maintenance reports, double ball-bar measurements, and implemented online monitoring system.
The implemented online monitoring system of the linear axes allowed acquisition of different signals from the axes controller. Values of velocity and torque were used to calculate power delivered to the axis. Analysis revealed some abnormal behaviour on one of the monitored machines. Although the root cause was not discovered, the re-sults indicate the potential of this type of monitoring to detect some anomalies.
Acoustic emission signals were recorded and analysed on a machine with audible noise. Energy in the frequency band 935Hz–1560Hz shows correlation with the mo-tion of one the axes that was the source of the sound (Figure 4.2).
Figure 4.2: Correlation of acoustic emission (blue solid) and velocity of axis motion; green (--) in positive direction,
red (-.) in negative direction
Theoretical lifetime, based on nominal life expectancy (ISO 2006) with load parame-ters obtained from online monitoring, was compared with real failure data. The results indicate that ball screws could be working in harsher operational conditions than “nor-mal” (see Section 3.5.2).
Velo
city
; E
ne
rgy
in b
and
93
5-1
560
Hz
Time [s]
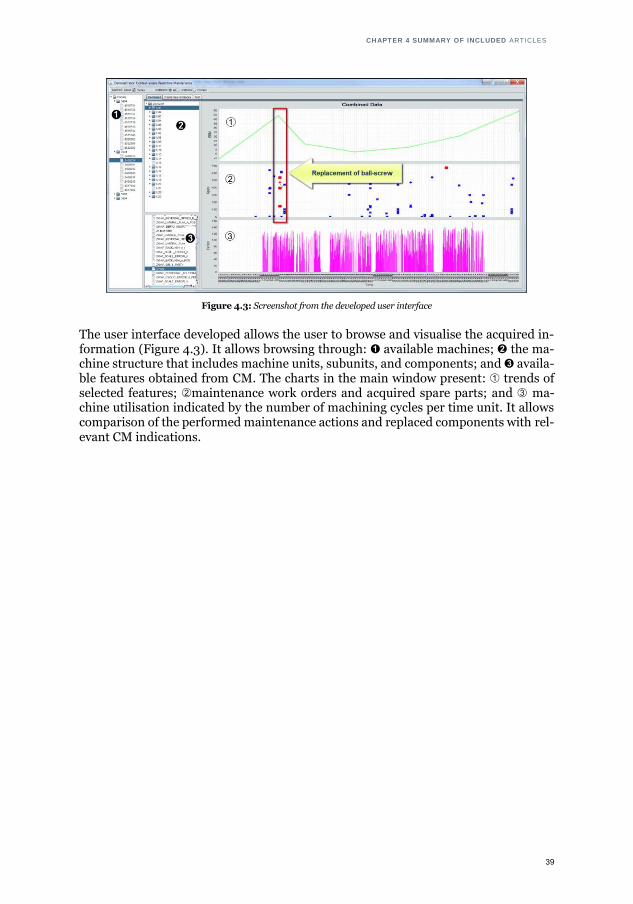
CHAPTER 4 SUMMARY OF INCLUDED ARTICLES
39
Figure 4.3: Screenshot from the developed user interface
The user interface developed allows the user to browse and visualise the acquired in-formation (Figure 4.3). It allows browsing through: ➊ available machines; ➋ the ma-chine structure that includes machine units, subunits, and components; and ➌ availa-ble features obtained from CM. The charts in the main window present: ➀ trends of selected features; ➁maintenance work orders and acquired spare parts; and ➂ ma-chine utilisation indicated by the number of machining cycles per time unit. It allows comparison of the performed maintenance actions and replaced components with rel-evant CM indications.
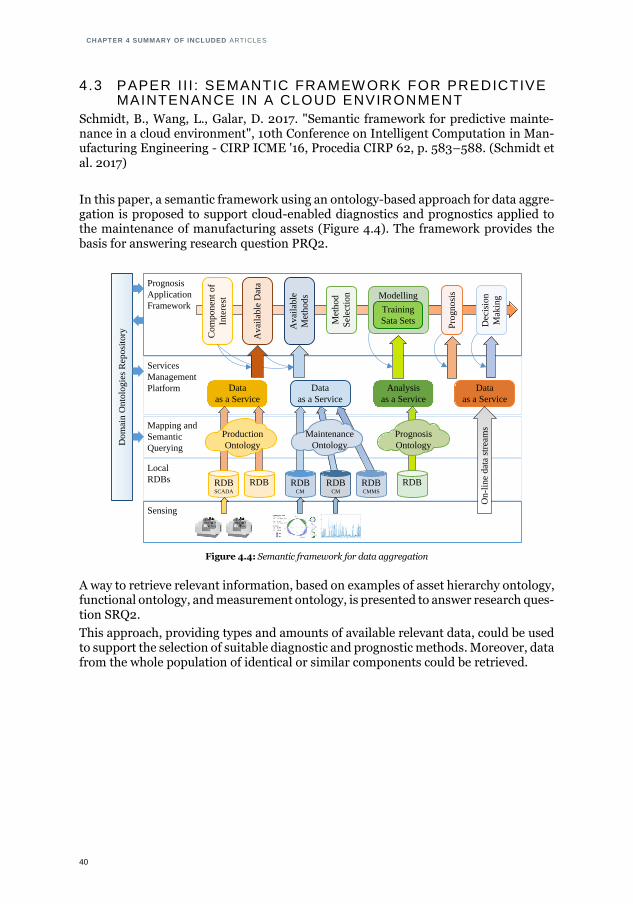
CHAPTER 4 SUMMARY OF INCLUDED ARTICLES
40
4.3 PAPER I I I : SEMANTIC FRAMEW ORK FOR PREDICTIVE MAINTENANCE IN A CLOUD ENVIRONMENT
Schmidt, B., Wang, L., Galar, D. 2017. "Semantic framework for predictive mainte-nance in a cloud environment", 10th Conference on Intelligent Computation in Man-ufacturing Engineering - CIRP ICME '16, Procedia CIRP 62, p. 583–588. (Schmidt et al. 2017)
In this paper, a semantic framework using an ontology-based approach for data aggre-gation is proposed to support cloud-enabled diagnostics and prognostics applied to the maintenance of manufacturing assets (Figure 4.4). The framework provides the basis for answering research question PRQ2.
Figure 4.4: Semantic framework for data aggregation
A way to retrieve relevant information, based on examples of asset hierarchy ontology, functional ontology, and measurement ontology, is presented to answer research ques-tion SRQ2.
This approach, providing types and amounts of available relevant data, could be used to support the selection of suitable diagnostic and prognostic methods. Moreover, data from the whole population of identical or similar components could be retrieved.
Analysis
as a Service
Data
as a Service
Local
RDBs
Services
Management
Platform
Mapping and
Semantic
Querying
Com
ponen
t of
Inte
rest
Prognosis
Application
Framework
Avai
lable
Dat
a
Avai
lable
Met
hods Modelling
Met
hod
Sel
ecti
on
Training
Sata Sets
Pro
gnosi
s
Maintenance
OntologyDom
ain O
nto
logie
s R
eposi
tory
Production
Ontology
Prognosis
Ontology
Data
as a Service
Dec
isio
n
Mak
ing
Data
as a Service
Sensing
On-l
ine
dat
a st
ream
sRDBSCADA
RDB RDBCM
RDBCM
RDBCMMS
RDB
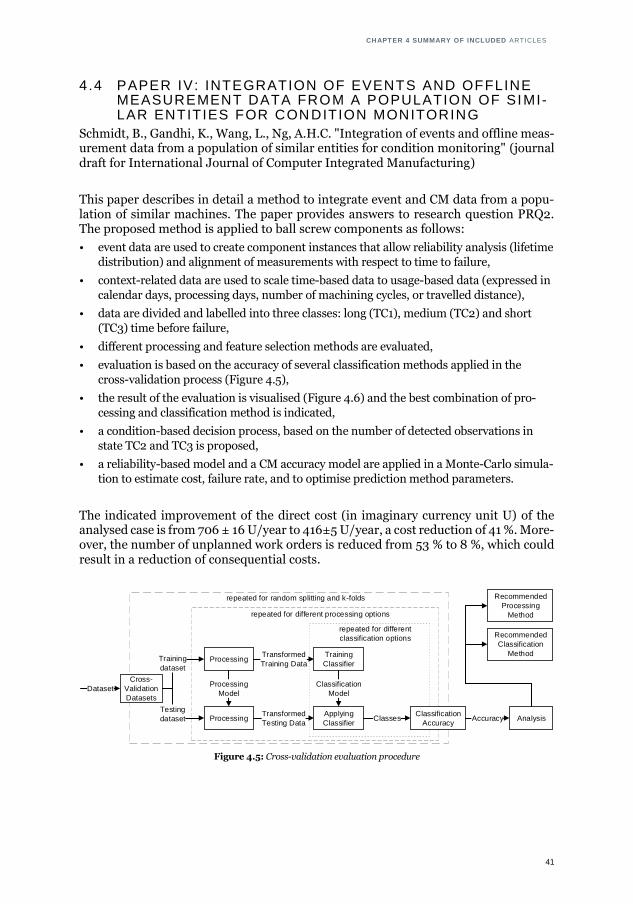
CHAPTER 4 SUMMARY OF INCLUDED ARTICLES
41
4.4 PAPER IV: INTEGRATION OF EVENTS AND OFFLINE MEASUREMENT DATA FROM A POPULATION OF SIMI-LAR ENTITIES FOR CON DITION MONITORING
Schmidt, B., Gandhi, K., Wang, L., Ng, A.H.C. "Integration of events and offline meas-urement data from a population of similar entities for condition monitoring" (journal draft for International Journal of Computer Integrated Manufacturing)
This paper describes in detail a method to integrate event and CM data from a popu-lation of similar machines. The paper provides answers to research question PRQ2. The proposed method is applied to ball screw components as follows:
• event data are used to create component instances that allow reliability analysis (lifetime
distribution) and alignment of measurements with respect to time to failure,
• context-related data are used to scale time-based data to usage-based data (expressed in
calendar days, processing days, number of machining cycles, or travelled distance),
• data are divided and labelled into three classes: long (TC1), medium (TC2) and short
(TC3) time before failure,
• different processing and feature selection methods are evaluated,
• evaluation is based on the accuracy of several classification methods applied in the
cross-validation process (Figure 4.5),
• the result of the evaluation is visualised (Figure 4.6) and the best combination of pro-
cessing and classification method is indicated,
• a condition-based decision process, based on the number of detected observations in
state TC2 and TC3 is proposed,
• a reliability-based model and a CM accuracy model are applied in a Monte-Carlo simula-
tion to estimate cost, failure rate, and to optimise prediction method parameters.
The indicated improvement of the direct cost (in imaginary currency unit U) of the analysed case is from 706 ± 16 U/year to 416±5 U/year, a cost reduction of 41 %. More-over, the number of unplanned work orders is reduced from 53 % to 8 %, which could result in a reduction of consequential costs.
Figure 4.5: Cross-validation evaluation procedure
repeated for different processing options
ProcessingTraining
Classifier
Transformed
Training Data
ProcessingApplying
Classifier
Transformed
Testing Data
Processing
Model
Classification
Model
ClassesClassification
Accuracy
Training
dataset
Cross-
Validation
Datasets
Testing
dataset
Dataset
Accuracy Analysis
repeated for random splitting and k-folds
repeated for different
classification options
Recommended
Processing
Method
Recommended
Classification
Method
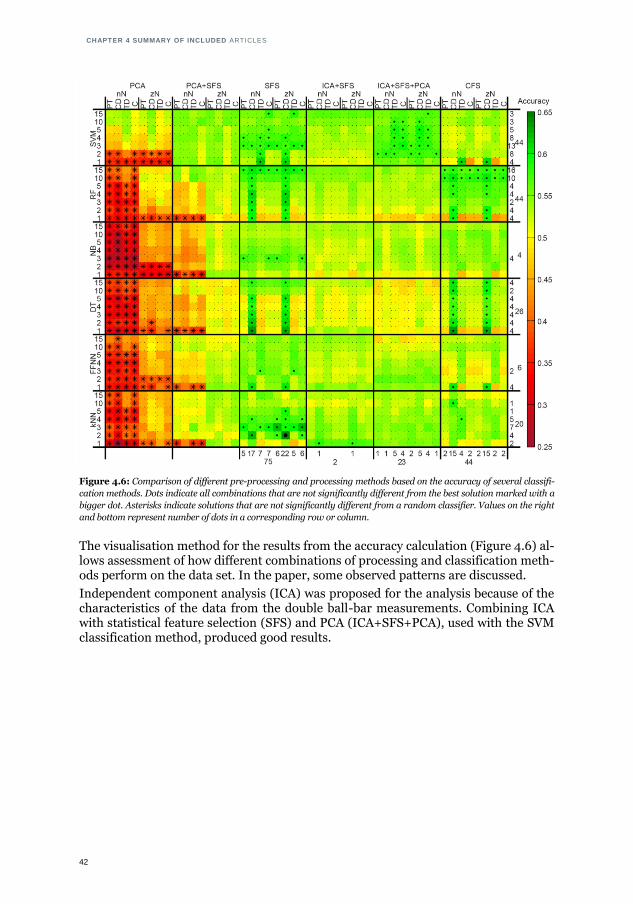
CHAPTER 4 SUMMARY OF INCLUDED ARTICLES
42
Figure 4.6: Comparison of different pre-processing and processing methods based on the accuracy of several classifi-
cation methods. Dots indicate all combinations that are not significantly different from the best solution marked with a
bigger dot. Asterisks indicate solutions that are not significantly different from a random classifier. Values on the right
and bottom represent number of dots in a corresponding row or column.
The visualisation method for the results from the accuracy calculation (Figure 4.6) al-lows assessment of how different combinations of processing and classification meth-ods perform on the data set. In the paper, some observed patterns are discussed.
Independent component analysis (ICA) was proposed for the analysis because of the characteristics of the data from the double ball-bar measurements. Combining ICA with statistical feature selection (SFS) and PCA (ICA+SFS+PCA), used with the SVM classification method, produced good results.
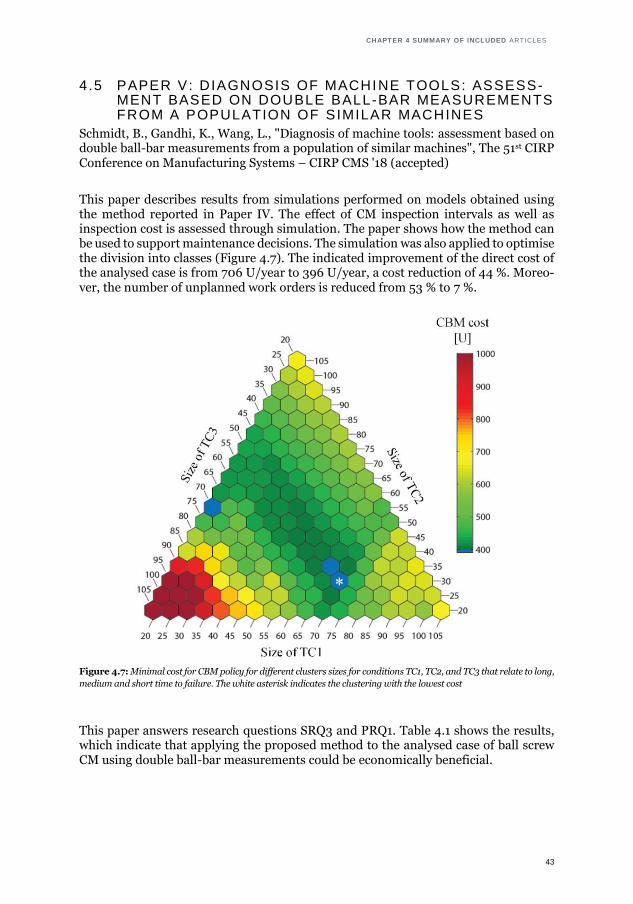
CHAPTER 4 SUMMARY OF INCLUDED ARTICLES
43
4.5 PAPER V: DIAGNOSIS OF MACHINE TOOLS: ASSESS-MENT BASED ON DOUBLE BALL-BAR MEASUREMENTS FROM A POPULATION OF SIMILAR MACHINES
Schmidt, B., Gandhi, K., Wang, L., "Diagnosis of machine tools: assessment based on double ball-bar measurements from a population of similar machines", The 51st CIRP Conference on Manufacturing Systems – CIRP CMS '18 (accepted)
This paper describes results from simulations performed on models obtained using the method reported in Paper IV. The effect of CM inspection intervals as well as inspection cost is assessed through simulation. The paper shows how the method can be used to support maintenance decisions. The simulation was also applied to optimise the division into classes (Figure 4.7). The indicated improvement of the direct cost of the analysed case is from 706 U/year to 396 U/year, a cost reduction of 44 %. Moreo-ver, the number of unplanned work orders is reduced from 53 % to 7 %.
Figure 4.7: Minimal cost for CBM policy for different clusters sizes for conditions TC1, TC2, and TC3 that relate to long,
medium and short time to failure. The white asterisk indicates the clustering with the lowest cost
This paper answers research questions SRQ3 and PRQ1. Table 4.1 shows the results, which indicate that applying the proposed method to the analysed case of ball screw CM using double ball-bar measurements could be economically beneficial.

CHAPTER 4 SUMMARY OF INCLUDED ARTICLES
44
Maintenance policy
Mean cost [U/year]
Mean lifetime [days]
Mean EWO ratio [%]
Inspection interval TCM [days]
RM 767 1143 100
TBM 706 857 53.4
CBM*,CCM=10 395.9 1030 6.9 50
CBM,CCM=10 407.9 962.7 8.6
70
CBM,CCM=20 460.0 960.0 8.5 70
CBM,CCM=50 560.1 966.3 21.1 140
CBM,CCM=80 635.2 982.0 24.0 150
Table 4.1: Comparison of results from the simulation for different costs of condition monitoring CCM, with obtained
optimal TCM. Results for simulation with improved division into classes are marked with *.


46

47
CONCLUSIONS AND
DISCUSSIONS

48
49
CHAPTER 5
CONCLUSIONS AND DISCUSIONS
This chapter concludes with how the research questions have been answered and what the contribution of the research is. It also discusses some results and suggests further work.
5.1 REVISITING THE RESEARCH QUESTIONS
PRQ1: In what ways can predictive maintenance activities be improved by utilising information from multiple similar entities?
This research question was formulated to investigate and justify the need for data in-tegration from a population of entities in condition-based predictive maintenance. In-itial justification was performed based on observations and literature study (Paper I). Quantitative results from Paper V show that the cost and number of failures could be reduced. a suitable interval for inspections could also be obtained. In the case ana-lysed, the potential cost reduction is 44 %, with breakdowns reduced from 53 % to 7 % compared to the time-based approach.
PRQ2: How can the integration of information from a population of similar moni-tored objects be achieved by data science for maintenance prediction?
This research question was formulated to investigate how information from a popula-tion of similar objects could be acquired and processed to support better maintenance decisions. The answer to this question is supported by answers to secondary research questions SRQ1 and SRQ2. The integration of information from a population of similar monitored components can be achieved by following the method developed and eval-uated in Paper IV.
SRQ1: What potentially relevant data for condition monitoring of machine tool linear axes are available?
This research question was formulated with the goal of exploring and describing avail-able information. The result was reported in Paper II. Identified sources include maintenance work orders, reports, cycle information from SCADA, signals from the controller, NC code, and double ball-bar measurements. The answer to this question
CHAPTER 5 CONCLUSIONS AND DISCUSIONS
50
allowed the development of a method for data integration. It is possible that awareness of existing data and its importance has increased in the company involved.
SRQ2: How could the relevant data be acquired?
This research question was formulated to investigate how available relevant infor-mation could be identified and acquired. To answer this question, the ontology-based framework is presented in Paper III. The use of semantic querying and ontology base mapping allows accessing of relevant information from disparate sources. Moreover, provision of a service-oriented data access within the cloud concept allows relevant information to be obtained regardless of its location.
SRQ3: Can double ball-bar measurements be used in predictive maintenance?
This question was formulated to determine whether available data from offline double ball-bar measurements can be used not only for diagnostics but also for prognostics. The obtained evidence shows that double ball-bar measurements can indeed be used in predictive maintenance. The results from applying the proposed method to the data, reported in Paper IV and V, indicate the potential for the method to improve mainte-nance decisions.
5.2 RESEARCH CONTRIBUTION
The presented research contributes to the body of knowledge and to the industry.
SCIENTIFIC CONTRIBUTION
• Method to integrate event, CM, and context data from a population of similar machines:
• event data are used to create component instances that allow reliability analysis and
alignment of measurements with respect to time to failure,
• context-related data are used to scale time-based data to usage-based data,
• different processing and feature selection methods are evaluated,
• a condition-based decision process is proposed,
• a reliability-based model and a CM accuracy model are applied in a Monte-Carlo
simulation to estimate cost, failure rate, and to optimise prediction method parame-
ters.
• Numerous scientific publications.
INDUSTRIAL CONTRIBUTION
• Identified and described available and potentially useful data.
• Evaluated the method using data from a real manufacturing setup.
• Proposed economic evaluations to allow the assessment of the consequences of different
scenarios; this could be used to optimise the maintenance procedure.
• Indicated potential benefits of double ball-bar measurements.
• Provided support in analysing ball-bar measurements.
CHAPTER 5 CONCLUSIONS AND DISCUSIONS
51
5.3 DISCUSSION
5.3.1 VALIDITY OF RESULTS In this thesis a population-wide approach is presented. Data from the population of similar components are analysed and the estimations obtained are valid for a similar population.
The main assumption affecting the results regards the failure time. It is assumed that component replacement is equivalent to component failure. When replacements are performed before actual failure and information on the degradation level of the re-placed component is not available, the life distribution model will be biased. Lifetime predicted based on this model will be shorter than the actual lifetime, and replace-ments based on the model will be premature. The consequences are that the potential useful life is not fully utilised.
In the research, the analysed components (ball screws) are replaced based on CM (double ball-bar measurements) or because of failure. There is no time-based preven-tive replacement of the ball screw.
5.3.2 QUALITY OF DATA In this subsection, different sources of data are discussed.
5.3.2.1 EVENT DATA
Information about component replacement can be retrieved from maintenance rec-ords, that is, work orders stored in CMMS. However, it is not always obvious what was replaced and where.
Each machine, its subsystems, and components have a unique ID in the system and can be unambiguously identified. Nevertheless, very often the performed work is la-belled with an ID of the machine or one subsystem, while the work was performed on several subsystems. Information on what exactly was done is provided in the free-form text description. Moreover, each component has an ID of the corresponding spare part, but several components of the machine can use the same spare part. An example is the end-bearings for ball screws in these machines. There are three different types of ball screws in the three main axes; however, the end-bearings are the same type and have the same spare part ID. It is not possible to identify on which axis the end-bear-ings were replaced based solely on the spare part ID if the axis is not explicitly logged. This makes it difficult or impossible to retrieve information automatically about com-ponent lifetimes.
5.3.2.2 DOUBLE BALL-BAR MEASUREMENTS
Measurements come from the standardised procedure in the company. The test for each machine is prepared based on common configuration templates. Each machine is measured in an operational area close to where the workpiece is located. There could be some deviation in location between machines, as well as between different occa-sions of measurement on the same machine.
Most machines are scheduled to be measured every 3 months. Sometimes additional measurements are performed when disturbances are noticed and measurements are needed to identify and/or confirm the source of the problem. DBB measurements are also performed after component replacement to confirm that the problem has been solved. When the measurements are taken during other maintenance work, it is not possible to automatically distinguish whether the measurement was taken on an old part before replacement or a new part just after replacement.
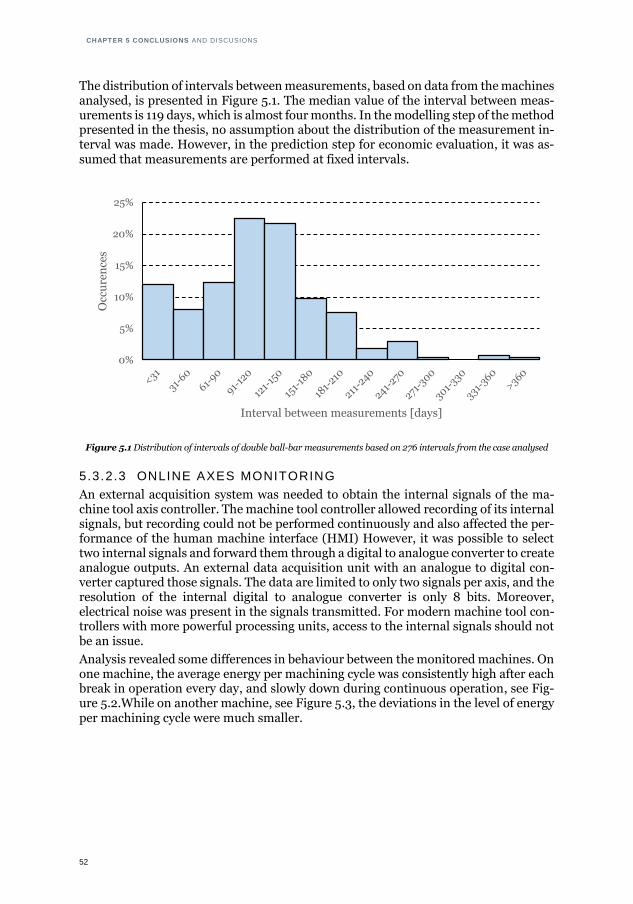
CHAPTER 5 CONCLUSIONS AND DISCUSIONS
52
The distribution of intervals between measurements, based on data from the machines analysed, is presented in Figure 5.1. The median value of the interval between meas-urements is 119 days, which is almost four months. In the modelling step of the method presented in the thesis, no assumption about the distribution of the measurement in-terval was made. However, in the prediction step for economic evaluation, it was as-sumed that measurements are performed at fixed intervals.
Figure 5.1 Distribution of intervals of double ball-bar measurements based on 276 intervals from the case analysed
5.3.2.3 ONLINE AXES MONITORING
An external acquisition system was needed to obtain the internal signals of the ma-chine tool axis controller. The machine tool controller allowed recording of its internal signals, but recording could not be performed continuously and also affected the per-formance of the human machine interface (HMI) However, it was possible to select two internal signals and forward them through a digital to analogue converter to create analogue outputs. An external data acquisition unit with an analogue to digital con-verter captured those signals. The data are limited to only two signals per axis, and the resolution of the internal digital to analogue converter is only 8 bits. Moreover, electrical noise was present in the signals transmitted. For modern machine tool con-trollers with more powerful processing units, access to the internal signals should not be an issue.
Analysis revealed some differences in behaviour between the monitored machines. On one machine, the average energy per machining cycle was consistently high after each break in operation every day, and slowly down during continuous operation, see Fig-ure 5.2.While on another machine, see Figure 5.3, the deviations in the level of energy per machining cycle were much smaller.
0%
5%
10%
15%
20%
25%
Occ
ure
nce
s
Interval between measurements [days]
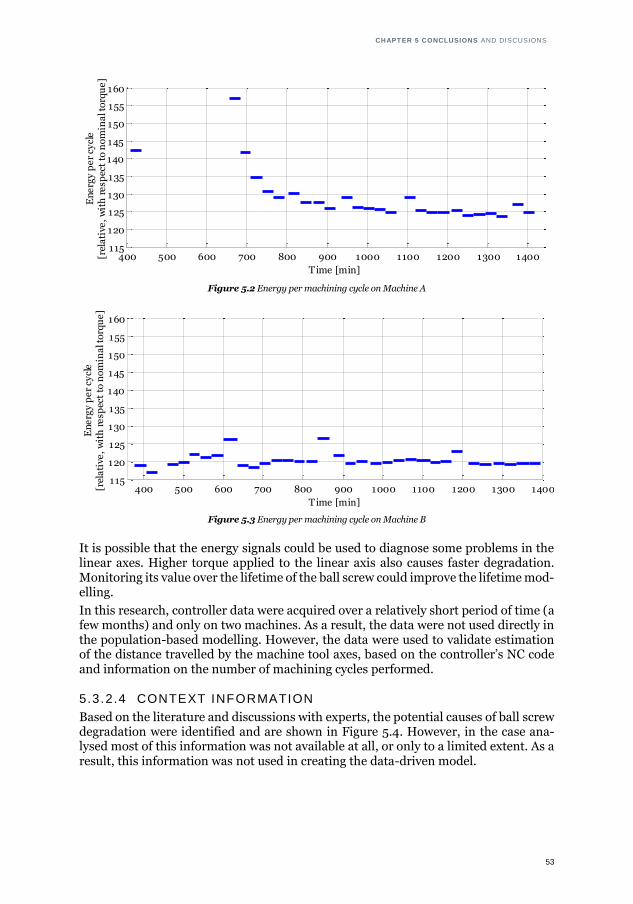
CHAPTER 5 CONCLUSIONS AND DISCUSIONS
53
Figure 5.2 Energy per machining cycle on Machine A
Figure 5.3 Energy per machining cycle on Machine B
It is possible that the energy signals could be used to diagnose some problems in the linear axes. Higher torque applied to the linear axis also causes faster degradation. Monitoring its value over the lifetime of the ball screw could improve the lifetime mod-elling.
In this research, controller data were acquired over a relatively short period of time (a few months) and only on two machines. As a result, the data were not used directly in the population-based modelling. However, the data were used to validate estimation of the distance travelled by the machine tool axes, based on the controller’s NC code and information on the number of machining cycles performed.
5.3.2.4 CONTEXT INFORMATION
Based on the literature and discussions with experts, the potential causes of ball screw degradation were identified and are shown in Figure 5.4. However, in the case ana-lysed most of this information was not available at all, or only to a limited extent. As a result, this information was not used in creating the data-driven model.
400 500 600 700 800 900 1000 1100 1200 1300 1400115
120
125
130
135
140
145
150
155
160
Time [min]
En
erg
y p
er
cycl
e[r
ela
tive
, w
ith
re
spec
t to
no
min
al t
orq
ue
]
400 500 600 700 800 900 1000 1100 1200 1300 1400115
120
125
130
135
140
145
150
155
160
Time [min]
En
erg
y p
er
cycl
e[r
ela
tive
, w
ith
re
spec
t to
no
min
al t
orq
ue
]
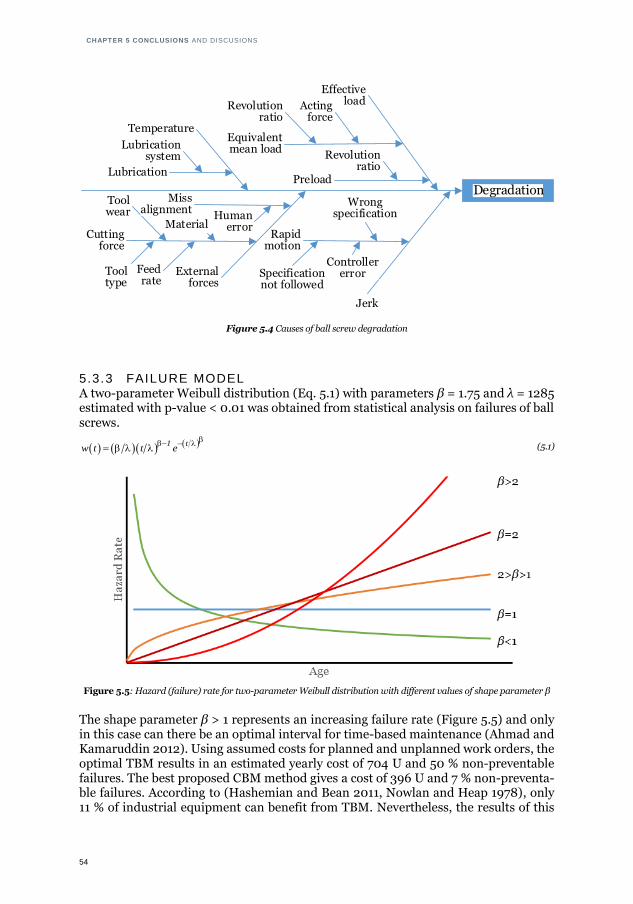
CHAPTER 5 CONCLUSIONS AND DISCUSIONS
54
Figure 5.4 Causes of ball screw degradation
5.3.3 FAILURE MODEL A two-parameter Weibull distribution (Eq. 5.1) with parameters β = 1.75 and λ = 1285 estimated with p-value < 0.01 was obtained from statistical analysis on failures of ball screws.
1 tw t t e
(5.1)
Figure 5.5: Hazard (failure) rate for two-parameter Weibull distribution with different values of shape parameter β
The shape parameter β > 1 represents an increasing failure rate (Figure 5.5) and only in this case can there be an optimal interval for time-based maintenance (Ahmad and Kamaruddin 2012). Using assumed costs for planned and unplanned work orders, the optimal TBM results in an estimated yearly cost of 704 U and 50 % non-preventable failures. The best proposed CBM method gives a cost of 396 U and 7 % non-preventa-ble failures. According to (Hashemian and Bean 2011, Nowlan and Heap 1978), only 11 % of industrial equipment can benefit from TBM. Nevertheless, the results of this
Degradation

CHAPTER 5 CONCLUSIONS AND DISCUSIONS
55
research indicate that even in those cases CBM could be beneficial and should be con-sidered.
5.3.4 CLASSIFICATION EVALUATION Classification accuracies were compared in the intermediate evaluation process of dif-ferent combinations of processing and classification methods. However, the goal is to provide support for maintenance decisions that include economic aspects. In a later step, the simulation-based economic evaluation, a 3 x 3 confusion matrix was used. Classification evaluation metrics other than accuracy could be applied to improve the model. The new metrics should be derived from dependencies between the confusion matrix and economic evaluation results. In this research, this is not a trivial task as multiclass classification was used.
5.4 FUTURE RESEARCH
Future work needs to be done to improve the predictive part of the presented method. A possible option is using a hidden semi-Markov Model.
To improve the feature and method selection step of presented approach, the data mining techniques could be applied to analyse how the accuracy of classification af-fects the predicted cost. This could lead to the classification evaluation metrics that will reflect the estimations from the predictive step.
It would be interesting to apply this method to other types of machines. As the method is not constrained by the source of CM (that is, the monitored components) it would be beneficial to apply the method to other types of components and CM. For example, features could be extracted from monitoring the machine tool main spindle.
Another extension of this work is to utilise identified data sources such as the signals of the internal machine tool controller. It would be beneficial if the offline double ball-bar measurements could be partially replaced by an automatic method based on online monitoring and automatic testing.
Further to presented work, it could be investigated if and to what extend the classifi-cation model build on one linear axis, can be applied to remaining linear axes of the machine tool. In applied data-driven approach, predictions were done with use of models built based on historical observations. It means that only earlier observed fail-ure could be predicted. The idea is to enchase historical data for one axis, where there is no previous observation of failure, with artificial failure data generated based on models built for another axis with previously observed failures.

56

57
REFERENCES

58

59
REFERENCES
Ahmad, R. and S. Kamaruddin (2012). "An overview of time-based and condition-based
maintenance in industrial application." Computers & Industrial Engineering 63(1):
135-149. doi:10.1016/j.cie.2012.02.002
Al-Dahidi, S., F. Di Maio, P. Baraldi and E. Zio (2016). "Remaining useful life estimation in
heterogeneous fleets working under variable operating conditions." Reliability
Engineering & System Safety 156: 109-124. doi:10.1016/j.ress.2016.07.019
Al-Najjar, B. (1997). Condition-based maintenance: selection and improvement of a cost-
effective vibration-based policy for rolling element bearings Doctoral Dissertation,
Lund University.
Alsyouf, I. (2009). "Maintenance practices in Swedish industries: Survey results." International Journal of Production Economics 121(1): 212-223.
doi:10.1016/j.ijpe.2009.05.005
Altintas, Y., A. Verl, C. Brecher, L. Uriarte and G. Pritschow (2011). "Machine tool feed
drives." CIRP Annals - Manufacturing Technology 60(2): 779-796.
Archenti, A. (2014). "Prediction of machined part accuracy from machining system
capability." CIRP Annals 63(1): 505-508. doi:10.1016/j.cirp.2014.03.040
Archenti, A., M. Nicolescu, G. Casterman and S. Hjelm (2012). "A New Method for Circular
Testing of Machine Tools Under Loaded Condition." Procedia CIRP 1(Supplement C):
575-580. doi:10.1016/j.procir.2012.05.002
Bahga, A. and V. K. Madisetti (2012). "Analyzing massive machine maintenance data in a
computing cloud." IEEE Transactions on Parallel and Distributed Systems 23(10):
1831-1843.
Benkedjouh, T., K. Medjaher, N. Zerhouni and S. Rechak (2013). "Remaining useful life
estimation based on nonlinear feature reduction and support vector regression."
Engineering Applications of Artificial Intelligence 26(7): 1751-1760.
doi:10.1016/j.engappai.2013.02.006
Binsaeid, S., S. Asfour, S. Cho and A. Onar (2009). "Machine ensemble approach for
simultaneous detection of transient and gradual abnormalities in end milling using
multisensor fusion." Journal of Materials Processing Technology 209(10): 4728-4738.
doi:10.1016/j.jmatprotec.2008.11.038
Bjorling, S.-e., D. Baglee, D. Galar and S. Singh (2013). "Maintenance Knowledge Management with Fusion of CMMS and CM."
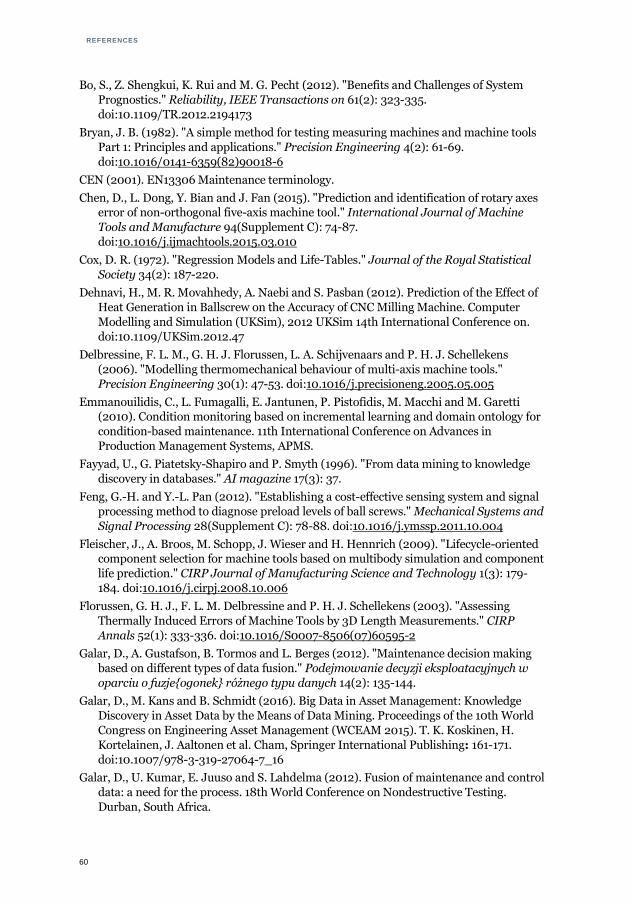
REFERENCES
60
Bo, S., Z. Shengkui, K. Rui and M. G. Pecht (2012). "Benefits and Challenges of System
Prognostics." Reliability, IEEE Transactions on 61(2): 323-335.
doi:10.1109/TR.2012.2194173
Bryan, J. B. (1982). "A simple method for testing measuring machines and machine tools
Part 1: Principles and applications." Precision Engineering 4(2): 61-69.
doi:10.1016/0141-6359(82)90018-6
CEN (2001). EN13306 Maintenance terminology.
Chen, D., L. Dong, Y. Bian and J. Fan (2015). "Prediction and identification of rotary axes error of non-orthogonal five-axis machine tool." International Journal of Machine
Tools and Manufacture 94(Supplement C): 74-87.
doi:10.1016/j.ijmachtools.2015.03.010
Cox, D. R. (1972). "Regression Models and Life-Tables." Journal of the Royal Statistical
Society 34(2): 187-220.
Dehnavi, H., M. R. Movahhedy, A. Naebi and S. Pasban (2012). Prediction of the Effect of
Heat Generation in Ballscrew on the Accuracy of CNC Milling Machine. Computer
Modelling and Simulation (UKSim), 2012 UKSim 14th International Conference on.
doi:10.1109/UKSim.2012.47
Delbressine, F. L. M., G. H. J. Florussen, L. A. Schijvenaars and P. H. J. Schellekens
(2006). "Modelling thermomechanical behaviour of multi-axis machine tools."
Precision Engineering 30(1): 47-53. doi:10.1016/j.precisioneng.2005.05.005
Emmanouilidis, C., L. Fumagalli, E. Jantunen, P. Pistofidis, M. Macchi and M. Garetti (2010). Condition monitoring based on incremental learning and domain ontology for
condition-based maintenance. 11th International Conference on Advances in
Production Management Systems, APMS.
Fayyad, U., G. Piatetsky-Shapiro and P. Smyth (1996). "From data mining to knowledge
discovery in databases." AI magazine 17(3): 37.
Feng, G.-H. and Y.-L. Pan (2012). "Establishing a cost-effective sensing system and signal
processing method to diagnose preload levels of ball screws." Mechanical Systems and
Signal Processing 28(Supplement C): 78-88. doi:10.1016/j.ymssp.2011.10.004
Fleischer, J., A. Broos, M. Schopp, J. Wieser and H. Hennrich (2009). "Lifecycle-oriented component selection for machine tools based on multibody simulation and component
life prediction." CIRP Journal of Manufacturing Science and Technology 1(3): 179-
184. doi:10.1016/j.cirpj.2008.10.006
Florussen, G. H. J., F. L. M. Delbressine and P. H. J. Schellekens (2003). "Assessing
Thermally Induced Errors of Machine Tools by 3D Length Measurements." CIRP
Annals 52(1): 333-336. doi:10.1016/S0007-8506(07)60595-2
Galar, D., A. Gustafson, B. Tormos and L. Berges (2012). "Maintenance decision making
based on different types of data fusion." Podejmowanie decyzji eksploatacyjnych w
oparciu o fuzje{ogonek} różnego typu danych 14(2): 135-144.
Galar, D., M. Kans and B. Schmidt (2016). Big Data in Asset Management: Knowledge
Discovery in Asset Data by the Means of Data Mining. Proceedings of the 10th World
Congress on Engineering Asset Management (WCEAM 2015). T. K. Koskinen, H.
Kortelainen, J. Aaltonen et al. Cham, Springer International Publishing: 161-171.
doi:10.1007/978-3-319-27064-7_16
Galar, D., U. Kumar, E. Juuso and S. Lahdelma (2012). Fusion of maintenance and control
data: a need for the process. 18th World Conference on Nondestructive Testing.
Durban, South Africa.

REFERENCES
61
Gao, R., L. Wang, R. Teti, D. Dornfeld, S. Kumara, M. Mori and M. Helu (2015). "Cloud-
enabled prognosis for manufacturing." CIRP Annals - Manufacturing Technology
64(2): 749-772. doi:10.1016/j.cirp.2015.05.011
Garinei, A. and R. Marsili (2012). "A new diagnostic technique for ball screw actuators."
Measurement 45(5): 819-828. doi:10.1016/j.measurement.2012.02.023
Ghodrati, B., S. H. Hoseinie and U. Kumar (2017). "Context-driven mean residual life
estimation of mining machinery." International Journal of Mining, Reclamation and
Environment: 1-9. doi:10.1080/17480930.2017.1308067
Gruber, T. (2009). Ontology. Encyclopedia of Database Systems. L. Liu and M. T. ÖZsu, Springer US: 1963-1965. doi:10.1007/978-0-387-39940-9_1318
Hall, M. A. (1999). "Correlation-based feature selection for machine learning."
Hashemian, H. M. and W. C. Bean (2011). "State-of-the-Art Predictive Maintenance
Techniques*." Instrumentation and Measurement, IEEE Transactions on 60(10):
3480-3492. doi:10.1109/TIM.2009.2036347
Hevner, A. R., S. T. March, J. Park and S. Ram (2004). "Design science in information
systems research." MIS Q. 28(1): 75-105.
Higgs, P. A., R. Parkin, M. Jackson, A. Al-Habaibeh, F. Zorriassatine and J. Coy (2004). "A Survey on Condition Monitoring Systems in Industry." (41758): 163-178.
doi:10.1115/ESDA2004-58216
ISO (2005). ISO 230-4: Test code for machine tools. Part 4: Circular tests for numerically
controlled machine tools. Switzerland.
ISO (2006). ISO 3408 - Ball screws.
ISO (2012). ISO 230-1: Test code for machine tools. Part 1: Geometric accuracy of
machines operating under no-load or quasi-static conditions. Switzerland.
Jardine, A. K. S., D. Lin and D. Banjevic (2006). "A review on machinery diagnostics and
prognostics implementing condition-based maintenance." Mechanical Systems and Signal Processing 20(7): 1483-1510. doi:10.1016/j.ymssp.2005.09.012
Jemielniak, K., L. Kwiatkowski and P. Wrzosek (1998). "Diagnosis of tool wear based on
cutting forces and acoustic emission measures as inputs to a neural network." Journal
of Intelligent Manufacturing 9(5): 447-455.
Jie, Z., X. Limei and L. Lin (2007). Equipment fault forecasting based on ARMA model.
Kakino, Y., Y. Ihara, Y. Nakatsu and K. Okamura (1987). "The measurement of motion
errors of NC machine tools and diagnosis of their origins by using telescoping magnetic
ball bar method." CIRP Annals-Manufacturing Technology 36(1): 377-380.
Kiang, M. Y. (2003). "A comparative assessment of classification methods." Decision Support Systems 35(4): 441-454. doi:10.1016/S0167-9236(02)00110-0
Kitcher, P. S. (2017). "Philosophy of science." Retrieved December 21, 2017, from
https://www.britannica.com/topic/philosophy-of-science.
Kohavi, R. and G. H. John (1997). "Wrappers for feature subset selection." Artificial
Intelligence 97(1): 273-324. doi:10.1016/S0004-3702(97)00043-X
Koukias, A., D. Nadoveza and D. Kiritsis (2015). "An ontology–based approach for
modelling technical documentation towards ensuring asset optimisation."
International Journal of Product Lifecycle Management 8(1): 24-45.
Lee, J., F. Wu, W. Zhao, M. Ghaffari, L. Liao and D. Siegel (2014). "Prognostics and health management design for rotary machinery systems—Reviews, methodology and
REFERENCES
62
applications." Mechanical Systems and Signal Processing 42(1): 314-334.
doi:10.1016/j.ymssp.2013.06.004
Lee, J., S. Yang, E. Lapira, H.-A. Kao and N. Yen (2013). "Methodology and Framework of
a Cloud-Based Prognostics and Health Management System for Manufacturing
Industry " Chemical Enginering Transcriptions 33: 205-210.
doi:10.3303/CET1333035
Lee, W. G., J. W. Lee, M. S. Hong, S. H. Nam, Y. Jeon and M. G. Lee (2015). "Failure
diagnosis system for a ball-screw by using vibration signals." Shock and Vibration
2015. doi:10.1155/2015/435870
March, S. T. and G. F. Smith (1995). "Design and natural science research on information technology." Decision Support Systems 15(4): 251-266. doi:10.1016/0167-
9236(94)00041-2
Mauro, S., S. Pastorelli and E. Johnston (2015). "Influence of controller parameters on the
life of ball screw feed drives." Advances in Mechanical Engineering 7(8): 1-11.
doi:10.1177/1687814015599728
McGuinness, D. L. v. H., Frank. (2004). "OWL Web Ontology Language." Retrieved 30
Jan 2018, 2018, from https://www.w3.org/TR/2004/REC-owl-features-20040210/.
Medina-Oliva, G., A. Voisin, M. Monnin and J. B. Leger (2014). "Predictive diagnosis
based on a fleet-wide ontology approach." Knowledge-Based Systems 68: 40-57.
Medina-Oliva, G., A. Voisin, M. Monnin, F. Peysson and J.-B. Leger (2012). Prognostics Assessment Using Fleet-wide Ontology. PHM Conference. Minneapolis, Minnesota,
USA.
Mitchell, T. M. (1997). Machine learning. WCB, McGraw-Hill Boston, MA:.
Monostori, L. (2014). Cyber-physical production systems: Roots, expectations and R&D
challenges. Procedia CIRP. doi:10.1016/j.procir.2014.03.115
Moriwaki, T. (2008). "Multi-functional machine tool." CIRP Annals 57(2): 736-749.
doi:10.1016/j.cirp.2008.09.004
Nowlan, F. S. and H. F. Heap (1978). Reliability centered maintenance. . San Francisco CA, United Airlines Inc.
Oates, B. J. (2006). Researching Information Systems and Computing, Sage Publications
Ltd.
Peffers, K., T. Tuunanen, M. Rothenberger and S. Chatterjee (2007). "A Design Science
Research Methodology for Information Systems Research." J. Manage. Inf. Syst.
24(3): 45-77. doi:10.2753/mis0742-1222240302
Prytz, R. (2014). Machine learning methods for vehicle predictive maintenance using off-
board and on-board data Licentiate Thesis, Halmstad University.
Prytz, R., S. Nowaczyk, T. Rögnvaldsson and S. Byttner (2013). Analysis of truck compressor failures based on logged vehicle data. Proceedings of the International
Conference on Data Mining (DMIN), The Steering Committee of The World Congress
in Computer Science, Computer Engineering and Applied Computing (WorldComp).
Prytz, R., S. Nowaczyk, T. Rögnvaldsson and S. Byttner (2015). "Predicting the need for
vehicle compressor repairs using maintenance records and logged vehicle data."
Engineering Applications of Artificial Intelligence 41(Supplement C): 139-150.
doi:10.1016/j.engappai.2015.02.009
Quan, Y., M. Zhou and Z. Luo (1998). "On-line robust identification of tool-wear via multi-
sensor neural-network fusion." Engineering Applications of Artificial Intelligence
11(6): 717-722. doi:10.1016/S0952-1976(98)00046-3
REFERENCES
63
Quinlan, J. R. (1993). C4.5: programs for machine learning, Morgan Kaufmann Publishers
Inc.
Randall, R. B. and J. Antoni (2011). "Rolling element bearing diagnostics—A tutorial."
Mechanical Systems and Signal Processing 25(2): 485-520.
doi:10.1016/j.ymssp.2010.07.017
Reichardt, C. S. and S. F. Rallis (1994). "The Qualitative-Quantitative Debate: New
Perspectives." New directions for program evaluation 61: 1-98.
Ren, L., L. Zhang, F. Tao, C. Zhao, X. Chai and X. Zhao (2013). "Cloud manufacturing: from concept to practice." Enterprise Information Systems: 1-24.
doi:10.1080/17517575.2013.839055
Renishaw (2012). Ballbar 20 softwar - Online instructions for using QC20-W and QC10
ballbar systems.
Robson, C. (2011). Real world research. Oxford, Wiley-Blackwell.
Schmidt, B., D. Galar and L. Wang (2015). Asset management evolution: from taxonomies
toward ontologies. Maintenance, Condition Monitoring and Diagnostics, Maintenance
Performance Measurement and Managemen. Oulu, Finland.
Schmidt, B., D. Galar and L. Wang (2016). Big data in maintenance decision support systems: aggregation of disparate data types. Euromaintenance 2016: 503-512.
Schmidt, B., D. Galar and L. Wang (2016). Context Awareness in Predictive Maintenance.
Current Trends in Reliability, Availability, Maintainability and Safety, Springer
International Publishing: 197-211. doi:10.1007/978-3-319-23597-4_15
Schmidt, B., K. Gandhi, L. Wang and D. Galar (2017). "Context preparation for predictive
analytics – a case from manufacturing industry." Journal of Quality in Maintenance
Engineering 23(3): 583-588. doi:10.1108/JQME-10-2016-0050
Schmidt, B. and L. Wang (2015). Cloud-based Predictive Maintenance. Flexible
Automation and Intelligent Manufacturing, FAIM2015. Wolverhampton, UK.
Schmidt, B. and L. Wang (2015). Predictive Maintenance: Literature Review and Future Trends. Flexible Automation and Intelligent Manufacturing, FAIM2015.
Wolverhampton, UK.
Schmidt, B. and L. Wang (2016). "Cloud-enhanced predictive maintenance." The
International Journal of Advanced Manufacturing Technology. doi:10.1007/s00170-
016-8983-8
Schmidt, B., L. Wang and D. Galar (2017). "Semantic Framework for Predictive
Maintenance in a Cloud Environment." Procedia CIRP 62: 583-588.
doi:10.1016/j.procir.2016.06.047
Si, X.-S., W. Wang, C.-H. Hu and D.-H. Zhou (2011). "Remaining useful life estimation – A
review on the statistical data driven approaches." European Journal of Operational
Research 213(1): 1-14. doi:10.1016/j.ejor.2010.11.018
Siemens (2016). Circularity test in SINUMERIK Operate (828D and 840D sl). I. Siemens Industry, Siemens Industry, Inc.
Sikorska, J. Z., M. Hodkiewicz and L. Ma (2011). "Prognostic modelling options for
remaining useful life estimation by industry." Mechanical Systems and Signal
Processing 25(5): 1803-1836. doi:10.1016/j.ymssp.2010.11.018
Sun, B., Y. Li, T. Ye and Y. Ren (2015). "A Novel Ontology Approach to Support Design for
Reliability considering Environmental Effects." The Scientific World Journal 2015.

REFERENCES
64
Takeda, H., P. Veerkamp and H. Yoshikawa (1990). "Modeling design process." AI
magazine 11(4): 37.
Teti, R., K. Jemielniak, G. O’Donnell and D. Dornfeld (2010). "Advanced monitoring of
machining operations." CIRP Annals - Manufacturing Technology 59(2): 717-739.
doi:10.1016/j.cirp.2010.05.010
THK (2015). Precision Ball Screws DIN Standard Compliant Ball Screw 2015. L. THK CO.
Tsai, P. C., C. C. Cheng and Y. C. Hwang (2014). "Ball screw preload loss detection using ball pass frequency." Mechanical Systems and Signal Processing 48(1–2): 77-91.
doi:10.1016/j.ymssp.2014.02.017
TWPL. (2015). "What is ISO 55000?", from
http://www.assetmanagementstandards.com/.
Uddin, M. S., S. Ibaraki, A. Matsubara and T. Matsushita (2009). "Prediction and
compensation of machining geometric errors of five-axis machining centers with
kinematic errors." Precision Engineering 33(2): 194-201.
doi:10.1016/j.precisioneng.2008.06.001
UTHAH. (2006). "Precision Machine Design: Ball Screw Selection and Calculations."
Retrieved 23 Jan 2018, from http://www.mech.utah.edu/~me7960/lectures/Topic4-
BallscrewCalculations.pdf.
Wang, L., X. V. Wang, L. Gao and J. Váncza (2014). "A cloud-based approach for WEEE remanufacturing." CIRP Annals - Manufacturing Technology 63(1): 409-412.
doi:10.1016/j.cirp.2014.03.114
Wang, X. H., Z. Da Qing, G. Tao and H. K. Pung (2004). Ontology based context modeling
and reasoning using OWL. Pervasive Computing and Communications Workshops,
2004. Proceedings of the Second IEEE Annual Conference on.
doi:10.1109/PERCOMW.2004.1276898
Verl, A., U. Heisel, M. Walther and D. Maier (2009). "Sensorless automated condition
monitoring for the control of the predictive maintenance of machine tools." CIRP
Annals - Manufacturing Technology 58(1): 375-378. doi:10.1016/j.cirp.2009.03.039
Vogl, G. W., M. A. Donmez and A. Archenti (2016). "Diagnostics for geometric
performance of machine tool linear axes." CIRP Annals 65(1): 377-380. doi:10.1016/j.cirp.2016.04.117
Voisin, A., G. Medina-Oliva, M. Monnin, J.-B. Léger and B. Iung (2013). Fleet-wide
Diagnostic and Prognostic Assessment. Annual Conference of the Prognostics and
Health Management Society
Wong, M. A. and T. Lane (1981). A kTH Nearest Neighbour Clustering Procedure.
Computer Science and Statistics: Proceedings of the 13th Symposium on the Interface.
W. F. Eddy. New York, NY, Springer US: 308-311. doi:10.1007/978-1-4613-9464-8_46
Xia, H.-j., W.-c. Peng, X.-b. Ouyang, X.-d. Chen, S.-j. Wang and X. Chen (2017).
"Identification of geometric errors of rotary axis on multi-axis machine tool based on
kinematic analysis method using double ball bar." International Journal of Machine
Tools and Manufacture 122(Supplement C): 161-175.
doi:10.1016/j.ijmachtools.2017.07.006
Xia, K., L. Gao, L. Wang, W. Li and K.-M. Chao (2015). "A Semantic Information Services Framework for Sustainable WEEE Management Toward Cloud-Based
Remanufacturing." Journal of Manufacturing Science and Engineering 137(6):
061011-061011. doi:10.1115/1.4030008

REFERENCES
65
Ylipää, T., A. Skoogh, J. Bokrantz and M. Gopalakrishnan (2017). "Identification of
maintenance improvement potential using OEE assessment." International Journal of
Productivity and Performance Management 66(1): 126-143. doi:doi:10.1108/IJPPM-
01-2016-0028
Zargarbashi, S. H. H. and J. R. R. Mayer (2006). "Assessment of machine tool trunnion
axis motion error, using magnetic double ball bar." International Journal of Machine
Tools and Manufacture 46(14): 1823-1834. doi:10.1016/j.ijmachtools.2005.11.010
Zhang, L., Y. Luo, F. Tao, B. H. Li, L. Ren, X. Zhang, H. Guo, Y. Cheng, A. Hu and Y. Liu
(2014). "Cloud manufacturing: a new manufacturing paradigm." Enterprise
Information Systems 8(2): 167-187.

66

67
INCLUDED ARTICLES

68
69
INCLUDED ARTICLES
PAPER I
Schmidt, B., Wang, L. 2016. "Cloud-enhanced predictive maintenance", International Journal of Advanced Manufacturing Technology, http://dx.doi.org/10.1007/s00170-016-8983-8 (online ahead of print).
PAPER I I
Schmidt, B., Gandhi, K., Wang, L., Galar, D. 2017. "Context preparation for predictive analytics: A case from manufacturing industry", Journal of Quality in Maintenance Engineering 23(3), p.341–354.
PAPER I I I
Schmidt, B., Wang, L., Galar, D. 2017. "Semantic framework for predictive mainte-nance in a cloud environment", 10th Conference on Intelligent Computation in Man-ufacturing Engineering - CIRP ICME '16, Procedia CIRP 62, p. 583–588.
PAPER IV
Schmidt, B., Gandhi, K., Wang, L., Ng, A.H.C. (journal draft). "Integration of events and offline measurement data from a population of similar entities for condition mon-itoring", to be submitted to International Journal of Computer Integrated Manufac-turing, Special Issue on Smart Cyber-Physical System Applications in Production and Logistics .
PAPER V
Schmidt, B., Gandhi, K., Wang, L. (Accepted). "Diagnosis of machine tools: An assess-ment based on double ball-bar measurements from a population of similar machines", submitted to the 51st CIRP Conference on Manufacturing Systems – CIRP CMS '18, 16-18 May, Stockholm, Sweden.


71
PAPER I

72
ORIGINAL ARTICLE
Cloud-enhanced predictive maintenance
Bernard Schmidt1 & Lihui Wang2,1
Received: 25 November 2015 /Accepted: 26 May 2016# Springer-Verlag London 2016
Abstract Maintenance of assembly and manufacturingequipment is crucial to ensure productivity, product qual-ity, on-time delivery, and a safe working environment.Predictive maintenance is an approach that utilises thecondition monitoring data to predict the future machineconditions and makes decisions upon this prediction. Themain aim of the present research is to achieve an im-provement in predictive condition-based maintenance de-cision making through a cloud-based approach with us-age of wide information content. For the improvement, itis crucial to identify and track not only condition relateddata but also context data. Context data allows betterutilisation of condition monitoring data as well as anal-ysis based on a machine population. The objective of thispaper is to outline the first steps of a framework andmethodology to handle and process maintenance, produc-tion, and factory related data from the first lifecyclephase to the operation and maintenance phase. Initialcase study aims to validate the work in the context ofreal industrial applications.
Keywords Predictivemaintenance . Condition-basedmaintenance . Context awareness . Cloudmanufacturing
1 Introduction
Maintenance of assembly and manufacturing equipment iscrucial to ensure productivity, product quality, on-time deliv-ery, and a safe working environment. Implementation of ef-fective prognosis for maintenance can bring variety of benefitsincluding increased system safety, improved operational reli-ability, increased maintenance effectiveness, reduced mainte-nance inspection and repair-induced failure, and reducedlifecycle cost [1].
Maintenance approaches in industrial history haveevolved over time [2], and they are still the challengingresearch topics. At earlier stages, the CorrectiveMaintenance also known as reactive maintenance orrun-to-failure was used. Later, an approach called pre-ventive maintenance (PM) was focused on taking actionsbefore a failure occurs. This approach has evolved toCondition-Based Maintenance (CBM), where the deci-sions are made based on the machine condition indica-tors obtained in most cases through measurement sys-tems. Predictive maintenance (PdM) and Prognosticsand Health Management (PHM) are approaches that uti-lise the condition monitoring data to predict the futuremachine health state and make decisions upon thisprediction.
Three key steps [3] of CBM are: (1) data acquisition,(2) data processing, and (3) maintenance decision mak-ing. In this model, the diagnosis and prognosis are in-cluded in the last step as a part of the decision-makingprocess.
Standard EN 13306 [4] defines PdM as CBM carriedout following a forecast derived from the analysis andevaluation of significant parameters of the degradationof the item. According to the standard, the approaches tomaintenance can be categorised as shown in Fig. 1.
* Bernard [email protected]
1 School of Engineering Science, University of Skövde, Skövde 54128, Sweden
2 Department of Production Engineering, KTH Royal Institute ofTechnology, Stockholm 100 44, Sweden
Int J Adv Manuf TechnolDOI 10.1007/s00170-016-8983-8
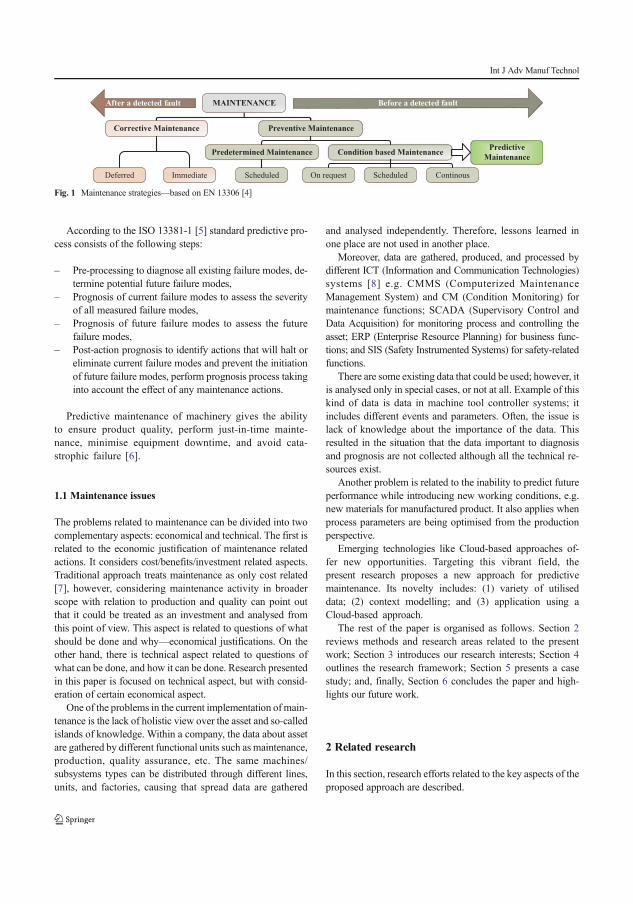
According to the ISO 13381-1 [5] standard predictive pro-cess consists of the following steps:
– Pre-processing to diagnose all existing failure modes, de-termine potential future failure modes,
– Prognosis of current failure modes to assess the severityof all measured failure modes,
– Prognosis of future failure modes to assess the futurefailure modes,
– Post-action prognosis to identify actions that will halt oreliminate current failure modes and prevent the initiationof future failure modes, perform prognosis process takinginto account the effect of any maintenance actions.
Predictive maintenance of machinery gives the abilityto ensure product quality, perform just-in-time mainte-nance, minimise equipment downtime, and avoid cata-strophic failure [6].
1.1 Maintenance issues
The problems related to maintenance can be divided into twocomplementary aspects: economical and technical. The first isrelated to the economic justification of maintenance relatedactions. It considers cost/benefits/investment related aspects.Traditional approach treats maintenance as only cost related[7], however, considering maintenance activity in broaderscope with relation to production and quality can point outthat it could be treated as an investment and analysed fromthis point of view. This aspect is related to questions of whatshould be done and why—economical justifications. On theother hand, there is technical aspect related to questions ofwhat can be done, and how it can be done. Research presentedin this paper is focused on technical aspect, but with consid-eration of certain economical aspect.
One of the problems in the current implementation ofmain-tenance is the lack of holistic view over the asset and so-calledislands of knowledge. Within a company, the data about assetare gathered by different functional units such as maintenance,production, quality assurance, etc. The same machines/subsystems types can be distributed through different lines,units, and factories, causing that spread data are gathered
and analysed independently. Therefore, lessons learned inone place are not used in another place.
Moreover, data are gathered, produced, and processed bydifferent ICT (Information and Communication Technologies)systems [8] e.g. CMMS (Computerized MaintenanceManagement System) and CM (Condition Monitoring) formaintenance functions; SCADA (Supervisory Control andData Acquisition) for monitoring process and controlling theasset; ERP (Enterprise Resource Planning) for business func-tions; and SIS (Safety Instrumented Systems) for safety-relatedfunctions.
There are some existing data that could be used; however, itis analysed only in special cases, or not at all. Example of thiskind of data is data in machine tool controller systems; itincludes different events and parameters. Often, the issue islack of knowledge about the importance of the data. Thisresulted in the situation that the data important to diagnosisand prognosis are not collected although all the technical re-sources exist.
Another problem is related to the inability to predict futureperformance while introducing new working conditions, e.g.new materials for manufactured product. It also applies whenprocess parameters are being optimised from the productionperspective.
Emerging technologies like Cloud-based approaches of-fer new opportunities. Targeting this vibrant field, thepresent research proposes a new approach for predictivemaintenance. Its novelty includes: (1) variety of utiliseddata; (2) context modelling; and (3) application using aCloud-based approach.
The rest of the paper is organised as follows. Section 2reviews methods and research areas related to the presentwork; Section 3 introduces our research interests; Section 4outlines the research framework; Section 5 presents a casestudy; and, finally, Section 6 concludes the paper and high-lights our future work.
2 Related research
In this section, research efforts related to the key aspects of theproposed approach are described.
MAINTENANCE
Preventive MaintenanceCorrective Maintenance
Condition based MaintenancePredetermined Maintenance
On request ContinousScheduledScheduledDeferred Immediate
Predictive Maintenance
Fig. 1 Maintenance strategies—based on EN 13306 [4]
Int J Adv Manuf Technol
2.1 Cloud-based approaches
2.1.1 Cloud computing
Cloud computing can be considered as evolution of grid com-puting with orientation to business [9]. The idea of the cloudcomputing is to provide on-demand services through theInternet that can be categorised in three groups:Infrastructure as a Service (IaaS), Platform as a Service(PaaS), and Software as a Service (SaaS). In recent years,there has been a noticed trend to apply the cloud computingmodel in the manufacturing industry [10].
During the past years, the cloud approach for CM hasfound several implementations; several companies are provid-ing commercial services. Still, not many if any provide thePdM. Recently, Lee et al. [11] presented the methodologyfor adapting Prediction and Health Management (PHM) sys-tems in a cloud environment, exemplified by IMS WatchdogAgent® Toolbox. In the presented example, the system hasbeen adopted to run on virtual machines in cloud with en-hanced configurability enabled by modularisation of its func-tionality. It has also been mentioned that cloud computingallows recording of data and status of machine throughoutits whole life span. Therefore, degradation process can betracked by both the machine builder and the user.
2.1.2 Internet of things
Internet of Things (IoT) is a paradigm where everyday objectsare connected to the Internet. It allows devices communicationwith each other with minimum human intervention [12]. Theterm has been initially used by Kevin Ashton in 1999. In [13],he describes the IoT as follows:
‘If we had computers that knew everything there was toknow about things—using data they gathered without anyhelp from us—we would be able to track and count every-thing, and greatly reducewaste, loss and cost.Wewould knowwhen things needed replacing, repairing or recalling, andwhether they were fresh or past their best.’
2.1.3 Cloud manufacturing
Cloud manufacturing (CMfg) paradigm is a result of combi-nation of cloud computing, the IoT, service-oriented technol-ogies, and high performance computing [14]. It transformsmanufacturing resources and capabilities into manufacturingservices. It is not the simple deployment of manufacturingsoftware tools in the computing cloud. The physical resourcesintegrated in the manufacturing cloud are able to offer adap-tive, secure, and on-demand manufacturing services over theInternet of Thinks [15]. One of the services included in CMfgconcept is Maintenance-as-a-Service [16].
2.2 Disparate data source
Integration of disparate data sources that are commonly avail-able in industry can be integrated for better maintenance de-cision making. The cloud approach is pointed as a feasiblesolution for this integration [8, 17]. XML language is present-ed as a tool that can be used for data integration. However,there is no research reported on how this data can be used toimprove the prediction. In [18], the architecture and the basicconcept of an integration platform for maintenance have beenpresented.
2.3 Fleet-wide approach
Research described in [19, 20] presented an approach of pre-dictive maintenance at the fleet level. By adding not only datafrom identical units but also similar ones, the higher volume ofdata can be obtained to reduce uncertainty. Semantic model isused to determine similar cases that have been registered in thepast among the fleet. Indicated context have been divided into:
– Technical context—technical features,– Dysfunctional context—degradation modes,– Operational context—operational conditions– Service context—operation modes– Application context—context indicated as needed for
optimisation.
It applies a similarity-based prognosis approach for RUL(remaining useful life) estimation as presented in [21].Multiple models are built upon data from previous run-to-failure cases, and data from current case are compared withthe obtained models. Prediction is done based on the modelsthat are closest to the current situation. Offline stage is used todetermine the aggregation function, which allows conversionof multidimensional time series of faulty and nominal signalsinto mono-dimensional health time series. Relevance VectorMachine (RVC) and Sparse Bayes Learning (SBL) are used toutilise new knowledge for prognosis. The approach has beentested in the referenced work through a case study for dieselengines. In online stage, the time series from the current unitare converted to health time series. Among learned time series,the similar ones are found and similarity-based interpolation isapplied for RUL prediction.
2.4 Massive machine maintenance data analysis
In [22], the cloud-based case-based reasoning has beenadopted for fault prediction. Case-based reasoning (CBR) isan effective way for solving problems. Cases are created basedon data fault and sensor data retrieved from maintenance da-tabase and machine sensor data, respectively. When a newcase is created, this is updated in a local node. To maintain
Int J Adv Manuf Technol
the case database, some cases need to be updated or removed.In this approach, the local nodes are used for real-time mon-itoring and prognosis, while cluster computing in the cloud isused for case-base creation and its maintenance. In the localnode, the ‘target case’ is created and all similar cases from thelocal database are retrieved. Based on the similarity, the casesare ranked. Each case is associated with a fault type. This isused to predict the failure. However, this is prediction of whattype of failure can occur, but not when it will occur. Thepresented framework is of big potential, but methods for esti-mation of RUL have not been mentioned. Moreover, it doesnot fully utilise the cloud computing concept. It is limited todistributed and cluster computing.
2.5 Information fusion
In predictive maintenance, there is a need to handle differentdata from different sources. These are the inputs to the processas well as intermediate results. Foo and Ng [23] provided anoverview on high-level information fusion. Data and informa-tion fusion has been explained as a technique that involves aprocess of combining data from multiple inputs with the aimto obtain information that is better than that would be derivedfrom each of the sources individually. Data fusion is used inpredictive maintenance in various ways. Recently, a review onmultisensory data fusion state-of-the-art was reported in [24].Information fusion (IF) research has an origin in military area;however, it was also applied in other areas. As an example, thework done in [25] presented the application of IF inmanufacturing for simulation-based decision support.
The IF and CBM processes have many in common.Therefore, knowledge from IF research could be applied forimprovements in CBM. Figure 2 presents an overview of theIF and CBM processes. For proper maintenance decisionmaking, the processes included in high-level IF should bewithhigh importance.
2.6 Challenges in predictive maintenance
In analysing surveys and state-of-the-art papers in the field ofpredictive maintenance, several challenges are found.
2.6.1 Context data utilisation
Beside condition monitoring data, there is a need to collectand utilise in predictions effect of external environmentalvariables such as operational condition data, as well as ef-fects of minor maintenance actions [26]. Moreover, bettercorrelation of machine condition with process and inspectiondata are required to provide context needed to differentiatebetween process and machine degradation [6]. The appropri-ate means to synthesise data in this way remains an openresearch question [27].
2.6.2 Knowledge management
Knowledge extracted during process should be managed inthe way that it can be reused in later cases. Incorporate sub-jective information from the area experts in RUL estimationand effect on it for prediction reliability.
2.6.3 Uncertainty management
It is important to develop robust algorithms that can accuratelyperform the prognosis in the presence of uncertainty as well asmethods to quantify the confidence in the results of prognosis[28].
2.6.4 Systematic approach
There is a lack of systematic way in predictive maintenancesystem design and implementation [29]. It should also includean economical justification of a selected approach [1]. To beable to compare and select proper approach, there is a need ofan evaluation framework for predictive methods.
3 Problem definitions
This research aims at improving maintenance activities byapplying cloud-based predictive maintenance approach withutilisation of variety of data types and sources. The main as-pects of the research can be summarised by the following fourresearch questions.
RQ1. In what ways can predictive maintenance activitiesfor one entity be improved by utilising information from mul-tiple similar entities? This research question aims to studypossible improvements for predictive maintenance. The hy-pothesis for this question can be expressed by the followingmathematical formula (1).
I in KAk <X
i
I in KAi <X
i
I in⋃i
KAi ð1Þ
where I in KAx is the information that can be obtained fromxth knowledge area, ∑ is a fusion operator for information,and U is a fusion operator for knowledge areas.
Knowledge area can be interpreted as knowledge abouteach separate entity or group of entities. It can also beinterpreted as knowledge from specific perspective e.g. main-tenance, production, and quality. Very often, data from thoseperspectives are analysed independently. Lee et al. [6] provid-ed an example where overall equipment effectiveness (OEE)only provides the status of production efficiency without rela-tionship between performance and the cost involved in sus-taining a certain OEE level. Furthermore, machine condition
Int J Adv Manuf Technol
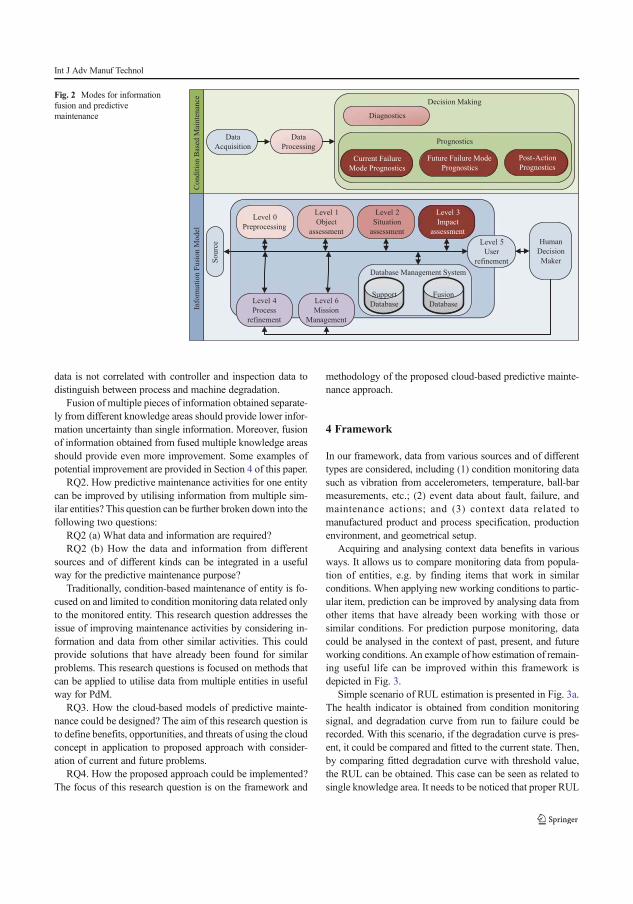
data is not correlated with controller and inspection data todistinguish between process and machine degradation.
Fusion of multiple pieces of information obtained separate-ly from different knowledge areas should provide lower infor-mation uncertainty than single information. Moreover, fusionof information obtained from fused multiple knowledge areasshould provide even more improvement. Some examples ofpotential improvement are provided in Section 4 of this paper.
RQ2. How predictive maintenance activities for one entitycan be improved by utilising information from multiple sim-ilar entities? This question can be further broken down into thefollowing two questions:
RQ2 (a) What data and information are required?RQ2 (b) How the data and information from different
sources and of different kinds can be integrated in a usefulway for the predictive maintenance purpose?
Traditionally, condition-based maintenance of entity is fo-cused on and limited to condition monitoring data related onlyto the monitored entity. This research question addresses theissue of improving maintenance activities by considering in-formation and data from other similar activities. This couldprovide solutions that have already been found for similarproblems. This research questions is focused on methods thatcan be applied to utilise data from multiple entities in usefulway for PdM.
RQ3. How the cloud-based models of predictive mainte-nance could be designed? The aim of this research question isto define benefits, opportunities, and threats of using the cloudconcept in application to proposed approach with consider-ation of current and future problems.
RQ4. How the proposed approach could be implemented?The focus of this research question is on the framework and
methodology of the proposed cloud-based predictive mainte-nance approach.
4 Framework
In our framework, data from various sources and of differenttypes are considered, including (1) condition monitoring datasuch as vibration from accelerometers, temperature, ball-barmeasurements, etc.; (2) event data about fault, failure, andmaintenance actions; and (3) context data related tomanufactured product and process specification, productionenvironment, and geometrical setup.
Acquiring and analysing context data benefits in variousways. It allows us to compare monitoring data from popula-tion of entities, e.g. by finding items that work in similarconditions. When applying new working conditions to partic-ular item, prediction can be improved by analysing data fromother items that have already been working with those orsimilar conditions. For prediction purpose monitoring, datacould be analysed in the context of past, present, and futureworking conditions. An example of how estimation of remain-ing useful life can be improved within this framework isdepicted in Fig. 3.
Simple scenario of RUL estimation is presented in Fig. 3a.The health indicator is obtained from condition monitoringsignal, and degradation curve from run to failure could berecorded. With this scenario, if the degradation curve is pres-ent, it could be compared and fitted to the current state. Then,by comparing fitted degradation curve with threshold value,the RUL can be obtained. This case can be seen as related tosingle knowledge area. It needs to be noticed that proper RUL
Level 0
Preprocessing
Level 1
Object
assessment
Level 2
Situation
assessment
Level 4
Process
refinement
Level 5
User
refinement
Level 3
Impact
assessment
Sourc
e
Support
Database
Fusion
Database
Database Management System
Human
Decision
Maker
Info
rmat
ion F
usi
on M
odel
Condit
ion B
ased
Mai
nte
nan
ce
Data
Acquisition
Data
Processing
Decision Making
Diagnostics
Prognostics
Current Failure
Mode Prognostics
Future Failure Mode
Prognostics
Post-Action
Prognostics
Level 6
Mission
Management
Fig. 2 Modes for informationfusion and predictivemaintenance
Int J Adv Manuf Technol
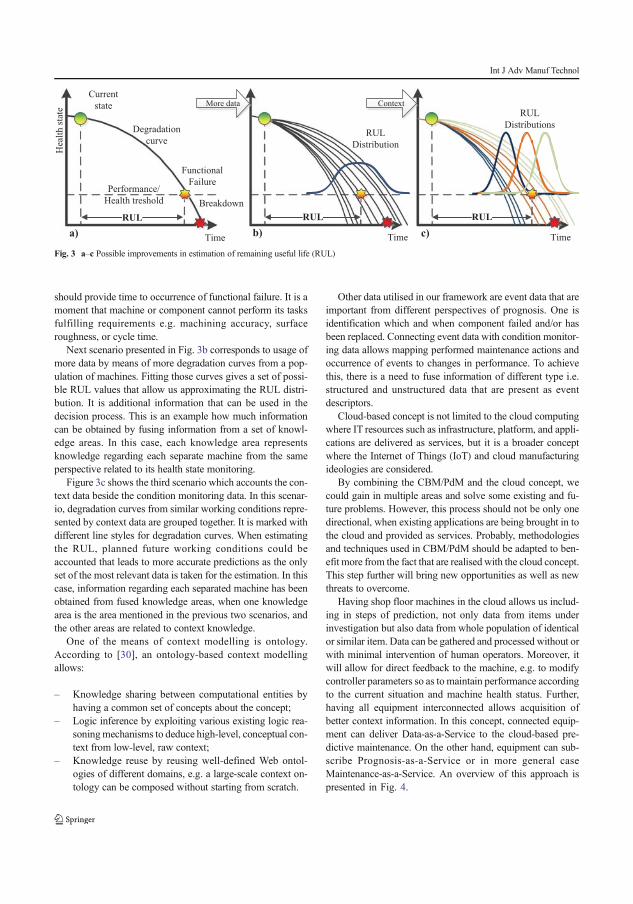
should provide time to occurrence of functional failure. It is amoment that machine or component cannot perform its tasksfulfilling requirements e.g. machining accuracy, surfaceroughness, or cycle time.
Next scenario presented in Fig. 3b corresponds to usage ofmore data by means of more degradation curves from a pop-ulation of machines. Fitting those curves gives a set of possi-ble RUL values that allow us approximating the RUL distri-bution. It is additional information that can be used in thedecision process. This is an example how much informationcan be obtained by fusing information from a set of knowl-edge areas. In this case, each knowledge area representsknowledge regarding each separate machine from the sameperspective related to its health state monitoring.
Figure 3c shows the third scenario which accounts the con-text data beside the condition monitoring data. In this scenar-io, degradation curves from similar working conditions repre-sented by context data are grouped together. It is marked withdifferent line styles for degradation curves. When estimatingthe RUL, planned future working conditions could beaccounted that leads to more accurate predictions as the onlyset of the most relevant data is taken for the estimation. In thiscase, information regarding each separated machine has beenobtained from fused knowledge areas, when one knowledgearea is the area mentioned in the previous two scenarios, andthe other areas are related to context knowledge.
One of the means of context modelling is ontology.According to [30], an ontology-based context modellingallows:
– Knowledge sharing between computational entities byhaving a common set of concepts about the concept;
– Logic inference by exploiting various existing logic rea-soningmechanisms to deduce high-level, conceptual con-text from low-level, raw context;
– Knowledge reuse by reusing well-defined Web ontol-ogies of different domains, e.g. a large-scale context on-tology can be composed without starting from scratch.
Other data utilised in our framework are event data that areimportant from different perspectives of prognosis. One isidentification which and when component failed and/or hasbeen replaced. Connecting event data with condition monitor-ing data allows mapping performed maintenance actions andoccurrence of events to changes in performance. To achievethis, there is a need to fuse information of different type i.e.structured and unstructured data that are present as eventdescriptors.
Cloud-based concept is not limited to the cloud computingwhere IT resources such as infrastructure, platform, and appli-cations are delivered as services, but it is a broader conceptwhere the Internet of Things (IoT) and cloud manufacturingideologies are considered.
By combining the CBM/PdM and the cloud concept, wecould gain in multiple areas and solve some existing and fu-ture problems. However, this process should not be only onedirectional, when existing applications are being brought in tothe cloud and provided as services. Probably, methodologiesand techniques used in CBM/PdM should be adapted to ben-efit more from the fact that are realised with the cloud concept.This step further will bring new opportunities as well as newthreats to overcome.
Having shop floor machines in the cloud allows us includ-ing in steps of prediction, not only data from items underinvestigation but also data from whole population of identicalor similar item. Data can be gathered and processed without orwith minimal intervention of human operators. Moreover, itwill allow for direct feedback to the machine, e.g. to modifycontroller parameters so as to maintain performance accordingto the current situation and machine health status. Further,having all equipment interconnected allows acquisition ofbetter context information. In this concept, connected equip-ment can deliver Data-as-a-Service to the cloud-based pre-dictive maintenance. On the other hand, equipment can sub-scribe Prognosis-as-a-Service or in more general caseMaintenance-as-a-Service. An overview of this approach ispresented in Fig. 4.
Time
Performance/
Health treshold
Functional
Failure
Breakdown
Current
state
Degradation
curve
RUL
Time
RUL
Distribution
Time
RUL
Distributions
More data Context
Hea
lth s
tate
a) b) c)
Fig. 3 a–c Possible improvements in estimation of remaining useful life (RUL)
Int J Adv Manuf Technol
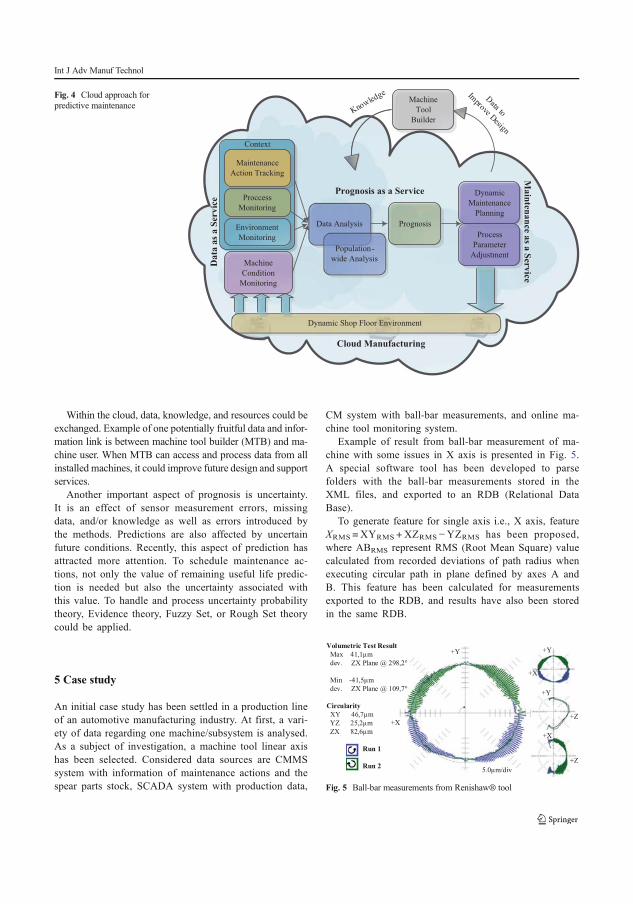
Within the cloud, data, knowledge, and resources could beexchanged. Example of one potentially fruitful data and infor-mation link is between machine tool builder (MTB) and ma-chine user. When MTB can access and process data from allinstalled machines, it could improve future design and supportservices.
Another important aspect of prognosis is uncertainty.It is an effect of sensor measurement errors, missingdata, and/or knowledge as well as errors introduced bythe methods. Predictions are also affected by uncertainfuture conditions. Recently, this aspect of prediction hasattracted more attention. To schedule maintenance ac-tions, not only the value of remaining useful life predic-tion is needed but also the uncertainty associated withthis value. To handle and process uncertainty probabilitytheory, Evidence theory, Fuzzy Set, or Rough Set theorycould be applied.
5 Case study
An initial case study has been settled in a production lineof an automotive manufacturing industry. At first, a vari-ety of data regarding one machine/subsystem is analysed.As a subject of investigation, a machine tool linear axishas been selected. Considered data sources are CMMSsystem with information of maintenance actions and thespear parts stock, SCADA system with production data,
CM system with ball-bar measurements, and online ma-chine tool monitoring system.
Example of result from ball-bar measurement of ma-chine with some issues in X axis is presented in Fig. 5.A special software tool has been developed to parsefolders with the ball-bar measurements stored in theXML files, and exported to an RDB (Relational DataBase).
To generate feature for single axis i.e., X axis, featureXRMS = XYRMS + XZRMS −YZRMS has been proposed,where ABRMS represent RMS (Root Mean Square) valuecalculated from recorded deviations of path radius whenexecuting circular path in plane defined by axes A andB. This feature has been calculated for measurementsexported to the RDB, and results have also been storedin the same RDB.
+Y
+X
+Y
+
Volumetric Test Result
Max 41,1μm
dev. ZX Plane @ 298,2°
Min -41,5μm
dev. ZX Plane @ 109,7°
Circularity
XY 46,7μm
YZ 25,2μm
ZX 82,6μm
Run 1
Run 2
+X
+Z
+Z
+X
+Y
5.0μm/div
Fig. 5 Ball-bar measurements from Renishaw® tool
Machine
Condition
Monitoring
Machine
Tool
Builder
Data Analysis
Dynamic
Maintenance
Planning
Process
Parameter
Adjustment
Prognosis
Population-
wide Analysis
Maintenance as a Service
Cloud Manufacturing
Dat
a as
a S
ervi
ce
Prognosis as a Service
Context
Environment
Monitoring
Dynamic Shop Floor Environment
Proccess
Monitoring
Maintenance
Action Tracking
Fig. 4 Cloud approach forpredictive maintenance
Int J Adv Manuf Technol
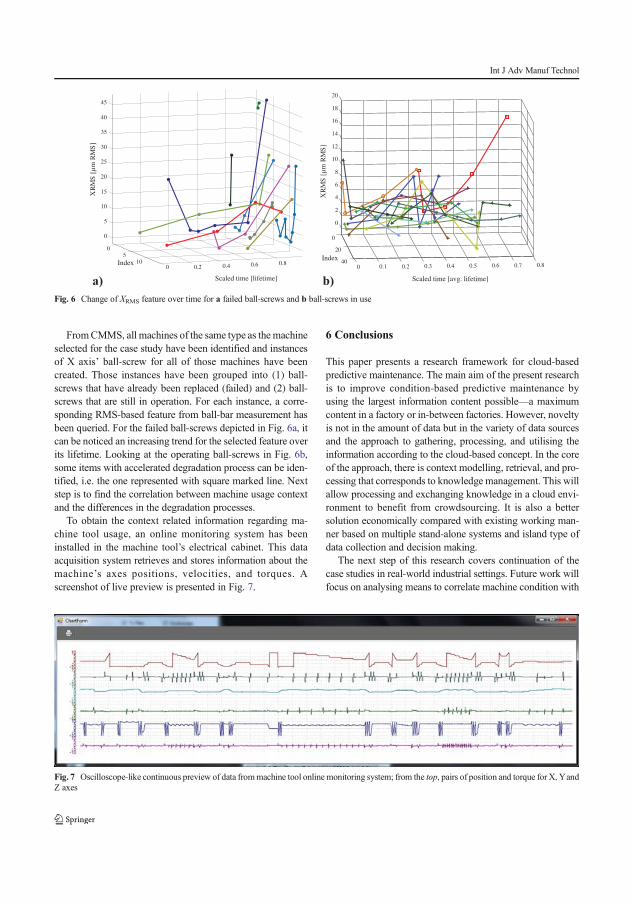
FromCMMS, all machines of the same type as the machineselected for the case study have been identified and instancesof X axis’ ball-screw for all of those machines have beencreated. Those instances have been grouped into (1) ball-screws that have already been replaced (failed) and (2) ball-screws that are still in operation. For each instance, a corre-sponding RMS-based feature from ball-bar measurement hasbeen queried. For the failed ball-screws depicted in Fig. 6a, itcan be noticed an increasing trend for the selected feature overits lifetime. Looking at the operating ball-screws in Fig. 6b,some items with accelerated degradation process can be iden-tified, i.e. the one represented with square marked line. Nextstep is to find the correlation between machine usage contextand the differences in the degradation processes.
To obtain the context related information regarding ma-chine tool usage, an online monitoring system has beeninstalled in the machine tool’s electrical cabinet. This dataacquisition system retrieves and stores information about themachine’s axes positions, velocities, and torques. Ascreenshot of live preview is presented in Fig. 7.
6 Conclusions
This paper presents a research framework for cloud-basedpredictive maintenance. The main aim of the present researchis to improve condition-based predictive maintenance byusing the largest information content possible—a maximumcontent in a factory or in-between factories. However, noveltyis not in the amount of data but in the variety of data sourcesand the approach to gathering, processing, and utilising theinformation according to the cloud-based concept. In the coreof the approach, there is context modelling, retrieval, and pro-cessing that corresponds to knowledge management. This willallow processing and exchanging knowledge in a cloud envi-ronment to benefit from crowdsourcing. It is also a bettersolution economically compared with existing working man-ner based on multiple stand-alone systems and island type ofdata collection and decision making.
The next step of this research covers continuation of thecase studies in real-world industrial settings. Future work willfocus on analysing means to correlate machine condition with
a) b)
05
100 0.2 0.4 0.6 0.8
0
5
10
15
20
25
30
35
40
45
Scaled time [lifetime]
Index
]S
MR
mμ[S
MR
X
0
20
400 0.1 0.2 0.3 0.4 0.5 0.6 0.7 0.8
0
2
4
6
8
10
12
14
16
18
20
Scaled time [avg. lifetime]
Index
]S
MR
mμ[S
MR
X
Fig. 6 Change of XRMS feature over time for a failed ball-screws and b ball-screws in use
Fig. 7 Oscilloscope-like continuous preview of data frommachine tool online monitoring system; from the top, pairs of position and torque for X, YandZ axes
Int J Adv Manuf Technol
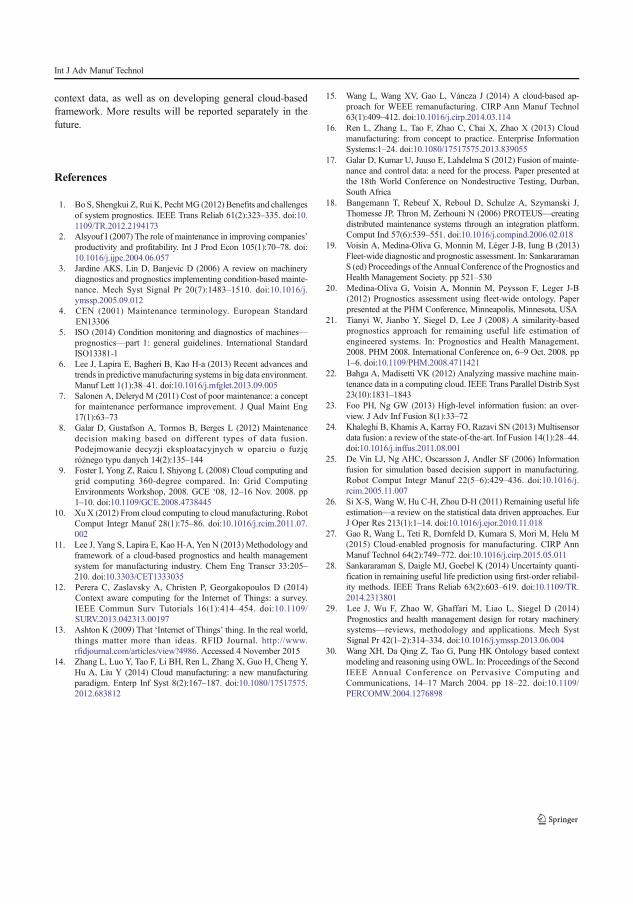
context data, as well as on developing general cloud-basedframework. More results will be reported separately in thefuture.
References
1. Bo S, Shengkui Z, Rui K, PechtMG (2012) Benefits and challengesof system prognostics. IEEE Trans Reliab 61(2):323–335. doi:10.1109/TR.2012.2194173
2. Alsyouf I (2007) The role of maintenance in improving companies’productivity and profitability. Int J Prod Econ 105(1):70–78. doi:10.1016/j.ijpe.2004.06.057
3. Jardine AKS, Lin D, Banjevic D (2006) A review on machinerydiagnostics and prognostics implementing condition-based mainte-nance. Mech Syst Signal Pr 20(7):1483–1510. doi:10.1016/j.ymssp.2005.09.012
4. CEN (2001) Maintenance terminology. European StandardEN13306
5. ISO (2014) Condition monitoring and diagnostics of machines—prognostics—part 1: general guidelines. International StandardISO13381-1
6. Lee J, Lapira E, Bagheri B, Kao H-a (2013) Recent advances andtrends in predictive manufacturing systems in big data environment.Manuf Lett 1(1):38–41. doi:10.1016/j.mfglet.2013.09.005
7. Salonen A, Deleryd M (2011) Cost of poor maintenance: a conceptfor maintenance performance improvement. J Qual Maint Eng17(1):63–73
8. Galar D, Gustafson A, Tormos B, Berges L (2012) Maintenancedecision making based on different types of data fusion.Podejmowanie decyzji eksploatacyjnych w oparciu o fuzjęróżnego typu danych 14(2):135–144
9. Foster I, Yong Z, Raicu I, Shiyong L (2008) Cloud computing andgrid computing 360-degree compared. In: Grid ComputingEnvironments Workshop, 2008. GCE ‘08, 12–16 Nov. 2008. pp1–10. doi:10.1109/GCE.2008.4738445
10. XuX (2012) From cloud computing to cloud manufacturing. RobotComput Integr Manuf 28(1):75–86. doi:10.1016/j.rcim.2011.07.002
11. Lee J, Yang S, Lapira E, Kao H-A, Yen N (2013) Methodology andframework of a cloud-based prognostics and health managementsystem for manufacturing industry. Chem Eng Transcr 33:205–210. doi:10.3303/CET1333035
12. Perera C, Zaslavsky A, Christen P, Georgakopoulos D (2014)Context aware computing for the Internet of Things: a survey.IEEE Commun Surv Tutorials 16(1):414–454. doi:10.1109/SURV.2013.042313.00197
13. Ashton K (2009) That ‘Internet of Things’ thing. In the real world,things matter more than ideas. RFID Journal. http://www.rfidjournal.com/articles/view?4986. Accessed 4 November 2015
14. Zhang L, Luo Y, Tao F, Li BH, Ren L, Zhang X, Guo H, Cheng Y,Hu A, Liu Y (2014) Cloud manufacturing: a new manufacturingparadigm. Enterp Inf Syst 8(2):167–187. doi:10.1080/17517575.2012.683812
15. Wang L, Wang XV, Gao L, Váncza J (2014) A cloud-based ap-proach for WEEE remanufacturing. CIRP Ann Manuf Technol63(1):409–412. doi:10.1016/j.cirp.2014.03.114
16. Ren L, Zhang L, Tao F, Zhao C, Chai X, Zhao X (2013) Cloudmanufacturing: from concept to practice. Enterprise InformationSystems:1–24. doi:10.1080/17517575.2013.839055
17. Galar D, Kumar U, Juuso E, Lahdelma S (2012) Fusion of mainte-nance and control data: a need for the process. Paper presented atthe 18th World Conference on Nondestructive Testing, Durban,South Africa
18. Bangemann T, Rebeuf X, Reboul D, Schulze A, Szymanski J,Thomesse JP, Thron M, Zerhouni N (2006) PROTEUS—creatingdistributed maintenance systems through an integration platform.Comput Ind 57(6):539–551. doi:10.1016/j.compind.2006.02.018
19. Voisin A, Medina-Oliva G, Monnin M, Léger J-B, Iung B (2013)Fleet-wide diagnostic and prognostic assessment. In: SankararamanS (ed) Proceedings of theAnnual Conference of the Prognostics andHealth Management Society. pp 521–530
20. Medina-Oliva G, Voisin A, Monnin M, Peysson F, Leger J-B(2012) Prognostics assessment using fleet-wide ontology. Paperpresented at the PHM Conference, Minneapolis, Minnesota, USA
21. Tianyi W, Jianbo Y, Siegel D, Lee J (2008) A similarity-basedprognostics approach for remaining useful life estimation ofengineered systems. In: Prognostics and Health Management,2008. PHM 2008. International Conference on, 6–9 Oct. 2008. pp1–6. doi:10.1109/PHM.2008.4711421
22. Bahga A, Madisetti VK (2012) Analyzing massive machine main-tenance data in a computing cloud. IEEE Trans Parallel Distrib Syst23(10):1831–1843
23. Foo PH, Ng GW (2013) High-level information fusion: an over-view. J Adv Inf Fusion 8(1):33–72
24. Khaleghi B, Khamis A, Karray FO, Razavi SN (2013) Multisensordata fusion: a review of the state-of-the-art. Inf Fusion 14(1):28–44.doi:10.1016/j.inffus.2011.08.001
25. De Vin LJ, Ng AHC, Oscarsson J, Andler SF (2006) Informationfusion for simulation based decision support in manufacturing.Robot Comput Integr Manuf 22(5–6):429–436. doi:10.1016/j.rcim.2005.11.007
26. Si X-S, Wang W, Hu C-H, Zhou D-H (2011) Remaining useful lifeestimation—a review on the statistical data driven approaches. EurJ Oper Res 213(1):1–14. doi:10.1016/j.ejor.2010.11.018
27. Gao R, Wang L, Teti R, Dornfeld D, Kumara S, Mori M, Helu M(2015) Cloud-enabled prognosis for manufacturing. CIRP AnnManuf Technol 64(2):749–772. doi:10.1016/j.cirp.2015.05.011
28. Sankararaman S, Daigle MJ, Goebel K (2014) Uncertainty quanti-fication in remaining useful life prediction using first-order reliabil-ity methods. IEEE Trans Reliab 63(2):603–619. doi:10.1109/TR.2014.2313801
29. Lee J, Wu F, Zhao W, Ghaffari M, Liao L, Siegel D (2014)Prognostics and health management design for rotary machinerysystems—reviews, methodology and applications. Mech SystSignal Pr 42(1–2):314–334. doi:10.1016/j.ymssp.2013.06.004
30. Wang XH, Da Qing Z, Tao G, Pung HK Ontology based contextmodeling and reasoning using OWL. In: Proceedings of the SecondIEEE Annual Conference on Pervasive Computing andCommunications, 14–17 March 2004. pp 18–22. doi:10.1109/PERCOMW.2004.1276898
Int J Adv Manuf Technol


73
PAPER II

74
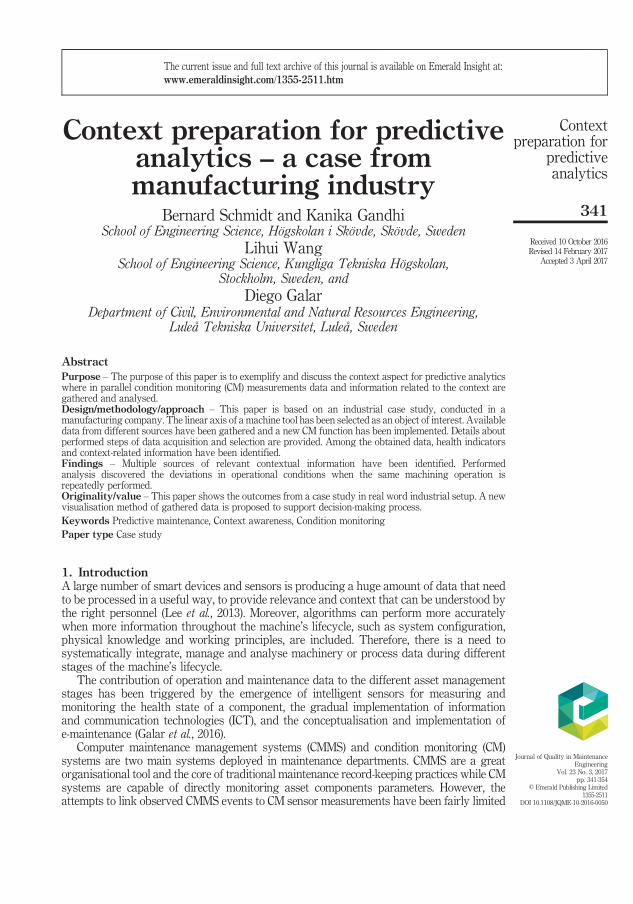
Context preparation for predictiveanalytics – a case frommanufacturing industry
Bernard Schmidt and Kanika GandhiSchool of Engineering Science, Högskolan i Skövde, Skövde, Sweden
Lihui WangSchool of Engineering Science, Kungliga Tekniska Högskolan,
Stockholm, Sweden, andDiego Galar
Department of Civil, Environmental and Natural Resources Engineering,Luleå Tekniska Universitet, Luleå, Sweden
AbstractPurpose – The purpose of this paper is to exemplify and discuss the context aspect for predictive analyticswhere in parallel condition monitoring (CM) measurements data and information related to the context aregathered and analysed.Design/methodology/approach – This paper is based on an industrial case study, conducted in amanufacturing company. The linear axis of a machine tool has been selected as an object of interest. Availabledata from different sources have been gathered and a new CM function has been implemented. Details aboutperformed steps of data acquisition and selection are provided. Among the obtained data, health indicatorsand context-related information have been identified.Findings – Multiple sources of relevant contextual information have been identified. Performedanalysis discovered the deviations in operational conditions when the same machining operation isrepeatedly performed.Originality/value – This paper shows the outcomes from a case study in real word industrial setup. A newvisualisation method of gathered data is proposed to support decision-making process.Keywords Predictive maintenance, Context awareness, Condition monitoringPaper type Case study
1. IntroductionA large number of smart devices and sensors is producing a huge amount of data that needto be processed in a useful way, to provide relevance and context that can be understood bythe right personnel (Lee et al., 2013). Moreover, algorithms can perform more accuratelywhen more information throughout the machine’s lifecycle, such as system configuration,physical knowledge and working principles, are included. Therefore, there is a need tosystematically integrate, manage and analyse machinery or process data during differentstages of the machine’s lifecycle.The contribution of operation and maintenance data to the different asset management
stages has been triggered by the emergence of intelligent sensors for measuring andmonitoring the health state of a component, the gradual implementation of informationand communication technologies (ICT), and the conceptualisation and implementation ofe-maintenance (Galar et al., 2016).Computer maintenance management systems (CMMS) and condition monitoring (CM)
systems are two main systems deployed in maintenance departments. CMMS are a greatorganisational tool and the core of traditional maintenance record-keeping practices while CMsystems are capable of directly monitoring asset components parameters. However, theattempts to link observed CMMS events to CM sensor measurements have been fairly limited
Journal of Quality in MaintenanceEngineering
Vol. 23 No. 3, 2017pp. 341-354
© Emerald Publishing Limited1355-2511
DOI 10.1108/JQME-10-2016-0050
Received 10 October 2016Revised 14 February 2017Accepted 3 April 2017
The current issue and full text archive of this journal is available on Emerald Insight at:www.emeraldinsight.com/1355-2511.htm
341
Contextpreparation for
predictiveanalytics
Dow
nloa
ded
by H
OG
SKO
LAN
I SK
OV
DE
At 0
4:33
08
Dec
embe
r 201
7 (P
T)
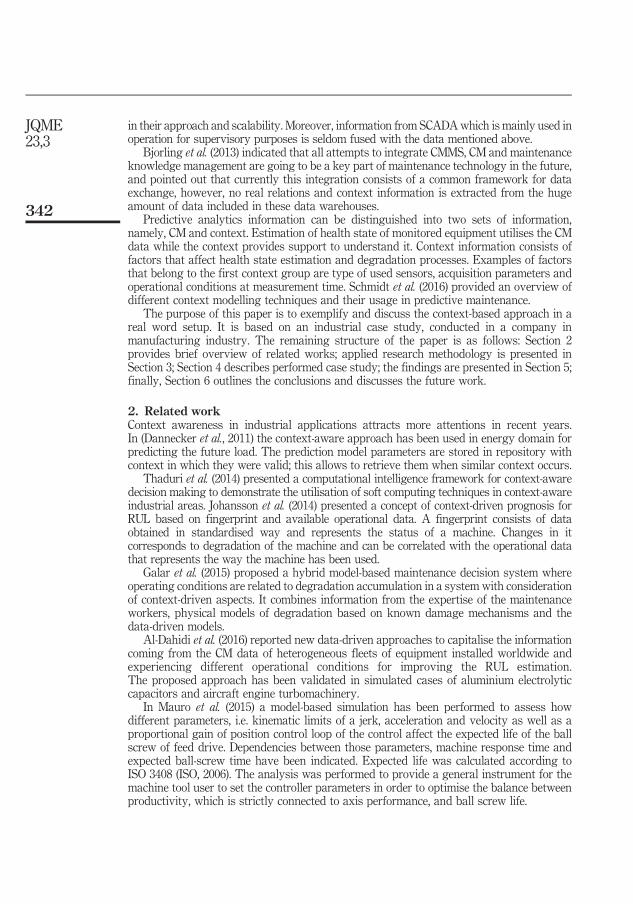
in their approach and scalability. Moreover, information from SCADAwhich is mainly used inoperation for supervisory purposes is seldom fused with the data mentioned above.Bjorling et al. (2013) indicated that all attempts to integrate CMMS, CM and maintenance
knowledge management are going to be a key part of maintenance technology in the future,and pointed out that currently this integration consists of a common framework for dataexchange, however, no real relations and context information is extracted from the hugeamount of data included in these data warehouses.Predictive analytics information can be distinguished into two sets of information,
namely, CM and context. Estimation of health state of monitored equipment utilises the CMdata while the context provides support to understand it. Context information consists offactors that affect health state estimation and degradation processes. Examples of factorsthat belong to the first context group are type of used sensors, acquisition parameters andoperational conditions at measurement time. Schmidt et al. (2016) provided an overview ofdifferent context modelling techniques and their usage in predictive maintenance.The purpose of this paper is to exemplify and discuss the context-based approach in a
real word setup. It is based on an industrial case study, conducted in a company inmanufacturing industry. The remaining structure of the paper is as follows: Section 2provides brief overview of related works; applied research methodology is presented inSection 3; Section 4 describes performed case study; the findings are presented in Section 5;finally, Section 6 outlines the conclusions and discusses the future work.
2. Related workContext awareness in industrial applications attracts more attentions in recent years.In (Dannecker et al., 2011) the context-aware approach has been used in energy domain forpredicting the future load. The prediction model parameters are stored in repository withcontext in which they were valid; this allows to retrieve them when similar context occurs.Thaduri et al. (2014) presented a computational intelligence framework for context-aware
decision making to demonstrate the utilisation of soft computing techniques in context-awareindustrial areas. Johansson et al. (2014) presented a concept of context-driven prognosis forRUL based on fingerprint and available operational data. A fingerprint consists of dataobtained in standardised way and represents the status of a machine. Changes in itcorresponds to degradation of the machine and can be correlated with the operational datathat represents the way the machine has been used.Galar et al. (2015) proposed a hybrid model-based maintenance decision system where
operating conditions are related to degradation accumulation in a system with considerationof context-driven aspects. It combines information from the expertise of the maintenanceworkers, physical models of degradation based on known damage mechanisms and thedata-driven models.Al-Dahidi et al. (2016) reported new data-driven approaches to capitalise the information
coming from the CM data of heterogeneous fleets of equipment installed worldwide andexperiencing different operational conditions for improving the RUL estimation.The proposed approach has been validated in simulated cases of aluminium electrolyticcapacitors and aircraft engine turbomachinery.In Mauro et al. (2015) a model-based simulation has been performed to assess how
different parameters, i.e. kinematic limits of a jerk, acceleration and velocity as well as aproportional gain of position control loop of the control affect the expected life of the ballscrew of feed drive. Dependencies between those parameters, machine response time andexpected ball-screw time have been indicated. Expected life was calculated according toISO 3408 (ISO, 2006). The analysis was performed to provide a general instrument for themachine tool user to set the controller parameters in order to optimise the balance betweenproductivity, which is strictly connected to axis performance, and ball screw life.
342
JQME23,3
Dow
nloa
ded
by H
OG
SKO
LAN
I SK
OV
DE
At 0
4:33
08
Dec
embe
r 201
7 (P
T)
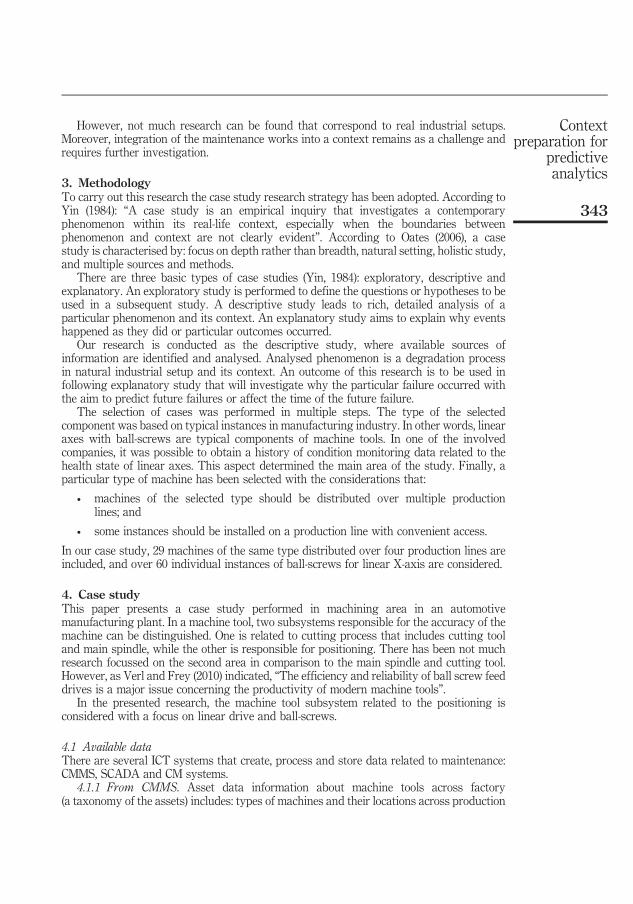
However, not much research can be found that correspond to real industrial setups.Moreover, integration of the maintenance works into a context remains as a challenge andrequires further investigation.
3. MethodologyTo carry out this research the case study research strategy has been adopted. According toYin (1984): “A case study is an empirical inquiry that investigates a contemporaryphenomenon within its real-life context, especially when the boundaries betweenphenomenon and context are not clearly evident”. According to Oates (2006), a casestudy is characterised by: focus on depth rather than breadth, natural setting, holistic study,and multiple sources and methods.There are three basic types of case studies (Yin, 1984): exploratory, descriptive and
explanatory. An exploratory study is performed to define the questions or hypotheses to beused in a subsequent study. A descriptive study leads to rich, detailed analysis of aparticular phenomenon and its context. An explanatory study aims to explain why eventshappened as they did or particular outcomes occurred.Our research is conducted as the descriptive study, where available sources of
information are identified and analysed. Analysed phenomenon is a degradation processin natural industrial setup and its context. An outcome of this research is to be used infollowing explanatory study that will investigate why the particular failure occurred withthe aim to predict future failures or affect the time of the future failure.The selection of cases was performed in multiple steps. The type of the selected
component was based on typical instances in manufacturing industry. In other words, linearaxes with ball-screws are typical components of machine tools. In one of the involvedcompanies, it was possible to obtain a history of condition monitoring data related to thehealth state of linear axes. This aspect determined the main area of the study. Finally, aparticular type of machine has been selected with the considerations that:
• machines of the selected type should be distributed over multiple productionlines; and
• some instances should be installed on a production line with convenient access.
In our case study, 29 machines of the same type distributed over four production lines areincluded, and over 60 individual instances of ball-screws for linear X-axis are considered.
4. Case studyThis paper presents a case study performed in machining area in an automotivemanufacturing plant. In a machine tool, two subsystems responsible for the accuracy of themachine can be distinguished. One is related to cutting process that includes cutting tooland main spindle, while the other is responsible for positioning. There has been not muchresearch focussed on the second area in comparison to the main spindle and cutting tool.However, as Verl and Frey (2010) indicated, “The efficiency and reliability of ball screw feeddrives is a major issue concerning the productivity of modern machine tools”.In the presented research, the machine tool subsystem related to the positioning is
considered with a focus on linear drive and ball-screws.
4.1 Available dataThere are several ICT systems that create, process and store data related to maintenance:CMMS, SCADA and CM systems.
4.1.1 From CMMS. Asset data information about machine tools across factory(a taxonomy of the assets) includes: types of machines and their locations across production
343
Contextpreparation for
predictiveanalytics
Dow
nloa
ded
by H
OG
SKO
LAN
I SK
OV
DE
At 0
4:33
08
Dec
embe
r 201
7 (P
T)
lines; hierarchical structure of machine tool with the division into units, subunits,components and spare parts.Work orders (WO) include information regarding machine/unit/component on which
maintenance action was performed; type of maintenance action; descriptions (symptoms,comments on performed actions); list of acquired spare parts.
4.1.2 From SCADA. In SCADA system, information about production process aregathered. For each station information about performed cycles includes processing time,waiting time, produced variant and reasons for stop.
4.1.3 From CM. For monitoring of machine accuracy and health status of axes, periodicoff-line measurements are performed by using a ball-bar measuring device. In this test, thegeometric errors present in machine tool are measured. It allows detecting inaccuraciesinduced by its controller and linear-drive system (Kuric et al., 2013).Ball-bar measurement (BBM) indicates the health status of the machine axis. An example
of the measurement result from a machine tool with some issues is presented in Figure 1.Each single test corresponds to two axes – a planar motion. Performance of the axis dependsnot only on the ball screw but also other components like end-bearings, bearing housing,control system, etc.Several features are extracted from the measurement, to mention some: circularity,
backlash, reversal spikes, lateral play, cyclic error and servo mismatch.4.1.4 From reports. There are also available reports from ball-bar CM measurements.
Those reports are created when symptoms of degradation or malfunction are observed indata. Based on the analysis performed by expert, suggestion to inspect or replacecomponents of specific linear axes is provided. Moreover, some of the reports frommeasurements that have been performed confirm that maintenance action solved theproblem, includes the analysis of replaced components. Those reports depict the realdamage to the components, how severe it was and in some cases indicate the potential causethat initiated the degradation.
4.2 Physics of failureAccording to ISO 3408 (ISO, 2006) nominal life expectancy L of a ball screw based onmaterial fatigue can be estimated as presented in Equations (1)-(3):
L ¼ Ca
Fma
� �3U106 (1)
Volumetric Test ResultsMaximumdeviation
Minimumdeviation
Sphericity
CircularityXYYZZX
41.1�mZX Plane @ 298.2°
–41.5�mZX Plane @ 109.7°82.6�m
46.7�m25.2�m82.6�m
+Y+Y
+Y
+X
+X
+Z
+Z
+X
Run 1
Run 2
Figure 1.Result of ball-barmeasurement (BBM)obtained with use ofRenishaw® measuringsystem
344
JQME23,3
Dow
nloa
ded
by H
OG
SKO
LAN
I SK
OV
DE
At 0
4:33
08
Dec
embe
r 201
7 (P
T)
Fma ¼ Fpr 1þ Fm
3Fpr
� �32
(2)
Fm ¼ffiffiffiffiffiffiffiffiffiffiffiffiffiffiffiffiffiffiffiffiffiffiffiffiffiffiffiffiffiffiffiffiffiffiffiffiffiffiffiffiffiffiffiffiffiffiffiffiffiffiffiffiffiffiffiffiffiffiffiffiffiffiffiffiffiffiffiffiffiffiffiffiffiffiffiffiq1Un1UF
31þq2Un2UF
32þ � � � þqnUnnUF
3n
q1Un1þq2Un2þ � � � þqnUnn
3
s
(3)
where Ca is dynamic load capacity, Fma is equivalent mean load, Fm is mean load, Fpr ispreloading tension, Fi is trust, ni is speed, qi is time percentage. An extended form ofEquation (1) presented in Equation (4) includes additional factor fw that correlates lifeexpectancy with different operational conditions:
L ¼ Ca
f wUFma
� �3U106 (4)
The value of fw can vary in ranges from 1-1.2 for smooth movement without impacts up to2-3.5 for movements with high velocity and strong vibrations and impacts.
4.3 Additional monitoringOver already recorded and stored data, an online system to acquire information directlyfrom linear-drive controllers has been deployed. The selected machine tool controller has thecapabilities to configure and record selected parameters. However, there are limitationsregarding the length of recording and negative effects on performance of the humanmachine interface of the machine. An external acquisition system is implemented toovercome those issues. It enables the online monitoring of torque and velocity applied inlinear axes of the selected machine tool. Those data have been configured with respect toball-screw fatigue-based degradation model (ISO, 2006).
4.4 Data acquisitionAt initial stage safety and security issues do not allow direct connection between theimplemented framework and the mentioned ICT systems. For the purpose of this case study,data has been imported through CSV and Excel files. The architecture of implemented dataacquisition and processing is presented in Figure 2.
4.4.1 Data description. Data from CMMS and SCADA systems are available throughuser interfaces. It is possible to export those in CSV/Excel formats. BBMs data are stored inXML files, with raw recorded measurements, as well as calculated predefined indicators.
Data
Acquisition
Local Data
Storage
CM Ball-bar
measurements
Replacement time
of component
Instance of
component
Historical
instance
Current
Instance
PdM
CMMSWork Orders
Spare parts,
Assets
Processing
Algorithms
RMS
Machine
utilisation
SQL
Context
Figure 2.Overview of data
acquisition
345
Contextpreparation for
predictiveanalytics
Dow
nloa
ded
by H
OG
SKO
LAN
I SK
OV
DE
At 0
4:33
08
Dec
embe
r 201
7 (P
T)
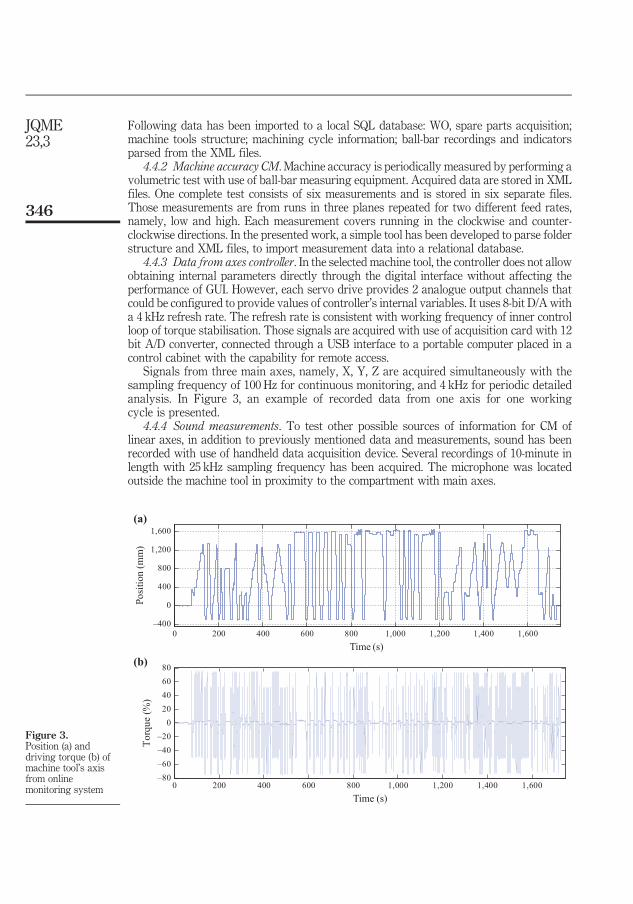
Following data has been imported to a local SQL database: WO, spare parts acquisition;machine tools structure; machining cycle information; ball-bar recordings and indicatorsparsed from the XML files.
4.4.2 Machine accuracy CM. Machine accuracy is periodically measured by performing avolumetric test with use of ball-bar measuring equipment. Acquired data are stored in XMLfiles. One complete test consists of six measurements and is stored in six separate files.Those measurements are from runs in three planes repeated for two different feed rates,namely, low and high. Each measurement covers running in the clockwise and counter-clockwise directions. In the presented work, a simple tool has been developed to parse folderstructure and XML files, to import measurement data into a relational database.
4.4.3 Data from axes controller. In the selected machine tool, the controller does not allowobtaining internal parameters directly through the digital interface without affecting theperformance of GUI. However, each servo drive provides 2 analogue output channels thatcould be configured to provide values of controller’s internal variables. It uses 8-bit D/A witha 4 kHz refresh rate. The refresh rate is consistent with working frequency of inner controlloop of torque stabilisation. Those signals are acquired with use of acquisition card with 12bit A/D converter, connected through a USB interface to a portable computer placed in acontrol cabinet with the capability for remote access.Signals from three main axes, namely, X, Y, Z are acquired simultaneously with the
sampling frequency of 100 Hz for continuous monitoring, and 4 kHz for periodic detailedanalysis. In Figure 3, an example of recorded data from one axis for one workingcycle is presented.
4.4.4 Sound measurements. To test other possible sources of information for CM oflinear axes, in addition to previously mentioned data and measurements, sound has beenrecorded with use of handheld data acquisition device. Several recordings of 10-minute inlength with 25 kHz sampling frequency has been acquired. The microphone was locatedoutside the machine tool in proximity to the compartment with main axes.
0 200 400 600 800 1,000 1,200 1,400 1,600
–400
0
400
800
1,200
1,600
Time (s)
Po
siti
on
(m
m)
0 200 400 600 800 1,000 1,200 1,400 1,600–80
–60
–40
–20
0
20
40
60
80
Time (s)
To
rqu
e (%
)
(a)
(b)
Figure 3.Position (a) anddriving torque (b) ofmachine tool’s axisfrom onlinemonitoring system
346
JQME23,3
Dow
nloa
ded
by H
OG
SKO
LAN
I SK
OV
DE
At 0
4:33
08
Dec
embe
r 201
7 (P
T)
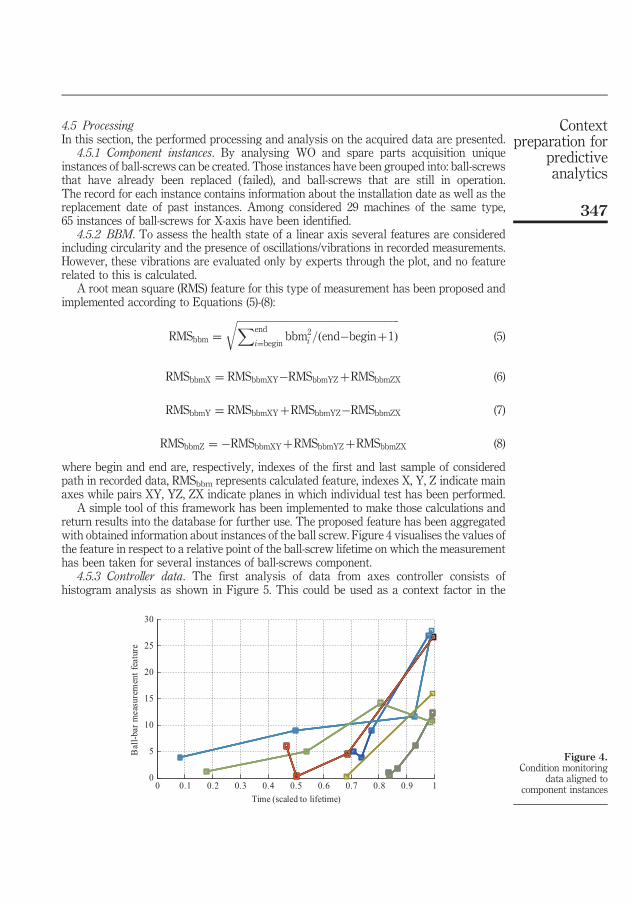
4.5 ProcessingIn this section, the performed processing and analysis on the acquired data are presented.
4.5.1 Component instances. By analysing WO and spare parts acquisition uniqueinstances of ball-screws can be created. Those instances have been grouped into: ball-screwsthat have already been replaced ( failed), and ball-screws that are still in operation.The record for each instance contains information about the installation date as well as thereplacement date of past instances. Among considered 29 machines of the same type,65 instances of ball-screws for X-axis have been identified.
4.5.2 BBM. To assess the health state of a linear axis several features are consideredincluding circularity and the presence of oscillations/vibrations in recorded measurements.However, these vibrations are evaluated only by experts through the plot, and no featurerelated to this is calculated.A root mean square (RMS) feature for this type of measurement has been proposed and
implemented according to Equations (5)-(8):
RMSbbm ¼ffiffiffiffiffiffiffiffiffiffiffiffiffiffiffiffiffiffiffiffiffiffiffiffiffiffiffiffiffiffiffiffiffiffiffiffiffiffiffiffiffiffiffiffiffiffiffiffiffiffiffiffiffiffiffiffiffiffiffiffiffiffiffiffiXend
i¼begin bbm2i = end�beginþ1ð Þ
r(5)
RMSbbmX ¼ RMSbbmXY�RMSbbmYZþRMSbbmZX (6)
RMSbbmY ¼ RMSbbmXYþRMSbbmYZ�RMSbbmZX (7)
RMSbbmZ ¼ �RMSbbmXYþRMSbbmYZþRMSbbmZX (8)
where begin and end are, respectively, indexes of the first and last sample of consideredpath in recorded data, RMSbbm represents calculated feature, indexes X, Y, Z indicate mainaxes while pairs XY, YZ, ZX indicate planes in which individual test has been performed.A simple tool of this framework has been implemented to make those calculations and
return results into the database for further use. The proposed feature has been aggregatedwith obtained information about instances of the ball screw. Figure 4 visualises the values ofthe feature in respect to a relative point of the ball-screw lifetime on which the measurementhas been taken for several instances of ball-screws component.
4.5.3 Controller data. The first analysis of data from axes controller consists ofhistogram analysis as shown in Figure 5. This could be used as a context factor in the
0 0.1 0.2 0.3 0.4 0.5 0.6 0.7 0.8 0.9 10
5
10
15
20
25
30
Time (scaled to lifetime)
Bal
l-bar
mea
sure
men
t fe
atur
e
Figure 4.Condition monitoring
data aligned tocomponent instances
347
Contextpreparation for
predictiveanalytics
Dow
nloa
ded
by H
OG
SKO
LAN
I SK
OV
DE
At 0
4:33
08
Dec
embe
r 201
7 (P
T)
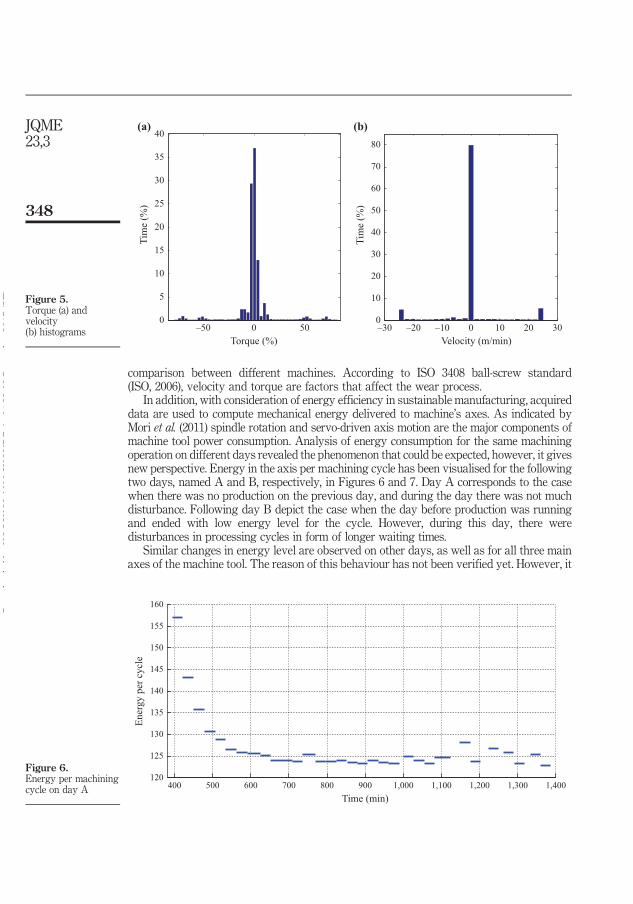
comparison between different machines. According to ISO 3408 ball-screw standard(ISO, 2006), velocity and torque are factors that affect the wear process.In addition, with consideration of energy efficiency in sustainable manufacturing, acquired
data are used to compute mechanical energy delivered to machine’s axes. As indicated byMori et al. (2011) spindle rotation and servo-driven axis motion are the major components ofmachine tool power consumption. Analysis of energy consumption for the same machiningoperation on different days revealed the phenomenon that could be expected, however, it givesnew perspective. Energy in the axis per machining cycle has been visualised for the followingtwo days, named A and B, respectively, in Figures 6 and 7. Day A corresponds to the casewhen there was no production on the previous day, and during the day there was not muchdisturbance. Following day B depict the case when the day before production was runningand ended with low energy level for the cycle. However, during this day, there weredisturbances in processing cycles in form of longer waiting times.Similar changes in energy level are observed on other days, as well as for all three main
axes of the machine tool. The reason of this behaviour has not been verified yet. However, it
–50 0 500
5
10
15
20
25
30
35
40
Torque (%)
Tim
e (%
)
–30 –20 –10 0 10 20 300
10
20
30
40
50
60
70
80
Velocity (m/min)
Tim
e (%
)
(a) (b)
Figure 5.Torque (a) andvelocity(b) histograms
400 500 600 700 800 900 1,000 1,100 1,200 1,300 1,400120
125
130
135
140
145
150
155
160
Time (min)
Ener
gy p
er c
ycl
e
Figure 6.Energy per machiningcycle on day A
348
JQME23,3
Dow
nloa
ded
by H
OG
SKO
LAN
I SK
OV
DE
At 0
4:33
08
Dec
embe
r 201
7 (P
T)
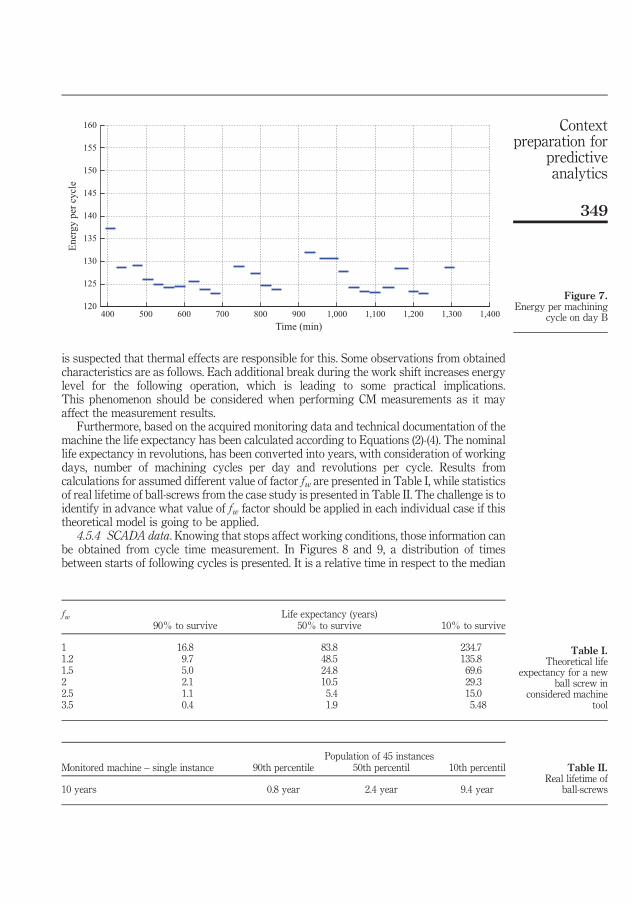
is suspected that thermal effects are responsible for this. Some observations from obtainedcharacteristics are as follows. Each additional break during the work shift increases energylevel for the following operation, which is leading to some practical implications.This phenomenon should be considered when performing CM measurements as it mayaffect the measurement results.Furthermore, based on the acquired monitoring data and technical documentation of the
machine the life expectancy has been calculated according to Equations (2)-(4). The nominallife expectancy in revolutions, has been converted into years, with consideration of workingdays, number of machining cycles per day and revolutions per cycle. Results fromcalculations for assumed different value of factor fw are presented in Table I, while statisticsof real lifetime of ball-screws from the case study is presented in Table II. The challenge is toidentify in advance what value of fw factor should be applied in each individual case if thistheoretical model is going to be applied.
4.5.4 SCADA data. Knowing that stops affect working conditions, those information canbe obtained from cycle time measurement. In Figures 8 and 9, a distribution of timesbetween starts of following cycles is presented. It is a relative time in respect to the median
400 500 600 700 800 900 1,000 1,100 1,200 1,300 1,400120
125
130
135
140
145
150
155
160
Time (min)
Ener
gy p
er c
ycl
e
Figure 7.Energy per machining
cycle on day B
fw Life expectancy (years)90% to survive 50% to survive 10% to survive
1 16.8 83.8 234.71.2 9.7 48.5 135.81.5 5.0 24.8 69.62 2.1 10.5 29.32.5 1.1 5.4 15.03.5 0.4 1.9 5.48
Table I.Theoretical life
expectancy for a newball screw in
considered machinetool
Population of 45 instancesMonitored machine – single instance 90th percentile 50th percentil 10th percentil
10 years 0.8 year 2.4 year 9.4 year
Table II.Real lifetime of
ball-screws
349
Contextpreparation for
predictiveanalytics
Dow
nloa
ded
by H
OG
SKO
LAN
I SK
OV
DE
At 0
4:33
08
Dec
embe
r 201
7 (P
T)
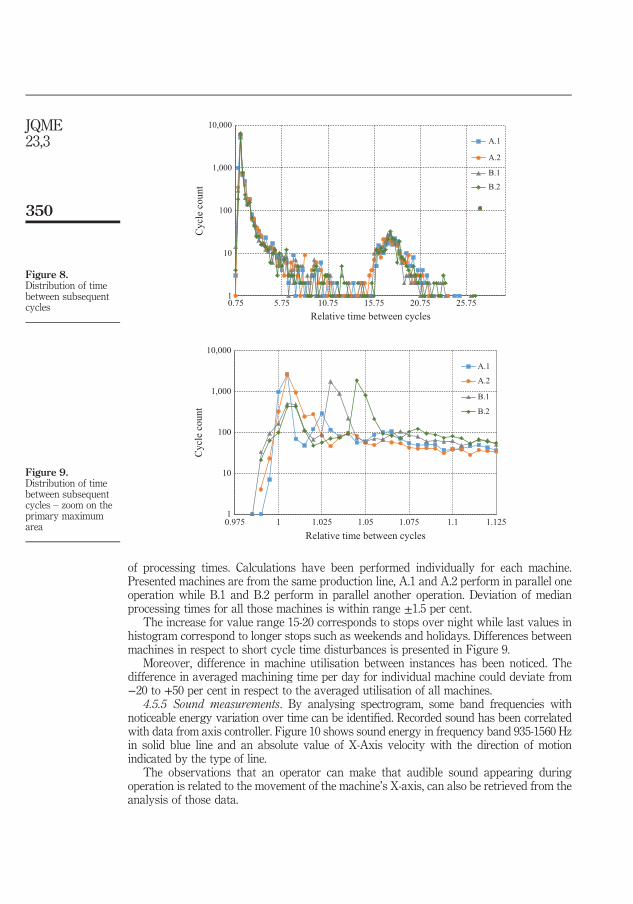
of processing times. Calculations have been performed individually for each machine.Presented machines are from the same production line, A.1 and A.2 perform in parallel oneoperation while B.1 and B.2 perform in parallel another operation. Deviation of medianprocessing times for all those machines is within range ±1.5 per cent.The increase for value range 15-20 corresponds to stops over night while last values in
histogram correspond to longer stops such as weekends and holidays. Differences betweenmachines in respect to short cycle time disturbances is presented in Figure 9.Moreover, difference in machine utilisation between instances has been noticed. The
difference in averaged machining time per day for individual machine could deviate from−20 to +50 per cent in respect to the averaged utilisation of all machines.
4.5.5 Sound measurements. By analysing spectrogram, some band frequencies withnoticeable energy variation over time can be identified. Recorded sound has been correlatedwith data from axis controller. Figure 10 shows sound energy in frequency band 935-1560 Hzin solid blue line and an absolute value of X-Axis velocity with the direction of motionindicated by the type of line.The observations that an operator can make that audible sound appearing during
operation is related to the movement of the machine’s X-axis, can also be retrieved from theanalysis of those data.
1
10
100
1,000
10,000
0.75 5.75 10.75 15.75 20.75 25.75
Cycl
e co
unt
Relative time between cycles
A.1
A.2
B.1
B.2
Figure 8.Distribution of timebetween subsequentcycles
1
10
100
1,000
10,000
0.975 1 1.025 1.05 1.075 1.1 1.125
Cycl
e co
unt
Relative time between cycles
A.1
A.2
B.1
B.2
Figure 9.Distribution of timebetween subsequentcycles – zoom on theprimary maximumarea
350
JQME23,3
Dow
nloa
ded
by H
OG
SKO
LAN
I SK
OV
DE
At 0
4:33
08
Dec
embe
r 201
7 (P
T)
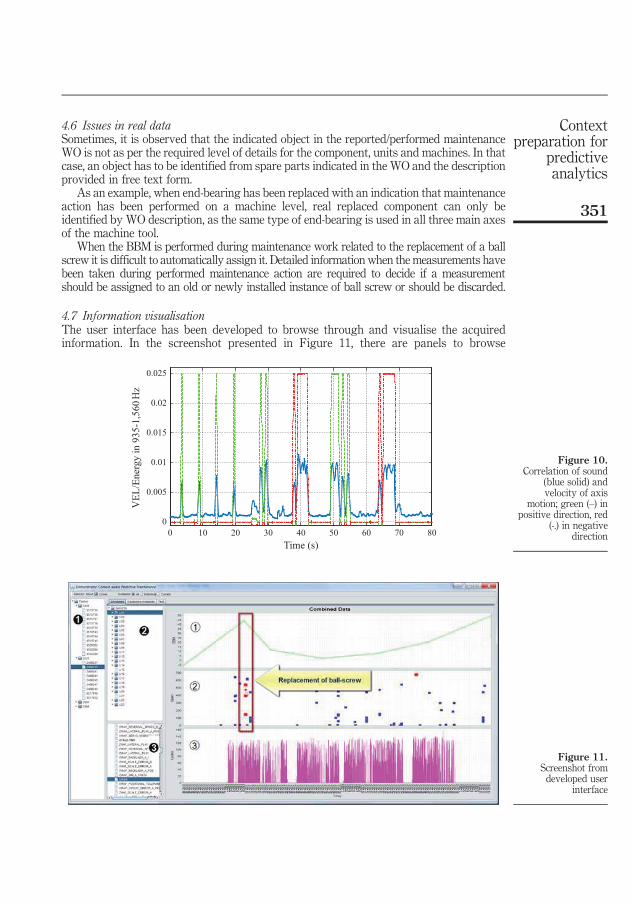
4.6 Issues in real dataSometimes, it is observed that the indicated object in the reported/performed maintenanceWO is not as per the required level of details for the component, units and machines. In thatcase, an object has to be identified from spare parts indicated in the WO and the descriptionprovided in free text form.As an example, when end-bearing has been replaced with an indication that maintenance
action has been performed on a machine level, real replaced component can only beidentified by WO description, as the same type of end-bearing is used in all three main axesof the machine tool.When the BBM is performed during maintenance work related to the replacement of a ball
screw it is difficult to automatically assign it. Detailed information when the measurements havebeen taken during performed maintenance action are required to decide if a measurementshould be assigned to an old or newly installed instance of ball screw or should be discarded.
4.7 Information visualisationThe user interface has been developed to browse through and visualise the acquiredinformation. In the screenshot presented in Figure 11, there are panels to browse
0 10 20 30 40 50 60 70 80
0
0.005
0.01
0.015
0.02
0.025
Time (s)
VE
L/E
ner
gy i
n 9
35-1
,560
Hz
Figure 10.Correlation of sound
(blue solid) andvelocity of axis
motion; green (–) inpositive direction, red
(-.) in negativedirection
Figure 11.Screenshot fromdeveloped user
interface
351
Contextpreparation for
predictiveanalytics
Dow
nloa
ded
by H
OG
SKO
LAN
I SK
OV
DE
At 0
4:33
08
Dec
embe
r 201
7 (P
T)
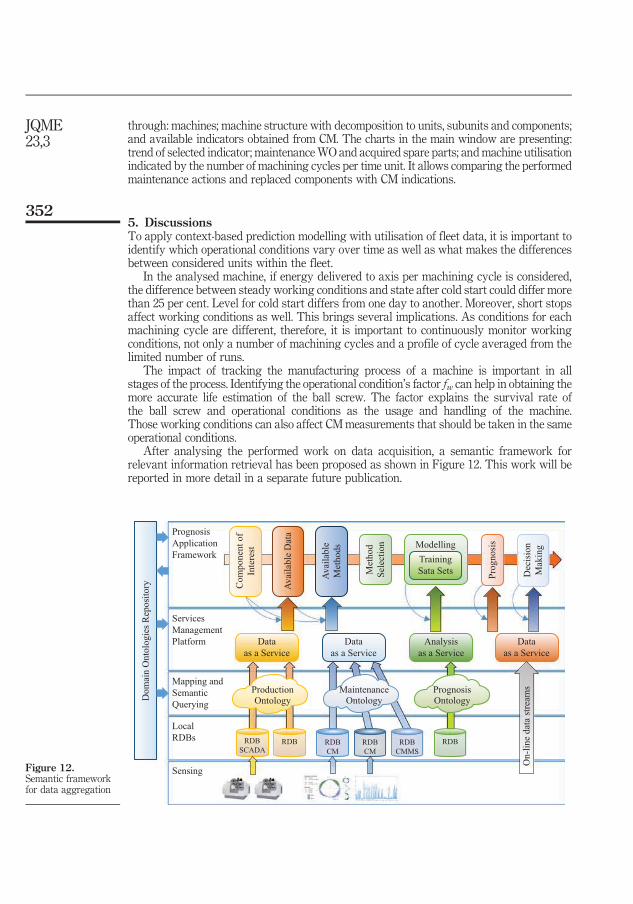
through: machines; machine structure with decomposition to units, subunits and components;and available indicators obtained from CM. The charts in the main window are presenting:trend of selected indicator; maintenanceWO and acquired spare parts; andmachine utilisationindicated by the number of machining cycles per time unit. It allows comparing the performedmaintenance actions and replaced components with CM indications.
5. DiscussionsTo apply context-based prediction modelling with utilisation of fleet data, it is important toidentify which operational conditions vary over time as well as what makes the differencesbetween considered units within the fleet.In the analysed machine, if energy delivered to axis per machining cycle is considered,
the difference between steady working conditions and state after cold start could differ morethan 25 per cent. Level for cold start differs from one day to another. Moreover, short stopsaffect working conditions as well. This brings several implications. As conditions for eachmachining cycle are different, therefore, it is important to continuously monitor workingconditions, not only a number of machining cycles and a profile of cycle averaged from thelimited number of runs.The impact of tracking the manufacturing process of a machine is important in all
stages of the process. Identifying the operational condition’s factor fw can help in obtaining themore accurate life estimation of the ball screw. The factor explains the survival rate ofthe ball screw and operational conditions as the usage and handling of the machine.Those working conditions can also affect CMmeasurements that should be taken in the sameoperational conditions.After analysing the performed work on data acquisition, a semantic framework for
relevant information retrieval has been proposed as shown in Figure 12. This work will bereported in more detail in a separate future publication.
Analysis
as a Service
Data
as a Service
Local
RDBs
Services
Management
Platform
Mapping and
Semantic
Querying
Com
ponen
t of
Inte
rest
Prognosis
Application
Framework
Avai
lable
Dat
a
Avai
lable
Met
hods Modelling
Met
hod
Sel
ecti
on
Training
Sata Sets
Pro
gnosi
s
MaintenanceOntologyD
om
ain O
nto
logie
s R
eposi
tory
ProductionOntology
PrognosisOntology
Data
as a Service
Dec
isio
n
Mak
ing
Data
as a Service
Sensing
On-l
ine
dat
a st
ream
s
RDB
SCADARDB RDB
CM
RDB
CM
RDB
CMMS
RDB
Figure 12.Semantic frameworkfor data aggregation
352
JQME23,3
Dow
nloa
ded
by H
OG
SKO
LAN
I SK
OV
DE
At 0
4:33
08
Dec
embe
r 201
7 (P
T)
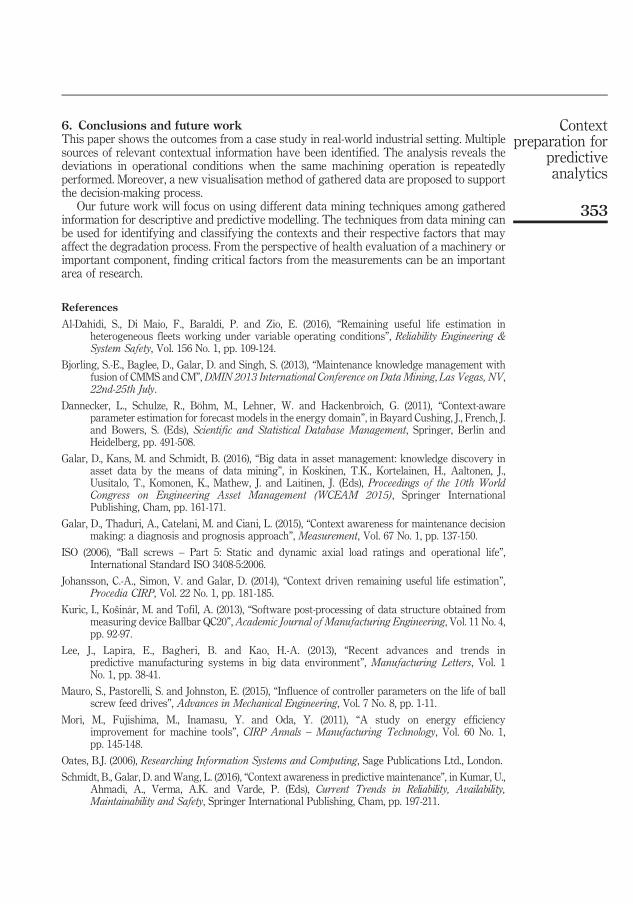
6. Conclusions and future workThis paper shows the outcomes from a case study in real-world industrial setting. Multiplesources of relevant contextual information have been identified. The analysis reveals thedeviations in operational conditions when the same machining operation is repeatedlyperformed. Moreover, a new visualisation method of gathered data are proposed to supportthe decision-making process.Our future work will focus on using different data mining techniques among gathered
information for descriptive and predictive modelling. The techniques from data mining canbe used for identifying and classifying the contexts and their respective factors that mayaffect the degradation process. From the perspective of health evaluation of a machinery orimportant component, finding critical factors from the measurements can be an importantarea of research.
References
Al-Dahidi, S., Di Maio, F., Baraldi, P. and Zio, E. (2016), “Remaining useful life estimation inheterogeneous fleets working under variable operating conditions”, Reliability Engineering &System Safety, Vol. 156 No. 1, pp. 109-124.
Bjorling, S.-E., Baglee, D., Galar, D. and Singh, S. (2013), “Maintenance knowledge management withfusion of CMMS and CM”, DMIN 2013 International Conference on Data Mining, Las Vegas, NV,22nd-25th July.
Dannecker, L., Schulze, R., Böhm, M., Lehner, W. and Hackenbroich, G. (2011), “Context-awareparameter estimation for forecast models in the energy domain”, in Bayard Cushing, J., French, J.and Bowers, S. (Eds), Scientific and Statistical Database Management, Springer, Berlin andHeidelberg, pp. 491-508.
Galar, D., Kans, M. and Schmidt, B. (2016), “Big data in asset management: knowledge discovery inasset data by the means of data mining”, in Koskinen, T.K., Kortelainen, H., Aaltonen, J.,Uusitalo, T., Komonen, K., Mathew, J. and Laitinen, J. (Eds), Proceedings of the 10th WorldCongress on Engineering Asset Management (WCEAM 2015), Springer InternationalPublishing, Cham, pp. 161-171.
Galar, D., Thaduri, A., Catelani, M. and Ciani, L. (2015), “Context awareness for maintenance decisionmaking: a diagnosis and prognosis approach”, Measurement, Vol. 67 No. 1, pp. 137-150.
ISO (2006), “Ball screws – Part 5: Static and dynamic axial load ratings and operational life”,International Standard ISO 3408-5:2006.
Johansson, C.-A., Simon, V. and Galar, D. (2014), “Context driven remaining useful life estimation”,Procedia CIRP, Vol. 22 No. 1, pp. 181-185.
Kuric, I., Košinár, M. and Tofil, A. (2013), “Software post-processing of data structure obtained frommeasuring device Ballbar QC20”, Academic Journal of Manufacturing Engineering, Vol. 11 No. 4,pp. 92-97.
Lee, J., Lapira, E., Bagheri, B. and Kao, H.-A. (2013), “Recent advances and trends inpredictive manufacturing systems in big data environment”, Manufacturing Letters, Vol. 1No. 1, pp. 38-41.
Mauro, S., Pastorelli, S. and Johnston, E. (2015), “Influence of controller parameters on the life of ballscrew feed drives”, Advances in Mechanical Engineering, Vol. 7 No. 8, pp. 1-11.
Mori, M., Fujishima, M., Inamasu, Y. and Oda, Y. (2011), “A study on energy efficiencyimprovement for machine tools”, CIRP Annals – Manufacturing Technology, Vol. 60 No. 1,pp. 145-148.
Oates, B.J. (2006), Researching Information Systems and Computing, Sage Publications Ltd., London.
Schmidt, B., Galar, D. and Wang, L. (2016), “Context awareness in predictive maintenance”, in Kumar, U.,Ahmadi, A., Verma, A.K. and Varde, P. (Eds), Current Trends in Reliability, Availability,Maintainability and Safety, Springer International Publishing, Cham, pp. 197-211.
353
Contextpreparation for
predictiveanalytics
Dow
nloa
ded
by H
OG
SKO
LAN
I SK
OV
DE
At 0
4:33
08
Dec
embe
r 201
7 (P
T)

Thaduri, A., Kumar, U. and Verma, A. (2014), “Computational intelligence framework for context-awaredecision making”, International Journal of System Assurance Engineering and Management,pp. 1-12, available at: https://doi.org/10.1007/s13198-014-0320-8
Verl, A. and Frey, S. (2010), “Correlation between feed velocity and preloading in ball screw drives”,CIRP Annals – Manufacturing Technology, Vol. 59 No. 1, pp. 429-432.
Yin, R.K. (1984), Case Study Research: Design and Methods, 2nd ed., Sage Publications Ltd, London.
Corresponding authorBernard Schmidt can be contacted at: [email protected]
For instructions on how to order reprints of this article, please visit our website:www.emeraldgrouppublishing.com/licensing/reprints.htmOr contact us for further details: [email protected]
354
JQME23,3
Dow
nloa
ded
by H
OG
SKO
LAN
I SK
OV
DE
At 0
4:33
08
Dec
embe
r 201
7 (P
T)

75
PAPER II I

76
Procedia CIRP 62 ( 2017 ) 583 – 588
Available online at www.sciencedirect.com
2212-8271 © 2017 The Authors. Published by Elsevier B.V. This is an open access article under the CC BY-NC-ND license (http://creativecommons.org/licenses/by-nc-nd/4.0/).Peer-review under responsibility of the scientific committee of the 10th CIRP Conference on Intelligent Computation in Manufacturing Engineeringdoi: 10.1016/j.procir.2016.06.047
ScienceDirect
10th CIRP Conference on Intelligent Computation in Manufacturing Engineering - CIRP ICME '16
Semantic framework for predictive maintenance in a cloud environment
Bernard Schmidta,*, Lihui Wangb,a, Diego Galara
aSchool of Engineering Science, University of Skövde, Skövde, 541 28, SwedenbDepartment of Production Engineering, KTH Royal Institute of Technology, Stockholm, 100 44, Sweden
* Corresponding author. Tel.: +46-500-44-8547; fax: +46-500-44-8598. E-mail address: [email protected]
Abstract
Proper maintenance of manufacturing equipment is crucial to ensure productivity and product quality. To improve maintenance decis ion support, and enable prediction-as-a-service there is a need to provide the context required to differentiate between process and machine degradation. Correlating machine conditions with process and inspection data involves data integration of different types such as condition monitoring, inspection and process data. Moreover, data from a variety of sources can appear in different formats and with different sampling rates. This paper highlights those challenges and presents a semantic framework for data collection, synthesis, and knowledge sharing in a Cloud environment for predictive maintenance.© 2016 The Authors. Published by Elsevier B.V.Selection and peer-review under responsibility of the International Scientific Committee of “10th CIRP ICME Conference".
Keywords: Predictive maintenance; Knowledge management; Cloud manufacturing;
1. Introduction
Maintenance plays an important and supportive role in theproduction. Effective maintenance policy improves quality, efficiency, and effectiveness of manufacturing operation and could influence the productivity and profitability of a manufacturing process [1]. Diagnostics and prognostics are two important aspects in a Condition-based Maintenance(CBM) program [2]. In literature several approaches for machining operation and machine tool condition monitoring have been reported [3].
To improve diagnostics and prognostics for better maintenance decision making, there is a need to better correlate process and inspection data with machine condition to differentiate between process and machine degradation [4]. Generally, diagnostics and prognostics models require significant amounts of historical condition monitoring and event data, as the uncertainty of these models decreases when data become more extensive. The means to synthesise smaller available data sets to generate extensive, representative historical condition monitoring and event data sets remains an open research question [5].
To solve those problems more detail information aboutmanufacturing asset across its lifetime need to be gathered, accessed and processed. Targeting cloud-based predictive maintenance, this research aims at developing a semantic framework for the context-aware approach.
The remainder of the paper is organised as follows. Section 2 reviews background. Section 3 highlights available sources of data and benefits of its aggregation. Proposed semantic framework is presented in Section 4. Section 5 provide anexample how this framework can be used to retrieve relevant information. Finally, Section 6 conclude the paper.
2. Backgrounds
2.1. Disparate data sources
Development and implementation of Information and Communication Technologies (ICT) in the industry in past decade brings new possibilities and challenges. More data are gathered, however, stored and processed in disparate and heterogeneous systems as Computerised Maintenance Management System (CMMS) for maintenance record-keeping, Condition Monitoring (CM) for asset health state
© 2017 The Authors. Published by Elsevier B.V. This is an open access article under the CC BY-NC-ND license (http://creativecommons.org/licenses/by-nc-nd/4.0/).Peer-review under responsibility of the scientifi c committee of the 10th CIRP Conference on Intelligent Computation in Manufacturing Engineering
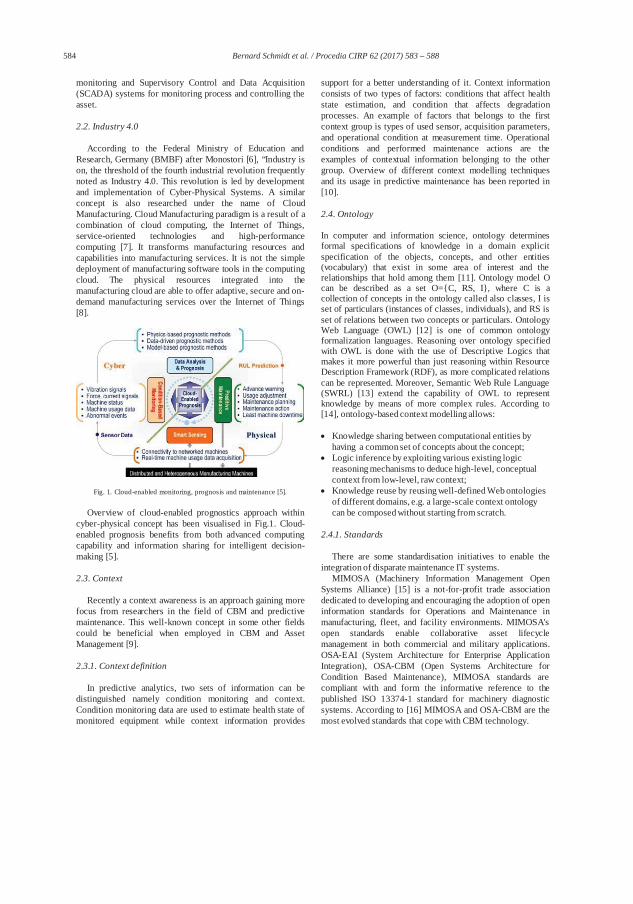
584 Bernard Schmidt et al. / Procedia CIRP 62 ( 2017 ) 583 – 588
monitoring and Supervisory Control and Data Acquisition (SCADA) systems for monitoring process and controlling the asset.
2.2. Industry 4.0
According to the Federal Ministry of Education and Research, Germany (BMBF) after Monostori [6], “Industry is on, the threshold of the fourth industrial revolution frequently noted as Industry 4.0. This revolution is led by development and implementation of Cyber-Physical Systems. A similarconcept is also researched under the name of Cloud Manufacturing. Cloud Manufacturing paradigm is a result of a combination of cloud computing, the Internet of Things, service-oriented technologies and high-performancecomputing [7]. It transforms manufacturing resources and capabilities into manufacturing services. It is not the simpledeployment of manufacturing software tools in the computing cloud. The physical resources integrated into the manufacturing cloud are able to offer adaptive, secure and on-demand manufacturing services over the Internet of Things [8].
Fig. 1. Cloud-enabled monitoring, prognosis and maintenance [5].
Overview of cloud-enabled prognostics approach within cyber-physical concept has been visualised in Fig.1. Cloud-enabled prognosis benefits from both advanced computing capability and information sharing for intelligent decision-making [5].
2.3. Context
Recently a context awareness is an approach gaining more focus from researchers in the field of CBM and predictive maintenance. This well-known concept in some other fields could be beneficial when employed in CBM and Asset Management [9].
2.3.1. Context definition
In predictive analytics, two sets of information can be distinguished namely condition monitoring and context. Condition monitoring data are used to estimate health state of monitored equipment while context information provides
support for a better understanding of it. Context information consists of two types of factors: conditions that affect health state estimation, and condition that affects degradation processes. An example of factors that belongs to the first context group is types of used sensor, acquisition parameters, and operational condition at measurement time. Operational conditions and performed maintenance actions are the examples of contextual information belonging to the other group. Overview of different context modelling techniques and its usage in predictive maintenance has been reported in [10].
2.4. Ontology
In computer and information science, ontology determines formal specifications of knowledge in a domain explicit specification of the objects, concepts, and other entities (vocabulary) that exist in some area of interest and the relationships that hold among them [11]. Ontology model Ocan be described as a set O={C, RS, I}, where C is a collection of concepts in the ontology called also classes, I isset of particulars (instances of classes, individuals), and RS is set of relations between two concepts or particulars. Ontology Web Language (OWL) [12] is one of common ontology formalization languages. Reasoning over ontology specified with OWL is done with the use of Descriptive Logics that makes it more powerful than just reasoning within Resource Description Framework (RDF), as more complicated relations can be represented. Moreover, Semantic Web Rule Language (SWRL) [13] extend the capability of OWL to represent knowledge by means of more complex rules. According to [14], ontology-based context modelling allows:
Knowledge sharing between computational entities by having a common set of concepts about the concept;Logic inference by exploiting various existing logic reasoning mechanisms to deduce high-level, conceptual context from low-level, raw context; Knowledge reuse by reusing well-defined Web ontologies of different domains, e.g. a large-scale context ontology can be composed without starting from scratch.
2.4.1. Standards
There are some standardisation initiatives to enable the integration of disparate maintenance IT systems.
MIMOSA (Machinery Information Management Open Systems Alliance) [15] is a not-for-profit trade association dedicated to developing and encouraging the adoption of open information standards for Operations and Maintenance in manufacturing, fleet, and facility environments. MIMOSA's open standards enable collaborative asset lifecycle management in both commercial and military applications.OSA-EAI (System Architecture for Enterprise Application Integration), OSA-CBM (Open Systems Architecture for Condition Based Maintenance), MIMOSA standards are compliant with and form the informative reference to the published ISO 13374-1 standard for machinery diagnostic systems. According to [16] MIMOSA and OSA-CBM are the most evolved standards that cope with CBM technology.
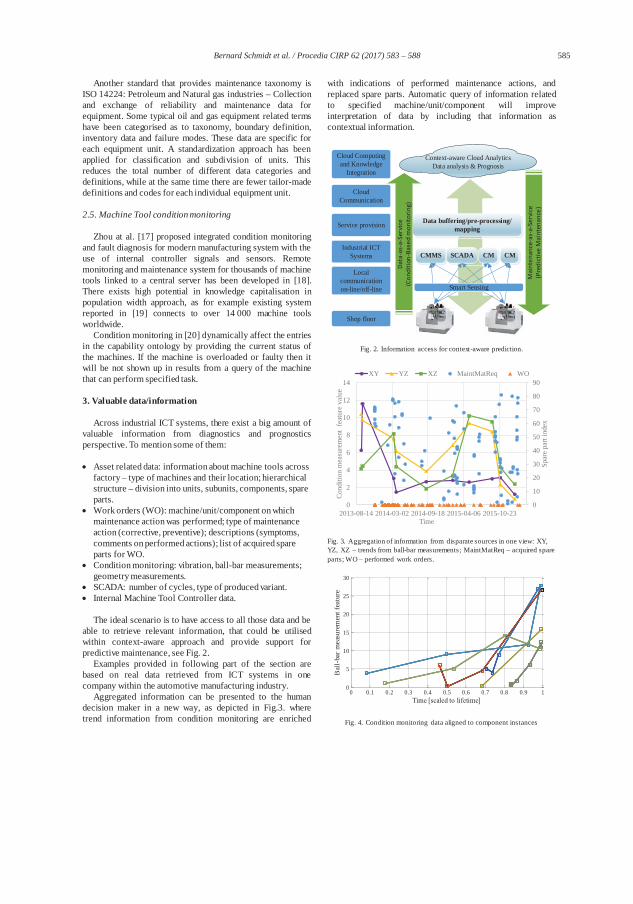
585 Bernard Schmidt et al. / Procedia CIRP 62 ( 2017 ) 583 – 588
Another standard that provides maintenance taxonomy is ISO 14224: Petroleum and Natural gas industries – Collection and exchange of reliability and maintenance data for equipment. Some typical oil and gas equipment related terms have been categorised as to taxonomy, boundary definition, inventory data and failure modes. These data are specific for each equipment unit. A standardization approach has been applied for classification and subdivision of units. This reduces the total number of different data categories and definitions, while at the same time there are fewer tailor-made definitions and codes for each individual equipment unit.
2.5. Machine Tool condition monitoring
Zhou at al. [17] proposed integrated condition monitoring and fault diagnosis for modern manufacturing system with the use of internal controller signals and sensors. Remote monitoring and maintenance system for thousands of machine tools linked to a central server has been developed in [18]. There exists high potential in knowledge capitalisation in population width approach, as for example existing system reported in [19] connects to over 14 000 machine tools worldwide.
Condition monitoring in [20] dynamically affect the entries in the capability ontology by providing the current status of the machines. If the machine is overloaded or faulty then it will be not shown up in results from a query of the machine that can perform specified task.
3. Valuable data/information
Across industrial ICT systems, there exist a big amount of valuable information from diagnostics and prognostics perspective. To mention some of them:
Asset related data: information about machine tools across factory – type of machines and their location; hierarchical structure – division into units, subunits, components, spare parts. Work orders (WO): machine/unit/component on which maintenance action was performed; type of maintenance action (corrective, preventive); descriptions (symptoms, comments on performed actions); list of acquired spare parts for WO. Condition monitoring: vibration, ball-bar measurements; geometry measurements. SCADA: number of cycles, type of produced variant. Internal Machine Tool Controller data.
The ideal scenario is to have access to all those data and be able to retrieve relevant information, that could be utilised within context-aware approach and provide support for predictive maintenance, see Fig. 2.
Examples provided in following part of the section are based on real data retrieved from ICT systems in one company within the automotive manufacturing industry.
Aggregated information can be presented to the human decision maker in a new way, as depicted in Fig.3. where trend information from condition monitoring are enriched
with indications of performed maintenance actions, and replaced spare parts. Automatic query of information related to specified machine/unit/component will improve interpretation of data by including that information as contextual information.
CMMS SCADA CM CM
Shop floor
Local communicationon-line/off-line
Industrial ICTSystems
Service provision Data buffering/pre-processing/mapping
Context-aware Cloud AnalyticsData analysis & Prognosis
Cloud Communication
Cloud Computing and Knowledge
Integration
Data
-as-
a-Se
rvic
e(C
ondi
tion-
Base
d m
onito
ring)
Mai
nten
ance
-as-
a-Se
rvic
e(P
redi
ctiv
e M
aint
enan
ce)
Smart Sensing
Fig. 2. Information access for context-aware prediction.
0
10
20
30
40
50
60
70
80
90
0
2
4
6
8
10
12
14
2013-08-14 2014-03-02 2014-09-18 2015-04-06 2015-10-23
Spar
e pa
rt in
dex
Con
ditio
n m
easu
rem
ent
feat
ure
valu
e
Time
XY YZ XZ MaintMatReq WO
Fig. 3. Aggregation of information from disparate sources in one view: XY, YZ, XZ – trends from ball-bar measurements; MaintMatReq – acquired spare parts; WO – performed work orders.
0 0.1 0.2 0.3 0.4 0.5 0.6 0.7 0.8 0.9 10
5
10
15
20
25
30
Time [scaled to lifetime]
Bal
l-ba
r mea
sure
men
t fea
ture
Fig. 4. Condition monitoring data aligned to component instances
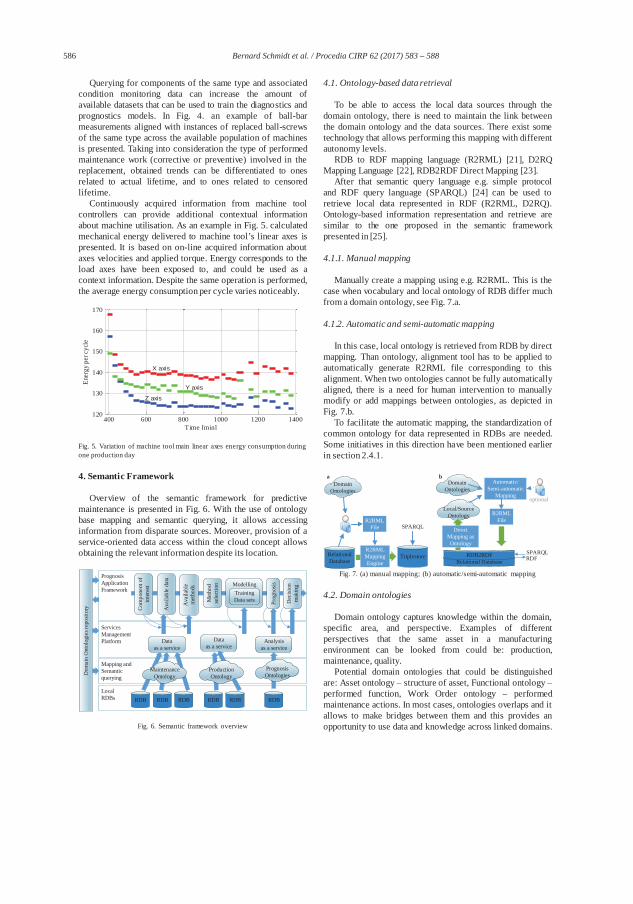
586 Bernard Schmidt et al. / Procedia CIRP 62 ( 2017 ) 583 – 588
Querying for components of the same type and associated condition monitoring data can increase the amount of available datasets that can be used to train the diagnostics and prognostics models. In Fig. 4. an example of ball-barmeasurements aligned with instances of replaced ball-screws of the same type across the available population of machines is presented. Taking into consideration the type of performed maintenance work (corrective or preventive) involved in the replacement, obtained trends can be differentiated to ones related to actual lifetime, and to ones related to censored lifetime.
Continuously acquired information from machine tool controllers can provide additional contextual information about machine utilisation. As an example in Fig. 5. calculated mechanical energy delivered to machine tool’s linear axes is presented. It is based on on-line acquired information about axes velocities and applied torque. Energy corresponds to the load axes have been exposed to, and could be used as a context information. Despite the same operation is performed, the average energy consumption per cycle varies noticeably.
400 600 800 1000 1200 1400120
130
140
150
160
170
Time [min]
Ener
gy p
er c
ycle
Z axis
Y axis
X axis
Fig. 5. Variation of machine tool main linear axes energy consumption during one production day
4. Semantic Framework
Overview of the semantic framework for predictive maintenance is presented in Fig. 6. With the use of ontology base mapping and semantic querying, it allows accessinginformation from disparate sources. Moreover, provision of a service-oriented data access within the cloud concept allowsobtaining the relevant information despite its location.
LocalRDBs
ServicesManagementPlatform
Mapping andSemantic querying
RDB RDB RDB RDB RDB RDB
Com
pone
nt o
f in
tere
st
Prognosis Application Framework
Ava
ilabl
e da
ta
Ava
ilabl
e m
etho
ds
Modelling
Met
hod
sele
ctio
n
Training Data sets Pr
ogno
sis
MaintenanceOntologyD
omai
n O
ntol
ogie
s rep
osito
ry
ProductionOntology
Prognosis Ontologies
Dataas a service
Dataas a service
Analysisas a service
Dec
ision
m
akin
g
Fig. 6. Semantic framework overview
4.1. Ontology-based data retrieval
To be able to access the local data sources through the domain ontology, there is need to maintain the link between the domain ontology and the data sources. There exist some technology that allows performing this mapping with different autonomy levels.
RDB to RDF mapping language (R2RML) [21], D2RQ Mapping Language [22], RDB2RDF Direct Mapping [23].
After that semantic query language e.g. simple protocol and RDF query language (SPARQL) [24] can be used to retrieve local data represented in RDF (R2RML, D2RQ).Ontology-based information representation and retrieve aresimilar to the one proposed in the semantic framework presented in [25].
4.1.1. Manual mapping
Manually create a mapping using e.g. R2RML. This is the case when vocabulary and local ontology of RDB differ much from a domain ontology, see Fig. 7.a.
4.1.2. Automatic and semi-automatic mapping
In this case, local ontology is retrieved from RDB by direct mapping. Than ontology, alignment tool has to be applied to automatically generate R2RML file corresponding to this alignment. When two ontologies cannot be fully automatically aligned, there is a need for human intervention to manually modify or add mappings between ontologies, as depicted in Fig. 7.b.
To facilitate the automatic mapping, the standardization ofcommon ontology for data represented in RDBs are needed. Some initiatives in this direction have been mentioned earlier in section 2.4.1.
Relational Database
DomainOntologies
R2RML File
TriplestoreR2RMLMappingEngine
SPARQLRelational Database
RDB2RDF
DomainOntologies
Local/SourceOntology
Automatic/Semi-automatic
Mapping
R2RML File
Direct Mapping as Ontology
RDF
SPARQL
a b
optional
Fig. 7. (a) manual mapping; (b) automatic/semi-automatic mapping
4.2. Domain ontologies
Domain ontology captures knowledge within the domain, specific area, and perspective. Examples of different perspectives that the same asset in a manufacturingenvironment can be looked from could be: production, maintenance, quality.
Potential domain ontologies that could be distinguished are: Asset ontology – structure of asset, Functional ontology –performed function, Work Order ontology – performed maintenance actions. In most cases, ontologies overlaps and it allows to make bridges between them and this provides anopportunity to use data and knowledge across linked domains.
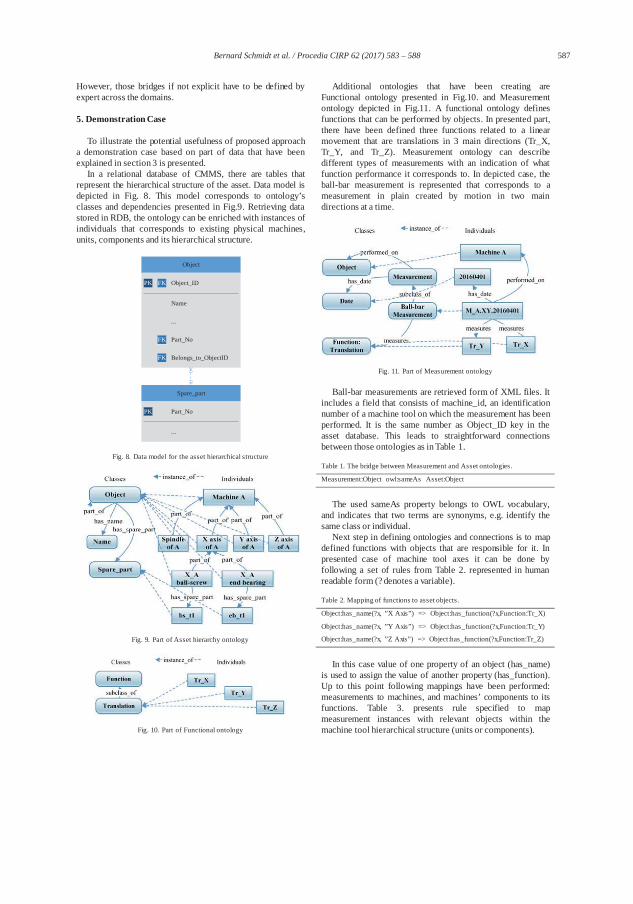
587 Bernard Schmidt et al. / Procedia CIRP 62 ( 2017 ) 583 – 588
However, those bridges if not explicit have to be defined by expert across the domains.
5. Demonstration Case
To illustrate the potential usefulness of proposed approach a demonstration case based on part of data that have been explained in section 3 is presented.
In a relational database of CMMS, there are tables that represent the hierarchical structure of the asset. Data model is depicted in Fig. 8. This model corresponds to ontology’s classes and dependencies presented in Fig.9. Retrieving data stored in RDB, the ontology can be enriched with instances of individuals that corresponds to existing physical machines, units, components and its hierarchical structure.
Object
Spare_part
Object_IDFKPK
Belongs_to_ObjectIDFK
Part_NoFK
Name
...
Part_NoPK
...
Fig. 8. Data model for the asset hierarchical structure
Fig. 9. Part of Asset hierarchy ontology
Fig. 10. Part of Functional ontology
Additional ontologies that have been creating areFunctional ontology presented in Fig.10. and Measurement ontology depicted in Fig.11. A functional ontology definesfunctions that can be performed by objects. In presented part, there have been defined three functions related to a linearmovement that are translations in 3 main directions (Tr_X, Tr_Y, and Tr_Z). Measurement ontology can describedifferent types of measurements with an indication of what function performance it corresponds to. In depicted case, the ball-bar measurement is represented that corresponds to a measurement in plain created by motion in two main directions at a time.
Fig. 11. Part of Measurement ontology
Ball-bar measurements are retrieved form of XML files. It includes a field that consists of machine_id, an identificationnumber of a machine tool on which the measurement has been performed. It is the same number as Object_ID key in theasset database. This leads to straightforward connections between those ontologies as in Table 1.
Table 1. The bridge between Measurement and Asset ontologies.
Measurement:Object owl:sameAs Asset:Object
The used sameAs property belongs to OWL vocabulary, and indicates that two terms are synonyms, e.g. identify the same class or individual.
Next step in defining ontologies and connections is to map defined functions with objects that are responsible for it. In presented case of machine tool axes it can be done by following a set of rules from Table 2. represented in human readable form (? denotes a variable).
Table 2. Mapping of functions to asset objects.
Object:has_name(?x, ”X Axis”) => Object:has_function(?x,Function:Tr_X)
Object:has_name(?x, ”Y Axis”) => Object:has_function(?x,Function:Tr_Y)
Object:has_name(?x, ”Z Axis”) => Object:has_function(?x,Function:Tr_Z)
In this case value of one property of an object (has_name) is used to assign the value of another property (has_function).Up to this point following mappings have been performed: measurements to machines, and machines’ components to its functions. Table 3. presents rule specified to map measurement instances with relevant objects within themachine tool hierarchical structure (units or components).
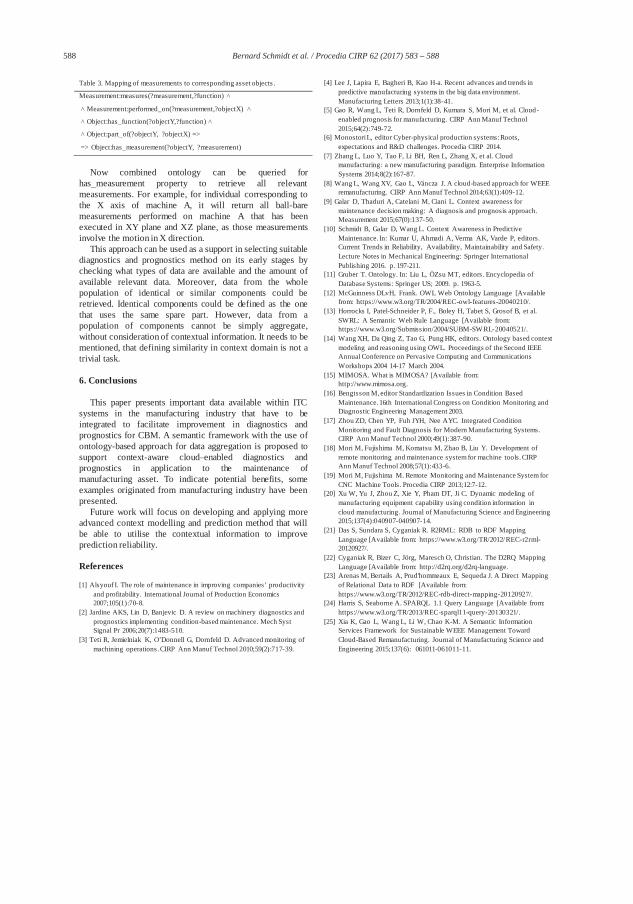
588 Bernard Schmidt et al. / Procedia CIRP 62 ( 2017 ) 583 – 588
Table 3. Mapping of measurements to corresponding asset objects .
Measurement:measures(?measurement,?function)
Measurement:performed_on(?measurement,?objectX)
Object:has_function(?objectY,?function)
Object:part_of(?objectY, ?objectX) =>
=> Object:has_measurement(?objectY, ?measurement)
Now combined ontology can be queried for has_measurement property to retrieve all relevant measurements. For example, for individual corresponding tothe X axis of machine A, it will return all ball-bare measurements performed on machine A that has been executed in XY plane and XZ plane, as those measurements involve the motion in X direction.
This approach can be used as a support in selecting suitablediagnostics and prognostics method on its early stages bychecking what types of data are available and the amount of available relevant data. Moreover, data from the wholepopulation of identical or similar components could be retrieved. Identical components could be defined as the one that uses the same spare part. However, data from a population of components cannot be simply aggregate, without consideration of contextual information. It needs to be mentioned, that defining similarity in context domain is not a trivial task.
6. Conclusions
This paper presents important data available within ITC systems in the manufacturing industry that have to be integrated to facilitate improvement in diagnostics and prognostics for CBM. A semantic framework with the use of ontology-based approach for data aggregation is proposed to support context-aware cloud–enabled diagnostics and prognostics in application to the maintenance of manufacturing asset. To indicate potential benefits, some examples originated from manufacturing industry have been presented.
Future work will focus on developing and applying more advanced context modelling and prediction method that will be able to utilise the contextual information to improve prediction reliability.
References
[1] Alsyouf I. The role of maintenance in improving companies’ productivity and profitability. International Journal of Production Economics 2007;105(1):70-8.
[2] Jardine AKS, Lin D, Banjevic D. A review on machinery diagnostics and prognostics implementing condition-based maintenance. Mech Syst Signal Pr 2006;20(7):1483-510.
[3] Teti R, Jemielniak K, O’Donnell G, Dornfeld D. Advanced monitoring of machining operations. CIRP Ann Manuf Technol 2010;59(2):717-39.
[4] Lee J, Lapira E, Bagheri B, Kao H-a. Recent advances and trends in predictive manufacturing systems in the big data environment. Manufacturing Letters 2013;1(1):38-41.
[5] Gao R, Wang L, Teti R, Dornfeld D, Kumara S, Mori M, et al. Cloud-enabled prognosis for manufacturing. CIRP Ann Manuf Technol 2015;64(2):749-72.
[6] Monostori L, editor Cyber-physical production systems: Roots, expectations and R&D challenges. Procedia CIRP 2014.
[7] Zhang L, Luo Y, Tao F, Li BH, Ren L, Zhang X, et al. Cloud manufacturing: a new manufacturing paradigm. Enterprise Information Systems 2014;8(2):167-87.
[8] Wang L, Wang XV, Gao L, Váncza J. A cloud-based approach for WEEE remanufacturing. CIRP Ann Manuf Technol 2014;63(1):409-12.
[9] Galar D, Thaduri A, Catelani M, Ciani L. Context awareness for maintenance decision making: A diagnosis and prognosis approach. Measurement 2015;67(0):137-50.
[10] Schmidt B, Galar D, Wang L. Context Awareness in Predictive Maintenance. In: Kumar U, Ahmadi A, Verma AK, Varde P, editors. Current Trends in Reliability, Availability, Maintainability and Safety. Lecture Notes in Mechanical Engineering: Springer International Publishing 2016. p. 197-211.
[11] Gruber T. Ontology. In: Liu L, ÖZsu MT, editors. Encyclopedia of Database Systems: Springer US; 2009. p. 1963-5.
[12] McGuinness DLvH, Frank. OWL Web Ontology Language [Available from: https://www.w3.org/TR/2004/REC-owl-features-20040210/.
[13] Horrocks I, Patel-Schneider P, F., Boley H, Tabet S, Grosof B, et al. SWRL: A Semantic Web Rule Language [Available from:https://www.w3.org/Submission/2004/SUBM-SW RL-20040521/.
[14] Wang XH, Da Qing Z, Tao G, Pung HK, editors. Ontology based context modeling and reasoning using OWL. Proceedings of the Second IEEEAnnual Conference on Pervasive Computing and Communications Workshops 2004 14-17 March 2004.
[15] MIMOSA. What is MIMOSA? [Available from:http://www.mimosa.org.
[16] Bengtsson M, editor Standardization Issues in Condition Based Maintenance. 16th International Congress on Condition Monitoring and Diagnostic Engineering Management 2003.
[17] Zhou ZD, Chen YP, Fuh JYH, Nee AYC. Integrated Condition Monitoring and Fault Diagnosis for Modern Manufacturing Systems. CIRP Ann Manuf Technol 2000;49(1):387-90.
[18] Mori M, Fujishima M, Komatsu M, Zhao B, Liu Y. Development of remote monitoring and maintenance system for machine tools. CIRP Ann Manuf Technol 2008;57(1):433-6.
[19] Mori M, Fujishima M. Remote Monitoring and Maintenance System for CNC Machine Tools. Procedia CIRP 2013;12:7-12.
[20] Xu W, Yu J, Zhou Z, Xie Y, Pham DT, Ji C. Dynamic modeling of manufacturing equipment capability using condition information in cloud manufacturing. Journal of Manufacturing Science and Engineering 2015;137(4):040907-040907-14.
[21] Das S, Sundara S, Cyganiak R. R2RML: RDB to RDF Mapping Language [Available from: https://www.w3.org/TR/2012/REC-r2rml-20120927/.
[22] Cyganiak R, Bizer C, Jörg, Maresch O, Christian. The D2RQ Mapping Language [Available from: http://d2rq.org/d2rq-language.
[23] Arenas M, Bertails A, Prud'hommeaux E, Sequeda J. A Direct Mapping of Relational Data to RDF [Available from:https://www.w3.org/TR/2012/REC-rdb-direct-mapping-20120927/.
[24] Harris S, Seaborne A. SPARQL 1.1 Query Language [Available from:https://www.w3.org/TR/2013/REC-sparql11-query-20130321/.
[25] Xia K, Gao L, Wang L, Li W, Chao K-M. A Semantic Information Services Framework for Sustainable WEEE Management Toward Cloud-Based Remanufacturing. Journal of Manufacturing Science and Engineering 2015;137(6): 061011-061011-11.

77
PAPER IV

78
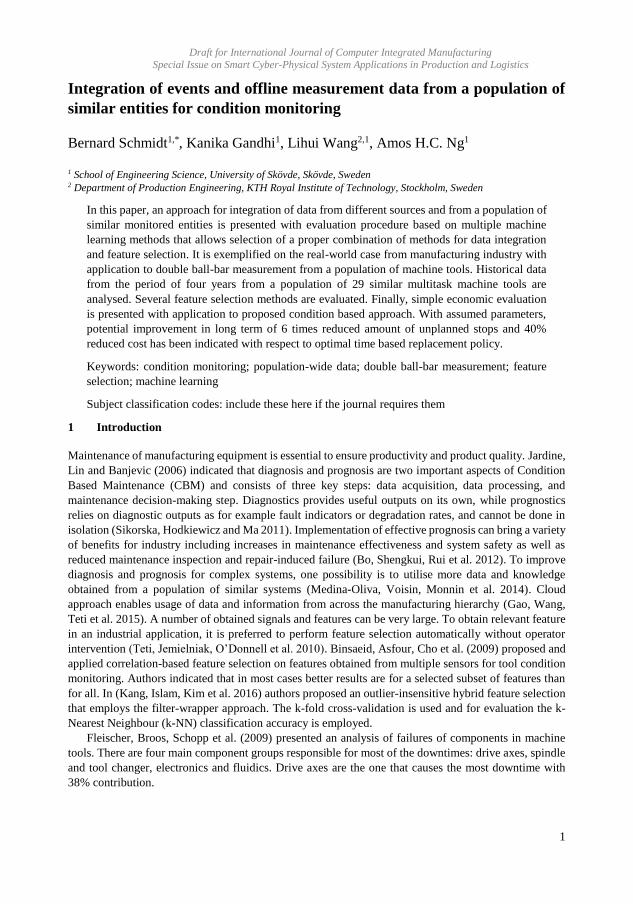
Draft for International Journal of Computer Integrated Manufacturing
Special Issue on Smart Cyber-Physical System Applications in Production and Logistics
1
Integration of events and offline measurement data from a population of
similar entities for condition monitoring
Bernard Schmidt1,*, Kanika Gandhi1, Lihui Wang2,1, Amos H.C. Ng1
1 School of Engineering Science, University of Skövde, Skövde, Sweden 2 Department of Production Engineering, KTH Royal Institute of Technology, Stockholm, Sweden
In this paper, an approach for integration of data from different sources and from a population of
similar monitored entities is presented with evaluation procedure based on multiple machine
learning methods that allows selection of a proper combination of methods for data integration
and feature selection. It is exemplified on the real-world case from manufacturing industry with
application to double ball-bar measurement from a population of machine tools. Historical data
from the period of four years from a population of 29 similar multitask machine tools are
analysed. Several feature selection methods are evaluated. Finally, simple economic evaluation
is presented with application to proposed condition based approach. With assumed parameters,
potential improvement in long term of 6 times reduced amount of unplanned stops and 40%
reduced cost has been indicated with respect to optimal time based replacement policy.
Keywords: condition monitoring; population-wide data; double ball-bar measurement; feature
selection; machine learning
Subject classification codes: include these here if the journal requires them
1 Introduction
Maintenance of manufacturing equipment is essential to ensure productivity and product quality. Jardine,
Lin and Banjevic (2006) indicated that diagnosis and prognosis are two important aspects of Condition
Based Maintenance (CBM) and consists of three key steps: data acquisition, data processing, and
maintenance decision-making step. Diagnostics provides useful outputs on its own, while prognostics
relies on diagnostic outputs as for example fault indicators or degradation rates, and cannot be done in
isolation (Sikorska, Hodkiewicz and Ma 2011). Implementation of effective prognosis can bring a variety
of benefits for industry including increases in maintenance effectiveness and system safety as well as
reduced maintenance inspection and repair-induced failure (Bo, Shengkui, Rui et al. 2012). To improve
diagnosis and prognosis for complex systems, one possibility is to utilise more data and knowledge
obtained from a population of similar systems (Medina-Oliva, Voisin, Monnin et al. 2014). Cloud
approach enables usage of data and information from across the manufacturing hierarchy (Gao, Wang,
Teti et al. 2015). A number of obtained signals and features can be very large. To obtain relevant feature
in an industrial application, it is preferred to perform feature selection automatically without operator
intervention (Teti, Jemielniak, O’Donnell et al. 2010). Binsaeid, Asfour, Cho et al. (2009) proposed and
applied correlation-based feature selection on features obtained from multiple sensors for tool condition
monitoring. Authors indicated that in most cases better results are for a selected subset of features than
for all. In (Kang, Islam, Kim et al. 2016) authors proposed an outlier-insensitive hybrid feature selection
that employs the filter-wrapper approach. The k-fold cross-validation is used and for evaluation the k-
Nearest Neighbour (k-NN) classification accuracy is employed.
Fleischer, Broos, Schopp et al. (2009) presented an analysis of failures of components in machine
tools. There are four main component groups responsible for most of the downtimes: drive axes, spindle
and tool changer, electronics and fluidics. Drive axes are the one that causes the most downtime with
38% contribution.

Draft for International Journal of Computer Integrated Manufacturing
Special Issue on Smart Cyber-Physical System Applications in Production and Logistics
2
Condition monitoring of linear axes can be divided into the online indirect measurement and offline
direct measurements. Examples of online approaches are: Verl, Heisel, Walther et al. (2009) proposed
approach of using signals available in position controlled drives such as position, speed and motor current
to detect wear of drive unit; Feng and Pan (2012) developed a temperature and vibration sensory unit
embedded in ball screw nut, to detect different levels of preload through supervised learning of Support
Vector Machine (SVM) classifier; Garinei and Marsili (2012) used hall-effect sensor to detect presence
of damaged balls in ball-screw; in (Tsai, Cheng and Hwang 2014) authors use accelerometer to monitor
ball pas frequency and detect loose of ball screw preload; Lee, Lee, Hong et al. (2015) use vibration
signals from accelerometer placed on ball screw nut in laboratory test rig, and detect artificially
introduced failures on ball screw race. In (Vogl, Donmez and Archenti 2016) authors developed method
to use data from an internal measurement unit for identification of changes in the axis errors due to its
degradation. Those approaches are mainly performed in laboratory setup, based on artificially introduced
failures.
A well-established method for off-line direct measurement of axes accuracy is double ball-bar (DBB)
measurement that was first presented by Bryan (1982) and later standardised in ISO 230-1. Its advantages
are low cost, the simplicity of use and robustness (Zargarbashi and Mayer 2006). The DBB test is
designed to perform circular trajectory interpolation of two prismatic axes and is mainly applied for three-
axis machines. Most of the research that utilises this test is focused on identification of sources of
deviation (Kakino, Ihara, Nakatsu et al. 1987), its applications to multi-axis and/or not-prismatic axis
(Chen, Dong, Bian et al. 2015, Uddin, Ibaraki, Matsubara et al. 2009, Xia, Peng, Ouyang et al. 2017,
Zargarbashi and Mayer 2006), modelling the thermal deviations (Dehnavi, Movahhedy, Naebi et al.
2012, Delbressine, Florussen, Schijvenaars et al. 2006, Florussen, Delbressine and Schellekens 2003),
improvement of measurement to dynamic conditions (Archenti, Nicolescu, Casterman et al. 2012),
prediction of the machined part accuracy (Archenti 2014). It is hard to find reported research where data
from double ball-bar measurements have been used for predictive maintenance. It is mainly used to
identify existing problem, not to indicate when the problem can occur.
Most of the approach for prediction works with time trends from run to failure – for each individual
instance e.g. like in similarity-based approach presented in (Wang, Yu, Siegel et al. 2008) or in research
presented in (N. Gebraeel 2006, Nagi Z. Gebraeel, Lawley, Li et al. 2005). In presented work focus is on
analysing data from a population of similar entities. Data are of high dimension, and for each individual
unit, only several points on the trend are available.
In the context of emerging cloud approach for prognosis, establishing guidelines for designing
prognosis system, including sensor selection, prognostic method selection and intelligent decision, would
significantly advance the state of prognosis (Gao, Wang, Teti et al. 2015). In this paper, an approach for
the integration of data from different sources and from a population of similar monitored entities is
presented. Key part of the approach is an evaluation procedure (see Fig.1) that allows selection of a
proper combination of methods for data integration and feature selection applied in earlier steps.
Presented evaluation methodology could be applied in automatic method selection step of predictive
maintenance in a cloud environment approach presented by Schmidt, Wang and Galar (2017). Presented
approach is exemplified based on application to the real-world industrial case with consideration of
population of the linear axes. Data cover 4 year period and are gathered from machining area.
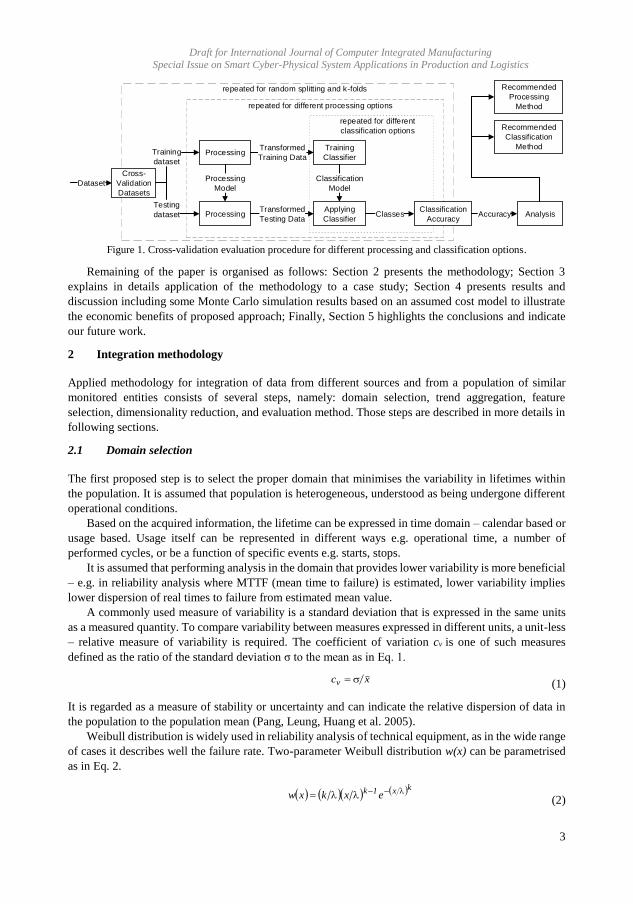
Draft for International Journal of Computer Integrated Manufacturing
Special Issue on Smart Cyber-Physical System Applications in Production and Logistics
3
Figure 1. Cross-validation evaluation procedure for different processing and classification options.
Remaining of the paper is organised as follows: Section 2 presents the methodology; Section 3
explains in details application of the methodology to a case study; Section 4 presents results and
discussion including some Monte Carlo simulation results based on an assumed cost model to illustrate
the economic benefits of proposed approach; Finally, Section 5 highlights the conclusions and indicate
our future work.
2 Integration methodology
Applied methodology for integration of data from different sources and from a population of similar
monitored entities consists of several steps, namely: domain selection, trend aggregation, feature
selection, dimensionality reduction, and evaluation method. Those steps are described in more details in
following sections.
2.1 Domain selection
The first proposed step is to select the proper domain that minimises the variability in lifetimes within
the population. It is assumed that population is heterogeneous, understood as being undergone different
operational conditions.
Based on the acquired information, the lifetime can be expressed in time domain – calendar based or
usage based. Usage itself can be represented in different ways e.g. operational time, a number of
performed cycles, or be a function of specific events e.g. starts, stops.
It is assumed that performing analysis in the domain that provides lower variability is more beneficial
– e.g. in reliability analysis where MTTF (mean time to failure) is estimated, lower variability implies
lower dispersion of real times to failure from estimated mean value.
A commonly used measure of variability is a standard deviation that is expressed in the same units
as a measured quantity. To compare variability between measures expressed in different units, a unit-less
– relative measure of variability is required. The coefficient of variation cv is one of such measures
defined as the ratio of the standard deviation σ to the mean as in Eq. 1.
xcv (1)
It is regarded as a measure of stability or uncertainty and can indicate the relative dispersion of data in
the population to the population mean (Pang, Leung, Huang et al. 2005).
Weibull distribution is widely used in reliability analysis of technical equipment, as in the wide range
of cases it describes well the failure rate. Two-parameter Weibull distribution w(x) can be parametrised
as in Eq. 2.
kx1k
exkxw (2)
repeated for different processing options
ProcessingTraining
Classifier
Transformed
Training Data
ProcessingApplying
Classifier
Transformed
Testing Data
Processing
Model
Classification
Model
ClassesClassification
Accuracy
Training
dataset
Cross-
Validation
Datasets
Testing
dataset
Dataset
Accuracy Analysis
repeated for random splitting and k-folds
repeated for different
classification options
Recommended
Processing
Method
Recommended
Classification
Method
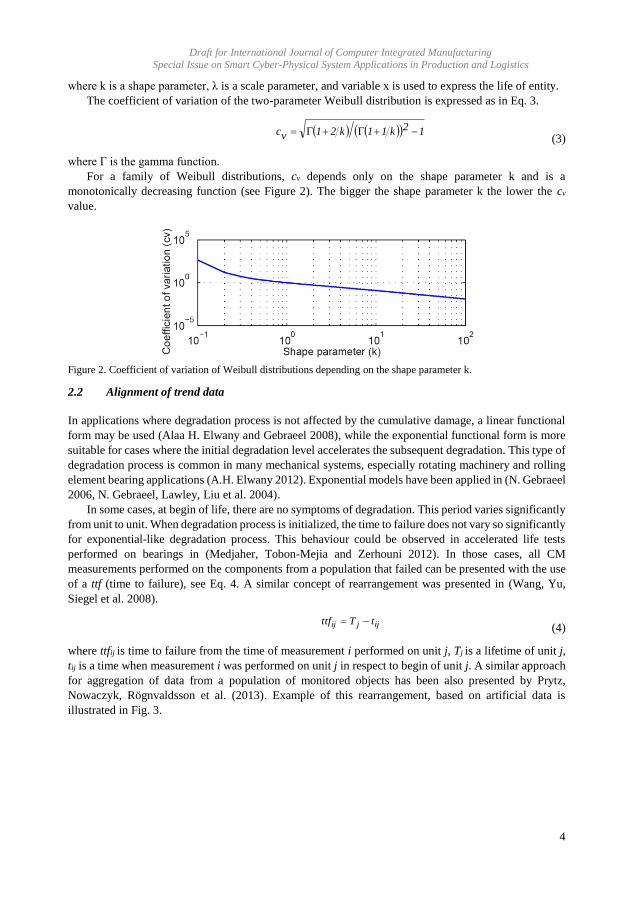
Draft for International Journal of Computer Integrated Manufacturing
Special Issue on Smart Cyber-Physical System Applications in Production and Logistics
4
where k is a shape parameter, λ is a scale parameter, and variable x is used to express the life of entity.
The coefficient of variation of the two-parameter Weibull distribution is expressed as in Eq. 3.
12k11k21vc
(3)
where Γ is the gamma function.
For a family of Weibull distributions, cv depends only on the shape parameter k and is a
monotonically decreasing function (see Figure 2). The bigger the shape parameter k the lower the cv
value.
Figure 2. Coefficient of variation of Weibull distributions depending on the shape parameter k.
2.2 Alignment of trend data
In applications where degradation process is not affected by the cumulative damage, a linear functional
form may be used (Alaa H. Elwany and Gebraeel 2008), while the exponential functional form is more
suitable for cases where the initial degradation level accelerates the subsequent degradation. This type of
degradation process is common in many mechanical systems, especially rotating machinery and rolling
element bearing applications (A.H. Elwany 2012). Exponential models have been applied in (N. Gebraeel
2006, N. Gebraeel, Lawley, Liu et al. 2004).
In some cases, at begin of life, there are no symptoms of degradation. This period varies significantly
from unit to unit. When degradation process is initialized, the time to failure does not vary so significantly
for exponential-like degradation process. This behaviour could be observed in accelerated life tests
performed on bearings in (Medjaher, Tobon-Mejia and Zerhouni 2012). In those cases, all CM
measurements performed on the components from a population that failed can be presented with the use
of a ttf (time to failure), see Eq. 4. A similar concept of rearrangement was presented in (Wang, Yu,
Siegel et al. 2008).
ijjij tTttf (4)
where ttfij is time to failure from the time of measurement i performed on unit j, Tj is a lifetime of unit j,
tij is a time when measurement i was performed on unit j in respect to begin of unit j. A similar approach
for aggregation of data from a population of monitored objects has been also presented by Prytz,
Nowaczyk, Rögnvaldsson et al. (2013). Example of this rearrangement, based on artificial data is
illustrated in Fig. 3.
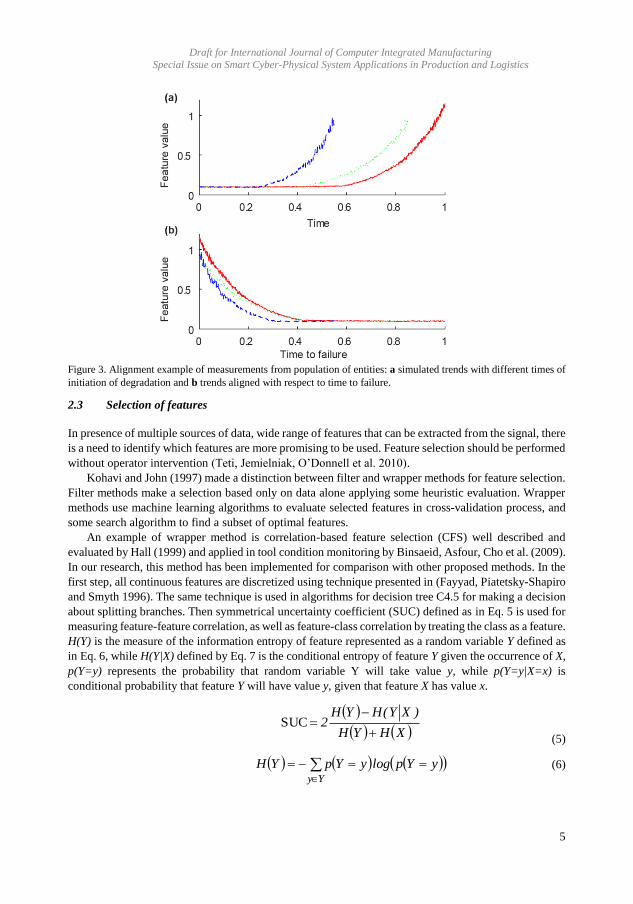
Draft for International Journal of Computer Integrated Manufacturing
Special Issue on Smart Cyber-Physical System Applications in Production and Logistics
5
Figure 3. Alignment example of measurements from population of entities: a simulated trends with different times of
initiation of degradation and b trends aligned with respect to time to failure.
2.3 Selection of features
In presence of multiple sources of data, wide range of features that can be extracted from the signal, there
is a need to identify which features are more promising to be used. Feature selection should be performed
without operator intervention (Teti, Jemielniak, O’Donnell et al. 2010).
Kohavi and John (1997) made a distinction between filter and wrapper methods for feature selection.
Filter methods make a selection based only on data alone applying some heuristic evaluation. Wrapper
methods use machine learning algorithms to evaluate selected features in cross-validation process, and
some search algorithm to find a subset of optimal features.
An example of wrapper method is correlation-based feature selection (CFS) well described and
evaluated by Hall (1999) and applied in tool condition monitoring by Binsaeid, Asfour, Cho et al. (2009).
In our research, this method has been implemented for comparison with other proposed methods. In the
first step, all continuous features are discretized using technique presented in (Fayyad, Piatetsky-Shapiro
and Smyth 1996). The same technique is used in algorithms for decision tree C4.5 for making a decision
about splitting branches. Then symmetrical uncertainty coefficient (SUC) defined as in Eq. 5 is used for
measuring feature-feature correlation, as well as feature-class correlation by treating the class as a feature.
H(Y) is the measure of the information entropy of feature represented as a random variable Y defined as
in Eq. 6, while H(Y|X) defined by Eq. 7 is the conditional entropy of feature Y given the occurrence of X,
p(Y=y) represents the probability that random variable Y will take value y, while p(Y=y|X=x) is
conditional probability that feature Y will have value y, given that feature X has value x.
XHYH
)XY(HYH2
SUC
(5)
Yy
yYplogyYpYH (6)
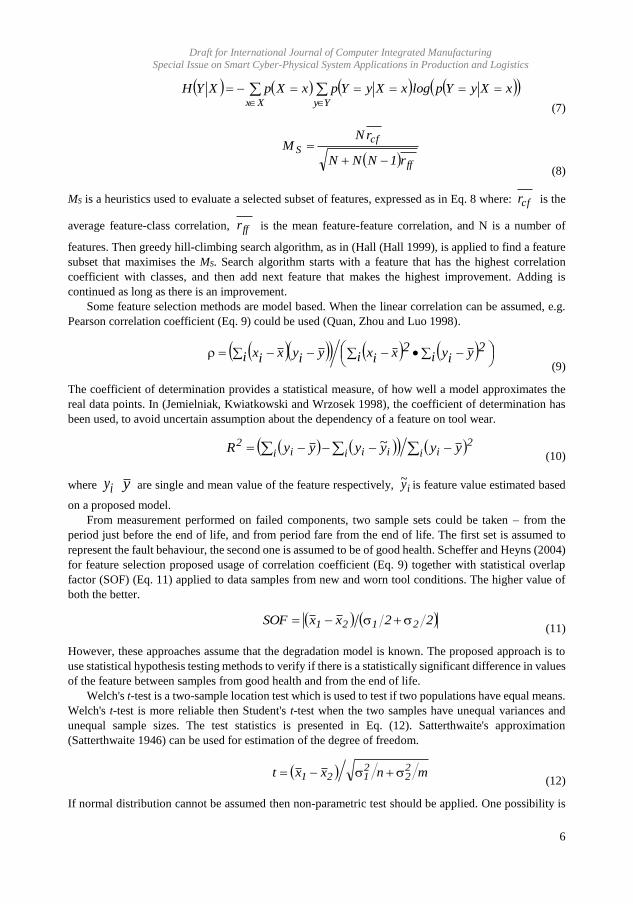
Draft for International Journal of Computer Integrated Manufacturing
Special Issue on Smart Cyber-Physical System Applications in Production and Logistics
6
YyXx
xXyYplogxXyYpxXpXYH
(7)
ff
cfS
r1NNN
rNM
(8)
MS is a heuristics used to evaluate a selected subset of features, expressed as in Eq. 8 where: cfr is the
average feature-class correlation, ffr is the mean feature-feature correlation, and N is a number of
features. Then greedy hill-climbing search algorithm, as in (Hall (Hall 1999), is applied to find a feature
subset that maximises the MS. Search algorithm starts with a feature that has the highest correlation
coefficient with classes, and then add next feature that makes the highest improvement. Adding is
continued as long as there is an improvement.
Some feature selection methods are model based. When the linear correlation can be assumed, e.g.
Pearson correlation coefficient (Eq. 9) could be used (Quan, Zhou and Luo 1998).
i
2yiyi2xixi yiyxix
(9)
The coefficient of determination provides a statistical measure, of how well a model approximates the
real data points. In (Jemielniak, Kwiatkowski and Wrzosek 1998), the coefficient of determination has
been used, to avoid uncertain assumption about the dependency of a feature on tool wear.
i
2ii i iii
2 yyy~yyyR (10)
where iy y are single and mean value of the feature respectively, iy~ is feature value estimated based
on a proposed model.
From measurement performed on failed components, two sample sets could be taken – from the
period just before the end of life, and from period fare from the end of life. The first set is assumed to
represent the fault behaviour, the second one is assumed to be of good health. Scheffer and Heyns (2004)
for feature selection proposed usage of correlation coefficient (Eq. 9) together with statistical overlap
factor (SOF) (Eq. 11) applied to data samples from new and worn tool conditions. The higher value of
both the better.
22xxSOF 2121
(11)
However, these approaches assume that the degradation model is known. The proposed approach is to
use statistical hypothesis testing methods to verify if there is a statistically significant difference in values
of the feature between samples from good health and from the end of life.
Welch's t-test is a two-sample location test which is used to test if two populations have equal means.
Welch's t-test is more reliable then Student's t-test when the two samples have unequal variances and
unequal sample sizes. The test statistics is presented in Eq. (12). Satterthwaite's approximation
(Satterthwaite 1946) can be used for estimation of the degree of freedom.
mnxxt 2
22121
(12)
If normal distribution cannot be assumed then non-parametric test should be applied. One possibility is
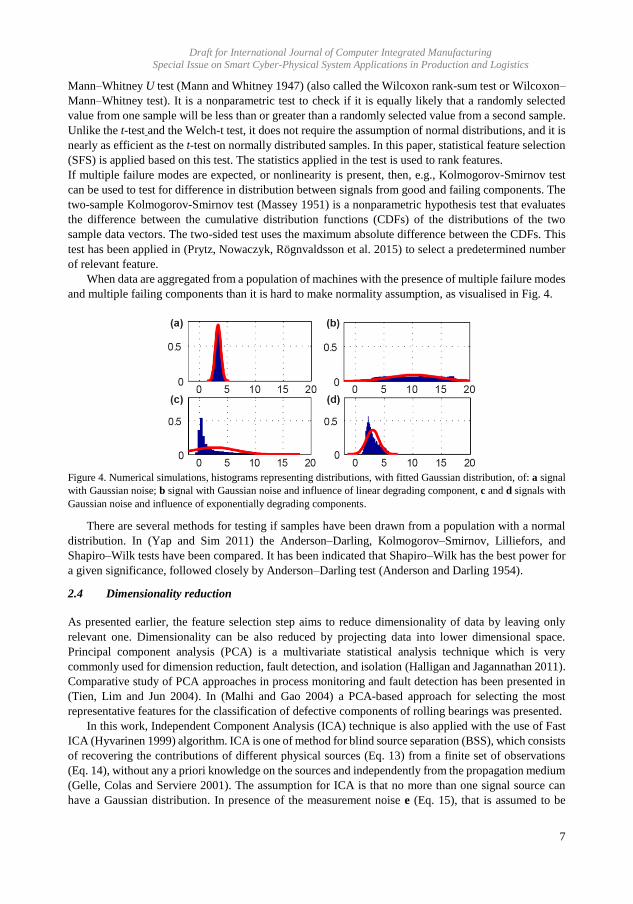
Draft for International Journal of Computer Integrated Manufacturing
Special Issue on Smart Cyber-Physical System Applications in Production and Logistics
7
Mann–Whitney U test (Mann and Whitney 1947) (also called the Wilcoxon rank-sum test or Wilcoxon–
Mann–Whitney test). It is a nonparametric test to check if it is equally likely that a randomly selected
value from one sample will be less than or greater than a randomly selected value from a second sample.
Unlike the t-test and the Welch-t test, it does not require the assumption of normal distributions, and it is
nearly as efficient as the t-test on normally distributed samples. In this paper, statistical feature selection
(SFS) is applied based on this test. The statistics applied in the test is used to rank features.
If multiple failure modes are expected, or nonlinearity is present, then, e.g., Kolmogorov-Smirnov test
can be used to test for difference in distribution between signals from good and failing components. The
two-sample Kolmogorov-Smirnov test (Massey 1951) is a nonparametric hypothesis test that evaluates
the difference between the cumulative distribution functions (CDFs) of the distributions of the two
sample data vectors. The two-sided test uses the maximum absolute difference between the CDFs. This
test has been applied in (Prytz, Nowaczyk, Rögnvaldsson et al. 2015) to select a predetermined number
of relevant feature.
When data are aggregated from a population of machines with the presence of multiple failure modes
and multiple failing components than it is hard to make normality assumption, as visualised in Fig. 4.
Figure 4. Numerical simulations, histograms representing distributions, with fitted Gaussian distribution, of: a signal
with Gaussian noise; b signal with Gaussian noise and influence of linear degrading component, c and d signals with
Gaussian noise and influence of exponentially degrading components.
There are several methods for testing if samples have been drawn from a population with a normal
distribution. In (Yap and Sim 2011) the Anderson–Darling, Kolmogorov–Smirnov, Lilliefors, and
Shapiro–Wilk tests have been compared. It has been indicated that Shapiro–Wilk has the best power for
a given significance, followed closely by Anderson–Darling test (Anderson and Darling 1954).
2.4 Dimensionality reduction
As presented earlier, the feature selection step aims to reduce dimensionality of data by leaving only
relevant one. Dimensionality can be also reduced by projecting data into lower dimensional space.
Principal component analysis (PCA) is a multivariate statistical analysis technique which is very
commonly used for dimension reduction, fault detection, and isolation (Halligan and Jagannathan 2011).
Comparative study of PCA approaches in process monitoring and fault detection has been presented in
(Tien, Lim and Jun 2004). In (Malhi and Gao 2004) a PCA-based approach for selecting the most
representative features for the classification of defective components of rolling bearings was presented.
In this work, Independent Component Analysis (ICA) technique is also applied with the use of Fast
ICA (Hyvarinen 1999) algorithm. ICA is one of method for blind source separation (BSS), which consists
of recovering the contributions of different physical sources (Eq. 13) from a finite set of observations
(Eq. 14), without any a priori knowledge on the sources and independently from the propagation medium
(Gelle, Colas and Serviere 2001). The assumption for ICA is that no more than one signal source can
have a Gaussian distribution. In presence of the measurement noise e (Eq. 15), that is assumed to be
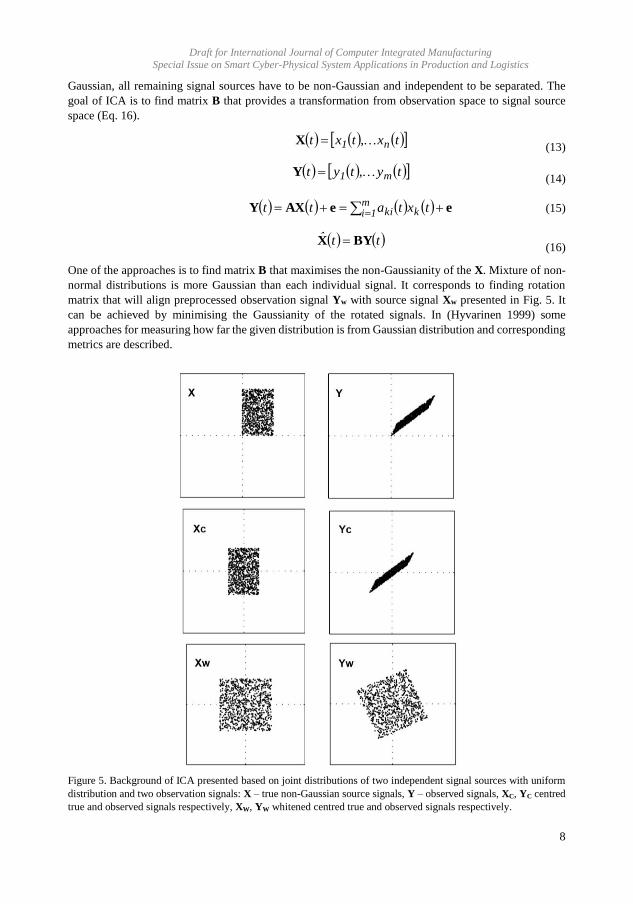
Draft for International Journal of Computer Integrated Manufacturing
Special Issue on Smart Cyber-Physical System Applications in Production and Logistics
8
Gaussian, all remaining signal sources have to be non-Gaussian and independent to be separated. The
goal of ICA is to find matrix B that provides a transformation from observation space to signal source
space (Eq. 16).
tx,txt n1 X
(13)
ty,tyt m1 Y
(14)
eeAXY m
1i kki txtatt (15)
ttˆ BYX
(16)
One of the approaches is to find matrix B that maximises the non-Gaussianity of the X. Mixture of non-
normal distributions is more Gaussian than each individual signal. It corresponds to finding rotation
matrix that will align preprocessed observation signal Yw with source signal Xw presented in Fig. 5. It
can be achieved by minimising the Gaussianity of the rotated signals. In (Hyvarinen 1999) some
approaches for measuring how far the given distribution is from Gaussian distribution and corresponding
metrics are described.
Figure 5. Background of ICA presented based on joint distributions of two independent signal sources with uniform
distribution and two observation signals: X – true non-Gaussian source signals, Y – observed signals, XC, YC centred
true and observed signals respectively, XW, YW whitened centred true and observed signals respectively.
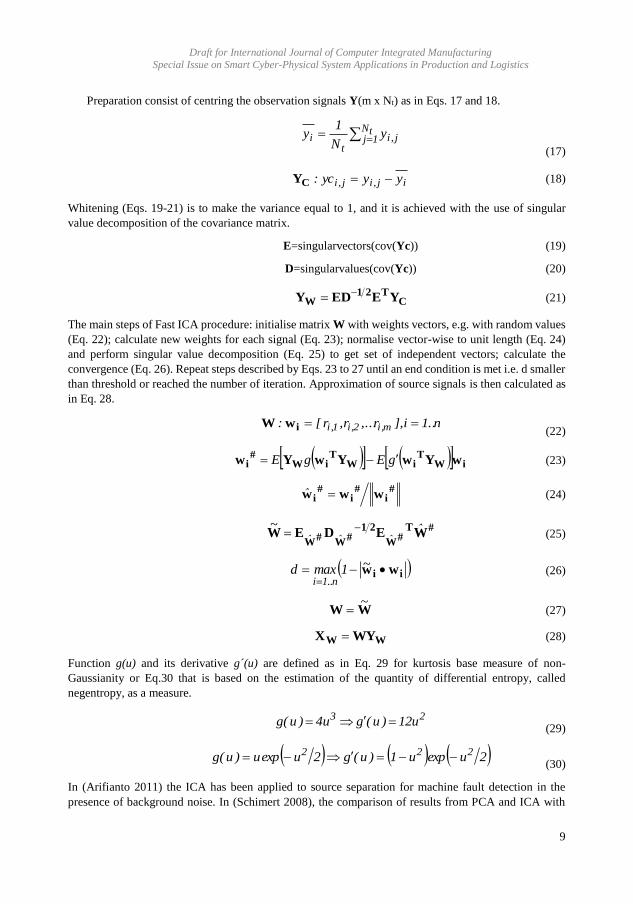
Draft for International Journal of Computer Integrated Manufacturing
Special Issue on Smart Cyber-Physical System Applications in Production and Logistics
9
Preparation consist of centring the observation signals Y(m x Nt) as in Eqs. 17 and 18.
tN1j j,i
ti y
N
1y
(17)
ij,ij,i yyyc: CY (18)
Whitening (Eqs. 19-21) is to make the variance equal to 1, and it is achieved with the use of singular
value decomposition of the covariance matrix.
E=singularvectors(cov(Yc)) (19)
D=singularvalues(cov(Yc)) (20)
CT21
W YEEDY (21)
The main steps of Fast ICA procedure: initialise matrix W with weights vectors, e.g. with random values
(Eq. 22); calculate new weights for each signal (Eq. 23); normalise vector-wise to unit length (Eq. 24)
and perform singular value decomposition (Eq. 25) to get set of independent vectors; calculate the
convergence (Eq. 26). Repeat steps described by Eqs. 23 to 27 until an end condition is met i.e. d smaller
than threshold or reached the number of iteration. Approximation of source signals is then calculated as
in Eq. 28.
n..1i],r,...r,r[: m,i2,i1,i iwW
(22)
iWT
iWT
iW#
i wYwYwYw gEgE (23)
#
i#
i#
i www ˆ (24)
#T
#W
21#
W#
WWEDEW ˆ~
ˆˆˆ
(25)
ii ww
~1maxdn..1i
(26)
WW~
(27)
WW WYX (28)
Function g(u) and its derivative g´(u) are defined as in Eq. 29 for kurtosis base measure of non-
Gaussianity or Eq.30 that is based on the estimation of the quantity of differential entropy, called
negentropy, as a measure.
23 u12)u(gu4)u(g
(29)
2uexpu1)u(g2uexpu)u(g 222
(30)
In (Arifianto 2011) the ICA has been applied to source separation for machine fault detection in the
presence of background noise. In (Schimert 2008), the comparison of results from PCA and ICA with
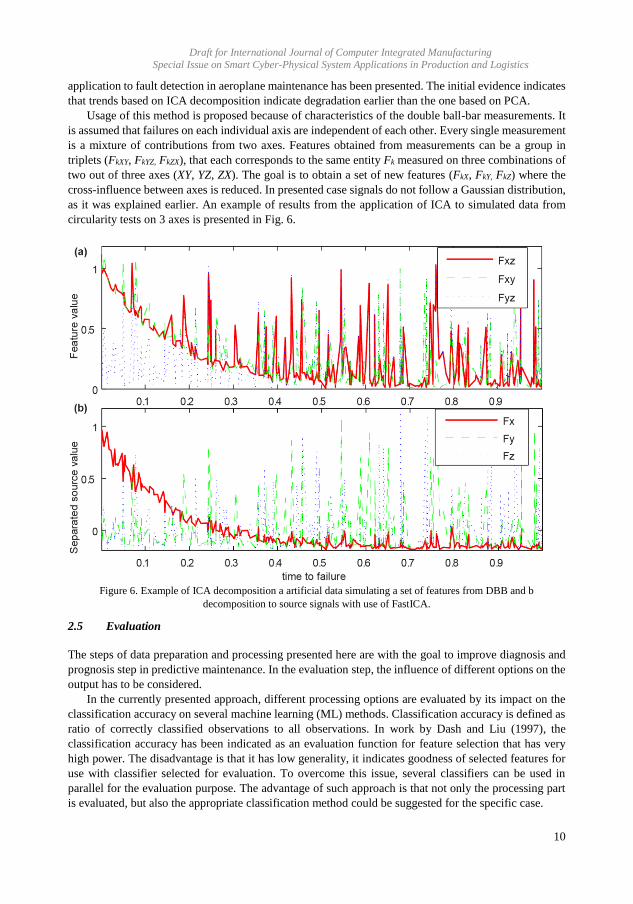
Draft for International Journal of Computer Integrated Manufacturing
Special Issue on Smart Cyber-Physical System Applications in Production and Logistics
10
application to fault detection in aeroplane maintenance has been presented. The initial evidence indicates
that trends based on ICA decomposition indicate degradation earlier than the one based on PCA.
Usage of this method is proposed because of characteristics of the double ball-bar measurements. It
is assumed that failures on each individual axis are independent of each other. Every single measurement
is a mixture of contributions from two axes. Features obtained from measurements can be a group in
triplets (FkXY, FkYZ, FkZX), that each corresponds to the same entity Fk measured on three combinations of
two out of three axes (XY, YZ, ZX). The goal is to obtain a set of new features (FkX, FkY, FkZ) where the
cross-influence between axes is reduced. In presented case signals do not follow a Gaussian distribution,
as it was explained earlier. An example of results from the application of ICA to simulated data from
circularity tests on 3 axes is presented in Fig. 6.
Figure 6. Example of ICA decomposition a artificial data simulating a set of features from DBB and b
decomposition to source signals with use of FastICA.
2.5 Evaluation
The steps of data preparation and processing presented here are with the goal to improve diagnosis and
prognosis step in predictive maintenance. In the evaluation step, the influence of different options on the
output has to be considered.
In the currently presented approach, different processing options are evaluated by its impact on the
classification accuracy on several machine learning (ML) methods. Classification accuracy is defined as
ratio of correctly classified observations to all observations. In work by Dash and Liu (1997), the
classification accuracy has been indicated as an evaluation function for feature selection that has very
high power. The disadvantage is that it has low generality, it indicates goodness of selected features for
use with classifier selected for evaluation. To overcome this issue, several classifiers can be used in
parallel for the evaluation purpose. The advantage of such approach is that not only the processing part
is evaluated, but also the appropriate classification method could be suggested for the specific case.
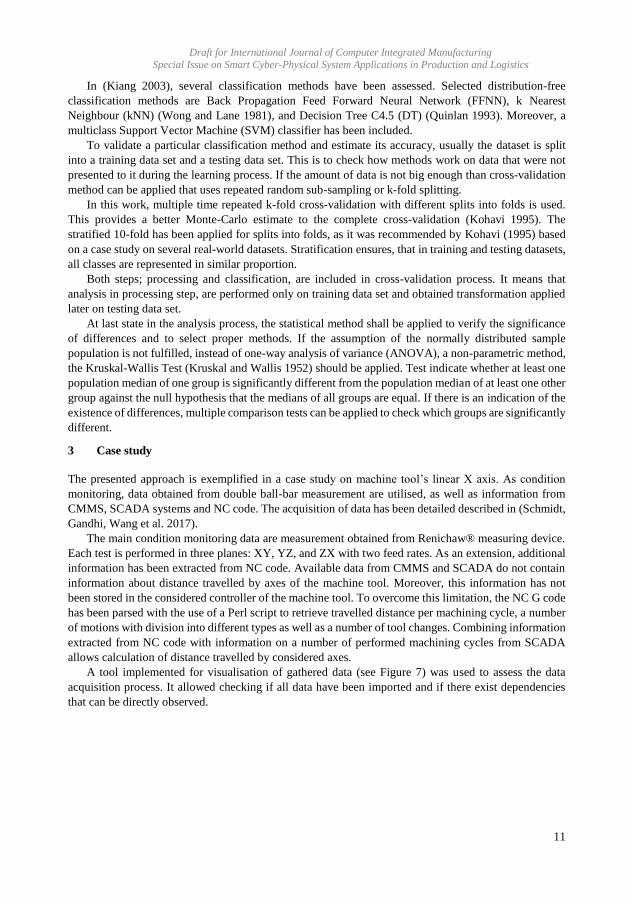
Draft for International Journal of Computer Integrated Manufacturing
Special Issue on Smart Cyber-Physical System Applications in Production and Logistics
11
In (Kiang 2003), several classification methods have been assessed. Selected distribution-free
classification methods are Back Propagation Feed Forward Neural Network (FFNN), k Nearest
Neighbour (kNN) (Wong and Lane 1981), and Decision Tree C4.5 (DT) (Quinlan 1993). Moreover, a
multiclass Support Vector Machine (SVM) classifier has been included.
To validate a particular classification method and estimate its accuracy, usually the dataset is split
into a training data set and a testing data set. This is to check how methods work on data that were not
presented to it during the learning process. If the amount of data is not big enough than cross-validation
method can be applied that uses repeated random sub-sampling or k-fold splitting.
In this work, multiple time repeated k-fold cross-validation with different splits into folds is used.
This provides a better Monte-Carlo estimate to the complete cross-validation (Kohavi 1995). The
stratified 10-fold has been applied for splits into folds, as it was recommended by Kohavi (1995) based
on a case study on several real-world datasets. Stratification ensures, that in training and testing datasets,
all classes are represented in similar proportion.
Both steps; processing and classification, are included in cross-validation process. It means that
analysis in processing step, are performed only on training data set and obtained transformation applied
later on testing data set.
At last state in the analysis process, the statistical method shall be applied to verify the significance
of differences and to select proper methods. If the assumption of the normally distributed sample
population is not fulfilled, instead of one-way analysis of variance (ANOVA), a non-parametric method,
the Kruskal-Wallis Test (Kruskal and Wallis 1952) should be applied. Test indicate whether at least one
population median of one group is significantly different from the population median of at least one other
group against the null hypothesis that the medians of all groups are equal. If there is an indication of the
existence of differences, multiple comparison tests can be applied to check which groups are significantly
different.
3 Case study
The presented approach is exemplified in a case study on machine tool’s linear X axis. As condition
monitoring, data obtained from double ball-bar measurement are utilised, as well as information from
CMMS, SCADA systems and NC code. The acquisition of data has been detailed described in (Schmidt,
Gandhi, Wang et al. 2017).
The main condition monitoring data are measurement obtained from Renichaw® measuring device.
Each test is performed in three planes: XY, YZ, and ZX with two feed rates. As an extension, additional
information has been extracted from NC code. Available data from CMMS and SCADA do not contain
information about distance travelled by axes of the machine tool. Moreover, this information has not
been stored in the considered controller of the machine tool. To overcome this limitation, the NC G code
has been parsed with the use of a Perl script to retrieve travelled distance per machining cycle, a number
of motions with division into different types as well as a number of tool changes. Combining information
extracted from NC code with information on a number of performed machining cycles from SCADA
allows calculation of distance travelled by considered axes.
A tool implemented for visualisation of gathered data (see Figure 7) was used to assess the data
acquisition process. It allowed checking if all data have been imported and if there exist dependencies
that can be directly observed.
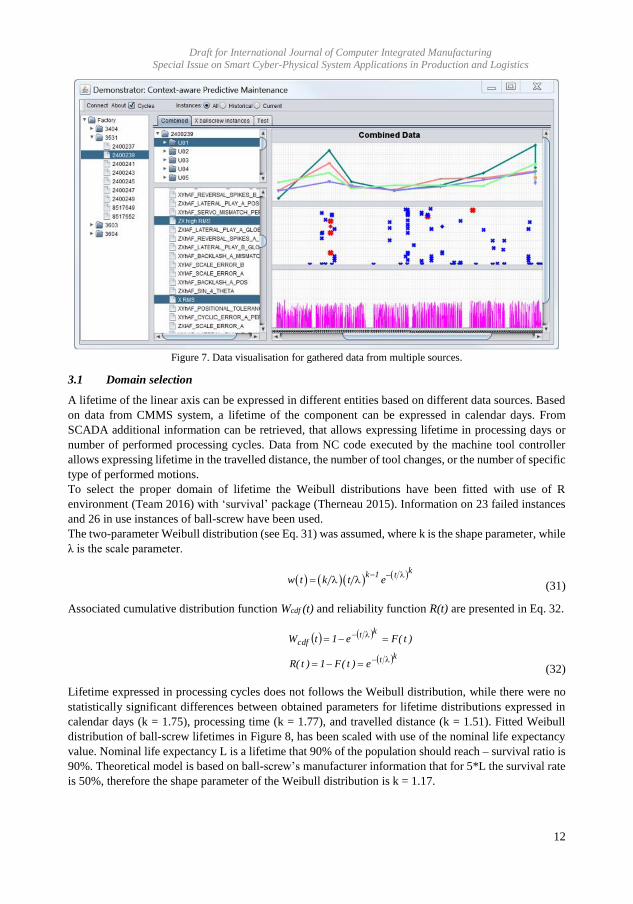
Draft for International Journal of Computer Integrated Manufacturing
Special Issue on Smart Cyber-Physical System Applications in Production and Logistics
12
Figure 7. Data visualisation for gathered data from multiple sources.
3.1 Domain selection
A lifetime of the linear axis can be expressed in different entities based on different data sources. Based
on data from CMMS system, a lifetime of the component can be expressed in calendar days. From
SCADA additional information can be retrieved, that allows expressing lifetime in processing days or
number of performed processing cycles. Data from NC code executed by the machine tool controller
allows expressing lifetime in the travelled distance, the number of tool changes, or the number of specific
type of performed motions.
To select the proper domain of lifetime the Weibull distributions have been fitted with use of R
environment (Team 2016) with ‘survival’ package (Therneau 2015). Information on 23 failed instances
and 26 in use instances of ball-screw have been used.
The two-parameter Weibull distribution (see Eq. 31) was assumed, where k is the shape parameter, while
λ is the scale parameter.
kk 1 t
w t k t e
(31)
Associated cumulative distribution function Wcdf (t) and reliability function R(t) are presented in Eq. 32.
kt
ktcdf
e)t(F1)t(R
)t(Fe1tW
(32)
Lifetime expressed in processing cycles does not follows the Weibull distribution, while there were no
statistically significant differences between obtained parameters for lifetime distributions expressed in
calendar days (k = 1.75), processing time (k = 1.77), and travelled distance (k = 1.51). Fitted Weibull
distribution of ball-screw lifetimes in Figure 8, has been scaled with use of the nominal life expectancy
value. Nominal life expectancy L is a lifetime that 90% of the population should reach – survival ratio is
90%. Theoretical model is based on ball-screw’s manufacturer information that for 5*L the survival rate
is 50%, therefore the shape parameter of the Weibull distribution is k = 1.17.
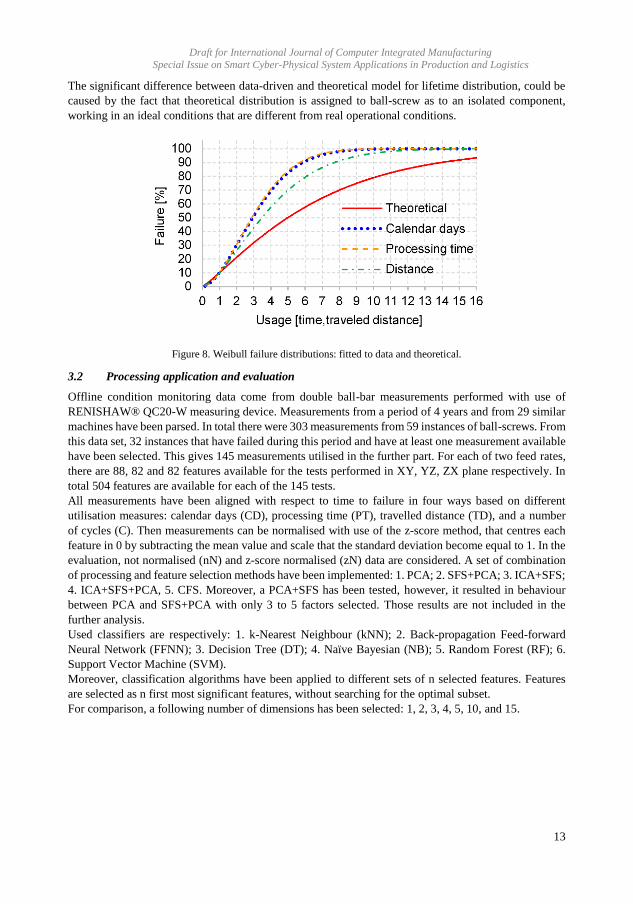
Draft for International Journal of Computer Integrated Manufacturing
Special Issue on Smart Cyber-Physical System Applications in Production and Logistics
13
The significant difference between data-driven and theoretical model for lifetime distribution, could be
caused by the fact that theoretical distribution is assigned to ball-screw as to an isolated component,
working in an ideal conditions that are different from real operational conditions.
Figure 8. Weibull failure distributions: fitted to data and theoretical.
3.2 Processing application and evaluation
Offline condition monitoring data come from double ball-bar measurements performed with use of
RENISHAW® QC20-W measuring device. Measurements from a period of 4 years and from 29 similar
machines have been parsed. In total there were 303 measurements from 59 instances of ball-screws. From
this data set, 32 instances that have failed during this period and have at least one measurement available
have been selected. This gives 145 measurements utilised in the further part. For each of two feed rates,
there are 88, 82 and 82 features available for the tests performed in XY, YZ, ZX plane respectively. In
total 504 features are available for each of the 145 tests.
All measurements have been aligned with respect to time to failure in four ways based on different
utilisation measures: calendar days (CD), processing time (PT), travelled distance (TD), and a number
of cycles (C). Then measurements can be normalised with use of the z-score method, that centres each
feature in 0 by subtracting the mean value and scale that the standard deviation become equal to 1. In the
evaluation, not normalised (nN) and z-score normalised (zN) data are considered. A set of combination
of processing and feature selection methods have been implemented: 1. PCA; 2. SFS+PCA; 3. ICA+SFS;
4. ICA+SFS+PCA, 5. CFS. Moreover, a PCA+SFS has been tested, however, it resulted in behaviour
between PCA and SFS+PCA with only 3 to 5 factors selected. Those results are not included in the
further analysis.
Used classifiers are respectively: 1. k-Nearest Neighbour (kNN); 2. Back-propagation Feed-forward
Neural Network (FFNN); 3. Decision Tree (DT); 4. Naïve Bayesian (NB); 5. Random Forest (RF); 6.
Support Vector Machine (SVM).
Moreover, classification algorithms have been applied to different sets of n selected features. Features
are selected as n first most significant features, without searching for the optimal subset.
For comparison, a following number of dimensions has been selected: 1, 2, 3, 4, 5, 10, and 15.

Draft for International Journal of Computer Integrated Manufacturing
Special Issue on Smart Cyber-Physical System Applications in Production and Logistics
14
3.3 Configuration of methods
3.3.1 Statistical Feature Selection
For SFS two sample sets of the size of n1=30 samples with the longest time to failure and n2=50 samples
with the shortest time to failure are selected. This corresponds to data from good health state, and from
degraded health state respectively and are drawn each time from a training population of around 130
samples. The assumption is that, as a lifetime of ball-screws is relatively long, and only measurements
from one that had failed are considered there is more measurement available from the degraded state than
from good state.
3.3.2 Correlation-based Feature Selection
This method has been implemented as one of the reference methods, used in similar studies presented
(Binsaeid, Asfour, Cho et al. 2009). In process of feature discretisation and searching for optimal feature
subset it requires the information of class labels – supervised learning. The same labels are used as later
for supervised learning of classification method.
3.3.3 Independent Component Analysis
For ICA only 492 features have been considered, while 12 features have been discarded as there were no
corresponding features to group them in triplets. Discarded features come from measurement on XY
plane, where the full circular path is performed, while on YZ, and ZX planes only a 270-degree arc is
executed, and not all features can be retrieved.
3.3.4 Labelling for supervised learning
There is no information available for each measurement about true degradation state that could be used
to label the data. The whole data set (145 samples) has been divided based on time to failure into three
classes: 1. good health state; 2. initiation of degradation; and 3. degraded/faulty state. The threshold used
to calculate the size of classes was selected as 135 processing days, and 50 processing days before failure.
To set threshold, trends on several features selected by SFS has been analysed. Sizes of those classes are
41, 49 and 55 respectively. For each time usage domain (CD, PT, TD, C) the size of respective classes is
kept the same.
3.3.5 k-Nearest Neighbour
To select the proper size of the neighbourhood the k value, a wrapper like optimisation has been
performed. The 10-fold cross-validation has been performed 50 times on not normalised (nN) data
ordered with use of Processing Time (PT). The classification has been performed with value of k from 1
to 40 and with use of 1 to 40 features from SFS. Then for each fold, k has been selected that maximise
the average accuracy of classification on the test dataset. Accuracy has been averaged among 40 results
obtained from different feature sets. Value k=15 has been selected, as one that was occurring most often
among giving optimal results. Because of this optimisation, there could be a bias in further results, toward
methods that have been applied at this stage.
3.3.6 Neural Network
Tests have been performed with different numbers of hidden neurons (5, 10, and 15). No difference has
been noticed and the default value of 10 neurons in hidden layer has been selected. The output layer
consists of three neurons, while a number of neurons in the input layer is equal to the number of input
signals.

Draft for International Journal of Computer Integrated Manufacturing
Special Issue on Smart Cyber-Physical System Applications in Production and Logistics
15
3.3.7 Random Forest
The classification’s parameter selection has been performed in a similar way as for kNN algorithm. A
bigger number of trees in a random forest prevents overfitting problem, however, makes the algorithm
very time-consuming. Value of 40 trees has been selected as a tradeoff between accuracy and execution
time.
3.3.8 Support Vector Machine
Linear SVM and Radial Kernel SVM have been checked. As Radial Based SVM performed much better,
only this classifier is included in further steps. To select proper parameters for the kernel, a grid search
has been performed on a set of training data, and the optimal parameters that occur most often have been
selected. Those parameters are c=4, g=0014, and c=2, g=0.002 for not normalised and normalised
features respectively.
3.4 Cross-validation step
Combining different pre-processing and feature selection method with classification methods gives in
total 2016 possible configurations. All those configurations are applied in 10-fold cross validation
repeated 30 times for different folds sampling, producing 300 classification accuracy values for each
configuration. In none of the 2016 cases, the distribution of accuracy follows the normal distribution.
This has been verified with use of Anderson–Darling test (Anderson and Darling 1954) with a
significance level of p=0.05. For analysing the results the nonparametric Kruskal-Wallis test (Kruskal
and Wallis 1952) is applied.
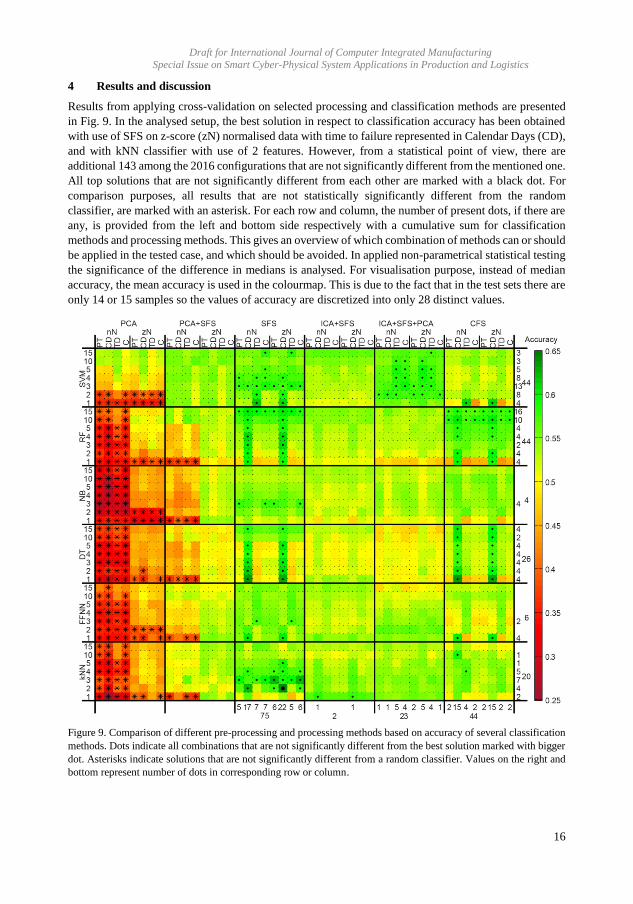
Draft for International Journal of Computer Integrated Manufacturing
Special Issue on Smart Cyber-Physical System Applications in Production and Logistics
16
4 Results and discussion
Results from applying cross-validation on selected processing and classification methods are presented
in Fig. 9. In the analysed setup, the best solution in respect to classification accuracy has been obtained
with use of SFS on z-score (zN) normalised data with time to failure represented in Calendar Days (CD),
and with kNN classifier with use of 2 features. However, from a statistical point of view, there are
additional 143 among the 2016 configurations that are not significantly different from the mentioned one.
All top solutions that are not significantly different from each other are marked with a black dot. For
comparison purposes, all results that are not statistically significantly different from the random
classifier, are marked with an asterisk. For each row and column, the number of present dots, if there are
any, is provided from the left and bottom side respectively with a cumulative sum for classification
methods and processing methods. This gives an overview of which combination of methods can or should
be applied in the tested case, and which should be avoided. In applied non-parametrical statistical testing
the significance of the difference in medians is analysed. For visualisation purpose, instead of median
accuracy, the mean accuracy is used in the colourmap. This is due to the fact that in the test sets there are
only 14 or 15 samples so the values of accuracy are discretized into only 28 distinct values.
Figure 9. Comparison of different pre-processing and processing methods based on accuracy of several classification
methods. Dots indicate all combinations that are not significantly different from the best solution marked with bigger
dot. Asterisks indicate solutions that are not significantly different from a random classifier. Values on the right and
bottom represent number of dots in corresponding row or column.
Draft for International Journal of Computer Integrated Manufacturing
Special Issue on Smart Cyber-Physical System Applications in Production and Logistics
17
4.1 Marginal statistics
More insight can be obtained by analysing marginal statistics when only the subset of configuration
parameters are considered (see Table 1). Options from analysed subset of parameters has been ordered
in descending order in respect to obtained accuracy, with consideration of statistical significance in
differences. This could provide some generalisation of which configuration to choose. However, it needs
to be noticed, that if some method, in general, gives good results, it does not means it always is better
than other methods.
Table 1. Marginal statistics of cross validation results
Ordered options*
Domain 1. CD; 2. TD; 3. [PT, C]
Normalisation 1. zN; 2. nN
Processing method 1. SFS; 2. CFS; 3. ICA+SFS+PCA; 4. ICA+SFS; 5. PCA+SFS; 6.
PCA
Classification method 1. SVM; 2. kNN; 3. RF; 4. FFNN; 5. NB; 6. DT.
Dimension no 1. [10, 15]; 2. [3, 4, 5]; 3. 2; 4. 1.
Processing method
x Classification method
1. ICA+SFS+PCA x SVM; 2. SFS x SVM; 3. [SFS x kNN, SFS x
FFNN, CFS x RF, SFS x RF]; 4. [SFS x NB, PCA+SFS x SVM,
ICA+SFS+PCA x kNN, ICA+SFS x kNN, CFS x NB] *options in square brackets holding the same position are statistically not significantly different from each other
4.2 Correlation-based Feature Selection
Analysing results obtained for Correlation-based Feature Selection, it can be noticed, that good results
are obtained when Random Forest or Decision Tree classifiers are applied. It is due to fact that CFS is a
wrapper based method that evaluates selected subset of features with the use of a similar method that is
used in mentioned classification method. One needs to be careful applying such method for feature
selection when in a later stage another classification method is used.
4.3 Limitations
The results of analysis depend on selected analyses ranges. Considering the different set of numbers of
selected features the results can be different. In the presented analysis, lower dimensionality is
overrepresented, and this could cause bias toward methods that work better with a lower number of
selected features.
4.4 Economic justification
To analyse results, from the perspective of potential benefits of its application, an economic evaluation
method is defined. A simple condition based maintenance strategy is proposed and compared with time
based maintenance. Obtained results are from Monte Carlo simulation where 100000 of instances is being
simulated in each scenario. The considered key performance indicators (KPI) are the cost and ratio of
emergency work orders. Cost is expressed in imaginary currency unit U. All times presented in this
section are expressed in calendar days if not indicated differently.
Assumptions for the economic model: TCM = 90 – an interval for CBM offline measurements; TPL = 14 –
time required to schedule planned work order, if component fails within this time it is an emergency work
order; CCM = 10U – cost for condition monitoring inspection; CEWO = 2400U – cost for unplanned
emergency work order (EWO); CPWO = 800U – cost for planned preventive work order (PWO). Cost for
unplanned work order is equal to cost for planned work order increased by direct cost of stopped
production for the time needed for the replacement that is assumed to be the same as for planned work
order.
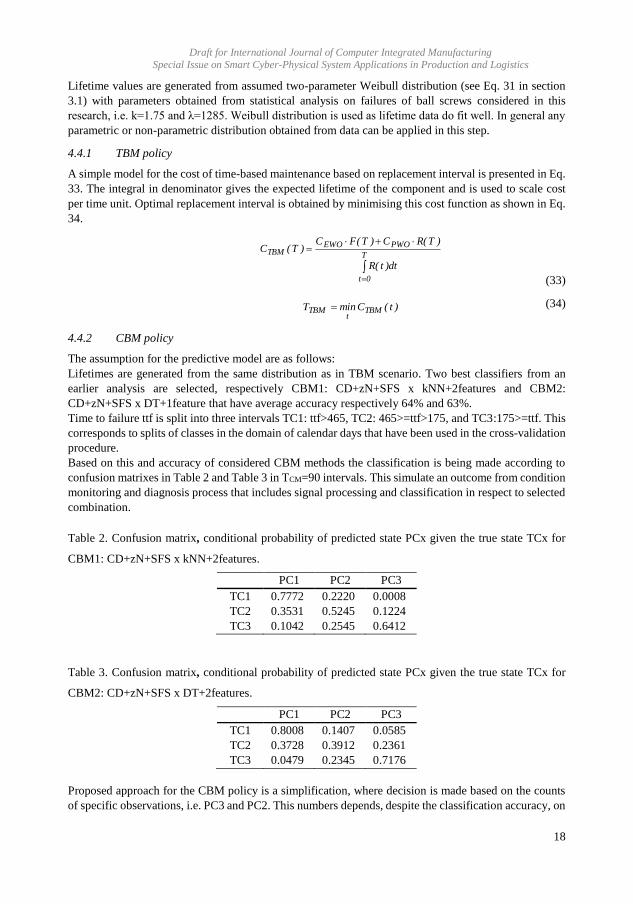
Draft for International Journal of Computer Integrated Manufacturing
Special Issue on Smart Cyber-Physical System Applications in Production and Logistics
18
Lifetime values are generated from assumed two-parameter Weibull distribution (see Eq. 31 in section
3.1) with parameters obtained from statistical analysis on failures of ball screws considered in this
research, i.e. k=1.75 and λ=1285. Weibull distribution is used as lifetime data do fit well. In general any
parametric or non-parametric distribution obtained from data can be applied in this step.
4.4.1 TBM policy
A simple model for the cost of time-based maintenance based on replacement interval is presented in Eq.
33. The integral in denominator gives the expected lifetime of the component and is used to scale cost
per time unit. Optimal replacement interval is obtained by minimising this cost function as shown in Eq.
34.
T
0t
PWOEWOTBM
dt)t(R
)T(RC)T(FC)T(C
(33)
)t(CminT TBMt
TBM (34)
4.4.2 CBM policy
The assumption for the predictive model are as follows:
Lifetimes are generated from the same distribution as in TBM scenario. Two best classifiers from an
earlier analysis are selected, respectively CBM1: CD+zN+SFS x kNN+2features and CBM2:
CD+zN+SFS x DT+1feature that have average accuracy respectively 64% and 63%.
Time to failure ttf is split into three intervals TC1: ttf>465, TC2: 465>=ttf>175, and TC3:175>=ttf. This
corresponds to splits of classes in the domain of calendar days that have been used in the cross-validation
procedure.
Based on this and accuracy of considered CBM methods the classification is being made according to
confusion matrixes in Table 2 and Table 3 in TCM=90 intervals. This simulate an outcome from condition
monitoring and diagnosis process that includes signal processing and classification in respect to selected
combination.
Table 2. Confusion matrix, conditional probability of predicted state PCx given the true state TCx for
CBM1: CD+zN+SFS x kNN+2features.
PC1 PC2 PC3
TC1 0.7772 0.2220 0.0008
TC2 0.3531 0.5245 0.1224
TC3 0.1042 0.2545 0.6412
Table 3. Confusion matrix, conditional probability of predicted state PCx given the true state TCx for
CBM2: CD+zN+SFS x DT+2features.
PC1 PC2 PC3
TC1 0.8008 0.1407 0.0585
TC2 0.3728 0.3912 0.2361
TC3 0.0479 0.2345 0.7176
Proposed approach for the CBM policy is a simplification, where decision is made based on the counts
of specific observations, i.e. PC3 and PC2. This numbers depends, despite the classification accuracy, on
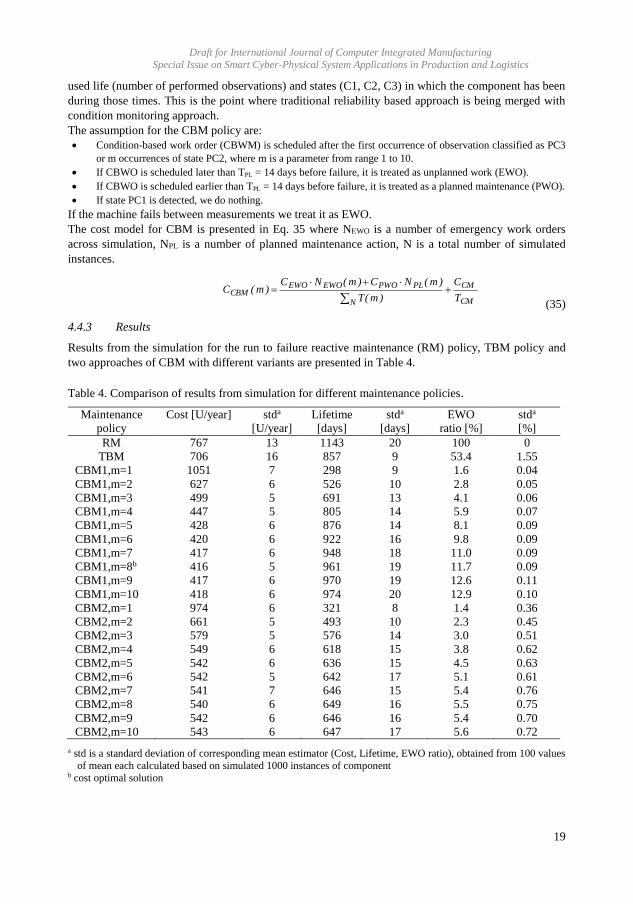
Draft for International Journal of Computer Integrated Manufacturing
Special Issue on Smart Cyber-Physical System Applications in Production and Logistics
19
used life (number of performed observations) and states (C1, C2, C3) in which the component has been
during those times. This is the point where traditional reliability based approach is being merged with
condition monitoring approach.
The assumption for the CBM policy are:
Condition-based work order (CBWM) is scheduled after the first occurrence of observation classified as PC3
or m occurrences of state PC2, where m is a parameter from range 1 to 10.
If CBWO is scheduled later than TPL = 14 days before failure, it is treated as unplanned work (EWO).
If CBWO is scheduled earlier than TPL = 14 days before failure, it is treated as a planned maintenance (PWO).
If state PC1 is detected, we do nothing.
If the machine fails between measurements we treat it as EWO.
The cost model for CBM is presented in Eq. 35 where NEWO is a number of emergency work orders
across simulation, NPL is a number of planned maintenance action, N is a total number of simulated
instances.
CM
CM
N
PLPWOEWOEWOCBM
T
C
)m(T
)m(NC)m(NC)m(C
(35)
4.4.3 Results
Results from the simulation for the run to failure reactive maintenance (RM) policy, TBM policy and
two approaches of CBM with different variants are presented in Table 4.
Table 4. Comparison of results from simulation for different maintenance policies.
Maintenance
policy
Cost [U/year] stda
[U/year]
Lifetime
[days]
stda
[days]
EWO
ratio [%]
stda
[%]
RM 767 13 1143 20 100 0
TBM 706 16 857 9 53.4 1.55
CBM1,m=1 1051 7 298 9 1.6 0.04
CBM1,m=2 627 6 526 10 2.8 0.05
CBM1,m=3 499 5 691 13 4.1 0.06
CBM1,m=4 447 5 805 14 5.9 0.07
CBM1,m=5 428 6 876 14 8.1 0.09
CBM1,m=6 420 6 922 16 9.8 0.09
CBM1,m=7 417 6 948 18 11.0 0.09
CBM1,m=8b 416 5 961 19 11.7 0.09
CBM1,m=9 417 6 970 19 12.6 0.11
CBM1,m=10 418 6 974 20 12.9 0.10
CBM2,m=1 974 6 321 8 1.4 0.36
CBM2,m=2 661 5 493 10 2.3 0.45
CBM2,m=3 579 5 576 14 3.0 0.51
CBM2,m=4 549 6 618 15 3.8 0.62
CBM2,m=5 542 6 636 15 4.5 0.63
CBM2,m=6 542 5 642 17 5.1 0.61
CBM2,m=7 541 7 646 15 5.4 0.76
CBM2,m=8 540 6 649 16 5.5 0.75
CBM2,m=9 542 6 646 16 5.4 0.70
CBM2,m=10 543 6 647 17 5.6 0.72
a std is a standard deviation of corresponding mean estimator (Cost, Lifetime, EWO ratio), obtained from 100 values
of mean each calculated based on simulated 1000 instances of component b cost optimal solution
Draft for International Journal of Computer Integrated Manufacturing
Special Issue on Smart Cyber-Physical System Applications in Production and Logistics
20
It can be noticed that in most of the cases, the CBM approaches in the simulated case are more beneficial
than the TBM. If we consider for example strategy CBM1with m=5, then with similar expected lifetime
(876 vs. 857), the ratio of emergency work orders EWO is reduced over 6 times with respect to TBM
(8.1% vs. 53.4%), and it reduces cost by almost 40% (428 vs. 706). The difference in classification
accuracy between CBM1 and CBM2 is not big, however, the economical KPI looks differently. This is
due to differences in classifier sensitivity for individual classes. It can be noticed, that for CBM2 in Table
3 there is a high ratio of false positive detection of PC3 than for states TC1 and TC2. This would cause
that the components are replaced earlier than it is required.
In this study, inappropriate use of condition based approach (e.g. CBM1, m=1 and CBM2, m=1), despite
the low ratio of EWO, is inefficient in terms of direct cost.
The potential improvement is noticeable; however, there is a need for more thorough analysis that will
include the effect of the model's inaccuracies on the estimation of KPI’s.
5 Conclusions and future work
In this work, we presented an approach for integration of data from different sources (CMMS, SCADA,
and CM) and from a population of similar objects with the aim to provide decision support system that
will improve maintenance actions. Real data related to the population of 29 similar linear axes of the
machine tools are analysed. Presented cross-validation framework allows to compare different processing
and feature selection method, and at the same time gives suggestion which from used machine learning
methods shows better performance in each individual case. It has been shown that proposed SFS method
performs very well being statistically significantly better than other processing methods when
considering independently from ML method. While the proposed combination of ICA+SFS+PCA
method together with SVM gives statistically best combination of the method when analysing
independently from other attributes. The obtained classification method is applied as a decision support
tool for making maintenance actions. Economic evaluation is shown with application to the simulated
case. Results show that in analysed case the condition based approach can reduce the number of
unplanned stops and the cost of maintenance.
Future work will be focused on including presented economic justification model in the statistical
evaluation framework. Moreover, the Condition Based Maintenance policies could be improved by
considering more advanced predictive models, e.g. Hidden Semi Markov Model (HSMM). Further
optimisation can be applied to find an optimal interval for condition monitoring, i.e. the double ball-bar
measurements.
6 Acknowledgements
Authors would like to acknowledge the financial support of the Knowledge Foundation (KK-
Environment INFINIT), the University of Skövde, Volvo GTO and Volvo Cars through the IPSI
industrial research school on University of Skövde.
7 References
Anderson, T. W. and D. A. Darling (1954). "A Test of Goodness of Fit." Journal of the American
Statistical Association 49(268): 765-769. doi:10.2307/2281537
Archenti, A. (2014). "Prediction of machined part accuracy from machining system capability." CIRP
Annals 63(1): 505-508. doi:https://doi.org/10.1016/j.cirp.2014.03.040
Archenti, A., M. Nicolescu, G. Casterman and S. Hjelm (2012). "A New Method for Circular Testing of
Machine Tools Under Loaded Condition." Procedia CIRP 1(Supplement C): 575-580.
doi:https://doi.org/10.1016/j.procir.2012.05.002
Arifianto, D. (2011). Source separation using independent component analysis techniques for machine
fault detection in the presence of background noise. 2011 2nd International Conference on
Instrumentation Control and Automation. doi:10.1109/ICA.2011.6130171
Draft for International Journal of Computer Integrated Manufacturing
Special Issue on Smart Cyber-Physical System Applications in Production and Logistics
21
Binsaeid, S., S. Asfour, S. Cho and A. Onar (2009). "Machine ensemble approach for simultaneous
detection of transient and gradual abnormalities in end milling using multisensor fusion." Journal of
Materials Processing Technology 209(10): 4728-4738.
doi:https://doi.org/10.1016/j.jmatprotec.2008.11.038
Bo, S., Z. Shengkui, K. Rui and M. G. Pecht (2012). "Benefits and Challenges of System Prognostics."
Reliability, IEEE Transactions on 61(2): 323-335. doi:10.1109/TR.2012.2194173
Bryan, J. B. (1982). "A simple method for testing measuring machines and machine tools Part 1:
Principles and applications." Precision Engineering 4(2): 61-69. doi:https://doi.org/10.1016/0141-
6359(82)90018-6
Chen, D., L. Dong, Y. Bian and J. Fan (2015). "Prediction and identification of rotary axes error of non-
orthogonal five-axis machine tool." International Journal of Machine Tools and Manufacture
94(Supplement C): 74-87. doi:https://doi.org/10.1016/j.ijmachtools.2015.03.010
Dash, M. and H. Liu (1997). "Feature selection for classification." Intelligent Data Analysis 1(1): 131-
156. doi:https://doi.org/10.1016/S1088-467X(97)00008-5
Dehnavi, H., M. R. Movahhedy, A. Naebi and S. Pasban (2012). Prediction of the Effect of Heat
Generation in Ballscrew on the Accuracy of CNC Milling Machine. Computer Modelling and
Simulation (UKSim), 2012 UKSim 14th International Conference on. doi:10.1109/UKSim.2012.47
Delbressine, F. L. M., G. H. J. Florussen, L. A. Schijvenaars and P. H. J. Schellekens (2006). "Modelling
thermomechanical behaviour of multi-axis machine tools." Precision Engineering 30(1): 47-53.
doi:https://doi.org/10.1016/j.precisioneng.2005.05.005
Elwany, A. H. (2012). Sensor-Based Prognostics and Structured Maintenance Policies for Components
with Complex Degradation, BiblioBazaar.
Elwany, A. H. and N. Z. Gebraeel (2008). "Sensor-driven prognostic models for equipment replacement
and spare parts inventory." IIE Transactions 40(7): 629-639. doi:10.1080/07408170701730818
Fayyad, U., G. Piatetsky-Shapiro and P. Smyth (1996). "From data mining to knowledge discovery in
databases." AI magazine 17(3): 37.
Feng, G.-H. and Y.-L. Pan (2012). "Establishing a cost-effective sensing system and signal processing
method to diagnose preload levels of ball screws." Mechanical Systems and Signal Processing
28(Supplement C): 78-88. doi:https://doi.org/10.1016/j.ymssp.2011.10.004
Fleischer, J., A. Broos, M. Schopp, J. Wieser and H. Hennrich (2009). "Lifecycle-oriented component
selection for machine tools based on multibody simulation and component life prediction." CIRP
Journal of Manufacturing Science and Technology 1(3): 179-184.
doi:http://dx.doi.org/10.1016/j.cirpj.2008.10.006
Florussen, G. H. J., F. L. M. Delbressine and P. H. J. Schellekens (2003). "Assessing Thermally Induced
Errors of Machine Tools by 3D Length Measurements." CIRP Annals 52(1): 333-336.
doi:https://doi.org/10.1016/S0007-8506(07)60595-2
Gao, R., L. Wang, R. Teti, D. Dornfeld, S. Kumara, M. Mori and M. Helu (2015). "Cloud-enabled
prognosis for manufacturing." CIRP Annals - Manufacturing Technology 64(2): 749-772.
doi:10.1016/j.cirp.2015.05.011
Garinei, A. and R. Marsili (2012). "A new diagnostic technique for ball screw actuators." Measurement
45(5): 819-828. doi:http://dx.doi.org/10.1016/j.measurement.2012.02.023
Gebraeel, N. (2006). "Sensory-Updated Residual Life Distributions for Components With Exponential
Degradation Patterns." IEEE Transactions on Automation Science and Engineering 3(4): 382-393.
doi:10.1109/TASE.2006.876609
Gebraeel, N., M. Lawley, R. Liu and V. Parmeshwaran (2004). "Residual life predictions from vibration-
based degradation signals: a neural network approach." Industrial Electronics, IEEE Transactions
on 51(3): 694-700. doi:10.1109/TIE.2004.824875
Draft for International Journal of Computer Integrated Manufacturing
Special Issue on Smart Cyber-Physical System Applications in Production and Logistics
22
Gebraeel, N. Z., M. A. Lawley, R. Li and J. K. Ryan (2005). "Residual-life distributions from component
degradation signals: A Bayesian approach." IIE Transactions 37(6): 543-557.
doi:10.1080/07408170590929018
Gelle, G., M. Colas and C. Serviere (2001). "Blind Source Separation: A Tool For Rotating Machine
Monitoring By Vibrations Analysis?" Journal of Sound and Vibration 248(5): 865-885.
doi:http://dx.doi.org/10.1006/jsvi.2001.3819
Hall, M. A. (1999). "Correlation-based feature selection for machine learning."
Halligan, G. R. and S. Jagannathan (2011). "PCA-based fault isolation and prognosis with application to
pump." The International Journal of Advanced Manufacturing Technology 55(5): 699-707.
doi:10.1007/s00170-010-3096-2
Hyvarinen, A. (1999). "Fast and robust fixed-point algorithms for independent component analysis."
IEEE Transactions on Neural Networks 10(3): 626-634. doi:10.1109/72.761722
Jardine, A. K. S., D. Lin and D. Banjevic (2006). "A review on machinery diagnostics and prognostics
implementing condition-based maintenance." Mechanical Systems and Signal Processing 20(7):
1483-1510. doi:http://dx.doi.org/10.1016/j.ymssp.2005.09.012
Jemielniak, K., L. Kwiatkowski and P. Wrzosek (1998). "Diagnosis of tool wear based on cutting forces
and acoustic emission measures as inputs to a neural network." Journal of Intelligent Manufacturing
9(5): 447-455.
Kakino, Y., Y. Ihara, Y. Nakatsu and K. Okamura (1987). "The measurement of motion errors of NC
machine tools and diagnosis of their origins by using telescoping magnetic ball bar method." CIRP
Annals-Manufacturing Technology 36(1): 377-380.
Kang, M., M. R. Islam, J. Kim, J. M. Kim and M. Pecht (2016). "A Hybrid Feature Selection Scheme for
Reducing Diagnostic." IEEE Trancactions on Industrial Electronics 63(5): 3299-3310.
doi:10.1109/tie.2016.2527623
Kiang, M. Y. (2003). "A comparative assessment of classification methods." Decision Support Systems
35(4): 441-454. doi:http://dx.doi.org/10.1016/S0167-9236(02)00110-0
Kohavi, R. (1995). A study of cross-validation and bootstrap for accuracy estimation and model selection.
Ijcai, Stanford, CA.
Kohavi, R. and G. H. John (1997). "Wrappers for feature subset selection." Artificial Intelligence 97(1):
273-324. doi:https://doi.org/10.1016/S0004-3702(97)00043-X
Kruskal, W. H. and W. A. Wallis (1952). "Use of Ranks in One-Criterion Variance Analysis." Journal
of the American Statistical Association 47(260): 583-621. doi:10.1080/01621459.1952.10483441
Lee, W. G., J. W. Lee, M. S. Hong, S. H. Nam, Y. Jeon and M. G. Lee (2015). "Failure diagnosis system
for a ball-screw by using vibration signals." Shock and Vibration 2015. doi:10.1155/2015/435870
Malhi, A. and R. X. Gao (2004). "PCA-based feature selection scheme for machine defect classification."
IEEE Transactions on Instrumentation and Measurement 53(6): 1517-1525.
Mann, H. B. and D. R. Whitney (1947). "On a test of whether one of two random variables is
stochastically larger than the other." The annals of mathematical statistics: 50-60.
Massey, F. J. (1951). "The Kolmogorov-Smirnov Test for Goodness of Fit." Journal of the American
Statistical Association 46(253): 68-78. doi:10.2307/2280095
Medina-Oliva, G., A. Voisin, M. Monnin and J. B. Leger (2014). "Predictive diagnosis based on a fleet-
wide ontology approach." Knowledge-Based Systems 68: 40-57.
Medjaher, K., D. A. Tobon-Mejia and N. Zerhouni (2012). "Remaining Useful Life Estimation of Critical
Components With Application to Bearings." IEEE Transactions on Reliability 61(2): 292-302.
doi:10.1109/TR.2012.2194175
Pang, W.-K., P.-K. Leung, W.-K. Huang and W. Liu (2005). "On interval estimation of the coefficient
of variation for the three-parameter Weibull, lognormal and gamma distribution: A simulation-based
approach." European Journal of Operational Research 164(2): 367-377.
doi:http://dx.doi.org/10.1016/j.ejor.2003.04.005
Draft for International Journal of Computer Integrated Manufacturing
Special Issue on Smart Cyber-Physical System Applications in Production and Logistics
23
Prytz, R., S. Nowaczyk, T. Rögnvaldsson and S. Byttner (2013). Analysis of truck compressor failures
based on logged vehicle data. Proceedings of the International Conference on Data Mining (DMIN),
The Steering Committee of The World Congress in Computer Science, Computer Engineering and
Applied Computing (WorldComp).
Prytz, R., S. Nowaczyk, T. Rögnvaldsson and S. Byttner (2015). "Predicting the need for vehicle
compressor repairs using maintenance records and logged vehicle data." Engineering Applications
of Artificial Intelligence 41(Supplement C): 139-150.
doi:https://doi.org/10.1016/j.engappai.2015.02.009
Quan, Y., M. Zhou and Z. Luo (1998). "On-line robust identification of tool-wear via multi-sensor neural-
network fusion." Engineering Applications of Artificial Intelligence 11(6): 717-722.
doi:https://doi.org/10.1016/S0952-1976(98)00046-3
Quinlan, J. R. (1993). C4.5: programs for machine learning, Morgan Kaufmann Publishers Inc.
Satterthwaite, F. E. (1946). "An Approximate Distribution of Estimates of Variance Components."
Biometrics Bulletin 2(6): 110-114. doi:10.2307/3002019
Scheffer, C. and P. S. Heyns (2004). "An industrial tool wear monitoring system for interrupted turning."
Mechanical Systems and Signal Processing 18(5): 1219-1242.
doi:https://doi.org/10.1016/j.ymssp.2003.09.001
Schimert, J. (2008). Data-Driven Fault Detection Based on Process Monitoring using Dimension
Reduction Techniques. 2008 IEEE Aerospace Conference. doi:10.1109/AERO.2008.4526621
Schmidt, B., K. Gandhi, L. Wang and D. Galar (2017). "Context preparation for predictive analytics – a
case from manufacturing industry." Journal of Quality in Maintenance Engineering 23(3): 583-588.
doi:https://doi.org/10.1108/JQME-10-2016-0050
Schmidt, B., L. Wang and D. Galar (2017). "Semantic Framework for Predictive Maintenance in a Cloud
Environment." Procedia CIRP 62: 583-588. doi:https://doi.org/10.1016/j.procir.2016.06.047
Sikorska, J. Z., M. Hodkiewicz and L. Ma (2011). "Prognostic modelling options for remaining useful
life estimation by industry." Mechanical Systems and Signal Processing 25(5): 1803-1836.
doi:http://dx.doi.org/10.1016/j.ymssp.2010.11.018
Team, R. C. (2016). "R: A Language and Environment for Statistical Computing." from https://www.R-
project.org/.
Teti, R., K. Jemielniak, G. O’Donnell and D. Dornfeld (2010). "Advanced monitoring of machining
operations." CIRP Annals - Manufacturing Technology 59(2): 717-739.
doi:http://dx.doi.org/10.1016/j.cirp.2010.05.010
Therneau, T. (2015). "A Package for Survival Analysis in S." from http://CRAN.R-
project.org/package=survival.
Tien, D. X., K. W. Lim and L. Jun (2004). Comparative study of PCA approaches in process monitoring
and fault detection. 30th Annual Conference of IEEE Industrial Electronics Society, 2004. IECON
2004. doi:10.1109/IECON.2004.1432212
Tsai, P. C., C. C. Cheng and Y. C. Hwang (2014). "Ball screw preload loss detection using ball pass
frequency." Mechanical Systems and Signal Processing 48(1–2): 77-91.
doi:http://dx.doi.org/10.1016/j.ymssp.2014.02.017
Uddin, M. S., S. Ibaraki, A. Matsubara and T. Matsushita (2009). "Prediction and compensation of
machining geometric errors of five-axis machining centers with kinematic errors." Precision
Engineering 33(2): 194-201. doi:https://doi.org/10.1016/j.precisioneng.2008.06.001
Wang, T., J. Yu, D. Siegel and J. Lee (2008). A similarity-based prognostics approach for remaining
useful life estimation of engineered systems, Denver. doi:10.1109/PHM.2008.4711421
Verl, A., U. Heisel, M. Walther and D. Maier (2009). "Sensorless automated condition monitoring for
the control of the predictive maintenance of machine tools." CIRP Annals - Manufacturing
Technology 58(1): 375-378. doi:http://dx.doi.org/10.1016/j.cirp.2009.03.039

Draft for International Journal of Computer Integrated Manufacturing
Special Issue on Smart Cyber-Physical System Applications in Production and Logistics
24
Vogl, G. W., M. A. Donmez and A. Archenti (2016). "Diagnostics for geometric performance of machine
tool linear axes." CIRP Annals 65(1): 377-380. doi:https://doi.org/10.1016/j.cirp.2016.04.117
Wong, M. A. and T. Lane (1981). A kTH Nearest Neighbour Clustering Procedure. Computer Science
and Statistics: Proceedings of the 13th Symposium on the Interface. W. F. Eddy. New York, NY,
Springer US: 308-311. doi:10.1007/978-1-4613-9464-8_46
Xia, H.-j., W.-c. Peng, X.-b. Ouyang, X.-d. Chen, S.-j. Wang and X. Chen (2017). "Identification of
geometric errors of rotary axis on multi-axis machine tool based on kinematic analysis method using
double ball bar." International Journal of Machine Tools and Manufacture 122(Supplement C): 161-
175. doi:https://doi.org/10.1016/j.ijmachtools.2017.07.006
Yap, B. W. and C. H. Sim (2011). "Comparisons of various types of normality tests." Journal of
Statistical Computation and Simulation 81(12): 2141-2155. doi:10.1080/00949655.2010.520163
Zargarbashi, S. H. H. and J. R. R. Mayer (2006). "Assessment of machine tool trunnion axis motion error,
using magnetic double ball bar." International Journal of Machine Tools and Manufacture 46(14):
1823-1834. doi:https://doi.org/10.1016/j.ijmachtools.2005.11.010

79
PAPER V

80
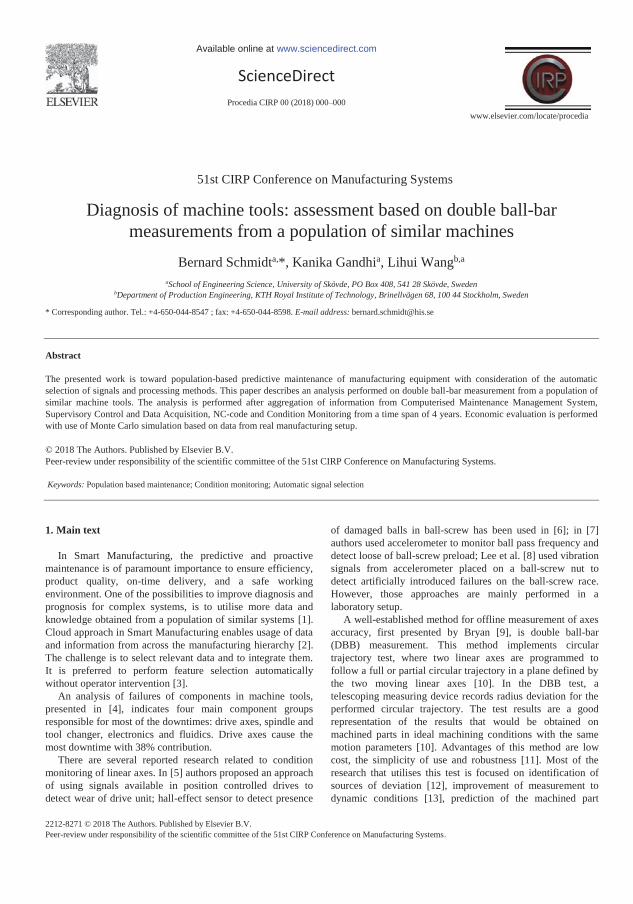
Available online at www.sciencedirect.com
ScienceDirect Procedia CIRP 00 (2018) 000–000
www.elsevier.com/locate/procedia
2212-8271 © 2018 The Authors. Published by Elsevier B.V. Peer-review under responsibility of the scientific committee of the 51st CIRP Conference on Manufacturing Systems.
51st CIRP Conference on Manufacturing Systems
Diagnosis of machine tools: assessment based on double ball-bar measurements from a population of similar machines
Bernard Schmidta,*, Kanika Gandhia, Lihui Wangb,a aSchool of Engineering Science, University of Skövde, PO Box 408, 541 28 Skövde, Sweden
bDepartment of Production Engineering, KTH Royal Institute of Technology, Brinellvägen 68, 100 44 Stockholm, Sweden
* Corresponding author. Tel.: +4-650-044-8547 ; fax: +4-650-044-8598. E-mail address: [email protected]
Abstract
The presented work is toward population-based predictive maintenance of manufacturing equipment with consideration of the automatic selection of signals and processing methods. This paper describes an analysis performed on double ball-bar measurement from a population of similar machine tools. The analysis is performed after aggregation of information from Computerised Maintenance Management System, Supervisory Control and Data Acquisition, NC-code and Condition Monitoring from a time span of 4 years. Economic evaluation is performed with use of Monte Carlo simulation based on data from real manufacturing setup. © 2018 The Authors. Published by Elsevier B.V. Peer-review under responsibility of the scientific committee of the 51st CIRP Conference on Manufacturing Systems.
Keywords: Population based maintenance; Condition monitoring; Automatic signal selection
1. Main text
In Smart Manufacturing, the predictive and proactive maintenance is of paramount importance to ensure efficiency, product quality, on-time delivery, and a safe working environment. One of the possibilities to improve diagnosis and prognosis for complex systems, is to utilise more data and knowledge obtained from a population of similar systems [1]. Cloud approach in Smart Manufacturing enables usage of data and information from across the manufacturing hierarchy [2]. The challenge is to select relevant data and to integrate them. It is preferred to perform feature selection automatically without operator intervention [3].
An analysis of failures of components in machine tools, presented in [4], indicates four main component groups responsible for most of the downtimes: drive axes, spindle and tool changer, electronics and fluidics. Drive axes cause the most downtime with 38% contribution.
There are several reported research related to condition monitoring of linear axes. In [5] authors proposed an approach of using signals available in position controlled drives to detect wear of drive unit; hall-effect sensor to detect presence
of damaged balls in ball-screw has been used in [6]; in [7] authors used accelerometer to monitor ball pass frequency and detect loose of ball-screw preload; Lee et al. [8] used vibration signals from accelerometer placed on a ball-screw nut to detect artificially introduced failures on the ball-screw race. However, those approaches are mainly performed in a laboratory setup.
A well-established method for offline measurement of axes accuracy, first presented by Bryan [9], is double ball-bar (DBB) measurement. This method implements circular trajectory test, where two linear axes are programmed to follow a full or partial circular trajectory in a plane defined by the two moving linear axes [10]. In the DBB test, a telescoping measuring device records radius deviation for the performed circular trajectory. The test results are a good representation of the results that would be obtained on machined parts in ideal machining conditions with the same motion parameters [10]. Advantages of this method are low cost, the simplicity of use and robustness [11]. Most of the research that utilises this test is focused on identification of sources of deviation [12], improvement of measurement to dynamic conditions [13], prediction of the machined part
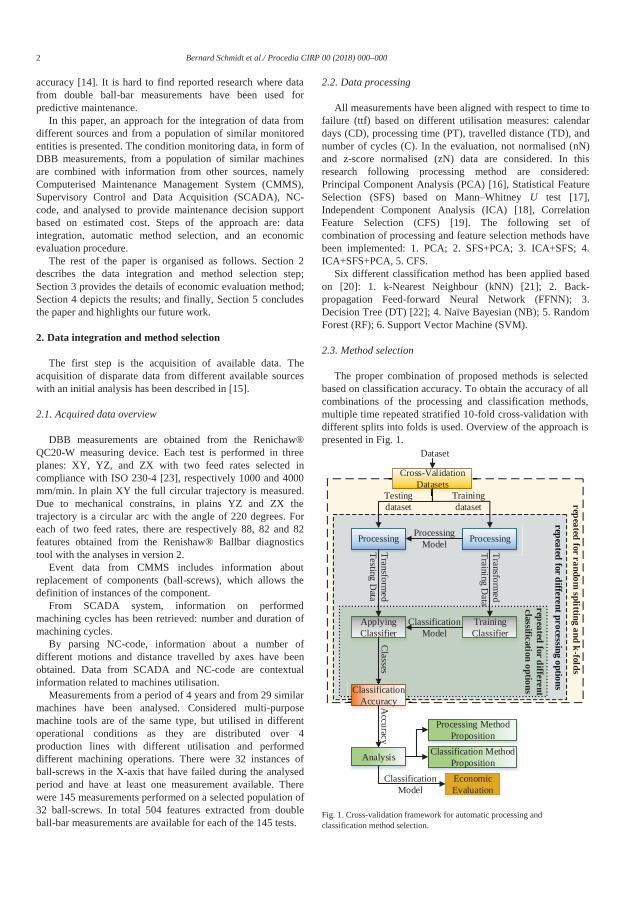
2 Bernard Schmidt et al./ Procedia CIRP 00 (2018) 000–000
accuracy [14]. It is hard to find reported research where data from double ball-bar measurements have been used for predictive maintenance.
In this paper, an approach for the integration of data from different sources and from a population of similar monitored entities is presented. The condition monitoring data, in form of DBB measurements, from a population of similar machines are combined with information from other sources, namely Computerised Maintenance Management System (CMMS), Supervisory Control and Data Acquisition (SCADA), NC-code, and analysed to provide maintenance decision support based on estimated cost. Steps of the approach are: data integration, automatic method selection, and an economic evaluation procedure.
The rest of the paper is organised as follows. Section 2 describes the data integration and method selection step; Section 3 provides the details of economic evaluation method; Section 4 depicts the results; and finally, Section 5 concludes the paper and highlights our future work.
2. Data integration and method selection
The first step is the acquisition of available data. The acquisition of disparate data from different available sources with an initial analysis has been described in [15].
2.1. Acquired data overview
DBB measurements are obtained from the Renichaw® QC20-W measuring device. Each test is performed in three planes: XY, YZ, and ZX with two feed rates selected in compliance with ISO 230-4 [23], respectively 1000 and 4000 mm/min. In plain XY the full circular trajectory is measured. Due to mechanical constrains, in plains YZ and ZX the trajectory is a circular arc with the angle of 220 degrees. For each of two feed rates, there are respectively 88, 82 and 82 features obtained from the Renishaw® Ballbar diagnostics tool with the analyses in version 2.
Event data from CMMS includes information about replacement of components (ball-screws), which allows the definition of instances of the component.
From SCADA system, information on performed machining cycles has been retrieved: number and duration of machining cycles.
By parsing NC-code, information about a number of different motions and distance travelled by axes have been obtained. Data from SCADA and NC-code are contextual information related to machines utilisation.
Measurements from a period of 4 years and from 29 similar machines have been analysed. Considered multi-purpose machine tools are of the same type, but utilised in different operational conditions as they are distributed over 4 production lines with different utilisation and performed different machining operations. There were 32 instances of ball-screws in the X-axis that have failed during the analysed period and have at least one measurement available. There were 145 measurements performed on a selected population of 32 ball-screws. In total 504 features extracted from double ball-bar measurements are available for each of the 145 tests.
2.2. Data processing
All measurements have been aligned with respect to time to failure (ttf) based on different utilisation measures: calendar days (CD), processing time (PT), travelled distance (TD), and number of cycles (C). In the evaluation, not normalised (nN) and z-score normalised (zN) data are considered. In this research following processing method are considered: Principal Component Analysis (PCA) [16], Statistical Feature Selection (SFS) based on Mann–Whitney U test [17], Independent Component Analysis (ICA) [18], Correlation Feature Selection (CFS) [19]. The following set of combination of processing and feature selection methods have been implemented: 1. PCA; 2. SFS+PCA; 3. ICA+SFS; 4. ICA+SFS+PCA, 5. CFS.
Six different classification method has been applied based on [20]: 1. k-Nearest Neighbour (kNN) [21]; 2. Back-propagation Feed-forward Neural Network (FFNN); 3. Decision Tree (DT) [22]; 4. Naïve Bayesian (NB); 5. Random Forest (RF); 6. Support Vector Machine (SVM).
2.3. Method selection
The proper combination of proposed methods is selected based on classification accuracy. To obtain the accuracy of all combinations of the processing and classification methods, multiple time repeated stratified 10-fold cross-validation with different splits into folds is used. Overview of the approach is presented in Fig. 1.
Fig. 1. Cross-validation framework for automatic processing and classification method selection.
repeated for different processing optionsrepeated for different processing options
Processing
TrainingClassifier
Transformed
Training Data
Processing
ApplyingClassifier
Transformed
Testing Data
ProcessingModel
ClassificationModel C
lasses
Classification Accuracy
Training dataset
TTraii iinin
Cross-ValidationDatasets
Testing dataset
Dataset
Accuracy . .
Analysis
repeated for random splitting and k-folds
repeated for different classification options
Processing Method Proposition
Classification Method PropositionEconomic Evaluation
Classification Model
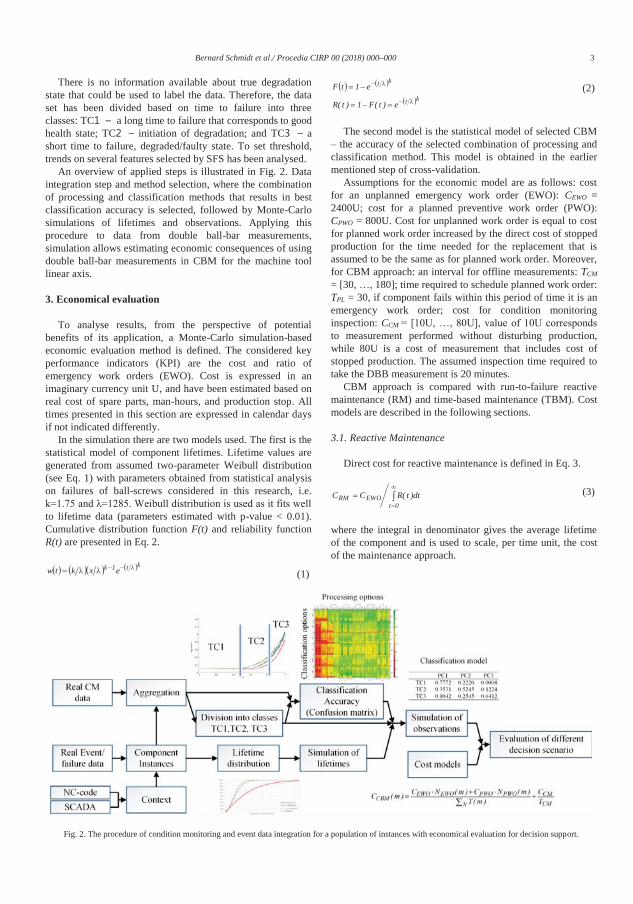
Bernard Schmidt et al./ Procedia CIRP 00 (2018) 000–000 3
There is no information available about true degradation state that could be used to label the data. Therefore, the data set has been divided based on time to failure into three classes: TC a long time to failure that corresponds to good health state; TC initiation of degradation; and TC a short time to failure, degraded/faulty state. To set threshold, trends on several features selected by SFS has been analysed.
An overview of applied steps is illustrated in Fig. 2. Data integration step and method selection, where the combination of processing and classification methods that results in best classification accuracy is selected, followed by Monte-Carlo simulations of lifetimes and observations. Applying this procedure to data from double ball-bar measurements, simulation allows estimating economic consequences of using double ball-bar measurements in CBM for the machine tool linear axis.
3. Economical evaluation
To analyse results, from the perspective of potential benefits of its application, a Monte-Carlo simulation-based economic evaluation method is defined. The considered key performance indicators (KPI) are the cost and ratio of emergency work orders (EWO). Cost is expressed in an imaginary currency unit U, and have been estimated based on real cost of spare parts, man-hours, and production stop. All times presented in this section are expressed in calendar days if not indicated differently.
In the simulation there are two models used. The first is the statistical model of component lifetimes. Lifetime values are generated from assumed two-parameter Weibull distribution (see Eq. 1) with parameters obtained from statistical analysis on failures of ball-screws considered in this research, i.e. k=1.75 and λ=1285. Weibull distribution is used as it fits well to lifetime data (parameters estimated with p-value < 0.01). Cumulative distribution function F(t) and reliability function R(t) are presented in Eq. 2.
kt1k exktw (1)
kt
kt
e)t(F1)t(R
e1tF (2)
The second model is the statistical model of selected CBM – the accuracy of the selected combination of processing and classification method. This model is obtained in the earlier mentioned step of cross-validation.
Assumptions for the economic model are as follows: cost for an unplanned emergency work order (EWO): CEWO = 2400U; cost for a planned preventive work order (PWO): CPWO = 800U. Cost for unplanned work order is equal to cost for planned work order increased by the direct cost of stopped production for the time needed for the replacement that is assumed to be the same as for planned work order. Moreover, for CBM approach: an interval for offline measurements: TCM
= [30, …, 180]; time required to schedule planned work order: TPL = 30, if component fails within this period of time it is an emergency work order; cost for condition monitoring inspection: CCM = [10U, …, 80U], value of 10U corresponds to measurement performed without disturbing production, while 80U is a cost of measurement that includes cost of stopped production. The assumed inspection time required to take the DBB measurement is 20 minutes.
CBM approach is compared with run-to-failure reactive maintenance (RM) and time-based maintenance (TBM). Cost models are described in the following sections.
3.1. Reactive Maintenance
Direct cost for reactive maintenance is defined in Eq. 3.
0tEWORM dt)t(RCC (3)
where the integral in denominator gives the average lifetime of the component and is used to scale, per time unit, the cost of the maintenance approach.
Fig. 2. The procedure of condition monitoring and event data integration for a population of instances with economical evaluation for decision support.
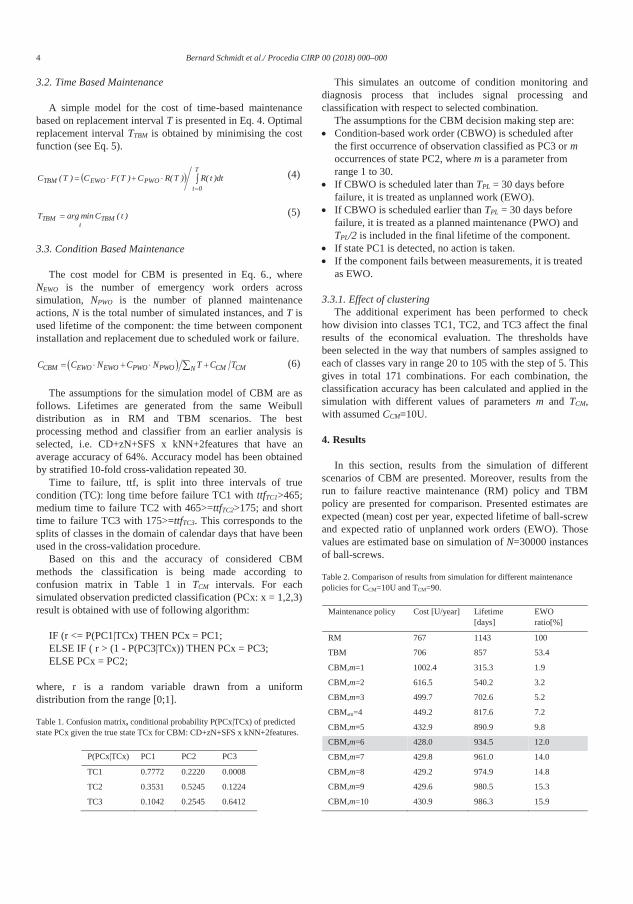
4 Bernard Schmidt et al./ Procedia CIRP 00 (2018) 000–000
3.2. Time Based Maintenance
A simple model for the cost of time-based maintenance based on replacement interval T is presented in Eq. 4. Optimal replacement interval TTBM is obtained by minimising the cost function (see Eq. 5).
T
0tPWOEWOTBM dt)t(R)T(RC)T(FC)T(C (4)
)t(CminargT TBMt
TBM (5)
3.3. Condition Based Maintenance
The cost model for CBM is presented in Eq. 6., where NEWO is the number of emergency work orders across simulation, NPWO is the number of planned maintenance actions, N is the total number of simulated instances, and T is used lifetime of the component: the time between component installation and replacement due to scheduled work or failure.
CBM EWO EWO PWO PWO CM CMNC C N C N T C T (6)
The assumptions for the simulation model of CBM are as follows. Lifetimes are generated from the same Weibull distribution as in RM and TBM scenarios. The best processing method and classifier from an earlier analysis is selected, i.e. CD+zN+SFS x kNN+2features that have an average accuracy of 64%. Accuracy model has been obtained by stratified 10-fold cross-validation repeated 30.
Time to failure, ttf, is split into three intervals of true condition (TC): long time before failure TC1 with ttfTC1>465; medium time to failure TC2 with 465>=ttfTC2>175; and short time to failure TC3 with 175>=ttfTC3. This corresponds to the splits of classes in the domain of calendar days that have been used in the cross-validation procedure.
Based on this and the accuracy of considered CBM methods the classification is being made according to confusion matrix in Table 1 in TCM intervals. For each simulated observation predicted classification (PCx: x = 1,2,3) result is obtained with use of following algorithm:
IF (r <= P(PC1|TCx) THEN PCx = PC1; ELSE IF ( r > (1 - P(PC3|TCx)) THEN PCx = PC3; ELSE PCx = PC2;
where, r is a random variable drawn from a uniform distribution from the range [0;1].
Table 1. Confusion matrix, conditional probability P(PCx|TCx) of predicted state PCx given the true state TCx for CBM: CD+zN+SFS x kNN+2features.
P(PCx|TCx) PC1 PC2 PC3
TC1 0.7772 0.2220 0.0008
TC2 0.3531 0.5245 0.1224
TC3 0.1042 0.2545 0.6412
This simulates an outcome of condition monitoring and diagnosis process that includes signal processing and classification with respect to selected combination.
The assumptions for the CBM decision making step are: Condition-based work order (CBWO) is scheduled after
the first occurrence of observation classified as PC3 or m occurrences of state PC2, where m is a parameter from range 1 to 30.
If CBWO is scheduled later than TPL = 30 days before failure, it is treated as unplanned work (EWO).
If CBWO is scheduled earlier than TPL = 30 days before failure, it is treated as a planned maintenance (PWO) and TPL/2 is included in the final lifetime of the component.
If state PC1 is detected, no action is taken. If the component fails between measurements, it is treated
as EWO.
3.3.1. Effect of clustering The additional experiment has been performed to check
how division into classes TC1, TC2, and TC3 affect the final results of the economical evaluation. The thresholds have been selected in the way that numbers of samples assigned to each of classes vary in range 20 to 105 with the step of 5. This gives in total 171 combinations. For each combination, the classification accuracy has been calculated and applied in the simulation with different values of parameters m and TCM, with assumed CCM=10U.
4. Results
In this section, results from the simulation of different scenarios of CBM are presented. Moreover, results from the run to failure reactive maintenance (RM) policy and TBM policy are presented for comparison. Presented estimates are expected (mean) cost per year, expected lifetime of ball-screw and expected ratio of unplanned work orders (EWO). Those values are estimated base on simulation of N=30000 instances of ball-screws.
Table 2. Comparison of results from simulation for different maintenance policies for CCM=10U and TCM=90.
Maintenance policy Cost [U/year] Lifetime [days]
EWO ratio[%]
RM 767 1143 100
TBM 706 857 53.4
CBM,m=1 1002.4 315.3 1.9
CBM,m=2 616.5 540.2 3.2
CBM,m=3 499.7 702.6 5.2
CBM,m=4 449.2 817.6 7.2
CBM,m=5 432.9 890.9 9.8
CBM,m=6 428.0 934.5 12.0
CBM,m=7 429.8 961.0 14.0
CBM,m=8 429.2 974.9 14.8
CBM,m=9 429.6 980.5 15.3
CBM,m=10 430.9 986.3 15.9
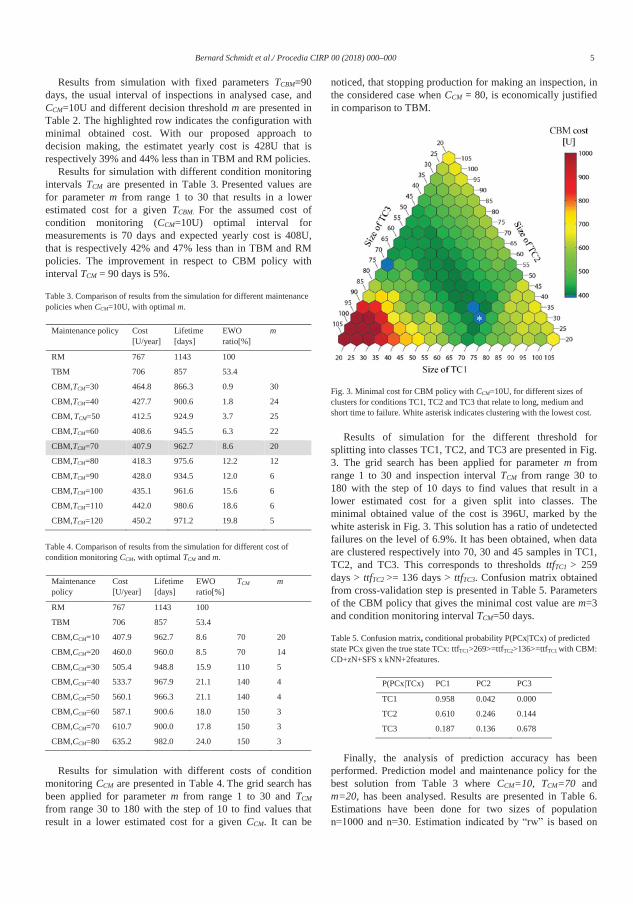
Bernard Schmidt et al./ Procedia CIRP 00 (2018) 000–000 5
Results from simulation with fixed parameters TCBM=90 days, the usual interval of inspections in analysed case, and CCM=10U and different decision threshold m are presented in Table 2. The highlighted row indicates the configuration with minimal obtained cost. With our proposed approach to decision making, the estimatet yearly cost is 428U that is respectively 39% and 44% less than in TBM and RM policies.
Results for simulation with different condition monitoring intervals TCM are presented in Table 3. Presented values are for parameter m from range 1 to 30 that results in a lower estimated cost for a given TCBM. For the assumed cost of condition monitoring (CCM=10U) optimal interval for measurements is 70 days and expected yearly cost is 408U, that is respectively 42% and 47% less than in TBM and RM policies. The improvement in respect to CBM policy with interval TCM = 90 days is 5%.
Table 3. Comparison of results from the simulation for different maintenance policies when CCM=10U, with optimal m.
Maintenance policy Cost [U/year]
Lifetime [days]
EWO ratio[%]
m
RM 767 1143 100
TBM 706 857 53.4
CBM,TCM=30 464.8 866.3 0.9 30
CBM,TCM=40 427.7 900.6 1.8 24
CBM, TCM=50 412.5 924.9 3.7 25
CBM,TCM=60 408.6 945.5 6.3 22
CBM,TCM=70 407.9 962.7 8.6 20
CBM,TCM=80 418.3 975.6 12.2 12
CBM,TCM=90 428.0 934.5 12.0 6
CBM,TCM=100 435.1 961.6 15.6 6
CBM,TCM=110 442.0 980.6 18.6 6
CBM,TCM=120 450.2 971.2 19.8 5
Table 4. Comparison of results from the simulation for different cost of condition monitoring CCM, with optimal TCM and m.
Maintenance policy
Cost [U/year]
Lifetime [days]
EWO ratio[%]
TCM m
RM 767 1143 100
TBM 706 857 53.4
CBM,CCM=10 407.9 962.7 8.6 70 20
CBM,CCM=20 460.0 960.0 8.5 70 14
CBM,CCM=30 505.4 948.8 15.9 110 5
CBM,CCM=40 533.7 967.9 21.1 140 4
CBM,CCM=50 560.1 966.3 21.1 140 4
CBM,CCM=60 587.1 900.6 18.0 150 3
CBM,CCM=70 610.7 900.0 17.8 150 3
CBM,CCM=80 635.2 982.0 24.0 150 3
Results for simulation with different costs of condition
monitoring CCM are presented in Table 4. The grid search has been applied for parameter m from range 1 to 30 and TCM from range 30 to 180 with the step of 10 to find values that result in a lower estimated cost for a given CCM. It can be
noticed, that stopping production for making an inspection, in the considered case when CCM = 80, is economically justified in comparison to TBM.
Fig. 3. Minimal cost for CBM policy with CCM=10U, for different sizes of clusters for conditions TC1, TC2 and TC3 that relate to long, medium and short time to failure. White asterisk indicates clustering with the lowest cost.
Results of simulation for the different threshold for splitting into classes TC1, TC2, and TC3 are presented in Fig. 3. The grid search has been applied for parameter m from range 1 to 30 and inspection interval TCM from range 30 to 180 with the step of 10 days to find values that result in a lower estimated cost for a given split into classes. The minimal obtained value of the cost is 396U, marked by the white asterisk in Fig. 3. This solution has a ratio of undetected failures on the level of 6.9%. It has been obtained, when data are clustered respectively into 70, 30 and 45 samples in TC1, TC2, and TC3. This corresponds to thresholds ttfTC1 > 259 days > ttfTC2 >= 136 days > ttfTC3. Confusion matrix obtained from cross-validation step is presented in Table 5. Parameters of the CBM policy that gives the minimal cost value are m=3 and condition monitoring interval TCM=50 days.
Table 5. Confusion matrix, conditional probability P(PCx|TCx) of predicted state PCx given the true state TCx: ttfTC1>269>=ttfTC2>136>=ttfTC1 with CBM: CD+zN+SFS x kNN+2features.
P(PCx|TCx) PC1 PC2 PC3
TC1 0.958 0.042 0.000
TC2 0.610 0.246 0.144
TC3 0.187 0.136 0.678
Finally, the analysis of prediction accuracy has been
performed. Prediction model and maintenance policy for the best solution from Table 3 where CCM=10, TCM=70 and m=20, has been analysed. Results are presented in Table 6. Estimations have been done for two sizes of population n=1000 and n=30. Estimation indicated by “rw” is based on
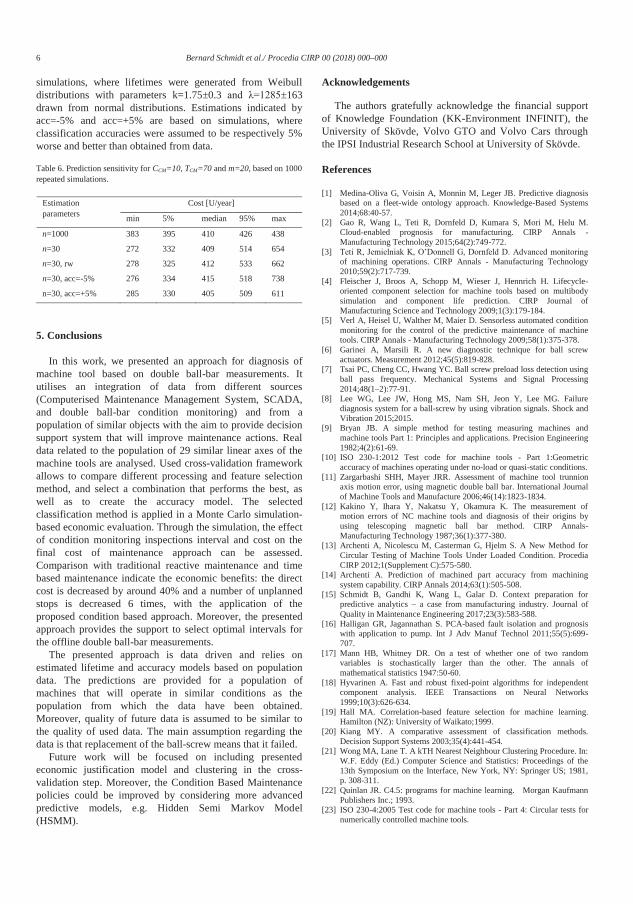
6 Bernard Schmidt et al./ Procedia CIRP 00 (2018) 000–000
simulations, where lifetimes were generated from Weibull distributions with parameters k=1.75±0.3 and λ=1285±163 drawn from normal distributions. Estimations indicated by acc=-5% and acc=+5% are based on simulations, where classification accuracies were assumed to be respectively 5% worse and better than obtained from data.
Table 6. Prediction sensitivity for CCM=10, TCM=70 and m=20, based on 1000 repeated simulations.
Estimation parameters
Cost [U/year]
min 5% median 95% max
n=1000 383 395 410 426 438
n=30 272 332 409 514 654
n=30, rw 278 325 412 533 662
n=30, acc=-5% 276 334 415 518 738
n=30, acc=+5% 285 330 405 509 611
5. Conclusions
In this work, we presented an approach for diagnosis of machine tool based on double ball-bar measurements. It utilises an integration of data from different sources (Computerised Maintenance Management System, SCADA, and double ball-bar condition monitoring) and from a population of similar objects with the aim to provide decision support system that will improve maintenance actions. Real data related to the population of 29 similar linear axes of the machine tools are analysed. Used cross-validation framework allows to compare different processing and feature selection method, and select a combination that performs the best, as well as to create the accuracy model. The selected classification method is applied in a Monte Carlo simulation-based economic evaluation. Through the simulation, the effect of condition monitoring inspections interval and cost on the final cost of maintenance approach can be assessed. Comparison with traditional reactive maintenance and time based maintenance indicate the economic benefits: the direct cost is decreased by around 40% and a number of unplanned stops is decreased 6 times, with the application of the proposed condition based approach. Moreover, the presented approach provides the support to select optimal intervals for the offline double ball-bar measurements.
The presented approach is data driven and relies on estimated lifetime and accuracy models based on population data. The predictions are provided for a population of machines that will operate in similar conditions as the population from which the data have been obtained. Moreover, quality of future data is assumed to be similar to the quality of used data. The main assumption regarding the data is that replacement of the ball-screw means that it failed.
Future work will be focused on including presented economic justification model and clustering in the cross-validation step. Moreover, the Condition Based Maintenance policies could be improved by considering more advanced predictive models, e.g. Hidden Semi Markov Model (HSMM).
Acknowledgements
The authors gratefully acknowledge the financial support of Knowledge Foundation (KK-Environment INFINIT), the University of Skövde, Volvo GTO and Volvo Cars through the IPSI Industrial Research School at University of Skövde.
References
[1] Medina-Oliva G, Voisin A, Monnin M, Leger JB. Predictive diagnosis based on a fleet-wide ontology approach. Knowledge-Based Systems 2014;68:40-57.
[2] Gao R, Wang L, Teti R, Dornfeld D, Kumara S, Mori M, Helu M. Cloud-enabled prognosis for manufacturing. CIRP Annals - Manufacturing Technology 2015;64(2):749-772.
[3] Teti R, Jemielniak K, O’Donnell G, Dornfeld D. Advanced monitoring of machining operations. CIRP Annals - Manufacturing Technology 2010;59(2):717-739.
[4] Fleischer J, Broos A, Schopp M, Wieser J, Hennrich H. Lifecycle-oriented component selection for machine tools based on multibody simulation and component life prediction. CIRP Journal of Manufacturing Science and Technology 2009;1(3):179-184.
[5] Verl A, Heisel U, Walther M, Maier D. Sensorless automated condition monitoring for the control of the predictive maintenance of machine tools. CIRP Annals - Manufacturing Technology 2009;58(1):375-378.
[6] Garinei A, Marsili R. A new diagnostic technique for ball screw actuators. Measurement 2012;45(5):819-828.
[7] Tsai PC, Cheng CC, Hwang YC. Ball screw preload loss detection using ball pass frequency. Mechanical Systems and Signal Processing 2014;48(1–2):77-91.
[8] Lee WG, Lee JW, Hong MS, Nam SH, Jeon Y, Lee MG. Failure diagnosis system for a ball-screw by using vibration signals. Shock and Vibration 2015;2015.
[9] Bryan JB. A simple method for testing measuring machines and machine tools Part 1: Principles and applications. Precision Engineering 1982;4(2):61-69.
[10] ISO 230-1:2012 Test code for machine tools - Part 1:Geometric accuracy of machines operating under no-load or quasi-static conditions.
[11] Zargarbashi SHH, Mayer JRR. Assessment of machine tool trunnion axis motion error, using magnetic double ball bar. International Journal of Machine Tools and Manufacture 2006;46(14):1823-1834.
[12] Kakino Y, Ihara Y, Nakatsu Y, Okamura K. The measurement of motion errors of NC machine tools and diagnosis of their origins by using telescoping magnetic ball bar method. CIRP Annals-Manufacturing Technology 1987;36(1):377-380.
[13] Archenti A, Nicolescu M, Casterman G, Hjelm S. A New Method for Circular Testing of Machine Tools Under Loaded Condition. Procedia CIRP 2012;1(Supplement C):575-580.
[14] Archenti A. Prediction of machined part accuracy from machining system capability. CIRP Annals 2014;63(1):505-508.
[15] Schmidt B, Gandhi K, Wang L, Galar D. Context preparation for predictive analytics – a case from manufacturing industry. Journal of Quality in Maintenance Engineering 2017;23(3):583-588.
[16] Halligan GR, Jagannathan S. PCA-based fault isolation and prognosis with application to pump. Int J Adv Manuf Technol 2011;55(5):699-707.
[17] Mann HB, Whitney DR. On a test of whether one of two random variables is stochastically larger than the other. The annals of mathematical statistics 1947:50-60.
[18] Hyvarinen A. Fast and robust fixed-point algorithms for independent component analysis. IEEE Transactions on Neural Networks 1999;10(3):626-634.
[19] Hall MA. Correlation-based feature selection for machine learning. Hamilton (NZ): University of Waikato;1999.
[20] Kiang MY. A comparative assessment of classification methods. Decision Support Systems 2003;35(4):441-454.
[21] Wong MA, Lane T. A kTH Nearest Neighbour Clustering Procedure. In: W.F. Eddy (Ed.) Computer Science and Statistics: Proceedings of the 13th Symposium on the Interface, New York, NY: Springer US; 1981, p. 308-311.
[22] Quinlan JR. C4.5: programs for machine learning. Morgan Kaufmann Publishers Inc.; 1993.
[23] ISO 230-4:2005 Test code for machine tools - Part 4: Circular tests for numerically controlled machine tools.

81
PUBLICATIONS IN THE
DISSERTATION SERIES

82
PUBLICATIONS IN THE DISSERTATION SERIES
1. Berg Marklund, Björn (2013) Games in formal educational settings: obstacles for the
development and use of learning games, Informatics.
Licentiate Dissertation, ISBN 978-91-981474-0-72.
2. Aslam, Tehseen (2013) Analysis of manufacturing supply chains using systemdynamics
and multi-objective optimization, Informatics.
Doctoral Dissertation, ISBN 978-91981474-1-43.
3. Laxhammar, Rikard (2014) Conformal Anomaly Detection-Detecting Abnormal Tra-
jectories in Surveillance Applications, Informatics.
Doctoral Dissertation, ISBN 978-91-981474-2-14.
4. Alklind Taylor, Anna-Sofia (2014) Facilitation matters: a framework for instructor led serious gaming, Informatics.
Doctoral Dissertation, ISBN 978-91-981474-4-55.
5. Holgersson, Jesper (2014) User participation in public e-service development: guide-
lines for including external users, Informatics.
Doctoral Dissertation, ISBN 978-91-981474-5-26.
6. Kaidalova, Julia (2015) Towards a Definition of the role of Enterprise Modeling in the
Context of Business and IT Alignment, Informatics.
Licentiate Dissertation, ISBN 978-91-981474-6-97.
7. Rexhepi, Hanife (2015) Improving health care information systems – A key to evidence based medicine, Informatics.
Licentiate Dissertation, ISBN 978-91-981474-7-68.
8. Berg Marklund, Björn (2015) Unpacking Digital Game-Based Learning: The complexi-
ties of developing and using educational games, Informatics. Doctoral Dissertation,
ISBN 978-91-981474-8-3.
9. Fornlöf, Veronica (2016) Improved remaining useful life estimations for on-condition
parts in aircraft engines, Informatics.
Licentiate Dissertation, ISBN 978-91-981474-9-0.
10. Ohlander, Ulrika (2016) Towards Enhanced Tactical Support Systems, Informatics.
Licentiate Dissertation, ISBN 978-91-982690-0-0.

11. Siegmund, Florian (2016) Dynamic Resampling for Preference-based Evolutionary
Multi-objective Optimization of Stochastic Systems, Informatics.
Doctoral Dissertation, ISBN 978-91-982690-1-7.
12. Kolbeinsson, Johan (2016) Managing Interruptions in Manufacturing: Towards a The-
oretical Framework for Interruptions in Manufacturing Assembly, Informatics.
Licentiate Dissertation, ISBN 978-91-982690-2-4.
13. Sigholm, Ari (2016) Secure Tactical Communications for Inter-Organizational Collabo-
ration: The Role of Emerging Information and Communications Technology, Privacy
Issues, and Cyber Threats on the Digital Battlefield, Informatics.
Doctoral Dissertation, ISBN 978-91-982690-3-1.
14. Brolin, Anna (2016) An investigation of cognitive aspects affecting human performance
in manual assembly, Informatics.
Doctoral Dissertation, ISBN 978-91-982690-4-8.
15. Brodin, Martin (2016) Mobile device strategy: A management framework for securing
company information assets on mobile devices, Informatics.
Licentiate Dissertation, ISBN 978-91-982690-5-5.
16. Ericson, Stefan (2017) Vision-based perception for localization of autonomous agricul-
tural robots, Informatics.
Doctoral Dissertation, ISBN 978-91-982690-7-9.
17. Holm, Magnus (2017) Adaptive Decision Support for Shopfloor: Operators using Func-
tion Blocks, Informatics. Doctoral Dissertation, ISBN 978-91-982690-8-6.
18. Larsson, Carina (2017) Communicating performance measures: Supporting continu-
ous improvement in manufacturing companies, Informatics.
Licentiate Dissertation, ISBN 978-91-982690-9-3.


B
ER
NA
RD
SC
HM
IDT
TO
WA
RD
PR
ED
ICT
IVE
MA
INT
EN
AN
CE
IN A
CL
OU
D M
AN
UF
AC
TU
RIN
G E
NV
IRO
NM
EN
T 2
01
8
V
BERNARD SCHMIDT
Bernard Schmidt received his M.Sc. in Automatics and Ro-
botics from AGH University of Science and Technology in 2005. For 5 years he worked in a company that delivers soft-
ware and services for condition monitoring. Since 2011 he
has been working as a research assistant at the University of Skövde.
In this thesis Bernard investigates how data from a popula-tion of machines can be used for predictive maintenance. He
focuses on data analytics of the linear axes of industrial ma-
chine tools. Aggregated data comes from multiple disparate data sources, including double ball-bar circularity tests,
maintenance management systems, and the machine tool
controller. Bernard has applied and evaluated various data processing and machine learning methods. He has also per-
formed an economic evaluation of the proposed approach.
ISBN 978-91-984187-2-9
Dissertation Series, No. 20 (2018)