Parallel Genetic Simulated Annealing: A Massively Parallel SIMD Algorithm
Upload
khangminh22Category
view
3download
0
Remigius Niekrawietz
TopSpot: Highly Parallel NanoliterDispensing - Operating Conditions andDesign Rules
Dissertationzur Erlangung des Doktorgrades der Technischen Fakultät der Albert-Ludwigs-Universität Freiburg im Breisgau
Freiburg i. Br., 2009

DekanProf. Dr. Hans Zappe
ReferentenProf. Dr. Roland Zengerle (Freiburg)Prof. Dr. Hermann Sandmaier (Stuttgart)
Tag der Prüfung16. Oktober 2009
Institut für Mikrosystemtechnik (IMTEK)Lehrstuhl für AnwendungsentwicklungTechnische FakultätAlbert-Ludwigs-Universität Freiburg

DISSERTATION REMIGIUS NIEKRAWIETZ ERKLÄRUNG
TOPSPOT: HIGHLY PARALLEL NANOLITER DISPENSING - OPERATING CONDITIONS AND DESIGN RULES - I -
ERKLÄRUNG
Ich erkläre hiermit, dass ich die vorliegende Arbeit ohne unzulässige Hilfe Dritter undohne Benutzung anderer als der angegebenen Hilfsmittel angefertigt habe. Die aus an-deren Quellen direkt oder indirekt übernommenen Daten und Konzepte sind unter An-gabe der Quelle gekennzeichnet. Insbesondere habe ich hierfür nicht die entgeltlicheHilfe von Vermittlungs- oder Beratungsdiensten (Promotionsberaterinnen oder Pro-motionsberater oder anderer Personen) in Anspruch genommen. Niemand hat von mirunmittelbar oder mittelbar geldwerte Leistungen für Arbeiten erhalten, die im Zusam-menhang mit dem Inhalt der vorgelegten Dissertation stehen. Die Arbeit wurde bisherweder im In- noch im Ausland in gleicher oder ähnlicher Form einer anderen Prüfungs-behörde vorgelegt.
Freiburg, den (Remigius Niekrawietz)

CONTENTS DISSERTATION REMIGIUS NIEKRAWIETZ
CONTENTS
ERKLÄRUNG . . . . . . . . . . . . . . . . . . . . . . . . . . . . . . . . . . . . . . . . . . . . . . .ICONTENTS . . . . . . . . . . . . . . . . . . . . . . . . . . . . . . . . . . . . . . . . . . . . . . . IIABSTRACT . . . . . . . . . . . . . . . . . . . . . . . . . . . . . . . . . . . . . . . . . . . . . . . VZUSAMMENFASSUNG . . . . . . . . . . . . . . . . . . . . . . . . . . . . . . . . . . . . . .VIIPUBLICATIONS . . . . . . . . . . . . . . . . . . . . . . . . . . . . . . . . . . . . . . . . . . . . XINTRODUCTION . . . . . . . . . . . . . . . . . . . . . . . . . . . . . . . . . . . . . . . . . . . . 1
1.1 MICROARRAYS AND THEIR APPLICATIONS. . . . . . . . . . . . . . . . . . . . . . . . . . . . . . 1
1.2 MICROARRAY-FABRICATION TECHNOLOGIES . . . . . . . . . . . . . . . . . . . . . . . . . . . 51.2.1 On-Chip Synthesis . . . . . . . . . . . . . . . . . . . . . . . . . . . . . . . . . . . . . . . . . . . . . 5
1.2.1.1 On-Chip Approaches using Photolithography . . . . . . . . . . . . . . . . . . 51.2.1.2 On-Chip Approaches using Printing. . . . . . . . . . . . . . . . . . . . . . . . . . 7
1.2.2 Printing Pre-synthesized Molecules . . . . . . . . . . . . . . . . . . . . . . . . . . . . . . . . 81.2.2.1 Contact Printing . . . . . . . . . . . . . . . . . . . . . . . . . . . . . . . . . . . . . . . . . 91.2.2.2 Non-Contact Printing . . . . . . . . . . . . . . . . . . . . . . . . . . . . . . . . . . . . 10
1.2.3 TopSpot Technology. . . . . . . . . . . . . . . . . . . . . . . . . . . . . . . . . . . . . . . . . . . 141.2.3.1 Operation Principle of the TopSpot Dispenser . . . . . . . . . . . . . . . . . 151.2.3.2 TopSpot Microarrayer. . . . . . . . . . . . . . . . . . . . . . . . . . . . . . . . . . . . 17
1.3 AIM OF THE THESIS. . . . . . . . . . . . . . . . . . . . . . . . . . . . . . . . . . . . . . . . . . . . . . . . 19
FUNDAMENTALS . . . . . . . . . . . . . . . . . . . . . . . . . . . . . . . . . . . . . . . . . . 202.1 NAVIER-STOKES EQUATION. . . . . . . . . . . . . . . . . . . . . . . . . . . . . . . . . . . . . . . . . 20
2.2 CONTINUITY EQUATION . . . . . . . . . . . . . . . . . . . . . . . . . . . . . . . . . . . . . . . . . . . . 22
2.3 YOUNG-LAPLACE EQUATION. . . . . . . . . . . . . . . . . . . . . . . . . . . . . . . . . . . . . . . . 23
2.4 ANALYTICAL SOLUTIONS FOR SELECTED BOUNDARY CONDITIONS . . . . . . . 252.4.1 Analytical Equivalents to Electronics. . . . . . . . . . . . . . . . . . . . . . . . . . . . . . 252.4.2 Fluidic Resistance . . . . . . . . . . . . . . . . . . . . . . . . . . . . . . . . . . . . . . . . . . . . . 262.4.3 Capillary Filling of Liquids . . . . . . . . . . . . . . . . . . . . . . . . . . . . . . . . . . . . . 272.4.4 Refilling (Dispensing Frequency). . . . . . . . . . . . . . . . . . . . . . . . . . . . . . . . . 302.4.5 Junction Effects. . . . . . . . . . . . . . . . . . . . . . . . . . . . . . . . . . . . . . . . . . . . . . . 312.4.6 Fluidic Inertance . . . . . . . . . . . . . . . . . . . . . . . . . . . . . . . . . . . . . . . . . . . . . . 332.4.7 Pressure Generation in the Actuation Chamber . . . . . . . . . . . . . . . . . . . . . . 35
2.4.7.1 Model for the Pressure Generation . . . . . . . . . . . . . . . . . . . . . . . . . . 362.4.7.2 Pressure Generation Adapted to Real Devices . . . . . . . . . . . . . . . . . 40
- II - TOPSPOT: HIGHLY PARALLEL NANOLITER DISPENSING - OPERATING CONDITIONS AND DESIGN RULES

DISSERTATION REMIGIUS NIEKRAWIETZ CONTENTS
2.5 CHARACTERISTIC NUMBERS FOR DROPLET FORMATION. . . . . . . . . . . . . . . . . 412.5.1 Reynolds Number . . . . . . . . . . . . . . . . . . . . . . . . . . . . . . . . . . . . . . . . . . . . . 412.5.2 Weber Number . . . . . . . . . . . . . . . . . . . . . . . . . . . . . . . . . . . . . . . . . . . . . . . 422.5.3 Critical Parameters for Droplet Tear-off . . . . . . . . . . . . . . . . . . . . . . . . . . . 432.5.4 Approximation for Droplet Tear-off. . . . . . . . . . . . . . . . . . . . . . . . . . . . . . . 492.5.5 Droplet Impact . . . . . . . . . . . . . . . . . . . . . . . . . . . . . . . . . . . . . . . . . . . . . . . 51
2.5.5.1 Droplet Impact on Solid Surfaces. . . . . . . . . . . . . . . . . . . . . . . . . . . 512.5.5.2 Droplet Impact on Liquid Surfaces. . . . . . . . . . . . . . . . . . . . . . . . . . 53
EXPERIMENTAL INVESTIGATION OF THE PRINTING PROCESS . . . . . . . 543.1 DROPLET QUALITY CONTROL . . . . . . . . . . . . . . . . . . . . . . . . . . . . . . . . . . . . . . . 54
3.1.1 Stroboscopic Imaging of Droplets . . . . . . . . . . . . . . . . . . . . . . . . . . . . . . . . 543.1.1.1 Droplet Volume . . . . . . . . . . . . . . . . . . . . . . . . . . . . . . . . . . . . . . . . 553.1.1.2 Droplet Velocity . . . . . . . . . . . . . . . . . . . . . . . . . . . . . . . . . . . . . . . . 56
3.1.2 Analysis of all 24 Parallel Dispensed Spots . . . . . . . . . . . . . . . . . . . . . . . . . 573.1.2.1 Fluorescence Image Analysis . . . . . . . . . . . . . . . . . . . . . . . . . . . . . . 573.1.2.2 Online Monitoring by Camera . . . . . . . . . . . . . . . . . . . . . . . . . . . . . 59
3.1.3 Error Consideration of the Measurement Methods. . . . . . . . . . . . . . . . . . . . 633.1.3.1 Error Consideration for the Stroboscopic Imaging. . . . . . . . . . . . . . 643.1.3.2 Error Consideration for the Camera Imaging . . . . . . . . . . . . . . . . . . 653.1.3.3 Error Consideration for the Fluorescence Image Analysis. . . . . . . . 65
3.1.4 Array Homogeneity . . . . . . . . . . . . . . . . . . . . . . . . . . . . . . . . . . . . . . . . . . . 653.1.4.1 Coating of Printheads . . . . . . . . . . . . . . . . . . . . . . . . . . . . . . . . . . . . 663.1.4.2 Cleaning Procedure for the Printheads . . . . . . . . . . . . . . . . . . . . . . . 68
3.2 INTEGRATED PRESSURE DETECTION. . . . . . . . . . . . . . . . . . . . . . . . . . . . . . . . . . 693.2.1 Sealing of the Actuation Chamber . . . . . . . . . . . . . . . . . . . . . . . . . . . . . . . . 70
3.2.1.1 PDMS Processing . . . . . . . . . . . . . . . . . . . . . . . . . . . . . . . . . . . . . . . 713.2.1.2 Fabrication of the PDMS Seal Ring . . . . . . . . . . . . . . . . . . . . . . . . 71
3.2.2 Pressure Sensor . . . . . . . . . . . . . . . . . . . . . . . . . . . . . . . . . . . . . . . . . . . . . . . 733.2.3 Pressure Sensor Circuit Board . . . . . . . . . . . . . . . . . . . . . . . . . . . . . . . . . . . 743.2.4 Evaluation Electronics . . . . . . . . . . . . . . . . . . . . . . . . . . . . . . . . . . . . . . . . . 753.2.5 Assembling of the Piston Components. . . . . . . . . . . . . . . . . . . . . . . . . . . . . 763.2.6 Calibration of the Pressure Sensor . . . . . . . . . . . . . . . . . . . . . . . . . . . . . . . . 773.2.7 Detecting Failure Modes. . . . . . . . . . . . . . . . . . . . . . . . . . . . . . . . . . . . . . . . 79
DESIGN AND OPERATION RULES . . . . . . . . . . . . . . . . . . . . . . . . . . . . . 814.1 TOPSPOT PRINT MODULE. . . . . . . . . . . . . . . . . . . . . . . . . . . . . . . . . . . . . . . . . . . 81
4.1.1 Actuation chamber . . . . . . . . . . . . . . . . . . . . . . . . . . . . . . . . . . . . . . . . . . . . 824.1.2 Vent Nozzle . . . . . . . . . . . . . . . . . . . . . . . . . . . . . . . . . . . . . . . . . . . . . . . . . 834.1.3 Piezo Actuator Movement . . . . . . . . . . . . . . . . . . . . . . . . . . . . . . . . . . . . . . 85
4.1.3.1 Stroke . . . . . . . . . . . . . . . . . . . . . . . . . . . . . . . . . . . . . . . . . . . . . . . . 854.1.3.2 Downstroke Velocity . . . . . . . . . . . . . . . . . . . . . . . . . . . . . . . . . . . . 864.1.3.3 Hold Time. . . . . . . . . . . . . . . . . . . . . . . . . . . . . . . . . . . . . . . . . . . . . 874.1.3.4 Upstroke Velocity . . . . . . . . . . . . . . . . . . . . . . . . . . . . . . . . . . . . . . . 87
TOPSPOT: HIGHLY PARALLEL NANOLITER DISPENSING - OPERATING CONDITIONS AND DESIGN RULES - III -

CONTENTS DISSERTATION REMIGIUS NIEKRAWIETZ
4.1.4 Printing Frequency . . . . . . . . . . . . . . . . . . . . . . . . . . . . . . . . . . . . . . . . . . . . 884.1.5 Rubber Spring . . . . . . . . . . . . . . . . . . . . . . . . . . . . . . . . . . . . . . . . . . . . . . . . 894.1.6 Selection of the PDMS-Seal-Ring Design . . . . . . . . . . . . . . . . . . . . . . . . . . 90
4.2 HIGHLY INTEGRATED TOPSPOT PRINTHEADS . . . . . . . . . . . . . . . . . . . . . . . . . . 924.2.1 CFD Simulations of the TopSpot Printhead . . . . . . . . . . . . . . . . . . . . . . . . . 92
4.2.1.1 Model of the Ejection and Droplet Impact Process . . . . . . . . . . . . . 934.2.1.2 Model of the First Priming . . . . . . . . . . . . . . . . . . . . . . . . . . . . . . . . 98
4.2.2 Printhead Filling . . . . . . . . . . . . . . . . . . . . . . . . . . . . . . . . . . . . . . . . . . . . . 1014.2.3 Droplet Volume . . . . . . . . . . . . . . . . . . . . . . . . . . . . . . . . . . . . . . . . . . . . . 103
4.2.3.1 Nozzle Diameter . . . . . . . . . . . . . . . . . . . . . . . . . . . . . . . . . . . . . . . 1034.2.3.2 Nozzle Expansion Diameter . . . . . . . . . . . . . . . . . . . . . . . . . . . . . . 1054.2.3.3 Nozzle Length. . . . . . . . . . . . . . . . . . . . . . . . . . . . . . . . . . . . . . . . . 1084.2.3.4 Pressure Pulse Shape . . . . . . . . . . . . . . . . . . . . . . . . . . . . . . . . . . . 1094.2.3.5 Printing Media . . . . . . . . . . . . . . . . . . . . . . . . . . . . . . . . . . . . . . . . 111
4.2.4 Droplet Interaction with Solid and Liquid Surfaces . . . . . . . . . . . . . . . . . . 1134.2.4.1 Single Droplet Impaction on a Solid Surface . . . . . . . . . . . . . . . . . 1134.2.4.2 Drop on Drop Dispensing . . . . . . . . . . . . . . . . . . . . . . . . . . . . . . . . 115
TECHNOLOGICAL DESIGN RULES FOR INTEGRATION . . . . . . . . . . . . . 1185.1 FABRICATION OF THE TOPSPOT PRINTHEADS . . . . . . . . . . . . . . . . . . . . . . . . . 120
5.1.1 Printhead with Pyrex-Si-Pyrex Design . . . . . . . . . . . . . . . . . . . . . . . . . . . . 1205.1.1.1 Catwalk Width of Anodic Bonded Printheads . . . . . . . . . . . . . . . . 1215.1.1.2 Microchannel Width . . . . . . . . . . . . . . . . . . . . . . . . . . . . . . . . . . . . 1225.1.1.3 Etch Rate Depending on Etchable Area . . . . . . . . . . . . . . . . . . . . . 1225.1.1.4 Notching Effect. . . . . . . . . . . . . . . . . . . . . . . . . . . . . . . . . . . . . . . . 1235.1.1.5 Nozzle Length Versus Mechanical Stability . . . . . . . . . . . . . . . . . 124
5.1.2 Printhead with Pxrex-Si-Si Design . . . . . . . . . . . . . . . . . . . . . . . . . . . . . . . 1255.1.2.1 Passive Capillary Filling Structure . . . . . . . . . . . . . . . . . . . . . . . . . 1305.1.2.2 Catwalk Width of Silicon Fusion Bonded Printheads . . . . . . . . . . 131
OPTIMIZED DESIGN OF A 384 NOZZLE PRINTHEAD . . . . . . . . . . . . . . 1336.1 RESERVOIR ARRANGEMENT OF THE 384 PRINTHEAD. . . . . . . . . . . . . . . . . . . 133
6.2 CHARACTERIZATION OF THE 384 PRINTHEAD . . . . . . . . . . . . . . . . . . . . . . . . . 1356.2.1 First Priming of the Printhead. . . . . . . . . . . . . . . . . . . . . . . . . . . . . . . . . . . 1356.2.2 Cross-contamination . . . . . . . . . . . . . . . . . . . . . . . . . . . . . . . . . . . . . . . . . . 1366.2.3 Array Homogeneity . . . . . . . . . . . . . . . . . . . . . . . . . . . . . . . . . . . . . . . . . . 1366.2.4 Droplet Volume . . . . . . . . . . . . . . . . . . . . . . . . . . . . . . . . . . . . . . . . . . . . . 1376.2.5 Droplet Velocity . . . . . . . . . . . . . . . . . . . . . . . . . . . . . . . . . . . . . . . . . . . . . 138
CONCLUSION AND COMPARISON TO STANDARD PRINTHEAD DESIGN 139NOMENCLATURE . . . . . . . . . . . . . . . . . . . . . . . . . . . . . . . . . . . . . . . . 146REFERENCES . . . . . . . . . . . . . . . . . . . . . . . . . . . . . . . . . . . . . . . . . . . . 152ACKNOWLEDGEMENTS . . . . . . . . . . . . . . . . . . . . . . . . . . . . . . . . . . . . 163
- IV - TOPSPOT: HIGHLY PARALLEL NANOLITER DISPENSING - OPERATING CONDITIONS AND DESIGN RULES

DISSERTATION REMIGIUS NIEKRAWIETZ ABSTRACT
ABSTRACT
The development of microarray technology has revolutionized the field of biologicalresearch and is nowadays an established method in diagnostics and drug discovery.This powerful tool provides the ability of a parallel high throughput analysis of hun-dreds to thousands of samples on a single microarray slide. Due to the steadily increas-ing number of samples, which have to be measured in research, highly parallel andflexible dispensers are required for spotting of microarray slides. One of these microar-rayers is the pressure driven TopSpot nanoliter dispenser, which uses the non-contactprinting method for spotting microarrays. Core of the TopSpot dispensing technologyis a re-usable micromachined printhead, which allows the parallel ejection of up to 96different samples and its one to one format change from the microtiterplate ordered res-ervoir pattern to the 500 µm pitched microarray grid (see Fig. 8.1).
The overall goal of this work is to improve the quality of the microarray spotting bycharacterizing and optimizing the TopSpot printing process. One part of the optimiza-tion is to determine technological limits for integration and fabrication of Topspotprintheads and to derive design rules for an improved printhead performance. The at-tained design rules should allow the development of highly integrated printheads,which raise the number of simultaneous dispensed droplets up to 384.
The first section introduces the present trend of microarray applications and the dif-ferent manufacturing technologies. It further gives a short overview of the state-of-the-art microarrayer systems compared to the TopSpot technology.
In the second chapter the basic differential equations are presented, which are rele-vant for the capillary filling of the printhead, the droplet formation and the droplet im-pact on surfaces in the micro scale. In order to provide a fundamental understanding ofthe pneumatic actuation process for the droplet ejection of the TopSpot dispenser, ananalytical model of the generated pressure pulse is presented. The time depending pres-sure pulse and the approximated resulting flow through the nozzle is further developedinto an analytical model to determine the requirements for a successful droplet tear-off.
The implementation of an integrated process control for the highly parallel non-con-tact dispenser, which is essential for the high-quality microarray production, is ad-dressed in section three. A camera system mounted under a special tray is used asoptical process control for the spotted microarray. This online monitoring gives preciseinformation about the droplet diameter and the homogeneity of all ejected droplets inone evaluation step during the microarray production. Based on this technique an au-tomatic adaptation of the optimal dispensing parameter for unknown printing media,the detection of missing spots, satellites, dirt particles on the slide and the position ofthe spots in the array is established. As a result multi-ejection of droplets per nozzlecould be eliminated and a CV of 1.5 % for all 24 spot diameters is achieved.
For achieving a higher pressure pulse for the droplet ejection a new sealing methodwas developed, which enabled a direct sealing on the silicon layer and eliminated thedead-volume in the actuation chamber. In comparison to the standard method a four
TOPSPOT: HIGHLY PARALLEL NANOLITER DISPENSING - OPERATING CONDITIONS AND DESIGN RULES - V -

ABSTRACT DISSERTATION REMIGIUS NIEKRAWIETZ
fold increase in the printable viscosity range from 2.5 mPas to 10.8 mPas has beenachieved. A further prerequisite to increase the microarray quality is monitoring thepressure pulse, which is necessary for the single droplet ejection process. Hence a pres-sure sensor was integrated into the actuation chamber to acquire the transient pressurepulse during the droplet ejection. This fundamental process parameter provides infor-mation of possible failure modes of the dispenser like an increased pressure amplitudein a flooded actuation chamber or a reduced pressure amplitude from an empty nozzle.
Chapter four presents the significant influence parameters of the TopSpot dispens-ing method. These parameters are subdivided into those related to the print module, thehighly integrated printheads and the operation conditions. Two separate fully three-di-mensional numerical simulation models were set up using the Volume of Fluid methodto study the influence of the parameters. The first model analyzed the droplet ejectionand the droplet impact onto the slide. The deviations between simulation and experi-ment regarding the droplet volume and droplet velocity were less than 5 %. The influ-ence of specific design parameters like the printhead nozzle dimensions, liquidproperties of the printing media and the pressure pulse shape were analyzed. The cap-illary liquid transport for the first priming of the printhead was researched in the secondmodel. The new passive capillary filling structure 1 B developed within this work re-duced the evaporation of the dispensing liquid due to the sealed microchannels in theactuation chamber. It further enhanced the reproducibility and stable first priming ofthe nozzles with the highest successful self-filling rate of 99 % and the lowest CV(1 %).
The design rules for highly integrated TopSpot printheads are the topic of chapterfive. Compared to the standard printhead design the research of the nozzle length downto 50 µm enabled the reduction of the critical pressure by 20 % for the single dropletejection. Different printhead designs enabled the size optimization of the nozzle expan-sion diameter. A value of 150 µm at the nozzle expansion diameter meets the demandsof a minor increased pressure pulse (8 %) for a single droplet ejection process and therequirements for a highly integrated 384 nozzle printhead design. In addition the mi-crochannel width reduction down to 20 µm allowed a reliable capillary self filling ofthe nozzles while providing more space for higher spatial integration. The ensuredcross-talk free printing enabled the manufacturing of highly integrated 384 nozzleprintheads with a pitch of 500 µm. Droplet diameters have been measured by a strobo-scopic camera using the automated image processing software NeuroCheck®. For thestandard operating conditions of the 384 nozzle printhead the characterization showedCVs lower than 1% per nozzle with a calculated droplet volume of 825 pl. The mea-sured fluorochrome signal intensity of the spotted 384 array demonstrated a homoge-neity better than 2.8 % depending on the used printing buffer. The newly developedmulti-layer design overcomes the technological limitation of the small space inside thenozzle array with the help of additional silicon levels for the microchannels. This ap-proach could even allow for the fabrication of printheads with 1536 nozzles in the fu-ture.
- VI - TOPSPOT: HIGHLY PARALLEL NANOLITER DISPENSING - OPERATING CONDITIONS AND DESIGN RULES

DISSERTATION REMIGIUS NIEKRAWIETZ ZUSAMMENFASSUNG
ZUSAMMENFASSUNG
Mit der Entwicklung der Microarry Technologie hat ein Durchbruch im Bereich derbiologischen Forschung begonnen. Microarrys sind heutzutage eine etablierte Metho-de in der Diagnostik und der Arzneistoffwissenschaften. Die Technologie ermöglichteine parallele Hochdurchsatz-Analyse von einigen hundert bis zu tausenden biologi-scher Proben auf einem einzigen Glasträger. Aufgrund der ständig steigenden Anzahlan Proben, die in einem Experiment analysiert werden müssen, sind hochparalleleDruckverfahren zur Herstellung der Microarrys erforderlich. Einer dieser sogenanntenMicroarrayer ist der druckgetriebene TopSpot Nanoliter Dispenser, der auf der Basisder kontaktlosen Methode zur Microarray Produktion genutzt wird. Das Herzstück derTopSpot Dosiertechnologie ist ein wiederverwendbarer Druckkopf, der durch Silizi-um-Mikromechanik hergestellt wird und den parallelen Ausstoß von bis zu 96 ver-schiedenen Medien ermöglicht. Die Eins-zu-Eins Formatwandlung der Reservoire, dieein Mikrotiterplattenraster besitzen, auf einen Abstand der Spots im Microarray(500 µm) wird durch Mikrokanäle im Druckkopf ermöglicht (siehe Fig. 8.1).
Übergeordnetes Ziel dieser Arbeit ist es, die Microarrayqualität durch Charakteri-sierung und Optimierung des TopSpot Dispensierprozesses zu erhöhen. Ein Teilgebietdieser Optimierung ist die Bestimmung technologischer Grenzen der Integration undHerstellung von TopSpot Druckköpfen und das Ableiten von Designregeln, um eineverbesserte Druckkopf-Performance zu erlangen. Die erzielten Designregeln sollen dieEntwicklung von hochintegrierten Druckköpfen ermöglichen, um die Anzahl der un-terschiedlichen Analyten, die parallel in ein Microarrayraster von 500 µm dosiert wer-den können, weiter zu erhöhen.
Im ersten Kapitel werden die derzeitigen Trends der Microarray Applikationen undderen unterschiedliche Herstellungstechnologien erläutert. Eine Übersicht über einenTeil der derzeitigen relevanten Dosiersysteme wird als Vergleich zum Ausgangsstadi-um der TopSpot Technologie herangezogen.
Das zweite Kapitel stellt die grundlegenden Differentialgleichungen, welche die ka-pillare Befüllung mikromechanischer Druckköpfe, die Tropfenbildung und den Trop-fenaufprall auf Oberflächen beschreiben dar. Um ein fundamentales Verständnis despneumatischen Aktuationsprinzips zur Tropfendosierung des TopSpot Dispensers zuerlangen wurde ein analytisches Modell für die Druckgenerierung in der Aktuations-kammer erstellt. Der zeitabhängige Druckimpuls und der näherungsweise resultieren-de Volumenfluss aus der Dosierdüse wurden ferner in einem analytischen Modellzusammengefasst, um die Anforderungen für einen Tropfenabriss zu bestimmen.
Die Umsetzung einer integrierten Prozesskontrolle für den hochparallelen kontakt-losen TopSpot Dispenser, welche essentiell für die hochqualitative Microarray Pro-duktion ist, wird im dritten Kapitel beschrieben. Ein Kamerasystem wird dabei untereinen speziell angefertigten Substratträger montiert und als optische Prozesskontrolleder dispensierten Microarrays genutzt. Die Online Prozesskontrolle ermöglicht präziseInformationen über den Tropfendurchmesser und die Homogenität aller gedrucktenMedien in einem Auswertungsschritt zu erhalten. Eine automatische Ermittlung opti-
TOPSPOT: HIGHLY PARALLEL NANOLITER DISPENSING - OPERATING CONDITIONS AND DESIGN RULES - VII -

ZUSAMMENFASSUNG DISSERTATION REMIGIUS NIEKRAWIETZ
maler Dispensierparameter für unbekannte Medien, die Detektion von fehlenden Trop-fen, Satelliten, Schmutzpartikeln auf dem Substrat und die Position der gedrucktenTropfen im Microarray wurde etabliert. Hierdurch wurde es möglich, die MultitropfenDosierung der Düse zu eliminieren und eine Standardabweichung von 1.5 % für alle24 Tropfendurchmesser zu erreichen.
Um einen höheren Druckimpuls zur Tropfengenerierung zu erzielen, wurde eineneue Abdichtungsmethode entwickelt, die direkt am Silziumdruckkopf das Gasvolu-men einschließt. Dadurch konnte das Totvolumen in der Aktuationskammer desDruckkopfes beseitigt werden. Verglichen mit der Standardmethode konnte der dosier-bare Viskositätsbereich um einen Faktor vier erhöht werden (von 2.5 mPas auf10.8 mPas). Eine weitere Voraussetzung zur Erhöhung der Microarrayqualität ist dieKontrolle der Druckverhältnisse, die zur Einzeltropfendosierung notwendig sind.Demzufolge wurde ein Drucksensor in die Aktuationskammer integriert, um den tran-sienten Druckimpuls während der Tropfendosierung zu erfassen. Dieser fundamentaleProzessparameter liefert Informationen über mögliche Fehler im Dispenser, wie z.B.die Erhöhung der Druckamplitude in einer überfluteten Aktuationskammer oder dieReduzierung eines Druckimpulses aufgrund einer entleerten Dosierdüse.
Kapitel vier präsentiert die signifikanten Einflussparameter des TopSpot Dispen-sers. Diese werden unterteilt in Einflüsse der Einstellparameter des Druckmoduls, derhochintegrierten Druckköpfe und der Ansteuerungsparameter. Zwei separate dreidi-mensionale fluidische Simulationsmodelle wurden erstellt, um diese Parameter zu un-tersuchen. Im ersten Modell wird der Tropfenbildungsprozess sowie der Tropfen-aufprall auf dem Substrat betrachtet. Die Abweichung zwischen Simulations- und ex-perimentellen Ergebnissen bezüglich des dosierten Tropfenvolumens und der Tropfen-geschwindigkeit war geringer als 5 %. Designvarianten der Druckkopfdüsen, Flüssig-keitsparameter der Dosiermedien und die Druckpulsform für die Tropfendosierungwurden analysiert. Die kapillare Befüllung des Druckkopfes wurde im zweiten Modellnäher untersucht. Die neu entwickelte passive kapillare Befüllungsstruktur 1 B redu-ziert die Verdunstung des Dosiermediums aufgrund der geschlossenen Mikrokanäle inder Aktuationskammer. Ferner verbessert sie die zuverlässige und stabile Erstbefül-lung der Düsen mit der höchsten Befüllungsrate von 99 % und der geringsten Standar-dabweichung von 1 %.
Die Designregeln für hochintegrierte Druckköpfe zur Verbesserung des TopSpotDispensers, sind Gegenstand von Kapitel fünf. Im Vergleich zum Standard DruckkopfDesign ermöglichte die Reduktion der Düsenlänge auf bis zu 50 µm, die Reduzierungdes kritischen Drucks um 20 % die für eine Einzeltropfendosierung notwendig ist. Un-terschiedliche Druckkopfausführungen erlaubten die Optimierung des Düsenaufwei-tungsdurchmessers (150 µm), die die Anforderungen eines gering erhöhten Druck-impuls (8 %) für eine Einzeltropfendosierung und die Randbedingungen für ein hoch-integriertes 384er Druckkopfdesign erfüllten. Darüber hinaus konnte die Mikrokanal-breite auf bis zu 20 µm reduziert werden, sodass eine zuverlässige kapillare Befüllungder Düsen sichergestellt wurde. Die kreuzkontaminationsfreie Dosierung der Medienermöglichte die Realisierung hochintegrierter 384er Druckköpfe mit einem Düsenab-stand von 500 µm. Tropfendurchmesser wurden mit einer stroboskopischen Kamerawährend der Flugphase mittels einer automatisierten Bildverarbeitungssoftware Neu-roCheck® vermessen. Die Charakterisierung bei Standard-Betriebsbedingungen eines
- VIII - TOPSPOT: HIGHLY PARALLEL NANOLITER DISPENSING - OPERATING CONDITIONS AND DESIGN RULES

DISSERTATION REMIGIUS NIEKRAWIETZ ZUSAMMENFASSUNG
384er Druckkopfes zeigten Standardabweichungen geringer als 1 % an einer Düse beieinem errechneten Tropfenvolumen von 825 pl. Die gemessene Fluoreszenzintensitäteines gedruckten 384 Microarrays zeigte abhängig vom verwendeten Dosiermediumeine Homogenität besser als 2,8 %. Das neu entwickelte Multilagen-Design überwin-det die technologischen Limits des geringen Platzangebots innerhalb des Düsenarraysmit Hilfe von zusätzlichen Siliziumebenen für die Mikrokanäle. Diese Entwicklungkönnte in Zukunft sogar die Herstellung von hochintegrierten Druckköpfen mit 1536Düsen ermöglichen.
TOPSPOT: HIGHLY PARALLEL NANOLITER DISPENSING - OPERATING CONDITIONS AND DESIGN RULES - IX -

PUBLICATIONS DISSERTATION REMIGIUS NIEKRAWIETZ
PUBLICATIONS
Parts of this work have been published at the following journals or conferences:
JOURNALS
1. B. de Heij, M. Daub, O. Gutmann, R. Niekrawietz, H. Sandmaier, and R.Zengerle, "Highly parallel dispensing of chemical and biological reagents", Anal.Bioanal. Chem., Heidelberg, Germany, vol. 378, no. 1, pp. 119-122, Jan.2004.
2. O. Gutmann, R. Kuehlewein, S. Reinbold, R. Niekrawietz, C. P. Steinert, B. deHeij, R. Zengerle and M. Daub, "A Highly Parallel Nanoliter Dispenser forMicroarray Fabrication", Biomed. Microdevices, vol. 6, no. 2, pp. 131-137, June2004.
3. O. Gutmann, R. Niekrawietz, R. Kuehlewein, C. P. Steinert, S. Reinbold, B. deHeij, M. Daub, and R. Zengerle, "Non-Contact Production of OligonucleotideMicroarrays Using the Highly Integrated TopSpot Nanoliter Dispenser", Analyst,vol. 129, no. 9, pp. 835-840, Sept.2004.
4. O. Gutmann, R. Niekrawietz, R. Kuehlewein, C. P. Steinert, B. de Heij, R. Zen-gerle, and M. Daub, "Impact of Medium Properties on Droplet Release in a HighlyParallel Nanoliter Dispenser", Sensors and Actuators A-Physical, vol. 116, no. 2,pp. 187-194, Oct.2004.
5. O. Gutmann, R. Kuehlewein, S. Reinbold, R. Niekrawietz, C. P. Steinert, B. deHeij, R. Zengerle and M. Daub, "Fast and Reliable Protein Microarray Productionby a new Drop-in-Drop Technique", Lab on a Chip, vol. 5, no. 6, pp. 675-681,2005.
6. T. Glatzel, C. Litterst, C. Cupelli, T. Lindemann, C. Moosmann, R. Niekrawi-etz, W. Streule, R. Zengerle, P. Koltay, “Computational fluid dynamics (CFD) soft-ware tools for microfluidic applications - a case study”, Computers & Fluids 37,Vol. 3, 2008, pp. 218 - 235
- X - TOPSPOT: HIGHLY PARALLEL NANOLITER DISPENSING - OPERATING CONDITIONS AND DESIGN RULES

DISSERTATION REMIGIUS NIEKRAWIETZ PUBLICATIONS
CONFERENCE PROCEEDINGS
1. B. de Heij, M. Daub, R. Niekrawietz, C. Steinert, O. Gutmann, M. Löhr, H.Sandmaier, R. Zengerle, "TopSpot technology; high-throughput production ofmicroarrays", in 3.Biosensor Symposium, Potsdam, Germany, 2002
2. R. Niekrawietz, M. Daub, O. Gutmann, C. Steinert, B. de Heij, M. Löhr, I. Gou-tier, W. Wibel, H. Sandmaier, R. Zengerle, "TopSpot Technology - High-Through-put Printing of Microarrays", BioDigital, Germany, 2002
3. O. Gutmann, R. Niekrawietz, C. Steinert, H. Sandmaier, S. Messner, B. de Heij,M. Daub, R. Zengerle, "Droplet Release in a Highly Parallel Pressure DrivenNanoliter Dispenser", in Proceedings of IEEE International Conference on Solid-State Sensors, Actuators and Microsystems (IEEE-Transducers 2003), Boston,USA, June 8 - 12, 2003, pp. 364-367.
4. O. Gutmann, R. Kuehlewein, R. Niekrawietz, C. P. Steinert, B. de Heij, R. Zen-gerle, M. Daub, "Highly Parallel Droplet Release in a Nanoliter Dispenser", inProceedings of micro.tec 2003, Munich, Germany, Oct. 13 - 15, 2003, pp. 73-76
5. R. Niekrawietz, O. Gutmann, C. Steinert, Stefanie Reinbold, H. Sandmaier, B.de Heij, R. Zengerle, M. Daub, "TopSpot Technology - High-Throughput Printingof Microarrays", im Statusseminar Chiptechnologie, 26-27 January 2004, Frank-furt a.M., Germany
6. M. Daub, R. M. Kaack, O. Gutmann, C. P. Steinert, R. Niekrawietz, P. Koltay,B. de Heij, R. Zengerle, "Microfluidics and Beyond - Devices for Applications inBiotechnology", in Proc. MRS Symposium R 2004, San Francisco, USA, 2004
7. O. Gutmann, R. Kuehlewein, S. Reinbold, R. Niekrawietz, C. P. Steinert, B. deHeij, R. Zengerle, and M. Daub, "Fast and Reliable Protein Microarray Productionby a New Drop-in-Drop Technique", in Proceedings of the International Confe-rence on Miniaturized Systems for Chemistry and Life Sciences (µTAS 2004), Mal-moe, Sweden, Sept. 26 - 30, 2004, pp. 381-383.
8. R. Niekrawietz, W. Honstein, O. Gutmann, T. Wielath, B. de Heij, R. Zengerle,M. Daub, "Integrated Process Control For Highly Parallel and Contact FreeMicroarray Printing", presented at Statusseminar Chiptechnologien - Technologien& Anwendungen, 03.02.2005 - 04.02.2005, Dechema Haus, Frankfurt, Germany,2005
9. R. Niekrawietz, W. Honstein, O. Gutmann, B. de Heij, M. Daub, and R. Zen-gerle, "Integrated Process Control for Highly Parallel and Contact-Free MicroarrayPrinting", in Proceedings of IEEE International Conference on Micro ElectroMechanical Systems (MEMS 2005), Miami, USA, Jan. 30 - Feb. 3, 2005, pp. 738-741.
TOPSPOT: HIGHLY PARALLEL NANOLITER DISPENSING - OPERATING CONDITIONS AND DESIGN RULES - XI -

PUBLICATIONS DISSERTATION REMIGIUS NIEKRAWIETZ
10. O. Gutmann, M. K. Wintermantel, R. Niekrawietz, B. de Heij, R. Zengerle, M.Daub, ”Dispensing of Cells for Highly Parallel Production of Living Cell Microar-rays”, Proceedings of IEEE International Conference on Solid-State Sensors,Actuators and Microsystems (Transducers 2005), Seoul; Korea, June 5-9, 2005,pp. 449-452.
11. D. Schuhmacher, R. Niekrawietz, H. Scheithauer, B. de Heij, M. Alavi, R.Zengerle, P. Koltay, "Production of Solder Microdroplets Using a Highly Paralleland Contact-Free Printing Method", in Proceedings of IEEE International Confe-rence on Micro Electro Mechanical Systems (MEMS 2007), Kobe, Japan, Jan. 21 -25, 2007
12. D. Schuhmacher, R. Niekrawietz, H. Scheithauer, B. de Heij, M. Alavi, R.Zengerle, P. Koltay, "Erzeugung von Mikrotropfen aus flüssigem Lötzinn mittelseiner hochparallelen und kontaktlosen Drucktechnik", presented at Mikrosystem-technik-Kongress 15.10.2007-17.10.2007, Dresden, Germany 2007
- XII - TOPSPOT: HIGHLY PARALLEL NANOLITER DISPENSING - OPERATING CONDITIONS AND DESIGN RULES

DISSERTATION REMIGIUS NIEKRAWIETZ INTRODUCTION
INTRODUCTION
In the past several years, the microarray technology has revolutionized the fields ofbiotechnology and life sciences. It has opened new perspectives for decoding the hu-man genome, in DNA diagnostics, proteomics as well as in pharmacogenetics. In thelast few years microarray technology has become a powerful tool for highly parallelanalysis of biological molecules [1]. Miniaturization, automation and parallelization ofconventional assays has become a general trend in biomedical research. The microar-ray technology enables a fast and parallel detection of thousands of probes within onesingle experiment [2]. Microarrays reduce reagent consumption, minimize reactionvolumes, increase the sample concentration, accelerate the reaction kinetics, allow todecrease the costs of often expensive materials and lead to faster analysis times. Themicroarray assays can be very sensitive, reproducible and quantitative because of theuse of optimized detection methods and rigorous quality control [3]. Additionally mi-croarrays offer the use of advanced fabrication and data mining technologies, whichallow for data gathering at an unprecedented rate [4]. The application of microarrayscan be used to identify complex genetic diseases for drug discovery, toxicology stud-ies, mutation and polymorphism detection, pathogen analysis and differing expressionof genes over time. Due to the large number of applications, the microarray technologyis a rapidly growing field. These various applications are also increasing the range ofused printing media. The steadily increasing number of interactions, which have to bemeasured in research, e.g. chemical science, life science or drug discovery highly par-allel fabrication technologies for microarrays are required to cope with this task.
This thesis deals with the development and characterization of a highly integratedprinthead for a pneumatic non-contact printer, which enables to dispense 384 nanoliterdroplets in parallel at a pitch of 500 µm for microarray fabrication.
1.1 MICROARRAYS AND THEIR APPLICATIONSAlthough the concept of using microarrays can be traced back 25 years to the introduc-tion of the Southern blot [5], modern microarray analysis was introduced in 1995 by aStanford University research team led by Pat Brown and Ron Davis [6]. In the mean-time the production of microarrays has become a large technological challenge due toits high complexity and diversity of media. In principle there are three main types ofmicroarrays: DNA microarrays, protein microarrays and cell microarrays. Fig. 1-1gives a basic overview of the structure of a cell as well as DNA and protein assembly.
Historically, the development of microarrays started in the field of genomics. DNAmicroarrays have gained a key position in medical and biological research and will cer-tainly lead to new analytical approaches in the attempt to understand the inherent com-plexity of biological systems [7,8]. In theory microarrays make it even possible tomonitor the expression levels of all genes of an organism simultaneously in a singleexperiment [9,10]. However, the genome sequencing projects of several model organ-
TOPSPOT: HIGHLY PARALLEL NANOLITER DISPENSING - OPERATING CONDITIONS AND DESIGN RULES - 1 -

INTRODUCTION DISSERTATION REMIGIUS NIEKRAWIETZ
isms showed that complete information of the genome did not provide enough insightto understand the complex cellular network [11]. Although the genetic informationprovides us with the sequence information of each protein, it contains only little infor-mation about the localization, structure, modifications, interactions, activities and ulti-mately their function [12].
Proteins are the functional entity encoded by the genome [13]. Analyzing proteinexpression is a more direct way to analyze the molecular basis of diseases [14]. Hence,proteins, not genes, are the true targets of medicine and thus of particular interest to thepharmaceutical industry [15]. The experimental attempts to describe the complexity ofthe entire protein content of biological systems is called Proteomics [16]. Protein mi-croarrays have evolved as a powerful tool to provide quantitative data on a large num-bers of samples [12,14,17,18].
The basic concept of all microarrays is a spatial ordered, miniaturized arrangementof a multitude of immobilized capture sites (DNA, protein or cells) with known iden-tity on a substrate. The dense arrangement of the probes on microarrays also reducesthe amount of sometimes very precious and expensive sample required for an experi-ment. Therefore, they can be considered as highly parallel biosensors whose sensor ef-fect is based on a chemical reaction between molecules with a lock and key principle.
DNA is built out of four different nucleotides generating an uniform molecule witha well defined structure on a hydrophilic, negatively charged sugar backbone (see Fig.1-1). By contrast, proteins are built up of up to 20 different amino acids displaying very
Figure 1-1: The human body contains about 100 trillion cells. The human genome is found inside thenucleus of our cells and stores the genetic information. Each nucleus contains 23 pairs of (or 46 indi-vidual) chromosomes. Inside each of these tiny chromosomes is a long chain molecule called DNA(deoxyribonucleic acid, double-stranded helix) that carries the genetic message that controls all cellu-lar functions. A DNA molecule consists of four nucleotides, and each nucleotide is made up of a deox-yribose, a phosphate group and one of the four nitrogen bases called adenine (A), guanine (G),cytosine (C) and thymine (T). The human genome has about 100,000 genes, and they contain instruc-tions for making proteins—the building blocks of the human body. Each protein in the human bodyconsists of a unique sequence of amino acids.
- 2 - TOPSPOT: HIGHLY PARALLEL NANOLITER DISPENSING - OPERATING CONDITIONS AND DESIGN RULES

DISSERTATION REMIGIUS NIEKRAWIETZ INTRODUCTION
diverse properties ranging from hydrophilic to hydrophobic, acidic or basic. This isvarying the fluidic and the biochemical properties of proteins. So the production ofprotein microarrays is much more difficult than the production of DNA microarrays[15]. Despite of these problems microarrays containing over 100 different proteins andeven an entire proteome were produced [7]. In general, protein microarray technologydisplays a great potential to have a significant impact on research, e.g. cancer [19,20]or pharma research [21].
A precondition for successful analysis of protein microarrays is, that the captureproteins must be kept in a functional state when immobilized onto a microarray [18].In many cases full protein functionality is only given within the living organism. To beable to analyze in nearly native conditions the third main type of microarrays was de-veloped: living cell microarrays [22,23,24]. Applications are also the detection of bio-logical warfare agents and environmental toxicants [23]. Cell microarrays are intendedto identify potential drug targets by functionally characterizing large numbers of geneproducts in cell-based assays or to evaluate the specificity of drug leads [24]. Addition-ally identification of proteins binding to drugs with unknown mechanism of action ispossible.
Generally, a microarray experiment proceeds in five steps and every process playsan important role for the final quality of the result (see Fig. 1-2). The initial point of amicroarray experiment such as a DNA microarray is a clear defined complex biologi-cal question. The researchers insight is increased with each cycle. The second step isthe sample preparation of the reagents or samples by a complex biotechnological pro-duction method. The production of the microarrays for instance by a non-contact print-ing technology is part of this cycle step. Due to the extensive and time consumingsynthesis most of the samples are very expensive. Therefore, a microarrayer has towork absolutely reliable in order not to waste significant quantities of the precioussamples. In the third step catching molecules (probes) are arranged on the substrate ina fixed matrix array. After a washing step the complex sample liquid, is brought intocontact with the immobilized probes. The probes bind their complementary counter-parts (hybridization) and remain bonded even after rinsing. After the microarray reac-tion, the molecular interaction between the arrayed substances and substances in thesample liquid is detected via labeled molecules and quantified in the fourth step. Mi-croarray detection methods are mainly based on fluorescence, but chemiluminiscence,radioactivity, mass spectrometry or electrochemistry are also used [2,4]. The fifth andlast step is the analysis of data and modeling using bioinformatic tools to address theinitial biological question. Depending on the results of these five steps, a redefinitionof the microarray layout might be needed and the next round of the microarray cyclecan be started. In this context the print process plays a central role for the quality of amicroarray. This is an important factor for the succeeding processes. Due to the largenumbers of spotted probes, the microarray print process also determines whether a rap-id and cost effective production of microarrays can be achieved.
In the years 1997 to 2002 different market studies claimed, that the DNA microar-rays had a market volume around 300 million dollars, which shows the overall com-mercial success. Even more promising seems to be the market for protein microarraysthat was estimated in 2002 to grow from 45 million dollars in the year 2000 to almost
TOPSPOT: HIGHLY PARALLEL NANOLITER DISPENSING - OPERATING CONDITIONS AND DESIGN RULES - 3 -

INTRODUCTION DISSERTATION REMIGIUS NIEKRAWIETZ
500 million dollars in the year 2006 [15]. Because of the predicted central role of themicroarrays in biomedical research, some experts believe that the microarray revenueswill eventually eclipse the sale of computer chips.
The growing market for microarrays demands for devices, which are able to pro-duce microarrays in a fast manner at reasonable costs. The current state of microarrayprinting technology is mainly very time consuming and cumbersome. At this point thefocus of the thesis is set on the TopSpot dispensing technology, which allows for theparallel and fast production of high quality microarrays.
Figure 1-2: The microarray life cycle shows the five main steps needed for a microarrayexperiment [1] (1) The biological question is the first step of the microarray production. (2) The sam-ple preparation includes the spotting of the media. (3) Microarray reaction: The complex liquid, whichis labeled is brought into contact with the fixed catching molecules, binds to their counterparts andremains bonded even after rinsing. (4) The detection of a microarray, which is mainly based on fluo-rescence method. (5) The last step is the analysis of the data and modeling by using bioinformatictools.
- 4 - TOPSPOT: HIGHLY PARALLEL NANOLITER DISPENSING - OPERATING CONDITIONS AND DESIGN RULES

DISSERTATION REMIGIUS NIEKRAWIETZ INTRODUCTION
1.2 MICROARRAY-FABRICATION TECHNOLOGIESMicroarray-fabrication technologies fall into two main categories. First the on-chipsynthesis, where microarrays are prepared in a stepwise fashion by in situ synthesis ofnucleic acids and other biopolymers from biochemical building blocks directly on thesubstrate. In this approach with each cycle of synthesis, nucleotides are added to grow-ing chains until the desired length and sequence of the oligonucleotide is achieved. Thesecond approach uses the deposition of pre-synthesized molecules for microarray fab-rication. Molecules such as oligonucleotides and DNAs are amplified by PCR and pu-rified, and small quantities are deposited onto known locations using a variety ofdelivery technologies.
1.2.1 ON-CHIP SYNTHESIS
In on-chip synthesis, two different approaches are used: sequential printing of oligo-nucleotide pre-cursors or photolithography processes, which were adopted from thesemiconductor technologies.
1.2.1.1 ON-CHIP APPROACHES USING PHOTOLITHOGRAPHY
A photolithography process allows for the construction of high density oligonucleotidemicroarrays by a combinatorial on-chip approach (Fig. 1-3a-c). Synthetic linkers mod-ified with photochemically removable protecting groups are attached to a glass sub-strate. Direct light through a photolithographic mask to specific areas on the surfaceproduces localized photodeprotection. The surface is then flooded with a solution con-taining either adenine, thymine, cytosine, or guanine, and coupling occurs only in thoseregions on the glass that have been deprotected through illumination. The coupled nu-cleotide also bears a light-sensitive protecting group, so the cycle can be repeated. Inthis way oligomers with a length of up to 25 bases and a minimum feature size of11 µm can be produced [25]. But for each oligonucleotide synthesis step another pho-tolithographic mask is needed. So up to 100 masks have to be used for fabrication ofthe so called GeneChips from Affymetrix Inc. [25]. The fixed cost of the mask set,which are also time-consuming to design and build, makes this approach only afford-able for the production of many microarrays without any flexibility in array layout. Themanufacturing process ends with a comprehensive series of quality control tests. Asampling of arrays from every wafer is used to test the batch by running control hy-bridizations.For higher flexibility NimbleGen and Febit use Maskless Array Synthesis (MAS) tech-nology. This approach combines photo-deposition chemistry with controllable micro-mirror arrays to expose the desired positions. The NimbleGen system is based on aDigital Micromirror Device (DMD), similar to Texas Instruments' Digital Light Pro-cessor (DLP), employing a solid-state array of miniature aluminum mirrors to patternup to 786,000 individual pixels of light, enabling minimum feature size of 17 µm [26].The DMD "virtual masks" replace the physical chromium masks of the Affimatrix ap-proach. This on-chip approach enables a more flexible production of small batches ofoligonucleotide microarrays with different array layouts. In the meantime the company
TOPSPOT: HIGHLY PARALLEL NANOLITER DISPENSING - OPERATING CONDITIONS AND DESIGN RULES - 5 -

INTRODUCTION DISSERTATION REMIGIUS NIEKRAWIETZ
NimbleGen was taken over by Roche. The acquisition of NimbleGen Systems hasbrought Roche a step closer to its strategic goal of providing complete workflow solu-tions for the genomics and post-genomics life science markets.
Febit has introduced a commercially available integrated benchtop instrument „GENI-OM“ that generates microarrays within a three-dimensional structure called DNA pro-cessorTM by using also a Digital Micromirror Device. The DNA processor is a
Figure 1-3: High density synthetic oligonucleotide microarrays by Affymetrix [25] a.) Sequence ofcombinatorial on-chip synthesis of 25-mer oligos by photolithography b.) Schematic representation ofthe lamp, mask and array. c.) The GeneChip cartridge with zoomed schematic view onto synthesizedoligonucleotides [30].
Figure 1-4: a.) Manufacturing process of NimbelExpress Arrays based on micromirrors instead ofexpensive masks for photolithography. b.) Schematic principle: The DMD controls the pattern of UVlight, which selectively cleaves a UV-labile protecting group at the precise location where the nextnucleotide will be coupled [26,27].
a)
b) c)
a)
b)
- 6 - TOPSPOT: HIGHLY PARALLEL NANOLITER DISPENSING - OPERATING CONDITIONS AND DESIGN RULES

DISSERTATION REMIGIUS NIEKRAWIETZ INTRODUCTION
disposable microchannel chip consisting of eight segments with individual fluid con-trol for eight independent arrays. A freely designable oligonucleotide microarray isbuilt up inside these meandering microfluidic channels over night. It allows synthesiz-ing of up to eight times 6,000 different oligonucleotides. After the oligomer buildingprocess, also the hybridization and analyzing is done by fluorescence detection, whichcan be achieved in the same device. The GENIOM external hybridization unit allowsto perform hybridizations while synthesizing new arrays on another DNA processor,thereby enhancing the productivity of the system [28].
1.2.1.2 ON-CHIP APPROACHES USING PRINTING
The idea of printed microarrays emerged from Agilent’s long printing legacy as part ofHewlett Packard. Nowadays Agilent does not offer a microarrayer itself, but they offercustomer shaped DNA microarrays, which are printed by their SurePrint technology,which is based on inkjet printing technology. Instead of printing the oligonucleotidesfully prepared onto the microarray surface, they are actually synthesized base-by-basein repetitive print layers using standard phosphoramidite chemistry [29]. After the ink-jet head and reservoirs are washed and thoroughly dried, they are connected to bottlescontaining the four different phosphoramidite nucleotides (A, C, G, T) that make up thebuilding blocks of in situ nucleic acid synthesis. This ensures a constant supply of re-agents flowing to the inkjet head during printing like displayed in Fig. 1-6b-c. The oli-go print run commences with the firing of a test pattern to select the best nozzles forprinting. Then the iterative oligonucleotide synthesis loop begins when the first nucle-otide of each oligo is printed onto the activated glass surface. The protective group of5' hydroxyl group of printed nucleotide is removed chemically and oxidized to activateit enabling it to react with the 3' group of nucleotide printed in the next print layer (seeFig. 1-6a). The excess of unbound nucleotides is washed away so that they won't ran-domly react later in the synthesis. The process of printing a nucleotide followed by de-protection, activation and washing is repeated 60 times, before moving on to laserscribing, dicing and quality control testing.
Figure 1-5: a.) GENIOM is a fully integrated benchtop system for the DNA processing by Febit [28].b.) The external hybridization unit incubates the samples while GENIOM synthesizes new arrays.c.) DNA Processor: a three-dimensional disposable microchannel chip, which consists of eight seg-ments with individual fluid control. d.) Cartridge for easy handling and auto alignment to fluidics andoptics. e.) DNA synthesis princple: (1) Spacers bound to activated glass surface (2) Selective cleavageof protection groups at illuminated spots, light projection by digital deflectable micromirror device(3) Coupling of amidite building blocks results in oligonucleotide chain elongation
a)
b) c) e)
d)
TOPSPOT: HIGHLY PARALLEL NANOLITER DISPENSING - OPERATING CONDITIONS AND DESIGN RULES - 7 -

INTRODUCTION DISSERTATION REMIGIUS NIEKRAWIETZ
Three different formats are available on a 1 x 3 inch microarray glass slide containingeither two times a 10,263, one time a 21,495 or one time a 42,034 oligonucleotide fea-ture set. The printing process involves multiple real-time quality control feedbackmechanisms of each printed layer of nucleotides. This guarantees the proper synthesiz-ing of desired oligonucleotide sequence.The advantage of all on-chip approaches is that the methods are well established andmore uniform than other technologies [30]. A disadvantage is that they can only be ap-plied for the production of oligonucleotide microarrays. So far, only scientific but nocommercial approaches were undertaken to produce peptide chips by an on-chip ap-proach [24]. Even if the high density of the microchips is important in some biologicalquestions, not all applications require such a high density. Often it is more importantto have a high flexibility by small lots of different specialized chips with lower densityat reasonable costs.
1.2.2 PRINTING PRE-SYNTHESIZED MOLECULES
For the production of microarrays from pre-synthesized molecules a wide variety ofmicroarrayer systems are available. The printing technology of such microarrayerscurrently exits in two forms: contact and non-contact printing. Due to the fact that inresearch application the array needs to be flexible and often small batches (hundreds
Figure 1-6: a.) The general cycle of oligo synthesis via phosphoramidite chemistry by Agilent’s Sure-Print technology [29]. b.) Schematic view of a four channel inkjet printer, each one filled with one ofthe 4 nucleotides (A,C,G,T): The first layer of the nucleotides being deposited on the activatedmicroarray surface. c.) Growth of oligomeres by multiple printing of nucleotides onto each other.
a) b)
c)
- 8 - TOPSPOT: HIGHLY PARALLEL NANOLITER DISPENSING - OPERATING CONDITIONS AND DESIGN RULES

DISSERTATION REMIGIUS NIEKRAWIETZ INTRODUCTION
or less) of microarrays with low density (a few hundred spots) are required, these print-ers predominate the market. Additionally, the high demands for the production of pro-tein or cell microarrays can be addressed by the following printing technologies.
1.2.2.1 CONTACT PRINTING
Contact printing was the first technology, which was used for the microarray produc-tion and today it is the most widely used method in the research community. The print-ing principle is based on pin tools, which are dipped into the sample solution, takingup a small volume of sample. When the pin comes in contact with the substrate, it re-sults in the formation of a liquid bridge across the two surfaces. Liquid delivery isachieved, when the pins are moved away from the surface and the attractive force ofthe substrate on the liquid draws a small amount of analyte from the sample channel ofeach pin. The spot diameter on the substrate, is determined by the surface interactionsof the pin, the fluid and the substrate [1]. One of the major pin suppliers is TeleChemInternational. Their pins deliver spot volumes from 0.5 nl to 12 nl, resulting in spot siz-es from 62.5 µm to 600 µm [1,31]. The pins are manufactured most commonly ofstainless steel or silicon. The pins have to be cleaned carefully and extensively aftereach printing to avoid cross-contamination. If standard solid pins are used, the pin hasto be reloaded after nearly every print. Specially shaped pins were developed to allowfor several depositions with one dipping step, e.g. capillary tubes, tweezers, split pinsor ink stamps like micro-spotting-pins (Fig. 1-7a-d). They can be customized to hold0.25 µl to 1.25 µl of sample solution. The deposition process is passive, in the sensethat no liquid is ejected from the pin. Another way to circumvent re-dipping is the Pin-and-Ring technology, which was developed by Genetic Microsystems (today a subdi-vision of Affymetrix). A small ring is dipped into the sample solution with a typicalload volume of 1.5 µl [32]. The surface tension of sample is used to form a fluid layerin the ring. A solid pin is pushed through the fluid layer and the trapped sample is de-posited onto the surface [1]. After retraction of the pin the fluid film is still intact andfluid is replenished from the ring.
Figure 1-7: Contact printing of microarrays: a.) Different available pin types b.) Working principle ofthe contact printing methods c.) Printing with 48 pins in parallel by the ArrayIt® microarray technolo-gies. The pins are constructed from TeleChem's proprietary RM101 alloy, which is 10-times moredurable than stainless steel, ensuring 10 million printing cycles and faster printing speeds [31].
a)
b) c)
TOPSPOT: HIGHLY PARALLEL NANOLITER DISPENSING - OPERATING CONDITIONS AND DESIGN RULES - 9 -

INTRODUCTION DISSERTATION REMIGIUS NIEKRAWIETZ
Advantages of contact printing technology include easy prototyping and therefore rap-id implementation at low costs. Further, the pin based printing technology allows forthe robust transfer of liquid by direct contact of the pins with the surface to be printed.However, the interaction between the contact tip and substrate can result in tip or sub-strate damage and it can also be a variable in the transfer volume to the substrate [21].In addition, substrate designs may have topology aspects, which may interfere with thecontact volume transfer. So both pins and the sometimes fragile slide surfaces can bedamaged, substantially decreasing the reproducibility of the microarrays. This is par-ticularly important in protein arrays, where 3D substrate surfaces such as membranesare advantageous. The influence of the metallic pin on protein structure remains alsounclear. To produce a high number of arrays in a reasonable time, it is necessary to usemany pins in parallel, typically up to 48 (see Fig. 1-7c-d). It is not easy to obtain a setof pins that are uniform in size, shape and height, so a very tedious pre-selection pro-cess for the pins is needed [33,34]. Only mechanically very precisely produced pinswill deliver the same volume consistently and reliably. Another unsolved problem forpin printers, using more than one pin is, that the pitch of samples usually provided inwell plates (4.5mm for 384 well plate) is larger than the desired pitch of the spots onthe microarray. To obtain a smaller pitch, the spots have to be printed in between ofeach other in an interdigitated way. Hence, the spot layout will be different from theplate layout. After the first spotting cycle, the pins have to be cleaned to avoid carry-over, before a second sample can be loaded. Achieving fast and efficient cleaning(wash/dry process) of pins is difficult. This is lowering the maximum printing speed.Because of an immediate cross-contamination of the pins a drop in drop dispensing ismore complex. Non-contact dispensing can eliminate many of these concerns.
1.2.2.2 NON-CONTACT PRINTING
The non-contact printing method, which is based on various drop-on-demand deliveryapproaches, provides another way to manufacture microarrays. The most advanced ofthese approaches are adaptations of the ink-jetting technology, which utilizes piezo-electric and other forms of propulsion to transfer biochemical substances from minia-ture nozzle to solid surfaces. During the whole dispensing process there is no contactbetween printing tool and substrate. The sample is dispensed onto the surface from acertain distance without any direct surface to nozzle interaction and makes meteringmore precise in many cases. Usually, the dispensing unit of a non-contact printer com-prises a reservoir for supplying the fluid to the ejection nozzles. Samples are filled intoreservoirs and commonly capillary forces or pumping mechanisms transport the liquidthrough small tubes or microchannels to the printing nozzles. This enables the non-contact printer to dispense thousands of droplets without the need to refill.
SOLENOID NON-CONTACT DISPENSER TECHNOLOGY: The synQUADTM non-contact system of Genomic Solutions involves the coupling ofthe opening and closing of a highspeed microsolenoid valve with the movement of ahigh-resolution syringe pump to release drops from a ceramic tip [35]. A system fluidfills all the syringe pumps and lines providing a non-compressible volume. A steppermotor drives the syringe plunger and pushes the programmed liquid volume into theclosed solenoid valve. The actuation of the valve releases the pressure that has been
- 10 - TOPSPOT: HIGHLY PARALLEL NANOLITER DISPENSING - OPERATING CONDITIONS AND DESIGN RULES

DISSERTATION REMIGIUS NIEKRAWIETZ INTRODUCTION
created within the system and a drop is accelerated out and onto (or into) the target. Thecombination of the pressure generated by the syringe and the acceleration of the fluidby closing the valve allows very small droplets to be released cleanly from the tip.Placing the valve as close as possible to the dispenser tip produces the best results andthe greatest control over the dispensing process. The precision of the syringe and speedof the opening and closing of the solenoid valve are the critical issues in the control ofnanoliter dispensing using syringe pumps. The Cartesian synQUADTM effectively ad-dresses these problems by allowing the scientist to control both parameters. The resultis an extremely fast dispensing system, which can deliver volumes from 20 nl to 20 µl.The aspirate and dispensing mode simply involves aspirating a sample from a sourceand then transferring aliquots to a destination area or plate. Fig. 1-8 shows the syringesolenoid principle and the assembly of the synQUADTM dispensing platform witheight channels.
PIEZOELECTRIC NON-CONTACT DISPENSER TECHNOLOGY: The prevalent actuation principle for non-contact microarray dispensers is piezoelec-tric. The fast response time of the piezoelectric crystal allows high dispensing ratesover a frequency range of up to 5000 Hz in a volume range of hundreds of picoliters toa few nanoliters. Non-contact dispensers based on glass capillaries with contractiblepiezo ring actuators fixed around them are used by companies like MicroDrop, Perkin-Elmer, Scienion and Aurora Discovery. In all piezo tip systems the automatic aspira-tion of a precisely defined sample volume of a well plate is possible by applying aslight vacuum at the end of all piezo tips [37]. A schematic view of the piezo actuation,which indicates the dispensing process, is seen in Fig. 1-9.
Aurora Discovery's patented dispense mechanism is claimed to be superior to alter-native piezo designs, because it uses two cylindrical piezoelectric ceramic elementssurrounding the microcapillary instead of one. The nozzles of the piezoelectric GeSiMmicropipetts consist of micromachined bonded silicon glass layers. The piezo actuatoris fixed on top of the dispenser tip. The squeezing of the tip forced by the piezo actua-
Figure 1-8: Syringe solenoid non-contact microarrayer: a.) Working principle, which allows for aspi-rate and dispense mode [36] b.) SynQUADTM PreSys 4040XL dispensing platform with 8 channel dis-pense head [35]
a) b)
TOPSPOT: HIGHLY PARALLEL NANOLITER DISPENSING - OPERATING CONDITIONS AND DESIGN RULES - 11 -

INTRODUCTION DISSERTATION REMIGIUS NIEKRAWIETZ
tion induces the droplet ejection out of the capillary. Each pipet connects to a dedicatedsyringe that supplies both sample and washing fluids. The washing step prevents cross-contamination between the pipetting cycles like displayed in Fig. 1-11.
For higher throughput parallel systems are required like Gesim-Nano-PlotterTM
NP 2 [41] with up to sixteen piezo tips or the Scout MPD Workstation from AuroraDiscovery, which increase the productivity with 96- or even 384 tips (Fig. 1-10) [42].In addition, non-contact methods can often be operated in a continuous mode for on-the-fly dispensing, which results in even faster arraying speed. Because there is no con-tact between tips and substrate the horizontal alignment of all tips is not as critical asit is for contact printer printheads. But each tip has its own piezo actuator, which resultsin a time-consuming calibration to enable homogeneous droplet ejections from all usedtips. The nozzle geometry and surface properties are also important parameters influ-encing the droplet shape and volume. Minor differences lead to high fluctuations in thedroplet volume and spot size [21]. The tips are mainly produced in small batches in amanual process, so a tedious quality control of the tips is needed to ensure the high pre-cision of the tip geometries. Further, the format change from the well plate to the mi-croarray is still a problem as it is for contact printers. However, the non-contactprinting approaches provide less spot to spot and chip to chip variability than contactprinting methods [34]. In view of the growing interest in microarray technology and itspotential impact on drug development and disease profiling, it is unrealistic to suggestthat any single enabling technology will dominate this large and diverse industry. Amore detailed overview over currently available microarrayer systems is given by C.P.Steinert [43].
Figure 1-9: Piezoelectric non-contact dispenser: a.) Working principle [36] b.) Picture of a micro-drop tip [38] c.) Sample aspiration from a well plate [39] d.) A piezoarray printhead of Perkin-Elmerwith 4 tips [40] e.) Droplets dispensed into small cavities of a well plate from the sciFLEXARRAYER ofScienion f.) Stroboscopic pictures of the droplet ejection process out of Scienion tips [39]
a) b) c)
d)
e)
f)
- 12 - TOPSPOT: HIGHLY PARALLEL NANOLITER DISPENSING - OPERATING CONDITIONS AND DESIGN RULES

DISSERTATION REMIGIUS NIEKRAWIETZ INTRODUCTION
INTEGRATED PROCESS CONTROLS FOR NON-CONTACT DISPENSER: Manufacturing of a large number of microarrays not only requires a fully automatedproduction process but also integrated process controls. As a result of the diversity andcomplexity of the printing media, which also influence the dispensing process, the ad-justment of printing parameters is necessary. An optical drop sensor for instance pro-vides a live image of the flying droplets and allows for easy optimization of the printingparameters by the user. It is not only important to dispense the liquid but also to ensure,that no satellites follow the main droplet, which can cause a cross-contamination oftwo neighboring spots. The quality control of microarray production is essential toachieve a reliable conclusion on the final biological question. Due to the high numberof features on a slide it is necessary to monitor spot presence and position. A failure oran empty tip can be recognized and can be "repaired" in an additional step. This, how-ever, is time-consuming and expensive. A better strategy is to prevent errors by inspec-tion of the most important process parameters during the dispensing process in orderto enable the early intervention in the production process of the microarrays. There-fore, a clear trend towards microfluidic dispensers with integrated process controls toimprove quality of microarrays can be observed. Integrated sensing elements offerhuge advantages regarding costs and performance compared to human intervention.The Nano-PlotterTM NP 2 of Gesim has two process control units for the micropipettesas it can be seen in Fig. 1-11. The microelectronic droplet sensor consists of an arrayof 8 x 4 interdigitated electrodes structured on a glass substrate. The glass chip sits on
Figure 1-10: a.) Gesim dispenser tip b.) Gesim Nano-PlotterTM NP 2 system can be equipped with 16tips and is used for high throughput production of microarrays. The integrated wash/dry station pre-vents cross-contamination between the pipetting cycles. c.) Detail view of the dispensing process[41,44] d.) Aurora Discovery dispenser tip e.) Scout MPD from Aurora Discovery is a robust 96- or384-tip liquid handler, which combines superior liquid delivery at low volumes from 1 nl – 2 µl.f.) Scout MPD printhead equipped with 96 tips in parallel g.) The optical tip test station provides per-formance verification of a piezo tip, that is removed from the workstation [42].
a)
b) c)
d) e) f) g)
TOPSPOT: HIGHLY PARALLEL NANOLITER DISPENSING - OPERATING CONDITIONS AND DESIGN RULES - 13 -

INTRODUCTION DISSERTATION REMIGIUS NIEKRAWIETZ
a printed circuit board on, which the connector pins are mounted. If a droplet hits therectangular electrode pad, an electric current is generated and monitored. It checkseach tip after aspiration of the dispensing medium. The second process control is a stro-boscope camera, which observes the droplets during the flight and allows for identifi-cation of the optimum operation parameters. However, this process control is only afunctional testing of the pipettes before the spotting and gives no information on theperformance of the pipettes during the microarray production [45].
1.2.3 TOPSPOT TECHNOLOGY
The TopSpot technology [47-50] was originally developed in collaboration of HSG-IMIT and IMTEK and is currently commercialized by BioFluidix. The core of the non-contact dispensing technology is a re-usable micromachined printhead, which is ableto dispense up to 384 different samples in parallel. Two pyrex and one silicon layerform a three layer design of the printhead. The upper pyrex layer contains the centralactuation chamber, which opens the nozzle to the upper side of the printhead and up to384 reservoirs (see Fig. 1-12). The spacing of the reservoirs is 2.25 mm or 4.5 mm,which are well-known standards for microplates [46,47,48]. This enables filling of thereservoirs manually by a pipette or automatically by standard liquid handling robots.The reservoir capacity of 6 µl is enough for spotting some thousands of microarrayswithout reloading the printhead. All the important fluidic microstructures of the print-head like nozzles and capillary channels are realized in the silicon layer by using DeepReactive Ion Etching (DRIE). The silicon micromachining enables very homogeneous,precise and reproducible geometries of the printhead. Because all nozzles of the print-head are manufactured in the same process step, it can be achieved, that the geometricvariations of nozzle diameters is below 1 µm. This enables a much higher precisioncompared to other contact and non-contact microarrayers. Every reservoir is connectedwith just one corresponding nozzle in the central area of the printhead via an etched
Figure 1-11: Operating principle of the piezoelectric GeSiM-Micropipettes 1.) Pipette filled with sys-tem liquid ready for use 2.) Programmable sample aspiration from a microplate 3.) Parameter optimi-zation with a stroboscope camera by dosage of a certain number of droplets of each tip, dropfrequency up to 1000 Hz (optional) 4.) Automatic function test with microelectronic droplet sensorpads 5.) Contactless sample delivery on a substrate 6.) Removal of the sample and washing step7.) Drying of the tip [41,44]
- 14 - TOPSPOT: HIGHLY PARALLEL NANOLITER DISPENSING - OPERATING CONDITIONS AND DESIGN RULES

DISSERTATION REMIGIUS NIEKRAWIETZ INTRODUCTION
microchannel in the silicon wafer, which allows for independent filling with differentsamples. The 50 µm wide channels in the printhead have two functions: firstly drawingthe liquids by capillary forces to the nozzles and secondly to perform the format changeof the 4.5 mm reservoir pitch to the 500 µm nozzle pitch. This inherent format changeis another advantage compared to the pin and piezo tip printers. At the bottom of thesilicon layer another pyrex layer with a square opening for the nozzle outlets is fixedto close the capillary channels from below. The glass layers are structured by high pre-cision ultrasonic drilling and are bonded to the silicon wafer by anodic bonding, so thata covalent bond between glass and silicon is achieved. The nozzles are arranged in a6 x 4 (24 channel printhead) or 24 x 4 (96 channel printhead) grid with a pitch of500 µm [50]. A 384 channel printhead (24 x 16) with a pitch of 1 mm has also beenrealized before [46]. Due to the minimum dead-volume of the printhead, the loss of ex-pensive sample is almost zero (max. 0.4 µl). A main difference to other non-contactprinting methods is, that instead of the use of multiple actuator units, which have to becalibrated to each other, only one actuator for all nozzles is used. That means, that allnozzles are ejected at the same time and print up to 384 different liquids simultaneous-ly.
1.2.3.1 OPERATION PRINCIPLE OF THE TOPSPOT DISPENSER
To operate a TopSpot printhead the dispensing liquids are filled into the reservoirs ofthe printhead manually by a pipette or automatically with a pipetting robot (Fig. 1-13).The minimum required sample volume is only 1 µl for each reservoir. Due to the max-
Figure 1-12: TopSpot printheads: a.) Top and bottom view of a 24 channel printhead with a reservoirpitch of 4.5mm and nozzle pitch of 500µm [48] b.) 96 channel printhead with a reservoir pitch of2.25mm and a nozzle pitch of 500µm [49] c.) 384 channel printhead with a reservoir pitch of 2.25mmand a nozzle pitch of 1mm [46] d.) SEM picture of the actuation chamber with nozzles and correspond-ing supplying microchannel e.) & f.) Top and bottom detail screen of the dispensing nozzle g.) Close-up view of nozzle array from the bottom
a) b) c)
d) e)
f)
g)
TOPSPOT: HIGHLY PARALLEL NANOLITER DISPENSING - OPERATING CONDITIONS AND DESIGN RULES - 15 -

INTRODUCTION DISSERTATION REMIGIUS NIEKRAWIETZ
imum filling capacity (6 µl) of the reservoirs and the low spotted droplet volume(~1 nl) the dispenser is able to print over 5000 cycles without reloading. The geometryand hydrophilic surfaces of the microchannels transport the sample by capillary forcesinto the nozzles. After filling the printhead is ready for actuation, which takes place ina so called print module. A piezo stack actuator (max. stroke 80 µm) is used for theactuation of the printhead [D1]. The piezo stack drives the piston, which is placed ap-proximately 150 µm above the nozzle array, into the actuation chamber of the print-head. The pneumatic actuation is not done by a valve based principle, which wouldrequire an external pressure source and has some other disadvantages. The piston basedprinciple generates the pressure directly at the point of action. The piston compressesthe initial air volume in the actuation chamber. The generated pressure pulse affects allnozzles simultaneously. The pressure energy is coupled into the liquid and small drop-lets are accelerated in parallel out of the printhead. A droplet ejection occurs, if thepressure energy overcomes the friction, representing all viscous and geometrical pres-sure losses, plus the energy required to create the surface of a spherical droplet plus thekinetic energy of the resulting free flying droplet. For the ejection of the small dropletsout of the printhead nozzles a very fast generation of the pressure pulse is needed. Thehigh resonance frequency (12 kHz) of the used piezo actuator enables the required fastdeflection time of the piston [51]. Due to the low droplet volume and the nozzle capac-ity of ~16 nl, the nozzle is not empty after the dispensing process (see Fig. 1-13b). Re-filling of the dispensed liquid takes place by capillary forces of the microchannels,
Figure 1-13: Comparison of the TopSpot technologies: a.) Schematic cross-section of main parts ofthe dispenser and the printhead b.) Detail view of a standard TopSpot nozzle c.) Working principle ofthe dispenser: (1) Filling of the printhead reservoirs (left, right) Elastomer and piston is placed intothe printhead before filling (right) (2) Placing of piston into printhead, defines a certain actuationchamber above the nozzles (left), air in actuation chamber is replaced by an elastomer (right)(3) Pneumatic actuation by piston movement (left), printing by direct liquid displacement (right)(4) Retraction of the piston and refilling by capillary forces
a) b)
c)
- 16 - TOPSPOT: HIGHLY PARALLEL NANOLITER DISPENSING - OPERATING CONDITIONS AND DESIGN RULES

DISSERTATION REMIGIUS NIEKRAWIETZ INTRODUCTION
which are connected to the reservoirs on the upper side of the printhead. The size ofthe ejected droplets can be influenced by using different nozzle sizes and designs. AnO-ring below the piston enables a mechanical coupling between the piezo actuator andpiston during the displacement process and retracts the piston to its initial position. Af-ter ejection of droplets, equilibration of the pressure within the actuation chamber isneeded. Hence, a small vent hole of 80 µm diameter is integrated into the piston or theprinthead. Additionally, compared to the fast actuation of the piezo actuator (50 µs-200 µs for a stroke of up to 80 µm) it retracts very slow (1 ms-10 ms). To achieve ahomogenous ejection of the droplets, the nozzle array on the bottom side of the print-head is coated after the fabrication process with a hydrophobic silane [52,53].
TOPSPOTVARIO: Further improvements of the described actuation technique were achieved by the de-velopment of the TopSpot Vario technology, which is based on the TopSpot technologyand described in the thesis of C.P. Steinert [43]. The actuation mechanism in this casewas changed from the indirect transfer of pressure energy into the liquid by the pneu-matic actuation principle to a direct liquid displacement principle. This was achievedby filling the air chamber with an elastomer [54]. The elastomer acts as an incompress-ible fluid, which is deformed during actuation into the displacement chambers initiat-ing droplet ejection out of the nozzles (see Fig. 1-13). Due to the direct displacementmethod the required piezo stroke for droplet ejection can be reduced from 80 µm to afew micrometers. The amount of elastomer displaced into the displacement chambers,defines the volume of the ejected droplets and is easily controlled by the piezo stroke.A linear relationship between the piezo stroke and droplet volume was found. By tun-ing the piezo stroke between 1 µm and 11 µm the droplet volume can be adjusted be-tween 100 pl and 720 pl [55], [56]. Additionally, the microchannels and nozzles aresealed by the elastomer, so that cross-contamination within the printhead is excludedreliably. During filling, the displacement chambers behave like blind channels becausethe nozzles usually acting as air outflow channels are filled with liquid before the entireair can escape. To solve this problem of bubble trapping, a new principle for bubblefree priming of blind channels was needed, which resulted in a complex printhead de-sign. Further, the preparation procedure is very extensive before a printing process canstart. Compared to the standard TopSpot technology the TopSpot Vario system hasbeen only validated for a 24 channel printhead and for now only a laboratory prototypeis available.
1.2.3.2 TOPSPOT MICROARRAYER
On the basis of the print module three automation levels of TopSpot printing devicesfor the production of custom made low to medium density microarrays were developedas seen in Fig. 1-14. The modular concept enables the user to operate with severalprintheads, which are filled with different printing media in one sequenced procedure.Only the automation environment limits the number of simultaneously used print-heads. The TopSpot/E personal microarrayer has one print module and consequently the low-est level of automation (Fig. 1-14b-c) [56]. The print module can use multiple print-heads during one print run on the slide, moved by an automated xy-axis system. When
TOPSPOT: HIGHLY PARALLEL NANOLITER DISPENSING - OPERATING CONDITIONS AND DESIGN RULES - 17 -

INTRODUCTION DISSERTATION REMIGIUS NIEKRAWIETZ
the system is done with the current printhead and requires the next one to proceed theprocess, it prompts the user to change the printhead accordingly. A graphical user in-terface enables easy usage and fast microarray layout design. It was designed for smalllaboratories especially for array development.The TopSpot Modular Arrayer (TopSpot/M) is a medium size machine, which consistsof a higher degree of automation (Fig. 1-14d). The system can operate in parallel withup to five print modules, which allows to use five printheads simultaneously. A slidetray on a mobile axis system is used for printing up to 40 microarray substrates in oneprocedure. The integrated image processing system enables an online quality controlof the print process. TopSpot/M enables a throughput of nearly 300 slides per hour,each containing 480 different features, when using printheads with 96 nozzles.The highest automation level was developed in the TopSpot Production Line (TopSpot/P), which enables microarray fabrication with up to 15 print modules spotting 1,440different reagents at a throughput of 300 biochips per hour (see Fig. 1-14e). The slidesare carried by an assembly line through the six modules of the machine. The first mod-
Figure 1-14: TopSpot microarrayer: a.) TopSpot print module, which forms the heart of a TopSpotarrayer b.) TopSpot/E personal microarrayer arrayer uses one print module to print on one slidemoved by an automated xy-axis system. c.) An open TopSpot/E enables an insight into the device,which consists of the piezo electronic, the print module and the axis system. d.) The TopSpot ModularArrayer (TopSpot/M) is able to use up to five print modules, which can be equipped with five print-heads to print 40 slides on a moved tray. e.) The TopSpot Production Line (TopSpot/P) can handle upto 15 print modules in parallel. An assembly line carries the slides through the six processing modules.The camera based quality control ensures, that only slides with 100 % spot presence leave themachine.
a) b) c)
d) e)
- 18 - TOPSPOT: HIGHLY PARALLEL NANOLITER DISPENSING - OPERATING CONDITIONS AND DESIGN RULES
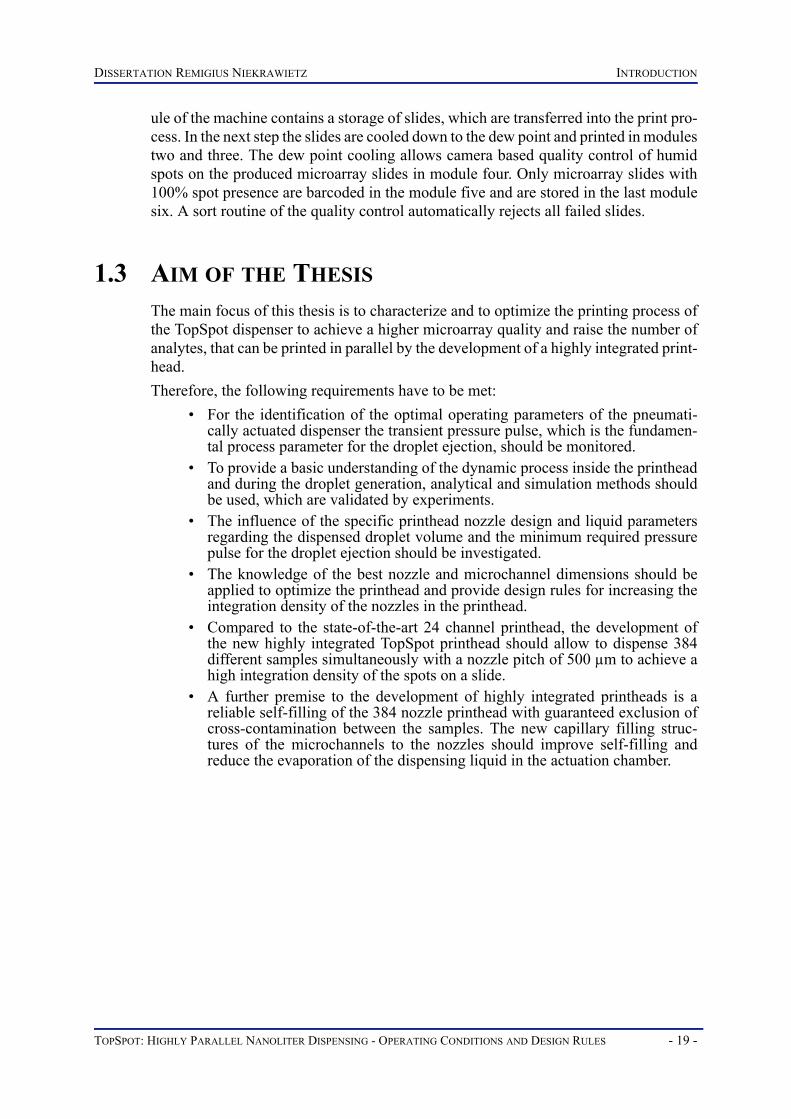
DISSERTATION REMIGIUS NIEKRAWIETZ INTRODUCTION
ule of the machine contains a storage of slides, which are transferred into the print pro-cess. In the next step the slides are cooled down to the dew point and printed in modulestwo and three. The dew point cooling allows camera based quality control of humidspots on the produced microarray slides in module four. Only microarray slides with100% spot presence are barcoded in the module five and are stored in the last modulesix. A sort routine of the quality control automatically rejects all failed slides.
1.3 AIM OF THE THESISThe main focus of this thesis is to characterize and to optimize the printing process ofthe TopSpot dispenser to achieve a higher microarray quality and raise the number ofanalytes, that can be printed in parallel by the development of a highly integrated print-head.Therefore, the following requirements have to be met:
• For the identification of the optimal operating parameters of the pneumati-cally actuated dispenser the transient pressure pulse, which is the fundamen-tal process parameter for the droplet ejection, should be monitored.
• To provide a basic understanding of the dynamic process inside the printheadand during the droplet generation, analytical and simulation methods shouldbe used, which are validated by experiments.
• The influence of the specific printhead nozzle design and liquid parametersregarding the dispensed droplet volume and the minimum required pressurepulse for the droplet ejection should be investigated.
• The knowledge of the best nozzle and microchannel dimensions should beapplied to optimize the printhead and provide design rules for increasing theintegration density of the nozzles in the printhead.
• Compared to the state-of-the-art 24 channel printhead, the development ofthe new highly integrated TopSpot printhead should allow to dispense 384different samples simultaneously with a nozzle pitch of 500 µm to achieve ahigh integration density of the spots on a slide.
• A further premise to the development of highly integrated printheads is areliable self-filling of the 384 nozzle printhead with guaranteed exclusion ofcross-contamination between the samples. The new capillary filling struc-tures of the microchannels to the nozzles should improve self-filling andreduce the evaporation of the dispensing liquid in the actuation chamber.
TOPSPOT: HIGHLY PARALLEL NANOLITER DISPENSING - OPERATING CONDITIONS AND DESIGN RULES - 19 -

FUNDAMENTALS DISSERTATION REMIGIUS NIEKRAWIETZ
FUNDAMENTALS
The chapter of the fundamentals provides the theoretical background required for theunderstanding of the TopSpot printing technology. First of all, the main equations forthe fluid flow, the Navier-Stokes and the continuity equation, are presented. The fol-lowing Young-Laplace equation describes the capillary pressure due to surface forces,which drives and influences processes like the capillary filling, droplet tear-off and thedroplet impact. Based on these equations analytical solutions for selected boundaryconditions like fluidic resistance, inertance, capillary rise of liquids and junction ef-fects are derived. To establish a further understanding of the droplet ejection processan analytical model of the generated pressure pulse is presented. Finally, importantcharacteristic numbers for the fluid flow at micro dimensions of the droplet formationand droplet impact are introduced.
2.1 NAVIER-STOKES EQUATION
The Navier-Stokes equations are the fundamental partial differentials equationsdescribing fluid flow. Using the Navier-Stokes equations signifies to consider the fluidas a continuum and indefinitely divisible. The equations ignore the molecular nature ofgases and liquids and regard the fluid as continuous medium. It describes fluiddynamics in terms of the spatial and temporal variation of density, velocity, pressure,temperature and other macroscopic flow quantities. Applied to the droplet ejectionprocess of the TopSpot dispenser considered in this work, the continuum model shouldlead to accurate predictions, since the system is huge compared to the size of thecomprised molecules. The Navier-Stokes equation is valid for stationary and also fortransient problems. For an incompressible Newtonian fluid with constant viscosity ηand constant density ρ under isothermal conditions (T = constant) the three vectorcomponents of the Navier-Stokes equation can be written in a cartesian coordinate(x, y, z) system [58]:x component
y component
(2.1)
(2.2)
ρ∂vx∂t
-------- vx ∂vx∂x-------- + vy
∂vx∂y-------- + vz
∂vx∂z--------+⎝ ⎠
⎛ ⎞ = ∂p∂x------ + η
∂2vx
∂x2-----------
∂2vx
∂y2-----------
∂2vx
∂z2-----------+ +
⎝ ⎠⎜ ⎟⎛ ⎞
+ ρfbody,x–
ρ∂vy∂t
-------- vx ∂vy∂x-------- + vy
∂vy∂y-------- + vz
∂vy∂z--------+⎝ ⎠
⎛ ⎞ = ∂p∂y------ + η
∂2vy
∂x2-----------
∂2vy
∂y2-----------
∂2vy
∂z2-----------+ +
⎝ ⎠⎜ ⎟⎛ ⎞
+ ρfbody,y–
- 20 - TOPSPOT: HIGHLY PARALLEL NANOLITER DISPENSING - OPERATING CONDITIONS AND DESIGN RULES

DISSERTATION REMIGIUS NIEKRAWIETZ FUNDAMENTALS
z component
which can also be written in vector notation:
These five terms can be interpreted as follows:• is the transient term.
The partial time derivative considers the momentum change due to thechange in velocity of a continuum element observed at a fixed position.
• is the convective term.It embodies the acceleration of a fluid element experienced while moving toa region of deviating velocity during the time dt. If this part is missing, theremaining equation is called the "diffusion equation".
• is the viscosity term.It reflects the inner friction of the fluid. In this form it is only valid for New-tonian fluids where the viscosity is proportional to the shear rate. If this partis omitted, the remaining equation is called "equation of convection" or"Euler equation".
• describes the body force term.It represents the forces acting on a fluid element, for example gravity, cen-trifugal, Coriolis, or electromagnetic forces. If the body force is caused onlyby gravity it is neglectable in systems with dimensions in the micro scale.
• is the pressure gradient. It represents the pressure force density in anti parallel direction to the pres-sure gradient in the direction of declining pressure.
• Both terms and together are called source terms, resulting fromforce impact.
The convection term makes the Navier-Stokes equation a nonlinear secondorder differential equation, that can only be solved analytically for simple cases. Inmost cases, they have to be simplified to obtain a solution for the specific problem.Another approach to solve the equations for specific systems is to use numericaltechniques utilized in Computational Fluid Dynamics (CFD), which are used forsimulations of fluidic systems in common.For the analytical consideration of droplet ejection the notation of the Navier-Stokesequation in a cylindrical coordinate system (r, z, θ) is generally more appropriate. ForNewtonian fluids under isothermal conditions it yields [59]:radial component r
(2.3)
(2.4)
(2.5)
ρ∂vz∂t
-------- vx ∂vz∂x-------- + vy
∂vz∂y-------- + vz
∂vz∂z--------+⎝ ⎠
⎛ ⎞ = ∂p∂z------ + η
∂2vz
∂x2----------
∂2vz
∂y2----------
∂2vz
∂z2----------+ +
⎝ ⎠⎜ ⎟⎛ ⎞
+ ρfbody,z–
ρ ∂v∂t----- v ∇⋅( )v+ ∇p– η∇2v ρfbody+ +=⋅
∂v ∂t⁄
v ∇⋅( )v
η∇2v
ρ fbody
∇p–
∇pρ fbody ∇p–
v ∇⋅( )v
ρ∂vr∂t------- vr
∂vr∂r-------
vθ2
r----- + vz
∂vr∂z-------–+
⎝ ⎠⎜ ⎟⎛ ⎞
= ∂p∂r------ + η ∂
∂r----- 1
r--- ∂
∂r----- r vr( ) +
∂2vr
∂z2----------
⎝ ⎠⎜ ⎟⎛ ⎞
–
TOPSPOT: HIGHLY PARALLEL NANOLITER DISPENSING - OPERATING CONDITIONS AND DESIGN RULES - 21 -

FUNDAMENTALS DISSERTATION REMIGIUS NIEKRAWIETZ
height component z
azimuthal component θ
Implicit in writing the Navier-Stokes equations in these forms is the assumption, thatthe viscosity μ is constant. If additionally an axisymmetric behavior along the z axis can be assumed - which isjustified in most considered cases - the azimuthal component θ can be neglected. Thisfurther simplifies the above presented Navier-Stokes equation in a cylindricalcoordinate system (r, z, θ) for Newtonian fluids under isothermal conditions [60-64].
2.2 CONTINUITY EQUATION
The continuity equation describes the mass conservation inside a volume element. Thein streaming mass and the out streaming mass are balanced [65]:
For an incompressible fluid with a constant density ρ:
or in more compact vector notation:
This can also be written in a cylindrical coordinate system (r, z, θ) for Newtonian flu-ids under isothermal conditions. This is the more important notation, if an axisymmet-ric behavior of a droplet ejection is considered [59]:
(2.6)
(2.7)
ρ∂vz∂t
-------- vr ∂vz∂r-------- + vz
∂vz∂z--------+⎝ ⎠
⎛ ⎞ = ∂p∂z------ + η 1
r--- ∂
∂r----- r
∂vz∂r-------- +
∂2vz
∂z2----------
⎝ ⎠⎜ ⎟⎛ ⎞
+ ρfbody,z–
ρ∂vθ
∂t-------- ur
∂vθ
∂r--------
vrvθ
r--------- + vz
∂vθ
∂z--------+ +⎝ ⎠
⎛ ⎞ = η ∂∂r----- 1
r--- ∂
∂r----- r vθ( ) +
∂2vθ
∂z2-----------
⎝ ⎠⎜ ⎟⎛ ⎞
(2.8)
(2.9)
(2.10)
(2.11)
∂ρ∂t------
∂ ρvx( )∂x
----------------∂ ρvy( )
∂y----------------
∂ ρvz( )∂z
----------------+ + + 0=
∂vx∂x--------
∂vy∂y--------
∂vz∂z--------+ + 0=
div v 0=
∂vz∂z-------- + 1r
--- ∂ r vr( )
∂r----------------- = 0
- 22 - TOPSPOT: HIGHLY PARALLEL NANOLITER DISPENSING - OPERATING CONDITIONS AND DESIGN RULES

DISSERTATION REMIGIUS NIEKRAWIETZ FUNDAMENTALS
2.3 YOUNG-LAPLACE EQUATION
The Young-Laplace equation describes the capillary pressure generated by a curvedsurface across the interface between two fluids. This pressure is of increasing impor-tance when scaling down the system into micro dimensions like in microfluidic sys-tems. On a plain interface no vertical pressure relative to the surface occurs since allsurface tension forces only act planar and do not have orthogonal components. Atcurved interfaces like at menisci or droplets on a surface, a normal force vertical to thecurved interface occurs. This force causes an interfacial pressure, the so called capil-lary pressure [66-69].Considering a curved interface element with the length of the edges ds1 and ds2, thecurvature angles ϑ1 and ϑ2 and with both curvature radii R1 and R2 as displayed in Fig.2.1 where R1 and R2 are the mean curvature radii, i.e. the minimum and maximumradius of the curved interface element [70]. Usually, the minimum and maximum
radius of the curved interface element are perpendicular. In the special case of anejected jet the maximum radius corresponds to the curvature of the jet along itstrajectory whereas the minimum radius is the radius of the jet cross-section itself.Knowing this, the following equilibrium approach between the capillary pressureΔpcap and the surface tension σ with the normal force to the surface dFn can be derived:
Figure 2.1: Sketch for the derivation of the capillary pressure. With the normal force to the surfacedFn, the surface tension σ, the curvature angles ϑ1 and ϑ2, the curvature radii R1 and R2, and the arclengths ds1 and ds2 [66,71].
(2.12)dFn Δpcap ds1 ds2⋅ ⋅= σ= ds2 ϑ1 σ ds1 ϑ2⋅ ⋅+⋅ ⋅
TOPSPOT: HIGHLY PARALLEL NANOLITER DISPENSING - OPERATING CONDITIONS AND DESIGN RULES - 23 -

FUNDAMENTALS DISSERTATION REMIGIUS NIEKRAWIETZ
and with the both curvature angles and :
According to this the capillary pressure Δpcap of a spherical droplet with radius R is:
Considering a liquid droplet on a solid surface surrounded by gas three surface tensionsare dominating. σgs is the surface tension between gas and solid phase, σls is the sur-face tension between liquid and solid phase and σlg is the surface tension between liq-uid and gas phase. The liquid surface forms a contact angle Θ with the solid. Thesurface tension indicates an equilibrium at the contact point of the three phases, whichcan be seen in Fig. 2.2a and can be expressed as [66]:
Accordingly, two different domains can be distinguished as shown in Fig. 2.2:• σgs < σls, non-wetting (hydrophobic) surface, contact angle Θ > 90°
• σgs > σls, wetting (hydrophilic) surface, contact angle Θ < 90°.
(2.13)
(2.14)
(2.15)
(2.16)
(2.17)
Figure 2.2: Wetting behavior of liquids: a.) The forces between the phases equilibrate at the three-phase point and thus define the contact angle b.) non wetting liquids c.) wetting liquids
ϑ1ds1R1--------= ϑ2
ds2R2--------=
Δpcap ds1 ds2 σ ds2ds1R1-------- σ ds1
ds2R2--------⋅ ⋅+⋅ ⋅=⋅ ⋅
Δpcap→ σ 1R1------ 1
R2------+⎝ ⎠
⎛ ⎞⋅=
Δpcap2 σ⋅
R-----------=
σgs σls– σlg Θcos⋅=
Θcos→σgs σls–
σlg--------------------=
a) b) c)
- 24 - TOPSPOT: HIGHLY PARALLEL NANOLITER DISPENSING - OPERATING CONDITIONS AND DESIGN RULES

DISSERTATION REMIGIUS NIEKRAWIETZ FUNDAMENTALS
2.4 ANALYTICAL SOLUTIONS FOR SELECTED BOUNDARY CONDITIONS
To provide a general estimation, which boundary conditions are necessary to fill a noz-zle by capillary force, to generate the pressure pulse for the droplet ejection and toachieve a stable droplet tear-off the following approximative solutions can be applied.This implies a fundamental understanding of the fluid behavior and which parameterslike geometry variations, different liquid properties acting on the fluid dynamic.
2.4.1 ANALYTICAL EQUIVALENTS TO ELECTRONICS
It is a common technique to describe fluidic systems by their analogy to electronic cir-cuits [72]. Therefore the fluidic system is split up into its components and modeled asa network of discrete devices representing the components. One possible approxima-tion is to model a fluidic channel as a combination of a resistor, a capacity and an in-ductance. Using Kirchhoff’s laws (node- and mesh-rule), the transfer function of thesystem can be obtained and be solved analytically or numerically with software avail-able for electric networks like Spice or Saber [73-76]. The most common analogies be-tween the fluidic and the electric domain are shown in Table 2.1.
Table 2.1: Analogies between fluidic and electric systems.
Fluidic ElectricDenotation Definition Unit Denotation Definition Unit
Pressure Voltage
Flow Current
Resistance Resistance
Capacity Capacity
Inductivity Inductivity
p FA---=
Nm2------ Pa= Uel
F d⋅q
-----------= NmC
-------- V=
ΦvdVdt-------= m3
s------ Iel
dqdt------= C
s---- A=
Rflp
Φv-------= Pas
m3--------- Rel
UelIel--------= V
A--- Ω=
dV Chd dp⋅= m3
Pa------- dq Cel dUel⋅= As
V------ F=
dp LhddΦvdt
----------⋅=Pas2
m3------------ Uind L– el
dIeldt
---------⋅=VsA------ H=
TOPSPOT: HIGHLY PARALLEL NANOLITER DISPENSING - OPERATING CONDITIONS AND DESIGN RULES - 25 -

FUNDAMENTALS DISSERTATION REMIGIUS NIEKRAWIETZ
2.4.2 FLUIDIC RESISTANCE
A pressure driven stationary flow of a Newtonian fluid under isothermal conditionsthrough a cylindrical tube with radius R and length x leads to a parabolic flow profiledepending on the radius r. This cylindrical symmetric velocity profile v(r) can be ob-tained through a simplification of the Navier-Stokes equations by equating the pressureforce Fp with the viscous force Fη [67]:
The volume flow Φv through this tube with parabolic velocity profile can be obtainedby integration of v(r) over the radius of the tube R. The result is known as the Hagen-Poiseuille law.
Thus a fluidic equivalent to Ohm’s law can be deduced from Eq. (2.20).
As this formula is only valid for cylindrical tubes, a transformation can be performedto describe arbitrary cross-sections empirically. This transformation maps any givengeometry into an equivalent cylindrical cross-section. The general equation for the flu-idic resistance can be written as:
where Cgeom is a geometry coefficient, which summarizes the influence of the shapeof the cross-section and A is the area of the cross-section. For a fluidic resistance ofcircular capillaries the correction factor of Cgeom is 8π. In the case of rectangular cap-illaries the correction factor Cgeom is more complicated. The variable c in Eq. (2.23)represents the quotient of channel height h and channel width w [78].
(2.18)
(2.19)
(2.20)
(2.21)
(2.22)
(2.23)
v r( ) pΔ4 x η⋅ ⋅------------------ R2 r2–( )⋅=
ΦvVdtd
------ v r( ) 2πr t d π pΔ⋅2 η x⋅ ⋅------------------ R2r rd r3 rd
0
R
∫–0
R
∫⎝ ⎠⎜ ⎟⎜ ⎟⎛ ⎞
=0
R
∫= =
Φv→ π8η------ pΔ
x------ R⋅ 4⋅=
Rfl→ pΔΦv------- 8 η x⋅ ⋅
π R4⋅------------------= =
Rfl Cgeomη x⋅
A2----------⋅=
Cgeom2
c cαi
5-------
αic-----
αic-----tanh–⎝ ⎠
⎛ ⎞⋅i 1=
∞
∑⎝ ⎠⎜ ⎟⎛ ⎞
⋅
---------------------------------------------------------------------------= αiπ 2 i 1–⋅( )⋅
2------------------------------=
- 26 - TOPSPOT: HIGHLY PARALLEL NANOLITER DISPENSING - OPERATING CONDITIONS AND DESIGN RULES

DISSERTATION REMIGIUS NIEKRAWIETZ FUNDAMENTALS
The row of the correction factor Cgeom of rectangular capillaries can be approximated to [58]:
For an open rectangular channel the geometry coefficient can be written as [79]:
The TopSpot printhead consists of many microchannels. For liquid transport the fluidicresistance has to be considered for the performance and design of the microchannels.In Fig. 2.3a we can see the calculated fluidic resistance of three different microchanneldesigns with a length of 10 mm. An increasing cross-section of the microchannels re-duces the fluidic resistance as expected. In this configuration the rectangular channelhas the highest fluidic resistance. The open rectangular channel and the circular chan-nel with an equivalent cross-section are following. If the channel width of about 50 µmis reached, the free surface of the open rectangular channel gets a higher impact andthe fluidic resistance of the circular channel will be higher (see Fig. 2.3b).
2.4.3 CAPILLARY FILLING OF LIQUIDS
The capillary transport of low amounts of liquids using microfluidic systems hasopened avenues for higher throughput and parallelization of miniaturized bio/chemicalprocesses. Understanding the capillary filling process is important, especially for theTopSpot printhead design. Different geometries of liquid flow pathways may result indifferent capillary filling behavior such as filling time, possibility of entrapping an airbubble, etc. Knowledge of the filling process can guide the designer in arranging theinternal structure of the printhead to avoid potential filling problems and to achievehigh filling velocity [80].Capillary rise is the term, which is often used for the spontaneous penetration of a liq-uid into microfluidic devices under the action of surface tension. It occurs when the ad-hesive intermolecular forces between the liquid and a solid are stronger than the
(2.24)
(2.25)
Figure 2.3: The ratio of the fluidic resistance in comparison to geometrical form of the capillary chan-nel a.) Fluidic resistance for microchannel width up to 40 µm b.) Fluidic resistance for microchannelwidth between 40 and 200 µm
Cgeom 8 1 c+( )2
c-------------------⋅ 8 h w+( )2
h w⋅--------------------⋅= =
Cgeom 2 2 h⋅ w+( )2
h w⋅----------------------------⋅=
a) b)
TOPSPOT: HIGHLY PARALLEL NANOLITER DISPENSING - OPERATING CONDITIONS AND DESIGN RULES - 27 -

FUNDAMENTALS DISSERTATION REMIGIUS NIEKRAWIETZ
cohesive intermolecular forces within the liquid. The surface tension forms a concavemeniscus where the liquid is in contact with a vertical surface. The driving force for„wicking“ is the capillary pressure difference Δpcap, which is well approximated by us-ing the Young-Laplace equation. The most studied wicking situation considers theflow into a long straight capillary (see Fig. 2.4a) [59],[82]. But only in a few symmetric cases the shape of the liquid surface can be approximatedby spherical caps like for the straight capillary case. This situation requires, that an axiscan be found, which has a distance from all faces i. However, the curvatureof the fluid surface and therefore the capillary pressure can be calculated without ex-plicitly calculating the surface shape [83]. Considering the energy principle the capil-lary pressure in a capillary with a constant cross-section can be traced back to theperimeter U and the cross-section area A [84], the ratio of which is called hydraulic di-ameter.
According to this the capillary pressure Δpcap of a material with different lateral sur-faces can be defined as:
In this case Li is the width of the lateral surface i with the contact angle of Θi.
(2.26)
(2.27)
Figure 2.4: .Capillary rise inside a spherical tube, rectangular channel and in an open rectangularchannel. a.) In a spherical tube the meniscus is a section of the sphere of radius Rs, which is related tothe capillary radius R and the contact angle Θ. b-c) If a corner formed from two solid plates, as shownin rectangular and open rectangular channel, is put in contact with wetting liquid, a meniscus gener-ally rises towards the corner.
R Θicos⋅
Δpcap σ Θcos UA----⋅ ⋅=
Δpcap σLi
i∑ Θicos⋅
A----------------------------------⋅=
a) b) c)
- 28 - TOPSPOT: HIGHLY PARALLEL NANOLITER DISPENSING - OPERATING CONDITIONS AND DESIGN RULES

DISSERTATION REMIGIUS NIEKRAWIETZ FUNDAMENTALS
Correspondingly, for uniformly coated lateral surfaces, the capillary pressure of threedifferent microchannel designs as seen in Fig. 2.4 can be determined to be:
• Capillary pressure in a spherical tube:
• Capillary pressure in a rectangular channel:
• Capillary pressure in an open rectangular channel:
Fig. 2.5 shows the calculated capillary pressure of the three microchannels against thechannel width. The rectangular microchannel has the best performance in terms of cap-illary pressure.
If we assume, that the liquid is Newtonian and the flow is very slow, at low Reynoldsnumbers, then we may write the average velocity of capillary filling in the sphericaltube using Eq. (2.20) and Eq. (2.28) as:
Similarly, this assumption leads for a rectangular microchannel to
(2.28)
(2.29)
(2.30)
Figure 2.5: The ratio of the capillary pressure inside a spherical tube, rectangular channel and in anopen rectangular channel.
(2.31)
(2.32)
Δpcap→ 2 σ⋅R
----------- Θcos⋅=
Δpcap→ 2 σ Θcos 1w---- 1
h---+⎝ ⎠
⎛ ⎞⋅ ⋅ ⋅=
Δpcap→ σ Θcos 2w---- 1
h---+⎝ ⎠
⎛ ⎞⋅ ⋅=
v
vΦvA
------- dVA dt⋅-------------= dx
dt------ σ Θcos R⋅ ⋅
4 η x⋅ ⋅-------------------------------===
v dxdt------= σ Θcos⋅
4 η x⋅ ⋅----------------------- w h⋅
w h+-------------⋅=
TOPSPOT: HIGHLY PARALLEL NANOLITER DISPENSING - OPERATING CONDITIONS AND DESIGN RULES - 29 -

FUNDAMENTALS DISSERTATION REMIGIUS NIEKRAWIETZ
and for the open rectangular microchannel to the following equation:
We assume, that length x is the only portion of the capillary which gets wetted. Sincethe velocity v is just dx/dt, we are led to a differential equation. If the contact angle isregarded as a constant, independent of the velocity we can solve the dynamic equationfor the capillary rise analytically. The solution is also known as the Washburn equation[85]. Fig. 2.6 shows the behavior according the solution. As expected, themicrochannel with a wider cross-section shows the fastest capillary filling time of theliquid. The TopSpot printheads consists of many microchannels to deliver the liquidfrom the reservoirs to the nozzles. So the microchannel width should only be reducedif it is really necessary. With highly integrated printheads, for example, logisticproblems can arise because of the limited space and the high nozzle density. Thisshortage of space enforces the reduction of the channel width. But this is only a localproblem, the rest of the microchannel can and should be widened. However, reducing the cross-section of the microchannels leads to a change of thefilling behavior of a spherical channel compared to an open rectangular channel. Belowa channel width of 50 µm the spherical channel shows the best filling performance.The results further show, that the cross-section design of the microchannel is notcritical for the filling of the printhead because the differences of the filling time are inthe range of milliseconds. On the other hand the total length x can become important.A microchannel width with 24 µm and 20 cm length would result in a filling time of1 minute before the printhead could be used for the dispensing process.
2.4.4 REFILLING (DISPENSING FREQUENCY)
After the dispensing process of the printhead the nozzles have to be refilled. The min-imal refilling time of the nozzles defines the maximum dispensing frequency of theprinting device. The maximum frequency can be estimated by assuming, that the vol-ume (dV), that is shot out of the nozzle, needs to be refilled only by capillary forces
(2.33)
Figure 2.6: Comparison of the capillary filling in a spherical tube, a rectangular channel and in anopen rectangular channel. a.) At a channel width of 24 µm, the spherical tube shows the best fillingperformance. b.) However, at a channel width of 50 µm the open rectangular channel has a faster fill-ing rate.
v dxdt------= σ Θcos⋅
2 η x⋅ ⋅----------------------- w h⋅
2 h⋅ w+--------------------⋅=
a) b)
- 30 - TOPSPOT: HIGHLY PARALLEL NANOLITER DISPENSING - OPERATING CONDITIONS AND DESIGN RULES

DISSERTATION REMIGIUS NIEKRAWIETZ FUNDAMENTALS
pcap as described before. The refilling has to work against the fluidic resistance of themicrochannel Rfl, a net flow Φv is generated. The following equation assumes, that thevolume that needs to be refilled, is very small compared to the volume inside the mi-crochannels, so that the capillary pressure and the capillary resistance can be consid-ered constant:
Due to the low dispensed droplet volume of 1 nl the nozzle is not completely emptyand only the upper part of the nozzle expansion has to be refilled (see Fig. 2.7). Rewrit-ing the fluidic resistance of the nozzle expansion and the rectangular microchannels asa function of the viscosity and the geometrical shape leads to:
For a standard printhead with a maximum microchannel length of 29 mm, a cross-section of 100 µm to 50 µm and a dispensing volume of 1 nl this results in a theoreticalmaximum dispensing frequency of 21 Hz with water. This calculated printingfrequency even exceeds the needed requirements for the production of microarrays.
2.4.5 JUNCTION EFFECTS
Due to the characteristics of the silicon micromachining by DRIE, there are two differ-ent possible junction appearances in the TopSpot printhead. The contraction and theexpansion of a fluidic flow as displayed in Fig. 2.8. Both, contraction as well as expan-
(2.34)
(2.35)
Figure 2.7: Schematic cross-section of the filling structure of the printhead and their correspondingfluidic resistances.
VΔ Φv dt⋅pcapRfl--------- dt⋅= =
dt→Rfl VΔ⋅
pcap------------------
η4 l⋅ nz,ex
πDnz,ex
2--------------⎝ ⎠
⎛ ⎞4
⋅
------------------------------ 4 h w+( )⋅ 2
h w⋅( )3---------------------------- lch
2 h⋅ w+( )2
h w⋅( )3---------------------------- loch⋅+⋅+
⎝ ⎠⎜ ⎟⎜ ⎟⎜ ⎟⎛ ⎞
VΔ⋅ ⋅
2 σ⋅Dnz,ex-------------- Θcos⋅
------------------------------------------------------------------------------------------------------------------------------------------------------= =
Dnz,ex : 300 µm[Nozzle expansion diameter]Dnz : 50 µm[Nozzle diameter]lnz,ex : 230 µm[Nozzle expansion length] lch : 26 mm[Microchannel length]loch : 3 mm[Open microchannel length]pcap : capillary pressureΔV : volume pushed intonozzle inletVdrop : droplet volume ge-nerated at nozzle outlet
TOPSPOT: HIGHLY PARALLEL NANOLITER DISPENSING - OPERATING CONDITIONS AND DESIGN RULES - 31 -

FUNDAMENTALS DISSERTATION REMIGIUS NIEKRAWIETZ
sion, lead to an additional pressure loss. However, both pressure losses are not equal.This is the reason why such components can be used as a kind of fluidic diode or rec-tifier. Hence, the fluid flow can leave the junction in a favored direction and in the op-posite direction the flow is reduced.
CONTRACTION OF THE CROSS-SECTION: The contraction resistance of the cross-section can be derived using a simplified formof the Navier-Stokes equation (2.4), which is called Bernoulli equation. The total pres-sure on the left side of the constriction is equal to the total pressure on the right side ofthe constriction. Due to the mass conservation the resistance can be written as [72]:
with the resistance number ζ depending on the shape of the junction and the proportionof the both cross-section areas (Asmall / Alarge) going from ζ = 0 for a smoothly roundedjunction to ζ = 0.5 for an angular junction. The resistance is infinite for Asmall = 0 andzero for Asmall = Alarge [86].
EXPANSION OF THE CROSS-SECTION: The abrupt expansion of the cross-section is also known as Borda- or Carnot-push. Theresulting flow loss due to the flow release at the junction can be derived using momen-tum and energy conservation [58]. The resistance can be calculated to [72]:
Figure 2.8: Schematic drawing of the contraction and expansion of a circular channel with cross-sec-tion areas Alarge and Asmall, and velocities vlarge and vsmall, respectively.
(2.36)
(2.37)
(2.38)
RcontractionΦv ρ⋅
2 Asmall2⋅
--------------------- 1 ζAsmall
2
Alarge2
-------------–+⎝ ⎠⎜ ⎟⎛ ⎞
⋅=
ΔpcontractionΦv
2 ρ⋅
2 Asmall2⋅
--------------------- 1 ζAsmall
2
Alarge2
-------------–+⎝ ⎠⎜ ⎟⎛ ⎞
⋅=
RexpansionΦv ρ⋅
2 Asmall2⋅
--------------------- 1AsmallAlarge-------------–⎝ ⎠
⎛ ⎞2
⋅=
- 32 - TOPSPOT: HIGHLY PARALLEL NANOLITER DISPENSING - OPERATING CONDITIONS AND DESIGN RULES

DISSERTATION REMIGIUS NIEKRAWIETZ FUNDAMENTALS
For example, a contraction/expansion component with a two times bigger Alarge com-pared to Asmall, and ζ = 0.5, leads to a contraction resistance, which is five times biggerthan the corresponding expansion resistance. This means, that the flow direction to-wards the expansion direction experiences a five times smaller fluidic resistance thanin the reverse direction. However, the higher the difference between Alarge and Asmall,the smaller is the difference of the resistances.This is an important criterion of the vent nozzle design in the printhead, which has toinhibit the air flow during the pressure generation and enable the exhaust of theactuation chamber as the piston retracts.
2.4.6 FLUIDIC INERTANCE
So far only steady flows have been considered. However, many microfluidic devicesare actuated by time varying force, like the TopSpot dispenser or a microdisplacementpump. While studying these devices, often the question arises how fast the fluid adjuststo a pressure change. The physical background of a possible phase shift between theforce and the system response roots in the inertial mass of the liquid only, if anincompressible liquid is assumed (compare Eq. (2.10)). Again making assumptions of a laminar Hagen-Poiseuille velocity profile v(r) in a cir-cular tube with radius R, length l and cross-section A, driven by a pressure gradient Δp,the acceleration a(r) can be determined to be [81]:
The acceleration a is independent of the radius r, i.e. a is constant across the wholechannel. Thus the force F on an infinitesimal element of mass dm can be calculated:
The fluidic law of inertance is obtained from Eq. (2.41)
(2.39)
(2.40)
(2.41)
(2.42)
ΔpexpansionΦv
2 ρ⋅
2 Asmall2⋅
--------------------- 1AsmallAlarge-------------–⎝ ⎠
⎛ ⎞2
⋅=
a r( ) v r( )dtd
------------- Fdmd
------- Δp Ad⋅ρ l Ad⋅ ⋅---------------------- Δp
ρ l⋅--------- const.= = = = =
F A Δp⋅ mv( )dtd
--------------- ρlAv( )dtd
-------------------- ρ l Av( )dtd
--------------⋅ ⋅ ρ lΦvdtd
----------⋅ ⋅= = = = =
Lhd ρ lA---⋅=
TOPSPOT: HIGHLY PARALLEL NANOLITER DISPENSING - OPERATING CONDITIONS AND DESIGN RULES - 33 -

FUNDAMENTALS DISSERTATION REMIGIUS NIEKRAWIETZ
The fluidic inertance is a measure of the transient response of the fluid in the channelto a time-varying applied pressure gradient. Using again the electrical analogy the flu-idic inertance can be defined as the ratio of the change in pressure and the resultingchange in flow rate given by:
Considering the TopSpot printhead the question arises if the volume flow from the res-ervoir to the nozzle can be neglected during the droplet ejection processes. The supplymicrochannel from the reservoir to the nozzle (29 mm) has a higher inertance as wellas a higher fluidic resistance compared to the nozzle length (380 µm). To describe thedynamic behavior of the volume flow during the droplet ejection processes, a networkmodel was set up. The purpose of network models, also known as lumped-elementmodels, is to describe a fluidic system by an equivalent circuit model. The networkmodel of the printhead was set up in the Saber network simulator [75]. The measuredpressure pulse of Figure 2.10 was used as inlet boundary condition. The pressure pulseacts on the liquid filled (water) printhead, which consists of a rectangular supply chan-nel and a model for the nozzle described in [74], [77]. The supply channel is realizedby its fluidic resistance and inertance. The nozzle consists of fluidic resistance, iner-tance and the additional resistance due to the contraction of the cross-section. An inte-grator on both sides of the network model was used for the detection of the dispensedliquid volume and the volume flow into the reservoir.
The results presented in Figure 2.10 show a high damping of the volume flow in thesupply channels during the dispensing process. The integrated volume flow in thesupply channel (0.086 nl) is only an eighteenths in comparison to the dispensed dropletvolume at the nozzle (1.561 nl). Hence, the supply channels can be neglected in thefollowing CFD simulation model of the droplet ejection process, see chapter 4.2.1.1.
(2.43)
Figure 2.9: Network model used for approximation of the volume flow from the supply channel into theprinthead reservoir and the dispensed droplet volume out of the nozzle. For the boundary condition themeasured pressure pulse of chapter 2.4.7.1 was used.
LhdΔp
Φv td⁄d------------------ ρ l
A---⋅= =
- 34 - TOPSPOT: HIGHLY PARALLEL NANOLITER DISPENSING - OPERATING CONDITIONS AND DESIGN RULES

DISSERTATION REMIGIUS NIEKRAWIETZ FUNDAMENTALS
2.4.7 PRESSURE GENERATION IN THE ACTUATION CHAMBER
If a system behavior needs to be optimized, it is essential, that the input parameters arewell understood. This means, all relevant input parameters have to be identified andtheir influence on the whole system’s behavior has to be analyzed. The first step is tofind variables, which can be used to describe the main features of the system with therequired accuracy. For the considered case of the droplet ejection from a TopSpotprinthead the main parameter is the generated pressure in the actuation chamber. Sincethe generated pressure pulse and the gas flow out of the chamber are connected theycan not be calculated separately. The gas flow out of the actuation chamber caused byejected droplets can be neglected in this context. During the dispensing process thenozzle delivers only the sixteenth part of the whole nozzle volume, hence no additionalpaths for the gas flow exist, except the vent hole like sketched in Fig. 2.11.
Figure 2.10: Determination of the flow rates in the supply channel and nozzle using the Saber networksimulation model. The time dependent measured pressure pulse p(t) was used as input (see chapter2.4.7.1).
TOPSPOT: HIGHLY PARALLEL NANOLITER DISPENSING - OPERATING CONDITIONS AND DESIGN RULES - 35 -

FUNDAMENTALS DISSERTATION REMIGIUS NIEKRAWIETZ
An analytical approach was chosen for the simulation of the pressure profile in the ac-tuation chamber. However, due to the complexity of the resulting differential equationsthe usage of numerical computation methods is necessary to solve these equations.Therefore the mathematics package mathematica was used. This package combines asymbolic and numerical computation engine capable of performing complex calcula-tions reliably. Especially its ability to solve differential equations numerically is need-ed in this case. For this purpose the NDSOLVE command is used. This commandautomatically uses the most appropriate solution method out of several possible algo-rithms.Some of the simplifications made in the analytical approach require validation. This isperformed by the integration of a pressure sensor in the actuation chamber andexperimental validation as described at the end of this section.
2.4.7.1 MODEL FOR THE PRESSURE GENERATION
Since the dispensing occurs in the range of 1 ms, the gas compression can be computedadiabatically, i.e. heat transfer between the gas and the walls can be neglected. Thepressure resulting from compressing a certain volume of gas Vgas in a chamber of thevolume Vchamber can thus be easily calculated using the adiabatic Eq. (2.44) [66] andhas been also studied by Moosmann [119]. This pressure increase is relative to thepressure at the beginning, which is the normal pressure pnorm in this case. The influ-ence of the used gas type enters into the exponent χ. For an ideal gas with moleculesconsisting of two atoms this factor is 1.4. Nitrogen and air meet these requirementsclose enough.
In the context of the TopSpot dispenser the chamber volume Vchamber is defined by thepiston movement, that is controlled by the actuator and can be calculated straight for-ward from the dimensions of the actuation chamber and the piston position. The com-putation of the numerator, the gas volume inside the chamber, is somewhat morecomplex. For this computation the gas flow out of the chamber also needs to be known.
Figure 2.11: Pressure generation in the actuation chamber: The vent hole can be manufactured eitherin the piston or the silicon printhead or in both components.
(2.44)
a) b)
p t( ) pnormVgas t( )
Vchamber t( )--------------------------⎝ ⎠
⎛ ⎞χ
⋅=
- 36 - TOPSPOT: HIGHLY PARALLEL NANOLITER DISPENSING - OPERATING CONDITIONS AND DESIGN RULES

DISSERTATION REMIGIUS NIEKRAWIETZ FUNDAMENTALS
GAS FLOW OUT OF THE ACTUATION CHAMBER: The liquid flow of compressible gases can be calculated by using the energy Eq. (2.45).
In this case it means, that the sum of potential, pressure, kinetic and internal energy atboth ends of the outlet is the same. Due to the small masses m and height differences zthe potential energy Epot can be disregarded. The specific gas constant is given by thedifference of the specific heat at constant pressure cp and the specific heat at a constantvolume cv. It can be expressed by the ratio of the universal gas constant R and the molarmass Mi also [66].
The specific internal energy can be written as (Eq. (2.47)):
The expression for the specific gas constant and specific internal energy is inserted inEq. (2.45) and divided by the mass m:
During the decompression the gas cools down. Therefore the intrinsic energy can nolonger be disregarded. So the pressure energy Eq. (2.45) changes to an expression forthe specific enthalpy hs. The product of the specific heat cp and temperature T is knownas specific enthalpy:
(2.45)
(2.46)
(2.47)
(2.48)
(2.49)
Epot Epressure Ekinetic Einternal+ + + const=
Epot m g z⋅ ⋅=
Epressurem p⋅
ρ-----------=
Ekinetic12--- m v2⋅ ⋅=
Einternal m uspez⋅=
Ri cp cv– RMi------ p
ρ T⋅-----------= = =
uspez cv T⋅=
cp T 12--- v2⋅+⋅ const=
hs12--- v2⋅+ const=
TOPSPOT: HIGHLY PARALLEL NANOLITER DISPENSING - OPERATING CONDITIONS AND DESIGN RULES - 37 -

FUNDAMENTALS DISSERTATION REMIGIUS NIEKRAWIETZ
In consideration of the continuity equation the flow into the actuation chamber has tobe the same as the flow out of the nozzle.
Due to the very small viscosity of gases fluidic resistances also can be neglected. Whilefor liquid flow the effective change in cross-section is from the nozzle expansion to thenozzle, for gas flow it is from the actuation chamber to the vent nozzle. Hence, the gasvelocity in the chamber, can be disregarded.
The final expression Eq. (2.52) is reached, when the equation is solved for the velocityvnz,gas.
For ideal gases the difference in the isentropic enthalpy is given by the difference intemperature multiplied by the specific heat [66].
As the gas expands isentropically, the temperature behind the vent nozzle Tvent is con-nected to the temperature inside the chamber Tchamber with the pressures and the adia-batic exponent χ Eq. (2.54).
To substitute the specific heat, the specific gas constant Ri (Eq. (2.46)) and the isen-tropic exponent χ must be used. The isentropic exponent is given by the fraction of cpand cv.
(2.50)
(2.51)
(2.52)
(2.53)
(2.54)
(2.55)
(2.56)
hchamber12--- vchamber,gas
2⋅+ hnz12--- vvent,gas
2⋅+=
vvent,gas2
2-------------------- hchamber hvent–≈ Δhs=
vvent,gas 2 Δhs⋅=
Δhs cp Tchamber Tvent–( )⋅=
Tvent Tchamberpvent
pchamber------------------⎝ ⎠
⎛ ⎞χ 1–
χ------------
⋅=
Δhs cp Tchamber 1pvent
pchamber------------------⎝ ⎠
⎛ ⎞χ 1–
χ------------
–⎝ ⎠⎜ ⎟⎜ ⎟⎛ ⎞
⋅ ⋅=
cp Riχ
χ 1–------------⋅=
- 38 - TOPSPOT: HIGHLY PARALLEL NANOLITER DISPENSING - OPERATING CONDITIONS AND DESIGN RULES

DISSERTATION REMIGIUS NIEKRAWIETZ FUNDAMENTALS
Inserted in Eq. (2.55) with the replacement for the product Ri · T given in Eq. (2.46)leads to the final expression for the change in the isentropic enthalpy (Eq. (2.57)).
The gas density inside the chamber can be computed with the given pressure using Eq.(2.44) to yield:
Combining Eq. (2.52) with Eq. (2.57) the gas flow velocity through a defined openingcan be expressed only dependent on the pressure inside and outside the orifice.
To calculate the gas flow Φvent,gas the computed velocity has to be multiplied by theeffective outflow area, which is given by the cross-section surface of the nozzle Avent.The real flow and velocity out of the actuation chamber is usually smaller than the idealone. The reason for this lies in the friction loss the fluid encounters at the walls of thenozzle, as well as the viscosity, since these are not infinitesimal. Friction can be imple-mented by the so called velocity coefficient , which is an empirical factor and thecontraction factor . The contraction factor describes the contraction of the gas flowcompared to the nozzle outlet diameter. Empirical values for the common nozzle ge-ometries can be found in literature [66,86]. The contraction factor and the velocitycoefficient are often combined to the outflow number µ. For different nozzle shapes,the corresponding values for µ are available [66,86]. A factor of 0.82 is closest to theTopSpot nozzle outlet geometries.
As this formula is only valid for the subsonic range, it is of great importance to know,which pressure range is covered. The sonic speed of air is at 344 m/s. It is reached at achamber pressure of about 195 kPa; the pressure outside is assumed to be normal pres-sure. Since the typical operating pressure ranges lie between 20 kPa and 40 kPa formu-la Eq. (2.60) can be regarded as valid for the considered case.
(2.57)
(2.58)
(2.59)
(2.60)
Δhsχ
χ 1–------------
pchamberρchamber------------------- 1
pventpchamber------------------⎝ ⎠
⎛ ⎞χ 1–
χ------------
–⎝ ⎠⎜ ⎟⎜ ⎟⎛ ⎞
⋅ ⋅=
ρchamber ρgaspchamber
pnorn------------------⎝ ⎠
⎛ ⎞1χ---
⋅=
vvent,gas 2 χχ 1–------------
pchamberρchamber------------------- 1
pventpchamber------------------⎝ ⎠
⎛ ⎞χ 1–
χ------------
–⎝ ⎠⎜ ⎟⎜ ⎟⎛ ⎞
⋅ ⋅ ⋅=
ϒζ
ζϒ
Φvent,gas ϒ ξ Avent vvent,gas μ Avent vvent,gas⋅ ⋅=⋅ ⋅ ⋅=
Φvent,gas μ Avent 2 χχ 1–------------
pchamberρchamber------------------- 1
pventpchamber------------------⎝ ⎠
⎛ ⎞χ 1–
χ------------
–⎝ ⎠⎜ ⎟⎜ ⎟⎛ ⎞
⋅ ⋅ ⋅⋅ ⋅=
TOPSPOT: HIGHLY PARALLEL NANOLITER DISPENSING - OPERATING CONDITIONS AND DESIGN RULES - 39 -

FUNDAMENTALS DISSERTATION REMIGIUS NIEKRAWIETZ
2.4.7.2 PRESSURE GENERATION ADAPTED TO REAL DEVICES
Since this concept includes a venting hole a gas outlet through the piston exists also.In contrast to a valve concept this outlet can not be switched, so it is open all the time.Hence, the equation of the pressure generation describes not only the piston movementpistonz(t), that results in a compression of the actuation chamber, but also the gas flowout of the vent hole Φvent,gas during the dispensing process. Therefore, Vgas(t) andVchamber(t) in Eq. (2.44) are replaced by the expressions describing the considered con-cept, leading to Eq. (2.61). In this connection Vadd is an additional gas volume (dead-volume), which exist between the endwalls of the piston and the inner surface of theprinthead (see Fig. 2.11). When the threshold pressure is reached the system evolves to the next state. Now liquidis ejected through the nozzles. This flow increases the volume of the pressure chamber.Since this volume is very small, compared to the volume of the pressure chamber, theintroduced error can be neglected.
Fig. 2.12 shows the calculated pressure pulse in comparison to the measurements ofthe integrated pressure sensor. The optimized sealing method of chapter 3.2.1 was usedfor the measurements of the transient pressure pulse. This new sealing methoddescribed there allows to eliminate the dead-volume (Vadd) in the actuation chamber.
(2.61)
Figure 2.12: Measured piston displacement and pressure pulse in the actuation chamber compared tothe calculated pressure pulse according to Eq. (2.61).
Table 2-2: Liquid properties and geometry parameters of the actuation chamber for the calculation ofthe transient pressure pulse.
Geometry of a actuation chamber Liquid properties Initial condition
Achamber 5.03·10-5 m2 ρair 1.2929 kg/m³ pnorm 101300 Pa
Avent 5.03·10-9 m2 ηair 1.724·10-5 Pa·s
hchamber 0.3·10-3 m χ 1.4
Vadd 0 m3 µ 0.82
p t( ) pnormAchamber hchamber Vadd Φvent,gas t( )–+⋅
Achamber hchamber pistonz t( )–( ) Vadd+⋅-----------------------------------------------------------------------------------------------⎝ ⎠
⎛ ⎞χ
⋅=
- 40 - TOPSPOT: HIGHLY PARALLEL NANOLITER DISPENSING - OPERATING CONDITIONS AND DESIGN RULES

DISSERTATION REMIGIUS NIEKRAWIETZ FUNDAMENTALS
Piston movement was measured by the laser vibrometer (see also chapter 4.1.5). Thedisplacement profile of the piston was inserted in the analytical pressure model. Theanalytical model shows a good agreement. Further the graph also shows themeasurement of the piston movement, which results in the pressure pulse.
2.5 CHARACTERISTIC NUMBERS FOR DROPLET FOR-MATION
A dimensionless number is most often derived as a ratio of two physical, geometrical,mechanical, thermal, or chemical quantities. Dimensionless numbers are often used influidic dynamics to characterize and describe liquid flow [37,87]. The advantage of di-mensionless numbers is the fact that a physical behavior can easily be expressed qual-itatively by a simple characteristic number. In our case the characteristic numbersrepresent the relationship of two different energies. For example the Weber number in-dicates whether the kinetic or the surface tension energy is dominant during a dropletformation process.
2.5.1 REYNOLDS NUMBER
The Reynolds number is the most important dimensionless number in fluid dynamicsand describes the ratio of the dynamic pressure force to the viscous force. It can alsobe derived by the geometrical affinity of the relations of the inertial energy Ekinetic tothe viscous dissipation Eviscous. It is used to determine whether a flow will be laminaror turbulent [37,58,87,88].
In general, three flow regimes can be distinguished, which lead to characteristic flowconditions.
• Creeping flow regime: The Reynolds number is very small (Re < 1), so thatthe inertia effects can be ignored in comparison to the viscous resistance. Thenonlinear term of the Navier-Stokes equation can be neglected.
• Intermediate flow regime: For 1 < Re < 2300 the nonlinear term of theNavier-Stokes equation becomes increasingly important. The flow structurecan be considered as creeping flow superimposed with the so calledsecondary flow.
• Turbulent flow regime: For Re > 2300 the velocity fluctuates in magnitude
(2.62)
(2.63)
Re EkineticEviscous-----------------∼
12--- m v2⋅ ⋅
2 η v V l⁄⋅ ⋅ ⋅-------------------------------- 1
4--- ρ v l⋅ ⋅
η----------------⋅= =
Re→ ρ v l⋅ ⋅η
----------------=
ρ v ∇⋅( )v
TOPSPOT: HIGHLY PARALLEL NANOLITER DISPENSING - OPERATING CONDITIONS AND DESIGN RULES - 41 -

FUNDAMENTALS DISSERTATION REMIGIUS NIEKRAWIETZ
and direction over time. The flow is instationary and chaotic.
The creeping flow regime and the intermediate flow regime are generally calledlaminar flow regime. In microfluidics with typically small channel dimensions and lowvelocities the flow conditions are in the laminar flow regime. Rewriting the Navier-Stokes equation in a dimensionless manner indicates that the Reynolds numberdetermines the dynamics of the momentum equation, if the Reynolds number is smalland the gravity can be neglected [58].
2.5.2 WEBER NUMBER
The dimensionless Weber number represents the ratio of disruptive hydrodynamicforces to the stabilizing surface tension force. Hence, the Weber number indicateswhether the inertial energy Ekinetic or the surface tension energy Esurface of a fluid isdominant [37,87], [89-94]. For a spherical droplet it may be written as:
Where ρ is the fluid density, v is its velocity, D is its characteristic length and σ is thesurface tension. The Weber number can be used for two different declarations. On theone hand it describes whether a droplet can leave a nozzle at all due to higher kineticenergy compared to surface energy. For droplet ejection processes v corresponds to thevelocity at the nozzle outlet and D to the nozzle diameter, respectively. On the otherhand it can describe the interaction of a liquid droplet with a solid surface, which canresult in a droplet spreading, splashing or rebounding, as well as the impact on a liquidsurface, which results in droplet bouncing, coalescing or splashing. The behavior dur-ing an impact depends mainly on the impact velocity v of the droplet, or more preciselyon the Weber number We. In this case D denotes the droplet diameter before impact(see Eq. (2.65)).
CRITICAL WEBER NUMBER FOR DROPLET TEAR-OFF: In the literature an empirical approach can be found, which states that v has to exceeda critical value to initiate a successful droplet tear-off [59,93,95,96]. This crit-ical velocity can be estimated via the Weber number. As can be deduced fromEq. (2.64) the Weber number has to be 12 to equilibrate kinetic and surface energy. Ac-cording to this, a Weber number larger than 12 signifies that the disruptive hydrody-namic forces are larger than the stabilizing surface tension forces. Additionally thiscritical Weber number, at which a droplet tear-off can start, can also be determined em-
(2.64)
(2.65)
We EkineticEsurface----------------∼
12--- m v2⋅ ⋅
Adrop σ⋅---------------------
12--- 1
6--- ρ D3 π v2⋅⋅ ⋅ ⋅ ⋅
D2 π σ⋅ ⋅----------------------------------------------- 1
12------ ρ D v2⋅ ⋅
σ---------------------⋅= = =
We→ ρ D v2⋅ ⋅σ
---------------------=
vcriticalvcritical
- 42 - TOPSPOT: HIGHLY PARALLEL NANOLITER DISPENSING - OPERATING CONDITIONS AND DESIGN RULES

DISSERTATION REMIGIUS NIEKRAWIETZ FUNDAMENTALS
pirically. In this context it is assumed, that the droplet diameter is in the range of thenozzle diameter. This empirical critical Weber number is also around Wecritical = 12[93,95,97,98,99,100].
However, the Weber number is independent of the fluid viscosity. Therefore, the We-ber number is not adequate to distinguish between low or high viscous fluids. But it iswell known, that viscosity has a considerable effect on the droplet formation process.To account for the liquid viscosity in droplet formation, the appropriate nondimension-al number is the Ohnesorge number. It represents the ratio of internal viscosity dissi-pation to the surface tension energy [59,87,93,94,95,101]. The Ohnesorge number may be written in terms of the Reynolds and Weber number:
On the other hand the Ohnesorge number is independent of the velocity and thereforeonly adequate to describe droplet ejection in conjunction with the Weber number.Hence, a constant critical Weber number is only valid for liquids with low viscositysuch that the Ohnesorge number is small, On < 0.1. This is the case for viscositiesη < 10 mPas for appropriate spatial dimensions in the micro scale. For higher viscousmedia a modified critical Weber number has to be exceeded to initiate adroplet tear-off [93,102].
Using Eq. (2.66, 2.67, 2.68) a critical velocity can be derived. This is theminimum velocity of the liquid at the nozzle outlet needed to initiate a droplet tear-off.
2.5.3 CRITICAL PARAMETERS FOR DROPLET TEAR-OFF
To predict the droplet ejection for the TopSpot dispenser a simplified model wasformed. The pressure energy Epressure to initiate a droplet tear-off of the volume Vdropletwith a pressure loss p over the simplified model consists of three single expressionsand was also studied by Lindemann [96]. These are the energy loss due to friction
(2.66)
(2.67)
(2.68)
(2.69)
Wecritical 12=ρ D vcritical
2⋅ ⋅σ
--------------------------------=
On
On WeRe
------------ ρ D v2 σ⁄⋅ ⋅ρ v D η⁄⋅ ⋅
--------------------------------- ηρ D σ⋅ ⋅
------------------------== =
Wecritical,mod
Wecritical,mod 12 1 1.077 On1.6⋅+( )⋅=
vcritical
vcriticalWe critical,mod σ⋅
ρ Ddrop⋅--------------------------------------- 12 σ⋅
ρ Ddrop⋅-------------------- 1 1.077 η
ρ Ddrop σ⋅ ⋅( )--------------------------------------⎝ ⎠
⎛ ⎞ 1.6⋅+⎝ ⎠
⎛ ⎞⋅= =
TOPSPOT: HIGHLY PARALLEL NANOLITER DISPENSING - OPERATING CONDITIONS AND DESIGN RULES - 43 -

FUNDAMENTALS DISSERTATION REMIGIUS NIEKRAWIETZ
Efriction in the channel, representing all viscous and geometrical pressure losses, theenergy required to create the surface of a spherical droplet Esurface and the kineticenergy of the resulting free flying droplet Ekinetic:
Further it is a fact, that the needed energies to initiate the droplet tear-off can be nor-malized to the pressure p at the nozzle inlet to push a fixed volume ΔV into it. Assum-ing, that the liquid is incompressible and that it can only flow out of the nozzle outlet,the finally displaced volume ΔV after droplet tear-off corresponds to the generateddroplet volume Vdrop. Therefore:
The friction energy is calculated by the fluidic resistance as defined in section [2.4.2]and consists of the circular nozzles expansion Rnz,ex, the circular nozzle Rnz and theresistance due to the contraction of the cross-section Rcontraction (Eq. (2.36)). Due to thehigh fluidic inertance of the 10 mm long capillary supply channels from the reservoirsto the nozzles we can consider the TopSpot nozzles separately from these channels dur-ing the dispensing process. The additional small inductances of the nozzle expansionLnz,ex and nozzle Lnz in the µm range can be neglected here.
Using the equation of continuity for incompressible media, both considered velocitiescan be linked to each other:
Figure 2.13: Schematic cross-section of a standard TopSpot nozzle: The applied pressure at the nozzleinlet pushes a volume ΔV into the nozzle. After droplet tear-off, ΔV corresponds to the droplet volumeVdrop if it is assumed, that the liquid is incompressible.
(2.70)
(2.71)
(2.72)
(2.73)
Dnz,ex : 300 µm[Nozzle expansion diameter]Dnz : 50 µm[Nozzle diameter]lnz,ex : 230 µm[Nozzle expansion length]lnz : 150 µm[Nozzle length]p : Applied pressure atnozzle inletΔV : Volume pushed intonozzle inletVdrop : Droplet volume ge-nerated at nozzle outletvnz : Velocity inside thenozzlevnz : Velocity inside thenozzle expansion
Epressure Efriction Esurface Ekinetic+ +=
Epressure F Δx⋅ p A Δx⋅ ⋅ p ΔV⋅ p Vdrop⋅= = = =
Efriction Rnz,ex Rnz Rcontraction+ +( ) V⋅ drop Φv⋅=
vnz,ex Anz,ex⋅ vnz Anz⋅=
- 44 - TOPSPOT: HIGHLY PARALLEL NANOLITER DISPENSING - OPERATING CONDITIONS AND DESIGN RULES

DISSERTATION REMIGIUS NIEKRAWIETZ FUNDAMENTALS
The volume flow Φv can be replaced by the mean velocity through the cross-section area Anz of the nozzle. Hence, Efriction can be written as:
The first term in the brackets of Eq. (2.75) can be neglected, because the diameter ofthe nozzle expansion Dnz,ex appears in the power of four and is commonly much largerthan the diameter of the nozzle Dnz (at TopSpot standard printheads: Dnz,ex = ).But if the nozzle expansion is reduced dramatically (see Table 2-3) the resistance ofthe nozzle expansion gets a higher impact. Further, the contraction resistance of thenozzle is heavily dependent on the critical velocity and also on the proportion of bothcross-section areas and their corresponding resistance numbers. The reduction of thenozzle expansion leads in this case to a reduced total resistance of the nozzle.The second energy listed in Eq. (2.70) is the surface energy Esurface of a resultingspherical droplet. It is defined by the surface tension σ and the surface area of thedroplet Adrop, where the droplet diameter is assumed to be equal to the nozzle diameterDnz.
(2.74)
(2.75)
Table 2-3: Calculation of the fluidic resistance of different TopSpot nozzle expansion diameters.
Geometry of a standard nozzle Liquid properties Critical velocityDnz 50 µm ρwater 1000 kg/m³
vcritical 4.2 m/slnz,ex 230 µm ηwater 0.001 Pa·s
lnz 150 µm σwater 0.073 N/m
Nozzle expansion diameter [Dnz,ex]
Resistance number [ζ]
Resistance of the nozzle
[Rnz]
Resistance of the nozzle expan-sion [Rnz,ex]
Contraction resistance of the
cross-section [Rcontraction]
Total resistance[Rtotal]
300 µm 0.45 0.98·1012
Pa·s/m30.12·1010
Pa·s/m31.55·1012
Pa·s/m32.53·1012
Pa·s/m3
150 µm 0.375 0.98·1012
Pa·s/m30.19·1011
Pa·s/m31.45·1012
Pa·s/m32.45·1012
Pa·s/m3
75 µm 0.2 0.98·1012
Pa·s/m30.3·1012
Pa·s/m31.07·1012
Pa·s/m32.35·1012
Pa·s/m3
(2.76)
vnz
Efriction8 η lnz,ex⋅ ⋅
πDnz,ex
2--------------⎝ ⎠
⎛ ⎞4
⋅
------------------------------8 η lnz⋅ ⋅
πDnz2
--------⎝ ⎠⎛ ⎞
4⋅
------------------------Φv ρ⋅
2 Anz2⋅
--------------- 1+ζAnz
2
Anz,ex2
-------------–⎝ ⎠⎜ ⎟⎛ ⎞
⋅+ + Vdrop⋅ Φv⋅=
8 η lnz,ex⋅ ⋅
πDnz,ex
2--------------⎝ ⎠
⎛ ⎞4
⋅
------------------------------8 η lnz⋅ ⋅
πDnz2
--------⎝ ⎠⎛ ⎞
4⋅
------------------------vnz ρ⋅2 Anz⋅--------------- 1+ζ
Anz2
Anz,ex2
-------------–⎝ ⎠⎜ ⎟⎛ ⎞
⋅+ += Vdrop⋅ Anz vnz⋅ ⋅
6 Dnz⋅
Esurface Adrop σ⋅ π Ddrop2 σ⋅ ⋅= =
TOPSPOT: HIGHLY PARALLEL NANOLITER DISPENSING - OPERATING CONDITIONS AND DESIGN RULES - 45 -

FUNDAMENTALS DISSERTATION REMIGIUS NIEKRAWIETZ
The third energy term in Eq. (2.70) represents the kinetic energy of the flying dropletwith the droplet velocity directly at the nozzle outlet. After the droplet tear-off themass is equal to the mass of the droplet, hence Ekinetic can be written as:
Finally, inserting Anz= , the pressure energy can be calculated by adding thethree energy terms for the standard TopSpot nozzle:
The needed pressure p, which is applied at the inlet of the nozzle during the pushingthe liquid amount Vdrop out of the TopSpot printhead, is represented by the squarebrackets of Eq. (2.78). This basic equation enables us to approximate the minimumpressure energy required for a given droplet velocity. Also the resulting dropletvelocity for a given pressure can be estimated. However, this formula is only valid if adroplet is issued at all! Inserting the critical velocity Eq. (2.69) as droplet velocity into Eq. (2.78), a criticalpressure pcritical can be estimated depending only on media parameters, geometryparameters and the critical Weber number:
This critical pressure given by Eq. (2.79) is the minimum pressure required for ejectinga droplet of approximately the size of the nozzle in the given configuration (see Fig.2.13).
(2.77)
(2.78)
(2.79)
Figure 2.14: Stroboscopic picture of the dispensing process of 30 % (v/v) DMSO with a TopSpot print-head with a nozzle diameter of Dnz=50 µm: a.) Pressure energy is not high enough to allow a singledroplet tear-off. b.) The critical pressure energy is exceeded and leads to a free flying single dropletwith a droplet diameter of Dex=108 µm.
vnz
Ekinetic12--- mdrop vnz
2⋅ ⋅ 12--- Vdrop ρ vnz
2⋅ ⋅ ⋅= =
π4--- Dnz
2⋅
Epressure Efriction Esurface Ekinetic+ +=
32 η lnz⋅ ⋅
Dnz2
------------------------vnz ρ⋅
2--------------- 1.45
Dnz4
Dnz,ex4
--------------–⎝ ⎠⎜ ⎟⎛ ⎞
⋅+⎝ ⎠⎜ ⎟⎛ ⎞
Vdrop vnz⋅ ⋅ π Ddrop2 σ⋅ ⋅[ ] 1
2--- Vdrop ρ vnz
2⋅ ⋅ ⋅+ +=
Vdrop 32 ηlnz
Dnz2
--------⋅ ⋅vnz ρ⋅
2--------------- 1.45
Dnz4
Dnz,ex4
--------------–⎝ ⎠⎜ ⎟⎛ ⎞
⋅+⎝ ⎠⎜ ⎟⎛ ⎞
vnz⋅ 6 σ⋅Ddrop-------------⎝ ⎠
⎛ ⎞ 12--- ρ vnz
2⋅ ⋅⎝ ⎠⎛ ⎞+ +⋅=
Vdrop p⋅=
pcritical 32 ηlnz
Dnz2
--------⋅ ⋅vcritical ρ⋅
2----------------------- 1.45
Dnz4
Dnz,ex4
--------------–⎝ ⎠⎜ ⎟⎛ ⎞
⋅+⎝ ⎠⎜ ⎟⎛ ⎞
vcritical⋅ 6 σ⋅Ddrop------------- 1
2--- ρ vcritical
2⋅ ⋅+ +=
Δpfriction Δpsurface Δpkinetic+ +=
a) b)
- 46 - TOPSPOT: HIGHLY PARALLEL NANOLITER DISPENSING - OPERATING CONDITIONS AND DESIGN RULES

DISSERTATION REMIGIUS NIEKRAWIETZ FUNDAMENTALS
However, dispensed droplets observed in experiments typically have a dropletdiameter of about 108 µm, which is about twice as big as the nozzle diameter of 50 µmin the analytical model (see Fig. 2.14). The corresponding droplet volume of about660 pl is approximately 10 times higher than the volume of a droplet with the diameterequal to the nozzle size. For a 50 µm droplet diameter the dispenser would indicate a critical velocity of4.2 m/s and a critical pressure of 38.29 kPa (see Table 2-5). The experimentallymeasured pressure pulse of 17.69 kPa does not exceed the analytically calculatedcritical pressure. But a droplet tear-off can be observed during the dispensing process.The mean velocity inside the nozzle extracted out of the CFD TopSpot simulationmodel (see chapter 4.2.1) is about 2.1 m/s at max. The analytical model presented inchapter 2.5.3 does not describe satisfactorily the dispensing process of the TopSpotsystem.The significant difference in the dispensed droplet volume is caused by the longduration of the actuation pressure pulse (see Fig. 2.12). In reality the needed pressurepulse can not be built up in the ideal assumed rectangular shape. The excess of thecapillary pressure of the nozzle leads to a volume displacement. During this time thecoupled pressure energy forcing liquid flow out of the nozzle results in a dropletgrowth to 660 pl. But the corresponding droplet diameter of this volume is much largerthan the nozzle diameter. The TopSpot system is still able to create free flying droplets,because the supplied energy during the dispensing process is high enough to allow adroplet tear-off [96].If the experimentally observed droplet diameter of Dex=108 µm is inserted in the Eq.(2.76) and Eq. (2.79) the critical velocity decreases to 2.8 m/s and also the critical pres-sure to 19.47 kPa. The critical pressure comes now closer to the experimentally mea-sured pressure pulse of 17.69 kPa. This closer examination leads to the thesis, that theTopSpot system is operating at its pressure limit to create free flying droplets. Smallchanges in the supplied pressure easily cause a failure of the dispensing process (seeFig. 2.14). For a more precise determination of the droplet ejection limit the accuratemeasured transient pressure pulse should be used as boundary condition like the Top-Spot CFD simulation model of chapter 4.2.1 or the improved analytical model of thenext chapter. Nevertheless, this analytical model can be used to get an indication forthe dependency of the critical pressure on media properties like density, surface tensionor viscosity. Both other liquid parameter were set to the values for water.
Table 2-4: Geometry parameter of the standard printhead nozzle and liquid properties for calculatingthe critical pressure for an ejection droplet volume of 65 pl and 660 pl.
Parameter of the dispensed droplet Geometry of a standard nozzle Liquid properties
Ddrop=Dnz=50 µm Vdrop=65 plDnz,ex 300 µm ρwater 1000 kg/m³
Dnz 50 µm ηwater 0.001 Pa·s
Ddrop=Dex=108 µm Vdrop=660 pllnz,ex 230 µm σwater 0.073 N/m
lnz 150 µm
TOPSPOT: HIGHLY PARALLEL NANOLITER DISPENSING - OPERATING CONDITIONS AND DESIGN RULES - 47 -

FUNDAMENTALS DISSERTATION REMIGIUS NIEKRAWIETZ
Fig. 2.15 shows, that the needed critical pressure is highly dependent on viscosity andsurface tension. An increasing viscosity causes a high fluidic resistance, which alsoincreases the required critical Weber number due to a high Ohnesorge number (see Eq.(2.67)). The influence of the surface tension on the critical pressure is even highercompared to the viscosity. The density has a minor impact on the critical pressure. Atwelvefold increase of the density leads only to a decline of 5.5 kPa of the criticalpressure.
The analytical model of the critical pressure pulse keeps the dispensed droplet volumeconstant by varying liquid properties. However, in reality the single droplet volume ofthe TopSpot dispenser is highly dependent on liquid properties. The changed dropletvolume has an additional effect on the critical pressure pulse for the droplet ejectionprocess.
Table 2-5: Calculated results of the required energies for the droplet ejection process (Eq. (2.69), Eq.(2.79))
Droplet diameter vcritical Δpfriction Δpsurface Δpkinetic Δppressure
Ddrop=Dnz50 µm
4.2 m/s 20.76 kPa 8.76 kPa 8.77 kPa 38.29 kPa
Ddrop=Dex108 µm
2.8 m/s 11.35 kPa 4.06 kPa 4.06 kPa 19.47 kPa
Figure 2.15: Influence of density, surface tension and dynamic viscosity on the critical pressure.Using a standard TopSpot nozzle geometry and a constant dispensed droplet volume of 660 pl.
- 48 - TOPSPOT: HIGHLY PARALLEL NANOLITER DISPENSING - OPERATING CONDITIONS AND DESIGN RULES

DISSERTATION REMIGIUS NIEKRAWIETZ FUNDAMENTALS
2.5.4 APPROXIMATION FOR DROPLET TEAR-OFF
A quite simple possibility to approximate if a droplet tear-off indeed occurs, is provid-ed by a detailed study of the time depending pressure pulse shape and the approximatedresulting flow through the nozzle. The pressure pulse p(t) is therefore calculated direct-ly from the piston displacement as described previously (see Fig. 2.4.7.1). Assuming apendent droplet, the kinetic energy of the resulting free flying droplet Ekinetic= 0 canbe neglected. If the pressure needed to create the surface of the spherical droplet is sub-tracted from pressure pulse p(t) the residual pressure can be considered to provide theenergy, which is able to break off the pending droplet from the nozzle. Afterwards thevolume flow Φv(t) can be calculated by dividing the residual pressure through the flu-idic resistance of the nozzle Rges,v(t), which results in an approximative necessary con-dition for droplet tear-off.
The fluidic resistance of the nozzle Rges,v(t) consists of several components with partial-ly time depending liquid velocities passing the cross-section of the nozzle (see Eq.(2.72)-Eq. (2.74)). For an upper approximation of the volume flow Φv(t) enabling adroplet tear-off a critical velocity given by Eq. (2.69) was assumed.
Hence, Φv,approx(t) can be defined as:
The value of the critical velocity obviously depends on the size of the consid-ered droplet. However, this size is changing during the dispensing process as describedbelow. Therefore, the critical velocity is not a constant. For the calculation of the ap-proximated volume flow Φv(t) the fluidic resistance of the nozzle Rges,v(t) was adaptedfor each time step. The integration of the approximated volume flow Φv,approx(t) enables theapproximation of the pendent droplet size Vapprox(t) as follows:
(2.80)
(2.81)
(2.82)
(2.83)
Φv t( ) p t( )Rges,v t( )------------------
p t( ) 6 σ⋅Ddrop------------–
Rges,v t( )----------------------------------≥=
vcritical
Rges,v t( )Rges vcritical(t),≤
Φv t( ) p t( )Rges,v t( )
----------------p t( ) 6 σ⋅
Ddrop------------–
Rges,vcritical(t)----------------------------------≥ Φv, approx t( )= =
vcritical
V approx t( )p t( ) 6 σ⋅
Ddrop------------–
Rges,vcritical(t)----------------------------------
⎝ ⎠⎜ ⎟⎜ ⎟⎜ ⎟⎛ ⎞
td∫=
TOPSPOT: HIGHLY PARALLEL NANOLITER DISPENSING - OPERATING CONDITIONS AND DESIGN RULES - 49 -

FUNDAMENTALS DISSERTATION REMIGIUS NIEKRAWIETZ
Vapprox(t) is not the volume of the droplet, that leaves the nozzle. It is the volume of thependent droplet just before the droplet tears-off from the nozzle. As expected, the fall-ing droplet has a smaller volume, since some of the liquid remains on the nozzle afterthe pendent droplet “splits“ as shown in Figure 2.14b. However, the remaining liquidis neglected in this approximation. Derived from Eq. (2.83) the time depending dropletsize Ddrop(t) can be approximated by Eq. (2.84).
Inserting the time depending droplet size Ddrop(t) into Eq. (2.69), a critical time de-pending velocity can be estimated, which is required to detach the droplet from thenozzle. This critical time depending velocity at the nozzle outlet can also be used tocalculate a critical time depending volume flow Φv, critical(t) (see Eq. (2.85)). Hence,the critical time depending volume flow Φv, critical(t) also depends on the droplet sizeDdrop(t).
Not all of the droplets leave the nozzle some remain attached. The requirement for adroplet tear-off is, that the critical volume flow Φv, critical(t) has to be surpassed at somepoint in time by the approximated volume flow Φv,approx(t) as described in Eq. (2.86). It was shown, that the critical velocity for a droplet tear-off is reduced by increasingthe droplet size. Therefore, the requirements for the critical volume flow Φv, critical(t)can be easier achieved by a growing droplet. If the approximated volume flow is per-sistently lower than the critical volume flow no droplet tear-off will occur.
Figure 2.16 shows the implementation of the derived analytical model by using a cal-culated pressure pulse for the droplet ejection applied on a standard TopSpot nozzle.The calculated approximated volume flow Φv,approx(t) surpasses the critical volumeflow Φv, critical(t) and initiates a droplet tear-off like in the experimental results. Theintegration of the approximated volume flow (see Eq. (2.83)) also enables the estima-tion of the droplet volume Vapprox(t). Further validation of the analytical model can befound in chapter 4.2.3.4.
(2.84)
(2.85)
(2.86)
Ddrop t( ) 6π---
p t( ) 6 σ⋅Ddrop------------–
Rges,vcritical(t)----------------------------------
⎝ ⎠⎜ ⎟⎜ ⎟⎜ ⎟⎛ ⎞
td∫3≥
Φv, critical t( ) vcritical Ddrop t( )( )Dnz2
--------⎝ ⎠⎛ ⎞
2π⋅ ⋅=
Φv, approx t( ) Φv, critical t( )> droplet tear-off ⇒
Φv, approx t( ) Φv, critical t( )≤ no droplet tear-off⇒
- 50 - TOPSPOT: HIGHLY PARALLEL NANOLITER DISPENSING - OPERATING CONDITIONS AND DESIGN RULES

DISSERTATION REMIGIUS NIEKRAWIETZ FUNDAMENTALS
2.5.5 DROPLET IMPACT
The fluid dynamics of a droplet impact on solid or liquid surfaces is very complicatedand depends on many different parameters. These comprise surface tension, viscosity,density and temperature of the droplet liquid, diameter, impact angle and velocity ofthe droplet, surface roughness and temperature, physical and chemical properties of thesolid as well as the contact angle between the droplet and the solid surface [89].
2.5.5.1 DROPLET IMPACT ON SOLID SURFACES
Droplet impacts on solid surfaces display a number of different possible behaviors.Bouncing occurs when the liquid does not wet the surface and capillary forces causethe droplet to recoil [103]. This happens at superhydrophobic surfaces, which generatevery high contact angles (160°–170°) as a result of their microstructure [104, 105]. Thedroplet impact on such a surface shows unusual features, such as total rebound at lowimpact velocity [107]. This effect is primarily due to the presence of air remaining onthe solid as a droplet is deposited, which increases dramatically the contact angle anddecreases the adhesion of the liquid to its substrate [106].Spreading takes place when the droplet does wet the surface and spreads out until itreaches an equilibrium state. The spreading can be divided into impact spreadingwhere the flow is driven by the kinetic energy, and leveling where wetting and surfacetension driven flow take place. The amount of impact spreading is determined by thebalance of the driving and resisting forces. The driving force for the impact spreadingis the kinetic energy of the droplet, whereas flow resistance is provided by viscosityand surface tension of the liquid [107, 108]. When the kinetic energy is dissipated, thedroplet reaches its maximum radius. If the liquid dose not wet the surface, surface ten-sion forces will cause the droplet to retract to an equilibrium sessile droplet shape. If
Figure 2.16: Approximated volume flow Φv, approx(t) in comparison to the critical volume flow Φv, criti-cal(t). Due to the exceeding of the critical volume flow the droplet tear-off can be predicted. By integra-ting the approximated volume flow (see Eq. (2.83)) the droplet volume Vapprox(t) can be calculated.
TOPSPOT: HIGHLY PARALLEL NANOLITER DISPENSING - OPERATING CONDITIONS AND DESIGN RULES - 51 -

FUNDAMENTALS DISSERTATION REMIGIUS NIEKRAWIETZ
the droplet dose wet the surface, there could be a second stage of slow spreading as thedroplet moves toward its equilibrium configuration [59],[109]. The extent of spreadingis determined by the molecular interaction between the fluid and the solid surface.The behavior during droplet collisions depends mainly on the impact velocity or moreprecisely on the Weber number Eq. (2.65), which compares kinetic and surface energy.For large values of the Weber number the kinetic energy of the droplet is able toovercome the surface tension of the liquid and spreading takes place. For low valuesof the Weber number, for example low impact velocities, the droplet tends to keep itsspherical shape on the surface provided no wetting takes place. The relative importanceof the kinetic energy versus viscous resistance for spreading can be assessed with theReynolds number Eq. (2.63). At high Reynolds numbers the droplet kinetic energy islarge enough to overcome the viscous resistance whereby the droplet spreads. Hencethe topology is determined by a competition between inertia and surface tension. Onthe other hand at low Reynolds numbers high viscosities reduce the spreading due toincreased viscous energy dissipation. Therefore, a combination of both dimensionlessparameters determine the behavior at droplet impact [107],[110].For the high demands on the microarray quality not only droplet volume is important,but it is also essential to achieve a high spot density on the microarray slide. However,the maximum spot diameter affects the minimum possible pitch of the spots on theslide. Therefore, the impact energy should be as small as possible. As mentionedbefore the system will show a tendency to establish a minimum, when the liquiddroplet dissipates the kinetic energy of the droplet impact. Hence, it is safe to assume,that the droplet has a shape of a spherical segment on a horizontal plane. Accordingly,the volume of a sessile droplet Vdrop can be expressed by
where Rls is the radius of the liquid-solid interface and Θ is the contact angle [111,112]. For a known droplet volume and the contact angle of Θ we can also predict thespreading radius Rls of the equilibrium state of the spot.
This allows us to calculate the maximum theoretical integration density of the spots onthe slide. Always provided, that impact spreading is negligible!At high droplet energies, splashing (or shattering) occurs, when the kinetic energy isdistributed among smaller droplets (= satellite droplets) with higher overall surface en-ergy relative to the original droplet. In this case the surface energy of the droplet is not
(2.87)
(2.88)
Vdropπ Rls
3 2 3 Θ Θ3cos+cos⋅–( )⋅ ⋅
3 Θ3sin⋅----------------------------------------------------------------------------=
RlsVdrop 3 Θ3sin⋅ ⋅
π 2 3 Θ Θ3cos+cos⋅–( )⋅----------------------------------------------------------------3=
- 52 - TOPSPOT: HIGHLY PARALLEL NANOLITER DISPENSING - OPERATING CONDITIONS AND DESIGN RULES

DISSERTATION REMIGIUS NIEKRAWIETZ FUNDAMENTALS
sufficient to maintain a closed surface and small droplets start emerging. This disinte-gration process emerges at large Weber and Reynolds numbers and depends further onthe properties of the wall such as roughness and temperature [89], [113]. If a small droplet (~150 µm diameter), like those created by the TopSpot dispenser, hitson a smooth surface at room temperature, there will be no splashing. The reason forthat is very simple: There is not enough energy to form secondary droplets. Dropletswith diameter of less than 150 µm typically have more surface energy than kineticenergy or in terms of the Weber number, splashing does not occur for low Webernumbers. The formation of splashes needs a lot of energy to form new surfaces. Butthis energy is not available. By calculating the energy relation for a droplet with typicaldimensions as produced by the TopSpot system with a droplet diameter of 150 µm,dispensing liquid water (σ = 0.0725 N/m, ρ = 1000 kg/m3) and a droplet velocity of~1 m/s the Weber number can be calculated to 0.172. This means, that the surfaceenergy is more than fivefold the kinetic energy. Even with liquids with much lowersurface tensions as for example organic solvents (Ethanol σ = 0.0225 N/m,ρ = 778.4 kg/m3) the surface energy is more than twice the kinetic energy. Withsmaller droplets the relation grows proportional to the diameter D [114].
2.5.5.2 DROPLET IMPACT ON LIQUID SURFACES
Likewise, liquid droplet impact on liquid layers or on another droplet also displays arange of different behaviors. Floating or bouncing occurs when the liquids do not im-mediately coalesce (often due to contaminants at the liquid’s surfaces). Coalescence isa process, where the liquid droplet merges with the liquid surface. Splashing occurs athigher inertial energies. Here the impacting liquid penetrates the surface, and a craterwith a radius of up to an order of magnitude greater than the original droplet is formed.At the circumference of this cavity, a liquid sheet of target liquid is ejected (the“crown”), which may enclose the cavity to form a bubble or break into small droplets[103]. However, at low impact energies, i.e. for low values of the Weber number, thedroplets coalescence with the liquid film without splashing. An example for dropletimpact on liquid surfaces is discussed in chapter 4.2.4.2 in more detail.
TOPSPOT: HIGHLY PARALLEL NANOLITER DISPENSING - OPERATING CONDITIONS AND DESIGN RULES - 53 -

EXPERIMENTAL INVESTIGATION OF THE PRINTING PROCESS DISSERTATION REMIGIUS NIEKRAWIETZ
EXPERIMENTAL INVESTIGATION OF THE PRINTING PROCESS
In this chapter the experimental setup for the investigation of the printing process isintroduced. In the first part the optical quality control for the assessment of the dropletejection process is discussed. The second part explains the design and implementationof an integrated process control for a TopSpot type non-contact dispenser. For this pur-pose the transient pressure pulse of the pneumatic actuated dispenser was monitoredby an integrated pressure sensor during the dispensing process.
3.1 DROPLET QUALITY CONTROL
Volumina in the nanoliter range evaporate very fast [111], [115]. So the determinationof the droplet volume using a high precision balance is difficult. In order to avoid theinfluence of evaporation the experiments must take place in a humidity chamber. In thechamber the evaporation should be in balance with water condensation, but this condi-tion is very difficult to achieve. Furthermore, an array of droplets is more complex tomeasure than a single droplet. The low spacing between the neighboring nozzles(500 µm) of the printhead makes it difficult to gravimetrically measure a single dropletvolume. In practice this way is nearly impossible to gain any information about the ho-mogeneity of the dispensed spots in the array in one step. Beyond gravimetric measure-ment techniques the optical measurements are the most important and evident methodsin this context. There are several optical methods to examine the droplet ejection pro-cess and to evaluate the results concerning droplet volume, velocity and shape like pre-sented in the following.
3.1.1 STROBOSCOPIC IMAGING OF DROPLETS
A stroboscopic camera MOCON-RT (Visit, Germany) [D2] was used to evaluate drop-let ejection and droplet impact onto the substrate as depicted in Fig. 3.1 and Fig. 3.7.The system consists of a high-definition asynchronous triggerable progressive scanvideo camera. The camera has a fast shutter time of 1.25 µs to provide the possibilityto store at least one to ten pictures per second to realize a high enough recording fre-quency. The framegrabber of the system is able to acquire and digitize the video pic-tures in real time. Finally, a digital phase shifter enables the observation of periodicallymoving objects. The optical magnification was realized with a microscope [D3], whichwas mounted on the stroboscope camera. The CCD camera provides a pixel resolutionof 659 (H) x 494 (V) in 256 grayscales.
- 54 - TOPSPOT: HIGHLY PARALLEL NANOLITER DISPENSING - OPERATING CONDITIONS AND DESIGN RULES
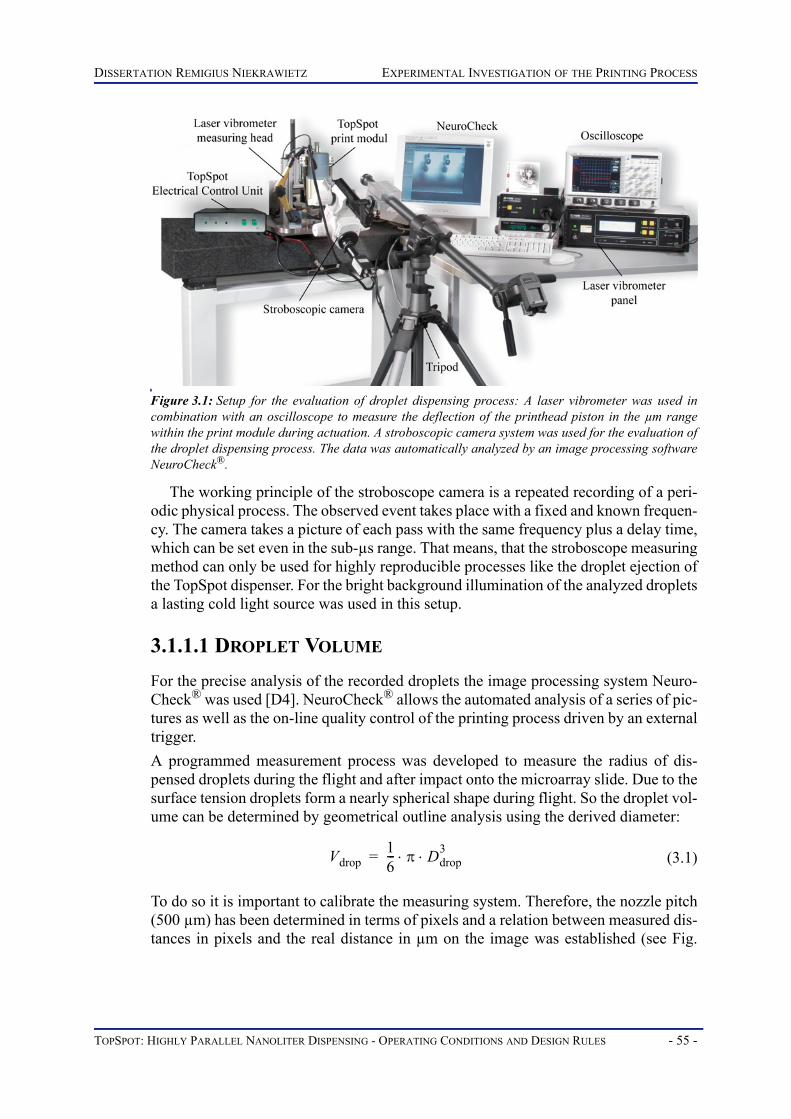
DISSERTATION REMIGIUS NIEKRAWIETZ EXPERIMENTAL INVESTIGATION OF THE PRINTING PROCESS
The working principle of the stroboscope camera is a repeated recording of a peri-odic physical process. The observed event takes place with a fixed and known frequen-cy. The camera takes a picture of each pass with the same frequency plus a delay time,which can be set even in the sub-µs range. That means, that the stroboscope measuringmethod can only be used for highly reproducible processes like the droplet ejection ofthe TopSpot dispenser. For the bright background illumination of the analyzed dropletsa lasting cold light source was used in this setup.
3.1.1.1 DROPLET VOLUME
For the precise analysis of the recorded droplets the image processing system Neuro-Check® was used [D4]. NeuroCheck® allows the automated analysis of a series of pic-tures as well as the on-line quality control of the printing process driven by an externaltrigger.A programmed measurement process was developed to measure the radius of dis-pensed droplets during the flight and after impact onto the microarray slide. Due to thesurface tension droplets form a nearly spherical shape during flight. So the droplet vol-ume can be determined by geometrical outline analysis using the derived diameter:
To do so it is important to calibrate the measuring system. Therefore, the nozzle pitch(500 µm) has been determined in terms of pixels and a relation between measured dis-tances in pixels and the real distance in µm on the image was established (see Fig.
Figure 3.1: Setup for the evaluation of droplet dispensing process: A laser vibrometer was used incombination with an oscilloscope to measure the deflection of the printhead piston in the µm rangewithin the print module during actuation. A stroboscopic camera system was used for the evaluation ofthe droplet dispensing process. The data was automatically analyzed by an image processing softwareNeuroCheck®.
(3.1)Vdrop16--- π Ddrop
3⋅ ⋅=
TOPSPOT: HIGHLY PARALLEL NANOLITER DISPENSING - OPERATING CONDITIONS AND DESIGN RULES - 55 -

EXPERIMENTAL INVESTIGATION OF THE PRINTING PROCESS DISSERTATION REMIGIUS NIEKRAWIETZ
3.2a). The stroboscopic camera was used to record subsequently 250 flying dropletsper printing buffer. By analyzing ejected droplet volumes for one single nozzle the CVwas found to be less than 1 % (see Fig. 3.2b) [116,117].
3.1.1.2 DROPLET VELOCITY
To determine the droplet velocity two pictures from the observed dispensing processare necessary. The first picture shows the droplet a short-time after the tear-off and thesecond picture shows a droplet after a flight distance of 340 µm. Both pictures wereoverlaid so that the distance between the droplets can be measured like it is displayedin Fig. 3.3. The delay time between these two records can be taken to be the delay timeset (Δt information) in the camera control software. The droplet velocity is determinedby dividing these two values, assuming a constant velocity (see Fig. 3.3b).
The limited resolution of the used stroboscopic camera and the arrangement of thenozzles on the printhead do not allow for the evaluation of all 24 nozzles at the sametime (confer Fig. 3.10). Only one row of the 4x6 array is in focus and the remaining
Figure 3.2: Screenshots of the GUI of the image analysis system NeuroCheck®. a.) The first pro-grammed sequence allows for the calibration of the captured stroboscopic pictures. b.) In the secondstep the program was used for the precise automated evaluation of camera data of droplet deflectionand droplet volumes.
Figure 3.3: Measurement of droplet velocity: a.) Analyzing the recorded stroboscopic camera pictureswith a delay time of 530 µs. b.) Corresponding calculation of the droplets velocity.
a) b)
a) b)
vd left( )500μm
358 Pixel----------------------- 244Pixel
530μs-----------------------⋅ 0.64m s⁄= =
vd right( )500μm
358 Pixel----------------------- 246Pixel
530μs-----------------------⋅ 0.65m s⁄= =
- 56 - TOPSPOT: HIGHLY PARALLEL NANOLITER DISPENSING - OPERATING CONDITIONS AND DESIGN RULES

DISSERTATION REMIGIUS NIEKRAWIETZ EXPERIMENTAL INVESTIGATION OF THE PRINTING PROCESS
droplets in the background are out of focus. This limitation makes it impossible to giveprecise information about the droplet diameter and the homogeneity of all ejecteddroplets in one evaluation step. Furthermore, the print module should not exceed themaximum distance of 1 mm to the slide loaded tray. Due to the difficult accessibility,the camera can only be mounted beside the slide tray. Therefore, this droplet controlmethod can only be used for a pre-print quality control of the droplet ejection but notduring the production of microarrays. A drift of print parameters, which can occur dur-ing the microarray production cannot be detected and compensated.
3.1.2 ANALYSIS OF ALL 24 PARALLEL DISPENSED SPOTS
To achieve an evaluation of all 24 parallel dispensed spot volumes in one evaluationstep the fluorescence image analysis method and an online monitoring by camera wasused. In theory the measured integral intensity of a fluorescence signal is proportionalto the number of fluorescence molecules in the spot. Consequently, a linear relation-ship to the ejected droplet volume should exist.
The online monitoring of spotted droplets on the substrate is used to measure thespot diameter and draw conclusions on droplet volume (see equation 2.87).
3.1.2.1 FLUORESCENCE IMAGE ANALYSIS
The fluorescence method is a widely used tool in analytical bioscience. The used flu-orescence imager Bioanalyzer 4S (LaVision BioTec) is an ultra sensitive CCD camerabased instrument for the imaging of microarrays and related formats [120]. The detec-tion is done by a peltier cooled CCD camera with a resolution of 10 µm. The detectionsensitivity is down to 0.8 Cy3 molecules/µm². Cy3 and Cy5 are reactive watersolublefluorescent dyes used for labelling proteins, peptides, DNA, RNA, and other biomole-cules. The system enables fast imaging (< 30 seconds per slide at 10 µm resolution).For fluorescence image analysis the integrated FIPS software is used [D5].
The fluorescence image method, which analyses all spots at once, represents an al-ternative method to the stroboscope camera. This typical microarray approach wasused by mixing the printing solution with Cy3-labeled oligonucleotides (20mer, 1 µMfinal concentration). In this case the number of the dispensed molecules should beequal to the number of fluorophores and therefore proportional to the fluorescence in-tensity of fluorophores. Hence the fluorescence signal should provide information ofthe dispensed droplet volume. In the experiments the fluorescence signal intensity ofthe spots was determined on microarray slides. The fluorescence based quantificationshowed a homogeneous result with a CVs of signals over all 24 spots to be better than3.1 % depending on the used printing buffer (see Fig. 3.4). However, the measurementresults are very time critical because of environmental influence factors, e.g. humidityor temperature. Hygroscopic additives like DMSO (Fig. 3.4), betaine or glycerol in theprinting buffer avoid the formation of donuts, but the accumulation of water alsochanges the intensity of the fluorescence signal [M1], [M2], [M3]. A residence time ofonly 1 minute causes a higher CV (4.2 %) fluorescence signal of the microarray spots.
TOPSPOT: HIGHLY PARALLEL NANOLITER DISPENSING - OPERATING CONDITIONS AND DESIGN RULES - 57 -

EXPERIMENTAL INVESTIGATION OF THE PRINTING PROCESS DISSERTATION REMIGIUS NIEKRAWIETZ
Furthermore, measurement errors due to the fluorescence method on the microarrayslides, e.g. quenching of the used fluorochromes or crystallization effects in spots, canadulterate the results as it can be seen in Fig. 3.5. Hence, the intensity of the fluores-cence signal is strongly influenced by the media and the environmental properties,which complicates the calculation of the actual dispensed droplet volume. An estima-tion of the absolute droplet volume was found to be very inaccurate and therefore thismethod was not used for measurement of droplet volume.
Figure 3.4: Time critical evaluation of the fluorescence signal intensity a.) Comparison of the signalintensity of a 1 µM Cy3-labeled 20mer oligonucleotides in 30 % (v/v) DMSO buffer solution directlyafter the print process (CV 3.1 %) and after a residence time of 1 min (CV 4.2 %). b-c.) The right sideshows the fluorescence image of the printed spots.
Figure 3.5: Environmental influence factors on the fluorescence signal intensity a.) The evaporation1 µM Cy3-labeled 20mer oligonucleotides in 0.5 xPBS buffer solution shows an inhomogeneous inten-sity of the array [M4] b.) The granulation of 1 µM Cy3-labeled 20mer oligonucleotides in 3 xSSC0.002 % NONIDET buffer solution leads to a changing of the fluorescence signal intensity [M5]
a) b)
c)
a) b)
- 58 - TOPSPOT: HIGHLY PARALLEL NANOLITER DISPENSING - OPERATING CONDITIONS AND DESIGN RULES

DISSERTATION REMIGIUS NIEKRAWIETZ EXPERIMENTAL INVESTIGATION OF THE PRINTING PROCESS
3.1.2.2 ONLINE MONITORING BY CAMERA
The spot diameter on the slide is a more practicable value to draw conclusions aboutthe droplet volume. However, the evaporation of the spots is again a time critical pa-rameter. Temperature and relative humidity of the air have a major impact on the evap-oration velocity of the nanoliter spots on the microarray slide. The air conditioningkeeps the temperature in the laboratory relatively constant at ambient conditions. Tocontrol the relative humidity to the surrounding laboratory during the printing the Top-Spot device was surrounded with a housing. Relative humidity in the device was reg-ulated by a simple humidifier by using moisturized cleanroom paper, which evaporatesthe water under the tray of the printing device. The variation of relative humidity dur-ing printing led to an optimal value of 40-60 % for reproducible and stable printing.Less humidity resulted in a higher risk of clogging the printhead nozzles due to crys-tallization of the printing buffer. Higher humidity can lead to condensation on theprinthead nozzle array and the droplet ejection process becomes unstable [121].
An optical check of the microarrays after the spotting is rather complex, because thedrying of the nanoliter spots occurs very fast and cannot be avoided completely by con-trolling the temperature and humidity. During the drying process the spots can alsomove away from the dispensed position, crystallise or become invisible to the camerasystem after drying (Fig. 3.6). Since these are time-critical processes it is essential to
analyse the droplets immediately after the spotting. Therefore, the CCD Dolphin F-201B camera system (1628 (H) x 1236 (V), Allied Vision Technologies) [D6] wasmounted under the slide tray and was used for optical process control of the spottedmicroarray. The tray has a recess for each slide position, which enables online moni-toring of all 24 parallel dispensed spots during the microarray production. Due to the
Figure 3.6: Evaporation of the 24 nanoliter spots on a microarray slide: The conditions in the labora-tory are kept relatively constant at a temperature of 20°C and the relative humidity of 42 %. a.) Thefirst picture sequence shows a double spot by sodium carbonate (1 M pH 9.6) printbuffer. Because of anon-uniform evaporation of the array the spot size looks unequal. b.) The second camera pictures showa 1 M PBS buffer solution of 24 single spots. As a result of the evaporation the spots move away fromcenter of the deposited positions and begin to crystallise.
a)
b) 1.5 sec 3.0 sec 4.5 sec
1.5 sec 3.0 sec 4.5 sec
TOPSPOT: HIGHLY PARALLEL NANOLITER DISPENSING - OPERATING CONDITIONS AND DESIGN RULES - 59 -

EXPERIMENTAL INVESTIGATION OF THE PRINTING PROCESS DISSERTATION REMIGIUS NIEKRAWIETZ
fact that the slides are optically accessible for the camera from the bottom side, it ispossible to analyse the microarrays without evaporation and without additional move-ment of the tray.
AUTOMATIC DETERMINATION OF OPTIMAL PRINT PARAMETERS FOR UNKNOWN PRINTING MEDIA: The image processing software NeuroCheck® was used in combination with a pro-grammed closed loop by the software TestPoint. The measuring system consists of afixed mounted TopSpot printing module with two axes in order to move a 20-positionslide tray and the camera like displayed in Fig. 3.7. A trigger signal handles the precisetiming between the piezo actuation, the acquiring of the camera picture and the move-ment to the next slide position by TestPoint. The acquired pictures are analysed in Neu-roCheck®. The constructed system is able to measure the spot diameters, detectmissing spots, satellites, dirt particles on the slide and the position of the spots in thearray.
Figure 3.7: TopSpot printing device a.) Adjustment of printing parameters for the specific printingmedia. The camera is mounted directly underneath the printing module. This enables an on-line qualitycontrol of the printing process and ensures the high quality of printed microarrays. b.) The picturesequence 1-8 shows also the highly correct positional accuracy of the spotted microarrays. The deflec-tion of all spots is less than 8 µm from a regular 500 µm grid.
a)
b)
- 60 - TOPSPOT: HIGHLY PARALLEL NANOLITER DISPENSING - OPERATING CONDITIONS AND DESIGN RULES

DISSERTATION REMIGIUS NIEKRAWIETZ EXPERIMENTAL INVESTIGATION OF THE PRINTING PROCESS
First the camera system was used for a pre-print control to find the ideal parametersfor each printing solution. The pressure pulse was adjusted by the variation of the piezostroke. The automatic control loop begins with a small pre-selected piezo stroke (Fig.3.8). After the printing NeuroCheck® compares the number of spots on the picture with
Figure 3.8: The integrated image processing software: The system measures the spots diameter,detects missing spots, satellites, dirt particles on the slide and the position of the spots in the array.a.) The red point in the array shows, that one spot is missing. If spots are missing, the control loop willincrease the displacement of the actuator. b.) The optimal pressure parameter for the printing solutionwas found. All spots of the array are green. To ensure the existence of all the spots the dispenser printsthree times with the same self-detected parameter. The picture sequence (1-5) shows the intermediatesteps from missing spots until the whole array is printed. c.) Database for storing the optimum processparameter of the dispensing medium and the resulting spot radius on the used slide.
a)
b)
c)
TOPSPOT: HIGHLY PARALLEL NANOLITER DISPENSING - OPERATING CONDITIONS AND DESIGN RULES - 61 -

EXPERIMENTAL INVESTIGATION OF THE PRINTING PROCESS DISSERTATION REMIGIUS NIEKRAWIETZ
the number of the nozzles of the used printhead. Further the program checks the ex-pected spot positions of the array. If all spots are missing the control loop will increasethe displacement of the actuator by 3 µm. If half the number of spots on the array aredetected the displacement will be increased only by 1 µm. The displacement of the pi-ezo stack can be adjusted by this simple algorithm to find the ideal pressure parameterfor each printing solution. To ensure the presence of all spots the dispenser prints threetimes with the same self-detected parameter. If the following spots on the array areequal to the number of nozzles of the printhead and homogeneous in their size the pa-rameters will be stored in a database. The database dose not only store the print param-eters but also the printing medium, the substrate and the calculated spot diameter andenables the loading of the process parameter for the replication of the microarrays (seeFig. 3.8).
CONTROL LOOP: In a second step this online quality control was coupled with a control loop during thewhole microarray production. In the case of missing spots or satellites a separate slidelocated on the tray is used. The actual print process is interrupted and the control lopis started. If all failures are corrected the print process will be continued. The controlloop assures a constant high quality of all printed microarrays. Since the standard op-eration procedure of printing includes this described online quality control loop themulti-ejection of droplets per nozzle could be eliminated. This multi-ejection, whichnormally consists of main droplets and satellites, was responsible for an increased CVof the spot diameter up to 15 % (Fig. 3.9a). As a result of this process control a CV of 1.5 % for all 24 spot diameters was achieved,which demonstrates stable, homogenous and reproducible results even after hundredsof printed arrays like displayed in Fig. 3.9b.
The highly correct positional accuracy of the microarrays spotted with the TopSpotprinting device is a direct result of the optimized print parameters. Higher spot densi-ties were achieved on the microarray slides by printing between the spots of a printedarray. As a consequence the 500 µm nozzle spacing of the printhead could be reducedto a 250 µm spacing of the spotted arrays. Afterwards it was spotted a second time atthe same place on the generated 250 µm spacing array and demonstrated, that even a
Figure 3.9: Array of 24 spots 40 % v/v glycerol Cy3-labeled on a coated glass slide a.) The pressurepulse is too high. Red marked spots indicate multi-ejection, which consist of main droplet and satel-lites, single spots are marked green. b.) The pressure pulse is well optimized for the printing solution.All spots on the array are very similar in size CV 1.5 %.
a) b)
- 62 - TOPSPOT: HIGHLY PARALLEL NANOLITER DISPENSING - OPERATING CONDITIONS AND DESIGN RULES

DISSERTATION REMIGIUS NIEKRAWIETZ EXPERIMENTAL INVESTIGATION OF THE PRINTING PROCESS
250 µm spacing of double spots is possible (Fig. 3.7). The spot positions of the cap-tured printed arrays were measured. The deflection of the spots was less than 8 µmfrom the regular 500 µm grid.
3.1.3 ERROR CONSIDERATION OF THE MEASUREMENT METHODS
Error analysis is an essential evaluation of uncertainty in measurements. Error existsin all experiments, basically every measurement of a physical value is loaded with anerror, i.e. the measured value x is not correct. Hence, error analysis has to be consid-ered for the optical and the fluorescence image analysis of the droplets to achieve ageneral knowledge of likely error sources. The observational error Δx of a measure-ment is the difference between a measured value x and its true value xt:
The true value cannot be determined certainly, so a confidence interval is specifiedrather than stating the measured value:
Generally, errors can be divided into two kinds of errors occurring in experimental ex-aminations.
Systematic errors are errors, which tend to shift all measurements in a systematicway, so that their mean value is displaced. A systematic error can arise from imperfectmeasurement equipment, neglected influences (pressure, temperature and others) orequipment affecting the considered device. Large systematic errors can and must beeliminated in a good experiment by using a calibration or correction. But small system-atic errors will always be present. For instance, no instrument can ever be calibratedperfectly. Systematic errors, which are not ascertainable, are estimated and added tothe random error.
Figure 3.10: Stroboscopic picture of the dispensing process of 24 droplets a.) An exaggerated pres-sure pulse will indicate satellites. b.) Pressure pulse ideally adjusted for the printing medium leads to aperfect ejection of 24 single droplets.
(3.2)
(3.3)
a) b)
Δx x xt–=
x x Δx±=
TOPSPOT: HIGHLY PARALLEL NANOLITER DISPENSING - OPERATING CONDITIONS AND DESIGN RULES - 63 -

EXPERIMENTAL INVESTIGATION OF THE PRINTING PROCESS DISSERTATION REMIGIUS NIEKRAWIETZ
Random errors are errors, which fluctuate from one measurement to the next. Theyyield results distributed about some mean value. Random errors can occur for a varietyof reasons like an inaccurate reading of a measurement display or statistically actinginfluences like vibrations or voltage fluctuations.For single measurements the random error has to be estimated. For numerous measure-ments the random error and the confidence interval can be calculated using statisticalmethods.For the calculation of the confidence interval two values are calculated, the arithmeticmean value and the standard deviation. If an experiment is performed n times, the arith-metic mean value can be calculated of the single results, x1, x2 ... xn [70], [122]:
All single results are differing more or less from the mean value. A quantitative valuefor this deviation is the standard deviation s [70], [122].
The coefficient of variation (CV) is defined as the ratio of the standard deviation to themean value:
3.1.3.1 ERROR CONSIDERATION FOR THE STROBOSCOPIC IMAGING
The first error source is the calibration method, which is used for the precise analysisof the recorded droplets by NeuroCheck® (see chapter 3.1.1.1). A systematic errorcould occur if the nozzle pitch of 500 µm is varying from printhead to printhead. Dueto the high precision alignment of photolithographic masks and the used manufactur-ing process (DRIE), nozzle pitches were obtained with an accuracy of ± 0.5 µm.
A further systematic error can be found in the read out of the pixels for the determi-nation of the droplet diameter and the travelled distance. This error is based on twoproblems. Firstly, high droplet velocities cannot be captured at a fixed position becauseof the limited shutter time of the camera and result into blurred pictures. Secondly, thenumber of pixels representing one droplet is limited due to the resolution of the usedcamera. The pixels of the nozzle diameter chosen for the calibration as well as the pix-els measuring of the droplet diameter are equipped with an error. The determination ofthe droplet diameter leads to an estimated total maximum error of about 4 %, because
(3.4)
(3.5)
(3.6)
x 1n--- xi
i 1=
n
∑⋅=
s 1n 1–------------ xi x–( )2
i 1=
n
∑=
CV sx--=
- 64 - TOPSPOT: HIGHLY PARALLEL NANOLITER DISPENSING - OPERATING CONDITIONS AND DESIGN RULES

DISSERTATION REMIGIUS NIEKRAWIETZ EXPERIMENTAL INVESTIGATION OF THE PRINTING PROCESS
all errors have to be summarized. The droplet diameter affects to the droplet volumewith the power of three, so the total maximum error for the droplet volume calculatedby equation 3.1 can be estimated to be 12 %.
For the calculation of the droplet velocity the flight distance as well as the flighttime have to be considered. The random error of the flight distance can also be estimat-ed to be 4 % because of the same reasons like those for the droplet diameter. An addi-tional systematic error for the stroboscopic imaging can be found in the time countingof the PC. An insufficiently accurate time counting can lead to an error calculating thedroplet velocity. Since no corresponding data from the manufacturer is available themaximum error is assumed to be 10 % of the used time delay. For example if the drop-let flight distance is determined to be 500 µm ± 4 % (20 µm) at a delay time of 500 µs± 10 % (50 µs), the resulting droplet velocity can be calculated to 1 m/s ± 0.15 m/s.
3.1.3.2 ERROR CONSIDERATION FOR THE CAMERA IMAGING
The error consideration for the camera imaging is basically the same as presented inthe previous section for the stroboscopic measurements. A systematic error for thecamera imaging can be found in the calibration method of the automated image pro-cessing by NeuroCheck® and the number of pixels representing one spot is also limitedby the resolution of the used camera (4 %). A random error occurs due to the contactof the droplet with the substrate, the spot diameter can be influenced by inhomoge-neous substrate coatings as well as particles and satellites, which change the wettingbehavior (10 %). Because the evaporation and drying of the nanoliter spots is very fastand cannot be avoided completely by controlling the temperature and humidity, a sys-tematic error has also to be considered here. Due to the absence of an established valuefor different liquids the maximum systematic error is assumed to be less than 2 % ofthe measured value.
3.1.3.3 ERROR CONSIDERATION FOR THE FLUORESCENCE IMAGE ANALYSIS
The evaporation plays a major role for the error consideration of the fluorescence im-age analysis, which uses the integral intensity of the fluorescence signal to draw con-clusions on droplet volume. Due to several interfering parameters like quenching,pipetting errors, inhomogeneities on slide surfaces, hygroscopic additives and crystal-lization effects in spots errors greater than 100 % are possible (see Fig. 3.5). The sys-tematic error due to the number of pixels representing one spot is also limited by theresolution (10 µm) of the used CCD camera but is of no consequence (5 %).
3.1.4 ARRAY HOMOGENEITY
Chapter 3.1.2.2 shows, that a high homogeneity of the dispensed droplet volumes inthe microarrays can be achieved. Nevertheless, the hydrophobic coated area around thenozzles is an important factor for reproducible droplet ejection. The quality of the coat-ed nozzle surface and the cleaning procedure of the reusable printheads are major in-fluence factors for the array homogeneity.
TOPSPOT: HIGHLY PARALLEL NANOLITER DISPENSING - OPERATING CONDITIONS AND DESIGN RULES - 65 -

EXPERIMENTAL INVESTIGATION OF THE PRINTING PROCESS DISSERTATION REMIGIUS NIEKRAWIETZ
3.1.4.1 COATING OF PRINTHEADS
In many microfluidic devices a bifunctionalization with hydrophilic and hydrophobicsurfaces is required. Also the filling of TopSpot printheads is based on capillary forcesof microchannels, so they have to be hydrophilic in order to enable autonomous filling.In contrast, the area around the nozzles has to be hydrophobic to ensure homogenousdroplet ejection [52].
A stable and reproducible droplet ejection was mainly achieved by improvementsin the homogeneity of the nozzle surface coating. Variations in the manufacturing ofthe printhead nozzles can be neglected due to the very high precision of the used etch-ing process [DRIE]. Tiny differences in the homogeneity of the hydrophobic layerhave significant influence on the droplet release process. Especially, the hydrophobiccoating at the small area around the nozzles (the edge of nozzles) is affected by theprinting media.
Hence, a quality control of the coated nozzle plate is necessary to ensure homoge-neous results. For this the printheads were filled with a betaine buffer solution and thedroplet flight was checked by the stroboscopic camera. The droplet flight showed, thatfresh homogeneously coated printheads led to an improved droplet ejection with a re-producible droplet volume, velocity and placement on the slide. Additionally, charac-
terization studies of different hydrophobic coatings on the nozzle array wereperformed. Therefore, sticky media (plasmids DNA) and wetting media (high concen-tration of surfactants) were printed [53,121]. An amiss coated nozzle surface couldlead in combination with a liquid with a high concentration of surfactants to an acutewetting of the nozzles and also to a cross-contamination of dispensing media (see Fig.3.12).Stroboscopic images of the droplets flight further showed, that printheads coated withan optimized selective removal coating method led to improved homogeneity of thedroplet diameter and velocity compared to the standard coating process of printheadsaccording to Breisch et al [52].
The selective removal hydrophobic coating method was developed and studied byGutmann et al [53,121]. It started with a standard printhead cleaning and surface acti-vation by an O2-plasma treatment (see Fig. 3.13). Immediately after the plasma treat-ment the printheads are coated with silane perfluorodecyldimethylchlorosilane(PFTCS) [M6]. During the coating process the hydrophilic microchannels and nozzlesare not protected. An amount of 5 µl of the coating solution is dispensed onto the noz-zle array and an incubation time of only 10 seconds is needed to achieve reproducible
Figure 3.11: Quality control of the coated nozzle plate a.) Bad coated nozzle plate with inhomoge-neous droplet flight b.) Good coated nozzle plate shows all droplets with same velocity and size.
a) b)
- 66 - TOPSPOT: HIGHLY PARALLEL NANOLITER DISPENSING - OPERATING CONDITIONS AND DESIGN RULES

DISSERTATION REMIGIUS NIEKRAWIETZ EXPERIMENTAL INVESTIGATION OF THE PRINTING PROCESS
coating. Hence, both parts, nozzle surface and microchannels are coated. After remov-al of unbound silane by short rinsing with acetone and deionized water, the hydropho-bic coating within microchannels is selectively removed. A PDMS-layer(PolyDiMethylSiloxane) is applied to protect the hydrophobic coating of the nozzle ar-ray (contact angle of ) from being removed by O2-plasma. Only the hydro-phobic coating within the microchannels is removed, which enables the capillaryfilling of the printhead [53,121].
Figure 3.12: Stroboscopic pictures of a dispensing cycle from an amiss coated nozzle surface a-d.) Thehigh concentration of the surfactant [Nonidet 0.1 % (v/v) in 3x SSC] in the liquid caused an acute wet-ting of the nozzle surface and also a cross-contamination of the dispensing media.
Figure 3.13: Schematic cross-section of the printhead during the selective hydrophobic coating pro-cess. Total operating time: 5 min. a.) O2-plasma cleaning and activation of the silicon surface (700 W,0.02 mbar, 2 min) b.) Incubation (10 s) of nozzle surface with PFTC silane (5 µl, indicated in red)c.) Removal of unbound silane by rinsing with excess of acetone and deionized water (about 20 ml) andmasking of nozzle array with PDMS (green) and removal of bound silane in microchannels and nozzleswith O2-plasma (2 min) d.) Removal of PDMS, the conformal contact between PDMS and nozzle arrayensures reproducible protection of hydrophobic coating, while the hydrophilic microchannels enablecapillary filling.
a) b)
c) d)
Θ 130°≈
a) b)
c) d)
TOPSPOT: HIGHLY PARALLEL NANOLITER DISPENSING - OPERATING CONDITIONS AND DESIGN RULES - 67 -

EXPERIMENTAL INVESTIGATION OF THE PRINTING PROCESS DISSERTATION REMIGIUS NIEKRAWIETZ
3.1.4.2 CLEANING PROCEDURE FOR THE PRINTHEADS The silicon printhead is reusable, so it is very important to have a suited washing pro-cedure. After each usage it is important to clean the complete microfluidic structure.Additionally, filtering of the cleaning solutions using 0.2 µm filters avoids clogging ofthe printhead microchannels by particles and improves the surface cleanliness of thenozzle plate (Fig. 3.14). A contaminated nozzle surface avoids a homogenous dropletejection process, hence a reuse of the printheads. To ensure an efficient cleaning theprintheads nozzle surface must be controlled after each cleaning.
Further, the cleaning procedure needs to address three main demands: 1. guarantythat no carry-over of previous fillings to the next use of the printhead can take place,2. assure capillary self-filling of the printhead, 3. retain the hydrophobic coating of thenozzle array.
The following washing protocol was used for cleaning the printhead. In the first stepa washing bottle is used for rinsing the printhead with deionized water (0.2 µm filtered)in order to remove any remaining printing media from the reservoirs. The printhead ismounted top side up into the corresponding adapter of the washing station and the lock-ing mechanism is closed (see Fig. 3.15). Overpressure (1 bar) is applied onto the5 % (v/v) RBS cleaning solution and 50 ml is transported through the microchannelsand nozzles of the printhead [M7]. During the 5 minute cleaning procedure, the adapteris dipped in a glass beaker filled with deionized water within the sonicator bath at 80°C[D7]. Afterwards the Y-valve is used for changing the cleaning liquid to H2Odeion. Thewashing station is transferred into the second beaker containing fresh deionized water
Figure 3.14: Quality control of the cleaned nozzle plate a.) A dirty nozzle array without filtering of thecleaning solution results in a inhomogeneous droplet flight b.) Shows a well cleaned nozzle plate
Figure 3.15: Cleaning station of the 24er printheads a.) Cleaning procedure for the printheadsb.) Placing the printhead in the cleaning station and closing the locking mechanism.
a) b)
a) b)
- 68 - TOPSPOT: HIGHLY PARALLEL NANOLITER DISPENSING - OPERATING CONDITIONS AND DESIGN RULES

DISSERTATION REMIGIUS NIEKRAWIETZ EXPERIMENTAL INVESTIGATION OF THE PRINTING PROCESS
within the sonicator bath for additional 5 minutes at 80°C. Then the printhead is un-loaded and manually dried with nitrogen. This standard washing procedure was testedfor 24 as well as 96 channel printheads.
Carry-over of printing media from one usage to the next must be excluded. Addi-tionally, in this highly parallel system it is crucial to prevent any cross-talk between the24 and 96 channels during the printing. To evaluate both aspects every second reser-voir was filled with Cy3-labeled oligonucleotides (1 µM) and the remaining reservoirswith pure printing buffer.
The arrays were printed onto microarray slides and detected via the fluorescencereader. Without cross-talk between the 24 nozzles of the printhead they look like acheckerboard. Afterwards the checkerboard-like filled printhead was cleaned accord-ing to the standard washing procedure. Then the checkerboard-like filling was in-versed, so every nozzle, which was filled with fluorescence labeled printing media wassubsequently filled with buffer solution and vice versa. The evaluation of the washingprocedure showed no cross-talk of the different microchannels, nozzles and dispenseddroplets even after thousands of printed arrays. Furthermore, the re-use of printheadsshowed, that after washing and re-using of printheads no carry-over of formerly printedmedia was detectable.
3.2 INTEGRATED PRESSURE DETECTION
Monitoring the fundamental process parameters is indispensable to satisfy significant-ly increased demands on high quality microarrays. Hence, an integrated process con-trol of a highly parallel non-contact dispenser is of major importance. As described inthe introduction (see chapter 1.2.3.1) the working principle of the TopSpot dispenseris based on the pneumatic compression of a defined gas volume. The pressure pulse isacting on all nozzles simultaneously and leads to the ejection of the droplets. Accord-ingly, the most important parameter to control the dispenser is the generated pressurepulse. Therefore, a pressure sensor was integrated into the print module to acquire thetransient pressure pulse during droplet ejection [117].
Figure 3.16: Carry-over test: a.) The printhead was filled with Cy3-labeled oligonucleotides andprinted buffer like a checkerboard. b.) The printed microarrays were evaluated in a fluorescencereader c.) Afterwards the printhead was washed, refilled with the inversed checkerboard filling andprinted again. Only the spots with Cy3-oligonucleotides are visible, indicating that neither cross-con-tamination nor carry-over occurred.
a) b) c)
TOPSPOT: HIGHLY PARALLEL NANOLITER DISPENSING - OPERATING CONDITIONS AND DESIGN RULES - 69 -

EXPERIMENTAL INVESTIGATION OF THE PRINTING PROCESS DISSERTATION REMIGIUS NIEKRAWIETZ
3.2.1 SEALING OF THE ACTUATION CHAMBER
The pressure pulse strongly depends on the sealing of the actuation chamber. Currentlythis chamber is enclosed by a seal ring between the piston and the upper pyrex layer.The actuation chamber encompasses an air volume between the side wall of the pistonand the pyrex layer, which can not be compressed during the piston movement like dis-played in Fig. 3.17. This uncompressed air volume is called dead-volume. Between thebottom of the print window and the piston there is a gap of 200 µm. The whole initialair volume of about 19 µl consists in sixth part of the dead-volume. To achieve a highpressure pulse for the droplet ejection process the dead-volume in the actuation cham-ber has to be reduced. So a new sealing method was developed. It was important, thatthe modifications change the entire system as little as possible to be able to use the es-tablished print module. Taking this into account a new PDMS sealring was developed,which enclosed the piston accurate to dimension [117,118]. This enabled a direct seal-ing on the silicon layer and eliminated the dead-volume in the actuation chamber.
Figure 3.17: Sealing methods of the actuation chamber a-b) Inefficient sealing of the actuation cham-ber, which includes a dead-volume between piston and the upper pyrex layer. c) Optimized sealingmethod of the actuation chamber as a result of direct sealing by PDMS. The pressure sensor was inte-grated in the lower part of the piston.
a)
b)
c)
- 70 - TOPSPOT: HIGHLY PARALLEL NANOLITER DISPENSING - OPERATING CONDITIONS AND DESIGN RULES

DISSERTATION REMIGIUS NIEKRAWIETZ EXPERIMENTAL INVESTIGATION OF THE PRINTING PROCESS
3.2.1.1 PDMS PROCESSING
The elastomeric polymer PDMS is a commercially availablestructurable, biocompatible, physically and chemically stable sil-icone rubber [123,124]. Due to the need of precise dimensions ofthe actuation chamber and a low strain transfer on the printheadduring the actuation, PDMS is the material of choice. Siliconeelastomers Sylgard 184 [M8] and Sylgard 186 [M9] from DowCorning were used. The starting point of each PDMS processingwas always the mixing of base and curing agent of the siliconeelastomer. They had to be thoroughly mixed using a weight ratioof 10:1 [125,126]. To adjust elastomer hardness, the diluter DowCorning 200 Fluid 50 cS [M10] was added to the main compo-nents. The mixture was filled into the casting mould and after-wards it was degassed [D8] at a pressure of 9 mbar for 20 to 45minutes to remove all air bubbles. For curing the mold was put for5 hours into an oven at 60°C [125,126]. The digital [Zwick/Roell]hardness tester was used to determine the hardness of the PDMSrubber (see Fig. 3.18). Prerequisite for tests according to test standard are specimenwith plane parallel contact areas of at least 35 mm diameter and a minimum thicknessof 6 mm [D9]. Fig. 3.19 shows the measured relationship between amount of diluter invol-% of the total mixture and elastomer hardness.
3.2.1.2 FABRICATION OF THE PDMS SEAL RING
The PDMS seal rings were formed in a separate castingmould to have the opportunity of testing different shorehardness parameters and shapes. The master, whichconsisted of a PMMA base plate and an aluminium in-sertion, was fabricated for casting up to 9 different in-sets in parallel (see Fig. 3.21a,b). The aluminiuminsertions had the same outside outline as the pistonand were placed into the round 9 mm holes of the
Figure 3.19: Elastomer hardness versus amount of diluter in the silicone elastomer
Figure 3.18: DigitalPDMS hardness tester[Zwick/Roell]
Specimen
Figure 3.20: Dimensions of theejected PDMS seal rings
TOPSPOT: HIGHLY PARALLEL NANOLITER DISPENSING - OPERATING CONDITIONS AND DESIGN RULES - 71 -

EXPERIMENTAL INVESTIGATION OF THE PRINTING PROCESS DISSERTATION REMIGIUS NIEKRAWIETZ
PMMA plate. Subsequently they were fixed by screws and 0.5 ml of the SG 186 mix-ture was dispensed with standard laboratory equipment into each of the nine cavities.The mold was cured for five hours in an oven at 60°C before the insets were taken outof the master form. The formed PDMS seal rings had an external diameter of 9 mm anda thickness of 500 µm (see Fig. 3.20). The combination of the PDMS-seal-ring, whichhas a unique flexibility, and the piston allows to seal the printhead directly on the sili-con layer.
Although the dead-volume in the actuation chamberwas eliminated by this design, the new PDMS sealingmethod generated a lower pressure pulse in the actua-tion chamber during the dispensing process. To mon-itor the behavior of the seal ring during thedeformation a simulation model was developed inCOSMOSWorks [127]. COSMOSWorks uses the Fi-nite Element Method (FEM). FEM is a numericaltechnique for analyzing engineering designs. FEM di-vides the model into many small pieces of simpleshapes called elements (triangular) effectively replac-ing a complex problem by many simple problems thatneed to be solved simultaneously. The contact condi-tion between the PDMS seal ring and piston piece wasNode to Node. The mesher creates compatible meshes at areas common to source andtarget faces. The nodes associated with the two parts on common areas are coincidentbut different. COSMOSWorks creates a gap element connecting each two coincidentnodes. The gap element between two nodes prevents interference but allows the twonodes to move away from each other. The boundary condition was an 80 µm displace-ment of the piezo stack on the upper part of the piston (see Fig. 3.23a). The simulationresults show an elastic deformation of the seal ring on a large-area range of 3.4 mm.As a result of the insufficient contact pressure of the PDMS seal ring on the printheadthe compressed air could exhaust from the actuation chamber. This hypothesis wastested by calculating a new PDMS ring, which comprised a sealing lip as modificationlike pictured in Fig. 3.22. This sealing lip reduced the deformation range to 450 µm andcaused a stronger deformation on the lower part of the seal ring, which results in a high-
Figure 3.21: Fabrication of the PDMS seal rings a.) Cross-section of the PMMA casting mold withaluminium insertions, which have the same outside outline as the piston b.) Detail view of the castingmould
a) b)
Figure 3.22: Dimensions of theejected PDMS seal ring with asealing lip.
- 72 - TOPSPOT: HIGHLY PARALLEL NANOLITER DISPENSING - OPERATING CONDITIONS AND DESIGN RULES

DISSERTATION REMIGIUS NIEKRAWIETZ EXPERIMENTAL INVESTIGATION OF THE PRINTING PROCESS
er contact pressure (see Fig. 3.23b). The modificated PDMS seal ring led to a dramaticperformance improvement pertaining to the generated pressure pulse and enabled thedispensing of highly viscous media. The consolidated findings were transferred intothe construction of a new casting mold, which forms rings with a sealing lip. Due to amore complex shape of the seal ring the casting mold must consist of three componentsas depicted in Fig. 3.24a-b.
3.2.2 PRESSURE SENSOR
To be able to capture the pressure signal during the actuation a pressure sensor was in-tegrated into the actuation chamber. Some considerations had to be made concerningthe measurement range of such a sensor. Assuming a maximum displacement of thepiston (80 µm) by the piezo stack the pressure can reach up to 80 kPa in worst case,which is equivalent with a flooded actuation chamber (see Fig. 3.34). As the changes,that are to be measured, occur in the time-scale of ten microseconds, the minimum res-onance frequency should be at least 500 kHz to obtain a correct measurement.
Figure 3.23: COSMOSWorks simulation results of the of PDMS seal ring deformation a.) The 80 µmdisplacement of the piston effected a deformation, which is distributed on the 3.4 mm range of thePDMS seal ring b.) An additional sealing lip reduced the deformation range to 450 µm and caused astronger deformation on the lower part of the seal ring.
Figure 3.24: Fabrication of the PDMS seal rings with sealing lips a.) Cross-section of a casting moldconsisting of a two layer base plate (aluminium and PMMA) and aluminium insertion. b.) Detail viewof the casting mould.
a) b)
a) b)
TOPSPOT: HIGHLY PARALLEL NANOLITER DISPENSING - OPERATING CONDITIONS AND DESIGN RULES - 73 -

EXPERIMENTAL INVESTIGATION OF THE PRINTING PROCESS DISSERTATION REMIGIUS NIEKRAWIETZ
Another requirement for the sensor is, that the device should not absorb too muchvolume for the sensing process. If the pressure change dP needed to measure a volumechange dV becomes too large, the sensor acts as a fluidic capacitance and influencesthe dispensing process.
All these requirements are met by micro pressure sensors made by silicon machin-ing like the AE-DS 26-series manufactured by Activ-Sensor [128]. They measure therelative pressure by using the bending of a plate, which induces stress in the plate ma-terial. The stress is read out by using the piezoresistive effect. Changes in the electricalresistances occur due to the stress in the material. To correct the thermal drift of thepiezoresistive effect, there is also a pn-junction diffused onto the chip, that allows fortemperature monitoring of the sensor. The palette of available sensors ranges frompressures between 1 kPa to 400 kPa. The small area of the membrane (1.1 mm x1.1 mm) reduces the dead-volume needed for the sensing process and allows high res-onance frequencies in the range of 13 MHz. By using a Wheatstone bridge likesketched in Fig. 3.25, these changes are reflected in a bridge voltage, which can be readout and amplified easily. The bridge voltages are in the range of several mV, thus anamplification near to the sensor is needed. No further noise should be coupled into thesignal, for example if long cables were used to transfer the sensor information to theamplification unit.
In order to properly mount the AE-DS 26 chip into the actuation chamber, it was notpossible to place the sensor in the reusable printhead, because the microfluidic struc-ture must be cleaned after each usage. During the cleaning procedure the printheadwould get in contact with a chemical liquid and an ultrasonic bath at 80 °C. Thus thesensor had to be integrated into the piston, directly above the actuation chamber.
3.2.3 PRESSURE SENSOR CIRCUIT BOARD
In the studied prototype device displayed in Fig. 3.25a-b, the pressure sensor was gluedinto the milling recess on the circular blank with an external dimension of 6 mm. Theelectronic connections from the sensor to a circular blank is made via wire bonds bywedge-wedge bonding. The bonding is covered by a resin (Epo-Tec 353ND-T), whichresults in a mechanical stabilization of the bonding and protects the electrical connec-
Figure 3.25: Pressure sensor (AE-DS 26) from Activ-Sensor: a.) Cross-section of the sensor: Thequadratic diaphragm is realized using micromechanical KOH-wet etching at the back of the pressuresensor element. b.) Top view of the chip: The bond pads consists of aluminium. c.) Layout of theWheatstone bridge circuit: The output of the powered bridge is a voltage signal (mV range) propor-tional to pressure [128].
a) c)b)
- 74 - TOPSPOT: HIGHLY PARALLEL NANOLITER DISPENSING - OPERATING CONDITIONS AND DESIGN RULES

DISSERTATION REMIGIUS NIEKRAWIETZ EXPERIMENTAL INVESTIGATION OF THE PRINTING PROCESS
tion between the sensor chip and the circuit board. For curing, the resin was put for 2hours into a 40°C heated oven [129]. The resin should not get in contact with the sen-sitive pressure membrane to ensure a correct pressure measurement. In the last step thesensor circuit board was contacted with the evaluation electronics (Fig. 3.26e).
3.2.4 EVALUATION ELECTRONICS
To avoid noise problems the evaluation electronics, which amplifies the sensor signalwas integrated as close as possible to the pressure sensor. Sensors often tend to be sen-sitive to more than one physical quantity. Pressure sensors show false signal, whenthey are exposed to vibrations. Hence, the evaluation electronics also comprised a sec-ond pressure sensor (see Fig. 3.27). The second sensor did not measure the pressure butwas used to detect a possible impact of the piezo stack on the piston. The piezo stackhits the piston during the displacement. By an insufficient coupling between these two
Figure 3.26: Integration of the pressure sensor circuit board a.) Milling recess for the pressure sensorin the middle of the circuit board b.) Inserting of the glue (cyanacrylate) c.) Positioning and connec-tion of the pressure sensor by wedge/wedge bonding d.) Protection of the wire bonds by covering withresin [129] e.) Connection of the pressure sensor circuit board with the evaluation electronics via sol-dered wires
Figure 3.27: Assembling of the evaluation electronics a.) Double-sided printed circuit boardb.) Double-sided equipped board c.) Placing of the second sensor and connection of the evaluationelectronics via wires
a) d)
c) e)
b)
a) c)b) Pressuresensor
Amplification
TOPSPOT: HIGHLY PARALLEL NANOLITER DISPENSING - OPERATING CONDITIONS AND DESIGN RULES - 75 -

EXPERIMENTAL INVESTIGATION OF THE PRINTING PROCESS DISSERTATION REMIGIUS NIEKRAWIETZ
components a shock could cause a vibration in the piston and also of the pressure sen-sor. If necessary this superimposed disturbing signal of the impact can be subtractedfrom the measurement signal by the use of the second pressure sensor.
CIRCUIT DIAGRAM OF THE SIGNAL AMPLIFICATION: The pressure- and temperature sensor signal is processed by an amplifier (see Fig.3.28). This differential amplifier multiplies the difference between the two inputs by aconstant factor of 75. The amplification factor for the pressure signal can be set by theresistor ratio of the values of R3/R4 and R1/R2. The amplified signal can be digitizedand processed for further treatment. An integrated voltage regulator on the circuitboard automatically maintains a constant 5 V voltage level.
3.2.5 ASSEMBLING OF THE PISTON COMPONENTS
As mentioned before the whole sensor technology was integrated into the piston likedisplayed in Fig. 3.29. The populated pressure sensor circuit board was glued into therecess in the lower part of the piston. The recess in the piston has the same externaldimension as the sensor circuit board. Thus no additional dead-volume was created inthe actuation chamber, which would decrease the generated pressure pulse during thepiston movement. In the upper part of the piston the evaluation electronics was mount-ed and connected via wires with the sensor circuit board.
Figure 3.28: The circuit diagram includes a voltage regulator and the amplifiers for the temperatureand pressure signal
- 76 - TOPSPOT: HIGHLY PARALLEL NANOLITER DISPENSING - OPERATING CONDITIONS AND DESIGN RULES

DISSERTATION REMIGIUS NIEKRAWIETZ EXPERIMENTAL INVESTIGATION OF THE PRINTING PROCESS
3.2.6 CALIBRATION OF THE PRESSURE SENSOR
Before starting the first measurement, the pressure sensor needs to be calibrated in or-der to reference the signal. In commercially available sensors this calibration is alreadytaken care of. For uncalibrated sensors at least two points should be calibrated againstknown values. Preferably, these known values should be within the range expectedwhen collecting data. For the used pressure sensors this range was from 0 bar to 1 bar.Assuming a linear behavior between these two points a formula can be computed,which later allows to conclude the pressure from the voltage signal. To record the cal-ibration curve the piston with the integrated pressure sensor was connected to a pneu-matic source (see Fig. 3.30a). The pneumatic pressure source has a separate calibratedpressure sensor. Afterwards the pressure was increased in 100 mbar steps and the re-spective voltage signal was logged in a voltage-pressure diagram as depicted in Fig.3.30b.
After the calibration of the pressure sensor the functionality of the sensor technolo-gy in the dispenser was verified. The piston was used to measure the pressure pulse ofa sealed actuation chamber containing a liquid filled printhead in comparison to an ac-tuation chamber with a big exhaust nozzle in the printhead (see Fig. 3.31). The exper-imental results show a pressure increase during the dispensing of the liquid and apressure curve around zero when the air can leak out of the actuation chamber. Hence,a second sensor, which does not measure the pressure but instead is used to detect apossible impact of the piezo stack on the piston turned out to be not necessary.
For the correlation between printing media and required printing parameters the pis-ton movement was recorded during the printing process using a laserdoppler-vibrome-ter [D10]. The actuation pressure pulse was detected by the integrated pressure sensor
Figure 3.29: Assembling of the piston components a.) Single components before the assembling: Thewires of the pressure sensor circuit board are carried through the piston and connected with the evalu-ation electronics. b.) A perspective detail of the piston cross-section shows the assembling of the mainparts of the piston.
a) b)
Pressure sensor circuit board
Evaluation electronics
PistonWires of the output signal
Evaluation electronics
PistonPDMS-sealing
Bonding
Pressure sensor
TOPSPOT: HIGHLY PARALLEL NANOLITER DISPENSING - OPERATING CONDITIONS AND DESIGN RULES - 77 -

EXPERIMENTAL INVESTIGATION OF THE PRINTING PROCESS DISSERTATION REMIGIUS NIEKRAWIETZ
in the piston. The data allows for the analysis of the correlation between amplitude, risetime and plateau of the pressure pulse on the one hand and the quality of droplet releaseon the other hand (see Fig. 3.32). A stroboscopic camera was used to evaluate dropletdispensing and droplet flight.
Furthermore, the initial air volume in the actuation chamber has been significantlyreduced by this improved PDMS-sealing from originally 19 µl down to 15 µl, whichled to a "dramatic" performance improvement. With this design it is possible to achievea higher pressure pulse than before and allows the dispensing of highly viscous media.In comparison to the standard method a four fold increase in the printable viscosityrange from 2.5 mPas to 10.8 mPas has been achieved [117].
The operation of the TopSpot is unchanged by the integrated sensor and piston:Samples are pipetted into 24 reservoirs, which are ordered in two blocks to the left andright of the actuation chamber. Microchannels transport the samples by capillary forces
Figure 3.30: a.) Experimental setup for the calibration of the integrated pressure sensor consisting ofsupply voltage for the sensor, a pressure source and a voltmeter for detecting of the equivalent voltagevalue. b.) The voltage-pressure diagram shows a linear relationship between pressure and voltagevalue.
Figure 3.31: Function test of the pressure sensor in the dispenser: a.) Experimental results of a pres-sure build-up in a sealed actuation chamber and pressure curve around zero due to the pressure loss ofthe big exhaust nozzle. b.) The piston made of Peek with integrated pressure sensor, electronics andPDMS-sealing. c.) The printhead with a big exhaust nozzle in the actuation chamber, which was usedto avoid pressure build-up.
Pressure source
Piston
Supply voltage
Voltmeter
a) b)
a) b)
c)
- 78 - TOPSPOT: HIGHLY PARALLEL NANOLITER DISPENSING - OPERATING CONDITIONS AND DESIGN RULES

DISSERTATION REMIGIUS NIEKRAWIETZ EXPERIMENTAL INVESTIGATION OF THE PRINTING PROCESS
from the reservoirs to the 6 by 4 ordered centered nozzle array. After filling the print-head is ready for actuation. Fig. 3.33 shows a cross-section of the design with the inte-grated pressure sensor and PDMS sealing at different stages of operation.
3.2.7 DETECTING FAILURE MODES
The pressure pulse signal also allows the detection of failure modes during the dispens-ing process of the TopSpot printhead (Fig. 3.34). Two failure modes could be distin-guished from the normal pressure pulse of a filled printhead (red graph). Firstly, anincreased pressure amplitude caused by the reduction of the initial air volume due to aflooded actuation chamber (black graph). This leads to a cross-contamination of theliquid in the nozzle array. Secondly, a reduced pressure amplitude from an empty noz-
Figure 3.32: Transient displacement of the piston [blue line] and measured pressure pulse [red line].The point in time for droplet tear-off is indicated in green. On the top of the graph the correspondingstroboscopic pictures of droplet ejection for DMSO 5 % v/v is shown.
Figure 3.33: Working principle of TopSpot dispenser (schematic, cross-section): Filling of the print-head reservoirs (1). The piston with the integrated pressure sensor defines a smaller actuation cham-ber above the nozzles (2). Piston actuation generates pressure pulse and expels 1 nl droplets (3).Retraction of the piston and refilling by capillary forces (4).
TOPSPOT: HIGHLY PARALLEL NANOLITER DISPENSING - OPERATING CONDITIONS AND DESIGN RULES - 79 -

EXPERIMENTAL INVESTIGATION OF THE PRINTING PROCESS DISSERTATION REMIGIUS NIEKRAWIETZ
zle in the printhead. Empty nozzles could also be identified originating from the gen-erated depression in the actuation chamber (violet and green graph). The quality of themicroarray production is greatly depended on cross-contamination free dispensed sam-ples, contamination would result in false signals. A further prerequisite is the spot pres-ence of all dispensed droplets. Therefore, already one empty nozzle must cause a stopof the microarray production. Because an empty nozzle of the printhead is not only onefailure in the microarray, but it will be multi duplicated in many microarray slides.Hence, it is necessary to have an integrated process control for the fast detection of fail-ures during the dispensing process.
Figure 3.34: Pressure pulses during the dispensing process of a 60 % (v/v) glycerol/water solution,which represents a viscosity of about 10.8 mPas. The red curve represents the pressure pulse of a dis-pensing process of a filled printhead. An increased impulse occurs due to a flooded actuation chamber.Empty printhead nozzles lead to a decreased pulse and a depression. To exaggerate the effect of theplateau the pressure pulse was extended to 10 ms [117].
- 80 - TOPSPOT: HIGHLY PARALLEL NANOLITER DISPENSING - OPERATING CONDITIONS AND DESIGN RULES

DISSERTATION REMIGIUS NIEKRAWIETZ DESIGN AND OPERATION RULES
DESIGN AND OPERATION RULES
The chapter of the design and operation rules is subdivided into three parts, the influ-ence parameters of the TopSpot print module, the highly integrated printheads and theoperation rules. The TopSpot print module parameters were analyzed regarding the im-pact of the actuation chamber and the vent nozzle size on the pressure pulse for thedroplet ejection process. Considering the influence of the highly integrated printheadparameters on the droplet building process, CFD simulations were used and validatedby experiments. The category of the operation rules is basically dominated by the dis-placement of the piezo actuator, which has to be adjusted for a single droplet process.Only a perfect adjustment of all three parts together enables a highly reproducible dis-pensing process. The most challenging step is to determine the optimum set of param-eters of all relevant impact factors.
4.1 TOPSPOT PRINT MODULE
The TopSpot print module influences many aspects of the droplet dispensing process.One of the most important factors is the integrated actuation principle based on a piezoactuator, which enables a fast compression of the actuation chamber. The generatedpressure pulse can be influenced by the displacement procedure, which is explained inmore detail in the following section. Another fundamental factor is the dimension ofthe actuation chamber and the size of the integrated vent nozzle in the printhead.
Figure 4.1: Preparation procedure using the TopSpot print module for microarray printing:1.) Placing of a printhead filled with sample in the printhead adapter. 2.) Positioning of the pistonholder and piston, which includes an integrated pressure detection in the printhead adapter.3.) Insertion of the assembly of the three components and closing the locking mechanism of the printmodule. 4.) The revised TopSpot print module contains a new plastic closing mechanism to reducecosts.
TOPSPOT: HIGHLY PARALLEL NANOLITER DISPENSING - OPERATING CONDITIONS AND DESIGN RULES - 81 -

DESIGN AND OPERATION RULES DISSERTATION REMIGIUS NIEKRAWIETZ
Fig. 4.1 shows a preparation procedure for setting up the TopSpot print module. In thefirst step the filled printhead is placed into the printhead adapter. Afterwards, the pistonholder and piston are positioned on the printhead adapter. In the next step the assemblyof the three components is inserted into the print module. During the closing of thelocking mechanism the piston is automatically set to the correct height position. Theprint module is now prepared for the dispensing process and can be used for microarrayprinting.
4.1.1 ACTUATION CHAMBER
The initial air volume in the actuation cham-ber, which has to be compressed, is located be-tween the piston, the silicon printhead and thePDMS-seal-ring. Manufacturing tolerances ofPDMS-seal-ring, piston, piston holder, print-head, printhead adapter and the piston position(X1-X7) can dramatically modify the dimen-sions of the actuation chamber (see Fig. 4.2).This leads to a change of the generated pres-sure pulse. Moreover, the knowledge of toler-ances is essential for a reproducible dispensingprocess with different print modules. Thecompression of the air takes place on thewhole cross-section surface of the piston,which is enclosed by the PDMS-seal-ring. Accordingly, height tolerances have a majorimpact on the pressure pulse. However, an actuation chamber with a larger outer diam-eter compensates those tolerances better than a smaller chamber. But a larger actuationchamber leads also to a reduction of stability and higher cost of the used silicon print-head. In the studied set-up the actuation chamber has a height of hs=300 µm. The ana-lytical model of the generated pressure pulse (see chapter 2.4.7.1) provides a tool toinvestigate the impact factor of these tolerances. In the model the manufacturing toler-ances are simulated by changing the initial air volume in the actuation chamber. Thepiston is moved with the same deflection of 33 µm and the pressure pulse is analyzedlike displayed in Fig. 4.3. The pressure pulse is increased about 130 % by reducing theheight of the actuation chamber from 300 µm to 150 µm. An extension of the actuationchamber from 300 µm to 450 µm leads only to a 36 % reduction of the pressure pulseamplitude. However, such an extension of the actuation chamber also would cause astrong increase of the pressure pulse rise time. In order to generate a droplet, especiallyfor high viscous liquids, which need high pressure amplitudes, it is beneficial to applyshort rise times.
Figure 4.2: Visualization of the manufactur-ing tolerances (X1-X7) of the TopSpot printmodule, which could lead to significant dif-ferences in the actuation chamber height (h).
- 82 - TOPSPOT: HIGHLY PARALLEL NANOLITER DISPENSING - OPERATING CONDITIONS AND DESIGN RULES

DISSERTATION REMIGIUS NIEKRAWIETZ DESIGN AND OPERATION RULES
4.1.2 VENT NOZZLE
As mentioned before in chapter 2.4.7 a small vent hole with a diameter of 80 µm is in-tegrated in the actuation chamber. During insertion and extraction of the piston in theactuation chamber a slow pressure pulse is generated, which acts on the liquid in thenozzles and microchannels of the printhead. This slow pressure pulse could cause thedifferent liquids to leak from the nozzles into the actuation chamber and lead to a mix-ture of the liquids. To avoid cross-contamination between nozzles and microchannels,an equilibration of the pressure within the actuation chamber by this vent hole is need-ed in the standard design.
The sealing method proposed in chapter 3.2.1 closes the actuation chamber in thelast moment before the PDMS-seal-ring touches on the silicon printhead surface. Theexperiments without a vent hole show, that no cross-contamination takes place due tothe insertion and extraction of the new piston assembly. To analyze the influence of thevent hole during the dispensing process we used two printheads, the first one with a80 µm hole in the printhead and another one without any vent hole. Due to the highfluidic resistance and inertance of the 80 µm vent hole, nearly no air can escape duringthe fast downstroke of the piezo actuator. The vent hole can be neglected in this phasesuch that only a small reduction (2.8 %) of the pressure amplitude can be observed. Ifwe integrate a hold time in the displacement procedure of the piezo actuator and in-crease it step-by-step, we can see a pressure drop at 400 µs (see Fig. 4.4). The 80 µmvent nozzle causes a higher air leakage from a longer piston hold time of 400 µs anddecreases the functionality of the extended pressure pulse. Further, the vent hole gen-erates a small depression in the actuation chamber after the piston retracts to its initialposition. In conclusion, the dispenser should not contain a vent nozzle in the actuationchamber, if the operating pressure pulse has a longer pressure hold time than 400 µs.
VENT NOZZLE SIZE: The size of the vent nozzle is an important factor for the pressure generation in the ac-tuation chamber. The analytical model of the pressure generation can also be used foranalyzing this behavior (see Fig. 4.5). The standard size of the vent nozzle in the Top-
Figure 4.3: Simulation of impact factors of the pressure pulse, which are caused by height tolerancesin the actuation chamber. The reference value of the actuation chamber is indicated in green and has aheight of 300 µm.
TOPSPOT: HIGHLY PARALLEL NANOLITER DISPENSING - OPERATING CONDITIONS AND DESIGN RULES - 83 -

DESIGN AND OPERATION RULES DISSERTATION REMIGIUS NIEKRAWIETZ
Spot printhead is 80 µm. A 60 µm vent nozzle size leads to a small depression in theactuation chamber. Further, a larger vent nozzle causes an intense reduction of thepressure amplitude, which confines the print media range. The rise time of the pressurepulse is not affected by the modification of the vent nozzle size. Furthermore, it comesto a depression in the actuation chamber from a vent nozzle size of 60 µm, which isindicated by the dotted line in Fig. 4.5. This is caused by the air leakage during the dis-placement of the piezo stack, which increases with the vent nozzle size and results ina depression after the retraction of the piezo stack.
Figure 4.4: Influence of the hold time on the pressure pulse: a-d.) The hold time is increased from50 µs, 100 µs, 200 µs to 400 µs. The blue curve shows pressure changes with a venting hole (80 µmdiameter), the red curve is without a vent hole. The pressure drop after 400 µs is indicated in orange.
Figure 4.5: Simulation results of the vent nozzle size impact on the generated pressure pulse in theactuation chamber. The dotted line indicates the starting point of the depression in the actuation cham-ber from a vent nozzle size of 60 µm.
a) b)
c) d)
- 84 - TOPSPOT: HIGHLY PARALLEL NANOLITER DISPENSING - OPERATING CONDITIONS AND DESIGN RULES

DISSERTATION REMIGIUS NIEKRAWIETZ DESIGN AND OPERATION RULES
4.1.3 PIEZO ACTUATOR MOVEMENT
For the piezo actuation the Piezo Elektronik R5 from BioFluidix is used, which is con-trolled by a graphical user interface programmed with TestPoint [D11]. There aremainly three time intervals in the displacement procedure of the piezo actuator. Firstly,the downstroke, which controls the duration for reaching the piezo stroke at a constantvelocity. Secondly, the hold time, which ensures that the piezo does not move back im-mediately after the displacement. In some cases the hold time can be zero. Finally, thethird part the upstroke, which is controlled by the velocity of the piezo stack contrac-tion. Generally, the downstroke has to be much faster than the upstroke as depicted inFig. 4.6. A fast downstroke provides a preferably high pressure impulse, which is nec-essary for the droplet tear-off. The influence of these three parameters on the dispens-ing process were analyzed in detail in the following sections.
4.1.3.1 STROKE
One of the main print parameters for ejecting droplets is the stroke of the piezo actuator[51]. The piezo actuator, providing a maximum stroke of 80 µm, is used to move thepiston into the actuation chamber of the printhead. In its idle position it defines a cer-tain initial air volume. The stroke of the piezo actuator leads to the compression of thisinitial air volume. Hence, it is the main impact factor for the adjustment of the pressurepulse amplitude. The optimal piezo stroke strength for a stable operation was found tobe in a range between 45 µm and 48 µm (see Fig. 4.7) by using a standard 24 channelprinthead filled with 3M betaine dissolved in 3 x SSC printing buffer [M11]. In thisrange no influence of the piezo stroke on the droplet volume or array homogeneity wasobserved. The dispenser causes satellites, if the piezo stroke is higher than 49 µm, butalso stops the droplet ejection being lower than 44 µm. This incorrect piezo stroke canonly be fractionally compensated by changing the downstroke velocity, upstroke ve-locity or hold time of the piezo actuator.
Figure 4.6: Piezo actuator movement described of the three time intervals. (Downstroke, hold time,upstroke)
TOPSPOT: HIGHLY PARALLEL NANOLITER DISPENSING - OPERATING CONDITIONS AND DESIGN RULES - 85 -

DESIGN AND OPERATION RULES DISSERTATION REMIGIUS NIEKRAWIETZ
Due to the large number of microarray applications a huge range of printing mediawith different liquid properties is required (see chapter 2.5.3). Furthermore, variouspossible printhead designs also have different fluidic resistances at their nozzles. Con-sequently, the stroke of the piezo actuator has to be aligned on each printhead designand dispensing medium in the micrometer-range.
4.1.3.2 DOWNSTROKE VELOCITY
The maximum downstroke of the piezo actuator is limited by its resonance frequencyof 12 kHz. In a first approximation, a piezo actuator can be regarded as a spring/masssystem. The resonance frequency of any spring/mass system is a function of its stiff-ness and effective mass of the piezo actuator. The resonance frequency of 12 kHz giv-en in the technical data table of the actuator always refers to the unloaded actuator withone end rigidly attached. In positioning applications like the TopSpot dispenser, piezoactuators should operate well below their resonance frequencies. A piezo actuator canreach its nominal displacement in approximately one-third of the period of the reso-nance frequency [130]. In this case a higher downstroke velocity of 380 µm/ms resultsin superposed oscillations of the piezo actuator displacement. The oscillation has atime period of 0.073 ms and a frequency of 13.7 kHz. In the experiments the maximumdownstroke velocity of the piezo actuator (380 µm/ms) was decreased stepwise. As ex-pected, the pressure pulse is reduced by a lower compression of the initial air volume.The vent hole in the actuation chamber gets a higher impact and a major amount of aircan leak during the downstroke phase of the piezo actuator. The measured droplet ve-locity is also reduced because of the missing pressure energy for the droplet formation(see Fig. 4.8). Without a vent hole the pressure pulse will not be reduced directly, butthe lower downstroke expedites the wetting of the nozzle. In conclusion, the down-stroke of the piezo actuator should be as high as possible to avoid the wetting of thecoated nozzle surface in order to generate a pressure pulse with a fast rise time and ahigh amplitude.
Figure 4.7: Influence of piezo stroke on printing performance (droplet flight @800 µs): The strobo-scopic pictures show a stable droplet ejection process in the range of 45 µm to 48 µm. A decreasingpiezo stroke leads to no droplet ejection and a higher stroke causes the generation of satellites.
44 µm 45 µm 46 µm
47 µm 48 µm 49 µm
50 µm 52 µm 55 µm
- 86 - TOPSPOT: HIGHLY PARALLEL NANOLITER DISPENSING - OPERATING CONDITIONS AND DESIGN RULES

DISSERTATION REMIGIUS NIEKRAWIETZ DESIGN AND OPERATION RULES
4.1.3.3 HOLD TIME
Due to the specification of the R5 electronic box a minimum hold time of 20 µs is re-quired to ensure a stable functionality. A hold time of the piezo actuator doesn’t nec-essarily lead to a hold time of the pressure pulse. The vent hole in the actuationchamber leads to a minimal reduction of the pressure pulse amplitude, consequently along hold time loses its real function due to the vent hole. However, a longer hold timeinfluences the dispensing process and results in a higher droplet volume.
To achieve a definite result an actuation chamber without a vent hole was investi-gated. During the experiments the displacement conditions were investigated for a sta-ble and satellite free droplet dispensing process. The hold time of the piezo stack wasincreased step-by-step (50 µs) and the single droplet volume was captured by the stro-boscope camera and analyzed with NeuroCheck®. For a longer hold time the piezostroke had to be decreased by 1 µm per 100 µs to avoid the building of small satellitesdroplets and achieve a stable operation. A linear relationship between hold time anddroplet volume was found as seen in Fig. 4.9b. Due to the longer hold time more liquidcan be transported from the nozzle to the dispensed droplet. For hold times longer than400 µs the reproducibility of the ejected droplet volume of the buffer solution (3M be-taine 3 x SSC) is reduced.
4.1.3.4 UPSTROKE VELOCITY
The travel of the piezo actuator before reaching its initial position is adjusted by thevelocity of the movement. Accordingly, the upstroke velocity is also responsible forthe exhaustion of the pressure in the actuation chamber. A long overpressure caused by
Figure 4.8: Influence of the droplet ejection process by the downstroke (droplet flight @1000 µs):Decreasing the downstroke velocity from 380 µm/ms to 50 µm/ms leads to a lower droplet velocity andpartially to no droplet tear-off.
Figure 4.9: Influence of the hold time (Ht) on the droplet volume: a.) Measured pressure pulse in theactuation chamber without a vent hole. b.) Stroboscopic pictures of the single droplets and the corre-sponding analyzed droplet volumes by NeuroCheck®.
380 µm/ms 200 µm/ms 50 µm/ms
a) b)
TOPSPOT: HIGHLY PARALLEL NANOLITER DISPENSING - OPERATING CONDITIONS AND DESIGN RULES - 87 -

DESIGN AND OPERATION RULES DISSERTATION REMIGIUS NIEKRAWIETZ
slow retraction of the piezo actuator potentially leads to a wetting of the nozzle plate.After the droplet ejection the remaining excess liquid can not be absorbed into the noz-zle as long as there is still overpressure in the actuation chamber. The maximum up-stroke velocity (70 µm/ms), which is supported by the electronic box, is used asstandard adjustment. Compared to the actuation downstroke of the piezo actuator(380 µm/ms) it retracts very slowly. In the experiment the maximum upstroke velocitywas reduced step by step. The experimental results show the generation of satellites ata upstroke velocity of 30 µm/ms.
If we add up all three time intervals during the displacement procedure of the piezoactuator, we can acquire the maximum printing frequency of the dispenser by neglect-ing the printhead refilling procedure.
4.1.4 PRINTING FREQUENCY
The refilling of the nozzles (see chapter 2.4.4) and the time intervals of the displace-ment procedure of the piezo actuator define the theoretical maximum printing frequen-cy. To verify this the frequency was increased step-by-step during an experiment witha 24 standard printhead and a 3M betaine dissolved in 3 x SSC printing buffer. Thestroboscope camera was used for evaluating the maximum printing frequency and theejected droplet volume (see Fig. 4.11a).
The droplet volume and the array homogeneity remained constant at frequencies upto 20 Hz. For higher frequencies the droplet ejection process looses its homogeneity.This can be traced back to a minor wetting of the nozzle surroundings, which leads tospreading of liquid on the nozzle plate. Due to the high dispensing frequency the excessliquid can not retract into the nozzles and impacts the droplet tear-off. Furthermore, theunequal microchannel lengths from the reservoir to the nozzles require different capil-lary refilling time and lead to a premature failure of individual nozzles. At 25 Hz anunstable operation starts with the appearance of the first satellite droplets. At frequen-cies higher than 25 Hz a decrease of array homogeneity as well as a decrease in dropletvolume (Fig. 4.11) can be observed.
Figure 4.10: Influence of the droplet ejection process by the upstroke of the piezo stack (droplet flight@1000 µs): A lower upstroke velocity of 30 µm/ms results in the generation of satellites by using the3M betaine 3 x SSC buffer solution.
70 µm/ms 30 µm/ms 10 µm/ms
- 88 - TOPSPOT: HIGHLY PARALLEL NANOLITER DISPENSING - OPERATING CONDITIONS AND DESIGN RULES

DISSERTATION REMIGIUS NIEKRAWIETZ DESIGN AND OPERATION RULES
4.1.5 RUBBER SPRING
During operation the piston is hit by the veryfast moving piezo actuator. There is no directmechanical join between the piezo and the pis-ton (Fig. 4.12). The piston can loose contactand work as „flying piston“. A ring under thepiston acts as a rubber spring, which presses thepiston against the actuator. During the move-ment of the piezo actuator, the ring is responsi-ble for a controlled displacement of the pistonand the retraction to its initial position. A per-fect mechanical coupling between the twocomponents avoids a flying piston. The cou-pling is influenced by the weight of the piston, the acceleration, the hardness and thepre-stressing of the ring. The weight of the piston was optimized by the choice of thematerial (PEEK) and the minimum dimensions. The maximum acceleration of the pis-ton is needed for good droplet tear-off. In the experiments the pre-stressing, the hard-ness and the design of the various rings was investigated. A force sensor was used formeasuring the ring pre-stressing [D12]. For measuring the piezo movement a laser vi-brometer [D10] was used. The closed assembly of the print module did not allow tomeasure the piezo movement on-line during normal printing operation. Therefore, aseparate experiment with drilled holes in the printhead was performed (see Fig. 4.12).A minor pre-stressing or a lower hardness of the ring results in a contact loss and anuncoordinated movement of the piston. However, a major pre-stressing or a higherhardness of the ring leads to a reduction of the maximum achievable displacement ofthe piezo actuator. The best results were realized by the combination of pre-stressingwith 8 N and using an X-ring with a hardness of 70 shore. Comparing different piston
Figure 4.11: Influence of printing frequency on array homogeneity and droplet volume: a.) The stro-boscopic pictures show, that the array homogeneity decreases and an unstable operation starts withfrequencies of 20 Hz. b.) The droplet volume decreases significantly at frequencies higher than 20 Hz.
a)
b)10Hz 20Hz 25HZ
Figure 4.12: Schematic illustration of thecharacterization of the rubber spring.
TOPSPOT: HIGHLY PARALLEL NANOLITER DISPENSING - OPERATING CONDITIONS AND DESIGN RULES - 89 -

DESIGN AND OPERATION RULES DISSERTATION REMIGIUS NIEKRAWIETZ
displacements of an O-ring with the same hardness the X-ring shows better couplingwith less oscillation at the maximum displacement value (Fig. 4.13). On the other handthe reverse movement of the piston is slower by using an X-ring.
4.1.6 SELECTION OF THE PDMS-SEAL-RING DESIGN
As already mentioned before (see chapter 3.2.1), the combination of the PDMS-seal-ring with the piston allows to seal the printhead directly on the silicon layer. Becausethe coupling between the piezo actuator and the piston is achieved by the rubber spring,the PDMS-seal-ring can be more flexible. The printhead is only exposed to compres-sive stress from the air compression and the soft contact of the PDMS-seal-ring. Theaim of the following experiments was to find the optimal PDMS-seal-ring design andhardness, which enables the highest pressure pulse in the actuation chamber and thelowest compressive stress on the printhead. Three designs of the PDMS-seal-ring (seeFig. 3.22) were analyzed: D1 with a wall thickness of 800 µm and a sealing lip of200 µm, D2 with the same wall thickness and a sealing lip of 150 µm and D3 with awall thickness of 500 µm and sealing lip of 350 µm, which touches the silicon surface.A complete assessment of the pros and cons of each PDMS-seal-ring is given in Table4.1, which also provides a final conclusion which ring is ideal. The following selectioncriteria were investigated: pressure build-up in the actuation chamber, the fabricationand the handling of the PDMS-seal-rings and the induced bending of the printhead.PDMS-seal-rings with an hardness of 29.6 Shore show predominantly bad pressurecharacteristics with a negative pressure in the actuation chamber (see Fig. 4.14a). Print-
Figure 4.13: Different displacements of the piston controlled by the rubber spring a.) An O-ring asrubber spring shows worse coupling with a higher oscillation at the maximum displacement. b.) Thereverse movement of the piston takes longer when using an X-ring but the coupling is efficient.
Table 4.1: Assessment matrix of the different PDMS-seal-ring designs and hardness. For selection cri-teria the pressure build-up in the actuation chamber, the fabrication and handling and the bending ofthe printhead center were evaluated.
Hardness PDMS-seal-ring
Pressure build-up Fabrication/Handling Bending of printhead ResultD1 D2 D3 D1 D2 D3 D1 D2 D3 D1 D2 D3
Shore 29.6 - - + + + + + + - - - -Shore 27.4 - + + + + + + + - - + -Shore 25.9 + + + - - - + + - - - -Shore 21.7 + + + - - - + + - - - -
a) b)
- 90 - TOPSPOT: HIGHLY PARALLEL NANOLITER DISPENSING - OPERATING CONDITIONS AND DESIGN RULES

DISSERTATION REMIGIUS NIEKRAWIETZ DESIGN AND OPERATION RULES
head bending was measured during maximum actuation by the laser vibrometer at thebottom center of the printhead, where the largest deflection was assumed. A printheadbending higher than 6 µm is assumed to be the maximum deflection, where the print-head is not damaged. As a result a printhead bending higher than 4 µm got a bad eval-uation. The different hardness of the PDMS-seal-rings shows minor differences in thebending of the printhead as depicted in Fig. 4.14b. Also, the border of the printheadand the printhead adapter were analyzed to obtain information on the impact of the de-flection on the whole print module. Details about the exact location of the measuringpoints can be seen in Fig. 4.15b. Due to the displacement of the piezo actuator the print-head adapter moves of 2 µm. The bending of the center of a filled printhead with a D2PDMS-seal-ring showed a maximum displacement of 4 µm, without the PDMS-seal-ring the bending is reduced to 3 µm (Fig. 4.15a).
Figure 4.14: Characterization of the PDMS-seal-rings D2 with different hardness: a.) Pressure gener-ation in the actuation chamber by the maximum deflection (80 µm) of piezo actuator. The PDMS-seal-ring with hardness of 29.6 Shore can not seal the actuation chamber, which leads to a negative pres-sure. b.) The bending of the printhead center shows minor differences by higher hardness of thePDMS-seal-rings in a range from 21.7 to 29.6 Shore.
Figure 4.15: Bending of the printhead and print module: a.) Measurement results of bending of differ-ent positions and preconditions on the printhead and print module. b.) Schematic visualization of themeasurement positions.
a) b)
a) b)
TOPSPOT: HIGHLY PARALLEL NANOLITER DISPENSING - OPERATING CONDITIONS AND DESIGN RULES - 91 -

DESIGN AND OPERATION RULES DISSERTATION REMIGIUS NIEKRAWIETZ
4.2 HIGHLY INTEGRATED TOPSPOT PRINT-HEADS
The well established Deep Reactive Ion Etching process (DRIE) allows a reproduciblefabrication and a high degree of freedom in the printhead design. The highly integratedmicromachined printheads are the core of the TopSpot technology and therefore haveto fulfill certain requirements: The printheads should enable a reliable capillary fillingof different printing media without cross-contamination. Furthermore, a parallel ho-mogeneous dispensing of a low droplet volume should be achieved. The pressure pulsefor the required droplet dispensing process should be as small as possible to cover awide range of printing media. Due to the complexity of the dispensing process a nu-merical method of the computational fluid dynamics (CFD) was used to obtain designrules for the printhead design. The CFD models further allow a fast adaptation of de-sign modifications, avoiding long waiting periods for the fabrication of the microma-chined printheads. An experimental validation of the CFD models was performed bythe fabrication and characterization of various printhead designs. Additionally, thegained experiences should be applicable for the production of highly integrated print-heads, particularly with regard to a maximum printing performance and integrationdensity of the nozzles.
4.2.1 CFD SIMULATIONS OF THE TOPSPOT PRINT-HEAD
In general, the Navier-Stokes equation cannot be solved analytically for complex flu-idic problems, so numerical methods also known as Computational Fluid Dynamics(CFD) were developed [131,132,133]. All of these methods are using numerical ap-proximation procedures based on the discretization of the problem on a computationalgrid. The mainly used method for fluidic problems is the Finite Volume Method(FVM), which is also used for all CFD simulations in this work [134].
Typical flow situations in the TopSpot printheads are capillary wicking and forma-tion of droplets. To model free surface flows including surface tension effects -amongst others - the so called volume of fluid method (VOF) has been published inearlier forms by Hirt and Nichols [135] and later by Rider et al. [136,137]. This methodis absolutely essential to simulate droplet ejection devices, because it provides a wayto implement surface tension effects at walls or during the drop formation as well asthe droplet breakup due to surface tension. Furthermore, capillary filling problems canbe simulated using the VOF method. Therein the surface tension represents the onlypresent actuation driving the liquid.
For a more fundamental understanding of the droplet ejection process and the firstpriming of the nozzle two separate fully three-dimensional simulation models were setup using the VOF method. The droplet ejection process was performed by the simula-tion package ACE+ (Version 2004.0.25) from CFDRC [138]. A 3D grid was used de-spite the rotational symmetry of the problem to account properly for surface tensioneffects. The meshing of the structured grid was done with an additional tool of the CFD
- 92 - TOPSPOT: HIGHLY PARALLEL NANOLITER DISPENSING - OPERATING CONDITIONS AND DESIGN RULES

DISSERTATION REMIGIUS NIEKRAWIETZ DESIGN AND OPERATION RULES
package, CFD-GEOM, the geometry and grid generation system. The second model tostudy the first priming of the printhead was built in FLUENT (Version 6.1.22) [139].One of the unique features of FLUENT is the geometry modeling and grid generationtool GAMBIT [140], which allows using different mesh types for complex geometries.
4.2.1.1 MODEL OF THE EJECTION AND DROPLET IMPACT PROCESS
A typical TopSpot printhead consists of 24 reservoirs, microchannels, and an actuationchamber with 24 nozzles. All nozzles are driven with the same pressure pulse. So it ispossible to reduce the simulation model of the printhead to one nozzle. During the dis-pensing process the long fluidic supply microchannel (29 mm) from the reservoir tothe short nozzles (380 µm) can be neglected. Due to the high inertance and the highflow resistance of the microchannel the pressure pulse can be considered as not beingaffected by the flow through this channel on the time scale of the droplet ejection sim-ilar to vent nozzle see chapter 4.1.2. Hence the pressure pulse affects only the liquid inthe nozzle. Therefore, only the nozzle region itself is considered in the following. Bycomparing experimental and numerical results it can be proven, that this approxima-tion is very well justified for the studied TopSpot device.
At the beginning the considered simulation model includes an experimentally mea-sured fast displacement of the piston, which reduces the initial air volume of the actu-ation chamber. The measured movement of the piston was interpolated by amathematical function and was set as moving boundary condition of the wall. This re-sults in a pneumatic pressure pulse. Furthermore, a venting hole, which is located inthe actuation chamber for the pressure compensation was also integrated in the model.
The grid deformation module allows CFD-ACE+ to calculate such moving gridproblems. Due to the complexity and the huge computing time the simulation modelwas simplified. The pressure pulse was calculated separately from the measured pistonmovement by the analytical model described in chapter 2.4.7.1. Afterwards this pres-sure pulse was applied as pressure boundary condition in the simulation model. In thecourse of the implementation of the integrated process control into the TopSpot dis-penser, the analytically calculated pressure pulse was later replaced by the measuredpulse of the pressure sensor. The simulation model as described in the following alsoincludes the characterization of the droplet impact on solid and liquid surfaces.
GEOMETRY: For the CFD simulation it was necessary to model the geometry by a three-dimensionalstructured computational grid consisting of up to 149.956 cuboid cells where thesmallest one had a volume of 2.5 x 10⁻¹⁸ m3 and the largest one had a volume of1.1 x 10-13 m3. Therefore, a python script, that is included with the CDROM versionof this thesis, was created. This script contains the geometric dimensions of a TopSpotnozzle as variable input parameters. Additionally, the grid density at the edges can bemodified. Regarding the TopSpot printhead only one half of a nozzle was modeled toreduce the number of required grid elements and computing time. The VOF methodincluding surface tension and the auto time step function was used with a CFL numberof 0.2 to solve the model. The CFL number is a time limitation of the automatic time
TOPSPOT: HIGHLY PARALLEL NANOLITER DISPENSING - OPERATING CONDITIONS AND DESIGN RULES - 93 -

DESIGN AND OPERATION RULES DISSERTATION REMIGIUS NIEKRAWIETZ
step when the VOF module is switched on. A CFL value of 0.2 allows the interface ofthe fluid to cross 20 % of the cell width during each time step. The time stepsdetermined by ACE+ varied in the range of 0.1 µs - 0.5 µs.
The activated capillary-wave damping option increases the viscosity in the vicinityof the interface, in an attempt to damp the capillary waves that are invariably in the in-terface under surface tension forces. Increasing the viscosity around the interface,however, could adversely affect the final solution, and must therefore be done as littleas possible to obtain the correct solution. The viscosity of the liquid and the gas in thevicinity of the interface must both be specified, as a ratio of the original viscosity. Typ-ical suitable ranges for the increase in the viscosity are 2-10 for the liquid, and 200-1000 for the gas, which is typically 100 times less viscous than the liquid. The usedvalue for the droplet ejection and droplet impact process was 2.5 for liquid and 200 forgas.
For solving the model, the CGS solver and the PLIC surface reconstruction werechosen and the removal of "Flotsam and Jetsam" was applied. This option restrains thegeneration of tiny isolated droplets of liquid in the gas phase or tiny isolated bubblesin the liquid phase, the so-called "Flotsam and Jetsam". The volume at the nozzle outletis called control volume and it is necessary to simulate and visualize the trajectory ofthe ejected droplet. The air filled chamber above the nozzle can detect possible leaksfrom the nozzle into the actuation chamber. This can occur during a negative pressurepulse, which could lead to cross-talk between the nozzles in a real device. The discret-ization of the mesh in the surrounding area of the nozzle outlet is quite fine(Δx = Δy = Δz = 1.5 µm) in order to investigate precisely the droplet tear-off and theinfluence of wetting effects.
Figure 4.16: Simulation model of one TopSpot nozzle, the structured 3D grid consisting of up to150,000 cuboid cells from different point of views. a.) Front view, b.) Top view, c.) Three-dimensionalview.
b)
a) c)
- 94 - TOPSPOT: HIGHLY PARALLEL NANOLITER DISPENSING - OPERATING CONDITIONS AND DESIGN RULES

DISSERTATION REMIGIUS NIEKRAWIETZ DESIGN AND OPERATION RULES
In Fig. 4.16 the used grid is displayed from different point of views. The used num-ber of grid elements was checked to be sufficient concerning consistency, convergenceand required computing time. A systematic grid refinement study was done by com-paring simulation results based on models with different numbers of grid elements.The present grid was chosen as optimum regarding minimum computing time andmaximum consistency and convergence compared to high-grid solutions.
BOUNDARY CONDITIONS: In Fig. 4.17a-b the applied boundary conditions (BC) and the pressure loss due to thecontraction of the cross-section and the fluidic resistance of the nozzle geometry aredisplayed. For driving the droplet generation a time dependent pressure BC as dis-played in Fig. 4.18 was applied on the top of the structure (see Fig. 4.17a). Before ap-plying the pressure pulse on the nozzle a 1 ms time period is needed to equilibrate themeniscus by capillary forces in order to avoid a meniscus oscillation, which has a neg-ative impact on the droplet dispensing process. The pressure curve as shown in Fig.4.18 was determined by experiments with the integrated pressure sensor. The innerwall of the nozzle and the nozzle chamber is assumed to be full-wetting (Θ = 0°), com-parable to the activated silicon oxide surface. The wall surrounding the outside of thenozzle is assumed to have a contact angle of Θ = 130°, like the average value for theused coating solution (see chapter 3.1.4.1). The outlet to the surrounding environmentfilled with air (fluid 0) has a constant pressure of 0 Pa. The implemented symmetryboundary condition, which is located in the paper plane, completes the device out ofthe half model. The dispensing medium was water like with a density of ρ = 1000 kg/m3, a surface tension of σ = 0.725 N/m and a dynamic viscosity of η = 0. 001 Pas.
Figure 4.17: Simulation model of one TopSpot nozzle: a.) Nozzle dimensions and the applied boundaryconditions, which were used for the simulation model of the dispensing process. b.) Visualization of thepressure loss due to the contraction of the cross-section and the fluidic resistance of the nozzle geome-try.
a) b)
Pressure loss due to fluidic resistance
Pressure loss due to contractionand entering effects
TOPSPOT: HIGHLY PARALLEL NANOLITER DISPENSING - OPERATING CONDITIONS AND DESIGN RULES - 95 -

DESIGN AND OPERATION RULES DISSERTATION REMIGIUS NIEKRAWIETZ
VALIDATION OF THE SIMULATION MODEL: A qualitative measure to assess the quality of droplet generation simulations is thedroplet shape. First of all the shape of a micro droplet can be determined very well bystroboscopic measurement techniques described in chapter 3.1.1. Secondly, the correctprediction of the droplet shape requires the consideration of all relevant physical ef-fects (viscosity, surface tension etc.). Thus the droplet shape as displayed in Fig. 4.19is ideally suited to test consistency with experiments. Furthermore, the point in time,when the droplet detaches from the nozzle (tear-off time) is a valuable quantitativemeasure, which can be extracted from stroboscopic experiments for validation purpos-es. In addition, the droplet velocity after leaving the nozzle and also the ejected dropletvolume can be measured. The droplet volume is the most important parameter regard-ing the printhead design, print media and the actuation principle of the dispenser.
A good agreement is obtained between simulation data and stroboscopic picturesdisplayed in Fig. 4.19. The shape of the droplet and point of the droplet tear-off fit verywell. The determination of the droplet volume out of the CFD simulation is done byintegrating the volume flow at the nozzle outlet. The volume flow can be taken out ofan ASCII file provided by the simulation tool at any arbitrary interface or inlet/outletof the model. The droplet volume in the simulation model of ACE+ resulted in 0.66 nl.The determination of the droplet velocity from the CFD simulation is done by measur-ing the average velocity of the droplet 150 µm outside the nozzle using the post-pro-cessing tool from CFD-ACE+. The simulated velocity is 0.60 m/s for a 50 µm nozzleof the TopSpot printhead [117].
A stroboscopic camera was used to experimentally measure the dispensed volumeof the flying droplet by counting the pixels of the droplet on the picture. Thus the drop-let volume can be determined by geometrical outline analysis of the dispensed drop-lets. For the precise analysis of the recorded pictures the image processing systemNeuroCheck® was used. The measurement error of the optically measured droplet vol-umes can be estimated to be ~12 % due to the random error in the read out of the pixelsrepresenting one unit volume (see chapter 3.1.3.1). The stroboscopic measurement re-sulted in a droplet volume of 0.68 nl, which is close to the 0.66 nl from the simulation.
Figure 4.18: Applied pressure pulse at the inlet, which was measured by the integrated pressure sen-sor. The stroke of the piezo actuator was 38 µm with a downstroke velocity of 380 µm/ms and anupstroke velocity of 70 µm/ms. The point of the droplet tear-off (green) and the capillary pressure ofthe printhead nozzle (blue) are indicated in the graph.
- 96 - TOPSPOT: HIGHLY PARALLEL NANOLITER DISPENSING - OPERATING CONDITIONS AND DESIGN RULES

DISSERTATION REMIGIUS NIEKRAWIETZ DESIGN AND OPERATION RULES
To determine the droplet velocity a series of pictures from the observed dispensingprocess has to be recorded like described in chapter 3.1.1.2 by a stroboscope cameraand analyzed by NeuroCheck®. The delay time between the recorded pictures can betaken from the software set Δt information. The droplet velocity can be determined bydividing the measured distance by the delay time of the droplets. The measured lengthwas 350 µm and started after the droplet tear-off. If a linear motion is assumed, a drop-let velocity of 0.65 m/s is obtained. The measuring error originates from droplets ve-locity, which is superposed by the „wobbling“ of the droplet and prevents a clearmeasuring point as a result of motion blur. Therefore, in some cases a distance mea-surement error of up to ~10 % has to be taken into account (see chapter 3.1.3.1). Thaterror is also influenced by the delay time between the two analyzed pictures.
The deviations between simulation and experiment regarding the droplet volumeand droplet velocity were less than 5 %. The critical pressure, which was experimen-tally determined by the integrated pressure sensor was used for the CFD simulation andled to no droplet ejection. Increasing the pressure pulse amplitude by only 5 %, a stabledroplet ejection process could be achieved in the simulation. This minor irregularitymight be explained by the fact, that the TopSpot printhead has a small deviation in thenozzle length. The notching effect explained in chapter 5.1.1.4 results in a shortenednozzle length, which affects the fluidic resistance and of course, the needed pressurepulse to dispense a single droplet.
VALIDATION OF THE DROPLET IMPACT: For the validation of the droplet impact the same simulation model was used. As out-lined in chapter 2.5.5 a dispensed droplet can exhibit a variety of behaviors during theimpact on a surface. The distance between the dispenser nozzle and the substrate isusually 530 µm, which matches the typical gap during microarray printing. The impactvelocity of the droplet is 0.65 m/s. A contact angle of 15° was assumed on the sub-strate, which conforms to an unmodified microscope slide. To visualize the experi-ment, a stroboscope camera was arranged in front of the dispenser. A slide tray on amobile axis system was placed below and moved after each printing to the next freeposition. This enabled to capture the dynamics of the continuous droplet impact on asurface. The numerical calculation of the droplet shape during the impact agrees wellwith the experimental results as displayed in Fig. 4.20. Both, simulations and experi-
Figure 4.19: 3D simulation of the droplet ejection of one nozzle and corresponding stroboscopic pic-tures (only the fluidic part is shown)
TOPSPOT: HIGHLY PARALLEL NANOLITER DISPENSING - OPERATING CONDITIONS AND DESIGN RULES - 97 -

DESIGN AND OPERATION RULES DISSERTATION REMIGIUS NIEKRAWIETZ
ments show no bursting of the droplets and the liquid wets the surface of the substrate.Minor deviations close to equilibrium position might be attributed to dynamic contactangle and priming effects.
These results help to understand the parameters and mechanisms, that control thedroplet spreading and provide information on possible operating ranges for high griddensity microarrays, because spreading widths can be estimated from simulations. Thisis important, because it has to be prevented, that neighboring spots merge.
4.2.1.2 MODEL OF THE FIRST PRIMING Capillary liquid transport is an enormously powerful tool and is commonly used forfilling microfluidic structures without need for any external actuation. An absolutelyreliable first priming of the TopSpot printhead is important to guarantee a robust func-tionality of the dispenser. Enclosed and trapped gas bubbles lead to malfunctions or er-ratic behavior. The microchannels in the printhead not only deliver the liquids from thereservoirs to the nozzles, but are also responsible for the format change of the 4.5 mmreservoir pitch to the 500 µm nozzle pitch. Considering the high density of the nozzlesin a 384 printhead, the channel width has to be reduced to a minimum, which can befilled by capillary forces. In addition, a concept should be proven, which enables to fillnozzles of different connection levels (see chapter 5.1) and accumulate more micro-channels on the same space. The unequal heights of the capillary channel and the noz-zle cause a separation of both levels by a sharp step. The latter acts as a capillary barrierand prevents a capillary liquid transfer from the upper microchannel to the lower levelof the nozzle. Therefore, a special geometrical structure has to be integrated in the mi-crochannel, which forces the liquid to wet the bottom of the nozzle and a „passive cap-illary filling“ is possible again. The knowledge of the capillary filling process isimportant to the printhead design. It can be a guide for developers to arrange the inter-nal structure of the printhead in an optimized way, avoiding potential filling problemsand ensuring a high filling speed.
GRID & BOUNDARY CONDITIONS: To examine the influences of the first priming occurring in the real printhead device aseparate complete three-dimensional model was set up in FLUENT 5.5.14, which is acommercial CFD code. For the geometry creation GAMBIT [140] provides a commonset of CAD-functions, that allow a fast geometry creation. Because the solver has only
Figure 4.20: Comparison of the 3D simulations of the impact of a dispensed droplet of one TopSpotnozzle on a hydrophilic surface and the corresponding stroboscopic pictures.
0 µs 100 µs 120 µs 140 µs 150 µs 170 µs 200 µs 250 µs
- 98 - TOPSPOT: HIGHLY PARALLEL NANOLITER DISPENSING - OPERATING CONDITIONS AND DESIGN RULES

DISSERTATION REMIGIUS NIEKRAWIETZ DESIGN AND OPERATION RULES
a few limitations concerning mesh-types GAMBIT allows a fast mesh creation. Thepossible mesh types are structured (quadrilateral in 2D and hexahedron, prism/wedgein 3D), unstructured (triangle in 2D and tetrahedron, pyramid in 3D), hybrid (combi-nation of structured and unstructured meshes in one geometry) and non-conformalmeshes. Structured meshes can either be created manually or by using the Cooper-scheme [140]. Using this scheme allows for fast meshing with good grid quality ofstructured meshes. After an appropriate mesh is provided, FLUENT is used for thesimulation setup, the solving process and the post processing of the results.
The grid of the TopSpot filling structure is a hybrid mesh. The main part of the gridis structured with hexahedron mesh elements as displayed in Fig. 4.21. In the nozzlevicinity an unstructured grid of hexahedron mesh elements is used. An immediate ad-vantage of an unstructured grid is, that it is able to conform more closely to the actualnozzle with its particular geometry than a regular grid. This is important in studies ofthe capillary wicking. The three-dimensional model consists of a hybrid computationalgrid of about 97,771 cuboid cells, where the smallest one has an area of 9.9 x 10⁻¹⁸ m2
and the largest one has an area of 2.4 x 10⁻¹⁶ m2 as it is displayed in Fig. 4.21.
The solution is time–dependent, which means that the transient version was used. Thecase was solved with the segregated solver and the sliding mesh capability. The timestep was chosen to be 1x10⁻⁷ s, so that the filling period would be composed by a suf-ficient number of steps (25000). The inner walls of the nozzle and nozzle chamber areassumed ideally to be full wetting (Θ = 0°) like explained in chapter 4.2.1.1. The res-ervoir inlets were realized as pressure boundary condition (p = 0 Pa, fluid 1). The noz-zle and microchannel outlet were also realized as pressure boundary condition (p = 0Pa, fluid 0). As initial condition a small amount of liquid was placed in the microchan-nel to reduce the computing time, facilitating the beginning and convergence of thesimulation (see Fig. 4.22). The segment above the nozzle and the microchannel with aheight of 10 µm is used for monitoring the capillary surface during the first priming. Ifliquid leaks out of the nozzle or the microchannel in this area it could cause a cross-contamination of the printing media between two nozzle neighbors. The filling simu-
Figure 4.21: The grid, which was used for the first priming of the TopSpot printhead consisting of themicrochannel and the nozzle from different point of views. The model is cut on the two yellow intersect-ing lines to better visualize the grid structure a.) Front view b.) Top view c.) Three-dimensional view.
b)
a) c)
TOPSPOT: HIGHLY PARALLEL NANOLITER DISPENSING - OPERATING CONDITIONS AND DESIGN RULES - 99 -

DESIGN AND OPERATION RULES DISSERTATION REMIGIUS NIEKRAWIETZ
lation took about four weeks of computing time on a state of the art PC (Pentium P4,1.8 GHz, 512 MB RAM). The very long computing time compared to the droplet ejec-tion is due to the low dynamics during the capillary filling and the resulting small timesteps automatically calculated by the solver using the progressing interface.
VALIDATION OF THE FIRST PRIMING: In Fig. 4.23 a picture sequence of the simulated first priming in comparison to the ex-perimental capillary filling is displayed. The experimental as well as the simulation re-sults show no stagnancy of the meniscus movement or an enclosed bubble in thenozzle. Furthermore, there is no wetting of the area above the nozzle and the micro-channel visible, hence no cross-contamination is taking place. In the simulation model,the filling liquid overcomes both levels, which are separated by a small sharp step. Thespecial filling structure at the end of the microchannel consists of a gap, which dividesthe microchannel into two separate inflows. The liquid wets the two inflows and fillsthe capillary gap between them. Afterwards the liquid reaches the second level of thenozzle and fills the whole surface. The sharp edge of the 50 µm diameter nozzle in themiddle prevents a further capillary filling. As a result the liquid rises in the nozzle ex-pansion until a certain filling height is reached and the barrier can be overcome. Thisfilling behavior is also obtained by the experimental results. The succession of the fill-ing steps shows a good agreement. The camera used for the measurements supports a
Figure 4.22: Dimension and initial condition of complete filling structure of the TopSpot printhead.The microchannel is partially filled with liquid to reduce the computing time. To visualize the separa-tion of both levels by a small sharp step, which should help to overcome the capillary barrier by theliquid, the microchannel level is colored in blue and the nozzle expansion level in yellow.
- 100 - TOPSPOT: HIGHLY PARALLEL NANOLITER DISPENSING - OPERATING CONDITIONS AND DESIGN RULES
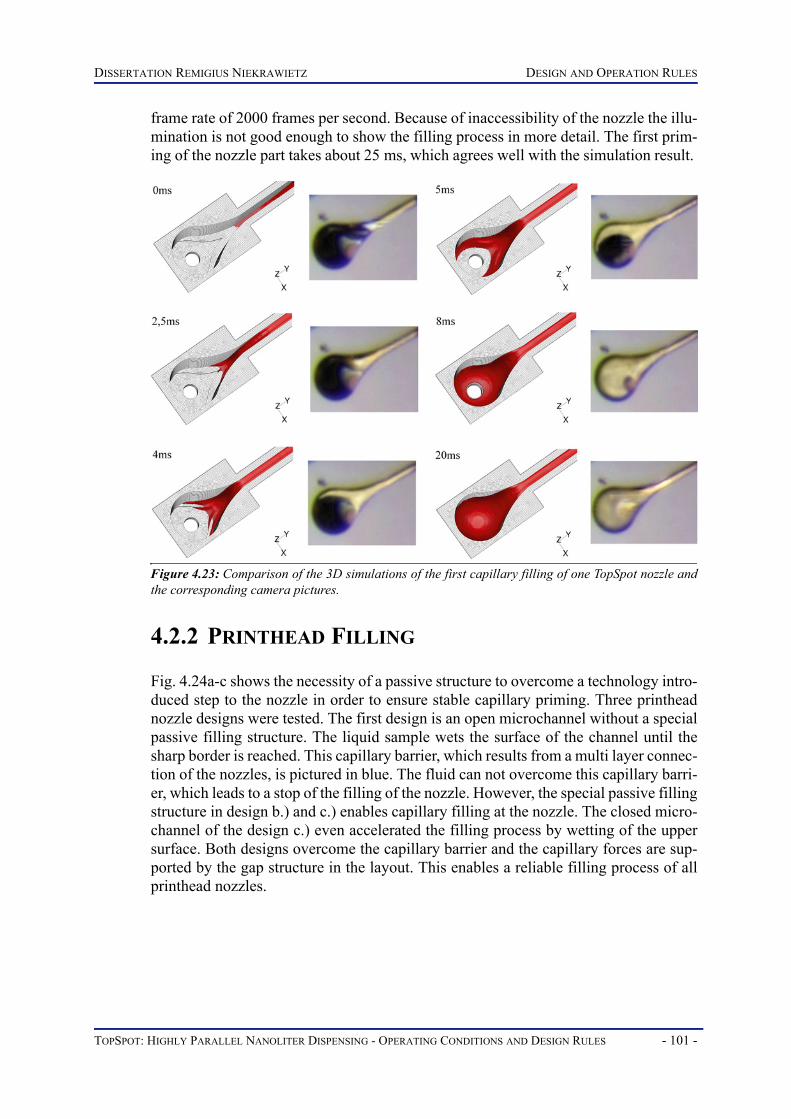
DISSERTATION REMIGIUS NIEKRAWIETZ DESIGN AND OPERATION RULES
frame rate of 2000 frames per second. Because of inaccessibility of the nozzle the illu-mination is not good enough to show the filling process in more detail. The first prim-ing of the nozzle part takes about 25 ms, which agrees well with the simulation result.
4.2.2 PRINTHEAD FILLING
Fig. 4.24a-c shows the necessity of a passive structure to overcome a technology intro-duced step to the nozzle in order to ensure stable capillary priming. Three printheadnozzle designs were tested. The first design is an open microchannel without a specialpassive filling structure. The liquid sample wets the surface of the channel until thesharp border is reached. This capillary barrier, which results from a multi layer connec-tion of the nozzles, is pictured in blue. The fluid can not overcome this capillary barri-er, which leads to a stop of the filling of the nozzle. However, the special passive fillingstructure in design b.) and c.) enables capillary filling at the nozzle. The closed micro-channel of the design c.) even accelerated the filling process by wetting of the uppersurface. Both designs overcome the capillary barrier and the capillary forces are sup-ported by the gap structure in the layout. This enables a reliable filling process of allprinthead nozzles.
Figure 4.23: Comparison of the 3D simulations of the first capillary filling of one TopSpot nozzle andthe corresponding camera pictures.
TOPSPOT: HIGHLY PARALLEL NANOLITER DISPENSING - OPERATING CONDITIONS AND DESIGN RULES - 101 -

DESIGN AND OPERATION RULES DISSERTATION REMIGIUS NIEKRAWIETZ
Figure 4.24: CFD simulated picture sequence of the first capillary filling: a.) An open microchannelwithout special passive filling structure, which results in a stop of the filling process at the step to thenozzle. b-c.) An open and closed microchannel with the integrated special filling structure, which over-comes the capillary barrier. The closed microchannel enables a faster and more reliable filling processof the nozzle.
a) b) c)
- 102 - TOPSPOT: HIGHLY PARALLEL NANOLITER DISPENSING - OPERATING CONDITIONS AND DESIGN RULES

DISSERTATION REMIGIUS NIEKRAWIETZ DESIGN AND OPERATION RULES
4.2.3 DROPLET VOLUME
The droplet volume of the TopSpot dispenser is influenced by many parameters. Thenozzle design plays an important role in determining the overall performance of theTopSpot printhead and the dispensed droplet volume. The pressure pulse, which con-trols the dispensing process and the dispensing media are also essential impact factors.A reduction of the droplet volume leads to a higher density of spots in the microarrayand is therefore a desirable design goal.
In the following experiments the required pressure conditions for a stable and satel-lite free single droplet dispensing process were investigated by stroboscoping imaging.For the precise analysis of the recorded droplets the image processing system Neuro-Check® was used. Therefore a programmed measurement process, which measured theradius of droplets during-the-fly was developed. The pressure value for this optimumprinting condition was measured by the integrated pressure sensor as described inchapter 3.2.
After the validation of the CFD simulation models further simulations have beenperformed to analyze the droplet volume dependency of the printhead by varying pa-rameters like geometrical dimensions, pressure pulses and liquid properties. In the sim-ulations the pressure pulse amplitude was also adjusted, similar as described in chapter3.1.2.2 for the automatic control loop to ensure the presence of all spots on the slide.But in this case the pressure pulse amplitude was adapted stepwise to achieve the min-imum required pressure for a single droplet tear-off.
4.2.3.1 NOZZLE DIAMETER
To evaluate the influence of the nozzle diame-ter on the droplet volume, a printhead with dif-ferent nozzle diameters from 25 µm up to50 µm and a standard nozzle expansion diame-ter of 300 µm was studied (see Fig. 4.25). Allthe nozzles of the printhead were filled with thesame printing liquid (DI-water). Due to the in-creased fluidic resistance by reducing the noz-zle diameter the pressure pulse has to beadapted separately for each nozzle to dispensea single droplet volume (see Fig. 4.27). Exper-imentally the pressure pulse for ejecting a drop-let out of the nozzle with a diameter of 25 µmcould not be generated by the maximum displacement of the piezo actuator. For the re-maining nozzles a positive correlation between nozzle diameter and pressure pulsewith decreasing droplet volumes was found (see Fig. 4.26, Fig. 4.27). Compared to thestandard nozzle diameter of 50 µm with a droplet volume of 813 pl, the dispensing vol-ume could be reduced by using a 30 µm nozzle to a minimum of 338 pl.
In the prefixed simulations of the different printhead nozzle diameters the experi-mental measured pressure pulse of a standard nozzle was used as boundary condition.This pressure pulse was linearly scaled down until no free flying droplet could be gen-
Figure 4.25: Top view of the used 24erprinthead. The row of the different ana-lyzed nozzle diameter is indicated in red.
TOPSPOT: HIGHLY PARALLEL NANOLITER DISPENSING - OPERATING CONDITIONS AND DESIGN RULES - 103 -

DESIGN AND OPERATION RULES DISSERTATION REMIGIUS NIEKRAWIETZ
erated. The pressure in Fig. 4.27 shows the minimum pressure amplitude, which is nec-essary to achieve a single droplet ejection. The simulation results show the samebehavior, but the dispensed droplet volume is slightly lower compared to the experi-mental results (see Figure 4.26). This might be explained with the changing of the rub-ber spring from an O-ring to a X-ring leading to a slower pressure decline in theexperimental used pressure pulse (chapter 4.1.5). Consequently, the applied pressureboundary condition in the simulation was not completely identical to the experimentalpressure pulse. Further, the activated capillary-wave damping option, which increasedthe viscosity in the simulation (see chapter 4.2.1.1) could have been chosen slightly tohigh compared to the results from real experiments. Both reasons could lead to an in-creased droplet volume in the experimental results.
Figure 4.26: Influence of the dispensed droplet volume by the reduction of the nozzle diameter. Simu-lation and experimental results show a reduced droplet volume with decreasing nozzle diameter.
Figure 4.27: Reducing the nozzle diameter raises the minimum pressure pulse required for a singledroplet ejection.
- 104 - TOPSPOT: HIGHLY PARALLEL NANOLITER DISPENSING - OPERATING CONDITIONS AND DESIGN RULES

DISSERTATION REMIGIUS NIEKRAWIETZ DESIGN AND OPERATION RULES
4.2.3.2 NOZZLE EXPANSION DIAMETER
To clarify, if the size of the nozzle expansiondiameter affects the minimum required peakpressure for a single droplet ejection, a print-head with several nozzle expansion diameterswas investigated (Fig. 4.28). The influence onthe dispensed droplet volume was also ana-lyzed. The nozzle diameter was kept constant at50 µm. The whole printhead was filled withDI-water and a stroboscopic camera was usedto observe the droplet ejection process. Thestroboscopic pictures showed a minor changein the droplet tear-off by reducing the nozzleexpansion diameter from 300 to 200 µm (seeFig. 4.29). The liquid could be dispensed by the
Figure 4.29: Stroboscope pictures of the droplet tear-off of a printhead with different nozzle expansiondiameters. The piezo stroke, which results in the pressure pulse was adjusted for a single droplet ejec-tion of a defined nozzle expansion (marked by dotted lines). The first picture row shows, that the reduc-tion of the nozzle expansion from 300 µm to 200 µm causes minor changes of the needed pressurepulse. All three nozzles could eject droplets with the same pressure pulse.
Figure 4.28: Top view of the used 24erprinthead. The row of the different ana-lyzed nozzle expansion diameters (300-75 µm) is indicated in red.
a) b)
TOPSPOT: HIGHLY PARALLEL NANOLITER DISPENSING - OPERATING CONDITIONS AND DESIGN RULES - 105 -

DESIGN AND OPERATION RULES DISSERTATION REMIGIUS NIEKRAWIETZ
same piezo stroke of 54 µm. When the nozzle expansion is reduced to 150 µm, the pi-ezo stroke has to be increased by 5 µm to produce a single droplet. Hence, the next stepof reducing the nozzle expansion requires also an increase of the piezo stroke. The re-duction of the nozzle expansion diameter leads to a slow increase of the fluidic resis-tance. When the nozzle expansion diameter gets in the range of the nozzle diameter, itbecomes more important and the dispensing process requires a higher pressure pulsefor the droplet ejection as depicted in Fig. 4.32. The experimental results also show aminor reduction of the droplet volume from 813 pl to 749 pl when using a 60 µm ex-pansion nozzle. The discontinuity in the reduction of the droplet volume in the exper-
imental results can be traced back to the fact, that two different printheads were usedfor the characterization (see Fig. 4.30). Small differences in the etch depth of the nozzleexpansions due to differently sized local mask opening areas of the printheads (seechapter 5.1.1.3) or maybe minor differences of the hydrophobic coating of the nozzlearea can change the dispensed droplet volume.
The simulations confirm the results and provide an insight into the whole nozzleduring the dispensing process. It can be seen, that the meniscus in the nozzle is set inmotion for nozzle expansion diameters smaller than 200 µm (Fig. 4.33). Due to the re-duction of the nozzle expansion diameter the liquid volume in the whole nozzle is dra-matically reduced, thus the ejected droplet substantially depletes the nozzle expansion.Especially the nozzle expansion of 60 µm with a filling quantity of 0.95 nl loses 0.59 nlduring the dispensing process, which is nearly the complete liquid volume (Fig. 4.31).A problem could arise once the nozzle gets empty. This could occur for a smaller noz-zle expansion diameter than 60 µm. The pressure pulse may result in an air flowthrough the nozzle, which could lead to a spraying effect.
The integration density of the nozzles in the printhead is also limited by the neces-sary size for the expansion diameter (see chapter 5). Consequently, the nozzle expan-sion should be as small as possible to enable a high integration density.
However, this should be realized without a considerably higher fluidic resistance ofthe nozzle. Assuming a higher fluidic resistance, an increased pressure pulse is neededand would result in a limitation of the printing media range. The nozzle expansion of
Figure 4.30: Top view of the two characterized printheads with different nozzle expansion diametersindicated in red. a.) Nozzle expansion diameter from 300-150 µm b.) Nozzle expansion diameter from125-60 µm
a) b)
- 106 - TOPSPOT: HIGHLY PARALLEL NANOLITER DISPENSING - OPERATING CONDITIONS AND DESIGN RULES

DISSERTATION REMIGIUS NIEKRAWIETZ DESIGN AND OPERATION RULES
150 µm is an optimal size, because the necessary pressure pulse for a single dropletejection needs to be increased by only 6.4 % and the nozzle expansion size can be re-duced to 50 %.
Figure 4.31: Influence on the dispensed droplet volume by increasing the nozzle expansion diameter.Simulation and experimental results show a nearly constant droplet volume when changing the nozzleexpansion diameter in this range.
Figure 4.32: Reducing the nozzle expansion diameter enforces minor adaptations of the pressure pulsefor a single droplet ejection. However the pressure pulse has to be increased significantly at nozzleexpansion diameters, which are in the range of the nozzle diameter.
TOPSPOT: HIGHLY PARALLEL NANOLITER DISPENSING - OPERATING CONDITIONS AND DESIGN RULES - 107 -

DESIGN AND OPERATION RULES DISSERTATION REMIGIUS NIEKRAWIETZ
4.2.3.3 NOZZLE LENGTH
The nozzle length can be reduced by a longer etching process of the nozzle expansions,which also leads to a higher filling volume of the whole nozzle. The second possibilityis to use a thinner silicon wafer, which also reduces the processing time. But this is lim-ited because of stability reasons of the printhead. Hence, the first method was used forthe processing of the printheads. To study its influence the nozzle length was reducedfrom 150 µm to 25 µm in 25 µm steps (see Fig. 4.34). Measurements and the simula-tions of the printhead showed a nearly linear correlation of the droplet volume to the
Figure 4.33: Simulation of the different nozzle expansion diameters: The reduced liquid volume innozzles caused by the reduction of the nozzle expansion diameter led to distinct movement of the liquidmeniscus. At a nozzle expansion diameter of 60 µm nearly the complete liquid volume of the nozzle willbe dispensed.
Figure 4.34: The reduction of the nozzle length leads to little lower droplet volume.
- 108 - TOPSPOT: HIGHLY PARALLEL NANOLITER DISPENSING - OPERATING CONDITIONS AND DESIGN RULES

DISSERTATION REMIGIUS NIEKRAWIETZ DESIGN AND OPERATION RULES
nozzle length. However, the experimental results show a lower droplet volume reduc-tion of 5 % from a 150 µm to a 25 µm nozzle length. Compared to the simulation re-sults, which reduced the droplet volume even by 17 %. The influence of the pressurepulse conforms to a linear correlation (see Fig. 4.35). The reduced nozzle length leadsto a decreased fluidic resistance and therefore a lower pressure pulse is needed for asingle droplet ejection. The critical velocity, which is needed to initiate a droplet tear-off (see chapter 2.5.2) can still be reached, even with higher viscosity fluids, which re-sults in an expansion of the printing media range.
4.2.3.4 PRESSURE PULSE SHAPE
The pressure pulse shape plays a decisive role for the droplet tear-off. For the CFDsimulations the measured pressure pulse of the integrated pressure sensor was used asinitial state (black curve in Fig. 4.36). The pressure energy of this pulse was calculatedand rectangular pulses with the same energy but with different pressure amplitudeswere used to investigate the droplet tear-off as depicted in Fig. 4.36. The results dem-onstrate clearly, that not only the pressure amplitude but also the hold time of the pres-sure pulse plays an essential role. If the critical pressure is reached, it will cause adroplet tear-off. This tear-off could be achieved at a pressure amplitude of 0.15 bar,with a longer hold time or with a higher amplitude of 0.175 bar with a shorter hold timelike the measured pressure pulse. If the pressure amplitude is too small (red curve), nodroplet ejection takes place.
The ejected droplet volume is growing with a rising amplitude of the square pres-sure pulse from 679 pl to 789 pl. Although the measured pressure pulse 1 had a higheramplitude than the square pressure pulse 3 it caused a lower droplet volume. Hence,the ejected volume depends on the amplitude and also on the hold time of the pressurepulse. The droplet velocity shows similar characteristics. The measured pressure pulse1 has a lower droplet velocity but a higher pressure amplitude than the square pressurepulse 3. Consequently, the droplet velocity increases linearly with the pressure ampli-tude but is also influenced by the pressure hold time.
Figure 4.35: Increasing the nozzle length causes an increased pressure pulse to be applied for a singledroplet ejection.
TOPSPOT: HIGHLY PARALLEL NANOLITER DISPENSING - OPERATING CONDITIONS AND DESIGN RULES - 109 -

DESIGN AND OPERATION RULES DISSERTATION REMIGIUS NIEKRAWIETZ
In Fig. 4.37 the calculated approximated volume flow Φv,approx(t) and the criticaltime depending volume flow Φv, critical(t) is displayed (see chapter 2.5.4). If the pres-sure pulse 1-6 causes an approximated volume flow, which exceeds the critical volumeflow a droplet tear-off with the droplet volume Vapprox(t) will be achieved. The calcu-lated approximate volume flow confirms the CFD simulation results in all consideredcases. The rectangular pressure pulse 2 generated an approximated volume flow 2,which did not reach the critical volume flow and no droplet tear-off was caused (seeFigure 4.37b). The pendent droplet grew but remained attached to the nozzle (see Fig.4.36). Due to the increased amplitude of the rectangular pressure pulse 3 the criticalvolume flow 3 could be reached in that case and a droplet tear-off was forced (see Fig-ure 4.37c). The higher pressure amplitude (square pressure pulse 4) further led to alonger exceed time of the critical volume flow 4 and also caused an increased dropletvolume. In summary of the presented results, the criterion for a droplet tear-off as de-scribed in chapter 2.5.4 could be confirmed for all considered cases. In the case of ahigher pressure pulse amplitude (square pressure pulse 5 and 6) the droplet ejectionprocess changes its shape to a jet dispensing process, where the jet is separating intoseveral single droplets.
The comparison of the dispensed droplet volume VCFD of the CFD simulation withthe calculated approximate volume Vapprox of the analytical model showed a consider-able higher volume (average 60 %) in the analytical model. This is due to the fact, that
Figure 4.36: Pressure pulse shape influences the droplet tear-off: The pressure energy of the experi-mentally measured pressure pulse was calculated and transferred to a rectangular shape with the sameenergy. The results show, that the ejected volume depends on the pressure amplitude and also on thepressure hold time. The droplet velocity depends linearly on the pressure amplitude but is also depend-ing on the pressure hold time.
- 110 - TOPSPOT: HIGHLY PARALLEL NANOLITER DISPENSING - OPERATING CONDITIONS AND DESIGN RULES

DISSERTATION REMIGIUS NIEKRAWIETZ DESIGN AND OPERATION RULES
Vapprox is not the volume of the droplet that leaves the nozzle. It is the volume of thependent droplet. The falling droplet splits and consists of a smaller droplet volume asdescribed in chapter 2.5.4.
4.2.3.5 PRINTING MEDIA
The droplet size is not only depending on thegeometrical outline of the nozzle and the pres-sure pulse, but it is also well known, that theliquid properties play a major role in determin-ing the print volume (see chapter 2.5.3). In theexperiments it is not possible to tune the liquidproperties independently of each other. In real-ity, density, surface tension and dynamic vis-cosity are intimately connected. To investigate, which parameter is dominant thesimulation model was used for analyzing this behavior. Varying the liquid parameters
Figure 4.37: Calculated volume flows to predict a droplet tear-off and resulted droplet volume (seealso chapter 2.5.4). a.) Shows the volume flow of a standard measured pressure pulse 1. b-d.) Presentsthe volume flow of the rectangular shape pressure pulses. The standard pressure pulse 1 and theapproximated volume flows of the rectangular pressure pulse 3 and 4 exceed their critical volume flowand a droplet tear-off is caused. The approximated volume flow of the rectangular pressure pulse 2 didnot reach the critical volume flow at no point in time and no droplet tear-off could be reached. By inte-grating the approximated volume flow (see also chapter 2.5.4) the droplet volume Vapprox(t) can becalculated.
a) b)
c) d)
Figure 4.38: Stroboscopic picture of adroplet ejection process of six nozzles filledwith a DMSO50-5 %v/v concentration row.
TOPSPOT: HIGHLY PARALLEL NANOLITER DISPENSING - OPERATING CONDITIONS AND DESIGN RULES - 111 -

DESIGN AND OPERATION RULES DISSERTATION REMIGIUS NIEKRAWIETZ
like density, surface tension or dynamic viscosity leads to a significant change in thedroplet volume as displayed in Fig. 4.39 for the considered TopSpot printhead. To eject
a single droplet volume with a six fold increased density only a 11 % higher pressurepulse is needed (see Fig. 4.40). Under the same conditions the droplet volume is re-duced to 60 %. But increasing the surface tension or viscosity requires a huge adapta-tion of the pressure pulse. For a three fold increased viscosity a 57 % higher pressurepulse is needed. For an equal increased surface tension an even 140 % higher pressurepulse is needed. Further, increasing the surface tension or viscosity also induces a high-er droplet volume.
Figure 4.39: Simulated single droplet volume dependence on the density, the surface tension and thedynamic viscosity. For every line only the indicated parameter was varied. All other parameters werefixed at reference conditions. The green circle selects the point of the single droplet volume of water.
Figure 4.40: Needed pressure pulse condition for a single droplet depending on liquid properties[density, surface tension and the dynamic viscosity]. The green circle marks the needed pressure con-dition to dispense water.
- 112 - TOPSPOT: HIGHLY PARALLEL NANOLITER DISPENSING - OPERATING CONDITIONS AND DESIGN RULES

DISSERTATION REMIGIUS NIEKRAWIETZ DESIGN AND OPERATION RULES
4.2.4 DROPLET INTERACTION WITH SOLID AND LIQ-UID SURFACES
The phenomena of liquid droplet impacts is of interest in a wide range of applicationsincluding ink-jet printing, spray painting, spray cooling, injection of droplets into com-bustion chambers and microarray production. As mentioned in section 2.5.5 the fluidicdynamic of a droplet impact on solid or liquid surfaces is very complicated and de-pends on many different parameters. A necessary precondition during a droplet surfaceinteraction for a high quality microarray production is the fact, that the droplet impactmust stay below the threshold of splashing. Therefore, it is important to prevent the for-mation of satellite droplets, which can lead to a cross-contamination of two neighbor-ing spots in a microarray. Furthermore, the integration density of the spots should beanalyzed, which is also limited by the droplet volume and the spreading of the spots.A high spreading on a wetting surface could also cause a cross-contamination throughthe contact of spots with a small pitch. Consequently, the correct droplet size and spotplacement on the slide is essential for high quality microarray production. Therefore,the whole droplet dispensing process down to the droplet impact onto the substrate wasobserved as shown in Fig. 4.41. Different printing media and slide types were testedby using a mobile axis system as slide carrier.
4.2.4.1 SINGLE DROPLET IMPACTION ON A SOLID SURFACE The parameters used to characterize the impact process will be the droplet spreadingratio (D*=Dls/D), which is the ratio of the diameter of the liquid-solid interface to theinitial diameter of the impacting droplet, the Weber number and the Reyonolds num-ber.
The experiments were performed using buffer solution droplets with impact veloc-ities of ~1 m/s and a diameter from about 129 µm to 140 µm depending on the printingmedia. As can be seen in the experimental results (Fig. 4.42a, Fig. 4.43a) a 129 µm di-ameter water droplet with 1 m/s velocity, a Weber number of 1.8 and a Reynolds num-ber of 129 impinges on the surface without splashing of satellites. Because of the smalldroplet dimensions and the low kinetic energy (velocity) that is not sufficient for build-ing a new surface, no bursting of the droplets takes place. At these low impact veloci-ties, drop spreading is primarily driven by solid-liquid interaction. After reaching themaximum spreading ratio (which is close to the equilibrium spreading ratio), a small
Figure 4.41: The printing process from the nozzle of the printhead down to the microarray slide.
TOPSPOT: HIGHLY PARALLEL NANOLITER DISPENSING - OPERATING CONDITIONS AND DESIGN RULES - 113 -

DESIGN AND OPERATION RULES DISSERTATION REMIGIUS NIEKRAWIETZ
amount of retracting and spreading may be present, but it is too small to be detected bythe stroboscopic camera system used for this experiment (see Fig. 4.42a). Furthermore,the spreading rate is slowed down by viscous effects.
In the second sequence, the same qualitative phenomena occur, but the dynamicshape of the droplet is quite different. On a wetting surface there is a second stage ofslow spreading as the droplet moves towards its equilibrium configuration (see Fig.4.43a). The droplet leaves a very thin fluidic film on the impacted surface. Acomparison of computer generated images with the stroboscopic pictures shows, thatthe CFD model predicts the droplet shape during impact with good accuracy (Fig.4.42b, Fig. 4.43b). Quantitative comparisons of measured and calculated dropletspread diameters have also shown good agreement.
Table 4.2 shows the experimental results of measured droplet diameters D in flight, thespot diameters on the surface Dls and the corresponding spreading ratio D*. Differentdispensing buffer solutions with an impact velocity of ~1 m/s on various surfaces atroom temperature were analyzed. The spreading ratio was in the range of 1.18 on hy-drophobic surfaces (PicoSlides TM [M12]) and up to 2.11 with hydrophilic surfaces onuncoated glass slides (ROTH [M13]). Accordingly, an uncoated slide makes it impos-sible to achieve a spot pitch of 250 µm without cross-contamination.
Figure 4.42: Comparison of stroboscopic pictures (top) of the droplet impact on a solid surface with acontact angle of Θ =80° and the corresponding 3D simulation.
Figure 4.43: Comparison of stroboscopic pictures (top) of the droplet impact on a hydrophilic surfaceand the corresponding 3D simulation.
b)
a)
0 µs 100 µs 120 µs 140 µs 150 µs 170 µs 200 µs 250 µs
a)
b)
0 µs 100 µs 120 µs 140 µs 150 µs 170 µs 200 µs 250 µs
- 114 - TOPSPOT: HIGHLY PARALLEL NANOLITER DISPENSING - OPERATING CONDITIONS AND DESIGN RULES
DISSERTATION REMIGIUS NIEKRAWIETZ DESIGN AND OPERATION RULES
4.2.4.2 DROP ON DROP DISPENSING
The influence of the droplet impact on a liquid layer was analyzed by the drop on dropdispensing method. Fig. 4.45 illustrates, that at low impact energies (corresponding to1 m/s) the droplet merges with the liquid film of the spot without splashing. As expect-ed, the doubled droplet volume of the second dispensed droplet also increased thespreading on the surface (see Fig. 4.44). Compared to the droplet diameter in flight(130 µm) the spot diameter of a single dispensed droplet is increased up to 272 µm(109.23 %) after the impact on the surface. On the other hand, the spreading diameteronly increases up to 342 µm (25.74 %) during the drop on drop dispensing.
Comparing the simulations of the droplet impact with the experimental results likestroboscopic pictures, a good qualitative match has been obtained. Calculated dropletspreading agreed well with measurements. This success allows the application of twocomponent systems, for instance EDC-NHS systems [141]. One problem in microarrayproduction is that the EDC-NHS reaction starts immediately after the two reactionpartners are mixed. Over long lasting printing runs this leads to different reaction timesand immobilization efficiency on the slides. Another problem could be the agglomer-
Table 4.2: Experimental results of the droplet impact of different printing buffer solutions on varioussurfaces at room temperature. The spreading ratio gives information of the wetting behavior of the sur-faces [M14],[M15],[M16].
Liquid SlidesDroplet
diameter D [µm]
Spot diameter Dls
[µm]
Spreadingratio [D*]
Double spotdiameter Ddls
[µm]
Spotincrease
[%]
DMSO 50% v/v Array Link TM 140 232 1.66 258 11.21
DMSO 50% v/v PMMA 139 202 1.45 243 20.30
DMSO 20% v/v Array Link TM 134 226 1.68 251 11.06
DMSO 20% v/v PMMA 134 195 1.46 238 22.05
DMSO 10% v/v Array Link TM 127 177 1.39 223 25.99
DMSO 10% v/v PMMA 128 165 1.29 215 30.30
3xSSC Nonidet 0.005% Array Link TM 134 215 1.60 242 12.56
3xSSC Nonidet 0.005% PMMA 134 189 1.41 226 19.58
3xSSC Nonidet 0.005% CMT-GAPS 2 TM 134 209 1.56 244 16.75
3xSSC Nonidet 0.005% PicoSlides TM 133 157 1.18 203 29.30
Distilled water ROTH 130 272 2.09 342 25.74
Distilled water Array Link TM 131 207 1.58 277 33.82
Distilled water PMMA 131 170 1.29 220 29.41
TOPSPOT: HIGHLY PARALLEL NANOLITER DISPENSING - OPERATING CONDITIONS AND DESIGN RULES - 115 -
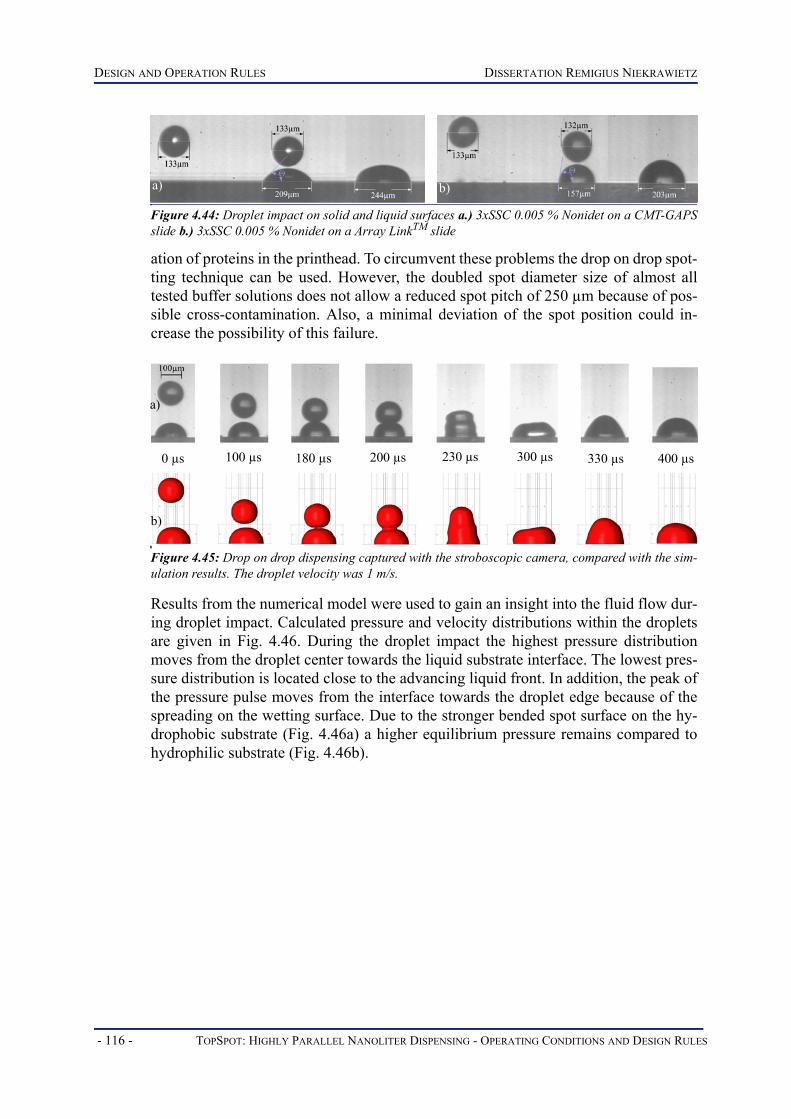
DESIGN AND OPERATION RULES DISSERTATION REMIGIUS NIEKRAWIETZ
ation of proteins in the printhead. To circumvent these problems the drop on drop spot-ting technique can be used. However, the doubled spot diameter size of almost alltested buffer solutions does not allow a reduced spot pitch of 250 µm because of pos-sible cross-contamination. Also, a minimal deviation of the spot position could in-crease the possibility of this failure.
Results from the numerical model were used to gain an insight into the fluid flow dur-ing droplet impact. Calculated pressure and velocity distributions within the dropletsare given in Fig. 4.46. During the droplet impact the highest pressure distributionmoves from the droplet center towards the liquid substrate interface. The lowest pres-sure distribution is located close to the advancing liquid front. In addition, the peak ofthe pressure pulse moves from the interface towards the droplet edge because of thespreading on the wetting surface. Due to the stronger bended spot surface on the hy-drophobic substrate (Fig. 4.46a) a higher equilibrium pressure remains compared tohydrophilic substrate (Fig. 4.46b).
Figure 4.44: Droplet impact on solid and liquid surfaces a.) 3xSSC 0.005 % Nonidet on a CMT-GAPSslide b.) 3xSSC 0.005 % Nonidet on a Array LinkTM slide
Figure 4.45: Drop on drop dispensing captured with the stroboscopic camera, compared with the sim-ulation results. The droplet velocity was 1 m/s.
a) b)
a)
b)
0 µs 100 µs 180 µs 200 µs 230 µs 300 µs 330 µs 400 µs
- 116 - TOPSPOT: HIGHLY PARALLEL NANOLITER DISPENSING - OPERATING CONDITIONS AND DESIGN RULES

DISSERTATION REMIGIUS NIEKRAWIETZ DESIGN AND OPERATION RULES
Figure 4.46: Calculated pressure distribution and velocity vectors of a 130 µm water droplet duringthe impact with a velocity of 1.0 m/s. a.) A droplet impact on solid surface with a contact angle ofΘ = 80° and less spreading behavior. b.) A droplet impact on hydrophilic surface with a high spread-ing (Θ = 30°). c.) Drop on drop dispensing with merging of the surfaces.
a) b) c)
TOPSPOT: HIGHLY PARALLEL NANOLITER DISPENSING - OPERATING CONDITIONS AND DESIGN RULES - 117 -

TECHNOLOGICAL DESIGN RULES FOR INTEGRATION DISSERTATION REMIGIUS NIEKRAWIETZ
TECHNOLOGICAL DESIGN RULES FOR INTEGRATION
This chapter describes the design iteration for the development of a highly integratedprinthead with 384 nozzles. It points out the technological design rules of such highlyintegrated printheads at a pitch of 500 µm. The main task was to find a general way toincrease the integration density of the nozzles in the TopSpot printhead. Based on thepreviously described designs (see chapter 1.2.3) different printhead types had to befabricated by suitable methods. Adding additional nozzles to the printhead is fairlyeasy due to the modular concept. The main problem is the fact, that each nozzle needsits own supply microchannel from a reservoir (see Fig. 5.1). The small space between
the individual nozzles limits the accessibility to connect them inside the nozzle arraywith the corresponding microchannels. In order to achieve a high integration density itis necessary to change the layout of some key parameters of the printhead, e.g. the di-ameter of the nozzle expansion, which potentially may have an impact on the correct
Figure 5.1: Overview of the standard three layer (Pyrex-Si-Pyrex) TopSpot printhead: a.) Cross-sec-tion of the printhead design. b.) Three-dimensional cross-section of the printhead: (1) nozzle diameter,(2) nozzle length, (3) nozzle expansion length, (4) nozzle expansion diameter, (5) catwalk widthbetween microchannels respectively between the microchannel and the nozzle expansion, (6) channelwidth. c.) Detailed view showing the height dimensions of the standard printhead.
a)
b) c)
- 118 - TOPSPOT: HIGHLY PARALLEL NANOLITER DISPENSING - OPERATING CONDITIONS AND DESIGN RULES

DISSERTATION REMIGIUS NIEKRAWIETZ TECHNOLOGICAL DESIGN RULES FOR INTEGRATION
operation of the printhead. Therefore, the influence parameters of the integration den-sity and the resulting impact factors for the dispensing process have to be analyzed. Ta-ble 5.1 shows the results of changed printhead design parameters and their impactfactors.
The established TopSpot printheads consistedof only one silicon layer, which contained the sup-ply microchannels for the nozzles (Fig. 5.1). Theintroduction of a multi-layer design with addition-al silicon levels for the microchannels allows toplace more channels between two nozzles. In thisway the integration density of the nozzles can beincreased with microchannels, which are not onlyplaced next to each other as in the single layer de-sign but also on top of each other in additional layers (see Fig. 5.2). The fabricationprocess steps of such multilayer silicon printheads are explained more precisely in thefollowing chapter.
Table 5.1: Design parameter and their impact factors on the higher integration density and the printperformance of the printhead.
Design parameter
Impact factor
Nozzle
[50-30µm]
Nozzle length
[150-25µm]
Nozzle expansion
[300-60µm]
Nozzle expansion
length [355-230µm]
Channel width
[50-10µm]
Catwalk width
[50-10µm]
Vent nozzle
[100-80µm]
Integration density of printhead nozzles
No No Yes No Yes Yes No
Minimum pressure pulse for droplet ejection
Yes Yes Yes Yes No No Yes
Dispensed droplet volume
Yes Yes Yes Yes No No No
Capillary filling of
the nozzleYes Yes Yes Yes Yes No No
Bond closeness
Cross-con-tamination
No No No No Yes Yes No
Stability of the
printheadYes Yes Yes Yes No Yes No
Cleaning of printhead Yes Yes Yes Yes Yes No Yes
∅∅ ∅
Figure 5.2: Schematic view of the sili-con multi layer design.
TOPSPOT: HIGHLY PARALLEL NANOLITER DISPENSING - OPERATING CONDITIONS AND DESIGN RULES - 119 -

TECHNOLOGICAL DESIGN RULES FOR INTEGRATION DISSERTATION REMIGIUS NIEKRAWIETZ
5.1 FABRICATION OF THE TOPSPOT PRINTHEADS
The TopSpot printheads consist of different layers depending on the chosen design.Hence, various bonding techniques are required. In general, these bonding processesoperate under two basic conditions. Firstly, the two bonding surfaces must be flattenedto ensure a proper contact for bonding. Secondly, accurate processing temperatures arerequired to initiate the bonding process. The silicon-to-silicon fusion bonding processtakes place at a bonding temperature of above 1000 °C. The conventional anodic bond-ing, on the other hand, is performed at a much lower temperature of about 300 °C–450 °C with the assistance of a high electrostatic field. Two different preliminary stud-ies were implemented to enable the realization of the 384 printhead design.
5.1.1 PRINTHEAD WITH PYREX-SI-PYREX DESIGN
For both designs the upper 2 mm thick pyrex layer forms the reservoirs and the actua-tion chamber. Afterwards the pyrex is fixed by anodic bonding on top of the siliconlayer. The first printhead design consists of one silicon layer sandwiched between twopyrex layers (see Fig. 5.1). The main microfluidic structures in the silicon layer are re-alized using Deep Reactive Ion Etching (DRIE). Four etching steps are necessary toimplement all microfluidic parts into the silicon. A combination of a silicon-oxide anda photoresist masking layer is used. At the bottom of the silicon layer another 150 µmthick pyrex layer is fixed in order to close the capillary channels. All pyrex layers werestructured by ultrasonic drilling. Finally, the bonded wafers were diced by a wafer sawto obtain the single printheads.
In the first Pyrex-Si-Pyrex layout all design parameters (see table 5.1) were variedin six different printheads. The former external vent nozzle of the piston was relocatedinto the actuation chamber of the printhead (see chapter 2.4.7). Furthermore, the ventnozzle was integrated into the fabrication process of the silicon layers. In this way pro-duction tolerances of the formerly drilled vent nozzle in the piston and production costswere reduced. Fig. 5.3 exemplarily shows one of the six manufactured printheads withvariations in the nozzle and nozzle expansion diameters. For all six printheads one sil-icon layer design was used. Vias are a must for this particular design. The vias connectmicrochannels on the bottom of the silicon layer with the inlet channels on the top side(see Fig. 5.1). Design optimization of these via structures were described in the thesisof C.P. Steinert [43]. The via type called V5 showed the best filling behavior, the high-est successful self-filling rate and the lowest CV. Hence, the via type V5 was used forthis printhead design. However, there is a potential risk of a capillary stop during thefilling of the printhead due to the via structure. The filling direction is rotated at 90° bythe via and the prior closed capillary channel is converted to an open channel, whichleads to a reduction of the capillary pressure (see chapter 2.4.3).
- 120 - TOPSPOT: HIGHLY PARALLEL NANOLITER DISPENSING - OPERATING CONDITIONS AND DESIGN RULES

DISSERTATION REMIGIUS NIEKRAWIETZ TECHNOLOGICAL DESIGN RULES FOR INTEGRATION
5.1.1.1 CATWALK WIDTH OF ANODIC BONDED PRINTHEADS
A prime interest of microarray production is to eliminate any possibility of samplecross-contamination. Due to the highly parallel printhead approach extensive cross-talk tests were performed to prove the total isolation of all supply channels, nozzles anddispensed droplets. For evaluation of the reduced catwalk width between the micro-channels every second reservoir was filled with 15 µM fluorescence marker (DyomicsDY-550 solved in 3M betaine 3 x SSC solution [M17], [M18]) and the other reservoirswith pure printing buffer (see Fig. 5.4). The arrays were printed onto microarray slidesand detected via the fluorescence reader. Without cross-talk between the 24 nozzles ofthe printhead they should look like a checker board. The extensive evaluation of thereduced catwalk width (50-10 µm) between the microchannels showed the total isola-tion of the different microchannels, nozzles and dispensed droplets without any cross-talk even after thousands of printed arrays. Consequently, printheads (Pyrex-Si-Pyrex)can be manufactured with a catwalk width of 10 µm without the risk of cross-contam-ination.
Figure 5.3: One silicon layer printhead design: a.) Detail view of the actuation chamber with 24 dif-ferent nozzle geometries. b.) Top view of the printhead with 24 reservoirs and the actuation chamber(10 mm diameter) in the upper pyrex layer. c.) Bottom view of the printhead with a 150 µm thick pyrexlayer, which seals the microchannels.
Figure 5.4: Cross-contamination tests for reduced catwalk widths from 50 µm to 10 µm: a.) Schematicview of a checker board filled printhead b.) Detailed view of the actuation chamber, every second res-ervoir was filled with 15 µM fluorescence marker (Dyomics DY-550) solved in 3M betaine 3 x SSCsolution. c.) The rest of the nozzles were filled with pure printing buffer d.) Fluorescence image showsno detectable cross-talk to neighboring nozzles even after thousands of printed arrays.
a) b) c)
a)
b) c) d)
TOPSPOT: HIGHLY PARALLEL NANOLITER DISPENSING - OPERATING CONDITIONS AND DESIGN RULES - 121 -

TECHNOLOGICAL DESIGN RULES FOR INTEGRATION DISSERTATION REMIGIUS NIEKRAWIETZ
5.1.1.2 MICROCHANNEL WIDTH
The reduction of the microchannel width enables the integration of more channels be-tween nozzles. Therefore, the density of the nozzle array can be increased. Neverthe-less, the capillary filling is also influenced by using a smaller microchannel. It leads toa higher capillary pressure but also to a rise of the fluidic resistance, hence to a slowercapillary filling (see chapter 2.4). The calculated filling time from the reservoir to thenozzle is in the range of 1 sec, which is fast enough for this application. The experi-mental result for the filling of different capillary channel widths is shown in Fig. 5.5.At a microchannel width smaller than 20 µm the capillary self filling was not possible.The liquid transport stopped in the microchannel and the printhead was not filled prop-erly. Only with an additional pressure pulse on the reservoirs the nozzles could befilled. The capillary filling problems could also be a result of minor changes in the sur-face roughness, which could lead to a capillary stop in these small microchannels. Thismeans, that the microchannels should be as wide as possible (> 20 µm). In addition, awider microchannel simplifies the cleaning after the usage.
5.1.1.3 ETCH RATE DEPENDING ON ETCHABLE AREA
For the fabrication process of the TopSpot printheads the silicon wafer has to be etchedthrough at three positions as depicted in Fig. 5.1. The first position is at the reservoirs,the second at the vias and the third at the nozzles. Ideally, through etching takes placesimultaneously at all three positions. However, the etching rate depends on the size ofthe local mask opening area. Fig. 5.6a visualizes the influence of the etching rate onthe width of the local mask opening area. A grinding surface pattern of the processedsilicon layer shows the different etch depths of the 50 µm wide inlet channel and the300 µm wide nozzle expansion (see Fig. 5.6b). This effect arises due to the thinner mi-crochannel width (see Fig. 5.6c-d). A 30 µm microchannel width and a nozzle expan-sion with a diameter of 300 µm have after an etching step of 275 µm a depth differenceof 11.6 µm. The inclination of the microchannel is no problem for the filling behaviorof the printheads. But the dependency of the etching rate on the etching area and theneed of through etching of three different sized geometries results in the fact, that atsome positions it is etched longer than necessary. Consequently, an overetching alsocalled notching can be observed.
Figure 5.5: Influence of microchannel width on the capillary filling. At the microchannel width of20 µm (indicated by red line) the capillary filling of the nozzles gets difficult and stops.
- 122 - TOPSPOT: HIGHLY PARALLEL NANOLITER DISPENSING - OPERATING CONDITIONS AND DESIGN RULES

DISSERTATION REMIGIUS NIEKRAWIETZ TECHNOLOGICAL DESIGN RULES FOR INTEGRATION
5.1.1.4 NOTCHING EFFECT
Notching is a lateral etching at the silicon-oxid interface, that occurs during overetch-ing. It is caused by charging effects of the directional ions (positive) at the etch stoplayer. The charging of the silicon-oxid surface results in a deflection of the followingions as can be seen in Fig. 5.7a. The geometric effects of notching depend on whethera smaller geometry meets a larger one or vice versa. Etching of larger geometries ontosmaller ones results in spikes around the contact line between both structures (see Fig.5.7a, top). Bulges are created when a smaller geometry is etched onto a larger one (Fig.5.7a, bottom and Fig. 5.7b-c). Depending on the duration of the overetching and thedirection of liquid flow, both effects can lead to a liquid stop during capillary filling.For the processing of the printhead nozzles the second procedure is used. In order tominimize notching, it is important to optimize the etch depth uniformity. Consequent-ly, the geometries of all three positions should be adapted in such a way that the mo-ment of through etching is as simultaneously as possible. This allows to keep the overetch time to a minimum. Another possibility is to reduce the geometries, which haveto be etched through the silicon wafer to a single structure. Furthermore, the diagram
Figure 5.6: Dependence of the etch depth on etching area: a.) Etch depth for different local maskopening areas at constant etching time [142]. b.) Grinding surface pattern of the nozzle expansion,nozzle and inlet channel [143]. A difference of ~ 8 µm etch depth is visible between the 300 µm widedisplacement chamber and the 50 µm wide inlet channel. c.) A reduction of the inlet channel to 30 µmshows a difference of 11.6 µm. d.) Detail view of the etch depth in the nozzle.
a)
c) d)
b)
TOPSPOT: HIGHLY PARALLEL NANOLITER DISPENSING - OPERATING CONDITIONS AND DESIGN RULES - 123 -

TECHNOLOGICAL DESIGN RULES FOR INTEGRATION DISSERTATION REMIGIUS NIEKRAWIETZ
of the etch depth in Fig. 5.6a shows a significant decrease of the etching rate, if themask opening falls below 20 µm. This means, that the widening of the vias, nozzlesand microchannels should not be smaller than 20 µm to achieve fast etching rates.
5.1.1.5 NOZZLE LENGTH VERSUS MECHANICAL STABILITY
The nozzle length can be changed by the etching time but the nozzle size is fixed bythe etch mask. A reduction of the nozzle length leads to a decrease of the flow resis-tance of the nozzle. This enables the reduction of the critical pressure for the dropletejection process (see chapter 4.2.3.3). To dispense fluids with a high viscosity theprinthead nozzle should be as short as possible. However, this is subjected to mechan-ical stability restrictions. At a nozzle length of 25 µm the nozzle expansion bottombursts along the crystal orientation of the silicon wafer (see Fig. 5.8). This did not occurduring the printing process but in the following ultrasonic cleaning procedure of theprinthead. The ultrasonic energy coupled into the silicon printhead led to the destruc-tion of the 24 channel printhead if the nozzle length was equal or smaller than 25 µm.A nozzle length of 50 µm showed no mechanical stability problems.
Figure 5.7: Notching formation during DRIE: a.) If a larger structure is etched onto a smaller one(top) and vice versa (bottom). (1) During DRIE F+ ions are reacting with silicon to gaseous SiF4.(2) At the ideal etching time, etching stops at the oxide etch stop layer. Due to the bombardment withF+ ions the oxide layer is charged positively. (3) As a result of overetching, the same charge forces asidewise deflection of F+ ions. (4) This way spikes and bulges are created respectively. b.) SEM pictureof over etched nozzles (bulges) in the actuation chamber c.) Detailed view of the bottom of the nozzleexpansion. The bulges created by notching are clearly visible [144].
a)
b) c)
- 124 - TOPSPOT: HIGHLY PARALLEL NANOLITER DISPENSING - OPERATING CONDITIONS AND DESIGN RULES

DISSERTATION REMIGIUS NIEKRAWIETZ TECHNOLOGICAL DESIGN RULES FOR INTEGRATION
5.1.2 PRINTHEAD WITH PXREX-SI-SI DESIGN
The second studied design consists of two fusion bonded silicon layers and one 2 mmthick pyrex layer. Regarding the 384 printhead design, which will be implemented ina 24 x 16 or 32 x 12 array, the corresponding nozzle expansion, microchannel widthand catwalk width were chosen so that a 500 µm pitch between the nozzles was real-ized. In order to achieve, a good print performance the nozzle length was reduced tocompensate the higher fluidic resistance of the smaller nozzle expansion (see results ofchapter 4.2.3.3). For the second design the following parameters were used:
• Nozzle expansion diameter (Dnz,ex) : = 150 µm• Nozzle diameter (Dnz) : = 50 µm• Nozzle length (lnz) : = 50 µm• Channel width (wch) : = 24 µm• Vent nozzle diameter (Dvent) : = 80 µm• Nozzle pitch (Pnz) : = 500 µm
The selected microchannel width of 24 µm ensureda reliable capillary filling from the reservoir to thenozzles (see chapter 5.1.1.2). Because of thechanged assembling process using fusion bondingthe closeness of the silicon layers and the minimumcatwalk width had to be investigated again to elimi-nate the possibility of cross-contamination betweenthe microchannels.In the design of a 384 printhead with the liquidtransport in one silicon layer a maximum of eightmicrochannels have to pass between two nozzle ex-pansions in the worst case (see Fig. 5.9). To analyzethe high integration density of the nozzles in a pre-liminary development a 48 printhead was producedusing this second design. The printhead consists of24 reservoirs and 48 nozzles with a nozzle pitch Pnz of 500 µm. Each reservoir fills twonozzles in the actuation chamber, which results in two identical shifted 24 arrays. The
Figure 5.8: Influence of the nozzle length on the stability of the printhead: a.) Front side of the print-head with a nozzle length of 15 µm before the cleaning step. b.) Back side of the printhead with dam-aged nozzles (length 15 µm) after one cleaning procedure. c.) Back side of the printhead with damagednozzles (length 25 µm) after 10 cleaning procedures.
a) b) c)
Figure 5.9: Schematic view of theconnection of the nozzles by micro-channel.
TOPSPOT: HIGHLY PARALLEL NANOLITER DISPENSING - OPERATING CONDITIONS AND DESIGN RULES - 125 -

TECHNOLOGICAL DESIGN RULES FOR INTEGRATION DISSERTATION REMIGIUS NIEKRAWIETZ
maximum number of microchannels Nch, which can pass between two nozzles per sil-icon layer lySi (see Fig. 5.9) with a channel width wch and a catwalk width wcat, can becalculated by the following equation:
Experiences with the first standard TopSpot printhead design (see Fig. 5.1) showed,that polluting particles (dust, fusels, fibers, etc.) are preferably stuck in sharp cornersof the microchannels. Therefore, all microchannels were created as smooth as possiblein this design. For the 48 printhead two concepts were implemented:
1. Concept: All microchannels are located in the lower silicon layer. The uppersilicon layer consists only of via structures from the reservoirs and the nozzleexpansions. The requirement of the upper silicon layer is to seal the openmicrochannels in the lower silicon part and to prevent a capillary stop at theactuation chamber. The lower part has only one nozzle structure, which hasto be etched through the silicon wafer and so no notching takes place. Themicrochannels from the reservoir to the nozzle are completely sealed, whichenables the placement of additional channels between the nozzle expansions.Using open channels in the actuation chamber with the same pitch of37.4 µm could result in cross-contamination. To simulate the same channeldensity like in the 384 design the microchannels were led several times bet-ween the nozzle expansions. Up to nine times, which is equivalent to a13.4 µm catwalk width (see Fig. 5.10).
(5.1)
Figure 5.10: 48 printhead with liquid transport in one silicon layer: Each reservoir is connected withtwo nozzles in the actuation chamber. The microchannels were led several times between the nozzleexpansions to simulate the same density as in a 384 printhead. This is equivalent to a 13.4 µm catwalkwidth.
NchPnz Dnz,ex wcat––
wch wcat+---------------------------------------⎝ ⎠
⎛ ⎞ lySi⋅=
- 126 - TOPSPOT: HIGHLY PARALLEL NANOLITER DISPENSING - OPERATING CONDITIONS AND DESIGN RULES

DISSERTATION REMIGIUS NIEKRAWIETZ TECHNOLOGICAL DESIGN RULES FOR INTEGRATION
2. Concept: The microchannels were distributed on two silicon layers. Half ofthe microchannels were led completely covered in the lower layer, the restwere connected by vias, which are located in the actuation chamber, withthe upper silicon layer. The microchannels behind the vias are open chan-nels like in the first design (see Fig. 5.12). The multi layer concept allowedto lead the microchannels on top of each other by using only two siliconwafers (see Fig. 5.11). Regarding the 384 printhead design, the critical con-striction between the nozzle expansions has to be used only by half of themicrochannels. The rest is relocated in the upper silicon wafer. An additio-nal silicon layer as displayed in Fig. 5.2 can be used to seal the open micro-channels to obtain a design, which consists of closed microchannels only.
Figure 5.11: 48 printhead with liquid transport in two silicon layers: The yellow circle in the middle ofthe printhead indicates the positions of the vias. The open microchannels (red) after the vias are ledconsciously above the covered channels to ensure, that no cross-contamination occurs. a-b) Detailedview in the actuation chamber of the two concepts of the 48 printhead design.
a) b)
TOPSPOT: HIGHLY PARALLEL NANOLITER DISPENSING - OPERATING CONDITIONS AND DESIGN RULES - 127 -

TECHNOLOGICAL DESIGN RULES FOR INTEGRATION DISSERTATION REMIGIUS NIEKRAWIETZ
Figure 5.12: Schematic view of the TopSpot printhead fabrication process (3 layer Pyrex-Si-Si): on theleft side without via from the microchannel to the nozzle, on the right side with a via: a.) Top siliconwafer (300 µm) structured by two DRIE steps b.) Bottom silicon wafer (300 µm) structured by threeDRIE steps. c.) Both wafer were bonded by silicon direct bonding d.) In the last step the pyrex wafer(2 mm) was attached by anodic bonding to the top silicon wafer.
a)
b)
c)
d)
- 128 - TOPSPOT: HIGHLY PARALLEL NANOLITER DISPENSING - OPERATING CONDITIONS AND DESIGN RULES

DISSERTATION REMIGIUS NIEKRAWIETZ TECHNOLOGICAL DESIGN RULES FOR INTEGRATION
Fig. 5.13 shows the two manufactured printheads of the Pxrex-Si-Si-Layer design. Tovisualize the assembling of the two concepts a cross-section of the printheads is seenin Fig. 5.14. To reduce the nozzle length independently of the microchannel height aseparate etching step was integrated in the printhead fabrication process (see Fig.
5.12b) in both concepts. Consequently, the optimized nozzle length, which is neededfor an efficient droplet ejection process can be used (see chapter 4.2.3.3). Without thedecoupling of the nozzle length and the microchannel height the remaining siliconthickness under the microchannel would have the same height as the nozzle length(50 µm), which would lead to a reduced mechanical stability of the silicon printheadlayer. However, the additional etch step, which can also be seen in the multi layer con-cept (see Fig. 5.2), causes a capillary stop at the nozzle expansion (see Fig. 5.14).
Figure 5.13: Two silicon layer printhead design: a.) Detailed view of 48 nozzles located in the actua-tion chamber (10 mm diameter). The microchannels from the reservoirs to the nozzles are sealed.b.) Detailed view of the actuation chamber, which contains 24 closed and 24 open microchannels.c.) Top view of the printhead with 24 reservoirs and 48 nozzles in the actuation chamber. Every reser-voir delivers two nozzles in the actuation chamber. d.) Bottom view of the printhead with a 300 µmthick silicon layer.
a)
b)
c) d)
TOPSPOT: HIGHLY PARALLEL NANOLITER DISPENSING - OPERATING CONDITIONS AND DESIGN RULES - 129 -

TECHNOLOGICAL DESIGN RULES FOR INTEGRATION DISSERTATION REMIGIUS NIEKRAWIETZ
5.1.2.1 PASSIVE CAPILLARY FILLING STRUCTURE To ensure a stable first priming, a passive capillary filling structure was designed toovercome the process-related fluidic barrier. The previous simulations indicated a suc-cessful filling before the real experiments took place (see chapter 4.2.1.2). For furtherconsolidated findings three passive filling structures were analyzed in extensive exper-iments. The passive filling structures split the microchannel in two separate inflows.Both inflows are located in the border area of the nozzle expansion and have differentdimensions in the widths and lengths, depending on the used design (see Fig. 5.15).Each of the three filling structures was integrated into both printhead concepts. Thesecond concept type with the 24 sealed and open microchannels was characterized forthe filling performance. Two equal printhead types, each one taken from another wafer,were used for the evaluation. The experimental procedure included 5 fillings of eachprinthead, which resulted in 240 fillings of each type of structure. A 30 % v/v glycerol/water solution was used as sample for the filling characterization. When capillarypriming stopped in microchannels before arriving in the passive filling structure, thefilling was not counted as a failure of this additional structure. The percentage of suc-cessful fillings of all six passive filling structures in the TopSpot printhead were cal-culated for each one. The calculated mean values and CVs are shown in Fig. 5.16. Theexperimental results indicated, that the open passive structure 2 C showed the worstself-filling rate of 87 % (CV: 5 %). Structure type 1 B demonstrated the best filling be-havior with the highest successful self-filling rate of 99 % and the lowest CV (1 %).As a result, the passive sealed structure 1 B was used for the final 384 TopSpot print-head design.
Figure 5.14: Cross-section of the silicon fusion bonded printhead design: Left side (Detail 2) closedmicrochannel without via structure. Right side (Detail 3) open microchannel after the via. The red cir-cles in the pictures indicate the capillary stop, which has to be overcome by the liquid.
- 130 - TOPSPOT: HIGHLY PARALLEL NANOLITER DISPENSING - OPERATING CONDITIONS AND DESIGN RULES

DISSERTATION REMIGIUS NIEKRAWIETZ TECHNOLOGICAL DESIGN RULES FOR INTEGRATION
5.1.2.2 CATWALK WIDTH OF SILICON FUSION BONDED PRINTHEADS
To ensure the total isolation of all supply channels, nozzles and dispensed droplets ofa silicon fusion bonded printhead, the cross-talk experiments were repeated. As men-tioned before the first design of the 48 nozzle printhead consists of nine channels be-tween the nozzle expansion, which results in a catwalk width of only 13.4 µm. Everysecond reservoir of the printhead was filled with 15 µM fluorescence marker (DyomicsDY-550 [M17] solved in 3M betaine 3 x SSC solution) and the other 12 reservoirs werefilled with pure printing buffer solution. The experimental results of the cross-contam-inations test (see Fig. 5.17), detected by the fluorescence reader, showed a checker-board-like filled printhead pattern. In conclusion the experiments not only ensured a
Figure 5.15: Passive capillary filling structure to prevent a capillary stop: a.) Perspective cross-sec-tion of the filling structure of the microchannel and nozzle. The special filling structure consists of agap, which divides the microchannel into two separate inflows, located in the border area of the nozzleexpansion. b.) Top view of three different variations 2A-2C. The three other passive filling structures1A-1C are identical to 2A-2C but they are sealed by an additional silicon wafer (see Fig. 5.14).
Figure 5.16: Filling rates of all six passive capillary filling structures. Six printheads containing allpassive filling structures were taken from two different wafers. The filling rate of each sealed and openmicrochannel structure type was measured and corresponding mean values and CVs are displayed.
a) b)
2A
2B
2C
Separate inflow
Microchannel
Nozzle
TOPSPOT: HIGHLY PARALLEL NANOLITER DISPENSING - OPERATING CONDITIONS AND DESIGN RULES - 131 -

TECHNOLOGICAL DESIGN RULES FOR INTEGRATION DISSERTATION REMIGIUS NIEKRAWIETZ
cross-talk free printing of silicon fusion bonded printheads with a catwalk width downto 13.4 µm but also enabled the manufacturing of a completely sealed highly integrated384 nozzle printhead in a three layer design.
Figure 5.17: Cross-contamination tests of a silicon fusion bonded printhead with a catwalk widthdown to 13.4 µm. a.) Every second reservoir of the 48 printhead was filled with a fluorescence markerand the remaining reservoirs with pure buffer solution. b.) The evaluated pictures of the fluorescencereader show no cross-contamination. c.) Afterwards the printheads were washed, refilled with aninversed checkerboard filling and printed again. The quantification of the 8x6 arrays shows, that onlythe spots with fluorescence marker are visible. That means, that neither cross-talk between nozzles norcarry-over occurs.
a) b) c)
- 132 - TOPSPOT: HIGHLY PARALLEL NANOLITER DISPENSING - OPERATING CONDITIONS AND DESIGN RULES

DISSERTATION REMIGIUS NIEKRAWIETZ OPTIMIZED DESIGN OF A 384 NOZZLE PRINTHEAD
OPTIMIZED DESIGN OF A 384 NOZZLE PRINTHEAD
The purpose of this chapter is to present an optimized 384 three layer printhead designbased on the results and experiences gained from the preceding chapters. The main fo-cus is the layout and characterization of the 384 printhead. In comparison to the stan-dard printhead design, the considerable advantages and the exceeding potential of thisnew printhead design will be shown.
6.1 RESERVOIR ARRANGEMENT OF THE 384 PRINTHEAD
The priming of the TopSpot printhead performs a reformatting process. Samples fromreservoirs of well plates are transferred into the 384 reservoirs of the printhead. Thearrangement and the pitch of the samples is 4.5 mm for a 96 [12 x 8] and 384 [24 x 16]plate or 2.25 mm for a 1536 [48 x 32] plate. Therefore, the reservoir arrangement ofthe printhead should be designed to be filled by conventional disposable tips of a 384dispenser with several microliters of sample. Automated filling is a key feature espe-cially for the use of 384 nozzle printheads for two reasons: Firstly, the manual fillingof 384 different probes into the reservoirs is time-consuming and could lead to evapo-ration effects. The first filled nozzles would evaporate even before the last nozzlescould get filled. Secondly, the manual pipetting could lead to a failure in the array lay-out by accidental false pipetting in wells at 2.25 mm spacing. By manual filling a fulltraceability of samples from the well plate to the microarray layout can not be ensured.Both issues are not acceptable for the fast production of high quality microarrays.
Two layouts for one silicon layer consisting of supply microchannels have beenconsidered: a 24 x 16 or 32 x 12 reservoir arrangement with a pitch of 2.25 mm. Theslide specifications are the standard slide dimensions of 75 x 25 x 1 mm with an usablesurface area of about 58 x 21 mm for the unique bar code and the elimination of fringeeffects. Both layout concepts fulfill the requirements. But the 500 µm pitch of the noz-zles in the actuation chamber results in a small space for the supply microchannels ofthe reservoirs (see chapter 5). The 24 x 16 layout with a microchannel width of 24 µmand a nozzle expansion of 150 µm results in a catwalk width of only 22.75 µm. How-ever, the 32 x 12 layout enables a catwalk width of 38.33 µm providing a higher safetymargin for the silicon-to-silicon fusion bonding process. Hence, the 32 x 12 layout wasproduced (see Fig. 6.1).
TOPSPOT: HIGHLY PARALLEL NANOLITER DISPENSING - OPERATING CONDITIONS AND DESIGN RULES - 133 -

OPTIMIZED DESIGN OF A 384 NOZZLE PRINTHEAD DISSERTATION REMIGIUS NIEKRAWIETZ
Figure 6.1: 384 printhead layout: Each reservoir is connected via a microchannel (blue) with its cor-responding nozzle. The printhead has an axis-symmetric assembling. In the middle of the print windowthe 24 µm width microchannels have a pitch of 62 µm.
- 134 - TOPSPOT: HIGHLY PARALLEL NANOLITER DISPENSING - OPERATING CONDITIONS AND DESIGN RULES
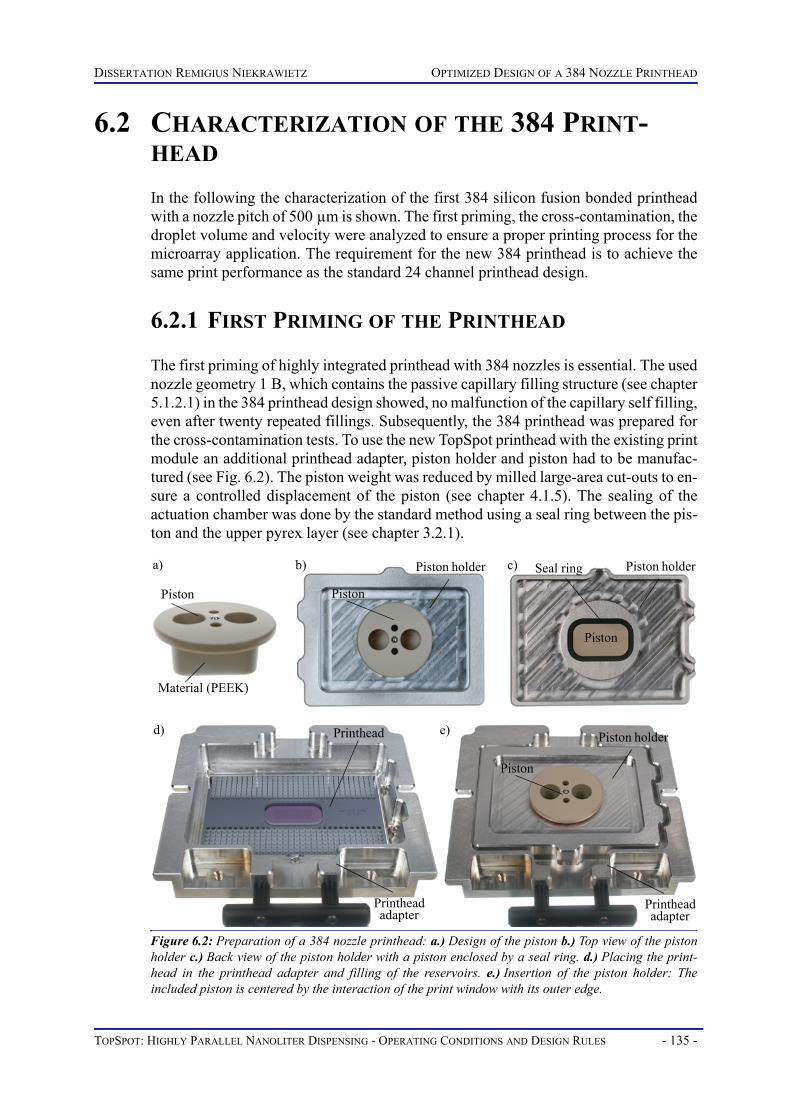
DISSERTATION REMIGIUS NIEKRAWIETZ OPTIMIZED DESIGN OF A 384 NOZZLE PRINTHEAD
6.2 CHARACTERIZATION OF THE 384 PRINT-HEAD
In the following the characterization of the first 384 silicon fusion bonded printheadwith a nozzle pitch of 500 µm is shown. The first priming, the cross-contamination, thedroplet volume and velocity were analyzed to ensure a proper printing process for themicroarray application. The requirement for the new 384 printhead is to achieve thesame print performance as the standard 24 channel printhead design.
6.2.1 FIRST PRIMING OF THE PRINTHEAD
The first priming of highly integrated printhead with 384 nozzles is essential. The usednozzle geometry 1 B, which contains the passive capillary filling structure (see chapter5.1.2.1) in the 384 printhead design showed, no malfunction of the capillary self filling,even after twenty repeated fillings. Subsequently, the 384 printhead was prepared forthe cross-contamination tests. To use the new TopSpot printhead with the existing printmodule an additional printhead adapter, piston holder and piston had to be manufac-tured (see Fig. 6.2). The piston weight was reduced by milled large-area cut-outs to en-sure a controlled displacement of the piston (see chapter 4.1.5). The sealing of theactuation chamber was done by the standard method using a seal ring between the pis-ton and the upper pyrex layer (see chapter 3.2.1).
Figure 6.2: Preparation of a 384 nozzle printhead: a.) Design of the piston b.) Top view of the pistonholder c.) Back view of the piston holder with a piston enclosed by a seal ring. d.) Placing the print-head in the printhead adapter and filling of the reservoirs. e.) Insertion of the piston holder: Theincluded piston is centered by the interaction of the print window with its outer edge.
d) e)Printhead
Printheadadapter
Piston holder
Piston
a) b) c)
Piston
Piston holder
Piston
Seal ring
Piston
Piston holder
Printheadadapter
Material (PEEK)
TOPSPOT: HIGHLY PARALLEL NANOLITER DISPENSING - OPERATING CONDITIONS AND DESIGN RULES - 135 -

OPTIMIZED DESIGN OF A 384 NOZZLE PRINTHEAD DISSERTATION REMIGIUS NIEKRAWIETZ
6.2.2 CROSS-CONTAMINATION
The absence of cross-contamination between the dispensed droplets onto the microar-ray slides could be ensured by analyzing the printed arrays via the fluorescence readeras described in chapter 5.1.1.1. The microarray looked like a checkerboard, which con-firmed, that no cross-talk between the 384 spots took place and in consequent no cross-talk between nozzles, channels and reservoirs (see Fig. 6.3). Afterwards the cleanedprinthead was inversely filled, printed and the arrays were analyzed again. The exper-iments not only showed again a cross-talk free use of the printhead, but also that a re-use of the printhead after a suited cleaning procedure without detectable cross-contam-ination was possible (see Fig. 6.4). Overcoming this initial step was essential for theintroduction of the highly parallel 384 nozzle printhead to the microarray production.
6.2.3 ARRAY HOMOGENEITY
Due to the numerous nozzles of the printhead, highly reproducible droplet ejections arerequired to ensure a homogeneous microarray. Tiny particles or an inhomogeneous hy-drophobic coating of the nozzle plate increase the chance of an unreproducible droplet
Figure 6.3: Cross-contamination test of the 384er nozzle printhead: The evaluated microarrays with0.4 M betaine 3xSSC +Cy5 and pure buffer solution showed no cross-talk between the spots.
Figure 6.4: Inversely filled cross-contamination test of the 384er nozzle printhead: Even after thecleaning and inversed filling, printing and analyzing of the arrays no cross-talk could be observed.
- 136 - TOPSPOT: HIGHLY PARALLEL NANOLITER DISPENSING - OPERATING CONDITIONS AND DESIGN RULES

DISSERTATION REMIGIUS NIEKRAWIETZ OPTIMIZED DESIGN OF A 384 NOZZLE PRINTHEAD
ejection, especially compared to the smaller 24 nozzles printhead. Hence, the cleaningprocedure and the coating of the printhead are the main critical processes for the mi-croarray printing and demand a high accuracy. The wide dimensions of the 32 x 12nozzle array further avoided the verification of the microarray by online monitoring(see chapter 3.1.2.2) immediately after the spotting. The microarray was analyzed sep-arately under the microscope with a bigger lens coverage (see Fig. 6.5). However, thefast inhomogeneous evaporation of the nanoliter spots caused a 8.5 % CV of the spotdiameter. For elimination of this effect the fluorochrome signal intensity of the spotswas analyzed by the fluorescence reader (see Fig. 6.6). This led to an improvement ofthe measured array homogeneity to be better than 2.8 % depending on the used printingbuffer.
6.2.4 DROPLET VOLUME
The droplet volume of water was analyzed during the flight by NeuroCheck® as ex-plained in chapter 3.1.1.1. CVs of droplet diameters lower than 1% within one singledispensing nozzle were measured. The calculated droplet volume of 825 pl showed
Figure 6.5: Single shot of a microarray consisting of 384 spots analyzed under a microscope: Theinhomogeneous evaporation of the printing solution (0.4 M betaine 3xSSC) results in a relatively highCV of 8.5 %.
Figure 6.6: Single shot of a microarray consisting of 384 spots evaluated by the fluorescence reader:The printing solution, which consisted of 15 µM fluorescence marker (Dyomics DY-550) solved in0.4 M betaine 3 x SSC showed a homogenous result with a CV of 2.8 %.
TOPSPOT: HIGHLY PARALLEL NANOLITER DISPENSING - OPERATING CONDITIONS AND DESIGN RULES - 137 -

OPTIMIZED DESIGN OF A 384 NOZZLE PRINTHEAD DISSERTATION REMIGIUS NIEKRAWIETZ
nearly the same results as for the 24 nozzle printhead (see Figure 6.7). The essentialgeometry parameters of the nozzle, that had to be changed in order to realize the 384printhead were chosen such that no negative impact on the dispensing performancewas observed. For example, the higher fluidic resistance of the reduced nozzle expan-sion from 300 to 150 µm were compensated by a reduced nozzle length from 150 to75 µm so that the pressure pulse needed for a single droplet ejection stayed nearly con-stant (see chapter 4.2.3).
6.2.5 DROPLET VELOCITY
The stroboscopic picture sequence allowed the measurement of the droplet velocitiesof water after a flight distance of 600 µm as explained in chapter 3.1.1.2. The calculat-ed value of 0.67 m/s is consistent with the data of the 24 channel printhead. The homo-geneous droplet tear-off of all 384 nozzles as seen in Fig. 6.7 demonstrated the sameprint performance. Due to the wide dimensions of the nozzle area, the picture of thedroplet ejection process had to be assembled from many detail screens, which againshowed the high reproducibility of the print process.
Figure 6.7: Stroboscopic picture sequence of a droplet ejection process for the calculation of the drop-let volume and velocity of the 384 printhead: a.) The 384 nozzles filled with water showed a homoge-neous droplet tear-off (@600 µs). b.) Detailed view of three nozzles during the dispensing process.Only the first row of the 32 x 12 array is visible, the eleven droplets in the back are out of focus.c.) Analyzing the recorded stroboscopic camera pictures with a delay time of 500 µs showed a dropletvelocity of 0.67 m/s and a corresponding droplet volume of 825 pl.
vd left( )500μm
221 Pixel----------------------- 149 Pixel
500μs-----------------------⋅ 0.67m s⁄= =
vd middle( )500μm
221 Pixel----------------------- 151 Pixel
500μs-----------------------⋅ 0.68m s⁄= =
vd right( )500μm
221 Pixel----------------------- 149 Pixel
500μs-----------------------⋅ 0.67m s⁄= =
a)
b)
c)
- 138 - TOPSPOT: HIGHLY PARALLEL NANOLITER DISPENSING - OPERATING CONDITIONS AND DESIGN RULES

DISSERTATION REMIGIUS NIEKRAWIETZ CONCLUSION AND COMPARISON TO STANDARD PRINTHEAD DESIGN
CONCLUSION AND COMPARISON TO STANDARD PRINTHEAD DESIGN
One subject of this thesis was the development and characterization of highly integrat-ed printheads for the fabrication of microarrays by the TopSpot method. The challengefor high-quality microarrays is a reproducible microarray printing process, which re-quires an adjusted pressure pulse for printing media and an optimized nozzle geometryof the printhead. The innovation compared to other commercially available non-con-tact dispensers is the higher number of analytes (384), that can be printed in parallel.This enables the mass fabrication of microarrays printed in parallel with a grid densityof 500 µm.
To achieve an improved microarray quality and to provide a fundamental under-standing of the droplet ejection process an integrated process control was developedfor the dispenser. A pressure sensor was integrated into the piston to acquire online themost important parameter of the pneumatically actuated dispenser: the transient pres-sure pulse of the droplet ejection process. The pressure pulse signal allows the detec-tion of various failure modes during the dispensing process like an increased pressureamplitude in a flooded actuation chamber or a reduced pressure amplitude caused byempty nozzles in the printhead. Microarrays are depending on a 100 % spot presence,so one empty nozzle can result in the stop of the microarray production. Due to this factit is essential to have an integrated process control of the slide. This online monitoringby an optical method enables measuring the spot diameter, localizes missing spots, sat-ellites, dirt particles on the slide and allows to determine the position of the spots in themicroarray (see chapter 3.1.2.2). The implemented control loop enabled the automaticadaptation of the optimal piezo stroke parameter of the dispenser for unknown printingmedia. During the whole production it assured a constant high quality of all printed mi-croarrays and eliminated multi-ejection of droplets. As a result of this automated printquality control, the CV for all 24 spot diameters was reduced from initially 15 % to1.5 %, which demonstrates stable, homogenous and reproducible results even afterhundreds of printed arrays.
The integrated pressure sensor and the presented analytical model of the pressuregeneration, which considers the piston movement and the leakage of pressure throughthe vent nozzle, provides an insight into the pressure dynamics inside the actuationchamber during the dispensing process. The impact on the pressure pulse caused bytolerances in the actuation chamber and geometrical variations of the vent nozzle sizewas analyzed and corresponding design rules were established (see chapter 4.1.1-chapter 4.1.2).
The new developed sealing method of the actuation chamber reduced the uncom-pressed air volume by a sixth part in comparison to the standard sealing configuration(see chapter 3.2.1). As a result the optimized pressure pulse enabled to increase theprintable viscosity range by a factor of four and is matching now a viscosity range upto 10.8 mPas.
TOPSPOT: HIGHLY PARALLEL NANOLITER DISPENSING - OPERATING CONDITIONS AND DESIGN RULES - 139 -

CONCLUSION AND COMPARISON TO STANDARD PRINTHEAD DESIGN DISSERTATION REMIGIUS NIEKRAWIETZ
A full 3D model of a single dispensing unit of the TopSpot printhead was developedusing computational fluid dynamics (CFD) simulations and was validated by experi-mental data. The measured pressure pulse was applied as pressure boundary conditionin the simulation model. Based on modelling approaches the dispensing, the fillingprocess and the droplet impact were studied in detail. The influence of the system pa-rameters like dispensing media, driving pressure, the channel layout, the nozzle geom-etry on the droplet formation, and the dispensed volume were quantified and designrules were derived to improve the performance of the dispenser as follows:
DISPENSING MEDIA: The wide field of microarray applications and the use of nu-merous different liquids in one printhead filling set high demands on the print perfor-mance. If the used liquids have similar properties, it is a minor problem. But if the useof a broad media range is desired, the applied TopSpot dispenser should exhibit a lowsensitivity to the liquid properties.
The CFD simulations provide an independent validation of the influences of the liq-uid properties on the dispensing process. The results of the CFD simulations showed,that an adaptation of the pressure pulse is necessary, if the surface tension or viscosityof the dispensing liquid is strongly diverse. If the dynamic viscosity of water(0.001 Pas) is increased by a factor of three, a 57 % higher pressure pulse (0.278 bar)is needed for a single droplet ejection. If the surface tension of water (0.073 N/m) isincreased in the same manner, an even higher pressure pulse of 0.425 bar (140 %) isrequired. The density plays only a minor role in this context: For a six fold increaseddensity value of 6000 kg/m3 only a 11 % higher pressure pulse (0.197 bar) is neces-sary.
Regarding this results one has to keep in mind, that the surface tension and densityare limited in practice to one order of magnitude for all dispensable fluids of interest.For instance the low surface tension of acetone (0.024 N/m) and the high value of wa-ter (0.073 N/m) or the low density of acetone (790 kg/m³) and the high value of sulfuricacid (1836 kg/m³). However, the dynamic viscosity (0.0003 Pas acetone -1.410 Pasglycerol) can vary over three orders of magnitude.
The amount of the ejected single droplet volume also changes with variations of thesurface tension, viscosity, density and the set of needed actuation parameters. Thedroplet volume can be reduced at 40 % to 397 pl by increasing the density six fold. Buta three fold increased viscosity leads to a 7 % higher droplet volume (701 pl). The threefold increased surface tension raised the single droplet volume even by 140 %, whichis equivalent to 932 pl.
To dispense the same droplet volume out of all printhead nozzles, a possible solu-tion could be the use of buffer media with a higher viscosity than the DNA or proteinmedia itself, e.g. a high concentration of glycerin. This dominant buffer solution canhelp to adapt the different liquid properties of the microarray media to the same opti-mized pressure pulse, which is needed for a single droplet ejection process.
PRESSURE PULSE FOR SINGLE DROPLET DISPENSING: The pressure pulse, which is one of the significant parameters of the dispenser, is main-ly influenced by the control of the piezo actuator. Hence, a well controllable and repro-ducible actuation has to be provided to achieve a good volume accuracy and precision.
- 140 - TOPSPOT: HIGHLY PARALLEL NANOLITER DISPENSING - OPERATING CONDITIONS AND DESIGN RULES

DISSERTATION REMIGIUS NIEKRAWIETZ CONCLUSION AND COMPARISON TO STANDARD PRINTHEAD DESIGN
Furthermore, not only the actuator itself has to exhibit a reproducible response to theprovided input signal, but also the electric input signal has to exhibit a stable and re-producible pattern. The analysis of the pressure pulse for a single droplet ejection pro-cess results in the following conclusions:
The stroke of the piezo actuator controls the amplitude of the pressure pulse. It hasto be adjusted for each printing liquid. Hence, it is the main print parameter to controlejection of droplets. For the single droplet ejection there is a small tolerance of about3 µm for a perfect stroke configuration (maximum stroke up to 80 µm), which causesno significant difference in the dispensing performance. This operating range is alsodepending on the used printing media.
The downstroke velocity of the piezo actuator should be as fast as possible to avoidthe wetting of the coated nozzle surface, which could lead to an unreproducible dropletejection process. The maximum downstroke velocity of 380 µm/ms is limited by theresonance frequency (12 kHz) of the used piezo actuator.
A longer hold time of the pressure pulse enables the control of a variable dispensedsingle droplet volume, which also depends on the used printing medium. Up to a holdtime of 400 µs the buffer solution (3M betaine 3 x SSC) led to a linear increase of thedispensed droplet volume and a trebled single droplet volume could be dispensed.
Although the upstroke velocity plays a minor role for the dispensed volume, a slowupstroke velocity causes a long over pressure in the actuation chamber, which poten-tially leads to a wetting of the nozzle plate. The slow pressure decay, resulting from anupstroke velocity of 30 µm/ms, is not high enough to increase the single droplet vol-ume but leads to unwanted satellites, which follow the main droplet. Hence, the max-imum upstroke velocity of 70 µm/ms, which is supported by the electronic, should beused for the adjustment of a single droplet dispensing process.
The vent nozzle size in the printhead has a significant influence on the pressure gen-eration in the actuation chamber. A small vent nozzle size with a diameter of 60 µm inthe standard 24 printhead design leads to a minor reduction of the pressure amplitude.An unwanted depression in the actuation chamber starts with a vent nozzle size of80 µm. With a wider vent nozzle size (200 µm) the droplet ejection process will failbecause of a significant decrease of the pressure amplitude (see chapter 4.1.2).
The maximum printing frequency of a 24 standard TopSpot printhead, filled with a3M betaine dissolved in 3 x SSC printing buffer, was identified to be 20 Hz. A higherfrequency would not increase the microarray printing velocity, because the positioningof the slide to the next printing position takes longer than fifty milliseconds with a typ-ical axis system. Further, the microarray quality also needs to be checked by an opticalprocess control, which is also time-consuming. In combination with the highly inte-grated printhead the maximum printing frequency of 20 Hz enables a very fast produc-tion of microarrays at a rate of 384 x 20 spots/second. A higher frequency could beuseful for spotting several droplets into each other to achieve larger spot volumes. Butthis can be also be achieved by a bigger nozzle diameter of the printhead. The droplet impact onto a solid and liquid surface was studied numerically and exper-imentally. Experiments showed, that the microarray fabrication with the TopSpot dis-penser prevented the splashing and building of satellite droplets during the dropletimpact on the surface because of the small droplet dimension (129 µm to 140 µm di-
TOPSPOT: HIGHLY PARALLEL NANOLITER DISPENSING - OPERATING CONDITIONS AND DESIGN RULES - 141 -

CONCLUSION AND COMPARISON TO STANDARD PRINTHEAD DESIGN DISSERTATION REMIGIUS NIEKRAWIETZ
ameter) and the low kinetic energy (droplet velocity ~1 m/s) (see chapter 4.2.4). Fur-thermore, the spot density on the slide is also limited by the droplet volume and thespreading of the spots, which depends mainly on the used slides. An uncoated hydro-philic microarray slide surface, for instance, makes a spot pitch of about 250 µm with-out a cross-contamination of surrounding spots impossible. It has to be taken intoconsideration, that the spreading ratio, which corresponds to the droplet diameter dur-ing flight divided by the spot diameter on the slide, can be larger than two and thus alsolimits the nozzle pitch in the printhead design.
DESIGNING RULES FOR THE FABRICATION OF HIGHLY INTEGRATED PRINTHEADS: The main requirements for the fabrication of highly integrated Top-Spot printheads were acquired based on the presented experimental and simulation re-sults. The attained experiences allowed to provide specific design rules for the layoutand fabrication of printheads:The three layer design of two fusion bonded silicon layers and one pyrex layer, whichresults in a Pyrex-Si-Si printhead design led to many improvements in comparison tothe standard printhead design (see Fig. 7.1). Due to a different position of the supplychannels in the lower silicon layer no pyrex layer is necessary to close the channels atthe bottom of the silicon layer. This was solved by the upper silicon layer containingonly nozzle expansions. Accordingly, the distance between the printhead nozzles andthe slide (optimum: 800 µm) could be reduced by the thickness of the 150 µm pyrexlayer. The shortened flight distance of the droplets to the substrate could enable a minorimpact of external environmental influences. An improved homogeneity of the spotpitches without the risk of smearing the printed spots by the printhead (too close) ispossible.
The fusion bonded silicon layer had no recess under the actuation chamber like thepyrex layer in the standard printhead layout. Hence, a higher mechanical stability ofthe printhead was also achieved. Further, a via from the microchannel to the nozzle ex-pansion like in the standard printhead layout is no longer needed. Only the nozzle itselfhas to be etched through the silicon wafer, which allows to minimize the notching ef-fect (see chapter 5.1.1.4). A general improvement of the presented design is, that the microchannels from the res-ervoir to the nozzle are completely sealed, reducing evaporation and cross-contamina-tion risks. Considering the high integration density of the 384 nozzle printhead, thecatwalk width between the microchannels is less than 40 µm. Using open channels inthe 384 printhead actuation chamber with the same pitch would lead to a higher risk ofcross-contamination due to the long distance to the nozzles (see Fig. 7.1). The sealedconcept enables the placement of additional microchannels between the nozzle expan-sions with a high safety factor and is only limited by the minimum bond area, which isnecessary for the silicon fusion bonding process (see chapter 5.1.2.2). The multi-layerconcept with additional silicon levels for the microchannels overcomes this technolog-ical limitation. It allows to place more channels between two nozzles. The integrationdensity of the nozzles can be increased with microchannels, which are not only placednext to each other as in the single layer design but also on top of each other in additionallayers. Due to this fact, the fabrication process of printheads with 1536 nozzles seemsfeasible. Particularly, the design rules of the highly integrated printhead nozzles leadto an improvement of the printing performance for the fabrication of microarrays:
- 142 - TOPSPOT: HIGHLY PARALLEL NANOLITER DISPENSING - OPERATING CONDITIONS AND DESIGN RULES

DISSERTATION REMIGIUS NIEKRAWIETZ CONCLUSION AND COMPARISON TO STANDARD PRINTHEAD DESIGN
The standard silicon printhead has a nozzle length of 150 µm. The optimization of thenozzle length down to 50 µm enabled the reduction of the critical pressure by 20 % forthe single droplet ejection process and allowed to increase the viscosity range of thedispenser. A further reduction of the nozzle length down to 25 µm led to a disruptionof the nozzle expansion bottom during the ultrasonic cleaning process of the 24 chan-nel printhead due to the reduced mechanical stability. For a smaller droplet volume the nozzle diameter of the printhead can be reduced. Re-garding the standard nozzle diameter of 50 µm with a corresponding droplet volumeof 813 pl, the dispensing volume could be reduced to a minimum of 338 pl by using a30 µm nozzle. On the other hand, the printing performance of the dispenser is also lim-ited by the increased fluidic resistance of the nozzle (see chapter 2.4.2). The requiredpressure pulse for the standard nozzle diameter of 50 µm (peak pressure: 0.177 bar) isincreased by 105 % by reducing the nozzle diameter to 30 µm (see chapter 4.2.3.1).With such nozzles liquids of higher viscosity can not be dispensed, because the neededpressure pulse for the single droplet ejection can not be generated by the piston move-ment. Another significant parameter is the diameter of the nozzle expansion. The bottleneck,which the microchannels have to pass from the reservoir to the nozzle, is the distancebetween the neighboring nozzle expansions. Their diameter reduction enables the wid-ening of this bottleneck and consequently leads to a higher integration density of thenozzles in the printhead. Furthermore, the capillary filling is improved because of alower difference between the microchannel width and the nozzle expansion diameter,which the liquid has to pass. In contrast, a huge widening of the microchannel can leadto a stop of the capillary filling. But a higher fluidic resistance and a smaller dropletvolume is also caused by the reduction of the nozzle expansion size (see chapter4.2.3.2). The size optimization of the nozzle expansion leads to a diameter of 150 µm,which meets the demands for an only slightly increased pressure pulse of 8 % for a sin-gle droplet ejection process and the requirements of a high nozzle integration densityin the 384 printhead design.In addition, the channel width reduction did not only allow for a higher integration den-sity of the nozzles but unfortunately also led to a longer filling time from the reservoirsto the nozzles (see chapter 2.4.3). The experiments further showed, that a capillary selffilling below a microchannel width of 20 µm was not possible without an additionalpressure pulse. A possible solution is to reduce the channel width only at the bottleneckbetween the nozzle expansions. The remaining microchannel is widened and has a lowfluidic resistance, which results in a reproducible and fast filling time.
The self-filling of the standard printhead mainly stopped at the vias connecting themicrochannels with the open microchannels or at the inlets of the nozzle expansions.The new developed passive capillary filling structure enhanced the reproducible andstable first priming of the nozzles (see chapter 5-1.2.1). Particularly, the passive fillingstructure 1 B demonstrated the best filling behavior with the highest successful self-filling rate (99 %) and the lowest CV (1 %).
One of the major challenges for the fabrication of the 384 nozzle printhead is thecost of production. Currently, only one 384 nozzle printhead can be arranged on a 4-inch silicon wafer, but a transfer to an 8-inch process is conceivable. Due to the newsilicon fusion bond process used for the fabrication, the production yield of the print-
TOPSPOT: HIGHLY PARALLEL NANOLITER DISPENSING - OPERATING CONDITIONS AND DESIGN RULES - 143 -

CONCLUSION AND COMPARISON TO STANDARD PRINTHEAD DESIGN DISSERTATION REMIGIUS NIEKRAWIETZ
Figure 7.1: Comparison of the 384er printhead designs: a.) The previous design was studied by Wibelet al. and had a reservoir arrangement of 24x16 with a pitch 2.25 mm [46]. Due to the pyrex siliconpyrex assembly the printhead contains vias from the microchannels to the nozzle expansions. The openmicrochannels are located in the actuation chamber, which required a huge actuation chamber of1116.28 mm3and led to a high evaporation of the dispensing liquid. The nozzle consists of a 300 µmdiameter nozzle expansion and a nozzle diameter of 50 µm with a length of 150 µm and a pitch of1 mm. b.) The new 384 design has a reservoir arrangement of 32x12 with a pitch of 2.25 mm. Thepyrex and double silicon layer assembly with a nozzle pitch of 500 µm is much more robust and con-tains sealed microchannels. The vent nozzle was transferred from the piston into the actuation cham-ber. The dimensions of the actuation chamber could nearly be halved resulting in an actuationchamber volume, that has been reduced by almost a factor of four.
a) b)
- 144 - TOPSPOT: HIGHLY PARALLEL NANOLITER DISPENSING - OPERATING CONDITIONS AND DESIGN RULES

DISSERTATION REMIGIUS NIEKRAWIETZ CONCLUSION AND COMPARISON TO STANDARD PRINTHEAD DESIGN
heads was decreased to 60 %. Because of the place requirement on the silicon waferthe cost of production for the 384 nozzle printhead is lower compared to four 96 nozzleprintheads. However, production volume and the silicon size used for the printheadfabrication determines, if a cost-effective production is possible.
Due to the high number of nozzles the cleaning process of the printhead is critical.After using the cleaning station the nozzles of the printhead should be optically con-trolled by a microscope to ensure, that no dirt and fuzzes can influence the dispensingprocess. A manual filling of the 384 nozzle printhead is time-consuming and not fea-sible. The automated filling with assured traceability of samples is indispensable. Dur-ing filling the evaporation of printing media out of the printhead has to be avoided bya dew point controlled cooling.Considering the presented results the 384 printhead comprised all technical expertiseof the implemented experiments and simulations. Stroboscopic evaluation of the dis-pensing process led to CVs of droplet diameter lower than 1 % per nozzle with a cal-culated droplet volume of 825 pl. The measured fluorochrome signal intensity of thespotted array showed CVs to be better than 2.8 % depending on the used printing buff-er. However, the presented printhead design is a compromise pertaining to the high in-tegration density of the nozzles and achievable printing media range. The best trade-off can be achieved with the following parameters:
• Nozzle expansion diameter (Dnz,ex) : = 150 µm• Nozzle diameter (Dnz) : = 50 µm• Nozzle length (lnz) : = 75 µm• Nozzle pitch (Pnz) : = 500 µm• Channel width (wch) : = 24 µm• Catwalk width (wcat) : = 38.33 µm• Vent nozzle diameter (Dvent) x 2 : = 80 µm• Passive filling structure : = 1 B
The higher fluidic resistance of the 150 µm nozzle expansion diameter, which is nec-essary for the high integration density, was compensated through a shortened nozzlelength of 75 µm.The established design rules can also be applied to other scenarios, if the high integra-tion density of the printhead is not the main focus. But requirements such as the lowestdroplet volume or the highest viscosity range of the dispensing liquids can also be con-sidered and will then lead to a different printhead layout.
TOPSPOT: HIGHLY PARALLEL NANOLITER DISPENSING - OPERATING CONDITIONS AND DESIGN RULES - 145 -

NOMENCLATURE DISSERTATION REMIGIUS NIEKRAWIETZ
NOMENCLATURE
Symbol Description [Unity]
A Area [m2]
A0 Constriction of the cross-section area [m2]
Adrop Surface of a spherical droplet [m2]
Alarge Cross-section area of a large circular channel [m2]
Anz Cross-section area of a nozzle [m2]
Anz,ex Cross-section area of a nozzle expansion [m2]
Asmall Cross-section area of a small circular channel [m2]
Avent Cross-section area of a vent nozzle [m2]
a Acceleration [m/s2]
Cel Electric capacitance [F]
Cgeom Geometry coefficient [-]
Chd Hydrodynamic capacitance [m4s2 kg-1]
cp Specific heat [J K-1kg-1]
D Diameter [m]
D* Spreading ratio [-]
Ddls Double spot diameter [m]
Ddrop Droplet diameter [m]
Dex Droplet diameter experimentally observed [m]
Dls Spot diameter [m]
Dnz Diameter of the nozzle [m]
Dnz,ex Diameter of the nozzle expansion [m]
d Distance [m]
E Energy [J]
- 146 - TOPSPOT: HIGHLY PARALLEL NANOLITER DISPENSING - OPERATING CONDITIONS AND DESIGN RULES

DISSERTATION REMIGIUS NIEKRAWIETZ NOMENCLATURE
Einternal Internal Energy [J]
Efriction Energy loss due to friction [J]
Ekinetic Kinetic energy [J]
Epot Potential energy [J]
Epressure Pressure energy [J]
Esurface Surface tension energy [J]
Eviscous Frictional energy [J]
F Force [N]
Fp Pressure force [N]
Fη Viscous force [N]
f Frequency [Hz]
fbody Body force [N]
g Normal earth acceleration [m/s2]
Ht Hold time [s]
h Channel height [m]
hchamber Height of the actuation chamber [m]
hs Specific Enthalpie [m2 s-2]
Iel Electric current [A]
Lel Electric Inductance [H]
Lhd Fluidic Inertance [kg/m4]
l Length [m]
lch Length of the microchannel [m]
loch Length of the open microchannel [m]
lnz Length of the nozzle [m]
lnz,ex Length of the nozzle expansion [m]
m Mass [kg]
Nch Number of microchannels [-]
Symbol Description [Unity]
TOPSPOT: HIGHLY PARALLEL NANOLITER DISPENSING - OPERATING CONDITIONS AND DESIGN RULES - 147 -

NOMENCLATURE DISSERTATION REMIGIUS NIEKRAWIETZ
n Normal force [N]
On Ohnesorge number [-]
Pnz Nozzle pitch [m]
p Pressure [Pa]
pcap Capillary pressure [Pa]
pcontraction Pressure due to contraction [Pa]
pcritical Critical pressure [Pa]
pexpansion Pressure due to expansion [Pa]
pistonz(t) Piston movement [m]
pnorm Normal pressure [Pa]
q Charge [Cb]
R Gas constant (= 8.3148 J mol-1 K-1) [J mol-1 K-1]
R Radius [m]
Rcontraction Fluidic resistance due to contraction [kg s-1m-4]
Re Reynolds number [-]
Rel Electric resistance [Ω]
Rexpansion Fluidic resistance due to expansion [kg s-1 m-4]
Rfl Fluidic resistance [kg s-1m-4]
Ri Specific gas constant [J K-1kg-1]
Rnz Fluidic resistance of the nozzle [kg s-1 m-4]
Rnz,ex Fluidic resistance of the nozzle expansion [kg s-1 m-4]
Rls Radius of the liquid-solid interface [m]
Rs Radius of the sphere [m]
r Radius [m]
T Temperature [K]
t Time [s]
U Perimeter [m]
Symbol Description [Unity]
- 148 - TOPSPOT: HIGHLY PARALLEL NANOLITER DISPENSING - OPERATING CONDITIONS AND DESIGN RULES

DISSERTATION REMIGIUS NIEKRAWIETZ NOMENCLATURE
Uel Electrical voltage [V]
V Volume [m3]
Vadd Additional gas volume [m3]
Vchamber(t) Volume of the pressure chamber [m3]
Vdrop Droplet volume [m3]
Vgas(t) Gas volume in the pressure chamber [m3]
v Velocity [m/s]
vcritical Critical velocity [m/s]
vdrop Droplet velocity [m/s]
vnz Velocity inside the nozzle [m/s]
vnz,ex Velocity inside the nozzle expansion [m/s]
vr Velocity in radial direction [m/s]
vvent,gas Gas velocity at the vent nozzle [m/s]
vx Velocity in x-direction [m/s]
vy Velocity in y-direction [m/s]
vz Velocity in z-direction [m/s]
We Weber number [-]
Wecritical Critical Weber number [-]
Wecritical,mod Modified critical Weber number for higher viscous media [-]
w Channel width [m]
wcat Catwalk width [m]
wch Channel width [m]
x Cartesian coordinate in x-direction [m]
y Cartesian coordinate in y-direction [m]
z Cartesian coordinate in z-direction [m]
σ Surface tension [N/m]
σgs Surface tension between gas and solid phase [N/m]
Symbol Description [Unity]
TOPSPOT: HIGHLY PARALLEL NANOLITER DISPENSING - OPERATING CONDITIONS AND DESIGN RULES - 149 -

NOMENCLATURE DISSERTATION REMIGIUS NIEKRAWIETZ
σlg Surface tension between liquid and gas phase [N/m]
σls Surface tension between liquid and solid phase [N/m]
η Dynamic viscosity [Pa s]
ρ Liquid density [kg/m3]
ρgas Gas density at normal pressure [kg/m3]
ϑ Curvature angle [°]
ζ Resistance number for contraction resistance [-]
Θ Contact Angle [°]
µ Outflow number [-]
π Number Pi [-]
Φm Mass flow [kg/s]
Φv Volume flow [m3/s]
Φv, critical Critical volume flow [m3/s]
Φvent,gas Gas flow through the vent nozzle [m3/s]
velocity coefficient [-]
χ Adiabatic exponent [-]
Symbol Description [Unity]
ϒ
- 150 - TOPSPOT: HIGHLY PARALLEL NANOLITER DISPENSING - OPERATING CONDITIONS AND DESIGN RULES

DISSERTATION REMIGIUS NIEKRAWIETZ NOMENCLATURE
Figure 8.1: a.) Piezo actuator movement described of the three time intervals. b.) Comparison of thestandard TopSpot technology to the new sealing method of the actuation chamber with the integratedpressure sensor and the silicon fusion bonded printhead design. c.) Top view of a 24 channel prin-thead. d.) Detail view of a standard TopSpot nozzle. e.) Schematic view of the connection of the nozzlesby microchannel. f.) Perspective cross-section of the filling structure of the microchannel and nozzle.g.) Detail view of a standard nozzle and open microchannel. h.) Detail view of the optimized nozzleand closed microchannel. i.) Schematic view of the silicon multi layer design.
a)
b)
c) d)
e) f)
g) h) i)
TOPSPOT: HIGHLY PARALLEL NANOLITER DISPENSING - OPERATING CONDITIONS AND DESIGN RULES - 151 -

REFERENCES DISSERTATION REMIGIUS NIEKRAWIETZ
REFERENCES
[1] M. Schena, Microarray Biochip Technology, 1 ed. Natick: Eaton PublishingCompany/Biotechniques Books, 2000.
[2] G. Hardiman, "Microarray technologies - an overview. The University of Cali-fornia San Diego Extension, Bioscience, Microarray Technologies - an over-view, March 13-15, 2002," Pharmacogenomics., vol. 3, no. 3, pp. 293-297, May2002.
[3] B. B. Haab, "Methods and Applications of Antibody Microarrays in Cancer Re-search", Proteomics, vol. 3, no. 11, pp. 2116-2122, Nov. 2003.
[4] M. Schena, DNA Microarrays: A Practical Approach, Oxford University Press,1. Okt. 1999.
[5] E. M. Southern, "Detection of specific sequences among DNA fragments sepa-rated by gel electrophoresis", J. Mol. Biol. 98, 503–517, 1975.
[6] M. Schena, D. Shalon, R. W. Davis, P. O. Brown, "Quantitative monitoring ofgene expression patterns with a complementary DNA microarray", Science 270,467–470, 1995.
[7] P. Cutler, "Protein Arrays: The Current State-of-the-art," Proteomics, vol. 3, no.1, pp. 3-18, Jan. 2003.
[8] J. M. Schwenk, D. Stoll, M. F. Templin, and T. O. Joos, "Cell Microarrays: AnEmerging Technology for the Characterization of Antibodies," Biotechniques,vol. Suppl, pp. 54-61, Dec. 2002.
[9] J. L. DeRisi, V. R. Iyer, and P. O. Brown, "Exploring the Metabolic and GeneticControl of Gene Expression on a Genomic Scale," Science, vol. 278, no. 5338,pp. 680-686, Oct. 1997.
[10] D. S. Wilson and S. Nock, "Functional Protein Microarrays," Curr. Opin. Chem.Biol., vol. 6, no. 1, pp. 81-85, Feb. 2002.
[11] A. E. Carpenter and D. M. Sabatini, "Systematic genome-wide screens of genefunction", Nat. Rev. Genet., vol. 5, no. 1, pp. 11-22, Jan.2004.
[12] J. Glokler and P. Angenendt, "Protein and antibody microarray technology", J.Chromatogr. B Analyt. Technol. Biomed. Life Sci., vol. 797, no. 1-2, pp. 229-240, Nov. 2003.
[13] K. D. Kumble, "Protein microarrays: new tools for pharmaceutical develop-ment", Anal. Bioanal. Chem., vol. 377, no. 5, pp. 812-819, Nov. 2003.
[14] U. B. Nielsen and B. H. Geierstanger, "Multiplexed sandwich assays in microar-ray format", J. Immunol. Methods, vol. 290, no. 1-2, pp. 107-120, July 2004.
[15] P. Mitchell, "A perspective on protein microarrays," Nat. Biotechnol., vol. 20,no. 3, pp. 225-229, Mar. 2002.
- 152 - TOPSPOT: HIGHLY PARALLEL NANOLITER DISPENSING - OPERATING CONDITIONS AND DESIGN RULES

DISSERTATION REMIGIUS NIEKRAWIETZ REFERENCES
[16] S. Nishizuka, L. Charboneau, L. Young, S. Major, W. C. Reinhold, M. Waltham,H. Kouros-Mehr, K. J. Bussey, J. K. Lee, V. Espina, P. J. Munson, E. Petricoin,III, L. A. Liotta, and J. N. Weinstein, "Proteomic profiling of the NCI-60 cancercell lines using new high-density reverse-phase lysate microarrays," Proc. Natl.Acad. Sci. U. S A, vol. 100, no. 24, pp. 14229-14234, Nov.2003.
[17] G. MacBeath, "Protein microarrays and proteomics," Nat. Genet., vol. 32 Suppl,pp. 526-532, Dec.2002
[18] M. F. Templin, D. Stoll, M. Schrenk, P. C. Traub, C. F. Vohringer, and T. O.Joos, "Protein microarray technology", Drug Discov. Today, vol. 7, no. 15, pp.815-822, Aug. 2002.
[19] B. B. Haab, "Methods and applications of antibody microarrays in cancer rese-arch", Proteomics, vol. 3, no. 11, pp. 2116-2122, Nov. 2003.
[20] K. D. Kumble, "Protein microarrays: new tools for pharmaceutical develop-ment," Anal. Bioanal. Chem., vol. 377, no. 5, pp. 812-819, Nov. 2003.
[21] T. Martinsky, "Protein Microarray Manufacturing," Pharmacogenomics, vol. 3,pp. 42-48, Apr. 2004.
[22] U. B. Nielsen and B. H. Geierstanger, "Multiplexed sandwich assays in microar-ray format", J. Immunol. Methods, vol. 290, no. 1-2, pp. 107-120, July 2004.
[23] J. B. Delehanty, K. M. Shaffer, and B. Lin, "A comparison of microscope slidesubstrates for use in transfected cell microarrays," Biosens. Bioelectron., vol. 20,no. 4, pp. 773-779, Nov. 2004.
[24] S. N. Bailey, R. Z. Wu, and D. M. Sabatini, "Applications of transfected cellmicroarrays in high-throughput drug discovery," Drug Discov. Today, vol. 7, no.18 Suppl, p. S113-S118, Sept. 2002.
[25] Affymetrix, Inc., „Array Manufacturing,“ GeneChip Technology, http://www.affymetrix.com/technology/manufacturing/index.affx (04 May 2005)
[26] NimbleGen Systems, Inc. (2005),“in situ Synthesis-based Microarray Manufac-turing“, http://www.nimblegen.com/technology/manufacture.html (04 May2005)
[27] Affymetrix, Inc. (2004), „NimbleExpress Array Program,“ Data Sheet , http://www.affymetrix.com/support/technical/datasheets/nimble_programs_datasheet.pdf (04 May 2005)
[28] Febit biotech gmbh, "GENIOM - The Instrument", http://www.geniom.de (04May 2006)
[29] Agilent Technologies, Inc. (2003), "Agilent SurePrint Technology", http://www.chem.agilent.com/temp/rad602EE/00039489.pdf (04 May 2005)
[30] Yale University, New Haven, USA (01/2005), „Affymetrix GeneChip System,“Affymetrix GeneChip Technology Overview, http://keck.med.yale.edu/affyme-trix/technology.htm#Affymetrix%20GeneChip%20system: (04 May 2005)
[31] TeleChem International, Inc. (1998-2005), “Stealth Microarrray Spotting Pinsand Printheads“, Products, Printing Technology, http://arrayit.com/Products/Printing/Stealth/stealth.html (03 May 2005)
TOPSPOT: HIGHLY PARALLEL NANOLITER DISPENSING - OPERATING CONDITIONS AND DESIGN RULES - 153 -

REFERENCES DISSERTATION REMIGIUS NIEKRAWIETZ
[32] U. R. Müller, D. V. Nicolau, Microarray Technology and Its Applications (Bio-logical and Medical Physics: Biomedical Engineering), 1 ed. Berlin: SpringerVerlag, Dec.2004.
[33] E. Zubritsky, "Spotting a microarray system," Anal. Chem., vol. 72, no. 23, pp.761A-767A, Dec.2000.
[34] P. J. Park, Y. A. Cao, S. Y. Lee, J. W. Kim, M. S. Chang, R. Hart, and S. Choi,"Current issues for DNA microarrays: platform comparison, double linear am-plification, and universal RNA reference," J. Biotechnol., vol. 112, no. 3, pp.225-245, Sept.2004.
[35] Genomic Solutions, „synQUAD technology“, http://www.genomicsoluti-ons.com//files/synQUAD.pdf (03 May 2005)
[36] M. Schena, Protein Microarrays. Sudbury, USA: Jones and Bartlett, 2004.[37] E. R. Lee, Microdrop Generation, 1 ed., Boca Raton: CRC Press, 2002.[38] Microdrop Technologies GmbH (April 2005), „Micropipette AD-K-501“, Dis-
pensers and pipettes (rev. 0.2), http://www.microdrop.com/html/dispensers_and_pipettes.html (03 May 2005)
[39] Scienion AG (2003), „Automatic Spot Control“, sciFLEXARRAYER PiezoDispenser, http://www.scienion.de/html_files/english/html_downloads/pdf/Dtbl_sciflex.pdf (03 May2005)
[40] Perkin Elmer, Inc. (2003), „Specifications sheet“, Piezorray, flexible Non-Con-tact Microarraying System, http://las.perkinelmer.com/Content/RelatedMateri-als/006935-Piezorray-SpecificationsSheet.pdf (03 May 2005)
[41] GeSim GmbH, „NanoPlotte NP 2.0“, The Nano-Plotter Family, http://www.ge-sim.de/Products/Nano-Plotters/Models/models.htm (03 May 2005)
[42] Aurora Discovery, Inc. (2003), „Small volumes big savings Low-VolumeMicrofluidic Workstations“, http://www.auroradiscovery.com/brochures/Auro-ra _ LH.pdf (17 Juli 2006)
[43] C. P. Steinert, "TopSpot Vario: A Novel Microarrayer System for Highly Paral-lel Picoliter Dispensing", PhD thesis, IMTEK - Institute of Microsystem Tech-nologies, University of Freiburg, 2005.
[44] GeSim GmbH, „Dispensers“, GeSim products, http://www.gesim.de/Products/products.htm (03 May 2005)
[45] Frank-Ulrich Gast, Hendrik Fiehn, "The development of integrated microfluidicsystems at GeSiM", Lab Chip, vol. 3, 6N - 10N, 2003
[46] W. Wibel, "Design and Characterization of a 384 Channel Micromachined Prin-thead Using TopSpot Technology", diploma thesis, IMTEK - Institute of Micro-system Technologies, University of Freiburg, Dec. 2002
[47] J. Ducrée, H. Gruhler, N. Hey, M. Müller, S. Bekesi, M. Freygang, H. Sandmai-er, and R. Zengerle, "TopSpot - A New Method for the Fabrication of Microar-rays", in Proceedings of IEEE International Conference on Micro ElectroMechanical Systems, Mizyazaki, Japan, Jan. 23 - 27, 2000, pp. 317-322.
- 154 - TOPSPOT: HIGHLY PARALLEL NANOLITER DISPENSING - OPERATING CONDITIONS AND DESIGN RULES

DISSERTATION REMIGIUS NIEKRAWIETZ REFERENCES
[48] B. de Heij, M. Daub, O. Gutmann, R. Niekrawietz, H. Sandmaier, and R. Zen-gerle, "Highly Parallel Dispensing of Chemical and Biological Reagents", Anal.Bioanal. Chem., vol.378, no. 1, pp. 119-122, Jan.2004.
[49] B. de Heij, S. Bekesi, M. Lohr, G. Kattinger, H. Sandmaier, and R. Zengerle, "A96 Channel Printhead for Production of Microarrays", in Proceedings of The In-ternational MEMS Workshop iMEMS, Singapore, July 4-6, 2001, pp. 125-131.
[50] R. Niekrawietz, W. Honstein, O. Gutmann, T. Wielath, B. de Heij, R. Zengerle,M. Daub, "Integrated Process Control For Highly Parallel and Contact FreeMicroarray Printing", presented at Statusseminar Chiptechnologien - Technolo-gien & Anwendungen, 03.02.2005 - 04.02.2005; Dechema Haus, Frankfurt, Ger-many, 2005
[51] Piezomechanik - Dr. Lutz Pickelmann GmbH, "Piezo-mechanical and Electrost-rictive Stack and ring actuators: Product range and Technical data," http://www.piezomechanik.com/hp030530/pdfs/232047_PIEZO_Produkt_GB.pdf(20 May 2005).
[52] S. Breisch, B. de Heij, M. Lohr, and M. Stelzle, "Selective Chemical SurfaceModification of Fluidic Microsystems and Characterization Studies," Journal ofMicromechanics and Microengineering, vol. 14, no. 4, pp. 497-505, Apr.2004.
[53] O. Gutmann, C. P. Steinert, G. Dernick, B. de Heij, C. Fattinger, U. Certa, R.Zengerle and M. Daub, "Fast Selective Surface Modification Of MicrofluidicPrintheads For Improvement Of Droplet Ejection," MicroTAS 2005, Boston,USA, 1267-1269
[54] B. de Heij, C. Steinert, H. Sandmaier, and R. Zengerle, "A Tunable and Highly-Parallel Picoliter-Dispenser Based on Direct Liquid Displacement", in Procee-dings of IEEE International Conference on Micro Electro Mechanical Systems,Las Vegas, USA, Jan. 20 - 24, 2002, pp. 706-709.
[55] B. de Heij, C. Steinert, H. Sandmaier, and R. Zengerle, "A tuneable and highly-parallel picolitre-dispenser based on direct liquid displacement", Sensors andActuators A-Physical, vol. 103, no. 1-2, pp. 88-92, Jan.2003.
[56] C. Steinert, H. Sandmaier, M. Daub, B. de Heij, and R. Zengerle, "Bubble-FreePriming of Blind Channels", Proceedings of IEEE International Conference onMicro Electro Mechanical Systems, MEMS, Maastricht, The Netherlands, 2004,pp. 224-228.
[57] Biofluidix GmbH, Freiburg, Germany (www.biofluidix.com).[58] H. Sigloch, Technische Fluidmechanik, 3 ed., Düsseldorf: VDI Verlag, 1996.[59] S. Middleman, Modeling Axisymmetric Flows, 1 ed., San Diego: Academic
Press, 1995.[60] H. C. Lee, "Drop Formation in A Liquid Jet", IBM Journal of Research and De-
velopment, vol. 18, no. 4, pp. 364-369, 1974.[61] J. Eggers, "Theory of Drop Formation", Physics of Fluids, vol. 7, no. 5, pp. 941-
953, 1995.
TOPSPOT: HIGHLY PARALLEL NANOLITER DISPENSING - OPERATING CONDITIONS AND DESIGN RULES - 155 -

REFERENCES DISSERTATION REMIGIUS NIEKRAWIETZ
[62] J. Eggers and and T. F. Dupont, "Drop Formation in A One-Dimensional Appro-ximation of the Navier-Stokes Equation", Journal of Fluid Mechanics, vol. 262,pp. 205-221, 1994.
[63] J. Eggers, "Nonlinear dynamics and breakup of free-surface flows", Reviews ofModern Physics, vol. 69, no. 3, 1997.
[64] J. Eggers, "Tropfenbildung", Phys. Bl., vol. 53, pp. 431-434, 1997.[65] H. K. Versteeg and M. Malalasekera, An Introduction to Computational Fluid
Dynamics, The Finite Volume Method, Prentice Hall, 1996.[66] W. Bohl, Technische Strömungslehre, 10 ed., Würzburg: Vogel-Verlag, 1994.[67] H. Oertel jr., Prandtl-Führer durch die Strömunglehre, 10 ed., Braunschweig /
Wiesbaden: Friedr. Vieweg & Sohn Verlagsgesellschaft, 2001.[68] E. Truckenbrodt, Grundlagen und elementare Strömungsvorgänge dichtebestän-
diger Fluide, 1 ed., Berlin: Springer Verlag, 1995.[69] E. Truckenbrodt, Elementare Strömungsvorgänge dichteveränderlicher Fluide
sowie Potentialströmungen und Grenzschichtströmungen, 4 ed., Berlin: SpringerVerlag, 1998.
[70] I. N. Bronstein, K. A. Semendjajew, G. Musiol, H. Mühlig, Taschenbuch derMathematik, 4 ed., Frankfurt am Main, Thun: Verlag Harri Deutsch, 1999.
[71] C. Litterst, "The Channel-In-Channel (CHIC) principle - A study on bubble ma-nagement in microfluidic systems", Diploma thesis, IMTEK - Institute of Micro-system Technologies, University of Freiburg, 2003.
[72] H. M. Schädel, Fluidische Bauelemente und Netzwerke, Wiesbaden: Vieweg,1979.
[73] Analyzing Designs using Saber Designer, Analogy Inc., Beaverton 1999, http://www.analogy.com/.
[74] P. Koltay, C. Moosmann, C. Litterst,W. Streule, and R. Zengerle. Simulation ofa micro dispenser using lumped models. In Fifth International Conference onModeling and Simulation of Microsystems (MSM), pages 112–115, 2002.
[75] SABER 2004.06, Synopsys Inc., www.synopsys.com[76] T. Thorpe. Computerized Circuit Analysis with SPICE. Wiley Interscience,
1991. ISBN 0-471-55164-3.[77] P. Koltay, C. Moosmann, C. Litterst, W. Streule, B. Birkenmeier and R. Zenger-
le, Modelling Free Jet Ejection on a System Level – An approach for microflui-dics, Fifth International Conference on Modeling and Simulation ofMicrosystems (MSM); San Juan, Puerto Rico, USA, April 22-25, 2002
[78] M. Richter, P. Woias and D. Weiß, "Microchannels for applications in liquid do-sing and flow-rate measurement", Sensors and Actuators A-Physical, vol. 62,no. 1-3, pp. 480-483, 1997.
[79] G. Waibel, "Miniaturisiertes Dosiersystem zur geregelten Dosierung von Tintein einem Schreibgerät", PhD thesis, Institut für Zeitmesstechnik, Fein- und Mi-krotechnik Universität Stuttgart, April 2005
- 156 - TOPSPOT: HIGHLY PARALLEL NANOLITER DISPENSING - OPERATING CONDITIONS AND DESIGN RULES

DISSERTATION REMIGIUS NIEKRAWIETZ REFERENCES
[80] N. Nguyen, Mikrofluidik - Entwurf, Herstellung und Charakterisierung, B.G.Teubner Verlag, 2004.
[81] J. Ducrée, Scriptum to Microfluidics, WS 2005/2006, IMTEK at Albert LudwigsUniversity in Freiburg / Germany.
[82] D. Juncker, H. Schmid, U. Drechsler, H. Wolf, M. Wolf, B. Michel, Nico deRooij, E. Delamarche, "Autonomous Microfluidic Capillary System", Analyti-cal Chemistry, vol. 74, pp. 6139-6144, December 15, 2002.
[83] D. Langbein, Capillary Surfaces, SMTP 178, Berlin / Heidelberg: Springer Ver-lag, 2002
[84] F. Goldschmidtböing, "Entwurf, Design und experimentelle Charakterisierungvon Mikro-Freistrahldispensern", PhD thesis, IMTEK - Institute of MicrosystemTechnologies, University of Freiburg, 2004.
[85] E.W. Washburn, "The dynamics of capillary flow", Phys. Rev. 17, 273-283,1921
[86] W. Beitz, K.-H. Grote, DUBBEL - Taschenbuch für den Maschinenbau, Sprin-ger-Verlag GmbH, 2001
[87] H. Liu, Science and Engineering of Droplets: Fundamentals and Applications,Norwich, New York, USA: Noyes Publications / William Andrew Publishing,LLC, 1981.
[88] N.-T. Nguyen, Mikrofluidik - Entwurf, Herstellung und Charakterisierung, B.G.Teubner Verlag, 2004.
[89] A. Frohn and N. Roth, Dynamics of Droplets, 1 ed., Berlin / Heidelberg: Sprin-ger Verlag, 2000.
[90] C. Weber, "Zum Zerfall eines Flüssigkeitsstrahles", Zeitschrift für angewandteMathematik und Mechanik, vol. 11, no. 2, pp. 136-154, 1931.
[91] A. Haenlein, "Über den Zerfall eines Flüssigkeitsstrahles", Forschung auf demGebiete des Ingenieurwesens, vol. 2, no. 4, pp. 139-149, 1931.
[92] J. E. Fromm, "Numerical-Calculation of the Fluid-Dynamics of Drop-On-De-mand Jets", IBM Journal of Research and Development, vol. 28, no. 3, pp. 322-333, 1984.
[93] M. Pilch and C. A. Erdman, "Use of Breakup Time Data and Velocity HistoryData to Predict the Maximum Size of Stable Fragments for Acceleration-InducedBreakup of A Liquid-Drop", International Journal of Multiphase Flow, vol. 13,no. 6, pp. 741-757, 1987.
[94] A. Tarnogrodzki, "Theoretical Prediction of the Critical Weber Number", Inter-national Journal of Multiphase Flow, vol. 19, no. 2, pp. 329-336, 1993.
[95] G. O. Thomas, "The Aerodynamic Breakup of Ligaments," Atomization andSprays, vol. 13, no. 1, pp. 117-129, Jan.2003.
[96] T. Lindemann, "Droplet Generation From the Nanoliter to the Femtoliter Ran-ge", PhD thesis, IMTEK - Institute of Microsystem Technologies, University ofFreiburg, 2006.
TOPSPOT: HIGHLY PARALLEL NANOLITER DISPENSING - OPERATING CONDITIONS AND DESIGN RULES - 157 -

REFERENCES DISSERTATION REMIGIUS NIEKRAWIETZ
[97] R. Schmehl, G. Klose, G. Maier and S. Wittig, "Efficient Numerical Calculationof Evaporating Sprays in Combustion Chamber Flows", Gas Turbine EngineCombustion, Emissions and Alternative Fuels (AGARD-RTO-MP-14), 1999,pp. 51-1 - 51-14.
[98] R. Schmehl, G. Maier and S. Wittig, "CFD Analysis of Fuel Atomization, Secon-dary Droplet Breakup and Spray Dispersion in the Premix Duct of a LPP Com-bustor", Eighth International Conference on Liquid Atomization and SpraySystems, Pasadena, USA, 2000.
[99] A. R. Hanson, E. G. Domich and H. S. Adams, "Shock tube investigation of thebreakup of drops by air blasts", Physics of Fluids, vol. 6, pp. 1070-1080, 1963.
[100] W. Wehl, "Akustik und Fluidmechanik in Kanälen und Düsen von Tinten-schreibwerken", PhD thesis, Technische Universität München, 1984.
[101] W. von Ohnesorge, "Die Bildung von Tropfen an Düsen und die Auflösung flüs-siger Strahlen", Zeitschrift für angewandte Mathematik und Mechanik, vol. 16,no. 6, pp. 355-358, 1936.
[102] R. S. Brodkey, The Phenomena of Fluid Motions. Reading, USA, Addison-Wes-ley, 1967.
[103] S. Agland and S.M. Iveson, "The impact of liquid drops on powder bed sur-faces", Proceedings of the 27th Australasian Chemical Engineering Conference(Chemeca 99), Newcastle, Australia, September 1999.
[104] T. Onda, S. Shibuichi, N. Satoh, K. Tsujii, “Super-water-repellent fractal sur-faces,” Langmuir, 12 [9], 2125-2127, 1996.
[105] L. Jiang, Y. Zhao, J. Zhai, "A Lotus-Leaf-like Superhydrophobic Surface: A Po-rous Microsphere/Nanofiber Composite Film Prepared by Electrohydrodyna-mics", Angewandte Chemie International Edition, vol. 43, Issue 33 , Pages 4338- 4341, August 2004.
[106] C. Clanet, C. Béguin, D. Richard, D. Quéré, "Maximal deformation of an impac-ting drop", Journal of Fluid Mechanics, vol. 517, pp. 199-208, October 2004.
[107] M. Toivakka, "Numerical Investigation of Droplet Impact Spreading Spray Coa-ting of Paper", Spring Advanced Coating Fundamentals Symposium, Spring2003.
[108] U. Mock, "Über das Benetzungsverhalten polymermodifizierter Grenzflächen",PhD thesis, Institute of Microsystem Technology (IMTEK), University of Frei-burg, Germany, 2004.
[109] V. Bergeron, D. Quéré, "Water droplets make an impact", PhysicsWorld, vol. 14,pp. 27–31, May 2001
[110] Y. Renardy, S. Popinet, L. Duchemin, M. Renardy, S.Zaleski, C. Josserand, M.A. Drumright-Clarke, D. Richard, C. Clanet, D. Quéré, "Pyramidal and toroidalwater drops after impact on a solid surface", Journal of Fluid Mechanics,vol. 484, pp. 69 - 83, June 2003.
[111] K. S. Birdi, D. T. Vu, and A. Winter, "A study of the evaporation rates of smallwater drops placed on a solid surface", Journal of Physical Chemistry, vol. 93,no. 9, pp. 3702 - 3703, May 4, 1989
- 158 - TOPSPOT: HIGHLY PARALLEL NANOLITER DISPENSING - OPERATING CONDITIONS AND DESIGN RULES
DISSERTATION REMIGIUS NIEKRAWIETZ REFERENCES
[112] H. Park, W. W. Carr, J. Zhu, J. F. Morris, "Single drop impaction on a solid sur-face", AIChE Journal, vol. 49, issue 10 , pp. 2461 - 2471, October 2003
[113] S.S. Yoona, P.E. DesJardin, C. Presser, J.C. Hewson, C.T. Avedisian, "Numeri-cal modeling and experimental measurements of water spray impact and trans-port over a cylinder", International Journal of Multiphase Flow, vol. 32, issue 1,pp. 132-157, January 2006
[114] Microdrop Technologies GmbH, "Energy Balance", http://www.microdrop.de/html/energy_balance.html (27 June 2006)
[115] K.T. Hjelt, G.W. Lubking, M.J. Vellekoop, L.J. van Vliet, L.R. van den Doel, A.Greiner, J.G. Korvink, "Nanoliter droplet behaviour in micromachined wells",Sensors Update 8, Baltes, Henry / Göpel, Wolfgang / Hesse, Joachim (eds.), Wi-ley, 2000, 39-72
[116] R. Niekrawietz, O. Gutmann, C. Steinert, Stefanie Reinbold, H. Sandmaier, B.de Heij, R. Zengerle, M. Daub, "TopSpot Technology - High-Throughput Prin-ting of Microarrays", presented at Statusseminar Chiptechnologie, 26-27 Janua-ry 2004, Frankfurt a.M., German
[117] R. Niekrawietz, W. Honstein, O. Gutmann, B. de Heij, M. Daub and R. Zengerle,"Integrated Process Control for Highly Parallel and Contact-Free MicroarrayPrinting", Proceedings of the 18th IEEE International Conference on MicroElectro Mechanical Systems, MEMS, Miami, USA, 2005, pp. 738-741.
[118] W. Honstein, "Integrierte Prozesskontrolle für TopSpot 4", Diploma thesis, IM-TEK - Institute of Microsystem Technologies, University of Freiburg, 2004.
[119] C. Moosmann, "Evaluation of highly dynamic actuation concepts for DWP andPCR-Slide dispensers", Diploma thesis, IMTEK - Institute of MicrosystemTechnologies, University of Freiburg, 2003.
[120] LaVision GmbH, http://www.LaVision.de, 2005.[121] O. Gutmann, "Production of Custom Microarrays Using a Pressure Driven Na-
noliter Dispenser", PhD thesis, Institute of Microsystem Technology (IMTEK),Laboratory for MEMS Applications, University of Freiburg, Germany, 2006.
[122] E. Scheffler, Statistische Versuchsplanung und -auswertung: Eine Einführungfür Praktiker, 3rd ed., Stuttgart, Germany, Dt. Verlag für Grundstoffindustrie,1997
[123] S. Hu, X. Ren, M. Bachman, C.E. Sims, G. P.Li, N. Allbritton, “Surface Modi-fication of Poly(dimethylsiloxane) Microfluidic Devices by Ultraviolet PolymerGrafting“, Anal.Chem., vol. 74, pp. 4117-4123, 2002
[124] D. Qin, Y. Xia, G. M. Whitesides, “Rapid Prototyping of Complex Structureswith Feature Sizes Larger Than 20 µm“, Adv. Mater., vol. 8, no. 11, pp. 917-919,1996
[125] Dow Corning Corp., Product Information - Sylgard 184 Silicone Elastomer, Ref.no. 10-1204A-01, Dow Corning Corp., Corporate Center, PO Box 994, MidlandMI 48686-0994, USA, www.dowcorning.com, Jun. 1998
TOPSPOT: HIGHLY PARALLEL NANOLITER DISPENSING - OPERATING CONDITIONS AND DESIGN RULES - 159 -

REFERENCES DISSERTATION REMIGIUS NIEKRAWIETZ
[126] Dow Corning Corp., Produkt Information - Sylgard 186 Silikonelastomer, Ref.no. 61-0114F-03, Dow Corning Corp., Corporate Center, PO Box 994, MidlandMI 48686-0994, USA, www.dowcorning.com, Sep. 1999
[127] COSMOSWorks, SolidWorks Corporation, http://www.solidworks.com[128] Aktiv Sensor, Ruhlsdorfer Str.95, Geb.4, D-14532 Stahnsdorf, http://www.ak-
tiv-sensor.de/.[129] Polytec Pt, Polymere Technologien, http://www.polytec-pt.com,2006.[130] Physik Instrumente (PI) GmbH & Co. KG, Auf der Römerstr. 1, D-76228 Karls-
ruhe/Palmbach, Designing with piezoelectric transducers: Nanopositioning Fun-damentals 09/2005, http://www.pi.ws
[131] H. K. Versteeg and M. Malalasekera, An Introduction to Computational FluidDynamics, The Finite Volume Method, Prentice Hall, 1996.
[132] J. D. Anderson, Computational Fluid Dynamics, 1st Edition, McGraw-Hill Sci-ence/Engineering/Math, 1995.
[133] R. W. Johnson, The Handbook of Fluid Dynamics, Heidelberg: Springer Verlag,1998.
[134] H. K. Versteeg and M. Malalasekera, An Introduction to Computational FluidDynamics, The Finite Volume Method, Prentice Hall, 1996.
[135] Hirt, C. W.; Nichols, B. D. Journal of Computational Physics 1981, 39, 201-225.[136] Rider, W. J.; Kothe, D. B.; Mosso, S. J.; Cerutti, J. H.; Hochstein, J. I. Accurate
Solution Algorithms for Incompressible Multiphase Flows. AIAA-95-0699.1994. Presented at the 33rd AIAA Aerospace Science Meeting and Exhibit.
[137] Kothe, D. B.; Rider, W. J. Comments on Modeling Interfacial Flows with Volu-me-of-Fluid Methods. Technical Report LA-UR-94-3384. 1995. Los AlamosNational Laboratory.
[138] CFD-ACE+, ESI CFD, Inc., http://esi-group.com, http://www.cfdrc.com, 2004.[139] Fluent Inc., http://www.fluent.com, 2005.[140] Fluent Inc., Gambit 2.1 Documentation. 2003.[141] O. Gutmann, R. Kuehlewein, S. Reinbold, R. Niekrawietz, C. P. Steinert, B. de
Heij, R. Zengerle, and M. Daub, "Fast and Reliable Protein Microarray Produc-tion by a New Drop-in-Drop Technique", in Proceedings of the InternationalConference on Miniaturized Systems for Chemistry and Life Sciences (µTAS2004), Malmoe, Sweden, Sept. 26 - 30, 2004, pp. 381-383.
[142] J. Frech, HSG-IMIT, Wilhelm Schickard-Strasse 10, 78052 Villingen-Schwen-ningen, Germany, personal communication.
[143] HSG-IMIT, Wilhelm Schickard-Strasse 10, 78052 Villingen-Schwenningen,Germany, internal report.
[144] R. Niekrawietz, K. Hiltmann, Microchannel (Prozessentwicklung und Untersu-chung zur Steigerung der Integrationsdichte hoch paralleler Druckverfahren),Abschlußbericht Arbeitsgemeinschaft industrieller Forschungsvereinigungen(AiF), HSG-IMIT, Wilhelm Schickard-Strasse 10, 78052 Villingen-Schwennin-gen, Germany, Dez. 2005.
- 160 - TOPSPOT: HIGHLY PARALLEL NANOLITER DISPENSING - OPERATING CONDITIONS AND DESIGN RULES

DISSERTATION REMIGIUS NIEKRAWIETZ REFERENCES
USED MATERIALS
[M1] DMSO, Dimethylsulfoxid (CH3)2SO, Sigma-Aldrich Laborchemikalien GmbH,Wunstorferstr. 40, 30926 Seelze, Germany, http://www.sigmaaldrich.com
[M2] Betaine Monohydrate, Sigma-Aldrich Laborchemikalien GmbH, Wunstorferstr.40, 30926 Seelze, Germany, http://www.sigmaaldrich.com
[M3] Glycerol, Acros Organics, Janssen Pharmaceuticalaan 3a, 2440 Geel, Belgium,http://www.acros.com
[M4] PBS buffer, 10x Phosphate Buffered Saline (=1.44 g KH2PO4, 90 g NaCl, 7.95g Na2HPO4-7H2O in 1000ml H2O (deion.)), Invitrogen GmbH, Technologie-park Karlsruhe, Emmy-Noether Strasse 10, 76131 Karlsruhe, http://www.invi-trogen.com
[M5] Nonidet P40 Substitute, ionic surfactant, Fluka, Sigma-Aldrich Chemie GmbHIndustriestrasse 25, 9470 Buchs, Switzerland
[M6] Perfluorodecyldimethylchlorosilane, ABCR GmbH & Co. KG, Im Schlehert 10,76187 Karlsruhe, Germany, http://www.abcr.de
[M7] RBS N, non-ionic surfactant (pH 7.0), Carl Roth GmbH + Co. KG, Schoemper-lenstr. 1-5, 76185 Karlsruhe, Germany, http://www.carl-roth.de
[M8] Sylgard 184 silicone elastomer kit, Dow Corning Corp., Corporate Center, POBox 994, Midland MI 48686-0994, USA, http://www.dowcorning.com
[M9] Sylgard 186 silicone elastomer kit, Dow Corning Corp., Corporate Center, POBox 994, Midland MI 48686-0994, USA, http://www.dowcorning.com
[M10]DC 200-50 CST, Dow Corning Corp., Corporate Center, PO Box 994, MidlandMI 48686-0994, USA, http://www.dowcorning.com
[M11]SSC buffer, 20x Sodiumchloride Sodium Citrate, 3.3 M, Invitrogen GmbH,Technologiepark Karlsruhe, Emmy-Noether Strasse 10, 76131 Karlsruhe, http://www.invitrogen.com
[M12]PicoSlidesTM, chemically activated glass substrates for microarray spotting, Pi-coRapid is a spin-off of the “Centre of Applied Gensensorik” (CAG). http://www-user.uni-bremen.de/~picorap/
[M13]ROTH OBJEKTTRäGER 76X26MM, GESCHL./MAT H870.1, Standard-Ob-jektträger Aus Kalk-Natron-Glas, 76 x 26 mm, 1 mm stark, gemäß ISO 8037/1,Carl Roth GmbH + Co. KG, Schoemperlenstr. 3-5, 76185 Karlsruhe, www.carl-roth.de
[M14]PMMA Polymethylmethacrylat, hydrophobic polymer slide, IMTEK, Chair forChemistry & Physics of Interfaces, Georges-Koehler-Allee 103, 79110 Freiburg,Germany, http://www.imtek.de/cpi
[M15]CMT-GAPS 2TM, Amino-modified glass slides, Corning, U.S.A. [M16]GOPS, Epoxy modified glass slides, IMTEK, Chair for Chemistry & Physics of
Interfaces, Georges-Koehler-Allee 103, 79110 Freiburg, Germany, http://www.imtek.de/cpi
TOPSPOT: HIGHLY PARALLEL NANOLITER DISPENSING - OPERATING CONDITIONS AND DESIGN RULES - 161 -

REFERENCES DISSERTATION REMIGIUS NIEKRAWIETZ
[M17]DY-550 NHS-Ester, Dyomics GmbH, Winzerlaer Str.2A, 07745 Jena, Germa-ny, http://www.dyomics.com
[M18]DY-555 NHS-Ester, Dyomics GmbH, Winzerlaer Str.2A, 07745 Jena, Germa-ny, http://www.dyomics.com
USED DEVICES
[D1] Piezo stack type PSt 150/7/80 VS 12, Piezomechanik GmbH, Berg-am-Laim-Str. 64, D-81673 München, http://www.piezomechanik.com
[D2] Hochgeschwindigkeits-Videostroboskop, Typ MOCON-RT, VISIT GmbH &Co. KG, Postfach 6628, D-97016 Würzburg, http://www.visit-gmbh.de
[D3] Stereomikroskop, Typ MZ6, Leica Mikrosysteme Vertrieb GmbH, Lilienstrasse39-45, D-64625 Bensheim, http://www.leica-microsystems.com
[D4] Industrielle Bildverarbeitung NeuroCheck® V5.0, NeuroCheck GmbH, Neckar-straße 76/1, D-71686 Remseck, http://www.neurocheck.de
[D5] BioAnalyzer 4F/4S, LaVision BioTec GmbH, Höfeweg 74, D-33619 Bielefeld,http://www.lavisionbiotec.de
[D6] AVT Dolphin F-201B CCD Camera, Allied Vision Technologies GmbH, Ta-schenweg 2A, D-07646 Stadtroda, http://shop.avt-cameras.com/
[D7] Sonorex Digital Ultraschall Reinigungsgerät DK 102 P, Bandelin electronic,Heinrichstrasse 3-4, D-12207 Berlin, http://www.bandelin.com
[D8] Vakuum Pumpsystem MZ 2C, Vacuubrand GmbH+Co KG, Alfred-Zippe Str. 4,97877 Wertheim, http://www.vacuubrand.de
[D9] Prüfeinrichtung 7206.200;7206.110; Digitales Handprüfgerät 3130.000, ZwickGmbH & Co, August-Nagel-Strasse 11, D-89079 Ulm, http://www.zwick.de
[D10]Laser Doppler Vibrometer, Fiber Interferometer OFV512, Vibrometer Control-ler OFV 3001, Polytek GmbH, Polytek-Platz 1-7, D-76337 Waldbronn, http://www.polytek.de
[D11]Testpoint V4.1, Capital Equipment, 6 Bedford Farms, Bedford, NH 03110,USA, http://cec488.com
[D12]Quartz Kraftmesselement, Typ 9321B, Kistler Instrumente GmbH, Daimler-strasse 6, 73760 Ostfildern, http://www.kistler.com
- 162 - TOPSPOT: HIGHLY PARALLEL NANOLITER DISPENSING - OPERATING CONDITIONS AND DESIGN RULES

DISSERTATION REMIGIUS NIEKRAWIETZ ACKNOWLEDGEMENTS
TOPSPOT: HIGHLY PARALLEL NANOLITER DISPENSING - OPERATING CONDITIONS AND DESIGN RULES - 163 -
ACKNOWLEDGEMENTS
I wish to express my gratitude to Prof. Dr. Roland Zengerle for giving me the excitingpossibility to perform this thesis at his Laboratory for MEMS Applications. In partic-ular his personal commitment in creating and maintaining such an amicable atmo-sphere in his big group of more than 40 people took care, that I enjoyed this time verymuch.Many thanks to Prof. Dr. Hermann Sandmaier for the kind acceptance to co-referee thisthesis.I want to thank Dr. Peter Koltay, Dr. Bas de Heij, Dr. Martina Daub and Prof. Dr. Ro-land Zengerle for being my tutors, for always being available for my questions and sup-porting me whenever any problems occurred. Many thanks to Melanie and Ulrike the helpful spirits of the department.In particular, I wish to express my gratitude to Claudio Cupelli and Timo Lindemannfor being more than just room mates for me.I also want to thank Wolfgang Streule for the private dancing lessons and rescuer forall computer and network problems, Christian Litterst for the easy-going discussionsabout CFD-ACE+. Many thanks to the TopSpot team Stefanie Reinbold, Oliver Gut-mann, Chris Steinert and Horst Holzwarth and Gerhard Birkle for answering any lab-oratory related questions.Further I want to thank the entire staff of the cleanroom service center (RSC) and HSG-IMIT’s cleanroom laboratory for doing a great job in fabrication of the silicon micro-machined TopSpot printheads. Also thanks to Adolf Neurath and SimoneSchwarzwaelder from the workshop of the HSG-IMIT, Villingen-Schwenningen, formanufacturing all the parts I needed in such an accurate, fast and precise manner.I also want to express my gratitude to Waldemar Honstein, Antje Kurowski and Tho-mas Wilath for supporting me at different steps of this thesis.Certainly I want to thank the entire staff of the Laboratory for MEMS Applications forthe friendly atmosphere.For reading the manuscript of my thesis at different stages and giving me a lot ofhelpful suggestions, improvements and corrections, I would like to thank Prof. Dr.Roland Zengerle, Dr. Peter Koltay, Oliver Gutmann, Claudio Cupelli, Janpeter Wolffand Felix Reichert.Last but not least I want to thank my parents Dorothea and Bernhard, my sister Adrianemy aunt Gabriele and uncle Karl and the whole family for supporting and encouragingme through my personal and professional life.I want to express my deepest gratitude to my wife Joanna for all her love and supportthroughout the last years and her patience in the last months in particular.
Copyright © 2022 FDOKUMEN