Tools for monitoring the coverage of integrated public health ...
347
Vaccination and deworming of soil-transmitted helminthiasis Tools for monitoring the coverage of integrated public health interventions
-
Upload
khangminh22 -
Category
Documents
-
view
2 -
download
0
Transcript of Tools for monitoring the coverage of integrated public health ...

Vaccination and dewormingof soil-transmitted helminthiasis
Tools for monitoring the coverage of integrated public health interventions

Tools for monitoring the coverage of integrated public health interventions. Vaccination and deworming of soil-transmitted helminthiasis.
Content: v.1: Conceptual and Methodological Foundations - v.2: Analysis of Administrative Coverage – v.3: Coverage Monitoring in the Field – v.4: Analysis of Data Quality – v.5: Coverage Surveys – v.6: Analysis of Data from Surveys and Electronic Immunization Registries.
ISBN: 978-92-75-11982-2
© Pan American Health Organization 2017
All rights reserved. Publications of the Pan American Health Organization are available on the PAHO website (www.paho.org). Requests for permission to reproduce or translate PAHO Publications should be addressed to the Communications Department through the PAHO website (www.paho.org/permissions).
Suggested citation. Pan American Health Organization. Tools for monitoring the coverage of integrated public health interventions. Vaccination and deworming of soil-transmitted helminthiasis. Washington, D.C.: PAHO; 2017.
Cataloguing-in-Publication (CIP) data. CIP data are available at http://iris.paho.org.
Publications of the Pan American Health Organization enjoy copyright protection in accordance with the provisions of Protocol 2 of the Universal Copyright Convention. The designations employed and the presentation of the material in this publication do not imply the expression of any opinion whatsoever on the part of the Secretariat of the Pan American Health Organization concerning the status of any country, territory, city or area or of its authorities, or concerning the delimitation of its frontiers or boundaries. The mention of specific companies or of certain manufacturers’ products does not imply that they are endorsed or recommended by the Pan American Health Organization in preference to others of a similar nature that are not mentioned. Errors and omissions excepted, the names of proprietary products are distinguished by initial capital letters.
All reasonable precautions have been taken by the Pan American Health Organization to verify the information contained in this publication. However, the published material is being distributed without warranty of any kind, either expressed or implied. The responsibility for the interpretation and use of the material lies with the reader. In no event shall the Pan American Health Organization be liable for damages arising from its use.

Tools for monitoring the coverage of integrated public health interventionsVaccination and dewormingof soil-transmitted helminthiasis
Conceptual and Methodological Foundations
Module 1

Tools for monitoring the coverage of integrated public health interventionsVaccination and dewormingof soil-transmitted helminthiasis
Conceptual and Methodological Foundations
Module 1

4

5
Table ofContents
Tables and figuresAcronymsGlossaryPreface Introduction1. Background2. Objectives
General objectiveSpecific objectives
3. Uses and applications4. Organization of the modules
Unit 1. Integrated intervention strategies1. Intervention strategies
1.1. Vaccination1.2. Deworming of soil-transmitted helminthiasis1.3. Other interventions
2. Opportunities for integration
Unit 2. Methodologies for monitoring coverage1. Basic concepts
What is monitoring?What is supervision?What is evaluation?What is the purpose of monitoring?How are the data obtained, processed, and analyzed for monitoring coverage?
2. Monitoring indicators3. Methodologies for monitoring coverage4. Data triangulation5. To measure or intervene?
References
67812131315
1516 1818182123
2424242424262626283031
34

6
Tablesand Figures
Vaccination strategies based on program objectives.Recommended strategies for controlling soil-transmitted helminth infections in preschool and school-age populations.Characteristics of monitoring, supervision, and evaluation.Characteristics, advantages, and limitations of the methodologies used for monitoring vaccination coverage.Recommendations for applying coverage monitoring tools to integrated public health interventions.
Effect of immunization strategies on the incidence of vaccine-preventable diseases.Types of indicators and their use in monitoring and evaluating health programs.Algorithm for applying coverage monitoring methods to integrated public health interventions.
Table 01. Table 02.
Table 03. Table 04.
Table 05.
Figure 01. Figure 02. Figure 03.

7
Acronyms
BCGDALYsDQADQSDTPEPIESAVIeNVRHep BHibIMCILQASMDAMDGsMMRNIDsOPVPAHOERCPSURMSAGESDHSTHTAGVPD
Bacillus Calmette-Guérin (vaccine)disability-adjusted life yearsdata quality auditdata quality self-assessmentdiphtheria, tetanus, and pertussis (vaccine)Expanded Program on Immunizationevent supposedly attributable to vaccination or immunizationelectronic nominal vaccination registryhepatitis B (vaccine)Haemophilus influenzae type b (vaccine)integrated management of childhood Illnesslot quality assurance samplingmass drug administrationMillennium Development Goalsmeasles, mumps, and rubella (vaccine)neglected infectious diseasesoral polio vaccinePAHO Ethics Review Committeeprimary sampling unitsrapid monitoring Strategic Advisory Group of Experts (on immunization)social determinants of healthsoil-transmitted helminthiasisTechnical Advisory Group (on vaccine-preventable diseases)vaccine-preventable disease

8
Administrative vaccination coverage: Percentage representing the number of administered doses recorded in the registration system divided by the total target population (e.g., children aged <1 year).
Bias or systematic error: Discrepancy between the real value of the variable being studied in the population and the value obtained from the sample. The discrepancy does not result from chance but from errors in selecting study units, collecting data, or other factors. In ecological studies, systematic error refers to an external variable that may distort results. The bias can arise from systematic differences in the groups being compared (selection bias), from the method or procedure of data collection (measurement bias), from the withdrawal or exclusion of subjects in the study (exclusion bias), or from the analysis of results (detection or analytic bias).
Census: Registration of each and every unit in a given population.
Cluster: Collection of units (e.g., houses, communities, or cases) grouped together within clearly defined geographic or administrative boundaries.
Cluster survey: Survey in which the population is divided into clusters or groups of individuals (people or things) that share common characteristics, called observation units. In the study sample, subjects are selected from each cluster.
Confidence interval: Range within which it is expected to find the true value of the sample with an established degree of certainty (e.g., 95% or 99%). The confidence interval represents the probability of random error but not the probability of systematic error or bias.
Confidence level: Probability that the interval created for a statistic captures the parameter’s true value. It is common to use numbers close to 1, such as 0.95 and 0.99.
Control: Restriction or regulation designed to correct or restore the normal status of a situation or event. Applied to a disease, a control measure aims to reduce disease incidence and prevalence to a point where the illness is not a public health problem.
Coverage: In epidemiology, the measurement of the extent to which the services offered meet the potential health needs of a community. Coverage is expressed as a proportion, where the numerator is the number of service units delivered and the denominator is the number that should have been provided.
Deworming round: Distribution of deworming treatments (anthelmintic drugs) to a large group of individuals over a specified time period. A target population can usually be reached in one or two weeks.
Design effect: Variance associated with the selection of subjects for a survey using any method other than simple random sampling. The effect compares the variance of an estimator in a sample design to that obtained by a simple random sample.
Glossary
Administrative coverage (%) = No. of vaccine doses administered x 100Target population

9
Deworming of soil-transmitted helminths: Early and regular administration of deworming drugs (starting at age 1 year, one or two cycles a year for several years) to a population at risk for infection (e.g., children aged 1-14 years, women in the second trimester of pregnancy, agricultural and mining workers, etc.). All references to deworming in these modules refer to the elimination of soil-transmitted helminths.
Dropout rate: Proportion of children who initiate but do not complete the vaccination series. It can be calculated by comparing the number of children vaccinated with DTP1 to the number vaccinated with BCG, or DTP3 to DTP1, or MMR to DTP3.
Effectiveness: Results or benefits of an intervention strategy when applied under real conditions to a population.
Efficacy: Results or benefits of an intervention strategy when applied under ideal conditions to a population.
Efficiency: Results or benefits of an intervention strategy when resources have been used rationally and the cost-outcome ratio is acceptable in a given population.
Elimination (of a disease): Interruption of the endemic transmission of an infectious agent in an area or region.
Endemic disease: Disease or infectious agent constantly present in a specific geographic area or population group, or the habitual prevalence of a given disease in that area or population group.
Epidemic: Cases of a disease, specific behaviors, or other health-related events in a given community or region in larger numbers than expected.
Eradication: Worldwide elimination of an infectious agent.
Evaluation: Set of procedures used to analyze the progress of a program and gather information on the completion and validity of its objectives, activities, cost, results, and impact.
Level of precision: Degree of error or difference that will be accepted in the value obtained from the sample, relative to the real value of the population.
Local level or local area: Smallest administrative unit in a country with governmental organization (e.g., municipality).
Lot: Group of units studied in a lot quality assurance survey. A lot may refer to a specific population (e.g., children in a specific age group) that resides in a given area (e.g., a community assigned to the health facility) or to a set of records for a particular service.
Lot quality assurance sampling (LQAS) or survey: Technique based on the sampling of lots (individual persons or units with shared characteristics, also called observation units) that makes it possible to draw conclusions on the achievement of a program’s coverage goal, either for each lot (groups of individuals) or by summing the weighted results of all lots.
Mass drug administration (MDA): Periodic distribution of drugs to the at-risk population of a region, regardless of individual infection status.
Monitoring: Ongoing process of data measurement and systematic analysis to track the progress of plans and programs. Through information and measurements obtained using standardized and systematic techniques and parameters, health programs may analyze and verify progress and fulfillment of plans and goals on a regular, ongoing, or periodic basis. The objective is to identify achievements and problems, analyze their causes, and immediately implement effective measures to meet program goals.

10
Neglected infectious diseases (NIDs): Group of neglected or “forgotten” infectious diseases, many of which are parasitic. These diseases primarily affect very vulnerable populations, including poor and marginalized communities with less access to health services and especially those living in poverty in remote rural or marginal urban areas.
Non-probabilistic sampling: Sampling method in which selected individuals do not all have the same probability of selection, meaning that results cannot be generalized to the entire population studied, since they are not fully representative.
Population: Group of individuals or elements that share the characteristics of time and place.
Population eligible for deworming treatment: Group of individuals who qualify or are selected to receive deworming treatment in the form of preventive chemotherapy. Eligible populations range from high-risk groups to the entire population of an endemic area. For purposes of these documents, the eligible population in the endemic areas is all preschool- and school-age children.
Population ineligible for deworming treatment: Individuals who do not qualify to receive deworming treatment in the form of preventive chemotherapy, such as those provided for soil-transmitted helminthiasis (STH), lymphatic filariasis, or schistosomiasis. These groups are determined by exclusion criteria based on the safety of the medicine used. Critically ill children and women in the first trimester of pregnancy are considered ineligible for treatment.
Preschool population: Children aged 1-4 years.
Prevalence of infection: Proportion of individuals in a population infected with a given pathogen.
Prevalence of soil-transmitted helminth infections: Proportion of individuals infected with at least one species of soil-transmitted helminths in a population.
Prevention: Set of activities or interventions intended to prevent a given event or stop its spread to a larger nucleus of individuals. Preventive strategies and activities are done to avoid or minimize negative outcomes, such as diseases, disorders, and injuries.
Preventive chemotherapy: Use of a deworming medication alone or in combination with other drugs as a public health tool to combat helminths. Drugs are given early and regularly to reduce the occurrence, spread, and severity of these diseases and their long-term sequelae.
Probabilistic sampling: Sampling method in which all individuals have the same probability of selection, making it possible to determine each individual’s chance of selection. There are four types of probabilistic sampling:
� Stratified random sampling: Random sampling method in which the population is grouped into strata (e.g., geographic regions) that are as internally homogeneous as possible and as heterogeneous as possible with respect to other strata.
� Random cluster sampling: Random sampling method based on clusters, or large numbers of elements in the population, that form natural heterogeneous subgroups and that are relatively similar among themselves.
� Simple random sampling: Random sampling method in which a number is assigned to each individual in the population and a random procedure is used to select subjects (a drawing, random number table, or automatic computer randomization) until the sample size is reached.
� Systematic random sampling: Sampling method in which one individual is selected at random from a previously ordered list of the entire population and then all others are selected at regular intervals until the sample size is reached.

11
Random: Depending on chance. In this document, “random” refers to the method used to generate a randomized sequence, either using a random number table or computer program.
Random error: Deviation from the results or inferences about the truth due only to chance, without any particular pattern. Confidence intervals and p values represent the probability of random errors, not systematic errors (bias).
Representativeness: Quality indicating that the set of observations being analyzed with regard to a particular event, at a given confidence level, represents the real value for the total population studied.
Sample: Group of observation units or research units taken from the total population under study or at risk. The sample may or may not be chosen randomly and may or may not be representative of the study population. Different sampling methods exist, including simple random sampling, stratified sampling, and cluster sampling.
Sample size: Number of individuals in the sample group selected from the population.
Sampling error: Degree of error that researchers are willing to accept for estimates or decisions based on results from the sample. It is also known as the precision of error or margin of error.
Sampling frame: Universe from which the sample is selected. The frame specifies the area or universe (the population, physical environment, or geographic area) containing all the population elements that are the targets of health interventions and serves as the basis or reference for obtaining the sample.
Sanitation: Health promotion strategy intended to prevent the risk of contact with refuse and other waste (e.g., use of installations to dispose of human feces).
School-age population: Children aged 5-14 years, regardless of whether they attend school.
Soil-transmitted helminth infections or soil-transmitted helminthiasis: Parasitic disease acquired by contact with contaminated soil. These modules pertain specifically to helminth infections caused by Ascaris lumbricoides, Trichuris trichiura,
and the hookworms Necator americanus and Ancylostoma duodenale.
Survey: Collection of data on a subset of the universe under study, followed by the use of various data analysis designs and methods to make inferences about the population.
Target population: People in a given sex or age group with specific characteristics that make it possible to apply an intervention strategy-vaccination, deworming, or the administration of supplements.

12 12
To improve the well-being of the population and bridge gaps in health service delivery, it is necessary to guarantee access to various health interventions, including proven strategies such as vaccination and deworming.1 Meeting program coverage goals, however, depends on identifying and reaching target populations. This means, in turn, promoting universal access to health using integrated approaches and a more efficient use of resources. What’s more, health services must adopt monitoring and systematic analysis of coverage as indispensable activities.
Immunization programs in the Americas have extensive experience with the methodologies and tools for monitoring vaccination coverage. Countries have adopted and improved these instruments, adapting them to a range of target populations and epidemiological contexts. Moreover, the accumulative experience gained in the area of vaccine-preventable diseases (VPDs) may be applied to other programs, like deworming, which uses very effective interventions to reduce the burden of disease caused by soil-transmitted helminths.
Registries that generate data on administrative coverage are very useful for helping to control, monitor, and evaluate program evaluation. But the quality of numerators and denominators can affect the quality of coverage data. It is thus important to analyze and interpret administrative coverage indicators correctly, supplementing them with other field methodologies that health teams can use to monitor and evaluate health interventions.
The Pan American Health Organization’s (PAHO) Comprehensive Family Immunization Unit and Regional Program on Neglected Infectious Diseases (NIDs) have highlighted the need to systematize and integrate methods for monitoring coverage of health interventions among preschool- and school-age populations and are offering strategies and opportunities for joint collaboration.
The tools presented in these modules are the result of reviewing and integrating concepts and methodologies that draw on the experiences and lessons learned in countries, with a view towards facilitating joint interventions and monitoring activities under various health programs and platforms.
It is expected that the concepts, methods, and tools in each of the modules will be incorporated into ongoing processes to improve the quality of coverage registries, build capacity in appropriate data analysis, and make timely use of the resulting information for decision-making and the implementation of interventions that provide effective access to health care.
1 In these modules, the term “deworming” refers to the elimination of soil-transmitted helminthiasis (STH).
Preface

13
1. Background
Countries in the Americas have implemented strategies that have made the Region a pioneer in preventing, controlling, and eliminating VPDs. Thanks to these strategies and high vaccination coverage rates, the last case of smallpox in the Americas was confirmed in 1971 and the circulation of poliovirus was interrupted in 1991, leading to the declaration that Region was polio-free in 1994. Endemic circulation of the measles and rubella viruses were interrupted in 2002 and 2009, respectively. Control of diphtheria, whooping cough, and yellow fever in enzootic areas and of invasive disease caused by the Haemophilus influenzae type b (Hib) bacterium has also benefited the population. In addition, countries have introduced new vaccines against rotavirus, pneumococcal disease, and human papillomavirus—further examples of the progress achieved by immunization programs (1).
Still, the Region of the Americas continues to face challenges related to the unfinished agenda, including eliminating neonatal tetanus as a public health problem in Haiti, controlling hepatitis B and seasonal influenza, ensuring that all municipalities maintain coverage levels of ≥95%, and completing the transition from an immunization schedule directed toward children to one targeting the entire family. Overcoming these challenges depends on achieving high and consistently uniform coverage levels for all vaccines recommended for each target population in all geographic areas. Given these challenges, the 50th Directing Council of PAHO, under Resolution CD50.R5, reaffirmed its commitment to strengthening immunization programs in the Americas (2).
At the XVII Meeting of the Technical Advisory Group (TAG) on VPDs, held in Guatemala in July 2006, the group emphasized that:
Efforts to improve the accuracy, consistency, completeness, and timeliness of coverage data should be a top priority of every country. The evaluation of the immunization monitoring system, in terms of these elements, can be performed using different methodologies. For example, the rapid (RM) monitoring recommended by PAHO provides a quick validity check on reported coverage levels and helps direct vaccination activities. The systematic and regular analysis of coverage data provides an opportunity to critically review the reported data to identify, explain, resolve, or correct features of the reporting system that may lead to inaccurate coverage data. Likewise, the assessment of the data on coverage available at the local level should be an integral component of supervisory visits (3).
In 2001, the World Health Assembly, in Resolution WHA54.19, agreed to reduce the global burden of diseases caused by soil-transmitted helminths, specifically Ascaris lumbricoides, Trichuris trichiura, and the hookworms Necator americanus and
Ancylostoma duodenale. To achieve this goal, the World Health Assembly decided that by 2010 the countries should have reached the minimum target of mass administration of preventive chemotherapy to ≥75%, and up to 100%, of all school-age children at risk for STH (4).
To follow up on those agreements and reaffirm the commitment to prevent, control, and eliminate these diseases, in 2009, the PAHO Directing Council urged Member States in Resolution CD49.R19 to “commit themselves to eliminate or reduce neglected diseases and other infections related to poverty for which tools exist, to levels so that these diseases are no longer considered public health problems by 2015” (5). As a result, Member States prioritized identifying vulnerable populations, filling in epidemiological information gaps, and carrying out interventions in at-risk geographic areas in all countries. In 2013, the World
Introduction

14
Health Assembly approved Resolution WHA66.12 (6), urging Member States to expand and implement interventions to reach the goals established in the Global Plan to Combat Neglected Tropical Diseases and to accelerate the work to overcome the global impact of these diseases by 2020, as outlined in the WHO roadmap (7).
Various microorganisms cause neglected infectious diseases (NIDs). In most cases, NIDs are chronic diseases with long-term health effects. Timely and effective treatments of these diseases improve the learning ability of affected children and their chance to generate income and contribute to human capital in their countries (8).
The impact of STH when they are contracted during the most critical periods of the life cycle, such as early childhood, is well known. Persistence of these infections contributes to the onset of health problems, including iron-deficiency anemia, deficiencies in vitamin A and other micronutrients, growth retardation, all types of malnutrition, and the risk of pregnant women delivering low-birthweight babies (9). These organic disorders lead to developmental problems, such as delayed cognitive performance, memory loss, language problems, and difficulties with fine and gross motor skills, which, in turn, impact school performance and result in higher absenteeism and dropout rates (10-14). The prevalence and intensity of STH also significantly impacts a country’s economy. A direct correlation exists between an individual’s years of schooling and eventual income. Thus, the sequelae of childhood parasitosis impact work performance, leading to as much as a 40% loss in productivity (15-16). Because NIDs disproportionately affect impoverished communities with poorer sanitation, the diseases also deepen the cycle of poverty.
Cost-effective interventions, such as deworming drugs, are a feasible option for reducing inequities created by STH. Accordingly, populations living in housing and environmental conditions where limited access to safe water and basic sanitation places them at risk for infection must have access to treatment.
Integrating vaccination strategies into activities to control STH makes it possible to optimize the use of resources and to meet coverage goals. In this regard, Resolution CD49.R19, approved by the PAHO Directing Council in 2009, established the goal of reducing STH prevalence among school-age children in high-risk areas (with a prevalence of >50%) to <20%. Due to the risk for young children, the Directing Council also set a goal to deworm preschool children (8,17,18-20).
At the 28th Pan American Sanitary Conference in September 2012, PAHO Member States, mindful of existing country agreements and the effectiveness of these interventions, endorsed the Strategy and Plan of Action for Integrated Child Health (21), which urges Member States to prioritize the implementation of evidence-based, effective interventions to prevent child morbidity and mortality and achieve optimum social development. These effective, easy-to-apply interventions include deworming, and vaccination, among others.
The integration of activities is an indispensable strategy for improving health conditions, since gaps continue to exist that can be bridged through safe, low-cost, effective interventions. To overcome health disparities, reliable systems must be in place to monitor and evaluate progress towards stated goals. Making these systems work requires guidelines for planning, executing, monitoring, and evaluating interventions using standardized methods that provide up-to-date, quality information for timely decision-making (22).

15
2. Objectives
General objective � Provide a methodology that integrates mutually complementary tools and facilitates the work of health teams in the
management, analysis, and monitoring of vaccination and deworming coverages, as well as other interventions aimed at improving population health, based on decision-making criteria and standardized procedures.
Specific objectives � Monitor vaccination coverage for the regular immunization schedule, as well as coverage of deworming and other priority
interventions at the local, subnational, and national levels. Local teams can implement these activities using rapid, practical tools, with step-wise supervision at different management levels.
� Using an integrated approach, find opportunities to improve data quality in order to lay the basis for increasing vaccination and deworming coverage. Using these findings, conduct integrated interventions to meet program coverage goals.
3. Uses and applications
These modules are for health teams at all levels. The modules contain easy-to-apply methodologies and tools for the systematic analysis of administrative coverages, including field studies. Countries are encouraged to use these methods at the local, subnational, and national levels to monitor coverage of different interventions, both as part of routine programs and campaigns.
A fundamental feature of these modules is that the tools and methodologies can be used rapidly and at relatively low cost without the assistance of statisticians or information systems professionals. The first step is learning about administrative data and some practical techniques for analyzing data quality and appropriately using the information. When more complex tools are needed, the modules provide the decision criteria, requirements, and steps necessary to conduct field studies.
Integrating the work of various childhood health service programs is a cross-cutting feature of these modules, and it is expected that they will facilitate monitoring coverage of immunization and deworming drug schedules among target populations of these interventions: children aged <1 year, preschool children, and school-age children. Integration also assists in detecting barriers in accessing health services and provides evidence for decision-making and the implementation of high-impact interventions.
Application of these modules does not mean that all activities under different programs must be integrated. At minimum, the target populations must be the same for each intervention and their joint implementation must be feasible. The modules offer recommendations and tools to facilitate integration. In this regard, the Expanded Program on Immunization (EPI) provides a service delivery platform that promotes increased coverage and access to interventions based on integrated modalities. Just the same, the NID program is ultimately responsible for STH control and all the tasks that this responsibility entails (including deworming).
4. Organization of the modules
The methodologies are grouped into six modules, each consisting of units that cover the individual steps in the process, along with instructions on the sequential application of the tools. For training purposes, a workbook is available with exercises for both facilitators and students, supplemented with PowerPoint® and Excel® presentations on data collection and report preparation. Each module’s content is summarized below.

16
Module 1 Conceptual and methodological bases
Introduction Presents background information on the importance of systematizing tools for monitoring coverage of integrated public health interventions. Introduces modules and explains their target audiences, uses and applications, and the organization of their content.
Unit 1: Integrated intervention
strategies
Describes intervention strategies, including prevention, control, elimination, or eradication, used to improve the health of preschool and school-age children through vaccination and deworming activities. Highlights opportunities for integration.
Unit 2: Methodologies
for monitoring coverage
Develops basic concepts of coverage monitoring and indicators used in health programs for preschool and school-age children. Reviews methods most frequently used for monitoring coverage, noting advantages and limitations. Presents general concepts on data triangulation and the general algorithm for monitoring coverage of integrated public health interventions.
Module 2 Analysis of administrative coverage
Unit 1: Administrative
vaccination coverage
Lists the steps of analyzing administrative vaccination coverage, including how to collect and organize data, the analysis process, dissemination of results, and decision-making. For each step, introduces the available tools, including those used for determining coverage, the quality of the data that make up numerators and denominators, and immunization service quality. Concludes with a simple proposal for analyzing, interpreting, and applying results to decision-making.
Unit 2: Administrative
coverage of deworming for
soil-transmitted helminth
infections
Describes the steps of analyzing administrative deworming coverage. Presents recommended tools for tracking coverage and assessing the quality of data in the denominator and numerator at each step of the analysis. Includes algorithms and criteria for identifying populations that need deworming as well as a proposal for decision-making and analyzing and interpreting results.
Module 3 Monitoring coverage in the field
Unit 1: Rapid monitoring
house-to-house
Reviews experiences and best practices developed by health teams in applying rapid monitoring to vaccination. Through integrated activities, systematizes this tool for application to monitor vaccination and deworming interventions. Describes the steps involved in conducting rapid monitoring house to house (RM), including establishing the intervention plan.
Unit 2: Coverage monitoring
in schools
Describes each step in monitoring the coverage of school-based health programs. Includes concepts and tools to monitor sentinel sites in schools.

17
Module 4 Analysis of data quality
Unit 1: Data quality Applies the data quality self-assessment (DQS) methodology to the coverage monitoring system based on a review of vaccination cards (health cards), registries, reports, files, demographic data, interviews, analyses, and other information sources, following which recommendations are made to improve data accuracy, timeliness and integrity of reporting, and quality of the coverage monitoring system. Describes abbreviated methodological options for analyzing quality of vaccination and deworming program data, to be used later during supervisory program visits and supervision of campaigns.
Module 5 Coverage surveys
Unit 1: Before starting a
coverage survey
Presents a series of questions and answers to consider before conducting a coverage survey, as well as basic criteria for choosing the most appropriate methodology, taking into account the survey’s objectives and intended results.
Unit 2: Conducting coverage
surveys
Describes each step of conducting a coverage survey using the two most common methods: cluster sampling and lot quality assurance sampling (LQAS). Offers methodological, ethical, and operational considerations to be remembered during surveys in order to ensure high-quality results and their appropriate use in decision-making.
Module 6 Analysis of survey data and nominal registries
Unit 1: Analysis of survey data
and nominal registries
Outlines the steps of analyzing data from surveys and electronic nominal vaccination registries (eNVRs), including elements related to the analysis plan and strategy. Explains the verification of data quality, application of descriptive analysis and data modeling tools, and correct interpretation of results.

18
1. Intervention strategies
Public health interventions are designed based on their intended purposes. Strategies for reaching target populations, surveillance modalities for particular events, and coverage levels must therefore all be based on the goals of public health programs. Control strategies are used to reduce the incidence or mortality of a given disease. To achieve disease control, prevention activities are used to reduce risk factors and disease morbidity. Intervention measures aim to eliminate diseases by interrupting circulation of the causative agent, or even eradicating it, if global elimination is the goal (23-24).
1.1. VaccinationDue to their mechanism of action and ability to provide long-term protection, vaccines make it possible to eliminate or eradicate certain diseases. In addition to protecting individual patients, vaccines create a herd effect, indirectly protecting the entire population when coverage is high.
But the possibility of eliminating a disease also depends on the effectiveness and duration of the immunity achieved by each type of vaccine. For example, polio, measles, and rubella vaccines can interrupt the circulation of these viruses and, assuming that global immunity is achieved, may lead to disease eradication. Conversely, the effectiveness of the tetanus and whooping cough vaccines declines over time, and booster doses are needed to maintain immunity. The purpose of administering these latter vaccines is thus to reduce disease incidence and mortality.
To achieve the intended benefits of immunization strategies, countries must maintain high coverage levels in cohorts of newborns and target populations, per the recommended immunization schedule. If the required level of coverage is not achieved, the unvaccinated population will increase, and there will not be sufficient immunity to interrupt transmission of the infectious agent. Accordingly, preventing the susceptible population from increasing and maintaining uniform coverage levels everywhere are key strategies.
Unit 1.IntegratedInterventionStrategies
Public health interventions can predict, control, and even eliminate or eradicate diseases, depending on the availability of appropriate technologies and evidence of their effectiveness. To achieve the desired impact, countries must understand the purposes and scope of interventions, such that programs can align the objectives of these interventions with effective population recruitment strategies to maintain sustainable coverage goals over time.

19
Apart from the type of illness and cost-benefit considerations, knowledge about vaccine characteristics has made it possible to set goals to eliminate certain diseases, including poliomyelitis, measles, and rubella. For other diseases, like tetanus and whooping cough, strategies are intended to prevent outbreaks and to reduce disease incidence, severity, and lethality.
Figure 1 shows the long-term, sustained effect of vaccination strategies for some VPDs.
Figure 1. Effect of immunization strategies on the incidence of vaccine-preventable diseases
Measles Elimination
Control of Diphtheria and Pertussis
Polio Eradication
Rubella Elimination
Pertussis Diphtheria Coverage
78 80 82 84 86 88 90 92 94 96 98 00 02 04 06 08 10 12 14
Confi
rmed
cas
es (t
hous
ands
)
Routine infant vaccination coverage (%)
100
80
60
40
20
0
300,000
250,000
200,000
150,000
100,000
50,000
080 81 82 83 85 87 89 91 93 95 97 99 01 03 05 07 09 1184 86 88 90 92 94 96 98 00 02 04 06 08 10 12 13 14 15
Cases Coverage
Catch-up campaigns
Follow-up campaigns
Num
ber o
f cas
es Coverage (%)
100
80
60
40
20
0
140,000
120,000
100,000
80,000
60,000
40,000
20,000
0
Num
ber o
f cas
es Coverage (%)
Num
ber o
f cas
es Coverage (%)
100
90
80
70
60
50
40
30
20
10
0
7000
6000
5000
4000
3000
2000
1000
070 72 74 76 80 84 88 92 96 00 04 08 1278 82 86 90 94 98 02 06 10 14
Cases Coverage
Type 1 vaccine derived virus in 2000 and 2001: 21 cases
100
80
60
40
20
0
140,000
120,000
100,000
80,000
60,000
40,000
20,000
0
Cases Routine coverage
82 83 85 87 89 91 93 95 97 99 01 03 05 07 09 1184 86 88 90 92 94 96 98 00 02 04 06 08 10 12 13 14 15
Acceleration Campaign
Num
ber o
f cas
es Coverage (%)
Num
ber o
f cas
es Coverage (%)
100
90
80
70
60
50
40
30
20
10
0
7000
6000
5000
4000
3000
2000
1000
070 72 74 76 80 84 88 92 96 00 04 08 1278 82 86 90 94 98 02 06 10 14
Cases Coverage
Type 1 vaccine derived virus in 2000 and 2001: 21 cases
100
80
60
40
20
0
140,000
120,000
100,000
80,000
60,000
40,000
20,000
0
Cases Routine coverage
82 83 85 87 89 91 93 95 97 99 01 03 05 07 09 1184 86 88 90 92 94 96 98 00 02 04 06 08 10 12 13 14 15
Acceleration Campaign
Source: PAHO/WHO, based on country data provided by the countries
High, uniform, and sustained coverage levels are needed to maintain achievements and facethe challenge of preventing and eliminating vaccine-preventable diseases.

20
Regardless of the disease, the recommended minimum immunization coverage is 95% for each vaccine in the schedule. To sustain this level of coverage, the EPI uses various strategies, including routine immunization, vaccination days to capture unimmunized populations, and mass campaigns to increase the population’s immunity.
To reach their target populations, the EPI relies on a combination of ways to offer services, including immunization in health facilities, from house to house, in schools and workplaces, on the street to passersby, in local gathering places, etc. (Table 1). The choice of strategy depends on the characteristics of the target group.
Table 1. Vaccination strategies based on program objectives
Strategy Objective Description
Ongoing Reach and vaccinate 100% of the population per the EPI schedule
The strategy consists of administering vaccines in the national schedule on all working days throughout the year, taking advantage of all opportunities within health services. Although the strategy prioritizes vaccination in health services, it also includes vaccination in the community by brigades going house to house and in institutions such as schools or workplaces in order to reach unvaccinated populations and achieve uniform coverage of ≥95%.
Intensive Achieve high vaccination coverage in a short time
Special campaigns involve extramural activities, including brigades to immunize people in their homes. Activities also include capturing target populations in institutions and at vaccination posts in local gathering places. To improve access, health facilities can increase communication efforts and extend regular working hours.
Emerging cases Interrupt or avoid transmission of an infectious agent in at-risk areas in the presence of a suspected or confirmed case
Community vaccination brigades are mobilized to go house to house. Fixed posts are established using tactics of population microconcentrations, and vaccines are administered in institutions located near at-risk populations. Heath units promote vaccination, intensify communication efforts, and extend working hours. Vaccination is combined with active surveillance to find suspected cases in at-risk areas.

21
1.2. Deworming of soil-transmitted helminthiasis One NID in Resolution CD49.R19 of PAHO’s Directing Council is STH. The most prevalent soil-transmitted helminths with the greatest impact on the population are Ascaris lumbricoides, Trichuris trichiura, and the hookworms Ancylostoma duodenale
and Necator americanus. These parasites are treated with the drugs albendazole and mebendazole, which have similar mechanisms of action and optimal efficacy profiles if administered on a regular basis (25-28).
The populations most vulnerable to parasitic infections live in rural areas or poverty belts on the outskirts of large cities. If the prevalence and intensity of these infections are not reduced, they will continue to be a factor in widening social gaps. Prevention and control of these poverty-related illnesses require an integrated multi-disease approach based on multisectoral efforts, combined initiatives, and cost-effective interventions to reduce their impact on the health, social, and economic well-being of people in all countries.
According to 2015 PAHO/WHO estimates, 45 million children 1 to 14 years old were in need of preventive chemotherapy.
STH prevention and control programs aim to reduce the parasitic burden and keep it low. To this end, countries use integrated control activities, such as deworming (Table 2). Deworming is the periodic mass drug administration (MDA) to the entire population at risk for STH in a region, regardless of individual status of infection. As a public health measure, deworming can be accomplished via various mechanisms, including drug administration from house to house, at mobile or fixed posts, in schools, in children’s homes, or at places where community members gather, such as markets or fairs. MDA is part of the preventive chemotherapy strategy to combat NIDs. Deworming drugs are given early and periodically, either alone or in combination with other strategies (29).
Table 2. Recommended control strategies STH in preschool and school-age population
Riskcategory
Baseline prevalence of any STH
Control strategy
Preventive chemotherapyAdditional
interventions
High-risk area ≥50% Treatment of all preschool and school-age
children (enrolled or not) twice a year a Improve water supply and sanitation
Implement health education strategies
Low-risk area ≥20 and < 50% Treatment of all preschool and school-age
children (enrolled or not) once a year
<20% Individual treatment b
a If resources are available and prevalence is close to the upper limit, health programs may wish to consider a third round of treatment. If so, treatment should be given every 4 months. b When the prevalence of any STH is <20%, large-scale preventive chemotherapy interventions are not recommended.
Sources: World Health Organization. Preventive chemotherapy in human helminthiasis: Coordinated use of anthelminthic drugs in control interventions; A manual for health professionals and programme managers. Geneva: WHO; 2006 (33); World Health Organization. Helminth control in school-age children: A guide for managers of control programmes. 2nd ed. Geneva; 2011 (30).

22
The goal of deworming is population-based. As sanitary conditions directly relate to persistence of the transmission cycle of soil-transmitted helminths, >75% coverage must be achieved to reduce the probability of reinfection in populations who live in areas with makeshift housing (dirt floors) and who have limited access to safe water and basic sanitation.
When the baseline prevalence of STH in a community is >20%, mass deworming should be provided to at-risk groups: children aged 1-14 years, women of childbearing age, women in the first trimester of pregnancy, and workers at risk for infection (e.g., farmers and miners).
Drugs should be registered regularly and repeatedly, depending on the prevalence of STH in the community. When access to safe water, basic sanitation, adequate housing, or footwear, among other factors, does not improve in the community, conditions for reinfection persist. As a result, repeating the treatment ensures that the intensity of the infection remains low and that everyone, and particularly children, continues to have opportunities to grow and learn.
Although the global coverage goal for deworming in these populations is ≥75%, countries in the Americas should strive to reach 95% coverage. In some countries, deworming is part of a joint strategy with the EPI. Because the deworming program and EPI serve the same populations, these programs can join forces to achieve the same coverage levels.
Children aged <15 years are most likely to suffer illness from STH. Consequently, several strategies have been developed to distribute deworming drugs to this population. It is recommended that countries use a combination of these strategies to provide MDA to at-risk population groups, depending on the particular situation in each community. The WHO has adopted measures for controlling STH according to baseline prevalence (Table 2) (31).
Regular deworming treatment can be offered during special health days, through school health programs, or as part of supplementation programs for preschool children. Schools are an ideal entry point for deworming activities and may also provide education on health and hygiene.
The frequency of MDA of deworming drugs can be determined by the prevalence detected in the impact assessment. For example, in population groups that have received preventive chemotherapy for five to six consecutive years with coverages ≥75%, the intervention is based on the following guidelines:
� If the prevalence is <1%, preventive chemotherapy is not required. � If the prevalence is 1-10%, preventive chemotherapy should be given every two years. � If the prevalence is 10-20%, preventive chemotherapy should be given once a year. � If the prevalence is 20-50%, preventive chemotherapy should continue to be administered on the same schedule as before. � If the prevalence is >50%, preventive chemotherapy should be provided three times a year.

23
1.3. Other interventions Based on the health situation analysis in each community, countries should identify opportunities to integrate strategies and interventions. These opportunities are not limited to vaccination and deworming activities. They may include prevention and timely treatment of malaria and dengue in endemic areas, application of short-course directly observed treatment of tuberculosis, care of persons with HIV/AIDS, monitoring child growth and development, supplementary feeding programs, timely access to diagnosis and treatment of childhood illnesses (e.g., diarrhea and respiratory infections), and the promotion of proper nutrition.
One concrete example of an opportunity for integration are programs to monitor child growth and development, which include periodic health center visits by families and children as well as community activities to promote comprehensive care. Community programs typically involve delivering food to populations at risk for or diagnosed with malnutrition.
When children visit health services, healthcare workers should provide information and recommendations to improve program coverage. Although giving vaccines, supplements, and deworming drugs may be contraindicated when children are sick, health workers should always take advantage of opportunities to provide information to the child’s parents and other family members. These conversations raise the population’s awareness, provide health education, give the family an opportunity to ask questions, and offer parents the chance to have their concerns and needs addressed.
2. Opportunities for integration
Integration of primary care activities provides improved access to health services in terms of both timeliness and quality. This is true for both services given directly in health care facilities and those offered outside the institution (home visits, field activities, etc.). Integrative approaches have numerous advantages: they create opportunities to intervene at every contact between health workers and families; they help to detect and resolve problems in accessing health services; they provide information and education; they offer timely treatment; and they promote simple practices that foster growth, proper nutrition, and child development.
Integrating vaccination and deworming activities makes for a better use of resources and increased efficiency, not only because collaboration facilitates access but also because it improves the information needed for monitoring and evaluation. Additionally, extramural activities done during RCV in at-risk communities may identify people who have not visited health services or were not reached by previous interventions.
The same local health teams usually conduct these health interventions, and often the activities are already done in an integrated fashion, since such collaboration is natural in local areas. One way to facilitate or formalize integration is by unifying the records of different health programs, thereby reducing paperwork and duplication of information.
In encouraging integration of different programs, health programs should consider such factors as age of the target populations in each program, complementarity of the capture mechanisms, frequency of the interventions, productive capacity and infrastructure, human and logistic resources, available budget and supplies, possibility of using information systems and indicators for integrated monitoring, political support, community acceptance, and the capacity for program mobilization.
This section has described a few ways to facilitate integration through joint activities and working platforms. More information on opportunities for integration can be found in PAHO guidelines developed for this purpose: http://www.paho.org/hq/index.php?option=com_docman&task=doc_download&Itemid=&gid=29804&lang=es (32).

24
1. Basic concepts
What is monitoring?Monitoring is a management and supervisory tool for following, observing, and controlling the progress of programs and the achievement of their goals. By using standardized techniques and parameters to obtain information, monitoring may be done on a regular, ongoing, or periodic basis.
What is supervision?Supervision is a periodic process of technical assistance done on site to gather information on the achievements and difficulties that have arisen during the course of work and to analyze the progress of activities and the fulfillment of goals and work plans. Supervision aims to introduce corrective or complementary measures in order to achieve objectives and goals and improve program and service performance.
What is evaluation?In the field of health, evaluation is the process of analyzing an entire service or program by using a set of methods and procedures to better understand different aspects of the service. These aspects include the target population’s access to the service, quality and user satisfaction, efficient use of resources, fulfillment of objectives, and the effect of interventions on disease incidence and mortality.
Table 3 provides additional details on supervision, monitoring, and evaluation.
Unit 2.MethodologiesFor MonitoringCoverage
Various methodologies are used for monitoring coverage, ranging from data registries to determine
administrative coverage to surveys of varying degrees of complexity. Health teams should understand
the basic concepts, characteristics, and purposes of these tools, so that they can rigorously follow
the methodologies and ensure that the results support decision-making.

25
Table 3. Characteristics of monitoring, supervision, and evaluation
Characteristic Monitoring Supervision Evaluation
Definition Ongoing process of measuring and systematically analyzing data to track program plans and progress
Process of onsite technical assistance to improve program performance
Overall analysis of the program or service using various tools at specific stages in the process
Objectives Identify achievements and problems, analyze their causes, and apply effective measures for obtaining desired results
Strengthen the technical capacity of personnel and improve their performance
Determine whether the program is meeting goals in terms of access, quality, effectiveness, efficiency, and the impact of interventions
Methodology Data collection and creation of indicators that are regularly analyzed to assess progress toward achieving objectives and goals
Scheduled field visits in which trained personnel apply standardized tools
Set of methods and procedures used at specific stages to analyze access, service quality, user satisfaction, resource utilization, and the objectives and effect of interventions, among other aspects
Periodicity Ongoing data analysis and decision-making
Periodic visits at short intervals Periodic assessment at specific stages of the program or service
Uses and applications
To make decisions based on progress toward achieving goals and objectives
To adopt and enhance corrective measures and encourage best practices for achieving goals and objectives
To determine whether results, objectives, and goals have been achieved in order to learn from experiences and make decisions to improve the effectiveness and efficiency of the program or service

26
What is the purpose of monitoring?Monitoring is done to identify achievements and problems, analyze their causes, and adopt effective measures to obtain the intended results. Coverage is monitored to determine the proportion of the target population that a program has reached and to identify reasons why some individuals cannot access health services. Based on these findings, health teams may modify strategies and interventions to achieve target coverage levels.
How are the data obtained, processed, and analyzed for monitoring coverage?Monitoring indicators are created based on data gathered during the delivery of everyday health services, which are then used to develop standardized predefined indicators. A good monitoring system requires high-quality data. Consequently, every step in the process of collecting, verifying, systematizing, analyzing, and disseminating the data must meet the highest standards of quality, such that the dataset serves its main function—i.e., to contribute to knowledge.
The construction of an indicator can be a simple or complex process, ranging from merely measuring an intervention’s outcome in absolute numbers (e.g., counting the number of vaccines or deworming drugs administered) to calculating proportions, ratios, rates, or more complex outcomes (e.g., comparative dropout rates for different vaccine doses, such as DTP1 and DTP3).
Coverage monitoring also uses methodologies that require fieldwork to complement and confirm the quality of administrative data reported by health services.
2. Monitoring indicators
A health indicator is a summary measure of information related to a given state of health or performance of the health system. Analyzed together, indicators help to characterize and monitor the health of a population.
The quality of an indicator depends on the coherence of its numerator and denominator. Indicators must meet conditions of integrity—i.e., data should be free of omissions and errors, such that the resulting values are coherent, plausible, and internally consistent (33). A coverage indicator should have the following qualities:
� Reliability: The data are measured and collected consistently, using standardized protocols and procedures. � Congruence (plausibility): The data bear a logical relationship to the target coverage. � Completeness: The data are exhaustive without omissions. � Specificity: The indicator reflects only changes in coverage pertaining to the situation or condition under evaluation. � Integrity: The process of collecting and analyzing data and creating a report is entirely free of bias and manipulation. � Timeliness: Information is available and up-to-date whenever needed. � Accuracy: If repeated, the values obtained from two measurements are very similar. � Reproducibility (reliability): Similar and repeatable results are obtained from calculations done by different people, under
different circumstances, and at different times. � Sensitivity: Fluctuations and changes can be detected based on the variables of person, time, and place. � Validity: The data should yield a value that measures what the investigators intended to measure, with controlled biases
and minimal errors.
Different types of indicators are used for different purposes. As displayed in Figure 2, they may measure and monitor variables in a process, such as the availability of supplies and resources (process indicators), or determine the effect of an intervention

27
Figure 2. Types of indicators and their use in monitoring and evaluating health programs
Source: Adapted from: World Health Organization. Monitoring drug coverage for preventive chemotherapy. Geneva; 2010.
(impact indicators). If developed to monitor activities, they are called performance indicators, since they measure the extent to which the intervention reached the target population.
A coverage indicator is the proportion of the population that needs the intervention and actually receives it.The coverage indicator has:
� A numerator: Number of people who receive the intervention. � A denominator: Total population that should receive the intervention.
Coverage indicators are disaggregated by age groups and geographic areas, since programs need to make comparisons based on these variables to ensure that people can access the intervention under evaluation. In creating indicators, health programs should use various data sources to establish the denominator, such as censuses, projections, surveys, and population estimates.
� Prevalence of the infectious agent
� Morbidity � Mortality � Disabilit
Evaluates whether the intended effect of the intervention and the health program was achieved
� Coverage
Determines whether the target population intended to be captured was reached and receive the intervention
� Policy � Financing � Logistics � Manuals � Training � Others
Determines whether the program has the needed resources, supplies, and capacity to adequately conduct the operation
Impact indicatorsPerformance indicatorsProcess indicators

28
3. Methodologies for monitoring coverage
Administrative coverage. The reliability of administrative coverage data depends on the availability of population numerators and denominators that accurately reflect the real situation, even in the smallest areas. As an example, some countries use birth records to estimate coverage of children aged <1 year; however, these data may contain errors for many reasons, including lack of coverage of home births and how quickly birth certificates are issued. Field coverage. Administrative records on vaccinated individuals are more problematic in countries that have less access to and poorer quality health services. Because the EPI is aware that administrative information systems and population denominators may contain errors and biases limiting their validity, the program should use various strategies to monitor immunization coverage in the field, including RCV, LQAS, and cluster sampling surveys (34-37).
Surveys. Surveys generate useful information for evaluating health programs. However, they are expensive and require specialized personnel. Additionally, it takes time for the results to become available, and surveys often are not representative at the local level, even though local results are immediately needed for decision-making.
Different survey designs have been used in vaccination programs, such as cluster sampling. In cluster sampling, the first step is to divide the population into groups, or clusters, of individuals who reside within clearly established geographic or administrative boundaries. The study team then selects subjects from each cluster and establishes acceptable confidence levels and margins of error.
The choice of analytic tools and strategies should be based on solid technical and statistical criteria. Methods should be simple enough for health workers without formal training in statistics or epidemiology to understand.
In addition to estimating vaccination coverage, the tools should help to identify problems related to access. It should be remembered that analysis of the monitoring results is intended for decision-making and the implementation of interventions to capture groups that have been excluded from these activities.
Table 4 outlines the methodologies most frequently used to monitor vaccination coverage and summarizes their advantages and limitations.

29
Table 4. Characteristics, advantages, and limitations of methodologies used to monitor vaccination coverage
Methodology Characteristics Advantages Limitations
Coverage based on administrative registries
� The numerator is the reported number of persons vaccinated; the denominator is the official population estimate.
� May or may not be nominal.
� Provides periodic information to monitor coverage progress.
� Provides standardized coverage information for each type of vaccine based on time, place, and person.
� Depending on data quality, both numerators and denominators can over- or underestimate coverage.
� Numerators can be affected by inaccurate recording of the place of residence or by inclusion of migrant populations that were not considered in the program’s total target population.
� If revaccinated people are registered and the registry is not nominal, coverage will be overestimated.
� Official demographic data may contain errors or biases.
Rapid monitoring of vaccination, house to house
� Provides a rapid assessment of the proportion of people vaccinated in a small, conveniently selected area.
� Used as supervisory tool.
� Offers a simple, low-cost tool that provides information immediately.
� Performed by the local health team under the supervision of other levels, thereby promoting evaluation of program performance and service improvement.
� The data obtained are not representative of the area evaluated; they cannot be aggregated; and they do not allow statistical inferences about the coverage.
� If children in the homes visited had a greater probability of being vaccinated or if many homes were excluded because they did not have information or did not participate in rapid monitoring, results may give the false impression that the entire population in the study area is well vaccinated.
Lot quality assurance sampling
� Randomly selects lots that are relatively internally uniform.
� Establishes minimum and maximum values as acceptance criteria.
� The data collection tools are relatively simple.
� Shows the relative uniformity of coverage among lots.
� It is not necessary to have information on all lots to make decisions; specific measurements are taken for each lot as soon as results are available.
� Does not estimate coverage of each lot; only indicates if the lot met acceptance criteria.
� By establishing a minimum value for deciding whether or not to accept the lot, there is a risk of concluding that lots above that cutoff point do not need interventions. Thus, lots meeting acceptance criteria must also be analyzed.
� For high margins of acceptance (e.g., 95% coverage) and narrow ranges of acceptability, the sample size must be large. LQAS has the same limitations in cost and logistics as cluster surveys.

30
Methodology Characteristics Advantages Limitations
Immunization coverage cluster survey
� The sampling design is probabilistic, with random selection of the population, allowing for statistical inferences.
� Directly measures coverage of the population universe.
� Allows for the compilation of information on a larger number of variables by using more extensive forms than those used in RCV.
� Requires detailed planning and organization and specialized professionals, resources, and logistics.
� Requires a greater investment of time and resources for data entry, processing, tabulation, and analysis.
� Unlike LQAS, the cluster survey does not allow for conclusions to be drawn for every cluster in the sample. Estimates are interpreted by summing data from all sampling units.
� Biases may affect results.
4. Data triangulation
To respond efficiently and meet goals, program coverages must be measured as accurately as possible. Since data for calculating coverage come from different sources and are obtained using various methods, they are only approximations of the real value. Consequently, the study team may find it useful to analyze the data in combination or through triangulation.
Triangulation compares different data, theories, contexts, tools, agents, and methodologies. The technique brings together the perspectives of various researchers either diachronically or synchronically, making it possible to observe a single object of study from different angles or points in time. The application of triangulation techniques to the analysis and monitoring of coverage helps to confirm results and detect incongruencies that should be addressed, such that the analysis better aligns with geographic and demographic realities.
There are four types of triangulation methods.
� Data triangulation compares different information sources to approximate the most reliable value for the event. This method is very useful for analyzing coverage because it detects discrepancies in data sources obtained via different collection methods.
� Person triangulation compares data from informants at different levels: individuals, small groups, or broader communities. The dataset of one source is used to validate data from other sources.
� Analysis triangulation uses data from two or more estimates to validate the analysis of a single dataset. The technique involves comparing results of the data analysis using quantitative and qualitative tests.
� Temporal triangulation confirms data congruence at different points in time. The data may represent a longitudinal trend over the years or a cross-section of a specific population at a given point.
Triangulation methods can be complex, but teams may also compare data using simpler procedures. One option is to identify discrepancies in coverage data from different management levels and compare coverages to obtain the best estimate, while highlighting opportunities to improve information systems. Further details on the four triangulation methods can be found in the bibliography (38-39).

31
5. To measure or intervene?
Coverage monitoring is based on the analysis of administrative data. However, if doubts arise about results, field studies may be needed to determine if administrative coverage data are valid, account for changes or gaps in coverage trends, determine coverage in the area, and identify the reasons given for not receiving the intervention. If figures are really lower than expected in the area under evaluation, field studies may also be needed to guide activities to increase coverage.
Tools for conducting field studies are described in detail in Module 3, along with RCV studies conducted in schools and from house to house.
In coverage monitoring, health programs must recognize limitations in data quality. Since good decisions depend on valid information, quality analysis and ongoing improvement must be incorporated into the process. Module 4 explains the tools that can be used in this process.
To obtain more realistic figures on the coverage of communities, countries may wish to conduct more complex field studies, such as surveys with different methodologies, sampling designs, and data analysis. Module 5 presents the LQAS technique and provides recommendations on conducting coverage surveys.
In summary, coverage monitoring of public health interventions should lead to decisions that make it possible to maintain high, uniform coverage based on quality data. The following questions should be answered:
� Based on administrative data, is the estimated coverage high and uniform? � Did the target population receive the intervention? � Are the data reliable (high quality)? � Are probabilistic studies needed to estimate coverage?
Figure 3 outlines the analysis and decision-making processes. Along with the recommendations in Table 5, this algorithm serves as the basis for the coverage monitoring tools and procedures described in the upcoming modules.

32
Figure 3. Algorithm for applying methods to monitor coverage of integrated public health interventions
Verif
y th
e qu
ality
of t
he d
ata
Verif
y th
at th
e ta
rget
pop
ulat
ion
rece
ived
the
inte
rven
tion
Verif
y th
at th
e co
vera
ge b
ased
on
adm
inis
trat
ive
data
is h
igh
and
hom
ogen
eous
Estim
ate
the
leve
l of c
over
age
base
d on
pro
babi
listic
stu
dies
Cove
rage
su
rvey
s
Evalu
ate
data
co
ngru
ence
an
d th
e qu
ality
of
the
infor
mat
ion
syst
em
(brie
f DQ
A)
Evalu
ate
the
quali
ty
of th
e da
ta
(com
plet
e DQ
A/DQ
S)
If po
pulat
ion
is
scho
ol
age-
child
ren
(5 to
14
year
s)
If po
pulat
ion
is pr
esch
ool
child
ren
(und
er 5
ye
ars)
Lot q
uality
as
sura
nce
sam
pling
Evalu
ate
data
co
ngru
ence
(su
pervi
sion)
ANAL
YSIS
OF
ADM
INIS
TRAT
TIVE
CO
VERA
GE
COVE
RAG
E M
ONI
TORI
NGIN
THE
FIE
LDAN
ALYS
IS O
FTH
E DA
TA Q
UALI
TYCO
VERA
GE
SURV
EYS
OBJECTIVES
Anal
yze
the
cove
rage
indi
cato
rsby
per
son,
tim
e, a
nd p
lace
, as
wel
l as
the
qual
ity in
dica
tors
fo
r the
vac
cina
tion
serv
ice
(dro
pout
rate
and
oth
er c
riter
ia)
Mon
itor t
o ke
ep c
over
age
high
and
hom
ogen
eous
Syst
emat
ic, o
ngoi
ng n
on-p
roba
bilis
tic a
naly
sis
of a
dmin
istr
ativ
e da
ta
obta
ined
per
iodi
cally
or f
rom
rapi
d st
udie
s in
the
field
pro
bab
ilist
ic c
ove
rag
e st
udie
s
TOOLS
Do R
CMin
sch
ools
Do R
CMdo
or to
doo
r

33
Table 5. Recommendations for applying coverage monitoring tools to integrated public health interventions
Which tool? When to apply? How often? At what level?
Analysis of administrative coverage
Before finalizing the quarterly coverage report
During monthly monitoring and upon creating the annual coverage report
National, subnational, and local
RCV in the field During supervisory activities, intensive interventions such as campaigns or national health days, or outbreak-control activities
At least twice a year as a regular practice in health services and following interventions like campaigns or mop-ups
Subnational and local
Analysis of data quality
Complete method—duringnational or international program evaluations
Every 3-5 years* National and international
Abbreviated method—after concluding the report on regular program coverage or following a campaign
At least once a year at the national level and some subnational levels. Initially every 3-6 months at the subnational and local levels. If there is evidence that data quality has improved, reduce to once a year. Upon completion of campaigns.
National, subnational, and local
Analysis of data congruence (supervision)
During supervisory activities; some questions will be included in the supervision checklist
National, subnational, and local
Coverage surveys
Integrated as a component of program evaluation or public health research
Based on country need National
* Interval and the frequency depend on the country’s resources, ability to apply the tool, and performance in terms of data coverage and quality.

34
1. Pan American Health Organization, Directing Council, 51st Meeting. Immunization: Challenges and Outlook Washington DC: PAHO; 2011. (Document CD51/INF/5, p.2 ff.) [Consulted on 2014 Feb 11]. Available from: http://www.paho.org/hq/index.php?option=com_docman&task=doc_download& gid=14314
2. Pan American Health Organization, Directing Council, 50th Meeting. Resolution CD50.R5 (2010). Strengthening immunization programs. Washington DC: PAHO; 2010. [Consulted on 2014 Feb 11]. Available from: http://www2.paho.org/hq/dmdo &cuments/2010/CD50.R5-e.pdf
3. Pan American Health Organization. Protecting the health of the Americas: Moving from child to family immunization. 17th Meeting of the Technical Advisory Group on Vaccine-preventable Diseases. Guatemala City, Guatemala, 2006 July 25-27. Available from: http://www2.paho.org/hq/dmdocuments/2009/tag17_2006_FinalReport_Eng.pdf
4. World Health Organization, World Health Assembly, 54th session. Resolution WHA54.19 (2001). Schistosomiasis and soil-transmitted helminth infections. Geneva: WHO; 2001. [Consulted on 2014 Jul 12]. Available from: http://www.who.int/neglected_diseases/mediacentre/WHA_54.19_Eng.pdf?ua=1
5. Pan American Health Organization, Directing Council, 49th Meeting. Resolution CD49.R19 (2009). Elimination of neglected diseases and other poverty-related infections. Washington DC, PAHO; 2009. [Consulted on 2014 Feb 11]. Available from: http://iris.paho.org/xmlui/bitstream/handle/123456789/399/CD49.R19%20%28Eng.%29.pdf?sequence=1&isAllowed=y
6. World Health Organization, World Health Assembly, 66th session. Resolution WHA66.12 (2014). Neglected tropical diseases. Geneva, WHO: 2013 [Consulted on 2014 Feb 10]. Available from: http://www.who.int/neglected_diseases/mediacentre/WHA_66.12_Eng.pdf
7. World Health Organization. Accelerating work to overcome the global impact of neglected tropical diseases – A roadmap for implementation. Geneva: WHO; 2012. [Consulted on 2015 Jun 27]. Available from: http://www.who.int/neglected_diseases/NTD_RoadMap_2012_Fullversion.pdf
8. Pan American Health Organization. Control and elimination of five neglected diseases in Latin America and the Caribbean, 2010-2015: Analysis of progress, priorities, and lines of action for lymphatic filariasis, schistosomiasis, onchocerciasis, trachoma, and soil-transmitted helminth infections. Washington DC: PAHO; 2010. Available from: http://www1.paho.org/hq/dmdocuments/2010/Prioritization_NTD_PAHO_Dec_17_2010_En.pdf
9. Christian P, Khatry SK, West KP Jr. Antenatal anthelmintic treatment, birthweight, and infant survival in rural Nepal. Lancet. 2004;(364):981-3.
10. Ault S, Nicholls R, Saboya M, Gyorkos T. Workshop on integrated deworming intervention into preschool child packages in the Americas, Report; 2011 Mar 24-25; Washington DC: PAHO and McGill University; 2011. Available from: http://new.paho.org/hq/index.php?option=com_docman&task=doc_view&gid=15254&Itemid
11. Pan American Health Organization. Final report: Consultation Meeting on a Trust Fund for the Prevention, Control, and Elimination of Neglected and Other Infectious Diseases in Latin America and the Caribbean. Washington DC, 2008 Dec 15-16} Washington DC: PAHO; 2008. Available from: http://www2.paho.org/hq/dmdocuments/2009/nds_trust_fund_final_rpt.pdf
12. Montresor A, Crompton DWT, Lobby A, Bundy DAP, Savioli L. Guidelines for the evaluation of soil-transmitted helminthiasis and schistosomiasis at community level. Trans R Soc Trop Med and Hyg. 1998;92(4):470-/1. Available from: http://whqlibdoc.who.int/hq/1998/who_ctd_sip_98.1.pdf
13. Oberhelman RA, Guerrero ES, Fernández ML, Silio M, Mercado D, Comiskey N, et al. Correlations between intestinal parasitosis, physical growth, and psychomotor development among infants and children from rural Nicaragua. Am J Trop Med Hyg. 1998;58(4):470-5.
References

35
14. Jasti A, Ojha SC, Singh YI. Mental and behavioral effects of parasitic infections: A review. Nepal Med Coll J. 2007;9(1):506.15. Guyatt H. Do intestinal nematodes affect productivity in adulthood? Parasitol Tod. 2000;16(4):153-8.16. World Health Organization. First WHO report on neglected tropical diseases: Working to overcome the
global impact of neglected tropical diseases. Geneva: WHO; 2010. Available from: http://whqlibdoc.who.int/publications/2010/9789241564090_eng.pdf
17. World Health Organization. Technical updates of the guidelines on the integrated management of childhood illness (IMCI): Evidence and recommendations for further adaptations. Geneva: WHO; 2005. Available from: http://whqlibdoc.who.int/publications/2005/9241593482.pdf?ua=1
18. Mumtaz S, Siddiqui H, Ashfaq T. Frequency and risk factors for intestinal parasitic infection in children under five years of age at to tertiary care hospital in Karachi. J Pak Med Assoc. 2008;59(4):216-9.
19. World Health Organization. Report on the WHO Informal Consultation on the use of praziquantel during pregnancy/lactation and albendazole/mebendazole in children under 24 months; 2002 Apr 8-9; Geneva: WHO, 2003 (WHO/CDS/SPC/PVC/2002.4). Available from: http://whqlibdoc.who.int/hq/2003/WHO_CDS_CPE_PVC_2002.4.pdf
20. Webb E, Mawa P, Ndibazza J, Kizito D, Namatovu A, Lugemwa J, et al. Effect of single-dose anthelmintic treatment during pregnancy on an infant’s response to immunization and on susceptibility to infectious diseases in infancy: A randomised, double-blind, placebo-controlled trial. Lancet. 2011;377:52-62.
21. Pan American Health Organization, Pan American Sanitary Conference, 28th Meeting. Resolution CSP28.R20 (2010). Strategy and Plan of Action Integrated Childhood Health. Washington DC: PAHO; 2010. [Consulted on 2014 Feb 11]. Available from: http://iris.paho.org/xmlui/bitstream/handle/123456789/3695/CSP28.R20-e.pdf?sequence=1&isAllowed=y
22. Pan American Health Organization. Monitoring child development (0-6 years) in the IMCI context. 2nd ed. Washington DC: PAHO; Mar 2012. Available from: http://www.paho.org/Hq/index.php?option=com_docman&task=doc_view&gid=17042&Itemid=
23. Organización Panamericana de la Salud. Módulos de principios de epidemiología para el control de enfermedades. 2nd ed. Washington DC: PAHO; 2002.http://www.paho.org/guy/index.php?option=com_content&view=frontpage&limitstart=30
24. Pan American Health Organization. Health indicators: Building blocks for health situation analysis. Epidemiol Bull. 2001;22(4):1-5. Available from: http://www.who.int/management/district/assessment/HealthIndicatorsBuildingBlocksHealthSituationAnalysis.pdf
25. Keiser J, Utzinger J. Efficacy of current drugs against soil-transmitted helminth infections: Systematic review and meta-analysis. JAMA. 2008;299:1937-48.
26. Albonico M, et al. Comparison of Kato-Katz thick smear and McMaster egg counting method for monitoring drug efficacy against soil-transmitted helminths in school children of Pemba Island, Tanzania. Trans R Soc Trop Med and Hyg. 2012;106:199-201.
27. Vercruysse J, et al. Assessment of the anthelmintic efficacy of albendazole in school children in seven countries where soil-transmitted helminths are endemic. PLoS Neglected Tropical Diseases, 2011;5:e948.
28. World Health Organization. Prevention and control of schistosomiasis and soil-transmitted helminthiasis: Report of a WHO Expert Committee. Geneva: WHO; 2002. WHO Technical Report Series 912. Available from: http://whqlibdoc.who.int/trs/WHO_TRS_912.pdf
29. World Health Organization. Monitoring drug coverage for preventive chemotherapy. Geneva: WHO; 2010. [consulted 2014 Feb 11]. Available from: http://whqlibdoc.who.int/publications/2010/9789241599993_eng.pdf
30. World Health Organization. Preventive chemotherapy in human helminthiasis: Coordinated use of anthelminthic drugs in control interventions; A manual for health professionals and programme managers. Geneva: WHO; 2006. Available from: http://whqlibdoc.who.int/publications/2006/9241547103_eng.pdf?ua=1
31. World Health Organization. Helminth control in school-age children: A guide for managers of control programmes. 2nd ed. Geneva: WHO; 2002. Available from: http://whqlibdoc.who.int/publications/2011/9789241548267_eng.pdf
32. Pan American Health Organization. Operational Guidelines for the Implementation of Deworming Activities: A Contribution to the Control of Soil-Transmitted Helminth Infections in Latin America and the Caribbean. Washington, DC : PAHO, 2015.

36
Available from: http://www.paho.org/hq/index.php?option=com_topics&view=article&id=419&Itemid=4100133. Ware J, Brook R, Davies A, Lohr K. Choosing measures of health status for individuals in general populations. AJPH.
1981;71(6):620-5.34. Dietz V, Venczel L, Izurieta H, Stroh G, Zell ER, Monterroso E,Tambini G. Assessing and monitoring vaccination coverage
levels: Lessons from the Americas. Pan Am J Public Health. 2004;16:432-42.35. World Health Organization. Immunization coverage cluster survey: Reference manual. Geneva: WHO; 2005. Available from: http://
whqlibdoc.who.int/hq/2005/who_ivb_04.23.pdf36. Tawfik Y, Hoque S, Mizan Siddiqi M. Using lot quality assurance sampling to improve immunization coverage in
Bangladesh. Bull World Health Org. 2001;79:501-5.37. World Health Organization. Monitoring immunization services using the lot quality technique. Geneva: WHO; 1996. Available
from: http://apps.who.int/iris/bitstream/10665/63177/2/WHO_VRD_TRAM_96.01.pdf?ua=138. Rodríguez C, Pozo T, Gutiérrez J. La triangulación analítica como recurso para la validación de estudios de encuesta
recurrentes e investigaciones de réplica en educación superior. Relieve. 2006;12(2):289-305.39. Denzin NK. Strategies of multiple triangulation; The Research Act: A theoretical introduction to sociological methods. 3rd ed.
Englewood Cliffs, NJ: Prentice-Hall; 1989.

Tools for monitoring the coverage of integrated public health interventionsVaccination and dewormingof soil-transmitted helminthiasis
Analysis of AdministrativeCoverage
Module 2

Tools for monitoring the coverage of integrated public health interventionsVaccination and dewormingof soil-transmitted helminthiasis
Analysis of AdministrativeCoverage
Module 2

4
Tables and figuresIntroduction
Unit 1. Administrative vaccination coverage
Step 1: Data collection and organization1.1. Definition of target populations1.2. Coverage indicators1.3. Data recording1.4. Tools for data presentation
Step 2: Data analysis2.1. Coverage
2.1.1. Person2.1.2. Time2.1.3. Place
2.2. Analysis of numerators and denominators 2.2.1. Numerators2.2.2. Denominators
2.3. Quality of the vaccination service 2.3.1. Access2.3.2. Dropout rate2.3.3. Simultaneity2.3.4. Timeliness2.3.5. Completion of the series
2.4. Interpretation of results2.4.1. Search for explanations2.4.2. Prioritization of risk areas
Step 3: Dissemination of results3.1. Report preparation3.2. Discussion of results
68
11
1213131416
2021212224272729373738394041424244
444445
Table ofContents

5
Step 4: Decision-making4.1. Definition of strategies4.2. Plan of action
Unit 2. Deworming coverage of soil-transmitted helminth infections
Step 1: Data collection and organization1.1. Defining target populations1.2. Coverage indicators1.3. Recording data1.4. Data presentation tools
Step 2: Data analysis2.1. Coverage
2.1.1. Person2.1.2. Time2.1.3. Place
2.2. Analysis of numerators and denominators2.2.1. Numerators 2.2.2. Denominators
2.3. Quality of the deworming service2.3.1. Access2.3.2. Integration2.3.3. Dropout rate
2.4. Interpretation of results2.4.1. Search for explanations2.4.2. Prioritization of risk areas
Step 3: Dissemination of results3.1. Preparation of the report3.2. Discussion of results
Step 4: Decision-making4.1. Definition of strategies4.2. Plan of action
References
464646
47
4848505153 535454555659616263636364666667
686869
707071
72

6
Roles coverage monitoring team members, by management level.Indicators for monitoring vaccination coverage.Example of data presentation in tabular form: MMR1 coverage (%), by health area.Municipalities and number of children in the target population, by percentage of vaccination coverage.Criteria for prioritizing municipalities based on vaccination coverage, by risk.Interpretation and decision-making based on the analysis of administrative vaccination coverage.Indicators for monitoring deworming coverage.Coverage monitoring: Nominal registry for monitoring the administration of deworming drugs for soil-transmitted helminths.Coverage of deworming round for soil-transmitted helminths (%), preschool children in at-risk areas, 2012.Interpretation of discrepancies and incongruities in the percentages of deworming coverage.Criteria for prioritizing at-risk areas based on deworming coverage levels.Interpretation and decision-making based on the analysis of administrative deworming coverage.
Algorithm for analyzing administrative coverage of integrated public health interventions.Types of registry: Nominal and consolidated.Health card for registering and verifying completion of the vaccination series.Vaccination coverage against measles, mumps and rubella, (MMR%) and uniformity, by municipality, country A, 2013.Monthly monitoring of vaccination coverage.Vaccination coverage (%), by age and vaccine type, 2012.Vaccination coverage (%), by year and vaccine type, country A, 2008-2012.Estimated cohorts not vaccinated with MMR1, children aged <15 years.Vaccination coverage (%), by area and coverage level, municipality A, 2012.Municipalities by vaccination coverage (%), by year, country A, 2008-2012.DTP1 and DTP3 doses administered, by year, country A, 2008-2012.Correlation between vaccine doses received in the health unit and doses administered to the target population.Population size used as the denominator for vaccination coverage, by age and department, country A, 2012.Population denominators by data source and relationship to census data, by year, country A, 2000-2012.Correlation between number of registered births and census figures for children aged <1 year, by municipality, country A, 2012.
Table 01. Table 02.Table 03. Table 04. Table 05. Table 06. Table 07.Table 08.
Table 09. Table 10. Table 11. Table 12.
Figure 01.Figure 02. Figure 03. Figure 04.
Figure 05. Figure 06. Figure 07.Figure 08. Figure 09. Figure 10.Figure 11. Figure 12.
Figure 13.Figure 14. Figure 15.
6
Tablesand Figures

7
Vaccination coverage (%) based on different information sources for the denominator, by type of vaccine.Administrative coverage (%) of DTP3, population denominator, and doses of DTP1 and DTP3 administered, by year, country A, 2005-2012.Pentavalent 3 vaccination coverage (%), by municipality and year, country A, 2008-2012.Effect of a 10% error in the target population (denominator) on the coverage calculation.DTP1 coverage (%) by municipality, country A, 2012.Dropout rates (%) for DTP1, DTP2, and DTP3, by year, country A, 2005-2012.Simultaneity (%) in the administration of pentavalent 1 and 2, polio, and rotavirus vaccine, country A, 2013.Capture of dropouts (pentavalent 3 vaccine), by birth and age cohort, country A, 2008-2011.Correlation between pentavalent 3 vaccination and number of live births, by municipality, country ACorrelation of pentavalent 3 coverage with the Social Development Index, by municipality.Algorithm for defining target populations and deworming strategies of soil-transmitted helminthiasis.Coverage monitoring: Consolidated registry for monitoring administration of deworming drugs. Deworming coverage for soil-transmitted helminths (%) in at-risk areas, by age group and sex, country A, 2012.Coverage with first and second doses of deworming drugs (%) for preschoolers in at-risk areas, by year, country A, 2008-2012.At-risk areas (%) achieving at least 95% deworming coverage in the annual rounds, by year, country A, 2008-2012.Deworming coverage for soil-transmitted helminthiasis (%), by coverage level and municipality, country A, 2012.Deworming coverage for soil-transmitted helminths (%), denominator and doses of preventive chemotherapy administered, by year, country A, 2005-2012.Correlation between deworming drugs provided to health facilities and drugs administered to the target population.Correlation between number of school-age children in the school census and official estimates of the school-age population.Deworming coverage for soil-transmitted helminths (%) in at-risk areas, by municipality, country A, 2012.Integration index for the MMR vaccination and deworming strategies, country A, 2012 and 2013 rounds.Deworming coverage (%) and changes in the dropout rate for deworming, by year, 2005-2012.Coverage of deworming rounds (%), by year and type of at-risk area, country A, 2010-2012.Correlation between MMR and deworming coverage rates (%) in children aged 1 year in at-risk areas.
Figure 16. Figure 17.
Figure 18.Figure 19. Figure 20. Figure 21.Figure 22. Figure 23. Figure 24.Figure 25. Figure 26. Figure 27.Figure 28.
Figure 29.
Figure 30.
Figure 31. Figure 32.
Figure 33.
Figure 34.
Figure 35. Figure 36. Figure 37. Figure 38. Figure 39.
7

8
The goal of monitoring administrative vaccination coverages is to determine if target levels have been achieved. If not, countries should implement interventions to improve coverage, keeping levels high and uniform while ensuring high-quality data (Figure 1).
Figure 1. Algorithm for analyzing administrative coverage of integrated public health interventions
Keep coverage high and homogeneous
Systematic, ongoing non-probabilistic analysis of administrative data obtained periodically or from rapid studies in the field
Analyze the results of administrative coverage
Coverage low, ununiform, or higher than 100%
Analysis of possible causes
Interventions based on the problems detected
Coverage high and uniform
Introduction
Verify that the coverage based on administrative data is high and homogeneous
Analyze the coverage indicators by person, time, and place, as well as the quality indicators for the vaccination
service (dropout rate and other criteria)
ANALYSIS OF ADMINISTRATIVE COVERAGE
OBJ
ECTI
VES
TOO
LSR
ESU
LTS
DEC
ISIO
NS

9
As part of this process, monitoring teams collect and analyze data and make decisions regarding the daily activities of health services. But they must also do fieldwork, carrying out activities in communities, schools, and other establishments. Table 1 describes the roles of monitoring team members by management level.
Table 1. Roles of coverage monitoring team members, by management level
Management level Function
Local � Collect data on the target population using various strategies (routine health services, deworming rounds, campaigns, mop-ups, etc.).
� Ensure proper registries.* � Calculate and analyze coverages and ensure quality of coverage indicators. � Create and share regular, uniform coverage indicators with local teams and higher management
levels. � Identify delays and barriers to access among target populations and implement corresponding
corrective measures. � Conduct regular monitoring activities in the field, using proper scheduling and evidence-based
decision-making. � Coordinate with local institutions and leaders to promote their involvement in monitoring
strategies and scheduled activities.
Subnational � Collect and integrate local-level information into the process for monitoring goals. � Analyze coverage trends and identify delays and disparities at the local level. � Conduct regular supervision, control, and evaluation activities of local coverage. � Identify program shortcomings, such as training needs and the flow and management of
supplies, and provide support to resolve these areas of weakness. � Based on the coverage analysis, identify gaps, errors, or biases in local data. � Establish strategies and interventions to reduce inequities in access to health services.
National � Establish the monitoring guidelines, methodology, tools, and registry system to be used at all levels.
� Ensure that all management levels have trained their personnel and have sufficient supplies, human resources, and financing to monitor coverage and to enlist private sector participation.
� Guarantee timely supervision, control, and coverage evaluation at the subnational level. � Facilitate the exchange of information, knowledge, experiences, and lessons learned among
different management levels. � Perform due diligence with high-ranking authorities in health and other sectors, such
as education, security, and culture, to facilitate the coordination and effectiveness of all interventions.
� Prepare reports by national stratification levels and disseminate findings to subnational and national levels as well as to national and international organizations, including cooperation agencies.
* Many countries have nominal registries at the operational level for monitoring individual vaccination status, as well as active capture systems. To ensure the efficient use of registries, data must be comprehensive and of high quality.

1010
Results of coverage monitoring exercises should be discussed with teams at the local level. These discussions help local teams to assess program performance and to determine how to improve the quality of health services.
If the data indicate that coverage goals have not been met, the study team and health programs must form a plan to redirect activities toward achieving the desired objectives. If coverage levels have been met, however, the team should analyze the successful strategies and activities, best practices, and lessons learned in order to reinforce and share them in other regions.
There may be problems in administrative data with the precision and accuracy of the numerator and denominator. The study team must therefore determine if coverage data satisfy quality requirements or if additional field studies are needed to verify that the intervention reached the target population. Coverage analysis thus involves using tools to assess both the quality and reach of data.
Coverage data from various sources should be consolidated and submitted for incorporation at the national level and for follow-up at all levels. Consolidated information is essential for monitoring national and subnational goals and for preparing integrated action plans to be overseen by supervisors.
Results of coverage monitoring should be disseminated outside of the health system. They should be shared with other institutions, organizations, and community leaders, so that these stakeholders are informed of coverage progress and can participate in ongoing improvement efforts.
The units in this module describe the recommended steps for analyzing administrative vaccination and deworming coverage. Although the analysis is done for each intervention, health units in countries should seek opportunities to integrate these programs, both during data collection and analysis and via activities to improve access to the interventions.

1111
Administrative vaccination coverage is an essential component of monitoring the target populations of an
immunization program. Programs should systematically evaluate progress indicators on a timely, ongoing
basis, identifying strategies and concrete actions to improve data quality. The tools described here should
make it possible to locate unvaccinated populations and to design strategies for reaching them and
achieving universal coverage.
This unit describes the four steps of analyzing administrative vaccination coverage in children aged <15 years. The tools here can also be applied to other target populations of the Expanded Program on Immunization (EPI). The diagram below summarizes the four steps.
Unit 1.AdministrativeVaccination Coverage
Steps in the analysis of administrative vaccination coverage
Definition of the Target PopulationsCoverage IndicatorsCollecting the DataTools for Presentation of the Data
CoverageAnalysis of the Numerators and DenominatorsQuality of the Vaccination ServiceInterpretation of the Results
Definition of StrategiesPlan of Action
Preparation of the ReportDiscussion of the Results
Collection and Organization of the DataStep 1
Analysis of the DataStep 2
Dissemination of the ResultsStep 3
Decision-makingStep 4

12
Step 1: Data collection and organization
The first step is collecting and organizing data based on the development of coverage indicators that are monitored according to the variables of person, time, and place. Additionally, the team must develop indicators to measure immunization service quality.
Definition of the Target Populations � Children under 1 year old � Preschool children � School-age children
� Person, time, and place � Quality of the monitoring
� Primary
� Consolidated
� Vaccination or health cards � Data tally � Monitoring � Computerized nominal record
� Tables � Figures � Maps
Coverage Indicators
Recording of the Data
Tools for Presentation of the Data
Collection and Organization of the DataStep 1

13
1.1. Definition of target populationsVaccination is a universal public health strategy. Accordingly, official demographic data are used to define target populations—i.e., coverage denominators. This practice reflects the Expanded Program on Immunization’s (EPI) fundamental purpose, which is to implement setting-appropriate capture measures that identify and reach unvaccinated populations, thereby reducing dropout rates from the scheduled series and avoiding missed opportunities for vaccination. Although these goals are generally applicable, immunization strategies sometimes focus on high-risk groups (e.g., influenza vaccine for pregnant women and patients with chronic diseases).
There are technical recommendations to define immunization schedules, as well as established regional and global agreements on program goals. Nevertheless, an individual country’s schedule depends on its policies and epidemiology. It must also be remembered that the EPI’s scope of work now includes not only children but also the entire family. Vaccines should be given all the way from birth to old age.
1.2. Coverage indicatorsTo monitor vaccination goals, the EPI uses indicators to measure coverage for each vaccine in the immunization schedule. For multi-dose vaccines, calculation of coverage has traditionally been based on the first and third doses administered. The denominator has been the country’s official population, according to census estimates and projections. In addition, countries monitor dropout rates—i.e., the percentage of children who received one but not all required doses of a given vaccine—and the proportion of children who received all doses in the series at the age and time recommended in the schedule (Table 2).
Table 2. Indicators for monitoring vaccination coverage*
Indicator Numerator Denominator
Coverage of the basic immunization schedule for children aged 12-23 months
Number of children aged 12-23 months vaccinated with BCG, Polio3, DTP3, HepB3, Hib3, rotavirus2, and pneumo3 (the latter two in countries that include these vaccines in their schedules)
Total children aged 12-23 months
Number of children aged 12-23 months vaccinated with one dose of MMR1
Total children aged 12-23 months
Dropout rate for DTP1-DTP3 in children aged 12-23 months
Number of children aged 12-23 months vaccinated with DTP1 – Number of children aged 12-23 months vaccinated with DTP3
Total children aged 12-23 months given DTP1
Dropout rate for Polio in children aged 12-23 months
Number of children aged 12-23 months vaccinated with Polio1– Number of children aged 12-23 months vaccinated with Polio3
Total children aged 12-23 months given Polio1
Coverage for children aged 2-4 years
Number of children aged 2-4 years vaccinated with BCG, Polio4, DTP4, HepB3, Hib3, MMR, rotavirus2, and pneumo3 (the latter two in countries that include these vaccines in their schedules)
Total children aged 24-59 months

14
Indicator Numerator Denominator
Coverage for school-age children (aged 5-14 years)
Number of children aged 5-14 years vaccinated with BCG, Polio4, DTP5, and HepB3
Total children aged 5-14 years
Number of children aged 5-14 years vaccinated with one or two doses of MMR (MMR1 and MMR2)
Total children aged 5-14 years
Number of children aged 5-14 years with complete vaccination schedules for their age
Total children aged 5-14 years
Percentage of municipalities, by coverage range, that have vaccinated children aged <1 year, 1-4 years, and 5-14 years
Number of municipalities with ≥95%, 80%-94%, and <80% coverage, by coverage range, for each age group
Total number of municipalities
*Information in this table should be adapted to each country’s vaccination schedule. Note: BCG = tuberculosis vaccine; Polio1, Polio3 = Polio vaccine, first and third dose, respectively; DTP1, DTP3, DTP4, DTP5 = vaccines against diphtheria, tetanus and pertussis, first, third, fourth, and fifth dose, respectively; HepB3: hepatitis B vaccine, third dose; pneumo3 = pneumococcal conjugate vaccine, third dose; Hib3 = vaccine against Haemophilus influenzae type b, third dose; MMR1, MMR2 = vaccine against measles, mumps and rubella, first and second dose, respectively.
1.3. Data recordingImmunization registriesMost countries use administrative registries of vaccinated patients as a source to monitor immunization coverage. These registries may be consolidated or nominal.
Consolidated registries group data on vaccinated individuals by a range of variables, such as sex, age group, residence, and health facility that administered the vaccine, but do not show the name of each person vaccinated. Consolidated registries monitor vaccination coverage, with the numerator being the doses administered and the denominator being the census figure corresponding to the target population for the vaccine in question. Information in consolidated registries is usually organized by municipality. Consolidated registries are used in mass vaccination campaigns for record keeping and calculating the number of doses administered (Figure 2).
In contrast, information in nominal registries is organized by individual persons vaccinated. Upon administration, health workers record the patient’s name and the date of each vaccine given. The main advantage of the nominal system is the ability to monitor an individual patient’s vaccination status, so that active capture systems can be implemented to reach people who have not been vaccinated on time.
Nominal registries can be kept on paper, in books, or on individual sheets of paper. Records can also be kept electronically, which requires a database of each person’s name, identification number, place of residence, and information on vaccines and health facilities. Figure 2 shows examples of nominal and consolidated registries.

15
Figure 2. Types of registry: Nominal and consolidated
Photo: Pan American Health Organization.
In most of the Region’s countries, nominal registries are kept on paper and contain the user’s date of birth and address, the day, month, and year of the consultation, and the vaccines and number of doses administered (i.e., daily immunization registries). At higher administrative levels, teams can consolidate the number of persons vaccinated by vaccine and dose (municipal, departmental, or national consolidated registries).
Tickler file for following up on the next doseTickler (or reminder) files are boxes containing copies of vaccination cards, organized by the month when each child is supposed to receive the next dose. When children are vaccinated, health workers update the cards with the vaccines administered and then place the card under the divider for the month corresponding to the child’s next dose. By checking the file at the end of each month, health workers can determine which children did not receive vaccines and take steps to administer pending immunizations.
Vaccination cardIn addition to registries in health centers, the vaccination card, also known as the health card, is used to let parents or guardians know which vaccines their children have and have not received based on their age. The vaccination card serves as the official document that children present to enroll in school and to show that their schedules are complete (e.g., verification during monitoring activities). The card is a comprehensive document with information on other preventative health programs, such as deworming, growth monitoring, child development, and oral health (Figure 3).

16
Figure 3. Health card for registering and verifying completion of the vaccination series
Photo: Pan American Health Organization.
1.4. Tools for data presentationAs shown in the examples below, tables, maps, and figures are prepared to analyze and present coverage data. Although each can be used in any setting, for ease of use, the letter L or N has been inserted in the right upper corner of each table or figure. Those with a L are figures or tables most appropriate for analyzing local coverage and those with a N are recommended for use at the national level.
Table 3 shows an example of coverage data organized by vaccine type, vaccinee age, and geographic area.

17
Table 3. Example of presentation of data in tabular form: MMR1 coverage (%), by health area
Health area Population under 1 year No. of doses of MMR Coverage (%)
Colinas 675 470 70
San Juan 450 250 56
Tres Ríos 500 200 40
Concepción 580 250 43
San Esteban 690 550 80
Naranjal 500 400 80
San Pablo 345 500 145
Total 3 740 2 620 70
Note: MMR1= measles, mumps and rubella vaccine.
Maps help to visualize the extent and variation of coverage using established cutoff points. They also show areas with very low coverage near areas with >100% coverage and help to determine if high-risk areas are in a particular region of the country. The uniformity index is a summary indicator that enhances the map by revealing uneven coverage among different geographic areas (Figure 4).
At-risk areas are more likely to have cases of vaccine-preventable diseases (VPDs). Risk is evaluated based on such conditions as low vaccination coverage and the resulting accumulation of susceptible populations, weak epidemiological surveillance, and proximity to areas experiencing disease outbreaks. In establishing risk, the EPI should also consider other socioeconomic factors, including poverty, population density, mobility, and migratory dynamics.
Another essential tool for monitoring coverage at the operational level is the monthly monitoring graph (Figure 5).
L

18
Figure 4. Vaccination coverage against measles, mumps and rubella (MMR1st dose) (%) and uniformity, by municipality, country A, 2013
≥101
95-100
90-94
80-89
≤80
Coverage (%)
Uniformity: 80%
N

19
Figure 5. Monthly monitoring of vaccination coverage
0
10
20
30
40
50
60
70
80
90
100
PROGRESS JAN FEB MAR APR MAY JUN JUL AUG SEP OCT NOV DEC
Pent
a1
MONTHLY 5 10 8 10
CUMULATIVE 5 15 23 33
IDEAL 8,3 8,3 8,3 8,3 8,3 8,3 8,3 8,3 8,3 8,3 8,3 8,3
Pent
a3
MONTHLY 5 8 9 9
CUMULATIVE 5 13 22 31
IDEAL 8,3 8,3 8,3 8,3 8,3 8,3 8,3 8,3 8,3 8,3 8,3 8,3
Percentage
Health CenterLa Fortuna
Type of VaccinePentavalent 1 and 3
Target PopulationAge: Children < 1 YearNo. of Children: 1000
L
Graphs, such as the one in Figure 5, help to analyze EPI activities and enable health teams to (1): � Set and regularly monitor monthly goals. � Compare progress at different times of the year. � Present the program’s progress to different audiences: health workers, community leaders, and the general population.

20
For universal strategies, such as routine immunization, approximately 8.3% of the children under the responsibility of a given service should be vaccinated each month (100% of children divided by 12 months = 8.3%). At the end of 12 months, 100% of children should have received all vaccines in the schedule. For vaccination to be considered successful, >95% coverage should be achieved. Each month, the program should thus confirm that the monthly target has been reached, and, using this information, identify any corrective measures needed to meet the established goals.
Step 2: Data analysis
In addition to calculating coverage, data analysis involves reviewing numerator and denominator data, assessing service quality, and interpreting results.
Coverage
Analysis of the Numerators and Denominators
Quality of the Vaccination Service
Interpretation of the Results
� Person � Time � Place
� Numerators � Denominators
� Access � Dropout Rate � Simultaneity � Timeliness � Completion of the Series
� Search for Explanations � Prioritization of Risk Areas
Analysis of the DataStep 2

21
2.1. CoverageCoverage indicators for each vaccine, by age group and percentage of the series completed, should be analyzed per the following criteria (2):
� If coverage is 95-100%, both the coverage and immunological protection are considered adequate. � Coverage <95% is lower than expected. In these cases, the team must investigate causes of the low coverage and develop
strategies to protect the population. Coverage may be further analyzed to refine monitoring (i.e., <50%, 50-79%, 80-95%, and 95-100%).
� If coverage is >100%, the team must investigate causes for overestimation. Among other possibilities, the registered population may be smaller than the actual population, children from other health areas may have been vaccinated, or there may be problems in the registry.
2.1.1. PersonDepending on the country’s schedule, the basic indicator for calculating the coverage of each vaccine recommended for children aged <1 year—namely, DTP, Polio, Hib, Hep B, rotavirus, pneumococcus, or others—is the following:
If field studies are conducted among preschool population, the denominator may be the number of children aged 1 year (12-23 months), which makes it possible to determine completion of the basic schedule recommended in the first year of life. The corresponding indicator is calculated as follows:
At age 1 year, children should begin receiving other vaccines, such as MMR and booster doses of the basic series already administered before age <1 year. The indicator for the vaccination of preschool children is:
Completion of the vaccination series for school-aged children is determined as follows:
No. of children given DTP1, DTP3, Polio1, Polio3, Hib3, HepB3 before age 1 yearTotal population aged <1 year
x 100
No. of children given DTP1, DTP3, Polio1, Polio3, HepB3 before Age 1 Year Total population aged 12-23 months
x 100
No. of children aged 2-4 years with complete series for their age Total population aged 2-4 years
x 100
No. of children aged 5-14 years with complete series for their age Total population aged 5-14 years
x 100

22
Figure 6. Vaccination coverage (%), by age and vaccine type, 2012
Note: BCG: tuberculosis vaccine; Penta1: pentavalent vaccine, first dose; Penta4: pentavalent vaccine, fourth dose; Rotavirus1: vaccine against the rotavirus, first dose; Rotavirus2: rotavirus vaccine, second dose; HepB3: hepatitisB vaccine, third dose; pneumo3: conjugate pneumococcal vaccine, third dose; MMR1: measles, mumps and rubella vaccine, first dose.
BCG Penta1 Penta3 HepB3 Rota1 Rota2
BCG Rota2 HepB3 Pneumo3 MMR1 Penta4
Cov
erag
e (%
)C
over
age
(%)
9496929396
89
929596959089100
80
60
40
20
100
80
60
40
20
BCG Penta1 Penta3 HepB3 Rota1 Rota2
BCG Rota2 HepB3 Pneumo3 MMR1 Penta4
Cov
erag
e (%
)C
over
age
(%)
9496929396
89
929596959089100
80
60
40
20
100
80
60
40
20
BCG HepB3 Pneumo 3 Penta4 MMR1 MMR2
BCG Rota2 HepB3 Pneumo3 MMR1 Penta4
Cov
erag
e (%
)C
over
age
(%)
949492939689
989593959792
100
80
60
40
20
100
80
60
40
20
BCG HepB3 Pneumo 3 Penta4 MMR1 MMR2
BCG Rota2 HepB3 Pneumo3 MMR1 Penta4
Cov
erag
e (%
)C
over
age
(%)
949492939689
989593959792
100
80
60
40
20
100
80
60
40
20
The administrative coverage for every vaccine in the schedule is presented for each age group to detect populations that have not met coverage goals (Figure 6).
2.1.2. Time To avoid the accumulation of susceptible individuals, vaccination monitoring must not be limited to analyzing current coverage levels. Accordingly, the study team should review the absolute numbers in the numerators and denominators and coverages from a period of several years. A five-year minimum is recommended (Figure 7).
The immunization of live birth cohorts should be consistent to prevent the accumulation of susceptible groups and create a herd effect. A diagram, such as the one in Figure 8, is helpful for identifying age groups not meeting coverage goals.
Age = <1 year Age = 2 years
Age = 4 years Age = 7 years
PERSON L

23
One way to analyze vaccinated cohorts is with a bar chart, where each bar represents the coverage of a population cohort by birth year. If there is a gap in protection in any age group, cohorts with low coverage will be easily visible (e.g., children aged 10-14 years in Figure 8). This type of analysis helps to identify and to implement the most effective strategies for reaching unvaccinated groups.
Figure 7. Vaccination coverage (%), by year and vaccine type, country A, 2008-2012
Cov
erag
e (%
)
BCG Penta1 Penta3 HepB3 MMR1
Vacc
inat
ed (%
)
Year of birth
100
80
60
40
20
0
Routine vaccination Vaccination campaign
2001 199920022012 2011 2010 2009 2008 2007 2006 2005 2004 2003 2000 1998
100
80
60
40
20
Note: BCG: tuberculosis vaccine; Penta1: pentavalent vaccine, first dose; Penta3: pentavalent vaccine, third dose; HepB3: hepatitisB vaccine, third dose; MMR1: vaccine against measles, mumps and rubella, first dose.
2008 84 98 95 95 932009 82 97 96 96 942010 89 96 95 96 942011 90 97 95 96 962012 91 98 97 97 97
LTIME

24
Figure 8. Estimated cohorts not vaccinated with measles, mumps and rubella1, children aged <15 yearsC
over
age
(%)
BCG Penta1 Penta3 HepB3 MMR1
Vacc
inat
ed (%
)
Year of birth
100
80
60
40
20
0
Routine vaccination Vaccination campaign
2001 199920022012 2011 2010 2009 2008 2007 2006 2005 2004 2003 2000 1998
100
80
60
40
20
2.1.3. PlaceTo achieve herd immunity, population coverage must be high and uniform, so that immunization creates an indirect barrier to prevent circulation of the infectious agent. Monitoring of vaccination coverage thus requires an analysis of geographic areas.
The following indicator determines the proportion of areas or municipalities within the ranges established for monitoring coverage, specifically <50%, 50-79%, 80-94%, 95-100%, and >100%:
Interpretation: At least 95% of municipalities should achieve 95-100% coverage. Due to possible problems in numerators and denominators, however, the data analysis team should consider population size and differences in coverage among adjacent municipalities and border areas, where coverage may be higher or lower depending on the population’s mobility and access to health services. What’s more, low coverage is not the only determinant of infection risk. As a result, the EPI should try to identify municipalities with weak epidemiological surveillance systems, high proportions of households living in poverty, and special population groups (e.g., indigenous or migrant populations) with limited access to health services.
No. of municipalities, by coverage range Total municipalities
x 100
NTIME
Vaccination campaign achieved at least 95% coverage in the population now aged 2-9 years. Population aged 10-14 years had
<80% vaccination coverage. How can the program reach
unvaccinated children?
<95%
rout
ine
vacc
inat
ion
cove
rage
.Ho
w c
an h
ealth
ser
vices
impr
ove
cove
rage
of t
he ta
rget
pop
ulat
ion?

25
To this end, maps are useful tools. Maps make it possible to identify quickly areas with coverage <95%. They also show nearby areas with critical values or areas with very low coverage near those with >100% coverage (Figure 9).
Figure 9. Vaccination coverage (%), by area and coverage level, municipality A, 2012
>100
95-100
80-94
50-79
<50
Coverage (%)
L
What characteristics do areas with <80% coverage have in common?
What conditions account for low coverage in areas with <50% coverage?
PLACE

26
Figure 10. Municipalities by vaccination coverage (%), by year, country A, 2008-2012
One easy-to-use indicator for geographic analyses is the homogeneity index, which shows the percentage of municipalities with 95-100% coverage. The homogeneity index is calculated as follows:
Interpretation: The homogeneity index quantifies the degree of coverage uniformity among municipalities and even smaller geographic areas.
Geographic areas are stratified by coverage level to determine which have consistently high or low coverage, which vary by year, and which show rising or falling trends. Tabulating the coverage by range is essential for adopting measures to focus activities on areas where values are consistently low, and for determining if areas with coverage <80% are decreasing over time (Figure 10).
No. of municipalities with 95-100% vaccination coverage Total municipalities
x 100
Mun
icip
aliti
es b
y co
vera
ge (
%)
100
80
60
40
20
02008 2009 2010 2011 2012
Under 50 50 to 79 80 to 94 95 to 100 Over 100
5
45
30
10105
55
20
10105
60
20
784
73
13
55 2
78
15
50
After identifying municipalities with consistently low coverage, >100% coverage, and fluctuating coverage, the study team must analyze each group to understand the patterns behind the coverage figures. It must be determined if the coverage relates to the quality of the numerator or denominator, or if an unvaccinated population exists that must be reached. For decision-making purposes, the team must determine the number of children in each coverage range (Table 4).
LTIME AND PLACE
Why does the country show a steady rising trend in percentage of municipalities achieving 95% coverage?
Uniformity index (2012) = 78%

27
Vaccine(e.g., DPT3)
A B C D E G F
Coverage (%) Number of municipalitiesnot reporting<50 50-79 80-89 90-94 95-100 >100
Number of municipalities
Number of children <1 year living in these
municipalties
Table 4. Municipalities and number of children in the target population, by percentage of vaccination coverage
2.2. Analysis of numerators and denominators The quality of vaccination coverage indicators depends on the validity of population (denominator) and registry (numerator) data. Either source may be incomplete or have errors or duplications. The Pan American Health Organization’s (PAHO) Technical Advisory Group (TAG) on VPDs has recommended improving the accuracy, coherence, integrity, and timeliness of coverage data within the context of regular immunization activities. All countries should prioritize this task (3). Both the numerator and denominator must meet the following quality criteria:
� Coherence: Data are internally consistent and not contradictory. � Accuracy: Data are recorded correctly. � Validity: The indicator measures what it is intended to measure—i.e., it is not affected by systematic bias.
In analyzing administrative coverage, the team may find discrepancies that suggest problems in data quality. The study team must thus evaluate not only the coverage data but also the absolute numbers in the numerator and denominator, keeping in mind the following points:
� Under- or overestimation of the population: Official estimates may not be accurate. Estimates may be less accurate in smaller geographic areas and areas with significant migration.
� Under- or overestimation of the number of persons vaccinated: People may be registered in a municipality where they do not live, or database errors may exist. Discrepancies may also result from a lack of data on vaccines administered in the private sector.
2.2.1. NumeratorsIn analyzing coverage, the team must evaluate not only the coverage percentage but also the absolute numbers. Reviewing the numbers will show whether discrepancies reflect changes in the denominator or numerator (based on the target population’s access to the intervention) (Figure 11). Of note, errors in the numerator or denominator may also cause significant changes in the coverage percentage.
L

28
Figure 11. DTP1 and DTP3 doses administered, by year, country A, 2005-2012
No.
of d
oses
160,000
140,000
120,000
100,000
80,000
60,000
40,000
20,000
02005 2006 2007 2008 2009 2010 2011 2012
DPT 1 150 249 131 367 143 192 134 080 144 308 139 698 106 558 113 171DPT 3 125 453 123 099 121 060 114 765 119 930 108 531 113 312 113 156
L
Another way to detect possible areas for improvement in the numerator is by comparing vaccine doses received to vaccine doses administered (Figure 12). When the difference is greater than the estimated percentage of loss for the vaccine in question, the waste may have been very high or the doses received may have been fewer than the number administered. These problems relate to the quality of the numerator.
NUMERATOR
Why did a sharp reduction in the number of vaccines administered occur in 2011 and 2012?

29
Figure 12. Correlation between vaccine doses received by the health unit and doses administered to the target population
Dos
es re
ceiv
ed (n
)
Doses administered (n)
8,000
6,000
4,000
2,000
00 2,000 4,000 6,000 8,000
N
Upon detecting data discrepancies, the study team must consider possible explanations. Several approaches can be used. One is to compare the data with other information sources to determine which number is closest to the actual value. Differences between sources should not exceed 10%.
2.2.2. DenominatorsThe team should thoroughly review denominators to calculate coverage of the target populations by geographic area. The following steps are recommended:
� Review the denominator’s data source, considering strengths and limitations. In general, countries use population projections from national censuses. Some countries with good birth records and low infant mortality rates use these records as data sources.
� Analyze data by the size of each municipality (Figure 13). For small populations, small differences in the number of inhabitants (denominator) may cause large differences in coverage. This does not occur in large municipalities.
NUMERATOR
Why were more doses received than
administered?
It is expected to lose up to 10% of the vaccine in multi-dose
presentations and that the health unit will receive more doses than
it actually administers.
What accounts for the difference between 29% received and 31% administered?

30
� Compare different data sources to detect discrepancies. Types of data sources include local population censuses, birth records, vaccination campaign data, BCG and DTP1 doses administered, existing coverage surveys, or records from other health programs (malaria, prenatal care, nutrition, or neonatal screening for congenital diseases). Various tools are used in official registries to estimate the size of the population, and more recent estimates are considered to be more reliable (Figure 14).
Figure 13. Population size used as the denominator to calculate vaccination coverage, by age and department, country A, 2012
San AntonioLimonal
AmazonasBarbudo
ColónBolívar
La FortunaRosario
La VirgenGuerrero
Monte Verde
FlorenciaLa Cascada
El AltoLa Ventana
NaranjalGranada
La PraderaCascajal
Santa MartaHiguerónEl Roble
FloridaSan RoqueSanta AnaSan PedroSan José
20,0000 40,000 60,000
Population
80,000 120,000100,000
Under 1 year 1 year and over
0
LDENOMINATOR

31
Figure 14. Population denominators by data source and relationship to census data, by year, country A, 2000-2012Po
pula
tion
20012000 2002 2003 2004 2005 2006 2007 20102008 2009 2011 2012
80,000
70,000
60,000
50,000
40,000
30,000
20,000
10,000
0
Official denominator BirthsBCG
Census Census
� If the number of registered births is used as the denominator, adjust by subtracting the number of infant deaths. Because migration may affect the denominator, the team should analyze sudden changes in the absolute number of births over time, considering explanations based on the sociodemographic characteristics of the communities under evaluation.
� The number of births may be overestimated if the municipality has a maternity hospital or is located near a border. As a result, newborns may be registered in a municipality that is not the family’s usual place of residence.
� Use a scatter plot to detect values different from those normally expected. A scatter plot helps to visualize data from two sources and to determine the proximity of source data to the line of best fit (Figure 15).
NDENOMINATOR

32
Figure 15. Correlation between number of registered births and census figures for population <1 year, by municipality, country A, 2012
Cen
sus
Registered births
8,000
7,000
6,000
5,000
4,000
3,000
2,000
1,000
0
0 2,0001,000 3,000 5,000 7,0004,000 6,000 8,000
� Differences between sources may fall within the confidence interval. This possibility is particularly important when comparing survey results, and the study team must therefore consider sample designs and confidence intervals.
� If the congruence between the denominators of different sources is >90%, the population data used to calculate the coverage are considered reliable. If not, the team must explain the cause of the difference (Figure 16).
NDENOMINATOR
This municipality is the nation’s capital, but there is only 78% concordance between the census of children aged <1 year and registered births.
What accounts for the discrepancy?

33
Figure 16. Vaccination coverage (%) based on different information sources for the denominator, by type of vaccine
100
80
60
40
20
0BCG Polio1 Polio3 MMR
Estimated population Registered births Coverage survey
9695
70
9595
7075
80
70
96
80
70
Cov
erag
e (%
)
Source
Note: BCG: tuberculosis vaccine; Polio1: polio vaccine, first dose; Polio3: polio vaccine, third dose; MMR: measles, mumps and rubella vaccine.
Data source for denominator Number
Projected population census 90,000
Reported live births 70,000
Sample Sample = 1,000Accuracy level = 10%
In addition to the examination of variations in trends and percentage values, the coverage analysis should include a review of the absolute numbers used for the numerator and denominator at the subnational and national levels (Figures 17 and 18).
NDENOMINATOR
What accounts for differences in the coverage denominators?

34
Figure 17. Administrative coverage (%) of DTP3, population denominator, and doses of DTP1 and DTP3 administered, by year, country A, 2005-2012
160,000
140,000
120,000
100,000
80,000
60,000
40,000
20,000
0
100
80
60
40
20
02005 2006 2007 2008 2009 2010 2011 2012
No.
of d
oses
Cov
erag
e (%
)
L
Coverage (%) 92 81 88 90 89 96 100 94
Dose 1 125 453 123 099 121 060 114 765 119 930 108 531 113 312 113 156
Dose 3 150 249 131 367 143 192 134 080 144 308 139 698 106 558 113 171
Population 138 229 106 407 126 009 120 672 128 434 134 110 106 558 106 381
NUMERATOR AND DENOMINATOR
Why did a sharp reduction in the number of vaccines administered occur in 2011 and 2012?
What accounts for the sharp decline in the denominator population in 2011 and 2012?

35
Figure 18. Pentavalent 3 vaccination coverage (%), by municipality and year, country A, 2008-2012
59
6465
5651
2008 2009 2010 2011 2012
1,200
1,000
800
600
400
200
0
100
80
60
40
20
0
2008 2009 2010 2011 2012
1,8001,6001,4001,2001,000
800600400200
0
85
75
50
77
93
100
80
60
40
20
0
No.
of d
oses
Cov
erag
e (%
)
No.
of d
oses
Cov
erag
e (%
)
No.
of d
oses
Cov
erag
e (%
)
2008 2009 2010 2011 2012
700
600
500
400
300
200
100
0
98100989898
2008 2009 2010 2011 2012
2,500
2,000
1,500
1,000
500
0
10093
8175
66
No.
of d
oses
Cov
erag
e (%
)
100
80
60
40
20
0
100
80
60
40
20
0
As vaccination or deworming coverages increases, the study team must remember that the same percentage of error in a population estimate may conceal a trend in coverage. This is not an intuitive concept, but Figure 19 helps to make it clearer.
Why do some municipalities have consistently low coverage (A) consistently high coverage (B), fluctuating coverage (C),
or progressively increasing coverage (D)?
Are changes in coverage due to variations in the numerator or denominator?
Coverage 51 56 65 64 59
No. of Doses 560 620 700 669 640
Denominator 1100 1110 1080 1050 1090
Coverage 93 77 50 75 85
No. of Doses 1400 1200 700 750 725
Denominator 1500 1550 1400 1000 850
Coverage 98 98 98 100 98
No. of Doses 600 590 585 593 600
Denominator 610 605 600 595 615
Coverage 65 75 81 93 100
No. of Doses 1380 1425 1420 1400 1300
Denominator 2100 1900 1750 1500 1300
NUMERATOR AND DENOMINATOR
Municipality A Municipality B
Municipality C Municipality D
N

36
Denominators for calculating childhood vaccination coverage are usually based on census projections or birth records (remember to adjust these figures for infant mortality to determine the number of infants surviving to age 1 year). Rarely, data from an electronic nominal immunization registry (eNVR) can be used as a denominator. For coverage of pregnant women, the number of births is often used to approximate the number of pregnant women. In these cases, the study team must understand how the data are obtained, how long it takes to finalize the figures for the year, and the percentage of underregistration in each of the country’s regions. This information helps to determine if the data are incomplete.
Figure 19. Effect of a 10% error in the target population (denominator) on the coverage calculation
Cov
erag
e (%
)
Year
100
80
60
40
20
01965 19851975 2005 2015
YearTarget population Coverage
Real Estimated Real Estimated
1970 100 90-110 10 9-11
1980 100 90-110 20 18-22
1990 100 90-110 50 45-56
2000 100 90-110 80 73-89
2010 100 90-110 90 82-100

37
Census projections do not always provide breakdowns by specific ages. For example, projections may give the number of children aged 1-4 years but not the number of children aged 1, 2, 3, and 4 years. Teams should also remember that estimates for smaller geographic areas are often less precise. Furthermore, the longer the time between the projection and previous census, the less likely the projection will be accurate. The EPI and the deworming program must know which institution prepares the specific age estimates and assign denominators to each municipality. In general, demographers in the census and statistical institutes have better tools to make these calculations than do those in the statistics departments of the Ministry of Health.
In detecting problems in the denominators, the study team should remember the following points: � To interpret trends in each area, it is important to know which sources were used for the denominators of vaccination and
deworming coverage. � In addition to observing trends in the denominator, the study team should determine if the number of doses of BCG, DTP/
pentavalent1, Polio1, or deworming drugs exceeds the number of people in the target population. If so, the reported coverage will be >100%. If the number of doses is considered reliable, the denominator may be underestimated. In that case, for purposes of the analysis (though not for the official report), the coverage may be calculated using data for the first vaccine doses, as it will be closer to the real value.
� If significant discrepancies are detected in the administrative coverage vis-à-vis estimates from a coverage survey, and if numerators are reliable, the differences may result from inaccuracies in the denominator.
� When results from rapid coverage of vaccination (RCV) show a consistently larger proportion of vaccinated persons than suggested by the administrative coverage, it is possible, though less likely, that the denominator is overestimated. If so, the team must interpret results cautiously given RCV’s non-probabilistic sampling design.
Other considerations include: � Population dynamics in municipalities where economic or social conditions require people to seek work elsewhere (e.g.,
during harvests, in the tourist industry, and among people searching for work in urban areas). � Bedroom municipalities in which residents work elsewhere during the day and return at night. Children in these families may
attend schools outside the municipality, and vaccination data may be recorded in a location that is not their address. � Migratory movement within the country to municipalities near a border or to different countries. Migration may affect
numerators and denominators. � Immunization services provided in the private sector or by social security, NGOs, the military, or the school system, among
others. These services may not be included in calculating the coverage numerator.
Beyond analyzing circumstances that may explain inaccuracies in denominators, the EPI and Neglected Infectious Diseases (NID) program have limited ability to adjust or estimate denominators. However, demographers, statisticians, and immunization experts may be invited to form a multi-institutional committee to review census projections or birth records and to make recommendations to the Ministry of Health about the most appropriate denominators for calculating vaccination coverage and other health indicators.
2.3. Quality of the vaccination serviceSome indicators evaluate immunization service quality. These may show if vaccination occurred on a timely basis per the established schedule; if the recommended series for the child’s age was completed; if all doses for multi-dose vaccines were administered; and if a health card or other proof of vaccination was available to confirm the child’s immunization status. Please see below for a description of pertinent indicators.
2.3.1. AccessAs noted, the coverage indicator measures the public’s access to an intervention. For vaccination, coverage reveals differences among geographic areas and helps to direct activities to the most vulnerable municipalities (Figure 20).

38
LACCESS
2.3.2. Dropout rateThe dropout rate is the proportion of children who start but do not complete the series of doses for a given vaccine. For multi-dose vaccines, the team should determine how many children received the first dose of the vaccine under evaluation but failed to complete the series through the third dose. BCG vaccination can be compared with DTP1; DTP1 with DTP2; and DTP3 with MMR. The dropout rate is calculated as follows:
Dropout rates reflect service quality. In a good system for monitoring childhood vaccination, a dropout rate of <5% is considered acceptable. If it is higher, the EPI should analyze causes for the high rate and adopt corrective measures. Negative dropout rates suggest problems with data quality.
Figure 20. DTP1 vaccination coverage (%), by municipality, country A, 2012
San RafaelLas Pirámides
AméricoBabilonia
GalaxiaBolívar
La FortunaVespucio
La PiadosaColón
Monte SacroVendabalLangosta
TamborLas Vertientes
NaranjalGranadilla
PraderaEl Bosque
Santa MartaEl CafetalLa FuenteFlorencia
San RoqueSanta AnaSan Juan
Guadalupe
20 40 10080600
Coverage (%)
99
5656
606061
6465
6666
676969
7071
7474
777878
8084
8792
9597
98
No. of doses of Polio1, DTP1, or penta1 – No. of doses Polio3, DTP3, or penta3 in <1 year No. of doses of Polio1, DTP1, or penta1 in children aged <1 year
x 100

39
LDROPOUT RATE
Figure 21. Dropout rates (%) for DTP1, DTP2, and DTP3 vaccines, by year, country A, 2005-2012
2.3.3. SimultaneityThe simultaneity indicator evaluates the timeliness and quality of immunization services and may identify problems in data quality. It is calculated as follows:
Simultaneity facilitates the detection of missed opportunities to administer immunizations at a given age, such as the first dose of pentavalent and rotavirus vaccines at ages 2 and 4 months (Figure 22).
No. of children given 2 or more vaccines at the appropriate age Population of the specific age group
x 100
2005 2006 20082007 2009 2010 2011 2012
15
10
5
0
-5
-10
-15
-20
-25
-30
Dro
pout
rate
(%)
Dropout trends should be analyzed over 5-to-10 year periods to determine if the indicator has improved, worsened, or stayed the same and to discuss as a team possible explanations for any changes. The indicator is essential for monitoring compliance of multi-dose vaccines in the schedule. It is also useful for examining both high rates, which reflect abandonment of the series, and low rates, which suggest problems in data quality (Figure 21).
What accounts for the negative dropout rates reported for DTP1-DTP3 and DTP2-DTP3?
DPT1-DPT3 -20 -7 -18 -17 -20 -29 -10 0DPT2-DPT3 -1 8 1 2 0 -1 0 1

40
LSIMULTANEITY
Figure 22. Simultaneity (%) in the administration of pentavalent 1 and 2, polio,and rotavirus vaccines, country A, 2013
2.3.4. TimelinessIf a nominal registry is available, timeliness of vaccination can be calculated as follows:
In addition to determining the timeliness of each administered vaccine, the timeliness indicator can show the coverage of population cohorts by adding the number of vaccines given at later ages (Figure 23). Late vaccination may explain high dropout rates.
No. of children vaccinated at the proper age, by age group Population of the specific age group
x 100
100
80
60
40
20Penta1 alone Penta1 + Polio1 Penta1 + Rota
Sim
ulta
neou
s ap
plic
atio
n (%
)
Why is the simultaneity of pentavalent 1 and Polio1 over 95%, while both the 1st and 2nd doses of pentavalent 1 and rotavirus 1 are 70% and 60%, respectively?
Penta1 0 98 70Penta2 0 97 60

41
LTIMELINESS
2.3.5. Completion of the seriesNominal registries are needed to calculate the proportion of children with complete immunization schedules for their age. The calculation is:
Figure 23. Capture of dropouts (pentavalent 3 vaccine), by birth and age cohort, country A, 2008-2011
No. of children with complete immunization series, by age group Population of the specific age group
x 100
0.2
1.88.6
84.4
0.3 0.21.67.9
84.6
1.27.5
88.3
7.1
80.6
Cov
erag
e (%
)
Age
Cohort
100
80
60
40
202008 2009 2010 2011
<1 year 1 year 2 years 3 years 4 years

42
N
2.4. Interpretation of results2.4.1. Search for explanationsIn addition to using complementary sources to detect data discrepancies or congruities, the study team should use quantitative and qualitative methods to evaluate the coherence of an indicator’s numerator and denominator. It is also necessary to analyze data to detect discrepancies and confirm the coverage level. To this end, the study team should evaluate the indicators above, including the dropout rate. As part of this analysis, the team must recognize and discuss the socioeconomic and demographic factors in different regions in order to interpret coverage accurately.
Stratification of different areas by population size (Figure 24), in conjunction with characterization of sociodemographics and access to health services, helps to identify explanations for low coverage in areas with certain social conditions. These conditions include degree of development and rural/urban residence, among other determinants of healthcare access.
Figure 24. Correlation between pentavalent 3 vaccination coverage and number of live births, by municipality, country A
In analyzing coverage, the team must try to understand local conditions, since qualitative information helps to interpret data in context. Figure 25 shows coverage stratification by the Social Progress Index.
120
100
80
60
40
20
02,000 3,0001,000 4,000 5,000 6,000 7,000 8,000 9,000 10,000
Cov
erag
e (%
)
Live births (N)
>5,000 live births
80%-100% coverage
1,000 to5,000
live births
<1,000 live births

43
N
Figure 25. Correlation of pentavalent 3 vaccine coverage with the Social Development Index, by municipality
In summary, the following steps are recommended to analyze vaccination coverage: � Contextualize coverage data and the absolute numbers constituting the numerators and denominators. Evaluate data
and figures, taking into account different geographic areas and population groups to detect discrepancies in basic data. Develop intervention plans for low-coverage areas.
� Identify critical areas and municipalities by analyzing high dropout rates, trends in the number of vaccines administered outside the recommended age for the series, and vaccine coverage differences (e.g., BCG or DTP1 in combination with others).
� Analyze the quality of the vaccination registry forms and how often health workers use the health card or other forms of documentation to verify immunization status.
� Use different data sources to validate information about the vaccines or deworming drugs administered. Sources include registries in public and private health services by locality and department, coverage differences by vaccine type and number of doses, analysis of dropout indicators by vaccine or between one dose and the next, and vaccination campaign records.
� Review multiple information sources to detect errors and biases in the data that may over- or underestimate the indicator and lead to erroneous conclusions and interventions. In a study in which the effect of a discrepancy was evaluated using three different data sources (health card, individual health service records, and computerized vaccination registry), investigators found that coverage rates based on a single source were significantly lower than those based on multiple sources (4).
140
120
100
80
60
40
20
0200 40 60 80 100
Cov
erag
e (%
)
Social Development Index
Low SDIPenta 3 ≥95%
High SDIPenta 3 ≥95%
High SDIPenta 3 <95%
Low SDIPenta 3 <95%
What conditions could account for differences in coverages among municipalities based on the Social Development Index?

44
Preparation of the ReportDiscussion of the Results
Dissemination of the ResultsStep 3
Table 5. Criteria for prioritizing municipalities based on vaccination coverage, by risk
Dropout rate (%)Vaccination coverage (%) with tracer vaccine
< 80% or > 100% 80 to 94% 95 to100%
-5% to +5% High risk Moderate risk Low risk
≤-5 % or ≥5 % Very high risk High risk Moderate risk
indicators, such as pentavalent 1 coverage, can be used. By classifying municipalities by coverage level and dropout rates, the study team may determine which municipalities are acceptable (i.e., meeting both criteria) and unacceptable (i.e., not meeting the criteria) and use this information for prioritization.
Step 3: Dissemination of results
Dissemination involves preparing a report of the data analysis and discussing results with decision-makers in order to maintain high, uniform coverage with high-quality data.
3.1. Report preparationThe data analysis report should include all of the study’s components, including an interpretation of the results and data sources. The report should also include recommendations to increase coverage in areas with unvaccinated populations and recommended activities to verify coverage levels in the field.
Table 6 is a guide to present the report’s main findings and recommendations.
2.4.2. Prioritization of risk areasIdentifying areas or strata with reliable administrative data that have achieved the target population coverage and comparing these to others with quality issues helps to identify areas requiring additional data verification. In low-coverage areas, interventions are needed to raise coverage levels. The study team may prepare a table similar to the one below to prioritize these areas (Table 5).Population areas or strata are placed in cells corresponding to their dropout rates and coverage levels. Additionally, tracer

45
Table 6. Interpretation and decision-making based on the analysis of administrative vaccination coverage
Result of coverage analysis Interpretation Data source Decision
Coverage level
Analysis by age group and vaccine type
Low coverage in geographic areas
Coverage trend
Uniformity over time and geographic area
Falling or fluctuating trends between different localities
Dropout levelDTP1-DTP3
Values (+) outside accepted range
Values (-) outsideaccepted range
Differences between data sources
Different denominator sources
Different numerator sources
3.2. Discussion of results The study team should analyze coverage with all interested parties, including local, subnational, and even national-level officials responsible for program supervision. These professionals should begin participating in the process when the data are registered at the time of vaccination and should review data operations, data quality control, preparation of coverage reports, and use of the information to improve the service. To this end, the professionals responsible for preparing tables, figures, and maps should be identified, so that everyone may participate in analyzing the results and decision-making.

46
Definition of StrategiesPlan of Action
Decision-makingStep 4
Step 4: Decision-making
Based on these results, health programs should make decisions that are integrated into the planning processes at all levels of management.
4.1. Definition of strategiesMonitoring vaccination coverage facilitates the timely detection of population groups with low coverage and the use of interventions to meet program goals. Strategies to improve coverage and reduce missed opportunities for vaccination include:
� Avoid letting false or unfounded beliefs, ideas, fears, or myths about vaccine contraindications keep parents and guardians from vaccinating their children; provide reliable information to address the public’s concerns.
� Ensure that health personnel always ask patients if their vaccination schedules are up to date, review records, and, if necessary, administer missing vaccines.
� Instruct immunization teams, when they find children with incomplete series, to open a multi-dose vaccine vial without concern for waste. Health workers should consider these situations as opportunities for prevention.
� Plan ahead to avoid shortages in vaccine supply or distribution in all health facilities. � Determine if any health centers have hours or days when they are closed that might limit the public’s access to immunization
services. � Systematically review health facility nominal registries to identify children behind on their immunization schedules; then,
implement effective strategies to find these children and administer missing vaccines. � Hold activities outside health facilities to reach target populations in homes or schools. Determine the best times to conduct
these activities, coordinating with schools, as necessary. � Involve community leaders and local associations in promoting activities to achieve more uniform coverage. � Provide feedback to health workers, volunteers, and leaders engaged in promoting child health and implementing vaccination
strategies; keep these stakeholders informed on the program’s progress and achievements.
4.2. Plan of actionFor more information on implementing vaccination activities and interventions, please see PAHO/WHO manuals and practical guidelines on immunization at:http://new.paho.org/hq/index.php?option=com_content&view=article&id=278&Itemid=39427&lang=es.

47
This unit presents steps for analyzing administrative deworming coverage in preschool and school-age children:
Unit 2.Deworming Coverageof Soil-TransmittedHelminth Infections1
To achieve >95% deworming coverage, health programs should administer deworming drugs periodically,
depending on the risk to the eligible patient populations. In addition to effective interventions, deworming
programs must focus on coverage monitoring, data quality, and timely information for decision-making in
order to reduce the disease burden associated with soil-transmitted helminthiasis (STH).
1 In these modules, the term deworming refers to the treatment of soil-transmitted helminthiasis.
Steps for adminstrative coverage analysis of deworming
Data collection and organizationStep 1
Data analysisStep 2
Dissemination of resultsStep 3
Decision-makingStep 4
Definition of the target populationsCoverage indicatorsData recordingTools for data presentation
CoverageAnalysis of the numerators and denominatorsQuality of the deworming serviceInterpretation of the results
Definition of strategiesPlan of Action
Preparation of the reportDiscussion of the results

48
� Primary
� Consolidated
Step 1: Data collection and organization
The first step is collecting and organizing the data by creating coverage indicators for the variables of person, place, and time, as well as indicators to evaluate the quality of the deworming service.
1.1. Defining target populationsIdentifying communities that require deworming depends on the epidemiological situation in each locality and country. When there is no baseline prevalence or intensity of STH to identify at-risk groups, the proportion of the population without access to improved basic sanitation disaggregated by rural or urban location can serve as the target population. In areas where >95% of people have access to improved basic sanitation services, transmission of helminths is assumed to be sufficiently low to prevent infections.
In 2011, the WHO published an algorithm to estimate the population at risk for STH (5). Based on standard criteria, countries are classified as having high, moderate, or low burdens of infection. An area in which the baseline prevalence of any SHTI—Ascaris lumbricoides (roundworms), Trichuris trichiura (whipworms), or hookworms—exceeds 50% is considered high risk, and the population should receive deworming drugs twice a year. Conversely, areas with STH prevalence of 20-50% are considered low risk and need only one round of annual treatment (6).
Definition of target populations
Coverage Indicators
Data recording
Tools for data presentation
Collection and organization of the dataStep 1
� Preschool children � School-age children
� Programming � Geographic � National
� Tables � Figures � Maps
� Health cards � Data tally � Monitoring

49
Evaluation of prevalence baseline
Treated population Treated population
Prevalence ≥20 and <50%Preventive chemotherapy
once a year
Prevalence ≥50%Preventive chemotherapy
three times a year
Prevalence 20-50%Maintain preventive
chemotherapy on previous schedule
Prevalence ≥10 and <20%Preventive chemotherapy
once a year
Prevalence ≥1% and <10%Preventive chemotherapy
every 2 years
Prevalence <1% Does not require preventive
chemotherapy
Prevalence evaluationafter 5-6 years of
preventive treatment
Prevalence ≥50%Preventive chemotherapy
twice a year
Prevalence <20 %Does not require preventive
chemotherapy
After five or six years of regular mass deworming rounds, the program should evaluate prevalence of infection and make any needed adjustments. For example, if prevalence is <1%, only individual treatment in health services is necessary. If prevalence is 1-10%, deworming rounds should be reduced to once every two years, while if prevalence is 10-20%, rounds may be reduced to once per year. If prevalence is 20-50%, rounds should continue on the same schedule as before the evaluation, and if prevalence is >50%, mass deworming should be done three times per year (7). The goal of each round is >75% coverage. However, for the purposes of coverage monitoring in these modules, the goal is >95%, as some countries integrate deworming and immunization programs and share common goals.
Figure 26 shows the criteria for defining the target populations and interventions to implement based on STH prevalence.
Figure 26. Algorithm for defining target populations and deworming strategies for soil-transmitted helminthiasis
Untreated population
Source: World Health Organization. Helminth control in school-age children: A guide for managers of control programmes. 2nd ed. Geneva; 2011.

50
1.2. Coverage indicatorsMonitoring coverage is as important as the actual administration of deworming drugs. In addition to serving as a supervisory activity, monitoring provides support for the professionals responsible for treating STH.
Monitoring helps to detect problems at any point in the activities of the deworming program, so that timely interventions can be made. Without reliable deworming coverages, the program’s performance cannot be evaluated. Professionals responsible for deworming, both locally and nationally, must know how many patients needing treatment actually received it, as well as when and where treatments were received.
Deworming coverage is defined as the proportion of people in a specific age group who received the deworming drugs out of the total population eligible for the treatment. The target population may be:
� Treatment groups: preschool and school-age children, agricultural and mining workers, breastfeeding women, and women in the second or third trimesters of pregnancy.
� Populations in given geographic regions, administrative units, or endemic communities. � The entire population at risk for infection in a country.
As described in Table 7, the study team may analyze deworming activities using three types of indicators: program, geographic, and national coverage (8).
Table 7. Indicators for monitoring deworming coverage
Indicador Numerator Denominator
Program coverageExample: Percentage of preschool children (1 to 4 years of age) and school-age children (5 to14 years) in endemic areas who received the medication
Number of preschool children who received the medication in a given endemic area
Total number of preschool children in the endemic area
Number of school-age children who received the medication in a given endemic area
Total number of preschool children in the endemic area
National coverage
Example: Percentage of preschool and school-age children who received the medication in the country
Number of preschool children who received the medication in a given country
Total number of preschool children who need medication in the country
Number of school-age children who received the medication in a given country
Total of school-age children who need medication in the country
Geographic coverage
Example: Percentage of administrative units in endemic areas that implemented a deworming program for preschool and school-age children
Number of administrative units in endemic areas with deworming programs in place for preschool and school-age children
Total number of administrative units that need a deworming program

51
1.3. Recording dataHealth programs should systematically monitor coverage indicators for deworming drugs, using registries to record the medications administered to the target population in each treatment round. Registries may be nominal (Table 8) or consolidated (Figure 27). If a nominal form is used, the health worker should check the dates when the child should receive his or her next dose (Table 8).
Table 8. Coverage monitoring: Nominal registry for monitoring the administration of deworming drugs for STH
Consolidated registries, such as the example in Figure 27, are used to record data on children who received treatment during the deworming rounds. These registries facilitate data collection and the calculation of coverage rates.
Name of child Date of birth
Sex Drug administered
Male Female1st round 2nd round 3rd round
Date: / / Date: / / Date: / /
Total number of children who need treatment
Number of children who received treatment
Total number of drug doses used
Department or state: Municipality/district: Health unit:

52
Age group 1 to 4 years 5 to 14 years
Sex Male Female Male Female
1
2
3
4
5
6
7
8
9
10
11
12
13
14
15
16
17
18
19
20
Total by sex
Total by age group
Grand total
Figure 27. Coverage monitoring: Consolidated registry for monitoring administrative deworming coverage
Vaccination cards, or health cards, make efficient use of the registries, confirm that each child has received the drug, and keep the child’s parents informed. Health workers record the date on the card when the child received the deworming drug as well as when he or she should receive the next dose (e.g., in six months or one year).
Consolidated Registry of Antiparasitic Treatments Administered
Department or state: Municipality/district: Health unit:Treatment administered
Mebendazole Albendazole

53
1.4. Data presentation tools Deworming overage can be monitored using tables, figures, and maps that show coverage by person, place, and time. Much like the options for monitoring administrative vaccination coverage in Unit 1, these tools may be used in any setting. For ease of use, the letter L or N has been inserted in the right upper corner of each table or figure. Those tables with a L are more appropriate for analyzing local coverage, while those with a N are recommended for use at the national level (see section 1.4 above).All the tables and figures below represent different ways of presenting data. In addition to describing the data, the results must be understood in context to explain any gaps encountered, detect problems in data quality, and interpret findings appropriately.
Step 2: Data analysis
Data analysis includes calculating coverage, reviewing the sources making up the numerators and denominators, interpreting results, and evaluating conditions related to service quality.
Coverage
Analysis of the numerators and denominators
Quality of the deworming service
Interpretation of the results
Data analysisStep 2
� Person � Time � Place
� Numerators � Denominators
� Access � Integration � Dropout Rate
� Search for Explanations � Prioritization of risk areas

54
2.1. Coverage2.1.1. PersonIn analyzing data according to the person variable, the first step is calculating the proportion of preschool and school-age children living in endemic areas covered by the deworming program. If a school-based intervention is used, the study team must consider factors affecting how many children are reached for treatment. These factors include school enrollment, dropout rate, the number of children attending special schools, and the number of children not enrolled in school. While captive populations (e.g., school children) are excellent for monitoring activities, this monitoring approach only captures children attending school, not all school-age children living in the area.
As shown in Figure 28, coverage should be analyzed following each deworming round, with data disaggregated at minimum by sex and age group (preschool and school-age children). In areas with multiple ethnic groups, deworming programs may also want to disaggregate coverage by ethnicity, as different groups may have customs and cultural or living conditions affecting treatment compliance.
Figure 28. Deworming coverage of soil-transmitted helminthiasis (%) in at-risk areas,by age group and sex, country A, 2012
Cov
erag
e (%
)
100
80
60
40
20
0Preschool School-age
Boys Girls Both sexses
706872
5963
55
Age group (years)
Target popu-lation
No. children Dewormed
Coverage (%)
Preschool 3,740 2,620 70
1 1 000 600 60
2 950 550 58
3 900 680 76
4 890 790 89
School-age 9,530 5,610 59
5 980 620 63
6 950 650 68
7 975 610 63
8 990 640 65
9 980 700 71
10 960 675 70
11 950 500 53
12 985 420 43
13 890 415 47
14 870 380 44
Total 13,270 8,230 62
LPERSON
Questions:Are there differences in deworming coverage by age or sex? If so: Are differences significant? How can the differences be explained?

55
2.1.2. TimeAnalysis of coverage trends following each deworming round, whether annual or semiannual, is very important because consistently low figures indicate that strategies must be changed (Figure 29). Additionally, fluctuating values may reflect problems in data sources. If so, the deworming program should review not only coverage data but also the absolute values of the numerator and denominator to identify the cause of the variations.
Figure 29. Coverage with first and second doses of deworming drugs (%) for preschoolers in at-risk areas, by year, country A, 2008-2012
Area C
Area BArea A
Area D
Cov
erag
e (%
)
2008 2009 2010 2011 2012
100
80
60
40
20
0
5545
60
8075
6560
5045
40
2008 2009 2010 2011 2012
100
80
60
40
20
0
Cov
erag
e (%
)
85
5040
7580
7568
30
60
40
One doses Two doses
One doses Two doses
Cov
erag
e (%
)
2008 2009 2010 2011 2012
100
80
60
40
20
0
5545
60
8075
6560
5045
40
2008 2009 2010 2011 2012
100
80
60
40
20
0
Cov
erag
e (%
)
85
5040
7580
7568
30
60
40
One doses Two doses
One doses Two doses
2008 2009 2010 2011 2012
100
80
60
40
20
0
One doses Two doses
One doses Two doses
97 99969595
90 90 91 92 94
2008 2009 2010 2011 2012
100
80
60
40
20
0
76
88
65
50
40
30
40
55
70
82
Cov
erag
e (%
)C
over
age
(%)
2008 2009 2010 2011 2012
100
80
60
40
20
0
One doses Two doses
One doses Two doses
97 99969595
90 90 91 92 94
2008 2009 2010 2011 2012
100
80
60
40
20
0
76
88
65
50
40
30
40
55
70
82
Cov
erag
e (%
)C
over
age
(%)
What factors account for the trends shown for deworming coverage in at-risk areas: consistently low (A), consistently high (B),
fluctuating (C), or gradually increasing (D)?
Were differences in coverage due to changes in the numerator or denominator?
TIME N

56
Table 9. Coverage of deworming round for soil-transmitted helminthiasis (%), preschool age children in at-risk areas, 2012
2.1.3. PlaceAnalysis of deworming coverage by place shows the proportion of a program’s administrative units in operation compared to all those that should be covered by the program. This indicator is known as geographic coverage. To better control STH, >75% coverage in each deworming round should be achieved. But this is the minimum. By integrating deworming activities with other universal strategies such as vaccination, health programs should be able to reach 100% of the target population.
After determining coverage for each area (Table 9), the study team should group areas by coverage range to determine the proportions that did and did not meet the established goal (Figure 30).
Area Target population No. children dewormed Coverage (%)
La Fuente 675 470 70
El Chorro 450 250 56
Dos Ríos 500 200 40
Naranjal 580 250 43
San Esteban 690 550 80
Las Manzanas 500 400 80
San Pablo 345 500 145
Total 3,740 2,620 70
What factors account for San Pablo reporting >100% coverage?What conditions may be causing low deworming coverages in some at-risk areas?
LPLACE

57
LPLACE
Figure 30. At-risk areas (%) achieving at least 95% deworming coverage in the annual rounds, by year, country A, 2008-2012
100
80
60
40
20
02008 2009 201220112010
< 95% ≥ 95%
Area
s by
leve
l of c
over
age
(%)
Why did some areas achieve ≥95% of the coverage goal in deworming rounds while others did not?
Uniformity index (2012) = 95%
Maps help to identify low-coverage areas next to border areas and areas with coverage >100%. Maps also help to explain differences and congruencies between different places (Figure 31). For areas reporting coverage >100%, health programs must evaluate the reasons for the overestimate, so that appropriate follow-up measures can be implemented.

58
Uniformity: 85%
>100%
95-100%
75-94%
50-74%
<50%
Coverage levels
Figure 31. Deworming coverage of soil-transmitted geohelminths (%), by coverage level and municipality, country A, 2012
N
Do municipalities with coverage <95% share certain characteristics? Are these the same municipalities that report low deworming coverage?
PLACE

59
2.2. Analysis of numerators and denominators For monitoring activities, the study team and health programs must analyze the quality of the data used to estimate the administrative coverage and the coherence of the denominators and numerators. Additionally, the team should explain factors that may affect the breadth and timeliness of the coverage in order to create criteria for establishing measures that will ensure regular access to treatment and improvements in the quality of coverage data.
Table 10 lists factors that may contribute to discrepancies and incongruences in the coverage figures and that should be considered in data interpretation.
Table 10. Interpretation of discrepancies and incongruences in the percentages of deworming coverage
Coverage (%) Potential cause
>100%
Numerator � Persons living outside the target area receiving deworming drugs in a facility not
corresponding to their place of residence � Inclusion of persons outside the age range of the denominator � Registration errors (e.g., duplicate records)
Denominator � Population figure smaller than the actual number of persons living in the target area
>10% difference in the same geographic area compared to
coverage from several other years
� Demographic changes in communities caused by migration or newly settled areas not counted in the census
� Errors in processing population data or in the deworming registries
>10% difference between the doses of vaccine or deworming drugs received and the doses
administered
� Errors in the administrative deworming registry (i.e., omissions) � Errors in the data on deworming drugs administered versus the number of drugs
received by health facilities � Greater losses than expected in the supply of deworming drugs � Delivery of a larger number of tablets to each eligible child
In addition to coverage, the team should evaluate the absolute numbers of the numerator and denominator. As shown in Figure 32, a sudden drop in the numerator or denominator should trigger a review of the data.

60
L
Figure 32. Deworming coverage for soil-transmitted helminths (%), denominator and doses of preventive chemotherapy administered, by year, country A, 2005-2012
Cov
erag
e (%
)
No.
of d
oses
160,000
140,000
120,000
100,000
80,000
60,000
40,000
20,000
02005 2006 2007 2008 2009 2010 2011 2012
100
80
60
40
20
0
Coverage (%) 92 81 88 90 89 96 100 94
No. of doses 125 453 123 099 121 060 114 765 119 930 108 531 113 312 113 156
Population 138 229 106 407 126 009 120 672 128 434 134 110 106 558 106 381
Why did a sharp reduction in the number of doses administered occur in 2011 and 2012?
Why did a sharp decline in the population denominator occur in 2011 and 2012?
NUMERATOR AND DENOMINATOR

61
NUMERATOR
Figure 33. Correlation between deworming drugs provided to health facilitiesand drugs administered to the target population
Trea
tmen
ts re
ceiv
ed (n
)
Treatments administered (n)
8,000
6,000
4,000
2,000
00 2,000 4,000 6,000 8,000
2.2.1. NumeratorsThe team must also analyze the numerator to determine if the number of deworming drugs administered is valid. As a reminder, deworming drugs come in tablet form (albendazole 400 mg and mebendazole 500 mg).
When the WHO supplies albendazole, health workers must remember to divide the tablets in two for children aged 12-23 months. These children should only receive half a tablet. Conversely, mebendazole should be given as a single 500 mg dose to all children aged >1 year. As mebendazole bottles usually contain 200, 500, or 1,000 tablets, some waste (an estimated 10%) is expected.
If countries purchase mebendazole in 100 mg tablets, children should receive five tablets instead of one, keeping in mind that young children may have trouble swallowing the pills. To prevent errors in record keeping, programs must take differences in drug presentation into account when comparing the number of tablets distributed to the health units or distribution posts to the number of children who received deworming drugs (Figure 33).
What accounts for a >30% difference between the number of drugs received and the number administered?
Why is the number of drugs
administered greater than the number of drugs received in the health facility?
N

62
DENOMINATOR N
Figure 34. Correlation between number of school-age children in the school censusand official estimates of the school-age population
Scho
ol p
opul
atio
n ce
nsus
(n)
Estimated population (n)
8,000
7,000
6,000
5,000
4,000
3,000
2,000
1,000
00 2,000 3,0001,000 4,000 5,000 6,000 7,000 8,000
2.2.2. DenominatorsWhen coverage reaches or exceeds 100%, it cannot be assumed that the deworming program is adequately covering the population. It is possible, for example, that underestimation of denominators or treatment of children who live outside the municipality in question has resulted in an over-estimation of coverage.
Comparing information from different sources helps to confirm the denominator data. Other sources include the local census, data from previous deworming rounds, the number of vaccine administered (useful for determining the number of children aged <1 and aged 5 years), malaria program data, and coverage surveys. These comparisons show what difference, if any, exists between the census of students in schools and official estimates of the school-age population (Figure 34). In calculating coverage of school-age children, deworming programs must also consider differences between the number of children enrolled in schools and the number of school-age children (aged 5-14 years) actually living in the community or municipality. The education department provides data on school-age children, whereas statistical institutes provide and publish data on preschool children in the census. The accuracy of these numbers should be evaluated, as variations affect coverage rates. In any case, for deworming activities in schools, the number of children enrolled is the coverage denominator.
This point refers to the national capital, where the school census is greater than the official estimate for the municipality.
In this municipality, the official population estimate is greater than the school census. What explains this discrepancy?

63
LACCESS
Figure 35. Deworming coverage for soil-transmitted helminthiasis (%) in at-risk areas, by municipality, country A, 2012
100
4050
5555
6065
666869
7071
7474
777878
8084
8792
9598
99San Rafael
CapellánHiguerón
San JoaquínRobledal
BolívarLa Fortuna
San PancracioLa Virgen
ColónCerro Alto
San IgnacioLangosta
CulebraNaranjal
La PraderaSanta Marta
El CafetalLa FuenteFlorencia
San RoqueSanta AnaSan Juan
San Pedro
20 30 40 50 100908070600
Coverage (%)
2.3. Quality of the deworming service2.3.1. AccessAs noted, the coverage indicator establishes if the target population has received sufficient deworming drugs. To determine the population’s access to deworming services, health programs must thus compare coverage rates in several areas that have received the intervention (Figure 35).
2.3.2. IntegrationA useful strategy for achieving and maintaining adequate deworming coverage is the integration of activities of different preschool and elementary school health programs. When deworming rounds are conducted in conjunction with health days, deworming programs should compare data on mass administration of deworming drugs to vaccination coverages. Based on these data, the integration index, which compares the two averages, may be calculated. The lower of the two coverages shows that the two interventions were implemented concurrently and represents the proportion of children benefiting from both interventions (Figure 36).

64
LINTEGRATION
Figure 36. Integration index for the MMR vaccination and deworming strategies, country A, 2012 and 2013 rounds
MMR+ PC, 2012 round MMR+PC, 2013 round
979798
60
75
60
Cov
erag
e (%
)
100
80
60
40
20
2.3.3. Dropout rateThe dropout rate should be calculated in areas where STH prevalence indicates that the population should be treated twice per year. As shown below, the dropout rate is the number of children who received the first but not the second dose of deworming drugs.
No.of first deworming doses - No.of second deworming doses by age groupNo.of first deworming doses in the population of the same age group
x 100
What factors explain the differences in percentage of concordance for the reported MMR + deworming coverage between the 2012 (97%) and 2013 (60%) rounds?
MMR (measles, mumps and rubella) 98 60
PC (preventive chemotherapy) 97 75
Integration index 97 60

65
LDROPOUT RATE
Figure 37. Deworming coverage (%) and changes in the dropout rate for deworming in rounds 1 and 2, by year, 2005-2012
The target population should be the point of reference for all calculations. After all, if coverage in the second deworming round is higher than in the first, the dropout rate between rounds will be negative (Figure 37).
2008 2009 2010 2011 2012
25
20
15
10
5
0
-5
-10
-15
-20
-25
Dro
pout
rate
(%)
20
12.5
24
2
-20
No.
of d
oses
Cov
erag
e (%
)
1400
1200
1000
800
600
400
200
02008R1
2008R2
2009R1
2009R2
2010R1
2010R2
2011R1
2011R2
2012R2
2012R1
100
80
60
40
20
0
What factors could account for dropout rates of >10% in 2008,
2009, and 2011?
What accounts for the negative
dropout rates for rounds in 2010?
2008 2009 2010 2011 2012
25
20
15
10
5
0
-5
-10
-15
-20
-25
Dro
pout
rate
(%)
20
12.5
24
2
-20
No.
of d
oses
Cov
erag
e (%
)
1400
1200
1000
800
600
400
200
02008R1
2008R2
2009R1
2009R2
2010R1
2010R2
2011R1
2011R2
2012R2
2012R1
100
80
60
40
20
0
Coverage (%) 83 67 66 57 63 76 86 66 82 80No. of doses 1000 800 800 700 750 900 1050 800 1000 980Denominator 1200 1200 1200 1200 1190 1190 1215 1215 1225 1225
Dropout Rate 20 12.5 -20 24 2

66
N
2.4. Interpretation of results2.4.1. Search for explanations To understand coverage variations and patterns, deworming programs must correlate these patterns with sociodemographic variables. Using these results, programs may then propose strategies to improve both program quality and access. The first step is to characterize the coverage (both the indicator and data comprising the numerator and denominator) according to the area’s location (rural or urban), demographic density, and geographic location (e.g., on a border or the outskirts of a city) (Figure 38). Deworming programs should also evaluate factors that account for trends over time as well as changes in the numerators and denominators.
Figure 38. Coverage of deworming rounds (%), by year and type of at-risk area, country A, 2010-2012
The uniformity index is another tool for analyzing coverage in areas where deworming has been integrated with immunization activities. A scatter plot can estimate the index by comparing vaccination and deworming coverages in different areas (Figure 39). The plot shows areas meeting vaccination goals, areas meeting deworming goals, and areas meeting both (integration uniformity index).
What accounts for the consistently low deworming coverage in a scattered rural area, consistently high coverage in a marginal urban area, and fluctuating
coverage in a border area?
Are the changes in coverage the result of variations in the numerator or the denominator?
No.
of d
oses
No.
of d
oses
1,200
1,000
800
600
400
200
02008 2008 2008 2008 2012
2008 2008 2008 2008 2012
1800
1600
1400
1200
1000
800
600
400
200
02008 2008 2008 2008 2012
Cov
erag
e (%
)
100
80
60
40
20
0
700
600
500
400
300
200
100
0
Cov
erag
e (%
)
100
80
60
40
20
0
No.
of d
oses
Cov
erag
e (%
)
100
80
60
40
20
0
No.
of d
oses
No.
of d
oses
1,200
1,000
800
600
400
200
02008 2008 2008 2008 2012
2008 2008 2008 2008 2012
1800
1600
1400
1200
1000
800
600
400
200
02008 2008 2008 2008 2012
Cov
erag
e (%
)
100
80
60
40
20
0
700
600
500
400
300
200
100
0
Cov
erag
e (%
)
100
80
60
40
20
0
No.
of d
oses
Cov
erag
e (%
)
100
80
60
40
20
0
Scattered rural area Marginal urban area
Border area
Coverage 51 56 65 64 59
No. of Doses 560 620 700 669 640
Denominator 1100 1110 1080 1050 1090
Coverage 98 98 98 100 98
No. of Doses 600 590 585 593 600
Denominator 610 605 600 595 615
Coverage 93 77 50 75 85
No. of Doses 1400 1200 700 750 725
Denominator 1500 1500 1400 1000 850

67
N
Figure 39. Correlation between MMR coverage and deworming coverage rates (%) in children 1 age year in at-risk areas
110
100
90
80
70
60
50
40
30
20
10
0200 40 60 8070503010 90 100
MM
R co
vera
ge (%
)
Deworming coverage (%)
Deworming ≥ 75%MMR < 95%
Deworming < 75 %MMR < 95 %
Deworming < 75%MMR ≥ 95%
Deworming > 75%MMR ≥ 95%
1
2
3 4
5
6 7
8 9 10 11
12
2.4.2. Prioritization of risk areasEstablishing the prevalence of STH is the starting point for identifying populations that need deworming. In the absence of prevalence data, the percentage of the population with access to improved basic sanitation can be used to determine which population groups should receive preventive treatment (areas without adequate sanitation systems).
It is also possible to compare areas that required preventive treatment (based on SHTI prevalence or sanitation coverage) by analyzing deworming coverages in these localities. This helps to identify at-risk areas for STH transmission that require immediate intervention and have not received preventive interventions as well as those with low coverage (less than the coverage target, which may be 100% for programs integrated with other activities like vaccination, or 75% for deworming alone) (Table 11). The analysis should be performed for each priority age group covered by the deworming program, but only in geographic areas selected for the study.
Uniformity index MMR = 8/12 (67% of areas
≥ 95 %)
Why do some at-risk areas achieve 95% MMR coverage but fail to meet the minimum target of 75% for deworming coverage—i.e., why don’t they meet both coverage goals?
Integrated uniformity index
= 3/12 (25%)
Dew
orm
ing
unifo
rmity
inde
x =
4/12
(33%
of a
reas
≥95
%)

68
Table 11. Criteria for prioritizing at-risk areas based on deworming coverage
Coverage of the preventive treatment round
< 75 % 75 to 95 % 95 to 100%
High risk Moderate risk Low risk
Municipalities are prioritized based on epidemiological indicators (prevalence of STH and access to improved basic sanitation) and deworming round coverage levels. The deworming program should determine which municipalities have acceptable indicators for sanitation and prevalence of STH; which are “unacceptable” at the second level of priority; and which have first priority because they have not received the deworming round corresponding to their risk level.
Step 3: Dissemination of results
Dissemination involves preparing a report of the data analysis and discussing results with decision-makers in order to maintain high, uniform coverage with high-quality data.
3.1. Preparation of the reportA table summarizing the evaluation’s principal findings shows options to improve the program and provides a means by which health teams can follow up on the study’s findings. The table below shows the study’s results, analysis, data sources, and program recommendations (Table 12).
Preparation of the ReportDiscussion of the Results
Dissemination of the ResultsStep 3

69
Table 12. Interpretation and decision-making based on the analysis of administrative deworming coverage
Result of coverage analysis
Interpretation Source of evidence Decision-making
Coverage over 100%
Numerator: � Persons living in other areas receiving deworming
drugs in a facility not corresponding to their place of residence
� Inclusion of persons outside the age range of the denominator
� Registration errors (e.g., duplicates)
Denominator: � Population figures lower than the actual number of
persons residing in the area
Variations of more than 10% in the same geographic area compared with previous years
� Demographic changes in communities caused by migration or newly settled areas that have not been counted in the census
� Errors in processing the population data or in the vaccination or deparasitization registries
Differences of more than 10% between the doses of vaccine and deworming drugs received and the doses administered
� Errors in the antiparasitic administrative registry (omissions)
� Errors in the data on deworming drugs administered in terms of the amount of medication received by the health facility
� More deworming drugs tablets lost than expected
3.2. Discussion of results Since the analysis of administrative coverage involves quantitative data, as well as knowledge of the situation in each intervention area, it is essential to discuss the findings and enlist the participation of the entire local health team and, insofar as possible, their respective supervisors.
It is also advisable to incorporate the perspectives of local leaders. In addition to their input on the results, their involvement offers an opportunity for coordination and secures their commitment to agreed-upon activities. When deworming treatments are integrated into other public health programs, such as the EPI, professionals from these programs should also participate in discussing the results.

70
Step 4: Decision-making
The analysis of administrative coverage should result in a report of all key information, including an analysis of results and the sources on which they are based. The report should present information for deworming programs that are considering the implementation of activities to increase coverage or to verify coverage in the field.
4.1. Definition of strategiesThe monitoring of deworming coverage should contribute to defining intervention strategies and generating knowledge and information for making policy on STH. Possible strategies in the plan of action include:
� Building trust in the communities by promoting health education, sharing coverage results, and emphasizing the importance of reaching and maintaining the target coverage to reduce the burden of STH. In addition to sharing messages on the benefits of deworming, health programs should take advantage of opportunities to improve hygiene practices to prevent new infections.
� Providing feedback on health worker and volunteer performance in distributing deworming drugs. Sharing this information promotes commitment and investment in the program team.
� Increasing the population’s trust and strengthening the work of health teams by announcing how many people are receiving treatment. Sharing this information promotes the program’s efforts to maintain adequate coverage.
� Providing information to improve planning for medical supplies needed in the future. � Implementing mobilization and advocacy activities with donors, partners, and stakeholders and sharing information on
progress made, with a view toward building trust and promoting long-term sustainability.
High STH prevalence and little access to improved basic sanitation are not the only criteria for deciding where interventions should be implemented. Per government policy, some countries and areas in the Americas perform deworming activities without considering the risk of STH transmission. Deworming programs should also monitor these areas through integrated actions.
Definition of StrategiesPlan of Action
Decision-makingStep 4

71
4.2. Plan of actionThe manuals below contain information on strategies and activities for preparing a plan of action, as well guidelines for designing activities to prevent and control STH.
1. Guideline: preventive chemotherapy to control soil-transmitted helminth infections in at-risk population groups. Geneva: World Health Organization; 2017. Licence: CC BY-NC-SA 3.0 IGO.
2. Montresor A, Crompton DWT, Hall A, Bundy DAP, Savioli L. Monitoring helminth control programmes: Guidelines for monitoring the impact of control programmes aimed at reducing morbidity caused by soil-transmitted helminths and schistosomes, with particular reference to school-age children. Geneva: WHO; 1999. (WHO/CDS/CPC/SIP/99.3)
3. World Health Organization. Preventive chemotherapy in human helminthiasis: Coordinated use of anthelminthic drugs in control interventions; A manual for health professionals and programme managers. Geneva: WHO; 2006. (WHO/CDS/NTD/PCT/2006.2)
4. World Health Organization. Helminth control in school-age children: A guide for managers of control programmes. 2nd ed. Geneva: WHO; 2011.

72
1. Pan American Health Organization. Immunization coverage monitoring chart: innovative simplicity. Immunization Newsletter. 2011 June;XXXIII(3):1-3.
2. Organización Panamericana de la Salud. Curso de gerencia para el manejo efectivo del Programa Ampliado de Inmunizaciones (PAI). Módulo VI: Supervisión, monitoreo y evaluación. Washington, DC: OPS; 2006.
3. Pan American Health Organization. Immunization: Prioritizing Vulnerable Populations. 18th Meeting of Technical Advisory Group on Vaccine-preventable Diseases. San José, Costa Rica, 2009; 24-26 agosto de 2009. pp. 35-7.
4. Luman ET, Sablan M, Stokley S, McCauley MM, Shaw KM. Impact of methodological “shortcuts” in conducting public health surveys: Results from a vaccination coverage survey. BMC Public Health. 2008;8:99.
5. World Health Organization. Soil-transmitted helminthiases: estimates of the number of children needing preventive chemotherapy and number treated, 2009. Wkly Epidemiol Rec. 2011;86(25):257-68.
6. World Health Organization. Helminth control in school age children: a guide for managers of control programmes. 2.nd ed. Geneva; 2011. Available from: http://whqlibdoc.who.int/publications/2011/9789241548267_eng.pdf
7. Montresor A, Gyorkos TW, Crompton DWT, Bundy DAP, Savioli L. Monitoring Helminth Control Programmes. Geneva: WHO; 1999. Guidelines for monitoring the impact of control programmes aimed at reducing morbidity caused by soil-transmitted helminths and schistosomes, with particular reference to school-age children. Geneva: WHO; 1999. (WHO/CDS/CPC/SIP/99.3) Available from: http://whqlibdoc.who.int/hq/1999/WHO_CDS_CPC_SIP_99.3.pdf
8. World Health Organization. Monitoring drug coverage for preventive chemotherapy. Geneva: WHO; 2010. Available from: http://whqlibdoc.who.int/publications/2010/9789241599993_eng.pdf
References

Tools for monitoring the coverage of integrated public health interventions
Vaccination and dewormingof soil-transmitted helminthiasis
CoverageMonitoringin the Field
Module 3

Tools for monitoring the coverage of integrated public health interventions
Vaccination and dewormingof soil-transmitted helminthiasis
CoverageMonitoringin the Field
Module 3

4
Table ofContents
List of tables and figuresIntroduction
Unit 1. Door-to-door rapid monitoring
Step 1: Planning1.1. Objectives: What, who, and when?1.2. Calculating the number of monitoring exercises1.3. Demarcation of areas
1.3.1. Selection of blocks and homes1.4. Adaptation of instruments1.5. Team formation1.6. Scheduling of activities1.7. Resources and logistics1.8. Coordination and information1.9. Training of the teams1.10. Pilot test
Step 2: Data collection and organization2.1. Initiation of fieldwork2.2. Selection of areas and houses2.3. Criteria for defining an acceptable house2.4. Data recording2.5. Quality control of the data
Step 3: Data analysis3.1. Tabulation and critical review of the data3.2. Report preparation3.3. Result interpretation
Step 4: Dissemination of the results4.1. Report preparation4.2. Discussion of the results
Step 5: Decision-making5.1. Definition of strategies5.2. Plan of action
68
11
141415151517191919191919
202020212224
24242526
272727
282828

5
Unit 2. Coverage monitoring in schools
Step 1: Planning1.1. Objectives: What, who, and when?1.2. Selection of schools
1.2.1. Convenience sampling1.2.2. Selection of schools for sentinel surveillance of soil-transmitted helminth infections
1.3. Adaptation of instruments1.4. Team formation1.5. Scheduling of activities1.6. Resources and logistics1.7. Coordination and information1.8. Training of the teams1.9. Pilot study
Step 2: Data collection and organization2.1. Initiation of the fieldwork2.2. Selection of classrooms and students2.3. Data recording2.4. Quality control of the data
Step 3: Data analysis3.1. Tabulation and critical review of the data3.2. Calculation of indicators3.3. Interpretation of results
Step 4: Dissemination of results4.1. Report preparation4.2. Discussion of the results
Step 5: Decision-making5.1. Definition of strategies5.2. Plan of action
References
29
303132323233333434343434
3535353636
37373738
393940
414141
42

6
Tablesand Figures
Table 01. Key questions and recommended actions at each stage of coverage monitoring in the field
Table 02. Characteristics of RM when used for monitoring routine vaccination in the health services or for
supervision, outbreaks, or campaigns.
Table 03. Definition of target populations and interventions for RM.
Table 04. Rapid monitoring form.
Table 05. Criteria for verbal verification of vaccination status.
Table 06. Example of a tabulation of coverage and frequency of reasons cited for preschool children not
having a complete vaccination series or not receiving deworming drugs or another intervention.
Table 07. Report of results of RM and deworming in preschool children.
Table 08. Target populations and interventions to be considered in RM at schools.
Table 09. Recording data from coverage monitoring of vaccination and deworming in schoolchildren.
Table 10. Consolidation of data from the monitoring of school coverage, by school, and decisions made based
on the findings.
Figure 01. Algorithm for coverage monitoring of integrated public health interventions in the field.
Figure 02. Selection of blocks for RM.
Figure 03. Selection of starting point and collection of data for RM.
Figure 04. Location of houses in rural communities.
Figure 05. Algorithm for interpreting the results of RM and criteria for decision-making.
Figure 06. Algorithm for interpreting the results of coverage monitoring in schools and criteria for decision-making.

7
Annexes
Annex 01. Operational definitions.
Annex 02. Fieldwork checklist.
Annex 03. Form for recording data from rapid monitoring of vaccination, deworming, or other interventions,
from door to door.
Annex 04. Form for reporting the results of rapid monitoring of vaccination, deworming, or other interventions,
from door to door.
Annex 05. Reasons why a child was not vaccinated.
Annex 06. Form for recording data from rapid monitoring of vaccination and/or deworming in schools.
Annex 07. Form for reporting the results of rapid monitoring of vaccination and/or deworming in schools.

8
The analysis of administrative coverage should be complemented by the implementation of methodologies in the field. Local
health teams use these methodologies to ensure that coverage goals are met and maintained over time. Figure 1 outlines the
decision-making process.
Figure 1. Algorithm for coverage monitoring of integrated public health interventions in the field
COVERAGE MONITORING IN THE FIELD
If population is preschool children (under 5 years)
Do coverage monitoring door to door
If population is school-age children (5 to 14 years)
Do coverage monitoring in schools
Verify that the target population received the intervention
OB
JEC
TIV
ES
TO
OL
SR
ES
ULT
SD
EC
ISIO
NS
Keep coverage high and uniform
Systematic, ongoing non-probabilistic analysis of administrative data obtained periodically or from rapid studies in the field
Analyze results of the coverage monitoring
Groups were found that did not receive the interventions
Analysis of possible causes
Interventions based on the problems detected
The target population received the interventions
IntroductionIn this module, the term “rapid monitoring” (MR) is used in a general sense. Monitoring can be applied to vaccination (rapid monitoring of vaccination) or deworming (rapid monitoring of deworming). It may also be used in other situations in which it is necessary to determine if an intervention reached the target population, such as the mass administration of medicines for neglected infectious diseases.

9
Following the implementation of interventions in an area, health programs should perform monitoring exercises to confirm,
based on established criteria, that the target population was reached. If not, the program must take additional actions.
At-risk areas are prioritized because their low coverage shows they are vulnerable. Using this information, health programs
can determine if the problem relates to the quality of the administrative data used to calculate the coverage or if preschool
and school health programs have not reached certain population groups. Notably, the population groups at greatest risk for
contracting neglected infectious disease (NIDs) and vaccine-preventable diseases (VPDs) usually live in marginal urban areas
or remote rural areas. Coverage monitoring helps to bridge gaps in access to health services.
In areas where vaccination coverage is low or people live in conditions favoring the transmission of soil-transmitted
helminthiasis (STH), countries and health programs may have opportunities to integrate activities. If the country has not
conducted interventions but has decided to implement an action plan, it is important to consider the local reality and the
needs of different communities.
REMINDER: Rapid monitoring (RM) cannot be used to estimate coverage, as, by definition, it is a non-probabilistic
methodology. RM is a simple method best used to provide information for operational purposes—i.e., to determine
if a campaign’s or the regular program’s performance was adequate.
Before starting coverage monitoring in the field, the country and study team should:
� Select indicator(s) to monitor, especially if RM will be done following a campaign. If so, the team must carefully select
the indicator corresponding to the intervention done during the campaign (i.e., the vaccine administered or another
intervention, such as deworming, that was done and should be monitored).1
� Clearly define the target population, including the age groups evaluated in the RM and what investigators hope to learn
from the methodology.
� Have information available to locate all houses, areas, or schools to be monitored in a given community, keeping in mind
that the methodology is not probabilistic. Children living in homes or attending schools are the units of observation.
� Validate the measuring instruments in advance, adapting the tools to the exercise’s objectives. Because immunization
programs have extensive experience using the RM methodology, appropriate forms likely already exist. If so, the study
team only needs to modify the instruments to include information on the indicators under evaluation. Questions should be
clear and easy to understand to minimize errors and the non-response rate. Most immunization programs have conducted
RM exercises in children aged <5 years, but if the school-age population is being monitored, teams will probably need to
prepare and validate forms for this purpose.
� Ensure that all RM supplies are available (registration forms, blank vaccination or health cards, folding table or clipboards,
pencils, and vaccines and deworming drugs for children who have not received them).
� Select and train a suitable team to conduct fieldwork. This step involves specifying each team member’s responsibilities
and ensuring that his or her tasks are performed as expected. Professionals who collect data must be familiar with the
operational definitions and trained to use the surveying instruments and study methodology (Annex1).
� Conduct a pilot study to test the questionnaire and other measurement tools in the field, train and evaluate interviewers,
and make any needed adjustments before starting the fieldwork. These steps are especially important when changes or
significant adjustments have been made to the indicators or forms used in the RM activity.
� Organize and supervise fieldwork to ensure high-quality results.
� Guarantee data quality through all stages of the monitoring process. There must be a plan for processing data and clear
1 In these modules, the term deworming refers to the treatment of soil-transmitted helminthiasis.

10
strategies for collecting data, analyzing results, and preparing the report.
� Determine the final destination of the data in advance, so that results provide information to meet the goals of the
monitoring exercise.
� While planning the monitoring exercise, outline the final report’s structure and content as well as the strategy for
disseminating findings, so that a joint analysis of results from both interventions can guide decision-making.
Annex 2 is a recommended checklist to ensure that all necessary steps are completed in preparation for fieldwork (i.e., team
formation, logistical planning, procurement of necessary materials, supplies, or equipment, etc.).
Table 1 lists the activities of each stage of RM and the team members responsible for carrying out each step.
Questions
Stage 1 Stage 2 Stage 3 Stage 4 Stage 5
Planning Data collection Data analysisDissemination of
resultsDecision-making
Who is responsible?
� Responsible program officers.
� Monitoring coordinator.
� Monitoring coordinator.
� Field supervisors. � Field team.
� Monitoring coordinator.
� Data management expert.
� Responsible program officers.
� Monitoring coordinator.
� Responsible program officers.
� Health service managers and health authorities.
What activities
will be carried
out?
1. Define the objectives and indicators of the monitoring exercise.
2. Select team members.
3. Adjust the procedures and data collection instruments to the local needs and situation.
4. Validate the questionnaires and data collection instruments for generating reports in a pilot study.
5. Specify financial needs and resources.
6. Train field teams. 7. In advance,
coordinate activities with the local authorities, health posts, and schools; obtain any needed authorizations.
1. Prepare supplies and logistical details needed for fieldwork.
2. Decide where the RM will be conducted: neighborhood, road or street, school, other.
3. Perform field activities and record data on established forms.
4. Implement a data quality control system.
1. Record data. 2. Carefully review
and tabulate data.3. Prepare indicators
and tables to present the data.
4. Prepare the preliminary report.
5. Share the report with responsible program officers and key individuals.
1. Prepare and approve the final report.
2. Organize dissemination of the results to responsible program officers, health authorities, and decision-makers.
1. Organize the interdisciplinary team responsible for proposing the strategies and interventions aimed at improving coverage and resolve any difficulties encountered during monitoring.
2. Discuss findings and define interventions.
3. Incorporate the agreed-upon strategies into the programs’ plans of action.
4. Specify and identify resources needed to carry out interventions.
5. Create an evaluation strategy and a plan for scheduled follow-up.
Table 1. Key questions and recommended actions at each stage of coverage monitoring in the field

11
Unit 1.Door-to-Door Rapid Monitoring
Immunization programs commonly use rapid monitoring of vaccination. RM is used in different circumstances for different reasons: during supervisory visits for comparison with administrative coverage data; at the end of national health days or vaccination campaigns to determine whether the desired coverage was reached; and to identify unvaccinated groups and determinae why they were overlooked. In these modules, the experience and lessons learned from RM conducted by immunization programs are leveraged to expand their use for other public health interventions, such as deworming programs.
The Pan American Health Organization’s Technical Advisory Group (TAG) on VPDs recommends that countries use rapid
monitoring to confirm the validity of reported administrative coverage in order to guide local immunization activities. RM also
helps to improve coverage because it involves vaccination as well as monitoring activities. When incorporated as part of health
service activities, RM can increase coverage among preschool and school-aged children.
While the RM methodology cannot be used to estimate coverage, since it is not based on probabilistic criteria that represent the
entire population, countries commonly use the methodology to supervise and monitor the coverage of local immunization programs.
RM is useful for the following reasons:
� The methodology takes advantages of resources and logistics already available in health services, and local teams can
easily implement RM.
� In small areas, RM can be completed within a few hours, generating real-time information at the local level.
� The methodology helps to identify unvaccinated populations, offering opportunities to reach these groups and increase
coverage.
� RM identifies participant explanations for non-vaccination and provides opportunities to clear up erroneous perceptions
and, if necessary, redirect communication strategies.
� RM guides decisions on where target interventions should be implemented to meet vaccination goals.
� The methodology helps to update and improve the quality of vaccination records—both individual health cards and
registries at health facilities.
� RM permits integration of vaccination with other interventions, such as deworming, which also requires coverage analysis
and monitoring to achieve the desired impact on target populations.
� Information from the field helps to improve local health program performance.

12
RM can be used in all immunization program activities (Table 2). As part of the routine service, RM identifies unvaccinated
patients. In supervision, it provides information on service access and quality. RM can be also used to monitor the execution
of campaigns, while providing complementary information on administrative coverages. Finally, in outbreak control, the
methodology helps to identify suspected cases, thereby allowing immunization programs to prioritize vaccination and
surveillance activities in high-risk areas.
Characteristics Routine monitoring Supervision Outbreaks Campaigns
Objective Improve immunization
program performance
by detecting
unvaccinated persons
and determining
reasons for non-
vaccination.
Provide information
to the supervisor
in charge of health
unit compliance with
regulations.
Detect and reach
unvaccinated
persons in at-risk and
outbreak areas.
Determine if the
campaign’s coverage
goals were met.
Number of RM Depends on national
regulations, the area’s
size and population,
and availability of
local resources.
Depends on
guidelines, feasibility,
and the time available
for supervision.
Depends on the size
and demographics of
the outbreak area.
Depends on national
campaign guidelines,
the size of the
population in each
municipality, and
the age of the target
population.
Criteria for
selection of the
area
Selected randomly or
based on risk criteria.
Defined based on
results of supervision
or based on risk
criteria.
Determined by
the presence of
cases; neighboring
communities are
selected based on
risk.
Selected randomly,
based on sectorization
of the areas, or based
on risk criteria.
Participants Local health unit
team and municipality
personnel.
Supervisor, with
support from local
teams.
Outbreak response
team.
Local teams, with
participation of
subnational and
national staff;
personnel from other
areas may participate.
Table 2. Characteristics of RM when used for monitoring routine vaccination in the health services
or for supervision, outbreaks, or campaigns

13
A number of conditions must be met to adjust the RM procedures and instruments to each situation in which they will be implemented:
� The immunization program’s regulations should specify the RM instruments and procedures used during supervision. To this end, the team must establish tracer vaccines and criteria for selecting study areas.
� If rapid monitoring is used in outbreak control activities, there should be guidelines specifying the forms and procedures for data collection and next steps based on the findings. In these situations, rapid monitoring may be used to do active case-finding in the community.
� If RM is used to monitor coverage during a campaign, national guidelines should specify the forms and procedures to be used, in accordance with the campaign’s objectives and target populations.
� Regardless of how the RM is used, once the forms and procedures have been defined, teams should validate the tools and make necessary adjustments to ensure that they are easy to use and meet their objectives.
The methodology described in this unit reflects lessons learned from past experiences. These include the requirement for verbal verification of immunization status, expansion of the forms to include coverage of adolescents and adults, and the consolidation and analysis of data based on management and geographic areas (1-3).
For at-risk populations in communities requiring periodic deworming, RM offers the opportunity to review coverage and guide
activities to improve access to deworming activities.
Steps for conducting rapid coverage monitoring house to house
Objectives: What, who, and when?Demarcation of the areasAdaptation of the instrumentsFormation of the teamsScheduling of the activitiesResources and logisticsCoordination and informationTraining of the teamsPilot test
Preparation of the reportDiscussion of the results
Definition of strategiesPlan of action
Tabulation and critical review of the dataCalculation of the indicatorsInterpretation of the results
Initiation of the fieldworkSelection of the areas and housesCriteria for defining an acceptable houseRecording of the dataQuality control of the data
PlanningStep 1
Data collection and organizationStep 2
Data analysisStep 3
Dissemination of resultsStep 4
Decision-makingStep 5

14
1.1. Objectives: What, who, and when? The first step in RM is defining the objectives. The team must identify the population and interventions to be monitored, as
well as the data to be collected. RM should be done in different contexts: during supervisory activities, as part of the routine
service to find unvaccinated individuals, and following campaigns to determine if target coverages were achieved.
The following questions guide the definition of objectives:
� What are the administrative vaccination and deworming coverages by age group and geographic area?
� What forms will be used to confirm the schedules or coverages of the interventions under evaluation? Do special forms
exist for recording information on the intervention for children or other population groups who will be interviewed?
- The latter question is important because RM assumes that an intervention may be analyzed via door-to-door
monitoring. Without standardized records of the intervention, however, RM will not produce good results.
- In immunization, for example, the vaccination card confirms that a child has received the vaccine being monitored
and shows whether the series is complete. If deworming is monitored, teams must first determine if the program for
controlling STH has a nominal registry showing the deworming drugs received by each child during the campaign under
evaluation. If a nominal registry does not exist, RM is not a suitable study methodology.
� What geographic areas have been identified that need coverage confirmation?
� What age groups will be included in the monitoring exercise (preschool children, school-age children, or both)?
� Which vaccines or interventions will be verified during the monitoring exercise?
� Will the team monitor the basic vaccine schedule, a specific vaccine, or an intervention from a mass campaign?
� What critical geographic areas require coverage verification in the field?
� Were deworming rounds or other health interventions done during the last six months in the areas undergoing RM?
- If so, what coverage was reported for these rounds?
- If not, do people in the areas undergoing RM need deworming or other interventions to improve their health?
Based on answers to these questions, the study team can define the population and interventions to be analyzed in the
RM (Table 3).
Step 1: Planning
Objectives: What, who, and when?Demarcation of the areasAdaptation of the instrumentsFormation of the teamsScheduling of the activitiesResources and logisticsCoordination and informationTraining of the teamsPilot test
PlanningStep 1

15
1.2. Calculating the number of monitoring exercises RM is a practical tool for determining if the intervention is reaching the target population. The number of monitoring exercises
conducted depends on the size of the target population in the study area. Since RM cannot estimate coverage, it is
recommended, for logistical and financial reasons, that the evaluation for vaccination adopts the goal of reaching at least 3%
of the population aged <2 years.
1.3. Demarcation of areas The study team should review maps and sectorization data used by local health teams. This information is usually stored in
the situation rooms of health facilities. It is important to ensure that all areas and populations are part of the study, including
those not assigned to or covered by a health facility.
In choosing areas for RM, the study coordinator should prioritize those at the greatest risk and those needing verification per
the following criteria:
� Peri-urban areas located near poverty belts.
� Border areas between countries or health facilities.
� Areas with geographic and social barriers that impede access to health services by people living in settlements that are not
legally recognized, in recently established squatter communities, or in communities that receive immigrants.
� Areas with large transient populations or bedroom communities with residents who go elsewhere during the day and return
at night. In these cases, children may attend schools away from their homes, where their vaccination records are stored.
� Areas with underserved populations or where there is reasonable doubt about the coverage of vaccination, deworming, or
other health programs as well as the quality of these services.
� Areas with consistently low coverage or coverage >100%, or those with high dropout rates from the immunization or
deworming series.
� Areas meeting other selection criteria—e.g., areas with reports of suspected or confirmed cases of VPDs. In this situation,
teams should choose blocks bordering the homes and locations visited by the patients under investigation.
1.3.1. Selection of blocks and homesAfter selecting the areas, the RM team must choose the blocks to be visited. It is best to choose blocks that are least likely to
have been visited before (e.g., those on high hills or far from the main streets). As resources permit, teams should try to visit
the entire area (Figure 2).
What will be
monitored?
Target population to be monitored
Infants <1 year Preschool age children
(1-4 years)
School-age children
(5-14 years)
Vaccination
(specify which vaccine)
Deworming for STH
Other intervention
(specify)
Table 3. Definition of target populations and interventions for RM

16
Figure 2. Selection of blocks for RM
1
2
4
3
After selecting the area or locality for monitoring, the RM coordinator must identify blocks to visit. These should
be blocks that are less likely to have been visited by vaccinators or health workers in the past (e.g., due to
difficult access or distance from the main roads).

17
Starting with the first block selected, teams should visit each house in a clockwise pattern until 20 children have been
identified in each age group of the RM (infants aged <1 year, preschoolers aged 1-4 years, or school-age children aged 5-14
years). An adult in each home must be present to show the child’s vaccination or deworming records and answer confirmation
questions.
In rural communities, houses are far apart and may not be organized by blocks. Teams will thus have to find the homes on
footpaths. Alternatively, in this situation, team may divide and number the area into quadrants of equal size and treat each
quadrant as a block.
As noted, RM is not based on a probabilistic sample. Consequently, if the assigned area is very large, such as in a high-
density municipality, a larger number of blocks should be selected to expand the monitoring area. To this end, the team should
obtain a comprehensive overview of the entire area, identifying critical localities and corresponding schools where monitoring
should be initiated. Because the selection of schools is based on qualitative criteria, zones assumed to have high coverage,
such as those near health services, must not be excluded. All types of areas should be part of the analysis.
1.4. Adaptation of instrumentsSince immunization programs have extensive experience conducting RM, many countries already have forms and protocols
for conducting these exercises and analyzing results. It is thus necessary to adjust the forms only if indicators for the
monitored interventions have changed. As an example, if RM is used in campaigns for interventions other than vaccination,
teams must modify the objectives and surveying instruments accordingly.
Components of the data collection instrument include (Table 4):
1. Heading: Information about the area in which the RM will be conducted, depending on the country’s political,
administrative, or geographic structure.
2. Data collection variables: Address; number of children in the age group for which the vaccination status, deworming
history, or other priority intervention is being verified; and reasons why the children were not vaccinated or dewormed.
3. Body of the form: Space for recording data from the RM exercise.
4. Data tabulation: Space for manually tabulating the data collected.
5. Identification of RM personnel: Information identifying the person responsible for the RM exercise.
All forms should have instructions, so that monitoring teams have detailed directions for carrying out fieldwork.

18
HEADING OF THE FORM: Identification information: Include the information needed in order to identify the place where the rapid monitoring (RM) is conducted according to the political-administrative-geographical structure of the countryName of the first subnational level (department, state, or provinceName of the second subnational level (district or municipality)Name of place (locality, community, or parish, and block)
VARIABLES TO BE INCLUDED IN THE RM FORM: Include all the variables needed, depending on the objective and indicators selected to include in the RM
(A) House
No.
(B) No. of
children in the age
group to be
included in the RM
(C) Type of vaccine and number of children vaccinated (select which vaccine(s)
to be covered in the RM
(D) No. of
children dewormed
in the campaign
(E) Other
intervention to be
included in the RM
(F) Reason why child does not have a complete
vaccination series, was not dewormed, or did not receive other intervention
(include all those necessary)
Vaccine 1
Vaccine 2
Vaccine 3
Vaccine 4
Vaccine 5
Vaccine 6
Vaccine 7
Complete series for
age1 2 3 4 5 6 7 8 9 10
SPACE FOR RECORDING THE DATA FOR EACH CHILD INCLUDED IN THE RM: REMEMBER THAT EACH DOOR-TO-DOOR RM COVERS 20 CHILDREN
1
2
3
4
5
6
7
8
9
10
11
12
13
14
15
16
17
18
19
20
TOTAL
Table 4. Rapid monitoring form
3
5
2
4
1
IDENTIFICATION DATA OF PERSON CONDUCTING THE RM
Name of responsible person Signature Date Other
* REMEMBER TO INCLUDE INSTRUCTIONS ON THE BACK OF THIS FORM
SPACE FOR TABULATING THE DATA
Coverage:Vaccine
1Vaccine
2Vaccine
3Vaccine
4Vaccine
5Vaccine
6Vaccine
7COMPLETE SERIES
% of children vaccinated (C/B*100)
% of children dewormed (D/B*100)
% of children who received other intervention (E/B*100)
Reasons why (F): 1 2 3 4 5 6 7 8 9 10Total not vaccinated/not dewormed/missing other
intervention
Vaccination series incomplete
Not dewormed
Did not receive the other intervention

19
The team should modify the registry and data consolidation forms for the age group being monitored and the variables being
analyzed. Annexes 3 and 4 are examples of standard forms for recording and tabulating data and preparing reports on door-
to-door RM.
1.5. Team formationEach team should have one professional familiar with the RM target area, who will be responsible for recording the information
and providing proof of monitoring to the children or populations monitored, and another professional responsible for carrying the
vaccines, deworming drugs, or other supplies for the children or population groups that may need them. One supervisor should
also be assigned to every three to five interviewing teams. The supervisor advises the interviewers, addresses their concerns, and
ensures that they have all materials needed to conduct the surveys and confirm coverage before leaving the area.
1.6. Scheduling of activitiesData collection visits should be scheduled when the target population is home, keeping in mind that some preschool and
school-age children will be in daycare centers or schools and that family members may not be at home during working hours.
Consequently, resources must be reserved for teams to work at night and on weekends, taking into account the target
population’s schedule. Otherwise, the people who are not at home may also be those who have difficulty accessing health
services, and they will be excluded from the RM exercise because no effort was made to accommodate their schedule.
1.7. Resources and logisticsIn conducting house-to-house visits, teams must make arrangements to ensure that supplies are available (thermoses,
biologicals, syringes, strongboxes, forms and cards for recording vaccination or deworming, forms for recording RM data,
etc.) and that all logistical issues have been addressed. These issues include mobilizing the team and providing interviewers
with maps or sketches of the municipality and the sector assigned to them, as well as a means for contacting supervisors with
any doubts or questions. Finally, team leaders must arrange safe transportation and ensure that the field staff members are
well fed and hydrated.
1.8. Coordination and information Obtaining proof of vaccination for the monitored intervention during house-to-house visits is essential. Teams should inform
the community of the RM ahead of time in order to increase the chance that vaccination cards and/or other documents with
information on the interventions being monitored are available. Community leaders, local representatives, and teachers should
be involved in planning the exercise, the monitoring itself, and analyzing results.
1.9. Training of the teamsAll personnel participating in the exercise should be trained in the RM methodology. Their roles and responsibilities should be
clearly defined, whether they are responsible for supervision or collecting and processing the data. All personnel must clearly
understand the operational definitions (Annex 1).
Training is an opportunity to improve the performance of local health workers in analyzing data and using methodologies to
evaluate immunization activities or other interventions. The RM training session may be scheduled as a morning session.
1.10. Pilot testIf changes are made to the target populations or interventions being monitored, the study team should conduct a pilot test in a
convenient location to determine if adjustments are needed. The pilot test should validate the instruments for consolidating data
and generating reports. To properly manage resources for fieldwork, the team should calculate the time required for each visit.

20
2.1. Initiation of fieldwork Before leaving for the field, teams should report to the health facility and, with their supervisor, review the areas and blocks to
be visited, ensuring that all supplies and materials are ready and reviewing the tasks to be done that day.
2.2. Selection of areas and housesFigures 3 and 4 illustrate techniques for selecting the initial block and establishing the route that the teams should follow to
visit the houses needed to identify a total of 20 children in the target population.
� Begin the house-to-house visit at the comer of the block selected as the starting point. � Visit houses until have reached a total of 20 children in the defined age group(s). � Follow the route in a clockwise direction. � If you do not find requird number of children, go to the next nearest block until obtaining a total of 20 children.
Figure 3. Selection of starting point and collection of data for RM
RCM Starting Point
20 childrenevaluated
2
1
3
4
Step 2: Data collection and organization
Initiation of the fieldworkSelection of the areas and housesCriteria for defining an acceptable houseRecording of the dataQuality control of the data
Data collection and organizationStep 2

21
2.3. Criteria for defining an acceptable houseIn conducting RM, teams should ensure that the houses visited are acceptable—i.e., that they will offer information on the
vaccination or deworming histories of children in each age group. An acceptable house is inhabited both by a child in the
target population and an informant who can provide the information required in the interview. Informants are considered to be
adults aged >18 years who are responsible for the child’s care and well-being. In addition to parents, informants may include
grandparents, aunts and uncles, other family members, and friends.
Questions may arise during data collection. Some frequently asked questions and answers include:
� What should I do if I cannot find 20 children in the target age group in the community? You should continue to the next
block or footpath, as long as it is in the area assigned to the health facility, until 20 children are found.
� What should I do if, as I keep on going, I find myself in an area that was already monitored? You should go to the block or
footpath next to the one that was already monitored, as long as it is within the area assigned to the health facility, until 20
children are found.
� If more than one child lives in the home, which do I select? In RM, you select all children in the target age group being
monitored, since the goal is to confirm the vaccination or deworming status of all children found. This is one significant
difference from a probabilistic sampling design.
� Do I include children in a kindergarten or school? RM is done from house to house and does not include schools, since
children in the school may not live in the selected block. A different methodology is used to monitor schools and is
described in the next section of this module.
� What should I do if there is an apartment building? Since families live with their children in apartment buildings, they should
be included. Each apartment corresponds to one house in which children of the age group being monitored may be living.
� Do l also include children who do not live in the area but happen to be visiting the houses? No, include only children living
in the area.
Figure 4. Location of houses in rural communities

22
� If no one is home, should I come back? For the RM, the house should not be included. However, for the program’s benefit,
you should report the house, so that local health teams can return later and determine if family members have completed
their immunization or deworming series.
� What should I do if there is no adult at home who can answer the questions? For RM, this house is not included. However,
for the program’s benefit, you should report the house, so that local health teams can return later and determine if family
members have completed their series.
� Who should I interview if more than one family with children lives in the house? Each family living in the home should be
interviewed. Although monitoring is done from door to door, households are the units of measurement.
2.4. Data recordingUpon arriving at a house, the team member should introduce him or herself and explain the purpose of the visit. If nobody at
home can show the child’s vaccination card or a record of the interventions received, the interviewer should still ask if children
in the target age group live in the home. With this information, the team can then obtain the children’s records at the health
facility. Children who are visiting the home and do not actually live in the area should be excluded from the study.
Each country should adapt its RM data registries based on the proposed objectives and indicators to be monitored. Annex 3
is a model form for recording RM data.
On the RM form, team members should specify the reasons why participants did not receive vaccines or deworming drugs.
To obtain this information, team members must carefully interview the mother or parent guardian. Potential reasons for non-
vaccination and non-deworming include:
1. The parent did not know it was necessary to vaccinate or deworm the child.
2. The parent does not know where to have the child vaccinated or dewormed.
3. The parent knows where to go but has not had time to visit the health facility.
4. The parent refuses to vaccinate or deworm the child for a variety of reasons.
5. The child was sick when it was time to be vaccinated or dewormed.
6. The child had contraindications preventing him or her from being vaccinated or receiving deworming drugs.
7. Health workers refused to vaccinate or deworm the child.
8. The family went to the health center, but it was closed.
9. The family went to the health center, but the vaccines or deworming drugs were not available.
10. Other reason (specify).
Countries or subnational regions may have their own reasons for non-vaccination or delays in the interventions being monitored.
The list of reasons should be reviewed and adjusted, if necessary, based on a consensus of the groups participating in the
monitoring exercise, in order to include the most frequent reasons. In addition, teams should analyze reasons for non-vaccination
or non-deworming for each population group in the study areas. For example, in areas with indigenous populations, people
of African descent, or other minorities, teams must adapt the list of reasons to include the characteristics of these specific
population groups. Annex 5 provides a more complete list of the reasons cited for non-vaccination.
Verbal verification: If the participant has lost or does not have on hand the child’s proof of vaccination and/or other
interventions being monitored (e.g., deworming), team members may accept verbal verification that the child was vaccinated
or dewormed. But the informant’s statements must meet certain criteria (Table 5).
Verbal statements are confirmed through a series of questions that the informant must correctly answer. Countries that
consider this methodology appropriate may use it for RM; however, it is optional. Notably, verbal statements are more valuable
in monitoring campaigns because campaigns use specific interventions that participants can more easily remember.

23
Question Criteria for verification
1. What disease was the vaccine for?The informant provides the correct name of the vaccine or disease—e.g.,
measles, rubella, tetanus, tuberculosis, etc.
2. How was the vaccine given?
BCG: The child received a single dose injected in the arm and it left a scar.
MR/MMR: The child received an injection in the arm.
Polio: The child received a few drops in the mouth or an injection in the arm.
DPT: The child received an injection in the thigh.
Pentavalent: The child received an injection in the thigh.
3. When was the vaccine given?
BCG: The vaccine was given at birth or in the first months of life, and it was
only one dose.
MR/MMR: The vaccine was given at age 1 year or in a campaign to control a
measles or rubella outbreak, or in a campaign to eliminate these diseases.
Polio: The drops were given two times (at ages 4 and 6 months) during the
first year of life or during campaigns.
Pentavalent: The vaccine was given three times (injected in the thigh) during
the first year of life at the time they also gave the drops for polio.
DPT: The vaccine was given three times (injected in the thigh) during the first
year of life.
4. Where was it given, and who gave it?
In campaigns, immunization programs use specific strategies to reach the
population. The informant should be able to say whether the child was
vaccinated at a school, health facility, or another site, depending on the
strategy used in the municipality.
5. If the child was vaccinated during a
campaign, how did you receive proof of
vaccination?
The informant describes the size and correct color of the card that the
municipality gives to vaccinated children.
6. For campaigns that include
deworming, ask:
� During the last 6 months or in the
last campaign (or 12 months if the
period evaluated is annual), did your
child receive pills for treating intestinal
parasites (worms)?
� Where were they given, and who gave
them?
� What did the pills look like?
� How did you receive proof of
deworming?
Deworming for STH is done in mass campaigns in certain geographic areas
and for certain population groups, meaning that RM is done after campaigns.
It is important to know when the campaign being monitored was conducted
and to ask the informant for that date, as well as where it was done and who
administered the deworming drug. These questions are important, since the
treatment could have been given at a vaccination post, a health facility, a
public place, or another location.
Mass deworming campaigns use albendazole (400 mg) or mebendazole (500
mg), almost always as a single dose in tablet form. However, mebendazole
may be given in 100 mg tablets, meaning that the patient may have received
five tablets. Before starting RM, interviewers should know the name and
formulation of the drug distributed. It is sometimes helpful to take sample
tablets to show informants and help them answer the RM questions.
The RM form should have a column to indicate if the data were obtained by reviewing a health or vaccination card or via verbal
verification criteria.
Table 5. Criteria for verbal verification of vaccination status

24
2.5. Quality control of the dataEnsuring data quality is essential for having accurate indicators for decision-making. Health workers collecting data should be
trained to avoid the following errors:
� Including children not in the target age groups.
� Including children who HAVE NOT BEEN vaccinated or dewormed in groups of children who have.
� Including children who HAVE BEEN vaccinated or dewormed in groups of children who have not.
� Registering people in a given house who do not live there.
� Registering doses given during RM in the monitoring results. People receiving vaccines or deworming drugs during RM are
registered as vaccinated or dewormed but should NOT be included in the results.
� Failing to note reasons for non-vaccination or non-deworming given by participants.
� Including reasons for non-vaccination or non-deworming under the heading ‘other,’ when the reasons APPEARED in the list
of reasons on the RM form.
� Conducting fieldwork during inconvenient times for the target population. Only visiting homes during normal weekday hours
makes it difficult to complete the exercise, since parents work and children are at school during regular business hours.
Teams should also standardize data collection. To ensure high quality data, Annex 1 provides operational definitions for RM as
well as data points to be collected during interviews.
3.1. Tabulation and critical review of the dataTabulation is the sum of all data collected in each monitoring exercise. Results are very useful for determining whether
more children than expected were not vaccinated or dewormed (Table 6). (Always remember that that data do not estimate
coverage because the sample is not probabilistic).
Table 6 shows an example of data tabulation on the RM registration form, emphasizing participant responses on why children
were not vaccinated or dewormed.
Step 3: Data analysis
Tabulation and critical review of the dataCalculation of the indicatorsInterpretation of the results
Data analysisStep 3

25
Table 6. Example of a tabulation of coverage and frequency of reasons cited for preschool children not having a
complete vaccination series or not receiving deworming drugs or another intervention
Percentage of children who received a
tracer vaccine, a campaign vaccine, or
have complete immunization series (%) =
80
Percentage of children dewormed (%) = 70
Percentage of children who received
another intervention (%) =55
Reasons given: 1 2 3 4 5 6 7 8 9 10
Total NOT
vaccinated/ NOT
dewormed/ did
NOT receive other
intervention
Series was incomplete: - - 1 - - - - 1 2 - 4
Child was not dewormed last year or during
the last campaign:4 - - - - - - - - - 4
Child did not receive another intervention: 9 - - - - - - - - - 9
During tabulation, the RM coordinator should carefully check the quality of the data recorded on the monitoring forms. If data
quality is high, the exercise can be assumed to accurately show that the target population has been reached and to represent
the causes for lack of vaccination, deworming, or the other interventions under evaluation.
3.2. Report preparationOnce tabulation is complete, teams should report if the target population was reached for each RM exercise. Because they
are not based on probabilistic samples, RM exercises cannot estimate coverage. Instead, they show how many exercises
were conducted and, of these, in how many the target population was reached. Additionally, the results of RM can inform
decision-making.
The reasons why children are behind in their immunization schedules or have not received deworming drugs help to shape
intervention strategies. Accordingly, teams should calculate the relative frequency of the different reasons for these delays.

26
Figure 5. Algorithm for interpreting the results of RM and criteria for decision-making
3.3. Result interpretationFigure 5 outlines the process of interpreting results from the RM exercise.
Note: RM is a supervisory tool at the operational level that supports decision-making. Coverage data cannot be generalized and thus cannot provide
actual coverage estimates for the area.
� Vaccinate the unvaccinated, administer deworming drugs to those who had not received it, or give another intervention.
� Indicate that the community is covered.
� Vaccinate the unvaccinated, administer deworming drugs to those who had not received them, or give another intervention.
� Define the intervention strategy. � Finally, repeat monitoring until the target is reached.
Determine the number of preschool or school-age children who received vaccine(s) or deworming drugs
Visit selected houses in at-risk areas until obtaining information from 20 children
<95% vaccinated or<95% dewormed or
<95% other intervention
≥95% vaccinated or≥95% dewormed or
≥95% other intervention
Some reasons for not vaccinating or deworming relate to a lack of information or opposition by the child’s parent guardians to
receive vaccines or other indicated interventions. Others reasons relate to problems accessing health services; these should
be resolved by the health services themselves.
� Which monitoring exercises showed that >95% of children were vaccinated or dewormed? (Remember that this is not
vaccination or deworming coverage for the entire geographic area.)
� Which age group of children experienced the greatest delays?
� What explanations exist for the children not being vaccinated or dewormed?
� What reasons do participants give for not vaccinating or deworming their children?
One important indicator is the percentage of children with health cards or proof of vaccination or deworming. Having access
to children’s cards is essential to determining if their schedules are up to date and if vaccines or deworming drugs are
needed. In some countries, presentation of the vaccination card is required for school admission. By reviewing the proportion
of children with vaccination cards, health programs can analyze different aspects of service quality, such as availability
and delivery of the cards to children and the effectiveness of education given to families on the importance of keeping the
documents available and in good condition.

27
4.1. Report preparationConsolidated RM results and the measures adopted in response to findings are important for monitoring the performance of
programs and interventions. Accordingly, the report should indicate how many RM exercises showed adequate coverage in
the community, the main causes of non-vaccination or non-deworming, and the corrective measures that were implemented.
Table 7 shows a simple way of reporting results from local monitoring exercises.
District
Number of RM
conducted in children aged 1-4
years
Number of RM in which ≥95% of the children have complete
vaccination series for their age
Number of RMs with ≥95% of
the children dewormed
Most frequent reasons for Decisions
Series incomplete
Not dewormedVaccination Deworming
La Fuente 10 8/10 7/10 Went to health facility and it was closed; went to facility and they didn’t have the vaccine.
Did not know it was necessary
Analyze schedule and availability of vaccines to avoid missed opportunities.
Launch plan to explain to the population that periodic deworming is needed.
La Esperanza
15 14/15 14/15 Did not have time.
Child was sick at the time of vaccination.
Information and communication to the population.
Launch plan to explain to the population periodic deworming is needed.
Total 25 22/25 21/25
4.2. Discussion of the resultsLocal health teams should help to analyze the results in order to explain the findings, identify strategies to reduce the number
of children without access to health programs, and improve the quality of the administrative registries. Supervisors at the
national and subnational levels should be informed of the results and monitor accompanying recommendations.
Table 7. Report of results of monitoring of vaccination and deworming in preschool children
Step 4: Dissemination of the results
Preparation of the reportDiscussion of the results
Dissemination of resultsStep 4

28
5.1. Definition of strategiesBased on the results of the RM, study teams and health programs can make decisions that will affect the programs as a whole
(e.g., if results reveal that children in all programs are not being reached in monitored areas). They can also make specific decisions
for each program, as would be the case, for example, if vaccination coverage met the target but deworming coverage did not.
The RM should answer the following questions:
� Where is the best place to find children who have not been vaccinated or dewormed? In their homes? At schools? At
daycare centers? Elsewhere?
� What is the most effective way to reach these children? A mop-up campaign? Strengthening the routine vaccination
program in the health services?
� What actions or measures should be taken?
� Who should be involved in these measures?
5.2. Plan of actionIf the RM suggests that the campaign or regular vaccination or deworming programs are inadequate, the study team and
health programs must form a plan to redirect activities to achieve the desired objectives. If the exercise’s results are positive,
however, the team should analyze the successful strategies and activities, best practices, and lessons learned in order to
reinforce and share them in other regions.
In addition to the RM report and plan of action, the team should prepare objectives and activities to address identified
weaknesses. Health programs should take advantage of opportunities to resolve problems, define a timetable for completing
activities, arrange for the services of necessary personnel, and mobilize the resources needed to implement the action plan.
Local teams should contribute their experience and knowledge about their communities to the plan of action. Local data
sources supplement RM findings and help to identify discrepancies and similarities among sources. In addition, the study
team should consider qualitative information from RM fieldwork when analyzing interview data. Working closely with families
and communities helps to detect problems and to identify opportunities for improving coverage. Using this approach, teams
can generate recommendations based on real conditions in the communities.
Step 5: Decision-making
Definition of strategiesPlan of action
Decision-makingStep 5

29
Unit 2.Coverage Monitoring in Schools
Both health and education programs serve preschool and school-age children. Consequently, the coordination of health program activities with daycare centers and schools is a very effective public health strategy. Close collaboration between health workers and educators helps to improve coverage and provides educational opportunities for children and parents as well as teachers and school staff.
Coordinating efforts between local health teams and staff in daycare centers and schools helps to monitor school health programs
as well as immunization and deworming campaigns. Joint rapid monitoring efforts reinforce this collaboration by providing more
opportunities to evaluate program strengths and challenges and thereby potentially improve coverage of the target population.
When monitoring coverage in schools, teams may use school vaccination registries (in some countries, schools and daycare centers
keep the children’s health records). However, the quality of this information may vary. Some schools record different data than those
needed for rapid monitoring, and some registries may be incomplete or outdated. As a result, monitoring should be based on the
child’s vaccination or health card or another information source that makes it possible to determine if the child has received the
indicated interventions. In this case, RM serves to compare data on children’s health or vaccination cards to information in schools
or daycare center registries, helping both to gather outstanding data and to monitor and update the child’s schedule for vaccination,
deworming, or other interventions.
As in door-to-door RM, rapid monitoring in schools or daycare centers uses non-probabilistic or convenience sampling. RM may be
conducted in schools in emergency situations when the health team anticipates difficulty in achieving desired coverage for a given
intervention (e.g., in schools located in remote areas). The subjects and facilities to be monitored may also be selected randomly
from a list of establishments (2). Before initiating RM, teams should specify the type of registry, form, or card that will be used for
monitoring the school-age population. Doing so ensures that an appropriate data source for RM is available.
This unit outlines the steps for conducting RM at educational facilities using a non-probabilistic design in which schools are selected
by convenience.

30
Steps for conducting rapid coverage monitoring house to house
PlanningStep 1
Data collection and organizationStep 2
Data analysisStep 3
Dissemination of resultsStep 4
Decision-makingStep 5
Objectives: What, who, and when?Selection of the schoolsAdaptation of the instrumentsFormation of the teamsScheduling of the activitiesResources and logisticsCoordination and informationTraining of the teamsPilot test
Report apreparationDiscussion of the results
Definition of strategiesPlan of action
Tabulation and critical review of the dataCalculation of the indicatorsInterpretation of the results
Initiation of the fieldworkSelection of classrooms and studentsData recordingQuality control of the data
Step 1: Planning
PlanningStep 1
Objectives: What, who, and when?Selection of the schoolsAdaptation of the instrumentsFormation of the teamsScheduling of the activitiesResources and logisticsCoordination and informationTraining of the teamsPilot test

31
1.1. Objectives: What, who, and when? Defining the target population for RM dictates the type of establishment to be visited—i.e., daycare centers for preschool
children and schools for children aged 5-14 years—as well as the interventions to be monitored. RM can be used in schools
as a supervisory tool or during regular school hours to confirm coverage. The methodology is also useful following vaccination
campaigns and deworming rounds to determine if target populations were reached.
The following questions help to define the goals of RM:
� What are the administrative vaccination and deworming coverages by age group and geographic area?
� Which geographic areas need RM to confirm coverage?
� Which age groups should be analyzed—preschool children, school-age children, or both?
� Which vaccines must be verified during the monitoring exercise? For school-age children (aged 5-14 years), each country
or department/state has its own immunization schedule, and the study team should know which vaccines are administered
at what ages in order to choose the correct age group for RM.
� Should all vaccines in the basic series be analyzed, or only those used in a campaign?
� Which high-risk geographic areas require verification in the field?
� Have deworming rounds or other health interventions been implemented in
- If so, what deworming coverages were reported?
- If not, do populations in these areas need deworming or vaccination?
Responses to these questions define the target populations and interventions to be analyzed using rapid monitoring (Table 8).
Table 8. Target populations and interventions to be considered in RM at schools
What will be monitored?
Who will be monitored? Children aged:
5-9 years 10-14 years
Vaccination
Deworming of STH
Other intervention(s) (specify)
For monitoring in schools, children attending the educational center selected for monitoring do not always represent school-
age children in the geographic area. Such situations occur when enrollment drops below 95%, when children stop attending
the school, or when children go to the school but live in other areas. Monitoring in schools therefore provides information
about the selected institution. However, unlike door-to-door RM, the methodology does not necessarily provide information
about the geographic area. Nevertheless, it is a good strategy to monitor preschool or school-age children. Compared to
other strategies, RM is more efficient, less expensive, and logistically simpler because the target population is located in a
single institution.

32
1.2. Selection of schools There are two ways to select schools for RM. One is convenience sampling. The other is based on schools in the sentinel
surveillance network for STH.
Convenience sampling is used when no sentinel STH surveillance has been done. Alternatively, the methodology can be used
even in areas with sentinel surveillance, when national or subnational decision-making criteria favor selection of schools by
convenience sampling rather than the use of sentinel schools as a framework for sampling.
1.2.1. Convenience sampling Selected schools should be those at the greatest risk, as judged by the supervisor of the monitoring exercise, or those
requiring a review of coverage data based on the following criteria:
� Peri-urban areas near poverty belts.
� Border areas between health facilities or countries.
� Areas with geographic and/or social barriers that impede access to health services by people living in settlements that are
not legally recognized, recently established squatter communities, or communities that receive immigrants, among others.
� Areas with large transient populations, or bedroom communities in which residents go elsewhere during the day and return
at night, suggesting that children may be attending schools away from their homes and where their immunization records
are stored.
� Areas with underserved populations and/or where there is reasonable doubt about the quality and coverage of vaccination,
deworming, or other health services.
� Areas with consistently low coverage, coverage >100%, or high dropout rates from the immunization or deworming series.
Another important selection criterion is any recent report of suspected or confirmed VPD cases. Schools in the area of the
reported cases, or schools attended by children living close to areas frequented by the patients under investigation, should be
selected for RM.
As noted, RM is not based on probabilistic sampling. Consequently, if the monitoring area is very large (e.g., capital cities
or high-density municipalities), the study team should select a larger number of schools to expand the monitoring area. To
this end, the team should obtain a comprehensive overview of the entire area, identifying critical localities and corresponding
schools where monitoring should be initiated. Because the selection of schools is based on qualitative criteria, schools near
health services in areas that are assumed to have high coverage should not be excluded. All types of areas should be part of
the analysis.
1.2.2. Selection of schools for sentinel surveillance of soil-transmitted helminth infectionsOne methodology recommended for monitoring progress of STH control is sentinel surveillance of parasitological indicators
(prevalence and intensity of infections) at schools. At both fixed and mobile sites, schools are randomly selected in areas
where STH are endemic or where the population is at risk for infection (e.g. due to limited access to safe water and basic
sanitation, dirt floors, the practice of walking barefoot, or challenges in maintaining personal hygiene). These are also areas
with similar ecological conditions—moisture, precipitation, vegetation, etc.—that facilitate STH transmission. Fixed sentinel
schools are monitored throughout the program for STH control; conversely, mobile sites change every year. In sentinel
schools, stool samples are collected from children and information is collected about the risk factors associated with STH.
This type of sentinel surveillance is recommended every two years, depending on the availability of resources (3).
At each fixed or mobile sentinel school, stool samples are obtained from 50 children aged 8-9 years. Children of this age
group are chosen because they have had extended exposure to infection and reinfection and have likely already received
deworming drugs, meaning that changes in their parasitological indicators due to interventions should be detectable.

33
This low-cost surveillance method provides quality information that helps to monitor deworming coverage (4). For the RM
exercise, the country or RM coordinator may decide, for convenience, to choose schools already participating in the sentinel
surveillance system. By integrating activities at the same site, the study team may consolidate resources for monitoring,
reducing the time needed to conduct the study. However, the team must decide when to conduct monitoring in schools,
since sentinel monitoring for prevalence usually occurs before a deworming round or campaign, whereas RM is typically done
immediately after the activity.
1.3. Adaptation of instrumentsAnnex 6 is a form to collect and add up coverage data, as well as the reasons provided for why children are not up to date on
their series or have not received deworming medicines. The same form can be used to prepare the report on field activities.
The form should be adjusted to actual community conditions, the monitoring exercise’s objectives, and the interventions
being monitored. Prior to initiating the RM, the team should conduct a pilot study to verify that the methodology and surveying
instruments will provide the required data. Tools should be adapted as necessary.
1.4. Team formation The team includes a coordinator and interviewers to gather the data that will be analyzed and presented in the report. If the
RM exercise is conducted in sentinel schools for STH, the team must clearly define when the exercise will be done because
stool samples for surveillance are collected before the deworming campaign and at least six months following the last
deworming rounds, while RM is done immediately after the campaign. Close coordination with schools is critical.
Team member roles and responsibilities are described below.
Coordinator
� Contact community leaders and health and education authorities, obtaining permission for fieldwork and coordinating
relevant activities.
� Organize logistics and resources for data collection.
� Oversee the quality of data recorded on forms.
� Summarize data and prepare a preliminary report to school administrators, teachers, health authorities, and the community.
� If the selected schools are sentinel surveillance sites for STH, maintain close contact with the professional responsible for
surveillance and STH control at the national or subnational level.
Field team (interviewers)
� Record data on all appropriate forms.
� Identify unvaccinated or non-dewormed children.
� Prepare forms for recording data and supplies and equipment (vaccines, cotton, syringes, vaccination or health cards,
deworming drugs, etc.).
� Review children’s health information on file at school (e.g., cards), recording data on forms.
� Update health cards with information on the vaccines and deworming drugs administered to children during the RM exercise.
� Follow proper biosafety and handling instructions to dispose of any materials that should be discarded or destroyed.
Ideally, field team members should be local personnel. In addition to their familiarity with the area, local personnel provide
points of contact and follow-up in each school.
The team conducting the RM exercise should have an initial meeting with the school’s administrators to explain the purpose of
the exercise and request access to the school’s health registries.

34
A supervisor should be assigned to each field team. The supervisor’s roles include supporting and organizing the work,
addressing any concerns, and verifying data quality.
1.5. Scheduling of activities Once a school is selected, the field team should contact the school and district or municipal health authorities and schedule
a meeting to obtain permission for conducting RM at the school, explain the exercise’s objectives and procedures, request
a list of students, answer any questions, and receive any pertinent feedback. The team should explain the importance of RM
to parents and students, along with the benefits of participation. These meetings set the stage for the RM activities and work
schedule.
1.6. Resources and logistics There should be a list of schools within the health facility’s assigned area where the RM will be done, including any schools
functioning as sentinel surveillance sites. The study team should also review health facility records on any interventions
conducted in schools.
To determine what materials and logistical resources are needed, Annex 2 provides a checklist to prepare for fieldwork,
including materials and supplies.
1.7. Coordination and informationBefore directly approaching principals of the schools selected for RM, the field team should contact relevant officials in the
school system. A letter should be sent to the principal explaining the project and outlining dates and logistics. In addition,
teachers should receive copies of a note for students to take home requesting parental permission to participate in the
exercise.
For the RM, the school’s principal should be contacted in advance and asked to tell the students to bring in their health cards
or proofs of vaccination and/or deworming prior to the monitoring exercise, so that the documents are available when the
health team arrives.
Before the visit, the field team should request that the teacher or school administrator explain the monitoring exercise’s
purpose to the students and their parents or guardians. The team should also ask the school to provide the information it
regularly collects on the children’s vaccination and deworming histories, including dates of treatments.
1.8. Training of the teams The teams conducting RM activities in schools should receive training on the theoretical and practical aspects of the
methodology, including activities to implement in schools, the information that should be given to each teacher and student
prior to the interviews, the proper way to record the information on forms, how to end each classroom visit, how to tabulate
and consolidate data, and each team member’s role and responsibilities.
1.9. Pilot studyA pilot study should be conducted to validate the surveying instruments and ensure that interviewers easily understand
the tools and that data can be recorded with a minimum risk of errors. For this purpose, the study team should test the
methodology exactly as it has been designed in a convenient school. Any necessary adjustments can then be made.

35
Initiation of the fieldworkSelection of classrooms and studentsData recordingQuality control of the data
2.1. Initiation of the fieldworkThe monitoring team should meet at the health facility corresponding to the area where the school is located. At the initial
meeting, team members should review logistics, agree on the schedule, and prepare the materials needed to conduct the
RM. Supervisors should give detailed instructions and share contact information with the team.
On arriving to the school, the field team coordinator should meet with the principal to discuss the data collection plan. Once
the plan has been reviewed, interviewers may proceed to the classrooms, introduce themselves to teachers and staff, and
begin gathering data. Data collection involves requesting and reviewing available health records and interviewing children.
Classrooms may be randomly selected.
2.2. Selection of classrooms and studentsBefore arriving to the school, the coordinator and the field team should know which vaccines, drugs, or interventions will be
monitored and thus the age group of the children interviewed in the monitoring exercise. Based on the age group, the team
should ask the principal and (if necessary) the teachers the questions below, and select students and classrooms accordingly:
1. Which grades or courses have children of the target age group? This information makes it possible to select the
classroom. For example, if the RM will monitor administration of the second DPT booster, the target population will be
children aged 4-6 years, who should be in preschool, kindergarten, or first grade classrooms. If the RM will monitor
tetanus-diphtheria toxoid vaccine (Td), the target population will be children aged 10 years (i.e. fifth grade). If the vaccine
against human papilloma virus is being monitored, children aged 9 years (i.e., fourth grade) are the likely study population.
To monitor administration of deworming drugs, any group selected for monitoring a vaccine is acceptable. However, the
ages and grades to undergo monitoring in the school depend on the country’s immunization and deworming schedules.
2. How many classrooms in the grade will participate in the RM exercise? At least one classroom should be selected for
each participating grade. If there is more than one classroom for the same grade, the team should randomly select a
classroom using one of several methods—e.g., drawing straws (each classroom in the grade is assigned a number, the
numbers are placed in a bag, and one is drawn) or using a random number table, as described in Module 5. Although
it is recommended to choose at least one classroom, since the method is based on convenience sampling, the team
coordinating the RM may choose as many classrooms as necessary.
3. How many children are in the selected classroom? The team can obtain this number in the classroom and record it on the
corresponding form. All children in the classroom, regardless of the number, must be included in the exercise.
Step 2: Data collection and organization
Data collection and organizationStep 2

36
2.3. Data recordingIn addition to collecting data for RM, health teams should give vaccines or deworming drugs to children needing these
interventions. Each child should be asked if he or she was vaccinated and, if so, to present his or her health card or proof of
vaccination. Teachers should have copies of children’s health cards available for review. If children do not know the answer to
the survey questions, the interviewer should ask the child’s teacher to provide the necessary information.
Table 9 shows a sample data collection form in a municipality where vaccination and deworming coverage were monitored.
Table 9. Recording data from coverage monitoring of vaccination and deworming in schoolchildren
Number of schools
Number of students in the
classroom
Children vaccinated with tracer
vaccine,a campaign
vaccine,or had
complete series fortheir ages
Number of schoolchildren dewormed in the past year
Reason why series was incomplete or child was not dewormed
1.) Did not know it was necessary. 2.) Did not know where to go to get child vaccinated or dewormed. 3.) Did not have time. 4.) Refused vaccination/ deworming. 5.) Child was sick. 6.) Child has a contraindication. 7.) Health personnel refused to vaccinate/deworm. 8.) Went to the health facility and it was closed. 9.) Went to the health facility and they did not have vaccine/ deworming drugs. 10.) Other (specify).
Incomplete series Not dewormed
1 30 28 20 3-3 1-1-1-1-5-1-1-1-1-1
2 35 28 25 3-3-3-6-8-8-8 1-1-1-5-5-1-1-1-1-5
3 40 30 28 1-3-3-1-1-4-1-8-8-8 1-1-1-4-1-1-2-2-1-2-1-1
4 35 28 27 3-3-1-1-8-8-1 2-1-2-4-1-1-1-1
5 35 31 25 4-4-3-4 1-1-4-4-1-4-1-1-1-1
Total 175 145 125 N=30 N=50
Percentage of schoolchildren vaccinated = 83
Percentage of schoolchildren receiving deworming drugs = 71
Reasons given for: 1 2 3 4 5 6 7 8 9 10 Total NOT vaccinated /NOT dewormed
Incomplete series 7 - 10 4 - 1 - 8 - - 30
Not dewormed in the past year 36 5 - 5 4 - - - - - 50
2.4. Quality control of the dataOnce data for each child have been obtained, team members should carefully check the vaccines and number of doses
administered, as well as the dates of any deworming drugs gives. This review ensures that the information has been recorded
correctly.

37
If the information on the card is unclear, the data are not considered valid. In these cases, teams should try to find another
data source (e.g., health facility registries, which can be reviewed after visiting the schools).
Each monitoring team’s supervisor should confirm the quality of the data collected and deliver the correctly tabulated forms
from each school to the coordinator of the monitoring exercise.
3.1. Tabulation and critical review of the dataTabulation is the sum of all data collected in each RM exercise, keeping in mind that the data cannot estimate coverage due
to the lack of probabilistic sampling. Despite this limitation, RM results help to determine if more children than expected were
not vaccinated or dewormed in the population of the target area. Data should be tabulated for each school participating in the
monitoring activity.
During tabulation, study teams should evaluate the quality of data recorded on the RM forms. If quality is high, the results can
be considered an accurate assessment of the coverage of the monitored interventions and the causes for lack of vaccination,
deworming, or other interventions monitored.
3.2. Calculation of indicatorsThe percentage of children immunized with each vaccine is calculated by dividing the number vaccinated by the total number
of students in the classroom(s) where the RM was conducted. The same calculation is performed for the percentage of
children receiving deworming drugs.
Please see below for the calculation of important indicators:
Total no. of preschool or school-age children vaccinated by type of vaccine
Total no. of preschool or school-age children evaluated at each school x 100
Step 3: Data analysis
Data analysisStep 3Tabulation and critical review of the dataCalculation of the indicatorsInterpretation of the results

38
Total no. of preschool or school-age children with complete immunization schedules
Total no. of preschool or school-age children evaluated at each school x 100
Total of preschool or school-age children who received deworming drugs
Total no. of preschool or school-age children evaluated at each school x 100
The next step is to indicate which classrooms did and did not achieve the target coverage and the reasons for delays. Data
from each school can be consolidated in a single table or form.
3.3. Interpretation of resultsFigure 6 shows the process of interpreting results and making decisions.
Figure 6. Algorithm for interpreting the results of coverage monitoring in schools and criteria for decision-making
� Vaccinate the unvaccinated; administer deworming drugs to those needing them.
� Indicate that the school visited is covered.
� Vaccinate the unvaccinated; administer deworming drugs to those needing them.
� Define the intervention strategy. � Finally, repeat the monitoring until the target is
reached.
Determine the number of schoolchildren who received vaccine(s) or deworming drugs
Visit at least one school in at-risk areas to obtain information on 50 children in each school
<95% vaccinated or<95% dewormed
≥95% vaccinated or≥95% dewormed

39
Coverage analysis in schools should answer the following questions:
� In which schools were ≥95% of children vaccinated or dewormed?
� Which age groups and children experienced the greatest delays?
� What possible reasons explain why children were not vaccinated or dewormed?
� What reasons did participants provide for not being vaccinated or dewormed?
In interpreting results, the study team should consider data limitations and the scope of the investigation. For example, teams
may want to consider the proportion of children without health cards who could not be evaluated. Additionally, for RM in
educational facilities, the school may not have information on why the series was delayed.
4.1. Report preparationCoverage monitoring reports should be consolidated and submitted to the national level for inclusion in the analysis of
integrated public health activities for children aged <15 years. This information is essential for evaluating program and
campaign performance at the subnational and national levels and for preparing the integrated action plans that supervisors
will monitor. The RM should generate reports showing how many monitoring exercises had adequate coverage of children, the
main reasons for non-vaccination or non-deworming, and the actions taken in response.
Results and the report will be analyzed in meetings with relevant school personnel in order to decide on the actions and
strategies to be adopted. Annex 7 is a model form to report the results and decisions made.
As data monitoring reveals barriers to achieving coverage goals, the exercise should not only produce quantitative results
but also identify the most appropriate strategies to overcome these obstacles. Table 10 is an example of how to present the
consolidated results of the monitoring exercise.
Step 4: Dissemination of the results
Dissemination of resultsStep 4 Report apreparationDiscussion of the results

40
Table 10. Consolidation of data from the monitoring of school coverage, by school,
and decisions made based on the findings
School no.
Schoolchildren vaccinated
with a tracer vaccine or with complete series for their age (%)
Schoolchildren who received deworming
drugs during the past year
(%)
Reasons given for incomplete
series* (No. and %)
schoolchildren dewormed in the past year
Reasons given for not
receiving deworming treatment* (No. and %)
Decisions
Vaccination deworming
1 93 67 1. Did not know it was necessary.n = 7 (23%).
3. Did not have time. n = 10 (33%).
4. Refused to let child be vaccinated.n = 4 (13%).
6. Child has a contraindication. n = 1 (3%).
8. Went to the health facility and it was closedn = 8 (27%).
1.Did not know it was necessary.n = 36 (72%);
2. Did not know where to receive vaccination/ deworming.n = 5 (10%);
4. Refused to let child to be dewormed. n = 5 (10%);
5. Child was sickn = 4 (8%)
Launch strategy to educate teachers, schoolchildren, and families on the importance of vaccination and the series that schoolchildren need to complete. Revise vaccination schedules in health facilities to minimize lost opportunities.
Implement a plan to educate teachers, schoolchildren, families, and the community on the effects of parasitic diseases and the treatment schedules, including information on the public health situation in those areas and the preventive measures that must be taken.
2 80 71
3 75 70
4 80 77
5 89 71
Total for the school 83 71
* The data on the reasons why the schoolchildren did not have complete immunization schedules or were not dewormed are shown in Table 9.
4.2. Discussion of the results Findings should be discussed not only with local health workers in the area where the school is located but also with
principal and teachers. Once the report is completed, there should be practical ways to share it with the children’s parents or
guardians. Children may even be invited to participate in the discussion. Overall, the analysis is an opportunity to emphasize
the importance of vaccination, periodic deworming, and other hygiene and health protection practices.
Results of the monitoring evaluation should be communicated outside the health sector to other institutions, organizations,
and community stakeholders, such that the population is kept up to date on progress in coverage and is invested in ongoing
improvement efforts.

41
5.1. Definition of strategiesAnalyzing and discussing results with different professionals involved in vaccination or deworming provides the basis for
answering the following questions, which help to define strategies in the plan of action:
� Where is the best place to reach children who have not been vaccinated or dewormed? Home? Schools? Daycare
centers? Somewhere else?
� What is the most effective approach for reaching them? A mop-up campaign? Reinforcement of the regular vaccination
program?
� What actions or measures should be taken?
� Who should be involved in these measures?
To emphasize the importance of keeping the vaccination and deworming schedules up to date, parents should be informed
of the study results. A note can be sent to each child’s parents or guardians, asking them to take their children to the nearest
health center to ensure they have received all recommended interventions.
5.2. Plan of actionIf RM suggests that the campaign or the regular immunization or deworming programs are inadequate, the study team and
health programs must form a plan to reorient activities to achieve the desired objectives. If the exercise’s results are positive,
however, the team should analyze the successful strategies and activities, best practices, and lessons learned in order to
reinforce and share them in other regions.
In addition to the RM report and a plan of action, the team should prepare objectives and activities to address identified
weaknesses. Teams should take advantage of opportunities to resolve problems, define a timetable for completing activities,
arrange for the services of necessary personnel, and mobilize the resources needed to implement the plan.
In preparing the plan of action, local teams should contribute their experience and knowledge about their communities.
Local data sources supplement the findings of the RM and help to identify discrepancies and similarities between sources.
In addition, the qualitative information from RM fieldwork should be considered when analyzing interview data. Working
closely with families and communities helps to detect problems and identify opportunities for improving coverage. Using this
approach, teams can generate recommendations based on real conditions in the communities.
Step 5: Decision-making
Definition of strategiesPlan of action
Decision-makingStep 5

42
1. Teixeira AMS, Samad SA, Souza MA, Segatto TC, Morice A, Flannery B. Monitoring of vaccination coverage during a
national rubella elimination campaign. Rev Panam Salud Publica. 2011;30(1):7-14.
2. Dietz V, Venczel L, Izurieta H, Stroh G, Zell ER, Monterroso E, et al. Assessing and monitoring vaccination coverage levels:
lessons from the Americas. Rev Panam Salud Publica. 2004;16(6):432-42.
3. Izurieta H, Venczel L, Dietz V, Tambini G, Barrezueta O, Carrasco P, et al. Monitoring measles eradication in the Region of
the Americas: critical activities and tools. J Infect Diseases. 2003;187(Suppl 1):S133-9.
4. World Health Organization. Helminth control in school age children: a guide for managers of control programmes. 2nd ed.
Geneva; 2011. p. 48.
References

43
Annex 1: Operational definitions
In applying monitoring methodologies, standardized operational definitions are needed to prepare data collection instruments
and obtain and analyze information. The following definitions are essential:
Acceptable house: house inhabited both by a child in the target population and an informant who can provide the
information required in the interview. Informants are considered adults aged >18 years who are responsible for the child’s care
and well-being. In addition to parents, they may include grandparents, aunts and uncles, other family members, and friends. If
nobody at home can provide the needed information, the house is excluded from the monitoring exercise and classified as an
unacceptable house.
Cluster: collection of units (e.g., houses, communities, or cases) grouped together within clearly defined geographic or
administrative boundaries.
Eligible house: house in which a child of the age defined for the monitoring activity lives.
House: dwelling occupied by a group of people who may or may not be related to each other.
Person who has been vaccinated or received deworming drugs: any person who can demonstrate a history of having
received vaccines or deworming drugs by presenting a health card or proof of vaccination or whose information has been
confirmed in administrative registries (hard copy or electronic records) or by verbal verification criteria.
Preschool age population: children aged 1-4 years.
Resident: person, who at the time of the visit, lives in the house and community.
School-age population: children aged 5-14 years, regardless of whether they attend school.
Annexes

44
Annex 2: Fieldwork checklist
Element Description Confirmed
Yes No
Field team formed and trained
Each team should have: � A leader to coordinate the team members’ work and communicate with the
general coordinator. � Interviewers to collect data. � A person, possibly from the community, to guide interviewers and to go from
house to house indicating which homes are acceptable. � Personnel to vaccinate or give deworming drugs to children needing these
interventions. � If conducted in schools, teachers may be invited to participate in the RM
exercise. All team members should have participated in the training sessions and be fully familiar with their duties and responsibilities.
Data collection materialsEach team should have enough data collection forms, pencils, a clipboard, a copy of the immunization schedule, a bag to hold these materials, informational materials to provide the public, etc.
Maps and information about the area
Maps and sketches to identify the houses and schools and a list of telephone numbers of local authorities or school administrators in case they must be contacted.
Supplies for administering vaccines, treatment, etc.
A thermos containing vaccines, syringes, and other supplies for administering immunizations and deworming drugs; forms for recording vaccines or deworming treatments; and cards to give people who receive vaccines or deworming drugs.
TransportationVehicles to transport field teams with drivers who understand the purpose of the trip and are familiar with the area to be monitored. Vehicles should have a good supply of fuel and be in good working condition to avoid accidents or delays.
FoodFood and water for the field team, either rations to bring to the field or money to buy supplies.
Lodging If the areas to be visited are far away and the team must be away for several days, there must be arrangements for suitable lodging. Funding must also be available.
Pay The budget should be sufficient to ensure that all personnel are compensated on a timely basis.
Safety Each team member should be identified as a health official. The situation in the area under monitoring should be considered. If necessary, local guides or security personnel should be available to support the team.
Protection against environmental risks
If the weather is unfavorable, as in the case of extreme heat, personnel should be protected with sunscreen and have adequate fluids to prevent dehydration. If rain is forecasted, rain gear and umbrellas should be provided.
Communication Cell phones are needed to communicate with coordinators and supervisors in order to resolve any situation that may prevent the study from being completed.
Coordination and reports to local authorities
Local authorities should be aware of the activity and be asked to let the population know that that they will be visited in their homes. This facilitates data collection and helps to prevent participant refusal due to fear or misinformation. If RM is done in schools, the team should coordinate with administrators and teachers before the visit. This helps to ensure that the students bring their vaccination cards, thereby facilitating the team’s work.
Supervision All fieldwork should be supervised, meaning that supervisors should be designated and trained in advance. Supervisors should have access to the standard tools needed to manage the field team.

45
Annex 3: Form for recording data from rapid monitoring of vaccination, deworming, or other interventions, from door to door
Department or state: Municipality/District:
(A) (B) (C) No. of children vaccinated (D)(E) Reason why child does not have the complete vaccination series, was not dewormed, or did not
receive the other intervention
1.Did not know it was necessary. 2.Did not know where to go to get child vaccinated or dewormed. 3.Did not have time. 4.Refused vaccination/ deworming. 5.Child was sick. 6.Child has a contraindication. 7.Health personnel refused to vaccinate/deparasitize. 8. Went to the health facility and it was closed. 9.Went to the health facility and they did not have vaccine/ deworming treatment. 10.Other (specify).
House No.
No. of children
aged 1-4 years
living in the home
BCG DTP1 DTP3 IPV1 Polio3 Hib3HepB3
MMR1Complete series for
age
No. of children
dewormed in the past
year
Series incomplete
Not dewormedNot receiving other
intervention
Total
% of children vaccinated (C/B*100)=
BCG DPT1 DPT3 IPV1 Polio3 Hib3 HepB3 Complete series
% of children dewormed (D/B*100)=
% of children who received the other intervention (E/B*100)=
Reasons cited (E): 1 2 3 4 5 6 7 8 9 10
Total not vaccinated, not dewormed, or not receiving another intervention
Vaccination series incomplete
Not dewormed in the past year
Did not receive another intervention
Responsible representative: Signature: Date:

46
Department or state: Municipality/District:
District
No. of RMs conducted in children aged 1-4
years
No. of RMs showings ≥95% children vaccinated with:No. of RMs
showing ≥95% of children
dewormed
No. of RMs showing ≥95% of children received
other intervention
Most frequent reasons for: Decisions made
DTP1 DPT3 IPV1 Polio3 Hib3 Hep B3 MMR1Complete series for
age
Incomplete series
Not dewormed
Not receiving
other intervention
Vaccination dewormingOther
intervention
Total
Responsible representative: Signature: Date:
Annex 4: Form for reporting the results of rapid monitoring of vaccination, deworming, or other interventions, from door to door

47
Annex 5: Reasons why a child was not vaccinated
Reasons attributable to the knowledge, attitudes, and practices of the health workers:
� The doctor or nurse told me the child could not be vaccinated because he/she was sick.
� The doctor or nurse told me the child was already vaccinated, had completed the series, or was not due to receive any
vaccines.
� The doctor or nurse did not want to give the child so many injections at the same time.
� The health workers did not ask me about it.
Reasons attributable to health and immunization services:
� The vaccination site is too far away for me.
� The day we went was not a vaccination day.
� The dates and times when vaccination is offered are limited.
� The vaccination area was closed.
� The person in charge of vaccination was not there.
� There were no vaccines.
� There were no syringes or other vaccination supplies.
� The wait time was too long.
� The treatment or service provided by the health workers was not appropriate.
� I did not bring the vaccination card.
Reasons attributable to the knowledge, attitudes, and practices of the child’s family or guardian:
� The child was sick at the time he/she was supposed to be vaccinated and it was not done.
� I don’t want my child to be injected with two different vaccines.
� I don’t have time.
� I forgot.
� Vaccines are not necessary or I don’t believe in vaccines.
� The child has completed his/her series.
� Someone in the family/someone I know had a bad experience.
� The last time my child was vaccinated he/she got very sick or had a reaction.
� A family member, a trusted adviser, or a healer told me not to have my child vaccinated.
� Vaccines can cause illness or discomfort.
� It’s against my religion.
� I don’t trust the vaccines at health facilities.
� I don’t trust the people at the health facility.
� I didn’t take the child to be vaccinated.
� The child was not due to be vaccinated.

48
Annex 6: Form for recording data from rapid monitoring of vaccination and/or deworming in schools
Department or state: Municipality/District:
(A) (B)(C)
Nº school vaccinated(D)
(E) Reason why child does not have the complete vaccination series or was not dewormed
Classroom no.
No. of children in classroom
BCG DPT5 Polio4 Hep.B3 MMR1 MMR2Complete series for
age
No. of children
dewormed in the past
year
1.Did not know it was necessary. 2.Did not know where to go to get child vaccinated or dewormed. 3.Did not have time.
4.Refused vaccination/ deparasitization. 5.Child was sick. 6.Child has a contraindication. 7.Health personnel refused to vaccinate/
dewormed. 8. Went to the health facility and it was closed. 9.Went to the health facility and they did not have vaccine/ antiparasitic
treatment. 10.Other (specify).
Series incomplete Not dewormed
Total
% of children vaccinated (C/B*100) =
BCG DPT5 Polio4 Hep B3 MMR1 MMR2 Complete series
% of children dewormed (D/B*100) =
Reasons (E) cited: 1 2 3 6 7 8 9 10Total not vaccinated/not dewormed
Vaccination series incomplete
Not dewormed in the past year
Responsible representative: Signature: Date:

Annex 7: Form for reporting the results of rapid monitoring of vaccination and/or deworming in schools
Department or state: Municipality/District:
School
No. of classrooms
No. of children
evaluated
% of children vaccinated with:
% of children
dewormed
Most frequent reasons for: Decisions made
Total Monitored BCG DTP5 Polio4HepB3
MMR1 MMR2Complete series for
age
Incomplete series
Not dewormed Vaccination Deworming
Total
Responsible representative: Signature: Date:

Tools for monitoring the coverage of integrated public health interventions
Vaccination and deworming ofsoil-transmitted helminthiasis
Analysis ofData Quality
Module 4

Tools for monitoring the coverage of integrated public health interventions
Vaccination and deworming ofsoil-transmitted helminthiasis
Analysis ofData Quality
Module 4

4
Table ofContents
Tables and Figures
Annexes
Introduction
Unit 1. Analysis of data quality
Step 1: Planning
1.1. Objectives: What and where?
1.2. Selection of centers for evaluation
1.3. Adaptation of the instruments
1.4. Team formation
1.5. Programming of activities
1.6. Resources and logistics
1.7. Coordination and information
1.8. Training of the teams
1.9. Pilot test
Step 2: Data collection
2.1. Visits to data management centers
2.2. Interviews
2.3. Data collection and processing
2.4. Quality control of the data
Step 3: Data analysis
3.1. Analysis of regulations and existing data
3.1.2 Forms and information systems in use
3.2. Flow of immunization data
3.3. Congruence of data from different sources
3.4. Completeness and timeliness of reports
3.5. Evaluation of the quality of the information system and data use
3.6. Evaluation of the electronic nominal vaccination registry
3.7. Denominators
6
7
8
11
12
13
16
17
17
17
18
18
18
18
19
19
19
19
20
20
20
21
23
27
34
34
36
37

5
Step 4: Dissemination of the results
4.1. Preparation of the report
4.2. Discussion of the results
Step 5: Decision-making
5.1. Definition of strategies
5.2. Plan of action
References
37
37
37
38
38
38
39

6
Recommendations for applying quality analysis tools to data from integrated public health interventions.
Operational definitions used in data quality analysis.
Main elements of data quality assessment.
Algorithm for analyzing quality of coverage data from integrated public health interventions.
Possible causes of problems in information systems and results generated by the data.
Levels of verification and evaluation of data quality.
Examples of daily dose registration forms.
Examples of nominal registries in notebooks or card files for follow-up of doses in the series.
Example of system flow for monitoring regular program vaccination coverage.
Example of system flow for monitoring coverage during campaigns.
Example of system flow for monitoring a national nominal vaccination registry.
Example of system flow for monitoring vaccines or deworming drugs.
Verification factor as an accuracy indicator.
Example of presentation of results of data congruence analysis and calculation of verification
factor for vaccines.
Example of presentation of results of data congruence analysis and calculation of verification factor
for deworming drugs.
Example of presentation of data accuracy: Comparing health units from different departments.
Example of presentation of data accuracy: Comparing reported and verified doses of pentavalent 3
vaccine.
Example of presentation of data accuracy: Comparing reported and verified doses of deworming
drugs in one treatment round.
Example of presentation of data accuracy for pentavalent vaccines 1, 2 and 3: Comparing
municipal, departmental, and national data.
Example of presentation of data accuracy on the administration of deworming drugs, by treatment
round: Comparing municipal, departmental, and national data.
Spider chart presenting results of a data quality assessment.
Chart presenting results of a data quality assessment of different health units.
Table 01.
Table 02.
Table 03.
Figure 01.
Figure 02.
Figure 03.
Figure 04.
Figure 05.
Figure 06.
Figure 07.
Figure 08.
Figure 09.
Figure 10.
Figure 11.
Figure 12
Figure 13.
Figure 14.
Figure 15.
Figure 16.
Figure 17.
Figure 18.
Figure 19.
Tablesand Figures

7
Sheet for recording data and calculating the indicators of accuracy, completeness, and timeliness.
Calculating the verification factor at each level of the coverage monitoring system.
Form for evaluating quality of the coverage monitoring system of health units.
Form for evaluating the quality of the municipal coverage monitoring system.
Form for evaluating the quality of the departmental coverage monitoring system.
Form for evaluating the quality of the national coverage monitoring system.
Form for verifying data quality on preventive chemotherapy for STH, with guiding questions on data
verification and systems evaluation.
Form for verifying data quality on preventive chemotherapy for STH, with guiding questions on
systems evaluation.
Description of the Electronic Immunization Registry (EIR).
Form for evaluating quality of the Electronic Immunization Registry (EIR).
Annexes
Annex 01.
Annex 02.
Annex 03.
Annex 04.
Annex 05.
Annex 06.
Annex 07.
Annex 08.
Annex 09.
Annex 10.

8
As high-quality data are essential for monitoring effective access to health care, there is much talk today about the quality of
coverage data. In simple, practical terms, high-quality data reflect the real situation that they are intended to describe. There
is no “gold standard” against which data may be compared to confirm that they accurately represent reality; health programs
thus cannot directly evaluate data accuracy and precision. However, there are methodologies to analyze certain attributes of
data and information systems and thereby determine if data quality can be improved. These methodologies include the data
quality self-assessment (DQS) and data quality audit (DQA) (1,2). The present module describes the steps of applying these
methodologies (Figure 1).
Introduction
Figure 1. Algorithm for analyzing quality of coverage data from integrated public health interventions
ANALYSIS OF DATA QUALITY
Verify the quality of the data
OB
JEC
TIV
ES
TO
OL
SR
ES
ULT
SD
EC
ISIO
NS
Keep coverage high and uniform
Systematic, ongoing non-probabilistic analysis of administrative data obtained periodically or from rapid studies in the field
Analyze results of assessment of data congruence and quality
Congruence and quality inadequate
Analysis of possible causes
Interventions based on the problems detected
Congruence and quality adequate
Evaluate data congruence (supervision)
Evaluate the quality of the data (complete DQA/DQS)
Evaluate data congruence and the quality of the information
system (brief DQA)

9
Methodologies for analyzing the quality of immunization and deworming data have a common origin. In addition to drawing
on the literature on evaluating the data quality of vaccination and deworming1 programs and the tools for implementing these
evaluations, this module incorporates lessons learned from several countries in the Region of the Americas (3,4,5,6,7). Coun-
tries using either method separately should choose the most appropriate methodology in their situation, while countries using
both methodologies may observe overlaps between the two and should use the best tools in their nations.
The DQS methodology evaluates data quality and the quality of the coverage monitoring system, using a review of health
cards, registries, reports, files, and demographic data as well as an analysis of program information. To conduct the assess-
ment, the health program’s evaluation team creates indicators, uses data collection instruments, interviews key informants,
and makes field visits to observe how health workers record data and prepare reports. Based on results from these activities,
the team can make recommendations to improve data accuracy, timeliness and completeness of reporting, and the coverage
monitoring system.
The DQA methodology for neglected infectious diseases (NIDs) evaluates the 1.) Quality of data reported during the study pe-
riod and 2.) The ability of the data management systems to compile, transmit, document, and report high-quality information.
In DQA, teams do quality assessment by re-counting and verifying data in select centers, analyzing the availability, complete-
ness, and timeliness of the original reports and documents, and conducting qualitative evaluations of the NID data manage-
ment and reporting systems in different areas.
The Pan American Health Organization (PAHO) offers evaluations using the DQS methodology to its Member States, ei-
ther as specific assessments or as part of the international evaluation of the Expanded Program on Immunization (EPI). The
latter methodology is available at www.paho/org/immunization. The analysis of immunization data quality is based on self-
assessment (http:/apps.who.int/immunization_monitoring/routine/DqS_tool.pdf), and Member States may request the Spanish
version from PAHO. Finally, methodologies exist to evaluate deworming data quality, which are available in the protocol for
the WHO quality assessment of data on NIDs. Countries may request English and Spanish versions of these documents from
PAHO8.
Complete DQA/DQS evaluations are recommended every three to five years. But countries should also conduct periodic
analyses of specific components of the coverage monitoring system to follow up on results and recommendations from the
complete evaluations. In addition, health programs should create indicators to evaluate data congruence among the different
management areas studied during supervisory activities. Supervision is prioritized in areas identified as critical due to coverage
or data quality problems.
In summary, DQA/DQS evaluations should be integrated into the daily activities of health services to improve data quality and
program management. Table 1 summarizes the modalities and recommendations for using tools to analyze data quality of
public health interventions.
1 In these modules, the term deworming refers to the treatment of soil-transmitted helminthiasis.

10
Table 1. Recommendations for applying quality analysis tools to data from integrated public health interventions
When should the data quality analysis tool be used?
How often? At what level?
Full evaluation: During national or international program evaluations
� Every 3-5 years.* National and international.
Abbreviated assessment: After completing the report on regular program coverage or following a campaign
� At least once per year under direction of the national
level at certain subnational levels.
� Initially, every 3-6 months at the subnational level
to evaluate local performance. If there is evidence
of improved data quality, the frequency can be
reduced to once per year.
� At the end of campaigns.
National,subnational, and local.
Analysis of data congruence (supervision)
� During supervisory activities. Data congruence
should be analyzed and questions on the
supervision form should be added based on
problems identified in the full and abbreviated
assessments, with the goal of improving data
quality.
National, subnational, and local.
* Frequency of evaluation depends on program resources, improvements in program coverage levels, and results of data
quality assessments.
Following the mass administration of vaccines and/or deworming drugs, the evaluation team can simultaneously assess the
data quality of both interventions. However, in analyzing two integrated interventions following a campaign, the team must
consider the strategy used in each activity. If, for example, the campaign involved mass distribution of mebendazole or
albendazole and measles and rubella (MR) vaccine to preschool or school-age children, the team should only evaluate data on
these interventions; data on other vaccines administered to complete children’s immunization schedules are irrelevant.

11
Unit 1.Analysis ofData Quality
The use of concepts and instruments to evaluate data quality helps health programs to better
understand the causes of underlying problems and to identify solutions to improve the quality of
coverage data. Programs should regularly and systematically use tools to analyze coverage data quality,
incorporating them as integral components of supervision and evaluation activities. Health teams in all
involved areas, especially those at the local level—the point of entry to the system— should carry out
activities to ensure high data quality.
If coverage problems relate to the quality of information used in the estimates, evidence shows that improvements in data
quality can lead to improved coverage levels (9). Better data also facilitate more precise coverage calculations by group and
geographic area and help health departments to prioritize interventions.
High-quality data are essential for distinguishing between vaccinated or dewormed populations and those needing these
interventions. Additionally, high-quality data allow for better staffing of activities (i.e., number of staff needed to administer
vaccines in a given week or month); help to identify patients behind on their schedules, so they can be sent reminders
or captured in the field; and facilitate the analysis of health center service delivery and the workload of vaccinators and
deworming personnel. Finally, higher quality data may help to identify the main reasons for non-vaccination and non-
deworming.
To improve program logistics and provide more efficient service, the evaluation team should analyze data quality related to
the following factors: 1) supply management, 2) transportation, 3) cold chain (for vaccines), 4) monthly supply orders (or
another period of time), 5) availability of vaccines and deworming drugs in different areas, 6) monthly vaccine usage, 7) loss
rates and reasons for loss rates, 8) use of single- versus multi-dose vaccine vials or the management of deworming drugs
in multi-dose vials, in suspension, or as chewable tablets, 9) inventories and maintenance of cold chain equipment, and 10)
transportation of deworming drugs. Countries can adapt the DQS methodology to evaluate epidemiological surveillance and
other immunization-related data (e.g., vaccine protocols).

12
As mentioned in the introduction, Unit 1 focuses on the analysis of vaccination data quality in the regular program. However,
countries may use these tools following integrated vaccination and deworming campaigns. If this is done, the evaluating team
should analyze data quality from interventions that use mass-capture strategies, keeping in mind that the mass administration
of vaccines or deworming drugs in a short time period increases the chances of data errors or omissions. Furthermore,
campaigns often use ad hoc registration forms because of the large number of doses administered. Consequently, health
workers may not record data in nominal registries (either hardcopy or electronic), and the information flow may be different
than it would be in the regular program.
The first step is determining what intervention will be evaluated and where data will be collected and analyzed. Subsequently, the
study team must identify the centers to be studied and the indicators to be generated, develop instruments for recording and
tabulating data, prepare the training for the study team, make logistical preparations, and ensure the availability of resources.
Steps for the analysis of data quality
PlanningStep 1
Data collectionStep 2
Data analysisStep 3
Dissemination of resultsStep 4
Decision-makingStep 5
Step 1: Planning

13
1.1. Objectives: What and where? In establishing the evaluation’s objectives, the team should consider causes of problems in information systems that affect
data reliability. Figure 2 shows problems for consideration.
Source: Diagram adapted from WHO.
Figure 2. Possible causes of problems with information systems and results generated by the data
The data are not available when needed.
Results
The data do not serve their purpose they are inaccurate, incomplete, or out of date.
Tha data are adequate, but they are not being used
for decision-making.
The data collected are not always the data needed.
Possible causes of the problems
They are not very helpful for collecting, reporting, and analyzing the data.
The data are not always available where they are needed.
Personnel are not adequately trained in the collection, reporting, and use of the data.
The paper forms for collecting and reporting the data are not always available.
The data do not always provide sufficient analytical support.
There are no incentives to collect and use the data, or they can be falsified.
The data are difficult to analyze and interpret.
There is a lack of knowledge and skills for improving the monitoring systems.
Cu
rre
nt
syst
em
sT
oo
ls a
nd
te
ch
no
log
yH
um
an
Re
sou
rce
s
Objectives: What and where?Selection of the centers to be evaluatedAdaptation of the instrumentsFormation of the teamsProgramming of the activitiesResources and logisticsCoordination and informationTraining of the teamsPilot test
PlanningStep 1

14
Objectives of evaluating the information system and data flow include:
� Determining the capacity of the program’s data management systems to compile, transmit, document, and report high-
quality data.
� Determining the accuracy of data on the doses administered by analyzing the congruence between recorded and reported
data in different areas.
� Evaluating data completeness and timeliness.
� Establishing quality indicators for different components of the information system.
� Developing recommendations to improve data quality based on the coverage monitoring system’s strengths and weaknesses.
Table 2 provides standardized operational definitions for some of the data characteristics that could be evaluated.
Data quality
characteristicOperational definition
Accuracy Also known as validity. Accurate data are considered correct and measure what they are
intended to measure. Accurate data minimize errors (e.g., recording or interviewer biases,
transcription or sampling errors) to the point of insignificance.
Precision Data are sufficiently detailed and appropriate. If, for example, an indicator calls for the number
of individuals who received vaccines or deworming drugs by sex and age and if the information
system does not capture these variables, the system lacks precision.
Completeness of the
report
Measures the extent to which all recorded results are included. Completeness is the degree to
which all relevant persons or units are present.
Timeliness Data are timely when the information arrives on time—i.e., before the report’s deadline for submission.
Integrity Data have integrity when the information system is protected from deliberate biases or
manipulation for political or personal reasons. Integrity is reflected by the absence of any changes
in data between updates in a registry. Data integrity directly affects the accuracy of stored data.
Reliability Data generated by the program’s information system are based on protocols and procedures that
ensure that they remain unchanged regardless of who processes them or when or how frequently
they are evaluated. Data are reliable if they remain consistent when they are collected and measured.
Confidentiality Confidentiality means that patients are guaranteed that their data will be stored per national
and international standards—i.e., personal data are not disclosed inappropriately and printed or
electronic data are appropriately secured (e.g., kept in locked cabinets or password-protected files).
Source: Adapted from Global Fund, USAID, Measure Evaluation. Data Quality Audit Tool: Guidelines for Implementation, Sept 2008. Table 1. Data Quality
Dimensions. Available at: http://www.cpc.unc.edu/measure/publications/ms-08-29/at_download/document. (Reviewed 2014 Aug 7).
These characteristics are used to determine the accuracy, timeliness, and completeness of the registries and reports, as well
as the quality of the monitoring system itself (Table 3).
Table 2. Operational definitions used in data quality analysis

15
Table 3. Main elements of data quality assessment
ObjectiveArea
Type of measurementHealth unit Municipality
Assess the report’s accuracy x x Verification factor
Assess the registry’s accuracy (based on community sampling)
x Verification factor
Assess completeness and timeliness of reports
x x
Percentage of reports: � Completeness of data � Timely � Available at the national level � Complete in the health unit � Timely in the health unit � Available in the municipality (reports
from the health unit)
Evaluate quality of the monitoring system x Quality index
Assess quality of the health or registration card x Included in the quality index
Estimate vaccine loss and/or waste of deworming drugs
x xLoss of unopened vaccine vials in districts, or vials opened in the health unit. Number of deworming tablets wasted
Source: Adapted from WHO, The immunization data quality self-assessment (DQS) tool. Geneva: WHO; 2005, p. 2.
To develop the evaluation plan, the team should answer the following questions:
� At what levels will the DQA methodology be implemented?
- The health unit compared to the local level.
- The local level compared to the subnational and national levels.
� How many regions or departments, municipalities, and/or health units will be evaluated?
� If data quality in the regular program is evaluated, which vaccines and immunization schedules will be analyzed?
� If the evaluation occurs following an intervention or campaign, will data quality for several interventions be analyzed? If so,
which interventions?
� Will the evaluation be complete or focus on a specific characteristic (e.g., accuracy, timeliness, completeness of the report,
or quality of the monitoring system)?
� What data quality indicators must be generated for the evaluation? Remember:
- For a complete evaluation, the team should conduct situation analyses of the programs to identify the most relevant
components for analysis.
- If using data quality indicators for an abbreviated assessment or to evaluate supervisory activities, the team must
identify the data components whose results were highlighted as most important during the full evaluation.
- If done following a campaign, it is important to prioritize indicators to maximize the effectiveness (time and effort) of the
team conducting the evaluation.
� Which documents (forms, reports) must be collected at each level, and where must they be collected? Where are reports
stored? Are copies available at the sites of data collection or the sites that receive consolidated reports?

16
� What time period will be analyzed? The evaluation team should know if the regular program or a campaign will be evaluated
and be aware of any changes in the coverage monitoring systems. Remember that evaluating a longer time period means
more time for data collection during the site visit.
� Will the evaluation be an independent analysis with the participation of external evaluators, or part of regular supervision?
1.2. Selection of centers for evaluationIn selecting facilities, the evaluation team must understand the coverage monitoring system. The system usually has multiple
components, including data, persons, activities, and resources (e.g., computers and communication equipment). The
information system should not be confused with computer programs or software; these are considered system resources.
After characterizing the coverage information system, the team may select centers. The number of facilities chosen depends
on the evaluation’s objectives, disaggregation of the data, and the institutions involved in monitoring vaccination or deworming
coverage. Facilities may be selected randomly or using non-probabilistic or probabilistic sampling (1-2). In some cases, the
evaluation’s objective is not to gather information about a representative sample of centers—e.g., in a district suspected to
have serious data quality problems, the goal may be to identify the cause of these problems. In such cases, the study team
should select centers intentionally or using convenience sampling.
Evaluation of the systems
Evaluation of the systems
Evaluation of the systems
Dataverificataion
Dataverification
Dataverification
HEALTH UNIT
INTERMEDIATE LEVEL
Aggregation of the data
NATIONAL LEVEL
Figure 3. Levels of verification and evaluation of data quality

17
1.3. Adaptation of the instrumentsForms and spreadsheets are often used to collect information needed for a DQS/DQA. But they must first be adapted to the
objectives of the evaluation:
� Assess data accuracy by comparing data recorded on forms from different areas. For example, compare data from daily
lists of vaccines or deworming drugs given during a campaign in health units to aggregated data at the local, subnational,
and national levels.
� Assess completeness and timeliness by verifying that data and documents are complete and received by established
deadlines. Timeliness can also be assessed if the institutions receiving or issuing reports have recorded the date that the
documents were sent or received.
� Evaluate quality of the monitoring system through interview-based questionnaires and observation of select variables
to determine the quality of recording, filing, planning, analysis, and supervision.
Annex 1 is a model form for recording information to determine the accuracy, timeliness, and completeness of vaccination
data. If the country wishes to analyze congruence of data collected in health units, departments, and at the national level,
simpler registry forms can be used for abbreviated assessments and to evaluate supervisory activities.
Annexes 2-5 provide standard forms that countries may adapt for conducting interviews in order to compile and generate
quality indicators for the vaccination monitoring system. Countries may also tailor instruments for abbreviated evaluations
and supervisory exercises by selecting the questions from these forms that relate specifically to monitoring the data quality
improvement process. Annexes 6 and 7 are forms to evaluate deworming data quality.
Of note, the evaluation team must help to adapt and validate the selected instruments. Their participation gives them
confidence and helps them to take ownership of the tools.
1.4. Team formationThe professionals conducting the evaluation must be trained in the study methodology, become familiar with the vaccination
or deworming series, thoroughly understand the data flow, and be committed to using results to improve the program. Upon
starting to assess data quality, it is helpful to have the support of a peer—for example, an EPI nurse at the subnational level—
who may evaluate an equivalent area in his or her own workplace.
The evaluation team should include personnel from the Ministry of Health and other health programs, such as the EPI, NID
program, or statistics department. National, subnational, and local personnel should all participate.
It is recommended that two external evaluators be involved in the data collection process. Additionally, personnel from the
health facility under evaluation should participate due to their familiarity with the coverage monitoring system. If the exercise
involves analysis of deworming data, the professional responsible for receiving and distributing the deworming drugs should
be part of the team. Finally, a professional who speaks the local language should accompany the team to the service delivery
points, as some deworming drug distributors do not speak the country’s official language.
1.5. Programming of activities There are several stages in scheduling activities.
� Design workshop: A workshop to design the evaluation is recommended, with the first two days devoted to defining the
scope and objectives of the study. The workshop should last 3-4 days, depending on the needs in each area. Forms and
other tools should be validated in select sites before the evaluation, such that any adjustments necessary can be made
prior to implementation. The team needs certain documents and information to plan activities and prepare a work plan.

18
� Examples include:
- Regulations and protocols of the health programs under evaluation.
- Organization of the health system, including names of the departments, municipalities, and health facilities where
vaccines and/or deworming drugs are administered.
- Target populations of each health unit, municipality, department, and country.
- Description of the data flow, from registration to consolidation of results to preparation of the final report.
- Forms and spreadsheets for collecting and reporting data and forms to consolidate subnational data.
- Protocol, data collection forms, and Excel files for data collection and report preparation.
� Fieldwork: Three to five days should be reserved for teams to travel to health units and the selected areas under local or
subnational jurisdiction in order to collect data. Besides training team members in the methodology, health programs must
ensure the availability of the resources and logistics necessary for the work to go smoothly.
� Analysis workshop: Following data collection, the team should have two or three days to analyze results and prepare the
report. Subsequently, there should be a meeting to present results and recommendations to health authorities.
1.6. Resources and logisticsAll supplies necessary for workshops and fieldwork must be available, including forms, stationery, pencils, erasers, rulers, and
calculators. Contact information for the professionals responsible for the information system should be available in case con-
cerns or questions arise that require their assistance.
1.7. Coordination and informationThe evaluation team should obtain the authorizations necessary to collect data at all levels, including national, subnational,
and municipal, where the health units under evaluation are located. The team should inform local and subnational authorities
in selected health units of the time period that the study will occur, so that registries and appropriate documents are made
available.
1.8. Training of the teamsAll participants must be trained in the methodology, learn to use the forms, be familiar with the vaccination or deworming
schedules, and understand the data flow. Training should cover all of these topics, while reminding health workers of the
evaluation’s importance and reinforcing their commitment to use results to improve data quality.
1.9. Pilot testA pilot test should always be conducted before the evaluation to validate the instruments and make necessary adjustments.
Make sure to measure the time needed for data collection, so that sufficient time and resources are allotted for the fieldwork.

19
2.1. Visits to data management centersThe teams should visit sites at all levels of data aggregation, including the health units where primary data are recorded. It is
important that the selected facilities, whether in the public, private, or another sector, have reported data to the intermediate
level (i.e. department, state, province), so that teams can visit these centers to perform the appropriate monitoring. Health
facilities reporting information to municipalities that are not part of the evaluation should not be assessed.
The evaluation should be conducted in strict compliance with national ethical standards. Teams must review charts to count
and verify results, but confidentiality of patient information must be guaranteed.
2.2. Interviews Teams must be trained to use data collection tools and appropriate interviewing techniques. Interviewers should begin by
explaining the evaluation’s purpose and expected duration. Participants must have the opportunity to ask questions and
provide consent before starting the interview.
After all questions are answered, interviewers should transfer answers to an Excel spreadsheet designed for this purpose.
Subsequently, the team can calculate indicators and generate reports with tables and figures.
2.3. Data collection and processing Interviewers can use blank sheets of paper to verify the doses administered before recording information on the official form.
If the data show major discrepancies compared to the information originally reported, the evaluator should re-count the
doses to confirm that a mistake has not been made. Data may be recorded on printed forms or directly into Excel. Once
entered, the data are used to generate reports on the DQS/DQA indicators with tables and figures for each area of information
management. The complete process will be discussed later in the “Data analysis” section. Rulers, pencils, erasers, and pocket
calculators should be available to facilitate data extraction from daily registration forms.
The same data recording form should be used to note the absence of reports that health facilities or municipalities should
have submitted, and to record the dates that the reports were received from lower management levels.
Step 2: Data collection
Visits to the data management centers (health facilities, intermediate administrative levels)InterviewsData collection and processingQuality control of the data
Data collectionStep 2

20
In evaluating system quality, the interviewer should assign a score to each response in the questionnaire (one point for ‘yes,’
zero for ‘no’) and total the scores to obtain a rating for each category. Responses can then be entered into Excel to generate
a radar chart, or spider chart, with each spoke representing a data quality indicator on a scale of 1-5. If all responses for a
given indicator are positive, the corresponding spoke will be the color of the outermost border. Conversely, the spider web will
be colorless if all responses are negative. These types of figures help to compare different units within the same area or a unit
or area’s trends over time.
2.4. Quality control of the dataTwo professionals should review and sum the numbers in order to minimize errors. For additional quality control, the Excel files
should have automatic acceptance limits for scores in each question of the interview. If data vary significantly from the originally
reported figures, the evaluators should perform a re-count and confirm that a mistake in counting the doses has not been made.
3.1. Analysis of regulations and existing dataBefore reviewing the quality of vaccination and deworming data, the evaluation team must understand the regulations
governing the information system, immunization schedule, and type of deworming drug used, including any recent changes. If
regulations do not exist, health programs should begin the process of creating these norms.
The evaluation then begins with an analysis of administrative coverage, as described in Module 2. At minimum, the team
should analyze the following data and indicators.
Trends in numerators and denominators: Teams should compare numerator and denominator data from month to month
and year to year. Excluding special interventions and supply shortages, there is generally no pre-established threshold beyond
which trends are considered inconsistent. But greater than 5-10% variations in year-to-year or campaign-to-campaign
numbers of doses administered suggest problems in data quality (e.g., duplicated, missing, or erroneous data).
Step 3: Data Analysis
Analysis of regulations and existing dataFlow of the data on immunizationCongruence of data from different information sourcesCompleteness and timeliness of the reportsEvaluation of the quality of the information system and use of the dataEvaluation of the Electronic Immunization Registry (EIR)The denominators
Data analysisStep 3

21
Dropout rate (see Module 2): Typically, more first than second doses are administered, more second than third doses are
administered, and so on. The PAHO/WHO TAG on vaccine-preventable diseases (VPDs) recommends monitoring dropout
rates between DPT1 and DPT3, DPT1 and DPT2, and DPT2 and DPT3. Negative rates indicate that more second and/or
third than initial doses were reported and that a full investigation should be conducted. One limitation of the dropout indicator
is that the numbers compared are typically aggregated and do not show patient-level dropout, which can only be detected
by analyzing nominal registries or survey data. What’s more, dropout rates may result from natural variability rather than data
problems, particularly when numbers are small, irregular, or negative.
The dropout rate may also be analyzed between deworming rounds, especially if two rounds are conducted per year. In such
cases, the number of children dewormed in the first round should roughly equal the number dewormed in the second round. If
not, the team must investigate the cause of the difference.
Coherence between the recommended doses at the same age: Coherence refers to the logical relationship between
two datasets. For practical purposes, the study team should compare numbers of doses reported for vaccines recommended
at the same age. Examples include comparisons of BCG and hepatitis B vaccines in newborns; the first, second, and third
doses of polio vaccine to DTP/pentavalent and pneumococcal vaccines in children aged 2, 4, and 6 months; and the MMR
and yellow fever vaccines in children aged 1 year. Notably, rotavirus vaccine should not be included in this evaluation, as late
vaccination may result in the child not being immunized against the pathogen. While the numbers of doses are not expected
to be equal, they should be very similar unless there were vaccine shortages. Exactly equal numbers may indicate that health
workers were not recording each dose administered (e.g., polio) on the daily registration form and were instead recording the
same number of doses for another vaccine (e.g., DPT/pentavalent) in the consolidated registry at the end of the month.
Similarly, if a campaign integrating vaccination and deworming activities is evaluated, the numbers of children who received
the first and seconds rounds of treatment can be compared. Because deworming occurs at age 1 year, the evaluating team
may compare deworming drugs to vaccine doses recommended at this age.
Notwithstanding the above information, data congruence and coherence do not prove that data are of high quality and without
errors. Indeed, data congruence and coherence may conceal systemic errors, such as double counting of some data or missing
information due to the failure to file a vaccination or deworming report following certain interventions (e.g., mop-up activities in
schools). Regardless, the team must investigate the cause of any discrepancy or lack of coherence that is detected.
3.1.2 Forms and information systems in use The study team must be familiar with the information system’s forms, computer systems, and data flow. These include:
� Daily registration form: Document for recording each vaccine dose, preferably immediately following administration.
At minimum, the form contains the date and site of vaccination, the vaccines and doses administered, and the patient’s
age group (or indication, such as pregnancy) (Figure 3). The form may also include sex, race or ethnicity, name, date of
birth, and immunization strategy (e.g., at the health facility, in the field, or during a campaign for outbreak control). Doses
recorded on the form are totaled to obtain consolidated data. Notably, the form may also be used for deworming, as the
variables are similar with the exception of the type of deworming drug.
� Nominal registry (hard copy), monitoring notebook, or card file: Registry for monitoring an individual’s vaccination
history, usually containing the patient’s name, a unique identification code (e.g., the person’s card number), date of birth,
and all vaccines given with dates of administration. Among other variables, the registry may include vaccine lot number and
the vaccinator’s name. Registries are organized by date or geographic area to identify children behind on their schedules or
those needing replacement vaccination cards (Figures 4 and 5).

22
Figure 4. Examples of daily dose registration forms
Figure 5. Examples of nominal registries in notebooks or card files for follow-up of doses in the series

23
� Clinical history, clinical chart, or medical record: A document that records all visits to the health facility with a
summary of the reasons for the visit (for example, treatment of a symptom or preventive examination) and the indications
and treatment given to the patient on that occasion.
� Vaccination card or health card: A document with information regarding the person and the date on which each vaccine
or deworming medicine was applied. Ideally, it should indicate when the next vaccines in the schedule and/or the next dose
of the deworming medicine are due. This card is handed to the person who received the vaccine or deworming medicine
or, in the case of a child, the responsible adult. It is a proof of vaccination and deworming (when the two are integrated)
and it is kept in the person’s home. When it is a health card, it may contain other pertinent data.
� Consolidated dose form (usually monthly): A document containing aggregated data on the number of doses of
each vaccine or deworming medicine administered over a given period by a particular health facility. It may also include
information from health posts or mobile teams within the service’s jurisdiction. This form may be the same for all health
facilities in the country or it may vary from one facility to the next or by type of provider. For example, each private clinic
may design its own monthly data form.
� Electronic nominal vaccination registry (eNVR): A computerized information system or database that uses information
on the population, including individual data on vaccine doses administered and who administered them. The data can
be entered at the point of vaccination or at a higher level from a hardcopy nominal registry. In general, besides making it
possible to computerize vaccination data by directly entering the data on a particular person, the vaccine administered, and
the place where it was applied, the eNVR facilitates individualized and timely monitoring of the vaccination schedule. It also
makes it possible to generate reports to monitor vaccination coverage by vaccine, dose, geographic area, age (or other
target group), and supplier. There are no individual registries on deworming in Latin America and the Caribbean because
this intervention is almost always conducted through campaigns directed toward specific population groups.
� Software, or platform for the aggregated data: An electronic system, ranging from an Excel file to a sophisticated
Internet portal, in which the aggregated data from consolidated dose forms are entered. The system aggregates the
dose numbers indicated on the forms received from multiple health facilities as well as the data entered by the different
administrative areas, all the municipalities in a given department or state, and all the subnational levels that feed data
to the national level. This software system can be devoted exclusively to vaccines or it may be used to register multiple
interventions. It may be administered under the EPI, the department of statistics, or an equivalent office in the Ministry
of Health. The level of disaggregation and detail of the data may vary: for example, the name of the health facility that
administered the vaccine or deworming medicine may be lost in the process, leaving only data on the corresponding
municipality, or, even though the specific age of each child was entered in the system, several ages may be grouped
together, such as children from 1 to 4 years old.
3.2. Flow of immunization dataThe flow of information refers to the way information circulates in an organization—in this case, to the way in which
vaccination or deworming data circulates within the information system of a country or administrative unit. The flow of
information can be simple or complex, and the level of complexity depends on the type of system and the structure in each
country. If simple, local facilities directly enter immunization data into an online nominal registry. If complex, health posts and
brigades submit daily registration forms to a health facility for consolidation with the facility’s information; subsequently, data
are submitted to other levels for aggregation before reaching the national level.
Some regions in a country may use more than one data flow, depending on the logistics and facilities available for data entry
and requirements for submitting reports to higher administrative levels.

24
To evaluate vaccination or deworming data (i.e., persons vaccinated or dewormed, not only doses administered), the
evaluation team must understand how the primary data were collected, the timeframe of the process, who collected the data,
and any regulations on the flow of forms and reported information.
Partial month cutoffs are important. Data from a given month— e.g., February—actually represent vaccines administered from
the end of January to sometime before the end of February and not the entire month. In addition, the team must determine
if the information system separates “production” from “coverage” doses. In most countries, only information on “production
doses” is available, meaning that the system only collects data from health facilities (and municipalities) where people are
vaccinated or dewormed, not from their areas of residence.
Some countries request information on the patient’s place of residence. If the patient’s residence does not fall within the
health facility’s (or the municipality in which the facility is located) jurisdiction, his or her doses should be separated from those
administered to persons living in the area and assigned to the health facility (or municipality) of the patient’s residence. This
separation ensures that individuals are assigned to areas where they are considered to be part of the denominator. Although
this distinction makes sense in theory, it is difficult to implement without an EIR or other electronic record of deworming.
Furthermore, the separation increases the likelihood that some doses given to patients living outside the health facility’s (or
municipality’s) area will be counted twice: once in the treating facility and again in the area of residence. On the other hand,
if it is unclear who should record the dose, the data may be lost. If a country decides to separate doses in this manner, there
should be a clear plan for implementation and data analysis to overcome the aforementioned challenges.
Besides understanding information flow, the evaluation team must be aware of deadlines for data submission to the next
highest level in order to determine if reports are received on time. Generally, national data should not run more than one month
behind the date of vaccination. The same principle applies to vaccination and/or deworming campaigns. For example, by
February of each year, data from December of the previous year should be available.
When evaluating vaccination and deworming data quality together, the study team must understand not only the flow of
information but also have access to records on doses administered and the operational or local reports sent to higher levels.
Of note, the only deworming data available may be the numbers of doses distributed and delivered; information on the
patients who received the drugs may be unavailable.
Figure 6 shows a sample flowchart for a system to monitor vaccination coverage.

25
In intensive strategies, such as vaccination and deworming campaigns, data flow and deadlines may vary due to the large
number of doses administered and the need to implement the intervention in a short time period (Figure 7).
Figure 6. Examples of system flow for monitoring regular program vaccination coverage
The process of requesting vaccines and supplies is programmed.Receipt of vaccines and supplies is acknowledged within 72 hours of arrival.
Public health unit
Private health unit
Cutoff DateLast day of the month
Municipality
Department
Ministry of Health (national level)
1-2 days
3-5 days
5-10 days
10-15 days
Movement of vaccines
Movement of vaccines
Loss of vaccines
Loss of vaccines
Request for vaccines
Monthly summary
Monthly summary
Ministry of Health(consolidates subnational data)
Health Unit(records, consolidates, and transmits data on vaccination
and other interventions based on various intra- and extramural tactics)
Municipality(consolidates and transmits data from health units)
Department or Region(consolidates and transmits data from municipalities)
Peripheral Level
Intermediate Level
National Level
Sub
mis
sio
n o
f D
ata
and
Rep
ort
s
by
Est
ablis
hed
Cut
off
Dat
es
Figure 7. Examples of system flow for monitoring coverage during campaigns

26
Remember that the information flow will be different if the country uses an EIR because records are submitted to the database
through automated coverage monitoring systems (Figure 8).
Figure 8. Examples of system flow for monitoring a national nominal vaccination registry
Electronic national nominal vaccination
registry
Public Sector National EPI
Private Sector Municipality
Social Security Department/Region
Other Providers Health Unit
If the data quality evaluation includes analysis of the vaccination or deworming monitoring system, remember to clearly specify
information on vaccine and deworming drugs orders, deliveries, and dates of shipment and receipt (Figure 9).
Figure 9. Examples of system flow for monitoring caccines or deworming drugs
Monthly summary
Movement of vaccines or deworming drugs
Losses of vaccinesor deworming drugs
Requests for vaccines or deworming drugs
Monthly information flow
Requests for vaccines or deworming drugs Receipt ack.
Public health unit
Private health unit
Municipality
Department
National Level

27
3.3. Congruence of data from different sourcesThe primary data source is the original registry of information at the time of service. For vaccination, the source may be the
daily registration form, nominal registry (hard copy), monitoring notebook, card file, patient’s medical chart, EIR, or health
or vaccination card. For deworming, the source is the registration form used in the campaign, which may be nominal or
consolidated by age group.
Evaluators should assess data completeness, verifying that all information requested in the form has been provided, or, if
not, that the minimum information required to satisfy the country’s standards for data quality is available. The evaluating
team should confirm the person’s identity (for nominal documents or registries), the date, and the dose. Since it is infeasible
to review every entry, the team can evaluate records from several months as a sample. Alternately, the team can establish a
quota—i.e., a number of records to review based on the time available—to complete the evaluation.
Annex 1 is a sample form to determine whether the primary source data are complete. The corresponding indicator is:
Complete forms = Percentage of original documents and reports with all required data.
If the primary source data are complete and data from different sources are congruent, the information should be confirmed
in the field. The team may select study areas randomly, per the DQS/DQA guidelines. However, teams typically select areas
based on logistical considerations.
Data congruence from different information sources can be confirmed by:
a. Conducting multiple comparisons of primary source data.
b. Comparing doses re-counted by the evaluator for a given period from a primary source (usually the daily registry or
campaign registry) to consolidated figures reported to the next highest level.
c. Comparing subnational to national data.
The first two approaches are most commonly used.
Congruence can be assessed between one or more vaccines or deworming doses, between one or more months, or for a
specific campaign. Decisions on the type of analysis to use depend on how often data are assessed, the time available in
each health facility, and the country’s interest in exploring data quality of a particular vaccine. Some countries, for example,
may wish to evaluate the influenza vaccine, which tends to have poorer quality data than the MMR vaccine (receiving more
attention as measles and rubella were in the elimination phase). Deworming programs may want to evaluate the concordance
between one or two deworming rounds; although this depends on the evaluation’s objective and the number of deworming
rounds done each year.
In analyzing regular program data, the team should analyze information from three consecutive months (excluding months
with campaigns due to the potential for biased results) and not more than four vaccine doses (e.g., pentavalent 1, pentavalent
3, rotavirus 2 in children aged <1 year, and MMR in children aged 1 year). BCG and hepatitis B in newborns can be analyzed
separately because these vaccines are usually given on maternity wards. After defining the time period and doses to be
evaluated, the study team should focus on reliability of the data under evaluation rather than on the performance of the regular
deworming or vaccination program.

28
To quantify congruence between two data sources, the study team may calculate an absolute or relative congruence index.
The absolute index is the difference between the values, using the highest or lowest number as the reference point. As shown
in Annex 2, the most common relative index is the verification factor—i.e., the proportion of reported doses that can be
confirmed in the document closest to the primary source (e.g., school of health center registries), per the following formula:
Verification factor
No. of doses recorded during a month on a health facility’s daily registration forms
No. of doses from this health facility consolidated at the municipal level during the same month x 100
To this end, the team can assess data accuracy by comparing data from each level and calculating the verification factor. This
compares the number of doses reported at the highest level to the number found by the evaluation team at the lowest level.
If all doses reported from a lower to a higher level cannot be confirmed, the verification factor will be <100%. Such values
suggest overreporting and occur if more doses were reported in a municipality than were re-counted in a facility in that
municipality. Conversely, if more doses were reported on the daily registration forms in a health facility than in the municipality,
the verification factor will be >100%, suggesting underreporting (Figure 10).
Figure 10. Verification factor as an indicator of accuracy
0
20
40
60
80
100
120
140
El F
aro
Colin
a
La A
uror
a
Trián
gulo
Ampa
ro
Higu
erón
Suka
rta
Roco
sa
Llan
o gr
ande
Tam
bor
Gav
ilán
Sant
a El
ena
San
Rafa
el
Mar
ipos
as
Cam
pana
Coyo
te
Verif
icat
ion
fact
or (%
)
� The verification factor measures the accuracy of two data sources-for example, the record of doses administered in health
center and reports available in the municipality.
� A verification factor >100% indicates underreporting: a VF <100% indicates overreporting.

29
Figure 11 presents sample documents that may be compared: the number of tally marks on the daily registration form versus
the number of doses in the consolidated monthly report. Figure 12 shows congruence of data from each deworming post, the
health service’s registry, and the monthly regional report, all following a deworming campaign.
Figure 11. Example of presentation or results of data congruence analysis and calculation
of verification factor for vaccines
Year 2013Age
groupVaccine
and dosesDaily
recordMonthly
spreadsheetMonthly
for regionDaily VF/ monthlyspreadsheet (%)
Daily VF/ monthly for region (%)
October - December
<1 Year
Penta1 1557 1538 1570 101.2 99.2
Penta3 1151 1106 1133 104.1 101.6
Polio3 1126 1092 1118 103.1 100.7
1 Year MMR1 1376 1366 1400 100.7 98.3
Penta1 Penta3 Polio3 MMR10
200
400
600
800
1,000
1,200
1,400
1,600
No.
of d
oses
Daily Register 1557 1151 1126 1376
Monthly Spreadsheet 1538 1106 1092 1366
Monthly Report For Region 1570 1113 1118 1400

30
The evaluation team should show the verification factor and the magnitude of any difference, since 2 or 3 doses can result in
a factor much greater than 100% in a health facility administering only a few vaccine doses. Figure 13 is an example of data
congruence analysis.
Figure 12. Example of presentation of results of data congruence analysis and calculation
of verification factor for deworming drugs
Record from each
deparasitization post11,985 10,587
Health service record from
deparasitization campaign11,369 10,361
Monthly report for region 11,259 10,253
RoundRecord
Deworming postRecord campaign
health serviceMonthly report
for regionVF deworming
post/health service
VF deworming post/monthly report
for region
Round 1 11,985 11,369 11,259 105.4 106.4
Round 2 10,587 10,361 10,253 102.2 103.3
No.
of d
oses
Round 1 Round 2
0
2,000
4,000
6,000
8,000
10,000
12,000

31
No.
of d
oses
El Oro Santa Ana Robledal
VF = 22%
VF = 81%VF = 100%
VF = 66%
Colina0
100
200
300
400
500
600
700
800
Before reporting a difference, particularly a significant one, the evaluating team should do a re-count to confirm that the
exercise was correctly performed and that the same month was being compared.
The report should include potential causes of any differences. Potential explanations include lost daily registration forms;
deworming sites that failed to submit reports; unclear cutoff dates for the monthly consolidated report; excluding or marking
some reported doses from a private supplier (e.g., DTaP-Hib-IPV) in the box marked “other” instead of adding them to the
polio, DTP, and Hib doses; formula errors in the Excel spreadsheet; and mistakenly combining pentavalent doses administered
to children aged >1 year with doses for children aged <1 year in the consolidated monthly report.
Figure 13. Example of presentation of data accuracy: Comparing health units from different departments
Department A
Department B
National 41 21 736 315
Health unit 41 21 736 315
Monthly spreadsheet 34 20 736 315
Daily register 41 17 163 209

32
Countries beginning to use EIR may also be able to assess coherence between the EIR data and consolidated forms still in use.
If the sites visited were not selected using probabilistic sampling, the average verification factor is not calculated; instead, the
factor for each site is presented. Differences should generally be 5-10%, depending on the situation.
Finally, the evaluating team must determine if any errors occurred due to missing data or duplications in the system. Figures
14-17 show results of an evaluation for accuracy. The first two figures compare reported to confirmed data. The third and
fourth show data sources from their entry point into the system and draw comparisons among municipal, departmental, and
national reports.
Data accuracy is represented using two bars that compare the data reported by the health center to data generated from the
assessment tool. The graph shows the results for each of the centers and management levels that were assessed.
No.
of d
oses
Verified Reported
0
200
400
600
800
1000
1200
1400
Vend
abal
El F
aro
La R
ocos
a
Rosa
l
Buen
aven
tura
Rosa
rio
Las
Palm
as
Valle
del
Sol
Llan
o
Dest
ino
San
Pedr
o
Sant
a El
ena
Figure 14. Example of presentation of data accuracy: Comparing reported and verified doses of pentavalent 3 vaccine

33
Figure 15. Example of presentation of data accuracy: Comparing reported and verified doses
of deworming drugs in one treatment round
Figure 16. Example of presentation of data accuracy for pentavalent vaccines 1, 2 and 3: Comparing municipal,
departmental, and national data
Verified Reported
No.
of d
oses
0
100
200
300
400
500
600
Mun
icipi
o 1
Mun
icipi
o 2
Mun
icipi
o 3
Mun
icipi
o 4
Mun
icipi
o 5
Mun
icipi
o 6
Mun
icipi
o 7
Mun
icipi
o 8
Mun
icipi
o 9
Mun
icipi
o 10
No.
of d
oses
0
100
200
300
400
500
600
Penta 1
Penta 1VF: DR/CRM = 95%
Penta 2VF: DR/CRM = 89%
Penta 3VF: DR/CRM = 84%
Penta 2 Penta 3
Daily register in health unit (DR)
Consolidated report for municipality (CRM)
Consolidated report for department (CD)
Departmental report (DR)
National report (NR)

34
Figure 17. Example of presentation of data accuracy on the administration of deworming drugs, by treatment round:
Comparing municipal, departmental, and national dataN
o. o
f dos
es
Round 1VF: PR/CRM = 106%
Round 2VF: PR/CRM = 103%
0
2,000
4,000
6,000
8,000
10,000
12,000
Round 1 Round 2
Deworming post register (PR)
Health service register on deworming campaign (CR)
Consolidated report for municipality (CRM)
Consolidated report for department (CD)
National report (NR)
3.4. Completeness and timeliness of reports The purpose of this section is to determine if all reports for the study period were sent to higher administrative levels and
received according to country deadlines. Indicators are the percentage of the reports submitted and the percentage of the
reports received on time at a higher level (depending on the information flow) and at the national level from the departments.
These calculations can only be made if the hardcopy or electronic reports have recorded dates of receipt.
� Documentation and complete reports: Percentage of original documents and reports received at a higher level. For example:
Percentage of consolidated weekly reports sent by health units to the municipality: 5/5 = 100%
Percentage of consolidated weekly reports sent by the department to the national level: 1/1 = 100%
� Documentation and timely reports: Percentage of original documents and reports collected or submitted on time. For example:
Percentage of consolidated weekly reports submitted on time by health units to the municipality: 4/5 = 80%
Percentage of consolidated weekly reports submitted on time by the department to the national level: 1/1 = 100%
3.5. Evaluation of the quality of the information system and data useThe team should assess the information system (data, persons, activities, and computer and communication resources)
and use of data by reviewing questionnaire responses, observing recording, filing, and analytical practices, and interviewing
the professionals responsible for administering vaccines and deworming drugs as well as for recording, consolidating, and
entering data. The team should do this evaluation at the same time and in the same centers as the evaluation of the data’s
completeness and congruence.

35
Evaluation of the information system’s quality can be divided into components. These include data recording practices,
monitoring and evaluation, training and supervision, filing practices and report generation, and demographic and planning
information (the last component is not applicable to operational aspects of the analysis).
To facilitate analysis, survey questions are usually designed to elicit ‘yes’ or ‘no’ answers, where ‘yes’ corresponds to what
should occur per national standards. The evaluation team should calculate a quality index for each site visited by dividing the
score obtained by the maximum possible score. Annexes 2-5 are sample questionnaires to evaluate different features of the
information system.
Results can be presented using bar graphs or radar charts, commonly known as “spider charts” (Figure 18).These illustrations
show results from the qualitative component of the evaluation, helping to compare equivalent categories (among health facilities,
municipalities, or departments/states) and to visualize the program’s strengths and areas for improvement (Figure 19).
Figure 18. Spider chart presenting the results of a data quality assessment
0%
20%
40%
60%
80%
100%
Report
Supervision
Analysis Planning
Management of supply stocks

36
Data collection and recording
Monitoring and evaluation
Filling and reporting
Data collection and recording
Monitoringand evaluation
Filling and reporting
-
2.0
4.0
6.0
8.0
10.0
-
2.0
4.0
6.0
8.0
10.0
Data collection and recording
Monitoring and evaluation
Filling and reporting
Data collection and recording
Monitoringand evaluation
Filling and reporting
-
2.0
4.0
6.0
8.0
10.0
-
2.0
4.0
6.0
8.0
10.0
Health Unit A Health Unit B
Figure 19. Spider chart presenting the results of a data quality assessment of different health units
If the study sites were not randomly selected, an average quality index for the verification factor (or other congruence factors)
cannot be presented. However, the team should prioritize problems that resulted in a score of zero over obtaining a value for the
quality index (e.g., 50%, 80%, or 90%) in order to implement corrective measures and improve data quality. Results from each
site visit should show the facility’s strengths and weaknesses, which can be summarized and presented in the final report.
3.6. Evaluation of the electronic immunization registry (EIR)Use of EIR is increasing, and methodologies for evaluating these systems are improving and being fine-tuned. In 2013, the
PAHO TAG strongly recommended monitoring EIR, especially during implementation10.
Countries can evaluate EIR data using the previously described methods. But there are few validated standards and
regulations to assess EIR design and operations. To evaluate the software itself, informatics standards do exist. Though
beyond the scope of these modules, the standards may be found in manuals of countries with EIR.
The first step in evaluating an EIR is describing the software, manuals, and norms pertinent to the registry. The evaluation
should include an observational visit to the health facility, EPI office, or bureau of statistics where the system operates.
Annex 6 is a form used to characterize an EIR, per the following elements: scope, legal and regulatory framework, software
architecture, maintenance and sustainability, human resources, software modules, capabilities, and degree of implementation.
Questionnaire-based interviews are conducted with EPI personnel and EIR users at the operational, subnational, and
national levels to evaluate the availability of adequate equipment, Internet access, infrastructure, human resources, technical
assistance, and data capture. Additionally, the study team should interview EPI personnel and data entry clerks at all levels to
assess user perception of the coverage monitoring system. Annex 9 is a form for interviewing data entry clerks.

37
3.7. DenominatorsEvaluating the quality of the denominators used to estimate administrative coverage continues to be a complex challenge for
immunization and deworming programs. To learn more about tools for analyzing denominator quality, please consult Module
2, “Analysis of administrative coverage.”
4.1. Preparation of the reportThe report should include indicators reflecting application of the various tools used to evaluate the system and verify the
data. The study team should discuss results with the system’s users and managerial and political stakeholders, highlighting
strengths and weaknesses and identifying opportunities to improve data quality.
4.2. Discussion of the resultsAnalysis of data quality should prompt discussion and questions about the following issues:
� What bottlenecks, if any, exist in the information system?
� What differences exist among national, subnational, and local data?
� What actions must be taken? Do supervision or training activities need to be strengthened? Do regulations need to be modified?
� Who should be involved in implementing corrective measures?
As mentioned, study teams and health programs must understand both the problems related to data on administered doses
(e.g., poor recording practices, overestimates, loss of data, failure to submit a report or delay in submission, long delays in
submitting reports) as well as the underlying causes of these problems. In collaboration with the professionals responsible for
service delivery at the local level, health programs must then adopt corrective measures to address these problems.
Step 4: Dissemination of the results
Preparation of the reportDiscussion of the resultsDissemination of resultsStep 4

38
5.1. Definition of strategiesStrategies for improving data quality must take into account the processes involved in collecting, analyzing, and using the
data. These strategies improve program performance in three areas of information management:
� Operational: To make better decisions in daily operations.
� Managerial: To ensure that solutions address real problems and achieve greater efficiency.
� Strategic: To provide a strong foundation for strategies and policies, with a view toward ongoing evaluation.
5.2. Plan of actionAfter identifying strategies for improving data quality, EPI and deworming program coordinators, among other leaders,
should form an action plan that outlines objectives, activities, work schedule, assignment of responsibilities, and resources.
Preferably, professionals from different management levels and the local level should assist in developing the plan, thereby
helping to ensure that agreed-upon activities respond appropriately to the country’s conditions and current situation.
The plan should present recommendations to establish good practices in registering vaccine and deworming drugs doses
to ensure that consolidated data are reliable and comprehensive, that the report is complete and up to date, and that
denominators are appropriate. The importance of systematic analyses and high-quality data should also be promoted in order
to improve program management.
Fundamentally, the DQA tool aims to determine how to improve the quality of data recorded as part of daily program activities.
To this end, following up on the findings of the evaluation should involve systematic analysis of data quality during program
activities as well as rapid tools and instruments to supervise and monitor key components of the coverage monitoring system.
Step 5: Decision-making
Decision-makingStep 5 Definition of strategiesPlan of action

39
1. World Health Organization. Data quality assessment protocol for neglected tropical diseases: guidelines for
implementation. Draft document provided by ENVISION project. (n.d.)
2. World Health Organization. The immunization data quality self-assessment (DQS) tool. Geneva: WHO; 2005. (WHO/
IVB/05.04).
3. Ronveaux O, Rickert D, Hadler S, Groom H, Lloyd J, Bchir A, et al. The immunization data quality audit: verifying the
quality and consistency of immunization monitoring systems. Bull World Health Organ. 2005;83(7):503-10.
4. Pan American Health Organization. Protecting the health of the Americas: moving from child to family immunization. Final
report. XVII Meeting of the Technical Advisory Group on Vaccine-preventable Diseases, Guatemala City, Guatemala, 2006
July 25-27. Washington, D.C.: PAHO; 2007.
5. Machado Cruz V, Salas Peraza D, Cervantes M, Esquevel G, García M, Hernández O, et al. Immunization data quality self-
assessment, Costa Rica, November 2005 [abstract]. In: Protecting the health of the Americas: moving from child to family
immunization. Final report. XVII Meeting of the Technical Advisory Group on Vaccine-preventable Diseases, Guatemala City,
Guatemala, 2006 July 25-27. Washington, D.C.: PAHO; 2007. p. 69.
6. Ronveaux O, Arrieta F, Curto S, Laurani H, Danovaro-Holliday MC. Assessment of the quality of immunization data
produced by the national individual registration system in Uruguay, 2006. Rev Panam Salud Publica. 2009;26(2):153-60.
7. Boyd Td, Linkins RW, Mason K, AS, Bulim I, Lemke B. Assessing immunization registry data completeness in Bexar
County, Texas. Am J Prev Med. 2002;22(3):184-7.
8. Data Quality Assessment for Neglected Tropical Diseases: Guidelines for implementation. December 2013. Working draft
for field-testing.
9. Papania M, Rodewald L. For better immunization coverage, measure coverage better. Lancet. 2006;367(9515):965-6.
10. Pan American Health Organization. Report de la XXI Technical Advisory Group on vaccine-preventable disease. July 2013.
Available at http://www.paho.org/hq/index.php?option=com_docman&task=doc_download&gid=22424&Itemid=270&lang=es
References

40
Annex 1. Sheet for recording data and calculating the indicators of accuracy, completeness, and timeliness
Municipality: a. No. of reports to be received (3 months) = Completeness and
timeliness indicators
Department: b. No. of reports actually received = % Completeness (a/b x 100) =
Date of evaluation: c. No. of reports received on time = % Timeliness (c/b x100) =
Month Month 1
Dat
e o
f re
ceip
t Month 2
Dat
e o
f re
ceip
t Month 3
Dat
e o
f re
ceip
t
Type of vaccine Penta1 Penta3 MMR Penta1 Penta3 MMR Penta1 Penta3 MMR
Dose No. of doses
No. of doses
No. of doses
No. of doses
No. of doses
No. of doses
No. of doses
No. of doses
No. of doses
A. National database (Total number reported by the municipality to the national level, if available)
B. Department-level database (Total number reported by the municipality to the departmental level, if available)
No.
List of health facilities in the municipality (Record the data on paper; if more space is needed, use another sheet)
1
2
3
4
5
6
7
8
9
10
11
12
C. Grand total
D.
Copy system output data here (from Excel database) if the system is in the municipality

41
Annex 2. Calculating the verification factor at each level of the coverage monitoring system
Months Period
Type of vaccine or deworming drug
Number of doses
Penta1 Penta3 MMR ALB or MBD*
A. National EPI program or integrated EPI/ deworming program (Total number from the municipality reported to the national level)
B. Department (Total number from the municipality reported to the department)
C. Municipality (Total number in the municipality confirmed by the evaluator)
D. Municipality (Total number in the municipality recorded in the system)
VF = Total number in the municipality confirmed by the evaluator/Total number from the municipality recorded in the system (C/D) x 100
VF = Total number in the municipality confirmed by the evaluator/Total number from the municipality reported to the department (C/B) x 100
VF = Total number in the municipality confirmed by the evaluator/Total number from the municipality reported to the national level (C/A) x100
VF = Total number from the municipality recorded in the system /Total number from the municipality reported to the department (D/B) x 100
VF = Total number from the municipality recorded in the system/Total number from the municipality reported to the national level) (D/A) x 100
*ALB = Albendazole; MBD = Mebendazole.

42
Annex 3. Form for evaluating quality of the coverage monitoring system of health units
Name of health unit
Municipality: Department:
Evaluation team
Date of assessment: / /
No. Registration practices Yes No N/A Score Comments
1 Are there enough daily vaccination registration forms available for the next 2 months?
The Ministry of Health should provide enough daily registration forms to each department and each of its health units.
2 Are there enough consolidated weekly registration forms available for the next 2 months?
The Ministry of Health should provide enough weekly registration forms to each department and each of its health units.
3 Is there a tickler file with cards for children aged <5 years?
Confirm that there is a tickler file.
4 If so, does the tickler file contain many cards? Are data for this year up to date?
If there is no tickler file, write ‘N/A’. Observe how it is used (movement, operation) and whether a standard index card file or another format is used.
5 Is it possible to replace a vaccination card for a child who has lost one?
Ask for a detailed explanation of the procedure and data sources used.
To answers questions 6–9, observe vaccine administration:
If there are not enough children to observe, ask how immunization is done. If the answer seems inadequate, write ‘N/A’.
6 Were each of the vaccines properly recorded on the daily registration form?
Observe how this was done.
7 Was information for each vaccinee properly recorded on the tickler file card?
Observe how this was done.
8 Was information for each vaccinee properly recorded on the vaccination or health card?
Observe how this was done.
9 Was each vaccinated child (or parent guardian) told when the next vaccines are due?
Observe how this was done.
10 Did the vaccinee meet the criteria for Exercise 1? (age 3 months; no previous vaccine doses; lives in the area)
Verify that the daily registration form, tickler file card, and vaccination card were properly filled out.
11
Did the vaccinee meet the criteria for Exercise 2? (age 18 months; already vaccinated with BCG, penta1, 2, and 3 and OPV1, 2, and 3; and was living in a different municipality but recently moved to the area)
Confirm that the correct vaccines were given and that the daily registration form, tickler file card, and vaccination card were properly filled out.
12
Did the vaccinee meet the criteria for Exercise 3?(age 7 months; already vaccinated for BCG, penta1 and OPV1; lives in another region and was visiting the municipality)
Verify that the correct vaccines were given and that the daily registration form, tickler file card, and vaccination card were properly filled out. Pay attention to how staff handle information on children from outside the area.
13 Does the daily registration form have a separate space for children living outside the area? Is it being properly filled out?
Check the daily registration form.

43
14 Is the weekly/monthly consolidation of vaccines being properly managed at the end of month?
Check the data. The two reports should be handled separately (i.e. two lines) during the last week of each month.
15 Is the weekly/monthly consolidation of vaccines being properly managed for children from outside the area?
Check the consolidated data for the week and previous month.
No. Movement of biologicals and other supplies Yes No N/A Score Comments
16 Is there an up-to-date form for tracking movement of biologicals?
Check the form for the current month.
17
On the form for tracking the movement of biologicals, are there up-to-date data on pentavalent vaccines for the months ___ through ___ of the current year?
Verify that the form is available, properly completed, and up to date.
18
On the form for tracking the movement of biologicals, is there up-to-date data on syringes for the months ___ through ___ of the current year?
Verify that the form is available, properly completed, and up to date.
19 Is there an adequate mechanism for tracking the lot numbers and expiration dates of biologicals?
Verify that expired vaccines and biologicals are not being used.
20 Is the number of administered doses being compared to the number of vaccinated patients?
Quickly verify that doses are not getting “lost” in the records.
21 Are losses in the movement of biologicals analyzed?
Verify that the record is up to date and that personnel know how to calculate losses and are not simply relying on a loss factor.
No. Monitoring and evaluation Yes No N/A Score Comments
22 Does the health unit have a population of children aged <1 year under its jurisdiction this year?
Population <1 year _____ (Year = ____) Source:
23 Does the health unit have a population of children aged <1 year under its jurisdiction for the year under evaluation?
Population <1 year _____ (Year = ____) Source:
24 Is the coverage graph up to date? Verify that the coverage graph is up to date.
25
At the time of the evaluation, is it known how many children need the penta1, 2, and 3 vaccines to reach the coverage target for the year under evaluation?
Ask how the data are interpreted.
26 Is it known how many children aged 10 years need Td vaccines during the year under evaluation?
Ask for the number of children and explain how the data are interpreted.
27 Have sectorization criteria for geographical areas been applied to the different vaccination activities in the health unit?
Verify that maps or sketches are available.
28 Is there a map or sketch of the health unit’s area showing neighborhoods or communities?
Verify that the map is being used.
29 Does the health unit have a strategy for finding children behind on their vaccinations?
Ask for an explanation (i.e., which children) and check the tickler file.
30 Was rapid coverage of vaccination (RCV) used for the regular program during the year under evaluation?
Confirm the number of RCV exercises done, excluding campaigns.

44
31 Were any RCV exercises done last month? Verify that the minimum was done.
32 Is the concept of dropout rate understood and used?
Ask how to determine if more penta3 than penta1 vaccines have been administered. What would it mean if this were the case?
33 Are activities done to promote vaccination in the community?
Determine what types of publicity been used—broadcasting, radio spots, community activities, health fairs, talks, etc.
No. Training and supervision Yes No N/A Score Comments
34 Have you received training and educational supervision on preparing the daily registration form and consolidated weekly report?
Determine the date of the most recent training, excluding training for campaigns.
35 Have you received training and educational supervision on completing and managing the tickler file?
Indicate who provided the supervision and ensure a report is available.
36 Have you received training and educational supervision on how to register children from outside the area?
Learn more about the training and who conducted it.
37 Have you been supervised administering vaccines (excluding campaigns) during the year under evaluation?
Indicate who provided the supervision and ensure a report is available.
No. Filing and reporting practices Yes No N/A Score Comments
38 Is there a filing system for the program’s forms? Determine the type of system.
39 Are all daily vaccination registration forms and consolidated weekly/ monthly forms on file for the year under evaluation?
If there is no filing system for the forms, write ‘N/A’.
40 Are the daily vaccination registration forms filed by date?
If there is no filing system for the forms, write ‘N/A’.
41 Are the consolidated forms filed by date? If there is no filing system for the forms, write ‘N/A’.
42 Are the reports submitted before their due dates?
Determine submission dates for the last two months.
43 In the case of a serious event supposedly attribution to vaccination (ESAVI), do you know what to do and how to report it?
Ask how the event would be reported.

45
Annex 4. Form for evaluating the quality of the municipal coverage monitoring system
Municipality: Department:
Evaluation team:
Date of evaluation: / /
No. Demographic and planning information Yes No N/A Comments
1 Do you know how many children aged <1 year your facility expects to vaccinate in the municipality or local area this year?
Population <1 year _____ (Year = ____) Source:
2 Do you know how many children aged 1 year your facility expects to vaccinate in the municipality or local area in the year under evaluation?
Population <1 year _____ (Year = ____) Source:
3 Do you know what the target population for Td vaccination is this year?
Population <1 year _____ (Year = ____) Source:
4 Do the populations aged <1 year and 1 year that need vaccination in the municipality equal the populations assigned by the Ministry of Health?
Population <1 year _____ (Year = ____) Source:
5
Do other programs—e.g., the Integrated Management of Childhood Illness or Child Growth and Development—use the same denominator for the populations aged <1 year and 1 year as the EPI does?
Verify denominators.
6 Did the municipality include EPI activities in its budget this year?
List funding sources. If none, explain.
7 Is there an up-to-date stratified map for planning and organizing vaccination activities?
Verify availability of the microprogramming document.
No. Training and supervision Yes No N/A Comments
8 Is there a schedule for supervising the health units under evaluation?
Review the supervision schedule.
9 Did the health units being evaluated follow their technical assistance schedule for the year under evaluation?
If there is no schedule, write ‘N/A’. If the schedule has not been followed, ask why.
10 This year, have you received any department-level supervision on the regular program (excluding campaigns)?
Determine who provided the supervision and ensure a report is available.
11 This year, have you received any department-level supervision on the data (data quality, congruence)?
Determine who provided the supervision and ensure a report is available.
12 This year, did you receive any training on EPI-related topics?
Find out the topic(s) of the training and who provided it.
13
This year, did you receive any training on topics related to information systems (daily vaccination registration forms, monthly spreadsheet, data quality)?
Find out the topic(s) of the training and who provided it.

46
No. Monitoring and evaluation Yes No N/A Comments
14 Do you have an updated progress board or graph showing vaccination coverage in the health units?
Verify that the progress board or graph is up to date.
15 Do you do data analysis and provide feedback to health units?
Learn more about the frequency and type of feedback. Verify that meetings are held.
16 Is there a mechanism for tracking the submission of consolidated monthly reports by all health units?
Determine if the consolidated reports have been submitted and ask for an explanation of the tracking mechanism.
17 Do you record the date the monthly vaccination report was received?
Verify that the date is recorded.
18 Are you familiar with the concept of a dropout rate? Do you use it?
Determine how the dropout rate is monitored. Ask why a negative dropout rate may occur.
19 Has the regular program done RCV this year?Determine how many RCV exercises were done this year. Number of RCVs ______
20 Do you have regular meetings with municipal authorities to discuss the program’s progress?
Review the agendas, reports, or minutes of any meetings.
21 Do you know the procedure for investigating a severe ESAVI?
If an ESAVI has occurred, review the reports.
No. Movement of biologicals and other supplies Yes No N/A Comments
22 Do you have a process for scheduling your health units’ monthly needs for vaccines and syringes?
Ask about the procedure for monitoring needs and how often it is done.
23 Do you have an up-to-date form for tracking the movement of biologicals, including the lot number and expiration date?
Review the movement of biologicals on the form.
24
On the form for tracking the movement of biologicals, is the record on the supply of pentavalent vaccine up to date for the months of____ to ____ in the current year?
Verify that records on pentavalent vaccine supply are up to date.
25
On the form for tracking the movement of biologicals, is the record on the supply of syringes up to date for the months of ____ to ____ in the current year?
Verify that the record on the supply of syringes is up to date.
26 In monitoring the movement of biologicals, do you analyze actual losses, including vaccine losses?
Verify that the record is up to date and that personnel can calculate losses and are not simply relying on the loss factor.

47
No. Recording, filing, and reporting practices Yes No N/A Comments
27 Do you have information on doses administered from %100 of the health units for the month of ____ this year?
Review the information.
28 What mechanism do you use to submit consolidated monthly vaccination reports when data are delayed?
Ask about the mechanism for submitting consolidated reports when data are delayed.
29 Are monthly reports from the health units organized chronologically?
Review the monthly reports.
30 Is the consolidated monthly report on administered doses managed properly?
Review the consolidated monthly report.
31 Is the computer used to manage data on doses administered suitable for this purpose?
If not, ask for an explanation.
32 Are there regulations regarding the backup of vaccination data?
Find out how often backups are done.
33
Do you know how to obtain vaccination coverage reports by select variables (age group, biological product, month, municipality) using the Excel spreadsheet?
Determine how long it takes to obtain the reports. Request an up-to-date report with these variables.
34 Do you think the mechanism for submitting monthly reports on doses administered to the departmental or municipal level is adequate?
If not, ask for an explanation.
No. EPI nominal information system Yes No N/A Comments
35 Have you been trained to use the EPI nominal information system?
Determine who provided the training and where.
36 Do you think the EPI nominal information system helps to monitor the doses administered?
If not, ask for an explanation.
37 Do you think the EPI nominal information system helps to monitor completion of the immunization schedule?
If not, ask for an explanation.
38 Do you think the EPI nominal information system facilitates the tracking of supplies (biologicals and syringes)?
If not, ask for an explanation.
39 Do you think the EPI nominal information system is easy to use?
If not, ask for an explanation.

48
Annex 5. Form for evaluating the quality of the departmental coverage monitoring system
Department:
Evaluation team:
Date of evaluation: / /
No. Demographic and planning information Yes No N/A Comments
1 Do you know how many children aged <1 year
your department expects to vaccinate this year?
Population
<1 year in (year) ________
Source:
2
Do you know how many
children aged 1 year your department expects to
vaccinate this year?
Population
Aged 1 year in (year) __________
Source:
3 Do you know what the target population for Td
vaccination is this year?
Target population for Td vaccination for this year:
____________
Source:
4
Do the populations aged <1 year and 1 year that
need vaccination in the municipality equal the
populations assigned by the Ministry of Health?
Record the populations in the department’s
municipalities this year: <1 year:______1 year:
_________
5
Do other programs, such as the Integrated
Management of Childhood Illness (IMCI) or
Child Growth and Development, use the same
denominators for the populations of children
aged <1 year and 1 year as the EPI does?
Verify the denominators.
6 Did the municipality include EPI activities in its
budget this year?List funding sources. If none, explain.
7 Is an up-to-date stratified map available for
planning and organizing vaccination activities?
Verify availability of the microprogramming
document.
No. Training and supervision Yes No N/A Comments
8 Is there a schedule for supervising municipalities
this year? Verify the supervision schedule.
9 Has the schedule for supervising municipalities
been completed this year?
If there is no schedule, write ‘N/A’. If the schedule
has not been completed, ask why.
10
This year, have you received any supervision
from the Ministry of Health on the regular
program (excluding campaigns)?
Determine who provided the supervision and
ensure a report is available.
11 This year, have you received any training on
immunization from the national level?
If so, find out the topic(s) of the training and who
provided it.

49
No. Monitoring and evaluation Yes No N/A Comments
12 Do you have an updated graph showing
vaccination coverage in your municipalities?Review the coverage graph.
13
Is there a mechanism for tracking the
submission of consolidated monthly reports by
all municipalities?
Review the consolidated monthly report and ask
for an explanation of the tracking mechanism.
14
What type of system do you use to ensure
that all municipalities submit their consolidated
monthly vaccination reports on time?
Ask how they define ‘on time.’
15 Are you familiar with the concept of dropout
rate? Do you use it?
Determine how it is monitored. Ask why a negative
dropout rate might occur.
16 Has the regular program done RCV this year?Determine how many RCV exercises were
conducted this year. Number of RCVs ______
17 Do you do data analysis and provide feedback
to the municipalities?
Review agendas, reports, or minutes of any
meetings.
18
Do you engage in regular meetings with
municipal or departmental authorities to discuss
the program’s progress?
Review agendas, reports, or minutes of any
meetings.
19 Do you know the protocol for investigating a
severe ESAVI?Review the reports of any serious case.
No. Movement of biologicals and other supplies Yes No N/A Comments
20
Do you have a process for scheduling your
municipalities’ monthly needs for vaccines and
syringes?
Ask about the process for monitoring needs and
how often it is done.
21
Do you have an up-to-date form for tracking
the movement of biologicals, including the lot
number and expiration date?
Review the movement of biologicals on the form.
22
On the form for tracking the movement of
biologicals, is the record on the supply of
pentavalent vaccine up to date for the months
of____ to ____ in the current year?
Verify that records on pentavalent vaccine supply
are up to date.
23
On the form for tracking the movement of
biologicals, is the record on the supply of
syringes up to date for the months of ____ to
____ in the current year?
Verify that the record on the supply of syringes is
up to date.
24 In monitoring the movement of biologicals, do you
analyze actual losses, including vaccine losses?
Verify that the record is up to date and that
personnel can calculate losses and are not simply
relying on the loss factor.

50
No. Recording, filing, and reporting practices Yes No N/A Comments
25
Do you have information on doses administered
from %100 of the health units for the month of
____ this year?
Review the information.
26
What mechanism do you use to submit
consolidated monthly vaccination reports when
data are delayed?
Ask about the mechanism for submitting
consolidated reports when data are delayed.
27 Are monthly reports from the health units
organized chronologically? Review monthly reports.
28 Is the consolidated monthly report on
administered doses managed properly?Review the consolidated monthly report.
29 Is the computer used to manage data on
administered doses suitable for this purpose?If not, ask for an explanation.
30 Are there regulations regarding the backup of
vaccination data?Find out how often backups are done.
31
Do you know how to obtain vaccination
coverage reports by variables of interest (age
group, biological product, month, municipality)
using Excel?
Determine how long it takes to obtain the reports.
Request an up-to-date report based on these
variables.
32
Do you think the mechanism for submitting
monthly reports on doses administered to the
departmental or municipal level is adequate?
If not, ask for an explanation.
No. EPI nominal information system Yes No N/A Comments
33 Have you been trained to use the EPI nominal
information system? Determine who provided the training and where.
34 Do you think the EPI nominal information system
helps to monitor the doses administered? If not, ask for an explanation.
35
Do you think the EPI nominal information system
helps to monitor completion of the immunization
schedule?
If not, ask for an explanation.
36
Do you think the EPI nominal information system
facilitates the tracking of supplies (biologicals
and syringes)?
If not, ask for an explanation.
37 Do you think the EPI nominal information system
is easy to use?If not, ask for an explanation.

51
Annex 6. Form for evaluating the quality of the national coverage monitoring system
Country:
Evaluation team:
Date of the evaluation: / /
No. System design Yes No N/A Comments
1
Do health units and other vaccination providers (social
security, private sector, etc.) use a single system to submit
data to departments?
Ask for an explanation, including reports,
forms used, and the information flow.
2 Is there a single system for submitting vaccination data
from departments to the national level?Ask for an explanation.
3
Do official regulations exist on the submission of
vaccination data by all providers—government health
services, social security, private sector, or any others?
Verify. There may be guidelines,
instructions, or a manual. The source
may not include details on the forms
used, reporting dates, and information
flow.
4 Are there any written instructions on the forms used
nationwide?
Determine if there are any instructions
on filling out and distributing the forms,
and where and how often they should be
submitted.
5 Are the penta3 doses given to children aged <1 year
reported separately from vaccines given at older ages?Review the report.
6 Is there a written procedure for handling late reports? Verify. If so, determine how it has been
followed at the most local level.
7
Do all the consolidated reports received from the
municipalities use the same form (i.e., the same version of
the consolidated vaccination report form)?
Verify. If the form has changed in the four
months before an audit, a combination of
different versions is acceptable.
8 Does a written procedure exist for health services,
districts, or health regions to report ESAVIs?
Verify. Note if there is no ESAVI
monitoring system. Also note if
aggregated or case-by-case monitoring
is done.
9
Does the consolidated form of weekly/monthly reports
allow for the percentage of loss of biologicals to be
calculated at each level?
Determine if there is a way to compare
the movement of biologicals to the
number of doses administered.
10 Is there a form or notebook for tracking the movement of
syringes (receipt and delivery)? Find out if the form exists.
11
Does the form or notebook for monitoring the movement
of biological products help to track vaccine lots and
expiration dates?
Ask for an explanation.
12 Can you tell from the form or departmental monthly
consolidated report whether all health units reported data?Discuss how this works.

52
No. Recording practices Yes No N/A Comments
13 Are all receipts and deliveries of biologicals recorded? Review the information.
14 Is there an up-to-date log showing the receipt and
shipment of pentavalent vaccine? If the log appears incomplete, find out why.
15 Is there an up-to-date log showing the receipts and
delivery of pentavalent vaccine?Review the information.
16 In the record on the movement of biological products, is
there an up-to-date log of lot numbers and expiration dates? Review the information.
17 Have enough EPI forms been delivered to the departments
to last through the year being evaluated?
Compare the response with the
responses given during the visits to the
departments.
18 Have all required data been processed on time?Confirm that the EPI is caught up with
data entry for the year.
No. Denominators Yes No NA Comments
19 Does the denominator for the vaccination of children in the
target population coincide with the WHO definition?
Example: The WHO/UNICEF
recommendation for children aged <1
year is to estimate ‘surviving infants.’
20 Did some municipalities report penta3 vaccination
coverage of >%100 last year?
Indicate which municipalities reported
>%100 coverage and discuss potential
causes.
21 Was the current year’s denominator for children aged <1
year the same as the denominator used last year?
The purpose of this question is to
determine if EPI personnel realize that
the denominator should be adjusted
every year.
22
Was the current year’s denominator for children aged <1
year the same as the one used in the EPI tables and the
reported delivered to PAHO/WHO?
Review the documents and discuss any
discrepancies.
23
Is the current year’s denominator for children aged <1
year the same as the one used in various child health
programs?
Review the denominator used by the
IMCI, the Child Growth Monitoring
Program, or any others.
24
Is the current year’s denominator used in the departments
for children aged <1 year the same as the one used in the
departments evaluated and at the national level for these
departments?
Compare these data to the findings of the
team(s) that visited the departments.
25 Do you know the percentage of population reached by the
health services, fixed posts, and activities in the field? Ideally, request documentation.
No. Monitoring and evaluation Yes No N/A Comments
26 Do you have up-to-date department-level coverage graphs?Determine if graphs exist and are up to
date.
27 Are dropout rates for this year being monitored?Determine if the EPI manager knows the
dropout rate so far this year.

53
28 Is the timeliness of reporting coverage being monitored
this year?Review reports.
29 Does the national office have a system for recording the
date that reports are received from the regions?
The date of receipt should be recorded
on the same day the report is received at
the national level.
30 Does the office give departments regular written feedback
on their coverage?Ask how feedback is given.
31 Was the most recent feedback given in the last 4 months? Verify the information.
32 Does the feedback form include a discussion about the
data and their interpretation? Review the most recent feedback report.
33 Does the country have an official publication that includes
immunization data for the year X?
Ask to see the report, evaluation
documents, etc.
34 Is there a map showing the progress of activities this year
by municipality?Confirm that the map is available.
35 Is there a graph showing VPDs over a given time period? If there is a graph or map showing at
least one VPD, assign 1 point.
36 Are possible vaccine stock-outs monitored at the local
level?Verify the information.
37 Are supervisory activities monitored? Ask when each department (and, ideally,
municipality) was supervised.
38 Can standardized tables or reports be created to show
EPI data as needed? Verify the information.
39 Do the EPI tables or reports show the date when the
information was updated? Review the information.
No. Movement of biologicals Yes No N/A Comments
40 Using the consolidated weekly or monthly report, can you
calculate the percentage of biologicals lost by level?
Ask if and how frequently losses are
monitored.
41 Is there a form or notebook for monitoring the movement
of syringes (receipt and delivery)?
Verify data in the warehouse where the
biologicals are stored.
42
Using data from the notebook where the movement of
biologicals is recorded, can you monitor the vaccine lot
numbers and expiration dates?
Verify data in the warehouse where the
biologicals are stored.
43 Does the record show the receipt and delivery of all
biological products?
Verify data in the warehouse where the
biologicals are stored.
44 Is there an up-to-date log showing the receipt and delivery
of pentavalent vaccine over the last year?
Verify data in the warehouse where the
biologicals are stored.
45 Is there an up-to-date record of vaccine lot numbers and
expiration dates in the registry of biologicals?
Verify data in the warehouse where the
biologicals are stored.
Note: ESAVI: Events supposedly attributable to vaccination or immunization; IMCI: Integrated management of childhood illness.

54
Annex 7. Form for verifying data quality on preventive chemotherapy for STH, with guiding questions on data verification and systems evaluation
Point of Service Delivery
Name of health facility
(point of service delivery)
Data aggregation center 1/
Data aggregation center 2/ District
Indicator(s) assessed
1)
2)
3)
4)
5)
Date of evaluation
Reference period for the deworming
round
Part 1: Data verification
A. Review of the
documentation
Ind
icat
or
1
Ind
icat
or
2
Ind
icat
or
3
Ind
icat
or
4
Ind
icat
or
5
Comments
Check availability and
completeness of all
original documents on
the indicator for the
period selected for the
deworming round.
1
Cite the original
documents for each
indicator (write ‘N/A’ for
indicators not applicable
to the facility being
evaluated—e.g., an
indicator for STH in a non-
endemic area).
Guiding question (for each indicator): What data source was used to prepare a summary report on the
deworming exercise (conducted during the period being evaluated)?
Comment: Write the source for each indicator. Please note the reference period of the evaluation.
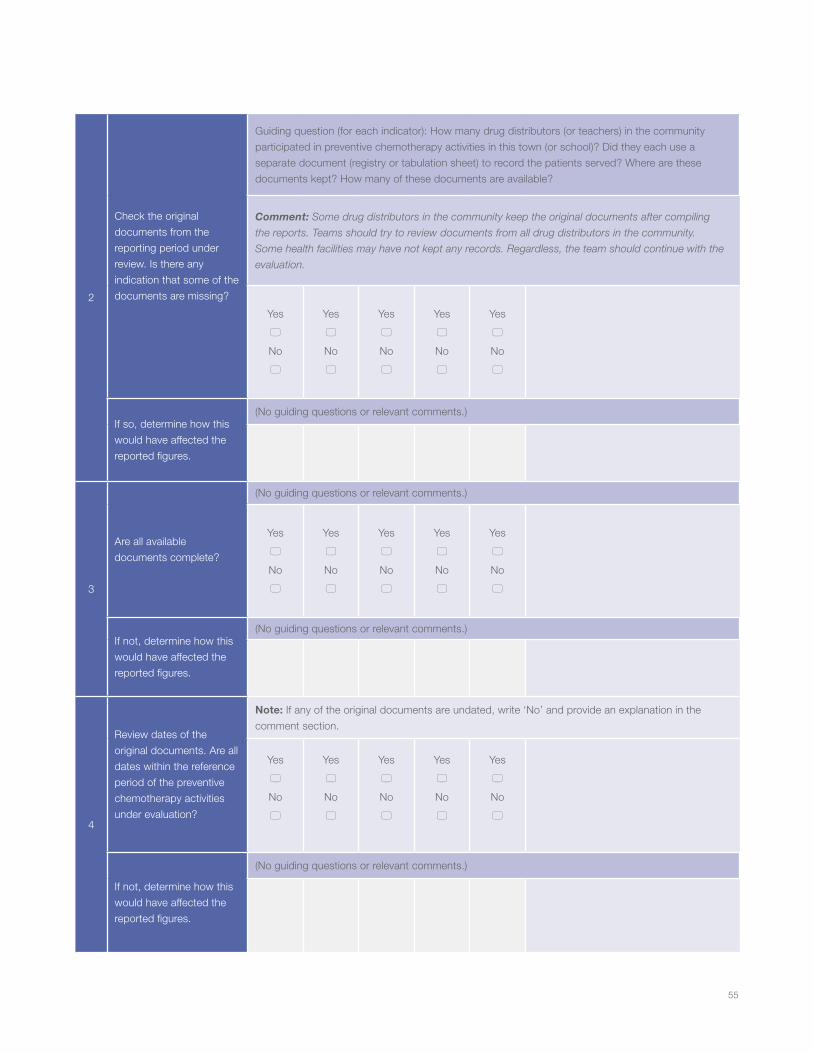
55
2
Check the original
documents from the
reporting period under
review. Is there any
indication that some of the
documents are missing?
Guiding question (for each indicator): How many drug distributors (or teachers) in the community
participated in preventive chemotherapy activities in this town (or school)? Did they each use a
separate document (registry or tabulation sheet) to record the patients served? Where are these
documents kept? How many of these documents are available?
Comment: Some drug distributors in the community keep the original documents after compiling
the reports. Teams should try to review documents from all drug distributors in the community.
Some health facilities may have not kept any records. Regardless, the team should continue with the
evaluation.
Yes
5
No
5
Yes
5
No
5
Yes
5
No
5
Yes
5
No
5
Yes
5
No
5
If so, determine how this
would have affected the
reported figures.
(No guiding questions or relevant comments.)
3
Are all available
documents complete?
(No guiding questions or relevant comments.)
Yes
5
No
5
Yes
5
No
5
Yes
5
No
5
Yes
5
No
5
Yes
5
No
5
If not, determine how this
would have affected the
reported figures.
(No guiding questions or relevant comments.)
4
Review dates of the
original documents. Are all
dates within the reference
period of the preventive
chemotherapy activities
under evaluation?
Note: If any of the original documents are undated, write ‘No’ and provide an explanation in the
comment section.
Yes
5
No
5
Yes
5
No
5
Yes
5
No
5
Yes
5
No
5
Yes
5
No
5
If not, determine how this
would have affected the
reported figures.
(No guiding questions or relevant comments.)

56
B. Totaling the reported results
Add up the results in the original documents, compare these figures to those reported by the health facility, and explain any
discrepancies.
5
Review the original
documents and add up the
number of persons, cases,
or events recorded during
the reference period of the
deworming round under
evaluation. [A]
(No guiding questions or relevant comments.)
6
From the health facility’s
summary report, copy the
number of persons, cases,
or events reported by the
facility during the reference
period of the deworming
round under evaluation. [B]
(No guiding questions or relevant comments.)
7
Calculate the quotient
between the figures
obtained in the re-count
and the figures reported.
[A/B]
(No guiding questions or relevant comments.)
8
If there are discrepancies
(e.g., mistakes in data
entry, arithmetic errors,
other causes), what might
account for them?
(No guiding questions or relevant comments.)
C. Verifying the reported results against other data sources
Confirm results by comparisons to other data sources—e.g., by reviewing the records of separate inventories that document
the quantities of drugs in order to determine if the figures match.
9 List the documents used
for verification.
(No guiding questions or relevant comments.)
10 Describe the steps of
verification.
(No guiding questions or relevant comments.)
11 What might account for
any discrepancies?
(No guiding questions or relevant comments.)

57
Annex 8. Form for verifying data quality on preventive chemotherapy for STH, with guiding questions on systems evaluation
Point of Service Delivery
Part 2. System evaluation
Response codes:
‘Yes, completely’
‘Partially’
‘Not at all’
‘N/A’
(Provide information for all questions not answered
‘Yes, completely’.
Detailed responses help to guide measures for institutional
strengthening).
I. Structure, functions, and monitoring and evaluation capacity
1
Responsibility for recording
the delivery of services in
the original documents
is clearly assigned to the
appropriate personnel.
Guiding questions: Is there a professional responsible for recording the services provided during
preventive chemotherapy treatments in this town or school health unit? If so, who has been assigned the
responsibility and who made the assignment? Were data-recording responsibilities clearly specified? (Ask
for a specific description of these responsibilities.) Was the assignment made in writing or verbally?
Comment: Try to determine if there are data management personnel and whether a health officer, such
as the district officer in charge of neglected tropical diseases, the subdistrict supervisor, or an authority
from the Ministry of Health, assigned the responsibility.
5 Yes, completely
5 Partially
5 Not at all
5 N/A
2
All pertinent personnel
are trained in data
management processes
and tools.
Guiding questions: How many people are responsible for recording data at this point of service (town
or school health unit, as appropriate)? How many received training in recording data and summarizing
or preparing a report on deworming activities? What aspects of recording and reporting data did the
training include?
Comment: Try to determine if the training included such aspects as the instruments for recording and
reporting the data, how to complete the instruments, reporting deadlines, places where the reports
should be sent, quality control, confidentiality, etc.
5 Yes, completely
5 Partially
5 Not at all
5 N/A
3
Have personnel been
given responsibility for
reviewing aggregated
figures before submission
to the next level?
Guiding question: Besides the person(s) responsible for summarizing the data or preparing the reports,
is there another person who verifies the summarized data and the report before submission to the next
level? If so, who is this person?
Comment: Hopefully, this professional is not the same person who prepares the report. On occasion,
however, the professional who writes the report also reviews it. In this case, please note that no one has
been designated to review the aggregated data.
5 Yes, completely
5 Partially
5 Not at all
5 N/A

58
II. Definitions of indicators and reporting guidelines
The national level has established guidelines (e.g., verbally, in writing, infographics, or practice aids) on …
4 ... what is expected to be
included in the report.
Guiding question: Has the town or school health unit received verbal or written instructions from the national
level on what should be included in the report following the deworming rounds?
Comment: This question is intended to determine if the health unit has received instructions on the
indicators for the data to be reported.
5 Yes, completely
5 Partially
5 Not at all
5 N/A
5
… how the reports should
be submitted (e.g.,
specific format).
Guiding question: Has the town or school health unit received instructions from the national level on
the format in which the reports should be presented? If so, what is the format?
Comment: (None)
5 Yes, completely
5 Partially
5 Not at all
5 N/A
6 … to whom the reports
should be sent.
Guiding question: Has the town or school health unit received instructions from the national level on
the person to whom the reports should be sent? If so, to whom should they be sent?
Comment: (None)
5 Yes, completely
5 Partially
5 Not at all
5 N/A
7 … when the reports
should be submitted.
Guiding question: Has the town or school health unit received instructions from the national level
regarding on the reports should be prepared and submitted to the next level? If so, what is the deadline
for preparing and submitting the reports to the next level? Compare these to national deadlines, if
available.
Comment: (None)
5 Yes, completely
5 Partially
5 Not at all
5 N/A
III. Forms and instruments for capturing and reporting data
8
The monitoring and
evaluation unit has
identified the current forms
and instruments for use
at the points of service
delivery to capture and
report data.
Guiding question: (None)
Comment: It may not be necessary to pose this question to personnel at the point of service delivery
because the information may already be available in the central monitoring and evaluation unit. The
question may only indicate if the unit is using the instruments.
5 Yes, completely
5 Partially
5 Not at all
5 N/A

59
9
… If so, do the personnel
at the point of service
delivery regularly use these
forms and instruments?
Guiding question: Do all drug distributors in the town or school community use current national-level
data collection instruments on an ongoing, constant basis? Do other data collection instruments exist
besides those used by the drug distributors in the town or school community?
Comment: Ask this question only if the monitoring and evaluation unit at the central level has identified
current forms and instruments.
5 Yes, completely
5 Partially
5 Not at all
5 N/A
10
The monitoring and
evaluation unit has
provided clear instructions
on how to complete the
forms and on instruments
for capturing and reporting
data.
Guiding question: Has the town or school health unit received instructions from the national level
on how to complete the forms and instruments for capturing and reporting data? How were these
instructions conveyed? Determine if they were given verbally, in writing, or as practice aids. How clear
were the instructions?
Comment: If the instructions were unclear, try to determine what parts were unclear.
5 Yes, completely
5 Partially
5 Not at all
5 N/A
11
All original documents
and appropriate report
forms for measuring the
indicator(s) are available
for audit (including
hardcopy data for
computerized systems).
Guiding question: How many original documents (e.g., registries) were used by all the drug distributors
from the town or school health unit during the deworming round under evaluation? Did the unit prepare a
report or summary data following the deworming round? Ask to see all original documents and summary
reports (tabulation sheets) prepared by the health unit.
Comment: Ask to see the original documents and compare the available figures against estimates. If the
town or school health unit prepared a report, ask to see it. If the center uses a computerized system, ask
for a hardcopy of the data.
5 Yes, completely
5 Partially
5 Not at all
5 N/A
12
Data in the original
document accurately
measure the indicator(s)—
i.e., relevant data collected
by sex, age, etc., if
the indicator requires
a breakdown by these
variables.
Guiding question: (None)
Comment: Determine if data in the original document are sufficiently accurate. The team should also
verify data in the source document to evaluate their accuracy. If not sufficiently accurate, consider
causes: the instruments may not have had good enough instructions or the health workers may not have
provided sufficient documentation.
5 Yes, completely
5 Partially
5 Not at all
5 N/A
IV. Data management processes
13
Quality control measures
of the data collected for
the summary reports have
been implemented (e.g.,
to detect transcription
errors).
Guiding question: Did the town or health unit use quality control measures during data collection to
guarantee the quality of the summary reports? If so, what measures were used?
Comment: An example: two different professionals total and compare results, comparing aggregated
values to disaggregated values.
5 Yes, completely
5 Partially
5 Not at all
5 N/A

60
14
(a) If applicable, there are
data quality controls when
data on hardcopy forms
are entered in a computer
database to ensure
accuracy (e.g., editing or
logical tests, subsequent
data verification, etc.).
Guiding question: Did the health unit use quality control measures to ensure that hardcopy data were
entered correctly into the computer?
Comment: Ask this question only if the center has a computerized system.
5 Yes, completely
5 Partially
5 Not at all
5 N/A
15
If applicable, the unit
keeps a written backup
copy of data entered in the
computer.
Guiding question: None
Comment: Ask this question only if the center has a computerized system.
5 Yes, completely
5 Partially
5 Not at all
5 N/A
16
… if so, the most recent
date of the backup copy
is appropriate, considering
the frequency with which
the computer system is
updated (e.g., if updates
occur weekly or monthly,
backup dates should be
weekly or monthly).
Guiding question: None
Comment: Ask this question only if the center has a computerized system.
5 Yes, completely
5 Partially
5 Not at all
5 N/A
17
Important personal data
are protected per national
or international standards
for confidentiality.
Guiding questions: Have measures been implemented to limit unauthorized access to original
documents containing personal data (e.g., registries)? If so, what measures were taken? (These may
include a locked document file). How are documents containing personal data protected when not in
use? How do you protect yourselves in case these documents are stolen or lost?
Comment: (None)
5 Yes, completely
5 Partially
5 Not at all
5 N/A
18
(b) The data registration and reporting system has safeguards to prevent a person from being counted twice at one or several health units—e.g., a person receiving the same service twice within the evaluation period or a person receiving the same service in two different places.
Guiding question: Have steps been taken to detect and avoid situations in which a person is recorded
and reported as receiving the same service more than once in the same town or school unit or as
receiving the same service in this unit and another one? If so, what steps have been taken?
Comment: None
5 Yes, completely
5 Partially
5 Not at all
5 N/A

61
V. Links to the national reporting system
19
If available, the appropriate
national forms or
instruments are used to
capture and report data.
Guiding question: None
Comment: This question applies to countries with national forms and/or instruments. The Ministry of
Health usually publishes national instruments. Instead of asking this question, it may be sufficient to
simply review the registration and reporting forms (which should been done under “Part III, forms and
instruments for capturing and reporting data”) to determine if national forms or instruments exist.
5 Yes, completely
5 Partially
5 Not at all
5 N/A
20
If applicable, the data are
reported through a single
channel to the national
information systems.
Guiding question: Where and how is your report submitted?
Comment: Only ask this question if there is a national information system on neglected tropical diseases.
It may be necessary to try to determine if there is follow-up of the national system.
5 Yes, completely
5 Partially
5 Not at all
5 N/A
21
Reporting deadlines are
consistent with deadlines
of the national program on
NIDs.
Guiding question: Has the national level set a deadline for preparing and submitting the reports
following the most recent deworming round? If so, what were the time frames? (Note: This information
may have already been obtained under Question 7, and the question may be unnecessary.)
Comment: Only ask this question if there is a national information system for neglected tropical
diseases. Teams in the field should be aware of the national program’s deadline. Compare the national
program’s deadlines to those for neglected tropical diseases.
5 Yes, completely
5 Partially
5 Not at all
5 N/A
22
Points of service
are identified using
identification numbers
consistent with the
national system.
Guiding question: (None)
Comment: This question applies to countries with a national information system that uses ID numbers
at points of service delivery in towns and schools.
5 Yes, completely
5 Partially
5 Not at all
5 N/A

62
Annex 9. Description of the electronic immunization registry (EIR)
Country:
Responsible team:
Date: / /
Scope of the electronic immunization registry
1. Which population groups are included in the EIR (children, adults, etc.)?
2. Does the EIR include nominal registry data from the regular (intramural) vaccination program?
3. Does the EIR include nominal registry data from campaigns?
4. Does the EIR include nominal registry data on non-EPI vaccines?
5. Does the EIR include nominal registry data from immunization activities in the field (extramural activities) other than
campaigns?
6. If so, what extramural vaccination activities are recorded?
7. Are historical data from previous cohorts included in the EIR by migrating or typing data into the database?
8. When a new person is added to the EIR, is his or her vaccination history recorded?
9. Is there a standard procedure for updating a child’s ID number to replace a temporary ID?
Legal and regulatory framework
1. Does the Ministry of Health have an eHealth strategy?
2. Does the country have legislation on eHealth?
3. Is there national legislation on use of the EIR?
4. If answers to the previous questions were ‘yes’:
e. Does the Ministry of Health’s EIR software meet all regulatory requirements?
f. Does the Social Security Fund’s EIR software meet all regulatory requirements?
g. Does the EIR software used by the private sector meet all regulatory requirements?
5. Is use of the EIR in Ministry of Health services mandatory?
6. Is use of the EIR in non-public health services, such as the private sector, mandatory?
7. What kind of legal framework regulates data privacy and confidentiality?
Software architecture
1. Is the EIR linked to other health information subsystems?
2. Are EIR data integrated with other health information subsystems?
3. Are EIR data linked to the birth records stored by the Department of Vital Statistics in the Office of the Comptroller of the
Republic or an equivalent institution?
4. Is the EIR linked to or integrated with data in other EPI sources?
5. Was the current EIR software created using Web-based technologies?
6. Was the current EIR software created using virtual desktop standalone or client-server technologies?
7. Does a mobile version of the EIR software exist?
8. Does the EIR software use MSS technology?
9. In what programming language(s) was the EIR software developed?
10. On what database platform was the EIR software developed?

63
1. If applicable, does the EIR software use an engine and/or package for generating reports or graphs?
2. If applicable, does the EIR software use an engine or package for generating maps?
3. If the answers to questions 11 and/or 12 were ‘yes’, list the engines or packages.
4. Does the software run online, offline, or both?
5. How often are the data updated?
6. Where is/are the EIR database(s) housed?
7. What are the minimum technical specifications for the user’s computer to run the EIR software correctly?
Maintenance and sustainability
1. What organization is responsible for managing the EIR software?
2. What organization is responsible for managing the information?
3. Can the EIR software be expanded?
4. Do plans exist to expand the EIR software?
5. Do plans exist to upgrade the computers that the EIR software runs on?
6. Do plans exist to expand the telecommunication facilities that the EIR software uses?
7. Is there a policy on computer security for the EIR?
8. Is there a backup protocol or policy?
9. Are there standard procedures for detecting and correcting duplicate records in the EIR?
10. Is there a computer policy on management of the EIR database?
11. What is the protocol for updating the EIR software?
12. What is the protocol for upgrading the EIR software?
13. What is the protocol for managing coverage in the EIR database?
14. Is there any technical documentation on the architecture and inner workings of the EIR software?
15. If so, is the documentation updated for the software’s latest version?
16. Is there technical documentation for EIR users, such as manuals, guidelines, etc.?
17. If so, has the documentation been updated for the software’s latest version?
18. Is there an annual budget for maintaining the EIR software?
19. If so, what are its funding sources?
20. Is there an annual budget for updating and upgrading the software?
21. If so, what are its funding sources?
Human resources
22. Are there standards regarding a minimum technical profile for personnel who enter data in the EIR software?
23. If so, what is the minimum technical profile?
24. Are there standards regarding a minimum technical profile for personnel who validate data entered into the EIR database?
25. If so, what is the minimum technical profile?
26. Is there a strategy for helping EIR users?
27. Is there a standard minimum technical profile for personnel who develop or maintain the EIR software?
28. Is there a standard minimum technical profile for personnel who train EIR users?
29. Is there a standard minimum technical profile for personnel who maintain the equipment and telecommunications used by
the EIR?
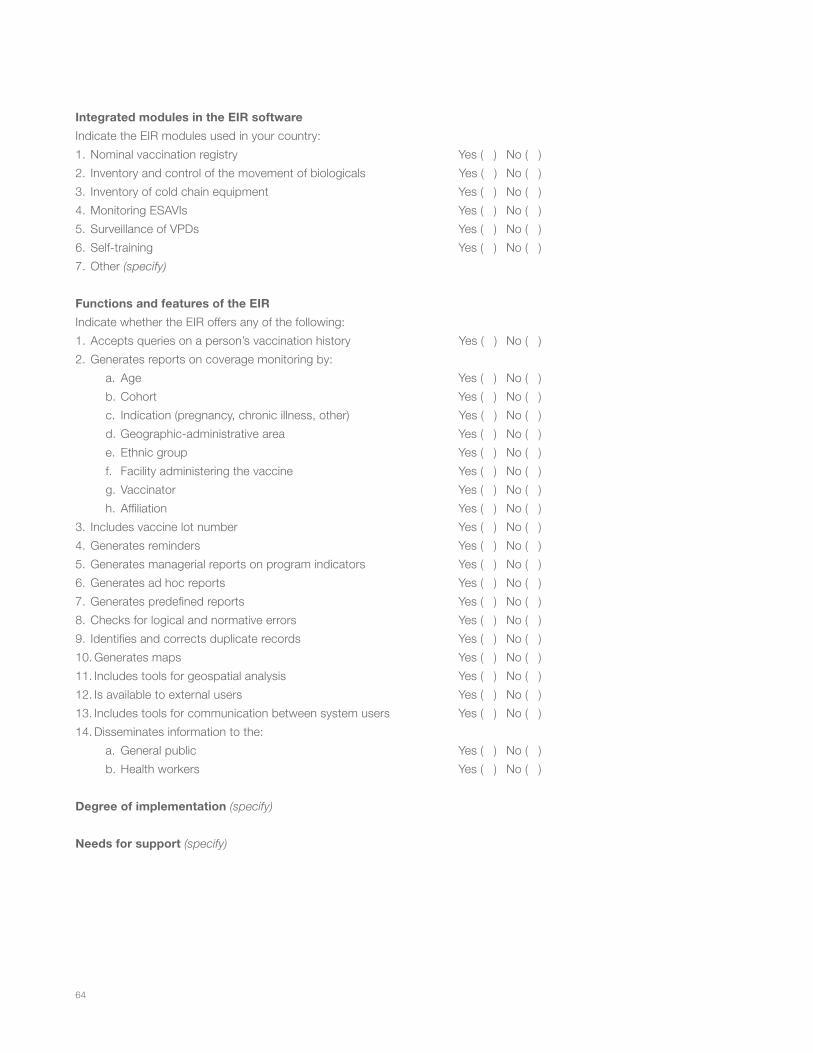
64
Integrated modules in the EIR software
Indicate the EIR modules used in your country:
1. Nominal vaccination registry Yes ( ) No ( )
2. Inventory and control of the movement of biologicals Yes ( ) No ( )
3. Inventory of cold chain equipment Yes ( ) No ( )
4. Monitoring ESAVIs Yes ( ) No ( )
5. Surveillance of VPDs Yes ( ) No ( )
6. Self-training Yes ( ) No ( )
7. Other (specify)
Functions and features of the EIR
Indicate whether the EIR offers any of the following:
1. Accepts queries on a person’s vaccination history Yes ( ) No ( )
2. Generates reports on coverage monitoring by:
a. Age Yes ( ) No ( )
b. Cohort Yes ( ) No ( )
c. Indication (pregnancy, chronic illness, other) Yes ( ) No ( )
d. Geographic-administrative area Yes ( ) No ( )
e. Ethnic group Yes ( ) No ( )
f. Facility administering the vaccine Yes ( ) No ( )
g. Vaccinator Yes ( ) No ( )
h. Affiliation Yes ( ) No ( )
3. Includes vaccine lot number Yes ( ) No ( )
4. Generates reminders Yes ( ) No ( )
5. Generates managerial reports on program indicators Yes ( ) No ( )
6. Generates ad hoc reports Yes ( ) No ( )
7. Generates predefined reports Yes ( ) No ( )
8. Checks for logical and normative errors Yes ( ) No ( )
9. Identifies and corrects duplicate records Yes ( ) No ( )
10. Generates maps Yes ( ) No ( )
11. Includes tools for geospatial analysis Yes ( ) No ( )
12. Is available to external users Yes ( ) No ( )
13. Includes tools for communication between system users Yes ( ) No ( )
14. Disseminates information to the:
a. General public Yes ( ) No ( )
b. Health workers Yes ( ) No ( )
Degree of implementation (specify)
Needs for support (specify)

65
Annex 10. Form for evaluating quality of the electronic immunization registry (eNVR) Interview with the professional responsible for data entry
No. Availability of equipment meeting technical
specifications Yes No N/A Comments
1 Do you have the latest version of the EPI software? Verify.
2 Do you think that the software updates due to changes in the immunization schedule are timely?
If not, ask for an explanation.
3 Do you have computers for running the EPI software? Verify.
4 If so, is the computer a desktop, laptop, or tablet?
5 If the answer to question 3 was ‘yes’, is the computer for shared or exclusive use?
If shared, ask with whom.
6 If shared, do you have enough time to use the EPI software?
If not shared, write ‘N/A’.
Computer specifications (verified in the computer, “My PC;” to identify the technical specifications of the computer, go to MY PC in Windows Explorer and copy the technical specifications)
7 RAM
8 Operating system
9 Version of MS Office®
10 Does the computer have antivirus protection? If not, ask for an explanation.
11 Does the computer have a working surge protector in case of power outages? A working UPS power supply?
If not, ask for an explanation.
12 Does the software run properly? If not, ask for an explanation.
13 Is an adequate printer available? If not, ask for an explanation.
14 Have there been enough supplies—ink, toner, paper, etc.—available over the last 3 months?
If not, ask for an explanation.
No. Internet access Yes No N/A Comments
15 Is there institutional Internet access?
Does the institution restrict Internet access to any of the following sites?
16 Personal e-mail Ask specifically about restrictions to Yahoo, Gmail, Hotmail, etc.
17 Social networks Facebook, MySpace, etc.
Name and location of health facility:
Level: National Departmental Municipal Health unit
Sector: Public Social security Private Other (specify):
Evaluation team:
Date: / /

66
18 YouTube
19 Other
20 How often is the Internet down?
21 When the Internet is down, how does it affect your work? Ask for an explanation.
No. Infrastructure Yes No N/A Comments
22 Have you had an uninterrupted electrical power over the last 3 months?
If not, ask for an explanation.
23 If you had a power outage, how many times did it happen?
24 If you had a power outage, how did it affect your work with the EPI software?
Ask for a description.
25 Do you have an electric generator or another power backup system?
If not, ask for an explanation.
26 Is your physical work site (workstation) adequate for data entry?
Check to make sure the work surface is large enough, the chair is adequate, etc.
27 Do you have all necessary supplies for data entry?
Check the availability of supplies, including rulers, magnifying glasses, pencils, highlighters, etc.
28 Is there a mechanism to alert you when records have already been entered into the EPI software?
Ask how the data entry clerk knows where he/she stopped entering data
29 Does the data entry workspace have air conditioning? Verify.
No. Human resources and technical assistance Yes No N/A Comments
30 Type of contract (for data entry clerk).
31 Time devoted to data entry (hours per week).
32 How long have you been using the EPI software?
33 Do your qualifications meet the required profile? For example, for the ideal data entry clerk.
34 Did you receive formal training on using the EPI software?
If not, ask for an explanation.
35 Did you receive training on minimum EPI standards?Ask if he or she has at least received training on the current immunization schedule.
36 Do you feel that you have enough time to enter the records in the EPI software database?
If not, ask for an explanation.
37 Do you know what to do when the text in the daily registration form is unclear?
If not, ask for an explanation.
38 Do you have access to technical assistance? If not, ask for an explanation.
39 If so, how do you obtain technical assistance? Specify the modality used most often.
In person or via telephone help desk, texting, Internet.
40 If so, in what type of situation do you ask for technical assistance?

67
No. Data capture Yes No N/A Comments
41 Do you know how to create a record for a new person in the database?
Ask the person to demonstrate how it is done.
42 Do you know how to update a record at the time of vaccination?
Ask the person to demonstrate how it is done.
43 How do you correct errors in data entry? Ask for an explanation.
44 In general, how soon are data entered?For example, on the same day as vaccination, within a week or month, or at another interval.
45 How long does it take to enter data on a new person in the system?
If possible, record the time it takes to enter two records and calculate the average.
46 How long does it take to update vaccination data in an existing record?
If possible, record the time it takes to update two records and calculate the average.
No. Perceptions of the data entry clerk Yes No More or
less Comments
47 Do you like the EPI software? If not, ask for an explanation.
48 Do you think the EPI software is user-friendly? Ask for an explanation.
49 Do you think there are enough human and technological resources to handle the volume of persons being vaccinated/entered into your facility’s database?
Ask for an explanation.
50 What suggestions do you have for improving the EPI software?
No. Perceptions of the professional in charge of the EPI
programYes No N/A Comments
Do you think the EPI software makes it easier to:
51 Monitor doses administered? If not, ask for an explanation.
52 Identify children who were not vaccinated on a given date? If not, ask for an explanation.
53 Generate consolidated monthly reports of doses administered?
If not, ask for an explanation.
54 Do you think the reports are useful? If not, ask for an explanation.
55 Do you think additional reports should be generated? If not, ask for an explanation.
56 If so, what would they be?
57 What suggestions do you have for improving the EPI software?

Tools for monitoring the coverage of integrated public health interventionsVaccination and deworming ofsoil-transmitted helminthiasis
CoverageSurveys
Module 5

3
Tools for monitoring the coverage of integrated public health interventionsVaccination and deworming ofsoil-transmitted helminthiasis
CoverageSurveys
Module 5

4
Tables and figures Introduction Unit 1. Before starting a coverage survey 1. Why conduct a coverage survey? 2. What is the best method for conducting a coverage survey?3. What factors should be considered in conducting a survey?4. What methodological standards must be met?5. What types of errors should be monitored? 6. How is it determined that the intervention was received? 7. How should the estimated coverage be interpreted? 8. What ethical standards should be met?
Unit 2. Implementation of coverage surveysStep 1: Planning 1.1. Objectives: What and who?1.2. Who should conduct the survey?1.3. Methodological design 1.4. Sampling frame1.5. Sample size1.6. Adaptation of the instruments1.7. Formation of the teams1.8. Programming of the activities1.9. Resources1.10. Coordination and information1.11. Training of the team1.12. Pilot test
Step 2: Data collection2.1. Collection, systematization, and processing2.2. Quality control of the data
68
999101112121313
1516161717192020212121212122
222223
Table ofContents

5
23232324
2424
25
262626
27
Step 3: Data analysis3.1. Data tabulation and critical review3.2. Calculation of indicators3.3. Interpretation of results
Step 4: Dissemination of the results4.1. Preparation of the report
Recommendations for preparing the report4.2. Discussion of the results
Step 5: Decision-making 5.1. Definition of strategies5.2. Plan of Action
References

Target populations and interventions subject to rapid monitoring of vaccination.Characteristics of cluster and lot quality assurance sampling.Sections of a report of results of coverage surveys.
Algorithm for coverage surveys of integrated public health interventions.Plan for dividing a municipality into areas.
Use of the random numbers table.Survey for collecting data on the coverage of integrated health interventions, preschool and school-age children.Form for recording data on vaccination and deworming coverage based on lot quality assurance sampling.Protocol for coverage surveys on integrated interventions.
Table 01. Table 02.Table 03.
Figure 01.Figure 02.
Annex 01.Annex 02.
Annex 03.
Annex 04.
6
Annexes
Tablesand Figures

7

8
Country decisions to conduct a coverage survey should be based on the need for information to make informed decisions. Since surveys are intended to guide public health activities, they must have sufficient methodological rigor to provide precise and valid results. Figure 1 shows the algorithm for conducting a survey.
Unit 1 of this module provides answers to the questions most frequently asked before starting a coverage survey. Unit 2 describes the steps of the survey itself, emphasizing the basic components of selecting and applying the most appropriate methodology based on the study’s objectives.
Figure 1. Algorithm for coverage surveys of integrated public health interventions
COVERAGE SURVEYS
OBJ
ECTI
VES
TOO
LSR
ESU
LTS
DEC
ISIO
NS
Coverage surveys
Analyze coverage estimates and indicators of vaccination opportunity and service quality
Identify gaps in coverage, timeliness and quality of service
Interventions based on the problems detected
The lot achieved acceptable coverage level
The lot did not achieve acceptable coverage level
Interventions based on the problems detected
Analysis of possible causes
Lot quality assurance sampling
Analyze results of lot quality assurance sampling
Estimate the level of coverage base on probabilistic studies
Analysis of possible causes
Maintain coverage high and uniform
Probabilistic coverage studies
Introduction

9
Coverage surveys are not often done due to the time, resources, and trained personnel needed to ensure
valid and representative results. Generally, countries conduct surveys to validate information using more
rigorous criteria or when there is no reliable data to make good decisions about coverage in a given area
or population group.
1. Why conduct a coverage survey?By using probability sampling, surveys make it possible to estimate coverage. In addition to evaluating the effectiveness of health interventions, coverage surveys facilitate the analysis of factors associated with the population’s access to health services and help to validate data from reliable information systems. They also help to improve the quality of administrative coverage data.
Nevertheless, coverage surveys are expensive and complicated to design, implement, and analyze. Surveys must also not distract from fundamental program goals—namely, vaccination and/or deworming activities to meet coverage targets. Coverage surveys have the following objectives:
� To confirm that administrative coverage data are valid. � To explain changes or gaps in coverage levels. � To determine coverage in the areas under evaluation and the reasons why the population failed to receive the intervention or
treatment. � To guide activities aimed at increasing the coverage of a target population, if current coverage lags behind the goal.
2. What is the best method for conducting a coverage survey?Because population groups are generally identified in geographic areas (neighborhoods, blocks, schools, etc.), coverage surveys often use cluster sampling. This methodology assumes that the random selection of clusters reflects the variability of the entire study population—i.e., that each cluster is to some extent a reflection of the whole.
In reality, clusters are selected along geographic or politico-administrative lines. As a result, not every cluster is internally heterogeneous or consistently similar to the others. Variation within a cluster sample may be high, resulting in imprecise estimates. To address this limitation, the sample size and number of clusters may be increased, although doing so results in higher costs and more complicated logistics (1,2).
Unit 1.Before Starting a Coverage Survey

10
Since interventions are intended to achieve universal coverage and ≥95% homogeneity in all areas and population groups, coverage estimates must be precise. For many years, immunization programs followed the Expanded Programme on Immunization Coverage Survey Manual, which recommend a cluster survey design of 30 clusters of 7 children each. This design was useful when coverage goals were <80%. In the era of higher coverage goals, however, countries must use larger samples to obtain more precise estimates and probabilistic sampling techniques to improve the estimation’s representativeness and accuracy (3,4).
Another method to analyze coverage is lot quality assurance sampling (LQAS) (1,5,6,7), which draws on quality assurance processes in industrial production. In LQAS, investigators establish a decision value, or cut-off point, corresponding to the maximum allowable number of individuals who did not receive the intervention. The decision value is used to determine if a lot has met the coverage goal.
For purposes of determining coverage, a lot corresponds to a population stratum or an area inhabited by the target population. From the standpoint of the organization of health services, a lot is the smallest unit that provides useful information for determining if programs have met coverage goals. Each lot should be internally consistent—i.e., each sampling unit or individual constituting a lot should have had similar exposure to the health intervention under evaluation. In using LQAS, keep the following points in mind (8,9):
� The method does not estimate coverage; it rates the coverage of each lot using pre-determined cut-off levels. � Compared to traditional stratified sampling, one of the method’s advantages is that the sample size may be smaller because it is
based on a binary response (either acceptable or unacceptable). � The methodology is not typically used to estimate overall coverage of the target population. However, if a more complex design is
used that weighs and incorporates analytic techniques to adjust data, LQAS may estimate overall population coverage (10 ). � Results do not always reflect coverage of the entire lot, especially if the lot is very large and heterogeneous (e.g., large or
capital cities). � Because of the sample’s relatively small size and the methodology used to select the lots, the team must be careful to avoid
mistakes in classifying lots—i.e., determining that a given lot has achieved the coverage goal when it has not, or vice versa. � The sample is based on a household survey, meaning that results reflect coverage of the children found in the home or those for
whom recorded information is available. � The method helps to identify areas that did not meet the established coverage minimum. Results can be used to design
interventions for communities without acceptable coverage (11).
3. What factors should be considered in conducting a survey? After deciding to conduct a survey, the country should define the objectives and intended use of the results. Initial steps include arranging statistical support, assembling and training a team to guarantee methodological quality, obtaining necessary resources, and making logistical arrangements, paying special attention to the geographic terrain and safety precautions needed to reach the target populations. The following questions help with planning:
� Do available data sources suggest that the immunization or deworming programs have not reached certain population groups? If so, proceed with the survey.
� Is the country interested in making statistical inferences from vaccination coverage? If so, what will the results be used for? Is there interest in having a general estimate of coverage without a detailed breakdown?
� How large is the budget and how much money is needed to conduct the survey? � Do adequate logistical resources and suitable operating conditions exist to conduct the survey? � Do personnel have experience with this type of methodology? Is there adequate technical support to guarantee the survey’s
methodological rigor? � Can previous coverage surveys of the population be studied? If so, when was the last survey conducted and what were the
results?

11
Once the country decides to proceed with the survey, it is recommended that the methodology selected be used in future surveys, such that results will be comparable. Using the same methodology helps to monitor both coverage trends and the effect of any corrective interventions. Next, the country must decide who will conduct the study: health workers or a technical group that specializes in conducting surveys, typically from a university, institute, or private company. Countries should consider the advantages and disadvantages of each option:
� Surveys administered by health workers tend are relatively cheap, and health professionals are often familiar with the subject matter. However, health workers may lack sufficient training or experience to ensure the study’s methodological rigor and may introduce biases—for example, as a result of failing to follow the selection criteria for houses in the protocol, or by interpreting the information to fit the way the schedule is supposed to work rather than the way it appears in the records or the way the mother reported it.
� The main advantages of an outside team, particularly a professional polling company, are that its members have knowledge and experience in administering surveys, are accustomed to following protocols, and usually have the necessary logistical tools to implement fieldwork. Additionally, international donors and national authorities outside the health system may believe that a report generated by an external agency is more objective. However, potential disadvantages of working with an academic institution or polling company include the increased cost and the possible need to provide greater training and supervision of interviewers.
4. What methodological standards must be met?Methodological standards for a coverage survey must be clearly established in the protocol and monitored throughout implementation. These include (12):
� Representativeness: The geographic area defined for estimating coverage must be representative. The degree of precision depends on the study’s objectives and feasibility. Coverage goals for interventions such as vaccination and deworming are high and should be uniform to achieve the desired impact. As much as possible, then, results should represent small geographic localities, either districts or municipalities. However, since this requirement increases the survey’s cost, another option is to generate coverage data that are representative of demographic characteristics (e.g., urban or rural areas) or sub-populations of interest (e.g., indigenous communities or populations living in vulnerable conditions).
� Sampling frame: The universe from which the primary sampling units (PSUs) are drawn should be comprehensive to ensure that all units have some probability of selection. Unit should be selected using random number tables or statistical programs that generate random lists. Maps and lists of the PSUs are needed.
� Selection of households: Criteria for selecting houses where participants will be interviewed are very important. To reduce the possibility of introducing systematic bias, the selection process should be randomized and standardized. The pre-selection of homes is recommended before going to the field, as are multiple visits to avoid a high number of replacement households. The field team should be trained in the sampling design of visiting the selected households; for this reason, procedures must be easy to understand and apply.
� Selection of individuals: In selecting individual children, the team must strictly follow the procedure in the protocol. On arriving to the house, the interviewer should explain the survey’s objective and obtain the consent of an adult or parent guardian who can answer the survey questions, which include information about the immunization history or other public health interventions received by the child. The interviewer should remind the participant that he or she has the right to refuse to participate in the survey or answer any questions. Good interviews are key to ensuring reliable data.
� Information source: The source may be a health card, a statement by the child’s parent or guardian, or a vaccination record from the health center(s) (the child may have been vaccinated at more than one health center and some immunization records may not be available).
� Questionnaire: To facilitate record-keeping and data processing, surveys should have closed-ended questions. Mobile devices are useful for obtaining high-quality data on a timely basis, and many have programs that detect mistakes in data input. The interviewer can see an error message and make corrections at the time of the interview.

12
In addition to collecting data from individuals at the time of the intervention (vaccination, deworming, etc.), coverage surveys serve to gather information on other variables, such as factors that facilitate or impede the population’s access to health services (Annex 2).
� Field teams: Trained supervisors should support the field teams. Preferably, at least one team member should be familiar with the area where the interviews will be conducted. Teams must be trained on the study’s objectives; on interpreting and extracting pertinent data from health cards, vaccination certificates, and other health documents; and on sampling techniques, ethical issues, and administration of the questionnaire.
� Strategy for data management and analysis: A database should be designed using computer packages that facilitate data tabulation and analysis. Double data entry may be required to minimize transcription errors. To verify data integrity and quality, some interviews may be repeated at houses randomly selected by the supervisor. To ensure that results are valid and meet the study’s objectives, the team should request help from professionals with experience in evaluating data quality and adjusting coverage estimates.
5. What types of errors should be monitored? In coverage surveys, two types of errors must be monitored: sampling (selection) and systematic errors (or bias) (4).
� Sampling errors reduce the precision of the results. Sampling errors can be avoided by choosing the most appropriate sampling design for achieving an acceptable degree of precision, keeping in mind the sample size and number of clusters. It is always necessary to balance financial constraints with the operational requirements for conducting the survey (13). The probability of sampling errors depends on the sample size, percentage and variability of coverage, effect of the sampling design, and number of observations in the sample group. The larger the sample, the more precise the coverage estimate and the lower and narrower the confidence interval.
� Systematic errors or bias can distort results by generating over- or underestimates of coverage, leading to misguided decision-making. Systematic errors may arise during any phase of the survey and create bias or systematic deviations in the results. These errors may originate from omissions in the sampling frame; inappropriate selection of study areas and households; poorly designed questionnaires; interviewers who are not fully trained or supervised and who thus make errors or omit data from the record; loss of data or errors in transcription or data input; or incorrect use of the analysis tools, leading to distorted results (14). Examples of information bias include recording a child as having been vaccinated when he or she did not receive the vaccine, or vice versa, recording a child as not vaccinated when he or she did receive the vaccine.
To reduce the risk of systematic bias in coverage surveys, the leadership team should:
• Train and closely supervise interviewers.• Develop a protocol with adequate methodological rigor and appropriate questionnaires.• Validate questionnaires before starting the survey and make any needed adjustments.• Use more than one data source to avoid omissions and improve the quality of the information collected (15).• To reduce the “no response” rate, schedule house visits at times convenient for the population and re-visit places where
no one was at home.• To obtain a valid estimate of coverage, try to gather the most reliable data during the survey. • Try to include remote areas and health centers.
6. How is it determined that the intervention was received?It is essential to have a reliable source of information on the patient’s vaccination or deworming status or the status of any other intervention of interest. Health cards are the most commonly used source in coverage surveys. However, cards may contain errors. Additionally, depending on the country and social and cultural factors, the card may not be available during the interview. To allow for such cases, verbal verification of health status is also accepted. In this modality, interviewers ask participants a series of questions to determine if the patient has received the intervention of interest (see Module 3).

13
Several studies have evaluated the quality of these and others data sources (16). Medical records are another data source, but they may contain data entry errors, and their validity depends on the population’s access to health services and the quality of these services. Additionally, some individuals may have been vaccinated or dewormed at another health facility. A final option is reviewing information in health facilities themselves. Here again, the usefulness of the information depends on the quality of the records.
Based on past experiences, the study team should use several methods to collect data. This helps to detect and resolve any discrepancies and make the data collection more complete. Finally, new technologies allow photographing of immunization cards and/or records, which helps to transcribe information, to resolve issues that arise, and to provide qualitative evidence about the primary sources of information on vaccination (4).
7. How should the estimated coverage be interpreted?Regardless of the sample size and methodological design, all surveys have a certain amount of sampling error. Consequently, the value of an indicator generated from the data analysis is an estimate of the real value in the population being studied. Survey results therefore must always include confidence intervals for the coverage estimates, since this information is necessary to interpret findings properly and make well-founded decisions. The confidence intervals reflect the precision of the estimates and are necessary to compare and detect differences in coverage among the areas and populations studied.
In interpreting results, the study team must evaluate for the possibility of systematic errors. This means reviewing the methodology to identify these errors and assessing possible sources of bias that may distort coverage estimates (17). If several areas are surveyed—e.g., when estimating national coverage—the team should use population size weighting after aggregating the data. Similarly, if only one child is selected in a house that has more than one eligible child, that child’s probability of inclusion in the study should be taken into account.
8. What ethical standards should be met?Research involving human subjects must meet international bioethical standards that guarantee respect for and protection of participants (18). It is therefore necessary to obtain authorization from the appropriate authorities and the approval of an ethics committee before conducting studies on coverage or the factors that prevent health program goals from being achieved. The country’s national ethics committee and then PAHO’s Ethics Committee (PAHOERC) must approve the protocol of any survey involving PAHO/WHO, whether the involvement is in the form of technical cooperation, funds, or in-kind contributions. Without this approval, PAHO/WHO cannot participate in any aspect of the survey. Further information on the PAHOERC approval process can be found on the PAHO website or through PAHO/WHO Representative Office in countries. From the start of the project to the implementation of methodologies for coverage analysis and monitoring, the country must guarantee compliance with basic ethical principles (19). In public health practice, these principles are expressed through the use of informed consent, informed consent of minors, impartial analysis of available evidence, risk-benefit analysis of the proposed protocol, proper selection of participants, and dissemination of results of public interest as an ethical obligation. Complying with ethical principles also means protecting participant confidentiality and autonomy; carefully preparing procedures and instruments; training and appropriately supervising the monitoring team; handling data and information with confidentiality and the highest quality standards; offering participants the opportunity to receive the benefits of an intervention if they have not been reached by health programs; and reporting results to communities and other stakeholders to support decision-making.

14
Providing appropriate information to interviewees and obtaining their informed consent guarantees that participants have voluntarily agreed to participate. For minors or persons incapable of providing consent, a guardian (i.e., person responsible for the patient’s care) may provide consent. Of note, minors have the right to be informed and provide consent, depending on their age and level of understanding (20). Interviewers should present information on the nature of the study and the rights of participants at the start of the survey. In some countries, an ethics committee may require that this information be presented in an individual or collective letter of consent that the interviewer reads aloud to each participant. In summary, remember the following points on informed consent:
� Use simple, nontechnical language wherever possible. � Avoid phrases that oblige or manipulate individuals to participate in the study. � Clearly explain the purpose of the research. � Give an estimate of the time of participation. � Explain that participation is voluntary and that participants may withdraw at any time without negative impact on interviewees
or their families. � Describe the study procedure—e.g., explain that an interview will be conducted and that, if necessary, participants will be
offered deworming drugs or vaccines needed per national guidelines. Explain the benefits, risks, or inconveniences that may arise from these interventions.
� Answer participants’ questions and tell them that they can consult their local health facility with further questions.

15
Surveys that do not meet basic methodological and operational criteria may yield erroneous results, leading to the misguided use of resources and unsound decision-making. Survey implementation must therefore be rigorous and systematic, per the steps below.
Unit 2.Implementation of Coverage Surveys
Coverage surveys provide information to detect and analyze inequities related to accessing health interventions. Conducting these surveys requires a significant investment of resources, and the surveys are complex to create, implement, and analyze. As a result, the reasons for conducting a survey should be clearly defined. Coverage surveys should not distract from the essential activity of health programs—administration of vaccines or deworming drugs to reach coverage goals.
Steps in conducting a coverage survey
PlanningStep 1
Data collection and organizationStep 2
Data analysisStep 3
Dissemination of resultsStep 4
Decision-makingStep 5
Objectives: What and who?Who will conduct the survey?Methodological designSampling frameSample sizeAdaptation of the instrumentsFormation of the teamsProgramming of the activitiesResources and logisticsCoordination and informationTraining of the teamsPilot test
Collection, systematization, and processingQuality control of the data
Tabulation and critical review of the dataCalculation of IndicatorsInterpretation of the results
Report preparationDiscussion of the results
Definition of strategiesPlan of action

16
Step 1: Planning
Upon beginning to plan a survey, the country should clearly define the evaluation’s objectives and the intended use of results. This helps to determine the most appropriate methodology and statistical design, mobilize resources, obtain the help of technical professionals, and make the necessary logistical arrangements to ensure the survey’s success.
1.1. Objectives: What and who? The first step in a conducting a survey is defining the study population, objectives, expected outcomes, and uses of the information. To guide this process, the study team should discuss the following questions:
� Why did the country decide to evaluate vaccination and/or deworming coverage level among the target populations? � Are the target populations preschool children and/or school-age children? � If vaccination coverage is analyzed, what vaccines are of interest? � Have deworming activities been conducted in the survey area? � If so, is information available on the deworming coverage of the target populations? What coverage was achieved? � Is the country interested in evaluating the coverage of other interventions such as birth registration, monitoring of child growth
and development, or malaria prevention? � What is the expected outcome of the survey? Which lots or areas have met the coverage goal (using lot quality assurance
assessment)? What estimated coverage was found (using cluster surveys)? After answering these questions, the study team can complete Table 1.
PlanningStep 1
Objectives: What and who?Who will conduct the survey?Methodological designSampling frameSample sizeAdaptation of the instrumentsFormation of the teamsProgramming of the activitiesResources and logisticsCoordination and informationTraining of the teamsPilot test

17
Study Population
Preschool children(aged 1-4 years)
School-age children(aged 5-14 years)
Both populations
Interventions to be assessed
Vaccination DewormingOther (indicate)_____________
Expected results Identification of the lots that have (or have not) met coverage goals
Estimate of average coverage of areas under evaluation
Both results
1.2. Who should conduct the survey?It is essential to decide who is responsible for each part of the survey, from development of the protocol to fulfillment of ethical and methodological requirements.
A working group should be formed to lead the development of the survey, and it is recommended that one professional with expertise and experience in conducting surveys be in charge of ensuring the quality of data collection; accurately reporting information; observing confidentiality and showing respect for participants: monitoring data quality during data entry, tabulation, and analysis; preparing the report; and disseminating the results. Planning each phase of the survey helps to guarantee that it will be correctly implemented and produce useful results.
1.3. Methodological designAfter defining the population and objectives, the team should establish the study’s methodology and statistical analysis, taking into account logistics and feasibility. Table 2 compares the two methodological designs most frequently used in coverage analysis.
Table 1. Target populations and interventions subject to coverage surveys

18
Sampling Method
Characteristic Cluster Lot Quality Assurance
Sampling design
Establishes clusters or groups of units persumed to be internally heterogenous and homogeneous with respect to one another. once the clusters have been randomly selected, the required number of units is randomly selected from each cluster, according to the sample size.
Lots or areas are selected for internal homogeneity and heterogeneity with respect to one another based on sociodemographic factors, access to health services, and organization of the services. The necessary number of units is randomly selected from each lot, according to the sample size.
Data entry, processing, and analysis
Requires the design of a database and specialized statistical packages to generate and analyze reports.
Analyzes data through Excel®-type program to calculate results for each lot.
Duration and complexity
Requires a long period of preparation to draft the protocol, define the operational plan and calculate costs, in addition to time spent on filedwork and analyses that may take several months.
Requires planning but data can be collected and analyzed in 1-2 days, meaning that decisions can be quickly made based on the results for each lot.
Use of the data in decision-making
Estimates coverage of interventions at the confidence levels and representativeness established in the sampling design. Information on several variables is usually collected, making it possible to analyze coverage-related factors. Results are used to make strategic decisions about public health interventons in different administrative areas.
Results make it possible to determine whether an area or lot has met the coverage goal (based on a standard criterion in the sampling design). Results provide local teams with the information necessary to implement interventions in their area of activity, thereby ensuring that adequate coverage is achieved.
Table 2. Characteristics of cluster and lot quality assurance sampling

19
1.4. Sampling frameIn selecting the target population, the study team needs specific information to determine the sampling frame—i.e., the universe of study (population or geographic area) containing all characteristics of the population to be surveyed. Such information is especially important if the survey will estimate the coverage of the area of interest rather than simply accepting or rejecting each lot. Required variables include:
� The official population census, by age groups, for the year under evaluation. Data should be stratified by the smallest possible subdivision (municipality, district, community, numbered area, etc.).
� A list of urban and rural communities, with the population of each. � Similar to the drawing in Figure 2, maps and up-to-date sketches of the localities under evaluation, showing each area divided
into communities or neighborhoods. Some health facilities have situation rooms with this information. Otherwise, the national statistics institute may have the data, although the evaluation team will need to verify that the records are up to date. If not, fieldwork to collect current information must be done.
� Data on the sociodemographic characteristics of people in these communities. It helps to know the number of people living in each household, their immigration status, employment, income level, etc.
Figure 2. Plan for dividing a municipality into areas
Area BArea C
Area D
Area E
Area A
Area F
Area G

20
1.5. Sample sizeTo make the initial sample size estimate, the study team must establish two values:
� The margin of error acceptable for each lot and the overall sample. In effect, this figure represents the risk of classifying a lot as having acceptable coverage when it is actually unacceptable or, conversely, of classifying a lot as unacceptable when it is acceptable. The smaller the acceptable margin of error for the estimated coverage, the larger the sample size must be.
� The confidence level for the expected value. Generally, the confidence level is 95%--i.e., if the test were conducted 100 times, the result would be within the margin of error a total of 95 times.
The higher the coverage goal, the more exact the level of precision must be. As vaccination coverage goals are ≥95%, the level of precision should be ≥5%. If a ±5% level of precision is used, results should be 5% above or below the actual coverage of the population. If the country wishes to determine subnational coverage (or a particular subgroup’s coverage), independent sampling must be done for each department, state, province, or region. To determine national coverage, the calculation must then take the population size of each subnational area surveyed and weight it accordingly. If the coverages of preschool and school-age children are studied separately, the sample must be representative of each age group. After establishing the sample size, the team must define the method for randomly selecting the sampling units. The method chosen depends on the level of detail of the available information. Several possibilities exist: 1. There is a nominal list of each child in the target population with his or her address. 2. Location of the houses where children in the target population live are known. But a list of all the children does not exist.3. A plan exists that shows the location of the blocks or pathways and the houses in the lot, even though it does not
indicate if children live in the houses. 4. Only a diagram or map of the lot is available, and it does not have details on the location of blocks or pathways.
If the information described in 1 and 2 above i.e., either a list of the children and/or a list of the houses where they live is available, the study team may choose sampling points randomly by identifying each child or house. The random sampling method may be simple; the team may assign consecutive numbers to each child or house and then use a random numbers table (Annex 1). Alternatively, the team can use a random starting point to select numbers in a systematic manner. Nowadays, statistical software programs are commonly used for random sampling.
1.6. Adaptation of the instrumentsIn preparing the data collection form, the study team must define the variables to be analyzed. For vaccination, the vaccines and coverages under evaluation should be identified, so that appropriate indicators can be prepared. There should be a clear understanding of the immunization schedule of the children to be surveyed, including any recent changes or added vaccines. It is also necessary to determine if deworming drugs have been given in the study area and if the questionnaires should have questions evaluating variables about the administration of these medicines.
Annex 2 shows a model form used in surveys of integrated interventions. In addition to evaluating coverage, the team must record reasons why children have not been vaccinated or received deworming drugs, among other relevant variables. Annex 3 is a simpler two-part form. The first part is used to gather data on compliance with the immunization schedule or deworming program. The second serves to record the reasons for delays in vaccination or deworming. All forms should have instructions for recording responses.

21
1.7. Formation of the teamsA supervisor should support each team, resolving any issues that arise or situations that occur in the field. Team members responsible for data collection should be properly identified as health officials to reassure the population. The team should include:
� An interviewer. � A health promoter or community leader from the area under evaluation to accompany and guide the team. (Take care to
ensure that this person does not introduce selection biases). � A vaccinator with the supplies to give and record vaccines and deworming drugs to children who have not received these
interventions.
1.8. Programming of the activitiesAfter establishing the protocol’s basic elements, the country should clearly define specific activities, identify the professionals responsible for implementing them, and create a work schedule. There must also be time to obtain the necessary ethical and managerial approvals to conduct the study. The team should review the checklist in Annex 2, Module 3, to confirm the availability of all necessary items, including materials for data collection, maps and information about the area, ID tags for each participant, supplies to administer vaccines and deworming drugs, transportation, food, etc.
1.9. Resources Because the field team must have all supplies needed to collect high-quality data, resources to conduct the survey must be secured in advance. In addition to having the right personnel, it is necessary to determine the number of vehicles needed, including boats and canoes (as well as other means of transportation based on the conditions for accessing the geographic area) and secure fuel, maps, forms, food, water, safety equipment, telephones and communication equipment, etc.
1.10. Coordination and informationBefore starting the study, the team should contact local authorities and community leaders. These officials should become active collaborators and participants in the survey. They will be asked to inform the population in advance about the home visits, facilitate data collection, and help to prevent people from refusing to be interviewed due to fear or misinformation. Potential study participants should receive a message asking them to have their children’s health cards available and be at home during the times scheduled for the survey. In addition, the study team should reassure local authorities and community leaders that they will receive the survey’s results as soon as possible and that their feedback and contributions are valued. These strategies help to involve the population as participants in the action plans that will be implemented based on the study results.
1.11. Training of the teamThe team should be trained in an at least a two-day session held just before the start of data collection; ideally, the training should include activities in the field. The session should cover the concepts, objectives, and methodology of the field study and review the study instruments and procedures, including some practical examples and situations that may occur, with suggestions on how to deal with them. The training should emphasize how to interview the families, obtain consent prior to data collection, and capture, record, and tabulate the data. Ideally, the team should have examples of different health or vaccination cards used in the study area and even some empty vaccine vials (e.g., for rotavirus and OPV). By becoming familiar with these materials, interviewers can obtain better answers from the mother or parent guardian when the health card is not available. Team members should have detailed instructions on where and when they should meet to start the survey, with a reminder to be punctual to complete all tasks by established deadlines. Upon arrival, the supervisor should confirm that the team is complete, well trained, and fully understands its duties and responsibilities.

22
1.12. Pilot testBefore beginning data collection, surveying instruments must be validated in the field to ensure the tools are understandable, practical, and easy to use. A good strategy is for two teams to interview the same participant and compare the data collected. If discrepancies are found, the team should investigate the cause of these differences and make any necessary adjustments before starting the survey. Annex 4 lists the protocol’s essential elements, including the study’s background and objectives; sample design; operational variables; the forms that have been developed; the design of systems for capturing data, building databases, and generating output tables; the plan for analyzing results; and the operational and logistical aspects of the fieldwork.
2.1. Collection, systematization, and processingUpon arriving at a house to conduct an interview, the team should confirm that children in the target population live in the home. Depending on the protocol, one child in the specified age group or all children living in the selected household may be eligible for the study. If no children in the specified age group live in the selected house, the team should proceed to the house located immediately to its right or to another house, depending on the protocol, until finding a child meeting the criteria. This sampling design is called replacement of the sampling unit. If an interview cannot be conducted in the selected lot, the team in charge of the study methodology may replace it with another, as stipulated in the protocol. Before starting the interview, the interviewer should explain the study’s purpose to the participant. Informed consent must be obtained, and the interviewer should provide the participant with an opportunity to raise questions or concerns. A child is considered vaccinated or dewormed if the parent guardian provides proof of receipt of these interventions or, in the absence of proof, if the guardian meets the previously described criteria for verbal verification. For children without information, the team may review the vaccination data in health facilities, providing that these centers have nominal registries. Children missing needed vaccines or deworming drugs should receive these interventions. They should also be asked why they had not received the interventions earlier, and the box corresponding to unvaccinated or non-dewormed should be checked. This information is used to improve programs and to identify missed opportunities for vaccination and deworming.
Finally, the team should record the number of houses with eligible children to calculate a participation rate and better understand possible selection biases.
Step 2: Data Collection
Data collection and organizationStep 2 Collection, systematization, and processingQuality control of the data

23
2.2. Quality control of the dataHigh-quality data are required for sound decision-making, and errors detected after data are tabulated may be difficult to correct. Accordingly, shortly following data collection, supervisors should review the forms while the team is still in the field. If errors or omissions are found, the team should revisit the house to correct the error or obtain the missing information. A supervisor should be assigned to each monitoring team to verify data quality, collect correctly tabulated questionnaires for each lot, and deliver these forms to the study coordinator for consolidation. If the team uses mobile devices (e.g., tablets or portable telephones) for data collection, automatic validation parameters can be used at the time of data collection. This helps to validate data in the field and detect errors shortly after they occur, so that teams can promptly revisit homes to correct the errors.
Step 3: Data Analysis
Data analysisStep 3Tabulation and critical review of the dataCalculation of IndicatorsInterpretation of the results
3.1. Data tabulation and critical reviewOnce the monitoring exercise is done, the team should add up data from the forms, including reasons why children did not receive vaccines or deworming drugs. Validation criteria should be used in tabulating data. Further details on validation can be founded in Module 6, in connection with the analysis of surveys and nominal vaccination registries. As mentioned, mobiles devices are a good option to capture and process data. Mobile devices are particularly helpful if the interview involves gathering information on a large number of variables, which would otherwise make it more challenging to present the data in a single table. The software program used should have automatic validation tools to detect and correct any data problems and should be capable of generating automated reports to facilitate the analysis and presentation of results.
3.2. Calculation of indicatorsThe initial data analysis yields gross figures—i.e., how many children were vaccinated or dewormed, using all children in the survey as the denominator. The crossing of variables is done at this point, per the analysis plan. The team should develop indicators based on absolute numbers, taking into account population weights, as defined in the statistical design. If using LQAS, the team should record which lots did and did not achieve acceptable levels, as well as which lots were accepted and rejected. Module 6 is a model for a comprehensives analysis, the results of which should be presented in the report.

24
3.3. Interpretation of resultsIn addition to interpreting reports generated based on the data analysis, the study team should compare survey results to administrative coverage levels and explain any differences observed.
Step 4: Dissemination of the Results
Dissemination of resultsStep 4 Report preparationDiscussion of the results
4.1. Preparation of the reportInformation to support decision-making must be timely. Therefore, once survey data have been recorded, the team should meet to agree on the report’s content and finalize the tables used to present findings. The following sections, at minimum, are required:
� Executive summary. Include the study’s general objectives, population, methodology, main results, and conclusions. As readers’ time is limited, the summary should be clear and concise. In fact, some readers may only review the executive summary. It is thus essential to include the study’s main findings and provide clear explanations for readers without technical backgrounds. The summary should not simply contain passages copied from the main document; instead, it should recap the study’s principal conclusions and recommendations for decision-makers.
� Introduction. Provide additional details on the study’s background, objectives, and the reasons it was conducted. The introduction should also describe the main sections of the report.
� Objectives. Present the study’s overall objectives and specific goals. � Methodology. Describe in detail the study’s sampling design, variables, data collection techniques, the profile and training
of the study team, the data collection and analytical methods, including any statistical program used. It is important to describe the survey’s scope and methodological limitations, as this information is necessary to interpret results appropriately.
� Results. Describe the following elements: characteristics of the study population; vaccination coverage, including confidence intervals; indicators created based on the data, including dropout rates or status of completion of the series, and frequency of the reasons given for not completing the vaccination or deworming schedule. Module 6 describes methods for analyzing survey data and nominal registries. The results section should include tables and figures, but it is not necessary to provide a description of each of these; this information can be presented in the larger report. Tables with standard errors should also be displayed.
� Conclusions. Conclusions should follow from quantitative findings and a qualitative analysis of the experience. Review the study’s objectives and propose answers to the questions that gave rise to the study. Highlight the study’s advantages and limitations, possible solutions to problems, input for future studies, and, if possible, other statistical parameters such as the design effect.
� Recommendations. Present corrective measures based on the analysis of results. � Annexes. Provide surveying instruments and other useful materials, including diagrams and photographs, and indicate
where databases and data dictionaries are stored in case further analyses will be done.

25
Recommendations for preparing the report � To ensure the text has a consistent style and that deadlines are met, a single person should be responsible for coordinating
the drafting of the report. This professional should have expertise and experience in writing reports. � During discussions with the study team, prepare a list of the points that come up that may not be included in the report but
that might relevant for secondary data analyses. � Completing sections or chapters of the report one at a time can make preparation easier and speed up the editing and
publication process. Table 3 has an example of the parts of sections suggested for a report. � Sharing the report with all stakeholders is as important as preparing it. Make a list of all the institutions and individuals that
should receive the report. � Include maps of the country, photographs of different phases of the survey, questionnaires, and other materials in the
annexes. An outline of the document’s contents is below.
Executive summary
Initial pages (contents, summary of indicators, preface, etc.)
Introduction
Methodology
Results, by topics
Annexes
Sampling design
Participants
Estimated sampling errors
Tables with high-quality data
List of indicators
Survey questionnaires
4.2. Discussion of the resultsThese questions may help to generate discussion on creating an intervention plan.
� Which geographic areas failed to achieve ≥95% vaccination or ≥75% deworming coverage? � Which age group(s) failed to meet the coverage targets—preschool children, school-age children, or both? � What factors might account for coverage delays? � Are there differences in coverage between people vaccinated in the public versus the private sector? � What reasons did participants give for not receiving vaccines or deworming drugs? � Where and how can unvaccinated and/or non-dewormed children be found? At home? In school? Through campaigns? � What measures should be taken? Do some municipalities or specific areas require urgent action?
Table 3. Sections of a report of results of coverage surveys

26
5.1. Definition of strategiesIn addition to analyzing coverage data, the study team should evaluate the reasons that participants provided for delays in receiving the interventions. This analysis, performed as a team, helps to detect and avoid missed opportunities for vaccination and deworming. Coverage figures should be compared to administrative data in order to identify and explain any differences. The study team should develop strategies to improve services and the quality of records and to encourage delivery and maintenance of the child’s health card.
If LQAS is used, the team should design interventions for unacceptable lots. To prioritize, the lots should be ranked from lowest to highest coverage. The team should also discuss all results with the officials in charge of the health programs because these conversations help to improve service.
5.2. Plan of ActionBased on the results, the professionals in charge of the immunization or deworming programs should define strategies to improve the population’s access to these health services. Subjects for consideration include reasons for delayed coverage, health workers’ knowledge of the situation in each area, available resources, and possibilities for mobilizing additional support. Based on this discussion, the study team can prepare a plan of action with specific activities, professionals responsible for implementing them, relevant dates, and the necessary resources.
Step 5: Decision-making
Decision-makingStep 5 Definition of strategiesPlan of action

27
1. Luman ET, Worku A, Berhane Y, Martin R, Cairns L. Comparison of two survey methodologies to assess vaccination coverage. Int J Epidemiol 2007;36:633-41.
2. Milligan P, Njie A, Bennett S. Comparison of two cluster sampling methods for health surveys in developing countries. Int J Epidemiol 2004;33(3):469-476.
3. World Health Organization. Immunization coverage cluster survey: reference manual. Geneva: WHO; 2005. Available from: http://whqlibdoc.who.int/hq/2005/who_ivb_04.23.pdf
4. WHO Vaccination Coverage Cluster Survey Reference Manual, 2015. Available at: http://www.who.int/immunization/monitoring_surveillance/en/
5. Robertson SE, Valadez JJ. Global review of health care surveys using lot quality assurance sampling (LQAS), 1984-2004. Soc Sci Med 2006;63:1648-60.
6. Cotter B, Bremer V, Stroh G, et al. Assessment of neonatal tetanus elimination in an African setting by lot quality assurance cluster sampling (LQA-CS). Epidemiol Infect 2003;130:221-6. Available from: http://www.polioeradication.org/portals/0/document/research/opvdelivery/lqas.pdf
7. World Health Organization. Monitoring immunization services using the lot quality technique. Geneva: WHO; 1996.8. Hoshaw-Woodard S. Description and comparison of the methods of cluster sampling and lot quality assurance sampling to
assess immunization coverage. Geneva: WHO, Department of Vaccines and Biologicals. WHO/IVB/01.26; August 2001.9. World Health Organization. Assessing vaccination coverage levels using clustered lot quality assurance sampling field manual.
Version edited for the Global Polio Eradicaton Initiative (GPEI). April 2012. Available from: http://www.polioeradication.org/Portals/0/Document/Research/OPVDelivery/LQAS.pdf
10. Cainia S, Beckc NM, Yacoubad H, Maigad I, et al. From Agadez to Zinder: estimating coverage of the MenAfriVacTM conjugate vaccine against meningococcal serogroup A in Niger, September 2010-January 2012. Vaccine 2013;31:1597-1603.
11. Tawfik Y, Hoque S, Siddiqi M. Using lot quality assurance sampling to improve immunization coverage in Bangladesh. Bull World Health Organ 2001;79:501-5.
12. Worrell C, Mathieu E. Drug Coverage surveys for neglected tropical diseases: 10 years of field experience. Am J Trop Med Hyg 2012;87(2):216-22.
13. Eisele TP, Rhoda DA, Cutts FT, Keating J, Ren R, et al. Measuring coverage in MNCH: total survey error and the interpretation of intervention coverage estimates from household surveys. PLoS Med 2013;10(5):e1001386. doi: 10.1371/journal.pmed.
14. Cutts FT, Izurieta HS, Rhoda DA. Measuring coverage in MNCH: design, implementation, and interpretation: challenges associated with tracking vaccination coverage using household surveys. PLoS Med. 2013;10(5):e1001404 doi: 10.1371/journal.pmed.1001404.
15. Luman ET, Sablan M, Stokley S, McCauley MM, Shaw KM. Impact of methodological “shortcuts” in conducting public health surveys: results from a vaccination coverage survey. BMC Public Health 2008;8:99.
16. Luman ET, Rymana TK, Sablanb M. Estimating vaccination coverage: validity of household-retained vaccination cards and parental recall. Vaccine 2009;27:2534-9.
17. Bryce J, Arnold F, Blanc A, Hancioglu A, Newby H, et al. (2013) Measuring Coverage in MNCH: new findings, new strategies, and recommendations for action. PLoS Med. 2013;10(5):e1001423. doi: 10.1371/journal.pmed.1001423.
18. World Health Organization. Standards and operational guidance for ethics review of health-related research with human participants. Geneva: WHO; 2011. Available from: http://www.who.int/ethics/research/en/
19. Council for International Organizations of Medical Sciences. International ethical guidelines for epidemiological studies. Geneva: WHO; 2008. Available from: http://www.who.int/ethics/research/en/
20. Committee on Bioethics. Informed consent, parental permission, and assent in pediatric practice. Pediatrics. 1995;95:314.
References

28
RowColumn
0 1 2 3 4 5
01 02946 96520 81881 56247 17623 47441
02 27821 91845 85697 62000 97957 07258
03 45054 58410 92081 97624 26734 68426
04 52067 23123 73700 58730 06111 64486
05 47829 32353 95941 72169 58374 03905
06 06865 95353 76603 99339 40571 41186
07 04981 17531 97372 39558 47526 26522
08 11045 83565 45639 02485 43905 01823
09 70100 85732 19741 92951 98832 38188
10 24090 24519 86819 50200 50889 06493
11 66638 03619 90906 95370 41616 30074
12 23403 03656 77580 87772 86877 57085
13 17930 26194 53836 53692 67125 98175
14 00912 11246 24649 31845 25736 75231
15 83808 98997 71829 99430 79899 34061
16 54308 59358 56462 58166 97302 86828
17 76801 49594 81002 30397 52728 15101
18 72070 33706 62567 08590 61873 63162
19 44873 35302 04511 38088 49723 15275
20 09399 12111 67352 41526 23497 75440
21 42658 70183 89417 57676 35370 14915
22 15669 54945 65080 35569 79392 14937
23 06081 74957 87787 68849 02906 38119
24 72407 71427 58478 99297 43519 62410
25 75153 86376 63852 60557 21211 77299
26 74967 99038 14192 49535 78844 13664
27 98964 64425 33536 15079 32059 11548
28 86364 74406 81496 23996 56872 71401
29 81716 80301 96704 57204 71361 41989
30 92589 69788 43315 50483 02950 09611
31 36341 20326 37489 34626 27510 10769
32 19975 48346 91029 78902 75689 70722
33 88553 83300 98356 76855 18769 52843
34 64204 95212 31320 03783 28798 17814
35 31446 68610 16574 42305 56300 84227
36 88014 27583 78167 25057 93552 74363
37 30951 41367 94491 19238 17639 10959
38 48907 79840 34607 62668 56957 05072
39 53948 07850 42569 82391 20435 79306
40 50915 31924 80621 17495 81618 15125
Annex 1. Use of the random numbers table
Random number table
Annexes

29
How is the random numbers table used? As the name implies, a random number is selected arbitrarily, with each number having the same initial probability of selection. Although computer programs now offer automated procedures for selecting the units in a sample, random number tables are user-friendly and sufficient. The table may be read from any location and in any order: diagonally, downward or upward, or right or left across rows. Follow these steps to select the numbers:
Step 1Assign a number to each unit of the population under study. The numbers are listed sequentially to select the number of units indicated in the sample size. For example, if a lot consists of 97 houses and 20 of them must be visited to obtain the sample, assign a number between 1 and 97 to each house.
Step 2Choose a direction in which to read the numbers (downward or upward, to the right or left, or diagonally).
Step 3Select a starting point in the table. To do so, close your eyes and point with a pencil to an area of the table.
Step 4Select the remaining numbers. As an example, if you decided to read the rows from right to left and if you selected column 2, row 04, as the starting point, the sequence of numbers should start with 73700. Since it is necessary to select numbers with two digits because the population is numbered from 01 to 97, the numbers 73, 70, 05, 87, 30, 06, 11, 16, 44, 86, 47, 82, 93, 23, 53, 95, 94, 17, 21, and 69 would be selected. The field teams would then visits houses corresponding to these numbers for data collection.

30
Name of locality: Block and household:
Name of child: Name of mother/parent guardian:
Name of interviewer: Date of interview: ____/____/____
On arriving at the house, greet the person who answers the door and tell him/her the purpose of the visit:
GOOD MORNING. WE ARE FROM THE MINISTRY OF HEALTH AND ARE CHECKING TO SEE IF CHILDREN AGED BETWEEN ____ AND _____ YEARS IN THIS COMMUNITY HAVE BEEN VACCINATED AND IF THE CHILDREN WHO NEED TREATMENT FOR PARASITES HAVE RECEIVED IT. DOES A CHILD IN THIS AGE GROUP LIVE HERE?
If the answer is “Yes,” continue with the interview. If not, thank the person and leave.
SINCE THERE ARE CHILDREN IN THIS AGE GROUP LIVING HERE, I WOULD LIKE TO TALK WITH YOU AND ASK YOU A FEW QUESTIONS. THE INTERVIEW WILL LAST APPROXIMATELY 10 MINUTES. ALL INFORMATION YOU GIVE US WILL BE KEPT CONFIDENTIAL.
CAN WE BEGIN NOW? Yes. If permission is granted, start the interview.
No. If permission is not granted, fill out the following form and discuss the results with your supervisor.
Result of the Interview
Acceptable house ....................................................................................... 1 House closed ............................................................................................. 2Children in the age group do not live there .................................................. 3Refused to participate ................................................................................ 4Other (specify) ............................................................................................ 5
1. How old was your the child on his/her last birthday?
Age (in years)
2. What is his/her date of birth? Day/Month/Year ___/___/___
3. Where is the child usually vaccinated?Public establishment ................................................................... 1Private establishment ................................................................. 2Other ......................................................................................... 3
Annex 2. Survey for collecting data on the coverage of integrated health interventions, preschool and school-age children

31
VACCINATION
4. Do you have a card showing the vaccines the child has received?(If the answer is “Yes,” ask: MAY I SEE IT PLEASE?)
If the health card is available, copy the dates for each
type of vaccine in the box below.
Enter a ‘9’ if the card indicates that the vaccine was
given but no date is specified.
Yes, seen .................................................................................... 1Go to Question 4
Yes, not seen ............................................................................. 2Go to Question 5
Does not have card .................................................................... 3Go to Question 5
5. VaccineVaccination Date
CodesDay Month Year
BCG/TUBERCULOSIS BCG
POLIO 1 IPV1
POLIO 2 OPV2
POLIO 3 OPV3
POLIO I BOOSTER OPV1B
DIPHTHERIA/WHOOPING COUGH/TETANUS 1
DPT1
DIPHTHERIA/WHOOPING COUGH/TETANUS 2
DPT2
DIPHTHERIA/WHOOPING COUGH/TETANUS 3
DPT3
DIPHTHERIA/WHOOPING COUGH/TETANUS I BOOSTER
DPT1B
DIPHTHERIA/WHOOPING COUGH/TETANUS II BOOSTER
DPT2B
HEPATITIS B HBV1
HEPATITIS B HBV2
HEPATITIS B HBV3
ROTAVIRUS 1 RV1
ROTAVIRUS 2 RV2
PNEUMOCOCCUS 1 PCV1
PNEUMOCOCCUS 2 PCV2
PNEUMOCOCCUS 3 PCV3
MEASLES/RUBELLA/MUMPS 1 MMR1
MEASLES/RUBELLA/MUMPS 2 MMR2
HAEMOPHILUS INFLUENZAE TYPE b Hib1
HAEMOPHILUS INFLUENZAE TYPE b Hib2
HAEMOPHILUS INFLUENZAE TYPE b Hib3
HAEMOPHILUS INFLUENZAE TYPE b Hib4
INFLUENZA Flu1
INFLUENZA Flu2

32
6. In addition to the vaccines on this card, has the child received any others? For example, vaccines given during immunization days or campaigns? If the answer is “yes,” proceed with the following
questions to determine which vaccine(s) were received.
Yes ............................................................................................. 1Go to Question 7
No ............................................................................................. 2Go to Question 19
7. Did the child ever receive the BCG vaccine against tuberculosis? This is an injection in the arm or shoulder that usually leaves a scar.
Yes ............................................................................................. 1No ............................................................................................. 2Doesn't know ............................................................................. 8
8. Did the child ever receive the oral polio vaccine? This is a vaccine given in drops to protect the child against poliomyelitis.
Yes ............................................................................................. 1No ............................................................................................. 2Doesn't know ............................................................................. 8
9. How many times did the child receive the polio vaccine?
Record the number of times
10. Did the child ever receive injections in the thigh to prevent tetanus, whooping cough, and diphtheria (DTP)? Point out that the DTP vaccine is
sometimes given with the polio vaccine.
Yes ............................................................................................. 1No ............................................................................................. 2Doesn't know ............................................................................. 8
11. How many times was the DTP vaccine given? Record the number of times
12. Did the child ever receive an injection against hepatitis B? This injection is usually is given in the thigh. Point out that the hepatitis B vaccine is
sometimes given with polio and DPT vaccines.
Yes ............................................................................................. 1No ............................................................................................. 2Doesn't know ............................................................................. 8
13. Was the first hepatitis B vaccine given within 24 hours after birth, or later?
Within the first 24 hours ............................................................ 1After the first 24 hours .............................................................. 2
14. How many times did the child receive hepatitis B vaccine?
Record the number of times
15. Did the child ever receive injections to prevent measles or rubella (MMR)? Point out
that this injection is given in the arm, almost always
starting at age 1 year.
Yes ............................................................................................. 1No ............................................................................................. 2Doesn't know ............................................................................. 8
16. How many times did the child receive the measles vaccine (or MMR)?
Record the number of times
17. Have you ever received the meningitis vaccine?
Yes ............................................................................................. 1No ............................................................................................. 2Doesn't know ............................................................................. 8
18. How many times did you receive the meningitis vaccine?
Record the number of times

33
19. If the child has not received the complete vaccination schedules, what is the main reason for the delay?
1. Did not know these vaccines were required.2. Did not know where to take child to be vaccinated.3. Did not have time4. Refuses to vaccinate the child 5. Child was sick 6. Child had a contraindication7. Health workers refused to vaccinate child 8. Child was taken to health unit but it was closed 9. Child was taken to health unit but the vaccine was unavailable 10. Other (specify)_________________
INTESTINAL PARASITES
20. In the last year, did the child receive treatment to eliminate worms or intestinal parasites? Show the common types of tablets used for
deworming drug.
Yes ............................................................................................. 1Go to Question 20
No ............................................................................................. 2Go to Question 21
Doesn't know ............................................................................. 8Go to Question 22
21. When was the child last treated for worms?Record the date. If the respondent does not exactly remember it, ask how many months.
22. Why wasn’t the child treated for worms last year?
1. Did not know that treatment was necessary2. Did not know where to get treatment3. Did not have time 4. Refuses treatment 5. Child was sick 6. Child had a contraindication 7. Health workers refused to give the treatment8. Child was taken to the health unit but it was closed9. Child was taken to the health unit but the treatment was unavailable10. Other (specify)_________________
CAMPAIGNS
23. Has the child participated in any of the following campaigns, national immunization, or healthy child days? In referring to the campaigns, verify the date and type
of health campaign (vaccination, deworming, etc.) that
was conducted.
Campaign A (Date _________, Type__________ )
Campaign B (Date _________, Type__________ )
Campaign C (Date _________, Type__________ )
Yes ............................................................................................. 1No ............................................................................................. 2Doesn't know ............................................................................. 8
Campaign A ..........................................................................1 2 8
Campaign B ..........................................................................1 2 8
Campaign C ..........................................................................1 2 8

34
ORAL REHYDRATION
24. Has the child had diarrhea in the last two weeks? If the answer is “no” and the child lives in a malaria-
endemic area, go to question 27. Otherwise, end the
interview and thank the person for his/her time.
Yes ............................................................................................. 1No ............................................................................................. 2Doesn't know ............................................................................. 8
25. During the diarrhea episode, was the child given any of the following?
An envelope of oral rehydration salts? Anti-diarrheal liquid in a bottle? Home-made fluids such as rice water?
Yes ............................................................................................. 1No ............................................................................................. 2Doesn't know ............................................................................. 8
Oral rehydration salts .............................................................1 2 8
Anti-diarrheal liquid in bottle ...................................................1 2 8
Home-made liquids ...............................................................1 2 8
MALARIA
26. Has the child sick had fever and chills at any time in the last two weeks?
Yes ............................................................................................. 1No ............................................................................................. 2Doesn't know ............................................................................. 8
27. At any time during this illness, were blood samples taken from the child’s finger or heel to diagnose malaria?
Yes ............................................................................................. 1No ............................................................................................. 2Doesn't know ............................................................................. 8
28. Was the child given a drug for fever or malaria in the health unit? If the answer is “Yes,” go to question 30. Otherwise, go
to Question 31.
Yes ............................................................................................. 1No ............................................................................................. 2Doesn't know ............................................................................. 8
29. What was the name of the drug given to the child?
Write the name of the drug if available.
_______________________________ (Name of drug)
AntimalarialsChloroquine ................................................................................ 1
Primaquine ................................................................................. 2
Antibiotic Analgesics and Antipyretics ......................................... 3Acetaminophen ........................................................................... 4
Aspirin ........................................................................................ 5
Ibuprofen/Motrin .......................................................................... 6
Other (specify) ............................................................................ 7
Doesn’t know .............................................................................. 8
30. Do you have a mosquito net at home that is used when the child sleeps? End the interview and thank the person for his/her time.
Yes ............................................................................................. 1No ............................................................................................. 2
After the interview, if the interviewer or supervisor has additional comments or other information that is important to mention, please write them below.

35
Department/State: Municipality/District: Locality:
Part One: Vaccination and Deworming schedule
1. Lot No.
4. N
ame
of c
hild
16. Total children who ARE vaccinated or dewormed
17. Total children NOT vaccinated or deworming
(Copy these figures in the
last column of Part Two)
2. Date ___/___/______
3. Age range (years) From_____ to _____
No. of children in the lot 1 2 3 4 5 6 7 8 9 10
5. Age of the childDOB
Age (yrs)
6. Has card Yes or No Card Verbal Registry Total
7. BCG
Date
Yes or No
Source (C, V, R)
8. DPT1
Date
Yes or No
Source (C, V, R)
DPT2
Date
Yes or No
Source (C, V, R)
DPT3
Date
Yes or No
Source (C, V, R)
9. IPV1
Date
Yes or No
Source (C, V, R)
OPV2
Date
Yes or No
Source (C, V, R)
Annex 3. Form for recording data on vaccination and deworming coverage based on lot quality assurance sampling

36
OPV3
Date
Yes or No
Source (C, V, R)
10. Hep. B1
Date
Yes or No
Source (C, V, R)
Hep. B2
Date
Yes or No
Source (C, V, R)
Hep. B3
Date
Yes or No
Source (C, V, R)
12. MMR1
Date
Yes or No
Source (C, V, R)
MMR2
Date
Yes or No
Source (C, V, R)
13. Vaccination series for child’s age is: (if series is incomplete, go to Part Two)
Complete
Incomplete
14. Basic series for <1 year old complete Yes or No
15. Was child dewormed in the campaign or during the last 6 months? (If child is not dewormed, go to Part Two)
Yes or No
Responsible adult: Signature:

37
Department/State: Municipality/District: Locality:
Part Two: Reasons for Delay in Vaccination or Deworming
1. Lot No.
5. N
ame
of c
hild
17. Total children NOT vaccinated or dewormed (Verify that the number agrees with the total in Part One)
2. Date ___/___/______
3. Age range (years) From____ to ____
4. No. of children in the lot 1 2 3 4 5 6 7 8 9 10
13. Vaccination series for child’s age is: Incomplete
18. Reasons why series is not up to date (Ask only about children whose series is incomplete)
a. Did not know these vaccines are required
b. Did not know where to take child to get the vaccination
c. Did not have time
d. Refuses to vaccinate the child
e. Child was sick
f. Child has some contraindications (Verify that it was contraindicated by trained staff)
g. Health workers refused to vaccinate child
h. Child was taken to health unit but it was closed
i. Child was taken to health unit but they did not have the vaccine
j. Other (Specify) ______________________
15. Was child dewormed in the campaign or during the last 6 months?
No
Annex 3. Part Two of the Form

38
19. Reasons why child did not receive antiparasitic treatment during the last 6 months (Ask only about children who were not dewormed)
a. Did not know that treatment was necessary
b. Did not know where to get treatment
c. Did not have time
d. Refuses treatment
e. Child was sick
f. Child has some contraindications (Verify that it was contraindicated by trained staff)
g. Health workers refused to give the treatment
h. Child was taken to health unit but it was closed
i. Child was taken to health unit but they did not have the treatment
j. Other (Specify) _______________________
Responsible adult: Signature:

39
The research protocol is a document that formalizes plans for the study and guides survey implementation. The protocol contains a clear and very detailed work plan that should:
� Establish the research plan clearly and precisely, such that anyone could repeat the study and obtain similar results or assess the validity and reliability of the steps involved. The plan should also specify the roles and responsibilities of team members, including keeps the database in case additional analyzes, such as those proposed in Module 6, are needed.
� Be written in simple language easily understood by evaluators, researchers, and the technical personnel who will use it. The protocol should be organized so that the relationship between the study’s phases is clear and the overall document is coherent.
The basic contents of the protocol are:
1. Title2. Information on researchers and participating institutions3. Summary4. Problem statement5. Theoretical or conceptual framework6. General and specific objectives7. Methodological design
a. Type of researchb. Sampling designc. Operationalization of variablesd. Data collection techniquese. Data analysis strategy
8. References9. Schedule of work10. Resources
Annex 4. Protocol for coverage surveys on integrated interventions

Tools for monitoring the coverage of integrated public health interventionsVaccination and dewormingof soil-transmitted helminthiasis
Analysis of Data from Surveys and Nominal Registries
Module 6

Tools for monitoring the coverage of integrated public health interventionsVaccination and dewormingof soil-transmitted helminthiasis
Module 6Analysis of Data from Surveys and Nominal Registries

4
Tables and figuresIntroduction
Unit 1. Analysis of data from surveys and electronic immunization registries
Step 1: Definition of the analysis plan1.1. What is being analyzed?
1.1.1. Coverage1.1.2. Immunization service quality1.1.3. Factors related to coverage and quality
1.2. Which data sources will be used?1.2.1. Administrative data1.2.2. Surveys1.2.3. Electronic Immunization Registries
1.3. How will data quality be monitored?1.3.1. Random error1.3.2. Systematic error (bias)1.3.3. Confounding factors
1.4. How should the data be analyzed?1.4.1. Descriptive analysis1.4.2. Multivariate analysis1.4.3. Data modeling
Step 2: Verification of data quality2.1. Missing data or registries2.2. Validation of the data ranges and data consistency2.3. Verification of dates2.4. Verification of the sequence of doses
Step 3: Data analysis3.1. Sociodemographic variables3.2. Coverage in doses administered
68
9
1011131313131314151717171819191919
2021212124
272729
Table ofContents

5
3.3. Coverage in valid doses3.4. Dropout rate3.5. Timeliness
3.5.1. Timeliness3.5.2. Average age at vaccination3.5.3. Median age and interquartile range of vaccination3.5.4. Inverted Kaplan-Meier curve
3.6. Simultaneity3.7. Series completed 3.7.1. Number of visits needed to complete the vaccination schedule
Step 4: Additional analyses4.1. Logistic regression4.2. Cox proportional hazards model4.3. Poisson regression
References
33394242464648525658
60616161
86

6
Childhood vaccination schedule, country A, 2011Administrative data coverage and survey results, country A, 2011Estimated vaccination coverage based on administrative data and vaccination registries, Curitiba, Brazil, 2002Detection of non-sensical dates: Vaccines administered prior to the child’s birthday Detection of non-sensical dates: Administration dates after the date of the surveyVerification of the sequence of vaccine doses. Part 1Verification of the sequence of vaccine doses. Part 2Verification of the sequence of vaccine doses. Part 3Population surveyed, by sociodemographic variables, country A, 2013Number of children vaccinated, by sociodemographic variables, country A, 2013Number of children aged 12-23 months vaccinated within the first year of life, by data source, country A, 2013Numerators and denominators for calculating coverage, by data sourceVaccination coverage and confidence intervals (95%) for vaccines in the basic series, country A, 2013Definition of valid doses for vaccines given during the first year of lifeDefinition of valid vaccination booster doses in the vaccination seriesDefinition of valid vaccination doses for school admission seriesDefinition of valid vaccination for annual influenza vaccine Numerators and denominators for calculating coverage of valid doses, by data sourceVaccine doses administered and valid doses, children aged 12-35 months, country A, 2011Vaccine doses administered and valid doses of rotavirus vaccine, children born in 2010, country A, 2011Vaccine doses administered and valid booster doses, children aged 18-35 months, country A, 2011Numerators and denominators to calculate the dropout rate between the first and third doses of pentavalent vaccine, by data sourceNumerators and denominators to calculate the dropout rate between the third dose of pentavalent vaccine and MMR vaccine, by data sourceDefinition of valid doses according to the vaccination schedule, by recommended age of administration of the vaccine series for the first year of lifeDefinition of valid doses according to the vaccination schedule, by recommended age of administration of the vaccine series in the second year of lifeDefinition of valid doses according to the vaccination schedule, recommended age of administration of the school admission series
Table 01. Table 02.Table 03.
Table 04. Table 05. Table 06. Table 07.Table 08. Table 09. Table 10. Table 11.
Table 12.Table 13.Table 14.Table 15. Table 16. Table 17.Table 18. Table 19. Table 20.Table 21. Table 22.
Table 23.
Table 24.
Table 25.
Table 26.
6
Tablesand Figures

7
Definition of valid doses of the influenza vaccine, by recommended age of administration Calculation of timely vaccination coverageCalculation of average age at vaccinationCalculation of the median age at vaccination and the interquartile rangeConstruction of the inverted Kaplan-Meier curveCalculation of simultaneous administration of vaccines recommended at the same age, Method 1Calculation of simultaneous administration of vaccines recommended at the same age. Method 2Calculation of simultaneous administration of all vaccines recommended at the same age, Option 1Calculation of simultaneous administration of all vaccines recommended at the same age. Option 2Calculation of children with complete immunization according to the national scheduleCalculation of children with complete immunization by age, according to the national scheduleCalculation of number of visits needed to update a child’s vaccination schedule
Relationship between variables and confounding factorsPercentage (%) of children aged 24-35 months who received MMR1 vaccine, by household income quintile, country A, 2013Probability of having received the second dose of pentavalent vaccine, by birth cohort in the coverage survey, country A, 2011Probability (95% CI) of having received the second dose of pentavalent vaccine, by birth cohort in the coverage survey, country A, 2011Probability (%) of having received all vaccines beginning at age 6 months, by birth cohort, country A, 2011
Table 27. Table 28. Table 29. Table 30.Table 31. Table 32. Table 33.Table 34. Table 35. Table 36.Table 37. Table 38.
Figure 01. Figure 02.
Figure 03.
Figure 04.
Figure 05.
7
Annexes
Weighted samplesDesign effectIntracluster correlationSteps for creating inverted Kaplan-Meier curves using the R statistical programSteps for analyzing vaccination coverage surveys using SAS statistical software
Annex 01.Annex 02. Annex 03.Annex 04. Annex 05.

8
After deciding to conduct a coverage survey, countries must follow a series of steps to ensure that results will be accurate and precise. For information on ethical and methodological aspects of coverage surveys, please see Module 5.
The present module describes specific concepts and tools that are used to analyze data from vaccination surveys and electronic immunization registries (EIR), including elements related to the data analysis plan and strategy, the steps for validating data quality, the application of a descriptive analysis and data modeling tools, and the correct interpretation of results.
Introduction
Steps for Conducting a Coverage Survey
PlanningStep 1
Collection of DataStep 2
Analysis of DataStep 3
Dissemination of the ResultsStep 4
Decision-makingStep 5

9
This unit reviews tools for different types of analysis of vaccination data from household survey databases and electronic immunization registries. The following diagram outlines the steps of these analyses, which will be described in detail below.
Unit 1.Analysis of Data from Surveys and Electronic Immunization Registries
The process of analyzing data from immunization surveys and electronic immunization registries begins by designing the protocol, defining the variables needed to create indicators, and establishing the steps necessary to collect, record, and manage data properly. The analysis’s success depends on high data quality, the proper application and correct interpretation of descriptive statistical tools, and the use of complex analytic methods, including multivariate analysis and data modeling.
Steps in the Analysis of Data from Surveys and Electronic Immunization Registries
Definition of the Analysis PlanStep 1
Verification of Data QualityStep 2
Data AnalysisStep 3
Additional AnalysesStep 4

10
Step 1: Definition of the analysis plan The first step of data analysis is defining the analysis plan. Plans make it possible to obtain results that are consistent with the survey protocol’s objectives and the indicators used to monitor coverage of the immunization schedule. The evaluation team must define the variables, data, information sources, steps for monitoring data quality, and analysis tools.
� Random Error � Systematic Error (Bias) � Confounding Factors
What is being analyzed?
Which data sources will be used?
How will data quality be monitored?
How should the data be analyzed?
Definition of the Analysis PlanStep 1
� Coverage � Quality of the Immunization Service � Factors Related to Coverage and Quality
� Administrative Data � Surveys � Electronic Immunization Registries
� Descriptive Analysis � Multivariate Analysis � Data Modeling

11
1.1. What is being analyzed?In establishing the data analysis plan, if a survey is used, the team should review the survey protocol, the variables and their categories in the questionnaire, the method for data collection, the analysis’s proposed objectives, and the study’s hypotheses. If a EIR will be evaluated, the team should review the definition of each variable that will be used.
The national immunization schedule is a good starting point for defining the analysis plan, as it is the basis for building indicators that show that program coverage goals for all target populations have been reached.
Table 1 outlines an example vaccination schedule that provides the basis for calculating coverage and quality indicators for the child immunization service in this module.
Age Vaccine Dose
Birth BGC (tuberculosis) 1st dose
2 monthsPolioPentavalentRotavirus
1st dose
4 monthsPolioPentavalentRotavirus
2st dose
6 monthsPolioPentavalent
3rd dose
12 monthsMeasles, mumps, and rubella (MMR)Yellow fever
1st dose
18 monthsPolioDiphtheria, pertussis, tetanus (DPT)
1st booster
4 yearsPolio DPT MMR
2nd booster
2nd dose
6-35 months Influenza Annual
Based on the available evidence, the PAHO Technical Advisory Group (TAG) and the WHO Strategic Advisory Group of Experts on Immunization (SAGE) have made a series of recommendations for vaccination schedules, including the number and order of doses in the series, in order to maximize vaccine effectiveness and minimize the period in which children are vulnerable to vaccine-preventable diseases (VPDs). More information can be obtained from a summary of WHO position papers on childhood vaccination at: http://www.who.int/immunization/policy/immunization_tables/en/. Accordingly, for example, an immunization series according to the child’s age might be:
Table 1. Childhood vaccination schedule, country A, 2011

12
Age <1 year � Tuberculosis: BCG (Bacillus Calmette-Guérin) � Hepatitis B: At birth � Pentavalent (diphtheria, tetanus, pertussis, Haemophilus influenzae type b, and hepatitis B): First, second, and third doses � Polio: First, second, and third doses polio virus vaccine � Pneumococcal (conjugate): First and second doses or first, second and third doses � Rotavirus: First and second, or first, second, and third doses
Age 1-2 years � MMR (measles, mumps, and rubella) or double viral (measles and rubella): First and second doses � Yellow fever � Pneumococcal (conjugate): Third doses � DPT (diphtheria, tetanus, and pertussis): First booster � Polio: First booster
Age 4-6 years � DPT: Second booster � Polio: Second booster � MMR or MR: Second dose
Starting at age 6 months, the influenza vaccine is recommended once a year for children aged <5 years. If the child is aged <9 years and receiving the vaccine for the first time, he or she should receive a second dose of the same vaccine a minimum of 28 days later.
PAHO/TAG has also issued a recommendation on the schedule of pneumococcal conjugate vaccine (PCV) for infants (Box 1)(1).
“Countries should consider three doses of the pneumococcal conjugate vaccine as the minimum for a vaccination schedule. The administration options can be 3 doses (primary series) without a booster or 2 doses (primary series) with a booster for children aged between 12 and 15 months, taking into account the epidemiological profile of the disease in each country...
“Countries should base the decision regarding the option of opting for a 3 dose schedule (primary series) without booster or a 2 dose schedule (primary series) with a booster for children aged between 12 and 15 months, mainly on the burden of the pneumococcal disease of the country and pneumonia mortality in children aged <2 years. If the country has a high burden of disease and a high mortality in children aged <7 months, the country should opt for the 3 dose schedule in the primary series; if the burden of disease and mortality is more important in children aged >7 months, the country could consider using the 2 dose schedule in the primary series with a booster.”
Box 1. Recommendations of the PAHO Technical Advisory Group on Pneumococcal conjugate vaccine, 2011

13
In analyzing the vaccination schedule, the team should know the year(s) of new vaccine introduction and details about any changes in the schedule. If new vaccines were introduced, or if the schedule was modified during the survey period, this information should be incorporated into the analysis. Likewise, campaigns or national health days offered during the study period must be taken into account.
Coverage surveys also provide the opportunity to compile data from other programs on breastfeeding, oral rehydration, and deworming of soil-transmitted helminths,1 etc.
1.1.1. CoverageImmunization programs aim to achieve sufficient coverage to reach the desired level of immunity among the population (herd immunity). Coverage indicators for survey or EIR are thus calculated based on the number of vaccine doses administered and an estimate of the valid vaccine doses administered.
To estimate coverage from surveys, the study team must calculate, average, median, and interquartile ranges. Based on the criteria below, the team should also determine if the minimum acceptable coverage was achieved:
� If coverage is 95-100%, the coverage and immunological protection are adequate. � If coverage is <95%, the immunization’s coverage goal was not was not reached.
1.1.2. Immunization service qualityTo calculate indicators on immunization service quality, the study team can analyze timeliness of administration of each vaccine; completion of the basic series and boosters needed to achieve immunity; missed opportunities to administer vaccines that should have been given simultaneously; availability of the child’s health card or other proof of vaccination; and consistency among different data sources.
1.1.3. Factors related to coverage and qualitySurveys and EIR, depending on the variables collected in the latter, provide opportunities to analyze coverage and service quality indicators in terms of such factors as healthcare access, education, job type, age of the mother, household income, and other aspects of sociodemographic development. Questions on access to vaccination are useful for determining if barriers depend on the population (e.g., refusal to vaccinate, not knowing that vaccination was required, etc.) or problems in the delivery of services (e.g., hours of vaccination or shortages of biologicals).
1.2. Which data sources will be used?1.2.1. Administrative dataAdministrative data are calculated using the vaccine doses administered as the numerator and the estimated population of the target age group as the denominator. The denominator may be the population of a specific area or of the entire country. Administrative data are different than survey and registry data in that they do not contain information on individual children’s age at vaccination or the interval between doses. For this reason, as explained in Module 2, the data making up the numerator may have limitations:
� Underestimation due to incomplete data from the reporting units or failure to consider other sources of vaccination (e.g., private sector or nongovernmental organizations).
� Overestimation due to excess data from the reporting units (e.g., because other target populations or age groups were included). Inaccuracies in the denominator may be due to:
� Displacement of populations between geographic areas. � Limitations in population estimates from censuses projections. � Use of multiple data sources.
1 In these modules, deworming refers to the treatment of soil-transmitted helminths.

14
1.2.2. SurveysThe standard methodology developed by the WHO for assessing immunization coverage is based on a small numbers of individuals. Teams visits home and/or analyze immunization records and registries to calculate coverage. The surveys use a cluster sampling technique to allow extrapolation from a small sample of homes to the larger population. However, the data could only be used aggregate (2,3). While immunization coverage surveys primarily seek to estimate coverage for selected vaccines (for infants and/or women), it is also possible to simultaneously collect other information, which is usually not available through routine monitoring systems (4).
Using surveys, the team may compile vaccination data from: � Health cards or other vaccination certificates kept by the family. These sources also provide information on the card retention
rate and distribution of health cards (5). � Health facility files, from which field teams can collect and record the vaccines administered and the dates of administration. � The memory of parents and guardians, although these are increasingly not accepted as a valid source of vaccination data. If
verbal verification is used as a source of vaccination data, the team may record the vaccines administered but not the exact dates of immunization.
Survey data are weighted—i.e., a value is assigned to each individual’s data based on the child’s probability of selection in the survey. Weighting makes it possible to use the data to describe the entire population rather than only children in the survey.
In presenting coverage indicators based on survey data, the team should remember to include confidence intervals for the estimate. These intervals indicate the uncertainty of the point estimate due to the small number of children used to represent a larger universe. A confidence interval of 95% is customary, but other intervals, such as 90%, can be used.
When administrative or EIR data are used, the team does not need to weight the data or include confidence intervals, since the uncertainty of the data cannot be estimated as these sources cover the whole population. Weighting is used to calculate the point estimates and confidence intervals for the examples from country A in this guide. For further information, please see the Annexes.
Several types of surveys have been used to estimate vaccination coverage, most the notably demographic and health survey (DHS) and the multiple indicator cluster survey (MICS) (https://dhsprogram.com / http://mics.unicef.org/surveys).
Demographic and health surveys can be downloaded for free from the Internet and are a good source of vaccination data (6). Generally, the surveys are done every five years in select countries with sample sizes of 5,000-30,000 households.
DHS data contain extensive information on population indicators, including vaccines administered to participants aged <5 years and other indications of the children’s nutritional and health status. In addition, the surveys have high participation rates (few unanswered questions). Given that the questionnaires only collect data on vaccines recorded on vaccination cards, if the health card retention rate is lower than the population sample being surveyed, inferences on immunization coverage or compliance with the schedule may be limited.
DHS data are representative of the country’s entire population as long as the corresponding weight is applied to each child in the survey. The studies also provide representative estimates for certain subgroups (e.g., rural or urban populations), called survey
domains or study domains. But DHS data cannot be used to calculate measurements of geographic or politico-administrative units any smaller than those at the regional level, since regional units are their smallest domain.

15
DHS data are broken down into multiple files. Vaccination data around found in the file for children. There are two types of databases—hierarchical and rectangular. The database must be rectangular in order to use programs like SAS, STATA, or SPSS.
Information on coding variables for DHS datasets, with recommendations for analysis, can be found in the Recode Manual: http://dhsprogram.com/pubs/pdf/DHSG4/Recode6_DHS_22March2013_DHSG4.pdf (7-8). DHS 6 is the most recent version and provides information on surveys from 2008-2013 (9).
The multiple indicator cluster survey was developed in the mid-1990s to help countries produce internationally comparable statistics. The MICS has groups of indicators for health, education, child protection (including vaccination), and HIV/AIDS in children and women that are were used to monitor fulfillment of the Millennium Development Goals and are now used to monitor the Sustainable Development Goals.
MICS results, including national reports and databases, are available at: http://www.unicef.org/statistics/index_24302.html.
1.2.3. Electronic Immunization registriesIdeally, electronic vaccination records should link each child to individual data on vaccines given and dates of administration. The denominator may come from the official record of live births or be derived from the registry itself by using the entire cohort who received the same vaccine (e.g., BCG administered or an infant registered with reasons for non-application, for example) at birth. Good EIR monitor real-time coverage and send reminders to children’s parents or guardians, and the registries may also be linked to other medical records.
If working well, EIR can improve data quality. But the registries are limited in the quality of variables on the vaccines administered to each child and in the entry of all of an individual child’s data over time. Gaps in registry data can lead to inaccurate inferences and affect the analysis’s validity. The immunization program must ensure, then, that the birth registry is complete and that all changes related to deaths, immigrations, and emigrations have been incorporated into the database.
Each EIR should have a single identification code (e.g., a national identification number) corresponding to the child’s full name and birthdate and data on the mother. These registries facilitate individualized monitoring, including of children with incomplete schedules, and therefore make it possible to obtain coverage data by cohort. They can also be used to aggregate data by geographic strata or management area and to analyze sociodemographic variables, including residence, mother’s educational level, and the place of vaccine administration (i.e., public or private facility).
Table 2 compares coverage estimates derived from surveys and administrative registries.

16
Vaccine
Administrative data
Coverage per survey results (CI 95%)Doses administered (n)
Coverage using target population per census
projection (%)
BCG 113,048 76 93 (92-94)
Polio vaccine, 1st dose 113,986 77 95 (95-96)
Polio vaccine, 2nd dose 113,269 76 94 (93-95)
Polio vaccine, 3rd dose 112,222 75 91 (89-92)
Pentavalent, 1st dose 114,015 77 95 (94-96)
Pentavalent, 2nd dose 113,269 76 94 (93-95)
Pentavalent, 3rd dose 112,222 76 90 (89-91)
Rotavirus, 1st dose 109,299 74 88 (86-91)
Rotavirus, 2nd dose 106,349 72 83 (80-85)
MMR 113,494 77 88 (87-90)
Table 3 refers to a 2011 study by Luhm et al. in which investigators used registry data to evaluate the immunization program in Curitiba, a city in southern Brazil (10). Researchers selected a random sample from the registries, supplementing it with information from a household survey when registry data were incomplete. They then compared results to administrative data. Luhm’s study showed that registries can improve data quality in a properly functioning system. The authors emphasize the importance of ensuring that registry data are complete before using them to analyze the immunization program.
Other recent studies have evaluated the completeness of registries and their concordance with other written documents. In 2014, in Belgium, Braeckman et. al found that the coverage calculated from the registry was lower than estimates obtained from health cards for each vaccine dose, and that physicians frequently recorded different dates than those shown in documents based on the cards (11).
Table 2. Administrative data coverage and survey results, country A, 2011

17
Vaccine
Coverage
Administrative data (%) Registry data (CI 95%)
BCG 98.6 99.9 (99.9-100.0)
DPT + Haemophilus influenzae type b (three doses) 94.3 96.7 (96.0-97.4)
Polio (three doses) 93.3 96.8 (96.1-97.5)
Hepatitis B (three doses) 93.1 97.3 (96.7-97.9) Source: Luhm KR, et al., 2011
In each calculation, all children in the denominator should have the opportunity to be part of the numerator. To be included in the analysis, children in a survey or registry should be of the recommended age for the dose under evaluation. In country A, some children were not aged 18 months at the time of the survey and were ineligible for the MMR second dose and polio booster. Although younger children had received the boosters, the analysis of these doses should be limited to children aged >18 months at the time of the survey.
Another consideration for the analysis is that the vaccine studied must have been available to the children in the registry or participating in the survey. In survey data from country A, some children were ineligible for the rotavirus vaccine because it was not yet part of the routine schedule when these children were at the age recommended for its administration. That said, nearly half the children were born after introduction of the rotavirus vaccine and were eligible to receive it. All rotavirus vaccine analyses are thus limited to these children; likewise, all children in the numerator must be included in the denominator.
1.3. How will data quality be monitored?1.3.1. Random errorA random error is not specific to a particular group—i.e., the same probability exists that any group might experience the error. Examples of random errors in registries are the dates of vaccine administration, since they are not associated with a particular interviewer (a systematic error) or a clinic with problems maintaining registries (also a systematic error). Random errors are taken into account in the 95% confidence intervals.
1.3.2. Systematic error (bias)A systematic error, also called bias, is one that affects different groups differently. If, for example, interviews are conducted only on working days between 9:00 am and 5:00 pm, children with caregivers who work outside the home during this time will be less likely to be included. This is a problem because the characteristics of these children may differ from those whose caregivers remain at home or work at night.
Another systematic error would be limiting the analysis to vaccine doses recorded with dates on the children’s health cards. Since children without cards probably have less access to vaccination services, their delays are greater, and it would be misleading to only include children with cards when making inferences about those who do not have cards.
Table 3. Estimated vaccination coverage based on administrative data and vaccination registries, Curitiba, Brazil, 2002

18
To reduce the possibility of bias in coverage surveys, evaluation teams should try to obtain complete and reliable vaccination data. While the card is the official record carried by the child’s family, when that document is not available, the team should try to obtain data from other sources, such as verbal verification or a review of health facility records.
In 2009, PAHO-TAG identified other sources of bias, including the phrasing of some questions in vaccination surveys, training given to interviewers, data collection processes, and the analysis of results (12). Additional information can be found in the 2009 PAHO-TAG report: http://www2.paho.org/hq/dmdocuments/2010/tag18_2009_Final%20Report_Eng.pdf.
1.3.3. Confounding factorsConfounding factors are variables (Z) affecting both exposure and evaluation criteria due to their association with the exposure and outcome under evaluation (Figure 1). When the study design or data analysis does not correct for confounding factors, they may give rise to inaccurate estimates of the correlation between the exposure and outcome. Fortunately, confounding factors can be measured and quantified.
X Y
Z
Exposure Result
Confounding Variable
Association of Interest
Figure 1. Relationship between variables and confounding factors

19
1.4. How should the data be analyzed?Collected data can be entered into a database but should not be evaluated until an analytical approach—the logical sequence of steps and tools used to generate results—is determined. Descriptive statistics and multivariate analysis are used to this end. Data modeling techniques are also used for more complex analyses.
1.4.1. Descriptive analysisTo establish the strategy for descriptive analysis, it is necessary to understand how the data were collected. In analyzing survey data, for example, the team must understand the sampling design to conduct the study taking into account the design and applying the necessary weights before selecting the most pertinent variables for preparing the frequency distributions and constructing the indicators. The process involves the following phases:
� Identifying and describing the variables to be analyzed, keeping in mind the scope and limitations of the data and sample size (see Annex 1).
� Estimating the standard error for each variable. � Weighting results (see Annex 2). � Taking into account the design effect (see Annex 3). � Building output tables with crossed variables based on the study design, keeping in mind the results needed to meet the
survey’s objectives. � Preparing frequency distributions for sociodemographic variables. � Building indicators to assess the coverage and quality of the vaccination service by time, place, and person. � Calculating the central tendency of coverage indicators—average, median, and interquartile ranges. � Calculating the statistical significance of the frequency of variables in output tables (using chi-squares test or Student’s
t-distribution) to determine if results are due purely to chance.
1.4.2. Multivariate analysisAfter completing the descriptive analysis, the team may undertake more complex analyses using data stratification techniques and multivariate modeling. A stratified analysis is useful to detect confounding factors and to determine the effect of more than one exposure or factor on the results. To this end, the team may calculate measures of association, such as relative risk and odds ratios, to determine the strength of association between an exposure and outcome.
1.4.3. Data modelingThis technique adjusts data using statistical equations and analytical models—e.g., logistic regression, which examines a binary dependent variable as it relates to different independent variables. Since statistical models are complex, computer programs are required. Different models are used to analyze survey data, such as logistical regression and the Cox proportional hazards model when working with life tables (mortality tables), among others.

20
Step 2: Verification of data quality
In analyzing surveys and applying automated systems to examine EIR, the team must verify the quality of data at each step of the process. Computer software programs should be able to check for discrepancies as data are entered, thereby making it possible to correct errors quickly.
During the analysis phase, the team can critically evaluate the data by using tools to verify the trajectory (statistical range), the data’s completeness and consistency, and the dates of vaccination and life events. To assist countries with these analyses, PAHO will soon publish the “Electronic Immunization Registry: Practical Considerations for Planning, Development, Implementation and Evaluation.”
The study team should document the data cleaning process and note any changes made. Information on the percentage of registries with unlikely dates may be useful for a published report, data collection in future surveys, and the documentation of practices in first-line health care facilities.
Missing Registries or DataTrajectory (Range) VerificationLogical (Consistency) VerificationVerification of DatesVerification of Sequence of the Doses
Verification of Data QualityStep 2
Several types of errors exist: � Errors in dates of birth, involuntary or due to inaccuracies in birth registration. � In the document where data are recorded (i.e., the health or vaccination card, health facility files, etc.) due to:
� Misreporting the time of service (e.g., incorrectly entering the date of vaccination). � Inability to access the health or vaccination card in the health establishment. This may occur if vaccines were
administered in multiple establishments and lead to incomplete files and monitoring problems. � Combination vaccines or vaccines registered with the commercial names of the products—i.e., those containing
several antigens, such as pentavalent or MMR vaccine. In this regard, vaccines should be recorded according to their individual components—e.g., the pentavalent vaccine should be listed as DPT plus H. influenzae type b and hepatitis B, all with the same administration date.
� Indecipherable letters or numbers on the health card or in health facility files due to: � Disorganized files. � Illegible handwriting. � Poor storage conditions. � Deterioration of the cards.
� Errors in the transfer of information when: � Data in files are copied onto data collection forms. � Data are entered into an electronic database.

21
2.1. Missing data or registriesTo minimize data errors, the study team must confirm that the number of registries is correct and that no data are duplicated. The use of electronic records removes some sources of error by eliminating several steps in data input, improving communication among health facilities, and avoiding problems related to maintaining hardcopy files.
The importance of checking and completing the information depends on its effect on the analysis. This is particularly relevant for small studies, where missing information on key variables significantly alters results. Conversely, missing data on less important variables is more easily tolerated. Values should never be changed because they “don’t look right.”
2.2. Validation of the data ranges and data consistencyIn monitoring quality, the evaluating team must verify the data’s range and logic. The range shows, for each variable, when values are outside certain limits—i.e., when they are impossible and thus unacceptable (this process will be described in detail for dates and ages of vaccine administration). After detecting the error, the team must determine if it is possible to verify the information source and correct the mistake, and then if the information should be left as entered or removed because it was clearly an error.
The following quality indicators should be calculated as a number and percentage: � Households visited relative to the number of homes in the sampling frame. � People interviewed relative to the total in the sample. � Questionnaires completed (response rate). � Data omitted in questions on vaccination and “I don’t know” responses. � Confirmed vaccine doses on the health card (and of these, data on which there is a mark but not a date). � Vaccine doses verified in the vaccination registries of health centers. � Vaccines doses recorded based on verbal verification.
2.3. Verification of datesSome procedures to correct dates of vaccine administration are described below. Double data entry helps to minimize, though not entirely eliminate, errors in transferring information from hardcopy files to an electronic database system.
Some obvious data input errors (e.g., unlikely dates) can be changed during the correction phrase. If the original source document is available, this information can be compared to the registry or data collection form, or the child’s photograph on the card can be compared to the health facility records. The erroneous data may be then be corrected or deleted.
Following the steps in Tables 4-8, the evaluation team may correct other obvious data input errors by identifying unlikely dates or comparing the dates of vaccines that were scheduled to be given on the same day.

22
Non-sensical dates: Vaccines administered prior to the child’s date of birth.
Steps Examples
1. Look for administration dates prior to each child’s birthday for each vaccine dose. Dates may be acceptable even if the dose is considered invalid.
Acceptable: Date of birth: 29 February 20121st pentavalent dose: 30 April 2012
Unacceptable: Date of birth: 29 February 20121st pentavalent dose: 30 April 2011
2. If possible, check the original source.
The error may have occurred during data capture or entry. As in the previous example, checking the original source may show that the year of administration was incorrectly recorded.
3. When step 2 is not feasible, compare administration dates to those of vaccines scheduled for simultaneous application.
1st pentavalent dose: 30 April 2011Date of birth: 29 February 2012 1st polio dose: 30 April 20122nd pentavalent dose: 25 June 20122nd polio dose: 25 June 2012
In this example, the unlikely year is assumed to be due to a data entry error, given the administration dates of the 1st dose of polio vaccine and the 2nd doses of pentavalent and polio.
4. When unacceptable dates detected in steps 2 or 3 cannot be corrected, eliminate the dates and doses with administration dates prior to the child’s birthday.
1st pentavalent dose: 30 April 2011Date of birth: 29 February 2012 2nd pentavalent dose: 25 June 20122nd polio dose: 25 June 2012
If there are no data indicating a correct administration date, as in the previous example, the 1st pentavalent dose should be recoded as “not administered” but without an administration date.
5. Verify that all changes have been correctly made.
If the year of administration has changed, confirm that the date of the 1st pentavalent dose is now recoded as 30 April 2012.
Table 4. Detection of non-sensical dates: Vaccines administered prior to the child’s date of birth

23
Non-sensical dates: Administration dates after the date of the survey.
Steps Examples
1. Look for administration dates after the date of the survey for each child and vaccine dose. Dates may be acceptable even if the dose is considered invalid.
Acceptable: 2nd polio dose: 30 December 2010Date of survey: 1 December 2012
Not acceptable: 2nd polio dose: 30 December 2012Date of survey: 1 December 2012
2. If possible, check the original source.
The error may have occurred during data collection or entry. As in the previous example, checking the original source may show that the year of administration was incorrectly recorded.
3. When step 2 is not feasible, compare administration dates to those of vaccines scheduled for simultaneous application.
1st polio dose: 1 April 20102nd pentavalent dose: 30 December 20103rd polio dose: 15 February 2011Date of the survey: 1 December 20122nd polio dose: 30 December 2012
In this example, the unlikely year is assumed to be due to a data entry error, given the administration dates of the 1st and 3rd doses of polio vaccine and the 2nd pentavalent dose.
4. When unacceptable dates detected in steps 2 or 3 cannot be corrected, eliminate the dates and doses with administration dates prior to the date of the survey.
1st dose of polio: 1 April 2010Date of the survey: 1 December 20122nd dose of polio: 30 December 20122nd dose of pentavalent: 30 December 20123rd dose of polio: 15 February 2013
If there are no data indicating a correct administration date, as in the previous example, all vaccine doses with unacceptable dates should be recoded as “not administered” but without a date of administration.
5. Verify that all changes have been correctly made.
If the year of application has changed, confirm that the administration date of the 2nd dose of polio vaccine is now recoded as 15 December 2010.
Table 5. Detection of non-sensical dates: Administration dates after the date of the survey

24
2.4. Verification of the sequence of doses
First: Ensure that multiple doses of the same vaccine do not have the same administration date.
Steps Examples
1. Look for matching administration dates for two or more doses of the same vaccine for each child and vaccine. Dates may be acceptable even if the dose is considered invalid.
Acceptable:1st polio dose: 29 July 20092nd polio dose: 22 August 20093rd polio dose: 29 October 2009
Unacceptable: 1st polio dose: 29 July 20092nd polio dose: 29 July 20093rd polio dose: 29 October 2009
2. If possible, check the original source.
The error may have occurred during data collection or entry. As in the previous example, checking the original source may show that the date of administration was incorrectly recorded.
3. When step 2 is not feasible, compare administration dates against those of vaccines scheduled for simultaneous application.
1st polio dose: 29 July 20092nd polio dose: 29 July 20093rd polio dose: 29 October 2009
1st pentavalent dose: 22 August 20092nd pentavalent dose: 22 August 20093rd pentavalent dose: 29 October 2009
1st rotavirus dose: 29 July 20092nd rotavirus dose: 22 August 2009
In this example, the unlikely year is assumed to result from a data entry error and that the 1st doses of pentavalent and polio vaccine were administered on 29 July 2009 and that the second doses of these vaccines were administered on 22 August 2009.
4. When unacceptable dates detected in steps 2 or 3 cannot be corrected, eliminate the dates and doses with administration dates that cannot be validated.
1st polio dose: 29 July 20092nd polio dose: 29 July 20093rd polio dose: 22 August 2009
1st pentavalent dose: 29 July 20092nd pentavalent dose: 22 August 20093rd pentavalent dose: 29 October 2009
If there are no data indicating a correct administration date, as in the previous example, the 2nd polio dose should be recoded as 22 August (to match the 2nd pentavalent dose) and the 3rd polio dose should be recoded as “not administered.”
5. Verify that all changes have been correctly made.
If the year of application has changed, confirm that the administration date of the polio and pentavalent vaccines is now 29 July 2009 and that the date of the 2nd dose of these vaccines is 22 August 2009.
Table 6. Verification of the sequence of vaccine doses. Part 1

25
Second: Verify that the order and administration dates of all doses correspond to sequential doses of the same vaccine.
Steps Examples
1. Look for administration dates that are out of order for each child and vaccine. Dates may be acceptable even if the dose is considered invalid.
Acceptable: 1st pentavalent: 10 February 20122nd pentavalent: 22 February 20123rd pentavalent: 26 May 2012
Unacceptable: 1st pentavalent: 10 February 20122nd pentavalent: 26 May 20123rd pentavalent: 22 February 2012
2. If possible, check the original source.
The error may have occurred during data collection or entry. As in the previous example, checking the original source may show that the date of administration was incorrectly recorded.
3. When step 2 is not feasible, compare the administration dates to those of vaccines scheduled for simultaneous application.
1st pentavalent: 10 February 20122nd pentavalent: 26 May 20123rd pentavalent: 22 February 2012
1st polio: 10 February 20122nd polio: 22 February 20123rd polio: 26 May 2012
In this example, a data input entry liked occurred and the dates of the 2nd and 3rd doses of pentavalent vaccine were accidentally entered in reverse order.
4. Verify that all the changes have been made correctly.
If the year of application is changed, confirm that the 2nd pentavalent dose is now recoded as 22 February 2012 and the 3rd dose of pentavalent is 26 May 2012.
Table 7. Verification of the sequence of vaccine doses. Part 2

26
Third: Confirm that the previous doses were not missing when the last doses were administered.
Steps Examples
1. Look for any child who has not had the previous doses of a vaccine but who has received subsequent doses of the same vaccine.
Acceptable: 1st polio dose: 29 July 20092nd polio dose: 22 August 20093rd polio dose: 29 October 2009
Unacceptable: 1st polio dose: 29 July 20092nd polio dose: skipped3rd polio dose: 29 October 2009
2. If possible, check the original source.
The error may have occurred during the data collection or entry. As in the previous example, checking the original source may reveal the date of administration was incorrectly recorded.
3. In this case, the doses scheduled for simultaneous administration cannot be compared.
1st polio dose: 29 July 20092nd polio dose: skipped3rd polio dose: 29 October 2009
1st pentavalent dose: 29 July 20092nd pentavalent dose: 22 August 20093rd pentavalent dose: 29 October 2009
The fact that the 2nd pentavalent dose has been given does not mean that the 2nd dose of polio has been given.
4. Recode the original data so that the later doses take the place of the skipped doses, keeping the actual administration date, and recode the subsequent doses as “not administered” without administration dates.
Original data: 1st polio dose: 29 July 20092nd polio dose: skipped3rd polio dose: 29 October 2009
Recoded version: 1st polio dose: 29 July 20092nd polio dose: 29 October 20093rd polio dose: not administered
The 2nd dose of polio vaccine has been recoded to show the information from the 3rd dose, and the 3rd polio dose is recoded as “not administered” without an administration date.
5. Verify that all changes have been correctly made.
If these changes are made, confirm that the administration date of the 2nd dose of polio is now 29 October 2009 and that the date of the 3rd dose now shows as “not administered.”
Table 8. Verification of the sequence of vaccine doses. Part 3

27
Before calculating indicators and applying multivariate analysis or data modeling, the study team should generate output tables of key variables to characterize the study population and obtain frequency distributions of the data for use in constructing indicators. Methods for data analysis are reviewed below.
Step 3: Data analysis
Analysis of the DataStep 3
Sociodemographic Variables Coverage in Doses Administered Coverage in Valid Doses Dropout Rate Timeliness
Simultaneity Series Completed Number of Visits Needed to Complete the Vaccination Schedule
� Timeliness � Average Age at Vaccination � Median Age at Vaccination
and Interquartile Range � Inverted Kaplan-Meier Curve
3.1. Sociodeographic variablesThe first step in creating the reports is to characterize the study population using tables that show the absolute and relative distribution of study subjects by sex, age, place of residence, and other sociodemographic variables (Table 9).

28
Table 9. Population surveyed, by sociodemographic variables, country A, 2013
Variable Characteristic Number Percentage
Sex Male
Female
Residence Urban
Rural
Mother’s age1 (years) <20
20-29
30-39
≥40
Mother's education None
Primary
Secondary
University
Wealth quintile2 1st quintile
2nd quintile
3rd quintile
4th quintile
5th quintile
Other
1 Generally, in coverage surveys, only the mother’s age is used because it will almost always be available. However, the team can modify the variable to mother or caregiver.2 The variable “wealth quintile” should be defined in each survey. In a registry, the quintile will not likely exist but an approximation can be used.
Coverage surveys and EIR make it possible to create indicators that not only estimate coverage by geographic area but also show differences in coverage by different sociodemographic variables (Table 10).

29
Table 10. Number of children vaccinated, by sociodemographic variables, country A, 2013
Variable Characteristic BCGPentavalent Polio
Other1 2 3 1 2 3
Sex Male
Female
Residence Urban
Rural
Mother’s age1 (years) <20
20-29
30-39
≥40
Mother's education None
Primary
Secondary
University
Wealth quintile2 1st quintile
2nd quintile
3rd quintile
4th quintile
5th quintile
Other
3.2. Coverage in doses administeredRegardless of the type or source of data, the basic formula to calculate coverage is:
Doses administeredBasic Coverage Formula
Target populationX 100

30
Before calculating and interpreting the coverage, the team must understand the quality of the data source on vaccines administered. To this end, the team must create tables showing the source of vaccination data—health card or verbal report. A sample table with some vaccines in the schedule is shown below (Table 11). Table 11. Number of children aged 12-23 months vaccinated within the first year of life, by data source, country A, 2013
VaccineVaccinated at any age prior to the survey per Vaccinated before
age 12 monthsHealth card Verbal report Either
Tuberculoses (BCG)
Polio 1st dose
2nd dose
3rd dose
DTP 1st dose
2nd dose
3rd dose
Hepatitis B 1st dose
2nd dose
3rd dose
All vaccines
No vaccine
Number of children aged 12-23 months
Numerators and denominators
Interpretation of coverage indicators depends on clearly established numerators and denominators to calculate data from different sources (Table 12).

31
Table 12. Numerators and denominators for calculating coverage, by data source
Variable Administrative data Survey Registry
Numerator Number of doses administeredWeights of children in the survey who received vaccines
Number of children in the registry who received vaccines
DenominatorTarget population (e.g., children aged <1 year, census population, projection, or birth records minus deaths)
Weights of children in the surveyNumber of children in the registry
Below is a sample coverage calculation using administrative and survey data from country A.
2,874 children who received the 3rd dose of pentavalent vaccineSurvey data* X 100 = 86.6%3,319 children aged ≥365 days in the survey
Third Dose of Pentavalent Vaccine
* Survey data must be weighted and analyzed using software that take into account complex sampling procedures—i.e., a value should be assigned to each child’s data based on his or her probability of selection. This makes it possible to characterize the entire population rather than only the children in the survey (Annex 2). For practical purposes, this example shows an unweighted coverage estimate (86.6%), assuming that all children had the same probability of selection. The MICS and DHS surveys already contained weighted variables. If only one child was selected from each household that had more than one eligible child, this weight must be taken into account.
Coverage results for the immunization schedule are displayed in tables and figures that should show the estimated coverage, the 95% confidence intervals, and other data, such as the size of the survey population (Table 13).
112,222 3rd doses of pentavalent vaccine administered to children aged <1 yearAdministrative Data
X 100148,630 children aged <1 year in the target population
= 75.5%

32
Table 13. Vaccination coverage and confidence intervals (95%) for vaccines in the basic schedule, country A, 2013 (unweighted for demonstration purposed only)
Variable n Coverage (%)Confidence interval (95%)
Lower Upper
Tuberculosis (BCG) 1,430 97.9 97.2 98.6
Hepatitis B, 1st dose 1,430 98.0 97.3 98.7
Hepatitis B, 2nd dose 1,352 95.3 94.2 96.5
Hepatitis B, 3rd dose 1,213 88.7 86.9 90.5
Hib, 1 1,352 97.6 96.7 98.4
Hib, 2 1,283 97.0 96.1 98.0
Hib, 3 1,213 94.4 93.1 95.7
There are other ways to calculate coverage from a survey or registry:
� The denominator can be only the number of children born in a given year, while the numerator can be the children aged <12 months vaccinated in the same year. These figures are equivalent to the coverage of children aged <1 year in a given birth cohort.
� The analysis can be limited to children with written records of vaccination, where the denominator is the number of children with documentation of any vaccine dose. However, results of this analysis are not representative of the entire population, as they exclude children without documentation.
As shown in Figure 2, the team must also stratify and present coverage of the immunization schedule according to socioeconomic variables and other demographic factors and show coverage estimates for each indicator with 95% confidence intervals.

33
3.3. Coverage in valid dosesNo vaccine is 100% effective. The degree of immunity achieved depends on the vaccine being administered at the indicated age and per the recommended schedule. Thus, in addition to estimating coverage of the vaccines administered, the evaluation team should also determine if vaccine were given at the appropriate age and with the recommended intervals between doses (13).
Valid doses are those given when the child has reached the minimum age for a particular vaccine or has reached the minimum number of days following administration of the previous dose in the series. Invalid doses leave children vulnerable to vaccine-preventable diseases (VPDs). The analysis and formula below determine the proportion of valid doses administered for each vaccine, regardless of the data type.
100
80
60
40
20
0Quintile 1 Quintile 2 Quintile 3 Quintile 4 Quintile 5
Vacc
inat
ed M
MR1
%
Household income
Figure 2. Proportion (%) of children 24 to 35 months old who received MMR 1 vaccine, by household income quintile, country A, 2013
Valid doses administeredFormula for calculating coverage in valid dosesTarget population
X 100

34
Tables 14-17 show PAHO-TAG and WHO-SAGE recommendations on valid doses. Definitions of validity are based on immunogenicity data (14).
Table 14. Definition of valid doses for vaccines given in the first year of life
VaccineRecommended age,
most PAHO countriesMinimum
ageMinimum interval between doses
Maximum age
Hepatitis B At birth 0 days Not applicable
Although this dose should be given within the first 24 hours of life to prevent vertical transmission of hepatitis B, as birth dose to differentiate from later doses. When given at age >59 days, the vaccine is no longer considered a newborn dose of hepatitis B vaccine.
Tuberculosis (BCG) At birth 0 days Not applicable Not recommended after age 364 days.
Rotavirus, 1st dose 2 months 42 days Not applicable 104 days
Rotavirus, 1st dose 4 months 70 days 28 days after 1st rotavirus dose
223 days
Polio, 1st dosePenvavalent, 1st dosePCV, 1st dose
2 months 42 days Not applicable None
Polio, 2nd dosePentavalent, 2nd dose PCV, 2nd dose
4 months 70 days 28 days after the first dose
None
Polio, 3rd dose, Pentavalent, 3rd dose, PCV, 3rd dose
6 months 98 days 28 days after the second dose
None
Yellow fever 12 months 182 days When yellow fever and MMR or measles and rubella vaccine are not given on the same date but within <28 days, the second dose is invalid.
None
MMR or MR, 1st dose 12 months 270 days None
Keep in mind the following points in calculating valid-dose vaccination coverage.

35
Minimum intervals required for validity
There are established minimum intervals between administration of two doses of the same vaccine. Additionally, if two live attenuated parenteral or nasal vaccines are given on different dates within an interval of <28 days, the second vaccine is invalid. However, when two attenuated parenteral or nasal vaccines are given on the same date, both vaccines are valid. Attenuated parenteral vaccines include the single antigen against measles, measles and rubella, MMR vaccine against measles, mumps, and rubella, yellow fever, and chickenpox vaccine. The nasal influenza vaccine is an attenuated vaccine given by the nasal route. The rule does not apply to attenuated vaccines given by the oral route, such as the oral polio and rotavirus vaccines. For more information, please see chapter 2 of the Pink Book (15): http:/www.cdc.gov/vaccines/pubs/pinkbook/downloads/genrec.pdf
Maximum age
Three vaccines have a recommended maximum age of administration: � Though the tuberculosis (BCG) vaccine can be given after 365 days of life, it is not recommended. Doses administered
after age 1 year are not included in coverage estimates. See the PAHO-TAG report and the complete position paper (16): http://www.who.int/wer/2004/en/wer7904.pdf?ua=1.
� Hepatitis B vaccine given more than 24 hours after birth provides very little protection against perinatal transmission of the disease. When the vaccine is given after age 59 days, it is no longer considered the birth dose. Doses given >60 days after birth are considered the first dose of hepatitis B vaccine in countries whose immunization schedules have three doses in addition to the birth dose for infants. See the full position paper (17): http://www.who.int/wer/2009/wer8440.pdf?ua=1.
� In 2012, PAHO-TAG indicated that the rotavirus vaccine can be given up to age 1 year in areas with high morbidity and mortality from diarrheal disease but that countries should try to respect maximum age limits (19). These guidelines relate to 2009 recommendations and can be found here: http://www.paho.org/hq/index.php?option=com_content&view=article&id=1862&Itemid=1682&lang=en.
Measles-containing vaccines
WHO-SAGE recommends giving the first dose of measles-containing vaccine (either the MMR or the measles and rubella vaccine) at age 9 months in areas where measles transmission is high and at age 12 months where transmission is low. An estimated 90% of infants receiving measles vaccine at age 8 or 9 months achieve seroconversion. For further information, please see the WHO position paper (20) on vaccines containing the measles antigen at: http://www.who.int/immunization/policy/position_papers/en/.
Due to the variety of national recommendations on ages of administration in the Americas, and for the purposes of this guide, 9 months is an acceptable age for administering a measles-containing vaccine. However, countries may need to modify this indication to align it more closely with national recommendations.

36
Table 15. Definition of valid vaccination booster doses in the vaccination series
Vaccine Reccomended age Minimum ageMinimum interval between doses
Maximum age
PCV booster 12 months 365 days 56 days after previous dose of the same vaccine
None
Polio booster Refer to the national schedule
126 days 28 days after previous dose of the same vaccine
None
DPT booster 18 months 365 days 181 days after previous dose of a DPT vaccine
None
MMR or measles and rubella, 2nd dose
Refer to the national schedule
298 days
28 days after previous dose of a vaccine that contains the measles antigen
None
Table 16. Definition of valid vaccination doses for school admission series
Vaccine Reccomended age Minimum ageMinimum interval between doses
Maximum age
Polio, 2nd booster Follow national schedule
At least 181 days after previous dose of same vaccine; may be 4 years in some countries
181 days after previous dose of the same vaccine
None
DPT, 2nd boosterFollow national schedule
446 days 181 days after previous dose of a DPT vaccine
None
Table 17. Definition of valid vaccination for annual vaccine against influenza
Vaccine Reccomended age Minimum age Minimum interval Maximum age
Influenza, 1st doseEvery year after age 6 months
181 days Not applicable None
Influenza, 2nd dose
One month after first dose only during first season of influenza vaccination
209 days 28 days after previous dose of influenza vaccine
8 years + 364 days

37
Please keep the following points in mind:
Second dose of influenza vaccine
A second dose of seasonal influenza vaccine, administered at least 28 days after the first dose, is only recommended for children aged <9 years during the first season in which the child is vaccinated against influenza.
Four-day grace period
The United States Advisory Committee on Immunization Practices considers doses to be valid if they are given up to four days before the minimum age for validity or four days before the minimum interval between doses. Please see chapter 2 of the Pink Book for more information: http://www.cdc.gov/vaccines/pubs/pinkbook/downloads/genrec.pdf
The four-day grace period was not used in the examples on calculating validity in this module. However, Dayan cites an example of an analysis done in Buenos Aires that used the rule (18, 21). How is coverage of valid doses calculated? Numerators and denominators
Table 18 compares numerators and denominators for calculating valid-dose coverage using different types of data. Because administrative data do not include birthdates or dates of vaccination, it is impossible to know the age of administration or the intervals between doses and thus to use this information to calculate valid-dose coverage. In contrast, surveys and EIR data provide information linked to individual children, making it possible to evaluate the validity of doses.
Table 18. Numerators and denominators for calculating coverage, by data source
Variable Administrative data Survey Registries
Numerator Not applicable Weights of children in the target age group with a date that reflects a valid dose of the vaccine of interest
Number of children in the target age group with a valid dose of the vaccine of interest in the registry
Denominator Not applicable Weights of children in the target age group who participated in the survey
Number of children in the target age group in the registry
If a low percentage of children in the sample have data on dates of vaccination, the calculation of valid doses should be
interpreted with caution.
Examples
The example below compares the coverage of all doses to the coverage of valid doses using survey data from country A.

38
Tables 19-21 show sample coverage calculations with all the doses and invalid doses using survey data. Each table has a different number of children as the denominator, since these numbers represent the children in the survey scheduled to receive different vaccine doses.
Table 19. Vaccine doses administered and valid doses, children aged 12-35 months, country A, 2011
VaccineTotal no.
of children
Total doses administered Valid doses administered Invalid dosesn % (CI 95%) n % (CI 95%)
BCG 3,319 3,079 92.8 (91.9-93.8) 3,079 92.8 (91.9-93.8) 0
Polio 1st dose 3, 319 3,163 95.3 (94.5-96.2) 3,130 94.3 (93.4-95.2) 33
Polio 2nd dose 3,319 3,133 94.4 (93.4-95.4) 3,076 92.7 (91.6-93.8) 57
Polio 3rd dose 3,319 3,004 90.5 (89.2-91.8) 2,962 89.2 (87.9-90.6) 42
Pentavalent, 1st dose
3,319 3,157 95.1 (94.3-96.0) 3,123 94.1 (93.2-95.0) 34
Pentavalent, 2nd dose
3,319 3,129 94.3 (93.3-95.2) 3,053 92.0 (90.9-93.1) 76
Pentavalent, 3rd dose
3,319 2,981 89.8 (88.5-91.1) 2,937 88.4 (87.1-89.8) 44
MMR 3 319 2,914 88.1 (86.6-89.6) 2,861 86.5 (85.1-88.0) 53
Yellow fever 3,319 2,834 85.8 (84.2-87.4) 2,775 84.1 (82.5-85.7) 59
2,914 children who received a dose of MMR vaccineTotal MMR vaccine doses* X 1003,319 children in the survey who met the age requirements
2,861 children who received a valid dose of MMR vaccine Valid doses of MMR vaccine* X 1003,319 children in the survey who met the age requirements
MMR vaccine: In country A, 53 children received invalid doses of MMR vaccine, either due to administration before age 270 days (9 months) or to administration 1-27 days after the yellow fever vaccine.
* As explained, survey data must be weighted—i.e., a value should be assigned to the data for each child based on the child’s probability of selection. This makes it possible to characterize the entire population rather than only children in the survey (Annex 2). For practical purposes, the example shows a gross calculation of coverage, assuming that all children had the same probability of selection (i.e., the percentage of the sample).
=87.8%
= 86.2%

39
Table 20. Vaccine doses administered and valid doses of rotavirus vaccine, children born in 2010, country A, 2011
Vaccine*Total no.
of children
Total doses administered Valid doses administered Invalid dosesn % (CI 95%) n % (CI 95%)
Rotavirus, 1st dose
1,194 1,058 88.4 (86.4-90.5) 988 82.6 (80.0-85.2) 70
Rotavirus,2nd dose
1,194 986 82.5 (79.8-85.1) 960 80.4 (77.7-83.1) 26
* In 2010, Country A introduced rotavirus vaccine. While the survey included children born in 2008-2010, this analysis only includes children born in 2010.
Table 21. Vaccine doses administered and valid booster doses, children aged 18-35 months, country A, 2011
Vaccine*Total no.
of children
Total doses administered Valid doses administered Invalid dosesn % (CI 95%) n % (CI 95%)
Polio booster 2,419 1,810 74.9 (72.6-77.2) 1,785 73.8 (71.5- 76.1) 25
DPT vaccine, booster
2,419 1,804 74.6 (72.3-76.9) 1,743 72.0 (69.7- 74.4) 61
* The DPT and oral polio vaccine boosters are recommended at age 18 months. The analysis only includes children aged 18-35 months at the time of the survey.
Programmatic implications
� The purpose of the validity criterion is to maximize the efficacy and safety of each dose administered. � Vaccines should be administered at an age that gives children the best chance of developing an immune response and
ensures that they are protected against VPDs. � Valid-dose coverage also provides information on how well vaccinators understand and follow guidelines.
3.4. Dropout rateMethod 1: To determine the dropout rate between the first and third doses of pentavalent vaccine, calculate the number of children who had access to the service when they received the 1st pentavalent dose but could not complete the series.
Regardless of the data type, the following formula is used to calculate the dropout rate between the first and third doses of pentavalent vaccine.
Numerators and denominators
Table 22 shows the numerators and denominators used to calculate the dropout rate between the first and third doses of pentavalent vaccine using three types of data.
Dropout rate between the 1st and 3rd doses of pentavalent vaccine
1st doses of pentavalent [minus] 3rd doses of pentavalent X 100
1st doses of pentavalent

40
Table 22. Numerators and denominators to calculate the dropout rate between the first and third doses of pentavalent vaccine, by data source
Variable Administrative data Surveys Registries
Numerator
Subtract the number of 3rd pentavalent doses from the number of 1st pentavalent doses
Number of children with a 1st pentavalent dose who did not receive the 3rd pentavalent dose by age 12 months
Number of children with a 1st pentavalent dose who did not receive the 3rd dose by age 12 months
DenominatorNumber of 1st pentavalent doses administered
Number of children aged <12 months with a 1st pentavalent dose on record
Number of children aged <12 months with 1st pentavalent dose on record
Keep the following points in mind when comparing the dropout rate using administrative, survey, or registry data: � Administrative data are aggregated and thus do not allow for monitoring of individual children. Additionally, in using
administrative data, the evaluation team should remember that it is impossible to compare the exact same group of children because the doses given to children aged <1 year are counted by calendar year; some children will therefore receive the first dose of pentavalent vaccine in one calendar year and the third dose in the next calendar year.
� However, survey and registry data help to determine which children failed to return for follow-up vaccination visits. Information on their risk factors, such as rural or urban residence or socioeconomic status, may also be obtained.
Example
The example from country A shows the calculation of dropout rates between the first and third doses of pentavalent vaccine based on administrative and survey data, respectively.
Dropout rates between the first and third doses of pentavalent vaccine
114,015 1st doses of pentavalent vaccine in children aged <12 months [minus]112,222 3rd doses of pentavalent vaccine in children aged <12 monthsAdministrative
Data 114,015 1st doses of pentavalent vaccine in children aged <12 months X 100 = 1.6%
176 children who received the 1st but not the 3rd dose of pentavalent before age 12 monthsSurvey Data 3,157 children who received the 1st dose of pentavalent before age 12 months
X 100 = 5.6%

41
Programming implications
Dropout rates show delays in completing both specific vaccine series and the vaccination schedule overall. In the case of DPT, dropout rates can show the percentage of children who received the first dose of the vaccine but did not receive the third dose. High dropout rates have many causes, including decreased demand for vaccines, problems with the immunization services, and barriers in accessing these services.
It is important to keep in mind that late doses may not appear in administrative estimates, but most vaccines can be administered after the indicated age (2).
Method 2: To determine the dropout rate between the third dose of pentavalent vaccine and the 1st dose of MMR or measles and rubella vaccine, compare the number of children who received the third dose of pentavalent vaccine at age 6 months but did not complete the vaccination series at age 12 months.
Basic formula
The formula below determines the dropout rate between the third dose of pentavalent vaccine and the first dose of triple or measles and rubella vaccine, regardless of the data type.
Numerators and denominators
Using three types of data, Table 23 shows the numerators and denominators needed to calculate the dropout rate between the third dose of pentavalent vaccine and the first dose of MMR or measles and rubella vaccines.
Table 23. Numerators and denominators to calculate the dropout rate between the third dose of pentavalent vaccine and MMR vaccine, by data source
Variable Administrative data Surveys Registries
Numerator
Subtract the number of MMR doses administered to children aged <1 year in a year from the number of 3rd doses of DPT administered to children aged <1 year in the previous year
Weights of children who received a 3rd pentavalent dose but did not receive the MMR vaccine by age 24 months
Number of children who received a 3rd pentavalent dose but did not receive the MMR vaccine by age 24 months
DenominatorNumber of 3rd pentavalent doses administered
Weights of children with a 3rd pentavalent dose on record by age 24 months
Number of children with a 3rd pentavalent dose on record by age 24 months
Dropout rate between the third dose of pentavalent vaccine and the first dose of MMR vaccine
3rd pentavalent dose [minus] MMR dose3rd pentavalent dose
X 100

42
The sample data from Country A below shows the dropout rates between the third dose of pentavalent vaccine and the first dose of MMR or measles and rubella vaccine, based on administrative and survey data, respectively.
The dropout rate may also be presented in figures (see Module 2, “Analysis of administrative coverage”).
Programmatic implications
The dropout indicator shows the percentage of children who had access to immunization services and received the third dose of DPT vaccine but were lost in follow-up before receiving a vaccine that contains the measles antigen. As noted, most vaccines can be applied when the child is older the recommended age, and these doses may not appear in administrative calculations. 3.5. Timeliness3.5.1. TimelinessGoal: To assess fulfillment of the recommended vaccination schedule.
In Tables 24-27, children’s ages are indicated at the time of vaccination by categories of timeliness or completion of the schedule but only for valid doses. Please see the previous section to determine valid doses.
In this guide, timeliness is defined as the period from when a child reaches the recommended age of vaccination for the dose of interest until one month (30 days) after that age. Several definitions of timeliness exist in the literature; most of these allow for a month after the recommend age for vaccination (22).
112,222 3rd doses of pentavalent administered in 2011 [minus]109,925 doses de MMR administered in 2012
Administrative Data X 100 = 2.0%112,222 3rd doses of pentavalent vaccine
Dropout rates between the third dose of pentavalent vaccine and the first dose MMR vaccine
67 children who received the 3rd dose of pentavalent but not the MMRSurvey data X 1002,981 children who received the 3rd dose of pentavalent vaccine
= 2.2%

43
Table 24. Definition of valid doses according to the vaccination schedule, by recommended age of administration of the vaccine series for the first year of life
VaccineBefore the
recommended age At the
recommended age After the
recommended age Late
Hepatitis B Not applicable 0-1 day 2-28 days
29-59 days (doses given >59 days are counted as the first vaccine dose)
BCG Not applicable 0-30 days 31-364 days ≥365 days (not recommended)
Rotavirus, 1st dose 42-59 days 60 to 90 days 91-104 days >104 days
Rotavirus, 2nd dose 70-119 days 120-150 days 151-223 days >223 days
Polio,1st dosePentavalent, 1st dosePCV, 1st dose
42-59 days 60-90 days 91-364 days >1 year (365 days)
Polio, 2nd dosePentavalent, 2nd dose PCV, 2nd dose
70-119 days 120-150 days 151-364 days >1 year (365 days)
Polio, 3rd dose Pentavalent, 3rd dosePCV, 3rd dose
98-179 days 180-210 days 211-364 days >1 year (365 days)
Keep in mind the following points in evaluating vaccination timeliness:
Late start
If a child starts the series after the age at which all the doses should have been administered, the team should consider a secondary analysis to evaluate completion of an accelerated schedule based on the minimum valid intervals between doses.
Table 25. Definition of doses according to the vaccination schedule, by recommended age of administration of the vaccine series in the second year of life
VaccineBefore the
recommended age At the
recommended age After the
recommended age Late
MMR or measles and rubella, 1st dose
270-364 days 365-395 days 390-729 days >2 years (730 days)
Yellow fever 181-364 days 365-395 days 396-729 days >2 years (730 days)
PCV booster Not applicable 365-395 days 396-729 days >2 years (730 days)
DPT booster Not applicable 547-577 days 578-729 days >2 years (730 days)
Polio booster Not applicable 547-577 days 578-729 days >2 years (730 days)

44
Table 26. Definition of valid doses according to the vaccination schedule, by recommended age of administration of the school admission series
VaccineBefore the
recommended age At the
recommended age After the
recommended age Late
MMR or measles and rubella, 2nd dose
<28 days before the prior dose
Up to 30 days after the age recommended in the national schedule
>30 days after the age recommended in the national schedule
After the next birthday
Polio, 2nd booster<28 days before the prior dose
Up to 30 days after the age recommended in the national schedule
>30 days after the age recommended in the national schedule
After the next birthday
DPT, 2nd booster <28 days before the prior dose
Up to 30 days after the age recommended in the national schedule
>30 days after the age recommended in the national schedule
After the next birthday
Second dose of a Measles-containing vaccine
PAHO-TAG recommends administering the second dose of the MMR or measles and rubella vaccine at age 18 months, along with the first booster of the DPT vaccine. Per this recommendation, the dose would be late because it would be given after the child’s second birthday (age 730 days) (23).
Table 27. Definition of valid doses of the influenza vaccine, by recommended age of administration
VaccineBefore the
recommended age At the
recommended age After the
recommended age Late
Influenza, 1st dose
Age 6 months (Depends on age during the flu season)
Influenza, 2nd dose (for children aged <9 years vaccinated for the first time)
<28 days after the 1st dose
28-57 days after the previous dose
58-181 days after the previous dose
Note: If the second dose for primovaccinated children aged <9 years is not given in the first season as the first dose, the next season two doses must be administered
Second dose of influenza vaccine
A second dose of influenza vaccine is only recommended for children aged <9 years who were not vaccinated with doses of influenza vaccine in any previous season.
Using survey data from country A, Table 28 describes the steps for assessing the timeliness of doses.

45
Table 28. Calculation of timely vaccination coverage
Steps Example
1. Select the vaccine(s) of interest. DPT vaccine booster
2. Choose a group of children who meet the age criteria for the vaccine of interest.
Children aged 24-35 months
3. For the denominator, use the total number of children in the age group.
There were 1,621 children aged 24-35 months at the time of the survey
4. Calculate the age of vaccine administration.
Date of administration of the vaccine of interest [minus] the child’s date of birth
5. Count the children who do not have an administration date on record for the vaccine of interest.
318 children aged 24-35 months had no record showing that the DPT vaccine booster was administered.
6. Count the children who received invalid doses because they were given before the minimum age.
Invalid DPT booster are given < age 365 days. 25 children aged 24-35 months received a dose of DPT vaccine < age 365 days.
7. Count the children who received invalid doses because the doses were given before the end of the minimum interval after the previous dose.
Invalid doses of the DPT booster are those given <181 days after the last dose of pentavalent vaccine. 22 children aged 24-35 months received a dose of DPT vaccine <181 days after the 3rd dose of pentavalent vaccine.
8. Add up the total number of invalid doses.
The total number of children with invalid doses is 47 (25+22).
9. Count the children who received timely doses.
Timely doses are those given < age 365 days, allowing for the minimum interval, and 569 days. 605 children aged 24-35 months received a dose of DPT vaccine on time.
10. Count the children who received doses after the recommended period.
“Not timely” doses are those given at age 570-729 days. 500 children aged 24-35 months received a dose of DPT vaccine after the recommended period.
11. Count the children who received late doses.
Late doses are those given >730 days. 151 children aged 24-35 months received a dose of DPT vaccine after their second birthday.
12. Calculate the percentage of coverage for specific doses.
605 children who received a DPT booster in a timely manner (weighted)
1,621 children aged >24 months at the time of the survey (weighted) = 37.3% (CI 95% = 34.2-40.5)
of children who received a timely DPT booster within 30 days after the recommended age.
In addition to vaccines administered on time, the evaluation team may estimate the proportion of children vaccinated in a timely fashion. Please see Module 2 for more information on the analysis of administrative coverage and the graphs used to display of timely vaccinations.

46
3.5.2. Average age at vaccinationUsing example survey data from country A, Table 29 describes steps for assessing the average age of vaccine administration.
Table 29. Calculation of average age at vaccination
Steps Example
1. Select the vaccine(s) of interest. Rotavirus, 2nd dose
2. Choose a group of children who meet the age criteria for the vaccine of interest.
1,194 children born following rotavirus vaccine introduction in 2010.
3. Limit the number to those children who received the vaccine of interest.
Of children born in 2010, 986 received the 2nd rotavirus dose.
4. Calculate the age at which the vaccine was administered to each child.
Date of administration of the 2nd rotavirus dose [minus] date of birth of the child = age at vaccination with the 2nd rotavirus dose.
5. Add up all the ages when the vaccine was administered.
The sum of all ages at vaccination for the 986 children born in 2010 who received the 2nd rotavirus dose is 131,984 days.
6. Divide the sum of the ages by the number of children vaccinated. This is the average age at vaccination.
3.5.3. Median age and interquartile range of vaccinationUsing survey data from country A, Table 30 describes how to evaluate the median age and interquartile range of vaccine administration.
The median age, or 50th percentile (second quartile), is the middle point in a distribution of numbers—i.e. the age at which 50% of children given the vaccine dose did so at a younger age and 50% received did so at a later age. The interquartile range covers the ages between the 25th (first quartile) and 75th percentiles (third quartile). Additionally, the study team may calculate the statistical range of vaccination days, between the doses administered at the youngest age and those administered at the oldest age.
This is the average of age of administration of the 2nd rotavirus dose in the survey.
131,984 days986 children
= 133.9 days of age

47
Table 30. Calculation of the median age at vaccination and the interquartile range
Steps Example
1. Select the vaccine(s) of interest. Rotavirus, 2nd dose
2. Choose a group of children who meet the age criteria for the vaccine of interest.
1,194 children were born following rotavirus vaccine introduction in 2010. Of these children, 968 received the 2nd rotavirus dose.
3. Calculate the age of vaccine administration.
Date of administration of the 2nd rotavirus dose [minus] date of birth of the child = age at vaccination with the 2nd rotavirus dose.
4. Divide the total number of children by half.
5. List the ages in descending order.The lowest and highest ages of the 986 children were 50 and 495 days, respectively.*
6. According to the list created in step 5, the age of the child calculated in step 4 represents the median age of vaccinated children in the survey.
The age at vaccine administration of child number 493 is 127 days. This is the median age.
7. Divide the total number of children by four.
8. The age at administration for the child identified in step 7 represents the lower limit of the interquartile range.
As this is not a whole number, the first quartile is delimited by the average ages of children number 246 and 247. This figure—122.5 days—is the cut-off for the first quartile.
9. Add up the number of children calculated in steps 4 and 7.
493 + 246.5 = child number 739.5
10. The age at administration for the child identified in step 9 represents the upper limit of the interquartile range.
As this is not a whole number, the third quartile is delimited by the average ages of children numbered 739 and 740. This figure—137 days—is the cut-off for the group’s third quartile.
11. Report the median age of administration and interquartile range. The range constitutes the upper and lower age limits in which most children received the vaccine of interest.
Median: age 127 days Interquartile range: age 122.5-137 days
Range: age 50-497 days
* Some doses are invalid but included in the analysis as an example.
986 children2
= 493 children
986 children4
= child number 246.5

48
Notably, the average (133.9 days) and median ages (127 days) of vaccination with the second rotavirus dose are not the same. This is because outliers (e.g., vaccination at age 497 days) strongly affect averages. As a result, the evaluation team may wish to report all outcomes—average, median, interquartile range, and statistical ranges—at the same time. 3.5.4. Inverted Kaplan-Meier curveThe inverted Kaplan-Meier curve is a graphical representation of the proportion of vaccinated children by age (in months). Unvaccinated children are included in the appropriate group for vaccination, starting from birth and proceeding to their age at the time of data collection. In these graphs, each dose is assumed to be independent of all others, including doses in the same series.
Clark and Sanderson use DHS data to present an example of time-to-event analysis (24). Using survey data from country A, Table 31 describes the steps for creating the variables necessary to build an inverted Kaplan-Meier curve.
Table 31. Construction of the inverted Kaplan-Meier curve
Steps Example
1. Select the vaccine(s) of interest. Pentavalent vaccine, 2nd dose
2. Choose a group of children who meet the age criteria for the vaccine of interest.
All the children in the survey (all aged >12 months).
3. Create a variable for each vaccine that indicates if it was administered.
Child who received the 2nd pentavalent dose = 1; child who did not receive it = 0.
4. Create a variable for time elapsed up to
the event for the vaccinated children.
If the child received the 2nd dose of pentavalent vaccine, the time
elapsed up to the event corresponds to the age recommended for administration.
5. Create a variable for time elapsed up to
the event for the unvaccinated children. Some children will have received some but not all doses.
If the child did not receive the 2nd pentavalent dose, the time elapsed up to the event is the age at the time of data collection. These children have been excluded, meaning that even though they did not receive the vaccine before the survey, they may receive it in the future.
6. Use a computer program to construct the inverted Kaplan-Meier curve at 1 [minus] the time elapsed up to the event and the corresponding confidence intervals.
Figure 3 below was created using R language.*

49
Figure 3. Probability of having received the second dose of pentavalent vaccine, by birth cohort in the coverage survey, country A, 2011
Prob
abili
ty o
f bei
ng v
acci
nate
d
Vaccination age (months)
0
0 1 2 3 4 5 6 7 8 9 10 11 12 13 14 15 16 17 18
0,1
0,2
0,3
0,4
0,5
0,6
0,7
0,8
0,9200820092010
1
Options
� Multiple doses of the same vaccine in a diagram. � One vaccine by multiple birth cohorts, as seen in the example. � One vaccine by subnational region.
The band showing the timeliness period for the vaccine under evaluation helps to visualize the data. In the next example from country A, the gray bands indicate the recommended ages of administration.
Kaplan-Meier diagrams allow for confidence intervals to be displayed (Figures 3-5). In all the figures, the ordinate axis represents the probability of vaccination rather than coverage.
Figure 3 does not include confidence intervals. The gray box indicates the recommended age of administration. This type of graph can be used in a presentation to a large group. Figure 4 shows the same information as Figure 3, with the addition of 95% confidence intervals. Each box represents a different birth cohort, labeled from the top. The gray boxes indicate the recommended ages of administration. This type of figure could be used in a written report.

50
Figure 4. Probability (CI 95%) of having received the second dose of pentavalent vaccine, by birth cohort in the coverage survey, country A, 2011
Figure 5 shows the probability of children aged >6 months having received vaccines in the schedule at the recommended ages. Cohorts of older children had lower coverage with PCV, since the vaccine had previously only been available in the private sector.
Prob
abili
ty o
f bei
ng v
acci
nate
d
Vaccination age (months)
Pent
aval
ente
2
6 12 18 6 12 18 6 12 180
0,2
0,4
0,6
0,8
1,0

51
HB3Polio3
Hip3Pneumococcus
DPT3
Prob
abili
ty o
f bei
ng v
acci
nate
d (%
)
Age (months)
40 2 106 8 1612 14 2218 20 2824 26 34 3630 320
10
20
30
40
50
60
70
80
90
100
Figure 5. Probability (%) of having received the vaccines administered starting at 6 months of age, by birth cohort, country A, 2011
These children were vaccinated in the private sector before the vaccine was introduced in the
official immunization series
Legend: HB3: hepatitis B, 3rd dose; polio3: polio, 3rd dose; DPT 3: diphtheria, pertussis, and tetanus, 3rd dose; Hib 3: Haemophilus influenzae type b, 3rd dose; pneumococcus: pneumococcal conjugate vaccine.
Programmatic implications
Significant delays in vaccination increase the time in which children are unprotected and delay the achievement of herd immunity in the cohort. Delays may also decrease the coverage estimate.
Timeliness analyses can highlight changes over time or differences in vaccination practices among subnational politico-administrative areas.
Limitations
The dataset must include birthdates and dates of vaccine administration.

52
3.6. SimultaneityGoal: To determine how frequently vaccines recommended for simultaneous administration are given on the same date.
Method 1: Using survey data from country A, Table 32 describes the basic steps for assessing the simultaneous administration of vaccines recommended to be given at the same age.
Table 32. Calculation of simultaneous administration of vaccines recommended at the same age, Method 1
Steps Example
1. Select two vaccines of interest with the same recommended age and administration date.
3rd doses of pentavalent and polio vaccines
2. Choose a group of children meeting the age criteria for the vaccine of interest
Children aged 12-35 months.
3. Limit the group to children who received both vaccines. This number is the denominator.
2,973 children aged 12-35 months received the 3rd doses of pentavalent and polio vaccines.
4. Determine which children received both vaccines on the same date. This number is the numerator.
2,924 children aged 12-35 months received the 3rd doses of pentavalent and polio vaccines on the same date and 49 children received the 3rd pentavalent dose and polio vaccine on different dates.
5. Calculate the percentage of children who received the vaccines of interest at the same time.
2,924 children received the 3rd doses of pentavalent and polio vaccines on the same date (weighted)2
2,973 children who received both doses, (weighted) = 98.4% (CI 95%: 97.9-98.8)
Options for the denominator
In method 1, the evaluating team may consider including children who received only some of the vaccines, in addition to those receiving both vaccines. The remaining children can then be grouped by whether they received only one vaccine, both vaccines on the same date, or each vaccine on a different date. Method 2: Using survey data from country A, Table 33 describes advanced steps for assessing simultaneous administration of vaccines recommended at the same age and at different ages.
2 Weighting is used in surveys to extrapolate from the sample population.

53
Table 33. Calculation of simultaneous administration of vaccines recommended at the same age, Method 2
Steps Example Children in each category (%)
1. Select a vaccine of interest.
Rotavirus, 1st dose
2. Choose a group of children meeting the age criteria for the vaccine of interest.
Children born in 2010.
3. Limit the group to children who received the vaccine of interest. This figure will be the denominator.
Of the children born in 2010, 1,058 received the 1st rotavirus dose.
4. Count the number of children who received the vaccine of interest on the same date as another vaccine scheduled at the same age.
1,008 children born in 2010 received the 1st rotavirus dose and the 1st pentavalent dose on the same date.
1,008 children who received the 1st rotavirus and pentavalent doses on the same date, (weighted)
1,058 children born in 2010 who received the 1st rotavirus dose (weighted)
= 95.1% (CI 95%: 93.6-96.6)
5. Count the number of children who received the vaccine of interest on the same date as the next dose of the second vaccine in step 4.
15 children born in 2010 received the 1st rotavirus dose and the 2nd pentavalent dose on the same date.
15 children who received the 1st rotavirus and 2nd pentavalent doses on the same date (weighted)
1,058 children born in 2010 who receivedthe 1st rotavirus dose (weighted)
= 1.5% (CI 95%: 0.6-2.3)
6. Count the number of children who received the vaccine of interest on the same date as the next dose after the dose of the second vaccine in step 5.
No children born in 2010 received the 1st rotavirus and 3rd pentavalent doses on the same date.
0 children who received the 1st rotavirus and 3rd pentavalent doses on the same date, (weighted)
1,058 children born in 2010 who received the 1st rotavirus dose (weighted)
= 0.0%
7. Count the number of children who received the vaccine of interest on a different date than the other vaccine.
35 children born in 2010 received the 1st rotavirus dose on a different date than the 1st, 2nd, or 3rd pentavalent dose
35 children who received the first rotavirus dose on a date different than the 1st, 2nd, or 3rd pentavalent dose (weighted)
1,058 children born in 2010 who receivedthe 1st rotavirus dose (weighted)
= 3.4% (CI 95%: 2.2-4.7)

54
Options for the denominator
In Method 2, all children may be included, even those who did not receive the vaccine being studied.
Programmatic implications
� The analysis identifies opportunities to improve immunization services, so that all children receive all recommended vaccines at every visit.
� The analysis highlights the flexibility and adaptability of vaccinators who manage to give all prescribed vaccines at each visit, even when the doses are not all scheduled for the same visit.
� Results may identify vaccine shortages at the national or subnational levels or hesitance among vaccinators in providing two or more injections simultaneously (25). To learn more about how to reduce the pain from injections, please see: http://
www.who.int/immunization/policy/position_papers/reducing_pain_vaccination/en/
The analysis of simultaneous administration of vaccines can also be presented in figures, such as those shown in Module 2.
Limitations
The dataset must include all dates of vaccine administration.
Goal: To determine if children receive all recommended vaccines during an immunization visit, and to evaluate how often the vaccines recommended for simultaneous administration are given on the same date. Method 1: When the child is delayed in receiving the third pentavalent dose and the dose can be given at the same time as the MMR vaccine, do health workers take advantage of opportunities to administer these vaccines on the same date?
Using survey data from country A, Table 34 describes the steps for determining if health workers are taking advantage of opportunities to vaccinate children with delayed schedules.
Table 34. Calculation of simultaneous administration of all vaccines recommended at the same age, Option 1
Steps Example Children in each category (%)
1. Select the vaccine(s) of interest.
Pentavalent, 3rd dose, and MMR
2. Choose a group of children who meet the age criteria for the vaccines of interest.
Children aged 12-35 months
3. Limit the group to children who had not received the previously scheduled vaccine, even though they could receive the vaccine at an older age. This number is the denominator.
498 children aged 12-35 months had not received the 3rd pentavalent dose at the recommended age for the MMR vaccine, i.e., 365 days.

55
Steps Example Children in each category (%)
4. Count the number of children who did not receive any of the vaccines.
204 children aged 12-35 months had not received the MMR vaccine or the 3rd pentavalent dose at the time of the survey.
204 children who had not received the MMR vaccine or the 3rd pentavalent dose (weighted)
498 children who had not received the 3rd pentavalent dose before age 365 days (weighted)
= 40.7% (CI 95%: 36.5-45.0)
5. Count the number of children who received both vaccines on the same date. These children did not miss an opportunity to be vaccinated during their visit.
60 children aged 12-35 months received the MMR vaccine and the 3rd pentavalent dose on the same date.
60 children who received the MMR vaccine and the 3rd pentavalent dose on the same date (weighted)
498 children who had not received the3rd pentavalent dose at 365 days (weighted)
= 12.1% (CI 95%: 9.2-15.0)
6. Count the number of children who received vaccine 1 but not vaccine 2. This number is the numerator.
12 children aged 12-35 months received the 3rd pentavalent dose > age 365 days but did not receive a dose of MMR vaccine at the time of the survey.
12 children who received the 3rd pentavalent dose but not the MMR vaccine (weighted)
498 children who had not received the3rd pentavalent before age 365 days (weighted)
= 2.3% (CI 95%: 1.1-3.6)
7. Count the number of children who received vaccine 2 but not vaccine 1. These children may also be the numerator.
134 children aged 12-35 months had received a dose of MMR vaccine but had not received the 3rd pentavalent dose at the time of the survey.
134 children who received the MMR vaccinebut not the 3rd pentavalent dose (weighted)
498 children who had not received the3rd pentavalent before age 365 days (weighted)
= 26.6% (CI 95%: 22.6-30.5)
8. Count the number of children who received both vaccines but not on the same date. These children can also be a numerator.
88 children aged 12-35 months had received both doses of the MMR vaccine and also the 3rd pentavalent dose, but these vaccines were administered on different dates.
88 children who received the MMR vaccine and the 3rd pentavalent dose on different dates (weighted)
498 children who had not received the 3rd pentavalent dose before age 365 days (weighted)
= 18.3% (CI 95%: 14.9-21.6)
Method 2: If a vaccine recommended in the second year of life was not given before age 24 months (730 days), were other vaccines administered between ages 365-730 days?
Using survey data from country A, Table 35 describes the steps for evaluating if health workers take advantage of opportunities to vaccinate children during or outside timeliness periods.

56
Table 35. Calculation of simultaneous administration of all vaccines recommended at the same age, Option 2
Steps Example
1. Select the vaccine(s) of interest. MMR and yellow fever vaccine.
2. Choose a group of children who meets the age criteria for the vaccines of interest.
Children aged 24-35 months.
3. Limit the group to children who had not received the vaccine before their second birthday. This number is the denominator.
262 children did not receive the MMR or yellow fever vaccines before their second birthday.
4. Count the number of children who received a different vaccine between the recommended age for the vaccine of interest and the birthday of interest. This number is the numerator.
96 children had one visit at which another vaccine was administered between ages 12-24 months.
5. Calculate the percentage of children who missed an opportunity to receive the vaccine
96 children had at least one vaccine between the agesof 12-24 months (weighted)
262 children who did not receive either the MMRor the yellow fever vaccine by age 24 months (weighted)
= 36.3% (CI 95%: 29.7-42.8)
Programmatic implications
Method 1 evaluates missed opportunities to update children with delayed vaccines at subsequent visits. Method 2 seeks to evaluate if children with delayed vaccines had the opportunity to receive the vaccines of interest before they reached the maximum age of administration.
Limitations
� The analysis does not show if children had true contraindications to vaccination. � Vaccine shortages and stocking issues may alter results. � The dataset must include birthdates and dates of vaccine administration.
3.7. Series completedChild with complete immunization
Goal: To determine how many children received all recommended vaccines at a given age. Please review the recommended schedule for each age cohort, as shown below.
Method 1: Using survey data from country A, Table 36 describes the steps for evaluating children with complete schedules of the basic vaccines in the EPI (BCG, DPT, polio, and MMR).

57
Table 36. Calculation of children with complete immunization according to the national schedule
Steps Example
1. Select the vaccines of interest.Polio, 1st, 2nd, and 3rd doses; pentavalent, 1st, 2nd, and 3rd doses; MMR vaccine.
2. Choose a group of children who meet the age criteria for all the vaccines of interest.
Children aged 18-35 months.
3. The number of children in this age group is the denominator.
There were 2,419 children aged 18-35 months at the time of the survey.
4. Count the number of children who received all vaccines of interest before the youngest age of the selected cohort. This number is the numerator.
1,908 children aged 18-35 months received the vaccine doses < age 18 months (547 days).
5. Calculate the percentage of children who received all the vaccines of interest before age 18 months.
1,908 children who received the seven vaccine doses< age 18 months (weighted)
2,419 children age 18-35 months (weighted)= 79.1% (CI 95%: of 77.0-81.2)
Method 2: Using survey data from country A, Table 37 describes the steps for evaluating children with national immunization schedules.
Table 37. Calculation of children with complete immunization by age, according to the national schedule
Steps Example
1. Select the vaccines of interest.Polio 1st, 2nd, and 3rd doses + booster; pentavalent, 1st, 2nd, and 3rd doses; MMR; yellow fever; and DPT booster.
2. Choose a group of children who meet the age criteria for all the vaccines of interest.
Children aged 24-35 months.
3. The number of children in this age group is the denominator.
There were 1,621 children aged 24-35 months at the time of the survey.
4. Count the number of children who received all vaccines of interest prior to the youngest age of the selected cohort. This number is the numerator.
1,041 children aged 24-35 months received the 10 vaccine doses before age 24 months (730 days).
5. Calculate the percentage of children who received all vaccines of interest before age 24 months.
1,041 children who received the 10 vaccinesbefore age 24 months (weighted)
1,621 children 24-35 months (weighted)= 64.5% (CI 95%: of 61.4-67.6)

58
Options for the numerator
The evaluation team may also do this analysis by restricting step 4 to only valid or timely doses. In the references, these analyses have been called complete vaccination when they only include valid doses and age-appropriate vaccination when they only include timely doses.
Programmatic implications
The analysis shows the proportion of children with complete immunization schedules at a given age.
Limitations
� The dataset must include birthdates and dates of vaccine administration. � The analysis does not show which children had true contraindications to vaccination.
3.7.1. Number of visits needed to complete the vaccination scheduleGoal: To determine the number of visits needed to complete the children’s schedule, by age cohort, remembering that multiple vaccines can be administered at the same visit and the minimum intervals between doses of each vaccine.
Using survey data from country A, Table 38 shows how to determine the number of visits necessary to update children with delayed immunization schedules.
Programmatic implications
The analysis provides information on the number of visits needed to update the immunization schedules of all children.
Limitations
� The analysis does not show which children had true contraindications to vaccination. � Vaccine shortages and stocking issues may alter results of these analyses. � The dataset must include birthdates and dates of vaccine administration.
Table 38. Calculation of number of visits needed to update a child’s vaccination schedule
Steps Example Children in each category (%)
1. Select the vaccines of interest.
Polio: 1st, 2nd, and 3rd doses; Pentavalent, 1st, 2nd, and 3rd doses; MMR vaccine,1st dose.
2. Choose a group of children who meet the age criteria for the vaccines of interest.
Children aged 18-35 months.
3. The total number of children in this age group is the denominator.
There were 2,419 children aged 18-35 months at the time of the survey.

59
Steps Example Children in each category (%)
4. Count the number of vaccines that each child must receive to be up to date by a given age.
Count all the missing vaccines not administered by age 18 months.
� Child A received 3 doses of polio, 3 doses of pentavalent, and no doses of MMR vaccine. Child A is missing one vaccine.
� Child B received 3 doses of polio, 3 doses of pentavalent, and 1 MMR dose. Child B it is not missing any vaccines.
� Child C received 2 doses of polio, 1 dose of pentavalent, and 1 dose of MMR vaccine. Child C is missing 3 vaccines.
5. Count the number of children with complete immunization schedules for their ages. This figure is the numerator.
1,908 children received the seven vaccines before age 18 months.
1,908 children who received the seven vaccines before age 18 months (weighted)
2,419 children age 18-35 months (weighted)= 79.1% (CI 95%: 77.0-81.2)
6. Count the number of children missing one or more vaccines, then subtract the number of children with complete immunization schedules from the total. This figure is the new denominator.
2,419 [minus] 1,908 = 511
7. For each child, determine how many of the missing vaccines could be administered during the same visit. All vaccines that could be given at the same visit should be administered. Additional visits may be needed when the child is missing more than one vaccine in the same series.
� Child A needs one visit to update his/her MMR vaccine.
� Child B is already up to date. � Child C needs two visits to get
up to date: one for the 3rd polio dose and 2nd pentavalent dose and another visit for the 3rd pentavalent dose.
8. Count the number of children who need one visit to be brought up to date. This figure is a numerator.
344 children need one visit to be brought up to date.
344 children who need one visit to be brought up to date (weighted)
511 children missingat least one vaccine (weighted)= 66.8% (CI 95%: 62.7-70.9)

60
Steps Example Children in each category (%)
9. Count the number of children who need two visits to be brought up to date. This number is also a numerator.
29 children need two visits to be brought up to date.
29 children who need two visits tobe brought up to date (weighted)
511 children missing at leastone vaccine (weighted)
= 5.8% (95% CI: 3.9-7.7)
10. Count the number of children who need three visits to be brought up to date. This number is also a numerator.
138 children need three visits to be brought up to date.
138 children who need three visitsto be brought up to date (weighted)
511 children missingat least one vaccine (weighted)= 27.4% (95% CI: 23.6-31.1)
In Annex 5, the codes for analyzing vaccination coverage surveys using SAS statistical software can be found. The Vaccination Coverage Quality Indicators (VCQI) code from the WHO is another option for the analysis of coverage surveys, which can be obtained by writing to [email protected].
Step 4: Additional analyses
Coverage surveys generate various data that are important to analyze to optimize their use and to provide knowledge to the programs. Each analysis should start with the formulation of a research question. Answering this question requires the use of appropriate analytical tools. Examples of other research areas include trends, data quality, combined information sources, and analytical models. Some research tools are briefly described below.
Logistic Regression Cox Proportional Hazards Model Poisson Regression
Additional AnalysesStep 4
Modeling techniques can be used to better understand the risk factors associated with late vaccination and non-vaccination.
The literature shows that there are three types of models to study the timeliness of vaccination.

61
4.1. Logistic regressionLogistic regression models make it possible to study discontinuous dichotomous or qualitative variables, such as:
� Vaccine administered or not administered. � Timely or late administration. � Simultaneous or not simultaneous vaccination.
4.2. Cox proportional hazards modelCriteria for assessing the time elapsed up to the event (Cox regression) include:
� Application of a given individual dose. � Completion of the series.
4.3. Poisson regressionPoisson regression is used to calculate group data rates. When modeling techniques are applied to vaccination data, the strategy usually involves: 1. Selecting covariates to be modeled, depending on the study design and available data. Timeliness models in the literature
include the following elements: � Factors related to the child or family (i.e., education of the mother, socioeconomic status). � Factors related to an individual professional or health facility (i.e., a public or private facility directed by a physician,
nurse, or another type of vaccinator). � Factors related to the community (i.e., region, urban or rural residence, violence in the community).
2. Verifying assumptions for the type of model.3. Evaluating interaction and confounding factors. 4. Verifying the final model’s goodness of fit.
When modeling is used to analyze vaccination, remember that the dates of a series of doses are not independent of the dates of previous doses in the same series—i.e., timeliness models must include dates of the previous doses, whether or not they were timely. To address this problem, investigators in previous studies have variables like administration of the entire series or
time required to complete the series, in lieu of individual doses (26).
Though surveys provide valuable data for different analyses, teams must also consider the study’s sampling design, representativeness, and data quality in order to understand the evaluation’s scope and limitations and appropriately interpret the results.

62
Annex 1. Weighted samplesWeighting is calculated as a function of the sampling procedure and the probability of being selected for the survey at each step. It varies in each situation. The old WHO’s 30x7 cluster survey design assumed that the sample is self-weighting. As statistical methods and expertise have rapidly improved, the 2015 WHO Vaccination Coverage Survey Manual, now recommends probability sampling and weighed analysis. The initial weighting can be adjusted by taking into account the refusal rate and then normalizing it to the sample, such that it is consistent with population totals from external data sources. To read more, read the 2015 WHO Vaccination Coverage Survey Manual.
Annexes
In country A, investigators in the capital region used different methods for selecting participants than did investigators elsewhere in the country. Children in all areas did not the same probability of being selected for the survey. The survey is weighted to correct these differences. In country A, all children in each home meeting the age criteria were included. As a result, weighting was not necessary. However, if one child in each home had been randomly selected, weighting would have been needed (3).
Weighting in demographic and health surveysIn DHS studies, participants are selected using a household sampling design, which is usually stratified and done in two stages. Four types of variables must be used when statistical indices are used to represent the entire survey population: the primary sampling unit, cluster, stratum, and weight. The dataset includes these variables. Once weighted, DHS data are representative of the study area’s entire population. When measurements are calculated by population subgroups, command variables are included in the dataset. Weighting is needed in the analyses only when the study team wishes to calculate statistical indices representative of the entire population.
Basic weighting of the sample 1 Sampling probability
Where: � The sampling probability is the probability of selecting each individual person. � The sampling probability is the product of the probabilities of selection at each stage of sampling.

63
Annex 2. Design effect
If the evaluating team is working with a cluster design and wishes to achieve the same level of precision that would be achieved in a simple random sample, the sample size must be increased.
In general, the WHO recommends a design effect of 2 in surveys with seven children in each cluster, unless previous survey data suggest a smaller or larger design effect. The design effect varies depending on different factors.
Before conducting the survey, an assumption of the design effect is used to determine the necessary sample size to compensate for the type of sampling. The observed design effect is used to calculate the intracluster correlation at the time of analysis.
Calculation of the sample size, keeping in mind the design effectThe formula below is used to calculate the simple size:
n = no x EDWhere:
� no: is the sample size calculated in example 2 � ED is the design effect (usually 2)
Example: Country A used a design effect of 1.5 due to information from previous surveys. The calculation is:
2,400 x 1.5 = 3,600 children needed for the survey
Estimate of variance taking cluster sampling into account Basic formula for the design effectEstimate of variance in a simple random sample

64
Annex 3. Intracluster correlationIntracluster correlation, or intraclass correlation, is a statistical characteristic showing whether the measurements of interest tend to be more similar among participants in a given cluster. Higher correlations indicate greater similarity, and therefore less information will be obtained if more participants from the same cluster are selected. The result is a larger design effect. Intracluster correlation can be calculated based on survey data using the observed design effect and the average number of responses on each cluster (3).
Although old cluster surveys usually were assumed to have a design effect of 2, intracluster correlation is useful in documenting the design needs and sample size of future surveys measuring the same factors. Of note, the correlation is a characteristic of the population and not of the study design.
Calculation of the Intracluster CorrelationFormula for the intracluster correlation:
Design effect [minus] 1= Intracluster correlation
Average responses per cluster [minus] 1
1.7734 design effect for the MMR vaccine [minus] 1= 0.100
average of 8.7 children per cluster
Example of intracluster correlation for the MMR vaccine:
In a 30x7 survey design, the intracluster correlation was expected to be nearly 0.167. Since this correlation is a characteristic of the population and is specific for the vaccine and dose being measured, there may be considerable variability in this value among countries, age groups, and vaccines.

65
Annex 4. Steps for creating inverted Kaplan-Meier curves using the R statistical programThe steps for creating inverted Kaplan-Meier figures using R, a free statistical program that provides a wide range of tools for building analytical models and generating a variety of figures, are described below.
Words in bold correspond to the names of the variables or the location of files that are specific to the situation under evaluation. These words can be changed without affecting the code itself.
The symbol # indicates comments in the code. When this symbol appears, R understands that the text is not an instruction and the program is not affected.
To create Kaplan-Meier figures using subpopulations, sufficient data for each subpopulation is needed. An adequate amount of data is at least one child each from 13 different clusters in each subpopulation. For more information on limitations, please see: http:/www.cdc.gov/nchs/tutorials/NHANES/Surveydesign/VarianceEstimation/Info3. htm
Figure 1#################################################################### Syntax: Country A KM Analysis.R
# Country A data is a stratified cluster survey# Objective: KM curves to describe time to vaccination
# date created May 07 2014# date modified May 08 2014################################################################################Step 1: call in the R programs we will need.library(foreign)library(gplots)library(lattice)library(RGraphics)library(stats)library(plotrix)library(ICC)library(ggplot2)library(survey)library(survival)library(Hmisc)
################################################################################################################Step 2: read in csv file to R data.frame#below in bold, include the location where the CSV file is saved on your computer or network.
data1 <- read.csv("//file/location/km_CountryA.csv", header=TRUE, sep=",")
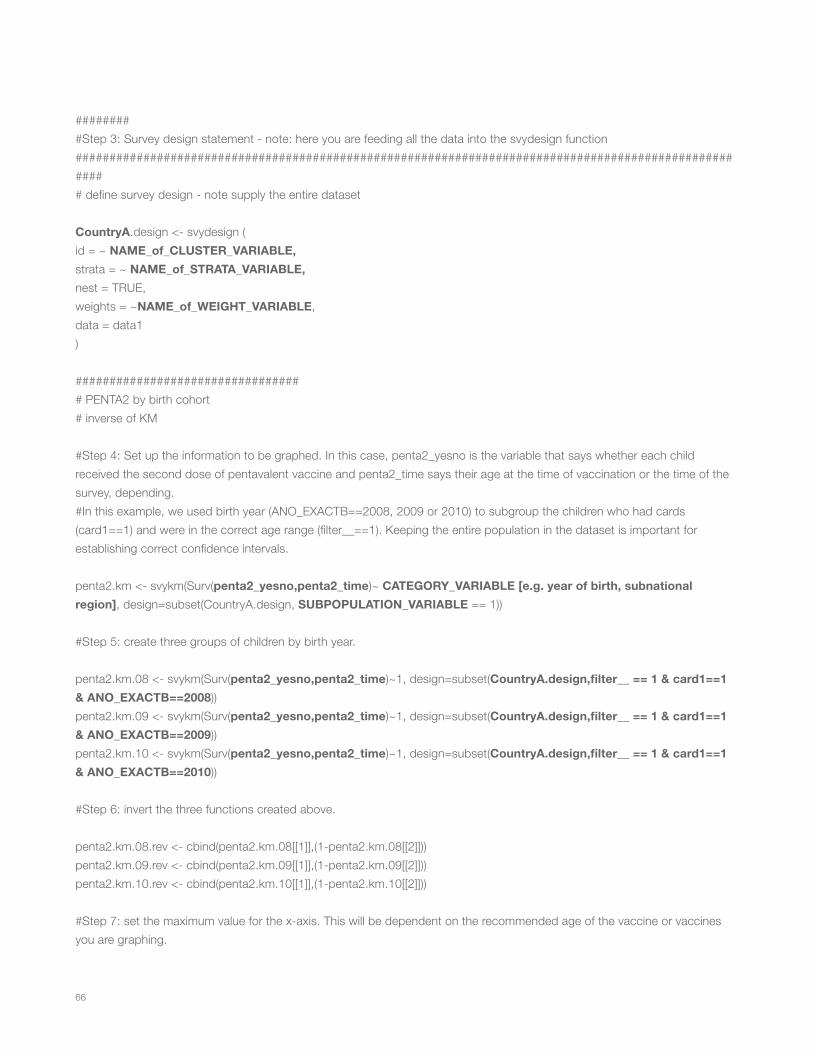
66
#########Step 3: Survey design statement - note: here you are feeding all the data into the svydesign function###################################################################################################### define survey design - note supply the entire dataset
CountryA.design <- svydesign (id = ~ NAME_of_CLUSTER_VARIABLE,strata = ~ NAME_of_STRATA_VARIABLE,nest = TRUE,weights = ~NAME_of_WEIGHT_VARIABLE,data = data1)
################################## PENTA2 by birth cohort# inverse of KM
#Step 4: Set up the information to be graphed. In this case, penta2_yesno is the variable that says whether each child received the second dose of pentavalent vaccine and penta2_time says their age at the time of vaccination or the time of the survey, depending.#In this example, we used birth year (ANO_EXACTB==2008, 2009 or 2010) to subgroup the children who had cards (card1==1) and were in the correct age range (filter__==1). Keeping the entire population in the dataset is important for establishing correct confidence intervals.
penta2.km <- svykm(Surv(penta2_yesno,penta2_time)~ CATEGORY_VARIABLE [e.g. year of birth, subnational region], design=subset(CountryA.design, SUBPOPULATION_VARIABLE == 1))
#Step 5: create three groups of children by birth year.
penta2.km.08 <- svykm(Surv(penta2_yesno,penta2_time)~1, design=subset(CountryA.design,filter__ == 1 & card1==1 & ANO_EXACTB==2008))penta2.km.09 <- svykm(Surv(penta2_yesno,penta2_time)~1, design=subset(CountryA.design,filter__ == 1 & card1==1 & ANO_EXACTB==2009))penta2.km.10 <- svykm(Surv(penta2_yesno,penta2_time)~1, design=subset(CountryA.design,filter__ == 1 & card1==1 & ANO_EXACTB==2010))
#Step 6: invert the three functions created above.
penta2.km.08.rev <- cbind(penta2.km.08[[1]],(1-penta2.km.08[[2]]))penta2.km.09.rev <- cbind(penta2.km.09[[1]],(1-penta2.km.09[[2]]))penta2.km.10.rev <- cbind(penta2.km.10[[1]],(1-penta2.km.10[[2]]))
#Step 7: set the maximum value for the x-axis. This will be dependent on the recommended age of the vaccine or vaccines you are graphing.

67
max.mos <- 18
#Step 8: Plot the first group.#lwd is the width of the line being plotted; this is modifiable#lty is the type of the line (i.e. dotted, solid, etc.); this is modifiable#col is the color of the line; this is modifiable#ylab is the label of the y axis. The most accurate description is “Probability of being vaccinated”.#xlab is the label of the x axis, "Age (months) at Vaccination"#ylim and xlim create the parameters of the plot. You created the max months in step 7.
plot(penta2.km.08.rev,lwd=2,lty=1,col="deepskyblue2",ylab="Probability of being vaccinated",xlab="Age (months) at Vaccination",ylim=c(0,1), xlim=c(0,(30.5*max.mos)),xaxt="n",yaxt="n",type="n")axis(1, at=seq(0,(30.5*max.mos),30.5), labels=seq(0,max.mos,1))axis(2, at=seq(1,0,-.1), labels=seq(1,0,-.1))
#Step 9: add a box to show target age period. We used the recommended age of administration until 30.5 days after the recommended age. In some situations, you may want to use other sizes of box.#col is the color of shading in the box; this is modifiable.
min.age <- 4*30.5max.age <- 5*30.5rect(min.age,-0.04,max.age,1.04,col="gray95")
#Step 10: plot the inverse KM function for all three groups.#Again, lwd, lty and col all change the appearance of the lines and can be modified.
lines(penta2.km.08.rev,lwd=2,lty=1,col="gray8")lines(penta2.km.09.rev,lwd=2,lty=1,col="gray70")lines(penta2.km.10.rev,lwd=2,lty=1,col="gray45")
#Step 11: create the title for the entire plot.
title("Time to receipt of pentavalent 2 by birth cohort.Country A Coverage Survey, 2011.")
#Step 12: create the legend for the image. The line color should match Step 10 above and be in the same order.
leg.lab <- c("2008","2009","2010")legend(5,1,legend=leg.lab,lwd=2,lty=1,col=c("gray30","gray70","gray50"),ncol=1,bty="o",cex=0.8)

68
Figure 2#################################################################### Syntax: Country A KM Analysis.R
# Country A data is a stratified cluster survey# Objective: KM curves to describe time to vaccination with confidence intervals
# date created 29JUL2013# date modified 31JUL2013################################################################################Step 1: call in the R programs we will need.
library(ggplot2)library(survey)library(survival)
################################################################################################################Step 2: read in csv file to R data.frame#below, enter in the location where the CSV file is saved on your computer or network.
data1 <- read.csv("//file/location/km_CountryA.csv", header=TRUE, sep=",")
######### Survey design statement - note: here you are feeding all the data into the svydesign function######################################################################################################Step 3: define survey design - note supply the entire dataset
CountryA.design <- svydesign (id = ~ NAME_of_CLUSTER_VARIABLE,strata = ~ NAME_of_STRATA_VARIABLE,nest = TRUE,weights = ~ NAME_of_WEIGHT_VARIABLE,data = data1)
################################################################################################# Penta 2 - calculate among those age eligible (filter__=1) for penta 2 and stratify by birth cohort
#Step 4: call svykm function
penta2.km <- svykm(Surv(penta2_yesno,penta2_time)~ CATEGORY_VARIABLE [e.g. year of birth, subnational region], design=subset(CountryA.design, SUBPOPULATION_VARIABLE == 1, se=TRUE))

69
#################################################################################################break up the output components to each stratum##################################Step 5: 2008 children
penta2.km.08 <- svykm(Surv(penta2_yes_no,penta2_time)~1, design=subset(CountryA.design,filter__ == 1 & card1==1 & ANO_EXACTB==2008), se=TRUE)
#Step 6: rescale to months
r1.time1 <- penta2.km.08[[1]]/30.5
#Step 7: Create the function you want to plot, in this case the time to penta 2 vaccination among children born in 2008
r1.s.t1 <- penta2.km.08[[2]]
#Step 8: Create the variance of the function; this will be used to calculate the confidence intervals
r1.var1 <- penta2.km.08[[3]]
#Step 9: calculate confidence intervals - NOTE THESE ARE NOT CONFIDENCE BANDSr1.lcl1 <- r1.s.t1*exp(-1.96*sqrt(r1.var1))r1.ucl1 <- r1.s.t1*exp(1.96*sqrt(r1.var1))
#Step 10: Invert the function and its confidence intervalsr1.s.t1.inv <- 1 - r1.s.t1r1.ucl1.inv <- 1 - r1.lcl1r1.lcl1.inv <- 1 - r1.ucl1
#Step 11: label the group, in this case the 2008 birth cohort.
cohort1 <- "2008”
#Step 12: create a data frame of these results including indicators for defining panels.
#In bold below, you can change the name to match the vaccine and dose being plotted. It is also important to correctly name the cohort. It is important that the names match those in step 17 below and that the words are in all CAPITAL LETTERS.
r1.cohort1 <- data.frame(cbind(r1.time1,r1.s.t1.inv,r1.lcl1.inv,r1.ucl1.inv),"PENTAVALENT DOSE 2","2008")colnames(r1.cohort1) <- c("time","prob","lcl","ucl","vacc","grp")
################################## 2009 children

70
#Step 13: repeat steps 5-12 for the next subpopulation, in this case the 2009 birth cohort. Again, variables and labels that can be renamed are in bolded font.
penta2.km.09 <- svykm(Surv(penta2_yes_no,penta2_time)~1, design=subset(CountryA.design,filter__ == 1 & card1==1 & ANO_EXACTB==2009), se=TRUE)
r1.time2 <- penta2.km.09[[1]]/30.5 #note rescaling to months r1.s.t2 <- penta2.km.09[[2]]r1.var2 <- penta2.km.09[[3]]
#calculate confidence intervals - NOTE THESE ARE NOTE CONFIDENCE BANDS
r1.lcl2 <- r1.s.t2*exp(-1.96*sqrt(r1.var2))r1.ucl2 <- r1.s.t2*exp(1.96*sqrt(r1.var2))
#Invert the function and its confidence limits
r1.s.t2.inv <- 1 - r1.s.t2r1.ucl2.inv <- 1 - r1.lcl2r1.lcl2.inv <- 1 - r1.ucl2
#label cohort
cohort2 <- "2009"
#create a data frame of these results including indicators for defining panels
r1.cohort2 <- data.frame(cbind(r1.time2,r1.s.t2.inv,r1.lcl2.inv,r1.ucl2.inv),"PENTAVALENT DOSE 2","2009")colnames(r1.cohort2) <- c("time","prob","lcl","ucl","vacc","grp")
################################## 2010 children#Step 14: Repeat steps 5-12 again for the 2010 birth cohort. Again, variables and labels that can be renamed are in bolded font.
penta2.km.10 <- svykm(Surv(penta2_event,penta2)~1, design=subset(parag.design,filter__ == 1 & card1==1 & ANO_EXACTB==2010), se=TRUE)
r1.time3 <- penta2.km.10[[1]]/30.5 #note rescaling to months #KAW you have not stratified your data so can drop the [[1]] from each of these 3 linesr1.s.t3 <- penta2.km.10[[2]]r1.var3 <- penta2.km.10[[3]]
#calculate confidence intervals - NOTE THESE ARE NOTE CONFIDENCE BANDS

71
r1.lcl3 <- r1.s.t3*exp(-1.96*sqrt(r1.var3))r1.ucl3 <- r1.s.t3*exp(1.96*sqrt(r1.var3))
#invert the function and its confidence intervals
r1.s.t3.inv <- 1 - r1.s.t3r1.ucl3.inv <- 1 - r1.lcl3r1.lcl3.inv <- 1 - r1.ucl3
#label cohort
cohort3 <- "2010"
# create a data frame of these results including indicators for defining panels
r1.cohort3 <- data.frame(cbind(r1.time3,r1.s.t3.inv,r1.lcl3.inv,r1.ucl3.inv),"PENTAVALENT DOSE 2","2010")colnames(r1.cohort3) <- c("time","prob","lcl","ucl","vacc","grp")
####################################################################################################Step 15: combine all results into a single data frame
rota.df <- rbind(r1.cohort1,r1.cohort2, r1.cohort3)
###################################################################################################Step 16: data frame to create the gray box on each panel showing the recommended age of administration# the graph will have 3 panels for the, three age groups, so need a data frame with information on the box for each panel# each box will have 4 rows indicating the coordinates of each of the 4 corners - therefore dataframe has 12 rows
#This part creates the grey box. The coordinates for Penta 2 (xval,yval of lower left corner, xval,yval of top left, xval,yval of upper right, xval,yval lower right)
r1.corners <- matrix (c(4,0,4,1,5,1,5,0),byrow=T,ncol=2)
#This part pulls together all of the information for the data frames for each subgroup.
r11.df <- data.frame(r1.corners,"PENTAVALENT DOSE 2","2008")names(r11.df) <- c("time","yval","vacc","grp")
r12.df <- data.frame(r1.corners,"PENTAVALENT DOSE 2","2009")names(r12.df) <- c("time","yval","vacc","grp")

72
r13.df <- data.frame(r1.corners,"PENTAVALENT DOSE 2","2010")names(r13.df) <- c("time","yval","vacc","grp")
#This part arranges the three data frames in a row
box <- rbind(r11.df,r12.df,r13.df)names(box) <- c("time","yval","vacc","grp")
##############Step 17: define the maximum number of months to display on x-axismax.mos <- 18
############################################################################
#Step 18 (optional): Tell R where to save a PDF of the image you are creating. To use, simply delete the ‘#’ in front of ‘pdf…’ and in front of ‘dev.off()’ in the last line of code#The alternate way to save once the image is created is in the File menu -> Save As. The image can be saved as a pdf, jpeg, or other file type.
#pdf(paste(path,"El Salvador Rota 1 Inverse KM Curves Example.pdf",sep=""),width=9,height=7)
#Step 19: Plot the three images#Below in bold are the labels for the x and y axis and the title for the graph. These are modifiable.
g <- ggplot(rota.df, aes(time, prob))g + facet_grid(vacc~grp) + geom_polygon(data=box,aes(x=time, y=yval,size=0),show_guide=FALSE,alpha=0.2) + geom_step(size=0.8) + coord_cartesian(xlim=c(0,max.mos), ylim = c(0, 1)) + geom_point(aes(time,ucl),size=(0.4)) + geom_point(aes(time,lcl),size=(0.4)) + theme_bw() + theme(axis.text.x = element_text(size=7), axis.text.y = element_text(size=7)) + scale_x_continuous(breaks=c(6,12,18,24,30,36)) + scale_y_continuous(breaks=seq(0.2,1,0.2)) + labs(x="Age (months) at Vaccination") + labs(y="Probability of being vaccinated") + ggtitle ("Time to receipt of pentavalent 2 by birth cohort.Country A Coverage Survey, 2011.")
#dev.off()

73
Annex 5. Steps for analyzing vaccination coverage surveys using SAS statistical softwareThe steps presented here provide an option to help analyze vaccination coverage surveys using SAS statistical software.
/************************************************************************SAS file: CountryA.SASAnalysis of data from national immunization coverage survey, CountryA
Date created: March 11, 2013Import: VIVIPAIFINAL-ENE-12.sav POBLAFINALENE-12.sav SAS dataset: VIVI.SD2 POB.SD2Last modified: July 10, 2013
*************************************************************************/
libname a "\\cdc.gov\private\countrya\data";libname library "\\cdc.gov\private\countrya\data";
/********************************************************************DATA STEP********************************************************************/
data hhchild;set hhchild;
*set age values less than 12 months to missing; if EDAD_EXACTA_MESES lt 12 then EDAD_EXACTA_MESES=.;
*recode ineligible children as excluded; if filter__=0 then filter__=.;
/*_____________________________________________________________*/
*recode dose administration dates as single YYYYMMDD variable;
/*_____________________________________________________________*/
*fecha nacimiento; dob= mdy (mess_exactb,dia_exactb,ano_exactb);

74
*bcg; bcg_admin = mdy (bcg_mes,bcg_dia,bcg_ano);
*polio; polio1_admin = mdy (antipolio_mes,antipolio_dia,antipolio_ano);
polio2_admin = mdy (antipolio2_mes,antipolio2_dia,antipolio2_ano);
polio3_admin = mdy (antipolio3_mes,antipolio3_dia,antipolio3_ano);
polio4_admin = mdy (antipolior_mes,antipolior_dia,antipolior_ano);
*rota; rota1_admin = mdy (rotavirus_mes,rotavirus_dia,rotavirus_ano);
rota2_admin = mdy (rotavirus2_mes,rotavirus2_dia,rotavirus2_ano);
*penta; penta1_admin = mdy (penta_mes,penta_dia,penta_ano);
penta2_admin = mdy (penta2_mes,penta2_dia,penta2_ano);
penta3_admin = mdy (penta3_mes,penta3_dia,penta3_ano);
*mmr; spr_admin = mdy (spr_mes,spr_dia,spr_ano);
*yellow fever; aa_admin = mdy (amarilla_mes,amarilla_dia,amarilla_ano);
*dtp; dpt_admin = mdy (dpt_mes,dpt_dia,dpt_ano); *date survey was administered ; survey_admin = mdy (MES_EXACTA,DDIA_EXACTA,ANO_EXACTA);
*formate all sas dates ; format dob bcg_admin polio1_admin polio2_admin polio3_admin polio4_admin penta1_admin penta2_admin penta3_admin rota1_admin rota2_admin spr_admin aa_admin dpt_admin survey_admin date9.;
*calculate age at time of survey; *this should be repeated for all antigens to get the age at vaccination for each child and each vaccine; age=survey_admin-dob;

75
*create a variable for children 2 or older at time of survey; if (age) lt 730 then under2=0; else under2=1;
**Create a variable for children age eligible for 18 month vaccines***;
if EDAD_EXACTA_MESES=. then booster_elig=.; else if EDAD_EXACTA_MESES lt 18 then booster_elig=0; else if EDAD_EXACTA_MESES ge 18 then booster_elig=1;
***Create a variable for children born after rota introduction***; if ano_exactb=1 then rota_avail=.; else if ano_exactb lt 2010 then rota_avail=0; else if ano_exactb ge 2010 then rota_avail=1;
/*_____________________________________________________________*/
*create variable for vaccinated/not vaccinated for each vaccine;
/*_____________________________________________________________*/
*BCG; if bcg_admin=. then bcg_carnet=.; if BCG_carnet=. then BCG=0; else if BCG_carnet=9 then BCG=0; else BCG=1;
*polio 1; if polio1_admin=. then antipolio_carnet=.; if antipolio_carnet=. then polio1 = 0; else if antipolio_carnet = 9 then polio1 = 0; else polio1 = 1;
*polio 2; if polio2_admin=. then antipolio2_carnet=.; if antipolio2_carnet=. then polio2 = 0; else if antipolio2_carnet = 9 then polio2 = 0; else polio2 = 1;
*polio 3; if polio3_admin=. then antipolio3_carnet=.;

76
if antipolio3_carnet=. then polio3 = 0; else if antipolio3_carnet = 9 then polio3 = 0; else polio3 = 1;
*polio booster; if polio4_admin=. then antipolior_carnet=.; if antipolior_carnet=. then polio4 = 0; else if antipolior_carnet = 9 then polio4 = 0; else polio4 = 1;
*penta 1; if penta1_admin=. then penta_carnet=.; if penta_carnet=. then penta1 = 0; else if penta_carnet = 9 then penta1 = 0; else penta1 = 1;
*penta 2; if penta2_admin=. then penta2_carnet=.; if penta2_carnet=. then penta2 = 0; else if penta2_carnet = 9 then penta2 = 0; else penta2 = 1;
*penta 3; if penta3_admin=. then penta3_carnet=.; if penta3_carnet=. then penta3 = 0; else if penta3_carnet = 9 then penta3 = 0; else penta3 = 1;
*rota 1; if rota1_admin=. then rotavirus_carnet=.; if rotavirus_carnet=. then rota1 = 0; else if rotavirus_carnet = 9 then rota1 = 0; else rota1 = 1;
*rota 2; if rota2_admin=. then rotavirus2_carnet=.; if rotavirus2_carnet=. then rota2 = 0; else if rotavirus2_carnet = 9 then rota2 = 0; else rota2 = 1;
*MMR = SPR; if spr_admin=. then spr_carnet=.; if spr_carnet=. then spr = 0; else if spr_carnet = 9 then spr = 0; else spr = 1;

77
*yellow fever= amarilla/AA; if aa_admin=. then amarilla_carnet=.; if amarilla_carnet=. then aa = 0; else if amarilla_carnet = 9 then aa = 0; else aa = 1;
*DTP = DPT; if dpt_admin=. then dpt_carnet=.; if DPT_carnet=. then dpt = 0; else if dpt_carnet = 9 then dpt = 0; else dpt = 1;
/*_____________________________________________________________*/
*Validity variables;
/*_____________________________________________________________*/
*BCG;if bcg=0 then bcg_valid=0;else if bcg_age ge 0 then bcg_valid=1;else bcg_valid=0;
*POLIO;if polio1=0 then polio1_valid=0;else if polio1_age ge 42 then polio1_valid=1;else polio1_valid=0;
if polio2=0 then polio2_valid=0;else if polio2_age-polio1_age lt 28 then polio2_valid=0;else if polio2_age lt 70 then polio2_valid=0;else polio2_valid=1;
if polio3=0 then polio3_valid=0;else if polio3_age-polio2_age lt 28 then polio3_valid=0;else if polio3_age lt 98 then polio3_valid=0;else polio3_valid=1;
*PENTA;if penta1=0 then penta1_valid=0;else if penta1_age ge 42 then penta1_valid=1;else penta1_valid=0;

78
if penta2=0 then penta2_valid=0;else if penta2_age-penta1_age lt 29 then penta2_valid=0;else if penta2_age lt 70 then penta2_valid=0;else penta2_valid=1;
if penta3=0 then penta3_valid=0;else if penta3_age lt 98 then penta3_valid=0;else if penta3_age-penta2_age lt 28 then penta3_valid=0;else penta3_valid=1;
*ROTA;if rota1=0 then rota1_valid=0;else if rota1_age lt 42 then rota1_valid=0;else if rota1_age gt 104 then rota1_valid=0;else rota1_valid=1;
if rota2=0 then rota2_valid=0;else if rota2_age lt 70 then rota2_valid=0;else if rota2_age gt 223 then rota2_valid=0;else if rota2_age-rota1_age lt 28 then rota2_valid=0;else rota2_valid=1;
*12 month VACCINES;
if spr=0 then spr_valid=0;else if spr_age-aa_age gt 0 and spr_age-aa_age lt 28 then spr_valid=0;else if spr_age lt 270 then spr_valid=0;else spr_valid=1;
if aa=0 then aa_valid=0;else if aa_age-spr_age gt 0 and aa_age-spr_age lt 28 then aa_valid=0;else if aa_age lt 270 then aa_valid=0;else aa_valid=1;
*18 month vaccines;
if dpt=0 then dpt_valid=0;else if dpt_age lt 365 then dpt_valid=0;else if penta3=1 and dpt_age-penta3_age lt 181 then dpt_valid=0;else dpt_valid=1;
if dpt=0 then dpt_table=0;else if dpt_age lt 365 then dpt_table=1;else if penta3=1 and dpt_age-penta3_age lt 181 then dpt_table=2;else dpt_table=3;

79
/*_____________________________________________________________*/
*Coverage variables= valid doses that were not late;
/*_____________________________________________________________*/
*BCG;if bcg_valid=0 then bcg_cover=0;else if bcg_age gt 364 then bcg_cover=0;else bcg_cover=1;
*POLIO;if polio1_valid=0 then polio1_cover=0;else if polio1_age gt 364 then polio1_cover=0;else polio1_cover=1;
if polio2_valid=0 then polio2_cover=0;else if polio2_age gt 364 then polio2_cover=0;else polio2_cover=1;
if polio3_valid=0 then polio3_cover=0;else if polio3_age gt 364 then polio3_cover=0;else polio3_cover=1;
*PENTA;if penta1_valid=0 then penta1_cover=0;else if penta1_age gt 364 then penta1_cover=0;else penta1_cover=1;
if penta2_valid=0 then penta2_cover=0;else if penta2_age gt 364 then penta2_cover=0;else penta2_cover=1;
if penta3_valid=0 then penta3_cover=0;else if penta3_age gt 364 then penta3_cover=0;else penta3_cover=1;
*ROTA;if rota1_valid=0 then rota1_cover=0;else rota1_cover=1;
if rota2_valid=0 then rota2_cover=0;else rota2_cover=1;
*12 month VACCINES;

80
if spr_valid=0 then spr_cover=0;else if spr_age gt 730 then spr_cover=0;else spr_cover=1;
if aa_valid=0 then aa_cover=0;else if aa_age gt 730 then aa_cover=0;else aa_cover=1;
*18 month vaccines;
if polio4_valid=0 then polio4_cover=0;else if polio4_age gt 730 then polio4_cover=0;else polio4_cover=1;
if dpt_valid=0 then dpt_cover=0;
else if dpt_age gt 730 then dpt_cover=0;else dpt_cover=1;
/*_____________________________________________________________*/
*Timeliness variables;
/*_____________________________________________________________*/
*BCG;if bcg_cover=0 then bcg_timely=0;else if bcg_age lt 31 then bcg_timely=1;else bcg_timely=0;
*POLIO;if polio1_cover=0 then polio1_timely=0;else if polio1_age lt 91 then polio1_timely=1;else polio1_timely=0;
if polio2_cover=0 then polio2_timely=0;else if polio2_age lt 151 then polio2_timely=1;else polio2_timely=0;
if polio3_cover=0 then polio3_timely=0;else if polio3_age lt 211 then polio3_timely=1;else polio3_timely=0;

81
*PENTA;if penta1_cover=0 then penta1_timely=0;else if penta1_age lt 91 then penta1_timely=1;else penta1_timely=0;
if penta2_cover=0 then penta2_timely=0;else if penta2_age lt 151 then penta2_timely=1;else penta2_timely=0;
if penta3_cover=0 then penta3_timely=0;else if penta3_age lt 211 then penta3_timely=1;else penta3_timely=0;
*ROTA;if rota1_cover=0 then rota1_timely=0;else if rota1_age lt 91 then rota1_timely=1;else rota1_timely=0;
if rota2_cover=0 then rota2_timely=0;else if rota2_age lt 151 then rota2_timely=1;else rota2_timely=0;
*12 month VACCINES;
if spr_cover=0 then spr_timely=0;else if spr_age lt 396 then spr_timely=1;else spr_timely=0;
if aa_cover=0 then aa_timely=0;else if aa_age lt 396 then aa_timely=1;else aa_timely=0;
*18 month vaccines;
if polio4_cover=0 then polio4_timely=0;else if polio4_age lt 578 then polio4_timely=1;else polio4_timely=0;
if dpt_cover=0 then dpt_timely=0;else if dpt_age lt 578 then dpt_timely=1;else dpt_timely=0;
/*_____________________________________________________________*/

82
*percent of children in each category of timeliness;
/*_____________________________________________________________*/
if bcg=0 then bcg_oportuna=0;else if bcg_valid=0 then bcg_oportuna=1;else if bcg_cover=0 then bcg_oportuna=4;else if bcg_timely=0 then bcg_oportuna=3;else bcg_oportuna=2;
if polio1=0 then polio1_oportuna=0;else if polio1_valid=0 then polio1_oportuna=1;else if polio1_cover=0 then polio1_oportuna=4;else if polio1_timely=0 then polio1_oportuna=3;else polio1_oportuna=2;
if polio2=0 then polio2_oportuna=0;else if polio2_valid=0 then polio2_oportuna=1;else if polio2_cover=0 then polio2_oportuna=4;else if polio2_timely=0 then polio2_oportuna=3;else polio2_oportuna=2;
if polio3=0 then polio3_oportuna=0;else if polio3_valid=0 then polio3_oportuna=1;else if polio3_cover=0 then polio3_oportuna=4;else if polio3_timely=0 then polio3_oportuna=3;else polio3_oportuna=2;
if penta1=0 then penta1_oportuna=0;else if penta1_valid=0 then penta1_oportuna=1;else if penta1_cover=0 then penta1_oportuna=4;else if penta1_timely=0 then penta1_oportuna=3;else penta1_oportuna=2;
if penta2=0 then penta2_oportuna=0;else if penta2_valid=0 then penta2_oportuna=1;else if penta2_cover=0 then penta2_oportuna=4;else if penta2_timely=0 then penta2_oportuna=3;else penta2_oportuna=2;
if penta3=0 then penta3_oportuna=0;else if penta3_valid=0 then penta3_oportuna=1;else if penta3_cover=0 then penta3_oportuna=4;else if penta3_timely=0 then penta3_oportuna=3;else penta3_oportuna=2;

83
if rota1=0 then rota1_oportuna=0;else if rota1_age lt 42 then rota1_oportuna=1;else if rota1_age gt 105 then rota1_oportuna=4;else if rota1_timely=0 then rota1_oportuna=3;else rota1_oportuna=2;
if rota2=0 then rota2_oportuna=0;else if rota2_age lt 70 or rota2_age-rota1_age lt 28 then rota2_oportuna=1;else if rota2_age gt 223 then rota2_oportuna=4;else if rota2_timely=0 then rota2_oportuna=3;else rota2_oportuna=2;
if spr=0 then spr_oportuna=0;else if spr_valid=0 then spr_oportuna=1;else if spr_cover=0 then spr_oportuna=4;else if spr_timely=0 then spr_oportuna=3;else spr_oportuna=2;
if aa=0 then aa_oportuna=0;else if aa_valid=0 then aa_oportuna=1;else if aa_cover=0 then aa_oportuna=4;else if aa_timely=0 then aa_oportuna=3;else aa_oportuna=2;
if dpt=0 then dpt_oportuna2=0;else if dpt_age lt 365 then dpt_oportuna2=1;else if penta3=1 and dpt_age-penta3_age lt 181 then dpt_oportuna2=1;else if dpt_age gt 729 then dpt_oportuna2=3;else if dpt_age gt 577 then dpt_oportuna2=3;else dpt_oportuna2=2;
if polio4=0 then polio4_oportuna=0;else if polio4_valid=0 then polio4_oportuna=1;else if polio4_cover=0 then polio4_oportuna=4;else if polio4_timely=0 then polio4_oportuna=3;else polio4_oportuna=2;
/*_____________________________________________________________*/
*simulatneous administration analysis variables;
/*_____________________________________________________________*/

84
*ovp1 v. penta 1; if polio1=0 or penta1=0 then poliopenta1=.; else if polio1_admin=penta1_admin then poliopenta1=1; else poliopenta1=0;
*OPV2 v. penta2; if polio2=0 or penta2=0 then poliopenta2=.; else if POLIO2_admin=PENTA2_admin then poliopenta2=1; else poliopenta2=0;
*opv3 v. penta3; if polio3=0 or penta3=0 then poliopenta3=.; else if POLIO3_admin=PENTA3_admin then poliopenta3=1; else poliopenta3=0;
*rota1 v. opv1 or penta1;
if rota1=0 then simul1=.; else if penta1=0 and polio1=0 then simul1=.; else if POLIO1_admin=rota1_admin then simul1=1; else if rota1_admin=PENTA1_admin then simul1=1; else simul1=0;
if rota2=0 then simul2=.; else if penta2=0 and polio2=0 then simul2=.; else if POLIO2_admin=rota2_admin then simul2=1; else if rota2_admin=PENTA2_admin then simul2=1; else simul2=0;
**PENTA2/ROTA2**;
if rota_avail=0 then pentarota2=.; else if rota2=0 then pentarota2=.; else if penta2=0 then pentarota2=.; else if rota2_admin=PENTA2_admin then pentarota2=1; else pentarota2=0;
**MMR/YF**;
if spr=0 then spraa=.; else if aa=0 then spraa=.; else if spr_admin=aa_admin then spraa=1; else spraa=0;

85
**Boosters**;
if dpt=0 then booster_simul=.; else if polio4=0 then booster_simul=.; else if dpt_admin=polio4_admin then booster_simul=1; else booster_simul=0;
run;
*here is an example of a proc surveyfreq statement;*it provides percentages of a given variable’s values accounting for survey design;*this statement can be modified for any categorical variable; *polio; proc surveyfreq data=hhchild nomcar; *hhchild is the name of the dataset; strata stratum; *stratum is the name of the strata from the survey design; cluster upm; *upm is the name of the cluster variable from the survey design; weight adj_wt; *adj_wt is the name of the weight variable for this data set; tables filter__*polio1_time/row(deff) cl nowt ; *filter__ is the variable name for children in the target age group of the survey; *polio1_time is the variable name that describes how many children received a valid, timely first dose of polio run;*the code below shows how to calculate quartiles for age of administration;*first, sort the dataset by the groups you are interested in;*here, we sort by children who received rotavirus vaccine, children in the target age group, and children born after rota introduction;proc sort data=hhchild;by filter__ rota_avail rota1;run;
*next, use proc surveymeans to calculate the quartiles for age of administration;proc surveymeans data=hhchild quartiles;*the strata variable from the survey design is called stratum;stratum stratum;*the variable we want the median for is rota1_age, that is age of administration for rota1;var rota1_age;*we sort by the variables in the sort statement above;*we will only report the results for the children in the target age group, born after rota introduction who received rota1;by filter__ rota_avail rota1;*adj_wt is the name of the weight variable;weight adj_wt;run;

86
References1. Pan American Health Organization. Vaccinate your family. Protect your community. Meeting of the Technical Advisory Group on Vaccine-Pre-
ventable Diseases (TAG), Buenos Aires, July 2011. Available from: http://www.paho.org/hq/index.php?option=com_docman&task=doc_download&gid=14164&Itemid=&lang=en
2. United States Agency for International Development. Immunization essentials: A practical field guide. Washington, DC: USAID; 2003. Avail-able from: http://pdf.usaid.gov/pdf_docs/PNACU960.pdf.
3. World Health Organization. Vaccination Coverage Cluster Survey Refrence Manual. Available from: http://www.who.int/immunization/moni-toring_surveillance/Vaccination_coverage_cluster_survey_with_annexes.pdf?ua=1
4. World Health Organization. Immunization coverage. Survey methods. Available from: http://www.who.int/immunization/monitoring_surveil-lance/routine/coverage/en/index2.html
5. World Health Organization. Practical guide for the design, use and promotion of home-based records in immunization programmes. Avail-able at: http://www.who.int/immunization/documents/monitoring/who_ivb_15.05/en/
6. Cutts FT, Izurieta HS, Rhoda DA. Measuring Coverage in MNCH: Design, implementation, and interpretation challenges associated with tracking vaccination coverage using household surveys. PLoS Med. 2013;10(5):e1001404.
7. Rutstein, SO, Rojas G. Demographic and health surveys methodology: Guide to DHS statistics. Demographic and Health Surveys, ORC Macro; Sep 2006 [cited 2014 May 7]. Available from: http://dhsprogram.com/publications/publication-dhsg1-dhs-questionnaires-and-manuals.cfm
8. United States Agency for International Development. Demographic and health surveys methodology: sampling and household listing manu-al. Sep 2012. [cited 2014 May]. Available from: http://dhsprogram.com/pubs/pdf/DHSM4/DHS6_Sampling_Manual_ Sept2012_DHSM4.pdf
9. United States Agency for International Development. Demographic and health surveys methodology: Standard recode manual for DHS 6. V. 1.0 (2013 March 22). [cited 2014 May]. Available from: http://dhsprogram.com/pubs/pdf/DHSG4/Recode6_DHS_22March2013_DHSG4.pdf
10. Luhm KR, Cardoso MR, Waldman EA. Vaccination coverage among children under two years of age based on electronic immunization registry in southern Brazil. Rev Saude Publica. 2011;45(1):90-8.
11. Braeckman T, Lernout T, Top G, Paeps A, Roelants M, Hoppenbrouwers K, et al. Assessing vaccination coverage in infants, survey studies versus the Flemish Immunization Register: Achieving the best of both worlds. Vaccine. 2014;32(3):345-9.
12. Pan American Health Organization. Immunization: Prioritizing vulnerable populations. Meeting of the Technical Advisory Group on Vaccine-Preventable Diseases (TAG), San José, Costa Rica; 2009 Aug. Available from: http://www2.paho.org/hq/dmdocuments/2010/tag18_2009_Final%20Report_Eng.pdf
13. Stokley S, Maurice E, MS, Smith PJ, Klevens M. Evaluation of invalid vaccine doses. Am J Prev Med. 2004;26(1):34-40.14. World Health Organization. Recommendations for routine immunization - summary tables. http://www.who.int/immunization/policy/immuni-
zation_tables/en/15. Centers for Disease Control and Prevention. Epidemiology and prevention of vaccine-preventable diseases. Atkinson W, Wolfe S, Hambor-
sky J, editors. 22.nd ed., Washington, DC: Public Health Foundation; 2012.16. World Health Organization. Hepatitis B vaccines. Wkly Epidemiol Rec. 2009;84(40): 405-19. Available from: http://www.who.int/wer/2009/
wer8440.pdf?ua=117. World Health Organization. Meeting of the Strategic Advisory Group of Experts on immunization, April 2012; conclusions and recommenda-
tions. Wkly Epidemiol Rec. 2012;87(21):201-16.18. Pan American Health Organization. Paving the way for immunization. Meeting of the Technical Advisory Group on Vaccine-Preventable Dis-
eases (TAG), Washington, DC: OPS; Oct, 2012. Available from: http://www.who.int/immunization/sage/meetings/2012/november/9_FINAL_ TAG_Meeting_2012_report.pdf
19. World Health Organization. Measles vaccines: WHO position paper. Wkly Epidemiol Rec. 2009;84(35):349-60. Available from: http://www.who.int/wer/2009/wer8435.pdf?ua=1
20. Dayan GH, Shaw KM, Baughman AL, Orellana LC, Forlenza R, Ellis A, et al. Assessment of delay in age-appropriate vaccination using survival analysis. Am J Epidemiol. 2006;163(6):561-70.
21. Luman ET, McCauley MM, Stokley S, Chu SY, Pickering LK. Timeliness of childhood immunizations. Pediatrics. 2002;110:935-9. 22. Pan American Health Organization. Final report of the XXI Technical Advisory Group (TAG) Meeting on Vaccine-preventable Dis-
eases of the Pan American Health Organization, held in Quito, Ecuador, 3-5 July 2013. Available at: http://www.paho.org/hq/index.

87
php?option=com_content&view=article&id=1862%3Atechnical-advisory-group-vaccine-preventable-diseases&catid=1549%3Ainformation-products&Itemid=39430&lang=en
23. Clark A, Sanderson C. Timing of children’s vaccinations in 45 low-income and middle-income countries: An analysis of survey data. Lancet. 2009;373(9674):1543-9.
24. World Health Organization. Reducing pain at time of vaccination position paper. Available at: http://www.who.int/immunization/policy/posi-tion_papers/reducing_pain_vaccination/en/
25. Cutts FT, Izurieta HS, Rhoda DA (2013) Measuring Coverage in MNCH: Design, Implementation, and Interpretation Challenges Associated with Tracking Vaccination Coverage Using Household Surveys. PLoS Med 10(5): e1001404.
26. Felicity T. Cutts, Pierre Claquin, M. Carolina Danovaro-Holliday, Dale A. Rhoda. Monitoring vaccination coverage: Defining the role of sur-veys. Vaccine 34 (2016) 4103–4109

ISBN: 978-92-75-11982-2