To Perceive or Not Perceive: The Role of Gamma-band Activity in Signaling Object Percepts
10
To Perceive or Not Perceive: The Role of Gamma-band Activity in Signaling Object Percepts Joa ˜ o Castelhano 1 , Jose ´ Rebola 1 , Bruno Leita ˜o 2 , Eugenio Rodriguez 3 , Miguel Castelo-Branco 1 * 1 Visual Neuroscience Laboratory, Institute for Biomedical Imaging and Life Sciences, Faculty of Medicine, University of Coimbra, Coimbra, Portugal, 2 Center for Informatics and Systems, University of Coimbra, Coimbra, Portugal, 3 Max-Planck for Brain Research, Frankfurt am Main, Germany; and Pontificia Universidad Cato ´ lica de Chile, Escuela de psicologı ´a, Santiago, Chile Abstract The relation of gamma-band synchrony to holistic perception in which concerns the effects of sensory processing, high level perceptual gestalt formation, motor planning and response is still controversial. To provide a more direct link to emergent perceptual states we have used holistic EEG/ERP paradigms where the moment of perceptual ‘‘discovery’’ of a global pattern was variable. Using a rapid visual presentation of short-lived Mooney objects we found an increase of gamma-band activity locked to perceptual events. Additional experiments using dynamic Mooney stimuli showed that gamma activity increases well before the report of an emergent holistic percept. To confirm these findings in a data driven manner we have further used a support vector machine classification approach to distinguish between perceptual vs. non perceptual states, based on time-frequency features. Sensitivity, specificity and accuracy were all above 95%. Modulations in the 30–75 Hz range were larger for perception states. Interestingly, phase synchrony was larger for perception states for high frequency bands. By focusing on global gestalt mechanisms instead of local processing we conclude that gamma-band activity and synchrony provide a signature of holistic perceptual states of variable onset, which are separable from sensory and motor processing. Citation: Castelhano J, Rebola J, Leita ˜o B, Rodriguez E, Castelo-Branco M (2013) To Perceive or Not Perceive: The Role of Gamma-band Activity in Signaling Object Percepts. PLoS ONE 8(6): e66363. doi:10.1371/journal.pone.0066363 Editor: Lawrence M. Ward, University of British Columbia, Canada Received December 12, 2012; Accepted May 3, 2013; Published June 13, 2013 Copyright: ß 2013 Castelhano et al. This is an open-access article distributed under the terms of the Creative Commons Attribution License, which permits unrestricted use, distribution, and reproduction in any medium, provided the original author and source are credited. Funding: This work was supported by PTDC/PSI/67381/2006 and COMPETE PIC/IC/82986/2007, PEst-C/SAU/UI3282/2013, CENTRO-07-ST24-FEDER-00205, Bial Foundation grants and a PhD fellowship (SFRH/BD/65341/2009) to JC from the Foundation for Science and Technology Portugal. The funders had no role in study design, data collection and analysis, decision to publish, or preparation of the manuscript. Competing Interests: The authors have declared that no competing interests exist. * E-mail: [email protected] Introduction Oscillatory processes in the gamma frequency range have been proposed to play a role in percept formation and object representation. Studies using EEG and MEG [1–3] have suggested that gamma-band oscillations are related to integration of information and the ability to form coherent gestalts [1,2] as well as attention and working memory processes [3–10]. Gamma-band synchrony does indeed seem to reflect binding of information across different brain regions [11–16] that leads to the emergence of a coherent percept [17–19]. Studies of oscillatory patterning may be important to understand normal and abnormal cognitive function related to perceptual functions [20]. Although some studies reported that gamma-activity may be influenced by artifacts of muscle activity and eye movements [21–23], valuable methods to attenuate this problem have been developed [24–26]. Here we examined the oscillatory large-scale neural correlates of gestalt-like perceptual recognition moments. As previous studies have relied on simple contrasts across inverted vs. upright static stimuli [17] we aimed to study the moment a coherent visual percept is formed. Paradigms where object recognition is variable in time would be helpful in elucidating this issue by isolating a neural correlate of coherent perception. Neurochronometric paradigms [27] that allow the emergence of variable moments of perception would also help in further clarifying the role of gamma- band synchrony in gestalt based perception. To help identify the processes underlying the emergence of a coherent object/face percept under ambiguous stimulus condi- tions, and the role of gamma-band activity in these processes, we have recorded EEG/ERP signals while performing two different tasks that used Mooney objects (two-tone black and white degraded images, [28]). The first task tried to achieve that goal with rapid serial visual presentation paradigms, where short lived target Mooney stimuli do appear randomly with low (1/30) probability. In a second experiment, based on time variable percepts, we designed a new face paradigm [29] that takes advantage of the well known role of face inversion in holistic processing [27,30–32]. A configural/holistic-based processing mode operates for upright faces [33] and a part-based processing mechanism is activated when faces are inverted [27,34]. We used such a paradigm that delayed the time of recognition from stimulus onset [29]. We were able to observe a delayed transition from non perception to perceptual states reflecting a gradual transition from local to holistic processing. This leads to the simple prediction that gamma should increase during the transition moment. We aimed to investigate the link between gamma-band activity and the aforementioned moment whereby a coherent visual percept is formed, which helped dissociating low level visual analysis from high level categorical perception. We used the time- frequency and phase synchrony analysis described elsewhere [17,35–37]. Finally, we performed an additional independent PLOS ONE | www.plosone.org 1 June 2013 | Volume 8 | Issue 6 | e66363
-
Upload
independent -
Category
Documents
-
view
0 -
download
0
Transcript of To Perceive or Not Perceive: The Role of Gamma-band Activity in Signaling Object Percepts

To Perceive or Not Perceive: The Role of Gamma-bandActivity in Signaling Object PerceptsJoao Castelhano1, Jose Rebola1, Bruno Leitao2, Eugenio Rodriguez3, Miguel Castelo-Branco1*
1 Visual Neuroscience Laboratory, Institute for Biomedical Imaging and Life Sciences, Faculty of Medicine, University of Coimbra, Coimbra, Portugal, 2 Center for
Informatics and Systems, University of Coimbra, Coimbra, Portugal, 3 Max-Planck for Brain Research, Frankfurt am Main, Germany; and Pontificia Universidad Catolica de
Chile, Escuela de psicologıa, Santiago, Chile
Abstract
The relation of gamma-band synchrony to holistic perception in which concerns the effects of sensory processing, high levelperceptual gestalt formation, motor planning and response is still controversial. To provide a more direct link to emergentperceptual states we have used holistic EEG/ERP paradigms where the moment of perceptual ‘‘discovery’’ of a globalpattern was variable. Using a rapid visual presentation of short-lived Mooney objects we found an increase of gamma-bandactivity locked to perceptual events. Additional experiments using dynamic Mooney stimuli showed that gamma activityincreases well before the report of an emergent holistic percept. To confirm these findings in a data driven manner we havefurther used a support vector machine classification approach to distinguish between perceptual vs. non perceptual states,based on time-frequency features. Sensitivity, specificity and accuracy were all above 95%. Modulations in the 30–75 Hzrange were larger for perception states. Interestingly, phase synchrony was larger for perception states for high frequencybands. By focusing on global gestalt mechanisms instead of local processing we conclude that gamma-band activity andsynchrony provide a signature of holistic perceptual states of variable onset, which are separable from sensory and motorprocessing.
Citation: Castelhano J, Rebola J, Leitao B, Rodriguez E, Castelo-Branco M (2013) To Perceive or Not Perceive: The Role of Gamma-band Activity in Signaling ObjectPercepts. PLoS ONE 8(6): e66363. doi:10.1371/journal.pone.0066363
Editor: Lawrence M. Ward, University of British Columbia, Canada
Received December 12, 2012; Accepted May 3, 2013; Published June 13, 2013
Copyright: � 2013 Castelhano et al. This is an open-access article distributed under the terms of the Creative Commons Attribution License, which permitsunrestricted use, distribution, and reproduction in any medium, provided the original author and source are credited.
Funding: This work was supported by PTDC/PSI/67381/2006 and COMPETE PIC/IC/82986/2007, PEst-C/SAU/UI3282/2013, CENTRO-07-ST24-FEDER-00205, BialFoundation grants and a PhD fellowship (SFRH/BD/65341/2009) to JC from the Foundation for Science and Technology Portugal. The funders had no role in studydesign, data collection and analysis, decision to publish, or preparation of the manuscript.
Competing Interests: The authors have declared that no competing interests exist.
* E-mail: [email protected]
Introduction
Oscillatory processes in the gamma frequency range have been
proposed to play a role in percept formation and object
representation. Studies using EEG and MEG [1–3] have suggested
that gamma-band oscillations are related to integration of
information and the ability to form coherent gestalts [1,2] as well
as attention and working memory processes [3–10]. Gamma-band
synchrony does indeed seem to reflect binding of information
across different brain regions [11–16] that leads to the emergence
of a coherent percept [17–19]. Studies of oscillatory patterning
may be important to understand normal and abnormal cognitive
function related to perceptual functions [20]. Although some
studies reported that gamma-activity may be influenced by
artifacts of muscle activity and eye movements [21–23], valuable
methods to attenuate this problem have been developed [24–26].
Here we examined the oscillatory large-scale neural correlates
of gestalt-like perceptual recognition moments. As previous studies
have relied on simple contrasts across inverted vs. upright static
stimuli [17] we aimed to study the moment a coherent visual
percept is formed. Paradigms where object recognition is variable
in time would be helpful in elucidating this issue by isolating a
neural correlate of coherent perception. Neurochronometric
paradigms [27] that allow the emergence of variable moments of
perception would also help in further clarifying the role of gamma-
band synchrony in gestalt based perception.
To help identify the processes underlying the emergence of a
coherent object/face percept under ambiguous stimulus condi-
tions, and the role of gamma-band activity in these processes, we
have recorded EEG/ERP signals while performing two different
tasks that used Mooney objects (two-tone black and white
degraded images, [28]). The first task tried to achieve that goal
with rapid serial visual presentation paradigms, where short lived
target Mooney stimuli do appear randomly with low (1/30)
probability. In a second experiment, based on time variable
percepts, we designed a new face paradigm [29] that takes
advantage of the well known role of face inversion in holistic
processing [27,30–32]. A configural/holistic-based processing
mode operates for upright faces [33] and a part-based processing
mechanism is activated when faces are inverted [27,34]. We used
such a paradigm that delayed the time of recognition from
stimulus onset [29]. We were able to observe a delayed transition
from non perception to perceptual states reflecting a gradual
transition from local to holistic processing. This leads to the simple
prediction that gamma should increase during the transition
moment.
We aimed to investigate the link between gamma-band activity
and the aforementioned moment whereby a coherent visual
percept is formed, which helped dissociating low level visual
analysis from high level categorical perception. We used the time-
frequency and phase synchrony analysis described elsewhere
[17,35–37]. Finally, we performed an additional independent
PLOS ONE | www.plosone.org 1 June 2013 | Volume 8 | Issue 6 | e66363

validation by a data driven (non hypothesis constrained) approach
using support vector machine (SVM) classification tools [38]. We
were able to differentiate between perceptual states based on
temporal activity patterns and thereby support their likely
functional relation with object recognition.
Given that previous studies have shown that the brain codes
different information in multiple oscillatory bands [39–41], we did
analyze a broad range of frequency bands, beyond the usual focus
on high-frequency (60–75 Hz) as well as lower frequency (30–
45 Hz) EEG low gamma bands and high beta [42]. We tested
whether induced (non-phase locked) oscillatory activity might be
differently modulated depending on the particular frequency band
as a function of perceptual state, as tested using statistical
classification tools.
Materials and Methods
Ethics StatementThis study and all the procedures were reviewed and approved
by the Ethics Commission of the Faculty of Medicine of the
University of Coimbra (Comissao de Etica da Faculdade de
Medicina da Universidade de Coimbra) and was conducted in
accordance with the declaration of Helsinki. Written informed
consent was obtained from all participants. The subjects of the
photographs in figure 1 have given written informed consent, as
outlined in the PLOS consent form, for publication of their
photograph.
ParticipantsAll participants (n = 20, mean age 27.7864.88 years, 9 males
and 11 females; 2 left-handed) had normal or corrected-to normal
vision and no history of neurological disorders. All participants
were naive regarding the purpose of the study. Participants took
part in EEG recordings, distributed over 2 experiments (14 in
experiment 2, 8 in experiment 1). Two of these subjects underwent
both experiments.
Experimental paradigmsExperiment 1– Perceptual reports on briefly presented
ambiguous stimuli – perceptual task with delayed
response. EEG/ERP data were recorded along with a rapid
visual presentation task with target probability of 1/30 (see below).
Subjects (n = 8) performed a three way forced choice task where
they had to report the presence of a target (Mooney face or
Mooney Guitar or none of these objects) among frequent stimuli at
the end of the trial (delayed report moment; see Figure 1A). The
choice of guitars was due to the fact that they have a highly
prototypical shape, like faces. Using these stimuli it is possible to
modify local features without changing global configuration.
Moreover there is little correspondence between face-selective
areas and regions correlated with guitar identification [43].
Frequent stimuli were scramble versions of the target. Each
picture was presented briefly for 150 ms in trials of 4500 ms. Each
trial contained a target and 29 random versions of it (frequent
standard stimuli). 103 different target Mooney faces and 103 target
Mooney guitars were shown (subjects did not know when the
target stimulus would appear). The timing of target presentation
was variable between 1500 ms and 3000 ms in the trial. Subjects
performed 7 runs (6 runs with 30 trials and 1 run with 26 trials)
with trials randomized across subjects.
Stimuli were generated in Psychophysics Toolbox (running in
MatlabH) to enable calculation on the fly of different random
Figure 1. Summary of the tasks. A: EEG Mooney rapid visual presentation task, with delayed response. Meaningful (perceived as faces or guitars)objects appear among noise images. Mooney faces and Mooney guitars are shown randomly with a likelihood of 1/30 (between the 10th and 20th
presented images) at each trial masked backward and forward by a randomization of itself (each picture 150 ms). Subjects had to report the presenceof a target (Mooney face or Mooney Guitar or none of these objects) at the end of the trial (inter-stimulus interval is 2000 ms). B: Mooney dynamicstimuli - Time-line of one run; for clarity, representative snapshots are represented in separated boxes (in the experiment movies run continuouslyand smoothly). Accordingly, only 4 snapshots are shown for each movie – faces rotate from inverted to upright in 12 s movies separated by a 3 sblack screen. Subjects were instructed to provide a motor report, when they perceived the face, as quickly as possible.doi:10.1371/journal.pone.0066363.g001
Gamma-Band Activity Signals Object Percepts
PLOS ONE | www.plosone.org 2 June 2013 | Volume 8 | Issue 6 | e66363

pictures (standard distractors – frequent stimuli). Stimuli were
presented in a black background in a CRT monitor with a
resolution of 10246768 pixels and refresh rate of 85 Hz. They
spanned a visual angle of 4.5u64.5u.EEG Recording – experiment 1. Subjects sat in a comfort-
able chair in a darkened room at a viewing distance of 120 cm
from the stimulus presentation monitor.
We have used a 128 channel EEG system (Compumedics Quick
cap; NeuroScan, USA) for recording. Caps were interfaced
through SynAmps2 (NeuroScan, USA) signal amplifier, which
fed the signal through the Acquire Data Acquisition software
(version 4.3.1, Compumedics NeuroScan, USA) at a sampling rate
(SR) of 2000 Hz. No notch filters were used during recording and
impedances were kept under 10 kV (electrodes with higher
impedances were marked as bad). All electrodes were referenced
during recording to one reference electrode located close of CZ.
Data were stored in the Portuguese Brain Imaging Network
repository.
EEG analysis – experiment 1. We used Edit EEG/ERP
analysis software (version 4.5, NeuroScan, USA) for data pre-
processing and extraction of event related responses (target
stimulus locked event related potentials (ERP)). The channels that
did not fulfill the impedance criteria during acquisition were
rejected. Offline re-referencing, using average reference was then
performed [35]. Data were digitally high-pass filtered at 1 Hz
using a finite impulse response filter and amplitude based (275,
75 mV) artifact rejection routines were then applied. Blinks were
removed by rejecting epochs in which the electrooculogram
bipolar channels exceeded 6100 mV. Stimulus presentation time
(150 ms) was below the known latency of eye movements.
Miniature saccades usually show an average peak around
250 ms [44]. Data were filtered with a low-pass filter of 100 Hz
and then segmented into epochs (2200 ms to 800 ms) locked to
the onset of the target stimuli (Mooney faces and guitars). Only
trials with correct categorization of the stimuli (.90%) were
considered for analysis. We used MatlabH(v.R2010a, The Math-
Works, USA) and EEGLAB MatlabH toolbox (version 10.2.5.6b)
for time-frequency, phase synchrony and additional statistical
analysis (see below for details).
We performed source localization for the grand average ERPs
of the target stimuli. Source analysis was performed in Curry 5.0
software (NeuroScan, USA) on a realistic head model. Group
average ERP data was co-registered with anatomical magnetic
resonance (MR) data using landmarks and applying standard xyz
coordinates of the channel locations. A boundary element model
(BEM) was created from standard anatomical MR data and
current source density was estimated for the ERP peaks with no
assumption regarding the number or location of active sources.
The sLORETA algorithm (standardized low resolution brain
electromagnetic tomography) was used [45,46]. This method is a
standardized discrete, three-dimensional (3D) distributed, linear,
minimum norm inverse solution. It takes several neurophysiologic
and anatomical constraints into account and has been shown to
yield images of standardized current density with exact localization
in the presence of measurement and biological noise [46].
Experiment 2– Perceptual reports on dynamic ambiguous
two-tone (Mooney) stimuli - emergent percepts and
concomitant responses. In this experiment, using dynamic
stimuli, EEG data were recorded in 14 right-handed subjects.
Rotating Mooney face movies – starting from inverted to upright –
were presented. The starting inverted position ensured minimal
likelihood of initial face perception and induced late recognition in
a substantial proportion of trials (see behavioural results). This is a
new paradigm (see Rebola et al., 2012 [29]) where the 2-tone
images started in the inverted position (180u), where local
processing prevails, and slowly rotate for 9 s until they reach the
upright position (0u), favoring holistic processing, staying then
fixed for 3 s. This design enabled the presence of different
perceptual states for the same physical stimulus (starting from
absent perception). This way one can compare between distinct
perceptual states induced by the same stimulus and not only a
simple contrast between different pictures. Each movie contained
a single embedded face and every stimulus appeared only once
during the experiments to prevent repetition effects (for data on
detection rates see below). We choose only one category (faces)
because the initial inverted configuration has only been proven to
be non-holistic for faces [27,47]. For this stimulus category there is
a transition from nonholistic/non perception to holistic/percep-
tual states. Stimuli were presented with Presentation (version 12.1,
Neurobehavioral Systems, Albany, CA, USA) in a setup similar to
experiment 1. The experiment was divided in 5 runs (total of 103
trials; 4 runs with 20 trials each and the last run with 23 trials). All
runs started with a fixation period of 10 s followed by a Mooney
dynamic face stimulus which was presented for 12 seconds.
Stimuli were separated (inter stimulus interval) by a black screen
during 3 s. Figure 1B summarizes the experimental paradigm.
Subjects were instructed to search for a face and to press a button
(concomitant report moment) as quickly as possible, only when
they were confident of its presence. Stimuli remained visible until
the end (12 seconds) for the perceived trials (even after the
response) and for the trials that never came to a full percept.
EEG Recording- experiment 2. Subjects sat in a comfort-
able reclining chair in a darkened, acoustically and electrically
shielded room at a viewing distance of 120 cm from the stimulus
presentation monitor.
We have used a 64 channel system (Compumedics Quick cap;
NeuroScan, USA) for recording. Electrodes were displayed as the
10–20 system in caps that were interfaced through SynAmps2
signal amplifier, which fed the signal through the Acquire Data
Acquisition software (version 4.3.1, Compumedics NeuroScan,
USA) at a SR of 2000 Hz. There were no filters applied during
recording and impedances were kept under 10 kV (electrodes with
higher impedances were marked as bad). Reference was set to one
reference electrode located close of CZ.
EEG analysis- experiment 2. We used Edit EEG/ERP
analysis software (version 4.5, Compumedics NeuroScan, USA) for
data pre-processing and extraction of ‘decision’ event related
responses. The data were inspected by eye for artifacts and bad
channels were rejected. Offline re-referencing, using average
reference was then performed [35].
Filtering and artifact rejection criteria were set as in experiment
1. We corrected for eye-blinks (and other artifacts) segment-wise
by rejecting data trials where the maximum exceeded 100 mV in
any of the EEG or EOG channels. Moreover, because of the
dynamic stimuli used in this experiment, we used independent
component analysis (ICA) for signal ‘‘correction’’, in particular
saccade potentials attenuation, based on all electrodes (including 4
EOG channels) [24]. We identified the ocular component based
on the scalp topography (higher activity around the orbits) and its
relation to EOG channel peaks, as described by Keren et al, 2010
[24].
Data were segmented into epochs (21500 ms to 500 ms) locked
to the response or to the middle of the trial, for the perceived trials
(perceptual ‘‘discovery’’ moment) and non perceived trials
respectively. Epochs were separated accordingly to the response
(perceived, no-perceived). To guarantee that the baseline was
equal between different trials, only trials with responses between
1 s to 11 s were considered for analysis.
Gamma-Band Activity Signals Object Percepts
PLOS ONE | www.plosone.org 3 June 2013 | Volume 8 | Issue 6 | e66363

Topography, time-frequency, phase synchrony and additional
statistical analysis were implemented in MatlabH(v.R2010a, The
MathWorks, USA).
Time-frequency and phase synchrony analysisTime-frequency analysis was performed as in Uhlhaas, et al.
(2006) [35,36] and is also described elsewhere [17,35,36,48].
Signals were time-frequency-analyzed using the pseudo Wigner-
Ville transformation. For every time window and frequency bin
(frequency resolution of 1 Hz/frequency bin) the amplitude and
phase were computed, using MatlabH, in the high-beta/gamma
frequency range (15 to 90 Hz in steps of 1 Hz) and in the time
period of the epochs described above with EOG correction
performed as described in Keren, et al. (2010) [24]. From these
phase values we calculated the phase-locking value (PLV), that
measures the inter-trial variability of the phase difference [35].
PLV looks for latencies at which the phase difference between the
signals varies little across trials at the target frequency. Because we
were interested in long-range coordination of neural activity, for a
given time window, the phase difference was calculated between
all electrode pairs, and the stability of phase difference evaluated
through all the trials across a large frequency range [17,35,36].
Coherency is an indicator of neural synchrony but, this phase
calculation can be affected by volume conduction since activity of
a single source is measurable in many electrodes. To avoid
spurious synchrony, we computed PLV between sources, using the
imaginary component part of coherence (ImCoh) as a measure for
functional connectivity at the sensor level [37,49]. As described by
Nolte et al 2004 [37], ImCoh more directly reflects true
interaction. We performed this analysis as it is implemented in
Source Information Flow toolbox for EEGLAB (SIFT version
0.9.7-alpha) [50,51]. To further examine the ImCoh we plotted
the head-in-head plots to visualize interactions between conditions
over all channels (pairs of channels) [49,52]. The topographies are
plotted at each electrode position and represent the connectivity
strength (ImCoh) between that given channel and all other
channels for each frequency band (15–30 Hz, 30–45 Hz, 45–
60 Hz, 60–75 Hz).
Time-frequency (induced) and phase were then normalized to
the baseline. The normalization involves subtracting the baseline
average and dividing by the baseline standard deviation on a
frequency by frequency basis [35,36]. Baseline was chosen
accordingly to the task. In the first experiment the baseline was
set to pre-stimulus interval (avoiding inclusion of post-stimulus
oscillations in the baseline segment). For the second experiment,
using dynamic stimuli, baseline time-window spanned the no-
perception time window (the time before perceptual decision).
After normalization, individual time-frequency and phase syn-
chrony data were averaged through subjects to obtain grand-
averages.
Statistical analysisThe alpha level was set at 0.05 for all tests. After verifying for
normality (Kolmogorov-Smirnov), statistical tests were performed.
Figure 2. Group average ERP for experiment 1 - Mooney Rapid Visual Presentation. Baseline is set to 2250 ms to 0 ms. ERP peaksnegatively around 220 ms and is consistent across subjects (line points means standard deviation). Source distribution maps show sLORETAstandardized current density for the three different peaks (hot colors signals the highest current density reconstruction values).doi:10.1371/journal.pone.0066363.g002
Figure 3. Time-frequency plot for the posterior channels – Experiment 1. Data are locked to the onset of the oddball salient frame (A: Face;B: Guitar), baseline corrected for the pre-stimulus interval and normalized for the baseline interval. Significant differences revealed prominent gammaactivity for face trials at low frequency (30–45 Hz, 373–685 ms; z = 4.14; p corrected,0.001) as well as for guitar trials both for low (30–45 Hz, 370–600 ms; z = 5.06; pcorrected,0.0001) and high frequencies (60–75 Hz; 166–641 ms; z = 10.33; pcorrected,0.0001) when comparing with thebaseline. Blue line marks the beginning of the target stimuli; Color scale: normalized units.doi:10.1371/journal.pone.0066363.g003
Gamma-Band Activity Signals Object Percepts
PLOS ONE | www.plosone.org 4 June 2013 | Volume 8 | Issue 6 | e66363

After a visual inspection of the results we focus and tested four
frequency bands of 15 Hz length each (15–30 Hz, 30–45 Hz, 45–
60 Hz, 60–75 Hz) to assess the significance of the oscillatory
patterns with paired t-test and Wilcoxon signed rank test. The
Bonferroni-Holms correction for multiple comparisons at level
alpha was applied when appropriate [53].
As a further statistical analysis we performed SVM classification
applied to matched perceived/unperceived time window. We have
performed classification of perceptual ‘‘discovery’’ responses of
experiment 2 for the subjects (n = 6) that had at least 10 non-
perceived trials. In 8 subjects the number of unperceived trials was
too low for classification. However, single subject statistics were
highly consistent across all 6 eligible subjects’ permiting proof of
concept validation. We were conservative in subject selection for
SVM but we guaranteed that we had enough number of trials for
both states. The algorithm classified between perceived/unper-
ceived trials. We used linear SVM implemented in the libSVM
library [38] based on time-frequency data. Data were divided into
training and test sets. The classifier used 3 seconds at the end of
the movies (for the perceived movies only trials with responses not
overlapping this period were considered; in this way we
guaranteed non contamination of overlaid motor responses). It
used time-frequency data features based on the average over time
in occipito-parietal channels (C1/Z/2, CP1/3/Z/2/4, P1/Z/4,
PO9/7/5/3/Z/4/6/8/10, O1/Z/2) for each averaged time-point
per frequency band. To determine the best regularization
parameter, we used a 3-fold cross-validation scheme. Thirty
repetitions were computed with random distribution of data
among folds. We used a permutation test approach [54,55] to
evaluate the statistical significance of the classification’s results. In
this procedure, labels are assigned randomly to the example trials,
then the classifier is trained on the task with the permuted
condition labels and finally the generalization performance is
tested with a ‘‘leave-one-out’’ cross-validation strategy.
Results
Behavioural dataHit rates for Mooney tasks were as follows, task 1: mean
89.7568.46% for faces and 90.3665.96% for guitar stimuli; task
Figure 4. Time-frequency representations and topographies in the perception (A) and no perception (B) conditions – Experiment 2.A: group average responses to Mooney dynamic stimuli locked to response onset (blue line), baseline corrected and normalized for the baselineinterval (fixation and stimulus); B: group average activity for the non- perceived trials. Topography plots for high and low gamma response are shownfor perception and no perception conditions respectively. The topographies are averaged across the time window (2800 – 0 ms) for the highergamma-band (60–75 Hz) and lower gamma-band (30–45 Hz; top right and bottom right, respectively). The gamma-band signal is expressed asrelative power change during perception compared to baseline, averaged across all channels. Note that the frequency band where the effect size ishighest is the higher gamma-band. Boxes highlight low (30–45 Hz) and high (60–75 Hz) gamma bands, here and in subsequent figures.doi:10.1371/journal.pone.0066363.g004
Table 1. No perception vs. Perception statistics for experiment 2.
Frequency range (Hz) p t
15–30 0.011187 22.7584 n.s.
30–45 6.7571E-06 25.7881 Perception higher than no perception
45–60 4.3518E-07 26.9535 Perception higher than no perception
60–75 4.7501E-14 216.1611 Perception higher than no perception
Results of statistical t-tests when comparing perception and no perception during the second before button press. We tested four frequency bands. p and t values areshown and differences were considered significant for p,0.0025 (corrected for multiple comparisons). Perception show increased activity for higher gammafrequencies.doi:10.1371/journal.pone.0066363.t001
Gamma-Band Activity Signals Object Percepts
PLOS ONE | www.plosone.org 5 June 2013 | Volume 8 | Issue 6 | e66363
2: mean 91.8767.28%. As an additional measure of reliable
perception we computed the overall group % of wrong
categorization. 9.22% of stimuli were incorrectly categorized as
faces or guitars.
In task 2 (Mooney dynamic stimuli) participants required a
mean detection time of 4.3062.95 s. When converting time into
an angular rotation required for detection, a mean value of 86ufrom the inverted position was obtained, suggesting that the object
had to be at least close to the orthogonal position for recognition.
These results are consistent with the face inversion effect [27,56].
Neurophysiological ResultsEmergent perception of faces elicited by both short lived
or dynamic ambiguous two-tone (Mooney) stimuli is related
to increases in gamma-band activity in visual posterior
brain regions. An ERP that peaks negative at 220 ms after
face/guitar onset was found conspicuously for the short-lived
stimuli in experiment 1 (see Figure 2). This peak preceded a
positive peak at 300 ms that is a known mark of target rare events
[57]. We performed source localization that revealed increased
activity from occipito-parietal regions for the N220 component
and more inferior temporal sources of activation for the P300 to
the N400 components both for Mooney faces or guitars (see source
mapping in Figure 2).
Regarding time-frequency analysis we found increased gamma
activity specifically related to the perception moments amongst
noise pictures in experiment 1 (Figure 3). These patterns were
indeed phase-locked to the detection of the target faces or objects
and appeared in both low and high gamma frequency bands (30–
45 Hz and 60–75 Hz respectively). In order to confirm these
findings we performed statistical comparisons between target and
frequent conditions with Wilcoxon rank-sum tests for each time
point and frequency band. Significant differences revealed gamma
activity was increased for face trials at low frequency (30–45 Hz,
373–685 ms; z = 4.14; p corrected,0.001) as well as for guitar
trials both for low (30–45 Hz, 370–600 ms; z = 5.06; pcorrected
,0.0001) and high frequencies (60–75 Hz; 166–641 ms;
z = 10.33; pcorrected,0.0001).
In experiment 2, we replicated these findings. We analyzed
temporal patterns of activity prior and after the perceptual
identification of faces using dynamic Mooney stimuli. Our difficult
stimulus conditions whereby stimuli start from an inverted position
often lead to a delayed recognition moment, as expressed by the
angle of stimulus rotation that is present at the moment of
perceptual report (see behavioural results). We have found
increases in gamma activity that starts prior to the perceptual
report (see time-frequency plots in Figure 4A and 4B for
perception and no perception results respectively). We found
gamma-band peaks of activity patterns at two frequencies (group
averaged gamma peaks: 32.69612.59 Hz and 70.3367.75 Hz) in
response to moments of perception. In Figure 4, for each time-
frequency plot, we depict the topography maps of the gamma
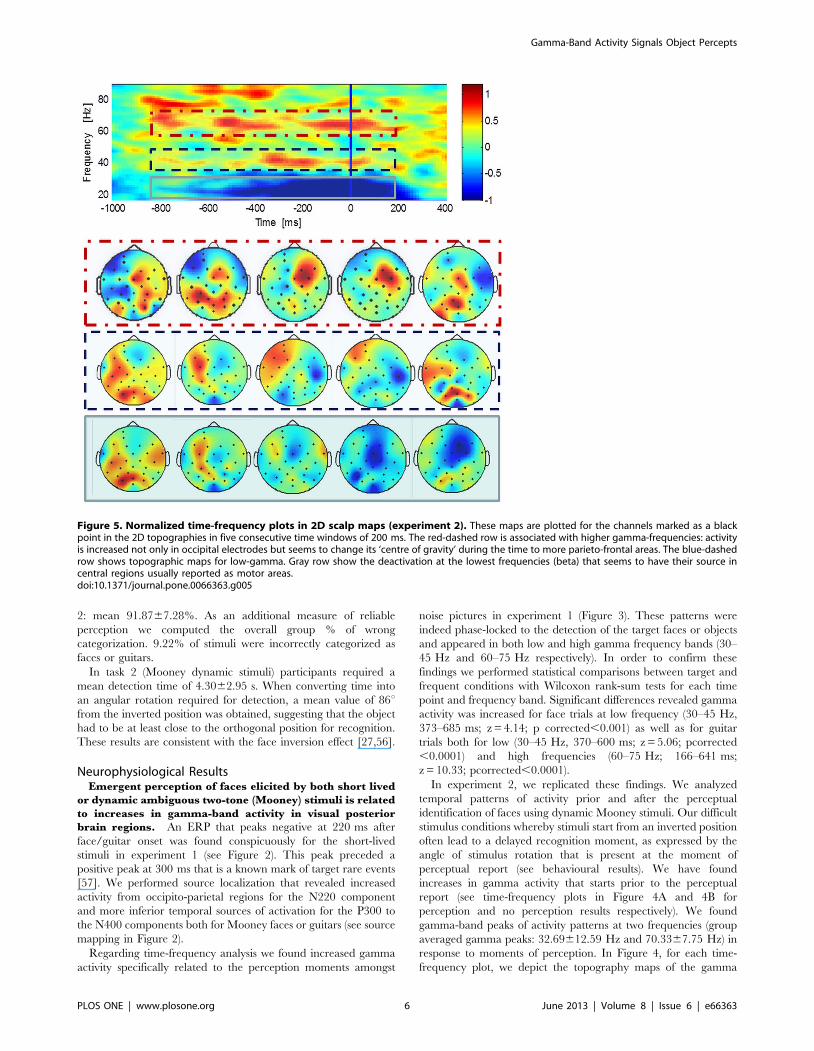
Figure 5. Normalized time-frequency plots in 2D scalp maps (experiment 2). These maps are plotted for the channels marked as a blackpoint in the 2D topographies in five consecutive time windows of 200 ms. The red-dashed row is associated with higher gamma-frequencies: activityis increased not only in occipital electrodes but seems to change its ‘centre of gravity’ during the time to more parieto-frontal areas. The blue-dashedrow shows topographic maps for low-gamma. Gray row show the deactivation at the lowest frequencies (beta) that seems to have their source incentral regions usually reported as motor areas.doi:10.1371/journal.pone.0066363.g005
Gamma-Band Activity Signals Object Percepts
PLOS ONE | www.plosone.org 6 June 2013 | Volume 8 | Issue 6 | e66363

response. We found increased central activity for the perception
condition (60–75 Hz gamma response) and a decrease over the
parietal regions for the no perception condition (30–45 Hz gamma
response).
Comparison of no perception vs. perception during a time
interval corresponding to the second before perceptual report
revealed significantly higher gamma-band activity for Perception
in the frequency bands 30–45 Hz, 45–60 Hz and 60–75 Hz (see
Table 1 for statistics).
We did also observe a peri-stimulus response reduction in the
lower frequency (15–30 Hz) beta band. This band in time-
frequency plots was only observed when a motor response was
required.
Frontal gamma-band activity is decision related. We
observed significant gamma-band activity in frontal electrodes
subsequent to occipital gamma related activation (see Figure 5)
suggesting the occurrence of these temporal patterns in anterior
locations until the moment of perceptual decision.
Accordingly, for the higher frequencies, activity is increased not
only in occipital electrodes but seems to change its ‘centre of
gravity’ during the time to more parieto-frontal areas. The
deactivation at lower (beta) frequencies seems to have its source in
central sensorimotor related regions.
Phase synchrony increases before the recognition
moment. After normalizing to periods corresponding to the
no perception states, group averages showed a burst of synchro-
nization that appears 400 ms prior to detection. In experiment 1
(suddenly recognizable objects) we observed higher synchroniza-
tion at both low (30–45 Hz; 200–373 ms; z = 4.69, pcor-
rected,0.0001) and high (60–75 Hz; 178–629 ms; z = 5.46,
pcorrected,0.001) gamma frequency bands (Figure 6A). In
experiment 2 increased synchronization (30–45 Hz) indexes were
detected just prior (2324- 2166 ms; z = 3.0516, pcor-
rected,0.003) to the perceptual report (Figure 6B). We have
observed a consistent pattern of increased synchronization in the
both experiments for the lower gamma frequency band. Moreover
we have analyzed the imaginary component part of coherence
(ImCoh) as a measure of synchrony that controls for volume
conduction spurious activity and we found different connectivity
patterns for the different conditions suggesting that distinct
neurophysiological mechanisms were involved associated with
the upcoming object recognition. Figure S1 shows ImCoh plots as
function of frequency. We found increased connectivity for the
same frequency bands and time-intervals thus replicating the
results of phase-synchrony. Figure 7 shows the ImCoh head-in-
head plots difference between perception and no perception
conditions. The connectivity is stronger for the topographic
distributions that contain frontal and right occipito-parietal
regions although one cannot make inferences about the direction-
ality of information flow [49].
SVM data driven analysis shows that temporal patterns
of gamma activity are informative in the classification of
perception vs. no perception states. The SVM classifier was
able to classify without an apriori hypothesis the perceived/non-
perceived trials of the Mooney dynamic task with high accuracy
(.95%), above chance for all subjects where a significant number
of no perception trials were available. A group average result for
accuracy, sensitivity, specificity and balanced accuracy is shown
for each frequency band in Table 2. The classifier performed with
balanced accuracy above 95% for all these bands (that are
matching the time-frequency results). The permutation results
yielded p-values bellow 0.001 in all of the cases, for the
classification of perceptual states (which is remarkable even if the
set of subjects with a sufficient number of trials for classification
was low). The likelihood that this would happen by chance even at
a group level is very low. The contribution of each sub-band to the
classification was based in an increase in perception related
activity.
Discussion
This study provides a direct link between gamma-band
temporal patterns and the presence versus absence of emerging
holistic perception of variable onset. We investigated visual
perceptual recognition moments based on EEG/ERP analysis
with two different experiments. The novelty of our study lies in the
fact that we departed from classical paradigms which are based on
contrasts between stimuli conditions that are fixed in time. Our
approach improves conventional designs by using short lived rapid
visual presentation of many events with 1/30 likelihood of target
presence or novel dynamic approaches whereby percepts are
variable in which concerns the moment of recognition. In the
latter case, this ensured that the moment of perception of an
emergent global pattern was variable. This way we could directly
compare perception vs. no perception states for the same stimuli.
In the first task, the short lived presentations yielded a
characteristic ERP with a negative peak at 220 ms. Previous
studies have shown a similar component for decision related
paradigms [58]. The emergence of this negative peak is very
common and can be related with the decision making demands of
our paradigm as reported previously by others [59] even in other
sensory modalities [57]. Moreover, our ERP data shows a clear
P300 peak that appears in response to the rare target stimuli. In
this experiment, we have found that increased gamma-band
patterns appear in response to brief moments of object percepts.
This result was replicated in the second experiment, using
dynamic stimuli. The topography plots for the perception
condition at each frequency band show a broad distribution of
Figure 6. Phase synchrony results for the two experiments. A:Phase synchrony for task 1, synchrony is locked to the ‘‘target’’ face.Boxes highlight the higher synchronization at both low (30–45 Hz; 200–373 ms; z = 4.69, pcorrected,0.0001) and high (60–75 Hz; 178–629 ms;z = 5.46, pcorrected,0.001) gamma frequency bands (Figure 6A). B:Increased synchronization for the lower gamma-band (30–45 Hz)appears during task 2 (2324- 2166 ms; z = 3.0516, pcorrected,0.003)before the perceptual report (blue line).doi:10.1371/journal.pone.0066363.g006
Gamma-Band Activity Signals Object Percepts
PLOS ONE | www.plosone.org 7 June 2013 | Volume 8 | Issue 6 | e66363

the activity over the scalp. In this case, higher gamma-band
activity appears in more anterior areas, possibly corresponding to
decision related central regions. Interestingly, for the lower band
of no perception states activity appears reduced over the occipito-
parietal areas.
Both high beta/low gamma (30–45 Hz) and high gamma (60–
75 Hz) frequencies showed higher synchrony but with an expected
decrease in amplitude for the lower band, for perceived objects
(faces or guitars, which are both very prototypical objects).
Although the brief presentation paradigm show good evidence
for a perceptual role of distinct gamma-band patterns in the
emergence of percepts, our dynamic paradigm extended this
notion by taking advantage of the well known role of face inversion
in holistic processing [27,30,32,33,60]. The face-inversion effect,
has been replicated by behavioral studies [61] but has also been
reported by other brain imaging studies (e.g. [56,62]). Our
Figure 7. Head-in-head plots for the imaginary part of coherency at each frequency band. ImCoh is represented between all channelpairs time-averaged for the second before the button press. The difference between perception and no perception conditions is shown. Each smallblack dot corresponds to the position of the reference electrode in terms of connectivity. Note the link between occipital and frontal sites in thegamma range. Colorbar codes connectivity.doi:10.1371/journal.pone.0066363.g007
Table 2. SVM classification results.
LibSVM: No Perception vs. Perception
Frequency Bands (Hz) Accuracy Sensitivity Specificity Balanced Accuracy
15–30 98.0461.29 99.0760.93 91.2466.59 95.1564.00
30–45 98.1161.31 99.3461.06 91.7865.25 95.5662.96
45–60 97.8761.43 98.6760.99 92.9366.52 95.8063.91
60–75 97.8361.51 98.9660.94 93.3466.88 96.1564.20
Frequency data from occipito-parietal electrodes were used as classification features to separate between perceptual states. Only subjects with .10 non perceived trialswere used. A group average of accuracy, sensitivity, specificity and balanced accuracy is shown for each frequency band. These bands are matching the time-frequencyresults (Table 1). We performed a permutation test for each subject and all p values were below threshold (p,0.001). Classification was successful for all tested subjects.doi:10.1371/journal.pone.0066363.t002
Gamma-Band Activity Signals Object Percepts
PLOS ONE | www.plosone.org 8 June 2013 | Volume 8 | Issue 6 | e66363

manipulation uses the bias of holistic processing in Mooney
stimuli. It delayed the time of perceptual discovery from stimulus
onset through a gradual rotation from inverted to upright position
because objects are mostly perceived far from the inverted
position. This way, sensory processing was separated from
perception. We would like to emphasize (as reported in Rebola
et al., 2012 [29]) that one departs from a configuration not
favoring holistic perception to one favoring an holistic perceptual
interpretation, as also discussed by Jemel and colleagues 2009
[27]. By delaying the moment of global integration or rendering it
unpredictable this paradigm focused on global gestalt mechanisms
instead of local sensory to noise levels. The moment a coherent
visual stimulus is perceived was therefore variable in its time of
occurrence as well as in the Rapid Visual Presentation paradigm.
Nevertheless, as reported by Melloni et al., 2011 [63] the
expectation for the stimulus at a short time scales may affect peak
signal latency and amplitudes.
The analysis of phase synchrony patterns showed that object
perception was associated with a burst of synchronous activity in
low frequency gamma-band components in both tasks. This
synchrony pattern for the lower frequency band (most specific in
task 2 but also present in task 1) irrespective of amplitude of
gamma-band changes suggests that, at lower gamma-band
frequencies, a different neurophysiological process [35] associated
with the upcoming object recognition, was involved. Interareal
synchrony between areas has been reported as a mechanism for
binding of information across different brain regions [11]. To
validate this increased interaction we looked to the ImCoh as a
reliable measure for neuronal interactions that is insensitive to
volume conduction artifacts [37,49] and we found a similar
pattern of activity with increased connectivity for the same
frequency bands and time-intervals (see Figure S1). It is accepted
that ImCoh represents brain connectivity at the sensor level
[37,52,64]. According to this view, the connectivity patterns we
found can be related with the interaction between dorso-ventral
stream regions involved in object perception and anterior areas
usually reported as decision related. Remarkably, we found a
decrease in gamma amplitude during an increase in synchrony.
These patterns are evidence that the synchrony increase was not
caused spuriously by neither a change in power of a common
source or a volume conduction artifact.
These results shed light on the mechanisms underlying
perceptual object processing and decision making and provide
support for the role of gamma-band frequency patterning and
synchrony in the well known binding problem [8,9,65]. Our data
supports a functional role for distributed spatiotemporal patterns
of gamma-band activity and synchronization in perceptual
decision. Together, these findings provide support for the claim
that gamma-band activity is a signature of emergent holistic
perceptual states.
An additional contribution of this study was the independent
validation by data driven (non-hypothesis constrained) approach-
es. Support vector machine classification approach enabled us to
directly distinguish between non perceptual vs. perceptual states,
based on time-frequency features in the gamma frequency band.
This SVM approach is a proof of concept that worked in all
subjects that were eligible for classification in terms of number of
trials. Classification balanced accuracy, sensitivity and specificity
were higher than 95% thereby emphasizing perception related
neurophysiological signatures. This analysis should be viewed in
light of our evidence that sustained activity was dominant in the
gamma-band, particularly in perception states [66]. These results
show that a broad range of frequencies is informative, corrobo-
rating the tenet that the brain uses different oscillatory bands to
code different information [17,39,41]. This statistical classification
of perceptual states using an SVM approach suggests an important
functional role for gamma activity patterns that can be generalized
to ambiguous percepts. This analysis provides evidence that time-
frequency patterns at gamma-band frequencies provide sufficient
information to infer about perceptual states in a data driven
manner.
In sum we have found evidence that gamma-band features can
differentiate perceptual versus non perceptual states, as confirmed
by SVM classification. We conclude that a functional role for
distinct distributed spatiotemporal patterns of gamma-band
activity can be identified for the moment a holistic object percept
is formed.
Supporting Information
Figure S1 Representation of imaginary coherence (Im-Coh) over all channels (pairs of channels) as function offrequency. For experiment 1 (top panel) baseline was set to the
interval before stimulus presentation. For experiment 2 (bottom
panel) a baseline was subtracted consisting of the coherence time-
averaged in the interval 21200 - 21000 ms. Colorbar codes
imaginary coherence. Increased connectivity for the high beta/low
gamma and high gamma band is present thus replicating the
results of phase-synchrony.
(TIF)
Acknowledgments
We acknowledge the support of BIN (the Brain Imaging Network of
Portugal). We would like to thank Britta Graewe for help in some
experiments and to thank all the volunteers that participated in this study.
We acknowledge the comments of all the reviewers.
Author Contributions
Conceived and designed the experiments: JC JR ER MCB. Performed the
experiments: JC JR. Analyzed the data: JC JR BL ER MCB. Contributed
reagents/materials/analysis tools: JC BL ER. Wrote the paper: JC BL ER
MCB.
References
1. Tallon-Baudry C, Bertrand O, Delpuech C, Pernier J (1996) Stimulus Specificity
of Phase-Locked and Non-Phase-Locked 40 Hz Visual Responses in Human.
J Neurosci 16: 4240–4249.
2. Keil A, Muller MM, Ray WJ, Gruber T, Elbert T (1999) Human gamma band
activity and perception of a gestalt. The Journal of neuroscience 19: 7152–7161.
3. Keil a, Gruber T, Muller MM (2001) Functional correlates of macroscopic high-
frequency brain activity in the human visual system. Neuroscience and
biobehavioral reviews 25: 527–534.
4. Kaiser J, Lutzenberger W (2003) Induced gamma-band activity and human
brain function. The Neuroscientist: a review journal bringing neurobiology,
neurology and psychiatry 9: 475–484.
5. Herrmann CS, Munk MHJ, Engel AK (2004) Cognitive functions of gamma-
band activity: memory match and utilization. Trends in cognitive sciences 8:
347–355.
6. Fries P, Scheeringa R, Oostenveld R (2008) Finding gamma. Neuron 58: 303–
305.
7. Uhlhaas PJ, Haenschel C, Nikolic D, Singer W (2008) The role of oscillations
and synchrony in cortical networks and their putative relevance for the
pathophysiology of schizophrenia. Schizophrenia bulletin 34: 927–943.
8. Fries P (2009) Neuronal gamma-band synchronization as a fundamental process
in cortical computation. Annual review of neuroscience 32: 209–224.
doi:10.1146/annurev.neuro.051508.135603.
Gamma-Band Activity Signals Object Percepts
PLOS ONE | www.plosone.org 9 June 2013 | Volume 8 | Issue 6 | e66363

9. Pockett S, Bold GEJ, Freeman WJ (2009) EEG synchrony during a perceptual-
cognitive task: widespread phase synchrony at all frequencies. Clinicalneurophysiology: official journal of the International Federation of Clinical
Neurophysiology 120: 695–708.
10. Roux F, Wibral M, Mohr HM, Singer W, Uhlhaas PJ (2012) Gamma-bandactivity in human prefrontal cortex codes for the number of relevant items
maintained in working memory. The Journal of neuroscience 32: 12411–12420.11. Singer W, Gray CM (1995) Visual feature integration and the temporal
correlation hypothesis. Annual review of neuroscience 18: 555–586.
12. Varela F, Lachaux J, Rodriguez E, Martinerie J (2001) The Brainweb: PhaseLarge-Scale Integration. Nature reviews Neuroscience 2: 229–239.
13. Castelo-Branco M, Neuenschwander S, Singer W (1998) Synchronization ofvisual responses between the cortex, lateral geniculate nucleus, and retina in the
anesthetized cat. The Journal of neuroscience 18: 6395–6410.14. Basar E, Basar-Eroglu C, Karakas S, Schurmann M (1999) Are cognitive
processes manifested in event-related gamma, alpha, theta and delta oscillations
in the EEG? Neuroscience letters 259: 165–168.15. Fingelkurts AA, Fingelkurts AA, Krause CM, Mottonen R, Sams M (2003)
Cortical operational synchrony during audio-visual speech integration. Brainand language 85: 297–312.
16. Tognoli E, Kelso JAS (2009) Brain coordination dynamics: true and false faces of
phase synchrony and metastability. Progress in neurobiology 87: 31–40.17. Rodriguez E, George N, Lachaux JP, Martinerie J, Renault B, et al. (1999)
Perception’s shadow: long-distance synchronization of human brain activity.Nature 397: 430–433.
18. Gruber T, Keil A, Muller MM (2001) Modulation of induced gamma bandresponses and phase synchrony in a paired associate learning task in the human
EEG. Neuroscience letters 316: 29–32.
19. Supp GG, Schlogl A, Trujillo-Barreto N, Muller MM, Gruber T (2007) Directedcortical information flow during human object recognition: analyzing induced
EEG gamma-band responses in brain’s source space. PloS one 2: e684.20. Engel J, Da Silva FL (2012) High-frequency oscillations - Where we are and
where we need to go. Progress in neurobiology: 38–40.
21. Nagasawa T, Matsuzaki N, Juhasz C, Hanazawa A, Shah A, et al. (2011)Occipital gamma-oscillations modulated during eye movement tasks: Simulta-
neous eye tracking and electrocorticography recording in epileptic patients.NeuroImage 58: 1101–1109.
22. Schwartzman DJ, Kranczioch C (2011) In the blink of an eye: the contributionof microsaccadic activity to the induced gamma band response. International
journal of psychophysiology: official journal of the International Organization of
Psychophysiology 79: 73–82.23. Yuval-Greenberg S, Tomer O, Keren AS, Nelken I, Deouell LY (2008)
Transient induced gamma-band response in EEG as a manifestation ofminiature saccades. Neuron 58: 429–441.
24. Keren AS, Yuval-Greenberg S, Deouell LY (2010) Saccadic spike potentials in
gamma-band EEG: characterization, detection and suppression. NeuroImage49: 2248–2263.
25. Gruber T, Martinovic J, Muller M (2008) It’s all in your eyes? Induced gammaband responses in the human EEG. Neuron Online Comments.
26. Plochl M, Ossandon JP, Konig P (2012) Combining EEG and eye tracking:identification, characterization, and correction of eye movement artifacts in
electroencephalographic data. Frontiers in human neuroscience 6: 278.
27. Jemel B, Coutya J, Langer C, Roy S (2009) From upright to upside-downpresentation: a spatio-temporal ERP study of the parametric effect of rotation on
face and house processing. BMC neuroscience 10: 100.28. Mooney CM (1957) Age in the development of closure ability in children.
Canadian journal of psychology 11: 219–226.
29. Rebola J, Castelhano J, Ferreira C, Castelo-Branco M (2012) Functionalparcellation of the operculo-insular cortex in perceptual decision making: An
fMRI study. Neuropsychologia 50: 3693–3701.30. Valentine T (1988) Upside-down faces: a review of the effect of inversion upon
face recognition. British journal of psychology 79: 471–491.
31. Rossion B, Boremanse A (2008) Nonlinear relationship between holisticprocessing of individual faces and picture-plane rotation: evidence from the
face composite illusion. Journal of vision 8: 1–13.32. Rossion B, Gauthier I (2002) How does the brain process upright and inverted
faces? Behavioral and cognitive neuroscience reviews 1: 63–75.33. Schiltz C, Rossion B (2006) Faces are represented holistically in the human
occipito-temporal cortex. NeuroImage 32: 1385–1394.
34. Farah MJ, Tanaka JW, Drain MH (1995) What Causes the Face InversionEffect? Journal of Experimental Psychology: Human Perception and Perfor-
mance 21: 628–634.35. Lachaux JP, Rodriguez E, Martinerie J, Varela FJ (1999) Measuring phase
synchrony in brain signals. Human brain mapping 8: 194–208.
36. Uhlhaas PJ, Linden DEJ, Singer W, Haenschel C, Lindner M, et al. (2006)Dysfunctional long-range coordination of neural activity during Gestalt
perception in schizophrenia. The Journal of neuroscience 26: 8168–8175.37. Nolte G, Bai O, Wheaton L, Mari Z, Vorbach S, et al. (2004) Identifying true
brain interaction from EEG data using the imaginary part of coherency. Clinical
neurophysiology: official journal of the International Federation of Clinical
Neurophysiology 115: 2292–2307.38. Chih-Chung C, Chih-Jen L (2011) LIBSVM: a library for support vector
machines. ACM Transactions on Intelligent Systems and Technology 2: 27:1–
27:27.39. Schyns PG, Thut G, Gross J (2011) Cracking the Code of Oscillatory Activity.
PLoS Biology 9: e1001064.40. Belluscio MA, Mizuseki K, Schmidt R, Kempter R, Buzsaki G (2012) Cross-
frequency phase-phase coupling between h and c oscillations in the
hippocampus. The Journal of neuroscience 32: 423–435.41. Bernardino I, Castelhano J, Farivar R, Silva E, Castelo-Branco M (2013) Neural
correlates of visual integration in Williams syndrome: increased gammaoscillations in a model of impaired coherence. Neuropsychologia (accepted).
42. Scheeringa R, Fries P, Petersson KM, Oostenveld R, Grothe I, et al. (2011)Neuronal dynamics underlying high- and low-frequency EEG oscillations
contribute independently to the human BOLD signal. Neuron 69: 572–583.
43. Grill-Spector K, Knouf N, Kanwisher N (2004) The fusiform face area subservesface perception, not generic within-category identification. Nature neuroscience
7: 555–562.44. Engbert R, Kliegl R (2003) Microsaccades uncover the orientation of covert
attention. Vision Research 43: 1035–1045.
45. Pascual-Marqui R (1994) Low resolution electromagnetic tomography: a newmethod for localizing electrical activity in the brain. International Journal of
Psychophysiology 18: 49–65.46. Pascual-Marqui RD (2002) Standardized low-resolution brain electromagnetic
tomography (sLORETA): technical details. Methods and findings in experi-mental and clinical pharmacology 24 Suppl D: 5–12.
47. Strother L, Mathuranath PS, Aldcroft A, Lavell C, Goodale M a, et al. (2011)
Face inversion reduces the persistence of global form and its neural correlates.PloS one 6: e18705.
48. Melloni L, Molina C, Pena M, Torres D, Singer W, et al. (2007)Synchronization of neural activity across cortical areas correlates with conscious
perception. The Journal of neuroscience 27: 2858–2865.
49. Ewald A, Marzetti L, Zappasodi F, Meinecke FC, Nolte G (2012) Estimatingtrue brain connectivity from EEG/MEG data invariant to linear and static
transformations in sensor space. NeuroImage 60: 476–488.50. Delorme A, Mullen T, Kothe C, Akalin Acar Z, Bigdely-Shamlo N, et al. (2011)
EEGLAB, SIFT, NFT, BCILAB, and ERICA: new tools for advanced EEGprocessing. Computational intelligence and neuroscience 2011: 12.
51. Mullen T, Delorme A, Kothe C, Makeig S (2010) An Electrophysiological
Information Flow Toolbox for EEGLAB Preprocessing Visualization. Society forNeuroscience 2010, San Diego, CA 1: 2.
52. Ewald A, Aristei S, Nolte G, Rahman RA (2012) Brain Oscillations andFunctional Connectivity during Overt Language Production. Frontiers in
psychology 3: 166.
53. Holm S (1979) A simple sequentially rejective multiple test procedure.Scandinavian journal of statistics: 65–70.
54. Golland P, Fischl B (2005) Permutation tests for classification: towards statisticalsignificance in image-based studies. Information processing in medical imaging:
proceedings of the. conference 18: 330–341.55. Pereira F, Mitchell T, Botvinick M (2009) Machine learning classifiers and
fMRI: a tutorial overview. NeuroImage 45: S199–209.
56. Yovel G, Kanwisher N (2005) The neural basis of the behavioral face-inversioneffect. Current Biology 15: 2256–2262.
57. Pazo-Alvarez P, Cadaveira F, Amenedo E (2003) MMN in the visual modality: areview. Biological Psychology 63: 199–236.
58. Nasr S, Esteky H (2009) A study of N250 event-related brain potential during
face and non-face detection tasks. Journal of vision 9: 5.1–14.59. Simson R, Vaughn HG, Ritter W (1977) The scalp topography of potentials in
auditory and visual discrimination tasks. Electroencephalography and ClinicalNeurophysiology 42: 528–535.
60. Yin RK (1969) Looking at upside-down faces. Journal of Experimental
Psychology 81: 141–145.61. Rhodes G, Brake S, Atkinson AP (1993) What’s lost in inverted faces? Cognition
47: 25–57.62. Rossion B, Gauthier I, Tarr MJ, Despland P, Bruyer R, et al. (2000) The N170
occipito-temporal component is delayed and enhanced to inverted faces but notto inverted objects: an electrophysiological account of face-specific processes in
the human brain. Neuroreport 11: 69–74.
63. Melloni L, Schwiedrzik CM, Muller N, Rodriguez E, Singer W (2011)Expectations change the signatures and timing of electrophysiological correlates
of perceptual awareness. The Journal of neuroscience 31: 1386–1396.64. Nolte G, Muller KR (2010) Localizing and estimating causal relations of
interacting brain rhythms. Frontiers in human neuroscience 4: 209.
65. Treisman A (1996) The binding problem. Current opinion in neurobiology 6:171–178.
66. Grutzner C, Uhlhaas PJ, Genc E, Kohler A, Singer W, et al. (2010)Neuroelectromagnetic correlates of perceptual closure processes. The Journal
of neuroscience 30: 8342–8352.
Gamma-Band Activity Signals Object Percepts
PLOS ONE | www.plosone.org 10 June 2013 | Volume 8 | Issue 6 | e66363