
Bold Diagrammatic Monte Carlo technique for frustrated spin systems
Upload
independentCategory
view
4download
0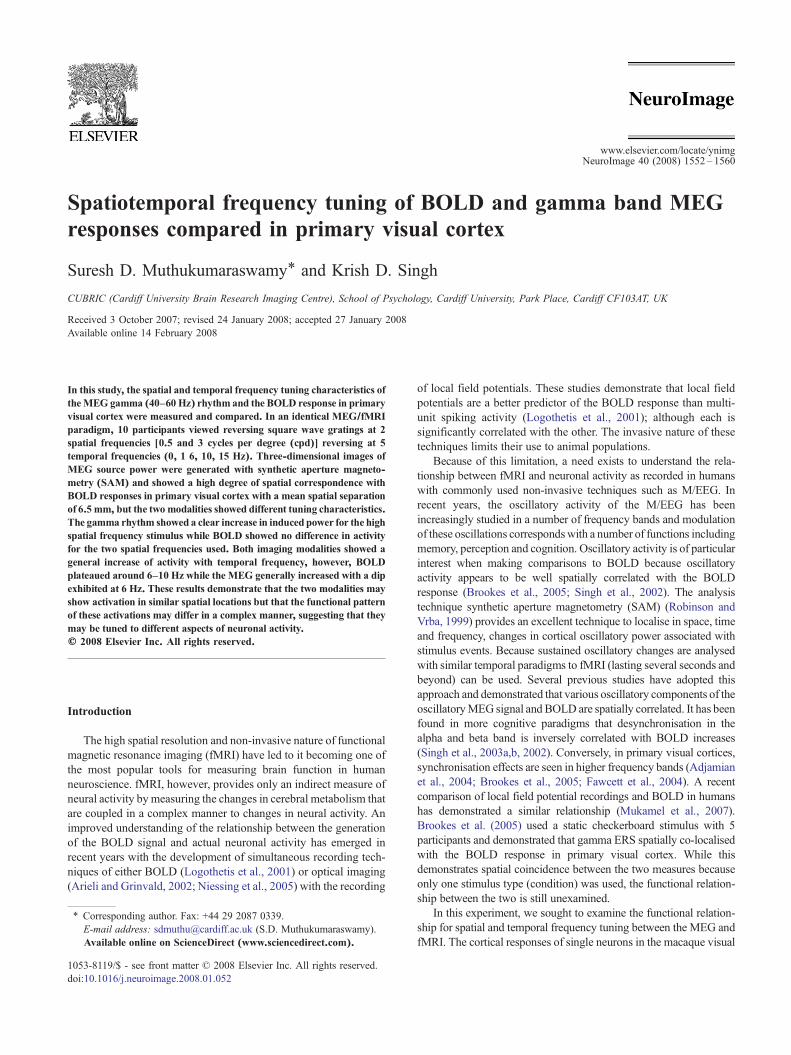
www.elsevier.com/locate/ynimg
NeuroImage 40 (2008) 1552–1560Spatiotemporal frequency tuning of BOLD and gamma band MEGresponses compared in primary visual cortex
Suresh D. Muthukumaraswamy⁎ and Krish D. Singh
CUBRIC (Cardiff University Brain Research Imaging Centre), School of Psychology, Cardiff University, Park Place, Cardiff CF103AT, UK
Received 3 October 2007; revised 24 January 2008; accepted 27 January 2008Available online 14 February 2008
In this study, the spatial and temporal frequency tuning characteristics oftheMEG gamma (40–60 Hz) rhythm and the BOLD response in primaryvisual cortex were measured and compared. In an identical MEG/fMRIparadigm, 10 participants viewed reversing square wave gratings at 2spatial frequencies [0.5 and 3 cycles per degree (cpd)] reversing at 5temporal frequencies (0, 1 6, 10, 15 Hz). Three-dimensional images ofMEG source power were generated with synthetic aperture magneto-metry (SAM) and showed a high degree of spatial correspondence withBOLD responses in primary visual cortex with a mean spatial separationof 6.5 mm, but the twomodalities showed different tuning characteristics.The gamma rhythm showed a clear increase in induced power for the highspatial frequency stimulus while BOLD showed no difference in activityfor the two spatial frequencies used. Both imaging modalities showed ageneral increase of activity with temporal frequency, however, BOLDplateaued around 6–10 Hz while the MEG generally increased with a dipexhibited at 6 Hz. These results demonstrate that the two modalities mayshow activation in similar spatial locations but that the functional patternof these activations may differ in a complex manner, suggesting that theymay be tuned to different aspects of neuronal activity.© 2008 Elsevier Inc. All rights reserved.
Introduction
The high spatial resolution and non-invasive nature of functionalmagnetic resonance imaging (fMRI) have led to it becoming one ofthe most popular tools for measuring brain function in humanneuroscience. fMRI, however, provides only an indirect measure ofneural activity by measuring the changes in cerebral metabolism thatare coupled in a complex manner to changes in neural activity. Animproved understanding of the relationship between the generationof the BOLD signal and actual neuronal activity has emerged inrecent years with the development of simultaneous recording tech-niques of either BOLD (Logothetis et al., 2001) or optical imaging(Arieli and Grinvald, 2002; Niessing et al., 2005) with the recording
⁎ Corresponding author. Fax: +44 29 2087 0339.E-mail address: [email protected] (S.D. Muthukumaraswamy).Available online on ScienceDirect (www.sciencedirect.com).
1053-8119/$ - see front matter © 2008 Elsevier Inc. All rights reserved.doi:10.1016/j.neuroimage.2008.01.052
of local field potentials. These studies demonstrate that local fieldpotentials are a better predictor of the BOLD response than multi-unit spiking activity (Logothetis et al., 2001); although each issignificantly correlated with the other. The invasive nature of thesetechniques limits their use to animal populations.
Because of this limitation, a need exists to understand the rela-tionship between fMRI and neuronal activity as recorded in humanswith commonly used non-invasive techniques such as M/EEG. Inrecent years, the oscillatory activity of the M/EEG has beenincreasingly studied in a number of frequency bands and modulationof these oscillations correspondswith a number of functions includingmemory, perception and cognition. Oscillatory activity is of particularinterest when making comparisons to BOLD because oscillatoryactivity appears to be well spatially correlated with the BOLDresponse (Brookes et al., 2005; Singh et al., 2002). The analysistechnique synthetic aperture magnetometry (SAM) (Robinson andVrba, 1999) provides an excellent technique to localise in space, timeand frequency, changes in cortical oscillatory power associated withstimulus events. Because sustained oscillatory changes are analysedwith similar temporal paradigms to fMRI (lasting several seconds andbeyond) can be used. Several previous studies have adopted thisapproach and demonstrated that various oscillatory components of theoscillatoryMEG signal and BOLD are spatially correlated. It has beenfound in more cognitive paradigms that desynchronisation in thealpha and beta band is inversely correlated with BOLD increases(Singh et al., 2003a,b, 2002). Conversely, in primary visual cortices,synchronisation effects are seen in higher frequency bands (Adjamianet al., 2004; Brookes et al., 2005; Fawcett et al., 2004). A recentcomparison of local field potential recordings and BOLD in humanshas demonstrated a similar relationship (Mukamel et al., 2007).Brookes et al. (2005) used a static checkerboard stimulus with 5participants and demonstrated that gamma ERS spatially co-localisedwith the BOLD response in primary visual cortex. While thisdemonstrates spatial coincidence between the two measures becauseonly one stimulus type (condition) was used, the functional relation-ship between the two is still unexamined.
In this experiment, we sought to examine the functional relation-ship for spatial and temporal frequency tuning between the MEG andfMRI. The cortical responses of single neurons in the macaque visual
1553S.D. Muthukumaraswamy, K.D. Singh / NeuroImage 40 (2008) 1552–1560
cortex have been well described. In terms of temporal frequencytuning cells in V1 exhibit increased firing rates up to 8 Hz and then adecrease (Foster et al., 1985). With respect to spatial frequency, cellsin macaque V1 are optimally responsive between 2 and 4 cpd (Fosteret al., 1985). This is similar to gamma band MEG responses thatexhibit a spatial frequency tuning effect, with a peak response at 3 cpd(Adjamian et al., 2004). The cortical responses of cells in V1 for bothmacaque and cat do not show interaction effects between differentspatial and temporal frequencies suggesting they can be used asorthogonal stimulus parameters (Tolhurst andMovshon, 1975; Fosteret al., 1985). Spatial and temporal frequency tuning have beenseparately reported with fMRI (Singh et al., 2000) and MEG(Adjamian et al., 2004; Fawcett et al., 2004), however, due to anumber of experimental variations used across these studies the dataare difficult to compare directly. Specifically, the spatiotemporalfrequency tuning fMRI experiment of Singh et al. (2000) usedcentrally fixated drifting sinusoids, the spatial frequency MEGexperiment of Adjamian et al. (2004) used centrally fixated squarewave gratings and the temporal frequency tuningMEG experiment ofFawcett et al. (2004) used single visual quadrant square wave check-erboard stimuli. Therefore, in this experiment, wemanipulated spatialand temporal frequency tuning with square wave gratings usingidentical subjects and stimulus parameters in both MEG and fMRIwith the aim of directly comparing their spatiotemporal frequencytuning characteristics.
Methods
Participants, stimuli and paradigm
Ten healthy right-handed volunteers including six females andfour males (mean age 27.5 years; range, 23–36 years) participated inthe experiment after giving informed consent. All procedures were
Fig. 1. Example MEG gamma 40–60 Hz SAM and BOLD images from the highfunctional images displayed are unthresholded amplitude maps for both modalities
approved by the local Ethics Committee. One other participantcompleted the fMRI component but was not asked to complete theMEG due to poor fMRI data quality and similarly a further participantcompleted the MEG component but due to excessive artefact (headmovement) was not asked to complete the fMRI component.
Identical participants, stimuli and paradigm-design were used forboth the MEG and fMRI sessions. This consisted of reversingsquare-wave vertical gratings presented at different spatial andtemporal frequencies displayed using Presentation software (Neu-robehavioral Systems Inc.). Grating stimuli were presented at twospatial frequencies (3 and 0.5 cpd) each at five temporal frequencies(0, 1, 6, 10, and 15 Hz). These frequencies were chosen such thateach image reversal would be an integer multiple of the frame rate ofthe video-card driving the projection systems at 60 Hz at 1024×768pixels. For the MEG, a Sanyo XP41 LCD back-projection systemwas used and for the MRI a Canon Xeed SX60 projector. The abilityof both our sets of stimulus projection equipment to accuratelydisplay the temporal frequencies required was verified using aphotodiode and examining the Fourier spectrum of its digitallyconverted output. Stimuli were presented in the lower left visualfield with the upper right corner of the stimulus located 1° hori-zontally and vertically from a small fixation cross. Stimuli subtended8° both horizontally and vertically. Participants were instructed tomaintain fixation for the entire experiment and to maintain attentionto press a response key at the termination of each stimulation period.500 ms offset jitter was added to each stimulus duration.
On separate days, each participant underwent fMRI or MEGscanning consisting of four identical runs each lasting 10 min back toback. Each run consisted of forty trials in a 15 s boxcar design with a10 s rest period followed by a 5 s active stimulation period. Ourtemporal design was chosen to satisfy several competing designconsiderations. Firstly, we wanted the same timing parameters forboth the MEG and fMRI. Secondly, we wanted relatively short but
spatial frequency, 6 Hz temporal frequency stimulus for participant I. The. MEG values are pseudo-T values and BOLD measures are arbitrary units.
1554 S.D. Muthukumaraswamy, K.D. Singh / NeuroImage 40 (2008) 1552–1560
more trials so that we could examine the temporal characteristics ofthe MEG signal change, and thirdly, we wanted long enough blocklengths to allow the BOLD response to occur and recover. The 10different stimuli were presented in randomised fashion in each of theblocks (each stimulus was presented four times in a run).
MRI/fMRI acquisition and analysis
MRI data were acquired on a 3-T General Electric HDx scannerwith an eight channel receive only head RF coil (Medical Devices).fMRI data were acquired using a gradient echo EPI sequence taking37 axial slices of the whole brain at 3 mm isotropic voxel resolutionusing a 64×64 matrix size, echo time of 35 ms, 90° flip angle and aTR of 2.5 s. For each participant, a 3D FSPGR scan with 1 mmisotropic voxel resolution was also obtained. Both MEG and fMRIdata were coregistered to this high resolution structural scan.
Analysis of fMRI data was analysed using the FSL softwarelibrary (www.fmrib.ox.ac.uk/fsl). The following pre-processing wasapplied; motion correction usingMCFLIRT (Jenkinson et al., 2002);non-brain removal using BET (Smith, 2002); spatial smoothingusing a Gaussian kernel of FWHM 5 mm; mean-based intensitynormalisation of all volumes by the same factor and high-passtemporal filtering (Gaussian-weighted least-squares straight linefitting, with σ=50 s). For each 10-min run, the GLM was used tomodel each of the 10 conditions using a 5 s on/10 s off boxcar todescribe each stimulus. This boxcar function was convolved with astandard HRF to account for hemodynamic effects. To combine thefour runs for each individual a second level analysis was performedusing a fixed effectsmodel, by forcing the random effects variance tozero in FLAME [FMRIB's Local Analysis of Mixed Effects(Beckmann et al., 2003; Woolrich et al., 2004)].
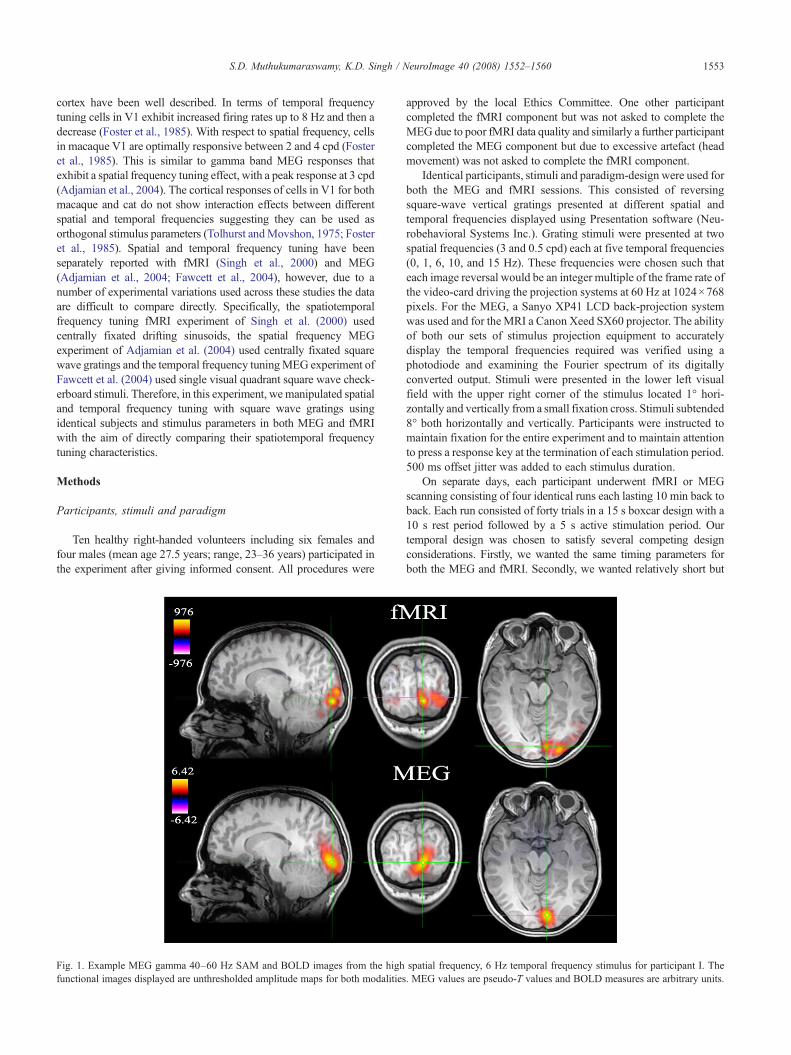
Fig. 2. Group temporal frequency tuning curves for peak responses for the fMRI aboth modalities on the same scale ordinate, magnitudes have been expressed as a peat 100%. The high spatial frequency stimulus was a 3 cpd square wave grating an
MEG acquisition and analysis
Whole-head MEG recordings were made using a 275-channelradial gradiometer system sampled at 600 Hz. An additional 29reference channels were recorded for noise cancellation purposesand the primary sensors were analysed as synthetic third ordergradiometers (Vrba and Robinson, 2001). 3 of the 275 channelswere turned off due to excessive sensor noise. At the commence-ment of each active period of photic stimulation, a TTL pulse wassent to the MEG system. The location of three fiduciary markers(nasion, left and right preauricular) was monitored continuouslythrough the MEG acquisition. In the event that participants movedmore than 5 mm from their initial position, the experiment waspaused between trials and participants were asked by theexperimenter to adjust their head position until it was less than5 mm from the original position as detected by the MEG systemand then the experiment continued.
Offline, each data set was band-pass-filtered using a fourth-orderbi-directional IIR Butterworth filter into four frequency bands 0–20,20–40, 40–60 and 60–80 Hz. Evenly spaced frequency bands wereused so that the accuracy of covariance matrix estimation would beequal for each frequency band (Brookes et al., in press). The SAMbeamformer algorithm as implemented in theCTF software (RobinsonandVrba, 1999)was used to create differential images of source power(pseudo-T statistics) for 5 s of baseline (−5 to 0 s) compared to 5 s ofvisual stimulation (0 to 5 s). Only 5 s of the baseline period was usedfor baseline estimation to achieve balanced covariance estimationbetween stimulated and unstimulated states. Details of the calculationof SAM pseudo-T source image statistics are described in detail in anumber of sources (Cheyne et al., 2003; Hillebrand et al., 2005;Robinson and Vrba, 1999; Singh et al., 2003a,b; Vrba and Robinson,
nd MEG Gamma (40–60 Hz) band in primary visual cortex. In order to plotrcentage of the maximum response hence each modality has one anchor pointd the low spatial frequency 0.5 cpd.
1555S.D. Muthukumaraswamy, K.D. Singh / NeuroImage 40 (2008) 1552–1560
2001). To achieve MRI/MEG co-registration, prior to the MEGacquisition, fiduciary markers were placed at fixed distances fromanatomical landmarks identifiable in participants' anatomical MRIs(tragus, eye centre). Fiduciary locations were verified afterwards usinghigh-resolution digital photographs. For source localisation, a multi-ple, local-spheres-forward model was derived by fitting spheres to thebrain surface extracted by BET (Huang et al., 1999). Estimates ofthe three-dimensional distribution of source power were derived forthe whole head at 3 mm isotropic voxel resolution for each subject,frequency-band and condition.
Virtual sensors were generated by using SAM beamformercoefficients obtained using the individual condition covariancematrices band pass filtered between 0 and 100 Hz and returningtime-series from peak locations in primary visual cortex for eachtrial (Robinson and Vrba, 1999). Time–frequency analysis ofvirtual sensors was conducted using slepian multitapers (Jarvis andMitra, 2001; Mitra and Pesaran, 1999; Percival and Walden, 1993;Thomson 1982) as implemented in the FieldTrip toolbox (www.ru.nl/fcdonders/fieldtrip). Time–frequency spectrograms are presentedas a percentage change from the baseline energy for each frequencyband.
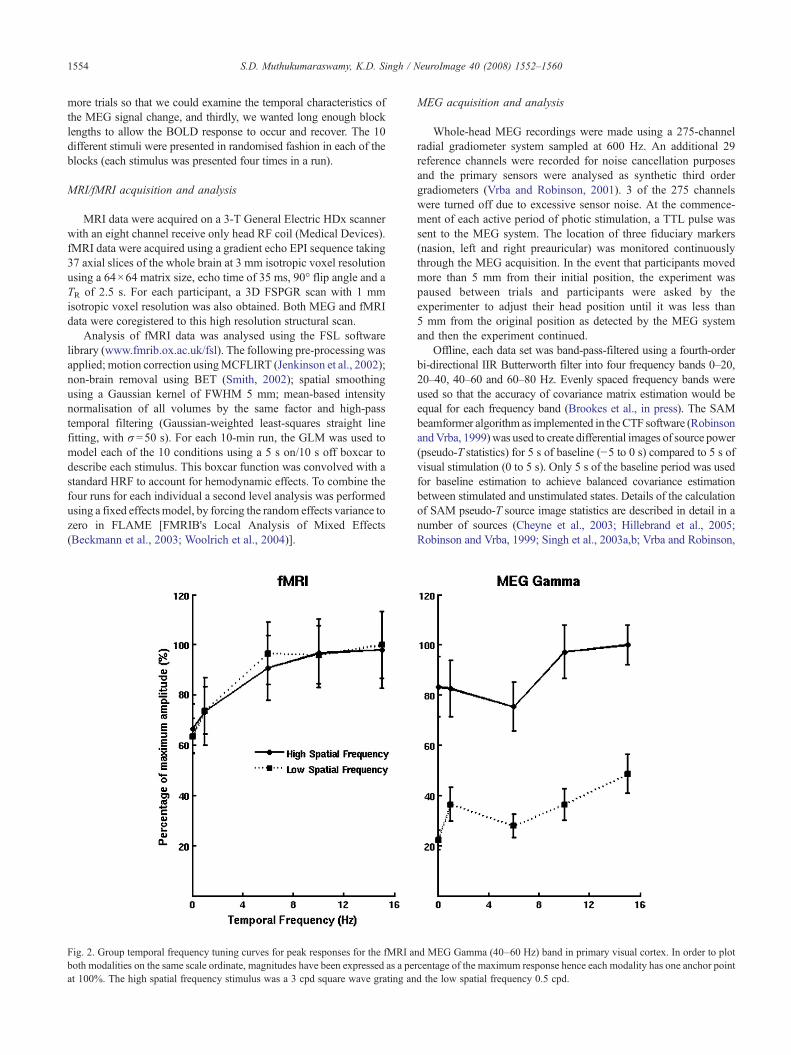
Fig. 3. Grand-averaged time–frequency spectrograms from MEG virtual sensorsEnergy values are represented as a percentage change from the baseline energy (calcof both evoked and induced power.
Group-level analysis (both MEG and fMRI)
For group analysis of both MEG and fMRI data sets, imageswere normalised using FLIRT into MNI template space using anaffine transform. Non-parametric permutation tests were conductedusing the full permutation set (1024) for each condition with 5 mmvariance smoothing and thresholded using the omnibus test statisticvalue at pb .05 (Nichols and Holmes, 2002; Singh et al., 2003a,b).
Results
Fig. 1 illustrates example MEG and fMRI activations from asingle participant using the unthresholded amplitude maps for theBOLD response and the MEG gamma response. It can be seen thatthere is a high spatial overlap between the MEG response and themedial activation in the fMRI response. While the MEG gammaimage is dominated by a single activation, the fMRI response hasseveral foci that extend into more lateral visual areas.
Statistical group images for the SAM images showed significantactivation for theMEG in the 40–60 Hz (gamma) frequency for all 10of the conditions, located in medial visual cortex (BA 17/18). No
constructed in peak locations in primary visual cortex for each condition.ulated for each frequency band). These spectrograms represent a combination
1556 S.D. Muthukumaraswamy, K.D. Singh / NeuroImage 40 (2008) 1552–1560
consistent oscillatory changes were seen in the lower frequency bands(10 conditions×2 frequency bands=20 analyses). Significant effectswere seen in all 10 conditions for the 60- Hz frequency band inlocations similar to the 40- Hz frequency band. Inspection ofindividual data showed that these responses were weaker and morespatially variable than the 40- Hz band, suggesting that this frequencyband was reflecting the upper frequency part of the activity seen in the40- Hz band.
Because the images were dominated by 40- Hz gamma bandactivity, we quantified the peak 40-Hz band activity (in primary visualcortex) and compared it to the BOLD amplitude measures in primaryvisual cortex for each individual for each of the 10 conditions. Fig. 2illustrates the results of this analysis and plots the spatial and temporalfrequency tuning curves of the MEG gamma source power and theBOLD response. In order to plot the two modalities on the sameordinate, amplitudes have been expressed as a percentage of themaximum amplitude measure for each modality. This figuredemonstrates that a clear difference exists in the spatial frequencytuning of theMEGgamma band at each temporal frequency. The highspatial frequency stimulus of 3 Hz elicited approximately three timesmore source power in this band than the 0.5 Hz spatial frequency
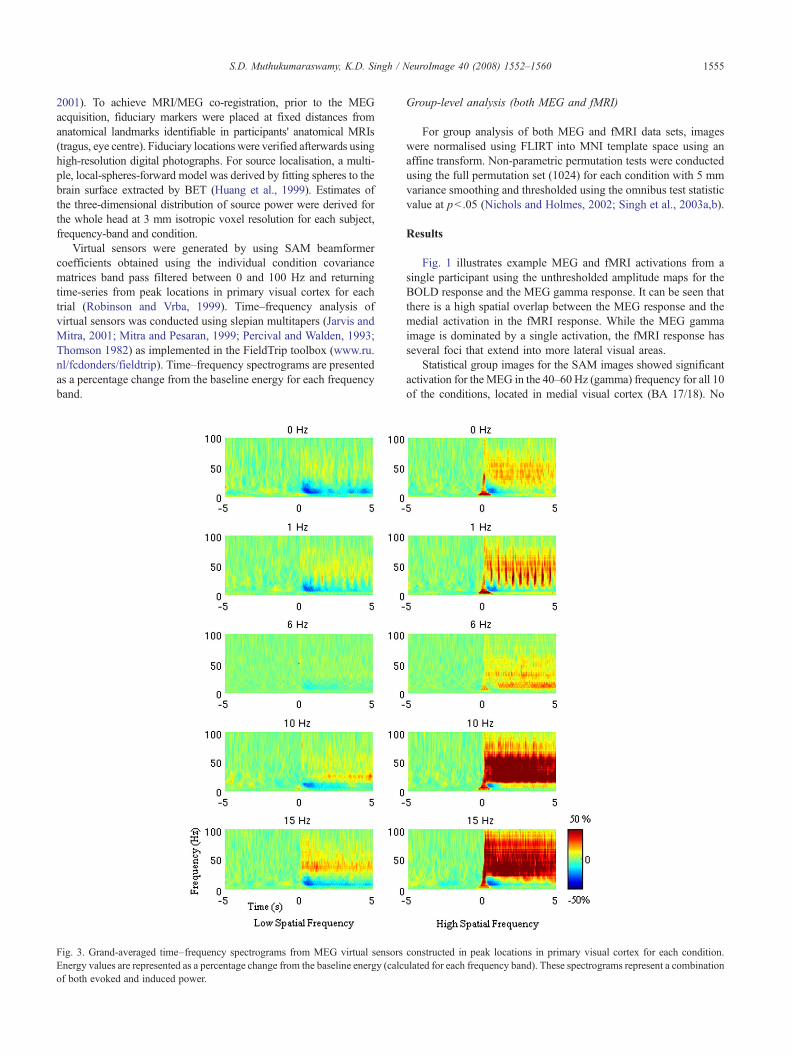
Fig. 4. Grand-averaged time–frequency spectrograms from the same virtual sensorshence these spectrograms represent only evoked power changes in the virtual sensorseen for the 6, 10 and 15 Hz conditions.
stimulus.However, this pattern is not reflected in the spatial frequencytuning for BOLD for which the high and low spatial frequency stimulishow an almost identical pattern. With regards to temporal frequencytuning the two modalities also show differences. BOLD showed anincreasing response up to 6 Hz and then plateaued whereas MEGshows a generally increasing amount of source power with temporalfrequency but a decrease at 6 Hz for both spatial frequencies. For theMEG data in Fig. 2, a repeated-measures two-way ANOVA foundsignificant main effects of spatial [F(1,9)=40.7, pb .001] andtemporal frequency [F(4,36)=14.78, pb .001] but no interactioneffect [F(4,36)=1.66, p=.181]. For the corresponding BOLD data inFig. 2, a significant effect of temporal frequency [F(4,36)=24.26,pb .001] was found but no main effect of spatial frequency [F(1,9)=0.086, p=.77] or interaction effect [F(4,36)=1.86, p=.139].
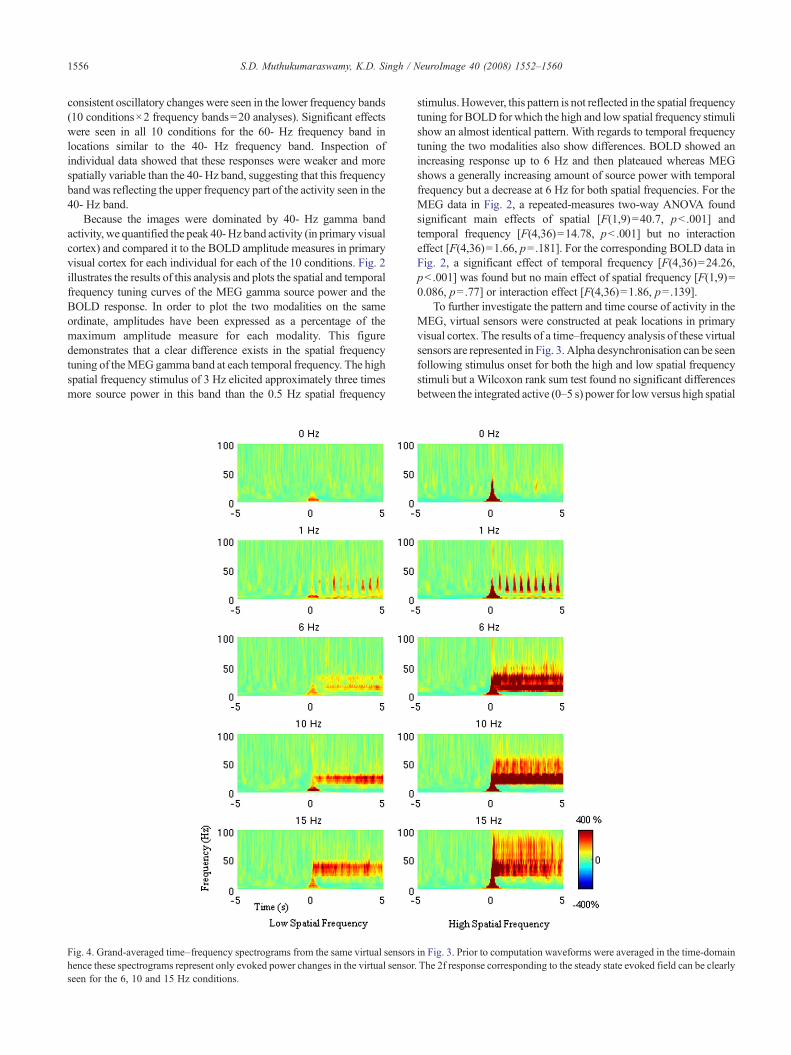
To further investigate the pattern and time course of activity in theMEG, virtual sensors were constructed at peak locations in primaryvisual cortex. The results of a time–frequency analysis of these virtualsensors are represented in Fig. 3. Alpha desynchronisation can be seenfollowing stimulus onset for both the high and low spatial frequencystimuli but a Wilcoxon rank sum test found no significant differencesbetween the integrated active (0–5 s) power for low versus high spatial
in Fig. 3. Prior to computation waveforms were averaged in the time-domain. The 2f response corresponding to the steady state evoked field can be clearly
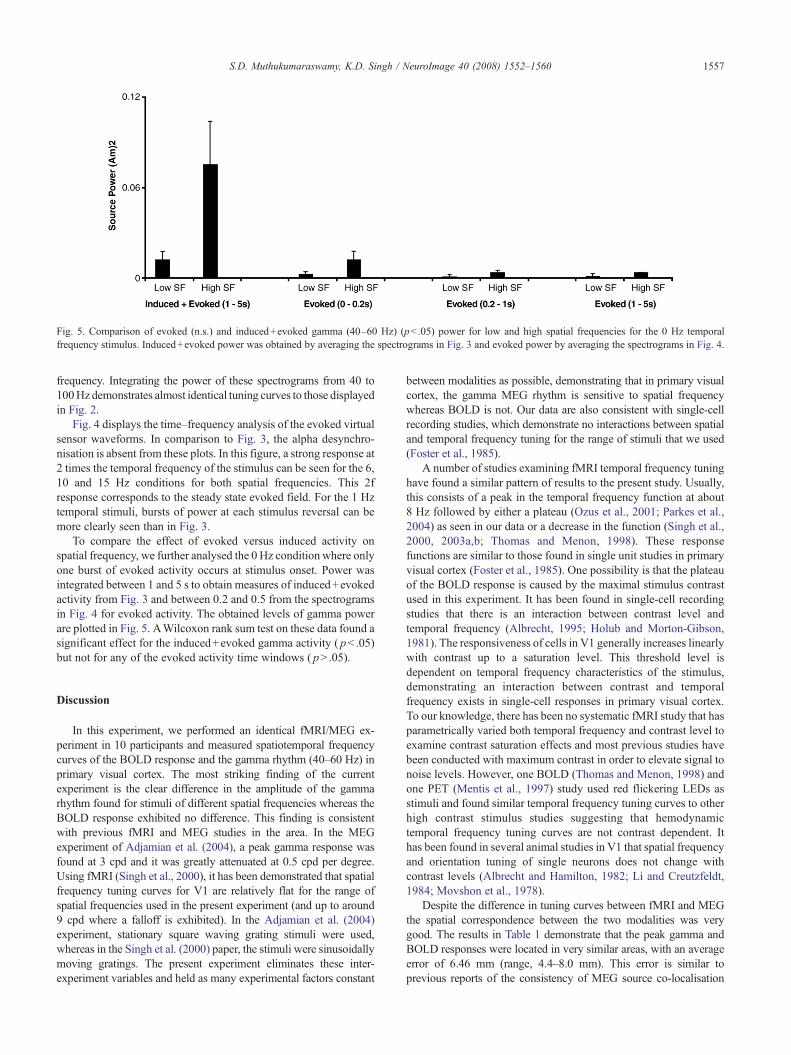
Fig. 5. Comparison of evoked (n.s.) and induced+evoked gamma (40–60 Hz) (pb .05) power for low and high spatial frequencies for the 0 Hz temporalfrequency stimulus. Induced+evoked power was obtained by averaging the spectrograms in Fig. 3 and evoked power by averaging the spectrograms in Fig. 4.
1557S.D. Muthukumaraswamy, K.D. Singh / NeuroImage 40 (2008) 1552–1560
frequency. Integrating the power of these spectrograms from 40 to100Hz demonstrates almost identical tuning curves to those displayedin Fig. 2.
Fig. 4 displays the time–frequency analysis of the evoked virtualsensor waveforms. In comparison to Fig. 3, the alpha desynchro-nisation is absent from these plots. In this figure, a strong response at2 times the temporal frequency of the stimulus can be seen for the 6,10 and 15 Hz conditions for both spatial frequencies. This 2fresponse corresponds to the steady state evoked field. For the 1 Hztemporal stimuli, bursts of power at each stimulus reversal can bemore clearly seen than in Fig. 3.
To compare the effect of evoked versus induced activity onspatial frequency, we further analysed the 0 Hz condition where onlyone burst of evoked activity occurs at stimulus onset. Power wasintegrated between 1 and 5 s to obtain measures of induced+evokedactivity from Fig. 3 and between 0.2 and 0.5 from the spectrogramsin Fig. 4 for evoked activity. The obtained levels of gamma powerare plotted in Fig. 5. AWilcoxon rank sum test on these data found asignificant effect for the induced+evoked gamma activity ( pb .05)but not for any of the evoked activity time windows ( pN .05).
Discussion
In this experiment, we performed an identical fMRI/MEG ex-periment in 10 participants and measured spatiotemporal frequencycurves of the BOLD response and the gamma rhythm (40–60 Hz) inprimary visual cortex. The most striking finding of the currentexperiment is the clear difference in the amplitude of the gammarhythm found for stimuli of different spatial frequencies whereas theBOLD response exhibited no difference. This finding is consistentwith previous fMRI and MEG studies in the area. In the MEGexperiment of Adjamian et al. (2004), a peak gamma response wasfound at 3 cpd and it was greatly attenuated at 0.5 cpd per degree.Using fMRI (Singh et al., 2000), it has been demonstrated that spatialfrequency tuning curves for V1 are relatively flat for the range ofspatial frequencies used in the present experiment (and up to around9 cpd where a falloff is exhibited). In the Adjamian et al. (2004)experiment, stationary square waving grating stimuli were used,whereas in the Singh et al. (2000) paper, the stimuli were sinusoidallymoving gratings. The present experiment eliminates these inter-experiment variables and held as many experimental factors constant
between modalities as possible, demonstrating that in primary visualcortex, the gamma MEG rhythm is sensitive to spatial frequencywhereas BOLD is not. Our data are also consistent with single-cellrecording studies, which demonstrate no interactions between spatialand temporal frequency tuning for the range of stimuli that we used(Foster et al., 1985).
A number of studies examining fMRI temporal frequency tuninghave found a similar pattern of results to the present study. Usually,this consists of a peak in the temporal frequency function at about8 Hz followed by either a plateau (Ozus et al., 2001; Parkes et al.,2004) as seen in our data or a decrease in the function (Singh et al.,2000, 2003a,b; Thomas and Menon, 1998). These responsefunctions are similar to those found in single unit studies in primaryvisual cortex (Foster et al., 1985). One possibility is that the plateauof the BOLD response is caused by the maximal stimulus contrastused in this experiment. It has been found in single-cell recordingstudies that there is an interaction between contrast level andtemporal frequency (Albrecht, 1995; Holub and Morton-Gibson,1981). The responsiveness of cells in V1 generally increases linearlywith contrast up to a saturation level. This threshold level isdependent on temporal frequency characteristics of the stimulus,demonstrating an interaction between contrast and temporalfrequency exists in single-cell responses in primary visual cortex.To our knowledge, there has been no systematic fMRI study that hasparametrically varied both temporal frequency and contrast level toexamine contrast saturation effects and most previous studies havebeen conducted with maximum contrast in order to elevate signal tonoise levels. However, one BOLD (Thomas and Menon, 1998) andone PET (Mentis et al., 1997) study used red flickering LEDs asstimuli and found similar temporal frequency tuning curves to otherhigh contrast stimulus studies suggesting that hemodynamictemporal frequency tuning curves are not contrast dependent. Ithas been found in several animal studies in V1 that spatial frequencyand orientation tuning of single neurons does not change withcontrast levels (Albrecht and Hamilton, 1982; Li and Creutzfeldt,1984; Movshon et al., 1978).
Despite the difference in tuning curves between fMRI and MEGthe spatial correspondence between the two modalities was verygood. The results in Table 1 demonstrate that the peak gamma andBOLD responses were located in very similar areas, with an averageerror of 6.46 mm (range, 4.4–8.0 mm). This error is similar toprevious reports of the consistency of MEG source co-localisation
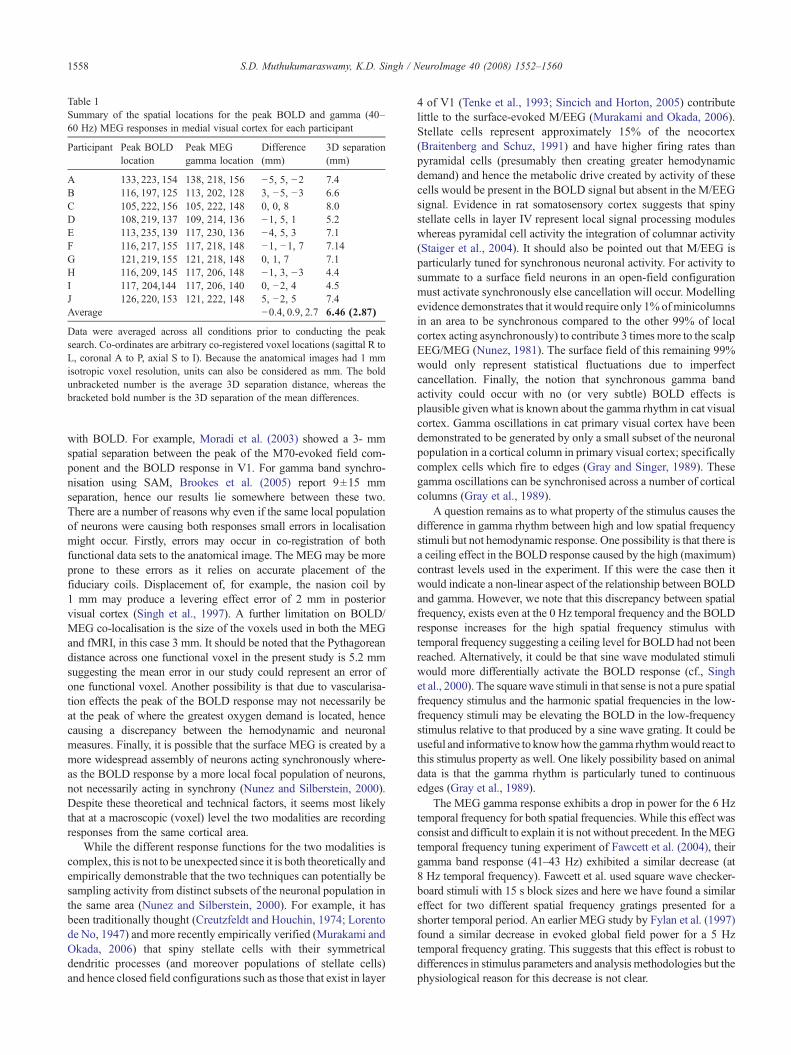
Table 1Summary of the spatial locations for the peak BOLD and gamma (40–60 Hz) MEG responses in medial visual cortex for each participant
Participant Peak BOLDlocation
Peak MEGgamma location
Difference(mm)
3D separation(mm)
A 133, 223, 154 138, 218, 156 −5, 5, −2 7.4B 116, 197, 125 113, 202, 128 3, −5, −3 6.6C 105, 222, 156 105, 222, 148 0, 0, 8 8.0D 108, 219, 137 109, 214, 136 −1, 5, 1 5.2E 113, 235, 139 117, 230, 136 −4, 5, 3 7.1F 116, 217, 155 117, 218, 148 −1, −1, 7 7.14G 121, 219, 155 121, 218, 148 0, 1, 7 7.1H 116, 209, 145 117, 206, 148 −1, 3, −3 4.4I 117, 204,144 117, 206, 140 0, −2, 4 4.5J 126, 220, 153 121, 222, 148 5, −2, 5 7.4Average −0.4, 0.9, 2.7 6.46 (2.87)
Data were averaged across all conditions prior to conducting the peaksearch. Co-ordinates are arbitrary co-registered voxel locations (sagittal R toL, coronal A to P, axial S to I). Because the anatomical images had 1 mmisotropic voxel resolution, units can also be considered as mm. The boldunbracketed number is the average 3D separation distance, whereas thebracketed bold number is the 3D separation of the mean differences.
1558 S.D. Muthukumaraswamy, K.D. Singh / NeuroImage 40 (2008) 1552–1560
with BOLD. For example, Moradi et al. (2003) showed a 3- mmspatial separation between the peak of the M70-evoked field com-ponent and the BOLD response in V1. For gamma band synchro-nisation using SAM, Brookes et al. (2005) report 9±15 mmseparation, hence our results lie somewhere between these two.There are a number of reasons why even if the same local populationof neurons were causing both responses small errors in localisationmight occur. Firstly, errors may occur in co-registration of bothfunctional data sets to the anatomical image. The MEG may be moreprone to these errors as it relies on accurate placement of thefiduciary coils. Displacement of, for example, the nasion coil by1 mm may produce a levering effect error of 2 mm in posteriorvisual cortex (Singh et al., 1997). A further limitation on BOLD/MEG co-localisation is the size of the voxels used in both the MEGand fMRI, in this case 3 mm. It should be noted that the Pythagoreandistance across one functional voxel in the present study is 5.2 mmsuggesting the mean error in our study could represent an error ofone functional voxel. Another possibility is that due to vascularisa-tion effects the peak of the BOLD response may not necessarily beat the peak of where the greatest oxygen demand is located, hencecausing a discrepancy between the hemodynamic and neuronalmeasures. Finally, it is possible that the surface MEG is created by amore widespread assembly of neurons acting synchronously where-as the BOLD response by a more local focal population of neurons,not necessarily acting in synchrony (Nunez and Silberstein, 2000).Despite these theoretical and technical factors, it seems most likelythat at a macroscopic (voxel) level the two modalities are recordingresponses from the same cortical area.
While the different response functions for the two modalities iscomplex, this is not to be unexpected since it is both theoretically andempirically demonstrable that the two techniques can potentially besampling activity from distinct subsets of the neuronal population inthe same area (Nunez and Silberstein, 2000). For example, it hasbeen traditionally thought (Creutzfeldt and Houchin, 1974; Lorentode No, 1947) and more recently empirically verified (Murakami andOkada, 2006) that spiny stellate cells with their symmetricaldendritic processes (and moreover populations of stellate cells)and hence closed field configurations such as those that exist in layer
4 of V1 (Tenke et al., 1993; Sincich and Horton, 2005) contributelittle to the surface-evoked M/EEG (Murakami and Okada, 2006).Stellate cells represent approximately 15% of the neocortex(Braitenberg and Schuz, 1991) and have higher firing rates thanpyramidal cells (presumably then creating greater hemodynamicdemand) and hence the metabolic drive created by activity of thesecells would be present in the BOLD signal but absent in the M/EEGsignal. Evidence in rat somatosensory cortex suggests that spinystellate cells in layer IV represent local signal processing moduleswhereas pyramidal cell activity the integration of columnar activity(Staiger et al., 2004). It should also be pointed out that M/EEG isparticularly tuned for synchronous neuronal activity. For activity tosummate to a surface field neurons in an open-field configurationmust activate synchronously else cancellation will occur. Modellingevidence demonstrates that it would require only 1%ofminicolumnsin an area to be synchronous compared to the other 99% of localcortex acting asynchronously) to contribute 3 timesmore to the scalpEEG/MEG (Nunez, 1981). The surface field of this remaining 99%would only represent statistical fluctuations due to imperfectcancellation. Finally, the notion that synchronous gamma bandactivity could occur with no (or very subtle) BOLD effects isplausible given what is known about the gamma rhythm in cat visualcortex. Gamma oscillations in cat primary visual cortex have beendemonstrated to be generated by only a small subset of the neuronalpopulation in a cortical column in primary visual cortex; specificallycomplex cells which fire to edges (Gray and Singer, 1989). Thesegamma oscillations can be synchronised across a number of corticalcolumns (Gray et al., 1989).
A question remains as to what property of the stimulus causes thedifference in gamma rhythm between high and low spatial frequencystimuli but not hemodynamic response. One possibility is that there isa ceiling effect in the BOLD response caused by the high (maximum)contrast levels used in the experiment. If this were the case then itwould indicate a non-linear aspect of the relationship between BOLDand gamma. However, we note that this discrepancy between spatialfrequency, exists even at the 0 Hz temporal frequency and the BOLDresponse increases for the high spatial frequency stimulus withtemporal frequency suggesting a ceiling level for BOLD had not beenreached. Alternatively, it could be that sine wave modulated stimuliwould more differentially activate the BOLD response (cf., Singhet al., 2000). The square wave stimuli in that sense is not a pure spatialfrequency stimulus and the harmonic spatial frequencies in the low-frequency stimuli may be elevating the BOLD in the low-frequencystimulus relative to that produced by a sine wave grating. It could beuseful and informative to knowhow the gamma rhythmwould react tothis stimulus property as well. One likely possibility based on animaldata is that the gamma rhythm is particularly tuned to continuousedges (Gray et al., 1989).
The MEG gamma response exhibits a drop in power for the 6 Hztemporal frequency for both spatial frequencies. While this effect wasconsist and difficult to explain it is not without precedent. In theMEGtemporal frequency tuning experiment of Fawcett et al. (2004), theirgamma band response (41–43 Hz) exhibited a similar decrease (at8 Hz temporal frequency). Fawcett et al. used square wave checker-board stimuli with 15 s block sizes and here we have found a similareffect for two different spatial frequency gratings presented for ashorter temporal period. An earlier MEG study by Fylan et al. (1997)found a similar decrease in evoked global field power for a 5 Hztemporal frequency grating. This suggests that this effect is robust todifferences in stimulus parameters and analysis methodologies but thephysiological reason for this decrease is not clear.
1559S.D. Muthukumaraswamy, K.D. Singh / NeuroImage 40 (2008) 1552–1560
The present data demonstrate that MEG and BOLD showdifferences in spatial and temporal frequency tuning, suggesting thatpotentially different neuronal populations contribute to their signaland/or that a complex non-linear relationship exists between theBOLD effect and the surfaceMEG.However, it should be pointed outthat other experimental manipulations such as visual contrast tuningmay yield less complex results (although this has not been testeddirectly). It has been found with MEG, using similar techniques tothose here, that gamma oscillations increase linearly with contrastenhancement (Hall et al., 2005). This linear increase is similar to thatseen inmulti-unit recordings of the macaque (Logothetis et al., 2001).Further, it has been shown in cat visual cortex with simultaneousrecording that gamma local field potential oscillations and hemody-namic responses measured with optical imaging show a correlationand both increase with stimulus contrast (Niessing et al., 2005).Therefore, it seems that both BOLD and gamma would linearlyincrease with contrast.
In summary, the present experiment examined and comparedthe spatial and temporal frequency tuning characteristics of theBOLD response with gamma band MEG activity in primary visualcortex. The two responses showed a high degree of congruence intheir spatial characteristics but distinctly different tuning char-acteristics. This suggests that the relationship between the twoeither contains a number of non-linear elements and/or that theymeasure distinct subsets of the total neuronal activity.
Acknowledgments
Krish Singh is supported by the Biotechnology and BiologicalSciences Research Council (BBSRC) grant number BBS/B/08035.
References
Adjamian, P, Holliday, IE, Barnes, GR, Hillebrand, A, Hadjipapas, A, Singh,KD, 2004. Induced visual illusions and gamma oscillations in humanprimary visual cortex. Eur. J. Neurosci. 20 (2), 587–592.
Albrecht, DG, 1995. Visual-cortex neurons in monkey and cat—effect ofcontrast on the spatial and temporal phase-transfer functions. Vis.Neurosci. 12 (6), 1191–1210.
Albrecht, DG, Hamilton, DB, 1982. Striate cortex of monkey and cat—contrast response function. J. Neurophysiol. 48 (1), 217–237.
Arieli, A, Grinvald, A, 2002. Optical imaging combined with targetedelectrical recordings, microstimulation, or tracer injections. J. Neurosci.Methods 116, 15–28.
Beckmann, CF, Jenkinson, M, Smith, SM, 2003. General multilevellinear modeling for group analysis in fMRI. NeuroImage 20 (2),1052–1063.
Braitenberg, V, Schuz, A, 1991. Anatomy of the Cortex, Statistics andGeometry. Springer, New York.
Brookes, MJ, Vrba, J, Robinson, SE, Stevenson, CM, Peters, AM, Barnes,GR, Hillebrand, A, Morris, PG, in press. Optimising experimentaldesign for MEG beamformer imaging. Neuroimage.
Brookes, MJ, Gibson, AM, Hall, SD, Furlong, PL, Barnes, GR, Hillebrand,A, Singh, KD, Holliday, IE, Francis, ST, Morris, PG, 2005. GLM-beamformer method demonstrates stationary field, alpha ERD andgamma ERS co-localisation with fMRI BOLD response in visual cortex.NeuroImage 26 (1), 302–308.
Cheyne, D, Gaetz, W, Garnero, L, Lachaux, J-P, Ducorps, A, Schwartz, D,Varela, FJ, 2003. Neuromagnetic imaging of cortical oscillationsaccompanying tactile stimulation. Cogn. Brain Res. 17, 599–611.
Creutzfeldt, O, Houchin, J, 1974. Neuronal basis of EEGwaves. In: Redmond,A. (Ed.), Handbook of Electroencephalography and Clinical Neurophy-siology. Elsevier, Amsterdam, pp. 5–55.
Fawcett, IP, Barnes, GR, Hillebrand, A, Singh, KD, 2004. The temporalfrequency tuning of human visual cortex investigated using syntheticaperture magnetometry. NeuroImage 21 (4), 1542–1553.
Foster, KH, Gaska, JP, Nagler, M, Pollen, DA, 1985. Spatial and temporalfrequency selectivity of neurones in visual cortical areas V1 and V2 ofthe macaque monkey. J. Physiol. 365, 331–363.
Fylan, F, Holliday, IE, Singh, IE, Anderson, SJ, Harding, GFA, 1997.Magnetoencephalographic investigation of human cortical area V1 usingcolor stimuli. NeuroImage 6, 47–57.
Gray, CM, Konig, P, Engel, AK, Singer, W, 1989. Oscillatory responses incat visual-cortex exhibit inter-columnar synchronization which reflectsglobal stimulus properties. Nature 338 (6213), 334–337.
Gray, CM, Singer, W, 1989. Stimulus-specific neuronal oscillations inorientation columns of cat visual-cortex. Proc. Natl. Acad. Sci. U. S. A.86 (5), 1698–1702.
Hall, SD, Holliday, IE, Hillebrand, A, Singh, KD, Furlong, PL, Hadjipapas,A, Barnes, GR, 2005. The missing link: analogous human and primatecortical gamma oscillations. NeuroImage 26 (1), 13–17.
Hillebrand, A, Singh, KD, Holliday, I, Furlong, PL, Barnes, GR, 2005. Anew approach to neuroimaging with magnetoencephalography. Hum.Brain Mapp. 25, 199–211.
Holub, MA, Morton-Gibson, M, 1981. Response of visual cortical neuronsof the cat to moving sinusoidal gratings: response-contrast functions andspatiotemporal interactions. J. Neurophysiol. 46 (6), 1244–1259.
Huang, MX, Mosher, JC, Leahy, RM, 1999. A sensor-weighted over-lapping-sphere head model and exhaustive head model comparison forMEG. Phys. Med. Biol. 44 (2), 423–440.
Jarvis, MR, Mitra, PP, 2001. Sampling properties of the spectrum andcoherency of action potentials. Neural Comput. 13 (4), 717–749.
Jenkinson, M, Bannister, P, Brady, M, Smith, S, 2002. Improvedoptimization for the robust and accurate linear registration and motioncorrection of brain images. NeuroImage 17 (2), 825–841.
Li, CY, Creutzfeldt, O, 1984. The representation of contrast and otherstimulus parameters by single neurons in area-17 of the cat. PflugersArch. Eur. J. Phys. 401 (3), 304–314.
Logothetis, NK, Pauls, J, Augath, M, Trinath, T, Oeltermann, A, 2001.Neurophysiological investigation of the basis of the fMRI signal. Nature412, 150–157.
Lorento de No, R, 1947. Action potential of the motoneurons of thehypoglossal nucleus. J. Cell. Comp. Physiol. 29, 207–287.
Mentis, MJ, Alexander, GE, Grady, CL, Horwitz, B, Krasuski, J, Pietrini, P,et al., 1997. Frequency variation of a pattern-flash visual stimulus duringPET differentially activates brain from striate through frontal cortex.NeuroImage 5 (2), 116–128.
Mitra, PP, Pesaran, B, 1999. Analysis of dynamic brain imaging data.Biophys. J. 76 (2), 691–708.
Moradi, F, Liu, LC, Cheng, K, Waggoner, RA, Tanaka, K, Ioannides,AA, 2003. Consistent and precise localization of brain activity inhuman primary visual cortex by MEG and fMRI. NeuroImage 18 (3),595–609.
Movshon, JA, Thompson, ID, Tolhurst, DJ, 1978. Spatial and temporalcontrast sensitivity of neurons in areas-17 and areas-18 of cats visual-cortex. J. Physiol.-London 283, 101–120 (Oct).
Mukamel, R, Gelbard, H, Arieli, A, Hasson, U, Fried, I, Malach, R, 2007.Coupling between neuronal firing, field potentials, and fMRI in humanauditory cortex. Science 309, 951–954.
Murakami, S, Okada, Y, 2006. Contributions of principal neocorticalneurons to magnetoencephalography and electroencephalography sig-nals. J. Physiol.-London 575 (3), 925–936.
Nichols, TE, Holmes, AP, 2002. Nonparametric permutation tests forfunctional neuroimaging: A primer with examples. Hum. Brain Mapp.15 (1), 1–25.
Niessing, J, Ebisch, B, Schmidt, KE, Niessing, M, Singer, W, Galuske,RAW, 2005. Hemodynamic signals correlate tightly with synchronizedgamma oscillations. Science 309 (5736), 948–951.
Nunez, PL, 1981. Electric Fields of the Brain: the Neurophysics of EEG.Oxford University Press, New York.
1560 S.D. Muthukumaraswamy, K.D. Singh / NeuroImage 40 (2008) 1552–1560
Nunez, PL, Silberstein, RB, 2000. On the relationship of synaptic activity tomacroscopic measurements: does co-registration of EEG with fMRImake sense? Brain Topogr. 13 (2), 79–96.
Ozus, B, Liu, HL, Chen, L, Iyer, MB, Fox, PT, Gao, JH, 2001. Ratedependence of human visual cortical response due to brief stimulation:an event-related fMRI study. Magn. Reson. Imaging 19 (1), 21–25.
Parkes, LM, Fries, P, Kerskens, CM, Norris, DG, 2004. Reduced BOLDresponse to periodic visual stimulation. NeuroImage 21 (1), 236–243.
Percival, DB, Walden, WT, 1993. Spectral Analysis for Physical Applica-tions: Multitaper and Conventional Univariate Techniques. CambridgeUniversity Press.
Robinson, SE, Vrba, J, 1999. Functional neuroimaging by synthetic aperturemagnetometry (SAM). In: Yoshimoto, T., Kotani, M., Kuriki, S., Karibe,H., Nakasato, N. (Eds.), Recent Advances in Biomagnetism. TohokuUniversity Press, Sendai, pp. 302–305.
Sincich, LC, Horton, JC, 2005. The circuitry of V1 and V2: integration ofcolor, form, and motion. Annu. Rev. Neurosci. 28, 303–326.
Singh, KD, Holliday, IE, Furlong, PL, Harding, GFA, 1997. Eva-luation of MRI-MEG/EEG co-registration strategies using MonteCarlo simulation. Electroencephalogr. Clin. Neurophysiol. 102 (2),81–85.
Singh, KD, Smith, AT, Greenlee, MW, 2000. Spatiotemporal frequency anddirection sensitivities of human visual areas measured using fMRI.Neuroimage 12 (5), 550–564.
Singh, KD, Barnes, GR, Hillebrand, A, Forde, EME, Williams, AL, 2002.Task-related changes in cortical synchronization are spatially coincidentwith the hemodynamic response. NeuroImage 16 (1), 103–114.
Singh, KD, Barnes, GR, Hillebrand, A, 2003a. Group imaging of task-related changes in cortical synchronisation using nonparametricpermutation testing. NeuroImage 19 (4), 1589–1601.
Singh, M, Kim, S, Kim, T-S, 2003b. Correlation between BOLD-fMRI andEEG signal changes in response to visual stimulus frequency in humans.Magn. Reson. Med. 49, 108–114.
Smith, SM, 2002. Fast robust automated brain extraction. Hum. BrainMapp.17 (3), 143–155.
Staiger, JF, Flagmeyer, I, Schubert, D, Zilles, K, Kotter, R, Luhmann, HJ,2004. Functional diversity of layer IV spiny neurons in rat somatosen-sory cortex: quantitative morphology of electrophysiologically char-acterized and biocytin labeled cells. Cereb. Cortex 14 (6), 690–701.
Tenke, CE, Schroeder, CE, Arezzo, JC, Vaughan, HG, 1993. Interpretation ofhigh-resolution current source density profiles— a simulation of sublaminarcontributions to the visual-evoked potential. Exp.BrainRes. 94 (2), 183–192.
Thomas, CG, Menon, RS, 1998. Amplitude response and stimuluspresentation frequency response of human primary visual cortex usingBOLD EPI at 4 T. Magn. Reson. Med. 40 (2), 203–209.
Thomson, DJ, 1982. Spectrum estimations and harmonic analysis. Proc.I.E.E.E. 70 (9), 1055–1096.
Tolhurst, DJ, Movshon, JA, 1975. Spatial and temporal contrast sensitivityof striate cortical neurones. Nature 257 (5528), 674–675.
Vrba, J, Robinson, SE, 2001. Signal processing in magnetoencephalography.Methods 25 (2), 249–271.
Woolrich, MW, Behrens, TEJ, Beckmann, CF, Jenkinson, M, Smith, SM,2004.Multilevel linear modelling for FMRI group analysis using Bayesianinference. NeuroImage 21 (4), 1732–1747.
Copyright © 2022 FDOKUMEN