Tivoli Decision Support for z/OS: Distributed Systems ... - IBM
252
IBM Tivoli Decision Support for z/OS Version 1.8.2 Distributed Systems Performance Feature Guide and Reference SH19-4018-13 IBM
-
Upload
khangminh22 -
Category
Documents
-
view
2 -
download
0
Transcript of Tivoli Decision Support for z/OS: Distributed Systems ... - IBM

IBM Tivoli Decision Support for z/OSVersion 1.8.2
Distributed Systems PerformanceFeature Guide and Reference
SH19-4018-13
IBM

IBM Tivoli Decision Support for z/OSVersion 1.8.2
Distributed Systems PerformanceFeature Guide and Reference
SH19-4018-13
IBM

Before using this information and the product it supports, read the information in “Notices” on page 217.
Thirteenth Edition (March 2015)
This edition applies to version 1, release 8, modification level 2 of Tivoli Decision Support for z/OS (programnumber 5698-B06) and to all subsequent releases and modifications until otherwise indicated in new editions.
© COPYRIGHT INTERNATIONAL BUSINESS MACHINES CORPORATION. ALL RIGHTS RESERVED. 1994, 2015

Contents
Figures . . . . . . . . . . . . . . . ix
Preface . . . . . . . . . . . . . . . xiWho should read this book . . . . . . . . . xiWhat this book contains . . . . . . . . . . xiPublications . . . . . . . . . . . . . . xiii
Tivoli Decision Support for z/OS library . . . xiiiAccessing terminology online . . . . . . . xivAccessing publications online . . . . . . . xiv
Accessibility . . . . . . . . . . . . . . xvTivoli technical training . . . . . . . . . . xvSupport information . . . . . . . . . . . xvConventions used in this book . . . . . . . . xv
Typeface conventions . . . . . . . . . . xv
Part 1. Distributed SystemsPerformance Feature Guide . . . . . 1
Chapter 1. Introducing the DistributedSystems Performance feature . . . . . 3Gathering and collecting performance data . . . . 4
Report Groups. . . . . . . . . . . . . 5
Chapter 2. Installing and configuring theDistributed component . . . . . . . . 7Planning the implementation process . . . . . . 7Installing and configuring your distributed nodes . . 7Installing and configuring your SLES nodes . . . . 8
Step 1: Checking requirements (SLES) . . . . . 8Disk space requirements . . . . . . . . 8Software requirements . . . . . . . . . 9
Step 2: Preparing and installing Tivoli DecisionSupport for z/OS code on the distributed node(SLES) . . . . . . . . . . . . . . . 9Step 3: Configuring the distributed node (SLES) 10Step 4: Starting the distributed node (SLES) . . 11Step 5: Configuring auto start on the distributednode (SLES) . . . . . . . . . . . . . 12
Installing and configuring your RHEL nodes . . . 12Step 1: Checking requirements (RHEL) . . . . 12
Disk space requirements . . . . . . . . 13Software requirements . . . . . . . . . 13
Step 2: Preparing and installing Tivoli DecisionSupport for z/OS code on the distributed node(RHEL) . . . . . . . . . . . . . . . 13Step 3: Configuring the distributed node (RHEL) 14Step 4: Starting the distributed node (RHEL) . . 15Step 5: Configuring auto-start on the distributednode (RHEL) . . . . . . . . . . . . . 16
Installing and configuring your HP-UX nodes . . . 16Step 1: Checking requirements (HP-UX) . . . . 17
Disk space requirements . . . . . . . . 17Software requirements . . . . . . . . . 17
Step 2: Preparing and installing Tivoli DecisionSupport for z/OS code on the distributed node(HP-UX) . . . . . . . . . . . . . . 17Step 3: Configuring the distributed node(HP-UX) . . . . . . . . . . . . . . 19Step 4: Starting the distributed node (HP-UX) . . 20Step 5: Configuring auto-start on the distributednode (HP-UX) . . . . . . . . . . . . 20
Installing and configuring your AIX nodes . . . . 21Step 1: Checking requirements (AIX) . . . . . 21
Disk space requirements . . . . . . . . 21Software requirements . . . . . . . . . 21
Step 2: Preparing and installing Tivoli DecisionSupport for z/OS code on the distributed node(AIX) . . . . . . . . . . . . . . . 22Step 3: Configuring the distributed node (AIX) 23Step 4: Starting the distributed node (AIX) . . . 24Step 5: Configuring auto-start on the distributednode (AIX) . . . . . . . . . . . . . 24
Installing and configuring your Solaris nodes . . . 25Step 1: Check requirements (Solaris) . . . . . 25
Disk space requirements . . . . . . . . 25Software requirements . . . . . . . . . 26
Step 2: Preparing and installing Tivoli DecisionSupport for z/OS code on the distributed node(Solaris) . . . . . . . . . . . . . . 26Step 3: Configure the distributed node (Solaris) 27Step 4: Start and check the distributed node(Solaris) . . . . . . . . . . . . . . 28Step 5: Configure auto-start on the distributednode (Solaris). . . . . . . . . . . . . 29
Installing Distributed component on the z/OSsystem . . . . . . . . . . . . . . . . 29Testing the installation. . . . . . . . . . . 31Putting the component into production . . . . . 32
Chapter 3. Installing and configuringthe Windows component . . . . . . . 33Planning the implementation process . . . . . . 33Considering which Windows subcomponents toinstall . . . . . . . . . . . . . . . . 34Installing the Windows component on yourWindows nodes . . . . . . . . . . . . . 35
Step 1: Checking Windows requirements . . . 35Disk space requirements . . . . . . . . 35Software requirements . . . . . . . . . 35
Step 2: Transferring Tivoli Decision Support forz/OS feature code to Windows . . . . . . . 35
Capturing Windows component data andtransmitting to z/OS . . . . . . . . . . . 36
Step 1: Customizing the Windows node . . . . 37Parameter file values to change. . . . . . 37
Step 2: Setting up scheduled tasks. . . . . . 37Installing Windows component on the z/OS system 38
iii

Collecting data under Tivoli Decision Support forz/OS . . . . . . . . . . . . . . . . 40
General collect job . . . . . . . . . . . 40Testing the installation. . . . . . . . . . . 41Putting the component into production . . . . . 41
Part 2. Distributed SystemsPerformance Feature Reference . . 43
Chapter 4. Data flow and TivoliDecision Support for z/OS objects . . . 45Distributed Systems Performance feature generaldata flow . . . . . . . . . . . . . . . 45
Chapter 5. Data tables . . . . . . . . 47Naming standard for tables . . . . . . . . . 47Table descriptions . . . . . . . . . . . . 47Tables in the Distributed component . . . . . . 48
DIST_CPU_H, _D, _M . . . . . . . . . . 48DIST_DISK_D, _M . . . . . . . . . . . 49DIST_DISKIO_H, _D . . . . . . . . . . 49DIST_PAGING_H, _D, _M . . . . . . . . 50
Tables in the Windows component. . . . . . . 51WIN_PERF_DD_H, _D, _M . . . . . . . . 51WIN_PERF_PU_H, _D, _M . . . . . . . . 51
Chapter 6. Reports . . . . . . . . . 53Report format and general description . . . . . 53
Report ID . . . . . . . . . . . . . . 53Report group . . . . . . . . . . . . . 53Source . . . . . . . . . . . . . . . 54Attributes . . . . . . . . . . . . . . 54Variables . . . . . . . . . . . . . . 54
Reports in the Distributed component . . . . . 54Distrib. CPU Util. for System, Hourly Trend . . 54Distrib. CPU Util. by System, Daily Overview . . 55Distrib. Statistics for System, Hourly Trend . . . 56Distrib. Statistics by System, Daily Overview . . 58Distrib. File Systems, Daily Overview . . . . 59Distrib. Disk I/O for Disk, Hourly Trend . . . 60Distrib. Disk I/O for System, Daily Overview . . 61Distrib. Page Space Util., Hourly Trend . . . . 62Distrib. CPU Util. Exceptions . . . . . . . 63
Reports in the Windows component . . . . . . 64Windows Disk Usage for System, Hourly Trend 65Windows Disk Usage for Device, Daily Overview 65Windows CPU Utilization by System, HourlyTrend . . . . . . . . . . . . . . . 66Windows CPU Utilization by System, DailyOverview . . . . . . . . . . . . . . 67Windows Memory Usage by System, HourlyTrend . . . . . . . . . . . . . . . 68Windows Memory Usage by System, DailyOverview . . . . . . . . . . . . . . 69Windows System Overview Report . . . . . 70
Chapter 7. Log record definitions . . . 73DIST_PERF_VM_A . . . . . . . . . . . . 73
Main section . . . . . . . . . . . . . 73
DIST_DISK_FS_A . . . . . . . . . . . . 74Main section . . . . . . . . . . . . . 74Record section DEVICE . . . . . . . . . 74Record section SPACE . . . . . . . . . . 74
DIST_PERF_IO_A . . . . . . . . . . . . 74Main section . . . . . . . . . . . . . 74
DIST_PERF_PS_A . . . . . . . . . . . . 75Main section . . . . . . . . . . . . . 75
WIN_PERF_DD . . . . . . . . . . . . . 76Main section . . . . . . . . . . . . . 76
WIN_PERF_PU . . . . . . . . . . . . . 76Main section . . . . . . . . . . . . . 76
Part 3. Distributed SystemsPerformance Feature Guide(heritage) . . . . . . . . . . . . . 79
Chapter 8. Introducing the DistributedSystems Performance feature . . . . . 81Gathering and collecting performance data . . . . 81
Report groups . . . . . . . . . . . . 82
Chapter 9. Installing and configuringthe UNIX and Linux Performancecomponents . . . . . . . . . . . . 85Planning the implementation process . . . . . . 85Considering which UNIX subcomponents to install 86Installing the UNIX Performance component onyour UNIX nodes . . . . . . . . . . . . 87
Step 1: Check UNIX requirements . . . . . . 87Disk space requirements . . . . . . . . 87Software requirements . . . . . . . . . 87
Step 2: Transfer Tivoli Decision Support for z/OSfeature code to UNIX . . . . . . . . . . 88
Capturing UNIX Performance component data andtransmitting to OS/390 . . . . . . . . . . 90
Step 1: Set up UNIX accounting . . . . . . 91Setting up accounting for AIX . . . . . . 91Setting up accounting for HP . . . . . . 93Setting up accounting for Sun Solaris . . . . 94
Step 2: Create log files . . . . . . . . . 94Step 3: Define the receiver of UNIX Performancecomponent data . . . . . . . . . . . . 95Step 4: Customizing UNIX Performancecomponent parameters . . . . . . . . . 96
Parameter file values for all subcomponents 96Parameter file values for Performancecomponent . . . . . . . . . . . . 97
Step 5: Start the drlperfd daemon . . . . . . 98Step 6: Invoke drlperfd at start time . . . . . 99Description of daily tasks performed by UNIXPerformance component . . . . . . . . . 99
Operating the UNIX Performance component onUNIX . . . . . . . . . . . . . . . . 100
Description of UNIX Performance componentfiles . . . . . . . . . . . . . . . 101AIX commands to use if UNIX Performancecomponent installed . . . . . . . . . . 102
drlpsperfd . . . . . . . . . . . . 102
iv Tivoli Decision Support for z/OS: Distributed Systems Performance Feature Guide and Reference

drlactperfd . . . . . . . . . . . . 102drldeactperfd . . . . . . . . . . . 102drlsend . . . . . . . . . . . . . 102
Installing UNIX Performance component on thez/OS system . . . . . . . . . . . . . 102Updating the lookup tables. . . . . . . . . 104
Updating XACCT_CONNECT_TYPE . . . . 105Updating X_NODE_NAME. . . . . . . . 105Updating XACCT_PRINT_TYPE . . . . . . 105
Collecting data under Tivoli Decision Support forz/OS . . . . . . . . . . . . . . . . 105
Creating your Generation Data Groups . . . . 106Renaming files sets sent from UNIX for usewith a GDG . . . . . . . . . . . . . 106
Example of renaming UNIX files . . . . . 106General collect job . . . . . . . . . . . 107Collect job with specified Tivoli DecisionSupport for z/OS tables . . . . . . . . . 108Backup and delete of generation data sets . . . 109
Testing the installation . . . . . . . . . . 109Putting the feature into production . . . . . . 109Considering which Linux subcomponents to install 110Installing the Linux Performance component onyour Linux nodes . . . . . . . . . . . . 110
Step 1: Check Linux requirements . . . . . 110Software requirements . . . . . . . . 110
Step 2: Transfer Tivoli Decision Support forz/OS feature code to Linux. . . . . . . . 110
Capturing Linux Performance component data andtransmitting to OS/390 . . . . . . . . . . 111
Step 1: Create log files . . . . . . . . . 112Step 2: Define the receiver of LinuxPerformance component data . . . . . . . 112Step 3: Customizing Linux Performancecomponent parameters . . . . . . . . . 113
Parameter file values for all subcomponents 113Parameter file values for performancecomponent . . . . . . . . . . . . 114
Step 4: Start the drlperfd daemon . . . . . 115Commands to use if Linux Performance componentinstalled . . . . . . . . . . . . . . . 115
drlpsperfd . . . . . . . . . . . . . 115drlactperfd . . . . . . . . . . . . . 115drldeactperfd . . . . . . . . . . . . 116drlsend . . . . . . . . . . . . . . 116
Collecting data under Tivoli Decision Support forz/OS . . . . . . . . . . . . . . . . 116
General collect job . . . . . . . . . . . 116
Chapter 10. Installing and configuringthe Windows component . . . . . . 117Planning the implementation process . . . . . 117Considering which Windows subcomponents toinstall . . . . . . . . . . . . . . . . 119Installing the Windows component on yourWindows nodes . . . . . . . . . . . . 119
Step 1: Check Windows requirements . . . . 119Disk space requirements . . . . . . . . 119Software requirements . . . . . . . . 120
Step 2: Transfer Tivoli Decision Support forz/OS feature code to Windows . . . . . . 120
Capturing Windows component data andtransmitting to OS/390 . . . . . . . . . . 121
Step 1: Customize Windows node . . . . . 121Parameter file values to change . . . . . 121
Step 2: Set up scheduled tasks . . . . . . 122Installing Windows component on the z/OSsystem . . . . . . . . . . . . . . . 123Collecting data under Tivoli Decision Support forz/OS . . . . . . . . . . . . . . . . 125
General collect job . . . . . . . . . . . 125Testing the installation . . . . . . . . . . 125Putting the feature into production . . . . . . 126
Part 4. Distributed SystemsPerformance Feature Reference(heritage) . . . . . . . . . . . . 127
Chapter 11. Data flow and TivoliDecision Support for z/OS objects . . 129Distributed Systems Performance componentgeneral data flow . . . . . . . . . . . . 129
Description of log files, record and logdefinitions . . . . . . . . . . . . . 131
Chapter 12. Data, lookup, and controltables. . . . . . . . . . . . . . . 133Naming standard for tables. . . . . . . . . 133Table descriptions . . . . . . . . . . . . 134Tables in the UNIX accounting subcomponent . . 134
XACCT_COMMAND_D, _M . . . . . . . 134XACCT_DISK_D, _M. . . . . . . . . . 135XACCT_PRINT_D, _M . . . . . . . . . 136XACCT_CONNECT_D, _M. . . . . . . . 136XACCT_DISK_MV . . . . . . . . . . 137
Tables in the UNIX configuration subcomponent 137XCONFIG_HW. . . . . . . . . . . . 137XCONFIG_SW . . . . . . . . . . . . 137
Tables in the UNIX error subcomponent . . . . 138XERROR_D, _M . . . . . . . . . . . 138
Tables in the UNIX performance subcomponent 138XPERF_CPU_H, _D, _M . . . . . . . . . 139XPERF_DISK_D, _M . . . . . . . . . . 140XPERF_DISKIO_H, _D, _M. . . . . . . . 140XPERF_PAGING_H, _D, _M . . . . . . . 141XPERF_PS_INFO . . . . . . . . . . . 142XPERF_VM_INFO . . . . . . . . . . . 142
Tables in the Windows component . . . . . . 143WIN_PERF_DD_H, _D, _M. . . . . . . . 143WIN_PERF_PU_H, _D, _M . . . . . . . . 143
Lookup tables . . . . . . . . . . . . . 144XACCT_CONNECT_TYPE . . . . . . . . 144
Example of table contents . . . . . . . 144X_NODE_NAME . . . . . . . . . . . 145
Example of table contents . . . . . . . 145XACCT_PRINT_TYPE . . . . . . . . . 145
Example of table contents . . . . . . . 145
Chapter 13. Linux data tables . . . . 147XCONF_HARDWARE . . . . . . . . . . 147
Contents v

XCONF_SOFTWARE . . . . . . . . . . . 147XDISK_INFOR . . . . . . . . . . . . . 147XDTMP_INFOR . . . . . . . . . . . . 148XPERF_PS_INFO . . . . . . . . . . . . 148XPERF_VM_INFO . . . . . . . . . . . . 148XWTMP_INFOR . . . . . . . . . . . . 149
Chapter 14. Reports . . . . . . . . 151Report format and general description . . . . . 151
Report ID . . . . . . . . . . . . . 151Report group . . . . . . . . . . . . 152Source . . . . . . . . . . . . . . . 152Attributes . . . . . . . . . . . . . 152Variables . . . . . . . . . . . . . . 152
Reports in the accounting subcomponent . . . . 152UNIX Acct Commands by User, Daily Overview 152UNIX Acct Users by Command, Daily Overview 154UNIX Acct Cmd Resource Consumption, DailyOverview. . . . . . . . . . . . . . 155UNIX Acct User Resource Usage, MonthlyOverview. . . . . . . . . . . . . . 157UNIX Acct Disk Blocks by User, MonthlyOverview. . . . . . . . . . . . . . 158UNIX Acct Disk Blocks in 1000s, Monthly Trend 159UNIX Acct Users and Connects, Daily Overview 160UNIX Acct Printed Pages by User, MonthlyOverview. . . . . . . . . . . . . . 161UNIX Acct Printed Pages by System, MonthlyOverview. . . . . . . . . . . . . . 162
Reports in the configuration subcomponent . . . 163UNIX Configuration of HW for a System,Overview. . . . . . . . . . . . . . 163UNIX Configuration of HW for Device Class,Overview. . . . . . . . . . . . . . 164UNIX Configuration of SW for a System,Overview. . . . . . . . . . . . . . 165UNIX Configuration of SW for Object,Overview. . . . . . . . . . . . . . 166
Reports in the error subcomponent . . . . . . 167UNIX Error by ID, Daily Overview . . . . . 168UNIX Error by Type, Daily Overview . . . . 168UNIX Error by Class, Daily Overview . . . . 169UNIX Error by Resource, Daily Overview . . . 170UNIX Error by Resource, Monthly Trend . . . 171
Reports in the performance subcomponent . . . 172UNIX Perf CPU Utilization by System, HourlyTrend . . . . . . . . . . . . . . . 173UNIX Perf CPU Utilization by System, DailyOverview. . . . . . . . . . . . . . 174UNIX Perf Statistics by System, Hourly Trend 175UNIX Perf Statistics all Systems, DailyOverview. . . . . . . . . . . . . . 176UNIX Perf Vol Group and File Syst, DailyOverview. . . . . . . . . . . . . . 177UNIX Perf Disk I/O for a Disk, Hourly Trend 178UNIX Perf Disk I/O for System, DailyOverview. . . . . . . . . . . . . . 180UNIX Perf Page Space Utilization, Hourly Trend 181LINUX Percentile Work Size . . . . . . . 182LINUX Disk Space Allocation . . . . . . . 183LINUX Performance from User Memory . . . 184
LINUX Performance ’PS’ for Volumes Info . . 185LINUX Hardware Configuration . . . . . . 186LINUX Software Configuration . . . . . . 187LINUX User Information . . . . . . . . 188LINUX Process Information . . . . . . . 189LINUX Performance ’VM’ for Swap Memory 190LINUX Performance ’VM’ for CPU . . . . . 191
Reports in the Windows component . . . . . . 192Windows Disk Usage for System, Hourly Trend 192Windows Disk Usage for Device, DailyOverview. . . . . . . . . . . . . . 193Windows CPU Utilization by System, HourlyTrend . . . . . . . . . . . . . . . 194Windows CPU Utilization by System, DailyOverview. . . . . . . . . . . . . . 195Windows Memory Usage by System, HourlyTrend . . . . . . . . . . . . . . . 196Windows Memory Usage by System, DailyOverview. . . . . . . . . . . . . . 197Windows System Overview Report . . . . . 198
Chapter 15. Log record definitions 201XACCT_COMMAND. . . . . . . . . . . 201
Main section. . . . . . . . . . . . . 201XACCT_CONNECT . . . . . . . . . . . 202
Main section. . . . . . . . . . . . . 202XACCT_DISK . . . . . . . . . . . . . 202
Main section. . . . . . . . . . . . . 202XACCT_PRINT. . . . . . . . . . . . . 203
Main section. . . . . . . . . . . . . 203XCONFIG_HW. . . . . . . . . . . . . 203
Main section. . . . . . . . . . . . . 203XCONFIG_SW . . . . . . . . . . . . . 203
Main section. . . . . . . . . . . . . 204Record section SUBTYPE_H . . . . . . . 204Record section SUBTYPE_I . . . . . . . . 204Record section SUBTYPE_L. . . . . . . . 204Record section FILE_NAME . . . . . . . 204Record section PATH_NAME . . . . . . . 205Record section PRODUCT_DESC . . . . . . 205
XERROR . . . . . . . . . . . . . . . 205Main section. . . . . . . . . . . . . 205
XPERF_CPU. . . . . . . . . . . . . . 206Main section. . . . . . . . . . . . . 206
XPERF_DISK_FS . . . . . . . . . . . . 206Main section. . . . . . . . . . . . . 206Record section FILE_SYSTEM . . . . . . . 206Record section DEVICE_NAME . . . . . . 207Record section SPACE_NAME. . . . . . . 207
XPERF_DISK_VG . . . . . . . . . . . . 207Main section. . . . . . . . . . . . . 207Record section VOLUME_GROUP . . . . . 207Record section SPACE_NAME. . . . . . . 208
XPERF_DISKIO . . . . . . . . . . . . 208Main section. . . . . . . . . . . . . 208
XPERF_PAGING . . . . . . . . . . . . 209Main section. . . . . . . . . . . . . 209
WIN_PERF_DD . . . . . . . . . . . . 209Main section. . . . . . . . . . . . . 209
WIN_PERF_PU. . . . . . . . . . . . . 210Main section. . . . . . . . . . . . . 210
vi Tivoli Decision Support for z/OS: Distributed Systems Performance Feature Guide and Reference

Part 5. Appendixes . . . . . . . . 211
Appendix. Support information. . . . 213Searching knowledge bases . . . . . . . . . 213
Searching the information center . . . . . . 213Searching the Internet . . . . . . . . . 213
Obtaining fixes . . . . . . . . . . . . . 213Receiving weekly support updates . . . . . . 214Contacting IBM Software Support . . . . . . 214
Determining the business impact . . . . . . 215Describing problems and gathering information 216Submitting problems . . . . . . . . . . 216
Notices . . . . . . . . . . . . . . 217Trademarks . . . . . . . . . . . . . . 219
Bibliography. . . . . . . . . . . . 221TDS publications . . . . . . . . . . . . 221
Glossary . . . . . . . . . . . . . 223
Index . . . . . . . . . . . . . . . 227
Contents vii

viii Tivoli Decision Support for z/OS: Distributed Systems Performance Feature Guide and Reference

Figures
1. Organizing and presenting system performancedata . . . . . . . . . . . . . . . 5
2. Implementation process for the Distributedcomponent . . . . . . . . . . . . . 7
3. Tivoli Decision Support for z/OSAdministration window . . . . . . . . 30
4. Components window . . . . . . . . . 305. Installation Options window . . . . . . . 316. Daily steps involved in using Tivoli Decision
Support for z/OS . . . . . . . . . . 327. Implementation process for the Windows
component . . . . . . . . . . . . . 348. Tivoli Decision Support for z/OS
Administration window . . . . . . . . 399. Components window . . . . . . . . . 39
10. Installation Options window . . . . . . . 4011. General COLLECT job . . . . . . . . . 4112. Daily steps involved in using Tivoli Decision
Support for z/OS . . . . . . . . . . 4213. General Distributed Systems Performance
feature data flow. . . . . . . . . . . 4514. Example of Distrib. CPU Util. for System,
Hourly Trend . . . . . . . . . . . . 5515. Example of Distrib. CPU Util. by System, Daily
Overview . . . . . . . . . . . . . 5616. Example of Distributed Statistics for System,
Hourly Trend . . . . . . . . . . . . 5717. Example of Distrib. Statistics by System, Daily
Overview . . . . . . . . . . . . . 5818. Example of Distrib. File Systems, Daily
Overview . . . . . . . . . . . . . 6019. Example of Distrib. Disk I/O for Disk, Hourly
Trend . . . . . . . . . . . . . . 6120. Example of Distrib. Disk I/O for System, Daily
Overview . . . . . . . . . . . . . 6221. Example of Distrib. Page Space Util., Hourly
Trend . . . . . . . . . . . . . . 6322. Example of Distributed CPU Utilization
Exceptions . . . . . . . . . . . . . 6423. Example of Windows Disk Usage for System,
Hourly Trend . . . . . . . . . . . . 6524. Example of Windows Disk Usage for Device,
Daily Overview . . . . . . . . . . . 6625. Example of Windows CPU Utilization by
System, Hourly Trend . . . . . . . . . 6726. Example of Windows CPU Utilization by
System, Daily Overview . . . . . . . . 6827. Example of Windows Memory Usage by
System, Hourly Trend . . . . . . . . . 6928. Example of Windows Memory Usage by
System, Daily Overview . . . . . . . . 7029. Example of Windows System Overview Report 7130. Organizing and presenting system
performance data . . . . . . . . . . 8231. Implementation process for the UNIX
Performance component . . . . . . . . 86
32. Tivoli Decision Support for z/OSAdministration window . . . . . . . . 103
33. Components window . . . . . . . . . 10334. Installation Options window . . . . . . 10435. General COLLECT job . . . . . . . . 10836. Sample COLLECT job with an INCLUDE
clause . . . . . . . . . . . . . . 10937. Daily steps involved in using Tivoli Decision
Support for z/OS . . . . . . . . . . 11038. General COLLECT job . . . . . . . . 11739. Implementation process for the Windows
component . . . . . . . . . . . . 11840. Tivoli Decision Support for z/OS
Administration window . . . . . . . . 12341. Components window . . . . . . . . . 12442. Installation Options window . . . . . . 12443. General COLLECT job . . . . . . . . 12544. Daily steps involved in using Tivoli Decision
Support for z/OS . . . . . . . . . . 12645. General Distributed Systems Performance
component data flow . . . . . . . . . 12946. Example of UNIX Acct Commands by User,
Daily Overview . . . . . . . . . . . 15347. Example of UNIX Acct Users by Command,
Daily Overview . . . . . . . . . . . 15548. Example of UNIX Acct Cmd Resource
Consumption, Daily Overview . . . . . . 15649. Example of UNIX Acct User Resource Usage,
Monthly Overview. . . . . . . . . . 15750. Example of UNIX Acct Disk Blocks by User,
Monthly Overview. . . . . . . . . . 15951. Example of UNIX Acct Disk Blocks in 1000s,
Monthly Trend . . . . . . . . . . . 16052. Example of UNIX Acct Users and Connects,
Daily Overview . . . . . . . . . . . 16153. Example of UNIX Acct Printed Pages by User,
Monthly Overview. . . . . . . . . . 16254. Example of UNIX Acct Printed Pages by
System, Monthly Overview . . . . . . . 16355. Example of UNIX Configuration of HW for a
System, Overview . . . . . . . . . . 16456. Example of UNIX Configuration of HW for
Device Class, Overview . . . . . . . . 16557. Example of UNIX Configuration of SW for a
System, Overview . . . . . . . . . . 16658. Example of UNIX Configuration of SW for
Object, Overview . . . . . . . . . . 16759. Example of UNIX Error by ID, Daily
Overview . . . . . . . . . . . . . 16860. Example of UNIX Error by Type, Daily
Overview . . . . . . . . . . . . . 16961. Example of UNIX Error by Class, Daily
Overview . . . . . . . . . . . . . 17062. Example of UNIX Error by Resource, Daily
Overview . . . . . . . . . . . . . 171
ix

63. Example of UNIX Error by Resource,Monthly Trend . . . . . . . . . . . 172
64. Example of UNIX Perf CPU Utilization bySystem, Hourly Trend. . . . . . . . . 173
65. Example of UNIX Perf CPU Utilization bySystem, Daily Overview . . . . . . . . 174
66. Example of UNIX Perf Statistics by System,Hourly Trend2 . . . . . . . . . . . 175
67. Example of UNIX Perf Statistics all Systems,Daily Overview . . . . . . . . . . . 177
68. Example of UNIX Perf Vol Group and FileSyst, Daily Overview . . . . . . . . . 178
69. Example of UNIX Perf Disk I/O for a Disk,Hourly Trend . . . . . . . . . . . 179
70. Example of UNIX Perf Disk I/O for System,Daily Overview . . . . . . . . . . . 180
71. Example of UNIX Perf Page Space Utilization,Hourly Trend . . . . . . . . . . . 182
72. Example of a LINUX - Percentile Work Sizereport . . . . . . . . . . . . . . 183
73. Example of a LINUX - Disk Space Allocationreport . . . . . . . . . . . . . . 184
74. Example of a LINUX - Performance fromUser Memory report . . . . . . . . . 185
75. Example of a LINUX - Performance ’PS’ forVolumes Info report . . . . . . . . . 186
76. Example of a LINUX - HardwareConfiguration report . . . . . . . . . 187
77. Example of a LINUX - SoftwareConfiguration report . . . . . . . . . 188
78. Example of a LINUX - User Informationreport . . . . . . . . . . . . . . 189
79. Example of a LINUX - Process Informationreport . . . . . . . . . . . . . . 190
80. Example of a LINUX - Performance ’VM’ forSwap Memory report . . . . . . . . . 191
81. Example of a LINUX - Performance ’VM’ forCPU report . . . . . . . . . . . . 192
82. Example of Windows Disk Usage for System,Hourly Trend . . . . . . . . . . . 193
83. Example of Windows Disk Usage for Device,Daily Overview . . . . . . . . . . . 194
84. Example of Windows CPU Utilization bySystem, Hourly Trend. . . . . . . . . 195
85. Example of Windows CPU Utilization bySystem, Daily Overview . . . . . . . . 196
86. Example of Windows Memory Usage bySystem, Hourly Trend. . . . . . . . . 197
87. Example of Windows Memory Usage bySystem, Daily Overview . . . . . . . . 198
88. Example of Windows System OverviewReport . . . . . . . . . . . . . . 199
x Tivoli Decision Support for z/OS: Distributed Systems Performance Feature Guide and Reference

Preface
The Distributed Systems Performance Feature Guide and Reference, SH19-4018 manualdescribes how to use IBM® Tivoli® Decision Support for z/OS® (hereafter referredto as Tivoli Decision Support for z/OS) to collect and report performance datagenerated by operating systems and applications running on a workstation. Thisbook:v Describes performance issues and how they affect the level of services you can
offer usersv Guides you through the component-selection, installation, and implementation
processesv Explores performance characteristics shown in Tivoli Decision Support for z/OS
reports so that you can analyze the characteristics of your system
Note: The term UNIX used in this book covers AIX, HP-UX, and Solaris operatingsystems. When AIX is used, this refers only to the IBM operating system (and notto HP-UX or Solaris).
The terms MVS™, OS/390®, and z/OS are used interchangeably throughout thisbook:
Who should read this bookThe Distributed Systems Performance Feature Guide and Reference, SH19-4018 isintended for:v Anyone who analyzes or monitors distributed systems performance.v Anyone responsible for establishing or meeting service-level objectives for
distributed systems.v Tivoli Decision Support for z/OS administrators (primarily as a guide to feature
installation and as a reference to table and report definitions)v Users with various backgrounds who are interested in analyzing and improving
distributed systems performance.
What this book containsThis book explains how to collect distributed systems performance data, and tocreate and display Tivoli Decision Support for z/OS reports to both monitor andunderstand performance on these platforms.
It is broadly divided into two sections.
Parts 1 and 2 detail the newer distributed component which replaces thedeprecated UNIX and Linux components.
Because the distributed component uses more modern tooling for development, it'smore easily portable to new platfoms, and the ability to configure external tools fordata collection allows easier adaptation to both newer platforms and currentplatforms where the environment changes.
The Windows component has also been copied here as that will remain after thedeprecated UNIX and Linux components are retired.
xi
Parts 3 and 4 cover the UNIX and Linux components which are still supported, butdeprecated. Newer installations should choose the distributed component. It alsocovers the Windows component which has been duplicated in parts 1 and 2.
This book contains the following parts:v Use Part 1 for developing and implementing your performance and service-level
strategy if you wish to use the newer distributed component, or the Windowscomponent:– Chapter 1, “Introducing the Distributed Systems Performance feature,” on
page 3 explains basic concepts of systems management and offers suggestionson establishing performance objectives and service-level agreements. It alsodescribes the Distributed Systems Performance feature role in the TivoliDecision Support for z/OS environment.
– Chapter 2, “Installing and configuring the Distributed component,” on page 7contains a task-oriented description of how to plan for and set up thedistributed component so that useful reports and decision-supportinformation are available immediately.
– Chapter 3, “Installing and configuring the Windows component,” on page 33contains a task-oriented description of how to plan for and set up theWindows components so that useful reports and decision-support informationare available immediately.
v Use Part 2 for a detailed description of the distributed component:– Chapter 4, “Data flow and Tivoli Decision Support for z/OS objects,” on page
45 describes the flow of data from log record to report, showing TivoliDecision Support for z/OS log and record definitions, tables, and reports.
– Chapter 5, “Data tables,” on page 47 describes the supplied data tables andupdates, including columns and expressions. It contains similar descriptionsof lookup tables and control tables. This chapter also describes the data tablesused by the Distributed Systems Performance component.
– Chapter 6, “Reports,” on page 53 contains examples of the DistributedSystems Performance component reports and shows where the data comesfrom.
– Chapter 7, “Log record definitions,” on page 73 describes the DistributedSystems Performance component record definitions and lists the record typesyou can select with each of them.
v Use Part 3 for developing and implementing your performance and service-levelstrategy if you wish to use the deprecated UNIX and Linux components or theWindows component:– Chapter 8, “Introducing the Distributed Systems Performance feature,” on
page 81 explains basic concepts of systems management and offerssuggestions on establishing performance objectives and service-levelagreements. It also describes the Distributed Systems Performance feature rolein the Tivoli Decision Support for z/OS environment.
– Chapter 9, “Installing and configuring the UNIX and Linux Performancecomponents,” on page 85 contains a task-oriented description of how to planfor and set up the UNIX and Linux components so that useful reports anddecision-support information are available immediately.
– Chapter 10, “Installing and configuring the Windows component,” on page117 contains a task-oriented description of how to plan for and set up theWindows components so that useful reports and decision-support informationare available immediately.
What this book contains
xii Tivoli Decision Support for z/OS: Distributed Systems Performance Feature Guide and Reference

v Use Part 4 for a detailed description of the UNIX, Linux and Windowscomponents:– Chapter 11, “Data flow and Tivoli Decision Support for z/OS objects,” on
page 129 describes the flow of data from log record to report, showing TivoliDecision Support for z/OS log and record definitions, tables, and reports.
– Chapter 12, “Data, lookup, and control tables,” on page 133 describes thesupplied data tables and updates, including columns and expressions. Itcontains similar descriptions of lookup tables and control tables. This chapteralso describes the data tables used by the Distributed Systems Performancecomponent.
– Chapter 14, “Reports,” on page 151 contains examples of the DistributedSystems Performance component reports and shows where the data comesfrom.
– Chapter 15, “Log record definitions,” on page 201 describes the DistributedSystems Performance component record definitions and lists the record typesyou can select with each of them.
v Use Part 5 as a reference for obtaining support for IBM software products.
A glossary and index follow the appendixes.
PublicationsThis section lists publications in the Tivoli Decision Support for z/OS library andany other related documents. It also describes how to access Tivoli publicationsonline, how to order Tivoli publications, and how to submit comments on Tivolipublications.
Tivoli Decision Support for z/OS libraryThe following documents are available in the Tivoli Decision Support for z/OSlibrary:v Administration Guide and Reference, SH19-6816.
Provides information about initializing the Tivoli Decision Support for z/OSdatabase and customizing and administering Tivoli Decision Support for z/OS.
v AS/400 System Performance Feature Guide and Reference, SH19-4019.Provides information for administrators and users about collecting and reportingperformance data generated by AS/400 systems.
v CICS Performance Feature Guide and Reference, SH19-6820.Provides information for administrators and users about collecting and reportingperformance data generated by Customer Information and Control System(CICS®).
v Distributed Systems Performance Feature Guide and Reference, SH19-4018.Provides information for administrators and users about collecting and reportingperformance data generated by operating systems and applications running on aworkstation.
v Guide to Reporting, SH19-6842.Provides information for users who display existing reports, for users who createand modify reports, and for administrators who control reporting dialog defaultfunctions and capabilities.
v IMS Performance Feature Guide and Reference, SH19-6825.Provides information for administrators and users about collecting and reportingperformance data generated by Information Management System (IMS).
What this book contains
Preface xiii

v Language Guide and Reference, SH19-6817.Provides information for administrators, performance analysts, andprogrammers who are responsible for maintaining system log data and reports.
v Messages and Problem Determination, SH19-6902.Provides information to help operators and system programmers understand,interpret, and respond to Tivoli Decision Support for z/OS messages and codes.
v Network Performance Feature Installation and Administration, SH19-6901.Provides information for network analysts or programmers who are responsiblefor setting up the network reporting environment.
v Network Performance Feature Reference, SH19-6822.Provides reference information for network analysts or programmers who usethe Network Performance feature.
v Network Performance Feature Reports, SH19-6821.Provides information for network analysts or programmers who use theNetwork Performance feature reports.
v Resource Accounting for z/OS, SH19-4495.Provides information for users who want to use Tivoli Decision Support forz/OS to collect and report performance data generated by Resource Accountingfor z/OS.
v Resource Accounting, SH19-6818.Provides information for performance analysts and system programmers whoare responsible for meeting the service-level objectives established in yourorganization.
v System Performance Feature Guide, SH19-6819.Provides information for administrators and users with a variety of backgroundswho want to use Tivoli Decision Support for z/OS to analyze z/OS, z/VM®,zLinux, and their subsystems, performance data.
v System Performance Feature Reference Volume I, SH19-4494.Provides information for administrators and users with a variety of backgroundswho want to use Tivoli Decision Support for z/OS to analyze z/OS, z/VM,zLinux, and their subsystems, performance data.
v System Performance Feature Reference Volume II, SC23-7966.Provides information about the functions and features of the Usage andAccounting Collector.
v IBM Online Library z/OS Software Products Collection Kit, SK3T-4270CD containing all z/OS documentation.
Accessing terminology onlineThe IBM Terminology Web site consolidates the terminology from IBM productlibraries in one convenient location. You can access the Terminology Web site at thefollowing Web address:
http://www.ibm.com/ibm/terminology
Accessing publications onlineIBM posts publications for this and all other Tivoli products, as they becomeavailable and whenever they are updated, to the IBM Knowledge Center Web site.Access the Tivoli Decision Support for z/OS web page in the Knowledge Centerby going to the following address: https://www-01.ibm.com/support/knowledgecenter/SSH53X/welcome
Tivoli Decision Support for z/OS library
xiv Tivoli Decision Support for z/OS: Distributed Systems Performance Feature Guide and Reference
AccessibilityAccessibility features help users with a physical disability, such as restrictedmobility or limited vision, to use software products successfully. With this product,you can use assistive technologies to hear and navigate the interface. You can alsouse the keyboard instead of the mouse to operate all features of the graphical userinterface.
For additional information, see the Accessibility Appendix in the AdministrationGuide and Reference.
Tivoli technical trainingFor Tivoli technical training information, refer to the following IBM TivoliEducation Web site:
http://www.ibm.com/software/tivoli/education/
Support informationIf you have a problem with your IBM software, you want to resolve it quickly. IBMprovides the following ways for you to obtain the support you need:v Searching knowledge bases: You can search across a large collection of known
problems and workarounds, Technotes, and other information.v Obtaining fixes: You can locate the latest fixes that are already available for your
product.v Contacting IBM Software Support: If you still cannot solve your problem, and
you need to work with someone from IBM, you can use a variety of ways tocontact IBM Software Support.
For more information about these three ways of resolving problems, see “Supportinformation,” on page 213.
Conventions used in this bookThis guide uses several conventions for special terms and actions, operatingsystem-dependent commands and paths, and margin graphics.
The following terms are used interchangeably throughout this book:v MVS, OS/390, and z/OS.v VM and z/VM.
Except for editorial changes, updates to this edition are marked with a vertical barto the left of the change.
Typeface conventionsThis guide uses the following typeface conventions:
Bold
v Lowercase commands and mixed case commands that are otherwisedifficult to distinguish from surrounding text
v Interface controls (check boxes, push buttons, radio buttons, spinbuttons, fields, folders, icons, list boxes, items inside list boxes,
Accessibility
Preface xv

multicolumn lists, containers, menu choices, menu names, tabs, propertysheets), labels (such as Tip, and Operating system considerations)
v Column headings in a tablev Keywords and parameters in text
Italic
v Citations (titles of books, diskettes, and CDs)v Words defined in textv Emphasis of words (words as words)v Letters as lettersv New terms in text (except in a definition list)v Variables and values you must provide
Monospace
v Examples and code examplesv File names, programming keywords, and other elements that are difficult
to distinguish from surrounding textv Message text and prompts addressed to the userv Text that the user must typev Values for arguments or command options
Typeface conventions
xvi Tivoli Decision Support for z/OS: Distributed Systems Performance Feature Guide and Reference

Part 1. Distributed Systems Performance Feature Guide
1

2 Tivoli Decision Support for z/OS: Distributed Systems Performance Feature Guide and Reference
Chapter 1. Introducing the Distributed Systems Performancefeature
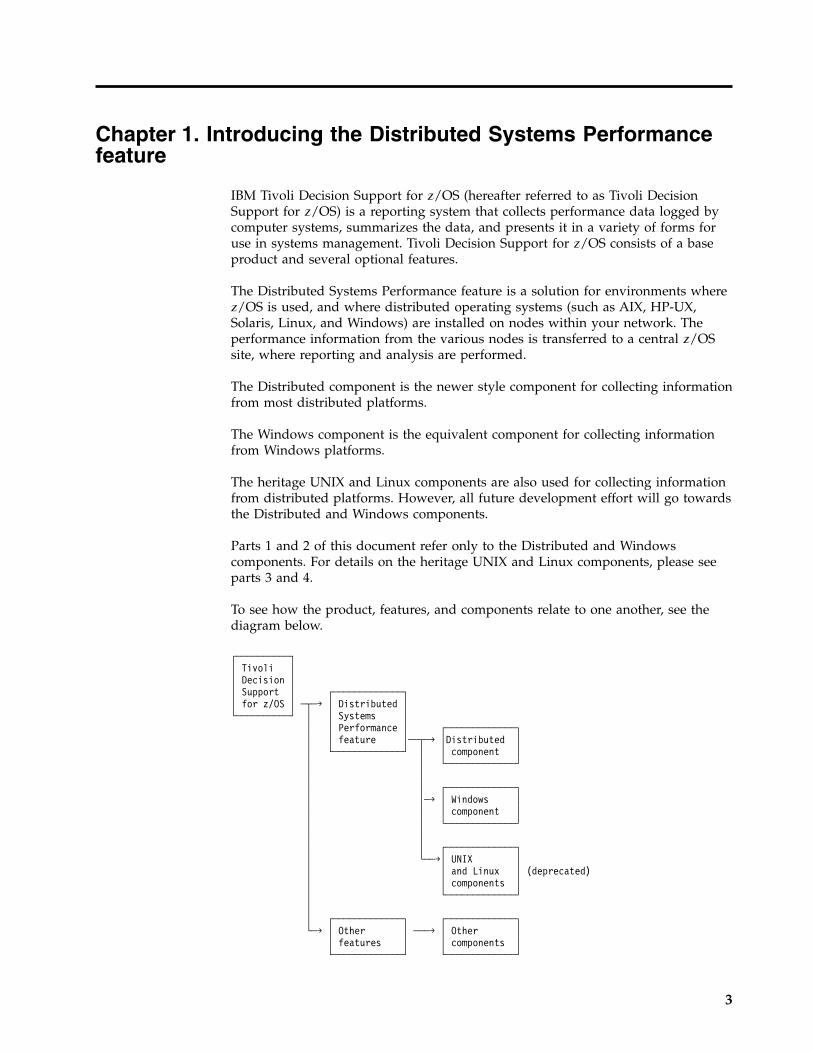
IBM Tivoli Decision Support for z/OS (hereafter referred to as Tivoli DecisionSupport for z/OS) is a reporting system that collects performance data logged bycomputer systems, summarizes the data, and presents it in a variety of forms foruse in systems management. Tivoli Decision Support for z/OS consists of a baseproduct and several optional features.
The Distributed Systems Performance feature is a solution for environments wherez/OS is used, and where distributed operating systems (such as AIX, HP-UX,Solaris, Linux, and Windows) are installed on nodes within your network. Theperformance information from the various nodes is transferred to a central z/OSsite, where reporting and analysis are performed.
The Distributed component is the newer style component for collecting informationfrom most distributed platforms.
The Windows component is the equivalent component for collecting informationfrom Windows platforms.
The heritage UNIX and Linux components are also used for collecting informationfrom distributed platforms. However, all future development effort will go towardsthe Distributed and Windows components.
Parts 1 and 2 of this document refer only to the Distributed and Windowscomponents. For details on the heritage UNIX and Linux components, please seeparts 3 and 4.
To see how the product, features, and components relate to one another, see thediagram below.
┌──────────┐│ Tivoli ││ Decision ││ Support │ ┌─────────────┐│ for z/OS │ ─┬─→ │ Distributed │└──────────┘ │ │ Systems │
│ │ Performance │ ┌─────────────┐│ │ feature │──┬─→ │Distributed ││ └─────────────┘ │ │ component ││ │ └─────────────┘│ ││ │ ┌─────────────┐│ │─→ │ Windows ││ │ │ component ││ │ └─────────────┘│ ││ │ ┌─────────────┐│ └──→│ UNIX ││ │ and Linux │ (deprecated)│ │ components ││ └─────────────┘││ ┌─────────────┐ ┌─────────────┐└─→ │ Other │ ───→ │ Other │
│ features │ │ components │└─────────────┘ └─────────────┘
3

The advantages of the Distributed component over the older UNIX and Linuxcomponents are as follows:v The code that runs on the distributed nodes uses more modern, cross-platform
development tools so that it can be more easily ported to new environments.This was first pioneered in the Windows component and has now beenimplemented for the other distributed platforms.
v The use of these development tools also removes a significant impediment tofast turn-around of bug fixes caused by the requirement to test changes acrossall platforms. Because the tools present a common environment, the code can becommon across all platforms, current and future.
v All low-level operating system data collection tasks are now externalized in theconfiguration file, allowing for easy changes in the event the tasks change theiroutput formats. This capability was earlier put into the Linux and zLinux agentsand means that changes to the underlying operating system should not need anew code release, only a configuration change.
v The ability for the distributed nodes to generate both the newer versioned logrecord format (for the Distributed component) and the older style (for the UNIXand Linux components). This will aid in transition.
v The ability to run as a non-root user on the distributed nodes, greatly reducingsecurity risks.
v Versioning of log record definitions so that distributed nodes can be upgradedgradually.
v Removal of wastage in the log record formats, leading to reduced storagerequirements.
v Can collect both standard records as defined in this document.
This topic describes how information is gathered and collected using theDistributed Systems Performance feature.
Gathering and collecting performance dataAt the nodes where Distributed and Windows component agents have beeninstalled and from which data is to be used, the basic information used by theDistributed Systems Performance feature is gathered by the agents into log filescontaining various performance and other data. The source data used by theDistributed Systems Performance feature to create the log files and a description ofthe log files, is given here:
Source dataDescription of created log files
Distributed dataLog files containing processor use, I/O rate, and paging space data. Theseare continuously updated by programs supplied with the DistributedSystems Performance feature.
Windows dataLog files containing various statistics collected from Windows systems.These are continuously updated by programs supplied with theDistributed Systems Performance feature.
SMF104 dataSMF104 data
The information contained in the log files must be transmitted to z/OS for use asdata sets in the Tivoli Decision Support for z/OS COLLECT procedure. The most
Introducing the Distributed Systems Performance feature
4 Tivoli Decision Support for z/OS: Distributed Systems Performance Feature Guide and Reference

convenient way is to use a product such as TCP/IP. The ftp function of TCP/IPcan be used to automate logon and file transfer.
After the transmission of log files is completed, the information contained in logdata sets at the z/OS host is collected into Tivoli Decision Support for z/OS tables.
The collected data is combined with more data (called environment data) and isfinally presented in reports.
The process of entering and maintaining environment data is called administration.Tivoli Decision Support for z/OS provides an administration dialog formaintaining resource information. Refer to the Administration Guide andReferencemanual for information on how to use the administration dialog.
Figure 1 illustrates how data is organized for presentation in Tivoli DecisionSupport for z/OS reports.
Report GroupsThe reports produced by the Distributed Systems Performance feature are groupedin the following report groups:
DistributedDistributed component reports
WindowsWindows component reports
┌──────────────────────────────────────────────┐│ Distributed and Windows Nodes ││ ┌───┐ ┌───┐ ┌───┐ ┌───┐ ││ │ ├─────┤ ├─────┤ ├─────┤ │ │ System data│ └─┬─┘ └─┬─┘ └─┬─┘ └─┬─┘ │ ││ │ │ │ │ │ ││ ┌─┴─┐ ┌─┴─┐ ┌─┴─┐ ┌─┴─┐ │ ││ │ ├─────┤ ├─────┤ ├─────┤ │ │ ││ └───┘ └───┘ └───┘ └───┘ │ ││ │ │└─────────────────────┬────────────────────────┘ │
↓ ↓┌────────────┴───────────┐ Gather data│ Distributed and │ to log files│ Windows log files │ │└────────────┬───────────┘ │
↓ │┌─────────────────────┼────────────────────────┐ ↓│ Tivoli ┌────────┴────────┐ │ Send log files to│ Decision │ Tivoli Decision │ │ z/OS, then collect│ Support │ Support for │ │ required data│ for z/OS │ z/OS records │ │ ││ └────────┬────────┘ │ ││ ↓ │ ││ ┌────────┴────────┐ ┌──────────┐ │ ↓│ │ Tivoli Decision │ │ User │ │ Environment data│ │ Support for ├←─┤ supplied │ │ summarized in the│ │ z/OS tables │ │ data │ │ Tivoli Decision│ └────────┬────────┘ └──────────┘ │ Support for│ │ │ z/OS database│ ┌───────────┼───────────┐ │ ││ ↓ ↓ ↓ │ ↓│ ┌───┴───┐ ┌───┴───┐ ┌───┴───┐ │ Required data│ │ Report│ │ Report│ │ Report│ │ presented in│ └───────┘ └───────┘ └───────┘ │ report format│ │└──────────────────────────────────────────────┘
Figure 1. Organizing and presenting system performance data
Gathering and collecting performance data
Chapter 1. Introducing the Distributed Systems Performance feature 5

The reports cover a wide range of needs in a data processing center, and reportingcan be done online or in batch. They are accessible from the Tivoli DecisionSupport for z/OS reporting dialog.
Finally, the key to successful implementation of Tivoli Decision Support for z/OSis knowing:v The information and resources on which you want to report and how to perform
customization to select themv The way you want to organize, set objectives for, and process the data (used
later to define the environment)
Report Groups
6 Tivoli Decision Support for z/OS: Distributed Systems Performance Feature Guide and Reference

Chapter 2. Installing and configuring the Distributedcomponent
This supplements the procedure in the Administration Guide and Reference forinstalling a component, with information specific to the Distributed component.
The chaptertopic describes how to plan, install, test and monitor the Distributedcomponent.
Planning the implementation processAbout this task
Before installing the Distributed component, you should follow these steps to planthe implementation process:
Procedure1. Describe user tasks. Then determine what data the Distributed component must
gather to help users accomplish those tasks.2. Determine the administration tasks you must perform for the Distributed
component, and make any decisions required by these tasks. These tasks helpyou customize Tivoli Decision Support for z/OS and the Distributedcomponent to work efficiently and effectively with your computer system.
Results
If this is your first exercise in implementation planning, follow all these steps toensure that the Distributed component's implementation is consistent. If you arereading this chaptertopic in preparation for modifying your system, you might notneed to perform all of these tasks.
Use the planning process to prepare for these main customization tasks:v Customizing the distributed nodes to generate the data required by the
Distributed component.v Defining environment data, which is all the information (in addition to the input
data) that the Distributed component needs to create reports. Environment datacontrols the data collection process and provides more information in thereports.
Figure 2 illustrates the process for implementing the Distributed component.
Installing and configuring your distributed nodesAbout this task
These sections give you step-by-step information on how to install and configureTivoli Decision Support for z/OS on your distributed nodes. This section gives ageneral overview of the process, and the sections following this give more detaileddescriptions for each target platform.
Figure 2. Implementation process for the Distributed component
7

The general process consists of the following steps:
Procedurev Check that the requirements are met, in terms of hardware, software, and other
items.v Prepare for, and install, the software on the distributed node.v Configure the distributed node for running the software.v Start the software on the distributed node.v Configure the distributed node for automatically running the software at startup
time.
Results
Instructions for each platform can be found in the following sections:v “Installing and configuring your SLES nodes,” for SuSe Linux Enterprise Server
11.v “Installing and configuring your RHEL nodes” on page 12, for Red Hat
Enterprise Linux 6.v “Installing and configuring your HP-UX nodes” on page 16, for HP-UX 11i v3.v “Installing and configuring your AIX nodes” on page 21, for IBM AIX 7.1v “Installing and configuring your Solaris nodes” on page 25, for Oracle Solaris
11.1
Note: Although the environments above are the only current officially supportedplatforms at the time of publication, the Distributed component has been built withportability in mind. The work required to get it running on other platforms will beminor compared to the heritage UNIX and Linux components.
Installing and configuring your SLES nodesAbout this task
This section gives you practical step-by-step information on how to install andconfigure Tivoli Decision Support for z/OS on your SLES nodes.
Step 1: Checking requirements (SLES)About this task
Check the following requirements:v “Disk space requirements”v “Software requirements” on page 9
Disk space requirementsYou need the following approximate disk space on each distributed node:
Table 1. Disk space requirements on each distributed node
Installation taskDisk space(approximate)
Load code in the file system 1MB
Create work files during the gathering process 5MB
Installing and configuring your distributed nodes
8 Tivoli Decision Support for z/OS: Distributed Systems Performance Feature Guide and Reference

Note: The 5MB of work files consists of:
Table 2. Detals of gathering process disk space requirements
Record type Space required
File systems (DISKFSA) 48KB (based on log record size of 100 bytes,gathering once per hour, and 20 disks)
Paging spaces (PERFPSA) 12KB (based on log record size of 100 bytes,gathering once per hour, and 5 spaces)
Processor and memory information(PERFVMA)
28KB (based on log record size of 200 bytes,gathering every 10 minutes)
Disk I/O information (PERFIOA) 576KB (based on log record size of 200 bytes,gathering every 10 minutes, and 20 disks)
Auxiliary amounts 4MB (temporary space needs, and allowance forseveral days of failed transmissions)
Software requirementsThe Distributed component requires:v Oracle SuSE Linux Enterprise Server 11.v IMPORTANT: SLES does not install the iostat program by default. You should
first check to see if it is installed by attempting to run iostat from a shell. If itcannot be found, it should be installed by the root user with the command yast2--install sysstat.
Step 2: Preparing and installing Tivoli Decision Support forz/OS code on the distributed node (SLES)
About this task
The distributed part of the Distributed component is contained in the followingSMP target library member:DRLxxx.SDRLWS(DRLDIST)
Download and install thetar.gz file using these steps
Procedure1. As the root user, create a new user drluser, according to the processes detailed
by your nominated operating system. SLES has the useradd command for thispurpose. To do this:a. Login as the root user.b. Execute the command useradd -m drluser.c. Execute the command passwd drluser.d. Enter your password, then enter password again for confirmation.
2. Once the user is created (and the password is set), login as that user.3. Enter the following commands from your home directory (/home/drluser) .v mkdir drl
v cd drl
4. Start an FTP session to your z/OS host, and receive the file from the hostwhere you installed Tivoli Decision Support for z/OS. In the followingexample, the highlighted entries show the commands you must enter.
zosboxThe IP address/name of the z/OS system where Tivoli DecisionSupport for z/OS was installed and where the tar.gz file is located.
Installing and configuring your SLES nodes
Chapter 2. Installing the Distributed component 9

tsoid The TSO user ID that has read access to the tar.gz file.
secret The password for the TSO user ID.
drlbaseThe high-level qualifier where Tivoli Decision Support for z/OS isinstalled.
The following transcript shows the transfer in action.
drluser(/home/drluser/drl): ftp zosboxConnected to zosbox.corp.com.220-FTPSERVE at ZOSBOX.CORP.COM, 11:05:24 on 02/24/12220 Connection will close if idle for more than 5 minutes.Name (zosbox:drluser): tsoid331 Send password please.Password: secret230 TSOID is logged on.ftp> binary200 Representation type is IMAGE.ftp> get ’drlbase.SDRLWS(DRLDIST)’ drldist.tar.gz200 Port request OK.125 Sending data set DRL181.SDRLWS(DRLDIST) FIXrecfm 12812345 bytes receivedftp> quit221 Quit command received. Goodbye.drluser(/home/drluser/drl):
5. On the node to which the tar file has been received, enter the followingcommands to unpack the drldist.tar.gz file and create the files in thedirectories:tar zxvf drldist.tar.gz
This will create and populate the bin, var and etc subdirectories:v bin holds all the executable files for the distributed code.v var holds all the data files created by the distributed code for transmission to
the host, along with all temporary files.v etc holds all the configuration files for the distributed code.
Step 3: Configuring the distributed node (SLES)About this task
Configure your node by following these steps:
Procedure1. Set up control files to control environment and permissions. Do this by editing
the relevant start files for the drluser user. Under SLES, this is the profile inyour home directory, /home/drluser/.profile. Add the following commands tothe end of this file:export PATH=$PATH:$HOME/drl/bin:/sbinexport DRLCFG=$HOME/drl/etc/drl.cfgumask 077chmod 755 $HOME/drl $HOME/drl/bin $HOME/drl/bin/*chmod 700 $HOME/drl/doc $HOME/drl/doc/*chmod 700 $HOME/drl/etc $HOME/drl/etc/*chmod 700 $HOME/drl/var $HOME/drl/var/*
Then log out and log back in as drluser2. Configure the /home/drluser/drl/etc/drl.cfg configuration file. As a
minimum, you need to change the following parameters:
Installing and configuring your SLES nodes
10 Tivoli Decision Support for z/OS: Distributed Systems Performance Feature Guide and Reference

Table 3. Parameters that need to be configured
Parameter Description
General:SysName The system name for identification purposes in Tivoli DecisionSupport for z/OS. This should be unique across all distributednodes.
Xfer:Host The host name or IP address of the host to transmit the datato.
Xfer:User The TSO user ID at the host.
Xfer:Password The password for that TSO user ID at the host.
Perf:IoCmd The prefabricated command indicator for collecting disk I/Ostatistics. Should be @0000 for SLES.
Perf:VmCmd The prefabricated command indicator for collecting memorystatistics. Should be @0000 for SLES.
Perf:UserCmd The prefabricated command indicator for collecting userstatistics. Should be @0000 for SLES.
Perf:ProcCmd The prefabricated command indicator for collecting processstatistics. Should be @0000 for SLES.
Disk:FsCmd The prefabricated command indicator for collecting file systemstatistics. Should be @0000 for SLES.
Page:PsCmd The prefabricated command indicator for collecting pagingspace statistics. Should be @0000 for SLES.
3. You may also want to examine the other parameters in the configuration file tosee how they affect various aspects. Each parameter section is documentedwithin the file itself. Specifically, you may need to change Xfer:DsName tochange where the data will be stored on the host. To do this, change the firstbit from TDS to the high-level qualifier you want for your data.
Step 4: Starting the distributed node (SLES)About this task
Start your node by following these steps:
Procedure1. While logged in as the drluser user, startup the gathering processes with the
command drlctrl start.2. Ensure that the following processes are running (assuming you have not
disabled them by changing General:RunProcs parameter in the configurationfile):
drlmntrThe monitor process responsible for keeping everything running.
drlperfThe process responsible for collecting disk I/O, memory usage, user,and process information.
drldiskThe process responsible for collecting disk usage information.
drlpageThe process responsible for collecting paging space information.
Installing and configuring your SLES nodes
Chapter 2. Installing the Distributed component 11

drlxferThe process responsible for transferring all information to the host.
drlclnpThe process responsible for cleaning up old files.
3. Check the nhp and log files in the var directory for errors or warnings.4. Ensure that the out files are being created in the var directory (for the drlperf,
drldisk and drlpage processes). It may take some time for all of these toappear; 10 minutes in the default configuration.
5. Ensure that the drlxfer process successfully transfers files to the host. In thedefault configuration this will not happen until early the following day, andcan be checked by examining the log files after the attempt.
6. Ensure that the drlclnp process successfully clears files from the node. This canbe tested by creating a log.drlperf-1900-01-01 in the var directory, thenexecuting the command drlctrl kill clnp, and ensuring that the file isdeleted.
Step 5: Configuring auto start on the distributed node (SLES)About this task
Configure the distributed node to automatically start the gathering software onstartup by following these steps. These have to be executed by the root user sincethey are changing system processes.
Procedure1. Login as root and go to the system startup directory cd /etc/init.d2. Create the file drluser using an editor. The contents of this file should be
#!/bin/shsu - drluser "/home/drluser/drl/bin/rc.drluser"
3. Change the permissions of the startup file with chmod 755 drluser.4. Edit the /etc/inittab file and add the line drl:5:wait:/etc/init.d/drluser.5. If possible, reboot the node to ensure the processes start up.
Installing and configuring your RHEL nodesAbout this task
This section gives you step-by-step information on how to install and configureTivoli Decision Support for z/OS on the RHEL nodes.
Step 1: Checking requirements (RHEL)About this task
Check the following requirements:v “Disk space requirements” on page 13v “Software requirements” on page 13
Installing and configuring your SLES nodes
12 Tivoli Decision Support for z/OS: Distributed Systems Performance Feature Guide and Reference

Disk space requirementsAbout this task
You need the following approximate disk space on each distributed node:
Table 4. Disk space requirements on each distributed node
Installation taskDisk space(approximate)
Loading code in the file system 1MB
Creating work files during the gathering process 5MB
Note: The 5MB of work files consists of:
Table 5. Details of gathering process disk space requirements
Record type Space required
File systems (DISKFSA) 48KB (based on log record size of 100 bytes,gathering once per hour, and 20 disks)
Paging spaces (PERFPSA) 12KB (based on log record size of 100 bytes,gathering once per hour, and 5 spaces)
Processor and memory information(PERFVMA)
28KB (based on log record size of 200 bytes,gathering every 10 minutes)
Disk I/O information (PERFIOA) 576KB (based on log record size of 200 bytes,gathering every 10 minutes, and 20 disks)
Auxiliary amounts 4MB (temporary space needs, and allowance forseveral days of failed transmissions)
Software requirementsAbout this task
The Distributed component requires:v Red Hat Linux Enterprise Server 6.
Step 2: Preparing and installing Tivoli Decision Support forz/OS code on the distributed node (RHEL)
About this task
The distributed part of the Distributed component is contained in the followingSMP target library member:DRLxxx.SDRLWS(DRLDIST)
Download and install the tar.gz file using these steps:
Procedure1. As the root user, create a new user drluser, according to the processes detailed
by your nominated operating system. RHEL has the useradd command for thispurpose. To do this:a. Login as the root user.b. Execute the command useradd -m drluser.c. Execute the command passwd drluser.d. Enter the desired password, then enter password again for confirmation.
2. Once the user is created (and the password is set), login as that user.
Installing and configuring your RHEL nodes
Chapter 2. Installing the Distributed component 13

3. Enter the following commands from your home directory (/home/drluser):v mkdir drl
v cd drl
4. Start an FTP session to your z/OS host, and receive the file from the hostwhere you installed Tivoli Decision Support for z/OS. In the followingexample, the highlighted entries show the commands you must enter.
zosboxThe IP address/name of the z/OS system where Tivoli DecisionSupport for z/OS was installed and where the tar.gz file is located.
tsoid The TSO user ID that has read access to the tar.gz file.
secret The password for the TSO user ID.
drlbaseThe high-level qualifier where Tivoli Decision Support for z/OS isinstalled.
The following transcript shows the transfer in action.
drluser(/home/drluser/drl): ftp zosboxConnected to zosbox.corp.com.220-FTPSERVE at ZOSBOX.CORP.COM, 11:05:24 on 02/24/12220 Connection will close if idle for more than 5 minutes.Name (zosbox:drluser): tsoid331 Send password please.Password: secret230 TSOID is logged on.ftp> binary200 Representation type is IMAGE.ftp> get ’drlbase.SDRLWS(DRLDIST)’ drldist.tar.gz200 Port request OK.125 Sending data set DRL181.SDRLWS(DRLDIST) FIXrecfm 12812345 bytes receivedftp> quit221 Quit command received. Goodbye.drluser(/home/drluser/drl):
5. On the node to which the tar file has been received, enter the followingcommands to unpack the drldist.tar.gz file and create the files in thedirectories:tar zxvf drldist.tar.gz
This will create and populate the bin, var and etc subdirectories:v bin holds all the executable files for the distributed code.v var holds all the data files created by the distributed code for transmission to
the host, along with all temporary files.v etc holds all the configuration files for the distributed code.
Step 3: Configuring the distributed node (RHEL)About this task
Configure your node by following these steps:
Procedure1. Set up control files to control environment and permissions. This is performed
by editing the relevant startup files for the drluser user. Under RHEL, this isthe profile in the user's home directory, /home/drluser/.bash_profile. Add thefollowing commands to the end of this file:
Installing and configuring your RHEL nodes
14 Tivoli Decision Support for z/OS: Distributed Systems Performance Feature Guide and Reference

export PATH=$PATH:$HOME/drl/bin:/sbinexport DRLCFG=$HOME/drl/etc/drl.cfgumask 077chmod 755 $HOME/drl $HOME/drl/bin $HOME/drl/bin/*chmod 700 $HOME/drl/doc $HOME/drl/doc/*chmod 700 $HOME/drl/etc $HOME/drl/etc/*chmod 700 $HOME/drl/var $HOME/drl/var/*
Then log out and log back in as drluser.2. Configure the /home/drluser/drl/etc/drl.cfg configuration file. As a
minimum you need to change the following parameters:
Table 6. Parameters that need to be configured
Parameter Description
General:SysName The system name for identification purposes in Tivoli DecisionSupport for z/OS. This should be unique across all distributednodes.
Xfer:Host The host name or IP address of the host to which the data willtransmitted.
Xfer:User The TSO user ID at the host.
Xfer:Password The password for that TSO user ID at the host.
Perf:IoCmd The prefabricated command indicator for collecting disk I/Ostatistics. Should be @0000 for RHEL.
Perf:VmCmd The prefabricated command indicator for collecting memorystatistics. Should be @0000 for RHEL.
Perf:UserCmd The prefabricated command indicator for collecting userstatistics. Should be @0000 for RHEL.
Perf:ProcCmd The prefabricated command indicator for collecting processstatistics. Should be @0000 for RHEL.
Disk:FsCmd The prefabricated command indicator for collecting file systemstatistics. Should be @0000 for RHEL.
Page:PsCmd The prefabricated command indicator for collecting pagingspace statistics. Should be @0000 for RHEL.
3. You may also want to examine the other parameters in the configuration file tosee how they affect various aspects. Each parameter section is documentedwithin the file itself. Specifically, you may need to change Xfer:DsName in orderto change where the data will be stored on the host. To do this, change the firstbit from TDS to whatever high-level qualifier you want for your data.
Step 4: Starting the distributed node (RHEL)About this task
Start your node by following these steps:
Procedure1. While logged in as the drluser user, startup the gathering processes with the
command drlctrl start.2. Ensure that the following processes are running (assuming you have not
disabled them by changing General:RunProcs parameter in the configurationfile):
drlmntrThe monitor process responsible for keeping everything running.
Installing and configuring your RHEL nodes
Chapter 2. Installing the Distributed component 15

drlperfThe process responsible for collecting disk I/O, memory usage, userand process information.
drldiskThe process responsible for collecting disk usage information.
drlpageThe process responsible for collecting paging space information.
drlxferThe process responsible for transferring all information to the host.
drlclnpThe process responsible for cleaning up old files.
3. Check the nhp and log files in the var directory for errors or warnings.4. Ensure that the out files are being created in the var directory (for the drlperf,
drldisk and drlpage processes). It may take some time for all of these toappear; 10 minutes in the default configuration.
5. Ensure that the drlxfer process successfully transfers files to the host. In thedefault configuration this will not happen until early the following day, andcan be checked by examining the log files after the attempt.
6. Ensure that the drlclnp process successfully clears files from the node. This canbe tested by creating a log.drlperf-1900-01-01 in the var directory, thenexecuting the command drlctrl kill clnp, and ensuring that the file isdeleted.
Step 5: Configuring auto-start on the distributed node (RHEL)About this task
Configure the distributed node to automatically start the gathering software onstartup by following these steps. These have to be executed by the root user asyou are changing system processes.
Procedure1. Login as root and go to the system startup directory cd /etc/init.d.2. Create the file drluser using an editor. The contents of this file should be:
#!/bin/shsu - drluser "/home/drluser/drl/bin/rc.drluser"
3. Change the permissions of the startup file with chmod 755 drluser.4. Create a symbolic link for the startup file:
cd /etc/rc5.dln -s /etc/init.d/drluser S99drluser
5. If possible, reboot the node to ensure the processes start up.
Installing and configuring your HP-UX nodesAbout this task
This section gives you step-by-step information on how to install and configureTivoli Decision Support for z/OS on your HP-UX nodes.
Installing and configuring your RHEL nodes
16 Tivoli Decision Support for z/OS: Distributed Systems Performance Feature Guide and Reference

Step 1: Checking requirements (HP-UX)About this task
Check the following requirements:v “Disk space requirements”v “Software requirements”
Disk space requirementsAbout this task
You need the following approximate disk space on each distributed node:
Table 7. Disk space requirements on each distributed node
Installation taskDisk space(approximate)
Loading code in the file system 1MB
Creating work files during the gathering process 5MB
Note: The 5MB of work files consists of:
Table 8. Detals of gathering process disk space requirements
Record type Space required
File systems (DISKFSA) 48KB (based on log record size of 100 bytes,gathering once per hour, and 20 disks)
Paging spaces (PERFPSA) 12KB (based on log record size of 100 bytes,gathering once per hour, and 5 spaces)
Processor and memory information(PERFVMA)
28KB (based on log record size of 200 bytes,gathering every10 minutes)
Disk I/O information (PERFIOA) 576KB (based on log record size of 200 bytes,gathering every 10 minutes, and 20 disks)
Auxiliary amounts 4MB (temporary space needs, and allowance forseveral days of failed transmissions)
Software requirementsAbout this task
The Distributed component requires:v HP-UX 11i v3.
Step 2: Preparing and installing Tivoli Decision Support forz/OS code on the distributed node (HP-UX)
About this task
The distributed part of the Distributed component is contained in the followingSMP target library member:DRLxxx.SDRLWS(DRLDIST)
Download and install this the tar.gz file using these steps:
Installing and configuring your HP-UX nodes
Chapter 2. Installing the Distributed component 17

Procedure1. As the root user, create a new user drluser, according to the processes detailed
by your nominated operating system. HP-UX has the useradd command forthis purpose. To do thisa. Login as the root user.b. Execute the command useradd -m drluser.c. Execute the command passwd drluser.d. Enter the desired password, then enter password again for confirmation.
2. Once the user is created (and the password is set), login as that user.3. Enter the following commands from your home directory (/home/drluser) .v mkdir drl
v cd drl
4. Start an FTP session to your z/OS host, and receive the file from the hostwhere you installed Tivoli Decision Support for z/OS. In the followingexample, the highlighted entries show the commands you must enter.
zosboxThe IP address/name of the z/OS system where Tivoli DecisionSupport for z/OS was installed and where the tar.gz file is located.
tsoid The TSO user ID that has read access to the tar.gz file.
secret The password for the TSO user ID.
drlbaseThe high-level qualifier where Tivoli Decision Support for z/OS isinstalled.
The following transcript shows the transfer in action.
drluser(/home/drluser/drl): ftp zosboxConnected to zosbox.corp.com.220-FTPSERVE at ZOSBOX.CORP.COM, 11:05:24 on 02/24/12220 Connection will close if idle for more than 5 minutes.Name (zosbox:drluser): tsoid331 Send password please.Password: secret230 TSOID is logged on.ftp> binary200 Representation type is IMAGE.ftp> get ’drlbase.SDRLWS(DRLDIST)’ drldist.tar.gz200 Port request OK.125 Sending data set DRL181.SDRLWS(DRLDIST) FIXrecfm 12812345 bytes receivedftp> quit221 Quit command received. Goodbye.drluser(/home/drluser/drl):
5. On the node to which the tar file has been received, enter the followingcommands to unpack the drldist.tar.gz file and create the files in thedirectories:gunzip drldist.tar.gz
tar xvf drldist.tar
This will create and populate the bin, var and etc subdirectories:v bin holds all the executable files for the distributed code.v var holds all the data files created by the distributed code for transmission to
the host, along with all temporary files.v etc holds all the configuration files for the distributed code.
Installing and configuring your HP-UX nodes
18 Tivoli Decision Support for z/OS: Distributed Systems Performance Feature Guide and Reference

Step 3: Configuring the distributed node (HP-UX)About this task
Configure your node by following these steps:
Procedure1. Set up control files to control environment and permissions. This is performed
by editing the relevant startup files for the drluser user. Under HP-UX, this isthe profile in the user's home directory, /home/drluser/.profile. Add thefollowing commands to the end of this fileexport PATH=$PATH:$HOME/drl/bin:/usr/sbinexport DRLCFG=$HOME/drl/etc/drl.cfgumask 077chmod 755 $HOME/drl $HOME/drl/bin $HOME/drl/bin/*chmod 700 $HOME/drl/doc $HOME/drl/doc/*chmod 700 $HOME/drl/etc $HOME/drl/etc/*chmod 700 $HOME/drl/var $HOME/drl/var/*
Then log out and log back in as drluser.2. Configure the /home/drluser/drl/etc/drl.cfg configuration file. As a
minimum, you need to change the following parameters:
Table 9. Parameters that need to be configured
Parameter Description
General:SysName The system name for identification purposes in Tivoli DecisionSupport for z/OS. This should be unique across all distributednodes.
Xfer:Host The host name or IP address of the host to transmit the datato.
Xfer:User The TSO user ID at the host.
Xfer:Password The password for that TSO user ID at the host.
Perf:IoCmd The prefabricated command indicator for collecting disk I/Ostatistics. Should be @0001 for HP-UX.
Perf:VmCmd The prefabricated command indicator for collecting memorystatistics. Should be @0001 for HP-UX.
Perf:UserCmd The prefabricated command indicator for collecting userstatistics. Should be @0000 for HP-UX.
Perf:ProcCmd The prefabricated command indicator for collecting processstatistics. Should be @0000 for HP-UX.
Disk:FsCmd The prefabricated command indicator for collecting file systemstatistics. Should be @0000 for HP-UX.
Page:PsCmd The prefabricated command indicator for collecting pagingspace statistics. Should be @0001 for HP-UX.
3. You may also want to examine the other parameters in the configuration file tosee how they affect various aspects. Each parameter section is documentedwithin the file itself. Specifically, you may need to change Xfer:DsName tochange where the data will be stored on the host. Most likely, this will simplybe changing the first bit from TDS to whatever high level qualifier you want foryour data.
Installing and configuring your HP-UX nodes
Chapter 2. Installing the Distributed component 19

Step 4: Starting the distributed node (HP-UX)About this task
Start your node by following these steps:
Procedure1. While logged in as the drluser user, startup the gathering processes with the
command drlctrl start.2. Ensure that the following processes are running (assuming you haven't
disabled them by changing General:RunProcs parameter in the configurationfile):
drlmntrThe monitor process responsible for keeping everything running.
drlperfThe process responsible for collecting disk I/O, memory usage, user,and process information.
drldiskThe process responsible for collecting disk usage information.
drlpageThe process responsible for collecting paging space information.
drlxferThe process responsible for transferring all information to the host.
drlclnpThe process responsible for cleaning up old files.
3. Check the nhp and log files in the var directory for errors or warnings.4. Ensure that the out files are being created in the var directory (for the drlperf,
drldisk and drlpage processes). It may take some time for all of these toappear; 10 minutes in the default configuration.
5. Ensure that the drlxfer process successfully transfers files to the host. In thedefault configuration this will not happen until early the following day, andcan be checked by examining the log files after the attempt.
6. Ensure that the drlclnp process successfully clears files from the node. This canbe tested by creating a log.drlperf-1900-01-01 in the var directory, thenexecuting the command drlctrl kill clnp and ensuring that the file isdeleted.
Step 5: Configuring auto-start on the distributed node(HP-UX)
About this task
Configure the distributed node to automatically start the gathering software onstartup by following these steps. These have to be executed by the root user sincethey are changing system processes.
Procedure1. Login as root and go to the system startup directory cd /sbin/init.d.2. Create the file drluser using an editor. The contents of this file should be:
#!/bin/shsu - drluser "/home/drluser/drl/bin/rc.drluser"
Installing and configuring your HP-UX nodes
20 Tivoli Decision Support for z/OS: Distributed Systems Performance Feature Guide and Reference

3. Change the permissions of that startup file with chmod 755 drluser.4. Edit the /etc/inittab file and add the line drl:345:wait:/sbin/init.d/
drluser.5. If possible, reboot the node to ensure the processes start.
Installing and configuring your AIX nodesAbout this task
This section gives you practical step-by-step information on how to install andconfigure Tivoli Decision Support for z/OS on your AIX nodes.
Step 1: Checking requirements (AIX)About this task
Check the following requirements:v “Disk space requirements”v “Software requirements”
Disk space requirementsAbout this task
You need the following approximate disk space on each distributed node:
Table 10. Disk space requirements on each distributed node
Installation taskDisk space(approximate)
Loading code in the file system 1MB
Creating work files during the gathering process 5MB
Note: The 5MB of work files consists of:
Table 11. Detals of gathering process disk space requirements
Record type Space required
File systems (DISKFSA) 48KB (based on log record size of 100 bytes,gathering once per hour, and 20 disks)
Paging spaces (PERFPSA) 12KB (based on log record size of 100 bytes,gathering once per hour, and 5 spaces)
Processor and memory information(PERFVMA)
28KB (based on log record size of 200 bytes,gathering every 10 minutes)
Disk I/O information (PERFIOA) 576KB (based on log record size of 200 bytes,gathering every 10 minutes, and 20 disks)
Auxiliary amounts 4MB (temporary space needs, and allowance forseveral days of failed transmissions)
Software requirementsAbout this task
The Distributed component requires:v IBM AIX 7.1.
Installing and configuring your HP-UX nodes
Chapter 2. Installing the Distributed component 21

Step 2: Preparing and installing Tivoli Decision Support forz/OS code on the distributed node (AIX)
About this task
The distributed part of the Distributed component is contained in the followingSMP target library member: DRLxxx.SDRLWS(DRLDIST)
Download and install this tar.gz file using these steps:
Procedure1. As the root user, create a new user drluser, according to the processes detailed
by your nominated operating system. HP-UX has the useradd command forthis purpose. To do thisa. Login as the root user.b. Execute the command useradd -m drluser.c. Execute the command passwd drluser.d. Enter the desired password, then enter password again for confirmation.
2. Once the user is created (and the password is set), login as that user.3. Enter the following commands from your home directory (/home/drluser) .v mkdir drl
v cd drl
4. Start an FTP session to your z/OS host, and receive the file from the hostwhere you installed Tivoli Decision Support for z/OS. In the followingexample, the highlighted entries show the commands you must enter.
zosboxThe IP address/name of the z/OS system where Tivoli DecisionSupport for z/OS was installed and where the tar.gz file is located.
tsoid The TSO user ID that has read access to the tar.gz file.
secret The password for the TSO user ID.
drlbaseThe high-level qualifier where Tivoli Decision Support for z/OS isinstalled.
The following transcript shows the transfer in action.
drluser(/home/drluser/drl): ftp zosboxConnected to zosbox.corp.com.220-FTPSERVE at ZOSBOX.CORP.COM, 11:05:24 on 02/24/12220 Connection will close if idle for more than 5 minutes.Name (zosbox:drluser): tsoid331 Send password please.Password: secret230 TSOID is logged on.ftp> binary200 Representation type is IMAGE.ftp> get ’drlbase.SDRLWS(DRLDIST)’ drldist.tar.gz200 Port request OK.125 Sending data set DRL181.SDRLWS(DRLDIST) FIXrecfm 12812345 bytes receivedftp> quit221 Quit command received. Goodbye.drluser(/home/drluser/drl):
5. On the node to which the tar file has been received, enter the followingcommands to unpack the drldist.tar.gz file and create the files in thedirectories:
Installing and configuring your AIX nodes
22 Tivoli Decision Support for z/OS: Distributed Systems Performance Feature Guide and Reference

gunzip drldist.tar.gz
tar xvf drldist.tar
This will create and populate the bin, var and etc subdirectories:v bin holds all the executable files for the distributed code.v var holds all the data files created by the distributed code for transmission to
the host, along with all temporary files.v etc holds all the configuration files for the distributed code.
Step 3: Configuring the distributed node (AIX)About this task
Configure your node by following these steps:
Procedure1. Set up control files to control environment and permissions. This is performed
by editing the relevant startup files for the drluser user. Under HP-UX, this isthe profile in the user's home directory, /home/drluser/.profile. Add thefollowing commands to the end of this fileexport PATH=$PATH:$HOME/drl/bin:/usr/sbinexport DRLCFG=$HOME/drl/etc/drl.cfgumask 077chmod 755 $HOME/drl $HOME/drl/bin $HOME/drl/bin/*chmod 700 $HOME/drl/doc $HOME/drl/doc/*chmod 700 $HOME/drl/etc $HOME/drl/etc/*chmod 700 $HOME/drl/var $HOME/drl/var/*
Then log out and log back in as drluser.2. Configure the /home/drluser/drl/etc/drl.cfg configuration file. At a bare
minimum, you need to change the following parameters:
Table 12. Parameters that need to be configured
Parameter Description
General:SysName The system name for identification purposes in Tivoli DecisionSupport for z/OS. This should be unique across all distributednodes.
Xfer:Host The host name or IP address of the host to transmit the datato.
Xfer:User The TSO user ID at the host.
Xfer:Password The password for that TSO user ID at the host.
Perf:IoCmd The prefabricated command indicator for collecting disk I/Ostatistics. Should be @0002 for AIX.
Perf:VmCmd The prefabricated command indicator for collecting memorystatistics. Should be @0002 for AIX.
Perf:UserCmd The prefabricated command indicator for collecting userstatistics. Should be @0000 for AIX.
Perf:ProcCmd The prefabricated command indicator for collecting processstatistics. Should be @0000 for AIX.
Disk:FsCmd The prefabricated command indicator for collecting file systemstatistics. Should be @0001 for AIX.
Page:PsCmd The prefabricated command indicator for collecting pagingspace statistics. Should be @0002 for AIX.
Installing and configuring your AIX nodes
Chapter 2. Installing the Distributed component 23

3. You may also want to examine the other parameters in the configuration file tosee how they affect various aspects. Each parameter section is documentedwithin the file itself. Specifically, you may need to change Xfer:DsName tochange where the data will be stored on the host. Most likely, this will simplybe changing the first bit from TDS to whatever high level qualifier you want foryour data.
Step 4: Starting the distributed node (AIX)About this task
Start your node by following these steps:
Procedure1. While logged in as the drluser user, startup the gathering processes with the
command drlctrl start.2. Ensure that the following processes are running (assuming you haven't
disabled them by changing General:RunProcs parameter in the configurationfile):
drlmntrThe monitor process responsible for keeping everything running.
drlperfThe process responsible for collecting disk I/O, memory usage, user,and process information.
drldiskThe process responsible for collecting disk usage information.
drlpageThe process responsible for collecting paging space information.
drlxferThe process responsible for transferring all information to the host.
drlclnpThe process responsible for cleaning up old files.
3. Check the nhp and log files in the var directory for errors or warnings.4. Ensure that the out files are being created in the var directory (for the drlperf,
drldisk and drlpage processes). It may take some time for all of these toappear; 10 minutes in the default configuration.
5. Ensure that the drlxfer process successfully transfers files to the host. In thedefault configuration this will not happen until early the following day, andcan be checked by examining the log files after the attempt.
6. Ensure that the drlclnp process successfully clears files from the node. This canbe tested by creating a log.drlperf-1900-01-01 in the var directory, thenexecuting the command drlctrl kill clnp and ensuring that the file isdeleted.
Step 5: Configuring auto-start on the distributed node (AIX)About this task
Configure the distributed node to automatically start the gathering software onstartup by following these steps. These have to be executed by the root user sincethey are changing system processes.
Installing and configuring your AIX nodes
24 Tivoli Decision Support for z/OS: Distributed Systems Performance Feature Guide and Reference

Procedure1. Login as root and go to the system startup directory cd /etc/rc.d/init.d.2. Create the file drluser using an editor. The contents of this file should be:
#!/usr/bin/shsu - drluser "/home/drluser/drl/bin/rc.drluser"
3. Change the permissions of the startup file with chmod 755 drluser.4. Create a symbolic link for the startup file
cd /etc/rc.d/rc2.dln -s /etc/rc.d/init.d/drluser S999drluser
5. If possible, reboot the node to ensure the processes start.
Installing and configuring your Solaris nodesAbout this task
This section gives you step-by-step information on how to install and configureTivoli Decision Support for z/OS on your Solaris nodes.
Step 1: Check requirements (Solaris)About this task
Check the following requirements:v “Disk space requirements”v “Software requirements” on page 26
Disk space requirementsAbout this task
You need the following approximate disk space on each distributed node:
Table 13. Disk space requirements on each distributed node
Installation taskDisk space(approximate)
Loading code in the file system 1MB
Creating work files during the gathering process 5MB
Note: The 5MB of work files consists of:
Table 14. Detals of gathering process disk space requirements
Record type Space required
File systems (DISKFSA) 48KB (based on log record size of 100 bytes,gathering once per hour, and twenty disks)
Paging spaces (PERFPSA) 12KB (based on log record size of 100 bytes,gathering once per hour, and five spaces)
Processor and memory information(PERFVMA)
28KB (based on log record size of 200 bytes,gathering every ten minutes)
Disk I/O information (PERFIOA) 576KB (based on log record size of 200 bytes,gathering every ten minutes, and twenty disks)
Auxiallary amounts 4MB (temporary space needs, and allowance forseveral days of failed transmissions)
Installing and configuring your AIX nodes
Chapter 2. Installing the Distributed component 25

Software requirementsAbout this task
The Distributed component requires:v Oracle Solaris 11.1
Step 2: Preparing and installing Tivoli Decision Support forz/OS code on the distributed node (Solaris)
About this task
The distributed part of the Distributed component is contained in the followingSMP target library member: DRLxxx.SDRLWS(DRLDIST)
Download and install this tar.gz file using these steps:
Procedure1. As the root user, create a new user drluser, according to the processes detailed
by your nominated operating system. Solaris has the useradd command for thispurpose. To do thisa. Login as the root user.b. Execute the command useradd -m drluser.c. Execute the command passwd drluser.d. Enter the desired password, then enter password again for confirmation.
2. Once the user is created (and the password is set), login as that user.3. Enter the following commands from your home directory (/export/home/
drluser) .v mkdir drl
v cd drl
4. Start an FTP session to your z/OS host, and receive the file from the hostwhere you installed Tivoli Decision Support for z/OS. In the followingexample, the highlighted entries show the commands you must enter.
zosboxThe IP address/name of the z/OS system where Tivoli DecisionSupport for z/OS was installed and where the tar.gz file is located.
tsoid The TSO user ID that has read access to the tar.gz file.
secret The password for the TSO user ID.
drlbaseThe high-level qualifier where Tivoli Decision Support for z/OS isinstalled.
The following transcript shows the transfer in action.
Installing and configuring your Solaris nodes
26 Tivoli Decision Support for z/OS: Distributed Systems Performance Feature Guide and Reference
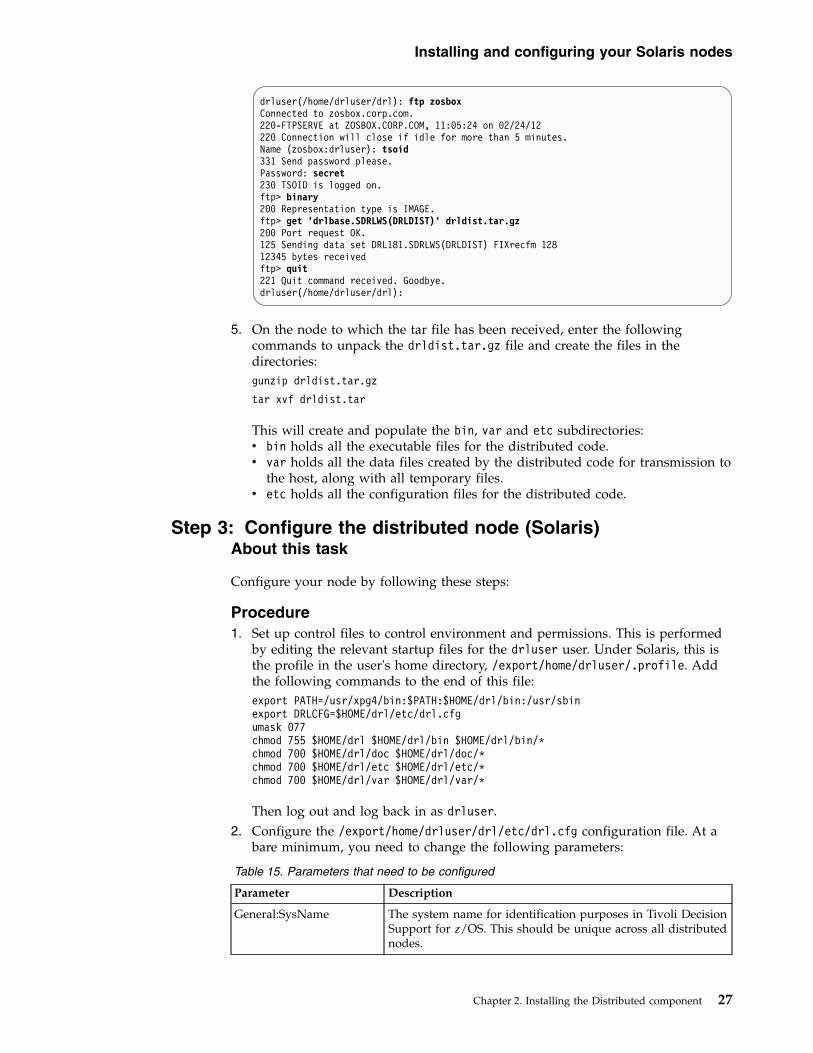
drluser(/home/drluser/drl): ftp zosboxConnected to zosbox.corp.com.220-FTPSERVE at ZOSBOX.CORP.COM, 11:05:24 on 02/24/12220 Connection will close if idle for more than 5 minutes.Name (zosbox:drluser): tsoid331 Send password please.Password: secret230 TSOID is logged on.ftp> binary200 Representation type is IMAGE.ftp> get ’drlbase.SDRLWS(DRLDIST)’ drldist.tar.gz200 Port request OK.125 Sending data set DRL181.SDRLWS(DRLDIST) FIXrecfm 12812345 bytes receivedftp> quit221 Quit command received. Goodbye.drluser(/home/drluser/drl):
5. On the node to which the tar file has been received, enter the followingcommands to unpack the drldist.tar.gz file and create the files in thedirectories:gunzip drldist.tar.gz
tar xvf drldist.tar
This will create and populate the bin, var and etc subdirectories:v bin holds all the executable files for the distributed code.v var holds all the data files created by the distributed code for transmission to
the host, along with all temporary files.v etc holds all the configuration files for the distributed code.
Step 3: Configure the distributed node (Solaris)About this task
Configure your node by following these steps:
Procedure1. Set up control files to control environment and permissions. This is performed
by editing the relevant startup files for the drluser user. Under Solaris, this isthe profile in the user's home directory, /export/home/drluser/.profile. Addthe following commands to the end of this file:export PATH=/usr/xpg4/bin:$PATH:$HOME/drl/bin:/usr/sbinexport DRLCFG=$HOME/drl/etc/drl.cfgumask 077chmod 755 $HOME/drl $HOME/drl/bin $HOME/drl/bin/*chmod 700 $HOME/drl/doc $HOME/drl/doc/*chmod 700 $HOME/drl/etc $HOME/drl/etc/*chmod 700 $HOME/drl/var $HOME/drl/var/*
Then log out and log back in as drluser.2. Configure the /export/home/drluser/drl/etc/drl.cfg configuration file. At a
bare minimum, you need to change the following parameters:
Table 15. Parameters that need to be configured
Parameter Description
General:SysName The system name for identification purposes in Tivoli DecisionSupport for z/OS. This should be unique across all distributednodes.
Installing and configuring your Solaris nodes
Chapter 2. Installing the Distributed component 27

Table 15. Parameters that need to be configured (continued)
Parameter Description
Xfer:Host The host name or IP address of the host to transmit the datato.
Xfer:User The TSO user ID at the host.
Xfer:Password The password for that TSO user ID at the host.
Perf:IoCmd The prefabricated command indicator for collecting disk I/Ostatistics. Should be @0003 for Solaris.
Perf:VmCmd The prefabricated command indicator for collecting memorystatistics. Should be @0003 for Solaris.
Perf:UserCmd The prefabricated command indicator for collecting userstatistics. Should be @0000 for Solaris.
Perf:ProcCmd The prefabricated command indicator for collecting processstatistics. Should be @0000 for Solaris.
Disk:FsCmd The prefabricated command indicator for collecting file systemstatistics. Should be @0000 for Solaris.
Page:PsCmd The prefabricated command indicator for collecting pagingspace statistics. Should be @0003 for Solaris.
3. You may also want to examine the other parameters in the configuration file tosee how they affect various aspects. Each parameter section is documentedwithin the file itself. Specifically, you may need to change Xfer:DsName tochange where the data will be stored on the host. Most likely, this will simplybe changing the first bit from TDS to whatever high level qualifier you want foryour data.
4. In particular, ensure that you check the entries for Path:BinPath andPath:VarPath. The default Solaris install places home directories into/export/home rather than just /home.
Step 4: Start and check the distributed node (Solaris)About this task
Start your node by following these steps:
Procedure1. While logged in as the drluser user, start up the gathering processes with the
command drlctrl start.2. Ensure that the following processes are running (assuming you haven't
disabled them by changing General:RunProcs parameter in the configurationfile):v drlmntr, the monitor process responsible for keeping everything running.v drlperf, the process responsible for collecting disk I/O, memory usage, user
and process information.v drldisk, the process responsible for collecting disk usage information.v drlpage, the process responsible for collecting paging space information.v drlxfer, the process responsible for transferring all information to the host.v drlclnp, the process responsible for cleaning up old files.
3. Check the nhp and log files in the var directory for errors or warnings.
Installing and configuring your Solaris nodes
28 Tivoli Decision Support for z/OS: Distributed Systems Performance Feature Guide and Reference
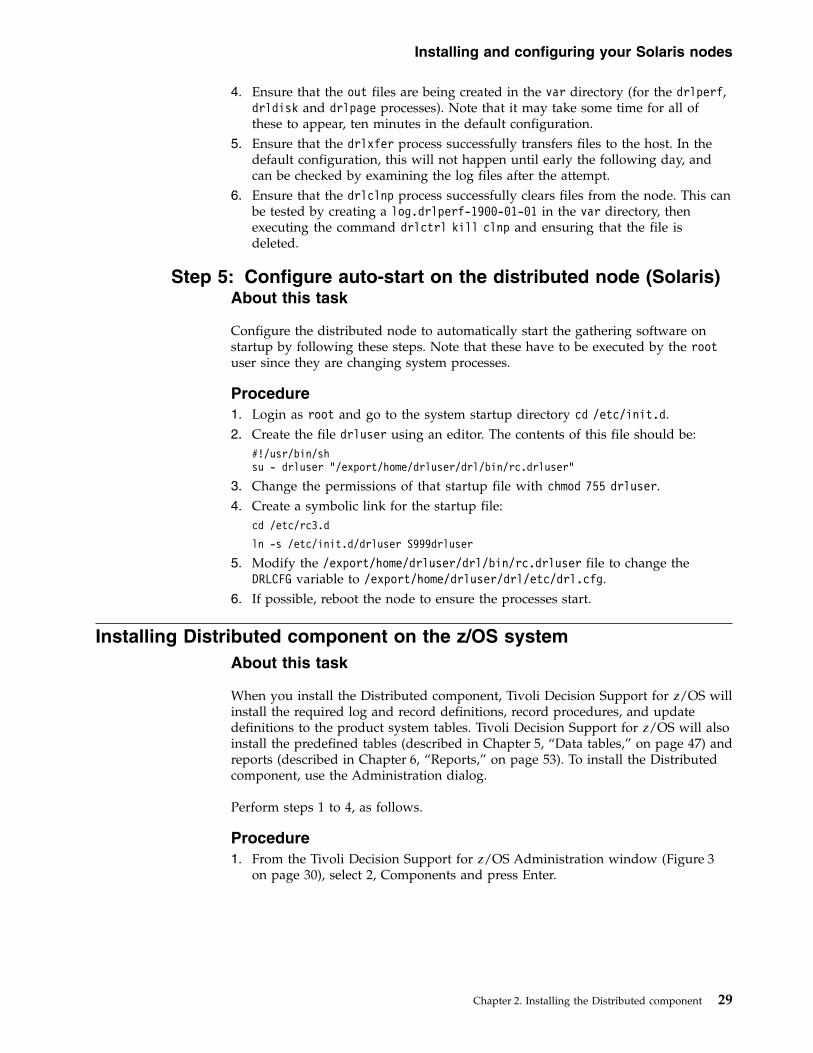
4. Ensure that the out files are being created in the var directory (for the drlperf,drldisk and drlpage processes). Note that it may take some time for all ofthese to appear, ten minutes in the default configuration.
5. Ensure that the drlxfer process successfully transfers files to the host. In thedefault configuration, this will not happen until early the following day, andcan be checked by examining the log files after the attempt.
6. Ensure that the drlclnp process successfully clears files from the node. This canbe tested by creating a log.drlperf-1900-01-01 in the var directory, thenexecuting the command drlctrl kill clnp and ensuring that the file isdeleted.
Step 5: Configure auto-start on the distributed node (Solaris)About this task
Configure the distributed node to automatically start the gathering software onstartup by following these steps. Note that these have to be executed by the rootuser since they are changing system processes.
Procedure1. Login as root and go to the system startup directory cd /etc/init.d.2. Create the file drluser using an editor. The contents of this file should be:
#!/usr/bin/shsu - drluser "/export/home/drluser/drl/bin/rc.drluser"
3. Change the permissions of that startup file with chmod 755 drluser.4. Create a symbolic link for the startup file:
cd /etc/rc3.d
ln -s /etc/init.d/drluser S999drluser
5. Modify the /export/home/drluser/drl/bin/rc.drluser file to change theDRLCFG variable to /export/home/drluser/drl/etc/drl.cfg.
6. If possible, reboot the node to ensure the processes start.
Installing Distributed component on the z/OS systemAbout this task
When you install the Distributed component, Tivoli Decision Support for z/OS willinstall the required log and record definitions, record procedures, and updatedefinitions to the product system tables. Tivoli Decision Support for z/OS will alsoinstall the predefined tables (described in Chapter 5, “Data tables,” on page 47) andreports (described in Chapter 6, “Reports,” on page 53). To install the Distributedcomponent, use the Administration dialog.
Perform steps 1 to 4, as follows.
Procedure1. From the Tivoli Decision Support for z/OS Administration window (Figure 3
on page 30), select 2, Components and press Enter.
Installing and configuring your Solaris nodes
Chapter 2. Installing the Distributed component 29

2. From the Components window, select the components to install (here, theDistributed component) and press F6.
3. The Installation Options window is displayed, (as shown in Figure 5 on page31).
Other Utilities Help------------------------------------------------------------------------------
AdministrationCommand ===> _____________________________________________________________
Select one of the following. Then press Enter.
2_ 1. System2. Components3. Logs4. Tables5. Reports
F1=Help F2=Split F3=Exit F9=Swap F10=Actions F12=Cancel
The Components window is displayed, (as shown in Figure 4).Figure 3. Tivoli Decision Support for z/OS Administration window
Component Space Other Help------------------------------------------------------------------------------
Components ROW 1 TO 16 OF 80Command ===> _____________________________________________________________
Select one or more components. Then press Enter to Open component.
/ Components Status Date_ z/OS System (MVS) Component Installed 2012-09-12_ z/OS Availability Component_ z/OS Interval Job/Step Accounting Component_ z/OS Performance Management (MVSPM) Component_ z/VM Performance Component_ CICS Monitoring Component_ CICS Monitoring Partitioned Component_ CICS OMEGAMON Monitoring Component_ CICS Statistics Component_ CICS Statistics Partitioned Component_ CICS Tran and UOW Analysis Partitioning Component_ CICS Transaction and UOW Analysis Component_ CICS Transaction Gateway Component_ Data Set Component/ Distributed Component_ DB2 Component
F1=Help F2=Split F3=Exit F5=New F6=Install F7=BkwdF8=Fwd F9=Swap F10=Actions F12=Cancel
Figure 4. Components window
Installing Distributed component on the z/OS system
30 Tivoli Decision Support for z/OS: Distributed Systems Performance Feature Guide and Reference
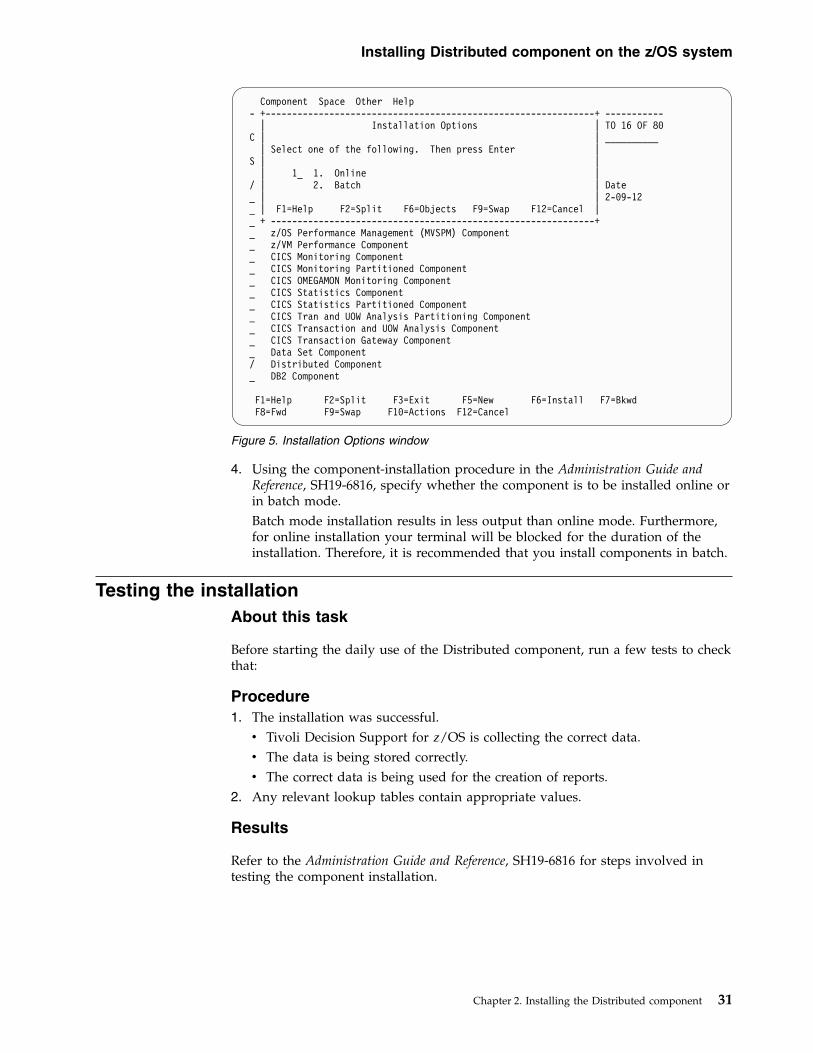
4. Using the component-installation procedure in the Administration Guide andReference, SH19-6816, specify whether the component is to be installed online orin batch mode.Batch mode installation results in less output than online mode. Furthermore,for online installation your terminal will be blocked for the duration of theinstallation. Therefore, it is recommended that you install components in batch.
Testing the installationAbout this task
Before starting the daily use of the Distributed component, run a few tests to checkthat:
Procedure1. The installation was successful.v Tivoli Decision Support for z/OS is collecting the correct data.v The data is being stored correctly.v The correct data is being used for the creation of reports.
2. Any relevant lookup tables contain appropriate values.
Results
Refer to the Administration Guide and Reference, SH19-6816 for steps involved intesting the component installation.
Component Space Other Help- +--------------------------------------------------------------+ -----------
| Installation Options | TO 16 OF 80C | | __________
| Select one of the following. Then press Enter |S | |
| 1_ 1. Online |/ | 2. Batch | Date_ | | 2-09-12_ | F1=Help F2=Split F6=Objects F9=Swap F12=Cancel |_ + -------------------------------------------------------------+_ z/OS Performance Management (MVSPM) Component_ z/VM Performance Component_ CICS Monitoring Component_ CICS Monitoring Partitioned Component_ CICS OMEGAMON Monitoring Component_ CICS Statistics Component_ CICS Statistics Partitioned Component_ CICS Tran and UOW Analysis Partitioning Component_ CICS Transaction and UOW Analysis Component_ CICS Transaction Gateway Component_ Data Set Component/ Distributed Component_ DB2 Component
F1=Help F2=Split F3=Exit F5=New F6=Install F7=BkwdF8=Fwd F9=Swap F10=Actions F12=Cancel
Figure 5. Installation Options window
Installing Distributed component on the z/OS system
Chapter 2. Installing the Distributed component 31
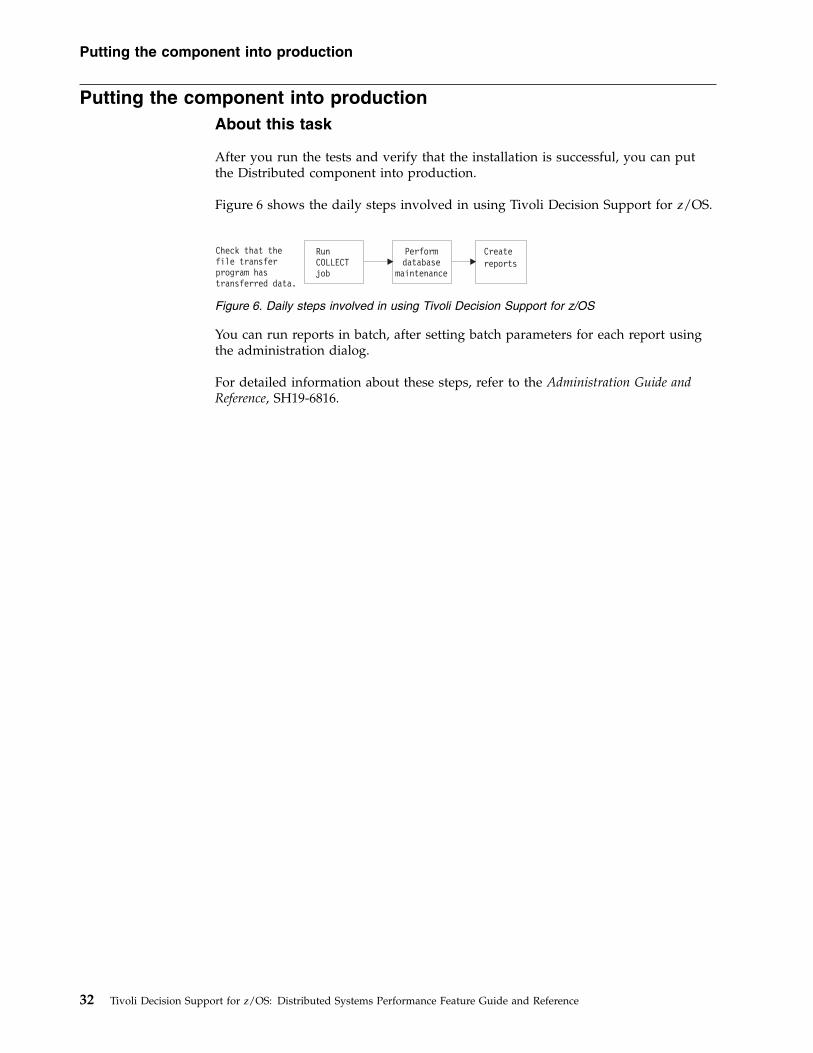
Putting the component into productionAbout this task
After you run the tests and verify that the installation is successful, you can putthe Distributed component into production.
Figure 6 shows the daily steps involved in using Tivoli Decision Support for z/OS.
You can run reports in batch, after setting batch parameters for each report usingthe administration dialog.
For detailed information about these steps, refer to the Administration Guide andReference, SH19-6816.
Check that thefile transferprogram hastransferred data.
RunCOLLECTjob
Performdatabase
maintenance
Create
reports
Figure 6. Daily steps involved in using Tivoli Decision Support for z/OS
Putting the component into production
32 Tivoli Decision Support for z/OS: Distributed Systems Performance Feature Guide and Reference

Chapter 3. Installing and configuring the Windows component
This supplements the procedure in the Administration Guide and Reference,SH19-6816 for installing a component, with information specific to the Windowscomponent.
The topic describes how to plan, install, and test the Windows component.
Planning the implementation processAbout this task
Before installing the Windows component, you should follow these steps to planthe implementation process:
Procedure1. Describe user tasks. Determine what data the Windows component must gather
to help users accomplish those tasks.2. Determine which Windows subcomponents you must install to meet the user
needs.3. Determine the administration tasks you must perform for the selected
subcomponents, and make any decisions required by these tasks. These taskshelp you customize Tivoli Decision Support for z/OS and the Windowscomponent to work efficiently and effectively with your computer system.
4. Determine the tasks you must perform for each selected subcomponent whencustomizing the supported products to work with Tivoli Decision Support forz/OS and with the Windows component.
Results
If this is your first exercise in implementation planning follow all these t to ensurethat the Windows component's implementation is consistent. If you are readingthis topic in preparation for modifying your system, you might not need toperform all of these tasks.
Use the planning process to prepare for the following main customization tasks:v Customizing Windows to generate the data required by the subcomponents you
install.v Defining environment data, which is all the information (in addition to the input
data) that the Windows component needs to create reports. Environment datacontrols the data-collection process and provides more information in thereports.
Figure 7 on page 34 illustrates the process for implementing the Windowscomponent.
33

Considering which Windows subcomponents to installYour most critical planning item is determining what information users need fromthe Windows component. For example, users may be interested only in processorinformation. Installing only those subcomponents needed to meet userrequirements ensures that the feature benefits users while it minimizes theperformance impact caused by data collection and interpretation activities.
The Windows component is divided into two subcomponents:v Windows Performancev Windows Device
Subcomponents are groups of Tivoli Decision Support for z/OS objects. Forexample, predefined update definitions, data tables, and reports. If you find thatyou need reports from a subcomponent that you have not installed, you mustinstall that subcomponent and then wait until enough data is collected to createreports. However, if you install more subcomponents than you need, TivoliDecision Support for z/OS collects needless data, which takes up disk space anduses processor time.
At this point, you might find it helpful to examine the predefined reports for eachsubcomponent, by turning to Chapter 6, “Reports,” on page 53.
┌───────────────────────────────┐ ┌───────────────────────────────┐│ Installing Tivoli Decision │ │ Planning to use the ├←─────┐│ Support for z/OS │ │ Windows component │ │└───────────────┬───────────────┘ │ (implementation and ├←──┐ │
↓ │ modifications) │ │ │┌───────────────┴───────────────┐ └─────────┬──────┬──────┬───────┘ │ ││ Installing the │ │ │ │ │ ││ Windows Component ├←───────────────┘ │ │ │ ││ (and its components) │ │ │ │ │└───────────────┬───────────────┘ │ │ │ │
│ │ │ │ ││ ┌───────────────────────────────┘ │ │ │↓ ↓ ↓ │ │
┌───────────────┴───────┴───────┐ ┌───────────────────────┴───────┐ │ ││ Administering Tivoli Decision │ │ Customizing Windows │ │ ││ Support for z/OS and the │ └───────────────────────────────┘ │ ││ Windows component │ │ │└───────────────┬───────────────┘ │ │
↓ │ │┌───────────────┴───────────────┐ │ ││ Testing the component │ │ │└───────────────┬───────────────┘ │ │
↓ │ │┌───────────────┴───────────────┐ Modification requirements │ ││ Evaluating the feature’s ├──────────────────────────────────────────┘ ││ implementation │ │└───────────────┬───────────────┘ │
↓ │┌───────────────┴───────────────┐ Maintenance requirements ││ Putting the component ├─────────────────────────────────────────────┘│ into production │└───────────────────────────────┘
Figure 7. Implementation process for the Windows component
Considering which Windows subcomponents to install
34 Tivoli Decision Support for z/OS: Distributed Systems Performance Feature Guide and Reference

Installing the Windows component on your Windows nodesAbout this task
This section gives you step-by-step information on how to install Tivoli DecisionSupport for z/OS on your Windows nodes.
Step 1: Checking Windows requirementsAbout this task
Check the following Windows requirements:v “Disk space requirements”v “Software requirements”
Disk space requirementsAbout this task
You need the following approximate disk space on each Windows node:
Table 16. Disk space requirements on each Windows node
Installation taskDisk space(approximate)
Loading code in the file system. For example, c:\tdszwin\bin: 1MB
Creating configuration file in. For example, c:\tdszwin\etc: 1MB
Creating directory for data files in. For example, c:\tdszwin\var: 10MB (see note)
Note: The 10MB is based on the following assumptions:
v Performance information written every 5 minutes (default) resulting in about 12 x 24 x100 bytes (30K) per day.
v Device information written every 30 minutes (default) resulting in about 2 x 24 x 100bytes (5K) per day.
v Allowance for a couple of hundred days of these files plus some overhead.
Software requirementsAbout this task
The Windows component requires all of the following programs:v Microsoft Windows 2003 Server or 2008 Serverv WMI enabledv VBScript enabled
Step 2: Transferring Tivoli Decision Support for z/OS featurecode to Windows
About this task
The Windows part of the Windows component is distributed inDRLxxx.SDRLWS(DRLWIN). Download this zip file using these steps:
Procedure1. Login to the Windows node and open a command window.
Installing the Windows component on your Windows nodes
Chapter 3. Installing and configuring the Windows component 35

2. Enter the following commands (we will assume all the files are to be storedunder c:\tdszwin, although you can place them anywhere as long as youadjust paths in later instructions: bin is for program binaries, etc forconfiguration and var for data files):c:mkdir \tdszwinmkdir \tdszwin\binmkdir \tdszwin\etcmkdir \tdszwin\varcd \tdszwin\bin
3. Start an FTP session to your z/OS host, and receive the file from the z/OS userwhere you installed Tivoli Decision Support for z/OS. In the followingexample, the highlighted entries show the commands you must enter.
yourmvsThe IP address/name of the z/OS system where Tivoli DecisionSupport for z/OS was installed and where the tar file is located.
epdmwinThe TSO user ID that has read access to the tar file.
c:\tdszwin\bin> ftp yourmvsConnected to yourmvs.yourcorp.com.220-FTPSERVE at YOURMVS.SE.IBM.COM, 11:05:24 on 03/24/00220 Connection will close if idle for more than 5 minutes.Name (yourmvs:root): epdmwin331 Send password please.Password: secret230 EPDMWIN is logged on.ftp> binary200 Representation type is IMAGE.ftp> get ’drl181.sdrlws(drlwin)’ epdmwin.zip200 Port request OK.125 Sending data set DRL181.SDRLWS(DRLWIN) FIXrecfm 12810240 bytes received in 0.05 seconds (204.80 Kbytes/s)ftp> quit221 Quit command received. Goodbye.c:\tdszwin\bin>
4. On the Windows node, use Windows Explorer to unzip the contents ofepdmwin.zip into your bin directory.
5. (Optional) After completing the previous step you can remove the zip file. Ifyou need the zip file in the future, it still exists on z/OS and can be used again.
6. A sample drl.cfg parameter file is distributed asc:\tdszwin\bin\drl.cfg-sample. Copy and rename the parameter file toc:\tdszwin\etc\drl.cfg usingWindows Explorer.
Capturing Windows component data and transmitting to z/OSAbout this task
This section describes the steps you must perform to set up the Windowscomponent system to capture performance data, and to transmit the data to thez/OS system:v Step 1: Customize Windows node.v Step 2: Set up scheduled tasks.
Installing the Windows component on your Windows nodes
36 Tivoli Decision Support for z/OS: Distributed Systems Performance Feature Guide and Reference

Step 1: Customizing the Windows nodeAbout this task
Edit the parameter file c:\tdszwin\etc\drl.cfg to change the default valuessupplied by the Windows component to those for your installation.
Parameter file values to changeNodeName = IBM-BOX01XmitServer = pthbox3.au.ibm.comXmitUser = drluserXmitPassword = drlpwdDrlPerfdXlat = ’drldata.perfd.n{n5,5}.d{f12,6}’
ParameterDescription
NodeNameThe unique identifier for this node (up to 16 characters).
XmitServerHost name (TCP nodename or TCP internet address) of the z/OS host toreceive the Windows component data files.
XmitUserUser name to use for transmitting to host.
XmitPasswordPassword to use for transmitting to host. This drl.cfg file should beprotected as much as practicable by the Windows operating system. Inaddition, the RACF user should be setup with only enough capabilities towrite to the required locations.
DrlPerfdXlatThe translation string used to form the host file name. The characters inthis translation string are copied exactly as they are, except when one ofthe following constructs is found (X and Y are considered to be numbers).
{nX,Y} Will cause characters from the NodeName to be copied to the filename. The X indicates start position (1 is the first character) and Yindicates the number of characters to copy.
{fX,Y} Will cause characters from the input file name to be copied to thefile name. The X indicates start position (1 is the first character)and Y indicates the number of characters to copy.
Consequently, the node name of "IBM-PAXPRIM" and input filenameofdrlperfd_20090529.txt, the translation stringtdssrv.log.n{n5,7}.d{f12,6} will result in thefiletdssrv.log.nPAXPRIM.d090529 being created on the host. Any non-validcharacters in the resulting name will be replaced with $.
Step 2: Setting up scheduled tasksAbout this task
The processes that will collect performance and disk space data during the day areinitiated by Windows Scheduled Tasks.
The process which transmits the information to the host is also controlled byWindows Scheduled Tasks.
Installing the Windows component on your Windows nodes
Chapter 3. Installing and configuring the Windows component 37

You can use other scheduling solutions, such as Tivoli Workload Scheduler, butthey are not covered here.
In order to set up drlperfd, you should follow these steps(for Windows 2003Server):
Procedure1. From the Start menu, add a scheduled task under the control panel (the
method to do this may vary depending on how your operating system is setup).
2. From the scheduled task wizard, click the Next button.3. Click on Browseand select c:\tdszwin\bin\drlperfd.vbs, then click on the
Open button.4. Call the task drlperfd, choose Daily then click on the Next button.5. Set the start time to 12:02 AM, every day, starting today then click on the
Next button.6. Enter your workstation password twice then click on the Next button.7. Check the Open advanced properties then click on the Finish button.8. Insert wscript (note the space at end) before the current run text.9. Append c:\tdszwin\etc\drl.cfg c:\tdszwin\var to the end of the run text.
For example:wscript c:\tdszwin\bin\drlperfd.vbs c:\tdszwin\etc\drl.cfg c:\tdszwin\var
10. Click on the OK button and enter the password again, if necessary.11. Exit from the scheduled task control panel application.
Results
Set up a similar task called drlperfd_boot, the only difference being that it shouldbe scheduled to start when the computer starts.
Set up a task for drlxmit.vbs to start at 12:10AM, 12:20AM and 12:30AM.
From scheduled tasks, run the drlperfd task by right-clicking on it and selectingRun. You should find that the control file and log file are created inc:\tdszwin\var. Once a suitable time has passed (enough to reach a 5 minuteboundary like 10:00, 10:05 or 12:35), the data file will also appear.
Installing Windows component on the z/OS systemAbout this task
When you install Windows component subcomponents, Tivoli Decision Support forz/OS will install the required log and record definitions, record procedures, andupdate definitions to Tivoli Decision Support for z/OS system tables. To install theWindows subcomponents, use the Administration dialog.
Perform steps 1 to 4, as follows:
Procedure1. From the Tivoli Decision Support for z/OS Administration window (Figure 8
on page 39), select 2, Components and press Enter.
Installing the Windows component on your Windows nodes
38 Tivoli Decision Support for z/OS: Distributed Systems Performance Feature Guide and Reference

The Components window is displayed, (as shown in Figure 9).
2. From the Components window, select the components to install (here, theWindows component) and press F6.
3. If individual subcomponents are listed, select the desired subcomponents forinstallation.
4. The Installation Options window is displayed, (as shown in Figure 10 on page40).
Other Utilities Help--------------------------------------------------------------------------
Tivoli Decision Support for z/OS Administration
Select one of the following. Then press Enter.
2_ 1. System2. Components3. Logs4. Tables5. Reports
Command ===> ______________________________________________________________F1=Help F2=Split F3=Exit F9=Swap F10=Actions F12=Cancel
Figure 8. Tivoli Decision Support for z/OS Administration window
Components Other Help------------------------------------------------------------------------------
Components ROW 1 TO 13 OF 47
Select one or more components. Then press Enter to Open component.
/ Components Status Date_ Network NetView FTP Component Installed 00-03-19_ Network NPM Internal Utilization Component Installed 00-03-19_ Network NV/SM Internal Utilization Component Installed 00-03-19_ Network Problem Component Installed 00-03-19_ Network RTM Response Time Component Installed 00-03-19_ Network Service Component Installed 00-03-19_ DB2 Component Installed 00-03-17_ Information/Management Component Installed 00-03-17/ Windows Component
Command ===> _________________________________________________________________F1=Help F2=Split F3=Exit F5=New F6=Install F7=BkwdF8=Fwd F9=Swap F10=Actions F12=Cancel
Figure 9. Components window
Installing Windows component on the z/OS system
Chapter 3. Installing and configuring the Windows component 39

5. Using the component-installation procedure in theAdministration Guide andReference, SH19-6816 specify whether the component is to be installed online, orin batch mode.Batch mode installation results in less output than online mode. Furthermore,for online installation your terminal will be blocked for the duration of theinstallation. Therefore, it is recommended that you install components in batch.
Collecting data under Tivoli Decision Support for z/OSAbout this task
There are various methods you can define yourself to setup the JCL for theCOLLECT procedure. This section, however, describes a method that uses a normaldata set. It explains the JCL for a general collect job, which uses a data set tocollect data into Tivoli Decision Support for z/OS tables.
General collect jobAbout this task
The member DRLxxx.SDRLCNTL(DRLJCOLL) contains sample JCL for a general collect.
Another way to obtain the COLLECT JCL, is to:
Procedure1. Select 'Tivoli Decision Support for z/OS Administration' from the Tivoli
Decision Support for z/OS Primary Menu.2. Select '3. LOGS'.3. Select 'Windows' from the list of logs, select the 'Utilities' pull-down, and press
Enter.4. Select '1. Collect'.5. Type your installation-specific information in this window, and press Enter.
Components Other Help.-----------------------------------------------------------------------------.| ROW 1 TO 7 OF 7 || .--------------------------------------------------------------. || S| Installation Options | Enter. || | | || /| Select one of the following. Then press Enter. |Date || /| | || _| __ 1. Online | || _| 2. Batch | || _| | || _| F1=Help F2=Split F6=Objects F9=Swap F12=Cancel | || _|--------------------------------------------------------------| || _ || ***************************** BOTTOM OF DATA ****************************** || || || || || || Command ===> ______________________________________________________________ || F1=Help F2=Split F7=Bkwd F8=Fwd F9=Swap F12=Cancel |’-----------------------------------------------------------------------------’F18=Fwd F9=Swap F10=Actions F12=Cancel
Figure 10. Installation Options window
Installing Windows component on the z/OS system
40 Tivoli Decision Support for z/OS: Distributed Systems Performance Feature Guide and Reference

Results
Figure 11 shows an example of the general collect job.
Testing the installationAbout this task
Before starting the daily use of the Windows component, run a few tests to checkthat:
Procedure1. The installation was successful.v Tivoli Decision Support for z/OS is collecting the correct datav The data is being stored correctlyv The correct data is being used for the creation of reports
2. The lookup tables contain appropriate values.
Results
Refer to the Administration Guide and Reference for detail about the steps involved intesting component installation.
Putting the component into productionAbout this task
After you run the tests and verify that the installation is successful, you can putthe Windows component and its subcomponents into production.
//JOBCARD//* *//* Notes: *//* Before you submit the job: *//* - Check the Tivoli Decision Support for z/OS and DB2 *//* data set names. *//* - Check the DB2 subsystem name (default is DSN) *//* and Tivoli Decision Support for z/OS *//* system table prefix (default is DRLSYS). *//* - Insert the correct collect statement in DRLIN *//* (as described above). *//* - Specify the name of the log data set (or GDG) in *//* DRLLOG. In this example, all existing generations *//* are to be collected for files from Windows *//* *//***************************************************************//COLLECT EXEC PGM=DRLPLC,PARM=(’SYSTEM=DB2A SYSPREFIX=DRLSYS’)//STEPLIB DD DISP=SHR,DSN=DRL180.SDRLLOAD// DD DISP=SHR,DSN=db2loadlibrary//DRLIN DD *
COLLECT WINDOWS;
//DRLLOG DD DISP=SHR,DSN=USER1.COLLECT.EPDMWIN//DRLOUT DD SYSOUT=*,DCB=(RECFM=F,LRECL=80)//DRLDUMP DD SYSOUT=*,DCB=(RECFM=F,LRECL=80)/*
Figure 11. General COLLECT job
Collecting data under Tivoli Decision Support for z/OS
Chapter 3. Installing and configuring the Windows component 41

Figure 12 shows the daily steps involved in using Tivoli Decision Support forz/OS.
You can run reports in batch, after setting batch parameters for each report usingthe administration dialog.
For detailed information about these steps, refer to the Administration Guide andReference.
Check that thefile transferprogram hastransferred data.
RunCOLLECTjob
Performdatabase
maintenance
Create
reports
Figure 12. Daily steps involved in using Tivoli Decision Support for z/OS
Putting the component into production
42 Tivoli Decision Support for z/OS: Distributed Systems Performance Feature Guide and Reference

Part 2. Distributed Systems Performance Feature Reference
43

44 Tivoli Decision Support for z/OS: Distributed Systems Performance Feature Guide and Reference

Chapter 4. Data flow and Tivoli Decision Support for z/OSobjects
The chapters in this part describe:v The general data flow, starting with the gathering of data at the distributed and
Windows nodes into log files, and ending with the production of Tivoli DecisionSupport for z/OS reports.
v The data tables used for storing the collected information.v The record specifications used for displaying information.v The record definitions and log types used for mapping data.v The data flow for these Distributed Systems Performance components, including
the names of log files, and Tivoli Decision Support for z/OS records, tables, andreports.
Distributed Systems Performance feature general data flow
The processing steps shown in Figure 13 can be viewed as:
▌1▐ Agents gather data into log files.
┌─────────────────────┐│ Distributed or ││ Windows Node │└──────────┬──────────┘
↓ (1)┌──────────┴──────────┐│ Log files │└──────────┬──────────┘
│├│
┌───────────────┼────────────────────────────────────────────┐│ │ (2) Tivoli Decision Support system ││ ↓ (z/OS) ││ ┌──────────┴──────────┐ ││ │ Log data sets │ ││ └──────────┬──────────┘ ││ ↓ ││ ┌──────────┴──────────┐ ││ │ Log definitions │ Tivoli Decision ││ │ Record definitions │ Support for z/OS ││ └──────────┬──────────┘ "Collect" ││ │ ││ ↓ (3) ││ ┌──────────┴──────────┐ ┌─────────────────────┐ ││ │ Tables ├←──────┤ Control tables │ ││ └──────────┬──────────┘ │ Lookup tables │ ││ │ └─────────────────────┘ ││ │ │└───────────────┼────────────────────────────────────────────┘
↓ (4)┌──────────┴──────────┐ ┌─────────────────────┐│ Reports ├←──────┤ Lookup tables │└─────────────────────┘ └─────────────────────┘
Figure 13. General Distributed Systems Performance feature data flow
45

▌2▐ Those log file are transmitted to Tivoli Decision Support for z/OS as logdata sets.
▌3▐ Tivoli Decision Support for z/OS collects those log data sets into tables.
▌4▐ Reports can be run to present the contents of those tables.
The following sections explain these steps in more detail:1. Gather data, Step ▌1▐
The basic data used by the Distributed Systems Performance feature is gatheredby agents into log files. These agents, which run on the distributed andWindows nodes, either issue commands or process files to gather the data.
2. Transmit log file to Tivoli Decision Support for z/OS, Step ▌2▐TCP/IP is used to transmit the log files to Tivoli Decision Support for z/OS.
3. Collect log data set information to Tivoli Decision Support for z/OS tables,Step ▌3▐In processing each record contained in the log data set, the collect procedure:a. Uses a log collector to update the Tivoli Decision Support for z/OS table
with the record. To do this, the log collector:v Uses the log definition and record definitions to update the Tivoli
Decision Support for z/OS table with the reformatted record.v Uses an update definition to decide which reformatted record fields are to
be included in which Tivoli Decision Support for z/OS table, includingfurther summarizing into other tables (for example, updating the monthlytable DIST_DISK_M from the information used for updating the dailytable DIST_DISK_D).
v Takes information from control tables, where necessary.v Uses lookup tables, where necessary, to add user-defined data to the Tivoli
Decision Support for z/OS table record.A description of the collect procedure is provided in the Language Guide andReference, SH19-6817. A description of the use of control tables is provided inthe Administration Guide and Reference, SH19-6816.
4. Create reports, Step ▌4▐A description of how to create new reports is provided in the Guide toReporting. The reports that can be created when using the Distributed SystemsPerformance feature are described in Chapter 6, “Reports,” on page 53.
Distributed Systems Performance feature general data flow
46 Tivoli Decision Support for z/OS: Distributed Systems Performance Feature Guide and Reference

Chapter 5. Data tables
The Tivoli Decision Support for z/OS database is a collection of DB2® tables,where each table contains a fixed number of columns. The number of rows in eachtable varies with time, because of rows added by the collect function and becauseof database maintenance.
This chaptertopic describes:v The format that is used for defining Distributed Systems Performance feature
table names and viewsv The layout of the tablesv The tables used by the Distributed componentv The tables used by the Windows component
Note: For descriptions of common data tables used by the Distributed SystemsPerformance feature and other Tivoli Decision Support for z/OS features, refer tothe Administration Guide and Reference, SH19-6816.
Naming standard for tablesThe names of the Distributed Systems Performance feature tables use one of thefollowing formats:
DIST_content_suffixWIN_PERF_content_suffix
where:v DIST or WIN_PERF specify whether the table is for the Distributed component
or Windows component respectively.v content is a description of the data held in the table (for example, DIST_CPU_D
for the CPU statistics).v suffix indicates the summarization level of the data in the table (for example,
DIST_CPU_D for CPU statistics summarized by day). A table name can havethese summarization-level suffixes:_H The table holds data summarized by hour (hourly data)._D The table holds data summarized by day (daily data)._M The table holds data summarized by month (monthly data).
Table descriptionsEach table description includes information about the table, a description of eachof the primary key columns, and a description of each of the data columns.v Primary key columns are marked with a “K”. They are sorted in the sequence
they appear in the key, from most significant to least.v Data columns follow the last key column and are sorted in alphabetical order
with the underscore ignored.
The descriptions of most key columns and data columns contain references to thefields from which they are derived in the record (for example, “From AC_UID”).For an explanation of such fields, refer to the log record definitions.
47
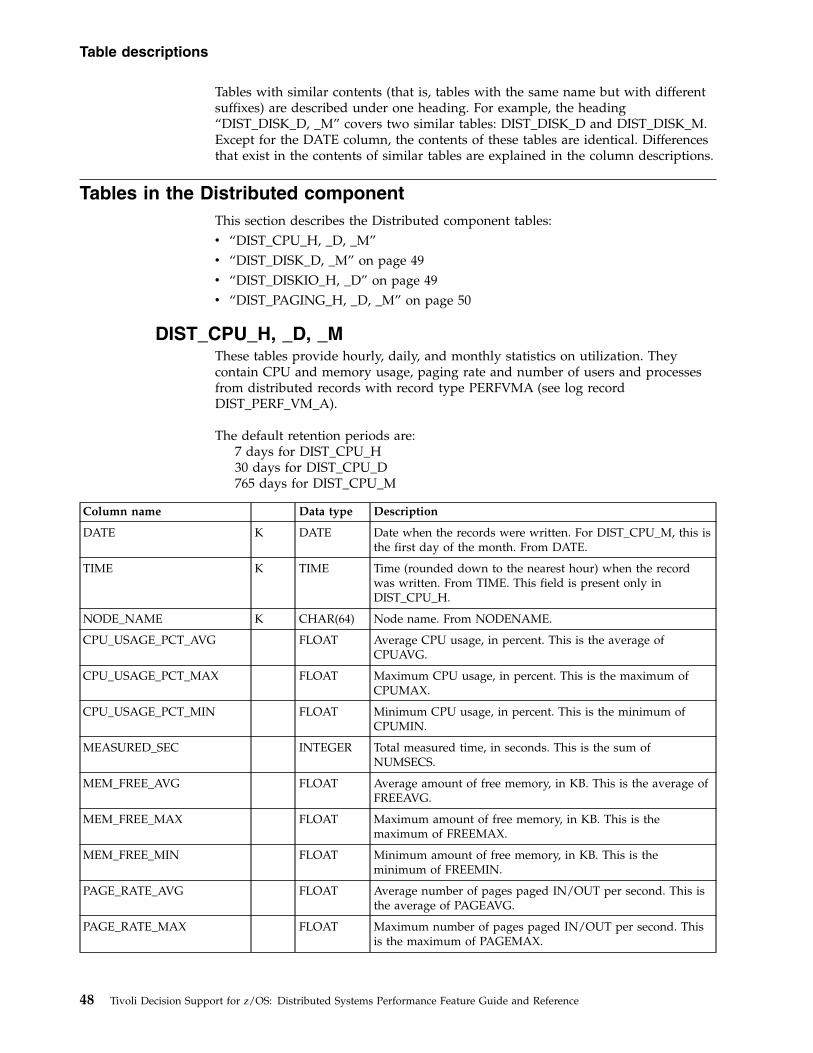
Tables with similar contents (that is, tables with the same name but with differentsuffixes) are described under one heading. For example, the heading“DIST_DISK_D, _M” covers two similar tables: DIST_DISK_D and DIST_DISK_M.Except for the DATE column, the contents of these tables are identical. Differencesthat exist in the contents of similar tables are explained in the column descriptions.
Tables in the Distributed componentThis section describes the Distributed component tables:v “DIST_CPU_H, _D, _M”v “DIST_DISK_D, _M” on page 49v “DIST_DISKIO_H, _D” on page 49v “DIST_PAGING_H, _D, _M” on page 50
DIST_CPU_H, _D, _MThese tables provide hourly, daily, and monthly statistics on utilization. Theycontain CPU and memory usage, paging rate and number of users and processesfrom distributed records with record type PERFVMA (see log recordDIST_PERF_VM_A).
The default retention periods are:7 days for DIST_CPU_H30 days for DIST_CPU_D765 days for DIST_CPU_M
Column name Data type Description
DATE K DATE Date when the records were written. For DIST_CPU_M, this isthe first day of the month. From DATE.
TIME K TIME Time (rounded down to the nearest hour) when the recordwas written. From TIME. This field is present only inDIST_CPU_H.
NODE_NAME K CHAR(64) Node name. From NODENAME.
CPU_USAGE_PCT_AVG FLOAT Average CPU usage, in percent. This is the average ofCPUAVG.
CPU_USAGE_PCT_MAX FLOAT Maximum CPU usage, in percent. This is the maximum ofCPUMAX.
CPU_USAGE_PCT_MIN FLOAT Minimum CPU usage, in percent. This is the minimum ofCPUMIN.
MEASURED_SEC INTEGER Total measured time, in seconds. This is the sum ofNUMSECS.
MEM_FREE_AVG FLOAT Average amount of free memory, in KB. This is the average ofFREEAVG.
MEM_FREE_MAX FLOAT Maximum amount of free memory, in KB. This is themaximum of FREEMAX.
MEM_FREE_MIN FLOAT Minimum amount of free memory, in KB. This is theminimum of FREEMIN.
PAGE_RATE_AVG FLOAT Average number of pages paged IN/OUT per second. This isthe average of PAGEAVG.
PAGE_RATE_MAX FLOAT Maximum number of pages paged IN/OUT per second. Thisis the maximum of PAGEMAX.
Table descriptions
48 Tivoli Decision Support for z/OS: Distributed Systems Performance Feature Guide and Reference

Column name Data type Description
PAGE_RATE_MIN FLOAT Minimum number of pages paged IN/OUT per second. Thisis the minimum of PAGEMIN.
PROCESSES_AVG FLOAT Average number of processes. This is the average of PROCS.
PROCESSES_MAX INTEGER Maximum number of processes. This is the maximum ofPROCS.
PROCESSES_MIN INTEGER Minimum number of processes. This is the minimum ofPROCS.
RECORDS_COLLECTED INTEGER Total number of records. This is the count of records.
USERS_AVG FLOAT Average number of users. This is the average of USERS.
USERS_MAX INTEGER Maximum number of users. This is the maximum of USERS.
USERS_MIN INTEGER Minimum number of users. This is the minimum of USERS.
DIST_DISK_D, _MThese tables provide daily and monthly statistics on disk usage. They contain diskperformance data from records with record type DISKFSA (see log recordDIST_DISK_FS_A).
The default retention periods are:30 days for DIST_DISK_D765 days for DIST_DISK_M
Column name Data type Description
DATE K DATE Date when the records were written. For DIST_DISK_M, this isthe first day of the month. From DATE.
NODE_NAME K CHAR(64) Node name. From NODENAME.
DEVICE K CHAR(64) Device name. From DEVNAME.
FILE_SYS K CHAR(64) File system name. From FSNAME.
RECORDS_COLLECTED INTEGER Number of samples. This is the count of records.
SPACE_FREE_MB FLOAT Free space, in MB, accumulated for all samples. This is thesum of FREE. This value should be divided byRECORDS_COLLECTED to get the average free space.
SPACE_SIZE_MB FLOAT Total size of space, in MB, accumulated for all samples. This isthe sum of SIZE. Divide this value by RECORDS_COLLECTEDto get the average value.
SPACE_USED_PCT FLOAT Used space, in percent, accumulated for all samples. Calculatedas the sum of 100*USED/SIZE. Divide this value byRECORDS_COLLECTED to get the average value.
DIST_DISKIO_H, _DThese tables provide hourly and daily statistics on disk I/O. They contain disk I/Operformance data from records with record type PERFIOA (see log recordDIST_PERF_IO_A).
The default retention periods are:7 days for DIST_DISKIO_H30 days for DIST_DISKIO_D
Tables in the Distributed component
Chapter 5. Data tables 49
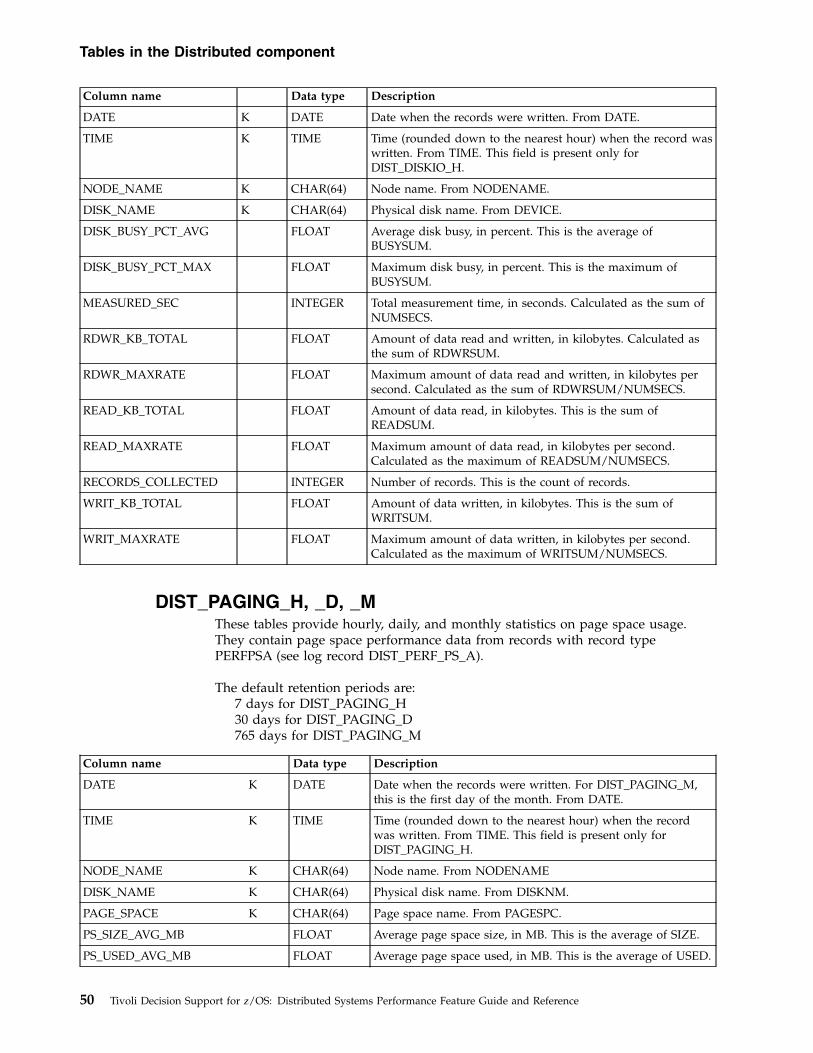
Column name Data type Description
DATE K DATE Date when the records were written. From DATE.
TIME K TIME Time (rounded down to the nearest hour) when the record waswritten. From TIME. This field is present only forDIST_DISKIO_H.
NODE_NAME K CHAR(64) Node name. From NODENAME.
DISK_NAME K CHAR(64) Physical disk name. From DEVICE.
DISK_BUSY_PCT_AVG FLOAT Average disk busy, in percent. This is the average ofBUSYSUM.
DISK_BUSY_PCT_MAX FLOAT Maximum disk busy, in percent. This is the maximum ofBUSYSUM.
MEASURED_SEC INTEGER Total measurement time, in seconds. Calculated as the sum ofNUMSECS.
RDWR_KB_TOTAL FLOAT Amount of data read and written, in kilobytes. Calculated asthe sum of RDWRSUM.
RDWR_MAXRATE FLOAT Maximum amount of data read and written, in kilobytes persecond. Calculated as the sum of RDWRSUM/NUMSECS.
READ_KB_TOTAL FLOAT Amount of data read, in kilobytes. This is the sum ofREADSUM.
READ_MAXRATE FLOAT Maximum amount of data read, in kilobytes per second.Calculated as the maximum of READSUM/NUMSECS.
RECORDS_COLLECTED INTEGER Number of records. This is the count of records.
WRIT_KB_TOTAL FLOAT Amount of data written, in kilobytes. This is the sum ofWRITSUM.
WRIT_MAXRATE FLOAT Maximum amount of data written, in kilobytes per second.Calculated as the maximum of WRITSUM/NUMSECS.
DIST_PAGING_H, _D, _MThese tables provide hourly, daily, and monthly statistics on page space usage.They contain page space performance data from records with record typePERFPSA (see log record DIST_PERF_PS_A).
The default retention periods are:7 days for DIST_PAGING_H30 days for DIST_PAGING_D765 days for DIST_PAGING_M
Column name Data type Description
DATE K DATE Date when the records were written. For DIST_PAGING_M,this is the first day of the month. From DATE.
TIME K TIME Time (rounded down to the nearest hour) when the recordwas written. From TIME. This field is present only forDIST_PAGING_H.
NODE_NAME K CHAR(64) Node name. From NODENAME
DISK_NAME K CHAR(64) Physical disk name. From DISKNM.
PAGE_SPACE K CHAR(64) Page space name. From PAGESPC.
PS_SIZE_AVG_MB FLOAT Average page space size, in MB. This is the average of SIZE.
PS_USED_AVG_MB FLOAT Average page space used, in MB. This is the average of USED.
Tables in the Distributed component
50 Tivoli Decision Support for z/OS: Distributed Systems Performance Feature Guide and Reference

Column name Data type Description
RECORDS_COLLECTED INTEGER Number of records. This is the count of records.
Tables in the Windows componentThis section describes the Windows component tables:v “WIN_PERF_DD_H, _D, _M”v “WIN_PERF_PU_H, _D, _M”
WIN_PERF_DD_H, _D, _MThese tables holds hourly, daily and monthly data for the disk device records.
The default retention periods are:10 days for WIN_PERF_DD_H30 days for WIN_PERF_DD_D765 days for WIN_PERF_DD_M
Column Key Datatype Description
DATE K DATE The date of the record. For the _M table, datesare stored as the first day of the month.
TIME K TIME The time of the record. Set to the start of thehour for table _H. This column does not exist inthe _D or _M tables.
NODE_NAME K CHAR(16) The node name of the machine.
DEVICE_NAME K CHAR(8) The device name for the device.
FREE_SPACE_AVG FLOAT Averages the free space on the device, based onSAMPLES.
FREE_SPACE_MAX FLOAT The maximum free space available.
FREE_SPACE_MIN FLOAT The minimum free space available.
PERCENT_FREE_AVG FLOAT Averages the free space percentage on thedevice, based on SAMPLES.
PERCENT_FREE_MAX FLOAT The maximum free space percentage.
PERCENT_FREE_MIN FLOAT The minimum free space percentage
SAMPLES INTEGER Count of the records consolidated into a tablerow. Used for working out averages.
TOTAL_DEVICE_SIZE FLOAT Device size at the end of the period.
WIN_PERF_PU_H, _D, _MThis table holds hourly, daily and monthly data for the performance usage records.
The default retention periods are:7 days for WIN_PERF_PU_H35 days for WIN_PERF_PU_D366 days for WIN_PERF_PU_M
Column Key Datatype Description
DATE K DATE The date of the record. For the _M table, datesare forced back to the first day of the month.
Tables in the Distributed component
Chapter 5. Data tables 51

Column Key Datatype Description
TIME K TIME The time of the record. Set to the start of thehour for table _H. This column does not exist inthe _D or _M tables.
NODE_NAME K CHAR(16) The node name of the machine.
CPU_COUNT SMALLINT Number of CPUs and/or cores.
CPU_USAGE_AVG FLOAT Averages the average CPU usage. This figure isaveraged based on SAMPLES.
CPU_USAGE_MAX FLOAT The maximum CPU usage.
CPU_USAGE_MIN FLOAT The minimum CPU usage.
MEMORY_FREE_AVG FLOAT Averages the average free memory. This figureis averaged based on SAMPLES.
MEMORY_FREE_MAX FLOAT The maximum free memory.
MEMORY_FREE_MIN FLOAT The minimum free memory.
MEMORY_SIZE FLOAT The total memory size at the end of the period.
SAMPLES INTEGER Count of the records consolidated into a tablerow. Used for working out actuals.
Tables in the Windows component
52 Tivoli Decision Support for z/OS: Distributed Systems Performance Feature Guide and Reference

Chapter 6. Reports
The reporting function produces reports based on the data in the Tivoli DecisionSupport for z/OS database. Reports can show data from tables or from views. Youcan request reports online or by submitting batch jobs. Typically, you use onlinereporting for reports that you use once, and batch reporting for regularly requiredreports.
This chaptertopic describes:v The format of the names used to define each report, and how source tables,
attributes and variables are used.v The reports in the Distributed componentv The reports in the Windows component
Report format and general descriptionTivoli Decision Support for z/OS presents reports in tables and graphs. All reportshave the same basic report layout. This section describes the elements that arecommon among Tivoli Decision Support for z/OS feature reports:v Report IDv Report groupv Sourcev Attributesv Variables
Report IDTivoli Decision Support for z/OS assigns each report a unique identifier. TheDistributed Systems Performance feature uses this format for report IDs:
component sequence
where:
componentIdentifies the component to which the report belongs. It can be one of thefollowing:DIST for the Distributed component.WIN for the Windows component.
sequenceA variable-length sequential number identifying the report.
Examples of report IDs are:DIST04WIN002
Report groupTivoli Decision Support for z/OS uses several predefined report groups. For theDistributed Systems Performance feature, each component has one group. Thereport groups are DISTRIBUTED and WINDOWS for the Distributed and Windowscomponents, respectively.
53

SourceEach report contains information from one or more source tables. The reportdescriptions in this chaptertopic list source tables. Refer to these source tables ifyou are interested in learning where certain data originates.
AttributesEach report has certain attributes associated with it. Use these attributes askeywords to search for specific reports in the dialogs.
You can specify any number of attributes for a report, but the area to which thereport belongs (for example, DISTRIBUTED) is always present for predefinedreports.
You can also specify these attributes, when appropriate:v Resource types, such as storage or processorv Performance issues, such as availability or responsev Presentation forms, such as detail, overview, or trendv Time resolutions, such as hourly, daily, or monthly
VariablesEach report has variables associated with it. You specify the values for thesevariables when you generate the report using the reporting dialog.
When you specify a date for a monthly report, specify the first day of the month.Otherwise, there is no match in the data table.
If a character variable happens to have only numeric characters, enclose it in singlequote marks, otherwise it will not match the data. For example, if you have asystem ID of 1234, specify it as '1234' on the Variables window.
Reports in the Distributed componentThis section describes the Distributed component reports:v “Distrib. CPU Util. for System, Hourly Trend.”v “Distrib. CPU Util. by System, Daily Overview” on page 55.v “Distrib. Statistics for System, Hourly Trend” on page 56.v “Distrib. Statistics by System, Daily Overview” on page 58.v “Distrib. File Systems, Daily Overview” on page 59.v “Distrib. Disk I/O for Disk, Hourly Trend” on page 60.v “Distrib. Disk I/O for System, Daily Overview” on page 61.v “Distrib. Page Space Util., Hourly Trend” on page 62.v “Distrib. CPU Util. Exceptions” on page 63.
Distrib. CPU Util. for System, Hourly TrendFor a specific node in the network and a specific date, this graphical representation(see Figure 14 on page 55) shows the hourly trend of processor utilization over theentire day. Such information is useful as an entry point when investigating systemperformance.
This information identifies the report:
Report format and general description
54 Tivoli Decision Support for z/OS: Distributed Systems Performance Feature Guide and Reference

Report IDDIST01
Report groupDistributed
SourceDIST_CPU_H (described on page “DIST_CPU_H, _D, _M” on page 48)
AttributesDistributed, Performance, CPU, Utilization, Usage, Hourly, Trend
VariablesDate, Node name
The report contains this information:
Hour The hour of the day.
CPU avgThe average processor time that has been utilized, in percent.
CPU maxThe maximum processor time that has been utilized, in percent.
Distrib. CPU Util. by System, Daily OverviewFor all nodes in the network, this graphical representation (see Figure 15 on page56) shows the average daily processor utilization. The report is produced by nodename. Such information is useful as an entry point when investigating systemperformance. An hourly graphical display of processor utilization for a specific node,is given in “Distrib. CPU Util. for System, Hourly Trend” on page 54.
Figure 14. Example of Distrib. CPU Util. for System, Hourly Trend
Distributed reports
Chapter 6. Reports 55

This information identifies the report:
Report IDDIST02
Report groupDistributed
SourceDIST_CPU_D (described on page “DIST_CPU_H, _D, _M” on page 48)
AttributesDistributed, Performance, CPU, Utilization, Usage, Daily, Overview
VariablesDate
The report contains this information:
Node nameThe name of the node in the network.
CPU avgThe average processor time that has been utilized, in percent.
Distrib. Statistics for System, Hourly TrendFor a specific node in the network, this report (see Figure 16 on page 57) provideshourly trend information about:v Processor utilization (average and maximum).v The amount of available memory (average and minimum).v The paging rate (average and maximum).v The number of processes (average and maximum).v The number of users (average and maximum).
Figure 15. Example of Distrib. CPU Util. by System, Daily Overview
Distributed reports
56 Tivoli Decision Support for z/OS: Distributed Systems Performance Feature Guide and Reference

A total row is given, which are the averages, minimums or maximums calculatedfor all hours.
This information identifies the report:
Report IDDIST03
Report groupDistributed
SourceDIST_CPU_H (described on page “DIST_CPU_H, _D, _M” on page 48)
AttributesDistributed, Performance, System, Usage, Hourly, Trend
VariablesDate, Node name
The report contains this information:
Hour The hour of the day.
CPU usage avg %The average processor utilization, in percent.
CPU usage max %The maximum processor utilization, in percent.
Mem free KB avgThe average number of free kilobytes of memory.
Mem free KB minThe minimum number of free kilobytes of memory.
Paging rate avgThe average paging rate, per second.
Paging rate maxThe maximum paging rate, per second.
Distrib. Statistics for System, Hourly TrendDate: 2012-05-16
Node name: xub11a
| CPU CPU Mem free Mem free Paging Paging| usage usage KB KB rate rate Procs Procs Users Users
Hour| avg % max % avg min avg max avg max avg max----| ----- ----- -------- -------- ------ ------ ----- ----- ----- -----
0| 3.1 5 399103 398708 0.00 0 161.2 192 2.3 41| 11.3 32 399103 398708 0.00 0 122.3 144 7.1 142| 8.5 17 399103 398708 0.00 0 157.5 166 1.4 23| 7.7 23 399103 398708 0.00 0 124.7 161 8.1 16.| . . . . . . . . . ..| . . . . . . . . . .
20| 19.9 30 399103 398708 0.00 0 156.1 151 2.5 521| 16.7 29 399103 398708 0.00 0 163.3 137 8.9 1722| 13.5 28 399103 398708 0.00 0 149.7 201 1.2 223| 10.3 27 399103 398708 0.00 0 180.9 201 8.6 15| ===== ===== ======== ======== ====== ====== ===== ===== ===== =====
Total| 11.9 47 399103 398708 0.00 0 161.0 161 4.2 9
Tivoli Decision Support: DIST03
Figure 16. Example of Distributed Statistics for System, Hourly Trend
Distributed reports
Chapter 6. Reports 57

Procs avgThe average number of processes.
Procs maxThe maximum number of processes.
Users avgThe average number of users for this node.
Users maxThe maximum number of users for this node.
Distrib. Statistics by System, Daily OverviewFor all nodes in the network, this report (see Figure 17) provides daily overviewinformation about:v Processor utilization (average and maximum).v The number of available pages of memory (average and minimum).v The paging rate (average and maximum).v The number of processes (average and maximum).v The number of users (average and maximum).
An hourly breakdown of the information provided in this report, and for a specificnode, is given in “Distrib. Statistics for System, Hourly Trend” on page 56.
This information identifies the report:
Report IDDIST04
Report groupDistributed
SourceDIST_CPU_D (described on page “DIST_CPU_H, _D, _M” on page 48)
AttributesDistributed, Performance, System, Usage, Daily, Overview
VariablesDate
The report contains this information:
Distrib. Statistics by System, Daily OverviewDate: 2012-05-16
| CPU CPU Mem free Mem free Paging Paging| usage usage KB KB rate rate Processes Processes Users Users
Node name | avg % max % avg min avg max avg max avg max----------| ----- ----- -------- -------- ------ ------ --------- --------- ----- -----xub11a | 6.2 41 399103 398708 0.00 0 141.9 172 17.4 38xub11b | 21.7 31 399103 398708 0.00 0 282.8 344 23.9 48xub11c | 9.3 12 399103 398708 0.00 0 223.7 316 16.5 36xub11d | 37.2 63 399103 398708 0.00 0 164.6 238 28.0 52xub11e | 3.1 15 399103 398708 0.00 0 105.5 200 19.6 36xub11f | 12.4 38 399103 398708 0.00 0 246.4 322 24.1 44
Tivoli Decision Support: DIST04
Figure 17. Example of Distrib. Statistics by System, Daily Overview
Distributed reports
58 Tivoli Decision Support for z/OS: Distributed Systems Performance Feature Guide and Reference

Node nameThe name of the node in the network.
CPU usage avg %The average processor utilization, in percent.
CPU usage max %The maximum processor utilization, in percent.
Mem free KB avgThe average number of free kilobytes of memory.
Mem free KB minThe minimum number of free kilobytes of memory.
Paging rate avgThe average paging rate, per second.
Paging rate maxThe maximum paging rate, per second.
Processes avgThe average number of processes.
Processes maxThe maximum number of processes.
Users avgThe average number of users for this node.
Users maxThe maximum number of users for this node.
Distrib. File Systems, Daily OverviewFor a specific node in the network, this report (see Figure 18 on page 60) providesdaily overview information about page space utilization: average allocated and freespace (in megabytes), and the average percentage used space (by device and filesystem).
This information identifies the report:
Report IDDIST05
Report groupDistributed
SourceDIST_DISK_D (described on page “DIST_DISK_D, _M” on page 49)
AttributesDistributed, Performance, File, Utilization, Usage, Daily, Overview
VariablesDate, Node name
Distributed reports
Chapter 6. Reports 59

The report contains this information:
DeviceThe device used by the node.
File systemThe file system corresponding to the given volume.
Space size avg (MB)The average size of the space, in megabytes.
Space free avg (MB)The average size of free space, in megabytes.
Space used avg (%)The average size of used space, in percent.
Distrib. Disk I/O for Disk, Hourly TrendFor a specific node in the network and (optionally) a specific disk, this report (seeFigure 19 on page 61) provides hourly trend information about the disk'sutilization: the average and maximum percentage busy times, the average andmaximum read amounts (in kilobytes per second), and the average and maximumwrite amounts (in kilobytes per second).
This information identifies the report:
Report IDDIST06
Report groupDistributed
SourceDIST_DISKIO_H (described on page “DIST_DISKIO_H, _D” on page 49)
AttributesDistributed, Performance, Disk, I/O, System, Hourly, Trend
VariablesDate, Node name, Disk
Distrib. File systems, Daily OverviewDate: 2012-05-16Node name: xub11a
| Space size Space free Space usedDevice File system | avg (MB) avg (MB) avg (%)--------- ----------- | ---------- ---------- ----------/dev/sda1 / | 10000000.0 2470000.0 75.3none /dev | 505348.0 504732.0 1.0none /dev/shm | 512388.0 512276.0 1.0none /var/lock | 512388.0 512388.0 0.0none /var/run | 512388.0 512284.0 1.0
Tivoli Decision Support: DIST05
Figure 18. Example of Distrib. File Systems, Daily Overview
Distributed reports
60 Tivoli Decision Support for z/OS: Distributed Systems Performance Feature Guide and Reference

The report contains this information:
Hour The hour of the day.
Busy avg (%)The average time in which the processor was busy, in percent.
Busy max (%)The maximum time in which the processor was busy, in percent.
Read avg (KB/sec)The average amount of disk space read per second, in kilobytes.
Read max (KB/sec)The maximum amount of disk space read per second, in kilobytes.
Write avg (KB/sec)The average amount of disk space written per second, in kilobytes.
Write max (KB/sec)The maximum amount of disk space written per second, in kilobytes.
RW avg (KB/sec)The average amount of disk space read and written per second, inkilobytes.
RW max (KB/sec)The maximum amount of disk space read and written per second, inkilobytes.
Distrib. Disk I/O for System, Daily OverviewFor a specific node in the network, this report (see Figure 20 on page 62) providesdaily overview information about the utilization of disks at the node: the averageand maximum percentage busy times, the average and maximum read amounts (inkilobytes per second), and the average and maximum write amounts (in kilobytesper second). If you require more detailed hourly trend information about a disk'sutilization, you can proceed to the report “Distrib. Disk I/O for Disk, HourlyTrend” on page 60.
This information identifies the report:
Report IDDIST07
Report groupDistributed
Distrib. Disk I/O for Disk, Hourly TrendDate: 2012-05-16Node name: xub11a
Disk: All
| Busy avg Busy max Read avg Read max Write avg Write max RW avg RW maxHour| (%) (%) (KB/sec) (KB/sec) (KB/sec) (KB/sec) (KB/sec) (KB/sec)----| -------- -------- -------- -------- --------- --------- -------- --------
0| 1.1 7.3 94.2 114.9 39.6 56.7 95.2 123.91| 3.4 3.7 88.7 113.7 48.3 55.7 91.6 162.42| 2.7 8.4 9.1 111.5 20.9 63.7 104.8 155.2:| : : : : : : : :22| 1.3 15.1 93.8 112.3 19.7 57.7 97.4 143.123| 0.5 3.5 67.2 114.1 46.2 44.7 92.2 139.5
| ======== ======== ======== ======== ========= ========= ======== ========Avg/max| 1.6 23.8 42.4 156.8 33.1 71.7 93.1 183.3
Tivoli Decision Support: DIST06
Figure 19. Example of Distrib. Disk I/O for Disk, Hourly Trend
Distributed reports
Chapter 6. Reports 61

SourceDIST_DISKIO_D (described on page “DIST_DISKIO_H, _D” on page 49)
AttributesDistributed, Performance, Disk, I/O, System, Daily, Overview
VariablesDate, Node name
The report contains this information:
Disk nameThe name of the physical disk.
Busy avg (%)The average time in which the disk was busy, in percent.
Busy max (%)The maximum time in which the disk was busy, in percent.
Read avg (KB/sec)The average amount of disk that was read per second, in kilobytes.
Read max (KB/sec)The maximum amount of disk that was read per second, in kilobytes.
Write avg (KB/sec)The average amount of disk that was written per second, in kilobytes.
Write max (KB/sec)The maximum amount of disk that was written per second, in kilobytes.
RW avg (KB/sec)The average amount of disk that was read and written per second, inkilobytes.
RW max (KB/sec)The maximum amount of disk that was read and written per second, inkilobytes.
Distrib. Page Space Util., Hourly TrendFor a specific node in the network, this report (see Figure 21 on page 63) providesdaily overview information about the utilization of page space at the node. Foreach page space, information about the disk name for the page space, page spacesize, and the amount of page space used (in megabytes and also as a percentage),is given.
This information identifies the report:
Distrib. Disk I/O for System, Daily OverviewDate: 2012-05-16Node name: xub11a
| Busy avg Busy max Read avg Read max Write avg Write max RW avg RW maxDisk name | (%) (%) (KB/sec) (KB/sec) (KB/sec) (KB/sec) (KB/sec) (KB/sec)--------- | -------- -------- -------- -------- --------- --------- -------- --------sda | 1.1 2.6 1.4 4.3 6.9 9.7 4.2 14.0sdb | 3.7 9.3 1.8 3.9 8.9 9.5 5.4 13.8
| ======== ======== ======== ======== ========= ========= ======== ========Avg/max | 2.4 9.3 1.6 4.3 7.9 9.7 4.8 14.0
Tivoli Decision Support: DIST07
Figure 20. Example of Distrib. Disk I/O for System, Daily Overview
Distributed reports
62 Tivoli Decision Support for z/OS: Distributed Systems Performance Feature Guide and Reference
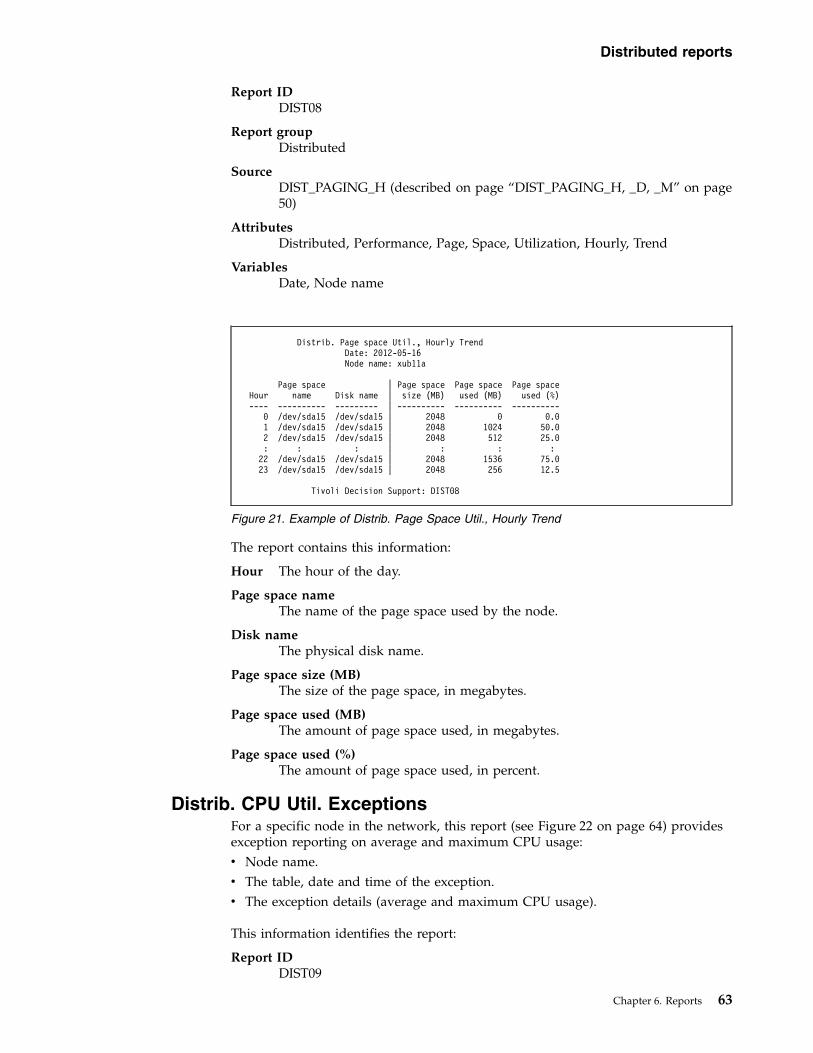
Report IDDIST08
Report groupDistributed
SourceDIST_PAGING_H (described on page “DIST_PAGING_H, _D, _M” on page50)
AttributesDistributed, Performance, Page, Space, Utilization, Hourly, Trend
VariablesDate, Node name
The report contains this information:
Hour The hour of the day.
Page space nameThe name of the page space used by the node.
Disk nameThe physical disk name.
Page space size (MB)The size of the page space, in megabytes.
Page space used (MB)The amount of page space used, in megabytes.
Page space used (%)The amount of page space used, in percent.
Distrib. CPU Util. ExceptionsFor a specific node in the network, this report (see Figure 22 on page 64) providesexception reporting on average and maximum CPU usage:v Node name.v The table, date and time of the exception.v The exception details (average and maximum CPU usage).
This information identifies the report:
Report IDDIST09
Distrib. Page space Util., Hourly TrendDate: 2012-05-16Node name: xub11a
Page space | Page space Page space Page spaceHour name Disk name | size (MB) used (MB) used (%)---- ---------- --------- | ---------- ---------- ----------
0 /dev/sda15 /dev/sda15 | 2048 0 0.01 /dev/sda15 /dev/sda15 | 2048 1024 50.02 /dev/sda15 /dev/sda15 | 2048 512 25.0: : : | : : :22 /dev/sda15 /dev/sda15 | 2048 1536 75.023 /dev/sda15 /dev/sda15 | 2048 256 12.5
Tivoli Decision Support: DIST08
Figure 21. Example of Distrib. Page Space Util., Hourly Trend
Distributed reports
Chapter 6. Reports 63

Report groupDistributed
SourceDIST_CPU_H,_D,_M (described on page “DIST_CPU_H, _D, _M” on page48)
AttributesDistributed, Performance, CPU, Utilization, Usage, Exception
VariablesStart date, Average CPU reporting threshold, Maximum CPU reportingthreshold
The report contains this information:
Node nameThe node at which the exception occurred.
Type The source table in which the exception was found.
Date The date of the exception.
Hour The hour of the exception.
Average CPUThe average processor utilization, in percent. Either this column, or thenext, or both, will excceed the relevant threshold.
Maximum CPUThe maximum processor utilization, in percent. Either this column, or theprevious, or both, will excceed the relevant threshold.
Reports in the Windows componentThis section describes the Windows component reports:v “Windows Disk Usage for System, Hourly Trend” on page 65.v “Windows Disk Usage for Device, Daily Overview” on page 65.v “Windows CPU Utilization by System, Hourly Trend” on page 66.v “Windows CPU Utilization by System, Daily Overview” on page 67.
Distrib. CPU Util. Exceptions
Start date : 2012-05-01Average threshold: 999Maximum threshold: 40
Node name Type Date Hour Average CPU Maximum CPU--------- ------- ---------- ---- ----------- -----------xub11a HOURLY 2012-05-16 6 6.0 41
7 6.0 7111 4.0 48
2012-05-17 6 6.3 4111 14.0 55
xub11b HOURLY 2012-05-16 7 12.1 4811 11.6 49
2012-05-17 11 4.0 5212 4.0 51
Tivoli Decision Support: DIST09
Figure 22. Example of Distributed CPU Utilization Exceptions
Distributed reports
64 Tivoli Decision Support for z/OS: Distributed Systems Performance Feature Guide and Reference

v “Windows Memory Usage by System, Hourly Trend” on page 68.v “Windows Memory Usage by System, Daily Overview” on page 69.v “Windows System Overview Report” on page 70.
Windows Disk Usage for System, Hourly TrendThis report shows the hourly trend of disk usage on a selected days for selectednodes. It allows you to identify potential periods during the day when unusuallyhigh disk usage is taking place.
This information identifies the report:
Report IDWIN001
Report groupWINDOWS
SourceWIN_PERF_DD_H
AttributesWINDOWS, DISK, DEVICE, TREND, FREE, SPACE
VariablesFROM_DATE, TO_DATE, NODE_NAME
Windows Disk Usage for Device, Daily OverviewThis report shows the daily overview of disk usage for the selected nodes anddevices, if any. It allows you to identify potential adverse changes in disk usage.
Windows Disk Usage for System, Hourly TrendDate: ’2009-06-12’ to ’2009-06-12’
FREE FREE FREESPACE SPACE SPACE PERCENT PERCENT PERCENT
NODE DEVICE MIN AVG MAX FREE FREE FREENAME DATE NAME TIME (MB) (MB) (MB) MIN AVG MAX---------------- ---------- -------- -------- ---------- ---------- ---------- ------- ------- -------IBM-PAXPRIM 2009-06-12 C: 00.00.00 61691 61691 61691 67 67 67
C: 01.00.00 61684 61688 61691 67 67 67C: 02.00.00 61684 61684 61684 67 67 67C: 03.00.00 61684 61684 61684 67 67 67C: 04.00.00 61684 61684 61684 67 67 67C: 05.00.00 61684 61702 61720 67 67 67C: 06.00.00 61720 61720 61720 67 67 67C: 07.00.00 61720 61720 61720 67 67 67C: 08.00.00 61720 61720 61720 67 67 67C: 09.00.00 61720 61720 61720 67 67 67C: 10.00.00 61594 61595 61595 67 67 67C: 11.00.00 61587 61588 61588 67 67 67C: 12.00.00 61586 61587 61587 67 67 67C: 13.00.00 61584 61586 61587 67 67 67C: 14.00.00 61565 61585 61604 67 67 67C: 15.00.00 61634 61635 61635 67 67 67C: 16.00.00 61631 61633 61634 67 67 67C: 17.00.00 61629 61633 61636 67 67 67C: 18.00.00 61635 61635 61635 67 67 67C: 19.00.00 61633 61634 61634 67 67 67C: 20.00.00 61632 61632 61632 67 67 67C: 21.00.00 61631 61632 61632 67 67 67C: 22.00.00 61630 61631 61631 67 67 67C: 23.00.00 61629 61630 61630 67 67 67
Tivoli Decision Support: WIN001
Figure 23. Example of Windows Disk Usage for System, Hourly Trend
Windows component reports
Chapter 6. Reports 65

This information identifies the report:
Report IDWIN002
Report groupWINDOWS
SourceWIN_PERF_DD_D
AttributesWINDOWS, DISK, DEVICE, OVERVIEW, FREE, SPACE
VariablesNODE_NAME, DEVICE_NAME
Windows CPU Utilization by System, Hourly TrendThis report shows the hourly trend of CPU usage for the selected dates and nodes.It allows you to identify potential problems with processor usage.
This information identifies the report:
Report IDWIN003
Report groupWINDOWS
SourceWIN_PERF_PU_H
AttributesWINDOWS, CPU, UTILIZATION, TREND, FREE
VariablesFROM_DATE, TO_DATE, NODE_NAME
Windows Disk Usage for Device, Daily Overview
FREE FREE FREESPACE SPACE SPACE PERCENT PERCENT PERCENT
NODE DEVICE MIN AVG MAX FREE FREE FREEDATE NAME NAME (MB) (MB) (MB) MIN AVG MAX---------- ---------------- -------- ---------- ---------- ---------- ------- ------- -------2009-06-12 IBM-PAXPRIM C: 61565 61652 61720 67 67 67
Tivoli Decision Support: WIN002
Figure 24. Example of Windows Disk Usage for Device, Daily Overview
Windows component reports
66 Tivoli Decision Support for z/OS: Distributed Systems Performance Feature Guide and Reference

Windows CPU Utilization by System, Daily OverviewThis report shows the daily overview of CPU usage for the selected dates andnodes. It allows you to identify potential problems with processor usage over thelonger term.
This information identifies the report:
Report IDWIN004
Report groupWINDOWS
SourceWIN_PERF_PU_D
AttributesWINDOWS, CPU, UTILIZATION, OVERVIEW, FREE
VariablesNODE_NAME
Windows CPU Utilization by System, Hourly TrendDate: ’2009-04-15’ to ’2009-06-12’
CPU CPU CPUUSAGE USAGE USAGE
NODE MIN AVG MAXNAME DATE TIME PERCENT PERCENT PERCENT---------------- ---------- -------- ------- ------- -------IBM-PAXPRIM 2009-06-12 00.00.00 4 4 7
01.00.00 4 5 502.00.00 5 5 503.00.00 5 5 504.00.00 4 5 505.00.00 4 4 506.00.00 4 4 407.00.00 4 4 408.00.00 4 4 409.00.00 4 4 510.00.00 4 5 511.00.00 5 5 512.00.00 5 5 513.00.00 5 5 514.00.00 5 5 515.00.00 5 5 516.00.00 5 5 517.00.00 5 5 618.00.00 6 6 619.00.00 6 7 720.00.00 7 7 821.00.00 8 8 822.00.00 8 9 923.00.00 9 9 9
Tivoli Decision Support: WIN003
Figure 25. Example of Windows CPU Utilization by System, Hourly Trend
Windows component reports
Chapter 6. Reports 67

Windows Memory Usage by System, Hourly TrendThis report shows the hourly trend of memory usage for the selected dates andnodes. It allows you to identify potential problems with memory usage during theday.
This information identifies the report:
Report IDWIN005
Report groupWINDOWS
SourceWIN_PERF_PU_H
AttributesWINDOWS, MEMORY, USAGE, TREND, FREE
VariablesFROM_DATE, TO_DATE, NODE_NAME
Windows CPU Utilization by System, Daily Overview
CPU CPU CPUUSAGE USAGE USAGE
NODE MIN AVG MAXNAME DATE PERCENT PERCENT PERCENT---------------- ---------- ------- ------- -------IBM-PAXPRIM 2009-06-12 4 5 9IBM-PAXPRIM 2009-06-13 2 15 74IBM-PAXPRIM 2009-06-14 1 16 79
Tivoli Decision Support: WIN004
Figure 26. Example of Windows CPU Utilization by System, Daily Overview
Windows component reports
68 Tivoli Decision Support for z/OS: Distributed Systems Performance Feature Guide and Reference

Windows Memory Usage by System, Daily OverviewThis report shows the daily overview of memory usage for the selected nodes. Itallows you to identify potential problems with memory usage over the medium tolong term.
This information identifies the report:
Report IDWIN006
Report groupWINDOWS
SourceWIN_PERF_PU_D
AttributesWINDOWS, MEMORY, USAGE, TREND, FREE
VariablesNODE_NAME
Windows Memory Usage by System, Hourly TrendDate: ’2009-06-12’ to ’2009-06-12’
MEMORY MEMORY MEMORYFREE FREE FREE
NODE MIN AVG MAXNAME DATE TIME (KB) (KB) (KB)---------------- ---------- -------- ---------- ---------- ----------IBM-PAXPRIM 2009-06-12 00.00.00 1399924 1407371 1408564
01.00.00 1364320 1380610 140753202.00.00 1367096 1367813 136868403.00.00 1366520 1367241 136798804.00.00 1366172 1366796 136752005.00.00 1346256 1380571 138938806.00.00 1387428 1388094 138887607.00.00 1376300 1387421 138815608.00.00 1386156 1386948 138766409.00.00 1015916 1353313 139914810.00.00 1045336 1155013 121418811.00.00 1015476 1056817 112024412.00.00 1100632 1152908 121314013.00.00 1062504 1138608 120042014.00.00 920532 984165 109666815.00.00 893760 988563 104789616.00.00 924324 983061 105048417.00.00 937800 958081 96330018.00.00 927856 941137 94411619.00.00 938352 940428 94195620.00.00 934356 939315 94093621.00.00 919056 937112 93958422.00.00 928324 933017 93526823.00.00 925836 932618 933872
Tivoli Decision Support: WIN005
Figure 27. Example of Windows Memory Usage by System, Hourly Trend
Windows component reports
Chapter 6. Reports 69

Windows System Overview ReportThis report shows the system overview for a given data range and node list. It isintended to provide a high-level health check for all listed Windows nodes.
This information identifies the report:
Report IDWIN007
Report groupWINDOWS
SourceWIN_PERF_PU_H, WIN_PERF_DD_H
AttributesWINDOWS, SYSTEM, MEMORY, DISK, USAGE, TREND, OVERVIEW
VariablesFROM_DATE, TO_DATE, NODE_NAME
Windows Memory Usage by System, Daily Overview
MEMORY MEMORY MEMORYFREE FREE FREE
NODE MIN AVG MAXNAME DATE (KB) (KB) (KB)---------------- ---------- ---------- ---------- ----------IBM-PAXPRIM 2009-06-12 893760 1159459 1408564
Tivoli Decision Support: WIN006
Figure 28. Example of Windows Memory Usage by System, Daily Overview
Windows component reports
70 Tivoli Decision Support for z/OS: Distributed Systems Performance Feature Guide and Reference

Windows System Overview ReportDate: ’2009-04-15’ to ’2009-04-15’
CPU CPU CPU MEMORY MEMORY MEMORY FREE FREE FREE FREE FREE FREEUSAGE USAGE USAGE FREE FREE FREE SPACE SPACE SPACE SPACE SPACE SPACE
NODE MIN AVG MAX MIN AVG MAX MIN AVG MAX MIN AVG MAXNAME DATE TIME % % % (KB) (KB) (KB) % % % (MB) (MB) (MB)----------- ---------- -------- ----- ----- ----- ------ ------ ------ ----- ----- ----- ----- ----- -----IBM-PAXW2K3 2009-04-15 01.00.00 0 0 0 761436 767177 769700 6 6 6 71059 71059 71059
02.00.00 0 0 0 762992 767326 768264 6 6 6 71059 71059 7105903.00.00 0 0 0 762488 767168 769344 6 6 6 71059 71059 7105904.00.00 0 0 0 763248 767604 769248 6 6 6 71059 71059 7105905.00.00 0 0 0 762536 767026 767936 6 6 6 71059 71059 7105906.00.00 0 0 0 750628 765030 768428 6 6 6 71059 71059 7105907.00.00 0 0 0 761988 766864 768684 6 6 6 71059 71059 7105908.00.00 0 0 0 761828 766428 767796 6 6 6 71059 71059 7105909.00.00 0 0 0 762660 766984 768732 6 6 6 71059 71059 7105910.00.00 0 0 0 761768 766314 767748 6 6 6 71059 71059 7105911.00.00 0 0 0 761848 767150 769156 6 6 6 71059 71059 7105912.00.00 0 0 0 763076 767396 769036 6 6 6 71059 71059 7105913.00.00 0 0 0 761764 766653 768648 6 6 6 71059 71059 7105914.00.00 0 0 0 762248 766901 768456 6 6 6 71059 71059 7105915.00.00 0 0 0 761992 766368 767444 6 6 6 71059 71059 7105916.00.00 0 0 0 759528 765585 767356 6 6 6 71059 71059 7105917.00.00 0 0 0 761256 765821 767588 6 6 6 71059 71059 7105918.00.00 0 0 0 760948 765652 767776 6 6 6 71059 71059 7105919.00.00 0 0 0 761504 765825 767204 6 6 6 71059 71059 7105920.00.00 0 0 0 760660 765440 767024 6 6 6 71059 71059 7105921.00.00 0 0 0 760556 765945 767820 6 6 6 71059 71059 7105922.00.00 0 0 0 761356 765693 767436 6 6 6 71059 71059 7105923.00.00 0 0 0 760828 766078 768404 6 6 6 71059 71059 71059
Tivoli Decision Support: WIN007
Figure 29. Example of Windows System Overview Report
Chapter 6. Reports 71

72 Tivoli Decision Support for z/OS: Distributed Systems Performance Feature Guide and Reference

Chapter 7. Log record definitions
This chapter describes the following record definitions:v “DIST_PERF_VM_A”v “DIST_DISK_FS_A” on page 74v “DIST_PERF_IO_A” on page 74v “DIST_PERF_PS_A” on page 75v “WIN_PERF_DD” on page 76v “WIN_PERF_PU” on page 76
Note that all log record definitions following have a two-byte length and two-bytefiller at the start. This is a result of transmitting the file into a variable length dataset on z/OS. The actual files generated on the distributed platforms start at thethird field in each record definition.
DIST_PERF_VM_AThis performance record definition is used for selecting records with record typePERFVMA.
Main section
Field name Offset Length Format Description
RECLEN 0 2 BINARY Record length
* 2 2 BINARY Unused
RECTYPE 4 7 CHAR Record type (literallyPERFVMA)
NODENAME 11 16 CHAR Node name
DATE 27 8 CHAR (YYYYMMDD) Date
TIME 35 6 TIME (HHMMSS) Time
NUMSECS 41 4 EXTERNAL INTEGER Measured time
FREEMIN 45 9 EXTERNAL INTEGER Free memory in KB,minimum
FREEAVG 54 11 EXTERNAL FLOAT Free memory in KB,average
FREEMAX 65 9 EXTERNAL INTEGER Free memory in KB,maximum
PAGEMIN 74 9 EXTERNAL INTEGER Paging rate, minimum
PAGEAVG 83 11 EXTERNAL FLOAT Paging rate, average
PAGEMAX 94 9 EXTERNAL INTEGER Paging rate, maximum
CPUMIN 103 9 EXTERNAL INTEGER CPU usage, minimum
CPUAVG 112 11 EXTERNAL FLOAT CPU usage, average
CPUMAX 123 9 EXTERNAL INTEGER CPU usage, maximum
USERS 132 9 EXTERNAL INTEGER Number of users
PROCS 141 9 EXTERNAL INTEGER Number of processes
73

DIST_DISK_FS_AThis disk space performance record definition is used for selecting records withrecord type DISKFSA.
Main section
Field name Offset Length Format Description
RECLEN 0 2 BINARY Record length
* 2 2 BINARY Unused
RECTYPE 4 7 CHAR Record type (literallyDISKFSA)
NODENAME 11 16 CHAR Node name
DATE 27 8 CHAR (YYYYMMDD) Date
TIME 35 6 TIME (HHMMSS) Time
SIZE 41 9 EXTERNAL INTEGER Total space, in MB
FREE 50 9 EXTERNAL INTEGER Free space, in MB
PCTUSED 59 3 EXTERNAL INTEGER Used space, in percent
Record section DEVICEOffset 62Length
Length of DEVLEN + 4
Field name Offset Length Format Description
DEVLEN 0 4 EXTERNAL INTEGER Length of fieldDEVNAME
DEVNAME 4 * CHAR(*) Device name
Record section SPACEOffset 66 + length of section DEVICELength
Length of FSLEN + 4
Field name Offset Length Format Description
FSLEN 0 4 EXTERNAL INTEGER Length of sectionSPACE_NAME
FSNAME 4 * CHAR(*) Space name
DIST_PERF_IO_AThis disk I/O performance record definition is used for selecting records withrecord type PERFIOA.
Main section
Field name Offset Length Format Description
RECLEN 0 2 BINARY Record length
DIST_DISK_FS_A
74 Tivoli Decision Support for z/OS: Distributed Systems Performance Feature Guide and Reference

Field name Offset Length Format Description
* 2 2 BINARY Unused
RECTYPE 4 7 CHAR Record type (literallyPERFIOA)
NODENAME 11 16 CHAR Node name
DATE 27 8 CHAR (YYYYMMDD) Date
TIME 35 6 TIME (HHMMSS) Time
NUMSECS 41 4 EXTERNAL INTEGER Measurement interval
READMIN 45 9 EXTERNAL INTEGER KB read, minimum
READAVG 54 11 EXTERNAL FLOAT KB read, average
READMAX 65 9 EXTERNAL INTEGER KB read, maximum
READSUM 74 9 EXTERNAL INTEGER KB read, total
WRITMIN 83 9 EXTERNAL INTEGER KB written, minimum
WRITAVG 92 11 EXTERNAL FLOAT KB written, average
WRITMAX 103 9 EXTERNAL INTEGER KB written, maximum
WRITSUM 112 9 EXTERNAL INTEGER KB written, total
RDWRMIN 121 9 EXTERNAL INTEGER KB read and written,minimum
RDWRAVG 130 11 EXTERNAL FLOAT KB read and written,average
RDWRMAX 141 9 EXTERNAL INTEGER KB read and written,maximum
RDWRSUM 150 9 EXTERNAL INTEGER KB read and written,total
BUSYSUM 159 5 EXTERNAL FLOAT Busy %
DEVICE 164 * CHAR(*) Physical disk name
DIST_PERF_PS_AThis paging space performance record definition is used for selecting records withrecord type PERFPSA.
Main section
Field name Offset Length Format Description
RECLEN 0 2 BINARY Record length
* 2 2 BINARY Unused
RECTYPE 4 7 CHAR Record type (literallyPERFPSA)
NODENAME 11 16 CHAR Node name
DATE 27 8 CHAR (YYYYMMDD) Date
TIME 35 6 TIME (HHMMSS) Time
PAGESPC 41 20 CHAR Page space name
DISKNM 61 20 CHAR Physical disk name
SIZE 81 5 EXTERNAL INTEGER Page space size, MB
DIST_PERF_IO_A
Chapter 7. Log record definitions 75

Field name Offset Length Format Description
USED 86 5 EXTERNAL INTEGER Page space used, MB
WIN_PERF_DDThis record gives the device information for each non-removable device on themachine. The information is gathered with the following WMI command:
select Name, Size, FreeSpacefrom Win32_LogicalDiskwhere DriveType = 3
This is both gathered and reported based on the configuration itemxa_XPerfDiskFsRun. Note that there is a single space following each field.
Main section
Column Position Size Description
Type 0 2 DD to indicate this is a disk device record.
Date 3 8 YYYYMMDD of the record.
Time 12 6 HHMMSS of the record.
Node name 19 16 Node name of the machine.
Device name 36 8 Device name.
Total size 45 9 Zero-padded device size in megabytes.
Free space 55 9 Zero-padded device free space in megabytes.
Free % 65 3 Zero-padded percentage free.
WIN_PERF_PUThis record gives the minimum, maximum and average figures for CPU percentageuse and memory usage. The information is gathered with the following WMIcommands:
select PercentProcessorTime, TimeStamp_100NSfrom Win32_PerfRawData_PerfOS_Processorwhere Name = ’_Total’
select TotalPhysicalMemoryfrom Win32_LogicalMemoryConfiguration
select AvailableKBytesfrom Win32_PerfFormattedData_PerfOS_Memory
This is gathered continuously and reported (aggregated) based on theconfiguration item xb_XPerfCpuRun. Note that there is a single space followingeach field.
Main section
Column Posit ion Size Description
Type 0 2 PU to indicate this is a performance usage record.
Date 3 8 YYYYMMDD of the record.
Time 12 6 HHMMSS of the record.
Node name 19 16 Node name of the machine.
DIST_PERF_PS_A
76 Tivoli Decision Support for z/OS: Distributed Systems Performance Feature Guide and Reference
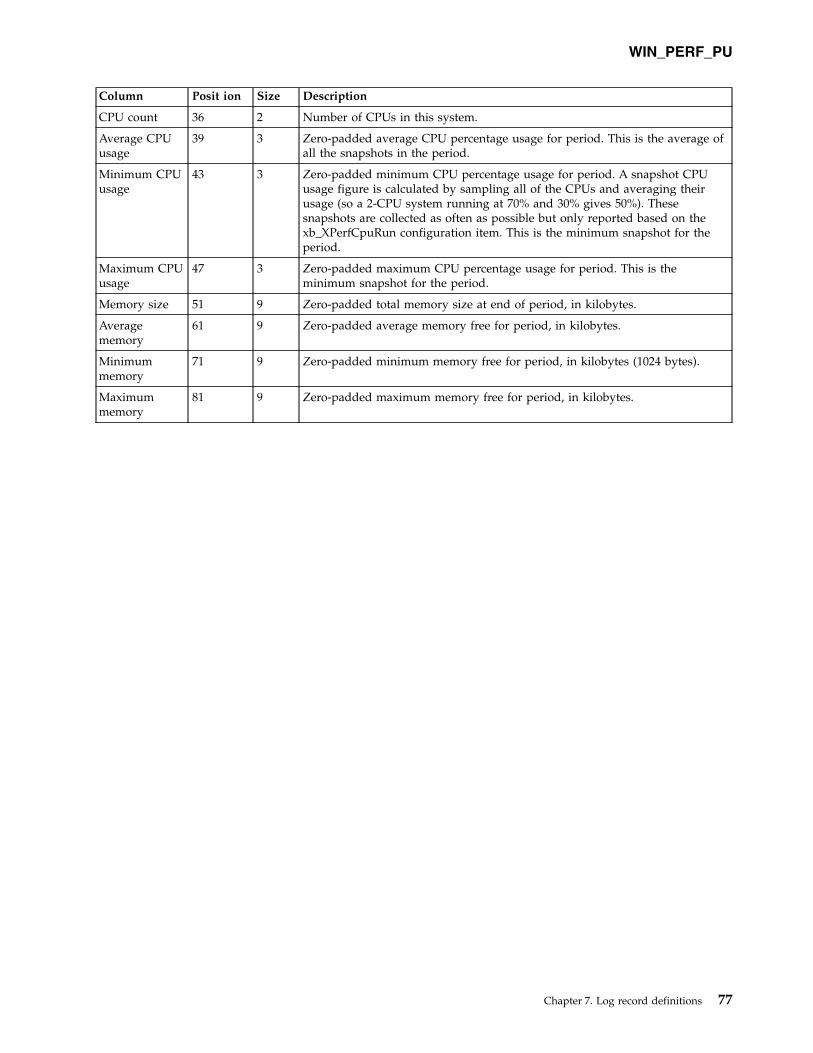
Column Posit ion Size Description
CPU count 36 2 Number of CPUs in this system.
Average CPUusage
39 3 Zero-padded average CPU percentage usage for period. This is the average ofall the snapshots in the period.
Minimum CPUusage
43 3 Zero-padded minimum CPU percentage usage for period. A snapshot CPUusage figure is calculated by sampling all of the CPUs and averaging theirusage (so a 2-CPU system running at 70% and 30% gives 50%). Thesesnapshots are collected as often as possible but only reported based on thexb_XPerfCpuRun configuration item. This is the minimum snapshot for theperiod.
Maximum CPUusage
47 3 Zero-padded maximum CPU percentage usage for period. This is theminimum snapshot for the period.
Memory size 51 9 Zero-padded total memory size at end of period, in kilobytes.
Averagememory
61 9 Zero-padded average memory free for period, in kilobytes.
Minimummemory
71 9 Zero-padded minimum memory free for period, in kilobytes (1024 bytes).
Maximummemory
81 9 Zero-padded maximum memory free for period, in kilobytes.
WIN_PERF_PU
Chapter 7. Log record definitions 77

WIN_PERF_PU
78 Tivoli Decision Support for z/OS: Distributed Systems Performance Feature Guide and Reference
Part 3. Distributed Systems Performance Feature Guide(heritage)
79

80 Tivoli Decision Support for z/OS: Distributed Systems Performance Feature Guide and Reference

Chapter 8. Introducing the Distributed Systems Performancefeature
IBM Tivoli Decision Support for z/OS (hereafter referred to as Tivoli DecisionSupport for z/OS) is a reporting system that collects performance data logged bycomputer systems, summarizes the data, and presents it in a variety of forms foruse in systems management. Tivoli Decision Support for z/OS consists of a baseproduct and several optional features.
The Distributed Systems Performance feature is a solution for environments wherez/OS is used, and whereAIXAIX , HP-UX, Sun Solaris, Linux, and Windowsoperating systems are installed on nodes within your network. The performanceinformation from the various nodes is transferred to a central z/OS site, wherereporting and analysis are performed.
This topic describes how information is gathered and collected using theDistributed Systems Performance feature.
Gathering and collecting performance dataAt the nodes where Distributed Systems Performance feature agents have beeninstalled and from which data is to be used, the basic information used by theDistributed Systems Performance feature is gathered by the agents into log filescontaining accounting, configuration, error, and performance data. The source dataused by the Distributed Systems Performance feature to create the log files and adescription of the log files, is given here:
Source dataDescription of created log files
UNIX accountingLog files containing accounting data. To create these log files, you mustactivate accounting in each node that is to be included in the performanceanalysis. However, activating accounting can place up to 20 percent loadon the system.
UNIX configurationA log file containing configuration data (for hardware and software).
UNIX errorA log file containing error data. Error logging is normally available in allnodes where the Distributed Systems Performance feature is installed and,therefore, no action by you should be required to create these log files.
UNIX performance and diskLog files containing processor use, I/O rate, and paging space data. Theseare continuously updated by a program supplied with the DistributedSystems Performance feature.
Windows performance and diskLog files containing processor and disk use. These are continuouslyupdated by a program supplied with the Distributed Systems Performancefeature.
81

The information contained in the log files must be transmitted to z/OS for use asdata sets in the Tivoli Decision Support for z/OS COLLECT procedure. The mostconvenient way is to use a product such as TCP/IP. The ftp function of TCP/IPcan be used to automate logon and file transfer.
After the transmission of log files is completed, the information contained in logdata sets at the z/OS host is collected into Tivoli Decision Support for z/OS tables.
The collected data is combined with more data (called environment data) and isfinally presented in reports.
The process of entering and maintaining environment data is called administration.Tivoli Decision Support for z/OS provides an administration dialog formaintaining resource information. Refer to the Administration Guide and Reference,SH19-6816 for information on how to use the administration dialog.
Figure 30 illustrates how data is organized for presentation in Tivoli DecisionSupport for z/OS reports.
Report groupsThe reports produced by the Distributed Systems Performance feature are groupedin the following report groups:
XACCTUNIX accounting reports
┌─────────────────────────────────────────────┐│ UNIX Nodes ││ ┌───┐ ┌───┐ ┌───┐ ┌───┐ ││ │ ├───┤ ├───┤ ├───┤ │ │ System data│ └─┬─┘ └─┬─┘ └─┬─┘ └─┬─┘ │ ││ │ │ │ │ │ ││ │ ┌───┐ │ ┌───┐ │ ┌───┐ │ │ ││ └─┤ ├─┴─┤ ├─┴─┤ ├─┘ │ ││ └───┘ └───┘ └───┘ │ ││ │ │└────────────────────┬────────────────────────┘ │
↓ ↓┌────────┴────────┐ Gather data│ UNIX log files │ to log files└────────┬────────┘ │
↓ │┌────────────────────┼────────────────────────┐ ↓│Tivoli ┌────────┴────────┐ │ Send log files to│Decision │ Tivoli Decision │ │ z/OS, then collect│Support │ Support for │ │ required data│for z/OS │ z/OS records │ │ ││System └────────┬────────┘ │ ││Perforance ↓ │ ││Feature ┌────────┴────────┐ ┌──────────┐ │ ↓│ │ Tivoli Decision │ │ User │ │ Environment data│ │ Support for ├←─┤ supplied │ │ summarized in the│ │ z/OS tables │ │ data │ │ Tivoli Decision│ └────────┬────────┘ └──────────┘ │ Support for│ │ │ z/OS database│ ┌───────────┼───────────┐ │ ││ ↓ ↓ ↓ │ ↓│ ┌───┴───┐ ┌───┴───┐ ┌───┴───┐ │ Required data│ │ Report│ │ Report│ │ Report│ │ presented in│ └───────┘ └───────┘ └───────┘ │ report format│ │└─────────────────────────────────────────────┘
Figure 30. Organizing and presenting system performance data
Gathering and collecting performance data
82 Tivoli Decision Support for z/OS: Distributed Systems Performance Feature Guide and Reference

XCONFIGUNIX configuration reports
XERRORUNIX error reports
XPERFUNIX performance reports
WINDOWSWindows reports
The reports cover a wide range of needs in a data processing center, and reportingcan be done online or in batch. They are accessible from the Tivoli DecisionSupport for z/OS reporting dialog.
Finally, the key to successful implementation of Tivoli Decision Support for z/OSis knowing:v The information and resources on which you want to report and how to perform
customization to select themv The way you want to organize, set objectives for, and process the data (used
later to define the environment)
Gathering and collecting performance data
Chapter 8. Introducing the Distributed Systems Performance feature 83

Gathering and collecting performance data
84 Tivoli Decision Support for z/OS: Distributed Systems Performance Feature Guide and Reference

Chapter 9. Installing and configuring the UNIX and LinuxPerformance components
This supplements the procedure in the Administration Guide and Reference andReference for installing a component, with information specific to the UNIXPerformance component.
Installing Linux on zSeries: For information about installing Linux on zSeries, see“Making input data available”in the Tivoli Decision Support for z/OS SystemPerformance Feature Reference Volume II.
This topic describes how to plan, install, and test the UNIX Performancecomponent and the Linux Performance component.
Planning the implementation processAbout this task
Before installing the UNIX Performance component, you should follow these stepsto plan the implementation process:
Procedure1. Describe user tasks. Then determine what data the UNIX Performance
component must gather to help users accomplish those tasks.2. Determine which UNIX Performance subcomponent you must install to meet
the user needs.3. Determine the administration tasks you must perform for the selected
subcomponents, and make any decisions required by these tasks. These taskshelp you customize Tivoli Decision Support for z/OS and the UNIXPerformance component to work efficiently and effectively with your computersystem.
4. Determine (for each selected subcomponent) the tasks you must perform tocustomize the supported products to work with Tivoli Decision Support forz/OS and with the UNIX Performance component.
Results
If this is your first exercise in implementation planning, follow all these steps toensure that the UNIX Performance component's implementation is consistent. Ifyou are reading this topic in preparation for modifying your system, you mightnot need to perform all of these tasks.
Use the planning process to prepare for these main customization tasks:v Customizing UNIX to generate the data required by the subcomponents you
install.v Defining environment data, which is all the information (in addition to the input
data) that the UNIX Performance component needs to create reports.Environment data controls the data-collection process and provides moreinformation in the reports.
85

Figure 31 illustrates the process for implementing the UNIX Performancecomponent.
Considering which UNIX subcomponents to installYour most critical planning task is determining what information users need fromthe UNIX Performance component. For example, users may be interested only inerror conditions or in processor capacity. Installing only those subcomponentsneeded to meet user requirements ensures that the feature benefits users while itminimizes the performance impact caused by data collection and interpretationactivities.
The UNIX Performance component is divided into four subcomponents:v Accountingv Configuration (AIX only)v Error (AIX only)v Performance
Subcomponents are groups of Tivoli Decision Support for z/OS objects (forexample, predefined update definitions, data tables, and reports). If you find thatyou need reports from a subcomponent that you have not installed, you mustinstall that subcomponent and then wait several days or weeks until enough datais collected to create reports. However, if you install more subcomponents thanyou need, Tivoli Decision Support for z/OS collects needless data, which takes updisk space and uses processor time.
┌───────────────────────────────┐ ┌───────────────────────────────┐│ Installing Tivoli Decision │ │ Planning to use the UNIX ├←─────┐│ Support for z/OS │ │ Performance component │ │└───────────────┬───────────────┘ │ (implementation and ├←──┐ │
↓ │ modifications) │ │ │┌───────────────┴───────────────┐ └─────────┬──────┬──────┬───────┘ │ ││ Installing the UNIX │ │ │ │ │ ││ Performance component ├←───────────────┘ │ │ │ ││ (and its components) │ │ │ │ │└───────────────┬───────────────┘ │ │ │ │
│ │ │ │ ││ ┌───────────────────────────────┘ │ │ │↓ ↓ ↓ │ │
┌───────────────┴───────┴───────┐ ┌───────────────────────┴───────┐ │ ││ Administering Tivoli Decision │ │ Customizing UNIX │ │ ││ Support for z/OS and the │ └───────────────────────────────┘ │ ││ UNIX Performance component │ │ │└───────────────┬───────────────┘ │ │
↓ │ │┌───────────────┴───────────────┐ │ ││ Testing the component │ │ │└───────────────┬───────────────┘ │ │
↓ │ │┌───────────────┴───────────────┐ Modification requirements │ ││ Evaluating the feature’s ├──────────────────────────────────────────┘ ││ implementation │ │└───────────────┬───────────────┘ │
↓ │┌───────────────┴───────────────┐ Maintenance requirements ││ Putting the component ├─────────────────────────────────────────────┘│ into production │└───────────────────────────────┘
Figure 31. Implementation process for the UNIX Performance component
Planning the implementation process
86 Tivoli Decision Support for z/OS: Distributed Systems Performance Feature Guide and Reference

Note: You should be aware that using the process accounting part of of theaccounting subcomponent (log type PACCT) will degrade machine performance.However, using the other parts of the accounting subcomponent (log types QACCT,DTMP, and WTMP) will not degrade machine performance.
At this point, you might find it helpful to examine the predefined reports for eachsubcomponent, by turning to Chapter 14, “Reports,” on page 151.
Installing the UNIX Performance component on your UNIX nodesThis section gives you practical step-by-step information on how to install TivoliDecision Support for z/OS on your UNIX nodes.
Step 1: Check UNIX requirementsAbout this task
Check the following UNIX requirements:v “Disk space requirements”v “Software requirements”
Disk space requirementsYou need the following approximate disk space on each UNIX node:
Table 17. Disk space requirements on each UNIX node
Installation taskDisk space(approximate)
Loading code in the file system /usr/lpp: 400KB
Creating work files for the volume group rootvg file system. Foreach node from which you are collecting data, and for allsubcomponents, you require:
43MB for 10 users(see table note)
Note: The 43MB consists of:
ComponentSpace required
Accounting42.25MB (of which process accounting uses 42MB)
Performance0.4MB
Configuration180KB
Error 3KB
Software requirementsThe UNIX Performance component requires one of the following programs:v AIX 5L™ for Power V5.x
Accounting Services (if you need to run the UNIX Resource Accounting)v AIX 6 for Power V6.1v HP-UX 11iv3 or earlierv Sun Solaris 10 or earlier
Notes:
1. For AIX, HP, and Sun, you also require the corresponding communicationprograms to transfer log files to OS/390.
Considering which UNIX subcomponents to install
Chapter 9. Installing the UNIX and Linux Perf.comp. 87

2. The Unix host name can be 16 characters long at maximum on AIX and 8characters at maximum on all other platforms. If it is longer, it will betruncated.
Step 2: Transfer Tivoli Decision Support for z/OS feature codeto UNIX
About this task
According to the operating system you are using, the UNIX part of the UNIXPerformance component is distributed in the following SMP target librarymembers:AIX DRLxxx.SDRLWS(DRLAIX)HP-UX
DRLxxx.SDRLWS(DRLHP11)Sun Solaris
DRLxxx.SDRLWS(DRLSOLAR)
Download these tar files using these steps:
Procedure1. Log in as root user on a UNIX node.2. Enter the following commands:
mkdir /usr/lpp/epdmcd /usr/lpp/epdm
3. Start an ftp session to your OS/390 host, and receive the file from the OS/390user where you installed Tivoli Decision Support for z/OS. In the followingexample, the highlighted entries show the commands
yourmvsis the IP address/name of the OS/390 system where Tivoli DecisionSupport for z/OS was installed and where the tar file is located.
epdmunixis the TSO userid that has read access to the tar file.
# ftp yourmvsConnected to yourmvs.yourcorp.com.220-FTPSERVE at YOURMVS.SE.IBM.COM, 11:05:24 on 03/24/00220 Connection will close if idle for more than 5 minutes.Name (yourmvs:root): epdmunix331 Send password please.Password: secret230 EPDMUNIX is logged on.ftp> binary200 Representation type is IMAGE.ftp> get ’drl181.sdrlws(drlaix)’ epdmaix.tarftp> get ’drl181.sdrlws(drlhp11)’ epdmhp.tarftp> get ’drl181.sdrlws(drlsolar)’ epdmsolaris.tar200 Port request OK.125 Sending data set DRL181.SDRLWS(DRLAIX) FIXrecfm 128125 Sending data set DRL181.SDRLWS(DRLHP11) FIXrecfm 128125 Sending data set DRL181.SDRLWS(DRLSOLAR) FIXrecfm 128389120 bytes received in 25.2 seconds (6.349 Kbytes/s)ftp> quit221 Quit command received. Goodbye.#
4. When the UNIX Performance component code has been received by one UNIXnode, send the tar files to all other UNIX nodes where the UNIX Performancecomponent is to be installed.
Installing the UNIX Performance component on your UNIX nodes
88 Tivoli Decision Support for z/OS: Distributed Systems Performance Feature Guide and Reference

5. On each of the UNIX nodes to which the tar files have been sent, enter thefollowing tar command to unpack the epdmxxxx tar files (where xxxx is one ofaix, hp, or solaris) and create the files in the directories tar -xvf epdmxxxx.tar
6. (Optional) After completing the previous step you can remove the tar filesusing the command rm epdmxxxx.tar (If you need the tar files in the future,they still exist on OS/390 and can be used again).
7. Create file system or directory for log files.v For the AIX operating system, the command drlcrfs is provided to create a
file system with the name /var/epdm/, in volume group rootvg. The size ofthe file system is determined by an argument used with the drlcrfs. TheUNIX Performance component uses the file system /var/epdm/ to storework and data files until they have been sent to OS/390.The drlcrfs command is also used to mount the file system using/var/epdm as the mount point.By having the /var/epdm/ directory in a separate file system, there is norisk of obtaining a “file system full” condition on file system /var (whichwould stop UNIX processing).For example, to create and mount a new file system with size 50MB, enter:/usr/lpp/epdm/bin/drlcrfs 50
Confirm that the new file system has been created, by entering the followingcommand:df /var/epdm
v For the HP and Sun operating systems, the command drlcrfs is providedto create a directory with the name /var/epdm. The UNIX Performancecomponent uses the directory /var/epdm to store work and data files untilthey have been sent to OS/390.For example, to create a directory, enter:/usr/lpp/epdm/bin/drlcrfs
Confirm that the new directory has been created, by entering the followingcommand:ls /var/epdm
8. Create symbolic links.To create these symbolic links, enter the command /usr/lpp/epdm/bin/drlmklinks
Confirm that the symbolic links are created, using the following command:9. The drl.cfg parameter file is distributed as /usr/lpp/epdm/etc/drl.cfg. Copy
the parameter file to /etc/drl.cfg by entering cp /usr/lpp/epdm/etc/drl.cfg/etc/drl.cfg.
Installing the UNIX Performance component on your UNIX nodes
Chapter 9. Installing the UNIX and Linux Perf.comp. 89

Results
Table 18 shows the files created by Steps 2 to 9.
Table 18. Files created on each system by Steps 2 to 9
Directory Description Created files:
/usr/lpp/epdm/bin/ This directory was createdwhen the tar command wasrun. It contains executableUNIX Performance componentcommands.
drlpacctdrlwtmpdrldtmpdrlqacct (see Note 1)drlerrpt (see Note 1)drlconfhw (see Note 1)drlconfsw (see Note 1)drlgatherdrlmklinksdrlrmlinksdrlperfddrliostatdrlvmstatdrlcrfsdrlrmfsdrlsend (see Note 2)drlpsperfd (see Note 2)drlactperfd (see Note 2)drldeactperfd (see Note2)drlydaydrlparmget (see Note 2)zccmsgwrite (see Note 2)
/usr/lpp/epdm/etc/ This directory was createdwhen the tar command wasrun. It contains various filesused by the UNIX Performancecomponent.
drlcrondrl.cfg (see Note 3)rc.epdmunix
/usr/lpp/epdm/lib/ This directory was createdwhen the tar command wasrun. It contains libraries usedby UNIX Performancecomponent.
libDrl.a
/usr/lpp/epdm/lib/nls/msg/$LANG/
This directory was createdwhen the tar command wasrun. It contains the messagecatalog used by UNIXPerformance component.
drl.cat
Notes:
1. AIX only
2. A symbolic link has been created from /usr/bin/ to this program.
3. This file has been copied to /etc/.
Capturing UNIX Performance component data and transmitting toOS/390
About this task
This section describes:
Installing the UNIX Performance component on your UNIX nodes
90 Tivoli Decision Support for z/OS: Distributed Systems Performance Feature Guide and Reference

v The steps you must perform to set up the UNIX Performance component systemto capture performance data, and to transmit the data to the OS/390 system:
Step 1: Set up UNIX accounting (accounting subcomponent).Step 2: Create log filesStep 3: Define the receiver of UNIX Performance component dataStep 4: Customize UNIX Performance component parametersStep 5: Start the drlperfd daemon (performance subcomponent)Step 6: Invoke drlperfd at start time (performance subcomponent)
Note: Where a step is for a specific subcomponent only, the subcomponentname is given in parentheses in the heading for the step. Otherwise, you mustcarry out the step for all the subcomponents (accounting, configuration, error,and performance).
v The daily tasks that the UNIX Performance component will perform on yourUNIX node if you use the default options when setting up the UNIXPerformance component system to capture performance data. For moreinformation see ( “Description of daily tasks performed by UNIX Performancecomponent” on page 99).
Step 1: Set up UNIX accounting(accounting subcomponent only)
This section describes how to set up accounting for:v AIXv HP (on page “Setting up accounting for HP” on page 93)v Sun (on page “Setting up accounting for Sun Solaris” on page 94)
Setting up accounting for AIXAbout this task
This information can also be found in the section on setting up an accountingsystem in the AIX System Management Guide.
Procedure1. Log in as root user.2. Enter the nulladm command to ensure that the files have the correct access
permissions, as follows: /usr/sbin/acct/nulladm wtmp pacct.3. Update the /usr/lib/acct/holidays file. The UNIX Performance component
does not use this file, because the accounting data is collected every hour,every day of the year. However, the accounting routines must have a valid filewith a valid year in order to run correctly.
Note: To define prime time, fill in the fields on the first data line (the first linethat is not a comment), using a 24-hour clock. This line consists of three4-digit fields, in the following order:a. Current yearb. Beginning of prime time (hhmm)c. End of prime time (hhmm)
Leading blanks are ignored. You can enter midnight as either 0000 or 2400.For example, to specify the year 2004, with prime time beginning at 8:00 a.m.and ending at 5:00 p.m., enter:2004 0800 1700
Installing the UNIX Performance component on your UNIX nodes
Chapter 9. Installing the UNIX and Linux Perf.comp. 91

To define the company holidays for the year, fill in the fields on the next dataline. This line consists of four fields, in the following order:a. Day of the yearb. Monthc. Day of the monthd. Description of holiday
The day-of-the-year field must be a number from 1 through 365 (366 on leapyear). It corresponds to the number of day on which the holiday falls. Forexample, February 1st is day 32. The other three fields are for informationonly and are treated as comments. A two-line example follows:
1 Jan 1 New Year’s Day332 Nov 28 Thanksgiving Day
4. Turn on process accounting at start time by adding the following line to the/etc/rc file or by deleting the comment symbol (#) in front of the line if itexists:/usr/bin/su - adm -c /usr/sbin/acct/startup
The startup procedure records the time that accounting was turned on andcleans up the previous day's accounting files.
5. Identify each file system that you want to include in disk accounting byadding the following line to the stanza for the file system in the/etc/filesystems file:account = true
Example:
/home:dev = /dev/hd1vfs = jfslog = /dev/hd8mount = truecheck = truevol = /homefree = falseaccount = true
6. Specify the data files to be used for printer accounting data by adding oneseparate line to each queue stanza in the /etc/qconfig file. The UNIXPerformance component separates the print queue reports by using differentprint queue account file names.Example:
dlp0:device = lp0acctfile = /var/adm/qacct.prquename <== your
print queue namelp0:
header = alwaystrailer = neverfile = /dev/lp0backend = /usr/lpd/piobe
7. As the adm user, create the /var/adm/acct/nite, /var/adm/acct/fiscal, and/var/adm/acct/sum directories to collect daily and fiscal period records, byentering the following commands:su - admcd /var/adm/acctmkdir nite fiscal sumexit
Installing the UNIX Performance component on your UNIX nodes
92 Tivoli Decision Support for z/OS: Distributed Systems Performance Feature Guide and Reference

8. Make the daily accounting routines run automatically.The following statement, contained in /usr/lpp/epdm/etc/drlcron, shows youhow to gather all log types. Add this statement to the cron file.0 2 * * * /usr/lpp/epdm/bin/drlgather acct perf >/dev/null 2>&1
Update the root cron file using this command:crontab -e
Include, also, in crontab file the dodisk, and runacct commands. For example:0 1 * * * /usr/sbin/acct/dodisk >/dev/null 2>&130 1 * * * /usr/sbin/acct/runacct 2>/var/adm/acct/nite/accterr
The first line starts disk accounting at 1:00 a.m. (0 1). The second line startsmost accounting procedures and processes active data files at 1:30 a.m. (30 1)every day. You must have root user authority to edit the /var/spool/cron/crontabs/root file
9. Create a file named siteacct in the /var/adm directory, and insert thesestatements in it. If the file already exists and is a script, insert the statementsin the existing file. The statements are:date=`date +"%m%d"`cat /var/adm/Spacct*.$date >/var/adm/acct/nite/opacct
Set the file permissions and ownership:chmod 550 siteacctchown adm:adm siteacct
If the /var/adm/siteacct file already exists and is a binary file (an executablefile), use one of these methods instead:Either: Update /usr/sbin/acct/runacctto also call prsiteacct after siteacct, and create a file as described but nameit prsiteacct. or: Rename the existing siteacct file to siteacct, and createfile siteacct as described, and add after the two statements a call to siteacctas follows:/var/adm/siteacct
10. Start process accounting (if accounting is not already running on the AIXsystem). This will be done at start time as a result of the preceding change tothe /etc/rc file. However, to start immediate process accounting, issue thiscommand:nohup /usr/sbin/acct/runacct 2> /var/adm/acct/nite/accterr &
Setting up accounting for HPAbout this task
Set up accounting on HP nodes by following the instructions in the appropriatemanual. In addition, follow these steps:
Procedure1. Create a file named runacct.local in the /usr/lib/acct directory, and insert the
following statements in it. If the file already exists and is a script, insert thestatements in the existing file. The statements to insert are:date=`date +"%m%d"`cat /usr/adm/Spacct*.$date >/usr/adm/acct/nite/opacct
Set the file permissions and ownership:chmod 550 runacct.localchown adm:adm runacct.local
Installing the UNIX Performance component on your UNIX nodes
Chapter 9. Installing the UNIX and Linux Perf.comp. 93

2. To run runacct.local, edit the file named /usr/lib/acct/runacct. If necessary,insert the following statement:[ -s /usr/lib/acct/runacct.local ] && /usr/lib/acct/runacct.local
3. Start process accounting (if accounting is not already running):/bin/su - adm -c /usr/lib/acct/startup
You can also add this statement to the /etc/rc file to enable it to be executed atstart time.
Setting up accounting for Sun SolarisAbout this task
Set up accounting on Sun Solaris nodes by following the instructions in theappropriate manual. In addition, follow these steps:
Procedure1. Ensure that during the operating system installation you installed the
SUNWaccr and SUNWaccu accounting packages. If not, install them by runningthe following statements:pkginfo -l SUNWaccupkginfo -l SUNWaccr
2. Create a file named runacct.local in the /usr/lib/acct directory, and insert thefollowing statements in the file:date=`date +"%m%d"`cat /var/adm/Spacct*.$date > /var/adm/acct/nite/opacct
If the file already exists, insert these statements in the existing file.3. Set the runacct.local file permissions and ownerships:
chmod 550 runacct.localchown adm runacct.localchgrp adm runacct.local
4. To run runacct.local file, ensure that the following statement appears after theUSEREXIT statement in the /usr/lib/acct/runacct file:[ -s /usr/lib/acct/runacct.local ] && /usr/lib/acct/runacct.local
If the statement is missing, insert it after the USEREXIT statement.5. Start process accounting (if accounting is not already running):
/usr/bin/su - adm -c /usr/lib/acct/startup
You can also add this statement to the /etc/rc file to enable it to be executed atstart time.
Step 2: Create log filesAbout this task
By including drlgather commands in the cron file, you can schedule the creationof log files, by entering the following command:/usr/lpp/epdm/bin/drlgather -c conf_day component_list
Where:
conf_dayIs used with the configuration component, and specifies the day on whichthe configuration log file will be created. The creation of the log file occurs
Installing the UNIX Performance component on your UNIX nodes
94 Tivoli Decision Support for z/OS: Distributed Systems Performance Feature Guide and Reference

on (default value) the first day of each calendar month. In the followingexample, the configuration log file will be created every fifth day:-c"1 5 10 15 20 25"
component_listCan be one or more of the following:v acct (accounting subcomponent)v conf (configuration subcomponent)v error (error subcomponent)v perf (performance subcomponent)
Procedure1. For AIX, edit the root cron file using the command crontab -e. For HP, edit the
root cron file using the following commands:cd /var/spool/cron/crontabsvi rootcrontab root (to update the cron daemon)
For Sun Solaris, edit the root cron file using the following commands:cd /usr/spool/cron/crontabsvi rootcrontab root (to update the cron daemon)
For the accounting, error, and performance subcomponents, the creation of thelog files occurs at (default value) 02.00 hours each day.To verify that the updates were successful, enter:crontab -l
2. Select the subcomponents for which you wish to gather log files.The following example shows you how to automatically schedule log files forall subcomponents:0 2 * * * /usr/lpp/epdm/bin/drlgather -c1 acct error perf conf
The next example shows you how to automatically schedule only the log filesfor the accounting and performance subcomponents:0 2 * * * /usr/lpp/epdm/bin/drlgather acct perf
(This statement can also be found in /usr/lpp/epdm/etc/drlcon)
Step 3: Define the receiver of UNIX Performance componentdata
About this task
Procedure1. Insert in the home directory .netrc file, the following entry:
machine mvssystem login epdmuser passwordpwd
Where the mvssystem, epdmuser, and pwd are the values for the OS/390 hostuser that will receive the data files. FTP uses this file when performing the filetransfer, each night.
Note: The value for password must be the same as the current password usedon OS/390.
2. After editing the .netrc file, check that the file has private read/writepermission only, by entering the command chmod 600 .netrc
Installing the UNIX Performance component on your UNIX nodes
Chapter 9. Installing the UNIX and Linux Perf.comp. 95

3. Use the command ping -c1 mvssystem, to check that communication betweenthe UNIX Performance component and OS/390 is possible. You can break fromthis command by typing Ctrl+C. If the ping command fails, you should add ahost definition to the file /etc/hosts, as shown in the following example:9.99.99.99 mvssystem
where 9.99.99.99 is the IP address, and mvssystem is the name of the OS/390system.
Step 4: Customizing UNIX Performance componentparameters
About this task
Edit the parameter file /etc/drl.cfg to change the default values supplied by theUNIX Performance component to those for your installation. If you are using theparameter file default values, you only need to change the value of epdmHost. Allthe subcomponents use these parameter file values.
Parameter file values for all subcomponentslogPath = /var/epdmexePath = /usr/lpp/epdm/bin (Do not change)epdmHost = yourmvsepdmPrefix = EPDMUNIXminFree = 2000site = bl=10204 lr=255 rec=vb cy pri=1 sec=5maxRetries = 72retInterval = 60HostLabel =
ParameterDescription
logPathThe name of directory where all the data log files will be stored.
exePathThe name of the directory where all commands are.
msgCatalogThe name of the file where all messages are stored.
epdmHostHost name (TCP nodename or TCP internet address) of the OS/390 host toreceive the UNIX Performance component data files.
epdmPrefixLog data set prefix, which you set according to your own requirements.
minFreeMinimum free disk space in KB on /var/epdm before running the dailydrlgather.
site OS/390 data set characteristics for the data files sent using TCP/IP FTP toOS/390.
maxRetriesWhen the UNIX Performance component data files are to be automaticallytransferred to OS/390 each night, the communication might be broken forsome reason, or the OS/390 host might be temporarily unavailable. If thatis the case, the routine drlgather will repeat attempt the file transfer of thedata files for a number of times given by the parameter 'maxRetries'. Using
Installing the UNIX Performance component on your UNIX nodes
96 Tivoli Decision Support for z/OS: Distributed Systems Performance Feature Guide and Reference

the default value for maxRetries, and with the retInterval set at its defaultvalue of 60 minutes, the file transfer retry period will, therefore, cover 3days.
retIntervalInterval in seconds between ftp retries (default value = 30).
HostLabelSet this parameter when there are more hosts that may have the samehostname (in an hacmp environment). If the HostLabel parameter has notany value, the product runs the ’uname -n’ command, otherwise it returnsthe HostLabel value.
Note:
1. Do not change the first two parameters logPath, and exPath as they are forinternal use only.
2. You must specify the node name in the epdmHost parameter and the data setprefix in the epdmPrefix parameter. This is the name of the host and user toreceive the data via TCP/IP FTP. These names must be the same as the valuesof node name and user ID in the .netrc file.
Parameter file values for Performance componentThe parameter file values used by the performance component (only), are asfollows:perfInterval = 60perfCount = 10diskInterval = 60
ParameterDescription
perfIntervalThe program drlperfd issues vmstat and iostat commands, which containthe perfInterval value as the interval parameter. The default intervalbetween samples is 60 seconds.
perfCountThe program drlperfd samples vmstat and iostat data, at the intervalvalues shown. This data is saved in the file /var/epdm/node_name.perf.dyymmdd.n, as follows:v The minimum, maximum and average values during the perfCount
intervalv The number of users and processesv The usage of paging space
The default interval between samples is 10 minutes.
diskIntervalThe program drlperfd issues the commands df and lsvg, and save filespace and volume group usage in the file /var/epdm/node_name.disk.dyymmdd. n. The default interval between samples is 60minutes.
Table 19 on page 98 shows the directory created by the drlcrfs commandexplained in item 7 of “Step 2: Transfer Tivoli Decision Support for z/OS featurecode to UNIX” on page 88.
Installing the UNIX Performance component on your UNIX nodes
Chapter 9. Installing the UNIX and Linux Perf.comp. 97

Table 19. Creating a directory from the drlcrfs command
Directory DescriptionFiles to be created when UNIXPerformance component running
/var/epdm/ This directory is created bythe command drlcrfs.
The directory resides in anew separate file system,generated and mounted over/var/epdm by an installationprocedure. No files areloaded in this directory atinstallation. The directorywill be used to hold workfiles, data files and log files.The data files will be deletedas soon as they aresuccessfully transmitted.
work files: (see Note 1)drlerrpt.time (see Note 1)node_name.perf.worknode_name.disk.work (see Note 1)node_name.perfio.worknode_name.perfvm.work
.sk log data files: (see Notes 2, 3, 4)node_name.pacct.dyymmdd.1node_name.wtmp.dyymmdd.1node_name.dtmp.dyymmdd.1node_name.qacct.dyymmdd.1 (see Note 1)node_name.errpt.dyymmdd.1 (see Note 1)node_name.perf.dyymmdd.1node_name.disk.dyymmdd.1 (see Note 1)node_name.conf.dyymmdd.1 (see Note 1)node_name.epdmunix.dyymmdd.1 (seeNote 6)
.sk message log files: (see Notes 2, 3)node_name.drlperfd.errorlognode_name.log.dyymmddnode_name.errorlog.dyymmdd
.sk ftp work files: (see Notes 2, 3, 5)node_name.ftpwork.dyymmddnode_name.ftpmsg.dyymmddnode_name.ftperr.dyymmdd
Notes:
1. AIX only
2. node_name is the name of the node.
3. yymmdd is the current date.
4. These files will be removed after they have been transferred to OS/390.
5. These files will be removed after the log data files have been transferred to OS/390. Ifthe transfer to OS/390 is not successful, these files contain details of the failure.
6. This file contains the 8 files listed before it (node_name.pacct.dyymmdd.1,node_name.wtmp.dyymmdd.1, and so on) and is the file to be transmitted.
Step 5: Start the drlperfd daemonAbout this task
The processes that will collect performance and disk space data during the day, areinitiated by program drlperfd.
You should now:
Procedure1. Start the 4 background processes that gather performance and disk space data,
by entering the command drlactperfd.If you enter the drlactperfd command without parameters on an AIX platform,the perf and disk data will be collected. You can collect them also running the"drlactperfd perf disk" command. If you want to collect only the disk or theperf data, enter the command drlactperfd disk or drlactperfd perf.
Installing the UNIX Performance component on your UNIX nodes
98 Tivoli Decision Support for z/OS: Distributed Systems Performance Feature Guide and Reference

To start the trace, start the drlactperfd with the "trace" option as follows:drlactperfd perf disk trace.
2. Enter the command drlpsperfd to display the status of the UNIX Performancecomponent processes. The four processes that should be listed, are shown in“drlpsperfd” on page 102
Results
Performance data will now be entered in the following files:v work files
– node_name.perf.work– node_name.disk.work– node_name.perfio.work– node_name.perfvm.work
v log data files– node_name.perf.dyymmdd
– node_name.disk.dyymmdd
The file node_name.drlperfd.errorlog contains possible error messages. This fileremains empty providing the drlactperfd command runs successfully.
The file node_name.drlperfd.log contains information messages which inform you,for example, of the files that have been transferred to OS/390.
Step 6: Invoke drlperfd at start timeAbout this task
(performance component only)
To automatically start the drlperfd program at IPL (boot) time, perform these steps:
Procedure1. For AIX, enter the command mkitab epdm:2:wait:/etc/rc.epdmunix. For HP
and Sun operating systems, edit /etc/inittab and add the epdm line at the endas shown.# 1.28 com/cfg/etc/inittab, bos, bos320 10/3/00 10:46:51# COMPONENT_NAME: CFGETC## ORIGINS: 3, 27...epdm:2:wait:/etc/rc.epdmunix
2. Copy rc.epdmunix to /etc/ using the command cp /usr/lpp/epdm/etc/rc.epdmunix /etc/.
Description of daily tasks performed by UNIX Performancecomponent
During the day, UNIX Performance component has four processes running whichare started by one program. UNIX is set up so that these four processes areautostarted at each IPL (boot-time), as described in “Step 6: Invoke drlperfd atstart time.” The program that starts the four processes is drlperfd, whichperiodically logs:
Installing the UNIX Performance component on your UNIX nodes
Chapter 9. Installing the UNIX and Linux Perf.comp. 99

v Various performance data to the daily file /var/epdm/node_name.perf.dyymmdd.n (the default value is every 10 minutes).
v Disk space data to the daily file /var/epdm/node_name.disk.dyymmdd.n (thedefault is every 60 minutes).
Note: An explanation of node_name, yymmdd, and n is given in Table 19 on page98..
Each night, UNIX accounting routines and the UNIX Performance componentroutines are run. These routines are started from the UNIX cron daemon at defaulttimes (which can be customized by you), in the root's cron file.
Time Action
01:00 UNIX starts the dodisk command via cron.
01:30 UNIX starts the runacct command via cron.
02:00 UNIX starts the drlgather command via cron.
Command drlgather calls the following routines:v drlpacct, which reads yesterday's process accounting file and produces
an ASCII file suitable for sending to OS/390.v drlwtmp, which reads yesterday's login/logout accounting file and
produces an ASCII file suitable for sending to OS/390.v drldtmp, which reads yesterday's disk accounting file and produces an
ASCII file suitable for sending to OS/390.v drlqacct, which reads yesterday's print queue accounting files and
produces an ASCII file suitable for sending to OS/390.v drlerrpt, which prints the AIX error log since previous print and
produces an ASCII file suitable for sending to OS/390.v drlconf, which produces a hardware and software configuration file in
ASCII format for sending to OS/390. This is performed once per month.v drlsend, which transmits a log file containing the concatenated ASCII
files shown, together with the performance and disk space files createdby drlperfd, to OS/390 (using TCP/IP ftp). If the link to OS/390 istemporarily down, or if ftp receives a time out during the connect fromUNIX to OS/390, the file will be transmitted (by default) one hour laterand this will be repeated (by default) 72 times.
02:30 UNIX starts the monacct command via cron daemon.
Following is an example of AIX crontab schedule:0 1 * * * /usr/sbin/acct/dodisk >/dev/null 2>&130 1 * * * /usr/sbin/acct/runacct >/dev/null 2>/var/adm/acct/nite/accterr0 2 * * * /usr/lpp/epdm/bin/drlgather -c1 acct error perf conf >/dev/null 2>&130 2 * * * /usr/sbin/acct/monacct >/dev/null 2>&1
Operating the UNIX Performance component on UNIXThis section describes:v The UNIX Performance component logsv The commands that you use to operate the UNIX Performance component on
UNIX (see “AIX commands to use if UNIX Performance component installed”on page 102).
Installing the UNIX Performance component on your UNIX nodes
100 Tivoli Decision Support for z/OS: Distributed Systems Performance Feature Guide and Reference

Description of UNIX Performance component filesExamine the /var/epdm directory to see how the nightly file transfer routineshave performed. Look for the files node_name.log.dyymmdd, where node_name is thename of the node and yymmdd is current date. There should be one informationlog file per day.
By looking into a particular information log file you can see:v What files were sent that day.v How big they were.v If and why the ftp file transfer was not completed.
This is an example of the /var/epdm directory:ls -l /var/epdmtotal 1544-rw-r--r-- 1 root system 770 Nov 24 19:12 drl.cfg-rw-r--r-- 1 root system 7847 Feb 07 10:43 node1.disk.work-rw-r--r-- 1 root system 0 Jan 02 19:25 node1.drlperfd.errorlog-rw-r--r-- 1 root system 618581 Jan 22 02:11 node1.epdmunix.d950127.1-rw-r--r-- 1 root system 93 Jan 22 02:12 node1.ftpwork.d950127-rw-r--r-- 1 root system 436 Jan 22 02:12 node1.ftpmsg.d950127-rw-r--r-- 1 root system 224 Jan 22 02:12 node1.ftperr.d950127-rw-r--r-- 1 root system 0 Jan 22 02:00 node1.errorlog.d950122-rw-r--r-- 1 root system 0 Jan 23 02:00 node1.errorlog.d950123-rw-r--r-- 1 root system 0 Jan 24 02:00 node1.errorlog.d950124-rw-r--r-- 1 root system 0 Jan 25 02:00 node1.errorlog.d950125-rw-r--r-- 1 root system 0 Jan 26 02:00 node1.errorlog.d950126-rw-r--r-- 1 root system 0 Jan 27 02:00 node1.errorlog.d950127-rw-r--r-- 1 root system 0 Jan 28 02:00 node1.errorlog.d950128-rw-r--r-- 1 root system 0 Jan 29 02:00 node1.errorlog.d950129-rw-r--r-- 1 root system 0 Jan 22 02:00 node1.errorlog.d950122-rw-r--r-- 1 root system 168 Feb 01 02:01 node1.errorlog.d950201-rw-r--r-- 1 root system 0 Feb 02 02:00 node1.errorlog.d950202-rw-r--r-- 1 root system 0 Feb 03 02:00 node1.errorlog.d950203-rw-r--r-- 1 root system 11 Feb 07 19:10 node1.errpt.time-rw-r--r-- 1 root system 2307 Jan 22 02:02 node1.log.d950122-rw-r--r-- 1 root system 2321 Jan 23 02:02 node1.log.d950123-rw-r--r-- 1 root system 2302 Jan 24 02:03 node1.log.d950124-rw-r--r-- 1 root system 2409 Jan 25 02:04 node1.log.d950125-rw-r--r-- 1 root system 2043 Jan 26 02:02 node1.log.d950126-rw-r--r-- 1 root system 2312 Jan 27 02:03 node1.log.d950127-rw-r--r-- 1 root system 2351 Jan 28 02:03 node1.log.d950128-rw-r--r-- 1 root system 2234 Jan 29 02:02 node1.log.d950129-rw-r--r-- 1 root system 2287 Jan 30 02:04 node1.log.d950130-rw-r--r-- 1 root system 2357 Jan 31 02:03 node1.log.d950131-rw-r--r-- 1 root system 2308 Feb 01 02:02 node1.log.d950201-rw-r--r-- 1 root system 2319 Feb 02 02:04 node1.log.d950202-rw-r--r-- 1 root system 2401 Feb 03 02:02 node1.log.d950203-rw-r--r-- 1 root system 35293 Feb 07 11:08 node1.perf.work-rw-r--r-- 1 root system 111 Feb 07 11:07 node1.perfio.work-rw-r--r-- 1 root system 116 Feb 07 11:07 node1.perfvm.work
In this example there is a communication problem on January 27, so the files forthis day have not been sent. You can check the contents of the filesnode1.ftpwork.d950127, node1.ftpmsg.d950127, and node1.ftperr.d950127 for detailsof the problem. The merged log data file for this date has been retained by thesystem. When the problem has been solved, you can then manually send the logdata file (node1.epdmunix.d950127.1), using the command drlsend.
You can also see that an error has occurred on February 01, because the filenode1.errorlog.d950201 is not empty. You can check the contents of this file fordetails of the problem.
Operating the UNIX Performance component on UNIX
Chapter 9. Installing the UNIX and Linux Perf.comp. 101

Obsolete log files must be deleted manually.
AIX commands to use if UNIX Performance componentinstalled
Use the following four commands when operating the UNIX Performancecomponent on UNIX.
drlpsperfdThis command displays the status of the UNIX Performance component processesin UNIX:drlpsperfdThe following drlperfd processes are running
USER COMMAND PID PPIDroot drlperfd 10200 1root drlperfd 11735 10200 (Not for HP or Sun)root drlvmstat 17153 11735root drliostat 19970 11735
drlactperfdUse this command to start the performance component processes in UNIX. It startsthe drlperfd daemon. This daemon will create performance log files. Commanddrlactperfd can also be used to restart the drlperfd daemon.
drldeactperfdUse this command to stop the performance component processes in UNIX.
drlsendIf there is a communication problem, the UNIX Performance component routinesautomatically attempt to re-send the files. However, for the following reasons youmight need to manually re-send the data files to OS/390:v If AIX has been rebooted and was “down” at the time of a retry event, the event
will never be rescheduled.v If the ftp retry period has been exceeded. The ftp retry period is defined using
the parameters maxRetries and retInterval in the parameter file /etc/drl.cfg.
All data files for those days in which the data files were not sent, remain on the/var/epdm directory. After the communication problems has been corrected, thedata files for a particular day can be sent using the drlsend command. The drlsendcommand deletes the files after they have been successfully transferred. Issue thiscommand with the date parameter, as follows:drlsend yymmdd
where yymmdd can be found in the corresponding file names, in the /var/epdmdirectory.
Installing UNIX Performance component on the z/OS systemAbout this task
When you install UNIX Performance component subcomponents, Tivoli DecisionSupport for z/OS will install the required log and record definitions, recordprocedures, and update definitions to the product system tables. Tivoli DecisionSupport for z/OS will also install the predefined tables (described in Chapter 12,“Data, lookup, and control tables,” on page 133) and reports (described inChapter 14, “Reports,” on page 151). To install the UNIX subcomponents, use theAdministration dialog.
Operating the UNIX Performance component on UNIX
102 Tivoli Decision Support for z/OS: Distributed Systems Performance Feature Guide and Reference

Perform steps 1 to 4, as follows:
Procedure1. From the Tivoli Decision Support for z/OS Administration window (Figure 32),
select 2, Components and press Enter.
The Components window is displayed, (as shown in Figure 33).
2. From the Components window, select the components to install (here, the AIXaccounting component) and press F6.
3. The Installation Options window is displayed, (as shown in Figure 34 on page104).
Other Utilities Help--------------------------------------------------------------------------
Tivoli Decision Support for OS/390 Administration
Select one of the following. Then press Enter.
2_ 1. System2. Components3. Logs4. Tables5. Reports
Command ===> ______________________________________________________________F1=Help F2=Split F3=Exit F9=Swap F10=Actions F12=Cancel
Figure 32. Tivoli Decision Support for z/OS Administration window
Components Other Help------------------------------------------------------------------------------
Components ROW 1 TO 13 OF 47
Select one or more components. Then press Enter to Open component.
/ Components Status Date_ Network Line Utilization Component Installed 00-03-19_ Network NetView FTP Component Installed 00-03-19_ Network NPM Internal Utilization Component Installed 00-03-19_ Network NV/SM Internal Utilization Component Installed 00-03-19_ Network Problem Component Installed 00-03-19_ Network RTM Response Time Component Installed 00-03-19_ Network Service Component Installed 00-03-19_ DB2 Component Installed 00-03-17_ Information/Management Component Installed 00-03-17/ UNIX Accounting Component_ UNIX Configuration Component_ UNIX Error Component_ UNIX Performance Component
Command ===> _________________________________________________________________F1=Help F2=Split F3=Exit F5=New F6=Install F7=BkwdF8=Fwd F9=Swap F10=Actions F12=Cancel
Figure 33. Components window
Operating the UNIX Performance component on UNIX
Chapter 9. Installing the UNIX and Linux Perf.comp. 103

4. Using the component-installation procedure in the Administration Guide andReference, SH19-6816 specify whether the component is to be installed online, orin batch mode.Batch mode installation results in less output than in online. Furthermore, foronline installation your terminal will be blocked for the duration of theinstallation. Therefore, it is recommended that you install components in batch.
Updating the lookup tablesAbout this task
All the subcomponents of the UNIX Performance component include lookup tablesthat you can customize to specify the groupings you want reflected in yourreports.
If you specify online installation, Tivoli Decision Support for z/OS displays theLookup Tables window. To edit a lookup table using ISPF edit, select a table andpress Enter.
If you specify batch mode installation, you can edit the lookup tables using theISPF editor, after the component is installed. To enter an ISPF edit from TivoliDecision Support for z/OS, you should:
Procedure1. Select 'Tivoli Decision Support for z/OS Administration' from the Tivoli
Decision Support for z/OS Primary Menu2. Select '4. Tables'3. Select the lookup table that you wish to edit, select the 'Edit' pull-down, and
press Enter4. Select '3. ISPF Editor' from the Edit pull-down.
Components Other Help.-----------------------------------------------------------------------------.| ROW 1 TO 7 OF 7 || .--------------------------------------------------------------. || S| Installation Options | Enter. || | | || /| Select one of the following. Then press Enter. |Date || /| | || _| __ 1. Online | || _| 2. Batch | || _| | || _| F1=Help F2=Split F6=Objects F9=Swap F12=Cancel | || _|--------------------------------------------------------------| || _ || ***************************** BOTTOM OF DATA ****************************** || || || || || || Command ===> ______________________________________________________________ || F1=Help F2=Split F7=Bkwd F8=Fwd F9=Swap F12=Cancel |’-----------------------------------------------------------------------------’F18=Fwd F9=Swap F10=Actions F12=Cancel
Figure 34. Installation Options window
Operating the UNIX Performance component on UNIX
104 Tivoli Decision Support for z/OS: Distributed Systems Performance Feature Guide and Reference

Results
With the UNIX Performance component, customization involves updating theXACCT_CONNECT_TYPE, X_NODE_NAME, and XACCT_PRINT_TYPE lookuptables, described in the following sections.
Updating XACCT_CONNECT_TYPEThis lookup table has information about connect types. It is used during reporting,to translate hexadecimal connect codes to a descriptive text.
A sample of the lookup table contents is given in “XACCT_CONNECT_TYPE” onpage 144.
Updating X_NODE_NAMEThis lookup table contains UNIX node names, accounting groups, Internetaddresses, and period plans. It is used during the collect, to translate the nodename to its accounting group and period plan.
If you are installing online, you will be given the opportunity to edit the contentsusing the ISPF editor. A sample of the lookup table contents is given in“X_NODE_NAME” on page 145. Add the host names of all your UNIX nodes forwhich you are going to do reporting.
Note: If you have many UNIX nodes, you can obtain a listing of the node names,by entering the following command on one of your AIX nodes:hostent -S
Updating XACCT_PRINT_TYPENode names and print queue names are grouped together into print types. Thislookup table contains each print type.
A sample of the lookup table contents is given in “XACCT_PRINT_TYPE” on page145.
After installation is completed, Tivoli Decision Support for z/OS returns you to theComponents window, and the Status field indicates that the component is installed.
Collecting data under Tivoli Decision Support for z/OSAbout this task
There are various methods you can define yourself, to set up the JCL for theCOLLECT procedure. This section, however, describes a method that uses a GDG(generation data set). It explains:v How a Generation Data Group (GDG) is created.v How the files received from UNIX are renamed, so they can be used with a
GDG.v The JCL for a general collect job, which uses a GDG to collect data into Tivoli
Decision Support for z/OS tables.v The JCL for a collect job with specified Tivoli Decision Support for z/OS tables to
be updated.
Updating the lookup tables
Chapter 9. Installing the UNIX and Linux Perf.comp. 105

Creating your Generation Data GroupsAbout this task
You are recommended to use a generation data group (GDG) to avoid the largeamount of JCL renaming work that would otherwise be required each time acollect was run. This is especially true if you work with a system containing manynodes.
The GDG must be created before you run the first collect. Thereafter, the same GDGcan be used with each collect. The following job is provided to create the GDG:DRL180.SDRLCNTL(DRLJXGDG)
Renaming files sets sent from UNIX for use with a GDGAbout this task
In a large UNIX network, there will be many files sent from UNIX nodes to thehost OS/390 each night. Each UNIX file transferred to OS/390 is given a uniquedata set name according to this naming convention:prefix.node_name.EPDMUNIX.Dyymmdd
Where:
prefix The high-level qualifier (for example, the user ID), for receiving files fromUNIX.
node_nameFirst qualifier from the UNIX node name.
yymmddCreation date of the file in UNIX.
This naming convention ensures that no data is lost by overlaying existing datasets, and makes it easy to identify the origin of the data.
Before each collect of data, you must rename the files sent from UNIX so theybecome a generation data set within a GDG. The GDG is then the input to thecollect job. The following job is provided to do this:DRL182.SDRLCNTL(DRLJXPCO)
This job uses the REXX program DRLEXRNM, which renames each UNIX file to ageneration data set within the GDG. The GDG has the following namingconvention:prefix.COLLECT.EPDMUNIX
Note: You should customize this job to meet your own naming conventions.Commented within the job DRL182.SDRLCNTL(DRLJXPCO) are detailedinstructions on how to do this.
Example of renaming UNIX filesThis example shows how files from the nodes ADAM, BAKER, and CESAR, are renamedto generation data sets, within the GDG with the name USER1.COLLECT.EPDMUNIX.GDG USER1.COLLECT.EPDMUNIX emptyFollowing datasets found for USER1.*.EPDMUNIX.D* and renamed toUSER1.COLLECT.EPDMAIX
USER1.ADAM.EPDMUNIX.D921214 G0001V00USER1.ADAM.EPDMUNIX.D921215 G0002V00
Collecting data under Tivoli Decision Support for z/OS
106 Tivoli Decision Support for z/OS: Distributed Systems Performance Feature Guide and Reference

USER1.BAKER.EPDMUNIX.D921214 G0003V00USER1.CESAR.EPDMUNIX.D921213 G0004V00USER1.CESAR.EPDMUNIX.D921214 G0005V00USER1.CESAR.EPDMUNIX.D921215 G0006V00
Number of datasets:6
Note:
1. The program DRLEXRNM used the search criterion 'USER1.*.EPDMUNIX.D*'.2. The generation numbers are given in the right column (G0001V00, G0002V00,
and so on).3. Generation data sets are given the next sequential generation number (existing
generations are retained). For example, if the generation data set withgeneration number G0006V00 currently exists in the GDG, new data sets willbe given the generation numbers G0007V000, G0008V000, and so on.
General collect jobThe member DRL180.SDRLCNTL(DRLJCOLL) contains sample JCL for a general collect.
Another way to obtain the COLLECT JCL, is to:1. Select 'Tivoli Decision Support for z/OS Administration' from the Tivoli
Decision Support for z/OS Primary Menu.2. Select '3. LOGS'.3. Select 'UNIX' from the list of logs, select the 'Utilities' pull-down, and press
Enter.4. Select '1. Collect'.5. Type your installation-specific information in this window, and press Enter.
The JCL given in Figure 35 on page 108 is the general collect job which uses (in theDRLLOG statement) the example of a GDG for the nodes ADAM, BAKER, and CESAR.
Collecting data under Tivoli Decision Support for z/OS
Chapter 9. Installing the UNIX and Linux Perf.comp. 107

Collect job with specified Tivoli Decision Support for z/OStables
The Administration Guide and Reference describes how to optimize Tivoli DecisionSupport for z/OS data collection by specifying only the needed tables in theINCLUDE (or EXCLUDE) clauses of the COLLECT statement.
The example in Figure 36 on page 109 shows how to selectively include two of theResource Accounting data tables.
//JOBCARD//* *//* Notes: *//* Before you submit the job: *//* - Check the Tivoli Decision Support for z/OS and DB2 *//* data set names. *//* - Check the DB2 subsystem name (default is DSN) *//* and Tivoli Decision Support for z/OS *//* system table prefix (default is DRLSYS). *//* - Insert the correct collect statement in DRLIN *//* (as described above). *//* - Specify the name of the log data set (or GDG) in *//* DRLLOG. In this example, all existing generations *//* are to be collected for files from UNIX *//* *//***************************************************************//COLLECT EXEC PGM=DRLPLC,PARM=(’SYSTEM=DB2A SYSPREFIX=DRLSYS’)//STEPLIB DD DISP=SHR,DSN=DRL180.SDRLLOAD// DD DISP=SHR,DSN=db2loadlibrary//DRLIN DD *
COLLECT UNIX;
//DRLLOG DD DISP=SHR,DSN=USER1.COLLECT.EPDMUNIX//DRLOUT DD SYSOUT=*,DCB=(RECFM=F,LRECL=80)//DRLDUMP DD SYSOUT=*,DCB=(RECFM=F,LRECL=80)/*
Figure 35. General COLLECT job
Collecting data under Tivoli Decision Support for z/OS
108 Tivoli Decision Support for z/OS: Distributed Systems Performance Feature Guide and Reference
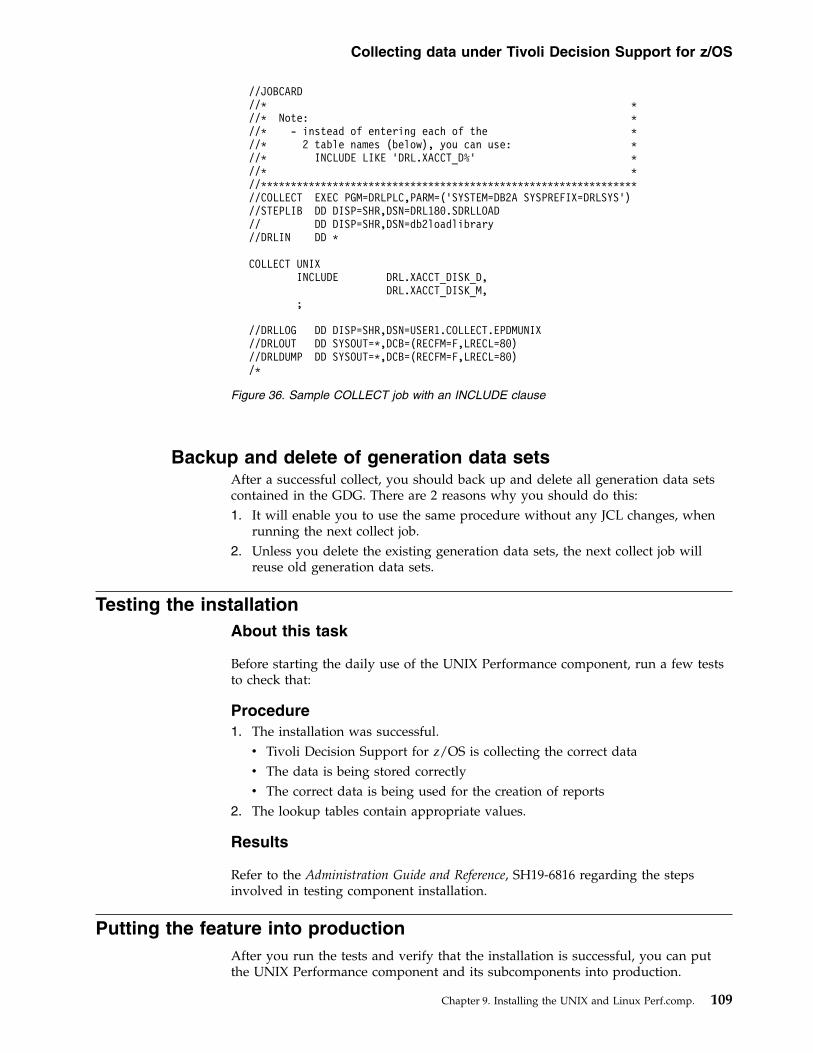
Backup and delete of generation data setsAfter a successful collect, you should back up and delete all generation data setscontained in the GDG. There are 2 reasons why you should do this:1. It will enable you to use the same procedure without any JCL changes, when
running the next collect job.2. Unless you delete the existing generation data sets, the next collect job will
reuse old generation data sets.
Testing the installationAbout this task
Before starting the daily use of the UNIX Performance component, run a few teststo check that:
Procedure1. The installation was successful.v Tivoli Decision Support for z/OS is collecting the correct datav The data is being stored correctlyv The correct data is being used for the creation of reports
2. The lookup tables contain appropriate values.
Results
Refer to the Administration Guide and Reference, SH19-6816 regarding the stepsinvolved in testing component installation.
Putting the feature into productionAfter you run the tests and verify that the installation is successful, you can putthe UNIX Performance component and its subcomponents into production.
//JOBCARD//* *//* Note: *//* - instead of entering each of the *//* 2 table names (below), you can use: *//* INCLUDE LIKE ’DRL.XACCT_D%’ *//* *//***************************************************************//COLLECT EXEC PGM=DRLPLC,PARM=(’SYSTEM=DB2A SYSPREFIX=DRLSYS’)//STEPLIB DD DISP=SHR,DSN=DRL180.SDRLLOAD// DD DISP=SHR,DSN=db2loadlibrary//DRLIN DD *
COLLECT UNIXINCLUDE DRL.XACCT_DISK_D,
DRL.XACCT_DISK_M,;
//DRLLOG DD DISP=SHR,DSN=USER1.COLLECT.EPDMUNIX//DRLOUT DD SYSOUT=*,DCB=(RECFM=F,LRECL=80)//DRLDUMP DD SYSOUT=*,DCB=(RECFM=F,LRECL=80)/*
Figure 36. Sample COLLECT job with an INCLUDE clause
Collecting data under Tivoli Decision Support for z/OS
Chapter 9. Installing the UNIX and Linux Perf.comp. 109

Figure 37 shows the daily steps involved in using Tivoli Decision Support forz/OS.
You can run reports in batch, after setting batch parameters for each report usingthe administration dialog.
For detailed information about these steps, refer to the Administration Guide andReference and Reference.
Considering which Linux subcomponents to installThe Linux Performance component is divided into three subcomponents:v Configuration (AIX only)v Error (AIX only)v Performance
Installing the Linux Performance component on your Linux nodesThis section gives you practical information on how to install Tivoli DecisionSupport for z/OS on your Linux nodes.
Note that the steps are very close to the ones of the Unix nodes. For more detailedinformation, please refer to them where applicable.
Step 1: Check Linux requirementsThis section lists the Linux software requirements.
Software requirementsAbout this task
The Linux Performance component requires one of the following programs:v Linux REDHAT 9 or earlierv Linux SUSE 10.1 or earlierv TURBOLinux 10 (Kernel 2.2.18) or earlier
Step 2: Transfer Tivoli Decision Support for z/OS feature codeto Linux
About this task
The Linux part of the Linux Performance component is distributed in the DRL180,SDRLWS (DRLLINUX) for Linux SMP target library member.
Download these tar files using these steps:
Procedure1. Log in as root user on a Linux node.2. Enter the commands:
Check that thefile transferprogram hastransferred data.
RunCOLLECTjob
Performdatabase
maintenance
Create
reports
Figure 37. Daily steps involved in using Tivoli Decision Support for z/OS
Putting the feature into production
110 Tivoli Decision Support for z/OS: Distributed Systems Performance Feature Guide and Reference

mkdir /usr/lpp/epdmcd /usr/lpp/epdm
3. Start an ftp session to your OS/390 host, and receive the file from the OS/390user where you installed Tivoli Decision Support for z/OS
Notes:
a. You need to specify the IP address/name of the OS/390 system whereTivoli Decision Support for z/OS was installed and where the tar file islocated.
b. You need to specify the TSO userid that has read access to the tar file.4. When the Linux Performance component code has been received by one Linux
node, send the tar files to all other Linux nodes where the Linux Performancecomponent is to be installed.
5. On each of the Linux nodes to which the tar files have been sent, enter thefollowing tar command to unpack the epdmLINUX tar files and create the filesin the directories tar -xvf epdmLINUX.tar
6. (Optional) After completing the previous step you can remove the tar filesusing the command rm epdmLINUX.tar. (If you need the tar files in the future,they still exist on OS/390 and can be used again).
7. Create file system or directory for log files.v The command drlcrfs is provided to create a file system with the name
/var/epdm/, in volume group rootvg. The size of the file system isdetermined by an argument used with the drlcrfs. The Linux Performancecomponent uses the file system /var/epdm/ to store work and data filesuntil they have been sent to OS/390.The drlcrfs command is also used to mount the file system using/var/epdm as the mount point.By having the /var/epdm/ directory in a separate file system, there is norisk of obtaining a “file system full” condition on file system /var (whichwould stop Linux processing).For example, to create and mount a new file system with size 50MB, enter:/usr/lpp/epdm/bin/drlcrfs 50
Confirm that the new file system has been created, by entering the followingcommand:df /var/epdm
8. The drl.cfg parameter file is distributed as /usr/lpp/epdm/etc/drl.cfg. Copythe parameter file to /etc/drl.cfg by entering cp /usr/lpp/epdm/etc/drl.cfg/etc/drl.cfg.
Capturing Linux Performance component data and transmitting toOS/390
About this task
This section describes:v The steps you must perform to set up the Linux Performance component system
to capture performance data, and to transmit the data to the OS/390 system:Step 1: Create log filesStep 3: Define the receiver of Linux Performance component dataStep 4: Customize Linux Performance component parametersStep 5: Start the drlperfd daemon (performance subcomponent)
Considering which Linux subcomponents to install
Chapter 9. Installing the UNIX and Linux Perf.comp. 111

Note: Where a step is for a specific subcomponent only, the subcomponentname is given in parentheses in the heading for the step. Otherwise, you mustcarry out the step for all the subcomponents (configuration, error, andperformance).
Step 1: Create log filesAbout this task
By including drlgather commands in the cron file, you can schedule the creationof log files, by entering the following command:/usr/lpp/epdm/bin/drlgather -c conf_day component_list
where:
conf_dayis used with the configuration component, and specifies the day on whichthe configuration log file will be created. The creation of the log file occurson (default value) the first day of each calendar month. In the followingexample, the configuration log file will be created every fifth day:-c"1 5 10 15 20 25"
component_listcan be one or more of the following:v conf (configuration subcomponent)v error (error subcomponent)v perf (performance subcomponent)
Procedure1. For AIX, edit the root cron file using the command crontab -e.
For the accounting, error, and performance subcomponents, the creation of thelog files occurs at (default value) 02.00 hours each day.To verify that the updates were successful, enter crontab -l.
2. Select the subcomponents for which you wish to gather log files.The following example shows you how to automatically schedule log files forall subcomponents:0 2 * * * /usr/lpp/epdm/bin/drlgather -c1 error perf conf
The next example shows you how to automatically schedule only the log filesfor the accounting and performance subcomponents:0 2 * * * /usr/lpp/epdm/bin/drlgather perf
(This statement can also be found in /usr/lpp/epdm/etc/drlcon)
Step 2: Define the receiver of Linux Performance componentdata
About this task
Procedure1. Insert in the home directory .netrc file, the following entries:
machine mvssystem login epdmuser passwordsecret
Considering which Linux subcomponents to install
112 Tivoli Decision Support for z/OS: Distributed Systems Performance Feature Guide and Reference

2. Change the mvssystem, epdmuser, and secret to the values corresponding to theOS/390 host user that will receive the data files. Ftp uses this file whenperforming the file transfer, each night.
Note: The value for password must be the same as the current password usedon OS/390
3. After editing the .netrc file, check that the file has private read/writepermission only, by entering the command chmod 600 .netrc.
4. Use the command ping -c1 mvssystem, to check that communication betweenthe Linux Performance component and OS/390 is possible. You can break fromthis command by typing Ctrl+C. If the ping command fails, you should add ahost definition to the file /etc/hosts, as shown in the following example:9.99.99.99 mvssystem
where '9.99.99.99' is the IP address, and 'mvssystem' is the name of thesystemOS/390.
Step 3: Customizing Linux Performance componentparameters
About this task
Edit the parameter file /etc/drl.cfg to change the default values supplied by theLinux Performance component to those for your installation. If you are using theparameter file default values, you only need to change the value of epdmHost. Allthe subcomponents use these parameter file values.
Parameter file values for all subcomponentslogPath = /var/epdmexePath = /usr/lpp/epdm/bin (Do not change)epdmHost = yourmvsepdmPrefix = EPDMLINUXminFree = 2000site = bl=10204 lr=255 rec=vb cy pri=1 sec=5maxRetries = 72retInterval = 60
ParameterDescription
logPathThe name of directory where all the data log files will be stored.
exePathThe name of the directory where all commands are.
msgCatalogThe name of the file where all messages are stored.
epdmHostHost name (TCP nodename or TCP internet address) of the OS/390 host toreceive the Linux Performance component data files.
epdmPrefixLog data set prefix, which you set according to your own requirements.
minFreeMinimum free disk space in KB on /var/epdm before running the dailydrlgather.
Considering which Linux subcomponents to install
Chapter 9. Installing the UNIX and Linux Perf.comp. 113

site OS/390 data set characteristics for the data files sent using TCP/IP FTP toOS/390.
maxRetriesWhen the Linux Performance component data files are to be automaticallytransferred to OS/390 each night, the communication might be broken forsome reason, or the OS/390 host might be temporarily unavailable. If thatis the case, the routine drlgather will reattempt the file transfer of the datafiles for a number of times given by the parameter 'maxRetries'. Using thedefault value for maxRetries, and with the retInterval set at its default of60 minutes, the file transfer retry period will, therefore, cover 3 days.
retIntervalInterval in seconds between ftp retries (default value = 30).
Note:
1. Do not change the first two parameters logPath, and exPath as they are forinternal use only.
2. You must specify the node name in the epdmHost parameter and the data setprefix in the epdmPrefix parameter. This is the name of the host and user toreceive the data via TCP/IP FTP. These names must be the same as the valuesof node name and user ID in the .netrc file.
Parameter file values for performance componentThe parameter file values used by the performance component (only), are asfollows:perfInterval = 60perfCount = 10diskInterval = 60
ParameterDescription
perfIntervalThe program drlperfd issues vmstat and iostat commands, which containthe perfInterval value as the interval parameter. The default intervalbetween samples is 60 seconds.
perfCountThe program drlperfd samples vmstat and iostat data, at the intervalvalues shown. This data is saved in the file /var/epdm/node_name.perf.dyymmdd.n, as follows:v The minimum, maximum and average values during the perfCount
intervalv The number of users and processesv The usage of paging space
The default interval between samples is 10 minutes.
diskIntervalThe program drlperfd issues the commands df and lsvg, and save filespace and volume group usage in the file /var/epdm/node_name.disk.dyymmdd. n. The default interval between samples is 60minutes.
Considering which Linux subcomponents to install
114 Tivoli Decision Support for z/OS: Distributed Systems Performance Feature Guide and Reference

Step 4: Start the drlperfd daemonAbout this task
(performance component only)
The processes that will collect performance and disk space data during the day, areinitiated by program drlperfd.
You should now:
Procedure1. Start the 4 background processes that gather performance and disk space data,
by entering the command drlactperfd.2. Enter the command drlpsperfd to display the status of the Linux Performance
component processes. The four processes that should be listed, are shown in“drlpsperfd” on page 102.
Results
Performance data will now be entered in the following files:v work files
– node_name.perf.work– node_name.disk.work
v log data files– node_name.perf.dyymmdd– node_name.disk.dyymmdd
The file node_name.drlperfd.errorlog contains possible error messages. This fileremains empty providing the drlactperfd command runs successfully.
The file node_name.drlperfd.log contains information messages which inform you,for example, of the files that have been transferred to OS/390.
Commands to use if Linux Performance component installedUse the following four commands when operating the Linux Performancecomponent on Linux.
drlpsperfdThis command displays the status of the Linux Performance component processesin Linux.drlpsperfdThe following drlperfd processes are running
USER COMMAND PID PPIDroot drlperfd 10200 1root drlperfd 11735 10200root drlvmstat 17153 11735root drliostat 19970 11735
drlactperfdUse this command to start the performance component processes in Linux. It startsthe drlperfd daemon. This daemon will create performance log files. Commanddrlactperfd can also be used to restart the drlperfd daemon.
Considering which Linux subcomponents to install
Chapter 9. Installing the UNIX and Linux Perf.comp. 115

drldeactperfdUse this command to stop the performance component processes in Linux.
drlsendIf there is a communication problem, the Linux Performance component routinesautomatically attempt to re-send the files. However, for the following reasons youmight need to manually re-send the data files to OS/390:v If Linux has been rebooted and was “down” at the time of a retry event, the
event will never be rescheduled.v If the ftp retry period has been exceeded. The ftp retry period is defined using
the parameters maxRetries and retInterval in the parameter file /etc/drl.cfg.
All data files for those days in which the data files were not sent, remain on the/var/epdm directory. After the communication problems has been corrected, thedata files for a particular day can be sent using the drlsend command. The drlsendcommand deletes the files after they have been successfully transferred. Issue thiscommand with the date parameter, as follows:drlsend yymmdd
where yymmdd can be found in the corresponding file names, in the /var/epdmdirectory.
Collecting data under Tivoli Decision Support for z/OSThis section describes how to collect data.
General collect jobAbout this task
The member DRL180.SDRLCNTL(DRLJCOLL) contains sample JCL for a general collect.
Another way to obtain the COLLECT JCL, is to:
Procedure1. Select 'Tivoli Decision Support for z/OS Administration' from the Tivoli
Decision Support for z/OS Primary Menu.2. Select '3. LOGS'.3. Select 'LINUX' from the list of logs, select the 'Utilities' pull-down, and press
Enter.4. Select '1. Collect'.5. Type your installation-specific information in this window, and press Enter.
Results
The JCL given in Figure 35 on page 108 is the general collect job.
Commands to use if Linux Performance component installed
116 Tivoli Decision Support for z/OS: Distributed Systems Performance Feature Guide and Reference

Chapter 10. Installing and configuring the Windowscomponent
This supplements the procedure in the Administration Guide and Reference forinstalling a component, with information specific to the Windows component.
The topic describes how to plan, install, and test the Windows component.
Planning the implementation processAbout this task
Before installing the Windows component, you should follow these steps to planthe implementation process:
Procedure1. Describe user tasks. Then determine what data the Windows component must
gather to help users accomplish those tasks.2. Determine which Windows subcomponents you must install to meet the user
needs.3. Determine the administration tasks you must perform for the selected
subcomponents, and make any decisions required by these tasks. These taskshelp you customize Tivoli Decision Support for z/OS and the Windowscomponent to work efficiently and effectively with your computer system.
//JOBCARD//* *//* Notes: *//* Before you submit the job: *//* - Check the Tivoli Decision Support for z/OS and *//* DB2 data set names. *//* - Check the DB2 subsystem name (default is DSN) *//* and the Tivoli Decision Support for z/OS system *//* table prefix (default is DRLSYS). *//* - Insert the correct collect statement in DRLIN *//* (as described above). *//* - Specify the name of the log data set (or GDG) in *//* DRLLOG. In this example, all existing generations *//* are to be collected for files from Linux *//* *//***************************************************************//COLLECT EXEC PGM=DRLPLC,PARM=(’SYSTEM=DB2A SYSPREFIX=DRLSYS’)//STEPLIB DD DISP=SHR,DSN=DRL180.SDRLLOAD// DD DISP=SHR,DSN=db2loadlibrary//DRLIN DD *
COLLECT LINUX;
//DRLLOG DD DISP=SHR,DSN=USER1.COLLECT.EPDMLINUX//DRLOUT DD SYSOUT=*,DCB=(RECFM=F,LRECL=80)//DRLDUMP DD SYSOUT=*,DCB=(RECFM=F,LRECL=80)/*
Figure 38. General COLLECT job
117

4. Determine (for each selected subcomponent) the tasks you must perform tocustomize the supported products to work with Tivoli Decision Support forz/OS and with the Windows component.
Results
If this is your first exercise in implementation planning, follow all these steps toensure that the Windows component's implementation is consistent. If you arereading this chaptertopic in preparation for modifying your system, you might notneed to perform all of these tasks.
Use the planning process to prepare for these main customization tasks:v Customizing Windows to generate the data required by the subcomponents you
install.v Defining environment data, which is all the information (in addition to the input
data) that the Windows component needs to create reports. Environment datacontrols the data-collection process and provides more information in thereports.
Figure 39 illustrates the process for implementing the Windows component.
┌───────────────────────────────┐ ┌───────────────────────────────┐│ Installing Tivoli Decision │ │ Planning to use the ├←─────┐│ Support for z/OS │ │ Windows component │ │└───────────────┬───────────────┘ │ (implementation and ├←──┐ │
↓ │ modifications) │ │ │┌───────────────┴───────────────┐ └─────────┬──────┬──────┬───────┘ │ ││ Installing the │ │ │ │ │ ││ Windows Component ├←───────────────┘ │ │ │ ││ (and its components) │ │ │ │ │└───────────────┬───────────────┘ │ │ │ │
│ │ │ │ ││ ┌───────────────────────────────┘ │ │ │↓ ↓ ↓ │ │
┌───────────────┴───────┴───────┐ ┌───────────────────────┴───────┐ │ ││ Administering Tivoli Decision │ │ Customizing Windows │ │ ││ Support for z/OS and the │ └───────────────────────────────┘ │ ││ Windows component │ │ │└───────────────┬───────────────┘ │ │
↓ │ │┌───────────────┴───────────────┐ │ ││ Testing the component │ │ │└───────────────┬───────────────┘ │ │
↓ │ │┌───────────────┴───────────────┐ Modification requirements │ ││ Evaluating the feature’s ├──────────────────────────────────────────┘ ││ implementation │ │└───────────────┬───────────────┘ │
↓ │┌───────────────┴───────────────┐ Maintenance requirements ││ Putting the component ├─────────────────────────────────────────────┘│ into production │└───────────────────────────────┘
Figure 39. Implementation process for the Windows component
Planning the implementation process
118 Tivoli Decision Support for z/OS: Distributed Systems Performance Feature Guide and Reference

Considering which Windows subcomponents to installYour most critical planning task is determining what information users need fromthe Windows component. For example, users may be interested only in processorinformation. Installing only those subcomponents needed to meet userrequirements ensures that the feature benefits users while it minimizes theperformance impact caused by data collection and interpretation activities.
The Windows component is divided into two subcomponents:v Windows Performancev Windows Device
Subcomponents are groups of Tivoli Decision Support for z/OS objects (forexample, predefined update definitions, data tables, and reports). If you find thatyou need reports from a subcomponent that you have not installed, you mustinstall that subcomponent and then wait until enough data is collected to createreports. However, if you install more subcomponents than you need, TivoliDecision Support for z/OS collects needless data, which takes up disk space anduses processor time.
At this point, you might find it helpful to examine the predefined reports for eachsubcomponent, by turning to Chapter 14, “Reports,” on page 151.
Installing the Windows component on your Windows nodesThis section gives you practical step-by-step information on how to install TivoliDecision Support for z/OS on your Windows nodes.
Step 1: Check Windows requirementsAbout this task
Check the following Windows requirements:v “Disk space requirements”v “Software requirements” on page 120
Disk space requirementsYou need the following approximate disk space on each Windows node:
Table 20. Disk space requirements on each Windows node
Installation taskDisk space(approximate)
Loading code in the file system, e.g., c:\tdszwin\bin: 1MB
Creating configuration file in, for example, c:\tdszwin\etc: 1MB
Creating directory for data files in, for example, c:\tdszwin\var: 10MB (see table note)
Note: The 10MB is based on the following assumptions:
v Performance information written every 5 minutes (default) resulting in about 12 x 24 x100 bytes (30K) per day.
v Device information written every 30 minutes (default) resulting in about 2 x 24 x 100bytes (5K) per day.
v Allowance for a couple of hundred days of these files plus some overhead.
Considering which Windows subcomponents to install
Chapter 10. Installing and configuring the Windows component 119

Software requirementsThe Windows component requires all of the following programs:v Microsoft Windows 2003 Server or 2008 Serverv WMI enabledv VBScript enabled
Step 2: Transfer Tivoli Decision Support for z/OS feature codeto Windows
About this task
The Windows part of the Windows component is distributed inDRLxxx.SDRLWS(DRLWIN). Download this zip file using these steps:
Procedure1. Log in to the Windows node and open a command window.2. Enter the following commands (we will assume all the files are to be stored
under c:\tdszwin although you can place them anywhere as long as you adjustpaths in later instructions: bin is for program binaries, etc for configuration andvar for data files):c:mkdir \tdszwinmkdir \tdszwin\binmkdir \tdszwin\etcmkdir \tdszwin\varcd \tdszwin\bin
3. Start an ftp session to your OS/390 host, and receive the file from the OS/390user where you installed Tivoli Decision Support for z/OS. In the followingexample, the highlighted entries show the commands you must enter. Notethat:
yourmvsis the IP address/name of the OS/390 system where Tivoli DecisionSupport for z/OS was installed and where the tar file is located.
epdmwinis the TSO userid that has read access to the tar file.
c:\tdszwin\bin> ftp yourmvsConnected to yourmvs.yourcorp.com.220-FTPSERVE at YOURMVS.SE.IBM.COM, 11:05:24 on 03/24/00220 Connection will close if idle for more than 5 minutes.Name (yourmvs:root): epdmwin331 Send password please.Password: secret230 EPDMWIN is logged on.ftp> binary200 Representation type is IMAGE.ftp> get ’drl181.sdrlws(drlwin)’ epdmwin.zip200 Port request OK.125 Sending data set DRL181.SDRLWS(DRLWIN) FIXrecfm 12810240 bytes received in 0.05 seconds (204.80 Kbytes/s)ftp> quit221 Quit command received. Goodbye.c:\tdszwin\bin>
4. On the Windows node, use Windows Explorer to unzip the contents ofepdmwin.zip into your bin directory.
Installing the Windows component on your Windows nodes
120 Tivoli Decision Support for z/OS: Distributed Systems Performance Feature Guide and Reference

5. (Optional) After completing the previous step you can remove the zip file. (Ifyou need the zip file in the future, it still exists on OS/390 and can be usedagain).
6. A sample drl.cfg parameter file is distributed as c:\tdszwin\bin\drl.cfg-sample.Copy and rename the parameter file to c:\tdszwin\etc\drl.cfg using WindowsExplorer.
Capturing Windows component data and transmitting to OS/390About this task
This section describes:v The steps you must perform to set up the Windows component system to
capture performance data, and to transmit the data to the OS/390 system:Step 1: Customize Windows node.Step 2: Set up scheduled tasks.
Step 1: Customize Windows nodeAbout this task
Edit the parameter file c:\tdszwin\etc\drl.cfg to change the default valuessupplied by the Windows component to those for your installation.
Parameter file values to changeNodeName = IBM-BOX01XmitServer = pthbox3.au.ibm.comXmitUser = drluserXmitPassword = drlpwdDrlPerfdXlat = ’drldata.perfd.n{n5,5}.d{f12,6}’
ParameterDescription
NodeNameThe unique identifier for this node (up to 16 characters).
XmitServerHost name (TCP nodename or TCP internet address) of the z/OS host toreceive the Windows component data files.
XmitUserUser name to use for transmitting to host.
XmitPasswordPassword to use for transmitting to host. This drl.cfg file should beprotected as much as practicable by the Windows operating system. Inaddition, the RACF user should be set up with only enough capabilities towrite to the required locations.
DrlPerfdXlatThe translation string used to form the host file name. The characters inthis translation string are copied as is except when one of the followingconstructs is found (X and Y are considered to be numbers).
{nX,Y} will cause characters from the NodeName to be copied to the filename. The X indicates start position (1 is the first character) and Yindicates the number of characters to copy.{fX,Y} will cause characters from the input file name to be copied to thefile name. The X indicates start position (1 is the first character) and Yindicates the number of characters to copy.
Installing the Windows component on your Windows nodes
Chapter 10. Installing and configuring the Windows component 121

So, with the node name of "IBM-PAXPRIM" and input file name of"drlperfd_20090529.txt", the translation string "'tdssrv.log.n{n5,7}.d{f12,6}'"will result in the file 'tdssrv.log.nPAXPRIM.d090529' being created on thehost. Any non-valid characters in the resulting name will be replaced with"$".
Step 2: Set up scheduled tasksAbout this task
The processes that will collect performance and disk space data during the day, areinitiated by Windows Scheduled Tasks.
The process which transmits the information to the host is also controlled byWindows Scheduled Tasks.
You can use other scheduling solutions, such as Tivoli Workload Scheduler, butthey are not covered here.
In order to set up drlperfd, you should (for Windows 2003 Server):
Procedure1. From the "Start" menu, add a scheduled task under the control panel (the
method to do this may vary depending on how your operating system is setup).
2. From the scheduled task wizard, click the "Next" button.3. Click on "Browse" and select "c:\tdszwin\bin\drlperfd.vbs", then click on the
"Open" button.4. Call the task "drlperfd", choose "Daily" then click on the "Next" button.5. Set the start time to "12:02 AM", every day, starting today then click on the
"Next" button.6. Enter your workstation password twice then click on the "Next" button.7. Check the "Open advanced properties" then click on the "Finish" button.8. Insert "wscript " (note space at end) before the current run text.9. Append "c:\tdszwin\etc\drl.cfg c:\tdszwin\var" to the end of the run text.
For example:wscript c:\tdszwin\bin\drlperfd.vbs c:\tdszwin\etc\drl.cfg c:\tdszwin\var
10. Click on the "OK" button and re-enter the password if necessary.11. Exit from the scheduled task control panel application.
Results
Set up a similar task called drlperfd_boot, the only difference being that it shouldbe scheduled to start when the computer starts.
Set up a task for drlxmit.vbs to start at 12:10AM, 12:20AM and 12:30AM.
From scheduled tasks, run the drlperfd task by right-clicking on it and selecting"Run". You should find that the control file and log file are created inc:\tdszwin\var. Once a suitable time has passed (enough to reach a 5-minuteboundary like 10:00, 10:05 or 12:35), the data file will also appear.
Installing the Windows component on your Windows nodes
122 Tivoli Decision Support for z/OS: Distributed Systems Performance Feature Guide and Reference

Installing Windows component on the z/OS systemAbout this task
When you install Windows component subcomponents, Tivoli Decision Support forz/OS will install the required log and record definitions, record procedures, andupdate definitions to Tivoli Decision Support for z/OS system tables. TivoliDecision Support for z/OS will also install the predefined tables (described inChapter 12, “Data, lookup, and control tables,” on page 133) and reports (describedin Chapter 14, “Reports,” on page 151). To install the Windows subcomponents, usethe Administration dialog.
Perform steps 1 to 4, as follows:
Procedure1. From the Tivoli Decision Support for z/OS Administration window (Figure 40),
select 2, Components and press Enter.
The Components window is displayed, (as shown in Figure 41 on page 124).
Other Utilities Help--------------------------------------------------------------------------
Tivoli Decision Support for OS/390 Administration
Select one of the following. Then press Enter.
2_ 1. System2. Components3. Logs4. Tables5. Reports
Command ===> ______________________________________________________________F1=Help F2=Split F3=Exit F9=Swap F10=Actions F12=Cancel
Figure 40. Tivoli Decision Support for z/OS Administration window
Installing the Windows component on your Windows nodes
Chapter 10. Installing and configuring the Windows component 123

2. From the Components window, select the components to install (here, theWindows component) and press F6.
3. If individual subcomponents are listed, select the desired subcomponents forinstallation.
4. The Installation Options window is displayed, (as shown in Figure 42).
5. Using the component-installation procedure in the Administration Guide andReference specify whether the component is to be installed online, or in batchmode.Batch mode installation results in less output than in online. Furthermore, foronline installation your terminal will be blocked for the duration of theinstallation. Therefore, it is recommended that you install components in batch.
Components Other Help------------------------------------------------------------------------------
Components ROW 1 TO 13 OF 47
Select one or more components. Then press Enter to Open component.
/ Components Status Date_ Network NetView FTP Component Installed 00-03-19_ Network NPM Internal Utilization Component Installed 00-03-19_ Network NV/SM Internal Utilization Component Installed 00-03-19_ Network Problem Component Installed 00-03-19_ Network RTM Response Time Component Installed 00-03-19_ Network Service Component Installed 00-03-19_ DB2 Component Installed 00-03-17_ Information/Management Component Installed 00-03-17/ Windows Component
Command ===> _________________________________________________________________F1=Help F2=Split F3=Exit F5=New F6=Install F7=BkwdF8=Fwd F9=Swap F10=Actions F12=Cancel
Figure 41. Components window
Components Other Help.-----------------------------------------------------------------------------.| ROW 1 TO 7 OF 7 || .--------------------------------------------------------------. || S| Installation Options | Enter. || | | || /| Select one of the following. Then press Enter. |Date || /| | || _| __ 1. Online | || _| 2. Batch | || _| | || _| F1=Help F2=Split F6=Objects F9=Swap F12=Cancel | || _|--------------------------------------------------------------| || _ || ***************************** BOTTOM OF DATA ****************************** || || || || || || Command ===> ______________________________________________________________ || F1=Help F2=Split F7=Bkwd F8=Fwd F9=Swap F12=Cancel |’-----------------------------------------------------------------------------’F18=Fwd F9=Swap F10=Actions F12=Cancel
Figure 42. Installation Options window
Installing the Windows component on your Windows nodes
124 Tivoli Decision Support for z/OS: Distributed Systems Performance Feature Guide and Reference
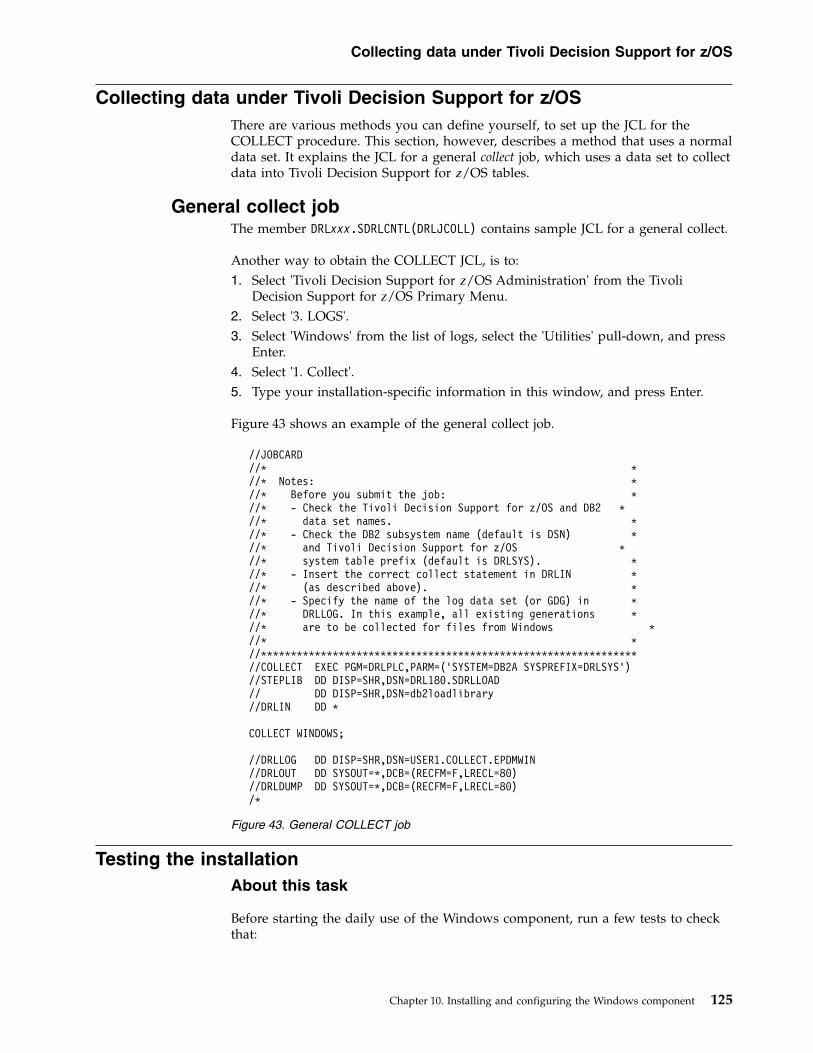
Collecting data under Tivoli Decision Support for z/OSThere are various methods you can define yourself, to set up the JCL for theCOLLECT procedure. This section, however, describes a method that uses a normaldata set. It explains the JCL for a general collect job, which uses a data set to collectdata into Tivoli Decision Support for z/OS tables.
General collect jobThe member DRLxxx.SDRLCNTL(DRLJCOLL) contains sample JCL for a general collect.
Another way to obtain the COLLECT JCL, is to:1. Select 'Tivoli Decision Support for z/OS Administration' from the Tivoli
Decision Support for z/OS Primary Menu.2. Select '3. LOGS'.3. Select 'Windows' from the list of logs, select the 'Utilities' pull-down, and press
Enter.4. Select '1. Collect'.5. Type your installation-specific information in this window, and press Enter.
Figure 43 shows an example of the general collect job.
Testing the installationAbout this task
Before starting the daily use of the Windows component, run a few tests to checkthat:
//JOBCARD//* *//* Notes: *//* Before you submit the job: *//* - Check the Tivoli Decision Support for z/OS and DB2 *//* data set names. *//* - Check the DB2 subsystem name (default is DSN) *//* and Tivoli Decision Support for z/OS *//* system table prefix (default is DRLSYS). *//* - Insert the correct collect statement in DRLIN *//* (as described above). *//* - Specify the name of the log data set (or GDG) in *//* DRLLOG. In this example, all existing generations *//* are to be collected for files from Windows *//* *//***************************************************************//COLLECT EXEC PGM=DRLPLC,PARM=(’SYSTEM=DB2A SYSPREFIX=DRLSYS’)//STEPLIB DD DISP=SHR,DSN=DRL180.SDRLLOAD// DD DISP=SHR,DSN=db2loadlibrary//DRLIN DD *
COLLECT WINDOWS;
//DRLLOG DD DISP=SHR,DSN=USER1.COLLECT.EPDMWIN//DRLOUT DD SYSOUT=*,DCB=(RECFM=F,LRECL=80)//DRLDUMP DD SYSOUT=*,DCB=(RECFM=F,LRECL=80)/*
Figure 43. General COLLECT job
Collecting data under Tivoli Decision Support for z/OS
Chapter 10. Installing and configuring the Windows component 125

Procedure1. The installation was successful.v Tivoli Decision Support for z/OS is collecting the correct datav The data is being stored correctlyv The correct data is being used for the creation of reports
2. The lookup tables contain appropriate values.
Results
Refer to the Administration Guide and Reference for detail about the steps involved intesting component installation.
Putting the feature into productionAfter you run the tests and verify that the installation is successful, you can putthe Windows component and its subcomponents into production.
Figure 44 shows the daily steps involved in using Tivoli Decision Support forz/OS.
You can run reports in batch, after setting batch parameters for each report usingthe administration dialog.
For detailed information about these steps, refer to the Administration Guide andReference.
Check that thefile transferprogram hastransferred data.
RunCOLLECTjob
Performdatabase
maintenance
Create
reports
Figure 44. Daily steps involved in using Tivoli Decision Support for z/OS
Testing the installation
126 Tivoli Decision Support for z/OS: Distributed Systems Performance Feature Guide and Reference

Part 4. Distributed Systems Performance Feature Reference(heritage)
127

128 Tivoli Decision Support for z/OS: Distributed Systems Performance Feature Guide and Reference

Chapter 11. Data flow and Tivoli Decision Support for z/OSobjects
This chaptertopic describes:v The general data flow, starting with the gathering of data at the UNIX, Linux
and Windows nodes into log files, and ending with the production of TivoliDecision Support for z/OS reports.
v The record definitions and log types used for mapping datav The data flow for these Distributed Systems Performance subcomponents,
including the names of log files, and Tivoli Decision Support for z/OS records,tables, and reports:– Accounting subcomponent– Configuration subcomponent– Error subcomponent– Performance subcomponent
Distributed Systems Performance component general data flow
The processing steps shown in Figure 45 are:
▌1▐ Agents gather data into log files
┌───────────────┐│ UNIX Node │└───────┬───────┘
↓ (1)┌───────┴───────┐│ Log files │└───────┬───────┘
│┌───────────────┼────────────────────────────────────────────┐│ │ (2) Tivoli Decision Support system ││ ↓ (z/OS) ││ ┌──────────┴──────────┐ ││ │ Log data sets │ ││ └──────────┬──────────┘ ││ │ ││ ↓ ││ ┌──────────┴──────────┐ ││ │ Log definitions │ Tivoli Decision ││ │ Record definitions │ Support for z/OS ││ └──────────┬──────────┘ "Collect" ││ │ ││ ↓ (3) ││ ┌──────────┴──────────┐ ┌─────────────────────┐ ││ │ Tables ├←──────┤ Control tables │ ││ └──────────┬──────────┘ │ Lookup tables │ ││ │ └─────────────────────┘ ││ │ │└───────────────┼────────────────────────────────────────────┘
↓ (4)┌──────────┴──────────┐ ┌─────────────────────┐│ Reports ├←──────┤ Lookup tables │└─────────────────────┘ └─────────────────────┘
Figure 45. General Distributed Systems Performance component data flow
129

▌2▐ Transmit log file to Tivoli Decision Support for z/OS.
▌3▐ Collect log data set information into Tivoli Decision Support for z/OStables.
▌4▐ Create reports.
The following sections explain these steps in more detail.1. Gather data, Step ▌1▐
The basic data used by the Distributed Systems Performance component isgathered by agents into log files. Agents either issue commands or process files,to gather the data. For each distributed component, the method of gatheringdata into log files is:
ComponentHow data is gathered
UNIX AccountingAgents process UNIX files pacct, wtmp, dtmp, qacct
UNIX ConfigurationAgents issue AIX commands lsdev, lslpp
UNIX ErrorAgents issue AIX command errpt
UNIX PerformanceAgents issue AIX commands df, lsvg, lsps, and UNIX commands iostat,vmstat
Windows PerformanceWindows Management Instrumentation (WMI)
Windows DeviceWindows Management Instrumentation (WMI)
Log files and their use in creating Tivoli Decision Support for z/OS records, aredescribed in Table 21 on page 131.
2. Transmit log file to Tivoli Decision Support for z/OS, Step ▌2▐To transmit the log file to Tivoli Decision Support for z/OS, TCP/IP is used.
3. Collect log data set information to Tivoli Decision Support for z/OS tables,Step ▌3▐In processing each record contained in the log data set, the collect procedure:a. Uses a log collector to update the Tivoli Decision Support for z/OS table
with the record. To do this, the log collector:v Uses the log definition and record definitions to update the Tivoli
Decision Support for z/OS table with the reformatted record.v Uses an update definition to decide which reformatted record fields are to
be included in which Tivoli Decision Support for z/OS table, includingfurther summarizing into other tables (for example, updating the monthlytable XPERF_DISK_M from the information used for updating the dailytable XPERF_DISK_D).
v Takes information from control tables (for example the UNIX Performancecomponent may determine the period in which the measurements weremade by looking up the day type information in the SPECIAL_DAY orDAY_OF_WEEK tables).
Distributed Systems Performance component general data flow
130 Tivoli Decision Support for z/OS: Distributed Systems Performance Feature Guide and Reference

v Uses lookup tables (which contain user-defined information that defines anorganization's operating environment) to add user-defined data to theTivoli Decision Support for z/OS table record.
A description of the collect procedure is provided in the Language Guide andReference, SH19-6817.A description of the use of control tables is provided in the Administration Guideand Reference, SH19-6816.
4. Create reports, Step ▌4▐A description of how to create new reports is provided in the Guide toReporting.The reports that can be created when using the UNIX Performance componentare described in Chapter 14, “Reports,” on page 151.
Description of log files, record and log definitionsTable 21 gives for each Distributed Systems Performance subcomponent, the nodelog file (and record sub-types, if any), the Tivoli Decision Support for z/OS recorddefinition, and the Tivoli Decision Support for z/OS log definition.
Table 21. Record and log definitions used by the Distributed Systems Performancecomponent
Performancecomponentsubcomponent
Log file (and recordsub-types, whenused)
Tivoli Decision Supportfor z/OS record definitionand description (see tablenote 2)
Tivoli DecisionSupport for z/OSlog definition
UNIXAccounting
PACCT (commandaccounting)
XACCT_COMMAND(command accounting data)
UNIX
UNIXAccounting
WTMP (connecttime accounting)
XACCT_CONNECT (useraccounting data)
UNIX
UNIXAccounting
DTMP (diskaccounting)
XACCT_DISK (disk usagedata)
UNIX
UNIXAccounting
QACCT (printaccounting)
XACCT_PRINT (printaccounting data)
UNIX
UNIXConfiguration
CONF (A,D,S)(configurationhardware)
XCONFIG_HW(configuration of hardwaredata)
UNIX
UNIXConfiguration
CONF (H,I,L)(configurationsoftware)
XCONFIG_SW(configuration of softwaredata)
UNIX
UNIX Error ERRPT (error) XERROR (error log data) UNIX
UNIXPerformance
PERF (VM)(processorperformance)
XPERF_CPU (processorusage data)
UNIX
UNIXPerformance
DISK (diskperformance)
XPERF_DISK (disk spaceusage data)
UNIX
UNIXPerformance
PERF (IO) (disk I/Operformance)
XPERF_DISKIO (disk I/Odata)
UNIX
UNIXPerformance
PERF (PS) (pagingperformance)
XPERF_PAGING (pagingspace usage data)
UNIX
WindowsPerformance
NA WINDOWS_PERF(Windows Performance)
WINDOWS_LOG
Distributed Systems Performance component general data flow
Chapter 11. Data and Objects 131

Table 21. Record and log definitions used by the Distributed Systems Performancecomponent (continued)
Performancecomponentsubcomponent
Log file (and recordsub-types, whenused)
Tivoli Decision Supportfor z/OS record definitionand description (see tablenote 2)
Tivoli DecisionSupport for z/OSlog definition
Windows Device NA WINDOWS_DISK(Windows Disk)
WINDOWS_LOG
Note:
v Log file names also contain the name of the UNIX node, and the date on which the logfile was created.
v The fields contained in each Tivoli Decision Support for z/OS record definition aredescribed in Chapter 15, “Log record definitions,” on page 201. You can also displaythese fields, when you do the following:
1. Select 2 (Tivoli Decision Support for z/OS Administration), from the Tivoli DecisionSupport for z/OS Primary Menu.
2. Select 3 (Logs).
3. Select the log definition UNIX.
4. Select the record definition you require, and the fields will be displayed.
The Distributed Systems Performance component does not use Tivoli DecisionSupport for z/OS record procedures.
Distributed Systems Performance component general data flow
132 Tivoli Decision Support for z/OS: Distributed Systems Performance Feature Guide and Reference
Chapter 12. Data, lookup, and control tables
The Tivoli Decision Support for z/OS database is a collection of DB2 tables, whereeach table contains a fixed number of columns. The number of rows in each tablevaries with time, because of rows added by the collect function and because ofdatabase maintenance.
This topic describes:v The format that is used for defining Distributed Systems Performance
component table names and viewsv The layout of the tablesv The tables used by the UNIX accounting subcomponentv The table used by the UNIX configuration subcomponentv The tables used by the UNIX error subcomponentv The tables used by the UNIX performance subcomponentv The tables used by the Windows componentv The lookup tables used by some of the subcomponents
Note: For descriptions of common data tables used by the Distributed SystemsPerformance component and other Tivoli Decision Support for z/OS features, referto the Administration Guide and Reference, SH19-6816.
Naming standard for tablesThe names of the Distributed Systems Performance component tables use thisformat:
Xsubcomponent_content_suffix or WIN_PERF_subcomponent_suffix
where:v subcomponent identifies the subcomponent to which the table belongs (for
example, ACCT for the accounting subcomponent).v content is a description (for example, XACCT_COMMAND for the accounting
subcomponent command statistics).v suffix indicates the summarization level of the data in the table (for example,
XACCT_COMMAND_D for command statistics summarized by day). Tablenames for the configuration subcomponent do not contain suffixes.A table name can have these summarization-level suffixes:_H The table holds data summarized by hour (hourly data)._D The table holds data summarized by day (daily data)._M The table holds data summarized by month (monthly data).Lookup tables and control tables do not have a suffix; control tables also do nothave a prefix.
The names of Distributed Systems Performance component views use the formatconsisting of the table name from which the view is taken, followed by a V. Forexample, the view XACCT_DISK_MV is taken from the table XACCT_DISK_M.
133

Table descriptionsEach table description includes information about the table, a description of eachof the key columns, and a description of each of the data columns.v Key columns are marked with a “K”. They are sorted in the sequence they
appear in the table.v Data columns follow the last key column and are sorted in alphabetical order
with the underscore ignored.
The descriptions of most key columns and data columns contain references to thefields from which they are derived in the record (for example, “From AC_UID”).For an explanation of such fields, refer to the applicable product documentation.
For each subcomponent, the tables appear in alphabetical order, with underscoresand suffixes ignored.
Tables with similar contents (that is, tables with the same name but with differentsuffixes) are described under one heading. For example, the heading“XACCT_COMMAND_D, _M” covers two similar tables: XACCT_COMMAND_Dand XACCT_COMMAND_M. Except for the DATE column, the contents of thesetables are identical. Differences that exist in the contents of similar tables areexplained in the column descriptions.
Tables in the UNIX accounting subcomponentThis section describes the accounting subcomponent tables:v “XACCT_COMMAND_D, _M.”v “XACCT_DISK_D, _M” on page 135.v “XACCT_PRINT_D, _M” on page 136.v “XACCT_CONNECT_D, _M” on page 136.v “XACCT_DISK_MV” on page 137.
XACCT_COMMAND_D, _MThese tables provide daily and monthly statistics on UNIX commands, andresource consumption. They contain command accounting data from UNIX recordswith record type 'PACCT'.
The default retention periods are:30 days for XACCT_COMMAND_D765 days for XACCT_COMMAND_M
Column name Data type Description
DATE K DATE Date when the records were written. ForXACCT_COMMAND_M, this is the first day of the month. FromDTE.
NODE_NAME K CHAR(16) Node name. From NODE_NAME.
PERIOD_NAME K CHAR(8) Name of the period. This is derived using fields NODE_NAME,DTE and TME from the record as parameters in the PERIODfunction.
USER_GROUP K CHAR(8) Group name. From AC_GID.
Table descriptions
134 Tivoli Decision Support for z/OS: Distributed Systems Performance Feature Guide and Reference

Column name Data type Description
NODE_GROUP K CHAR(16) Node group. From ACCOUNTING_GROUP in theX_NODE_NAME lookup table. This is derived using fieldNODE_NAME from the record as key. If no match is found, thiscolumn is set to '?'.
USER_NAME K CHAR(8) User name. From AC_UID.
TTY K CHAR(8) Control typewriter. From AC_TTY.
COMMAND K CHAR(12) Command name. From AC_COMM.
COMMANDS INTEGER Total number of commands. This is the count of records.
ELAPSED_SEC FLOAT Total elapsed time, in seconds. Calculated as the sum ofAC_ETIME/64.
IO_CHARS INTEGER Total characters transferred. This is the sum of AC_IO.
MEMORY_BYTES FLOAT Total memory usage, in bytes. This value should be divided byCOMMANDS to get the average memory usage. This is the sumof AC_MEM.
MEMORY_KB_SEC FLOAT Total memory usage, in kilobyte-seconds. Calculated as the sumof (AC_MEM/1024)*(AC_ETIME/64).
RW_BLOCKS INTEGER Total blocks read/written. This is the sum of AC_RW.
SYSTEM_SEC FLOAT Total system time, in seconds. Calculated as the sum ofAC_STIME/64.
USER_SEC FLOAT Total user time, in seconds. Calculated as the sum ofAC_UTIME/64.
XACCT_DISK_D, _MThese tables provide daily and monthly statistics on UNIX disk usage. Theycontain disk accounting data from UNIX records with record type 'DTMP'.
The default retention periods are:30 days for XACCT_DISK_D765 days for XACCT_DISK_M
Column name Data type Description
DATE K DATE Date when the records were written. For XACCT_DISK_M,this is the first day of the month. From DTE.
NODE_NAME K CHAR(16) Node name. From NODE_NAME.
USER_NAME K CHAR(8) User name. From USER_NAME.
NODE_GROUP K CHAR(16) Node group. From ACCOUNTING_GROUP in theX_NODE_NAME lookup table. This is derived using fieldNODE_NAME from the record as key. If no match is found,this column is set to '?'.
DISK_BLOCKS_AVG FLOAT Average number of disk blocks. This is the average ofDISK_BLOCKS over RECORDS_COLLECTED.
DISK_BLOCKS_SUM FLOAT Total number of disk blocks. This is the sum ofDISK_BLOCKS. Before using this column, divide it by thevalue in the RECORDS_COLLECTED column.
RECORDS_COLLECTED INTEGER Number of records. This is the count of records.
Tables in the UNIX accounting subcomponent
Chapter 12. Data, lookup, and control tables 135

XACCT_PRINT_D, _MThese tables provide daily and monthly statistics on UNIX printing. They containprint accounting data from UNIX records with record type 'QACCT'.
The default retention periods are:30 days for XACCT_PRINT_D765 days for XACCT_PRINT_M
Column name Data type Description
DATE K DATE Date when the records were written. For XACCT_PRINT_M, this isthe first day of the month. From DTE.
NODE_NAME K CHAR(16) Node name. From NODE_NAME.
PERIOD_NAME K CHAR(8) Name of the period. This is derived using fields NODE_NAME, DTEand TME from the record as parameters in the PERIOD function.
USER_NAME K CHAR(8) User name. From the first word of PR_USER.
PRINT_QUEUE K CHAR(8) Print queue name. From PRINT_QUEUE.
PRINT_TYPE K CHAR(8) Print queue type. From PRINT_TYPE in the XACCT_PRINT_TYPElookup table. This is derived using field PRINT_QUEUE from therecord as key. If no match is found, this column is set to the value infield PRINT_QUEUE.
NODE_GROUP K CHAR(16) Node group. From ACCOUNTING_GROUP in the X_NODE_NAMElookup table. This is derived using field NODE_NAME from therecord as key. If no match is found, this column is set to '?'.
REQUEST_NODE K CHAR(32) Node name of requesting node. From the second word of PR_USER.If no value is found the printout is local and this column is set toNODE_NAME.
PAGES INTEGER Number of pages. This is the sum of PAGES.
PRINTOUTS INTEGER Number of printouts. This is the count of records.
XACCT_CONNECT_D, _MThese tables provide daily and monthly statistics on UNIX users and theirconnections. They contain connect time accounting data from UNIX records withrecord type 'WTMP'.
The default retention periods are:30 days for XACCT_CONNECT_D765 days for XACCT_CONNECT_M
Column name Data type Description
DATE K DATE Date when the records were written. For XACCT_CONNECT_M, this isthe first day of the month.
NODE_NAME K CHAR(16) Node name. From NODE_NAME.
PERIOD_NAME K CHAR(8) Name of the period. This is derived using fields NODE_NAME, DTEand TME from the record as parameters in the PERIOD function.
USER_NAME K CHAR(8) User login name. From UT_USER.
CONNECT_TYPE K CHAR(2) Connect type code. From UT_TYPE.
CONNECTS INTEGER Total number of connections. This is the count of records.
Tables in the UNIX accounting subcomponent
136 Tivoli Decision Support for z/OS: Distributed Systems Performance Feature Guide and Reference

XACCT_DISK_MVThis view provides monthly UNIX disk accounting statistics for the 'root' user. It isbased on the XACCT_DISK_M table.
Column name Data type Description
DATE DATE Date when the record was written. From DTE. This is the dateof the first day of the month.
NODE_NAME CHAR(16) Node name. From NODE_NAME.
RECORDS_COLLECTED INTEGER Number of records. This is the count of records.
Tables in the UNIX configuration subcomponentThis section describes the configuration subcomponent tables:v XCONFIG_HWv XCONFIG_SW
XCONFIG_HWThis table provides AIX hardware configuration data. It contains hardwareconfiguration data from AIX records with record type 'CONF' and subtype 'A', 'D'or 'S'.
The default retention period for this table is 765 days.
Column name Data type Description
DATE K DATE Date when the record was written. From DTE.
TIME K TIME Time when the record was written. From TME.
NODE_NAME K CHAR(16) Node name. From NODE_NAME.
DEVICE_CLASS K CHAR(16) Device class. From DEVICE_CLASS.
DEVICE_SUBCLASS K CHAR(16) Device subclass. From DEVICE_SUBC.
DEVICE_NAME K CHAR(16) Device name. From DEVICE_NAME.
DEVICE_TYPE K CHAR(16) Device type. From DEVICE_TYPE.
STATUS K CHAR(2) Device status. From RECORD_SUBTYPE.
XCONFIG_SWThis table provides AIX software configuration data. It contains softwareconfiguration data from AIX records with record type 'CONF' and subtype 'H', 'I'or 'L'.
The default retention period for this table is 765 days.
Column name Data type Description
DATE K DATE Date when the record was written. From DTE.
TIME K TIME Time when the record was written. From TME.
NODE_NAME K CHAR(16) Node name. From NODE_NAME.
SOFTWARE_OBJECT K CHAR(32) Software object name. From FILE_NAME.
PATH K CHAR(32) Path name for object. From FILE_NAME.
DESCRIPTION VARCHAR(80) Product description. From FILE_NAME.
Tables in the UNIX accounting subcomponent
Chapter 12. Data, lookup, and control tables 137

Column name Data type Description
FEATURE CHAR(4) Feature ID. From FEATURE_ID.
INSTALL_DATE CHAR(8) Product installation date. From INST_DATE.
INSTALL_STATUS CHAR(10) Product installation status. From STATUS.
PRODUCT_ID CHAR(10) Product ID. From PRODUCT_ID.
PRODUCT_NAME CHAR(20) Product name. From PRODUCT_NAME.
PRODUCT_STATE CHAR(12) Product state. From STATE.
RELEASE CHAR(15) Product release number. From RELEASE.
Tables in the UNIX error subcomponentThis section describes the error subcomponent table.
XERROR_D, _MThese tables provide daily and monthly statistics on AIX error log. They containerror data from AIX records with record type 'ERRPT'.
The default retention periods are:30 days for XERROR_D765 days for XERROR_M
Column name Data type Description
DATE K DATE Date when the error occurred. From DTE. For XERROR_M, thisis the first day of the month.
NODE_NAME K CHAR(16) Node name. From NODE_NAME.
PERIOD_NAME K CHAR(8) Name of the period. This is derived using fieldsNODE_NAME, DTE and TME from the record as parameters inthe PERIOD function.
ERROR_ID K CHAR(8) Error identification. From ERROR_ID.
ERROR_TYPE K CHAR(1) Error type. From ERROR_TYPE.
ERROR_CLASS K CHAR(1) Error class. From ERROR_CLASS.
RESOURCE_NAME K CHAR(14) Resource name. From RESOURCE_NAME.
DESCRIPTION VARCHAR(40) Error description. From DESCRIPTION.
ERRORS INTEGER Number of errors. This is the count of records.
Tables in the UNIX performance subcomponentThis section describes the performance subcomponent tables:v “XPERF_CPU_H, _D, _M” on page 139v “XPERF_DISK_D, _M” on page 140v “XPERF_DISKIO_H, _D, _M” on page 140v “XPERF_PAGING_H, _D, _M” on page 141v “XPERF_PS_INFO” on page 142v “XPERF_VM_INFO” on page 142v “WIN_PERF_DD_H, _D, _M” on page 143v “WIN_PERF_PU_H, _D, _M” on page 143
Tables in the configuration subcomponent
138 Tivoli Decision Support for z/OS: Distributed Systems Performance Feature Guide and Reference

XPERF_CPU_H, _D, _MThese tables provide hourly, daily, and monthly statistics on UNIX utilization. Theycontain CPU and memory usage, paging rate and number of users and processesfrom UNIX records with record type 'PERF' and subtype 'VM'.
The default retention periods are:7 days for XPERF_CPU_H30 days for XPERF_CPU_D765 days for XPERF_CPU_M
Column name Data type Description
DATE K DATE Date when the records were written. For XPERF_CPU_M, thisis the first day of the month. From DTE.
TIME K TIME Time (rounded down to the nearest hour) when the recordwas written. From TME. This field is present only inXPERF_CPU_H.
NODE_NAME K CHAR(16) Node name. From NODE_NAME.
PERIOD_NAME K CHAR(8) Name of the period. This is derived using fieldsNODE_NAME, DTE and TME from the record as parametersin the PERIOD function.
CPU_USAGE_PCT_AVG FLOAT Average CPU usage, in percent. This is the average ofCPU_AVG.
CPU_USAGE_PCT_MAX INTEGER Maximum CPU usage, in percent. This is the maximum ofCPU_MAX.
CPU_USAGE_PCT_MIN INTEGER Minimum CPU usage, in percent. This is the minimum ofCPU_MIN.
MEASURED_SEC INTEGER Total measured time, in seconds. This is the sum ofINTERVAL*60.
MEM_FREE_PAGES_AVG FLOAT Average number of free pages. This is the average ofMEMORY_AVG.
MEM_FREE_PAGES_MAX INTEGER Maximum number of free pages. This is the maximum ofMEMORY_MAX.
MEM_FREE_PAGES_MIN INTEGER Minimum number of free pages. This is the minimum ofMEMORY_MIN.
PAGING_RATE_AVG FLOAT Average number of pages paged IN/OUT per second. This isthe average of PAGING_AVG.
PAGING_RATE_MAX INTEGER Maximum number of pages paged IN/OUT per second. Thisis the maximum of PAGING_MAX.
PAGING_RATE_MIN INTEGER Minimum number of pages paged IN/OUT per second. Thisis the minimum of PAGING_MIN.
PROCESSES_AVG FLOAT Average number of processes. This is the average ofPROCESSES.
PROCESSES_MAX INTEGER Maximum number of processes. This is the maximum ofPROCESSES.
PROCESSES_MIN INTEGER Minimum number of processes. This is the minimum ofPROCESSES.
RECORDS_COLLECTED INTEGER Total number of records. This is the count of records.
USERS_AVG FLOAT Average number of users. This is the average of USERS.
USERS_MAX INTEGER Maximum number of users. This is the maximum of USERS.
USERS_MIN INTEGER Minimum number of users. This is the minimum of USERS.
Tables in the performance subcomponent
Chapter 12. Data, lookup, and control tables 139

XPERF_DISK_D, _MThese tables provide daily and monthly statistics on AIX disk usage. They containdisk performance data from AIX records with record type 'DISK' and subtype 'FS'or 'VG'.
The default retention periods are:30 days for XPERF_DISK_D765 days for XPERF_DISK_M
Column name Data type Description
DATE K DATE Date when the records were written. For XPERF_DISK_M, thisis the first day of the month. From DTE.
NODE_NAME K CHAR(16) Node name. From NODE_NAME.
PERIOD_NAME K CHAR(8) Name of the period. This is derived using fieldsNODE_NAME, DTE and TME from the record as parametersin the PERIOD function.
SPACE_TYPE K CHAR(2) Space type, FS or VG. From RECORD_SUBTYPE.
VOLUME K CHAR(16) Volume. From FILE_SYSTEM for space type FS and fromVOLUME_GROUP for space type VG.
FILE_SYSTEM K CHAR(16) File system. From FILE_SYSTEM for space type FS and set toblanks for space type VG.
RECORDS_COLLECTED INTEGER Number of samples. This is the count of records.
SPACE_FREE_MB FLOAT Free space, in MB, accumulated for all samples. This is thesum of FREE_SPACE_MB for space type VG and calculated asthe sum of FREE_SPACE_KB/1024.0 for space type FS. Thisvalue should be divided by RECORDS_COLLECTED to get theaverage free space.
SPACE_SIZE_MB FLOAT Total size of space, in MB, accumulated for all samples. This isthe sum of TOTAL_SPACE_MB for space type VG andcalculated as the sum of TOTAL_SPACE_KB/1024.0 for spacetype FS. Divide this value by RECORDS_COLLECTED to getthe average value.
SPACE_USED_PCT FLOAT Used space, in percent, accumulated for all samples. Calculatedas the sum of 100*USED_SPACE_MB/TOTAL_SPACE_MBspace type VG and as the sum of USED_SPACE_PCT for spacetype FS. Divide this value by RECORDS_COLLECTED to getthe average value.
XPERF_DISKIO_H, _D, _MThese tables provide hourly, daily, and monthly statistics on UNIX disk I/O. Theycontain disk I/O performance data from UNIX records with record type 'PERF'and subtype 'IO'.
The default retention periods are:7 days for XPERF_DISKIO_H30 days for XPERF_DISKIO_D765 days for XPERF_DISKIO_M
Tables in the performance subcomponent
140 Tivoli Decision Support for z/OS: Distributed Systems Performance Feature Guide and Reference

Column name Data type Description
DATE K DATE Date when the records were written. For XPERF_DISKIO_M,this is the first day of the month. From DTE.
TIME K TIME Time (rounded down to the nearest hour) when the record waswritten. From TME. This field is present only forXPERF_DISKIO_H.
NODE_NAME K CHAR(16) Node name. From NODE_NAME.
PERIOD_NAME K CHAR(8) Name of the period. This is derived using fieldsNODE_NAME, DTE and TME from the record as parametersin the PERIOD function.
DISK K CHAR(10) Physical disk name. From DISK.
DISK_BUSY_PCT_AVG FLOAT Average disk busy, in percent. This is the average of BUSY.
DISK_BUSY_PCT_MAX INTEGER Maximum disk busy, in percent. This is the maximum ofBUSY.
MEASURED_SEC INTEGER Total measurement time, in seconds. Calculated as the sum ofINTERVAL*60.
READ_KB_TOTAL INTEGER Amount of data read, in kilobytes. This is the sum ofTOTREAD.
READ_MAXRATE FLOAT Maximum amount of data read, in kilobytes per second.Calculated as the maximum of TOTREAD/(INTERVAL*60.0).
RECORDS_COLLECTED INTEGER Number of records. This is the count of records.
WRITE_KB_TOTAL INTEGER Amount of data written, in kilobytes. This is the sum ofTOTWRITE.
WRITE_MAXRATE FLOAT Maximum amount of data written, in kilobytes per second.Calculated as the maximum of TOTWRITE/(INTERVAL*60.0).
RW_KB_TOTAL FLOAT Amount of data written, in kilobytes. Calculated as the sum ofTOTRW.
RW_MAXRATE INTEGER Maximum amount of data written, in kilobytes per second.Calculated as the sum of TOTRW/(INTERVAL*60.0).
XPERF_PAGING_H, _D, _MThese tables provide hourly, daily, and monthly statistics on UNIX page space.They contain page space performance data from UNIX records with record type'PERF' and subtype 'PS'.
The default retention periods are:7 days for XPERF_PAGING_H30 days for XPERF_PAGING_D765 days for XPERF_PAGING_M
Column name Data type Description
DATE K DATE Date when the records were written. For XPERF_PAGING_M,this is the first day of the month. From DTE.
TIME K TIME Time (rounded down to the nearest hour) when the recordwas written. From TME. This field is present only forXPERF_PAGING_H.
NODE_NAME K CHAR(16) Node name. From NODE_NAME
Tables in the performance subcomponent
Chapter 12. Data, lookup, and control tables 141
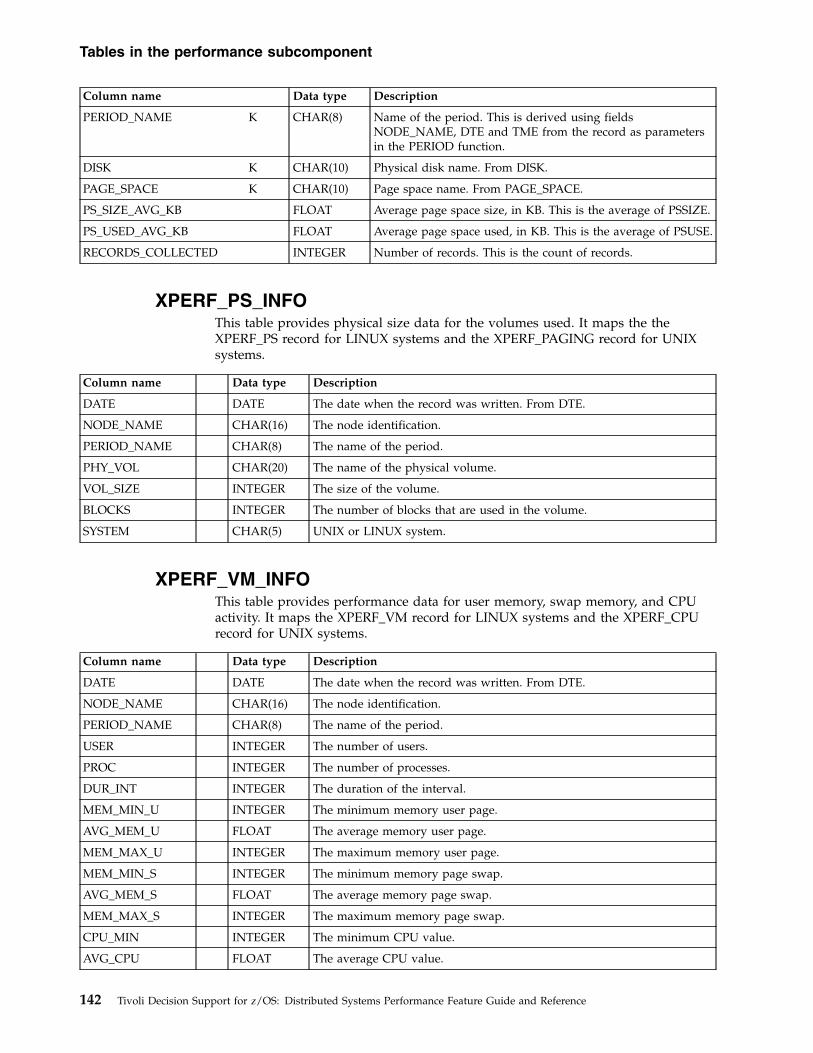
Column name Data type Description
PERIOD_NAME K CHAR(8) Name of the period. This is derived using fieldsNODE_NAME, DTE and TME from the record as parametersin the PERIOD function.
DISK K CHAR(10) Physical disk name. From DISK.
PAGE_SPACE K CHAR(10) Page space name. From PAGE_SPACE.
PS_SIZE_AVG_KB FLOAT Average page space size, in KB. This is the average of PSSIZE.
PS_USED_AVG_KB FLOAT Average page space used, in KB. This is the average of PSUSE.
RECORDS_COLLECTED INTEGER Number of records. This is the count of records.
XPERF_PS_INFOThis table provides physical size data for the volumes used. It maps the theXPERF_PS record for LINUX systems and the XPERF_PAGING record for UNIXsystems.
Column name Data type Description
DATE DATE The date when the record was written. From DTE.
NODE_NAME CHAR(16) The node identification.
PERIOD_NAME CHAR(8) The name of the period.
PHY_VOL CHAR(20) The name of the physical volume.
VOL_SIZE INTEGER The size of the volume.
BLOCKS INTEGER The number of blocks that are used in the volume.
SYSTEM CHAR(5) UNIX or LINUX system.
XPERF_VM_INFOThis table provides performance data for user memory, swap memory, and CPUactivity. It maps the XPERF_VM record for LINUX systems and the XPERF_CPUrecord for UNIX systems.
Column name Data type Description
DATE DATE The date when the record was written. From DTE.
NODE_NAME CHAR(16) The node identification.
PERIOD_NAME CHAR(8) The name of the period.
USER INTEGER The number of users.
PROC INTEGER The number of processes.
DUR_INT INTEGER The duration of the interval.
MEM_MIN_U INTEGER The minimum memory user page.
AVG_MEM_U FLOAT The average memory user page.
MEM_MAX_U INTEGER The maximum memory user page.
MEM_MIN_S INTEGER The minimum memory page swap.
AVG_MEM_S FLOAT The average memory page swap.
MEM_MAX_S INTEGER The maximum memory page swap.
CPU_MIN INTEGER The minimum CPU value.
AVG_CPU FLOAT The average CPU value.
Tables in the performance subcomponent
142 Tivoli Decision Support for z/OS: Distributed Systems Performance Feature Guide and Reference

Column name Data type Description
CPU_MAX INTEGER The maximum CPU value.
SYSTEM CHAR(5) UNIX or LINUX system.
Tables in the Windows component
WIN_PERF_DD_H, _D, _MThese tables holds hourly, daily and monthly data for the disk device records.
The default retention periods are:10 days for WIN_PERF_DD_H30 days for WIN_PERF_DD_D765 days for WIN_PERF_DD_M
Column Key Datatype Description
DATE K DATE The date of the record. For the _M table, datesare stored as the first day of the month.
TIME K TIME The time of the record. Set to the start of thehour for table _H. This column does not exist inthe _D or _M tables.
NODE_NAME K CHAR(16) The node name of the machine.
DEVICE_NAME K CHAR(8) The device name for the device.
SAMPLES INTEGER Count of the records consolidated into a tablerow. Used for working out averages.
TOTAL_DEVICE_SIZE FLOAT Device size at the end of the period.
FREE_SPACE_AVG FLOAT Averages the free space on the device, based onSAMPLES.
FREE_SPACE_MIN FLOAT The minimum free space available.
FREE_SPACE_MAX FLOAT The maximum free space available.
PERCENT_FREE_AVG FLOAT Averages the free space percentage on thedevice, based on SAMPLES.
PERCENT_FREE_MIN FLOAT The minimum free space percentage
PERCENT_FREE_MAX FLOAT The maximum free space percentage.
WIN_PERF_PU_H, _D, _MThis table holds hourly, daily and monthly data for the performance usage records.
The default retention periods are:7 days for WIN_PERF_PU_H35 days for WIN_PERF_PU_D366 days for WIN_PERF_PU_M
Column Key Datatype Description
DATE K DATE The date of the record. For the _M table, datesare forced back to the first day of the month.
TIME K TIME The time of the record. Set to the start of thehour for table _H. This column does not exist inthe _D or _M tables.
Tables in the performance subcomponent
Chapter 12. Data, lookup, and control tables 143
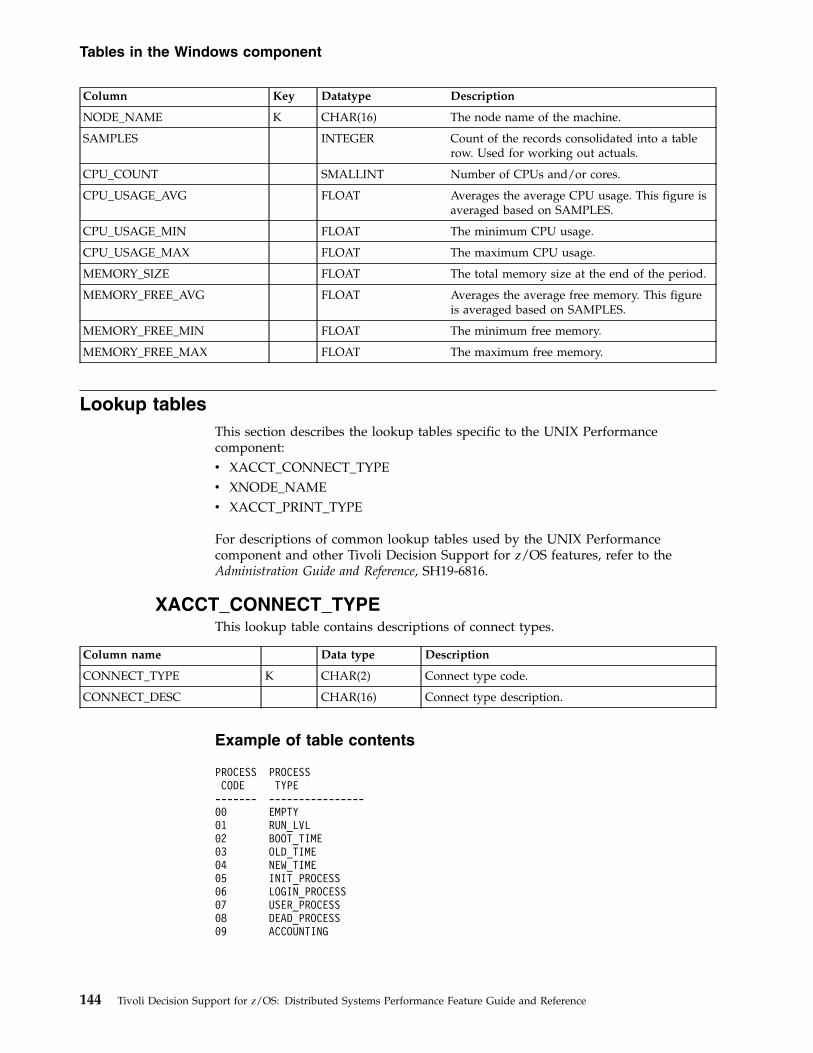
Column Key Datatype Description
NODE_NAME K CHAR(16) The node name of the machine.
SAMPLES INTEGER Count of the records consolidated into a tablerow. Used for working out actuals.
CPU_COUNT SMALLINT Number of CPUs and/or cores.
CPU_USAGE_AVG FLOAT Averages the average CPU usage. This figure isaveraged based on SAMPLES.
CPU_USAGE_MIN FLOAT The minimum CPU usage.
CPU_USAGE_MAX FLOAT The maximum CPU usage.
MEMORY_SIZE FLOAT The total memory size at the end of the period.
MEMORY_FREE_AVG FLOAT Averages the average free memory. This figureis averaged based on SAMPLES.
MEMORY_FREE_MIN FLOAT The minimum free memory.
MEMORY_FREE_MAX FLOAT The maximum free memory.
Lookup tablesThis section describes the lookup tables specific to the UNIX Performancecomponent:v XACCT_CONNECT_TYPEv XNODE_NAMEv XACCT_PRINT_TYPE
For descriptions of common lookup tables used by the UNIX Performancecomponent and other Tivoli Decision Support for z/OS features, refer to theAdministration Guide and Reference, SH19-6816.
XACCT_CONNECT_TYPEThis lookup table contains descriptions of connect types.
Column name Data type Description
CONNECT_TYPE K CHAR(2) Connect type code.
CONNECT_DESC CHAR(16) Connect type description.
Example of table contents
PROCESS PROCESSCODE TYPE------- ----------------00 EMPTY01 RUN_LVL02 BOOT_TIME03 OLD_TIME04 NEW_TIME05 INIT_PROCESS06 LOGIN_PROCESS07 USER_PROCESS08 DEAD_PROCESS09 ACCOUNTING
Tables in the Windows component
144 Tivoli Decision Support for z/OS: Distributed Systems Performance Feature Guide and Reference
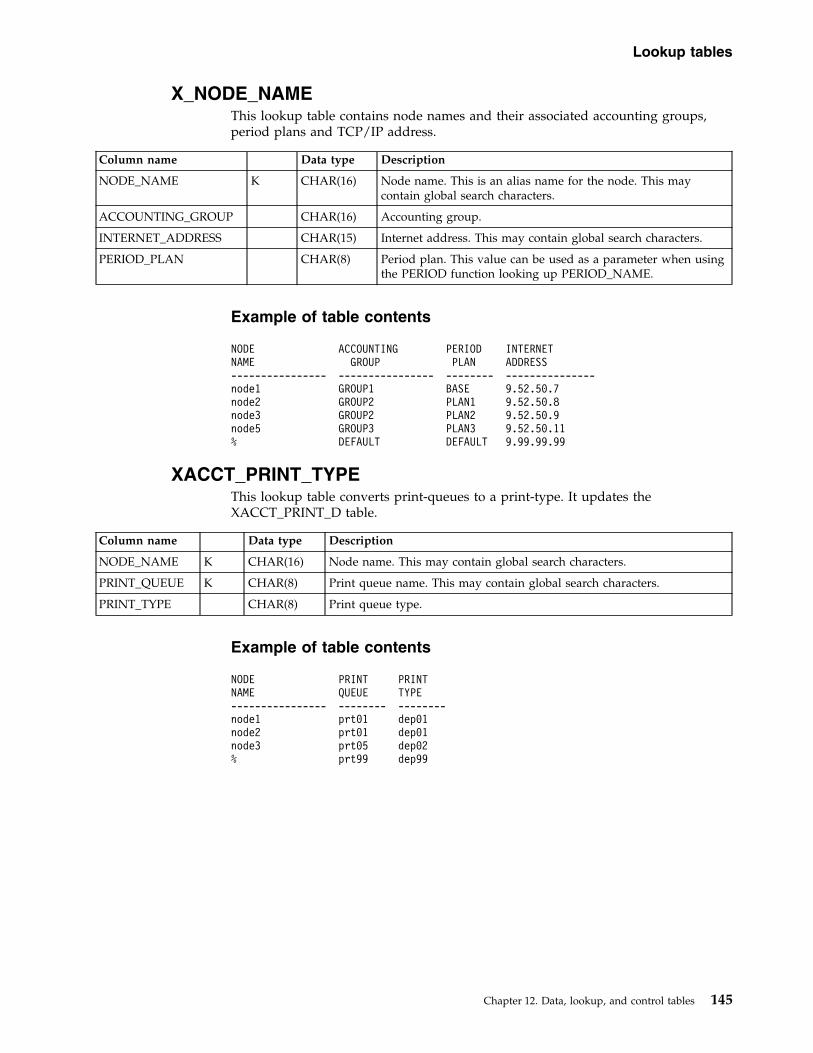
X_NODE_NAMEThis lookup table contains node names and their associated accounting groups,period plans and TCP/IP address.
Column name Data type Description
NODE_NAME K CHAR(16) Node name. This is an alias name for the node. This maycontain global search characters.
ACCOUNTING_GROUP CHAR(16) Accounting group.
INTERNET_ADDRESS CHAR(15) Internet address. This may contain global search characters.
PERIOD_PLAN CHAR(8) Period plan. This value can be used as a parameter when usingthe PERIOD function looking up PERIOD_NAME.
Example of table contents
NODE ACCOUNTING PERIOD INTERNETNAME GROUP PLAN ADDRESS---------------- ---------------- -------- ---------------node1 GROUP1 BASE 9.52.50.7node2 GROUP2 PLAN1 9.52.50.8node3 GROUP2 PLAN2 9.52.50.9node5 GROUP3 PLAN3 9.52.50.11% DEFAULT DEFAULT 9.99.99.99
XACCT_PRINT_TYPEThis lookup table converts print-queues to a print-type. It updates theXACCT_PRINT_D table.
Column name Data type Description
NODE_NAME K CHAR(16) Node name. This may contain global search characters.
PRINT_QUEUE K CHAR(8) Print queue name. This may contain global search characters.
PRINT_TYPE CHAR(8) Print queue type.
Example of table contents
NODE PRINT PRINTNAME QUEUE TYPE---------------- -------- --------node1 prt01 dep01node2 prt01 dep01node3 prt05 dep02% prt99 dep99
Lookup tables
Chapter 12. Data, lookup, and control tables 145

Lookup tables
146 Tivoli Decision Support for z/OS: Distributed Systems Performance Feature Guide and Reference

Chapter 13. Linux data tables
This chapter describes the data tables used by the UNIX Performance component.
XCONF_HARDWAREThis table provides hardware configuration data for the devices used. It maps theDRLTXCNF record.
Column name Data type Description
DATE DATE The date when the record was written. From DTE.
NODE_NAME CHAR(16) The node identification.
PERIOD_NAME CHAR(8) The name of the period.
DEVICE_CLS CHAR(10) The device class of the hardware element (Video, HD, CD).
CPU CHAR(10) The CPU identification.
ADD_ID CHAR(10) The address ID of the UNIX device.
DEVICE_ASG CHAR(7) The type of device used in the UNIX system.
BUS CHAR(7) The type of bus used in the UNIX system.
XCONF_SOFTWAREThis table provides software configuration data for the packages used. It maps theDRLTXCNF record.
Column name Data type Description
DATE DATE The date when the record was written. From DTE.
NODE_NAME CHAR(16) The node identification.
PERIOD_NAME CHAR(8) The name of the period.
PACK_NAME CHAR(50) The name of the package used on the system.
SOFT_VER CHAR(12) The software version of the package installed on the system.
INST_TS CHAR(12) The timestamp of when the software was installed.
XDISK_INFORThis table provides space allocation data for the disks on the file system. It mapsthe DRLTXDSK record.
Column name Data type Description
DATE DATE The date when the record was written. From DTE.
NODE_NAME CHAR(16) The node identification.
PERIOD_NAME CHAR(8) The name of the period.
FILE_SYS CHAR(9) The name of the file system.
TOT_SIZE INTEGER The maximum size of the disk.
FREE INTEGER The free space on the disk.
147

XDTMP_INFORThis table provides process information related to users. It maps the DRLTXDTMrecord.
Column name Data type Description
DATE DATE The date when the record was written. From DTE.
NODE_NAME CHAR(16) The node identification.
PERIOD_NAME CHAR(8) The name of the period.
US_ID CHAR(9) The user ID.
US_NAME CHAR(20) The user name.
USED_BLOCK CHAR(10) The number of disk blocks that are used.
XPERF_PS_INFOThis table provides physical size data for the volumes used. It maps the XPERF_PSrecord for Linux systems and the XPERF_PAGING record for UNIX systems.
Column name Data type Description
DATE DATE The date when the record was written. From DTE.
NODE_NAME CHAR(16) The node identification.
PERIOD_NAME CHAR(8) The name of the period.
PHY_VOL CHAR(20) The name of the physical volume.
VOL_SIZE INTEGER The size of the volume.
BLOCKS INTEGER The number of blocks that are used in the volume.
SYSTEM CHAR(5) UNIX or Linux system.
XPERF_VM_INFOThis table provides performance data for user memory, swap memory, and CPUactivity. It maps the XPERF_VM record for Linux systems and the XPERF_CPUrecord for UNIX systems.
Column name Data type Description
DATE DATE The date when the record was written. From DTE.
NODE_NAME CHAR(16) The node identification.
PERIOD_NAME CHAR(8) The name of the period.
USER INTEGER The number of users.
PROC INTEGER The number of processes.
DUR_INT INTEGER The duration of the interval.
MEM_MIN_U INTEGER The minimum memory user page.
AVG_MEM_U FLOAT The average memory user page.
MEM_MAX_U INTEGER The maximum memory user page.
MEM_MIN_S INTEGER The minimum memory page swap.
AVG_MEM_S FLOAT The average memory page swap.
MEM_MAX_S INTEGER The maximum memory page swap.
XDTMP_INFOR
148 Tivoli Decision Support for z/OS: Distributed Systems Performance Feature Guide and Reference

Column name Data type Description
CPU_MIN INTEGER The minimum CPU value.
AVG_CPU FLOAT The average CPU value.
CPU_MAX INTEGER The maximum CPU value.
SYSTEM CHAR(5) UNIX or Linux system.
XWTMP_INFORThis table provides process information related to users. It maps the DRLTXDTMrecord.
Column name Data type Description
DATE DATE The date when the record was written. From DTE.
NODE_NAME CHAR(16) The node identification.
PERIOD_NAME CHAR(8) The name of the period.
USER_LOG CHAR(8) The user login name.
ENTRY CHAR(2) The entry type.
PROC_ID CHAR(6) The process ID.
NODE CHAR(16) The node name.
XPERF_VM_INFO
Chapter 13. Linux data tables 149

XWTMP_INFOR
150 Tivoli Decision Support for z/OS: Distributed Systems Performance Feature Guide and Reference
Chapter 14. Reports
The reporting function produces reports based on the data in the Tivoli DecisionSupport for z/OS database. Reports can show data from tables or from views. Youcan request reports online or by submitting batch jobs. Typically, you use onlinereporting for reports that you use once, and batch reporting for regularly requiredreports.
This topic describes:v The format of the names used to define each report, and how source tables,
attributes and variables are used.v The reports in the accounting subcomponentv The reports in the configuration subcomponentv The reports in the error subcomponentv The reports in the performance subcomponent
Report format and general descriptionTivoli Decision Support for z/OS presents reports in tables and graphs. All reportshave the same basic report layout. This section describes the elements that arecommon among Tivoli Decision Support for z/OS feature reports:v Report IDv Report groupv Sourcev Attributesv Variables
Report IDTivoli Decision Support for z/OS assigns each report a unique identifier. The UNIXPerformance component uses this format for report IDs:
Xsubcomponentxx
Where:
subcomponentIdentifies the subcomponent to which the report belongs. It can be one ofthe following:ACCT The accounting subcomponent.CONFIG
The configuration subcomponent.ERROR
The error subcomponent.PERF The performance subcomponent.
xx A sequential number identifying the report.
Examples:XACCT01XPERF02
151

Report groupTivoli Decision Support for z/OS uses several predefined report groups. For theUNIX Performance component, each subcomponent has one group. The four UNIXPerformance component report groups are given in “Report groups” on page 82.
SourceEach report contains information from one or more source tables. The reportdescriptions in this topic list source tables. Refer to these source tables if you areinterested in learning where certain data originates.
AttributesEach report has certain attributes associated with it. Use these attributes askeywords to search for specific reports in the dialogs.
You can specify any number of attributes for a report, but the area to which thereport belongs (for example, UNIX) is always present for predefined reports.
You can also specify these attributes, when appropriate:v Resource types, such as storage or processorv Performance issues, such as availability or responsev Presentation forms, such as detail, overview, or trendv Time resolutions, such as hourly, daily, or monthly
VariablesEach report has variables associated with it. You specify the values for thesevariables when you generate the report using the reporting dialog.
When you specify a date for a monthly report, specify the first day of the month.Otherwise, there is no match in the data table.
If a character variable happens to have only numeric characters, enclose it in singlequote marks, otherwise it will not match the data. For example, if you have asystem ID of 1234, specify it as '1234' on the Variables window.
Reports in the accounting subcomponentThis section describes the accounting subcomponent reports:v “UNIX Acct Commands by User, Daily Overview.”v “UNIX Acct Users by Command, Daily Overview” on page 154.v “UNIX Acct Cmd Resource Consumption, Daily Overview” on page 155.v “UNIX Acct User Resource Usage, Monthly Overview” on page 157.v “UNIX Acct Disk Blocks by User, Monthly Overview” on page 158.v “UNIX Acct Disk Blocks in 1000s, Monthly Trend” on page 159.v “UNIX Acct Users and Connects, Daily Overview” on page 160.v “UNIX Acct Printed Pages by User, Monthly Overview” on page 161.v “UNIX Acct Printed Pages by System, Monthly Overview” on page 162.
UNIX Acct Commands by User, Daily OverviewFor a specific node in the network, this report (see Figure 46 on page 153) providesdaily overview information about the resource consumption by user name and
Report format and general description
152 Tivoli Decision Support for z/OS: Distributed Systems Performance Feature Guide and Reference

command name. The report is produced by period name (for example, PRIME orNIGHT). You can use the report to identify and have control of, the amount oftotal resources that each user is consuming.
You can easily amend the information provided in the report to suit your ownrequirements. For example, you can add the System time and User time values, tohave a measure of total processor resource.
The report can be used as a guide for charging users and departments for thesystem resources they have used.
This information identifies the report:
Report IDXACCT01
Report groupAccounting Subcomponent Reports
SourceXACCT_COMMAND_D, (described on page “XACCT_COMMAND_D,_M” on page 134)
AttributesUNIX, Acct, Accounting, Command, Cmd, User, Daily, Overview
VariablesDate, Node name, Period name
The report contains this information:
User nameThe name of the user who has used this node.
Command nameThe name of the UNIX command entered by the user.
UNIX Acct Commands by User, Daily OverviewDate: 2003-12-15 Period: ’PRIME ’
Node name: ’sun222 ’
| Elapsed System UserUser Command | Commands time time time Cmd mem IO RW blocksname name | (count) (hour) (sec) (sec) avg (KB) (KB) (count)-------- --------| -------- -------- -------- -------- -------- -------- ---------smith aixterm | 9 0.02 1 3 0.23 7 3
awk | 33 0.09 5 5 0.55 14 5. | . . . . . . .. | . . . . . . .xset | 14 0.10 4 10 0.78 18 9
| -------- -------- -------- -------- -------- -------- ---------Total| 314 2.19 58 55 5.15 92 80
|root awk | 18 0.80 7 5 0.15 13 18
bsh | 38 0.21 8 11 0.89 22 68. | . . . . . . .. | . . . . . . .xmservd | 12 1.17 21 24 1.19 51 10
| -------- -------- -------- -------- -------- -------- ---------Total| 104 10.18 112 122 5.08 103 130
|| ======== ======== ======== ======== ======== ======== =========
Total| 418 12.37 170 177 10.23 195 210
Tivoli Decision Support for z/OS Report: XACCT01
Figure 46. Example of UNIX Acct Commands by User, Daily Overview
Accounting reports
Chapter 14. Reports 153

Commands (count)The number of times this user has entered this command.
Elapsed time (hour)The elapsed time (in hours) used by this user, entering this command. Thisis calculated as ELAPSED_SEC/3600.
System time (sec)The system time (in seconds) used by this user, entering this command.
User time (sec)The user time (in seconds) used by this user, entering this command.
Cmd mem avg (KB)The average memory (in kilobytes) used by this user, entering thiscommand. This is calculated as MEMORY_BYTES/(1024*COMMANDS).
IO (KB)Characters (in kilobytes) that have been transferred by this user, using thiscommand. This is calculated as IO_CHARS/1024.
RW blocks (count)The number of blocks that have been read/written by this user, using thiscommand.
UNIX Acct Users by Command, Daily OverviewFor a specific node in the network, this report (see Figure 47 on page 155) providesdaily overview information about command usage by each user; the number oftimes a user has used a command, how much system and user time the commandrequired, how much memory, and how much I/O. The report is produced byperiod name (for example, PRIME or NIGHT).
You can use the report to identify and have control of, the amount of resourcesthat each user is consuming, by command. The information provided in the reportcan be amended to suit your own requirements. For example, by modifying theSQL routine that produces the report, you can remove from the report users whosecommand usage is not relevant.
The report can be used as a guide for charging users and departments for thesystem resources they have used.
This information identifies the report:
Report IDXACCT02
Report groupAccounting Subcomponent Reports
SourceXACCT_COMMAND_D, (described on page “XACCT_COMMAND_D,_M” on page 134)
AttributesUNIX, Acct, Accounting, Command, Cmd, User, Daily, Overview
VariablesDate, Node name, Period name
Accounting reports
154 Tivoli Decision Support for z/OS: Distributed Systems Performance Feature Guide and Reference

The report contains this information:
Command nameThe name of the UNIX command.
User nameThe name of the user who has used this node.
Commands (count)The number of times this user has entered this command.
Elapsed time (hour)The elapsed time (in hours) used by this user, entering this command. Thisis calculated as ELAPSED_SEC/3600.
System time (sec)The system time (in seconds) used by this user, entering this command.
User time (sec)The user time (in seconds) used by this user, entering this command.
Cmd mem avg (KB)The memory (in kilobytes) used by this user, entering this command. Thisis calculated as MEMORY_BYTES/(1024*COMMANDS).
IO (KB)Characters (in kilobytes) that have been transferred by this user, using thiscommand. This is calculated as IO_CHARS/1024.
RW blocks (count)The number of blocks that have been read/written by this user, using thiscommand.
UNIX Acct Cmd Resource Consumption, Daily OverviewFor a specific node in the network, this report (see Figure 48 on page 156) providesdaily overview information about command usage; the number of times acommand has been used, how much system and user time the command required,how much memory, and how much I/O. The report is produced by period name(for example, PRIME or NIGHT). You can use the report to identify and havecontrol of, the amount of total resources that each command is consuming.
You can easily amend the information provided in the report to suit your ownrequirements. For example, by modifying the SQL routine that produces the report,you can remove from the report commands that are not particularly important. Oryou can compare the amount of resources (for example, System time + User time)a command requires for different nodes. If command xyz requires more System
UNIX Acct Users by Command, Daily OverviewDate: 2003-12-16 Period: ’PRIME ’
Node name: ’hp555 ’
| Elapsed System UserCommand User | Commands time time time Cmd mem IO RW blocksname name | (count) (hour) (sec) (sec) avg (KB) (KB) (count)
-------- --------| -------- -------- -------- -------- -------- -------- ---------aixterm smith | 9 0.05 2 3 0.23 11 2awk smith | 7 0.07 3 2 0.07 2 4
root | 18 0.08 2 1 0.15 13 7bind smith | 28 0.10 6 4 0.44 10 3. . . . . . . . .. . . . . . . . .
Tivoli Decision Support for z/OS Report: XACCT02
Figure 47. Example of UNIX Acct Users by Command, Daily Overview
Accounting reports
Chapter 14. Reports 155

and User time at 'nodeA' than at 'nodeB', you might investigate, for example, ifpaging is too high at the first node, or if the command has to process more data atthe first node.
This information identifies the report:
Report IDXACCT03
Report groupAccounting Subcomponent Reports
SourceXACCT_COMMAND_D, (described on page “XACCT_COMMAND_D,_M” on page 134)
AttributesUNIX, Acct, Accounting, Command, Cmd, User, Daily, Overview
VariablesDate, Node name, Period name
The report contains this information:
Command nameThe name of the UNIX command.
Commands (count)The number of times this command has been entered.
Elapsed avg (min)The average elapsed time (in minutes) used by this command, This iscalculated as ELAPSED_SEC/(COMMANDS*60).
System avg (sec)The average system time (in seconds) used by this command. This iscalculated as SYSTEM_SEC/COMMANDS.
User avg (sec)The average user time (in seconds) used by this command. This iscalculated as USER_SEC/COMMANDS.
Cmd mem avg (KB)The average memory (in kilobytes) used by this command. This iscalculated as MEMORY_BYTES/(1024*COMMANDS).
UNIX Acct Cmd Resource Consumption, Daily OverviewDate: 2003-12-17 Period: ’PRIME ’
Node name: ’aix111 ’
Command | Commands Elapsed System User Cmd mem IO RWname | (count) avg (min) avg (sec) avg (sec) avg (KB) avg (KB) avg (block)
--------| -------- --------- --------- --------- -------- -------- -----------aixterm | 7 0.08 0.23 0.33 0.23 17.0 5awk | 5 0.03 0.04 0.05 0.13 4.1 2bind | 8 0.02 0.09 0.64 0.44 12.5 3bsh | 26 0.02 0.10 0.03 0.07 4.4 1. | . . . . . . .. | . . . . . . .
Tivoli Decision Support for z/OS Report: XACCT03
Figure 48. Example of UNIX Acct Cmd Resource Consumption, Daily Overview
Accounting reports
156 Tivoli Decision Support for z/OS: Distributed Systems Performance Feature Guide and Reference

IO avg (KB)The average number of characters (in kilobytes) used by this command.This is calculated as (IO_CHARS/1024)/COMMANDS.
RW avg (block)The average number of blocks read/written by this command. This iscalculated as RW_BLOCKS/COMMANDS.
UNIX Acct User Resource Usage, Monthly OverviewFor a specific node in the network, this report (see “UNIX Acct User ResourceUsage, Monthly Overview”) provides monthly overview information about theresource usage by user name. The report would typically be run each month inbatch mode, and if the report shows that further investigation for a specific user(or users) is required, you can then use the report “UNIX Acct Commands by User,Daily Overview” on page 152 for a daily breakdown of resource usage by theuser(s). The report is produced by period name (for example, PRIME or NIGHT).
The report can be used as a guide for charging users and departments for thesystem resources they have used.
This information identifies the report:
Report IDXACCT04
Report groupAccounting Subcomponent Reports
SourceXACCT_COMMAND_M, (described on page “XACCT_COMMAND_D,_M” on page 134)
AttributesUNIX, Acct, Accounting, Command, Cmd, User, Monthly, Overview
VariablesMonth, Node name, Period name
The report contains this information:
User nameThe name of the user who has used this node.
Commands (count)The total number of commands this user has entered.
UNIX Acct User Resource Usage, Monthly OverviewMonth: 2003-12-01 Period: ’PRIME ’
Node name: ’aix555 ’
| Elapsed System UserUser | Commands time time time IOname | (count) (hour) (sec) (sec) (KB)--------| -------- -------- -------- -------- --------smith | 514 1.19 58 125 3392root | 104 0.18 4 2 317
Tivoli Decision Support for z/OS Report: XACCT04
Figure 49. Example of UNIX Acct User Resource Usage, Monthly Overview
Accounting reports
Chapter 14. Reports 157

Elapsed time (hour)The elapsed time (in hours) used by this user, entering this command. Thisis calculated as ELAPSED_SEC/3600.
System time (sec)The system time (in seconds) used by this user, entering this command.
User time (sec)The user time (in seconds) used by this user, entering this command.
IO (KB)Characters (in kilobytes) that have been transferred by this user, using thiscommand. This is calculated as IO_CHAR/1024.
UNIX Acct Disk Blocks by User, Monthly OverviewFor a specific node in the network, this report (see“UNIX Acct Disk Blocks byUser, Monthly Overview”) provides monthly overview information about theaverage disk blocks allocated by each user, at this node. The report would typicallybe run each month in batch mode.
The report can be used as a guide for charging users and departments for the diskresources they have used.
This information identifies the report:
Report IDXACCT05
Report groupAccounting Subcomponent Reports
SourceXACCT_DISK_M, XACCT_DISK_MV (View), (described on page“XACCT_DISK_MV” on page 137)
AttributesUNIX, Acct, Accounting, Disk, User, Monthly, Overview
VariablesMonth, Node name
Accounting reports
158 Tivoli Decision Support for z/OS: Distributed Systems Performance Feature Guide and Reference

The report contains this information:
User nameThe name of the user who has used this node.
Disk blocks avgThe average number of blocks allocated by this user. This is calculated asDISK_BLOCKS/(RECORDS_COLLECTED for USER=root).
UNIX Acct Disk Blocks in 1000s, Monthly TrendFor a specific node in the network, this report (see Figure 51 on page 160) providesmonthly trend information about the average disk blocks allocated by the node.The number of blocks is given in units of one thousand. You can use the report toanticipate potential bottlenecks in disk space capacity (where, for example, theusage shows a steadily increasing trend).
The report would typically be run each month in batch mode. If you require moredetailed information about a node's disk usage for a specific month, you canproceed to the report “UNIX Acct User Resource Usage, Monthly Overview” onpage 157.
This information identifies the report:
Report IDXACCT06
Report groupAccounting Subcomponent Reports
SourceXACCT_DISK_M, XACCT_DISK_MV (View), (described on page“XACCT_DISK_MV” on page 137)
AttributesUNIX, Acct, Accounting, Disk, Monthly, Trend
VariablesFrom month, To month, Node name
UNIX Acct Disk Blocks by User, Monthly OverviewMonth: 2003-12-01Node name: ’aix555 ’
User | Disk blocksname | avg--------| -----------adm | 216archer | 4bin | 398644smith | 188daemon | 4guest | 4johanbe | 4loadl | 116root | 103824sys | 8uucp | 972xbill | 132
| ===========Total| 504116
Tivoli Decision Support for z/OS Report: XACCT05
Figure 50. Example of UNIX Acct Disk Blocks by User, Monthly Overview
Accounting reports
Chapter 14. Reports 159
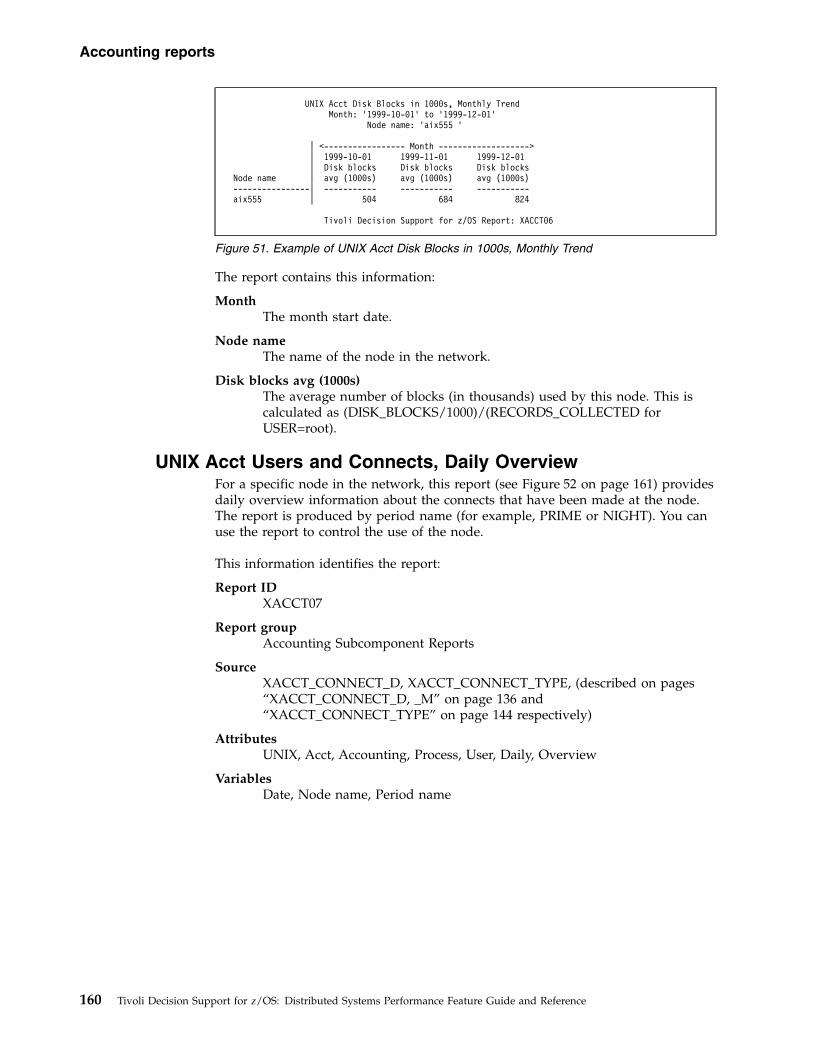
The report contains this information:
MonthThe month start date.
Node nameThe name of the node in the network.
Disk blocks avg (1000s)The average number of blocks (in thousands) used by this node. This iscalculated as (DISK_BLOCKS/1000)/(RECORDS_COLLECTED forUSER=root).
UNIX Acct Users and Connects, Daily OverviewFor a specific node in the network, this report (see Figure 52 on page 161) providesdaily overview information about the connects that have been made at the node.The report is produced by period name (for example, PRIME or NIGHT). You canuse the report to control the use of the node.
This information identifies the report:
Report IDXACCT07
Report groupAccounting Subcomponent Reports
SourceXACCT_CONNECT_D, XACCT_CONNECT_TYPE, (described on pages“XACCT_CONNECT_D, _M” on page 136 and“XACCT_CONNECT_TYPE” on page 144 respectively)
AttributesUNIX, Acct, Accounting, Process, User, Daily, Overview
VariablesDate, Node name, Period name
UNIX Acct Disk Blocks in 1000s, Monthly TrendMonth: ’1999-10-01’ to ’1999-12-01’
Node name: ’aix555 ’
| <----------------- Month ------------------->| 1999-10-01 1999-11-01 1999-12-01| Disk blocks Disk blocks Disk blocks
Node name | avg (1000s) avg (1000s) avg (1000s)----------------| ----------- ----------- -----------aix555 | 504 684 824
Tivoli Decision Support for z/OS Report: XACCT06
Figure 51. Example of UNIX Acct Disk Blocks in 1000s, Monthly Trend
Accounting reports
160 Tivoli Decision Support for z/OS: Distributed Systems Performance Feature Guide and Reference

The report contains this information:
User nameThe name of the user who has used this node.
Connect descriptionThe connect type description.
Connects (count)The total number of connects for this connect type, this user has made.
UNIX Acct Printed Pages by User, Monthly OverviewFor a specific node in the network, this report (see Figure 53 on page 162) providesmonthly overview information about how much of the printing resources each userhas used. The report is produced by period name (for example, PRIME or NIGHT).The report can be used as a guide for charging users and departments for theprinting resources they have used.
This information identifies the report:
Report IDXACCT08
Report groupAccounting Subcomponent Reports
SourceXACCT_PRINT_M, (described on page “XACCT_PRINT_D, _M” on page136)
AttributesUNIX, Acct, Accounting, Print, Page, User, Monthly, Overview
VariablesMonth, Node name, Period name
UNIX Acct Users and Connects, Daily OverviewDate: 1999-12-15 Period: ’PRIME ’
Node name: ’aix555 ’
User | Connect Connectsname | description (count)--------| ---------------- ---------archer | USER_PROCESS 8smith | USER_PROCESS 14cron | INIT_PROCESS 1root | LOGIN_PROCESS 1
Tivoli Decision Support for z/OS Report: XACCT07
Figure 52. Example of UNIX Acct Users and Connects, Daily Overview
Accounting reports
Chapter 14. Reports 161

The report contains this information:
User nameThe name of the user who has used this node.
Print queue nameThe name of the print queue used by this user.
Request nodeThe name of the node from which print was requested. When the requestnode is the same as the node name for which the report is being produced,the print request is local.
PrintoutsThe number of printouts printed by this user, at this node.
Pages Total number of pages printed by this user, at this node.
UNIX Acct Printed Pages by System, Monthly OverviewFor a specific node in the network, this report (see “UNIX Acct Printed Pages bySystem, Monthly Overview”) provides monthly overview information about howmuch of the printing resources each node has used. The report is produced byperiod name (for example, PRIME or NIGHT). The report can be used to controlthe amount of printing being performed by each node.
This information identifies the report:
Report IDXACCT09
Report groupAccounting Subcomponent Reports
SourceXACCT_PRINT_M, (described on page “XACCT_PRINT_D, _M” on page136)
AttributesUNIX, Acct, Accounting, Print, Page, System, Monthly, Overview
VariablesMonth, Period name
UNIX Acct Printed Pages by User, Monthly OverviewMonth: 1999-01-01 Period: ’PRIME’
Node name: ’aix555 ’
User Print queue Requestname name node Printouts Pages-------- ----------- -------------------------------- --------- --------smith prt0 aix555 2 2
wn5prt aix555 2 2--------- --------
Total 4 4
========= ========Total 4 4
Tivoli Decision Support for z/OS Report: XACCT08
Figure 53. Example of UNIX Acct Printed Pages by User, Monthly Overview
Accounting reports
162 Tivoli Decision Support for z/OS: Distributed Systems Performance Feature Guide and Reference

The report contains this information:
Node nameThe name of the node in the network.
Print queue nameThe print queue name.
Request nodeThe node from which the print was requested. When the request node isthe same as the node name for which the report is being produced, theprint request is local.
PrintoutsFor the specified request node, the total number of printouts printed.
Pages For the specified request node, the total number of pages printed.
Reports in the configuration subcomponentThis section describes the configuration subcomponent reports:v “UNIX Configuration of HW for a System, Overview.”v “UNIX Configuration of HW for Device Class, Overview” on page 164.v “UNIX Configuration of SW for a System, Overview” on page 165.v “UNIX Configuration of SW for Object, Overview” on page 166.
UNIX Configuration of HW for a System, OverviewThis report only covers nodes that use AIX. For a specific node in the network andfor a time period determined by the From and To-dates, this report (see Figure 55on page 164) provides overview information about the devices that were foundwhen the last “collect” job was run, information about each device (status,sub-class, type, date and time of configuration) are given.
This information identifies the report:
Report IDXCONFIG01
Report groupConfiguration Subcomponent Reports
SourceXCONFIG_HW, (described on page “XCONFIG_HW” on page 137)
UNIX Acct Printed Pages by System, Monthly OverviewMonth: 1999-01-01 Period: ’PRIME’
Print queue RequestNode name name node Printouts Pages---------------- ----------- -------- --------- --------sun555 prt0 aix222 2 12
wn5prt aix555 2 52--------- --------
Total 4 64
========= ========Total 4 64
Tivoli Decision Support for z/OS Report: XACCT09
Figure 54. Example of UNIX Acct Printed Pages by System, Monthly Overview
Accounting reports
Chapter 14. Reports 163

AttributesAIX, Configuration, HW, Hardware, Overview
VariablesFrom date, To date, Node name
The report contains this information:
Device classA class of devices configured at this node.
Device nameThe name of a device contained within the given device class.
Status The status of the device contained within the given device class. Thepossible values are:
A = ActiveD = Defined
Device subclassThe subclass of the device contained within the device class.
Device typeThe type of the device contained within the device class.
Date The date when the collect was run, and when the configuration data forthis device was captured.
Time The time when the collect was run, and when the configuration data forthis device was captured.
UNIX Configuration of HW for Device Class, OverviewThis report only covers nodes that use AIX. For a specific device class or for alldevice classes, this report (see Figure 56 on page 165) provides overviewinformation about the number of devices in the network, found when the collectjob(s) was run. If no device class is entered, the number of devices for all deviceclasses in the network, will be displayed.
UNIX Configuration of HW for a System, OverviewDate: ’2003-11-13’ to ’2003-12-13’
Node name: ’aix555 ’
Device class Device name | Status Device subclass Device type Date Time---------------- ----------------| ------ ---------------- ---------------- ---------- --------adapter ent0 | A sio ient_2 2003-12-13 16.45.12
fda0 | A sio fda_2 2003-12-13 16.45.12ppa0 | A sio ppa 2003-12-13 16.45.12. | . . . . .. | . . . . .. | . . . . .
aio aio0 | D Asynchronous node 2003-12-13 16.45.12bus bus0 | A sys mca 2003-12-13 16.45.12
sgabus0 | A sys sgabus 2003-12-13 16.45.12disk hdisk0 | A scsi 1000mb 2003-12-13 16.45.12diskette fd0 | A siofd fd 2003-12-13 16.45.12en en0 | D Standard EN 2003-12-13 16.45.12fpa fpa0 | A sys fpa1 2003-12-13 16.45.12
. | . . . . .
. | . . . . .
. | . . . . .
Tivoli Decision Support for z/OS Report: XCONFIG01
Figure 55. Example of UNIX Configuration of HW for a System, Overview
Configuration reports
164 Tivoli Decision Support for z/OS: Distributed Systems Performance Feature Guide and Reference

The information is displayed for a time period determined by From and To datesthat you enter.
This information identifies the report:
Report IDXCONFIG02
Report groupConfiguration Subcomponent Reports
SourceXCONFIG_HW, (described on page “XCONFIG_HW” on page 137)
AttributesAIX, Configuration, HW, Hardware, Device, Overview
VariablesFrom date, To date, Device class
The report contains this information:
Date The date(s) when the collect job was run.
Node nameThe name of the node in the network.
DevicesThe number of devices that were found by the collect job, on the date(s)the collect was run.
UNIX Configuration of SW for a System, OverviewThis report covers only nodes that use AIX. For a specific node in the network, thisreport (see Figure 57 on page 166) provides overview information about thesoftware configurations that have taken place. The information is displayed for atime period determined by the From and To dates that you enter.
This information identifies the report:
Report IDXCONFIG03
Report groupConfiguration Subcomponent Reports
SourceXCONFIG_SW, (described on page “XCONFIG_SW” on page 137)
AttributesAIX, Configuration, SW, Software, System, Overview
UNIX Configuration of HW for Device Class, OverviewDate: ’2003-11-13’ to ’2003-12-13’
Device class: ’adapter ’
<----------- Date --------->2003-11-13 2003-12-13
Node name Devices Devices---------------- ----------- -----------aix555 12 15
Tivoli Decision Support for z/OS Report: XCONFIG02
Figure 56. Example of UNIX Configuration of HW for Device Class, Overview
Configuration reports
Chapter 14. Reports 165

VariablesFrom date, To date, Node name
The report contains this information:
Feature codeThe feature code identification of the software object that is installed.
Path nameThe path to where the software object is located.
Software objectThe name of the software object.
Install dateThe date when the software object was installed.
DescriptionA description of the software object.
Date The date of the collect run, when the information about the software objectwas obtained.
Time The time of the collect run, when the information about the software objectwas obtained.
UNIX Configuration of SW for Object, OverviewThis report only covers nodes that use AIX. For a specific software object, thisreport (see Figure 58 on page 167) provides overview information about thesoftware objects that exist on the network. If no software object is selected fordisplay, the report will provide information about all software objects.
The information is displayed for a time period determined by From and To datesthat you enter.
This information identifies the report:
UNIX Configuration of SW for a System, OverviewDate: ’2003-01-01’ to ’2003-07-0 1’
Node name: ’aix555 ’
Feature Software Installcode Path name object date Description Date Time------- ------------------ ------------------ ------- ----------------------------- ---------- --------
/usr/lib/objrepo xmconsole.data 09/13/03 XMconsole configuration files 2003-01-17 09.51.31xmconsole.obj 09/13/03 XMconsole executables 2003-01-17 09.51.31
/etc/objrepo xlccmp.obj 09/10/03 AIX XL C Compiler/6000 2003-01-17 09.51.31/usr/lib/objrepo xlccmp.obj 09/10/03 AIX XL C Compiler/6000 2003-01-17 09.51.31
2924 /usr/lib/objrepo netmgrmEn_US.msg 09/10/03 Network Management I Messages 2003-01-17 09.51.315005 /etc/objrepo netmgr.am.obj 09/10/03 Alert Manager 2003-01-17 09.51.31
netmgr.api.obj 09/10/03 SNMP Appl. Programming Interf 2003-01-17 09.51.31netmgr.clm.obj 09/10/03 SNMP Command Line Manager 2003-01-17 09.51.31netmgr.nvdm.obj 09/10/03 NetView Dist. Manager Catcher 2003-01-17 09.51.31
/etc/objrepo nv6000.features.ob 10/29/03 AIX SystemView NetView/6000 Feat 2003-01-17 09.51.31/usr/lib/objrepo nv6000.base.obj 10/29/03 AIX SystemView NetView/6000 Base 2003-01-17 09.51.31
nv6000.features.ob 10/29/03 AIX SystemView NetView/6000 Feat 2003-01-17 09.51.310000 /usr/lib/objrepo perfmgr 09/10/03 Performance Manager 2003-01-17 09.51.310000 /etc/objrepo perfagent 09/10/03 Performance Agent 2003-01-17 09.51.31
/usr/lib/objrepo perfagent 09/10/03 Performance Agent 2003-01-17 09.51.315005 /usr/lib/objrepo aic.obj 09/10/03 AIXwindows Interface Composer 2003-01-17 09.51.312924 /usr/lib/objrepo bsmEn_US.msg 09/10/03 Base System Messages-U.S. Engl 2003-01-17 09.51.312937 /usr/lib/objrepo bsmSv_SE.msg 09/10/03 Base System Messages-Swedish 2003-01-17 09.51.315005 /etc/objrepo bos.obj 01/01/90 The Base Operating System 2003-01-17 09.51.31
bosext1.ecs.obj 09/10/03 Remote Customer Services 2003-01-17 09.51.31bosext1.mh.obj 09/10/03 Mail Handler 2003-01-17 09.51.31
Tivoli Decision Support for z/OS Report: XCONFIG03
Figure 57. Example of UNIX Configuration of SW for a System, Overview
Configuration reports
166 Tivoli Decision Support for z/OS: Distributed Systems Performance Feature Guide and Reference

Report IDXCONFIG04
Report groupConfiguration Subcomponent Reports
SourceXCONFIG_SW, (described on page “XCONFIG_SW” on page 137)
AttributesAIX, Configuration, SW, Software, Object, Overview
VariablesFrom date, To date, Object
The report contains this information:
Software objectThe name of the software object that has been selected.
Node nameThe node within the network, where the software object is located.
Path nameThe path(s) to where the software object is located.
ReleaseThe release level of the software object.
Install statusThe status of the installation of the software object.
Install dateThe date when the software object was installed.
Date The date of the collect run, when the information about the software objectwas obtained.
Time The time of the collect run, when the information about the software objectwas obtained.
Reports in the error subcomponentThis section describes the error subcomponent reports:v “UNIX Error by ID, Daily Overview” on page 168.v “UNIX Error by Type, Daily Overview” on page 168.v “UNIX Error by Class, Daily Overview” on page 169.v “UNIX Error by Resource, Daily Overview” on page 170.v “UNIX Error by Resource, Monthly Trend” on page 171.
UNIX Configuration of SW for Object, OverviewDate: ’2003-01-01’ to ’2003-02-10’
Object: ’bos.obj ’
Software Install Installobject Node name Path name Release status date Date Time---------------------------------- ----------------- --------------- ---------- -------- ---------- --------bos.obj aix555 /etc/obj/repo 03.02.0000.0000 COMPLETE 01/01/03 2003-01-31 15.52.57
/usr/lib/objrepo 03.02.0000.0000 COMPLETE 01/01/03 2003-01-31 15.52.57
Tivoli Decision Support for z/OS Report: XCONFIG04
Figure 58. Example of UNIX Configuration of SW for Object, Overview
Configuration reports
Chapter 14. Reports 167

UNIX Error by ID, Daily OverviewThis report only covers nodes that use AIX. For a specific node in the network, thisreport (see Figure 59) gives daily overview information about the error messagesthat have been issued. For each error message, the report shows error ID,description, number of times the message has occurred, and the percentageoccurrence of the message.
You can use this report to identify potential problems within an application, sincethe error ID allows you to differentiate between errors caused by softwareapplications, system errors, and so on.
This information identifies the report:
Report IDXERROR01
Report groupError Subcomponent Reports
SourceXERROR_D, (described on page “XERROR_D, _M” on page 138)
AttributesAIX, Error, ID, Daily, Overview
VariablesDate, Node name
The report contains this information:
Error IDThe identification of the error message.
DescriptionDescription of the error message.
Errors (count)The number of times this error has occurred.
Errors (%)The percentage of the total errors, in which this message has occurred.
UNIX Error by Type, Daily OverviewThis report only covers nodes that use AIX. For a specific node in the network, thisreport (see Figure 60 on page 169) gives daily overview information about the
UNIX Error by ID, Daily OverviewDate: 1999-11-29
Node name: ’aix555 ’
Errors ErrorsError ID| Description (count) (%)--------| ---------------------------------------- ---------- --------0F27AAE5| SOFTWARE PROGRAM ABNORMALLY TERMINATED 6 54.55E18E984F| SOFTWARE PROGRAM ERROR 3 27.271104AA28| System reset interrupt received 1 9.099DBCFDEE| Error logging turned on 1 9.09
| ========== ========| Total 11 100.00
Tivoli Decision Support for z/OS Report: XERROR01
Figure 59. Example of UNIX Error by ID, Daily Overview
Error reports
168 Tivoli Decision Support for z/OS: Distributed Systems Performance Feature Guide and Reference

types of error messages that have been issued. For each error type, the reportshows the number of times the message type has occurred, and the percentageoccurrence of the message type.
You can use this report to identify potential problems within a system, since themessage resource type allows you to measure the number of errors that are beinggenerated for a particular error type.
This information identifies the report:
Report IDXERROR02
Report groupError Subcomponent Reports
SourceXERROR_D, (described on page “XERROR_D, _M” on page 138)
AttributesAIX, Error, Type, Daily, Overview
VariablesDate, Node name
The report contains this information:
Error typeThe error type, which can be the following:
P = Program errorT = Token ring error
Errors (count)The number of times this error type has occurred.
Errors (%)The percentage of the total errors, that this error type has occurred.
UNIX Error by Class, Daily OverviewThis report only covers nodes that use AIX. For a specific node in the network, thisreport (see Figure 61 on page 170) gives daily overview information about the classof error messages that have been issued. For each error class, the report shows thenumber of times the message has occurred, and the percentage occurrence of themessage class.
UNIX Error by Type, Daily OverviewDate: 1999-11-29
Node name: ’aix555 ’
| Errors ErrorsError type| (count) (%)----------| ---------- --------P | 9 81.82T | 2 18.18
| ========== ========Total| 11 100.00
Tivoli Decision Support for z/OS Report: XERROR02
Figure 60. Example of UNIX Error by Type, Daily Overview
Error reports
Chapter 14. Reports 169

You can use this report to identify potential problems within a system, since themessage resource type allows you to measure the number of errors that are beinggenerated for a particular error class.
This information identifies the report:
Report IDXERROR03
Report groupError Subcomponent Reports
SourceXERROR_D, (described on page “XERROR_D, _M” on page 138)
AttributesAIX, Error, Class, Daily, Overview
VariablesDate, Node name
The report contains this information:
Error classThe error class, which can be the following:
S = Software messageH = Hardware messageO = Error log command message
Errors (count)The number of times this error class has occurred.
Errors (%)The percentage of the total errors, that this error class has occurred.
UNIX Error by Resource, Daily OverviewThis report only covers nodes that use AIX. For a specific node in the network, thisreport (see Figure 62 on page 171) gives daily overview information about theresource type of error messages that have been issued. For each resource type, thereport shows the number of times messages of this type have occurred, and thepercentage occurrence of messages of this resource type.
You can use this report to identify potential problems within a system, since themessage resource type allows you to measure the number of errors that are beinggenerated for a particular resource.
UNIX Error by Class, Daily OverviewDate: 1999-11-29
Node name: ’aix555 ’
Errors ErrorsError class (count) (%)----------- ---------- --------S 10 90.91O 1 9.09
========== ========Total 11 100.00
Tivoli Decision Support for z/OS Report: XERROR03
Figure 61. Example of UNIX Error by Class, Daily Overview
Error reports
170 Tivoli Decision Support for z/OS: Distributed Systems Performance Feature Guide and Reference

This information identifies the report:
Report IDXERROR04
Report groupError Subcomponent Reports
SourceXERROR_D, (described on page “XERROR_D, _M” on page 138)
AttributesAIX, Error, Resource, Daily, Overview
VariablesDate, Node name
The report contains this information:
Resource nameThe name of the resource.
Errors (count)The number of times errors originating from this resource name, haveoccurred.
Errors (%)The percentage of the total errors, that have originated from this resource.
UNIX Error by Resource, Monthly TrendThis report only covers nodes that use AIX. For a specific node in the network, thisreport (see Figure 63 on page 172) gives monthly trend information about theresource name of error messages that have been issued. For each resource name,the report shows the number of times messages of the resource name haveoccurred.
You can use this report to identify potential problems within a system, since themessage resource type allows you to measure the number of errors that are beinggenerated for a particular resource.
This information identifies the report:
Report IDXERROR05
Report groupError Subcomponent Reports
UNIX Error by Resource, Daily OverviewDate: 1999-11-29
Node name: ’aix555 ’
Resource Errors Errorsname (count) (%)
-------------- ---------- ----------SYSPROC 7 63.64SRC 3 27.27errdemon 1 9.09
========== ==========Total 11 100.00
Tivoli Decision Support for z/OS Report: XERROR04
Figure 62. Example of UNIX Error by Resource, Daily Overview
Error reports
Chapter 14. Reports 171

SourceXERROR_M, (described on page “XERROR_D, _M” on page 138)
AttributesAIX, Error, Resource, Monthly, Trend
VariablesFrom month, To month, Node name
The report contains this information:
MonthThe start date of the month.
Resource nameThe name of the resource.
Errors The number of times errors originating from this resource name, haveoccurred.
Reports in the performance subcomponentThis section describes the performance subcomponent reports:v “UNIX Perf CPU Utilization by System, Hourly Trend” on page 173.v “UNIX Perf CPU Utilization by System, Daily Overview” on page 174.v “UNIX Perf Statistics by System, Hourly Trend” on page 175.v “UNIX Perf Statistics all Systems, Daily Overview” on page 176.v “UNIX Perf Vol Group and File Syst, Daily Overview” on page 177.v “UNIX Perf Disk I/O for a Disk, Hourly Trend” on page 178.v “UNIX Perf Disk I/O for System, Daily Overview” on page 180.v “UNIX Perf Page Space Utilization, Hourly Trend” on page 181.v “LINUX Percentile Work Size” on page 182.v “LINUX Disk Space Allocation” on page 183.v “LINUX Performance from User Memory” on page 184.v “LINUX Hardware Configuration” on page 186.v “LINUX Software Configuration” on page 187.v “LINUX User Information” on page 188.v “LINUX Process Information” on page 189.v “LINUX Performance ’VM’ for Swap Memory” on page 190.v “LINUX Performance ’VM’ for CPU” on page 191.
UNIX Error by Resource, Monthly TrendMonth: ’2003-11-01’ to ’2003-12-01’
Node name: ’aix555 ’
<-------- Month -------->2003-11-01 2003-12-01
Resource name Errors Errors-------------- ----------- -----------errdemon 1 1tok0 1 1SRC 3 4SYSPROC 19 18SYSVMM 3 5
Tivoli Decision Support for z/OS Report: XERROR05
Figure 63. Example of UNIX Error by Resource, Monthly Trend
Error reports
172 Tivoli Decision Support for z/OS: Distributed Systems Performance Feature Guide and Reference

UNIX Perf CPU Utilization by System, Hourly TrendFor a specific node in the network, this graphical representation (see Figure 64)shows the hourly trend of processor utilization, over a specified time period. Suchinformation is useful as an entry point when investigating system performance.
This information identifies the display:
Report IDXPERF01
Report groupPerformance Subcomponent Reports
SourceXPERF_CPU_H, (described on page “XPERF_CPU_H, _D, _M” on page139)
AttributesUNIX, Performance, CPU, Utilization, Usage, Hourly, Trend
VariablesDate, Node name
The report contains this information:
Hour The hour of the day.
CPU avgThe average processor time that has been utilized, in percent.
CPU maxThe maximum processor time that has been utilized, in percent.
Figure 64. Example of UNIX Perf CPU Utilization by System, Hourly Trend
Performance reports
Chapter 14. Reports 173

UNIX Perf CPU Utilization by System, Daily OverviewFor all nodes in the network, this graphical representation (see Figure 65) showsthe average daily processor utilization. The display is produced by period name(for example, PRIME or NIGHT). Such information is useful as an entry pointwhen investigating system performance. An hourly graphical display of processorutilization for a specific node, is given in “UNIX Perf CPU Utilization by System,Hourly Trend” on page 173.
This information identifies the report:
Report IDXPERF02
Report groupPerformance Subcomponent Reports
SourceXPERF_CPU_D, (described on page “XPERF_CPU_H, _D, _M” on page139)
AttributesUNIX, Performance, Cpu, Utilization, Usage, Daily, Overview
VariablesDate, Period name
The report contains this information:
Node nameThe name of the node in the network.
CPU avgThe average processor time that has been utilized, in percent.
UNIX Perf CPU Utilization by System, Daily OverviewDate: 2000-06-08 Period: 'PRIME'
AIX11 AIX22 AIX33 HP111
Node name
SUN11 SUN22HP222
0
%
80
60
40
20
100
CPU avg
Figure 65. Example of UNIX Perf CPU Utilization by System, Daily Overview
Performance reports
174 Tivoli Decision Support for z/OS: Distributed Systems Performance Feature Guide and Reference

UNIX Perf Statistics by System, Hourly TrendFor a specific node in the network, this report (see Figure 66) provides hourly,trend information about:v Processor utilization (average and maximum)v The number of available pages of memory (average and minimum)v The paging rate (average and maximum)v The number of processes (average and maximum)v The number of users (average and maximum)
A total row is given, which are the averages and maximums calculated for allhours.
This information identifies the report:
Report IDXPERF03
Report groupPerformance Subcomponent Reports
SourceXPERF_CPU_H, (described on page “XPERF_CPU_H, _D, _M” on page139)
AttributesUNIX, Performance, System, Usage, Hourly, Trend
VariablesDate, Node name
The report contains this information:
Hour The hour of the day.
CPU usage avg (%)The average processor utilization, in percent.
CPU usage max (%)The maximum processor utilization, in percent.
Mem free pages avgThe average number of free pages of memory.
UNIX Perf Statistics by System, Hourly TrendDate: 1999-12-27Node name: ’hp111 ’
| CPU CPU Mem free Mem free Paging Paging| usage usage pages pages rate rate Processes Processes Users Users
Hour| avg (%) max (%) avg min avg max avg max avg max-----| -------- -------- -------- -------- -------- -------- --------- --------- -------- --------
.| . . . . . . . . . .14| 6.7 43 1099 166 0.03 0.17 90.3 92 7.0 715| 4.8 50 1257 687 0.05 0.12 91.3 96 7.3 1216| 5.6 21 822 125 0.02 0.09 92.3 99 7.0 7.| . . . . . . . . . ..| . . . . . . . . . .| ======== ======== ======== ======== ======== ======== ========= ========= ======== ========
Total| 4.7 50 2447 125 0.06 0.17 85.8 99 6.2 12
Tivoli Decision Support for z/OS Report: XPERF03
Figure 66. Example of UNIX Perf Statistics by System, Hourly Trend2
Performance reports
Chapter 14. Reports 175

Mem free pages minThe minimum number of free pages of memory.
Paging rate avgThe average paging rate, per second.
Paging rate maxThe maximum paging rate, per second.
Processes avgThe average number of processes.
Processes maxThe maximum number of processes.
Users avgThe average number of users for this node.
Users maxThe maximum number of users for this node.
UNIX Perf Statistics all Systems, Daily OverviewFor all nodes in the network, this report (see Figure 67 on page 177) provides dailyoverview information about:v Processor utilization (average and maximum)v The number of available pages of memory (average and minimum)v The paging rate (average and maximum)v The number of processes (average and maximum)v The number of users (average and maximum)
The report is produced by period name (for example, PRIME or NIGHT). Anhourly breakdown of the information provided in this report, and for a specificnode, is given in “UNIX Perf Statistics by System, Hourly Trend” on page 175.
This information identifies the report:
Report IDXPERF04
Report groupPerformance Subcomponent Reports
SourceXPERF_CPU_D, (described on page “XPERF_CPU_H, _D, _M” on page139)
AttributesUNIX, Performance, System, Usage, Daily, Overview
VariablesDate, Period name
Performance reports
176 Tivoli Decision Support for z/OS: Distributed Systems Performance Feature Guide and Reference

The report contains this information:
Node nameThe name of the node in the network.
CPU usage avg (%)The average processor utilization, in percent.
CPU usage max (%)The maximum processor utilization, in percent.
Mem free pages avgThe average number of free pages of memory.
Mem free pages minThe minimum number of free pages of memory.
Paging rate avgThe average paging rate, per second.
Paging rate maxThe maximum paging rate, per second.
Processes avgThe average number of processes.
Processes maxThe maximum number of processes.
Users avgThe average number of users for this node.
Users maxThe maximum number of users for this node.
UNIX Perf Vol Group and File Syst, Daily OverviewThis report only covers nodes that use AIX. For a specific node in the network, thisreport (see Figure 68 on page 178) provides daily overview information aboutspace utilization: average allocated and free space (in megabytes), and the averagepercentage used space (by space name and device name). The report is producedby period name (for example, PRIME or NIGHT).
This information identifies the report:
Report IDXPERF05
Report groupPerformance Subcomponent Reports
UNIX Perf Statistics all Systems, Daily OverviewDate: 1999-12-27 Period: ’PRIME ’
| CPU CPU Mem free Mem free Paging Paging| usage usage pages pages rate rate Processes Processes Users Users
Node name | avg (%) max /%) avg min avg max avg max avg max---------------| -------- -------- -------- -------- -------- -------- --------- --------- -------- --------hp111 | 5.6 50 1068 125 0.01 2 91.4 96 7.1 8sun333 | 18.2 74 621 62 0.15 18 163.9 202 13.5 17
Tivoli Decision Support for z/OS Report: XPERF04
Figure 67. Example of UNIX Perf Statistics all Systems, Daily Overview
Performance reports
Chapter 14. Reports 177
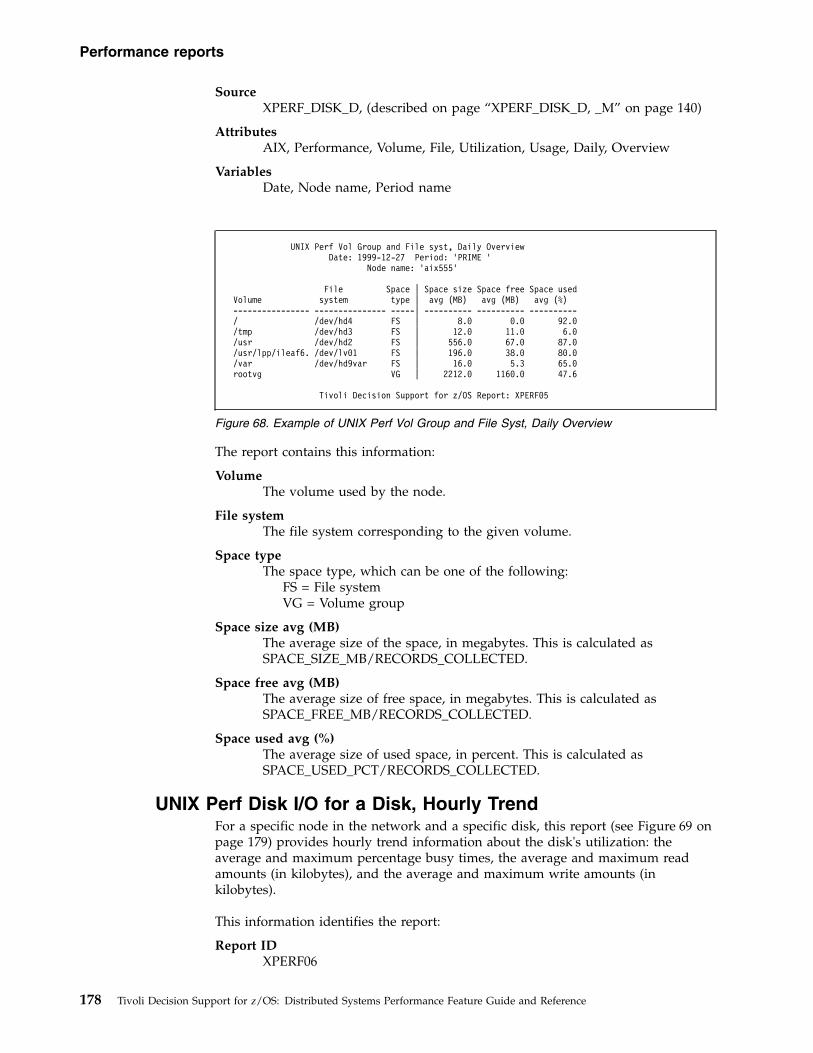
SourceXPERF_DISK_D, (described on page “XPERF_DISK_D, _M” on page 140)
AttributesAIX, Performance, Volume, File, Utilization, Usage, Daily, Overview
VariablesDate, Node name, Period name
The report contains this information:
VolumeThe volume used by the node.
File systemThe file system corresponding to the given volume.
Space typeThe space type, which can be one of the following:
FS = File systemVG = Volume group
Space size avg (MB)The average size of the space, in megabytes. This is calculated asSPACE_SIZE_MB/RECORDS_COLLECTED.
Space free avg (MB)The average size of free space, in megabytes. This is calculated asSPACE_FREE_MB/RECORDS_COLLECTED.
Space used avg (%)The average size of used space, in percent. This is calculated asSPACE_USED_PCT/RECORDS_COLLECTED.
UNIX Perf Disk I/O for a Disk, Hourly TrendFor a specific node in the network and a specific disk, this report (see Figure 69 onpage 179) provides hourly trend information about the disk's utilization: theaverage and maximum percentage busy times, the average and maximum readamounts (in kilobytes), and the average and maximum write amounts (inkilobytes).
This information identifies the report:
Report IDXPERF06
UNIX Perf Vol Group and File syst, Daily OverviewDate: 1999-12-27 Period: ’PRIME ’
Node name: ’aix555’
File Space | Space size Space free Space usedVolume system type | avg (MB) avg (MB) avg (%)---------------- --------------- -----| ---------- ---------- ----------/ /dev/hd4 FS | 8.0 0.0 92.0/tmp /dev/hd3 FS | 12.0 11.0 6.0/usr /dev/hd2 FS | 556.0 67.0 87.0/usr/lpp/ileaf6. /dev/lv01 FS | 196.0 38.0 80.0/var /dev/hd9var FS | 16.0 5.3 65.0rootvg VG | 2212.0 1160.0 47.6
Tivoli Decision Support for z/OS Report: XPERF05
Figure 68. Example of UNIX Perf Vol Group and File Syst, Daily Overview
Performance reports
178 Tivoli Decision Support for z/OS: Distributed Systems Performance Feature Guide and Reference

Report groupPerformance Subcomponent Reports
SourceXPERF_DISKIO_H, (described on page “XPERF_DISKIO_H, _D, _M” onpage 140)
AttributesUNIX, Performance, Disk, I/O, System, Hourly, Trend
VariablesDate, Disk, Node name
The report contains this information:
Hour The hour of the day.
Busy avg (%)The average time in which the processor was busy, in percent.
Busy max (%)The maximum time in which the processor was busy, in percent.
Read avg (KB/sec)The average amount of disk space read per second, in kilobytes. This iscalculated as READ_KB_TOTAL/MEASURED_SEC.
Read max (KB/sec)The maximum amount of disk space read per second, in kilobytes.
Write avg (KB/sec)The average amount of disk space written per second, in kilobytes. This iscalculated as WRITE_KB_TOTAL/MEASURED_SEC.
Write max (KB/sec)The maximum amount of disk space written per second, in kilobytes.
RW avg (KB/sec)The average amount of disk space read and written per second, inkilobytes. This is calculated as RW_KB_TOTAL/MEASURED_SEC.
RW max (KB/sec)The maximum amount of disk space read and written per second, inkilobytes.
UNIX Perf Disk I/O for a Disk, Hourly TrendDate: 1999-12-09
Node name: ’aix555 ’ Disk: ’hdisk8’
Busy avg Busy max Read avg Read max Write avg Write max RW avg RW maxHour (%) (%) (KB/sec) (KB/sec) (KB/sec) (KB/sec) (KB/sec) (KB/sec)
------ ---------- ---------- ---------- ---------- ---------- ---------- --------- ----------12 12.9 110.6 1.7 52.0 5.4 18.0 7.1 70.013 8.9 40.9 0.4 14.0 4.3 8.0 4.7 22.014 8.6 24.2 0.1 6.0 4.4 8.0 4.5 14.015 53.1 361.1 20.0 219.0 11.3 67.0 31.3 286.016 16.3 87.2 3.7 35.0 5.1 13.0 8.8 48.017 17.3 115.3 3.2 55.0 6.2 14.0 9.4 69.018 8.1 19.9 0.2 5.0 4.1 6.0 4.3 11.019 7.6 10.0 1.0 10.2 3.6 5.0 4.6 15.220 7.7 9.7 0.5 4.1 4.9 5.0 5.4 9.121 7.7 10.6 1.5 17.3 4.0 4.0 5.5 21.322 7.7 9.8 0.1 1.9 2.2 5.0 2.3 6.923 7.6 9.8 0.3 2.2 4.5 5.0 4.8 7.2
========== ========== ========== ========== ========== ========== ========= ==========Avg/max 13.6 361.1 2.7 219.0 5.0 67.0 7.7 286.0
Tivoli Decision Support for z/OS Report: XPERF06
Figure 69. Example of UNIX Perf Disk I/O for a Disk, Hourly Trend
Performance reports
Chapter 14. Reports 179

UNIX Perf Disk I/O for System, Daily OverviewFor a specific node in the network, this report (see Figure 70) provides dailyoverview information about the utilization of disks at the node: the average andmaximum percentage busy times, the average and maximum read amounts (inkilobytes), and the average and maximum write amounts (in kilobytes). The reportis produced by period name (for example, PRIME or NIGHT). If you require moredetailed hourly trend information about a disk's utilization, you can proceed to thereport “UNIX Perf Disk I/O for a Disk, Hourly Trend” on page 178.
This information identifies the report:
Report IDXPERF07
Report groupPerformance Subcomponent Reports
SourceXPERF_DISKIO_D, (described on page “XPERF_DISKIO_H, _D, _M” onpage 140)
AttributesUNIX, Performance, Disk, I/O, System, Daily, Overview
VariablesDate, Node name, Period name
The report contains this information:
Disk nameThe name of the physical disk.
Busy avg (%)The average time in which the disk was busy, in percent.
Busy max (%)The maximum time in which the disk was busy, in percent.
Read avg (KB/sec)The average amount of disk that was read per second, in kilobytes. This iscalculated as READ_KB_TOTAL/MEASURED_SEC.
Read max (KB/sec)The maximum amount of disk that was read per second, in kilobytes.
UNIX Perf Disk I/O for System, Daily OverviewDate: 1999-12-27 Period: ’PRIME ’
Node name: ’hp111’
Busy avg Busy max Read avg Read max Write avg Write maxDisk name (%) (%) (KB/sec) (KB/sec) (KB/sec) (KB/sec)---------- ---------- ---------- ---------- ---------- ---------- ----------hdisk0 33.5 17.0 1.0 1.4 11.1 40.0hdisk1 11.4 14.5 1.1 1.4 10.4 12.2hdisk2 10.0 10.0 1.0 1.0 10.0 1.2hdisk3 14.3 19.1 1.5 13.0 11.1 18.8
========== ========== ========== ========== ========== ==========Avg/max 17.3 19.1 1.1 13.0 10.6 40.0
Tivoli Decision Support for z/OS Report: XPERF07
Figure 70. Example of UNIX Perf Disk I/O for System, Daily Overview
Performance reports
180 Tivoli Decision Support for z/OS: Distributed Systems Performance Feature Guide and Reference

Write avg (KB/sec)The average amount of disk that was written per second, in kilobytes. Thisis calculated as WRITE_KB_TOTAL/MEASURED_SEC.
Write max (KB/sec)The maximum amount of disk that was written per second, in kilobytes.
UNIX Perf Page Space Utilization, Hourly TrendFor a specific node in the network, this report (see Figure 71 on page 182) providesdaily overview information about the utilization of page space at the node. Foreach page space, information about the disk name for the page space, page spacesize, and the amount of page space used (in kilobytes and also as a percentage), isgiven.
This information identifies the report:
Report IDXPERF08
Report groupPerformance Subcomponent Reports
SourceXPERF_PAGING_H, (described on page “XPERF_PAGING_H, _D, _M” onpage 141)
AttributesUNIX, Performance, Page, Space, Utilization, Hourly, Trend
VariablesDate, Node name
Performance reports
Chapter 14. Reports 181

The report contains this information:
Hour The hour of the day.
Page space nameThe name of the page space used by the node.
Disk nameThe physical disk name.
Page space size (MB)The size of the page space, in megabytes.
Page space used (MB)The amount of page space used, in megabytes.
Page space used (%)The amount of page space used, in percent. This is calculated as100*PS_USED_AVG_KB/PS_SIZE_AVG_KB.
LINUX Percentile Work SizeThis report shows the work space allocation for the disks on the file system.
The following information identifies the report:
Report ID:XLINU01
Report group:LINUX Reports
Source:XDISK_INFOR
UNIX Perf Page Space Utilization, Hourly TrendDate: 1999-01-14
Node name: ’hp111’
Page space Page space Page space Page spaceHour name Disk name size (MB) used (MB) used (%)
----- ----------- ---------- ---------- ---------- ----------. . . . . .8 hd6 hdisk0 96 63 66.1
9 hd6 hdisk0 96 65 67.7
10 hd6 hdisk0 96 66 68.9
11 hd6 hdisk0 96 67 69.8
12 hd6 hdisk0 96 67 69.8
13 hd6 hdisk0 96 67 69.8
14 hd6 hdisk0 96 68 71.2
15 hd6 hdisk0 96 68 70.8
16 hd6 hdisk0 96 67 70.0
17 hd6 hdisk0 96 68 70.8
18 hd6 hdisk0 96 67 70.3
19 hd6 hdisk0 96 68 70.8
20 hd6 hdisk0 96 68 70.8
Tivoli Decision Support for z/OS Report: XPERF08
Figure 71. Example of UNIX Perf Page Space Utilization, Hourly Trend
Performance reports
182 Tivoli Decision Support for z/OS: Distributed Systems Performance Feature Guide and Reference

Attributes:PERFORMANCE, CPU, UTILIZATION, USAGE, HOURLY, TREND, UNIX,LINUX
The report contains the following information:
DATE Date of the measurement.
PERIODName of the period.
FILE SYSName of the file system.
MAX SIZEMaximum size of the disk.
% WORK SIZEPercentage work space on the disk.
LINUX Disk Space AllocationThis report shows the free space allocation for the disks on the file system.
The following information identifies the report:
Report ID:XLINU02
Report group:LINUX Reports
Source:XDISK_INFOR
Attributes:PERFORMANCE, CPU, UTILIZATION, USAGE, HOURLY, TREND, UNIX,LINUX
LINUX - PERCENTILE WORK SIZE
DATE PERIOD FILE SYS MAX SIZE % WORK SIZE---------- -------- --------- ----------- -----------2001-01-16 PRIME /dev/hda7 23474136 9
/dev/hda1 54416 10/dev/hda5 5044156 6
NIGHT /dev/hda7 164318952 9/dev/hda1 380912 10/dev/hda5 35309092 6
Figure 72. Example of a LINUX - Percentile Work Size report
Performance reports
Chapter 14. Reports 183
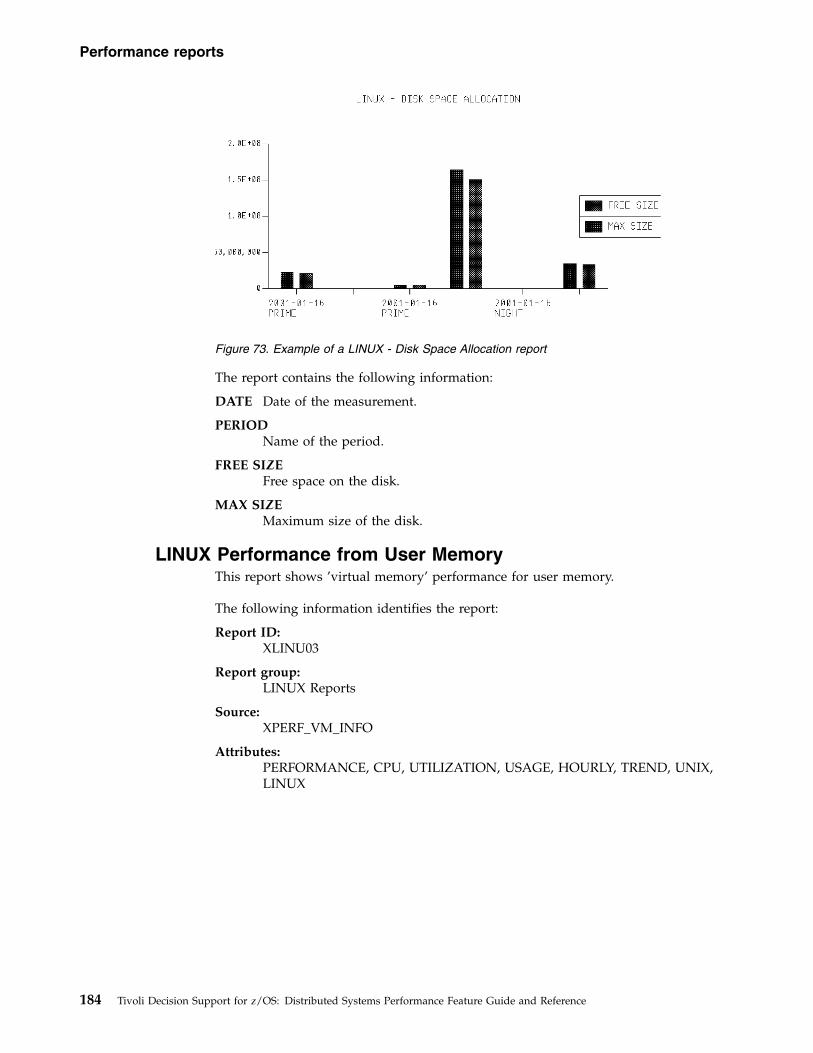
The report contains the following information:
DATE Date of the measurement.
PERIODName of the period.
FREE SIZEFree space on the disk.
MAX SIZEMaximum size of the disk.
LINUX Performance from User MemoryThis report shows ’virtual memory’ performance for user memory.
The following information identifies the report:
Report ID:XLINU03
Report group:LINUX Reports
Source:XPERF_VM_INFO
Attributes:PERFORMANCE, CPU, UTILIZATION, USAGE, HOURLY, TREND, UNIX,LINUX
Figure 73. Example of a LINUX - Disk Space Allocation report
Performance reports
184 Tivoli Decision Support for z/OS: Distributed Systems Performance Feature Guide and Reference

The report contains the following information:
DATE Date of the measurement.
PERIODName of the period.
MAX MEMMaximum memory used.
AVG MEMAverage memory used.
MIN MEMMinimum memory used.
LINUX Performance ’PS’ for Volumes InfoThis report shows ’physical size’ data for the volumes used.
The following information identifies the report:
Report ID:XLINU04
Report group:LINUX Reports
Source:XPERF_PS_INFO
Attributes:PERFORMANCE, CPU, UTILIZATION, USAGE, HOURLY, TREND, UNIX,LINUX
Figure 74. Example of a LINUX - Performance from User Memory report
Performance reports
Chapter 14. Reports 185

The report contains the following information:
DATE Date of the measurement.
PERIODName of the period.
VOLUMEName of the physical volume.
SIZE Size of the physical volume.
BLOCKSNumber of blocks used on the volume.
LINUX Hardware ConfigurationThis report shows hardware configuration data for the devices used.
The following information identifies the report:
Report ID:XLINU05
Report group:LINUX Reports
Source:XCONF_HARDWARE
Attributes:PERFORMANCE, CPU, UTILIZATION, USAGE, HOURLY, TREND, UNIX,LINUX
LINUX - PERFORMANCE ’PS’ FOR VOLUMES INFO
DATE PERIOD VOLUME SIZE BLOCKS---------- -------- -------------------- ---------- ----------2001-01-16 PRIME /dev/hda6 2.650E+05 5.360E+022001-01-16 NIGHT /dev/hda6 2.650E+05 5.360E+02
Figure 75. Example of a LINUX - Performance ’PS’ for Volumes Info report
Performance reports
186 Tivoli Decision Support for z/OS: Distributed Systems Performance Feature Guide and Reference

The report contains the following information:
DATE Date of the measurement.
PERIODName of the period.
DEVICEDevice class of the hardware element.
CPU CPU identification.
ADDRESSAddress ID of the UNIX device.
ASSIGNMType of device used in the UNIX system.
BUS Type of bus used in the UNIX system.
LINUX Software ConfigurationThis report shows software configuration data for the packages used.
The following information identifies the report:
Report ID:XLINU06
Report group:LINUX Reports
Source:XCONF_SOFTWARE
Attributes:PERFORMANCE, CPU, UTILIZATION, USAGE, HOURLY, TREND, UNIX,LINUX
LINUX - HARDWARE CONFIGURATION
DATE PERIOD DEVICE CPU ADDRESS ASSIGNM BUS
---------- -------- ---------- ---------- ---------- ------- -------2001-01-16 NIGHT OTHER 8086 1130 PCI
2001-01-16 NIGHT OTHER 8086 1131 PCI
2001-01-16 NIGHT OTHER 8086 244e PCI
2001-01-16 NIGHT OTHER 8086 2440 PCI
2001-01-16 NIGHT OTHER 8086 244b PCI
2001-01-16 NIGHT OTHER 8086 2442 PCI
2001-01-16 NIGHT OTHER 8086 2443 PCI
2001-01-16 NIGHT NETWORK 8086 2449 eth PCI
Figure 76. Example of a LINUX - Hardware Configuration report
Performance reports
Chapter 14. Reports 187

The report contains the following information:
DATE Date of the measurement.
PERIODName of the period.
PACKAGEName of the package used on the system.
VERSIONSoftware version of the package installed on the system.
LINUX User InformationThis report shows process information related to users.
The following information identifies the report:
Report ID:XLINU07
Report group:LINUX Reports
Source:XWTMP_INFOR
Attributes:PERFORMANCE, CPU, UTILIZATION, USAGE, HOURLY, TREND, UNIX,LINUX
LINUX - SOFTWARE CONFIGURATION
DATE PERIOD PACKAGE VERSION
---------- -------- ----------------------------------- -------2001-01-16 NIGHT anacron 2.1
2001-01-16 NIGHT apmd 3.0
2001-01-16 NIGHT ash 0.2
2001-01-16 NIGHT at 3.1
2001-01-16 NIGHT audiofile 0.1
2001-01-16 NIGHT audiofile-devel 0.1
2001-01-16 NIGHT aumix 1.3
2001-01-16 NIGHT authconfig 3.0
2001-01-16 NIGHT authconf 2.1
Figure 77. Example of a LINUX - Software Configuration report
Performance reports
188 Tivoli Decision Support for z/OS: Distributed Systems Performance Feature Guide and Reference

The report contains the following information:
DATE Date of the measurement.
PERIODName of the period.
USER User login name.
ENTRYEntry type.
PROCEDProcess ID.
NODENode name.
LINUX Process InformationThis report shows process information related to users.
The following information identifies the report:
Report ID:XLINU08
Report group:LINUX Reports
Source:XDTMP_INFOR
Attributes:PERFORMANCE, CPU, UTILIZATION, USAGE, HOURLY, TREND, UNIX,LINUX
LINUX - USER INFORMATION
DATE PERIOD USER ENTRY PROCED NODE
---------- -------- ---------- ----- ------ --------------2001-01-08 PRIME 08 000007 2.2.14-12
2001-01-08 PRIME reboot 02 000000 2.2.14-12
2001-01-08 PRIME runlevel 01 020019 2.2.14-12
2001-01-08 PRIME LOGIN 06 000590
2001-01-08 PRIME root 07 000590
2001-01-08 NIGHT runlevel 01 013616 2.2.14-12
2001-01-08 NIGHT 08 000599 2.2.14-12
2001-01-08 NIGHT shutdown 01 000000 2.2.14-12
Figure 78. Example of a LINUX - User Information report
Performance reports
Chapter 14. Reports 189

The report contains the following information:
DATE Date of the measurement.
PERIODName of the period.
ID User ID.
NAMEUser name.
BLOCKSNumber of disk blocks that are used.
LINUX Performance ’VM’ for Swap MemoryThis report shows ’virtual memory’ performance for swap memory.
The following information identifies the report:
Report ID:XLINU09
Report group:LINUX Reports
Source:XPERF_VM_INFO
Attributes:PERFORMANCE, CPU, UTILIZATION, USAGE, HOURLY, TREND, UNIX,LINUX
LINUX - PROCESS INFORMATION
DATE PERIOD ID NAME BLOCKS---------- -------- --------- -------------------- -----------2001-01-17 NIGHT 0 root 7823802001-01-17 NIGHT 1 bin 02001-01-17 NIGHT 2 daemon 82001-01-17 NIGHT 3 adm 02001-01-17 NIGHT 4 lp 02001-01-17 NIGHT 5 sync 02001-01-17 NIGHT 6 shutdown 02001-01-17 NIGHT 7 halt 0
Figure 79. Example of a LINUX - Process Information report
Performance reports
190 Tivoli Decision Support for z/OS: Distributed Systems Performance Feature Guide and Reference

The report contains the following information:
DATE Date of the measurement.
PERIODName of the period.
MAX MEMMaximum swap memory used.
AVG MEMAverage swap memory used.
MIN MEMMinimum swap memory used.
LINUX Performance ’VM’ for CPUThis report shows ’virtual memory’ performance for CPU activity.
The following information identifies the report:
Report ID:XLINU10
Report group:LINUX Reports
Source:XPERF_VM_INFO
Attributes:PERFORMANCE, CPU, UTILIZATION, USAGE, HOURLY, TREND, UNIX,LINUX
Figure 80. Example of a LINUX - Performance ’VM’ for Swap Memory report
Performance reports
Chapter 14. Reports 191

The report contains the following information:
DATE Date of the measurement.
PERIODName of the period.
MAX CPUMaximum CPU value.
AVG CPUAverage CPU value.
MIN CPUMinimum CPU value.
Reports in the Windows componentThis section describes the Windows subcomponent reports:v “Windows Disk Usage for System, Hourly Trend.”v “Windows Disk Usage for Device, Daily Overview” on page 193.v “Windows CPU Utilization by System, Hourly Trend” on page 194.v “Windows CPU Utilization by System, Daily Overview” on page 195.v “Windows Memory Usage by System, Hourly Trend” on page 196.v “Windows Memory Usage by System, Daily Overview” on page 197.v “Windows System Overview Report” on page 198.
Windows Disk Usage for System, Hourly TrendThis report show the hourly trend of disk usage on a selected days for selectednodes. It allows you to identify potential periods during the day when unusuallyhigh disk usage is taking place.
This information identifies the report:
Report IDWIN001
Report groupWINDOWS
Figure 81. Example of a LINUX - Performance ’VM’ for CPU report
Performance reports
192 Tivoli Decision Support for z/OS: Distributed Systems Performance Feature Guide and Reference

SourceWIN_PERF_DD_H
AttributesWINDOWS, DISK, DEVICE, TREND, FREE, SPACE
VariablesFROM_DATE, TO_DATE, NODE_NAME
Windows Disk Usage for Device, Daily OverviewThis report show the daily overview of disk usage for the selected nodes anddevices, if any. It allows you to identify potential adverse changes in disk usage.
This information identifies the report:
Report IDWIN002
Report groupWINDOWS
SourceWIN_PERF_DD_D
AttributesWINDOWS, DISK, DEVICE, OVERVIEW, FREE, SPACE
VariablesNODE_NAME, DEVICE_NAME
Windows Disk Usage for System, Hourly TrendDate: ’2009-06-12’ to ’2009-06-12’
FREE FREE FREESPACE SPACE SPACE PERCENT PERCENT PERCENT
NODE DEVICE MIN AVG MAX FREE FREE FREENAME DATE NAME TIME (MB) (MB) (MB) MIN AVG MAX---------------- ---------- -------- -------- ---------- ---------- ---------- ------- ------- -------IBM-PAXPRIM 2009-06-12 C: 00.00.00 61691 61691 61691 67 67 67
C: 01.00.00 61684 61688 61691 67 67 67C: 02.00.00 61684 61684 61684 67 67 67C: 03.00.00 61684 61684 61684 67 67 67C: 04.00.00 61684 61684 61684 67 67 67C: 05.00.00 61684 61702 61720 67 67 67C: 06.00.00 61720 61720 61720 67 67 67C: 07.00.00 61720 61720 61720 67 67 67C: 08.00.00 61720 61720 61720 67 67 67C: 09.00.00 61720 61720 61720 67 67 67C: 10.00.00 61594 61595 61595 67 67 67C: 11.00.00 61587 61588 61588 67 67 67C: 12.00.00 61586 61587 61587 67 67 67C: 13.00.00 61584 61586 61587 67 67 67C: 14.00.00 61565 61585 61604 67 67 67C: 15.00.00 61634 61635 61635 67 67 67C: 16.00.00 61631 61633 61634 67 67 67C: 17.00.00 61629 61633 61636 67 67 67C: 18.00.00 61635 61635 61635 67 67 67C: 19.00.00 61633 61634 61634 67 67 67C: 20.00.00 61632 61632 61632 67 67 67C: 21.00.00 61631 61632 61632 67 67 67C: 22.00.00 61630 61631 61631 67 67 67C: 23.00.00 61629 61630 61630 67 67 67
Tivoli Decision Support: WIN001
Figure 82. Example of Windows Disk Usage for System, Hourly Trend
Windows component reports
Chapter 14. Reports 193

Windows CPU Utilization by System, Hourly TrendThis report show the hourly trend of CPU usage for the selected dates and nodes.It allows you to identify potential problems with processor usage.
This information identifies the report:
Report IDWIN003
Report groupWINDOWS
SourceWIN_PERF_PU_H
AttributesWINDOWS, CPU, UTILIZATION, TREND, FREE
VariablesFROM_DATE, TO_DATE, NODE_NAME
Windows Disk Usage for Device, Daily Overview
FREE FREE FREESPACE SPACE SPACE PERCENT PERCENT PERCENT
NODE DEVICE MIN AVG MAX FREE FREE FREEDATE NAME NAME (MB) (MB) (MB) MIN AVG MAX---------- ---------------- -------- ---------- ---------- ---------- ------- ------- -------2009-06-12 IBM-PAXPRIM C: 61565 61652 61720 67 67 67
Tivoli Decision Support: WIN002
Figure 83. Example of Windows Disk Usage for Device, Daily Overview
Windows component reports
194 Tivoli Decision Support for z/OS: Distributed Systems Performance Feature Guide and Reference

Windows CPU Utilization by System, Daily OverviewThis report show the daily overview of CPU usage for the selected dates andnodes. It allows you to identify potential problems with processor usage over thelonger term.
This information identifies the report:
Report IDWIN004
Report groupWINDOWS
SourceWIN_PERF_PU_D
AttributesWINDOWS, CPU, UTILIZATION, OVERVIEW, FREE
VariablesNODE_NAME
Windows CPU Utilization by System, Hourly TrendDate: ’2009-04-15’ to ’2009-06-12’
CPU CPU CPUUSAGE USAGE USAGE
NODE MIN AVG MAXNAME DATE TIME PERCENT PERCENT PERCENT---------------- ---------- -------- ------- ------- -------IBM-PAXPRIM 2009-06-12 00.00.00 4 4 7
01.00.00 4 5 502.00.00 5 5 503.00.00 5 5 504.00.00 4 5 505.00.00 4 4 506.00.00 4 4 407.00.00 4 4 408.00.00 4 4 409.00.00 4 4 510.00.00 4 5 511.00.00 5 5 512.00.00 5 5 513.00.00 5 5 514.00.00 5 5 515.00.00 5 5 516.00.00 5 5 517.00.00 5 5 618.00.00 6 6 619.00.00 6 7 720.00.00 7 7 821.00.00 8 8 822.00.00 8 9 923.00.00 9 9 9
Tivoli Decision Support: WIN003
Figure 84. Example of Windows CPU Utilization by System, Hourly Trend
Windows component reports
Chapter 14. Reports 195

Windows Memory Usage by System, Hourly TrendThis report show the hourly trend of memory usage for the selected dates andnodes. It allows you to identify potential problems with memory usage during theday.
This information identifies the report:
Report IDWIN005
Report groupWINDOWS
SourceWIN_PERF_PU_H
AttributesWINDOWS, MEMORY, USAGE, TREND, FREE
VariablesFROM_DATE, TO_DATE, NODE_NAME
Windows CPU Utilization by System, Daily Overview
CPU CPU CPUUSAGE USAGE USAGE
NODE MIN AVG MAXNAME DATE PERCENT PERCENT PERCENT---------------- ---------- ------- ------- -------IBM-PAXPRIM 2009-06-12 4 5 9IBM-PAXPRIM 2009-06-13 2 15 74IBM-PAXPRIM 2009-06-14 1 16 79
Tivoli Decision Support: WIN004
Figure 85. Example of Windows CPU Utilization by System, Daily Overview
Windows component reports
196 Tivoli Decision Support for z/OS: Distributed Systems Performance Feature Guide and Reference

Windows Memory Usage by System, Daily OverviewThis report show the daily overview of memory usage for the selected nodes. Itallows you to identify potential problems with memory usage over the medium tolong term.
This information identifies the report:
Report IDWIN006
Report groupWINDOWS
SourceWIN_PERF_PU_D
AttributesWINDOWS, MEMORY, USAGE, TREND, FREE
VariablesNODE_NAME
Windows Memory Usage by System, Hourly TrendDate: ’2009-06-12’ to ’2009-06-12’
MEMORY MEMORY MEMORYFREE FREE FREE
NODE MIN AVG MAXNAME DATE TIME (KB) (KB) (KB)---------------- ---------- -------- ---------- ---------- ----------IBM-PAXPRIM 2009-06-12 00.00.00 1399924 1407371 1408564
01.00.00 1364320 1380610 140753202.00.00 1367096 1367813 136868403.00.00 1366520 1367241 136798804.00.00 1366172 1366796 136752005.00.00 1346256 1380571 138938806.00.00 1387428 1388094 138887607.00.00 1376300 1387421 138815608.00.00 1386156 1386948 138766409.00.00 1015916 1353313 139914810.00.00 1045336 1155013 121418811.00.00 1015476 1056817 112024412.00.00 1100632 1152908 121314013.00.00 1062504 1138608 120042014.00.00 920532 984165 109666815.00.00 893760 988563 104789616.00.00 924324 983061 105048417.00.00 937800 958081 96330018.00.00 927856 941137 94411619.00.00 938352 940428 94195620.00.00 934356 939315 94093621.00.00 919056 937112 93958422.00.00 928324 933017 93526823.00.00 925836 932618 933872
Tivoli Decision Support: WIN005
Figure 86. Example of Windows Memory Usage by System, Hourly Trend
Windows component reports
Chapter 14. Reports 197

Windows System Overview ReportThis report shows the system overview for a given data range and node list. It isintended to provide a high-level health check for all listed Windows nodes.
This information identifies the report:
Report IDWIN007
Report groupWINDOWS
SourceWIN_PERF_PU_H, WIN_PERF_DD_H
AttributesWINDOWS, SYSTEM, MEMORY, DISK, USAGE, TREND, OVERVIEW
VariablesFROM_DATE, TO_DATE, NODE_NAME
Windows Memory Usage by System, Daily Overview
MEMORY MEMORY MEMORYFREE FREE FREE
NODE MIN AVG MAXNAME DATE (KB) (KB) (KB)---------------- ---------- ---------- ---------- ----------IBM-PAXPRIM 2009-06-12 893760 1159459 1408564
Tivoli Decision Support: WIN006
Figure 87. Example of Windows Memory Usage by System, Daily Overview
Windows component reports
198 Tivoli Decision Support for z/OS: Distributed Systems Performance Feature Guide and Reference

Windows System Overview ReportDate: ’2009-04-15’ to ’2009-04-15’
CPU CPU CPU MEMORY MEMORY MEMORY FREE FREE FREE FREE FREE FREEUSAGE USAGE USAGE FREE FREE FREE SPACE SPACE SPACE SPACE SPACE SPACE
NODE MIN AVG MAX MIN AVG MAX MIN AVG MAX MIN AVG MAXNAME DATE TIME % % % (KB) (KB) (KB) % % % (MB) (MB) (MB)----------- ---------- -------- ----- ----- ----- ------ ------ ------ ----- ----- ----- ----- ----- -----IBM-PAXW2K3 2009-04-15 01.00.00 0 0 0 761436 767177 769700 6 6 6 71059 71059 71059
02.00.00 0 0 0 762992 767326 768264 6 6 6 71059 71059 7105903.00.00 0 0 0 762488 767168 769344 6 6 6 71059 71059 7105904.00.00 0 0 0 763248 767604 769248 6 6 6 71059 71059 7105905.00.00 0 0 0 762536 767026 767936 6 6 6 71059 71059 7105906.00.00 0 0 0 750628 765030 768428 6 6 6 71059 71059 7105907.00.00 0 0 0 761988 766864 768684 6 6 6 71059 71059 7105908.00.00 0 0 0 761828 766428 767796 6 6 6 71059 71059 7105909.00.00 0 0 0 762660 766984 768732 6 6 6 71059 71059 7105910.00.00 0 0 0 761768 766314 767748 6 6 6 71059 71059 7105911.00.00 0 0 0 761848 767150 769156 6 6 6 71059 71059 7105912.00.00 0 0 0 763076 767396 769036 6 6 6 71059 71059 7105913.00.00 0 0 0 761764 766653 768648 6 6 6 71059 71059 7105914.00.00 0 0 0 762248 766901 768456 6 6 6 71059 71059 7105915.00.00 0 0 0 761992 766368 767444 6 6 6 71059 71059 7105916.00.00 0 0 0 759528 765585 767356 6 6 6 71059 71059 7105917.00.00 0 0 0 761256 765821 767588 6 6 6 71059 71059 7105918.00.00 0 0 0 760948 765652 767776 6 6 6 71059 71059 7105919.00.00 0 0 0 761504 765825 767204 6 6 6 71059 71059 7105920.00.00 0 0 0 760660 765440 767024 6 6 6 71059 71059 7105921.00.00 0 0 0 760556 765945 767820 6 6 6 71059 71059 7105922.00.00 0 0 0 761356 765693 767436 6 6 6 71059 71059 7105923.00.00 0 0 0 760828 766078 768404 6 6 6 71059 71059 71059
Tivoli Decision Support: WIN007
Figure 88. Example of Windows System Overview Report
Chapter 14. Reports 199

200 Tivoli Decision Support for z/OS: Distributed Systems Performance Feature Guide and Reference

Chapter 15. Log record definitions
This chapter describes (in alphabetical sequence) the following record definitions:v “XACCT_COMMAND”v “XACCT_CONNECT” on page 202v “XACCT_DISK” on page 202v “XACCT_PRINT” on page 203v “XCONFIG_HW” on page 203v “XCONFIG_SW” on page 203v “XERROR” on page 205v “XPERF_CPU” on page 206v “XPERF_DISK_FS” on page 206v “XPERF_DISK_VG” on page 207v “XPERF_DISKIO” on page 208v “XPERF_PAGING” on page 209v “WIN_PERF_DD” on page 209v “WIN_PERF_PU” on page 210
XACCT_COMMANDThis process accounting record definition is used for selecting records with recordtype PACCT.
Main section
Field name Offset Length Format Description
RECORD_LENGTH 0 2 BINARY Record length
NODE_NAME 4 16 CHAR Node name
RECORD_TYPE 21 5 CHAR Record type
DTE 27 6 CHAR Date
TME 33 6 TIME(HHMMSS) Time
AC_FLAG 40 5 EXTERNAL INTEGER Acct. flag
AC_STAT 46 5 EXTERNAL INTEGER Exit status
AC_UID 52 8 CHAR User name
AC_GID 61 8 CHAR Group name
AC_TTY 70 10 CHAR Control typewriter
AC_COMM 81 12 CHAR Command name
AC_UTIME 94 10 EXTERNAL FLOAT User time
AC_STIME 105 10 EXTERNAL FLOAT System time
AC_ETIME 116 16 EXTERNAL FLOAT Elapsed time
AC_MEM 133 10 EXTERNAL FLOAT Memory usage
AC_IO 144 16 EXTERNAL FLOAT Characters Transferred
AC_RW 161 10 EXTERNAL FLOAT Blocks Read/Written
201

XACCT_CONNECTThis connect time accounting record definition is used for selecting records withrecord type WTMP.
Main section
Field name Offset Length Format Description
RECORD_LENGTH 0 2 BINARY Record length
NODE_NAME 4 16 CHAR Node name
RECORD_TYPE 21 5 CHAR Record type
DTE 27 6 CHAR Date
TME 33 6 TIME(HHMMSS) Time
UT_USER 40 8 CHAR User login name
UT_ID 49 14 CHAR /etc/inittab ID
UT_LINE 64 12 CHAR Device name
UT_TYPE 77 2 CHAR Type of entry
UT_PID 80 6 EXTERNAL INTEGER Connect ID
E_TERMINATION 87 2 CHAR Connect term status
E_EXIT 90 2 CHAR Connect exit status
UT_TIME 93 10 EXTERNAL FLOAT Time entry was made(see Note)
UT_HOST 104 * CHAR Node name
Note:Time is given in seconds, measured from 01.01.1970
XACCT_DISKThis disk accounting record definition is used for selecting records with recordtype DTMP.
Main section
Field name Offset Length Format Description
RECORD_LENGTH 0 2 BINARY Record length
NODE_NAME 4 16 CHAR Node name
RECORD_TYPE 21 5 CHAR Record type
DTE 27 6 CHAR Date
TME 33 6 TIME(HHMMSS) Time
USERID 40 11 EXTERNAL INTEGER User ID number
USER_NAME 52 8 CHAR User name
DISK_BLOCKS 61 8 EXTERNAL INTEGER Disk blocks
XACCT_CONNECT
202 Tivoli Decision Support for z/OS: Distributed Systems Performance Feature Guide and Reference

XACCT_PRINTThis print accounting record definition is used for selecting records with recordtype QACCT.
Main section
Field name Offset Length Format Description
RECORD_LENGTH 0 2 BINARY Record length
NODE_NAME 4 16 CHAR Node name
RECORD_TYPE 21 5 CHAR Record type
DTE 27 6 CHAR Date
TME 33 6 TIME(HHMMSS) Time
PRINT_QUEUE 40 8 CHAR Printer queue remotename
PAGES 49 8 EXTERNAL INTEGER Printed pages
COPIES 58 8 EXTERNAL INTEGER The number ofprintouts
PR_USER 67 * CHAR(*) User and requestingnode
XCONFIG_HWThis hardware configuration record definition is used for selecting records withrecord type CONF and record subtypes A, D, or S.
Main section
Field name Offset Length Format Description
RECORD_LENGTH 0 2 BINARY Record length
NODE_NAME 4 16 CHAR Node name
RECORD_TYPE 21 5 CHAR Record type
DTE 27 6 CHAR Date
TME 33 6 TIME(HHMMSS) Time
RECORD_SUBTYPE 40 2 CHAR Record subtype
DEVICE_NAME 43 16 CHAR Device name
LOCATION 60 16 CHAR Location
DEVICE_CLASS 77 16 CHAR Device class
DEVICE_TYPE 94 16 CHAR Device type
DEVICE_SUBCLASS 111 16 CHAR Device subclass
DEVICE_DESC 128 * CHAR(*) Device descr.
XCONFIG_SWThis software configuration record definition is used for selecting records withrecord type CONF and record subtypes H, I, or L.
XACCT_PRINT
Chapter 15. Log record definitions 203

Main section
Field name Offset Length Format Description
RECORD_LENGTH 0 2 BINARY Record length
NODE_NAME 4 16 CHAR Node name
RECORD_TYPE 21 5 CHAR Record type
DTE 27 6 CHAR Date
TME 33 6 TIME(HHMMSS) Time
RECORD_SUBTYPE 40 2 CHAR Record subtype
Record section SUBTYPE_HAbout this task
Present if RECORD_SUBTYPE has the value H.Offset 42Length
36
Field name Offset Length Format Description
RELEASE 1 15 CHAR Release number
STATUS 17 10 CHAR Installation status
INST_DATE 28 8 CHAR Installation date
Record section SUBTYPE_IPresent if RECORD_SUBTYPE has the value I.Offset 42Length
37
Field name Offset Length Format Description
PRODUCT_ID 1 10 CHAR Product ID
FEATURE_ID 12 4 CHAR Feature ID
PRODUCT_NAME 17 20 CHAR Product name
Record section SUBTYPE_LPresent if RECORD_SUBTYPE has the value L.Offset 42Length
13
Field name Offset Length Format Description
STATE 1 12 CHAR Product state
Record section FILE_NAMEOffset 79Length
Length of FILE_NAME_L
XCONFIG_SW
204 Tivoli Decision Support for z/OS: Distributed Systems Performance Feature Guide and Reference

Field name Offset Length Format Description
FILE_NAME_L 1 4 EXTERNAL INTEGER Length of sectionFILE_NAME
FILE_NAME 6 * CHAR(*) File name
Record section PATH_NAMEOffset Dependent upon length of previous sectionLength
Length of PATH_NAME_L
Field name Offset Length Format Description
PATH_NAME_L 1 4 EXTERNAL INTEGER Length of sectionPATH_NAME
PATH_NAME 6 * CHAR(*) Path name
Record section PRODUCT_DESCPresent if RECORD_SUBTYPE has the value L.Offset Dependent upon length of previous sectionLength
Length of PRODUCT_DESC_L
Field name Offset Length Format Description
PRODUCT_DESC_L 1 4 EXTERNAL INTEGER Length of sectionPRODUCT_DESC
PRODUCT_DESC 6 * CHAR(*) Product description
XERRORThis error record definition is used for selecting records with record type ERRPT.
Main section
Field name Offset Length Format Description
RECORD_LENGTH 0 2 BINARY Record length
NODE_NAME 4 16 CHAR Node name
RECORD_TYPE 21 5 CHAR Record type
DTE 27 6 CHAR Date
TME 33 6 TIME(HHMMSS) Time
ERROR_ID 40 8 CHAR Error ID
ERROR_TYPE 49 1 CHAR Error type
ERROR_CLASS 51 1 CHAR Error class
RESOURCE_NAME 53 14 CHAR Resource name
DESCRIPTION 68 * CHAR(*) Error descr.
XCONFIG_SW
Chapter 15. Log record definitions 205
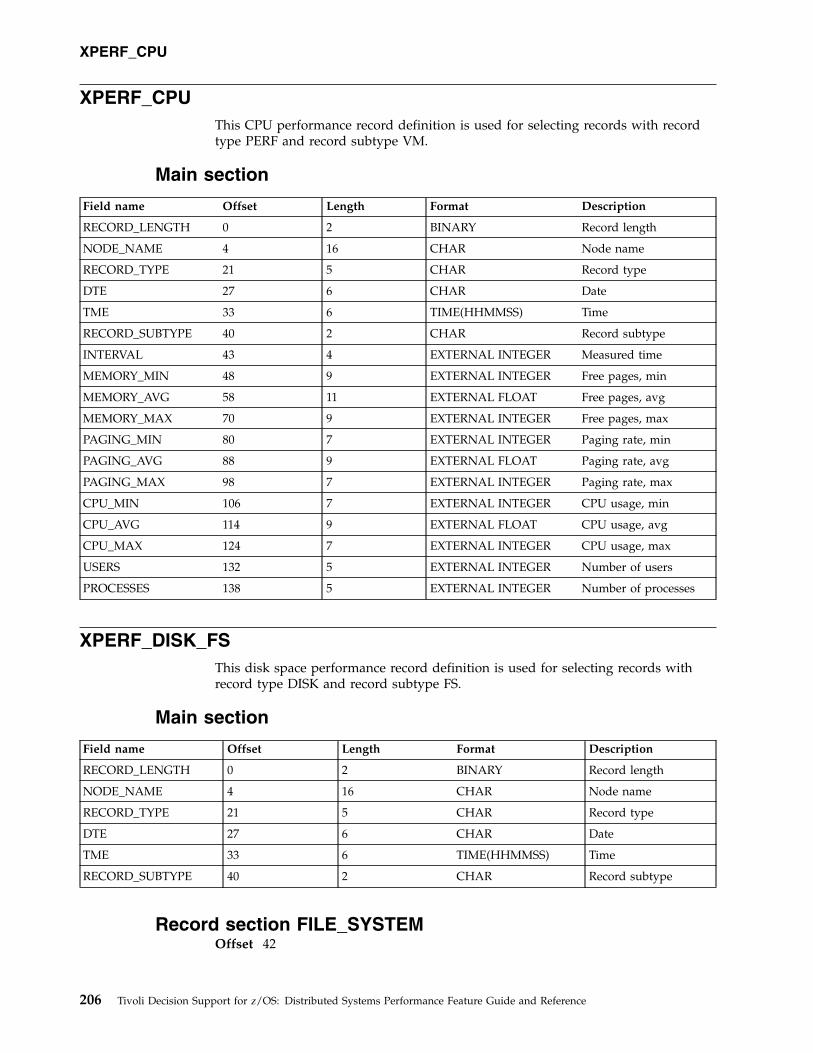
XPERF_CPUThis CPU performance record definition is used for selecting records with recordtype PERF and record subtype VM.
Main section
Field name Offset Length Format Description
RECORD_LENGTH 0 2 BINARY Record length
NODE_NAME 4 16 CHAR Node name
RECORD_TYPE 21 5 CHAR Record type
DTE 27 6 CHAR Date
TME 33 6 TIME(HHMMSS) Time
RECORD_SUBTYPE 40 2 CHAR Record subtype
INTERVAL 43 4 EXTERNAL INTEGER Measured time
MEMORY_MIN 48 9 EXTERNAL INTEGER Free pages, min
MEMORY_AVG 58 11 EXTERNAL FLOAT Free pages, avg
MEMORY_MAX 70 9 EXTERNAL INTEGER Free pages, max
PAGING_MIN 80 7 EXTERNAL INTEGER Paging rate, min
PAGING_AVG 88 9 EXTERNAL FLOAT Paging rate, avg
PAGING_MAX 98 7 EXTERNAL INTEGER Paging rate, max
CPU_MIN 106 7 EXTERNAL INTEGER CPU usage, min
CPU_AVG 114 9 EXTERNAL FLOAT CPU usage, avg
CPU_MAX 124 7 EXTERNAL INTEGER CPU usage, max
USERS 132 5 EXTERNAL INTEGER Number of users
PROCESSES 138 5 EXTERNAL INTEGER Number of processes
XPERF_DISK_FSThis disk space performance record definition is used for selecting records withrecord type DISK and record subtype FS.
Main section
Field name Offset Length Format Description
RECORD_LENGTH 0 2 BINARY Record length
NODE_NAME 4 16 CHAR Node name
RECORD_TYPE 21 5 CHAR Record type
DTE 27 6 CHAR Date
TME 33 6 TIME(HHMMSS) Time
RECORD_SUBTYPE 40 2 CHAR Record subtype
Record section FILE_SYSTEMOffset 42
XPERF_CPU
206 Tivoli Decision Support for z/OS: Distributed Systems Performance Feature Guide and Reference

Length24
Field name Offset Length Format Description
TOTAL_SPACE_KB 1 9 EXTERNAL INTEGER Total space, in kilobytes
FREE_SPACE_KB 11 9 EXTERNAL INTEGER Free space, in kilobytes
USED_SPACE_PCT 21 3 EXTERNAL INTEGER Used space, in percent
Record section DEVICE_NAMEOffset 66Length
Length of DEVICE_NAME_L
Field name Offset Length Format Description
DEVICE_NAME_L 1 4 EXTERNAL INTEGER Length of sectionDEVICE_NAME
DEVICE_NAME 6 * CHAR(*) Device name
Record section SPACE_NAMEOffset 66Length
Length of SPACE_NAME_L
Field name Offset Length Format Description
SPACE_NAME_L 1 4 EXTERNAL INTEGER Length of sectionSPACE_NAME
SPACE_NAME 6 * CHAR(*) Space name
XPERF_DISK_VGThis disk space performance record definition is used for selecting records withrecord type DISK and record subtype VG.
Main section
Field name Offset Length Format Description
RECORD_LENGTH 0 2 BINARY Record length
NODE_NAME 4 16 CHAR Node name
RECORD_TYPE 21 5 CHAR Record type
DTE 27 6 CHAR Date
TME 33 6 TIME(HHMMSS) Time
RECORD_SUBTYPE 40 2 CHAR Record subtype
Record section VOLUME_GROUPOffset 42Length
30
XPERF_DISK_FS
Chapter 15. Log record definitions 207

Field name Offset Length Format Description
TOTAL_SPACE_MB 1 9 EXTERNAL INTEGER Total space, inmegabytes
FREE_SPACE_MB 11 9 EXTERNAL INTEGER Free space, inmegabytes
USED_SPACE_MB 21 9 EXTERNAL INTEGER Used space, inmegabytes
Record section SPACE_NAMEOffset Dependent upon length of previous sectionLength
Length of SPACE_NAME_L
Field name Offset Length Format Description
SPACE_NAME_L 1 4 EXTERNAL INTEGER Length of sectionSPACE_NAME
SPACE_NAME 6 * CHAR(*) Space name
XPERF_DISKIOThis disk I/O performance record definition is used for selecting records withrecord type PERF and record subtype IO.
Main section
Field name Offset Length Format Description
RECORD_LENGTH 0 2 BINARY Record length
NODE_NAME 4 16 CHAR Node name
RECORD_TYPE 21 5 CHAR Record type
DTE 27 6 CHAR Date
TME 33 6 TIME(HHMMSS) Time
RECORD_SUBTYPE 40 2 CHAR Record subtype
INTERVAL 43 4 EXTERNAL INTEGER Measurement interval
MINREAD 48 9 EXTERNAL INTEGER KB read, minimum
AVGREAD 58 9 EXTERNAL FLOAT KB read, average
MAXREAD 68 9 EXTERNAL INTEGER KB read, maximum
TOTREAD 78 8 EXTERNAL INTEGER KB read, total
MINWRITE 87 7 EXTERNAL INTEGER KB write, minimum
AVGWRITE 95 9 EXTERNAL FLOAT KB write, average
MAXWRITE 105 7 EXTERNAL INTEGER KB write, maximum
TOTWRITE 113 8 EXTERNAL INTEGER KB write, total
MINRW 122 7 EXTERNAL INTEGER KB read and written,minimum
AVGRW 130 9 EXTERNAL FLOAT KB read and written,average
XPERF_DISK_VG
208 Tivoli Decision Support for z/OS: Distributed Systems Performance Feature Guide and Reference

Field name Offset Length Format Description
MAXRW 140 7 EXTERNAL INTEGER KB read and written,maximum
TOTRW 148 8 EXTERNAL INTEGER KB read and written,total
BUSY 157 5 EXTERNAL FLOAT Busy %
DISK 163 * CHAR(*) Physical disk name
XPERF_PAGINGThis paging space performance record definition is used for selecting records withrecord type PERF and record subtype PS.
Main section
Field name Offset Length Format Description
RECORD_LENGTH 0 2 BINARY Record length
NODE_NAME 4 16 CHAR Node name
RECORD_TYPE 21 5 CHAR Record type
DTE 27 6 CHAR Date
TME 33 6 TIME(HHMMSS) Time
RECORD_SUBTYPE 40 2 CHAR Record subtype
PAGE_SPACE 43 20 CHAR Page space name
DISK 64 20 CHAR Physical disk name
PSSIZE 85 5 EXTERNAL INTEGER Page space size in KB
PSUSE 91 5 EXTERNAL INTEGER Page space used in KB
WIN_PERF_DDThis record gives the device information for each non-removable device on themachine. The information is gathered with the following WMI command:
select Name, Size, FreeSpacefrom Win32_LogicalDiskwhere DriveType = 3
This is both gathered and reported based on the configuration itemxa_XPerfDiskFsRun. Note that there is a single space following each field.
Main section
Column Position Size Description
Type 0 2 DD to indicate this is a disk device record.
Date 3 8 YYYYMMDD of the record.
Time 12 6 HHMMSS of the record.
Node name 19 16 Node name of the machine.
Device name 36 8 Device name.
Total size 45 9 Zero-padded device size in megabytes (10242 bytes).
XPERF_DISKIO
Chapter 15. Log record definitions 209

Column Position Size Description
Free space 55 9 Zero-padded device free space in megabytes.
Free % 65 3 Zero-padded percentage free.
WIN_PERF_PUThis record gives the minimum, maximum and average figures for CPU percentageuse and memory usage. The information is gathered with the following WMIcommands:
select PercentProcessorTime, TimeStamp_100NSfrom Win32_PerfRawData_PerfOS_Processorwhere Name = ’_Total’
select TotalPhysicalMemoryfrom Win32_LogicalMemoryConfiguration
select AvailableKBytesfrom Win32_PerfFormattedData_PerfOS_Memory
This is gathered continuously and reported (aggregated) based on theconfiguration item xb_XPerfCpuRun. Note that there is a single space followingeach field.
Main section
Column Posit ion Size Description
Type 0 2 PU to indicate this is a performance usage record.
Date 3 8 YYYYMMDD of the record.
Time 12 6 HHMMSS of the record.
Node name 19 16 Node name of the machine.
CPU count 36 2 Number of CPUs in this system.
Average CPUusage
39 3 Zero-padded average CPU percentage usage for period. This is the average ofall the snapshots in the period.
Minimum CPUusage
43 3 Zero-padded minimum CPU percentage usage for period. A snapshot CPUusage figure is calculated by sampling all of the CPUs and averaging theirusage (so a 2-CPU system running at 70% and 30% gives 50%). Thesesnapshots are collected as often as possible but only reported based on thexb_XPerfCpuRun configuration item. This is the minimum snapshot for theperiod.
Maximum CPUusage
47 3 Zero-padded maximum CPU percentage usage for period. This is theminimum snapshot for the period.
Memory size 51 9 Zero-padded total memory size at end of period, in kilobytes.
Averagememory
61 9 Zero-padded average memory free for period, in kilobytes.
Minimummemory
71 9 Zero-padded minimum memory free for period, in kilobytes (1024 bytes).
Maximummemory
81 9 Zero-padded maximum memory free for period, in kilobytes.
WIN_PERF_DD
210 Tivoli Decision Support for z/OS: Distributed Systems Performance Feature Guide and Reference

Part 5. Appendixes
211

212 Tivoli Decision Support for z/OS: Distributed Systems Performance Feature Guide and Reference

Appendix. Support information
If you have a problem with your IBM software, you want to resolve it quickly. Thissection describes the following options for obtaining support for IBM softwareproducts:v “Searching knowledge bases”v “Obtaining fixes”v “Receiving weekly support updates” on page 214v “Contacting IBM Software Support” on page 214
Searching knowledge basesYou can search the available knowledge bases to determine whether your problemwas already encountered and is already documented.
Searching the information centerIBM provides extensive documentation that can be installed on your localcomputer or on an intranet server. You can use the search function of thisinformation center to query conceptual information, instructions for completingtasks, and reference information.
Searching the InternetIf you cannot find an answer to your question in the information center, search theInternet for the latest, most complete information that might help you resolve yourproblem.
To search multiple Internet resources for your product, use the Web search topic inyour information center. In the navigation frame, click Troubleshooting andsupport ► Searching knowledge bases and select Web search. From this topic, youcan search a variety of resources, including the following:v IBM technotesv IBM downloadsv IBM developerWorks®
v Forums and newsgroupsv Google
Obtaining fixesA product fix might be available to resolve your problem. To determine what fixesare available for your IBM software product, follow these steps:1. Go to the IBM Software Support Web site at http://www.ibm.com/software/
support/.2. Click Downloads and drivers in the Support topics section.3. Select the Software category.4. Select a product in the Sub-category list.5. In the Find downloads and drivers by product section, select one software
category from the Category list.6. Select one product from the Sub-category list.
213

7. Type more search terms in the Search within results if you want to refine yoursearch.
8. Click Search.9. From the list of downloads returned by your search, click the name of a fix to
read the description of the fix and to optionally download the fix.
For more information about the types of fixes that are available, see the IBMSoftware Support Handbook at http://www-304.ibm.com/support/customercare/sas/f/handbook/home.html.
Receiving weekly support updatesTo receive weekly e-mail notifications about fixes and other software support news,follow these steps:1. Go to the IBM Software Support Web site at http://www.ibm.com/support/
us/.2. Click My support in the upper right corner of the page.3. If you have already registered for My support, sign in and skip to the next
step. If you have not registered, click register now. Complete the registrationform using your e-mail address as your IBM ID and click Submit.
4. Click Edit profile.5. In the Products list, select Software. A second list is displayed.6. In the second list, select a product segment, for example, Application servers.
A third list is displayed.7. In the third list, select a product sub-segment, for example, Distributed
Application & Web Servers. A list of applicable products is displayed.8. Select the products for which you want to receive updates, for example, IBM
HTTP Server and WebSphere® Application Server.9. Click Add products.
10. After selecting all products that are of interest to you, click Subscribe to emailon the Edit profile tab.
11. Select Please send these documents by weekly email.12. Update your e-mail address as needed.13. In the Documents list, select Software.14. Select the types of documents that you want to receive information about.15. Click Update.
If you experience problems with the My support feature, you can obtain help inone of the following ways:
OnlineSend an e-mail message to [email protected], describing your problem.
By phoneCall 1-800-IBM-4You (1-800-426-4968).
Contacting IBM Software SupportIBM Software Support provides assistance with product defects.
214 Tivoli Decision Support for z/OS: Distributed Systems Performance Feature Guide and Reference

Before contacting IBM Software Support, your company must have an active IBMsoftware maintenance contract, and you must be authorized to submit problems toIBM. The type of software maintenance contract that you need depends on thetype of product you have:v For IBM distributed software products (including, but not limited to, Tivoli,
Lotus®, and Rational® products, as well as DB2 and WebSphere products thatrun on Windows, or UNIX operating systems), enroll in Passport Advantage® inone of the following ways:
OnlineGo to the Passport Advantage Web site at http://www.lotus.com/services/passport.nsf/ WebDocs/Passport_Advantage_Home and clickHow to Enroll.
By phoneFor the phone number to call in your country, go to the IBM SoftwareSupport Web site at http://techsupport.services.ibm.com/guides/contacts.html and click the name of your geographic region.
v For customers with Subscription and Support (S & S) contracts, go to theSoftware Service Request Web site at https://techsupport.services.ibm.com/ssr/login.
v For customers with IBMLink, CATIA, Linux, S/390®, iSeries, pSeries, zSeries,and other support agreements, go to the IBM Support Line Web site athttp://www.ibm.com/services/us/index.wss/so/its/a1000030/dt006.
v For IBM eServer™ software products (including, but not limited to, DB2 andWebSphere products that run in zSeries, pSeries, and iSeries environments), youcan purchase a software maintenance agreement by working directly with anIBM sales representative or an IBM Business Partner. For more informationabout support for eServer software products, go to the IBM Technical SupportAdvantage Web site at http://www.ibm.com/servers/eserver/techsupport.html.
If you are not sure what type of software maintenance contract you need, call1-800-IBMSERV (1-800-426-7378) in the United States. From other countries, go tothe contacts page of the IBM Software Support Handbook on the Web athttp://techsupport.services.ibm.com/guides/contacts.html and click the name ofyour geographic region for phone numbers of people who provide support foryour location.
To contact IBM Software support, follow these steps:1. “Determining the business impact”2. “Describing problems and gathering information” on page 2163. “Submitting problems” on page 216
Determining the business impactWhen you report a problem to IBM, you are asked to supply a severity level.Therefore, you need to understand and assess the business impact of the problemthat you are reporting. Use the following criteria:
Severity 1The problem has a critical business impact. You are unable to use theprogram, resulting in a critical impact on operations. This conditionrequires an immediate solution.
Appendix. Support information 215

Severity 2The problem has a significant business impact. The program is usable, butit is severely limited.
Severity 3The problem has some business impact. The program is usable, but lesssignificant features (not critical to operations) are unavailable.
Severity 4The problem has minimal business impact. The problem causes little impacton operations, or a reasonable circumvention to the problem wasimplemented.
Describing problems and gathering informationWhen describing a problem to IBM, be as specific as possible. Include all relevantbackground information so that IBM Software Support specialists can help yousolve the problem efficiently. To save time, know the answers to these questions:v What software versions were you running when the problem occurred?v Do you have logs, traces, and messages that are related to the problem
symptoms? IBM Software Support is likely to ask for this information.v Can you re-create the problem? If so, what steps were performed to re-create the
problem?v Did you make any changes to the system? For example, did you make changes
to the hardware, operating system, networking software, and so on.v Are you currently using a workaround for the problem? If so, be prepared to
explain the workaround when you report the problem.
Submitting problemsYou can submit your problem to IBM Software Support in one of two ways:
OnlineClick Submit and track problems on the IBM Software Support site athttp://www.ibm.com/software/support/probsub.html. Type yourinformation into the appropriate problem submission form.
By phoneFor the phone number to call in your country, go to the contacts page ofthe IBM Software Support Handbook at http://techsupport.services.ibm.com/guides/contacts.html and click the name of your geographic region.
If the problem you submit is for a software defect or for missing or inaccuratedocumentation, IBM Software Support creates an Authorized Program AnalysisReport (APAR). The APAR describes the problem in detail. Whenever possible,IBM Software Support provides a workaround that you can implement until theAPAR is resolved and a fix is delivered. IBM publishes resolved APARs on theSoftware Support Web site daily, so that other users who experience the sameproblem can benefit from the same resolution.
216 Tivoli Decision Support for z/OS: Distributed Systems Performance Feature Guide and Reference

Notices
This information was developed for products and services offered in the U.S.A.IBM may not offer the products, services, or features discussed in this document inother countries. Consult your local IBM representative for information on theproducts and services currently available in your area. Any reference to an IBMproduct, program, or service is not intended to state or imply that only that IBMproduct, program, or service may be used. Any functionally equivalent product,program, or service that does not infringe any IBM intellectual property right maybe used instead. However, it is the user's responsibility to evaluate and verify theoperation of any non-IBM product, program, or service.
IBM may have patents or pending patent applications covering subject matterdescribed in this document. The furnishing of this document does not give youany license to these patents. You can send license inquiries, in writing, to:
IBM Director of LicensingIBM CorporationNorth Castle DriveArmonk, NY 10504-1785 U.S.A.
For license inquiries regarding double-byte (DBCS) information, contact the IBMIntellectual Property Department in your country or send inquiries, in writing, to:
IBM World Trade Asia CorporationLicensing2-31 Roppongi 3-chome, Minato-kuTokyo 106, Japan
The following paragraph does not apply to the United Kingdom or any othercountry where such provisions are inconsistent with local law:
INTERNATIONAL BUSINESS MACHINES CORPORATION PROVIDES THISPUBLICATION "AS IS" WITHOUT WARRANTY OF ANY KIND, EITHEREXPRESS OR IMPLIED, INCLUDING, BUT NOT LIMITED TO, THE IMPLIEDWARRANTIES OF NON-INFRINGEMENT, MERCHANTABILITY OR FITNESSFOR A PARTICULAR PURPOSE.
Some states do not allow disclaimer of express or implied warranties in certaintransactions, therefore, this statement might not apply to you.
This information could include technical inaccuracies or typographical errors.Changes are periodically made to the information herein; these changes will beincorporated in new editions of the publication. IBM may make improvements andchanges in the product(s) and/or the program(s) described in this publication atany time without notice.
Any references in this information to non-IBM Web sites are provided forconvenience only and do not in any manner serve as an endorsement of those Websites. The materials at those Web sites are not part of the materials for this IBMproduct and use of those Web sites is at your own risk.
217

IBM may use or distribute any of the information you supply in any way itbelieves appropriate without incurring any obligation to you.
Licensees of this program who wish to have information about it for the purposeof enabling: (i) the exchange of information between independently createdprograms and other programs (including this one) and (ii) the mutual use of theinformation which has been exchanged, should contact:
IBM Corporation2Z4A/10111400 Burnet RoadAustin, TX 78758 U.S.A.
Such information may be available, subject to appropriate terms and conditions,including in some cases payment of a fee.
The licensed program described in this document and all licensed materialavailable for it are provided by IBM under terms of the IBM Customer Agreement,IBM International Program License Agreement or any equivalent agreementbetween us.
Any performance data contained herein was determined in a controlledenvironment. Therefore, the results obtained in other operating environments mayvary significantly. Some measurements may have been made on development-levelsystems and there is no guarantee that these measurements will be the same ongenerally available systems. Furthermore, some measurement may have beenestimated through extrapolation. Actual results may vary. Users of this documentshould verify the applicable data for their specific environment.
Information concerning non-IBM products was obtained from the suppliers ofthose products, their published announcements or other publicly available sources.IBM has not tested those products and cannot confirm the accuracy ofperformance, compatibility or any other claims related to non-IBM products.Questions on the capabilities of non-IBM products should be addressed to thesuppliers of those products.
All statements regarding IBM's future direction or intent are subject to change orwithdrawal without notice, and represent goals and objectives only.
All IBM prices shown are IBM's suggested retail prices, are current and are subjectto change without notice. Dealer prices may vary.
This information is for planning purposes only. The information herein is subject tochange before the products described become available.
This information contains examples of data and reports used in daily businessoperations. To illustrate them as completely as possible, the examples include thenames of individuals, companies, brands, and products. All of these names arefictitious and any similarity to the names and addresses used by an actual businessenterprise is entirely coincidental.
COPYRIGHT LICENSE:
This information contains sample application programs in source language, whichillustrate programming techniques on various operating platforms. You may copy,modify, and distribute these sample programs in any form without payment to
Notices
218 Tivoli Decision Support for z/OS: Distributed Systems Performance Feature Guide and Reference

IBM, for the purposes of developing, using, marketing or distributing applicationprograms conforming to the application programming interface for the operatingplatform for which the sample programs are written. These examples have notbeen thoroughly tested under all conditions. IBM, therefore, cannot guarantee orimply reliability, serviceability, or function of these programs. You may copy,modify, and distribute these sample programs in any form without payment toIBM for the purposes of developing, using, marketing, or distributing applicationprograms conforming to IBM‘s application programming interfaces.
If you are viewing this information in softcopy form, the photographs and colorillustrations might not display.
TrademarksIBM, the IBM logo, and ibm.com are trademarks or registered trademarks ofInternational Business Machines Corp., registered in many jurisdictions worldwide.Other product and service names might be trademarks of IBM or other companies.A current list of IBM trademarks is available on the Web at "Copyright andtrademark information" at www.ibm.com/legal/copytrade.shtml.
Notices
Notices 219

220 Tivoli Decision Support for z/OS: Distributed Systems Performance Feature Guide and Reference
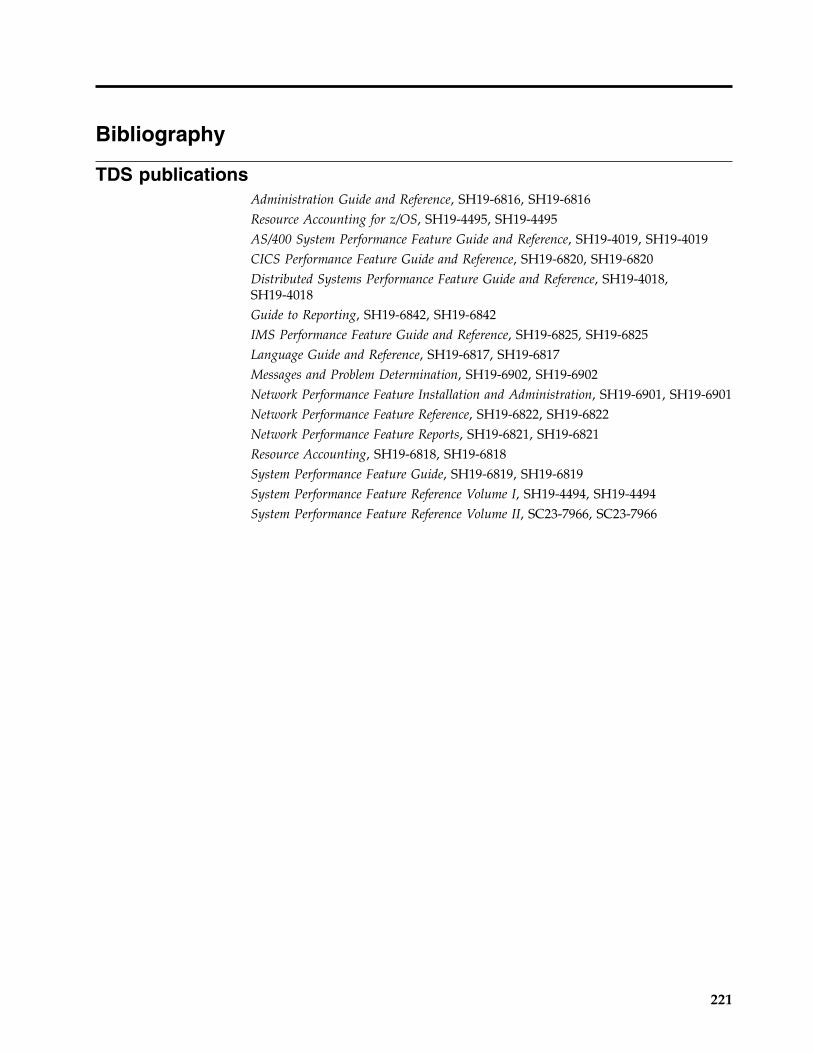
Bibliography
TDS publicationsAdministration Guide and Reference, SH19-6816, SH19-6816Resource Accounting for z/OS, SH19-4495, SH19-4495AS/400 System Performance Feature Guide and Reference, SH19-4019, SH19-4019CICS Performance Feature Guide and Reference, SH19-6820, SH19-6820Distributed Systems Performance Feature Guide and Reference, SH19-4018,SH19-4018Guide to Reporting, SH19-6842, SH19-6842IMS Performance Feature Guide and Reference, SH19-6825, SH19-6825Language Guide and Reference, SH19-6817, SH19-6817Messages and Problem Determination, SH19-6902, SH19-6902Network Performance Feature Installation and Administration, SH19-6901, SH19-6901Network Performance Feature Reference, SH19-6822, SH19-6822Network Performance Feature Reports, SH19-6821, SH19-6821Resource Accounting, SH19-6818, SH19-6818System Performance Feature Guide, SH19-6819, SH19-6819System Performance Feature Reference Volume I, SH19-4494, SH19-4494System Performance Feature Reference Volume II, SC23-7966, SC23-7966
221

222 Tivoli Decision Support for z/OS: Distributed Systems Performance Feature Guide and Reference
Glossary
administrationA Tivoli Decision Support for z/OS task that includes maintaining thedatabase, updating environment information, and ensuring the accuracy ofdata collected.
administration dialogThe set of host windows used to administer Tivoli Decision Support forz/OS.
agent In UNIX Performance featureUNIX Performance feature, a set of programsrunning on a network node that gather data about the node and write thedata to log files. Agents can gather data by issuing UNIX commands, andby reading files such as UNIX accounting files.
COLLECTA process used by Tivoli Decision Support for z/OS to read data frominput log data sets, interpret records in the data set, and store the data inDB2 tables in the Tivoli Decision Support for z/OS database.
componentAn optionally installable part of an Tivoli Decision Support for z/OSfeature. Specifically in Tivoli Decision Support for z/OS, a componentrefers to a logical group of objects used to collect log data from a specificsource, to update the Tivoli Decision Support for z/OS database using thatdata, and to create reports from data in the database.
control tableA predefined Tivoli Decision Support for z/OS table that controls resultsreturned by some log collector functions.
Data Language/I (DL/I)An IBM database-management facility.
data tableA Tivoli Decision Support for z/OS table that contains performance dataused to create reports.
distributed transaction processingThe distribution of processing among transactions that communicatesynchronously with each other over intersystem or interregion links.
environment informationAll of the information that is added to the log data to create reports. Thisinformation can include data such as performance groups, shift periods,installation definitions, and so on.
environment dataSee “environment information.”
223

gather A process performed by agents in which performance data is entered intolog files. The log files are located on the same nodes as the agents.
help topicsAn online table of contents for the Tivoli Decision Support for z/OS onlinehelp information.
key columnsThe columns of a DB2 table that together constitute the key.
key valueValue used to sort records into groups.
log Any sequential data set used as input to Tivoli Decision Support for z/OS.
log collectorA Tivoli Decision Support for z/OS program that processes log data setsand provides other services.
log collector languageTivoli Decision Support for z/OS statements used to supply definitions toand invoke services of the log collector.
log data setAny sequential data set used as input to Tivoli Decision Support for z/OS.
log definitionThe description of a log data set processed by the log collector.
log procedureA program module that is used to process all record types in certain logdata sets.
logical unit (LU)A port through which a user gains access to the services of a network.
lookup expressionAn expression that specifies how a value is obtained from a lookup table.
lookup tableA Tivoli Decision Support for z/OS DB2 table that contains grouping,translation, or substitution information.
object An integral part of a feature component needed for data collection (forexample, record definitions, record procedures, and update definitions).
process accountingAn analysis of how each process uses the processing unit, memory, andI/O resources
Tivoli Decision Support for z/OS databaseA set of DB2 tables that includes data tables, lookup tables, system tables,and control tables.
Glossary
224 Tivoli Decision Support for z/OS: Distributed Systems Performance Feature Guide and Reference

purge conditionInstruction for purging unneeded data from the Tivoli Decision Support forz/OS database.
record definitionThe description of a record type contained in the log data sets used byTivoli Decision Support for z/OS, including detailed record layout anddata formats.
record procedureA program module that is called to process some types of log records.
record typeThe classification of records in a log data set.
region A section of the dynamic area that is allocated to a job step or system task.
report definition languageTivoli Decision Support for z/OS statements used to define reports andreport groups.
report groupA collection of Tivoli Decision Support for z/OS reports that can bereferred to by a single name.
reporting dialogA set of host or workstation windows used to request reports.
resourceAny facility of the computing system or operating system required by a jobor task, including central storage, input/output devices, the processingunit, data sets, and control or processing programs.
resource groupA collection of resources identified as belonging to a particular departmentor division. Resources are organized into groups to reflect the structure ofan organization.
resource informationEnvironment information that describes the elements in a system (forexample, a network).
sectionA structure within a record that contains one or more fields and maycontain other sections.
source In an update definition, the record or DB2 table that contains the data usedto update an Tivoli Decision Support for z/OS DB2 table.
subcomponentAn optionally installable part of an Tivoli Decision Support for z/OSfeature component.
system tableA DB2 table that stores information for controlling log collector processing,Tivoli Decision Support for z/OS dialogs, and reporting.
target In an update definition, the DB2 table in which Tivoli Decision Support forz/OS stores data from the source record or table.
Glossary
Glossary 225

thresholdThe maximum or minimum acceptable level of usage. Usage measurementsare compared with threshold levels.
Transmission Control Protocol/Internet Protocol (TCP/IP)A non-proprietary communications protocol for linking workstations tohost computers and to other hardware.
update definitionInstructions for entering data into DB2 tables from records of differenttypes or from other DB2 tables.
updatesInstructions in Tivoli Decision Support for z/OS on how to process datafrom log data sets to DB2 tables.
view An alternative representation of data from one or more tables. A view caninclude all or some of the columns contained in the table on which it isdefined.
Glossary
226 Tivoli Decision Support for z/OS: Distributed Systems Performance Feature Guide and Reference

Index
Aaccessibility xvaccounting component
data tables 134, 135, 136reports 152, 154, 155, 157, 158, 159,
160, 161, 162tables 134
accounting component data tables 134,136, 137
accounting component reports 152accounting for AIX
setting up 91accounting for HP
setting up 93accounting for Sun Solaris
setting up 94accounting function in UNIX,
implementing 91ACCT_COMMAND 201ACCT_CONNECT 202ACCT_DISK 202ACCT_PRINT 203agents 4, 81AIX commands to use if UNIX
Performance component installed 102attributes, report 54, 152audience for this book, intended xi
Bbackup and delete of generation data
sets 109books xiiibooks for Administration Guide and
Reference 221
Ccapturing and transmitting
Windows dataz/OS 36
capturing and transmitting to z/OS 90capturing UNIX data 90, 111capturing Windows data 121COLLECT job (JCL) 40, 107, 116, 125collect procedure, description 46, 130collecting
data 40collecting performance data 4, 81collection optimization, data 108communication between UNIX and
MVS 88, 89, 95, 100, 110, 113communication between Windows and
MVS 120component
distributedintroducing 3
Linux performanceinstallation 85
component (continued)UNIX performance
installation 85introducing 81
Windowsinstalling 117
component installationUNIX Performance 102
CONFIG_HW 203CONFIG_SW 203configuration component
data tables 137reports 163, 164, 165, 166tables 137
configuration component data tables 137configuration component reports 163configure auto-start on the distributed
node (Solaris) 29configure the distributed node
(Solaris) 27configuring
auto startRHEL 16
Distributed component 7AIX 21distributed 7HP-UX 16RHEL 12SLES 8Solaris 25
distributed nodeAIX 24HP-UX 19, 20RHEL 14SLES 10
Windows component 33Configuring
distributed node auto startSLES 12
connects, made by users 160considering which UNIX subcomponents
to install 86control tables 46, 131, 133conventions
typeface xvCPU utilization 55, 56, 58, 63, 152, 154,
155, 157, 173, 174, 175, 176create log files 94customer support 214customizing
Windows 37parameter file values 37
customizing Linux Performancecomponent parameters 113
customizing UNIX Performancecomponent parameters 96
Ddaily reports
Distrib. CPU Util. by System, DailyOverview (DIST02) 55
Distrib. Disk I/O for System, DailyOverview (DIST07) 61
Distrib. File Systems, Daily Overview(DIST05) 59
Distrib. Statistics by System, DailyOverview (DIST04) 58
UNIX Acct Cmd ResourceConsumption, Daily Overview(XACCT03) 155
UNIX Acct Commands by User, DailyOverview (XACCT01) 152
UNIX Acct Users and Connects, DailyOverview (XACCT07) 160
UNIX Acct Users by Command, DailyOverview (XACCT02) 154
UNIX Error by Class, Daily Overview(XERROR03) 169
UNIX Error by ID, Daily Overview(XERROR01) 168
UNIX Error by Resource, DailyOverview (XERROR04) 170
UNIX Error by Type, Daily Overview(XERROR02) 168
UNIX Perf CPU Utilization by System,Daily Overview (XPERF02) 174
UNIX Perf Disk I/O for System, DailyOverview (XPERF07) 180
UNIX Perf Statistics all Systems, DailyOverview (XPERF04) 176
UNIX Perf Vol Group and File Syst,Daily Overview (XPERF05) 177
datasources of performance 81
data collection, optimizing 108data flow and objects 45, 129data flow from Distributed Systems
Performance component to TivoliDecision Support for z/OS
general flow 129data flow from Distributed Systems
Performance feature to Tivoli DecisionSupport for z/OS
general flow 45data tables 47, 133
in the accounting component 134,135, 136, 137
in the configuration component 137in the Distributed component 48, 49,
50in the error component 138in the performance component 138,
139, 140, 141in the Windows component 51, 143Linux 147LINUX component
XCONF_HARDWARE 147XCONF_SOFTWARE 147
227

data tables (continued)LINUX component (continued)
XDISK_INFOR 147XDTMP_INFOR 148XPERF_PS_INFO 142, 148XPERF_VM_INFO 142, 148XWTMP_INFOR 149
naming standard 47, 133summarization-level suffixes 47, 133Windows component 51, 143
WIN_PERF_PU_D 51, 143WIN_PERF_PU_H 51, 143WIN_PERF_PU_M 51, 143
define the receiver of UNIX Performancecomponent data 95
definitions, log record 73, 201description of daily tasks performed by
UNIX Performance component 99description of UNIX Performance
component files 101disk blocks
allocated to node 159allocated to user 158
disk device recordWIN_PERF_DD 76, 209
disk spacefor installation 87, 119utilization 60, 61, 178, 180
DIST_DISK_FS_A 74DIST_PERF_IO_A 74DIST_PERF_PS_A 75DIST_PERF_VM_A 73Distrib. CPU Util. for System, Hourly
Trendreports in the Distributed
component 54Distributed component
configuring 7data tables 48, 49DIST_CPU_M 48installing 7planning 7reports 54, 55, 56, 58, 59, 60, 61, 62,
63tables 48
Distributed component data tables 48,50
Distributed component reports 54Distributed Systems Performance feature
introducing 3, 81documentation, TDS 221drlpsperfd 102
Eeducation xvelapsed time 152, 154, 155, 157ERROR 205error component
data tables 138reports 167, 168, 169, 170, 171tables 138
error component data tables 138error component reports 167errors
by classnumber 169
errors (continued)by ID
number 168by resource
number 170by type
number 168errors, by resource
monthly trend 171evaluation and planning 86, 119exception reports
Distrib. CPU Util. Exceptions(DIST09) 63
Ffile transfer 95, 112fixes, obtaining 213format, Tivoli Decision Support for z/OS
report 53, 151
Ggather of data 4, 81Generation Data Group (GDG) 106glossary 223groups, report 53, 152
Hhardware configuration
for a device class 164for a system 163
hourly reportsDistrib. Disk I/O for Disk, Hourly
Trend (DIST06) 60Distrib. Page Space Util., Hourly
Trend (DIST08) 62Distrib. Statistics for System, Hourly
Trend (DIST03) 56UNIX Perf CPU Utilization by System,
Hourly Trend (XPERF01) 173UNIX Perf Disk I/O for a Disk,
Hourly Trend (XPERF06) 178UNIX Perf Page Space Utilization,
Hourly Trend (XPERF08) 181UNIX Perf Statistics by System,
Hourly Trend (XPERF03) 175how to use this book xi
II/O (kilobytes) 152, 154, 155, 157, 178,
180identifiers, report 53, 151implementation process
planningDistributed component 7
implementation process, planning 85,117
information centers, searching forproblem resolution 213
information logs 101installation
requirements 87, 110, 119
installation (continued)AIX 21HP-UX 17making input data available 106optimizing data collection 108putting component into
production 41putting feature into
production 109, 126RHEL 12SLES 8Solaris 25updating lookup tables 104Windows 35
testing 31testing the installation 41, 109, 125UNIX performance component 85
installingDistributed component 7
AIX 21distributed 7HP-UX 16RHEL 12SLES 8Solaris 25z/OS 29
planning subcomponentsWindows 34
Tivoli Decision Support for z/OSAIX 22HP-UX 17RHEL 13SLES 9Solaris 26
Windows component 33Windows 35z/OS 38
installing the Linux Performancecomponent on your Linux nodes 110
installing the UNIX Performancecomponent on your UNIX nodes 87
installing the Windows component onyour Windows nodes 119
installing UNIX Performance componenton the z/OS system 102
installing Windows component on thez/OS system 123
intended audience for this book xiInternet
searching for problem resolution 213invoke drlperfd at start time 99
JJCL
COLLECT with specified TivoliDecision Support for z/OStables 108
General COLLECT 40, 107, 116, 125
Kknowledge bases, searching for problem
resolution 213
228 Tivoli Decision Support for z/OS: Distributed Systems Performance Feature Guide and Reference
LLINUX
data tables 147subcomponents to install 110
Linux componentcommands 115transmitting data to z/OS 111
LINUX componentdata tables
XCONF_HARDWARE 147XCONF_SOFTWARE 147XDISK_INFOR 147XDTMP_INFOR 148XPERF_PS_INFO 142, 148XPERF_VM_INFO 142, 148XWTMP_INFOR 149
report IDsXLINU01 182XLINU02 183XLINU03 184XLINU04 185XLINU05 186XLINU06 187XLINU07 188XLINU08 189XLINU09 190XLINU10 191
reportsDisk Space Allocation 183Hardware Configuration 186Percentile Work Size 182Performance ’PS’ for Volumes
Info 185Performance ’VM’ for CPU 191Performance ’VM’ for Swap
Memory 190Performance from User
Memory 184Process Information 189Software Configuration 187User Information 188
Linux performance componentinstallation 85
Linux Performance componentcustomizing parameters 113
list of terms used in this book 223log definitions, Tivoli Decision Support
for z/OS 131log record definitions 73, 201logs
UNIX 131lookup tables 104, 133
Mmanuals xiiimanuals, TDS 221monthly reports
UNIX Acct Disk Blocks by User,Monthly Overview (XACCT05) 158
UNIX Acct Disk Blocks in 1000s,Monthly Trend (XACCT06) 159
UNIX Acct Printed Pages by System,Monthly Overview (XACCT09) 162
UNIX Acct Printed Pages by User,Monthly Overview (XACCT08) 161
monthly reports (continued)UNIX Acct User Resource Usage,
Monthly Overview (XACCT04) 157UNIX Error by Resource, Monthly
Trend (XERROR05) 171
Nnaming standards for tables 47, 133
Oobjects and data flow 45, 129online publications
accessing xivoperating the UNIX Performance
component on UNIX 100optimizing data collection 108overview reports
Distrib. CPU Util. by System, DailyOverview (DIST02) 55
Distrib. Disk I/O for System, DailyOverview (DIST07) 61
Distrib. File Systems, Daily Overview(DIST05) 59
Distrib. Statistics by System, DailyOverview (DIST04) 58
UNIX Acct Cmd ResourceConsumption, Daily Overview(XACCT03) 155
UNIX Acct Commands by User, DailyOverview (XACCT01) 152
UNIX Acct Disk Blocks by User,Monthly Overview (XACCT05) 158
UNIX Acct Printed Pages by System,Monthly Overview (XACCT09) 162
UNIX Acct Printed Pages by User,Monthly Overview (XACCT08) 161
UNIX Acct User Resource Usage,Monthly Overview (XACCT04) 157
UNIX Acct Users and Connects, DailyOverview (XACCT07) 160
UNIX Acct Users by Command, DailyOverview (XACCT02) 154
UNIX Configuration of HW for aSystem, Overview(XCONFIG01) 163
UNIX Configuration of HW forDevice Class, Overview(XCONFIG02) 164
UNIX Configuration of SW for aSystem, Overview(XCONFIG03) 165
UNIX Configuration of SW for Object,Overview (XCONFIG04) 166
UNIX Error by Class, Daily Overview(XERROR03) 169
UNIX Error by ID, Daily Overview(XERROR01) 168
UNIX Error by Resource, DailyOverview (XERROR04) 170
UNIX Error by Type, Daily Overview(XERROR02) 168
UNIX Perf CPU Utilization by System,Daily Overview (XPERF02) 174
overview reports (continued)UNIX Perf Disk I/O for System, Daily
Overview (XPERF07) 180UNIX Perf Statistics all Systems, Daily
Overview (XPERF04) 176UNIX Perf Vol Group and File Syst,
Daily Overview (XPERF05) 177
Ppage space, utilization 56, 58, 62, 175,
176, 181paging rate 56, 58, 175, 176parameter file values for all
subcomponents 96parameter file values for Performance
component 97parameter files for all subcomponents
Linux Performance component 113PERF_CPU 206PERF_DISK_FS 206PERF_DISK_IO 208PERF_DISK_VG 207PERF_PAGING 209performance component
data tables 139, 140reports 172, 173, 174, 175, 176, 177,
178, 180, 181tables 138XPERF_CPU_M 139
Performance componentparameter file values 97
performance component data tables 138,141
performance component reports 172performance management
collecting data (overview) 4, 81performance usage record
WIN_PERF_PU 76, 210planning
implementation processDistributed component 7
planning and evaluation 86, 119planning the implementation process 33,
85, 117print resources used
pages, by user 161, 162printouts, by user 162
problem determinationdescribing problems 216determining business impact 215submitting problems 216
processes, number of 56, 58, 175, 176production
component, putting into 32publications xiii
TDS 221
Rrecord definition descriptions
ACCT_COMMAND 201ACCT_CONNECT 202ACCT_DISK 202ACCT_PRINT 203CONFIG_HW 203
Index 229
record definition descriptions (continued)CONFIG_SW 203DIST_DISK_FS_A 74DIST_PERF_IO_A 74DIST_PERF_PS_A 75DIST_PERF_VM_A 73ERROR 205PERF_CPU 206PERF_DISK_FS 206PERF_DISK_IO 208PERF_DISK_VG 207PERF_PAGING 209
record definitions for Tivoli DecisionSupport for z/OS 131
reportformat 53, 151groups 5, 82
report IDs 53, 151DIST02 (Distrib. CPU Util. by System,
Daily Overview) 55DIST03 (Distrib. Statistics for System,
Hourly Trend) 56DIST04 (Distrib. Statistics by System,
Daily Overview) 58DIST05 (Distrib. File Systems, Daily
Overview) 59DIST06 (Distrib. Disk I/O for Disk,
Hourly Trend) 60DIST07 (Distrib. Disk I/O for System,
Daily Overview) 61DIST08 (Distrib. Page Space Util.,
Hourly Trend) 62DIST09 (Distrib. CPU Util.
Exceptions) 63XACCT01 (UNIX Acct Commands by
User, Daily Overview) 152XACCT02 (UNIX Acct Users by
Command, Daily Overview) 154XACCT03 (UNIX Acct Cmd Resource
Consumption, Daily Overview) 155XACCT04 (UNIX Acct User Resource
Usage, Monthly Overview) 157XACCT05 (UNIX Acct Disk Blocks by
User, Monthly Overview) 158XACCT06 (UNIX Acct Disk Blocks in
1000s, Monthly Trend) 159XACCT07 (UNIX Acct Users and
Connects, Daily Overview) 160XACCT08 (UNIX Acct Printed Pages
by User, Monthly Overview) 161XACCT09 (UNIX Acct Printed Pages
by System, Monthly Overview) 162XCONFIG01 (UNIX Configuration of
HW for a System, Overview) 163XCONFIG02 (UNIX Configuration of
HW for Device Class,Overview) 164
XCONFIG03 (UNIX Configuration ofSW for a System, Overview) 165
XCONFIG04 (UNIX Configuration ofSW for Object, Overview) 166
XERROR01 (UNIX Error by ID, DailyOverview) 168
XERROR02 (UNIX Error by Type,Daily Overview) 168
XERROR03 (UNIX Error by Class,Daily Overview) 169
report IDs (continued)XERROR04 (UNIX Error by Resource,
Daily Overview) 170XERROR05 (UNIX Error by Resource,
Monthly Trend) 171XPERF01 (UNIX Perf CPU Utilization
by System, Hourly Trend) 173XPERF02 (UNIX Perf CPU Utilization
by System, Daily Overview) 174XPERF03 (UNIX Perf Statistics by
System, Hourly Trend) 175XPERF04 (UNIX Perf Statistics all
Systems, Daily Overview) 176XPERF05 (UNIX Perf Vol Group and
File Syst, Daily Overview) 177XPERF06 (UNIX Perf Disk I/O for a
Disk, Hourly Trend) 178XPERF07 (UNIX Perf Disk I/O for
System, Daily Overview) 180XPERF08 (UNIX Perf Page Space
Utilization, Hourly Trend) 181reports 53, 151
attributes 54, 152format and general description 53,
151identifiers, unique 53, 151in the accounting component 152,
154, 155, 157, 158, 159, 160, 161, 162in the configuration component 163,
164, 165, 166in the Disributed component 55in the Distributed component 54, 56,
58, 59, 60, 61, 62, 63in the error component 167, 168, 169,
170, 171in the performance component 53,
152, 172, 173, 174, 175, 176, 177, 178,180, 181
in the Windows component 64, 192Windows CPU Utilization by
System, Daily Overview 67, 195Windows CPU Utilization by
System, Hourly Trend 66Windows Disk Usage for Device,
Daily Overview 65, 193Windows Disk Usage for System,
Hourly Trend 65, 192Windows Memory Usage by
System, Daily Overview 69, 197Windows Memory Usage by
System, Hourly Trend 68, 196Windows System Overview
Report 70, 198LINUX component
Disk Space Allocation 183Hardware Configuration 186Percentile Work Size 182Performance ’PS’ for Volumes
Info 185Performance ’VM’ for CPU 191Performance ’VM’ for Swap
Memory 190Performance from User
Memory 184Process Information 189Software Configuration 187User Information 188
reports (continued)source tables 54, 152variables 54, 152
reports in the Distributed componentDistrib. CPU Util. for System, Hourly
Trend 54reports in the Windows component
Windows CPU Utilization by System,Hourly Trend 194
requirementsdisk space
AIX 21HP-UX 17RHEL 13SLES 8Solaris 25Windows 35
softwareAIX 21HP-UX 17RHEL 13SLES 9Solaris 26Windows 35
requirements, installationdisk space 87, 110, 119distributed
AIX 21HP-UX 17RHEL 12SLES 8Solaris 25
software 87, 110, 120UNIX 87, 110Windows 119
Windows 35retry interval, file transfer 97, 114retry limit, file transfer 96, 114
Ssart and check the distributed node
(Solaris) 28set up UNIX accounting 91setting up accounting for AIX 91setting up accounting for HP 93setting up accounting for Sun Solaris 94setting up scheduled tasks 37software configuration
for a system 165for an object 166
Software Supportcontacting 214describing problems 216determining business impact 215receiving weekly updates 214submitting problems 216
source tables, report 54, 152space utilization 59, 177start and check
distributed nodeAIX 24HP-UX 20
start the drlperfd daemon 98starting
distributed nodeRHEL 15
230 Tivoli Decision Support for z/OS: Distributed Systems Performance Feature Guide and Reference

starting (continued)distributed node (continued)
SLES 11subcomponents to install, LINUX 110suffixes, data-table 47, 133system time 152, 154, 155, 157
Ttable descriptions 134tables 47, 48, 49, 50, 104, 105, 134, 135,
136, 137, 138, 139, 140, 141, 144, 145accounting component 134data, lookup, control 133in the configuration component 137in the Distributed component 48in the error component 138in the performance component 138in the Windows component 51, 143lookup 144
TCP/IP 5, 82terms used in this book 223testing
installation 31testing the installation 41, 109, 125Tivoli technical training xvtraining, Tivoli technical xvtransfer of files to MVS 90, 111, 121transferring
feature code to Windows 35trend reports
Distrib. Disk I/O for Disk, HourlyTrend (DIST06) 60
Distrib. Page Space Util., HourlyTrend (DIST08) 62
Distrib. Statistics for System, HourlyTrend (DIST03) 56
UNIX Acct Disk Blocks in 1000s,Monthly Trend (XACCT06) 159
UNIX Error by Resource, MonthlyTrend (XERROR05) 171
UNIX Perf CPU Utilization by System,Hourly Trend (XPERF01) 173
UNIX Perf Disk I/O for a Disk,Hourly Trend (XPERF06) 178
UNIX Perf Page Space Utilization,Hourly Trend (XPERF08) 181
UNIX Perf Statistics by System,Hourly Trend (XPERF03) 175
typeface conventions xv
UUNIX
operating Performance componenton 100
UNIX accountingsetting up 91
UNIX lookup tables 105, 144, 145UNIX performance component
installation 85UNIX Performance component
AIX commands to use 102description of component files 101description of daily tasks performed
by 99
UNIX Performance component(continued)
installing you your UNIX nodes 87UNIX Performance component
parameterscustomizing 96
updating lookup tablesfor UNIX component 104
use of this book, intended xiuser time 152, 154, 155, 157users, number of 56
Vvariables, report 54, 152view table for accounting
component 137
WWIN_PERF_DD 76, 209WIN_PERF_PU 76, 210Windows
capturing and transmitting toz/OS 121
parameter file values 37Windows component
configuring 33data tables
WIN_PERF_DD_D 51WIN_PERF_DD_H 51, 143WIN_PERF_DD_M 51WIN_PERF_PU_D 51, 143WIN_PERF_PU_H 51, 143WIN_PERF_PU_M 51, 143
installing 33planning the implementation
process 33reports 64, 192
Windows CPU Utilization bySystem, Daily Overview 67, 195
Windows CPU Utilization bySystem, Hourly Trend 66
Windows Disk Usage for Device,Daily Overview 65, 193
Windows Disk Usage for System,Hourly Trend 65, 192
Windows Memory Usage bySystem, Daily Overview 69, 197
Windows Memory Usage bySystem, Hourly Trend 68, 196
Windows System OverviewReport 70, 198
tables 51, 143Windows component data tables 51, 143Windows component reports 64, 192
Windows CPU Utilization by System,Daily Overview 67, 195
Windows CPU Utilization by System,Hourly Trend 66
Windows Disk Usage for Device,Daily Overview 65, 193
Windows Disk Usage for System,Hourly Trend 65, 192
Windows Memory Usage by System,Daily Overview 69, 197
Windows component reports (continued)Windows Memory Usage by System,
Hourly Trend 68, 196Windows System Overview
Report 70, 198Windows components
installing 117Windows CPU Utilization by System,
Hourly Trendreports in the Windows
component 194
XX_NODE_NAME lookup table 105XACCT_COMMAND 201XACCT_CONNECT 202XACCT_CONNECT_TYPE lookup
table 105XACCT_DISK 202XACCT_PRINT 203XACCT_PRINT_TYPE lookup table 105XCONF_HARDWARE 147XCONF_SOFTWARE 147XCONFIG_HW 203XCONFIG_SW 203XDISK_INFOR 147XDTMP_INFOR 148XERROR 205XPERF_CPU 206XPERF_DISK_FS 206XPERF_DISK_IO 208XPERF_DISK_VG 207XPERF_PAGING 209XPERF_PS_INFO 148XPERF_VM_INFO 148XWTMP_INFOR 149
Zz/OS system
installing UNIX Performancecomponent 102
Index 231

232 Tivoli Decision Support for z/OS: Distributed Systems Performance Feature Guide and Reference


IBM®
Printed in USA
SH19-4018-13