title of the thesis - DiVA portal
90
Name of Program: Energy Technology Examiner: Prof. Torsten Henry FRANSSON (KTH) Supervisors: Assistant Professor Peter HAGSTRÖM (KTH) Dr. Vénant KAYIBANDA(KIST) Dr. Vénant KAYIBANDA(KIST) Dr. Vénant KAYIBANDA(KIST)Assistant Professor Peter HAGSTRÖM Dr. Vénant KAYIBANDA(KIST) FACULTY OF ENGINEERING AND SUSTAINABLE DEVELOPMENT TITLE OF THE THESIS: BIOGAS DEVELOPMENT SCENARIOS TOWARDS 2020 IN RWANDA: The contribution to the energy sector and socio-economic and environmental impacts. The Authors : Jean de la Croix SINARUGULIYE Jean Baptiste HATEGEKIMANA November,2013 Master’s Thesis in Sustainable Power Generation
-
Upload
khangminh22 -
Category
Documents
-
view
1 -
download
0
Transcript of title of the thesis - DiVA portal

Name of Program: Energy Technology
Examiner: Prof. Torsten Henry FRANSSON (KTH)
Supervisors: Assistant Professor Peter HAGSTRÖM (KTH)
Dr. Vénant KAYIBANDA(KIST)
Dr. Vénant KAYIBANDA(KIST) Dr. Vénant KAYIBANDA(KIST)Assistant Professor Peter HAGSTRÖM Dr. Vénant KAYIBANDA(KIST)
FACULTY OF ENGINEERING AND SUSTAINABLE DEVELOPMENT
TITLE OF THE THESIS:
BIOGAS DEVELOPMENT SCENARIOS TOWARDS 2020 IN RWANDA:
The contribution to the energy sector and socio-economic and environmental impacts.
The Authors :
Jean de la Croix SINARUGULIYE
Jean Baptiste HATEGEKIMANA
November,2013
Master’s Thesis in Sustainable Power Generation

Abstract
Access to modern energy is essential to achieve sustainable development and poverty reduction. However, with about 321 kWh per capita, Rwanda is ranked among the countries that have a lower consumption of primary energy in the world. More than 86 percent of its total energy comes from the traditional biomass energy such as forests, agricultural residues and by-products from crops that lead to environmental degradation and ecological imbalance and negative impacts on human health as well. In addition, only 301,500 ha of forest are available for fuel wood and other uses such as construction for a total population of 10.5 million.
Therefore, decentralized energy sources in small-scale are presented to improve access to "appropriate" energy, which are beneficial to human health and environmental perspectives. The anaerobic digestion of biomass, popularly called “biogas”, is one of the appropriate energy technologies for cooking and/or lighting purposes (both in households and in institutions), which receives special attention in Rwanda since 2007. Three main objectives of this study were to assess the current biogas sector in Rwanda, to make projections of biogas development by 2020 and finally to analyze the socio-economic and environment benefits of biogas use to the Rwandan community.
The fieldwork conducted in two districts per province in addition to services that are in the capital, was based on the structured questionnaire, discussion with key people and see the state of biogas built. Therefore, in this study we used the "Appropriate Energy Model” to measure the degree of biogas dissemination, which educates for “geographical, institutional, entrepreneurial and socio-cultural “aspects.
The results showed that the temperature conditions in the country are generally conducive to the operation of a digester. However, the drought period between June and August, water scarcity in some regions and a low potential for digester feeding impede the propagation of biogas to a large number of people. The Rwandan entrepreneurs do not face institutional barriers to start-up biogas companies since the bureaucratic system in registration of a company is transparent. The installation costs of biogas plant are so high that they hamper the dissemination of biogas; however biogas technology does not contradict the socio-cultural conditions of Rwandans.
Based on projections of potential biogas in Rwanda in 2020, following three scenarios for 2020 biogas development were identified:
• 1,135,000 biogas plants can be built in 2020 by considering a global basis the potential biogas available
• If 70% of the population will live in grouped settlements in 2020, 70% of Rwandan households will use biogas if additional resources as livestock and subsidies were provided to the poor families.
• Only 10% of the population (251,000households) will be eligible for biogas installation
Reducing the consumption of firewood after biogas operation provides annual coverage of approximately 0.306 ha of forest area per household. Therefore, each household biogas would reduce annual GHG emissions of about 4.1 tonnes of CO2 and could possibly lead to Rwanda an annual income of about USD 21 due to the reduction of CO2 emissions in a hypothetical rate USD 5 per ton of CO2 if registered under the CDM.
Keywords: Anaerobic digestion, biogas, biomass, dissemination, scenario

ii
TABLE OF CONTENTS Abstract ............................................................................................................................................................................ i
NOMENCLATURE .................................................................................................................................................... v
LIST OF FIGURES .................................................................................................................................................... vi
LIST OF TABLES ...................................................................................................................................................... vii
ANNEXURE .............................................................................................................................................................. vii
1 Chapter one: INTRODUCTION AND BACKGROUND ........................................................................ 1
1.1 Biogas basics ................................................................................................................................................ 1
1.1.1 What is biogas?........................................................................................................................................ 1
1.1.2 The raw materials for biogas production ................................................................................................ 1
1.1.3 Utilization ..................................................................................................................................................... 1
1.1.4 Benefits of biogas technology ................................................................................................................... 2
1.2 Biogas production ....................................................................................................................................... 2
1.2.1 Hydrolysis ................................................................................................................................................ 2
1.2.2 Acidification ............................................................................................................................................ 2
1.2.3 Methane formation ................................................................................................................................. 3
1.3 Parameters and process optimization ...................................................................................................... 3
1.3.1 Substrate temperature ............................................................................................................................ 3
1.3.2 Available nutrients .................................................................................................................................. 3
1.3.3 Retention time ......................................................................................................................................... 3
1.3.4 Hydrogen ion concentration (pH)level ............................................................................................... 4
1.3.5 Nitrogen inhibition and C/N ratio ...................................................................................................... 4
1.3.6 Substrate solid content and agitation .................................................................................................. 4
1.3.7 Inhibitor factors ...................................................................................................................................... 5
1.4 History of biogas technology .................................................................................................................... 5
1.4.1 In the United States ................................................................................................................................ 5
1.4.2 In the United Kingdom ......................................................................................................................... 5
1.4.3 In Germany ............................................................................................................................................. 5
1.4.4 In China.................................................................................................................................................... 6
1.4.5 In India ..................................................................................................................................................... 6
1.4.6 In other Asian countries ........................................................................................................................ 6
1.4.7 In Africa ................................................................................................................................................... 6
1.5 Biogas plants technology ........................................................................................................................... 7
1.5.1 Feed methods .......................................................................................................................................... 7
1.5.2 Different types of biogas plants ........................................................................................................... 8

iii
2 Chapter two: CURRENT SITUATION OF ENERGY IN RWANDA................................................. 14
2.1 General National Context ........................................................................................................................14
2.1.1 . Geography ...........................................................................................................................................14
2.1.2 Demography ..........................................................................................................................................14
2.1.3 . Politics ..................................................................................................................................................15
2.1.4 . Economy ..............................................................................................................................................15
2.2 Energy situation .........................................................................................................................................16
2.2.1 Rwanda primary energy balance .........................................................................................................16
2.2.2 Electricity Generation ..........................................................................................................................17
2.2.3 . Methane Gas production ..................................................................................................................19
2.2.4 Geothermal energy potential ..............................................................................................................19
2.2.5 . Peat energy potential ..........................................................................................................................19
2.2.6 Waste to power energy potential ........................................................................................................20
2.2.7 Solar and Wind energy potential ........................................................................................................20
2.2.8 Biogas .....................................................................................................................................................20
2.3 Energy Policy situation .............................................................................................................................25
3 Chapter three: OBJECTIVES. ......................................................................................................................... 26
4 Chapter four: PROBLEM DESCRIPTION AND METHODOLOGY ................................................ 27
4.1 Problem Description ................................................................................................................................27
4.2 Methodology ..............................................................................................................................................27
4.2.1 Process of data collection ....................................................................................................................27
4.2.2 Assumptions ..........................................................................................................................................30
4.2.3 Assessment tool: Appropriate Energy Model ..................................................................................31
4.2.4 Methods applied to assess the biogas Sector development ...........................................................33
4.2.5 Thesis work structure ...........................................................................................................................33
4.3 Boundaries and Limitations .....................................................................................................................33
5 Chapter five: ASSESSMENT OF BIOGAS SECTOR IN RWANDA ................................................... 34
5.1 Results of Assessment ..............................................................................................................................34
5.1.1 Geographical aspect .............................................................................................................................34
5.1.2 . Institutional framework .....................................................................................................................36
5.1.3 Entrepreneurial aspect .........................................................................................................................40
5.1.4 Socio-cultural aspect ............................................................................................................................42
5.2 Analysis of Results ....................................................................................................................................43
5.2.1 Geographical aspect .............................................................................................................................45
5.2.2 Institutional aspect ...............................................................................................................................45
5.2.3 Entrepreneurial aspect .........................................................................................................................45

iv
5.2.4 Socio-cultural aspect ............................................................................................................................46
5.3 Discussion ..................................................................................................................................................46
6 Chapter six: BIOGAS SCENARIOS TOWARDS 2020 IN RWANDA ................................................ 48
6.1 Introduction: Review of the objectives of MDGs, Rwanda Vision 2020 and EDPRS .................48
6.2 Proposed biogas development scenarios by 2020 ...............................................................................50
6.2.1 Projections of biogas potential by 2020 ............................................................................................50
6.2.2 Scenario 1: The use of all potential of biogas for the production of biogas by 2020...............53
6.2.3 Scenario 2: Biogas plants in the grouped settlements “Imidugudu” by 2020 .............................53
6.2.4 Scenario 3: Biogas plants for eligible households for biogas by 2020 ..........................................54
6.2.5 Achieving the goal of Vision 2020 to reduce wood consumption to 50% of national energy
consumption in 2020 .........................................................................................................................................54
7 Chapter seven: SOCIO- ECONOMIC AND ENVIRONMENTAL IMPACTS OF BIOGAS
TECHNOLOGY IN RWANDA ............................................................................................................................ 55
7.1 Environmental benefits of biogas technology ......................................................................................55
7.2 Economical benefits of biogas technology ...........................................................................................56
7.3 Social benefits of biogas technology ......................................................................................................57
7.4 Health and sanitation benefits of biogas technology ..........................................................................57
7.5 Relation between biogas development and Vision 2020, EDPRS and Millennium Development
Goals 57
8 Chapter eight: CONCLUSIONS AND RECOMMENDATIONS ......................................................... 60
8.1 Conclusion .................................................................................................................................................60
8.2 Recommendations ....................................................................................................................................60
9 AKNOWLEDGEMENTS .............................................................................................................................. 62
10 BIBLIOGRAPHY ............................................................................................................................................. 63
11 ANNEXURE ..................................................................................................................................................... 67

v
NOMENCLATURE
AD Anaerobic digester
AEM Appropriate Energy Model
BNR National Bank of Rwanda
BPR Banque Populaire du Rwanda
BTU British thermal unit
CDM Clean Development Mechanism
C/N Carbon nitrogen ratio
EDPRS Economic Development and Poverty Reduction Strategy
EWSA Energy Water and Sanitation Authority
FAO Food and Agriculture Organization of United Nations
GDP Gross Domestic product
GHG Greenhouse Gas
GTZ Technical Cooperation Agency of Germany
GW (h) Gig watt (-hour)
IC Internal combustion (Engine)
IDP Integrated Development Programme
IRST Institut de Recherche Scientifique et Technologique
KIST Kigali Institute of Science and Technology
LPG Liquid petroleum gas
MDGs Millennium Development Goals
MINAGRI Ministry of Agriculture
MINALOC Ministry of Local Government
MINECOFIN Ministry of Finance and Economic Planning
MININFRA Ministry of Infrastructure
MINIRENA Ministry of Natural Resources
MW (h) Megawatt (-hour)
NDBP National Domestic Biogas Program
NGO Non- governmental Organisation
NISR National Institute of Statistics of Rwanda
NSCA National Society for Clean Air and Environmental Protection
pH Hydrogen ion concentration
PPP Purchasing Power Parity
RAB Rwanda Agriculture Board
RCS Rwanda Correctional Service
RDB Rwanda Development Board
REB Rwanda Education Board
REMA Rwanda Environmental Management Authority

vi
R&D Research and Development
SACCO Saving and Credit Cooperative
SNV Netherland Development Organisation
TW (h) Terawatt (-hour)
UNDP United Nations Development Programme
UNEP United Nations Environment Programme
UNFCCC United Nations Framework Convention on Climate Change
USD American dollar
WDA Workforce Development Agency
LIST OF FIGURES
Figure 1.1: The three-stage anaerobic fermentation of biomass
Figure 1.2: Batch digester
Figure 1.3: Horizontal Balloon-type biogas plant
Figure 1.4: Fixed dome plant
Figure 1.5: Chinese fixed dome plant
Figure 1.6: Fixed dome plant CAMARTEC design
Figure 1.7: Water-jacket plant with external guide frame
Figure 1.8: Low-cost polyethylene tube digester
Figure 2.1: Administrative map of Rwanda (Provinces and districts)
Figure 2.2: Rwanda Primary Energy Balance in 2008
Figure 2.3: Primary Energy Production & Consumption 2000-2009
Figure 2.4: Electricity production by source by February 2012
Figure 2.5: Total Electricity Installed Capacity, 2000-2009
Figure 2.6: Electricity Net Generation & Net Consumption, 2000-2009
Figure 2.7: Domestic digesters by district installed by September 2012
Figure 2.8: Domestic digesters by province installed by September 2012
Figure 2.9: Carbon Dioxide Emissions 2000-2010
Figure 5.1: Monthly average rainfall for each region in Rwanda and monthly average temperature for Kigali Aero (1961-90)
Figure 6.1: Evolution of dung potential for biogas (tonnes/day) from 2012 to 2020
Figure 6.2: Evolution of biogas potential (m3/day) from 2012 to 2020
Figure 6.3: Biogas potential by District (tonnes/day) from 2012 to 2020
Figure 6.4: Daily biogas potential (m3/day) at district level for period 2012-2020

vii
LIST OF TABLES
Table 2.1: Targets of number of domestic digesters to be installed for period 2007-2011
Table 2.2: Domestic biogas plants installed by district by September 2012
Table 2.3: Domestic biogas plants installed by province by September 2012
Table 4.1: Interviews and discussions conducted
Table 4.2: Appropriate Energy Model
Table 5.1: The potential waste for biogas generation
Table 5.2: Cost of the Modified GGC Nepal model biogas plant in Rwanda
Table 5.3: Cost of Rwanda design biodigesters
Table 5.4: The biogas sector assessed
Table 6.1: Projection of biogas potential between 2012- 2020
ANNEXURE
Annex 1: Biogas Potential for period 2012- 2020
Annex 2: Impact of Domestic Biogas on Forest
Annex 3: General Information on Biogas Plants in Prisons
Annex 4: Net GHG Saving by Household Biogas Plants
Annex 5: Net GHG Saving by Biogas Plants in Prisons
Annex 6: Data Base of Institutional Biogas
Annex 7: Biogas Companies
Annex 8: Questionnaire: Biogas plant Owner
Annex 9: Questionnaire: Biogas Companies

1 Chapter one: INTRODUCTION AND BACKGROUND
The interest in biogas technology is increasing worldwide due to the requirements of renewable energy, reusing materials and reducing harmful emissions. Biogas technology offers versatile options to meet all the objectives mentioned above with simultaneous controlled treatment of various organic materials. Biogas produces methane-rich biogas that can be used as renewable energy in various ways. In this section, biogas basics are given while the biogas production is developed in section two. The section three describes briefly the history of biogas technology when the section four deals with different types of biogas plants.
1.1 Biogas basics
1.1.1 What is biogas?
Biogas is a gaseous fuel obtained from biomass by the process of anaerobic (without air) digestion. In absence of oxygen, anaerobic bacterias decompose organic matter and produce a gas mainly composed of methane (40-70 %) and carbon dioxide (30-60 %) with small impurities such as hydrogen sulphide (0-3 %) and hydrogen (0-1 %)[GTZ, Volume 1, undated].
The heating value of biogas ranges between 5.5-8.0 kWh/mn3 i.e. 20-25 MJ/mn
3 [Navickas, 2009]. However, the composition of biogas depends on the pressure and the temperature at the digestion process and may be affected by the moisture content.
1.1.2 The raw materials for biogas production
In principle, all biomass can be fermented and digested and are formed in carbon and hydrogen. They can be combusted or burned. Those are generally the waste biomass or cultivated biomass [Luostarinen et al., 2011]. The waste biomass includes agricultural wastes (e.g. straw of rice, wheat, bagasse of sugarcane and waste tree leaves), rural animal wastes (e.g. cattle dung, human excreta, piggery dung and waste, poultry waste and slaughterhouse waste), urban garbage, aquatic wastes (waste from fishery), forestry residues and industrial wastes (e.g. waste from sugar factory, tannery, furniture industry and food processing industry). The waste is generated periodically and can be harnessed to generate methane gas, a useful gas that can be used for energy production. The cultivated or harvested biomass is specially grown on land or in sea/lake for obtaining raw materials for biogas production. This category of biomass includes agricultural energy crops, aquatic crops (e.g. harvested algae) and forest crops. However, wood does not ferment easily. Therefore pyrolysis or incineration processes are preferred for wood to energy conversion. The maximum of gas-production from a given amount of raw material depends on the type of substrate, temperature, process adopted etc.
1.1.3 Utilization
The biogas plant delivers a high grade fuel which has methane, carbon dioxide and other impurities. The biogas is used [Fulford, 2012; Luostarinen, 2011]:
• As fuel for kilns/ furnaces, domestic fuel used for cooking and lighting :Biogas replaces firewood and charcoal, so reduces deforestation
• As fuel for internal combustion (IC) engines to drive pump sets, producing electrical energy from IC Engine driven generator sets : Biogas replaces LPG and kerosene, so saves fossil carbon
• For producing mechanical energy by IC engine operated by biogas
• Biogas production is accompanied by output compost that can be used as an organic fertilizer or a soil amendment.

2
1.1.4 Benefits of biogas technology
Well-functioning biogas system unit can yield a whole range of benefits for their users, the society and the environment in general, the chief benefits being [GTZ, Volume 1, undated];
• Production of energy (heat, light, electricity).
• Transformation of organic wastes into high quality fertilizer.
• Improvement of hygienic conditions through reduction of pathogens, worm eggs and flies.
• Reduction of workload, mainly for women, in firewood collection and cooking.
• Environmental advantages through protection of forests, soil, water and air.
• Micro-economical benefits through energy and fertilizer substitution, additional income sources and increasing yields of animal husbandry and agriculture
• Macro-economical benefits through decentralized energy generation, import substitution and environmental protection.
• Global Environmental Benefits of Biogas Technology.
1.2 Biogas production
The whole biogas-process can be divided into three steps: hydrolysis, acidification, and methane formation (Figure 1.1).
1.2.1 Hydrolysis
In the first step (hydrolysis), the original organic matter containing carbohydrates, fats and complex organic compounds is enzymolyzed externally by extracellular enzymes (cellulase, amylase, protease and lipase) of microorganisms and then they are split up into simpler organic compounds due to bacteria [Rao & Parulekar, 1990].
1.2.2 Acidification
The micro-organisms of anaerobic and facultative groups (i.e. bacteria that can grow under acid conditions) involved in the second step, produce fermentation and hydrolysis to form volatile liquids and solids of simpler organic nature and acids such as acetic acid (CH3COOH) [Rao & Parulekar, 1990]. In this acid formation phase, hydrogen (H2) and carbon dioxide (CO2) are also released. To produce acetic acid, they need oxygen and carbon. For this, they use the oxygen solved in the solution or bounded-oxygen. Hereby, the acid-producing bacteria create an anaerobic condition which is essential for the methane producing microorganisms. Moreover, they reduce the compounds with a low molecular weight

3
into alcohols, organic acids, amino acids, carbon dioxide, hydrogen sulphide and traces of methane. From a chemical standpoint, this process is partially endergonic (i.e. only possible with energy input), since bacteria alone are not capable of sustaining that type of reaction. [GTZ, Volume 1, undated]
1.2.3 Methane formation
In this stage the organic acids and chemicals formed in the second stage are decomposed by anaerobes to release methane (CH4) and carbon dioxide gases.
The processes of acid formation and methane fermentation should continue without retarding each other. Both these processes are caused by different types of bacteria. The two processes should be in optimum dynamic continuation for efficient release of methane gas. Stronger acid formation process retards the methane production process and vice versa [Rao & Parulekar, 1990]. In practical fermentation processes the metabolic actions of various bacteria all act in concert. No single bacterium is able to produce fermentation products alone.
1.3 Parameters and process optimization
In microbiological methanation, the following parameters are controlled and optimized by improvements in the design of the biogas plant:
1.3.1 Substrate temperature
1.3.1.1 Temperature range of anaerobic fermentation
The process of biogas production takes place in anaerobic conditions and in different temperature diapasons. There are psychrophilic (temperature diapason below 200 C), mesophilic (20-400 C) and thermophilic (above 40 0C) regimes of bioconversion. Biogas production in a thermophilic regime is much higher than for the mesophilic and psychrophilic regimes. In principle, anaerobic fermentation is possible between 3°C and approximately 70°C [GTZ, Volume 1, undated; Asgari et al., 2011].
1.3.1.2 Minimal average temperature
The rate of bacteriological methane production increases with temperature. However, given the amount of free ammonia also increases with temperature, bio-digestive performance may be inhibited or even reduced. In general, unheated biogas plants perform satisfactorily if the annual average temperature is about 20 °C or above or when the average daily temperature is at least 18 °C [Energypedia, 2012]. In the range of 20-28 °C average temperature, gas production increases more than proportionally. If the temperature of the biomass is less than 15 °C, gas production is so low that the biogas plant is no longer economically viable [Asgari et al., 2011]. The process of anaerobic digestion is very sensitive to temperature variations. The sensitivity, in turn, depends on the temperature range
1.3.2 Available nutrients
To grow, the bacteria need more than a simple input of organic matter as a source of carbon and energy. They also need some mineral nutrients. In addition to carbon, oxygen and hydrogen, the production of biomass requires a sufficient amount of nitrogen, sulfur, phosphorus, potassium, calcium, magnesium and a number of trace elements such as iron, manganese, molybdenum, zinc, cobalt, selenium, tungsten, nickel, etc. Original substrates such as agricultural residues and municipal wastewater usually contain sufficient quantities of the items mentioned. Human excreta contains phosphorous. A higher concentration of any individual substance usually has an inhibitory effect, whereas analyzes are recommended on a case-by-case basis to determine the amount of nutrients, if any, has yet to be added [Energypedia, 2012].
1.3.3 Retention time
The retention time can only be accurately defined in batch-type facilities (i.e. digesters treating a large amount of material at once). For continuous systems (i.e. systems adding and removing waste material on regular basis), the mean retention time is approximated by dividing the digester volume by the daily

4
influent rate. Depending on the vessel geometry, the means of mixing, etc., the effective retention time may vary widely for the individual substrate constituents. Selection of a suitable retention time thus depends not only on the process temperature, but also on the type of substrate used [GTZ, Volume 1, undated].
1.3.4 Hydrogen ion concentration (pH)level
Hydrogen ion concentration-pH is a measure of the degree of acidity or alkalinity of a solution i.e. measure of the activity of the solvated hydrogen ion. The methane-producing bacteria live best under neutral to slightly alkaline conditions. The process of fermentation in the digester solution is considered to be optimum for biogas generation when the pH takes on a value ranging between 7 and 8.5. A digester containing a high volatile-acid concentration requires a somewhat higher-than-normal pH value. If the pH value drops below 6.2, the medium will have a toxic effect on the methanogenic bacteria [Asgari et al., 2011].
1.3.5 Nitrogen inhibition and C/N ratio
1.3.5.1 Nitrogen inhibition
All substrates contain nitrogen. For higher pH values, even a relatively low nitrogen concentration may inhibit the process of fermentation. Noticeable inhibition occurs at a nitrogen concentration of roughly 1.7µg ammonium-nitrogen (NH4-N) per litre substrate. Nonetheless, given enough time, the methanogens are capable of adapting to NH4-N concentrations in the range of 5.0-7.0µ g/litre substrate, the essential condition being that the ammonia level (NH3) does not exceed 0.2-0.3µg NH3-N per litre substrate. The rate of ammonia dissociation in water depends on the process temperature and pH value of the substrate slurry [Asgari et al., 2011].
1.3.5.2 C/N ratio
Microorganisms need both nitrogen and carbon for assimilation into their cell structures. Various experiments have shown that the metabolic activity of methanogenic bacteria can be optimized at a C/N ratio of approximately 8-20, whereby the optimum point varies from case to case, depending on the nature of the substrate [Asgari et al., 2011].
1.3.6 Substrate solid content and agitation
1.3.6.1 Substrate solids content
The mobility of the methanogens within the substrate is gradually impaired by increasing solids content, and the biogas yield may suffer as a result. Nevertheless, Asgari et al. (2011) mentioned that “reports of relatively high biogas yields from landfill material with high solids content may be found in recent literature. No generally valid guidelines can be offered with regard to specific biogas production for any particular solids percentage”.
1.3.6.2 Agitation
Many substrates and various modes of fermentation require some sort of substrate agitation or mixing in order to maintain process stability within the digester. Agitation aims mostly the following effects [Energypedia, 2012]:
• To remove the metabolites produced by the methanogens (gas)
• To mix fresh substrate and bacterial population (inoculation)
• To preclude scum formation and sedimentation
• To avoid pronounced temperature gradients within the digester
• To provide a uniform bacterial population density
• To prevent the formation of dead spaces that would reduce the effective digester volume.

5
1.3.7 Inhibitor factors
The presence of heavy metals, antibiotics (Bacitracin, Flavomycin, Lasalocid, Monensin, Spiramycin, etc.) and detergents used in farming may have an inhibitory effect on the process of anaerobic digestion [GTZ, Volume 1, undated]. Lead, copper, and zinc in decreasing order were found to be toxic to biomethanogenesis. Lead at the concentration of 10µg/ml completely stopped methane production. Iron did not produce any notable change in the process while manganese stimulated the rate of methane production. The toxicity of lead, copper, and zinc to methanogenic bacteria and methane production was dose-dependent but the growth of acetogenic bacteria was impaired at higher concentrations (2.5–10.0 µg/ml) of lead, copper, and zinc. Manganese stimulated the growth of only methanogenic bacteria, but not that of non-methanogenic bacteria or acetic acid production.
1.4 History of biogas technology
Marsh gas (i.e. another term of methane produced by plants decomposition under water) was used for heating batch water in Assyria during the 10th century BC and in Persia during 16th century AD [The University of Adelaide, 2012]. The Italian Count Alessandro Volta collected marsh gas and his investigation on its burning behaviour concluded that there was a direction correlation between the amount of decaying organic matter and the amount of flammable gas produced. The first digestion plant was constructed a leper colony in Bombay, India in 1859.AD. Biogas plant reached England in 1895 when biogas recovered from sewage treatment facility and used to fuel street lights in Exeter while in 1920, the first Germany sewage plant began to feed the collected biogas into the public gas supply system [Fulford, 2012]. In the 1930s, Buswell (1930), through its publication on “Production of Fuel Gas by Anaerobic Fermentations” contributed to the development of microbiology as a science leading to identifying anaerobic and the conditions that promote methane production. In 1937, municipal park cars of several German cities ran on biogas from sewage treatment while in 1972, due the oils crisis, construction of biogas plants became more interesting.
1.4.1 In the United States
In 2003, the United States consumed 147 trillion BTU of energy from "landfill gas", about 0.6% of the total U.S. natural gas consumption [Wikipedia, 2012].
Methane biogas derived from cow manure is also being tested in the U.S. The total generating capacity of the existing AD is 57.1MW providing about 374,000MWh annually [Bramly et al., 2011].
1.4.2 In the United Kingdom
In the UK there is a history of using anaerobic digestion of sewage sludge at major sewage treatment. In 2004, UK produced 1.5 million of TOE of biogas. Currently, there are some 38 AD plants at sewage works with a capacity of 61MW and 308 generating plants from landfill gas with a capacity of 660MW providing all about 4,70 GWh [NSCA,2006]. On 5 October 2010, biogas was injected into the UK gas grid for the first time [Wikipedia, 2012].
1.4.3 In Germany
In 1906, the first anaerobic waste –treatment plant was constructed in Germany and as we have seen above, the first Germany sewage plant began to feed the collected biogas into the public gas supply system in 1920 [GTZ, Volume 1, undated].
Currently, Germany has become Europe's biggest biogas producer as it is the market leader in biogas technology [Bramly et al. 2011]. In 2010 there were 5,905 biogas plants operating throughout the whole country. About 5800 of these plants are employed as power plants to produce the total installed electrical capacity of 2,291 MW. The electricity supply from biogas sector was approximately 12.8 TWh which is 12.6 per cent of the total generated renewable electricity. [Wikipedia, 2012] and currently it equals 2.6 of the German electricity consumption [Bramly et al., 2011].

6
1.4.4 In China
The history of biogas exploration and utilization in China covers a period of more than 70 years. First biogas plants were built in the 1940s by prosperous families. Around 1970, China had installed 6 million digesters in an effort to make agriculture more efficient. In 1978, more than 7 million small biogas digesters have been constructed and, over 20 million persons used biogas as a fuel [GTZ, Volume 1, undated] while in 2009, about 17 million biogas plants were working in China [Fulford, 2012].
1.4.5 In India
Although in 1897, Mumbai biogas systems were used in lights and that in 1907, biogas began to be used in engines [Fulford, undated], in India, the development of simple biogas plants for rural households started in the 1950s. A massive increase in the number of biogas plants took place in the 1970s through strong government backing [GTZ, Volume 1, undated]. Meanwhile, more than 12 million biogas plants existed in India [Fulford, 2012].
1.4.6 In other Asian countries
Biogas digester technology is well installed in several Asian countries. For instance, by February 2009, SNV in partnership with other institutes and experts has built 177,000 biogas plants in Nepal, 41,000plants in Vietnam, 2,800 plants in Bangladesh and 1,950 in Cambodia [SNV, 2008].
1.4.7 In Africa
Biogas technology is considered as one of the renewable technologies in Africa that can help in solving its energy and environmental problems. To date, some digesters have been installed in several sub-Saharan countries, utilizing a variety of waste such as from slaughterhouses, municipal wastes, industrial waste, animal dung and human excreta [Amigun et al. undated]. South Africa Some of the first biogas digesters were set up in 1950s in South Africa [Amigun et al. undated] but the country was not much interested so that Biogas Projects are still in their early stages of implementation. Kenya In 1957, a farmer built the first biogas digester in Kenya mainly to provide all the gas and fertilizer that his coffee farm needed. Currently, it is estimated that only up to 2000 units have been installed in total [Biogas for Better Life, 2007]. Tanzania. This is one of the countries that has progressed well in terms of biogas development and has several case studies [Amigun et al. undated]. Biogas digesters were first introduced in 1975 and The Government and Private Enterprises have built around 6,000 biogas digesters in the period 1980s-1990s [SNV Tanzania, undated]. A Tanzanian Domestic Biogas Programme was initiated in 2007, following a feasibility study by the GTZ. The Programme set an ambitious goal of developing 3500 to 4000 units each year with a target of 12,000 plants by December 2013. Uganda SNV Uganda (2010) indicates that biogas has been in Uganda since 1950 and that its dissemination and adaptation have met limited success owing to the higher upfront costs and low technical human resource potential. However, since early 90s, biogas technology has become a system for practical application at household, institutional and industrial level. The number of bio-digesters in Uganda has grown from an estimated 100 in 1990 to 700 digesters by 2008 while the Uganda Domestic Biogas Programme build 583 plants in 2010 and 1354 were built in 2011[ABPP, 2012]. The programme aims to build over 20,000 biogas plants by 2013.

7
Burundi The first agricultural family plants were constructed on livestock farms in the region of Cankuzo in 1985. In 1987 the project was extended to include the Ruyigi region. At the same time the building of biogas plants started for the toilets of schools and other institutions. Private contractors were commissioned for larger plants. The training of craftsmen, the establishment of a service system and the opening of material credit funds were to provide the basis for a self-reliant dissemination concept. By 1992, 206 small-scale plants, and 84 institute plants with digester volumes of over 100 m3 had been constructed [GTZ, Volume 4, undated]. Rwanda The first construction of a biogas plant was made in 1982 by a biogas consultant from Nepal. Four plants in the size from 8 to 20 m3 were built at Kabuye (Kigali city) and training was directly organised. After that; other plants was built at Rwesero (Northern Province) and at PADEC project in Murambi (Eastern Province) under supervision of SNV Rwanda. But that has been taken no longer because the General directorate of energy in the Ministry of Public Works, Water and Energy and SNV Rwanda did not lead to anything. At the end of 1990, some hundred domestic biogas plants of fixed dome model have been constructed, that was according to an international biogas survey published by BORDA in Bremen (Guy Dekelver, Silas Ruzigana and Jan Lam; August 2005). The first prison had a biogas plant in 2001 through KIST technicians, which have been started the project of dissemination of biogas plants into prisons in order to solve the problem of cutting trees and wood charcoals use (KIST, 2005) The biogas promotion in the whole country was started into 2006 through the SNV Rwanda project by cooperation with the Ministry of Infrastructure. 2006 was pilot year which may run in phase one up to 2010 (SNV doc. biogas promotion-Rwanda). About 15000 Biogas plants were planned to be built by 2012 (EDPRS, 2007).
1.5 Biogas plants technology
The plant which converts biomass to biogas by the process of anaerobic digestion is generally called a biogas plant. The feed slurry is fed into the digester (reactor) for fermentation. The feed slurry may be filled in the digester through the inlet tank or may be directly fed into the digester. Seeding matter (bacteria rich substance) may be added to the slurry in the digester to start and accelerate the process of anaerobic digestion. The biomass slurry is retained in the digester for several days to allow anaerobic fermentation. This time period is called retention time. Thus, retention time (also known as hydraulic retention time, HRT) is the average time that a given quantity of input remains in the digester to be acted upon by the methanogens [Lam, et al., 2011]. The retention time varies with the size of the biogas plant, type of feed, ambient temperature, rate of infeed etc [GTZ, Volume 1 &2, undated]. The biogas plants are built in several different configurations, simple to complex, small to large. Here the following three important types of biogas plants are described: The biogas plants are built in several different configurations, simple to complex, small to large.
1.5.1 Feed methods
The most common distinction is made between batch and continuous plants: (a) Batch plant is filled with substrate completely and then emptied completely after a fixed retention time. The operation is simply to charge a hermetic reactor with the substrate, in some cases, a chemical (regularly a base) to maintain the pH near neutral. The reactor is then closed, and the fermentation is allowed to make 30 to 180 days supplying the gas, depending on the ambient temperature [FAO, 1992]. Afterwards, it is emptied and recharged. This type of plant require large volume of digester, therefore initial cost becomes high. Its main components are shown in Figure 1.2.

8
(b) Continuous biogas plant is filled and emptied regularly -normally daily [Sasse, 1988]. The plant operates continuously and is stopped only for maintenance or for sludge removal. Continuous plants empty automatically through the overflow.
Continuous plants are more suitable for rural households. However, almost all biogas plants built today in developed countries are continuous type plants.
Substrate for this type of plants should be liquid and homogenous. Gas production is constant, and somewhat higher than in batch plants [Sasse, 1988].
1.5.2 Different types of biogas plants
The following three main types of simple biogas plants are described below:
1.5.2.1 Balloon plants
A balloon plant consists of a heat- sealed plastic or rubber bag in the upper part of which the gas is stored. The inlet and outlet are attached directly to the plastic skin of the balloon [GTZ, 1989]. The gas pressure can be increased through the elasticity of the balloon by adding weights on the balloon. The basic elements of a balloon plant are shown in figure 1.3.

9
Advantages Low cost, ease of transportation, low construction sophistication, shallow installation suitable for use in areas with a high groundwater table, high digester temperatures, uncomplicated cleaning, emptying and maintenance; difficult substrates such as water hyacinths can be used. Disadvantages Low gas pressure requires extra weight burden, scum cannot be removed. The plastic balloon has a relatively short useful life (about 5 years) [Sasse, 1988], is highly susceptible to damage by mechanical means, usually not available locally and, has a little creation of local employment. In addition, local craftsmen are rarely in a position to repair a damaged balloon.
Balloon biogas plants recommended, if local repair is or can be possible and the cost advantage is substantial. Balloon plants can be also recommended wherever the balloon skin is not likely to be damaged and where the temperature is regular and high [Energypedia, 2012].
1.5.2.2 Fixed-dome plants
A fixed-dome plant (Figure 1.4) consists of an enclosed digester with a fixed, immovable, rigid gas holder, which sits on top of the digester and a displacement pit. The gas is stored in the upper part of the digester. When gas production starts, the slurry is displaced into the compensation tank. Gas pressure increases with the volume of gas stored and the height difference between the slurry level in the digester and the slurry level in the compensation tank.
Advantages Relatively low construction costs, the absence of moving parts and rusting steel parts. If properly constructed, fixed dome plants have a long shelf life (20 years or more) [Sasse, 1988]. The underground construction of the plant saves space and protects the digester from temperature changes and from physical damage. The construction creates employment locally. Disadvantages Masonry is not normally gaslight (porosity and cracks) and therefore requires the use of special sealants. Cracking often causes irreparable leaks. Fluctuating gas pressure complicates gas utilization, and plant operation is not ready understandable.

10
Fixed-dome plants are, therefore, recommended only where construction can be supervised by experienced biogas technicians and when the user is amply familiar with how the plant operates.
Types of fixed dome plants
• Chinese fixed-dome plant is the archetype of all fixed dome plants which has been developed in China. The main characteristic of this design is that the digester and gas holder are a part of composite unit made of brick masonry. The digester consists of a cylinder with round bottom and top. The Chinese fixed dome plant has a cylindrical digester with dome shaped roof and large inlet and outlet tank (Figure 1.5).
• Janata model was the first fixed-dome design in India by Planning Research and Action Division and is a modified Chinese design with a brick reinforced and molded dome.
• Deenbandhu model is an improved version of Janata model by Action for Food Production in India and is more crack-proof and consumes less building material than the Janata plant. It is a fixed dome plant with a hemisphere digester.
• CAMARTEC model (Figure 1.6) has a simplified structure of a hemispherical dome shell based on a rigid foundation ring only and a calculated joint of fraction, the so-called weak / strong ring. It was developed in the late 80s by the Centre for Agricultural Mechanization and Rural Technology (CAMARTEC) in Tanzania.

11
1.5.2.3 Floating-drum plants
A floating-drum plant consists of a cylindrical or dome-shaped underground digester and a moving, floating gas-holder or drum. The gasholder floats either directly on the fermentation slurry or in a separate water jacket. The gas is collected in the gas drum, which rises or moves down, according to the amount of gas stored. If biogas is produced, the drum moves up while the gasholder sinks back if gas is consumed. The drum has an internal and /or external guide frame that provides stability and keeps the drum upright [GTZ, Volume 1, undated]. Floating-drum plants are used chiefly for digesting animal and human feces on a continuous feed mode of operation, i.e. with daily input. They are used most frequently by small- to middle-sized farms (digester size: 5-15m3) or in institutions and larger agro-industrial estates (Digester size: 20-100m3)[GTZ, Volume 2, undated]. Types of floating-drum plants
There are different types of floating-drum plants:
• KVIC model with a cylindrical digester is the oldest and most widespread floating drum biogas plant from India and developed by Khadi and Village Industry Commission (KVIC). It consists of a deep well and a floating drum usually made of mild steel.
• Pragati model is a floating drum plant with a hemisphere digester
• Ganesh model is a floating plant made of angular steel and plastic foil
• floating-drum plant made of pre-fabricated reinforced concrete compound units
• Floating-drum plant made of fibre-glass reinforced polyester low cost floating-drum plants made of plastic water containers or fiberglass drums.
• BORDA model: The BORDA-plant combines the static advantages of hemispherical digester with the process-stability of the floating-drum and the longer life span of a water jacket plant
1.5.2.4 Water-jacket floating-drum plants
As the floating drum is submerged in the digester content, it becomes dirty and it can even get stuck in cases of severe scum layer formation. An improved design is the water jacket biogas plant (Figure 1.5), with a floating drum that is not in contact with the digester liquid but rests in a water jacket around the top of the plant. The water jacket involves an extra cost but the hygiene of this design is superior to the

12
standard floating drum plant. Water-jacket plants are characterized by a long useful life and a more aesthetic appearance (no dirty gasholder). Due to their superior hygiene, they are recommended for use in fermentation of night soil and for cases involving pronounced scumming, e.g. due to rapid evaporation, since the gasholder cannot get stuck in the scum [Nels, 2013]. The extra cost of the masonry water jacket is relatively modest.
Advantages Floating drum plants are simple and easy to understand and operation - the volume of stored gas is directly visible. The gas pressure is constant, determined by the weight of the gas holder and the volume of gas stored directly visible and recognized by the position of the drum. The construction is relatively easy, construction mistakes do not lead to major problems in operation and gas yield [GTZ, Volume 1, undated]. Gas-tightness is no problem, provided the gasholder is de-rusted and painted regularly [GTZ, Volume 2, undated]. Disadvantages The steel drum is relatively expensive and requires regular maintenance of its painting since the steel pats are susceptible to corrosion. Because of this, floating drum plants have a shorter life-time (up to 15 years; in tropical coastal regions about five years) than fixed-dome plants [GTZ, Volume 2, undated].
1.5.2.5. Low-Cost Polyethylene Tube Digester
Polyethylene domes are used in fixed dome biogas plants especially in Deenbandhu type digester (Figure 1.8) in order to make installation easy and avoid gas leakage through the dome [Energypedia, 2012]. Its construction time can be reduced to only 6 days from 3 weeks for a conventional plant.

13

14
2 Chapter two: CURRENT SITUATION OF ENERGY IN RWANDA
Energy is a key factor for the development of each country. Currently, policy makers, researchers, scientists and businessmen agree that the production, transformation and use of energy must pursue the objective of a sustainable, competitive and secure energy supply. This chapter will provide a brief description of the current situation of energy in Rwanda. An overwhelming majority of primary energy used in Rwanda comes from biomass (86%) as wood, charcoal and agricultural residues while petroleum products and electricity occupy 11% and 3% respectively. Currently, the primary energy consumption per capita in Rwanda is ranked among the lowest in the world. However, Rwanda has considerable hydropower potential, in addition to large deposits of renewable methane gas in Lake Kivu, estimated at 60 billion cubic meters. In rural areas, solar or photovoltaic energy can be used, while up to 1/3 of 155 million tonnes of peat deposit is currently exploitable.
2.1 General National Context
2.1.1 . Geography
Rwanda is a country in central and eastern Africa with a total area of 26,338 square kilometres composed of 24,210 sq km of land area and 2,128 sq km of water and marshland water [NISR, 2008]. Rwanda is located at 1057’ latitude south and 3004’ longitude east and it is bordered by the Democratic Republic of the Congo to the west (along 217 km), Uganda to the north (along 169 km), Tanzania to the east (along 217 km), and Burundi to the south (along 290 km).
Rwanda is characterized by a relief made by a multitude of hills and high mountains. This relief rises progressively from the east where the average altitude is 1,250 metres towards the north and the west where there is a chain of mountains called “Congo Nile Crest” varying between 2,200 and 3,00 metres, and the Virunga volcano chain including the Rwanda’ s highest point (Mount Karisimbi) at 4,507 metres. The centre of the country is predominantly rolling hills, while the eastern border region consists of savanna, plains and swamps.
Rwanda has a temperature tropical highland climate, with annual temperature ranges between 16 and 200C [REMA, 2009] while the mean daily temperature variation is less than 20C. There are some temperature variations across the country; low temperatures are found in the mountainous west and north averaging between 15 and 170C. Moderate temperatures are observed in areas of intermediate altitude where average temperatures range between 19 and 21 ° C. In the lowlands (east and south-west), temperatures are higher and can go far beyond 30 ° C in February and July-August [REMA, 2009]
There are two rainy seasons in the year; the first runs from February to June and the second from September to December. These are separated by two dry seasons: the major one from June to September, during which there is often no rain at all, and a shorter and less severe one from December to February. Rainfall varies geographically, with the west and northwest of the country receiving more precipitation annually than the east and southeast. The country annual rainfall averages 1,212 mm [World Bank, 2010] but can reach 1500mm in the north and north- west and 900 mm in the east and south east [REMA, 2009].
2.1.2 Demography
Estimates for 2011 are a total population of almost 10.8 million [NISR, 2011]. At 432 inhabitants per square kilometre, Rwanda's population density is amongst the highest in Africa. Rwanda’s population growth rate is 2.80 per cent per annum and with 85.2 per cent, the majority of population lives in rural areas [NISR, 2011]. The birth rate is 36.74 per thousand populations and death rate is 9.88 per thousand populations while the life expectancy is estimated to be 58.02 years [Index mundi, 2012].

15
2.1.3 . Politics
Politics of Rwanda takes place in a framework of a presidential republic, whereby the President of the Republic is the head of state and while the government is headed by a Prime Minister, and of a multi-party system. There are three branches of government which are separate and independent from one another but all complementary [Republic of Rwanda, 2003]. Executive Power is exercised by the government i.e. the President of the Republic and the Cabinet. Legislative Power is vested in a Parliament consisting of two chambers: the Senate (Upper Chamber) and the Chamber of Deputies (Lower Chamber). Judicial Power is exercised by the Supreme Court and other courts established by the Constitution and other laws. The country is divided into five administrative provinces (North, South, East and West) and the City of Kigali , 30 districts as shown in Figure 2.1, 416 sectors, 2148 cells and 14 837 villages (called Imidugudu).
Figure 2.1: Administrative map of Rwanda (Provinces and Districts)
Source: African Forest Forum, 2011
2.1.4 . Economy
Rwanda is a country of few natural resources (gold, cassiterite, wolframite, coltan, methane, hydropower, arable land etc.), and the economy is based mostly on subsistence agriculture by local farmers using mainly simple tools. In 2007, labour force was estimated to 4.446 million populations with 90% of them employed in agriculture sector and 10% in both industry and services according to estimation made in 2000. However, agriculture comprised an estimated 33%, industry 13.9% and services 53.1% of GDP in 2011 [CIA, The World Fact book, 2011].
As reported by the World Bank the Gross Domestic Product (GDP) in Rwanda was worth 6.38 billion US dollars in 2011(i.e. GDP per capita was about 590 USD). The GDP value of Rwanda represents 0.01 percent of the world economy [Trading Economics, 2012].

16
Corrected for price levels between countries, Rwanda’s GDP per capita was 1,300 USD in 2011[CIA, The World Fact Book, 2011].
GDP has rebounded with an average growth rate of 7-8 per cent since 2003 and inflation has been reduced to single digits of 2.3% in 2010[CIA, The World Fact book, 2011].
Nevertheless, 44.9% of the population still live below the poverty line and 24.1 % live in extreme poverty [NISR, 2011]. Rwanda is still characterized by a low human development of 0.429 in 2011 and therefore it was ranked 166th out of 186 countries of the United Nations according to 2011th Human Development Index [CIA, The World Fact book, 2011].
Exports are mainly dominated by coffee, tea and tin ore and totalled 234.2 million USD in 2010 while imports amount 1.121 billion USD and consist of foodstuffs, machinery and equipment, petroleum products, construction material etc.
Tourism is one of the fastest-growing economic resources and became the country's leading foreign exchange earner in 2011[CIA, The World Fact book, 2011].
It should be noted that in the transport sector, Rwanda had 14,008km of highways including 2,662 km paved and 11,346 km unpaved in 2004.
2.2 Energy situation
2.2.1 Rwanda primary energy balance
The composition of the current primary energy balance in Rwanda is as follows as shown in Figure 2.2: today approximately 86% of primary energy still comes from biomass, in the form of wood that is used directly as a fuel (57%) or is converted into charcoal (23%), together with smaller amounts of crop residues and peat (6%). Of the 14% of non-biomass primary energy, petroleum products account for 11% (used mainly in the transport sector) and electricity for approximately 3% [MININFRA, 2008].
Figure 2.2: Rwanda primary energy balance in 2008 Source: MININFRA, 2008 Firewood and charcoal are practically the sole sources of energy for cooking energy in Rwanda. Firewood covers 86.3 % of the demand and charcoal 10.6 %, the remaining 3.1 % being mainly covered by agricultural residues. In rural areas 93.4% of households use firewood for cooking and 3.9% using charcoal while in urban areas households using firewood and charcoal for cooking are 45.3% and 50.9% respectively [NISR, 2011]. The main sources of lighting energy are petroleum products (44.4% of households), torch (28.6%), electricity (10.8%), and the remaining 16.2% being mainly covered by firewood. Even in urban areas only 46.0% of households use electricity for lighting [NISR, 2011].

17
In 2009, the primary energy consumption per capita was 1.10 million Btu (about 321kWh per capita) [IEA, 2012] which puts Rwanda in a position beyond 98th percentile of countries worldwide for primary energy consumption per capita.
Figure 2.3: Primary Energy Production & Consumption, 2000-2009 Source of data: International Energy Agency (IEA)
2.2.2 Electricity Generation
In Rwanda Energy Investment Forum held between 29th February and 1st March 2012 at Kigali, it was revealed that the existing installed capacity was 100.5 MW while the available capacity was 87.5MW [RDB, 2012] produced from home hydropower (41.7%), import hydropower (15.7%), thermal power (38.7%), solar energy (0.3%) and methane to power (3.6%)(Figure 2.4). The two main sources were hydroelectricity (57.4% of the total capacity) and conventional thermal i.e. diesel and heavy oil fuel (38.7%). Rwanda’s total electricity energy has increased on an annual rate of 4.1% over the last 20 years to 67 MW in 2008[IEA, 2012]. In the last three years, the total installed capacity has increased by about 50 % as shown in Figure 2.5. Total electricity capacity is made of 57.7% of renewable energy i.e. 57.4% for hydroelectricity and 0.3% for solar energy.

18
Figure 2.4: Electricity production by source by February 2012 Source of data: RDB, 2012
Figure 2.5: Total Electricity Installed Capacity, 2000-2009 Source of data: International Energy Agency (IEA) In 2009, Rwanda’s total net electricity consumption was 0.30 billion kWh while the net electricity generation was 0.24 billion kWh (Figure 2.6). The total electricity net imports mainly from the Democratic Republic of Congo was 0.087 billion kWh. Rwanda with less than 30 kWh per capita in 2009 remains one of the countries with the lowest electricity consumption per capita in the region. In 2011, only 10.8% of the population (or 215, 000 households) has access to electricity [NISR, 2011].

19
Figure 2.6: Electricity Net Generation & Net Consumption, 2000-2009 Source of data: International Energy Agency (IEA)
2.2.3 . Methane Gas production
Methane gas production is one of the most important sectors undergoing in energy growing sector. As the Rwanda has experienced the big shortage of energy in 2004, it has started to maximize all potential of energy in future development. The Lake Kivu was found as an important resource of methane gas production. It is located in the East African Rift Zone between Rwanda and DRC; with a potential of 300 billion cubic meter of Oxide dioxide gas (CO2) and 60 billion cubic meters of methane gas (CH4). From different studies done, it may produce equivalent to 700 MW of Electricity generation over around 55 years. The methane production has started, already 4.5 MW is now generated and being connected into national grid [RDB, 2012; EWSA, 2012]. Rwanda account to produce 300MW from methane gas within next 5 years to increase its energy potential.
2.2.4 Geothermal energy potential
As Rwanda is located in Eastern African rift valley and having volcanic origin, especially in its western region, where a seismic and magmatic movement are found, it was an important potential to generate an energy which may participate to increase its energy sector. Two main geothermal sites are identified, one in Virunga region (Gisenyi, Karisimbi and Kinigi) another in Western-south region (Mashyuza-Bugarama) with a potential estimated to 700 MW and currently, the country plan to develop only 310 MW within next 5 years. Project has already started for the first phase and 10MW electricity will be generated and feed in national grid by 2014. Reconnaissance surface studies has demonstrated that the drilling reservoir reach 100-150o C temperature at about 3 to 5 km bottom [RDB, 2012; EWSA, 2012].
2.2.5 . Peat energy potential
In Rwanda, it observes about 155 million tonnes of dry peat extended to 50 000 hectares’ area in Southern region. 77% are observed in the swamp of Nyabarongo and Akanyaru Rivers and Rwabusoro plains. The estimated total power covered from the peats is about 1200MW. Within next five years (2017), Rwanda plan to develop 200MW from its peats potential and that will contribute to energy sector. As pilot project, the first plant is now under construction at Bugarama to produce 15 MW [RDB, 2012; EWSA, 2012].

20
2.2.6 Waste to power energy potential
It is observed that from markets, restaurants, hotels, households, schools and high institutions correct a lot of solid waste and brought to the main compost. Kigali city is producing about 45 tons per day, those including the organic waste materials, agriculture, livestock waste and water hyacinth. Before 2012, in Kigali City, all solid wastes were centrally transported to Nyanza landfill in Kicukiro district but currently, all waste is collected in compost fitted in the Nduba sector in Gasabo district. Theoretical 100 tons per day of raw municipal solid waste can produce 1 MW. Now, the population of Kigali city is around 1.1 million [NISR, 2012] and it will be about 1.5 million by 2020. It will reach about 1000 tons per day. It implies that the plant of 10MW is possible to be constructed.
2.2.7 Solar and Wind energy potential
Considering the geographical location of Rwanda, its climate is favourable to solar plant. It is a savannah climate where has enough solar radiation intensity; up to 5 kWh/m2/day and peak sun hours of around 5hours per day. Currently, there is solar plant of 250 kW and is connected to the national grid. We account most of small solar plants useful for electrifying some isolated institutions like health centres, schools sectors offices… There is solar project like a construction of new solar plant of 10 MW at eastern Province (NYAGATARE district). The government has reserved a land of about 25 hectares for this project. Wind energy in Rwanda has not yet been fully developed, because of lack of enough data; some studies have been carried out but not being successfully. The Studies done at five locations resulted that Rwanda has not enough potential of wind energy [Tyldesley & Hogarth, 2011].
2.2.8 Biogas
The Ministry of Infrastructure is also strongly engaged in the promotion of biogas. In 2006, 441 biogas installations were being used in rural households instead of firewood. The National Domestic Biogas Program (NDBP) planned that by 2012 at least 15,000 families would use biogas for cooking and lighting. MININFRA in collaboration with MINEDUC has started a program for the construction of institutional biogas installations in schools, hospitals and other community institutions once funding has been secured.
2.2.8.1. Domestic biogas plants planned for construction for period 2007-2011 The National Domestic Biogas Programme has planned to build about 15, 000 domestic biogas plants in the period 2007-2011 as shown in Table 2.1.

21
Table 2.1: Targets of number of domestic biogas to be installed for period 2007-2011
Year Biogas plants to be installed
2008 600
2009 2750
2010 4300
2011 7200
Total 14850
Source: EWSA
The number of digesters expected to build by 2012 has not been reached. It was built only 2236 digesters representing 15% of what it was expected. Staffs of NDBP and SNV-Rwanda explain that this low result is due mainly to the high cost of a biogas plant and lack of mobilization. The actual number of digesters built is shown in table 4.2.
2.2.8.2. Actual domestic biogas plants installed by September 2012
The number of domestic biogas plants built by district is represented in table 2.2 and Figure 2.7 while the number of domestic biogas installed by province is given in table 2.3 and Figure 2.8.
Table 2.2: Domestic biogas plants installed by District by September 2012
Digester size (m3) Number of digesters No District 4 5 6 8 10
1 Bugesera 15 0 60 6 7 88
2 Burera 15 0 48 6 2 71
3 Gakenke 13 0 36 2 1 52
4 Gasabo 2 0 83 17 19 121
5 Gatsibo 5 0 43 13 5 66
6 Gicumbi 4 0 91 26 6 127
7 Gisagara 19 0 82 30 7 138
8 Huye 3 0 12 10 1 26
9 Kamonyi 5 0 41 7 4 57
10 Karongi 0 0 21 6 3 30
11 Kayonza 29 0 76 3 1 109
12 Kicukiro 0 0 25 4 10 39
13 Kirehe 2 0 218 1 1 222
14 Muhanga 14 0 30 4 3 51
15 Musanze 26 0 74 10 5 115

22
Table 2.2 (cont.)
16 Ngoma 13 0 94 13 3 123
17 Ngororero 6 0 17 2 1 26
18 Nyabihu 19 0 24 1 0 44
19 Nyagatare 0 0 78 20 8 106
20 Nyamagabe 7 0 33 3 0 43
21 Nyamasheke 8 0 102 0 1 111
22 Nyanza 5 0 27 4 2 38
23 Nyarugenge 0 0 10 3 3 16
24 Nyaruguru 0 0 17 2 1 20
25 Rubavu 7 0 22 6 10 45
26 Ruhango 4 0 56 10 5 75
27 Rulindo 34 0 63 7 3 107
28 Rusizi 11 0 17 8 2 38
29 Rutsiro 5 0 9 12 0 26
30 Rwamagana 8 0 59 28 11 106
Total 279 0 1568 264 125 2236
Source of data: EWSA, 2012

23
Table 2.3: Domestic biogas plants installed by Province by September 2012 Digester size (m3) Number of
digesters Province 4 5 6 8 10
East
Bugesera 15 0 60 6 7 88
Gatsibo 5 0 43 13 5 66
Kayonza 29 0 76 3 1 109
Kirehe 2 0 218 1 1 222
Ngoma 13 0 94 13 3 123
Nyagatare 0 0 78 20 8 106
Rwamagana 8 0 59 28 11 106
S/T 72 0 628 84 36 820
North
Burera 15 0 48 6 2 71
Gakenke 13 0 36 2 1 52
Gicumbi 4 0 91 26 6 127
Musanze 26 0 74 10 5 115
Rulindo 34 0 63 7 3 107
S/T 92 0 312 51 17 472
West
Karongi 0 0 21 6 3 30
Ngororero 6 0 17 2 1 26
Nyabihu 19 0 24 1 0 44
Nyamasheke 8 0 102 0 1 111
Rubavu 7 0 22 6 10 45
Rusizi 11 0 17 8 2 38
Rutsiro 5 0 9 12 0 26
S/T 56 0 212 35 17 320
South
Gisagara 19 0 82 30 7 138
Huye 3 0 12 10 1 26
Kamonyi 5 0 41 7 4 57
Muhanga 14 0 30 4 3 51
Nyamagabe 7 0 33 3 0 43
Nyanza 5 0 27 4 2 38
Nyaruguru 0 0 17 2 1 20
Ruhango 4 0 56 10 5 75
S/T 57 0 298 70 23 448
Kigali City
Gasabo 2 0 83 17 19 121
Kicukiro 0 0 25 4 10 39
Nyarugenge 0 0 10 3 3 16
S/T 2 0 118 24 32 176
TOTAL 279 0 1568 264 125 2236

24
2.2.8.3. Biogas plants in institutions
Institutions like the prisons, schools etc. have enormous demand for energy. For instance, some prisons consume up to 25 m3 (more than 10 tonnes) of firewood per day. The use of fuel wood at this rate can easily lead to local forest deforestation. The use of biogas by the institutions can save firewood and thus preserve the forest.
Currently biogas plants are running in 11 prisons, 30 schools, 3 religious congregations and 2 military camps (Annex 6). Also, about 3 biogas plants were constructed in farms and 2 in hospitals.
2.2.9. Carbon Dioxide/Green House Gas Emissions
In 2008, total carbon dioxide emissions in Rwanda has reached 0.72 million Metric Tons as shown in Figure 2.9 representing 0.06% of total regional emissions and about 0% of total world emissions [IEA, 2012].

25
2.3 Energy Policy situation
The energy sector is one of the key areas in Rwanda’s economic development. In order to meet both the Economic Development and Poverty Reduction strategy (EDPRS) and Millennium Development goal (MDGs)[MINECOFIN, 2007; MININFRA, 2011], Rwanda has set up different policies to increase energy supply, access and stability of electricity supply. That was done also to cover serious shortage of energy in 2004. Through the ministry of infrastructure, the laws, strategies, regulatory and frameworks have been established under the main height guidance as follows [RDB, 2012; EWSA, 2012]:
1. Energy efficiency and conservation: Empowering and improve the technologies that promote the use of energy efficiently and reduce environmental impacts.
2. Integrated approach to energy planning: Development of energy plans that meet the national economic plan and the strategic development objectives of the country.
3. Regulatory framework: Establishment the government institution for regulatory RURA to ensure independence in energy price regulation and licensing of energy providers.
4. Energy pricing and subsidy policies: The Government has developed cost reflective energy prices to ensure that the suppliers can operate and make necessary investment in energy freely and securely. Direct subsidies are provided in transparent.
5. The use of indigenous energy resources: To promote the strategies aim for development of available indigenous energy resources in order to overcome high cost of imported oil products.
6. Institutional framework and capacity building
7. Empowering the private sector participation in energy sector
8. Financing energy sector investments: To reduce the need for guarantees and contingent liabilities. To develop feed-in tariffs or others mechanisms to provide incentives and minimise risks in energy production (electricity). To promote the use of renewable energy technologies and finance them.

26
3 Chapter three: OBJECTIVES.
The main aim of this thesis work is threefold. The first objective is to assess the current biogas sector in Rwanda. The second objective is to build biogas energy scenarios for year 2020 mainly based on human and cattle manure for cooking and lighting purposes, based upon the biogas sector assessment. The last objective is to describe socio-economic-environmental impacts of biogas use. The specific objectives of this study are:
• To determine the nature of available waste producing the biogas around the country;
• To determine the number of installed biogas plant and its capacity around the country,
• To identify and measure the available location of high potential of biogas source with big communities (e.g. schools, hotels, factories, health centres and hospitals and prison centres)
• To quantify and measure of the available biogas sources (high potential sources like e.g. schools, hospitals and hotels)
• To assess the current state of biogas sector
• To determine the projection data towards 2020 of the quantified biogas sources around the country.
• Carrying out the contribution of available biogas on the energy sector in Rwanda
• To carry out analysis of biogas in eco-social environmental impacts.

27
4 Chapter four: PROBLEM DESCRIPTION AND METHODOLOGY
This chapter first presents the research questions and methodology of this study. Subsequently the data collection, the research hypotheses, tools and assessment methods of biogas sector in Rwanda will be introduced and followed by the structure of the thesis. Thereafter, the research boundaries and limitations will be presented.
4.1 Problem Description
The primary energy consumption today in Rwanda comes mainly from Biomass and is 86% of the total energy supply [MININFRA, 2008]. Among that, 65% is used as direct cooking wood, 28% as charcoals and 7% as peat and small crops residues. The electricity energy consumption account about 3% while the remaining 11% is from Petroleum products [MININFRA, 2008; Mazimpaka, 2009]. Most of the biomass energy supply is not harnessed and used in a sustainable manner, where the firewood and charcoals come from cutting trees at the highest rate of energy consumption which should cause many problems like deforestation, land degrade, various health and social problems as well as giving rise to greenhouse gases. The government of Rwanda has set up different policies to develop and use the techniques of minimizing the use of firewood and charcoals in order to avoid the rate of cutting trees and enhance the policy of using the sustainable energy supply. Biogas development is one of the solutions, today few households and large communities are using it for cooking across the country. In the period from 2007 to 2010, the National Domestic Biogas Programme (NDBP) has built about 682 family-sized biogas plants [Pellegrini, 2011] and about 2237 domestic digesters had been installed by September 2012. The biogas source is available around the country and its plant can be built in households or small and big communities. It is produced from organic waste, sewage, liquid manure of hens, cattle, pigs, and organic waste from markets, schools, health centres and hospitals, hotels, food industries.... The Biogas is the best method in sustainable energy supply to use by rural area and town region to contribute in energy sector in Rwanda. Till now, there is no study done showing the quantity of biogas source around the country (based on district level) therefore it becomes difficult for the country to plan and implement the stated policies in energy sector. In this study, we will focus on quantifying the biogas sources available at district level around the country, make biogas projection situation in 2020 based to different policies of the country like Economic Development Poverty Reduction Strategy (EDPRS), Millennium Development Goals (MDGs) and Vision 2020 particularly in Development of grouped settlement (known as Umudugudu) and One cow per family policies, assessing the eco-social environmental impact and contribution of the available biogas on the energy sector in Rwanda
4.2 Methodology
4.2.1 Process of data collection
The present study draws on research conducted over a period from July 2012 to April 2013 across the country. In order to gather data, field visits have been conducted in national ministries with elaborated policies related to energy and environment within their mandate such as Ministry of Infrastructure [MININFRA, 2011] as well as government institutions involved in implementation of these policies like EWSA [ MININFRA, 2007] and REMA [2009]. Some other data is retrieved from Ministry of Local Government [MINALOC, 2012; MINECOFIN, 2007; MINECOFIN, 2013; Republic of Rwanda, 2013] and additional data of Local governments (Districts and Provinces) and KIST as well as NISR [NISR, 2011; NISR, 2012], RCS and NGO’s [SNV-Rwanda, 2008; SNV-Rwanda, 2011]. Other much information was obtained through the internet. Qualitative methods were needed in assessments and analyses of the

28
biogas potential based upon household characteristics, geographical conditions, and available biogas potential.
In addition, interviews were used to improve the quantitative analyses in order to receive a thorough knowledge of the conditions to develop biogas in Rwanda. Two districts chosen at random by province and Kigali City were sampled. In each district visited, we should discuss and interview local government authorities, biogas field technician (annex 10), biogas companies (annex 9), NGOs involved in biogas sector, some of institutions and farmers owning bio- digesters (annex 8).
In sum, there are 152 people with whom we discussed or we interviewed classified in different groups of partners listed in Table 4.1.The groups are formed according to their particular role they play in biogas dissemination as it is describes in following:
Public sector
Central government is primarily responsible of policy development, enabling environment, investment incentives, and mobilization of funds and monitoring. The implementation of energy policy is assigned to Government’s agencies, especially EWSA. The dissemination of domestic biogas is mandated to the NDBP created within EWSA. Indeed, the NDBP is entrusted with technical support to biogas sector (selection of appropriate design and development of quality standards for this design, development of quality standards for plant guarantee and after-sales service, quality control on construction and after –sales service etc), certification of construction companies and channelling of subsidy funds to construction companies.
In this group, it is added LGAs who work closely day-to-day with farmers and biogas companies.
Private sector
Private sector development should be viewed as a means to develop a more productive and efficient economy and to increase the economic participation of the population. In the case of production and use of biogas in Rwanda, private sector (biogas companies, cooperatives and biogas appliance and component manufacturers) should be called for the promotion of the technology, construction of biogas plants and after-scale service provision. Through private sector competition, potential users will benefit from reduced costs while the private sector can be ensured of growing business opportunities through an increasing demand for biogas technology. In this group, we also add the BPR that has agreed with the Rwandan government to grant credits for biogas to farmers. NGOs
Local and International NGOs provide technical and financial assistance through advisory services, capacity building, resource mobilization and knowledge brokering. NGO’s as well as private sector companies assist the biogas users in acquiring micro-credits. CONSUMERS
The biogas plant owners or consumers are the most important stakeholders in the quality control of biogas plants during construction as well as operation and maintenance phases. Table 4.1. Interviews and discussions conducted
Partner Group
Sub-group Institutions Number of key informants
Place
Public sector
National level
MININFRA Energy Engineer
1 Kigali
Energy Economist
1 Kigali
MINALOC Rural Settlement Task
1 Kigali

29
Force
IDP 1
MINAGRI 1 Kigali
MINIRENA 1 Kigali
Sub-total 6
LGAs District Infrastructure office
5 Gicumbi, Huye, Nyanza, Nyabihu, Rubavu
Sub-total 5
Agencies EWSA Energy Development Division
1 Kigali
NDBP (Coordination)
3 Kigali
NDBP(Field technicians)
6 Gasabo, Gicumbi, Huye, Kayonza, Nyarugenge, Rwamagana
REMA Renewable Energy and Energy Efficient Promotion
1 Kigali
Poverty and Environment Initiative Project
1 Kigali
RCS 1 Kigali
RAB 1 Kigali
REB 2 Kigali
IRST 1 Huye
KIST CITT 1 Kigali
RDB 1 Kigali
Sub-total 19
Sub-total 30
Private Sector
Biogas Companies
BIOMOC, DOBIPRO, ECOSM,ECBQ,EECO, GEBIDECO, MTC, SACO
6 Rwamagana, Kigali, Kayonza, Gicumbi, Rulindo, Huye
Biogas hardware
GEMECA 1 Kigali
BPR 1 Kigali
Table 4.1 (cont,)

30
Sub-total 8
NGOs Technical and financial support
INADES, Safer-Rwanda, SNV, Vi-Life, World Vision
5 Kigali
Sub-total 5
Consumers Farmers 93 Gasabo, Gicumbi, Huye, Kayonza, Nyabihu, Nyanza, Nyarugenge, Rulindo, Rubavu, Rwamagana
Sub-total 93
Institutions Prisons 2 Huye, Gasabo
Schools Public 8 Gicumbi, Huye, Kayonza, Nyanza, Nyarugenge, Rulindo, Rubavu, Rwamagana
Private 3 Huye, Kayonza
Other Nsenga Farm 1 Gasabo
Sub-total 14
Sub-total 107
Pilot settlement Villages
Rubaya, Nyagatovu 2 Gicumbi,
Kayonza
Sub-total 2
Sub-total 109
TOTAL 152
4.2.2 Assumptions
The successful implementation of biogas technology on large scale depends on several factors. They may be grouped into four main conceptual aspects or dimensions namely geographical, institutional, entrepreneurial and socio-cultural aspects.
Geographical aspect
In this category, the factors that facilitate the dissemination of biogas biotechnology are the temperature, availability of water and availability of raw materials of biogas generation.
The temperature affects directly the velocity of the biological reactions, by influencing the metabolic activity of the microorganisms involved in the process. The efficiency of anaerobic processes is thus
Table 4.1 (cont,)

31
highly dependent of the reactor temperature. The optimal range of temperature for the anaerobic digestion is in the mesophilic range i.e. between 20°C and 40°C. The anaerobic digestion in the thermophilic range i.e. between 40 °C and 60°C shows more instability and thus does not increase the velocity of the process. Methanogenesis is also possible in psycrophilic conditions (0-25°C) but with a lower velocity.
Since biogas production requires constant water supply, the scarcity of water or the low levels of precipitation affect subsequently the efficiency of biogas production.
Institutional aspect
In order to encourage emerging business men and women, a country provides “a conductive environment, a promoting government system and supporting institutions” as at local level as well at national level [Kristiansen, 2001]. Hence, opportunities and incentives for starting and running a productive business and creation of jobs include infrastructure, access to financial services, governance, regulations, taxes and conflict resolution. According to Kristiansen (2001) “a transparent, clean and well-organized bureaucratic and judicial system “coupled with capital, information and skills are requirements in order to set up innovative business ventures.
Entrepreneurial aspect
An entrepreneur can be understood as someone who is creative, innovative and who uses entrepreneurial principles to organize and manage his/her business. Innovation happens when the entrepreneur introduces a new product and a new product method, opens up a new market, finds out a new source of raw material supply and introduces new organization in any enterprise.
Socio-cultural aspect
In any society, some groups of people may take stances against some modern technological developments in order to preserve their ideologies. In some of these cases, the conflict with the beliefs established technologies, such as personal values and lifestyles. As cultures are very robust and change slowly, it is typical for a new technology to be adapted within a culture and used to support existing patterns of behaviour.
Alternatively, the inability to accept or adapt to changing technologies, may result from that the importance is not clearly explained. The first step is therefore to make people aware of what are some of issues such as costs and the benefits of these technologies.
Therefore, the following assumptions regarding the development of the biogas sector in Rwanda are stated:
Assumption 1: Geographical conditions are favourable to generate energy from biomass in Rwanda.
Assumption 2: Rwandan entrepreneurs encounter institutional barriers to start biogas companies.
Assumption 3: High installation costs handicap the biogas dissemination in Rwanda
Assumption 4: Biogas technology is at odds with socio-cultural conditions of Rwanda
4.2.3 Assessment tool: Appropriate Energy Model
The previous section justified a focus on geographical, institutional, entrepreneurial and socio-cultural aspects. Based up the studied conducted by Schoot Uiterkamp (2011) in which he used an Appropriate Energy Model with three dimensions, we propose to use the same model and to adjust it at four dimensions or aspects. We will therefore use an Appropriate Energy Model which consists of four aspects: geographical, institutional, entrepreneurial and socio-cultural aspects. Thus, the four aspects are divided into 9 constructs and into 18 indicators represented in table 4.2.

32
Table 4.2: Appropriate Energy Model
Aspect Construct Indicator
Geographical Climate and environment conditions
Degree of energy fits with local climate and environment conditions
Availability of biogas potential Existence of biomass potential needed to replace firewood for cooking and lighting
Institutional National institutional framework Presence of focused appropriate energy strategy, level of awareness raising, existence of preferential regulations and taxes Investment subsidies Degree of infrastructural facility Transparency bureaucratic and judicial system
Local institutional framework
Existence of multi-sector biogas partnerships Encouraging local energy business development by establishing knowledge centres and market facilitating organizations providing support for energy business start-ups Presence of focused energy policy Availability and accessibility of financial services
Entrepreneurial Degree of technological and organizational capabilities
Energy innovations and product diversification
Competitiveness of sector New energy business development Creation of jobs in energy sector Attracting external energy investment
Entrepreneurial characteristics and behaviour
Need for achievement, risk-taking tendency, self-efficacy, creativity, motivation, expertise, knowledge, expectations of economic benefits
Socio-cultural Societal acceptance entrepreneurship
Social norms in environment regarding value attached to strive for individual progress and prosperity
Degree of adoption introduced technology
Upfront investment costs, compatibility of technology with customer capabilities, ability to take economic risks, availability of alternatives, quality of technology Perceived need, energy fit with values and ideology, willingness to adjust lifestyle

33
4.2.4 Methods applied to assess the biogas Sector development
To be able to assess the degree of biogas dissemination in Rwanda; we adopt the ranking system used by Schoot Uiterkamp (2011) and Schoot Uiterkamp and Bartjan Pennink (2012) to the Appropriate Energy Model. According to the author cited above, each indicator was measured using items on 4-points scale with “ 3” as “excellent”, “2” as “good”, “1” as “fair” and “ 0” as “poor”. The score” 3 "is given when the indicator is completely filled; " 2 "will be considered when the indicator is largely completed;”1" will be assigned when there is attention to the indicator in the context of case study while"0" will be held in the absence, or few attentions exist for the indicator. Taken together, the rankings of indicators by construct are classified as "excellent", "good", "fair" or "poor"[ibid]
4.2.5 Thesis work structure
This work is structured as follows: the general introduction and background are found in chapter one. Herein, biogas basics and favourable conditions to generate energy from biomass are introduced. In this same chapter, a brief description of the history of biogas in the world and in Africa in general and in Rwanda in particular, is given. Then, the chapter two reviews the current energy situation in Rwanda. In chapter three, the objectives of the research work are stated. The chapter four explains the methodology of the study and addresses the assumptions regarding biogas dissemination in Rwanda. In chapter five, the results of biogas assessment in Rwanda, their analysis and discussions will be presented. In chapter six biogas scenarios toward 2020 will be developed followed by socio-economic-environmental impacts of biogas technology in Rwanda in chapter seven. Finally, chapter eight will provide the conclusion, which includes recommendations and areas for further study.
4.3 Boundaries and Limitations
Several limitations apply to this study. Due to time constraints and limited financial resources, this study was conducted in 10 districts taking only two districts per province. In addition, because of the complexity and scope of the topic, some issues were not developed deeply not only due to lack of time and financial resources, but also because of the lack of reliable data available. Thus all socio-economic and environmental benefits biogas technology of have not been made the subject of investigation and some conclusions have been deduced or translated from existing results and / or from the literature. Furthermore, this study does not take into account non- biogas adopters. In this research, we will focus on the biogas produced from human and animal manure because it is easier controlled during a regular feeding into domestic digester.

34
5 Chapter five: ASSESSMENT OF BIOGAS SECTOR IN RWANDA
This chapter deals with the assessment of the biogas sector in Rwanda followed by analysis of the results and discussions based upon findings of the present assessment. Obviously, the presentation of the results is structured on the four aspects and nine constructs of the Appropriate Energy Model applied.
5.1 Results of Assessment
5.1.1 Geographical aspect
This section deals with the climate and environmental conditions and potential for biogas in Rwanda.
5.1.1.1. Climate and environmental conditions
Rwanda experiences a tropical temperate climate as a result of its high elevation. The western side of Rwanda is mountainous with elevation over of 2000m. Elevations decrease toward the central plateau (1500-2000 m) of Rwanda and further decrease in the eastern plateau towards the border with Tanzania (less than 1500m). The average temperature for Rwanda is around 20°C and varies with the topography described above. The warmest annual average temperatures ranging between 20 and 240C are found in the lowlands (east and south-west). Moderate temperatures are observed in areas of intermediate altitude where average temperatures range between 19 and 21 ° C and low temperatures are found in the mountainous west and north averaging between 15 and 170C in annually average [SSEE, 2011].
This shows that unheated biogas plants can perform satisfactory in almost every corner of the country.
The country annually average rainfall is about 1210mm but it varies across the country with the highest totals in western (more than 1200 mm) and then reducing towards the east (less than 900 mm).

35
Since biogas production requires constant water supply, the low levels of precipitation for months of June, July and August according to figure 5.1, is likely to be a constraint to generate energy from biomass. On the contrary, for the rest of the year, the country has favourable climatic conditions to produce energy from biomass due to stable precipitation and high temperatures. In addition, on average 74% of Rwandan households have access to drinking water source including protected springs, public standpipes, boreholes, protected wells and water piped into dwelling/yard [NISR, 2011]. The lowest proportion of households (67.0%) who have access to water is found in the eastern province.
5.1.1.2. Available biogas potential
We estimate the technical potential for biogas production in Rwanda based upon the number of human population and number of livestock population in the country, or specifically on the quantity of dung that could be available for biogas, and the micro-climatic pockets in different parts of the country. Rwanda is inhabited by a population of 10.5 million (estimates 2012) with overall 1.195million cattle, 0.718 millions sheep, 2.519 millions goats, 0.587million pigs and 2.217 millions poultry in 2008. Based on rates of growth of 11.71, 11.23, 17.90, 20.43 and 84.01per cent for cattle, sheep, goats, pigs and poultry respectively obtained from data for the period 2008-2009 available in RAB, we estimate that the Rwandan livestock population in 2012 consists of 1.75millions cattle, 1.04million sheep, 4.32 millions goats, 1.07 million pigs and 9.67 millions poultry. All those can produce about 9.97 million tonnes of manure per annum equivalent to 321.49 million cubic meters of biogas per annum (i.e.880.1 thousand cubic meters of biogas per day). The potential for biogas generation from human excreta and animal manure in 2012 is presented in Table 5.1. Table 5.1: The potential waste for biogas generation Component(source of manure)
Number (million)
Dung available /head/
day (kg)
Total dung available (tonnes/
day)
Biogas potential per kg of dung (m3/day)
Gas volume
(m3/day)
Daily biogas calorific energy (GJ)
Daily biogas Energy (MWh)
people 10.5 0.20* 2,100.00 0.040* 84,000.00 1,680 504.00
Cattle 1.754 10 17,540.00 0.035 613,900.00 12,278 3,683.40
Sheep 1.041 1** 1,041.00 0.016** 16,656.00 342.1 99.94
Goats 4.324 1** 4,324.00 0.016** 69,184.00 1,383.7 415.15
Pigs 1.066 2** 2,123.00 0.040** 85,280.00 1,705.6 511.68
Poultry 9.790 0.02 181.32 0.065** 11,785.8 235.72 70.71
Total 28.475 27,318.32 880,805.8 17,616 5,284.83
Source of data: * [SNV Nepal, 2001]; ** [Arthur.R, et al, 2010];
The daily dung production from human beings and livestock population is about 28,289 tons, which has theoretically a potential to produce 880,806 m3 of biogas or 5,285 MWh of biogas energy if the average
heating value of biogas is about 20,000 3mkJ or 6 3mkWh [Sasse, 1988].
The total annual biomass consumption countrywide is estimated at about 4.755 million tonnes including 4.718 million tonnes in households and 0.0 37 million tonnes in institutions [EWSA, 2012] equivalent to 2.37 million m3 of biogas energy per day taking an average of 5.5 kg of firewood for 1 m3 of biogas [GTZ, Volume 1, undated; Prakash C. Ghimire, 2008; Lam and Heegde, 2011]. From this, it is found that the biogas potential represents 37.32% of firewood consumption in the country. This therefore shows that even if the full potential of biogas was exploited, biogas can replace only a small portion of wood fuel.
Currently, the domestic digesters built, work with only cattle manure and in very rare cases, they are connected to toilets. The prerequisite for admission to the installation of a digester is to have at least two

36
cows. The number of households that meet this requirement is estimated at 110,000 households [E. Binamungu et al., 2011] which represents about 10% of 47.3% of Rwandan households owned at least one cow in 2011 [NISR, 2011]. Considering the restrictions made above, the actual available cattle dung could produce 61,390 m3 of biogas per day which represents only 2.36% of daily firewood consumption in the country.
5.1.1.3. Performance geographical aspect
Biogas technology responds to climatic and environmental conditions over most of the country and over a long period of the year except the period from June to August characterized by low level of precipitations. Hence, the indicator of Degree of energy fit with local climate and environment conditions is assigned “good”.
The section 5.1.1.2.showed that customers face limited feeding of bio digester, which is partially caused by limited potential to feed bio digesters due a limited number of cows per household. In addition, it is shown also that the available biomass potential is much lower than the amount of wood fuel required in cooking; subsequently the amount of biogas for lighting is also limited. Nevertheless, the potential exists to increase the number of cattle by “One cow per poor family program” in which the government of Rwanda is responsible for giving a cow free to every poor family. So, we rank the indicator of Existence of biomass potential needed to replace firewood for cooking and lighting as fair. The performance of the geographical aspect is represented in table 5.4.
5.1.2 . Institutional framework
5.1.2.1. National institutional framework For aspects of energy policy and strategies, the policy making and the overall coordination is the responsibility of MININFRA. The implementation of policies and strategies is exclusively reserved to EWSA. The other energy institution with major responsibilities including energy price is the regulator, RURA. The promotion of dissemination of biogas digesters to rural farmers and to schools, hospitals and other institutions where human waste can be transformed into biogas and slurry is then carried out by EWSA. The dissemination of domestic biogas digesters is implemented by the National Domestic Biogas Programme (NDBP) under EWSA which was created in 2007 by the Government of Rwanda and is partially funded by the Dutch Government. The NDBP receives technical and institutional support from the Dutch and German agencies SNV and GTZ respectively. Energy policy and strategy and regulations The current national energy policy strategy dates from May 2011, which “aims at providing affordable energy access for mineral processing, agro industries, increased tourism and electricity access for over 50% of the population by 2017”[MININFRA,2011]. In this context, the policy targets to increase very considerably the electricity production from indigenous resources particularly hydropower, geothermal and methane gas, and “promotes the use of indigenous renewable energy resources to progressively replace biomass in the primary energy mix” [MININFRA, 2011]. In this policy, statements, which are directly or indirectly related to biogas, are the following:
• “Dissemination of biogas digesters will be promoted to rural farmers which have the required animal dung or agricultural residue and to schools, hospitals and other institutions where human waste can be transformed into biogas and slurry”.
• “Proceed with further research and development of biogas, bio-fuels and technologies to utilize methane, peat, geothermal, solar and wind energy”.
• “Establish norms, codes of practice, guidelines and standards for new and renewable energy technologies”.
• “Ensure reliable supplies of energy at the household level by improving the supply of affordable sources of energy (with a primary focus on energy for cooking), this being targeted particularly at low income households”.

37
• “Promote alternative forms of energy for household use, informing women in particular on energy source and technology choices in order to reduce the time burden and the health risks for women associated with current biomass energy usage –alternatives are to include LPG and kerosene specifically”.
• “The diversification of energy sources for cooking and lighting in the home has a high priority and will be promoted”.
• “Rwanda is committed to mitigating the adverse impacts of traditional energy supply chains and of developing and disseminating environmentally friendly energy technologies”.
• “Technical R&D into innovative, environmentally-sound energy technologies, particularly in respect of biomass and other renewable energy sources”.
Besides those items listed above, there are no specific regulations for biogas energy either for Renewable energies. In addition, preferential taxes on input materials of bio digesters do not exist. Investment Subsidy The government of Rwanda provides subsidies for farmers deciding to install a biogas plant. Subsidy is an essential economic incentive in convincing farmers to invest in biogas technology. A subsidy of 300,000 Rwandan francs (about USD 476 at the nominal exchange of RwF 630 for 1 UD dollar) is given for each digester built regardless of its size. In the first phase, covering the period from 2007 to 2011, this subsidy was composed by 75% given by the Netherlands government through GTZ and the balance of 25% was given by the government of Rwanda. Since 2012 the all subsidy is fully supported by the government of Rwanda. Depending on size and location, a Modified GGC Nepal model biogas plant costs varies between USD 1032 and USD 1746(Table 5.2). The high up-front investment cost of a biogas plant is a barrier for farmers to willingly switch to the more environmentally friendly technologies. Table5.2. Cost of Modified GGC Nepal model biogas plant biogas in Rwanda Size Cost
Farmer contribution Government Subsidy Total cost RwF USD RwF USD RwF USD
4m3 350,000 556 300,000 476 650,000 1,032
6m3 500,000 794 300,000 476 800,000 1,270
8m3 650,000 1,032 300,000 476 950,000 1,508
10m3 800,000 1,270 300,000 476 1,100,000 1,746
Source: Data from EWSA The costs above are very high considering that the GDP per capita is less than USD 600 and a significant number of the Rwandan population is below the poverty line. So, biogas construction without subsidy is therefore not a financially attractive initiative for the rural farmers, and they will opt to use the conventional fuels to meet their cooking energy needs. In addition, even if the subsidy is guaranteed, a large number of farmers need other sources of financing their investment contribution. Thus, under of advocacy of the SNV, a product “biogas loan” called “BIOGAS-INDUHURAMURYANGO” was created in Banque Populaire du Rwanda (BPR) in order to facilitate farmers to access to a loan enabling them to install a digester. The bank committed to give the loan to a reduced interest rate of 13% while it ranges between 18% and 20% for customers enjoying of credit other than for biogas. Degree of infrastructural facility Rwanda has a total of 14,008 km of roads, of which 2,662 km are paved. The road of 81 km running along Lake Kivu between Rusizi, Nyamasheke, Karongi and Rubavu districts is under construction. Paved roads which are now in good condition link the capital with most of other major cities and towns in Rwanda.

38
In rural areas road conditions are not well developed and some areas are not accessible during rainy seasons, which results in higher costs for transportation and as such higher costs for doing business. The 2011/12 Global Competitiveness Index ranks Rwanda 101 out of 142 countries surveyed in turn contribute to the high costs of doing business, hinder private sector development and hamper national and regional connectivity[ADB, 2011] Transparency bureaucratic system Business registration is done at Kigali in Office of Registrar General (ORG) incorporated into Rwanda Development Board (RDB). RDB operates a One-Stop Centre permitting foreign investors and local investors to obtain the core facilitation and services required to realize their investment. One-stop Centre consists of the following services: Provision of application form and information, processing of investment certificate, access to utilities (water and electricity), processing of exemption on imported goods, and collection of non fiscal revenues, notary services, immigration services and environmental compliance. Business registration of a new company at RDB takes not more than three days and a flat of Rwf 15, 000 (i.e. about USD 24) is now paid. In order to further facilitate investors living in remote districts of the capital or outside the country, free online business registration is available. Due to the transparency in the procedures for business registration, Rwanda is located in the 8th position in starting a business by Doing Business Ranking 2012. Rwanda is also ranked 45th out of 183 in average ease doing business, 8th in getting credit and 29th in protecting investors[World business-rank, 2012].
5.1.2.2 Performance National Institutional Framework
As the political will and awareness of authorities are obvious and are particularly materialized in the creation of NDBP and institutional biogas office within the EWSA, we rate the first criterion of national institutional framework good. Further, subsidies were introduced because government concerns regarding the domestic energy needs increases. Therefore the indicator of investment subsidies is assigned as good. Conditions of inadequate road infrastructure in rural areas imposes transportation costs higher material input bio digester, which subsequently increases prices of bio digesters to customers in rural areas, as effort of improvement exist we rank degree infrastructural facility fair. The registration of a company is transparent and not expensive. Hence, the criterion of Transparency bureaucratic system is ranked excellent, which results in overall ranking for national institutional framework good as represented in table 5.4.
5.1.2.3. Local institutional framework
Existence of multi-sector Biogas partnerships
At the district level, some initiatives of non-governmental and private sector exist in the biogas sector, but they often do not operate correctly since measures taken to bring together individual initiatives to facilitate the implementation of multi-sectoral partnerships in the field of energy have not yet yielded tangible results. In all districts of the country, the NDBP with the help of SNV and GTZ has trained about 300 masons grouped in 104 biogas companies (annex 7). The recruitment was done on the basis of skills and experience in masonry. Unfortunately, only 53 companies are actually operating in the country for at least one company by district. Those biogas companies are called to be integrated into cooperatives or associations, as it is likely that their productivity increases due to better access to specific information. Other benefits of cooperatives and associations for small companies are a wide range of labor force, easy access to capital resources, reduction of operating costs through economies of scale. Again cooperatives/associations of biogas companies are not yet operational. Other stakeholders providing additional assistance to farmers include:
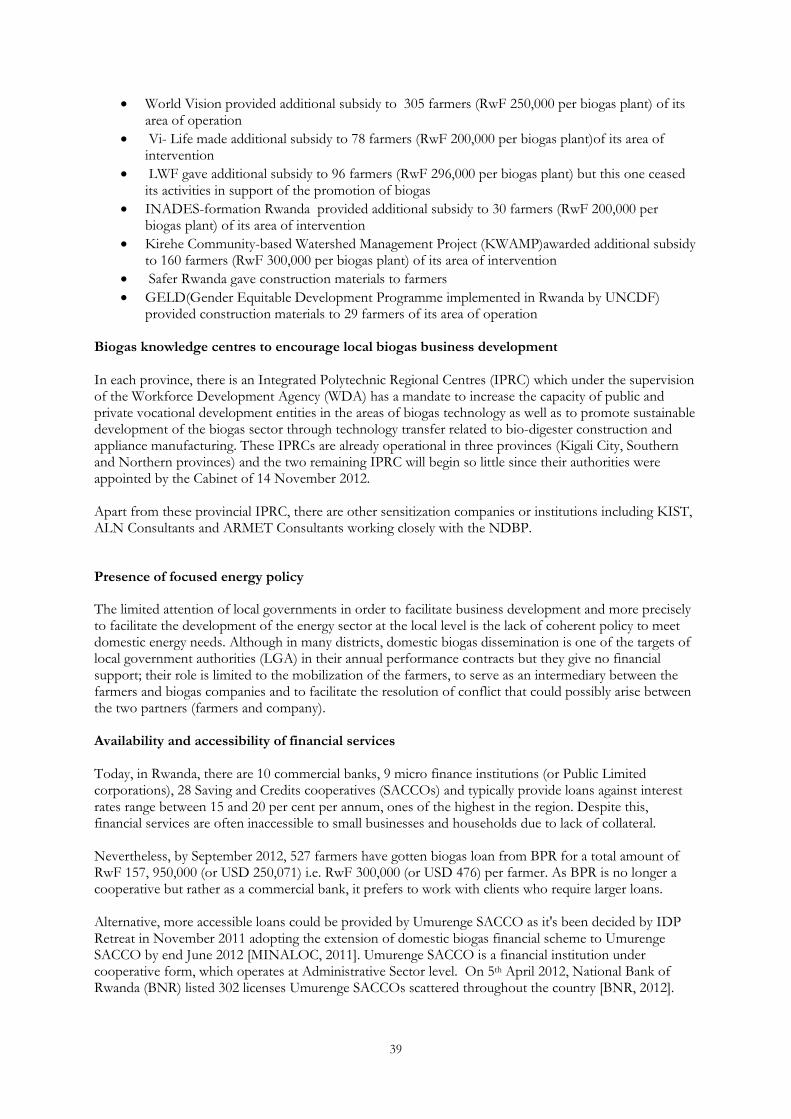
39
• World Vision provided additional subsidy to 305 farmers (RwF 250,000 per biogas plant) of its area of operation
• Vi- Life made additional subsidy to 78 farmers (RwF 200,000 per biogas plant)of its area of intervention
• LWF gave additional subsidy to 96 farmers (RwF 296,000 per biogas plant) but this one ceased its activities in support of the promotion of biogas
• INADES-formation Rwanda provided additional subsidy to 30 farmers (RwF 200,000 per biogas plant) of its area of intervention
• Kirehe Community-based Watershed Management Project (KWAMP)awarded additional subsidy to 160 farmers (RwF 300,000 per biogas plant) of its area of intervention
• Safer Rwanda gave construction materials to farmers
• GELD(Gender Equitable Development Programme implemented in Rwanda by UNCDF) provided construction materials to 29 farmers of its area of operation
Biogas knowledge centres to encourage local biogas business development In each province, there is an Integrated Polytechnic Regional Centres (IPRC) which under the supervision of the Workforce Development Agency (WDA) has a mandate to increase the capacity of public and private vocational development entities in the areas of biogas technology as well as to promote sustainable development of the biogas sector through technology transfer related to bio-digester construction and appliance manufacturing. These IPRCs are already operational in three provinces (Kigali City, Southern and Northern provinces) and the two remaining IPRC will begin so little since their authorities were appointed by the Cabinet of 14 November 2012. Apart from these provincial IPRC, there are other sensitization companies or institutions including KIST, ALN Consultants and ARMET Consultants working closely with the NDBP.
Presence of focused energy policy
The limited attention of local governments in order to facilitate business development and more precisely to facilitate the development of the energy sector at the local level is the lack of coherent policy to meet domestic energy needs. Although in many districts, domestic biogas dissemination is one of the targets of local government authorities (LGA) in their annual performance contracts but they give no financial support; their role is limited to the mobilization of the farmers, to serve as an intermediary between the farmers and biogas companies and to facilitate the resolution of conflict that could possibly arise between the two partners (farmers and company). Availability and accessibility of financial services Today, in Rwanda, there are 10 commercial banks, 9 micro finance institutions (or Public Limited corporations), 28 Saving and Credits cooperatives (SACCOs) and typically provide loans against interest rates range between 15 and 20 per cent per annum, ones of the highest in the region. Despite this, financial services are often inaccessible to small businesses and households due to lack of collateral. Nevertheless, by September 2012, 527 farmers have gotten biogas loan from BPR for a total amount of RwF 157, 950,000 (or USD 250,071) i.e. RwF 300,000 (or USD 476) per farmer. As BPR is no longer a cooperative but rather as a commercial bank, it prefers to work with clients who require larger loans. Alternative, more accessible loans could be provided by Umurenge SACCO as it's been decided by IDP Retreat in November 2011 adopting the extension of domestic biogas financial scheme to Umurenge SACCO by end June 2012 [MINALOC, 2011]. Umurenge SACCO is a financial institution under cooperative form, which operates at Administrative Sector level. On 5th April 2012, National Bank of Rwanda (BNR) listed 302 licenses Umurenge SACCOs scattered throughout the country [BNR, 2012].

40
However, the interest rate in Umurenge SACCOSs stands at between 1.5 to 2.5 percent per month which is more favourable than those charged by commercial banks.
5.1.2.4. Performance Local institutional framework
Based on the existence of local government initiatives to implement multi-sectoral partnerships although it is not yet operational, having regard also to the existence of many individual initiatives of NGOs and companies biogas to develop the dissemination of biogas we rank the first criterion fair. As there are many initiatives to develop biogas knowledge centres but noting that improvements are required, the second criterion is listed as good. On the basis of the absence of decentralized energy policy but because the initiatives of local authorities to incorporate biogas development into the annual performance contracts the third criterion is classified fair. Since financial services are widespread even in remote rural areas and specific loans biogas are launched and are likely to be extended, we attribute the fourth criterion good, which leads in overall ranking of good on construct local institutional framework. The results of the institutional aspect are shown Table 5.4.
5.1.3 Entrepreneurial aspect
5.1.3.1. Degree of technological and organizational capacities
Innovations, product diversification and Quality control
Until recently in 2012, one biogas product was disseminated in Rwanda. The biogas plant model disseminated by NDBP was the modified GGC Nepal model. It is a modification of the Chinese and Indian fixed dome models. The size of biogas constructed in Rwanda ranges from 4 to 10 cubic metrers for domestic biogas and the size of biodigesters is 30, 50 or 100 m3 for biogas in institutions. This model is considered a reliable, well functioning, simple, low maintenance cost and durable technology. Its construction is easy and everywhere applicable. It requires some cement, local available bricks or stones, sand and some manpower. In order to reduce the upfront cost of a biodigester, the NDBP is introducing three new biogas model so-called Rwanda designs 1, 2 and 3 or RW1, RW2 and RW3 respectively:
• RW1 is a biodigester made of stone foundation and round wall, dome, inlet and outlet made of bricks
• RW2 is a biodigester constructed with stone foundation, round wall made of stone and dome, inlet and outlet made of bricks.
• RW3 is an improved GGC with concrete dome but with spherical outlet made of bricks. The investment costs of the three new biodigesters are found in table 5.3. Table5.3. Cost of Rwanda design biodigesters Size Cost
RW1 RW2 RW3 RwF USD RwF USD RwF USD
4m3 545,525 866 555,695 882 617,800 981
6m3 624,155 991 658,250 1045 743,050 1179
8m3 712,640 1131 745,350 1183 883,600 1403
10m3 818,168 1299 827,200 1313 933,100 1481
Source: Data from EWSA Nominal exchange of RwF 630 for 1 US dollar Regarding the quality control, the EWSA office appoints a full-time field technician to serve two districts each in the biogas programme. The field technician is responsible for the protection of farmers against incompetent and/or careless masons. His main assignments include monitoring the construction,

41
operation and maintenance of digesters. Therefore, he must ensure that companies and masons comply with the requirements established by the NDBP including:
• Scrupulous respect of the standard design and sizes of digesters
• Use of trained, certified and registered masons for the construction of the digesters
• Construction of digesters on the basis of detailed quality standards;
• Provision of NDBP approved quality appliances (pipes, valve, stove, water trap, lamp);
• Provision of proper user training and provision of a user instruction manual;
• Provision of proper user training and provision of a user instruction manual;
• Provision of a one year guarantee on appliances and three years of guarantee on the civil structure of the digester, including an annual maintenance visit during the guarantee period;
• Timely visit of a technician to the digester in case of a complaint from the user; Stakeholders recognize that a high proportion of biogas masons do not have the technical skills to provide quality constructions. These statements were observed during field visits where we met some digesters are not working properly mainly due to gas leakages. We also met some digesters especially in institutions that have completely failed and never produce gas. 5.1.3.2. Competitiveness of sector New biogas business development Although the first digester was constructed in Rwanda there are almost thirty years, the dissemination in large scale did not begin until 2007. So far, this is only the Government of Rwanda and its donors who have significantly invested in biogas sector. Currently, some private occurs in biogas sector. Around 300 masons who should serve in 104 biogas companies were trained in the construction of digesters and the companies were related to the market. However, there are 53 active biogas companies with a total of 303 masons and 102 supervisors and 3 appliances manufacturing companies. They are involved in construction and after sales service of biogas. The major constraints that hamper private sector to be engaged effectively in the fields of marketing and promotion of biogas technology include high biogas investment cost , insufficient economy of scale ;lack of management, entrepreneurship and business skills and difficult access to financing. Creation of jobs in biogas The construction of biodigesters provides jobs for masons, mason’s mates and their supervisors. The salary of masons and mason’s helpers depends on the location. For instance, in urban area a mason earns between RwF 5,000 - 6,000 (USD 8-9.5) daily while in rural area, his daily wage ranges between RwF 3,000 and RwF 4,000.The salary of mason’s mates is half that of the masons in both urban and rural area. This salary is high compared to that of a teacher of the primary school which is USD 2.5 per day average. Since biogas does not offer sufficient employment opportunities throughout the year, most of the biogas masons see the construction of biogas plants mainly as a parallel activity; they usually find alternative job in the construction of houses... Attracting foreign biogas investment The biogas sector attract outside investors who are so far limited to NGOs that support technically and financially the activities of the Rwandan government. There is no external private investment involved in biogas market or technology. 5.1.3.3. Entrepreneurial characteristics and behaviour Need for achievement and risk-taking tendency It should be noted that there is a clear distinction between the entrepreneurial potential of less educated and educated technicians. The latter are more organized, innovative and successful entrepreneurs. In addition, masons with greater age and experience also expressed more interest in formalizing business activities.

42
A passive attitude of risk avoidance was often met under masons and contractors. In interviews with masons and contractors on starting a business showed that responsibility to manage employees, the fear of not having jobs regularly, obtaining a loan and other fixed costs such as income tax was considered as a huge obstacle. In addition, many respondents (masons, stakeholders, authorities ...) explained the absence of risk tendency by the lack of funding to start a business and the lack of skills to set up a business especially for poorly educated masons. 5.1.3.4. Performance Entrepreneurial aspect There are very few biogas products identified and exploited. In addition, the technical and business performance of biogas masons is sometimes low, and therefore the construct the degree of technological and organizational capacities is assigned fair since the NDBP puts much effort in the quality control process. Based upon the number of active biogas companies, we rate the first criterion of the construct competitiveness of sector fair. The criterion creation of jobs is assigned as good, since the installation of bio digesters is highly profitable and far exceeds Rwandan’s GDP per capita of about USD 600 per annum. Due to the lack of attraction of private enterprises that will provide biogas technology in Rwanda, the criterion attracting external investment is rated poor, resulting in overall ranking for competitiveness of sector fair. The construct entrepreneurial characteristics and behaviour of biogas masons is assigned fair as motivation, need for achievement and levels of education and skills are weak. The results in overall ranking for the entrepreneurial aspect are shown Table 5.4.
5.1.4 Socio-cultural aspect
5.1.4.1. Societal acceptance entrepreneurship Acceptance by social environment to strive for individual progress and prosperity Given the entrepreneurial potential to support economic growth, it is the policy objective of the government of Rwanda to develop a culture of entrepreneurship. This is done by integrating entrepreneurship into education systems, legislating to encourage risk-taking, and national campaigns. For this, entrepreneurship has a high societal status in Rwanda since it is also convenient and financial benefits are high. However, in some cases, entrepreneurs have little confidence because they are accused by customers that they just want to make money. For instance, in some districts of Western province, our field visits found many unfinished biodigesters that have been abandoned by the contractors. Some customers interviewed explained that when a contractor find a new more profitable contract he immediately abandons sites already commenced regardless the completion of them. 5.1.4.2. Degree of Adoption Introduced Technology Customer profile, degree of upfront investment costs and quality The high installation cost of a bio-digester is identified as a major barrier structural diffusion of technology in Rwanda. This causes that the majority of biogas customers are relatively rich. Some of them have a fixed monthly income and are employed as a teacher, pastor, nurse, drivers, businessman... The other biogas customers are agro-breeders who have a lot of fields and livestock. The 44.9% of the population below the poverty line and families with a single cow cannot get a biodigester. Perceived need and fit with values and ideology The previous investigations made by SNV and GTZ in 2007 showed that 89% of farmers interviewed were willing “ to use energy generated from animal and toilet waste for lighting and cooking purposes, and 90% would use the bio-slurry produced from animal and toilet waste as fertilizer on their fields”[MININFRA, 2007]. The taboos around handling human faeces seems not as principally rooted into culture and religion as can be the case in some Asian countries such as Nepal and India. From

43
various field visits, it was found no cultural or religious resistance against use of human excreta in biodigesters. On the contrary, it was noted that the perceived need of biogas in general is very high. For instance, an employee of NDBP stated that some farmers connect themselves their toilet to the biodigester while it was designed to run with cattle manure. 5.1.4.3. Performance Socio-cultural aspect We assign the construct societal acceptance entrepreneurship to fight for individual progress and prosperity as good because the economy based on the capitalist system is well established in Rwanda since for a long time. This acceptance is evident in all regions and all parts of Rwandan society so we meet women masons and biogas companies are run by women. The first to adopt biogas technology in Rwanda are wealthy citizens, who are usually able to take economic risks. The initial investment cost biodigesters hampers the further dissemination of technology to low-income groups, the majority of the population. Since the potential exists to increase access to domestic biodigesters through government’s subsidies and easy access to credit, the first criterion of the construct degree of adoption introduced technology is assigned fair. The perceived need of biogas among the population is very high and we have identified no cultural norms that can hinder dissemination of biogas technology. Therefore, we rate the criterion perceived need and fit with values and ideology excellent, which results in overall ranking of good on the construct degree of adoption introduced technology. . The results in overall ranking for the socio-cultural aspect are represented in Table 5.4.
5.2 Analysis of Results
This section provides the analysis of results from the assessment of biogas sector in Rwanda. Table 5.4 shows the status of the biogas sector in Rwanda at geographical-, institutional-, entrepreneurial, and socio-cultural aspects accompanied by 9 constructs consisting of 18 indicators. Table 5.4.The biogas sector assessed
Aspect Construct Indicator Performance
Geographical Climate and environment conditions
Degree of energy fits with local climate and environment conditions
2
Overall score of the construct Good Availability of biogas potential
Existence of biomass potential needed to replace firewood for cooking and lighting
1
Overall score of the construct Fair
Overall score of the aspect Fair
Institutional National institutional framework
Presence of focused appropriate energy strategy, level of awareness raising, existence of preferential regulations and taxes
2
Investment subsidy 2 Degree of infrastructural facility
1
Transparency bureaucratic and judicial system
3
Overall score of the construct Good

44
Local institutional framework
Existence of multi-sector biogas partnerships
1
Encouraging local energy business development by establishing knowledge centres and market facilitating organizations providing support for energy business start-ups
2
Presence of focused energy policy
1
Availability and accessibility of financial services
2
Overall score of the construct Fair
Overall score of the aspect Good Entrepreneurial Degree of technological
and organizational capabilities
Energy innovations and product diversification
1
Overall score of the construct Fair Competitiveness of sector New energy business
development 1
Creation of jobs in energy sector
2
Attracting external energy investment
0
Overall score of the construct Fair Entrepreneurial characteristics and behaviour
Need for achievement, risk-taking tendency, self-efficacy, creativity, motivation, expertise, knowledge, expectations of economic benefits
1
Overall score of the construct Fair Overall score of the aspect Fair Socio-cultural Societal acceptance
entrepreneurship Social norms in environment regarding value attached to strive for individual progress and prosperity
2
Overall score of the construct Good Degree of adoption introduced technology
Upfront investment costs , compatibility of technology with customer capabilities, ability to take economic risks, availability of alternatives, quality of technology
1
Perceived need, energy fit with values and ideology, willingness to adjust lifestyle
3
Overall score of the construct Good
Overall score of the aspect Good
Table 5.4 (cont,)

45
The assessment of the biogas sector in Rwanda at 4 aspects and 9 constructs shows that the Rwanda scores “Fair" on two out of four aspects which are geographical and entrepreneurial aspects while institutional and socio-cultural aspects are scored as “Good”. Five constructs are rated “Fair” also and the four remaining constructs are rated “Good”.
5.2.1 Geographical aspect
The average temperature of around 20°C and rainfall of about 1210 mm in mean throughout the country are favourable for the operation of the digester in Rwanda. However, the drought period between June and August; improved systems for collecting water rarely installed and a proportion of 36% of the Rwandan population not having access to water do not facilitate the extension of biogas. In addition, there is limited potential to feed a digester as only 4.7% of Rwandan households are eligible to install a biogas plant (i.e. owning at least two cows).
5.2.2 Institutional aspect
The national institutional framework is of limited support to encourage biogas dissemination. Although a national energy policy is available, the targets of entrepreneurship development in biogas energy are not stated clearly with supporting figures. Because of the lack of energy policy at the local government level and since the implementation of the energy policy is reserved for EWSA, the administrative authorities at district level are of limited energy action to be taken. The structure of EWSA is built up district level. However, the district authorities interviewed said that there is no formal framework for collaboration between EWSA and local government on implementation of energy strategy in general and of biogas dissemination in particular. In addition, one biogas field technician in two districts is not enough to effectively serve such a large area. In addition to the support provided at national and local levels, non-governmental organizations deliver business development services to potential and existing biogas enterprises. For example, SNV and GTZ contributed technically and financially to the training of 303 masons and KIST have trained hundreds of local technicians and energy entrepreneurs in entrepreneurial skills and the development of renewable energy. Moreover, in some districts there are NGOs who provide material or financial support to farmers to complement the subsidy given by the Government. Although company registration can be obtained only in the capital, however, the bureaucratic system facilitates for obtaining it and thus for biogas business start-ups.
5.2.3 Entrepreneurial aspect
Biogas masons and companies rarely identify business opportunities through innovation and product diversification. They expect all to build products placed on the market by the NDBP. In addition, biogas masons and companies show little tendency to risk-taking. To give an example, many product diversification options exist such as biogas installation of cow sheds, toilet connection to bio digesters and installation of water recovery system, but they are seldom initiated by masons. Although there is a net return to establish biogas enterprise at present, the low level of education and risk avoidance hamper businesses creation and risk-taking behaviour by biogas masons. However, the age and experience positively influence the intention to start a business, but not so much the actual implementation of it. However, it should be noted that the demand and therefore the profitability to install biodigester is affected by seasonality and therefore unstable. Potential customers have large incomes in the time of harvest. However, at the beginning of school terms, potential customers also invest in the education of children by providing school fees and materials.

46
5.2.4 Socio-cultural aspect
Some indicators suggest an acceptance of entrepreneurship in the Rwandan society in general. However, some factors may have an influence on the passive risk avoidance attitude biogas masons. Regarding customer profiles, biogas in Rwanda, is energy only accessible to healthy residents and farmers who have at least 2 cows, reflecting their relative affluence. The fact that many cattle are kept in farms away from households influences negatively the demand for biogas as these cattle are unlikely to be used to invest in biogas energy. In addition, since farmers often live in sparsely populated rural areas and given the poor state of roads in rural areas, the cost of transporting raw materials is high as well as quality control per digester becomes difficult. However, the perceived need is relatively high for the rural population due to the scarcity of firewood and very restrictive conditions introduced by the Government for tree harvesting. In urban areas, needs are highest since biogas replaces charcoal.
5.3 Discussion
The previous section analyzed the results obtained from the assessment of the biogas sector in Rwanda and identified underlying relationships. This section intends to discuss the results by comparing the assumptions made in the theoretical framework with the study findings. The results indicate to accept the hypothesis 3, while we reject hypotheses 1, 2 and 4. The explanation is given below Assumption 1: Our study suggests that the conditions of temperature across the country are conducive to the biodigester operating in Rwanda. However, the drought period between June and August, scarcity of water in some regions and little potential for biodigester feeding leads us to reject the assumption 1: Geographical conditions are favourable to generate energy from biomass in Rwanda. Our results and analysis stated that low amount of available waste prevents the production of biogas sufficient both in households and institutions that also hampers the spread of biogas to a large number of people. To illustrate this, a simple estimate shows that only 4.7% of Rwandan households are eligible to install a biogas plant (i.e. owning at least two cows).
In addition, our field visits have shown that the amount of biogas produced is often lower compared to the demand in both households and in institutions visited. This causes that frequently households and institutions still use wood/ charcoal or briquettes after having a connection to biogas. In such a case, the construction of an improved cooking stove is a good complement to cooking facilities available to the household or institutions.
Assumption 2: Our results show that the network of government bureaucracy in the registration of a business company is simple and transparent so that it stimulates biogas business development. Therefore, assumption 2, “Rwandan entrepreneurs encounter institutional barriers to start biogas companies” is rejected. Indeed, the Rwandan government, through EWSA offers a wide portfolio of assistance to develop the biogas sector. In this context, the government began a broad program to gradually build the biodigesters in public institutions .Also it provides a subsidy of 300,000 Rwandan francs for each domestic biodigester built and farmers can get a bank loan to complement the grant received. At the request of the Government, the Banque Populaire du Rwanda has committed to provide “biogas credit” at reduced interest rate. In addition, the government in collaboration with NGOs has contributed to the training of 300 masons who are then encouraged to set up biogas companies. In more, in order to encourage local biogas development, the Government established an Integrated Polytechnic Regional Centre (IPRC) in each province to promote sustainable development of the biogas sector through technology transfer related to bio-digester construction and appliance manufacturing.
Assumption 3: This study concludes that the demand for biogas in general is still in its infancy due to high costs of initial investment and a large entrepreneurial base is missing. Only a small number of affluent households can afford biogas plants currently. Therefore, the assumption 3: “High installation costs handicap the biogas dissemination in Rwanda” is accepted.

47
Assumption 4: During our field visits, information collected from local authorities, biogas field technicians, biogas companies, NGOs and farmers showed that the Rwandan population does not have a negative attitude towards biogas because firstly, no cooking traditions are inadequate with the gas supplied by the biodigester and secondly, it accepts handling of manure and human excretion. Thus, we reject assumption 4:”Biogas technology is at odds with socio-cultural conditions of Rwanda”

48
6 Chapter six: BIOGAS SCENARIOS TOWARDS 2020 IN RWANDA
The proposed biogas development scenarios follow as much as possible the Energy Sector Strategic Plan included Rwanda’s Vision 2020 and in the Economic Development and Poverty Reduction Strategy (EDPRS) and the Millennium Development Goals. Their aim is to contribute to accelerated socio-economic development to improve the well-being and quality of life of the population by supplying the social and economic sectors to meet the basic needs.
6.1 Introduction: Review of the objectives of MDGs, Rwanda Vision 2020 and EDPRS
This introduction summarizes the main objectives of the MDGs, Rwanda Vision 2020 and EDPRS. (a) THE MILLENNIUM DEVELOPMENT GOALS (MDGs) The eight Millennium Development Goals (MDGs) form a blueprint agreed by all countries of the world and all the world's largest development institutions and aim to reduce extreme poverty rate level, halting the spread of HIV/AIDS and provide primary education for all by the target date of 2015.
The goals stated by 193 United Nations member states and at least 23 international organisations at the Millenium Summit of the United Nations in 2000[Wikipedia, 2013] are:
1. Eradicating extreme poverty and hunger 2. Achieving universal primary education 3. Promoting gender equality and empowering women, 4. Reducing child mortality rates, 5. Improving maternal health, 6. Combating HIV/AIDS, malaria, and other diseases, 7. Ensuring environmental sustainability, and 8. Developing a global partnership for development.
(b) RWANDA VISION 2020
Rwanda Vision 2020 defines a set of goals that describes how the Rwandan envisions its future in all sectors of life: democracy, economy, education, health, environmental protection... The Vision is to fundamentally transform Rwanda into a middle income country by 2020. This will require to achieve the annual per capita income of 900 USD (220 USD in 2000), a poverty rate of 30% (60.4% n 2000) and an average life expectancy of 55 years (49 years in 2000) [Republic of Rwanda, 2000].
The expectations of Vision 2020 will be carried out around six "pillars" including
1. Good governance and a capable state 2. Human resource development and a knowledge based economy 3. A private sector-led economy 4. Infrastructure development 5. Productive and Market Oriented Agriculture 6. Regional and International Economic integration The six pillars on which the aspirations of Vision 2020 are based will be closely related to three cross-cutting issues, namely:
1. Gender equality 2. Protection of environment and sustainable natural resource management 3. Science and technology, including ICT

49
(c) RWANDA’S ECONOMIC DEVELOPMENT AND POVERTY REDUCTION STRATEGY (EDPRS) The EDPRS supplies a medium-term framework for the realization of the aspirations of long-term development of the country as outlined in Rwanda's Vision 2020, the seven year of the Government of Rwanda programme and the Millennium development Goals. The EDPRS 1 defines the country's objectives, priorities and broad policy for the next five years (2008-2012). Targets for the EDPRS 1 in 2012 The targets of the EDPRS 1 are as follows [MINICOFIN, 2007]: 1. Accelerate growth and poverty reduction 2. Widen and deepen the financial sector 3. Develop skills for a knowledge-based society 4. Promote science, technology and innovation for economic growth 5. Raise agricultural productivity and ensure food security 6. Raise the contribution of manufacturing and services to economic development for sustainable growth 7. Manage the environment and ensure optimal utilization of natural resources 8. Build economic infrastructure 9. Improve health status and slow down population growth 10. Improve water resources management and access to safe drinking water and sanitation 11. Integrate and extend social protection 12. Promote decentralization, citizen participation and empowerment, transparency and accountability 13. Promote vibrant and professional public and private media to enhance citizen’s voice and dissemination of public information 14. Support youth to participate in economic and social development Targets for the EDPRS 2 in 2017 The second Economic Development Strategy and Poverty Reduction Strategy (EDPRS 2) is a five-year plan to accelerate the progress already made and to shape the country's development in the future. EDPRS 2 formulates priorities for the coming period (2013/14-2017/18) based on the socio-economic development in the long term development (Vision 2020), on which was in force from the EDPRS 1 (2008-2012) and the Government Programme (2010-2017). In line with the 2020 target vision to transform Rwanda into a middle income country by 2020, the overall goal of EDPRS 2 is to increase the quality of life of all Rwandans through rapid and sustainable economic growth (11.5% per year) and accelerated poverty reduction (below 30%)[MINECOFIN, 2013]. To achieve these objectives, EDPRS 2 will be developed around four strategic thematic areas which will drive the rapid and sustainable economic growth, and the reduction of poverty faster: 1. Economic transformation (for 11.5% real GDP growth) 2. Rural Development (to reduce poverty from 45% to fewer than 30%) 3. Productivity and youth employment (to create 1.8 million off-farm jobs) 4. Responsible Governance The four strategic thematic areas of EDPRDS 2 will be closely related to three cross-cutting issues, including: 1. Capacity building
2. Regional integration
3. Gender and Family
4. Environment, climate change and disaster management
5. Disability and social inclusion
6. HIV/AIDS and non-communicable diseases

50
6.2 Proposed biogas development scenarios by 2020
In the energy sector, Rwanda plans by 2020, at least 35% of the population will be connected to electricity (against 2% in 2000) and wood consumption will decline from 94% (in 2000) to 50 % of national energy consumption. What will be the role of biogas in the accomplishment of this target? We will try to answer this question by proposing scenarios that are in the following sections:
6.2.1 Projections of biogas potential by 2020
As it was calculated in table 5.1 of paragraph 5.1.1.2, the theoretical biogas potential from human and livestock manure in Rwanda was estimated to 322 million cubic meters of biogas per annum by 2012 at local conditions of temperature and pressure which represented 37.32% of wood fuel consumption in the country.
By 2020, the human and livestock dung for biogas potential will increase by about 65% to become about 532 m3 of biogas. The evolution of biogas potential estimated at local temperature and pressure of 20 0C and 1.020 bars respectively in average is found in Table 6.1, annex 1 and Figure 6.1 to Figure 6.4.
Table 6.1: Projection of biogas potential between 2012- 2020
Province
Year 2012 Year 2015 Year 2020
Total dung available (tonnes/ day )
Gas volume (m3/day)
Daily biogas Energy (MWh)
Total dung available (tonnes/ day )
Gas volume (m3/day)
Daily biogas Energy (MWh)
Total dung available (tonnes/ day )
Gas volume (m3/day)
Daily biogas Energy (MWh)
Southern 7,903.1 255,672.1 1,542.9 9,902.2 319,286.7 1,915.7 13,221.7 424,817.9 2,548.9
Western 4,905.5 155,548.7 933.3 6,112.2 192,982.7 1,157.9 8,113.6 254,983.0 1,529.9
Northern 4,274.9 136,187.9 817.1 5,328.1 169,284.1 1,015.7 7,079.7 224,300.2 1,345.8
Eastern 9,144.2 297,177.7 1,783.1 11,415.5 369,551.4 2,217.3 15,178.2 489,259.3 2,935.6
Kigali city 1,115.8 37,503.8 225.0 1,383.1 46,410.2 278.5 1,819.1 60,877.5 365.3
Total Rwanda 27,343.5 882,090.2 5,301.4 34,141.1 1,097,515.1 6,585.1 45,412.2 1,454,238.0 8,725.4

51

52

53
6.2.2 Scenario 1: The use of all potential of biogas for the production of biogas by 2020
With dung potential for biogas available by 2020, 1.135 million biogas plants (average plant size of 6m3) can be built meaning that 45% of households countrywide will be equipped with a bio-digester. The major challenges of this scenario that can hamper the harnessing the full potential of biogas production are:
• Limited number of eligible households to biogas (i.e. having at least 2 cows per household),
• The biogas installation costs appeared at high compared to the population revenue (GDP per capita is less than USD 600 today even it is expected to be about USD 1240 in 2020),
• Reviewing biogas financial scheme so that many people can benefit of biogas
• Decentralization of biogas construction at local government level
• Restructuring the country’s settlement pattern so that many people can live in grouped settlements
6.2.3 Scenario 2: Biogas plants in the grouped settlements “Imidugudu” by 2020
This scenario is taken to analyze if possible to install the bio digesters in all community settlements across the country. REMA supported by the Poverty and Environment Initiative (PEI), funded by UNDP and UNEP has designed and built a pilot village demonstration to Rubaya (Gicumbi District, Northern Province). Rubaya Pilot Village consists of 43 households of 196 people who are all connected to biogas energy from toilet and cow dung where each household owns 2 cows. In this village, it was built two digesters 100 m3 each at the rate of a digester by 10 households and five digesters 50m3 each at the rate of a digester by 10 households. Other types of model villages such as Nyagatovu (Kayonza district) and Kitazigurwa (Rwamagana district) in Eastern province were constructed by the government of Rwanda. Unlike the first case, in these villages, only 65% households are using biogas. These are examples of demonstration projects to seek ways to accelerate the construction of bio digesters to the entire population in order to achieve the goal of having biogas across the country in the future. . Situation of community settlement in Rwanda The government Rwanda has a policy of Resettlement of population in modern common village known as “UMUDUGUDU”. Currently 18 622 sites have been identified across the country; including the 12 399 planned sites (modern site to install) and 6 223 unplanned sites (currently habited but not in modern one). It is in the line of achieving the MDGs goals, EDPRS and Vision 2020. Biogas scenario According to Vision 2020,” it is envisaged that 70% of the population will be living in rural grouped settlements (Imidugudu) and that the remaining 30% will reside in urban areas” in 2020. If all villages have biogas systems as the village of Rubaya, at least 1.76 million of households (70% of Rwandan population) will be using biogas in rural areas by 2020. The major challenges of implementation of this scenario:
• Restructuring and strengthening Rwanda’s Girinka “one cow” program which aims to offer a cow for each poor family. Each household in rural area will own at least 2 cows by 2020 if the new beneficiaries of this program is increased to about 644, 500 poor families while the program has targeted 350,000 poor families by 2017.
• Enhancement of zero grazing livestock and promoting the policy of common farming
• Restructuring the government’s subsidy so that even the poorest household could have the biogas
• Improvement in the collection of dung for all livestock

54
6.2.4 Scenario 3: Biogas plants for eligible households for biogas by 2020
We have previously seen that at the end of 2011, the total number of households that are consistent with the requirement of installing a digester (at least 2 cows / households) was 110,000 which represented approximately 4.8 % of Rwandan households. Assume that with Girinka “one cow” program combined with mobilization of the population, Rwandan households eligible to install a biogas plant will rise to 10% of all households by 2020. In this context 251,000 households can use biogas by 2020. The major challenges associated to this scenario are:
• Only the wealthiest families have access to biogas
• The objective of Vision 2020 to reduce the consumption of wood for cooking 94% (in 2000) to 50% of national energy consumption will be very difficult to achieve.
6.2.5 Achieving the goal of Vision 2020 to reduce wood consumption to 50% of national energy consumption in 2020
Analysis of the three biogas scenarios developed above, shows that meeting the Vision 2020’s goal of reduction wood consumption to 50% of national energy consumption is a big challenge for the country. Scenario 2 of the installation of biogas plants in the grouped settlements would reduce significantly the consumption of firewood (about 70%) but its implementation requires financial resources that the people and the country cannot have easily in 7 years remaining since, it also requires that people must have at least two cows per household and capability of paying the installation cost; in addition the Government must be able to provide the necessary subsidies. We conclude by saying that any scenario of biogas promotion should be accompanied by the promotion of alternative source of energy (e.g. hydropower), improvement of sourcing of wood and charcoal and promotion of improved cooking stoves.

55
7 Chapter seven: SOCIO- ECONOMIC AND ENVIRONMENTAL IMPACTS OF BIOGAS TECHNOLOGY IN RWANDA
Biogas technology supports protecting the environment and provides a wide range of improvements in overall living conditions of the population.
7.1 Environmental benefits of biogas technology
Firewood saving Estimating an average per household consumption of about 1,890 kg of firewood annually [EWSA, 2012] for energy (cooking, heating and boiling water) in rural areas, the annually per household demand of energy equals about 8500 kWh which could be covered by about 1400 m3 of biogas. A biogas plant therefore directly saves forest, assuming that not only deadwood is collected for fuel. Our study shows that most of domestic biogas visited save more than 80% of firewood and institutional biogas visited save between 30% and 85% of wood. Annually, each domestic biogas plant can save about 1.5 tonnes of firewood. Preservation of forest and protection of soil As we have seen in the previous paragraph, our study shows that each biogas plant saves about 1.5 tons of firewood per year. Therefore, a domestic biogas plant protects almost 0.306 ha of forest per year. All 2236 biogas plants can protect annually about 684.48 ha (Annex 2). Note that total forest available for timber, fuel wood and other uses in Rwanda is estimated at 301,500 hectares [EWSA, 2012].
Another illustration can be given of prisons where for example Gasabo prison has reduced its firewood usage from 35m3 to 2m3 after introducing biogas for cooking. This translate to 33 m3 of firewood saved per year or 4.7 ha of preserved forest. Referring to the findings of a study in India as what a biogas plant of 2.8 m3 for example [GTZ, Volume 3, undated], can preserve a forested area of 0.12 ha; we can estimate that the 71 biogas plants in Rwandan prisons totaling overall volume of 6801 m3 (annex 3) can save 291.49 ha of forest per year. In the examples given above, it must be discovered contribution of biogas to a reduction in land use and costs for reforestation or protection of the remaining forests. Without biogas the problem of deforestation and soil erosion will gradually become more critical as wood consumption increases relative to higher density population. Demand for food also increases accordingly, which means that the constant expansion of agricultural land increased at the expense of forest areas or population cannot find enough food where it is not possible to increase the agricultural land. The large-scale production and use of biogas should make a substantial contribution to soil protection and improvement. First, biogas could gradually replace wood as an energy source. Second, biogas systems produce more and better fertilizer. As a result, more fodder becomes available for pets. This, in turn, may reduce the risk of soil erosion due to overgrazing or to deforestation. Protection of biodiversity Deforestation causes loss of flora and fauna and its habitat. The level of biodiversity in Rwanda has decreased significantly in the last three decades as deforestation and agricultural activities have increased. This, in combination with the fact that the majority of the population tends to plant only species of trees that give good firewood e.g. eucalyptus, caused a loss of variability in all its ecosystems. The use of biogas protects biodiversity because it prevents deforestation. Protection of water quality Soil erosion often results in soil are deposited in water bodies. Most of the soil lost by erosion is found in the river system and wetlands. This is evident in the siltation of streams and associated wetlands different. Research indicates that the system Nyabarongo gate 51 kg / second soil Nyabarongo-Kigali, 44 kg/s Nyabarongo-Kanzenze and 26 kg/s at Akagera-Rusumo [SNV-Rwanda, 2011]. This siltation of water bodies can lead to stimulation of aquatic plants and algae growth and degradation of habitat for aquatic flora and fauna. Again as biogas technology prevents soil erosion, it also preserves water quality.

56
Greenhouse gas (GHG) reduction Biogas fuel reduces emissions of greenhouse gases by displacing the consumption of firewood, agricultural residues and oil. Research conducted in Nepal suggests biogas plants of size 4, 6 and 8 m³ reduces to about 3, 4 and 5 tons of carbon dioxide per plant per year [Dhoubhadel, 2011]. Translating this to the case of Rwanda, we find that the total annual GHG Emission Reduction by the replacing fuel wood by 2236 domestic biogas installation operational in Rwanda is 9,179 tonnes CO2 equivalent (Annex 4) while Rwandan prisons are mitigating GHG of approximately 4,191.225 tonnes CO2 equivalent per year (Annex 5).
7.2 Economical benefits of biogas technology
Saving of expenditures on fuel sources
We found above that the installation of biogas plants reduces the consumption of firewood annually about 1.5 tonnes per household, which therefore provides each household economy lying between 22,500 and 45,000 Rwandan francs per year at local rate varying between 15 and 30 Rwf following regions and seasons. Introducing the biogas in institutions has allowed the institutions concerned to reduce the cost of firewood between 30 and 85 percent. For instance, the director of biogas production in Rwanda’s prisons told Reuters on November 21, 2011 that before using biogas, prisons were using about USD 1.7 million to buy firewood each year and that amount has been reduced by 85% by installing biogas plants.
Creation of new jobs, income raising
The constructions of biogas plants create new jobs, those temporarily (during construction) and permanent (operation and maintenance) of plants and thereby increasing the income of biogas companies and masons.
Benefits of bio-slurry
In addition to biogas, the biogas systems produce liquid waste and compost that can be used to fertilize the land. Various studies have shown that, compared with farmyard manure, bio-slurry has more nutrients because of manure nutrients are lost by volatilization. When the slurry biogas plant is used as fertilizer in the fields, it increases agricultural production, which is more productive than undigested manure. Moreover, the substitution of commercial fertilizer with manure produced by the biogas technology reduces the impact on the balance of payments assuming a dependence on imported chemical fertilizers.
Time saving and Workload reduction
Farmers possessing biodigesters interviewed said that the installation of biogas supplied to each household to save on average between 1 and 2 hours per day. In Gasabo prison for example, the use of biogas has led to the reduction of prisoners working in the kitchen from 150 to 30 per day.
Possible carbon market
Trading of emission is based on the market approach used to control pollution by providing economic incentives for achieving reductions in the emissions of pollutants. For emissions trading greenhouse which are regulated, permit or emission allowances is considered equivalent to one tonne of carbon dioxide (CO2). Trade has been created to provide the physical spot market permits and the futures market and

57
options to help discover a market price and maintain liquidity. Each international transfer is validated by the United Nations Framework Convention on Climate Change (UNFCCC).
Biogas plants in Rwanda, particularly biogas plants in prisons can benefit from the Clean Development Mechanism (CDM) through carbon markets provided they meet the requirements to be registered to CDM project. Unfortunately no Rwandan project is eligible for CDM. However, given the results found in Section 7.1, our study showed each household biogas system would reduce approximately 4.1 tonnes of CO2 per year and each prison would reduce in average 59.0 tonnes of CO2 per year. According to the study, each household biogas installation is likely to bring to Rwanda an annual income of about USD 21 due to CO2 emission reduction when a prison could bring USD 295 per year to an assumed rate USD 5 per tonne of CO2 if claimed under the CDM.
7.3 Social benefits of biogas technology
Culture, education and gender mainstreaming
Biogas users argue that in addition to saving time, reducing physical stress in terms of collecting firewood, cooking and cleaning utensils was remarkable. Generally, rural women are greatly involved in managing household energy systems such as searching, collecting and transporting wood. Once a biogas plant is installed, they will have lots of extra time for themselves and their children. This will help improve the quality of life of women and children. They will now have more time for cultural, educational activities and interesting outside of the home.
7.4 Health and sanitation benefits of biogas technology
The treatment of human and animal excrement in biogas systems contribute directly to better hygienic situation for individual plant users, their families and the entire village community. Through the centralized collection of manure and connecting latrines, open storage is avoided. Apart from this, pathogens are largely eliminated during the process of digestion. In addition, unpleasant odors are avoided because the slurry decomposed stored in these pits is odorless. Overall, improved sanitation and hygiene is absolutely assured and therefore a biogas plant can contribute to greater life expectancy. Visited institutions during our field research, especially schools and prisons, are the fact that the problem of regular emptying of toilets filled is resolved after having connected toilets to the biogas is another gain that is not the least. Since biogas slurry does not attract flies or other vermin, vectors of diseases to humans and animals, are reduced. In addition, eye infections and respiratory problems due to soot and smoke from burning dried cow dung and wood, are attenuated.
7.5 Relation between biogas development and Vision 2020, EDPRS and Millennium Development Goals
Four of the eight Millennium Development goals, three of the six of pillars of Rwanda Vision 2020, two out of the three cross-cutting areas of Vision 2020, six in fourteen targets of EDPRS 1, three of the four strategic thematic areas of EDPRS 2 and three out of the six cross-cutting issues of EDPRS2 have a very direct relationship with the availability domestic biogas services. The explanation of this relationship is given in the following paragraphs: 1. MDG 1 Eradicate extreme poverty and hunger- Target 1: To halve extreme poverty Rwanda Vision 2020 Pillar 4: Infrastructure Development-Sub-sector (v): Energy “Rwanda projects that by 2020, at least 35 % of the population will be connected to electricity (up from 2% in 2000) and the consumption of wood will decrease from the current 94% to 50% of national energy consumption” Rwanda Vision 2020 Pillar 5: Productive High Value and Market Oriented Agriculture

58
“Agricultural policy orientation will have to be overhauled, promoting intensification so as to increase productivity and achieve growth rates of 4.5 % to 5% per year. This can only happen through the production of high value crops and modern livestock management”. EDPRD1-Target 1: Accelerate growth and poverty reduction EDPRS1 –Target 5: Raise agricultural productivity and ensure food security EDPRS2- Thematic area 1: Economic transformation (for 11.5% real GDP growth) EDPRS2-Thematic area 2: Rural Development (to reduce poverty from 45% in 2012 to less than 30% in 2017) EDPRS2-Thematic area 3: Productivity and youth employment (to create 1.8million off-farm jobs) Biogas plants reduce the economic and financial costs made on cooking fuel and to a lesser extent also the lighting. The bio-sludge product is a powerful organic fertilizer and can reduce the use of chemical fertilizers. Thus, the diffusion process of biogas and reduced demand resulting on common ecosystem services are affecting the living conditions very poor non-biogas households through: - Construction and installation of biogas creates jobs for rural landlessness. - Biogas saved on the use of traditional cooking fuels increases the availability of these fuels for the very poorest members of the community. 2. MDG 3 Promote gender equality and empower women-Target 4: Eliminate gender disparities in education EDPRS1 –Target 3 Development Skills for a knowledge based society:” The Government of Rwanda commits to increasing literacy to 85% among men and 80% among women by 2012”. Rwanda Vision 2020-Cross-cutting area 1: Gender equality: “In order to achieve gender equality and equity, Rwanda will continuously update and adapt its laws on gender. It will support education for all, eradicate all forms of discrimination, fight against poverty and practice a positive discrimination policy in favour of women”. EDPRS2-Cross-cutting issue 3: Gender and Family Women and girls spend mostly time and energy on the supply of traditional energy services. Housekeeping and lack of proper lighting creates barriers for women and girls access to education and information as well as their mobility and participation in public activities:
• Domestic Biogas reduces the workload of collecting firewood, tending the fire, soot cookware cleaning
• Biogas lighting is very popular for lighting, which makes reading / education / economic activities during the evening.
3. MDG 6 Combat HIV/AIDS, malaria and other diseases-Target 8 Halt / reverse the incidence of malaria and other major diseases Rwanda Vision 2020 Pillar 2: Human Resource Development and a Knowledge-based economy “The objectives to be attained in the field of health within the next 20 years include: a reduction in the infant mortality rate from 107 to 50 per 1000 and the maternal mortality rate from 1070 to 200 per 100.000. Life expectancy will have increased from 49 to 55 years, malaria and other potential epidemic diseases will have been controlled and the AIDS prevalence will have been reduced from 13% to 8%.” EDPRS1-Target 9: Improve health status and slow down population growth “Between 2008 and 2012, at the level of health outcomes, it is planned to reduce the total fertility rate from 6.1 to 4.5 children per woman, and to reduce HIV incidence among 15-24 year old men and women from 1% to 0.5%. The incidence of chronic malnutrition (stunting) among the under-fives is planned to fall from 45% to 35%, while the prevalence of anaemia among women aged 15- 49 is scheduled to decrease from 33% to 20%”. EDPRS2-Cross-cutting issue 6: HIV/AIDS and non-communicable diseases Half the world's population makes cooking with traditional energy fuels (mainly biomass) whose collection is becoming heavier. Indoor air pollution from the combustion of these fuels kills over 1.6 million people each year, the smoke inside claims the lives of nearly one million children under five per year [WHO, 2006]. Disease resulting from a lack of basic sanitation and consequently water contamination, causes a greater number of deaths, especially in small children (under five) mortality caused by diarrhea is approximately 1.5 million people per year. More than 1million children under the age of 15 died of malaria in 1998 and ninety percent of malaria cases are attributed to environmental conditions [U.S.EPA, 2013].

59
Acute respiratory infections such as pneumonia, killing about 2 million children each year worldwide and more than 60 percent of them are related to environmental conditions: Biogas stoves replace traditional stoves and energy, virtually eliminating pollution by smoke and therefore the risks to health related (e.g., respiratory diseases, eye diseases, burns, accidents):
• Biogas stoves replace traditional stoves and energy sources, virtually eliminating the indoor smoke pollution and, therefore, the related risks to health (e.g., respiratory diseases, eye diseases, burning accidents).
• The biogas considerably reduces the workload involved in the collection of traditional cooking fuels such as wood.
• Biogas greatly improves the health status of the farmyard and its immediate surroundings, lowering the exposure of members of the household hazardous infections usually associated with polluted water and sanitation.
• The correct application of bio-sludge will improve agricultural production (e.g., vegetable gardening), thus contributing to food security of the community. .
4. MDG 7 Ensure environmental sustainability EDPRS1-Target 7: Manage the environment and ensure optimal utilization of natural resources. “It is planned to increase the proportion of protected areas for biodiversity preservation from 8% to 10% in 2012. Forest and agro-forest coverage is scheduled to increase from 20% to 23% of total surface land area, and annual wood consumption is due to be reduced by 30% from the 2002 figure. Soil erosion and soil fertility decline will be reduced by 24% over the EDPRS period”. EDPRS2-Cross-cutting issue 4: Environment, climate and disaster management Domestic biogas can contribute to a sustainable use of natural resources and the reduction of GHG emissions, which protects the local and global environment. Application of bio-sludge increases soil structure and fertility, and reduces the need for chemical fertilizers. MGD 7-Target 9: Integrate the principles of sustainable development into country policies and program and reverse the loss of environmental resources. Rwanda Vision 2020-Cross-cutting area 2: Protection of environment and sustainable natural resource management: “In order to ensure sustainable development, Rwanda will implement adequate land and water management techniques, coupled with a sound biodiversity policy”. Particularly large biogas dissemination programs have a significant component of governance. As such, they positively influence national policies for sustainable development (e.g., agriculture, deforestation), and to promote participatory governance involving women and other disadvantaged groups. MGD 7-Target 10: Halve the proportion of people without sustainable access to safe drinking water and basic sanitation. EDPRS 1-Target 10: Improve water resources management and access to safe drinking water and sanitation. Biogas reduces the pollution of fresh water due to improved manure management. Connecting the toilet to the biogas plant greatly improves the farm health status.

60
8 Chapter eight: CONCLUSIONS AND RECOMMENDATIONS
8.1 Conclusion
The objective of this study was threefold. Firstly, the conditions of en energy production from biomass in Rwanda were assessed using the "Appropriate Energy Model" (AEM). Second, the scenarios of development of biogas in Rwanda in 2020 were constructed. Thirdly, the socio-economic-environmental impacts of biogas technology were analyzed. Depending on the overall study, we can conclude from the research in the following paragraphs:
The temperature conditions in the country are generally conducive to the digester operating in Rwanda. However, the drought period between June and August, water scarcity in some regions and low potential for feeding biodigester hinder the spread of biogas to a large number of people.
The system of government bureaucracy in registering a company is simple and transparent, so that it stimulates biogas business development. Thus, the Rwandan entrepreneurs do not face institutional barriers to start-up biogas companies.
Installation costs of biodigesters are high and hence, hamper the dissemination of biogas in Rwanda because only a small number of wealthy households can afford biogas plants currently.
Biogas technology does not contradict the socio-cultural conditions of Rwandans.
Reducing the consumption of firewood after the operation biogas provides annual protection of about 0.306 ha of forest area per household.
Domestic biogas plant and replacement of firewood would reduce the annual GHG emission of approximately 4.1 tonnes of CO2 per year and one prison would reduce in average 59.0 tonnes of CO2 per year. Hence, each household biogas installation would likely bring to Rwanda an annual income of about USD 21 due to CO2 emission reduction when a prison could bring USD 295 per year to an assumed rate USD 5 per tonne of CO2 if claimed under the CDM. Based on projections of potential biogas in Rwanda in 2020, following three scenarios for 2020 biogas development were identified:
• With all biogas potential available , 1.135 million biogas plants can be built in 2020
• If 70% of the population will live in grouped settlements in 2020, 70% of Rwandan households will be using biogas if additional means were provided to them.
• Only 10% of the population (251,000households) will be eligible for biogas installation
8.2 Recommendations
Based on the study and findings and recommendations were proposed:
With multiple direct and indirect advantages from the advantages of biogas in terms of the social sector, health and the environment, biogas should be prioritized.
Public support is still very important in the promotion of biogas and the public subsidy could even extend to private institutions.
The lack of financial resources to invest in biogas plants among poor farmers in rural areas is one of the biggest challenges. Possible solutions to this should be explored.
In further research, to study of mechanism for storing excess biogas produced especially for schools when students are on vacation and hence the excess is released into the atmosphere without flaring. It is still a great danger to the environment; methane is more potent than CO2, 21 times more.
The Clean Development Mechanism (CDM) can help finance further growth of biogas in developing countries. More research should be done in the biogas and CDM related aspects for data and support information.

61
Also, further research is welcomed to explore conceptual and practical considerations for establishing energy centers in rural areas in particular regarding the clustering strategy and delivery of appropriate energy mix to households in rural areas.

62
9 AKNOWLEDGEMENTS
This is our great pleasure to express our gratitude to all those who made possible our Master Studies in general and this thesis in particular.
Our Master’ program was technically and financially supported by the Kungliga Techniska Hӧgskolan (KTH) within Sustainable Energy Engineering Master Program Worldwide (SEE Worldwide). The contribution of KTH management and academic staff is gratefully acknowledged. We also extend our gratitude to Kigali Institute of Science and Technology (KIST) for hosting this program and for various facilities it has given to us.
Our sincere gratitude goes to our supervisors Assistant Professor Peter Hagstrӧm, Department of Energy Technology at KTH (Sweden) and Dr. Vénant Kayibanda, Lecturer in Department of Mechanical Engineering at KIST (Rwanda) for their constant help, guidance and inspiration through the structuring of the thesis and the final report.
Our special appreciation and gratitude go to all those who participated freely to the process of data collection, especially the staff of National Domestic Biogas Program (NDBP), without their contribution this study would not have this shape. Finally, we are grateful to our families, relatives and friends for their patience and moral support through the years.

63
10 BIBLIOGRAPHY
ABPP (African Biogas Partnership Programme). 2012 http://africabiogas.org/uganda/Accessed on June 13, 2012
AFF (African Forest Forum). 2011. Forest plantations and woodlots in Rwanda, Volume 1, July, 2011
Amigun,B., Parawira,W., Musango,J.K., Oboyade, A.O. & Badmos, A.S. (undated).Anaerobic Biogas Generation for Rural Area Energy Provision in Africa http://cdn.intechopen.com/pdfs/31319/InTech-Anaerobic_biogas_generation_for_rural_area_energy_provision_in_africa.pdf.
Arthur, R. Et al.2010. Biogas as a potential renewable energy source: A case Ghanaian study. Renewable Energy 36 (2011) 1510-1516
Asgari, M.J., Safavi, K.& Mortazaeinezahad, F. 2011, Landfill Biogas production process, International Conference on Food Engineering and Biotechnology IPCBEE vol.9 (2011) © (2011) IACSIT Press, Singapoore
Binamungu, E, Ndahimana, A, Owekita, D. 2011. I love biogas! It’s a profitable business! http://www.snvworld.org/sites/www.snvworld.org/files/publications/i_love_biogas_it_is_a_profitable_business.pdf, accessed on February 5, 2013
Biogas for Better Life.2007. Promoting Biogas Systems in Kenya: A Faisibility Study.
BNR.2012. List of Licensed UMURENGE SACCOs http://www.bnr.rw/docs/publicnotices/LicensedUSACCO 5April 202012.pdf
Bond, T. &Templeton, M.R. 2011. History and future of domestic biogas plants in developing world, Energy for Sustainable Development 15 (2011) 347-354: http://www.hedon.info/tiki-download_forum_attachment.php?attId=30
Buswell, A.M. 1930, Production of Fuel Gas by Anaerobic Fermentation, Journal, American Chemistry Society, Vol.22, page 1169, November, 1930
CIA, The World Fact Book.2011-Africa-Rwanda
Bramly, J. et al.2011. Agricultural Biogas in the United States. A Market Assessment , Team 6, Final Report ,2 011. http://ase.tufts.edu/uep/Degrees/field_project_reports/2011/Team_6_Final_Report.pdf
Dekelver G., Ruzigana S., Lam J. 2005.Biogas programme, feasibility report; Kigali, August 2005
Dhoubhadel, S. 2011. Potential of Biogas to replace fuel wood demand in LisankhuVDC of Sindhupalchowkdistr ict
Energypedia. 2012, Parameters and Process Optimisation for Biogas: https://energypedia.info/wiki/Parameters_and_Process_Optimisation_for_Biogas, Accessed on May 11, 2012
Energypedia.2012. Types of Biogas Digesters and Plants: https://energypedia.info/index.php/Types_of_Biogas_Digesters_and_Plants, accessed on June 12, 2012
EWSA.2012. Biomass use survey in urban and rural areas in Rwanda, May 2012
FAO.1992. Biogas processes for sustainable development. Rome. 1992. ISBN 92-5-103126-6
Fulford, D. 2012.Biogas Technology: Successful Projects in Asia and Africa http://ebookbrowse.com/rrps-ad250309-biogas-technology-pdf-d48420720, accesses on June 21, 2012
GTZ.1989. Biogas Plants in Animal Husbandry: http://collections.infocollections.org/ukedu/en/d/Jg32bie/6.3.html, Accessed on May 21, 2012
GTZ (undated). Biogas digest, volume 1, Biogas Basics: http://www.gtz.de/de/dokumente/en-biogas-volume1.pdf
GTZ (undated). Biogas digest, volume 2, Biogas-Application and Product Development: thttp://www.gtz.de/de/dokumente/en-biogas-volume2.pdf

64
GTZ (undated). Biogas digest, volume 3, Biogas-Costs and Benefits and Biogas-Programme Implementation: http://www.gtz.de/de/dokumente/en-biogas-volume3.pdf
GTZ (undated). Biogas digest, volume 4, Biogas Country Reports: http://www.gtz.de/de/dokumente/en-biogas-volume4.pdf
GTZ $ MARGE.2009. Biomass Energy Strategy (BEST), Rwanda, Volume 2: Background $Analysis
GTZ $ MARGE.2009. Biomass Energy Strategy (BEST), Rwanda, Volume 4: Proposed Strategy
Index mundi.2012. Rwanda Demographics Profile 2012
IEA (International Energy Agency) http://www.eia.gov/cfapps/ipdbproject/iedindex3.cfm?tid=93&pid=44&aid=33&cid=r6,RW,&syid=1980&eyid=2010&unit=MM, accessed 30 July 2012
Jönsson, O., Polman, E., Jensen, J.K., Eklund, R., Schyl, H. & Ivarson, S. http://www.dgc.dk/publikationer/konference/jkj_sustain_gas.pdf accessed on June 18, 2012
KIST.2005. Biogas plants providing sanitation and cooking fuel in Rwanda, KIST (Rwanda), 2005
Kristiansen.2001. Promoting African pioneers in business: What makes a context conductive to small-scale entrepreneurship? The Journal of Entrepreneurship, Vol.10, N0 1, pp.43-69 http:/joe.sagepub.com/content/10/1/43.full.pdf
Lam, J., Heegde, F.T, 2011. Domestic Biogas Compact Course-Technology and Mass Dissemination Experience from Asia, Handout for Students, University of Oldenburg, 2011.
Luostarinen, S., Normak, A & Edström, M. 2011, Overview of Biogas Technology, December 2011
Mazimpaka, E. 2009. Rwanda facing a wood fuel dilemma, University of Cape Town, Rondebosch, South Africa
MINALOC.2011. IDP Retreat Resolution held on 24th-25th November 2011 at Serena Hotel, Kigali
MINECOFIN.2007.Economic Development and Poverty Reduction Strategy, 2008-2012, Kigali, September 2007
MINECOFIN.2013. Guidelines for Development of Sector Strategies in the Context of EDPRS 2 Elaboration, Kigali, 2013.
MININFRA.2008. Energy Strategy Sector, August 2008. Ministry of Infrastructure, Kigali
MININFRA.2011: National energy policy and strategy, Kigali, May 2011
MININFRA.2007. National Domestic Biogas Programme Rwanda. Baseline Study Report. Final Version November 2007
NAVICKAS Kestutis, 2009: http://www.fk.uni-mb.si/fkweb-datoteke/Biosistemsko_inzenirstvo/Bioplin-Navickas.pdf, accessed on June 4, 2012
Nels. 2013. Anaerobic Digesters. http://www.nelsonelson.com/wiki/index.php?title=Anaerobic_Digesters, Accessed on April 18, 2013
NISR.2008. Rwanda in Statistics and Figures
NISR.2011. The Third Integrated Household Living Conditions Survey (EICV3): Main Indicator report, Kigali 2011
NISR.2012. 2012 Population and Housing Census, Provisional Results, Kigali 2012
NSCA.2006. Biogas as a road transport fuel: An assessment of the potential role of biogas as a renewable transport fuel. http://www.cleanvehicle.eu/fileadmin/downloads/UK/nsca_biogas_as_a_road_transport__084926300_1011_24042007.pdf
Pellegrini, L. 2011. Evaluating of Programs promoting Access to Energy in Rwanda-evaluation design, Kigali 2011
Prakash C. Ghimire. 2008. Training for Trainers on Construction and Supervision of SINIDU Model Biogas Plant for Ethiopia: Trainee’s Manuel, SNV Ethiopia, May 2008

65
Rao, S. &Parulekar, B.B.1999 ENERGY TECHNOLOGY, Nonconventional, Renewable and Conventianal, Dheli:Khanna Publishers, 1999.ISBN:81-7409-040-1
RDB.2012. Rwanda Energy Investors Forum 29th Feb-1st March 2012. http://rdb.rw/investinrwandaenergy/img/Rwanda_energy_Investor_Forum_9th_Draft_Program%20.pdf
REMA.2009. Rwanda State of Environment and Outlook Report , Kigali 2009
Republic of Rwanda. 2013: Economic Development and Poverty Reduction Strategy
2013 – 2018, Shaping our Development, Draft April 2013
Republic of Rwanda. 2003. The Constitution of the Republic of Rwanda, Kigali 2003
Saija Rasi.2009. Biogas Composition and Upgrading to Biomethane, Jyväskylä, 2009
Sasse, L.1988. Biogas Plants. GATE-GTZ-GmbH (1988)
Schoot Uiterkamp B.J.2011. Assessment of the Tanzanian Biogas Sector: First Empirical Results using the Appropriate Energy Model. Universiteit Utrecht, August 2011
Schoot Uiterkamp B.J., Pennink B.J.W.2012. Local Capacity Development via Knowledge Sharing: Empirical Results from Sulawesi. Research Report N0.30.University of Groningen, August 2012
SNV-Rwanda.2011. Charcoal value chain and improved cookstoves. Sector Analyses, Kigali, February 2011
SNV-Rwanda.2008. The Rwanda National Domestic Biogas Programme Creating a cheaper, eco-friendly energy source, Final Draft, Kigali 2011
SNV-Nepal.2001. Advanced Course in Biogas Technology (September 2000-January 2001), Lalitpur, February 2001
SNV- Tanzania (undated). Tanzania Domestic Biogas Programme. http://www.snvworld.org/sites/www.snvworld.org/files/publications/brochure_domestic_biogas_programme_tanzania.pdf
SNV- Uganda.2010. Programme Implementation Document for Uganda Domestic Biogas Programme
SSEE (Smith School of Enterprise and Environment). Rwanda’s Climate: Observations and Projections, University of Oxford, July 2011
Trading Economics.2012. http://www.tradingeconomics.com/rwanda/gdp, Accessed on June 13, 2012.
Tyldesley S., Hogarth R. 2011: Energy Sector Working Paper, Appendix B, SSEE, University of Oxford, June 2011
The University of Adelaide. 2012, http://www.adelaide.edu.au/biogas/history/, accessed on June 6, 2012
U.S.EPA (United Environment Protection Agency). Inventory of U.S. Greenhouse Gas Emissions and Sinks: 1990-2002
U.S.EPA.2013: Using Indicators to Measure Progress on Children’s Environmental Health: http://yosemite.epa.gov/ochp/ochpweb.nsf/content/CEHProgress.htm/$file/CEHProgress.pdf, Accessed on April 24, 2013
Wikipedia.2012.Biogas: http://en.wikipedia.org/wiki/Biogas, accessed on June 8, 2012
Wikipedia.2012. Economy of Rwanda: https://en.wikipedia.org/wiki/Economy_of_Rwanda, accessed on June 22, 2012
Wikipedia.2013. Millennium Development Goals: http://en.wikipedia.org/wiki/Millennium_Development_Goals, Accessed on April 20, 20013
WHO (World Health Organization).2006: Fuel for Life: Household Energy and Health. http://www.who.int/indoorair/publications/fuelforlife.pdf, Accessed on April 23, 2013

66
World Bank.2010. World Bank Indicators-Rwanda-Land Use

67
11 ANNEXURE
ANNEX 1: BIOGAS POTENTIAL FOR PERIOD 2012-2020
Pro
vin
ce
District
2012 2015 2020
Total dung available (tonnes/day)
Gas volume (m3/day)
Daily biogas calorific energy (GJ/day)
Daily biogas Energy (MWh/day)
Total dung available (tonnes/day)
Gas volume (m3/day)
Daily biogas calorific energy (GJ/day)
Daily biogas Energy (MWh/day)
Total dung available (tonnes/day)
Gas volume (m3/day)
Daily biogas calorific energy (GJ/day)
Daily biogas Energy (MWh/day)
South
ern
Gisagara 818.7 26,385.8 569.9 159.3 1,024.0 32,847.1 711.8 197.1 1,364.8 43,561.7 940.9 261.4
Huye 848.6 26,359.2 569.4 159.2 1,073.8 33,196.0 719.5 199.2 1,447.7 44,532.7 961.9 267.2
Kamonyi 1,191.7 39,295.9 848.8 237.2 1,493.7 49,148.0 1,064.9 294.9 1,995.0 65,491.5 1,414.6 392.9
Muhanga 939.3 30,401.7 656.7 182.9 1,179.6 38,103.9 824.3 228.6 1,579.5 50,912.9 1,099.7 305.5
Nyamagabe 703.0 22,456.0 485.0 135.7 872.3 27,717.8 601.1 166.3 1,153.0 36,432.8 786.9 218.6
Nyanza 1,031.5 33,292.4 719.1 201.5 1,288.0 41,401.2 898.4 248.4 1,713.1 54,820.1 1,184.1 328.9
Nyaruguru 1,168.7 38,759.7 837.2 233.6 1,464.5 48,476.8 1,049.5 290.9 1,956.2 64,615.6 1,395.7 387.7
Ruhango 1,201.6 38,721.3 836.4 233.6 1,506.3 48,395.9 1,048.4 290.4 2,012.5 64,450.6 1,392.1 386.7
S/Total 7,903.1 255,672.1 5,522.5 1,542.9 9,902.2 319,286.7 6,917.9 1,915.7 13,221.7
424,817.9 9,176.1 2,548.9
Wes
tern
Karongi 819.5 25,999.8 561.6 156.0 1,020.9 32,277.8 697.2 193.7 1,355.5 42,696.1 922.2 256.2
Ngororero 720.2 22,622.0 488.6 135.7 897.1 28,043.1 605.7 168.3 1,190.9 37,032.9 799.9 222.2
Nyabihu 940.4 29,652.8 640.5 177.9 1,169.0 36,716.9 793.1 220.3 1,549.4 48,466.7 1,046.9 290.8
Nyamasheke 674.2 22,091.2 477.2 132.5 841.1 27,452.8 593.0 164.7 1,118.1 36,336.6 784.9 218.0
Rubavu 572.8 18,192.2 393.0 109.2 714.6 22,614.9 488.5 135.7 948.4 29,879.4 645.4 179.3
Rusizi 505.6 16,184.9 349.6 97.1 628.4 19,992.4 431.8 120.0 831.3 26,273.5 567.5 157.6
Rutsiro 672.8 20,805.9 449.4 124.8 841.0 25,884.8 559.1 155.3 1,119.9 34,297.9 740.8 205.8
S/Total 4,905.5 155,548.7 3,359.9 933.3 6,112.2 192,982.7 4,168.4 1,157.9 8,113.6
254,983.0 5,507.6 1,529.9
No
rth
ern
Burera 722.1 22,285.0 481.4 133.7 898.4 27,593.3 596.0 165.6 1,191.9 36,426.9 786.8 218.6
Gakenke 765.3 24,342.1 525.8 146.1 953.8 30,261.8 653.7 181.6 1,267.6 40,114.4 866.5 240.7
Gicumbi 1,041.6 33,676.8 727.4 202.1 1,297.4 41,827.3 903.5 251.0 1,722.9 55,379.6 1,196.2 332.3
Musanze 786.1 25,317.9 546.9 151.9 977.4 31,380.4 677.8 188.3 1,294.8 41,431.4 894.9 248.6
Rulindo 959.8 30,566.1 660.2 183.4 1,201.2 38,221.4 825.6 229.3 1,602.6 50,947.9 1,100.5 305.7
S/Total 4,274.9 136,187.9 2,941.7 817.1 5,328.1 169,284.1 3,656.5 1,015.7 7,079.7
224,300.2 4,844.9 1,345.8
Eas
tern
Bugesera 864.9 27,045.0 584.2 162.3 1,085.7 33,764.0 729.3 202.6 1,451.4 44,872.2 969.2 269.2
Gatsibo 1,400.4 46,218.6 998.3 277.3 1,740.7 57,223.6 1,236.0 343.3 2,304.1 75,412.4 1,628.9 452.5
Kayonza 1,254.5 40,679.8 878.7 244.1 1,566.5 50,590.2 1,092.7 303.5 2,082.8 66,963.1 1,446.4 401.8
Kirehe 859.4 26,784.7 578.5 160.7 1,077.5 33,411.8 721.7 200.5 1,438.3 44,347.9 957.9 266.1
Ngoma 736.6 22,996.2 496.7 138.0 924.5 28,710.4 620.1 172.3 1,235.1 38,134.0 823.7 228.8
Nyagatare 3,248.6 109,104.8 2,356.7 654.6 4,043.7 135,519.5 2,927.2 813.1 5,363.1
179,312.2 3,873.1 1,075.9
Rwamagana 779.7 24,348.6 525.9 146.1 976.9 30,332.0 655.2 182.0 1,303.4 40,217.5 868.7 241.3
S/Total 9,144.2 297,177.7 6,419.0 1,783.1 11,415.5
369,551.4 7,982.3 2,217.3 15,178.2
489,259.3
10,568.0 2,935.6

68
Kig
ali C
ity
Gasabo 603.5 20,390.8 440.4 122.3 751.0 25,356.0 547.7 152.1 991.4 33,410.5 721.7 200.5
Kicukiro 316.4 10,310.3 222.7 61.9 393.5 12,770.3 275.8 76.6 519.0 16,757.9 362.0 100.5
Nyarugenge 195.9 6,802.7 146.9 40.8 238.6 8,283.8 178.9 49.7 308.7 10,709.1 231.3 64.3
S/Total 1,115.8 37,503.8 810.0 225.0 1,383.1 46,410.1 1,002.4 278.4 1,819.1 60,877.5 1,315.0 365.3
Rwanda 27,343.5 882,090.2
19,053.1 5,301.4 34,141.1 1,097,515
23,727.5 6,585.0 45,412.3
1,454,238 31,411.6 8,725.5
Note: The estimate is done at local conditions of temperature and pressure of 200C and 1.020bars in average
ANNEX 2: IMPACT OF DOMESTIC BIOGAS ON FOREST
Particulars Rwanda
Number of domestic biogas installed 2236
Annual firewood saving(tonnes of firewood per HH per year
1.5
Total firewood saving (tonnes of firewood) 3354
Total firewood saving (m3 of firewood) 4791.43
Equivalent forest area protection (ha) 864.48
Note: On average, the productivity of plantations is 7m3/ha/year [SNV-Rwanda, 2011]; firewood density=0.7tonne/m3
ANNEX 3: GENERAL INFORMATION ON BIOGAS PLANTS IN PRISONS
Number and sizes of cooking stoves
S/N
Sites Year of construction
Total number of digesters
Plant size
No of stoves
Size of the stoves
Number of prisoners
1 Rusizi (Western Province)
1999 6
75m3*2=150 m3
8 5 with 500L and 3 with 300L
3,228
100m3*4=400m3
2 Nyamagabe (Southern Province)
2006 6
100*3=300m3
4 500L each
4,500
30m3*2=60m3
16m3
3
Huye (Southern province (Southern
2005 9
100m3*6=600m3 13
500L each
8,123
100m3*3=300m3
4 Mpanga (Southern province)
2004 8
100m3*2=200m3
10 500L each
7,120
100m3*2=200m3
100m3*2=200m3
100m3*2=200m3
5
Muhanga (Southern province Province)
2005 10
100m3*5=500m3
10 500L each
5,944
100m3*5=500m3

69
6 Nsinda(Eastern province)
2007 12
100m3*12=1,200m3
12 500L each
7,590
7 Nyagatare (Eastern Province)
2002 1 75m3
2 500L each 300
8
Miyove-Gicumbi (Northern province)
2010 2
200m3
2 500L each
1736
9 Gasabo (Kigali City)
2006 7
100m3*7=700m3
7 500L each
4,700
10
Rilima-Rwamagana (Eastern province)
2010 8
100m3*8=800m3
8 500L each
4,000
11 Nyakiriba –Rubavu (Western
2012
2 100*2=200m3
2 500L each
Total
71
6,801 m3 78
47,241
ANNEX 4: NET GHG SAVING PER HOUSEHOLD BIOGAS PLANTS
Plant size t CO2 equivalent/plant/year
Number of plants Total CO2 equivalent
(t CO2/year)
4 m3 3 279 837
6 m3 4 1568 6272
8 m3 5 264 1320
10 m3 6 125 750
Total 2236 9179

70
ANNEX 5: NET GHG SAVING BY BIOGAS PLANTS IN PRISONS
Prison Size of the plant (m3)
Biogas production per day (m3)
Methane content (60% of biogas)
Kg CO2 equivalent per day
(m3) (kg)
Rusizi 550 110 66 44.22 928.62
Nyamagabe 376 75.2 45.12 30.23 634.84
Huye 900 180 108 72.36 1519.56
Mpanga (Nyanza) 800 160 96 64.32 1350.72
Muhanga 1000 200 120 80.4 1688.4
Nsinda 1200 240 144 96.48 2026.08
Nyagatare 75 15 9 6.03 126.63
Miyove (Gicumbi) 200 40 24 16.08 337.68
Gasabo 700 140 84 56.28 1181.88
Rilima (Rwamagana) 800 160 96 64.32 1350.72
Nyakiriba (Rubavu) 200 40 24 16.08 337.68
Total 6801 1360.2 816.12 548.80 11482.808
Total GHG emission reduction is 11.482 tonnes CO2 equivalent per day or 4,191.225 tonnes CO2 equivalent per year
Note:
• The estimation is done in local temperature and pressure conditions of 20 0Cand 1.020bar respectively in averages.
• Density of methane=0.67 kg/m3; methane content in biogas=60% (assumption); a 100 m3 plant generate 20 m3 of biogas per day (assumption) and Global warming potential (GWP) of methane=21(Source: U.S.EPA, Inventory of U.S Green house Gas Emissions and Sinks: 1990-2002, Annex 6)
• The mass of CO2 equivalent of a GHG is can be calculated
as: GWPGHGofmasseqCO ×= )(2
ANNEX 6: DATA BASE OF INSTITUTIONAL BIOGAS
Schools
SN NAMES DISTRICT Capacity/m3 per day
1 Rilima Secondary School Bugesera 50
2 APEBU Bugesera 30
3 GS St. Joseph Kabgayi Muhanga 30
4 Nyamata High School Bugesera 30
5 Byimana School of Sciences Ruhango 60
6 GSNDL Byimana Ruhango 90

71
7 Nyamirama High School* Kayonza 60
8 Rukira Secondary School Ngoma 60
9 Kiruhura Secondary School
10 College Saint Jean Nyarusange Muhanga 100
11 Ecole Technique de Kabgayi Muhanga
12 ETO Gitarama Nyanza 100
13 Lycee de Kigali* Nyarugenge
14 Petit Seminaire de Kabgayi Muhanga 100
15 Ecole Saint Bernadette Kamonyi 35
16 Institut Don Bosco Kabarondo* 30
17 APENA Secondary School 60
18 Nyarutovu High School Gakenke 60
19 Stella Matutina Secondary School* Rulindo 80
20 APEKI* Rulindo 60
21 ES Tumba Rulindo 32
22 GS Rulindo Rulindo 60
23 Groupe Scolaire Rwaza Musanze
24 Virgo Petit Seminaire * huye 60
25 G.S N D du Bon Conseil* Gicumbi 90
26 G.S Officiel de Butare* Huye 90
27 G.S St Aloys Rwamagana* Rwamagana 60
28 G.S Kabare Ngoma 60
29 Lycee de Zaza Ngoma 90
30 Bright Academy Nyagatare 90
31 EAV Gitwe Ngoma 30
32 G.S Rango Bugesera 50
33 College st Bernard Kansi Gisagara 30
34 EAV Kabutare Huye 50
35 G.S N. P Kabutare Huye 50
36 G.S Mater Dei* Nyanza 50
37 G.S St B ernadette Save Gisagara 50
38 TTC Zaza Ngoma 50
39 Rusumo High School Kirehe 50
40 G.S. St Joseph Nyamasheke Nyamasheke 50
41 EFA Nyagahanga Gatsibo 30
42 TTC Save Gisagara 50
43 Nyagatare secondary school Nyagatare 50
44 ES Gisenyi* Rubavu 50
45 EAV Ntendezi Nyamasheke 50
PRISON
1.a Kabutare Prison II* Huye 600
1.b Kabutare Prison I* Huye 300
2 Nsinda Prison Rwamagana 1200

72
3 Gikongoro Prison Nyamagabe 236
4 Cyangugu Prison Rusizi 600
5 Kimirinko Prison* Gasabo 700
6 Rilima prison Bugesera 800
7 Gitarama prison Muhanga 1000
8 Mpanga Prison Nyanza 400
9 Nyagatare prison Nyagatare 75
10 Miyove prison Gicumbi 200
11 Nyakiliba prison Rubavu 200
HOSPITAL
1 Kibuye hospital Karongi
OTHERS
1 1. Frère Saint Gabriel
2 Soeur de l’Assomption
3 Nsenga farm*
4 Gako organic farming training center
5
Ruyumba Demonstration and training center
6 Zirambe Diary farm
7 Carmelites Sisters
8 Gatete farm
9 Masaka Military Camp
10 Air Force Camp
11 Monastry of Benedictine Sisters
TOTAL 68 Note:
• The biogas capacity is given in m3 at local temperature and pressure conditions of 20 0C and 1.020bar respectively in average.
• Institutions with asterisk symbol (*) been visited by our team during the field visits. ANNEX 7: BIOGAS COMPANIES
SN COMPANIES Owner PHONE 1
1 ABC NAHAYO J.M.Vianney 0 788 610 935
2 ACSES-I SHINGIRO Ehudi 0 788 434 285
3 AEDE NIYIGENA Aimable 0 788 601 672
4 ARCOF RURANGIRWA Emmanuel 0 788 588 185
5 ASOFATE MUTSINZI Jean Nepomuscene 0 788 689 868
6 ATLAS CONSTRUCTION KAMALI Gilbert 0 788 510 292
7 BDCS NZABARUSHIMANA Jeremie 0 782 199 888
8 BETRAP TWAGIRIMANA JOSEPH 0 788 536 124

73
9 BISOVE KABANDA Ormstache 0 788 500 406
10 BRICO NIYOTWIZERA Pierre 0 788 656 580
11 BUCLINO BUCYEYE Lin 0 788 877 028
12 BUFAB DUSABEYEZU Fabien 0 783 628 931
13 CBSV SHYIRAMBERE Vital 0 785 343 638
14 CE Marceline 0 783 838 303
15 CEE MUNYABUGINGO Abdoul Karim 0 788 469 661
16 CELO CONSTRUCTION NZIYUMVIRA Marcel 0 788 752 894
17 CEPC MUNEZERO Augustin 0 788 887 700
18 CEPINA KABANDA Deudonne 0 788 519 110
19 COBITEC HAVUGIMANA Olivier 0 788 512 715
20 COFORWA NDAHIMANA Jean Damascene 0 788 303 389
21 COGECOMO HABINEZA Valens 0 783 052 206
22 CONS-TECH NDAYISHIMIYE Nicolas 0 788 685 020
23 COSE NIYINDAGIYE Innocent 0 788 550 313
24 CRET Edouard 0 788 302 624
25 CWC Mpungirehe 0 783 074 047
26 DASSY ENTREPRISE USANASE Bernardin 0 788 553 813
27 DECO UWITONZE Olivier
28 DOBIPRO Kayigi Celestin 0 788 506 181
29 ECAMI Hakizimana Janvier 0 788 352 054
30 ECBD KABERUKA Théoneste 0 788 849 892
31 ECBQ MURAMIRA Jean Pierre 0 788 603 769
32 ECMEP NTAGORAMA Lambert 0 788 794 976
33 ECNV NIYONSABA Vianney 0 788 681 960
34 ECOBI BIZIMUNGU Innocent 0 788 228 882
35 ECOBIO NTAGWABIRA Jean Bosco 0 783 504 078
36 ECODI HAHIRRWABASENGA Matusela 0 788 444 913
37 ECOFSOM NYAMWASA Pascal 0 788 404 000
38 ECOHEB BIKORIMANA Azarias 0 783 101 118
39 ECOJEA RUKUNDO Joseph 0 788 883 714
40 ECOKAR Karemera Anselve 0 788 786 227
41 ECOPEF SIKUBWABO Anicet 0 788 548 557
42 ECOPEM NSHIMIYUMUREMYI Theoneste 0 788 883 438
43 ECOPREDO NSENGIYERA Martin 0 788 497 960
44 ECOSM MBARUSHIMANA Emmanuel 0 788 635 033
45 ECOTRAPEGE Maniraguha J.M.V 0 788 838 163
46 ECPE BIZIYAREMYE Ezechiel 0 785 231 495
47 ECTP c/o NGARAMBE Elias 0 788 452 705

74
48 ECTPA MUTABARUKA Jean de Dieu 0 788 665 295
49 EDICEBIO Fasasi Diplomat Noor 0 788 783 791
50 EECO MUKIZA Epaphrase 0 788 599 419
51 EGECONTI NTIRENGANYA Innocent 0 788 470 731
52 EGTRCMS Ntakirutimana Fanuel 0 728 703 917
53 EKV KAMANZI Viateur 0 783 007 096
54 ELECTRICOM Kalimunda Fidele Claude 0 788 404 761
55 ENGINEERING SOLUTIONS RWOMUSHANA Benon 0 788 874 678
56 ENVIROTECH DUSABE Clement 0 788 539 145
57 EPECOD HABUMUREMYI Anatole 0 788 433 676
58 ERE RUTIYOMBA Eustache 0 788 506 049
59 ESA NIKUZWE Chantal 0 788 581 111
60 ETCB NSABIMANA Adolphe 0 788 670 780
61 ETCP RUDASINGWA Jackson 0 788 636 161
62 ETEMO NAHIMANA Phillipe 0 788 558 033
63 ETRABAG GAHIGI Ephrem 0 788 452 068
64 ETRADER GAHIMA Ismael 0 783 553 083
65 FAIR HABIMANA Olivier 0 788 493 451
66 FAIR TECHNOLOGY TUMUTUYEYEZU Michel 0 788 439 033
67 GCBC HABINEZA Philbert 0 788 508 265
68 GEBIDECO MUTESI Alphonsine 0 783 405 952
69 GEBTC KAYIRANGA Jovin 0 788 748 389
70 GICOF NTABARESHYA Anaclet 0 788 460 564
71 GLAS NZARURINDA Jean Damascene 0 788 302 691
72 GLHS Mabete Niyonsaba Dieudonne 0 788 627 522
73 GRAD RUTIKANGA Alexandre 0 788 415 085
74 HYCO NGIRABANZI Thélesphore 0 788 469 184
75 IHAMECO HAHIRWABASENGA Metusela 0 788 444 913
76 JTS UWIMANA Janvier 0 788 937 656
77 L&F CONSULTANT KAYITARE Florent 0 788 735 065
78 LA PERFECTION HAVUGINTWARI Barnabe 0 788 494 707
79 MILDECO KARARA Anther 0 788 557 709
80 MOSECO KARABARANGA Vedaste 0 788 416 292
81 MPS BIZIMANA RUTI Emmanuel 0 788 759 303
82 OMEGA BIGRIMANA Celestin 0 788 536 255
83 P&G WORKS Twizere Girbert 0 788 843 332
84 PANDAMU TELIMBERE Innocent 0 788 752 137
85 PECO BIZIMANA Jean Bosco 0 788 224 196
86 RCC NZARAMBA Jean Pierre 0 788 584 893

75
87 REC MUSONI Theogene 0 788 440 127
88 RECONS NKUSI Gilbert 0 788 510 590
89 RENITECH SIBOMANA Joseph 0 788 406 248
90 REUC Ndagijimana Pascal 0 783 002 736
91 ROOFING HABANABAKIZE Pierre 0 728 434 605
92 RRH NDABAMENYE Bernard 0 788 865 652
93 S. MUCOC SAFARI Alexis 0 788 679 438
94 SACO NIYIBIZI Frederic 0 788 455 991
95 SEAL SEMUHUNDU Albert 0 788 759 303
96 SEEPIC MURAGIJIMANA Boniface 0 788 860 997
97 SETCM MUNYABERA Venuste 0 783 027 649
98 SIEGECI BUREGEYA NDAYISABA Ali Ahmad 0 788 308 024
99 SOGELCO MUSONERA J.Damascene 0 788 533 675
100 SUSO MUGABO Richard 0 788 827 228
101 TEBA RULINDA Ernest 0 788 501 889
102 VIECO NDIKUMANA George 0 788 410 342
103 VISION CONSTRUCTION URAMUTSE Fabien 0 783 307 102
104 BIOMOC NDAYITEGEYE Rafiki 0 788 249 113
105 ECOTN NTEGERUMUKIZA Andre 0 788 801 975
Source: RDB
ANNEX 8: QUESTIONNAIRE: BIOGAS PLANT OWNER
1. General information
Name of respondent: …………………………Age of respondent: …………………….
Family size: ………………. Owner’s name: ………………………….
District: …………… Sector: ………….. Cell: ………… Village: …………..
2. Main occupation of the owner
Agriculture shop/business/trade Employee with monthly salary others
3. Plant identification
3.1. Plant size: …………….m3
3.2. Name of the plant construction company: …………………………………….
3.3. Plant construction date: Year………….Month………..
3.4. Total investment cost: Rwf………………….
a. Government subsidy: Rwf…………………
b. Contribution of the borrower: Rwf…………….
c. BPR loan: Rwf…………………
d. Other subsidy: Rwf……………. (Specify the provider)
3.5. Biogas plant feeding: toilet attached cattle manure other

76
4. Information on the livestock
Type- of animals Number of animals
Cattle
Pig
Sheep
Goat
Poultry
Others (specify)
5. Availability of water in the village
Excellent Good Satisfactory Poor
6. Availability of firewood in the village
Excellent Good Satisfactory Poor
7. Loan and subsidy terms and conditions
7.1. Conditions of eligibility to government subsidy:
…………………………………………………………..
…………………………………………………………..
…………………………………………………………..
…………………………………………………………..
7.2. What do you think of the eligibility requirements to government subsidy?
Difficult Somewhat difficult Not difficult
Explain your answer: ……………………………
7.3. How do you see the government subsidy?
Enough Little Too little
7.4. Conditions of eligibility to BPR loan:
…………………………………………………………..
…………………………………………………………..
…………………………………………………………..
…………………………………………………………..

77
7.5. What do you think of the eligibility requirements to BPR loan?
Difficult Somewhat difficult Not difficult
Explain your answer: …………………….
7.6. How the disbursement of loans and subsidies is made?
Loan: ………………………………………………
Subsidy: ……………………………………….
7.7. The time it takes for the disbursement of loans and subsidy from the date of submission of the application
Subsidy: ............days
Loan: ...............days
7.8. Collateral presented to BPR: ………………….
7.9. Loan repayment period: ………….months
7.10. Distance between home and the BPR office: ............m
7.11. How do you see the credit granted by BPR?
Enough Little Too little
9. Construction duration of biogas plant: ................days
Did the construction company meet all terms of the contract? If no, explain
10. Use of biogas
Cooking lighting
11. Information on firewood consumption
11.1. Firewood reduction: …………%
11.2. Use of extra firewood to match your energy needs:
If Yes (specify amount used: …….. %)
12. Information on use of fertilizers:
12.1. Using bio slurry as fertilizer in the fields of crops:
If yes, how is the change in crop productivity after biogas installation?
Increased Decreased No change
12.2. Do you use of additional fertilizer to meet your needs fertilizer?
If Yes (specify amount used: …….. %)
13. Change in household sanitation after installation of biogas plant
Type Increased Decreased No change

78
Smoke in the kitchen
Foul odor
Flies and rodents
Mosquito breeding
Other (specify)
14. Time saving due to the use of biog
14.1. Number of biogas stoves: …………..
14.2. Hours of day spent in household works:
Work Time taken before biogas plant installation
Time taken after biogas plant installation
Collecting firewood
Cooking
Fetching water
Stencil cleaning
Care of livestock
Dung collection
Others (specify)
14.3. Use of the free time
Better care of the family
More time to study
Participate in alternative income generating activities (specify): .........
Others (specify): .........
ANNEX 9: QUESTIONNAIRE: BIOGAS COMPANIES
1. General information
Name of respondent: …………………………Position: ………………………..
Name the company: ………………………….Name of the company manager: …………….
Address of the company: ………………..
2. Information on company registration
…………………………………………………………………………………………………………………………………………………………………………………………………………………………………………………………………………………………………………………………………………………………………………………………………………
2.2. Registration cost: Rwf………….
2.3. Time required for obtaining company registration: ………….days
2.4. Do you see any obstacles to register a biogas company? If yes, explain: ............................................

79
………………………………………………………………………………………………………………………………………………………………………………………………………………………………………………………………………………………………………..
3. Information of activities of the company
3.1. Level of education of the manager: …………………….
3.2. Level of education of masons: ……………….
3.3. Training received by masons:
a. Number of masons trained: ………
b. Topic: ……………
c. Duration: …………..
d. Name of trainer: ……………..
f. Name of fund provider: …………….
3.4. Date of commencement of activities: ………………….
3.5. Number of biogas plants built: ………………………..
3.6. Regularity of employment
Excellent Good Satisfactory Poor
3.7. Season of good market demand: …………….
3.8. How the disbursement of wages is done?
Before After Installments (explain): …………….
3.9. Did you encounter any problem in paying your salary? If yes, which? Explain
3.10. Alternative employment when there is no demand for biogas construction: ………………
4. Information of facilities:
4.1. Availability of credit:
Excellent Good Satisfactory Poor
4.2. Availability of construction material
Excellent Good Satisfactory Poor
4.3. Availability of plumbing material
Excellent Good Satisfactory Poor
4.4. Road network
Excellent Good Satisfactory Poor
4.5. How do you see the subsidy granted to the farmer by the government?
Enough Little Too little
4.6. How do you see the credit granted to the farmer by BPR?
Enough Little Too little
4.5. Level of cooperation with biogas field technicians
Excellent Good Satisfactory Poor

80
4.6. Level of cooperation with local authorities
Excellent Good Satisfactory Poor
4.7. Exist there a local association or cooperative grouping companies biogas?

81
ANNEX 10: QUESTIONNAIRE: BIOGAS FIEL TECHNICIANS/ INFRASTRUCTURE DISTRICT OFFICER/DISTRICT AGRONOME
1. General information
Name of respondent: …………………………
District assignment: ………………………………
2. Information on biogas plants
2.1. Number of biogas plants built: ……………………
2.2. Number of biogas plants under construction: ……………
2.3. Number operational biogas plants: ………………………………
2.4. Number of biogas plants failed
Number of biogas installation failed because of faulty construction: ……………………… Number of biogas installation failed because of lack of maintenance: ………………………..
Others (specify): ……………………..
3. Access to facilities
3.1. Road network
Excellent Good Satisfactory Poor
3.2. How do you see the subsidy granted to the farmer by the government?
Enough Little Too little
3.3. How do you see the credit granted to the farmer by BPR?
Enough Little Too little
4. Cooperation between institutions
4.1. Do you have NGOs supporting the biogas program in district?
If yes name them and specify their contribution:
…………………………………………………………………………………………………………………………………………………………………………………………………………………………………………………………………………………………………………………………………….
4.2. Level of cooperation between biogas field technician and farmers
Excellent Good Satisfactory Poor
4.3. Level of cooperation between biogas field technician and biogas companies
Excellent Good Satisfactory Poor
4.5. Level of cooperation between biogas field technician and local authorities
3.4. Excellent Good Satisfactory Poor
4.6. How local authorities implement biogas strategy? What is their role?

82
5. Need and acceptance of biogas technology
5.1. Availability of firewood in the district:
3.4. Excellent Good Satisfactory Poor
5.2. Resistance of the population due religious belief
Very high High Poor Nonexistent
5.3. Resistance of the population due to morals /lifestyle
Very high High Poor Nonexistent
5.4. Resistance of the population to manipulate with human and cattle excrement
Very high High Poor Nonexistent
6. Comments of the interviewee


![TITLE OF [THESIS, DISSERTATION]](https://static.fdokumen.com/doc/165x107/6333df734cd921f2410d11da/title-of-thesis-dissertation.jpg)