Title of Presentation - PCG
26
31 st August, 2022
-
Upload
khangminh22 -
Category
Documents
-
view
0 -
download
0
Transcript of Title of Presentation - PCG

31st August, 2022
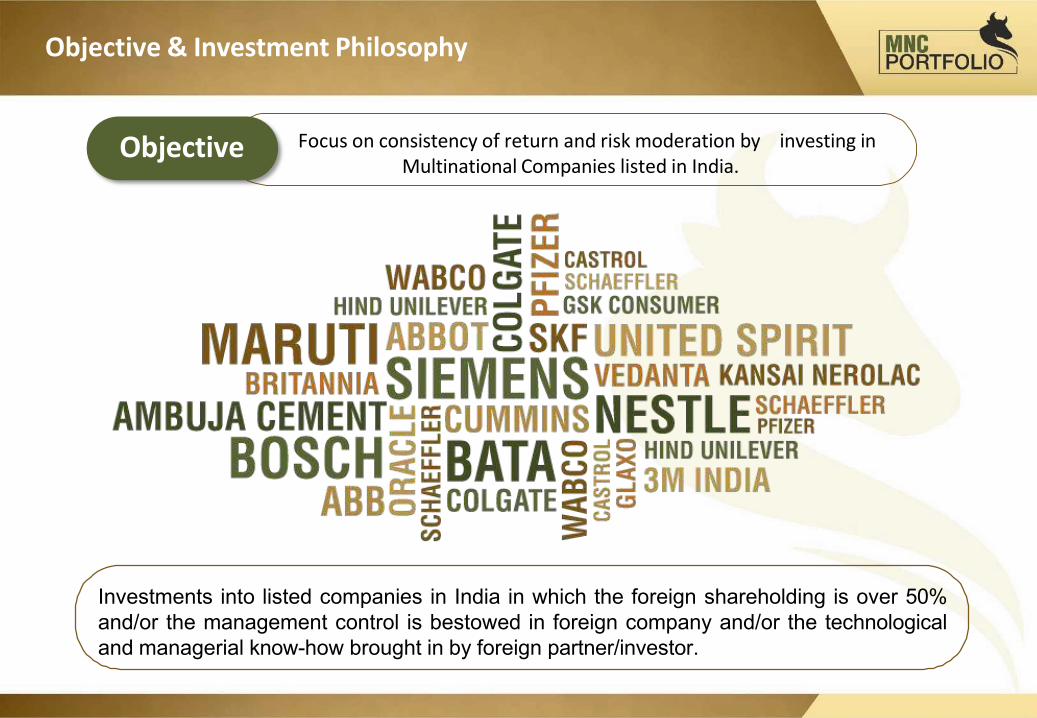
Objective & Investment Philosophy
investing inFocus on consistency of return and risk moderation byMultinational Companies listed in India.
Objective
Investments into listed companies in India in which the foreign shareholding is over 50%and/or the management control is bestowed in foreign company and/or the technologicaland managerial know-how brought in by foreign partner/investor.

MNC’s benefit from the economy of
scales by spreading R&D expenditures
and advertising costs over their global
sales, pooling global purchasing power
over suppliers, and utilizing their
technological and managerial know-how
globally with minimal additional costs.
MNC’s can use their global presence to
take advantage of underpriced labor
services available in certain developing
countries, and gain access to special
R&D capabilities residing in advanced
foreign countries
Successful Business Model

Strong Corporate Governance
MNC’s are generally rated high for
their corporate governance standard.
MNC’s depict high transparency and
accountability with well laid out policies
and regulatory framework, internal
control and risk management.
This provide good comfort for an
investor who would not fall prey to any
negative impact on investment due to
corporate mis-management and fraud.

Healthy Balance Sheet
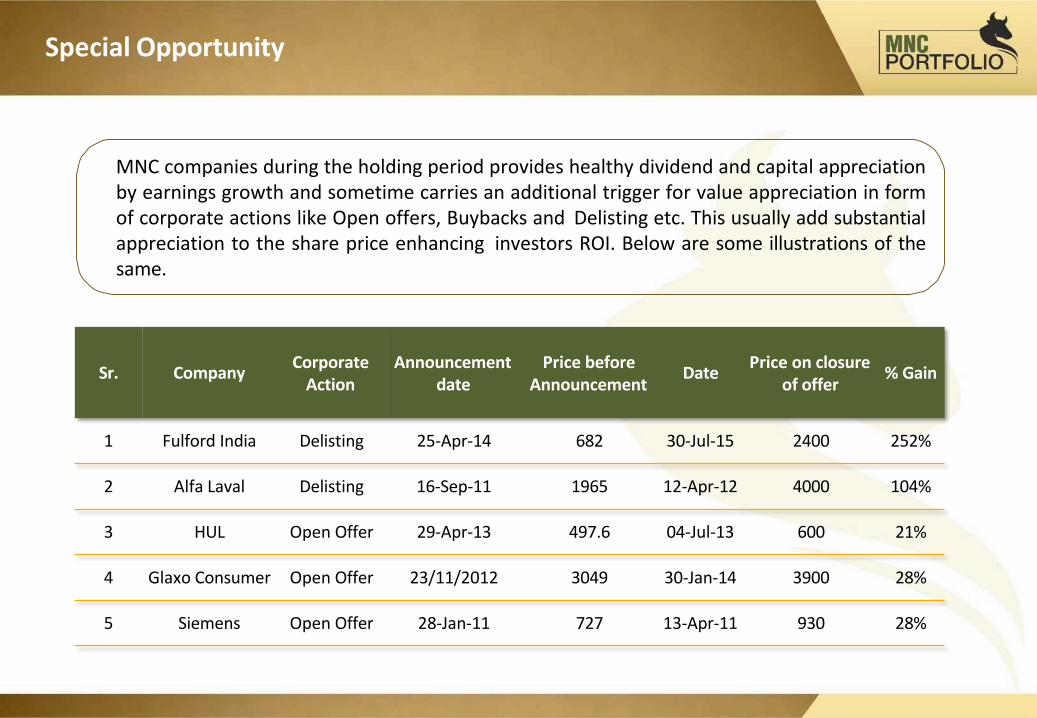
Special Opportunity
Sr. Company Corporate Action
Announcement date
Price before Announcement Date Price on closure
of offer % Gain
1 Fulford India Delisting 25-Apr-14 682 30-Jul-15 2400 252%
2 Alfa Laval Delisting 16-Sep-11 1965 12-Apr-12 4000 104%
3 HUL Open Offer 29-Apr-13 497.6 04-Jul-13 600 21%
4 Glaxo Consumer Open Offer 23/11/2012 3049 30-Jan-14 3900 28%
5 Siemens Open Offer 28-Jan-11 727 13-Apr-11 930 28%
MNC companies during the holding period provides healthy dividend and capital appreciationby earnings growth and sometime carries an additional trigger for value appreciation in formof corporate actions like Open offers, Buybacks and Delisting etc. This usually add substantialappreciation to the share price enhancing investors ROI. Below are some illustrations of thesame.

NIFTY MNC Index has good correlation with NIFTY 50 Index. However the Beta stands at 0.8Annualized returns of NIFTY MNC Index is higher compared to NIFTY 50 Index and Volatility is lower. This shows a favorable risk reward for NIFTY MNC against NIFTY 50 Index
Note: The above study is done on Nifty MNC Index which constitute 15 stocks. The actual portfolio in PMS could deviate compared to NIFTY MNC Index. The above analysis is not an indicative of future performance.
From 2006 to 2021 NIFTY MNCIndex
NIFTY 50Index
Annualised Return 12.23% 10.34%
Average 3 Year Rolling Return p.a. 13.6% 9.6%
Annual Volatility 20.1% 22.20%
Beta with NIFTY 50 0.8
Correlation with NIFTY 50 0.9
A study done on Nifty MNC Index which constitute 15 stocks shows favorable risk reward a portfolio of MNC company could deliver.
NIFTY MNC Index Analysis/Study
16.2% 15.6%14.7% 14.1%
12.2%
10.3%
5 YEAR 10 YEAR 15 YEAR
Annualised Return as on 31st Dec, 2021
NIFTY MNC INDEX NIFTY 50 INDEX

Portfolio Strategy

Re-VIEW Strategy
V
I
E
W
Valuation CheckA constant check is kept on the valuation of the companies so that any stock whosevaluation becomes relatively high, due to any reasons like sentiments or increase inliquidity, is exited before any price correction comes to the stock. We then shift themoney to a new stock with a reasonable valuation.
Impact of EventsA stock price can be highly affected by an event or series of events,recent examples: COVID crisis, Russia-Ukraine War, Increase in CrudePrice, Interest Rates Hike etc. Our team actively tracks these events andmakes timely modifications as per the situation’s needs to minimize risks& optimize returns.
Earnings Visibility ChangesOur fundamental research team scrutinizes the quarterly results of thecompanies to understand the current & future estimated growth. If weare not satisfied with 2 or 3 quarterly results of the company & don’t seegrowth, we take an exit to move to another stock.
Weightage Check of the HoldingsEvery stock & sector has been capped to a certain percentage of the total allocation to limit downside due to any uncertainties and also diversify the portfolio. If any stock or sector reaches near to the decided percent of allocation, we book profits and reduce the weightage and invest into any other stock.
Data as on 31st August, 2022
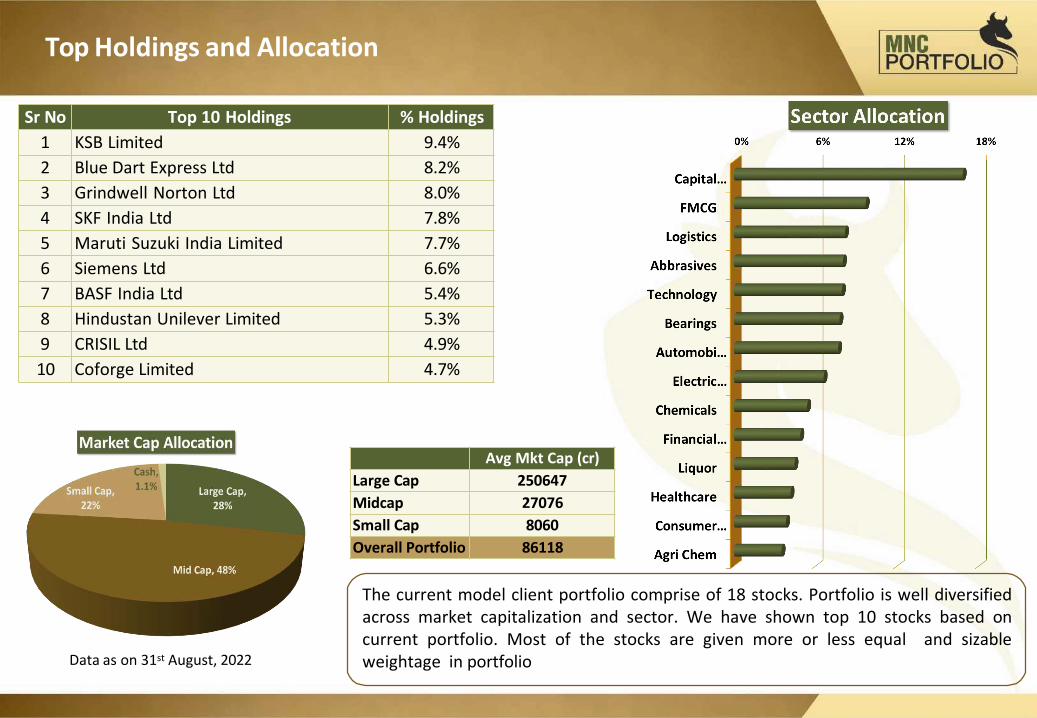
The current model client portfolio comprise of 18 stocks. Portfolio is well diversifiedacross market capitalization and sector. We have shown top 10 stocks based oncurrent portfolio. Most of the stocks are given more or less equal and sizableweightage in portfolio
Top Holdings and Allocation
Sr No Top 10 Holdings % Holdings1 KSB Limited 9.4%2 Blue Dart Express Ltd 8.2%3 Grindwell Norton Ltd 8.0%4 SKF India Ltd 7.8%5 Maruti Suzuki India Limited 7.7%6 Siemens Ltd 6.6%7 BASF India Ltd 5.4%8 Hindustan Unilever Limited 5.3%9 CRISIL Ltd 4.9%10 Coforge Limited 4.7%
Avg Mkt Cap (cr)Large Cap 250647Midcap 27076Small Cap 8060Overall Portfolio 86118

60
80
100
120
140
160
180
200
Aug-
19
Sep-
19
Oct
-19
Nov
-19
Dec-
19
Jan-
20
Feb-
20
Mar
-20
Apr-
20
May
-20
Jun-
20
Jul-2
0
Aug-
20
Sep-
20
Oct
-20
Nov
-20
Dec-
20
Jan-
21
Feb-
21
Mar
-21
Apr-
21
May
-21
Jun-
21
Jul-2
1
Aug-
21
Sep-
21
Oct
-21
Nov
-21
Dec-
21
Jan-
22
Feb-
22
Mar
-22
Apr-
22
May
-22
Jun-
22
Jul-2
2
Aug-
22
Nifty MNC Nifty 50 MNC PMS
3 Years Past Performance
In the above graph, we are presenting how our MNC PMS offering has over-performed compared to 2 indices, namely: Nifty 50& Nifty MNC. The comparison is of past 3 years where the returns of our PMS are post expenses.
Nifty MNC Nifty 50
BETA 0.89 0.63

0%
28%
24%
20%
16%
12%
8%
4%
3 Years Rolling Returns
MNC PMS NIFTY MNC Index Nifty 50 Index
Consistent Performer
MNC PMS 3 Year Rolling Returns (CAGR)Average returns 18%
Maximum returns 25%Minimum returns 10%
Our MNC PMS has been most consistent in terms of rewarding the investors if they had stayed invested with us for more than 3 years.Any such investor has made: 18% CAGR on an average, 25% CAGR on the maximum side, 10% CAGR on the minimum side.
Disclaimer: Past Performance is not necessarily indicative of likely future performance. Performance mentioned above are not verified by SEBI.We have shown the performance as Aggregate performance of all clients on TWRR basis. Note: - Returns above one year are annualized. Returns are net of all fees and expenses.
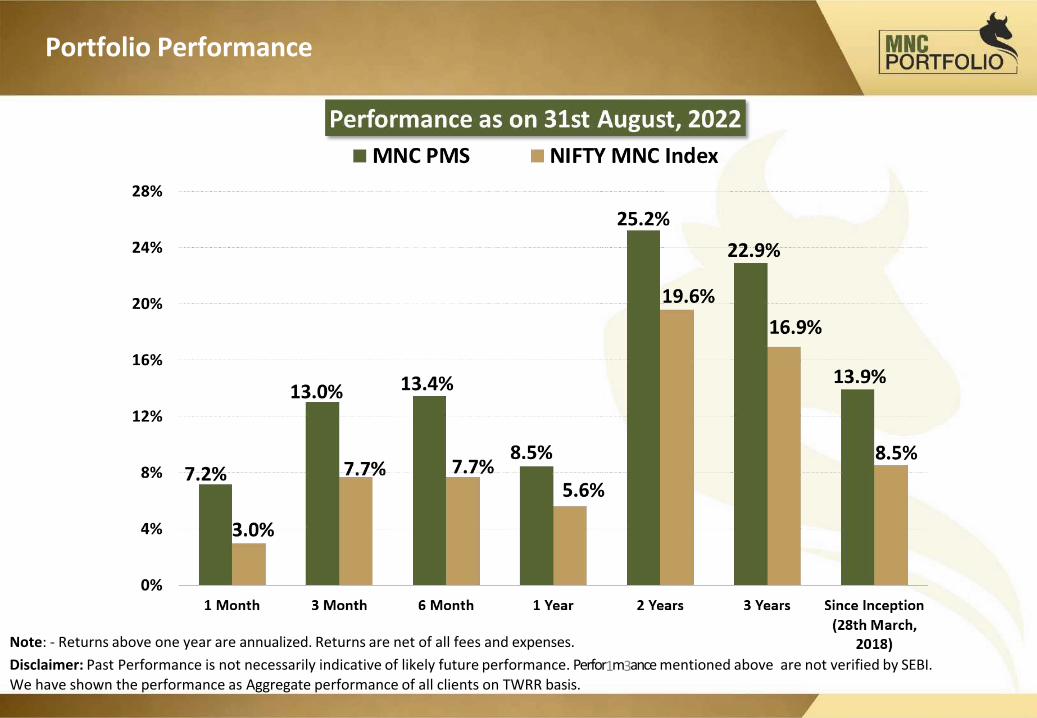
Note: - Returns above one year are annualized. Returns are net of all fees and expenses.Disclaimer: Past Performance is not necessarily indicative of likely future performance. Perfor1m3ance mentioned above are not verified by SEBI. We have shown the performance as Aggregate performance of all clients on TWRR basis.
Portfolio Performance

PORTFOLIO STRATEGY
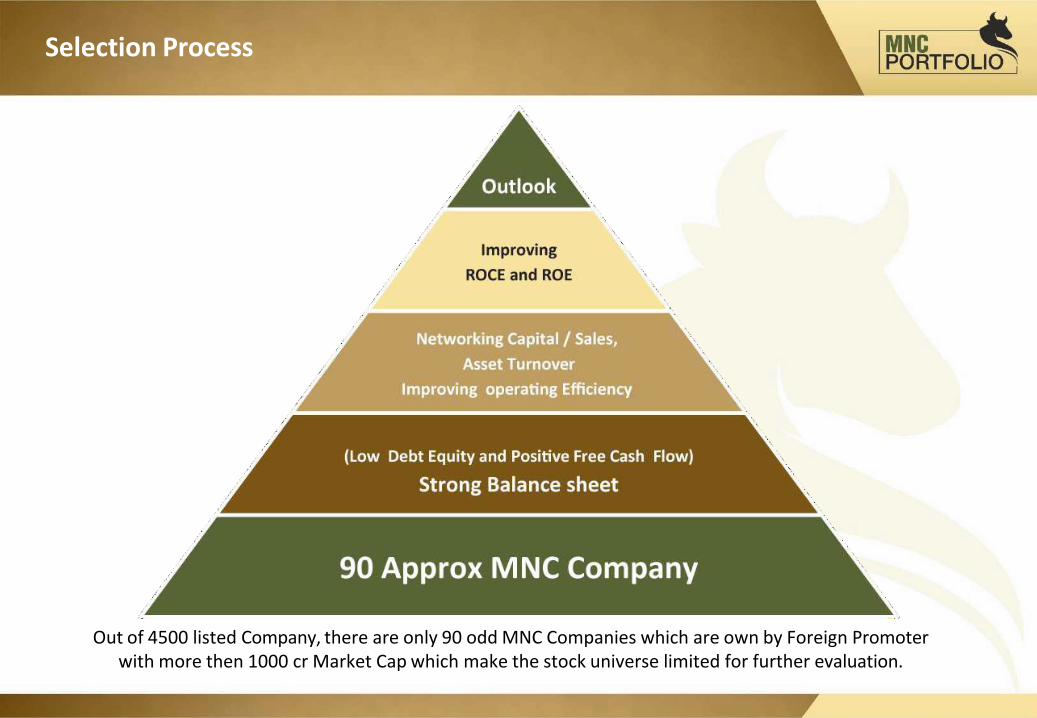
Selection Process
Out of 4500 listed Company, there are only 90 odd MNC Companies which are own by Foreign Promoterwith more then 1000 cr Market Cap which make the stock universe limited for further evaluation.

Well Balanced Defensive but Growth
Consumer non
Discretionary
Consumer Discretionary
Cyclical/Others
The three bucket strategy with shifting allocation as per the market outlook help to further optimize the returns,However Consumables remains the core part of the portfolio.
• Staple and Healthcare• Companies Like Hindustan Unilever, Nestle, Britannia, Colgate,
Glaxo Consumer etc.• Pfizer, Abbot lab, Glaxo Pharma, Sanofi, Astrzenca.
• Auto, Paint, Consumer Durables etc• Maruti, Wabco, 3M India, Bata, Whirpool, Bosch, Johnson Hitachi,
Kansai Nerloac, Akzo Nobel, Castrol, Gulf oil Lubricant etc.
• Cement, Engineering, Electricals, Capital Goods, Metals, IT, Chemicals etc.
• ACC, Ambuja, Heidelberg, Simenes, ABB, Honeywell ,Grindwell Norton, GMM Pfaudler, Mphasis, Bayer Crop, BASF, Oracle Financial, Crisil , Schaeffler, SKF etc.
This Bucket is Expected to show Steady and
Nominal growth
This Bucket Does Well with normal Economic
Growth
This Bucket Does Well when economic growth is
strong

Growth like Multicap but Quality like Large Cap
• MNC PMS is a Multicap Portfolio with all market capitalization. (large, Mid, Small)• There are many companies which by Indian Market Cap Definition are called as Midcap Companies
where as by Global Definition these are Large cap.• One gets benefit of growth like Midcap Companies in India where as Quality of Large Cap. Few Eg given below
Pfizer • Midcap in India• Biggest Pharma Company in World
3 M India • Midcap in India• Part of Dowjones 30 index
• Midcap in IndiaBata India • 125 year old Company operates in
70 Countries

Low Churn - Long term but Active Management
Though we have kept single stock weight max 15%, Partial Profit booking is done whenever overall weight of single stock in portfolio reaches close to 9-10% of portfolio.Max 15% weight is kept in case of any special opportunity is going to get unfold in short term.
Average Annual Turnover 27%
Partial Profit booking and Stocks completely exited in profit is shown in adjacent table.
To optimize performance there are couple of partial and complete exits in losses done depending upon market dynamics.
Eg: Reducing allocation in Auto and Ancillary in 2018-19 where sector was going through challenges
Eg 2: Covid 19. Reducing allocation in Industrial and cyclical
-20%
10%
40%
70%
100%
130%
160%
190%
220%
Abbott India Ltd Bata India Ltd Coforge Limited GMM Pfaudler Ltd Nestle India Ltd
Top Performers
Gain on Open Position Partial Profit Booking*GMM Pfaudler has been totally exited
0
5000
10000
15000
20000
25000
2-Ja
n-17
2-Ap
r-17
2-Ju
l-17
2-O
ct-1
7
2-Ja
n-18
2-Ap
r-18
2-Ju
l-18
2-O
ct-1
8
2-Ja
n-19
2-Ap
r-19
2-Ju
l-19
2-O
ct-1
9
2-Ja
n-20
2-Ap
r-20
2-Ju
l-20
2-O
ct-2
0
2-Ja
n-21
2-Ap
r-21
2-Ju
l-21
Abbot India
Abbot India
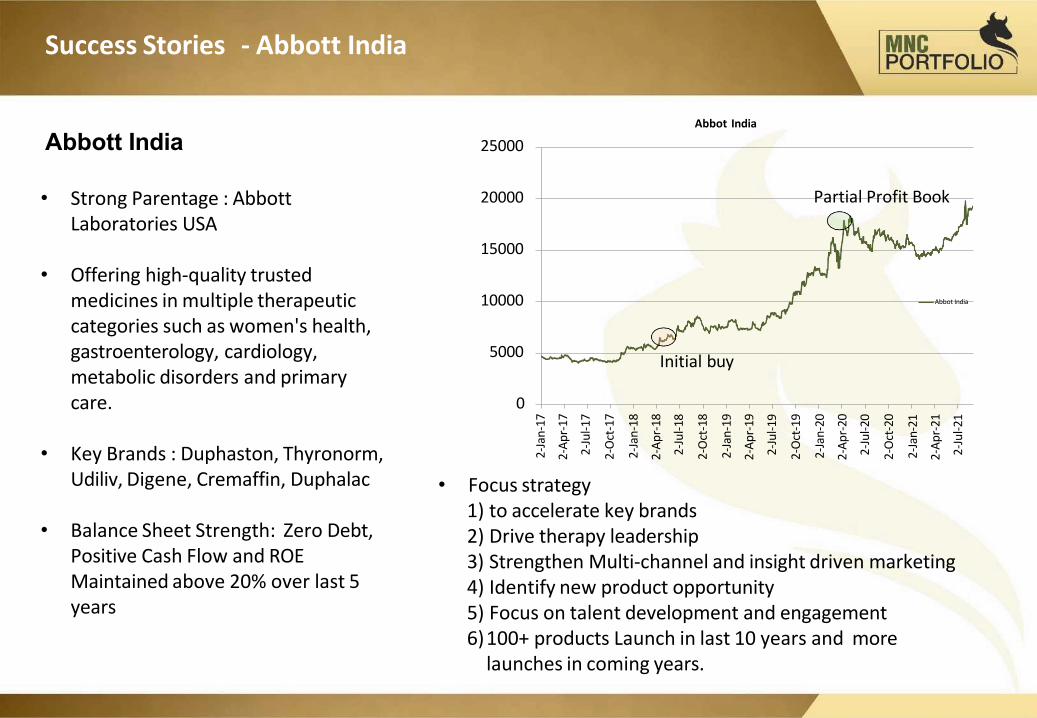
Success Stories - Abbott India
• Strong Parentage : Abbott Laboratories USA
• Offering high-quality trusted medicines in multiple therapeutic categories such as women's health, gastroenterology, cardiology, metabolic disorders and primary care.
• Key Brands : Duphaston, Thyronorm,Udiliv, Digene, Cremaffin, Duphalac
• Balance Sheet Strength: Zero Debt, Positive Cash Flow and ROE Maintained above 20% over last 5 years
Abbott India
Initial buy
Partial Profit Book
• Focus strategy1) to accelerate key brands2) Drive therapy leadership3) Strengthen Multi-channel and insight driven marketing4) Identify new product opportunity5) Focus on talent development and engagement6)100+ products Launch in last 10 years and more
launches in coming years.

Success Stories - GMM Pfaudler
• Focus strategy1) to accelerate key brands2) Drive therapy leadership3) Strengthen Multi-channel and insight driven marketing4) Identify new product opportunity5) Focus on talent development and engagement6)100+ products Launch in last 10 years and more
launches in coming years.
GMM Pfaudler
• Foreign Promoter: Pfaudler Inc.
• A leading supplier of glass lined based equipment (reactors, storage tanks) in India, commanding > 50% domestic market share, finding critical application in the chemical & pharmaceutical industries.
• Benefit from Domestic Chemical, Pharma and Agrochemical capacity addition post Shut down of industries in China.
• Balance Sheet Strength: Zero Debt, Positive Cash Flow and ROE Maintained above 20% over last 5 years.
Initial buy
Full Profit Book
Partial Profit Book

0
1000
2000
3000
4000
5000
6000
2-Ja
n-17
2-Ap
r-17
2-Ju
l-17
2-O
ct-1
7
2-Ja
n-18
2-Ap
r-18
2-Ju
l-18
2-O
ct-1
8
2-Ja
n-19
2-Ap
r-19
2-Ju
l-19
2-O
ct-1
9
2-Ja
n-20
2-Ap
r-20
2-Ju
l-20
2-O
ct-2
0
2-Ja
n-21
2-Ap
r-21
2-Ju
l-21
Coforge Ltd
Coforge Ltd
Success Stories - Coforge Ltd.
• In 2019 NIIT ltd sold its stake in NIIT Technology to foreign player Barings. The company rebranded to name it COFORGE ltd.
• Over the Last 5 years Revenues for thecompany has grown by 10% plus CAGRand PAT has grown by 25% plus CAGR.Operating margin is maintained around17% throughout.
• The company has three key verticals Banking and Financial contributing (17%), Insurance (30%) , Travel andTransportation (29%) and Others (24%). Geography wise America contributes 48%, EMEA 37%, ROW 15%. In terms ofservice Mix ADM Contributes 73%, IMS16% and IP Based 6% and others.
Coforge Ltd.
• Despite COVID except for Travel business most business is doing good with constant addition of new clients especially healthcare. Company continues to remain confident about its near- medium-term growthprospects, citing its strong order booking/pipeline and its investments in building strong sales and leadership.
Initial buy
Still Holding
Founder & Promoter (Anand Rathi Group)
Pradeep Gupta Co Founder & Vice Chairman
Gold medalist Chartered Accountant having more than four decades of rich and varied experience in corporate management, financial & capital markets and corporate & management consultancy.
Served Aditya Birla Group at very senior positions for more than 25 years before starting his own financial services outfit. Shri Rathi was earlier President of BSE for two terms.
Anand Rathi Group derives its strength and vision from legendary leadership of Shri Anand Rathi and charting growth path in his able guidance.
Anand RathiFounder & Chairman
Over twenty years broad based experience in the securities market and key driver of theRetail and Institutional Equities business of the group.
Under his leadership, the Group’s Institutional & Retail Business has won great recognition and many accolades. He has played a pivotal role in the Group’s network expansion and pan India growth.
His valuable contribution towards professionalizing the management of the Group has wonhim immense respect from the corporate world.
Fund Management Team
Mayur ShahFund Manager
Vinod Vaya
More than 15 years of rich experience in Investment advisory, Product Development and Portfolio Management.
Working with Anand Rathi since 2007 across Portfolio Management and Private Client Group Equity Advisory.
Started Career with “Kotak Securities Ltd” in 2005 as an Investment Advisor subsequently gotinto developing Equity products and running the same.
Qualified MBA (Finance) from Mumbai University and Certified Financial Planner.
More than 15 years of rich experience in Investment advisory, Portfolio Management andresearch.
Worked in past with Standard Chartered Securities, Religare Securities, Enam Securities.
PGDBM from Mumbai.

Product Features
AMC feesBrokerageExit Load
: 2.5% p.a (Charged Pro-rata at end of each quarter): 0.25% on Equity delivery transaction: 2% - 1st Year, 1% - 2nd Year, NIL after 2nd Year
Other Charges : GST, Other charges levied by Exchange, Custodial charges levied by custodian and any other statutory charges.
Minimum investment
Portfolio:
Themes offered
Risk – reward & tenure
Type of instruments
Benchmark
Rs. 50 lakhs
15-20 STOCKS, diversified across sectors.
Diversified portfolio of Multinational Companies listed in India with controlling stake with foreign holder
Moderate risk reward. Investment tenure preferably 3 years+
Equity & Equity Related Instruments, Fixed Income Instruments, Cash & Cash Equivalent
NIFTY MNC
Benefits• Dedicated Web Login for client to monitor portfolio.• A relationship manager to cater to investment needs• Constant monitoring of the portfolio• Audited statement at year end for tax filing purpose.Support• Back office customer service desk to address client
queries
MNC Portfolio
Fees & Charges

All Investment are subject to Market Risk.Please read the risk factors before investing in the same.Past Performance is not necessarily indicative of likely future performance
Specific Disclaimer
Registration Details
PMS registered under : Anand Rathi Advisors Ltd. PMS Registration Number : INP00000282.Custodian : Orbis Financial Corporation Ltd.
NameTel
: Vinod Vaya: 022 - 6281 3851
Product Support
Name : Sheetal Kotian / SourabhTel : 022 – 6965 3015 / 3014
Email ID : [email protected] Email ID : [email protected]
OFFICIAL ADDRESS: 10th Floor, Express Zone - A Wing, Western Express Highway, Malad (East), Mumbai - 400063, India
BOARD LINE : +91 22 6281 7000
Back Office Support More Information
Visit Our Website: https://www.anandrathipms.comClick here for Disclosure Document
To invest directly into our PMS, please:Mail: [email protected]: 022-62813851, 52Or click here:https://www.anandrathipms.com/contact-us.php
Direct On-Boarding

Disclaimer:-This presentation has been issued by Anand Rathi Advisors Limited (ARAL), which is regulated by SEBI. Neither the informationnor any opinion expressed constitutes an offer, or an invitation to make an offer, to buy or sell any securities or any options, futures or otherderivatives related to such securities ("related investments"). ARAL and its affiliates may trade for their own accounts as market maker /jobber and/or arbitrageur in any securities of this issuer(s) or in related investments, and may be on the opposite side of public orders. ARAL,its affiliates, directors, officers, and employees may have a long or short position in any securities of this issuer(s) or in related investments.ARAL or its affiliates may from time to time perform investment banking or other services for, or solicit investment banking or other businessfrom, any entity mentioned in this report. This presentation is prepared for private circulation. It does not have regard to the specificinvestment objectives, financial situation and the particular needs of any specific person who may receive this report. Investors should seekfinancial advice regarding the appropriateness of investing in any securities or investment strategies discussed or recommended in this reportand should understand that statements regarding future prospects may not be realized. Investors should note that income from suchsecurities, if any, may fluctuate and that each security's price or value may rise or fall. Past performance is not necessarily a guide to futureperformance. Foreign currency rates of exchange may adversely affect the value, price or income of any security or related investmentmentioned in this report.
THANK YOU