Tiny is mighty: seagrass beds have a large role in the export of organic material in the tropical...
12
Tiny Is Mighty: Seagrass Beds Have a Large Role in the Export of Organic Material in the Tropical Coastal Zone Lucy G. Gillis 1 *, Alan D. Ziegler 2 , Dick van Oevelen 3 , Cecile Cathalot 4 , Peter M. J. Herman 1 , Jan W. Wolters 5 , Tjeerd J. Bouma 1 1 Spatial Ecology Department, Royal Netherlands Institute for Sea Research (NIOZ), Yerseke, Zealand, The Netherlands, 2 Geography Department, National University of Singapore (NUS), Singapore, Singapore, 3 Ecosystems Studies Department, Royal Netherlands Institute for Sea Research (NIOZ), Yerseke, Zealand, The Netherlands, 4 Laboratoire Environnement Profond (LEP), French Research Institute for Exploitation of the Sea, Polouzane, Brittany, France, 5 Department of Biology, University of Antwerp, Antwerp, Flanders, Belgium Abstract Ecosystems in the tropical coastal zone exchange particulate organic matter (POM) with adjacent systems, but differences in this function among ecosystems remain poorly quantified. Seagrass beds are often a relatively small section of this coastal zone, but have a potentially much larger ecological influence than suggested by their surface area. Using stable isotopes as tracers of oceanic, terrestrial, mangrove and seagrass sources, we investigated the origin of particulate organic matter in nine mangrove bays around the island of Phuket (Thailand). We used a linear mixing model based on bulk organic carbon, total nitrogen and d 13 C and d 15 N and found that oceanic sources dominated suspended particulate organic matter samples along the mangrove-seagrass-ocean gradient. Sediment trap samples showed contributions from four sources oceanic, mangrove forest/terrestrial and seagrass beds where oceanic had the strongest contribution and seagrass beds the smallest. Based on ecosystem area, however, the contribution of suspended particulate organic matter derived from seagrass beds was disproportionally high, relative to the entire area occupied by mangrove forests, the catchment area (terrestrial) and seagrass beds. The contribution from mangrove forests was approximately equal to their surface area, whereas terrestrial contributions to suspended organic matter under contributed compared to their relative catchment area. Interestingly, mangrove forest contribution at 0 m on the transects showed a positive relationship with the exposed frontal width of the mangrove, indicating that mangrove forest exposure to hydrodynamic energy may be a controlling factor in mangrove outwelling. However we found no relationship between seagrass bed contribution and any physical factors, which we measured. Our results indicate that although seagrass beds occupy a relatively small area of the coastal zone, their role in the export of organic matter is disproportional and should be considered in coastal management especially with respect to their importance as a nutrient source for other ecosystems and organisms. Citation: Gillis LG, Ziegler AD, van Oevelen D, Cathalot C, Herman PMJ, et al. (2014) Tiny Is Mighty: Seagrass Beds Have a Large Role in the Export of Organic Material in the Tropical Coastal Zone. PLoS ONE 9(11): e111847. doi:10.1371/journal.pone.0111847 Editor: David William Pond, Scottish Association for Marine Science, United Kingdom Received June 13, 2014; Accepted October 8, 2014; Published November 11, 2014 Copyright: ß 2014 Gillis et al. This is an open-access article distributed under the terms of the Creative Commons Attribution License, which permits unrestricted use, distribution, and reproduction in any medium, provided the original author and source are credited. Data Availability: The authors confirm that all data underlying the findings are fully available without restriction. All relevant data are within the paper. Funding: This research was funded by Ecoshape, Building with Nature (SDWI/Eco-Shape/Building with Nature grant R-303-001-020-414). The funders had no role in study design, data collection and analysis, decision to publish, or preparation of the manuscript. Competing Interests: The authors have declared that no competing interests exist. * Email: [email protected] Introduction The tropical coastal zone is composed of ecosystems emerging from the open ocean, extending over coral reefs and seagrass beds towards the tidal zone, which may include mangrove forests. This zone forms a well-structured and gradual interface between the land and the sea that contains some of the most productive and biogeochemically active ecosystems in the world [1]. Part of this productivity is maintained by particulate and dissolved organic matter (POM and DOM) inputs from both terrestrial and oceanic sources [2]. The importance of external inputs to the coastal zone and the exchanges between coastal ecosystems depends on various factors. For example, the quantity of terrestrial organic matter (OM) input to the coastal zone has been shown to depend on the size of the catchment area and the land-use within [3]. Tidally-dominated estuaries have large exchanges of water with the ocean, and therefore, receive ocean-derived DOM and POM [4–6]. The recognized mangrove outwelling hypothesis [7–8] postulates that export of mangrove-derive OM supports adjacent ecosystems and food webs. Another potentially important OM source and sink within the tropical coastal zone are seagrass beds. Seagrass plants trap suspended POM originating from both external sources and from leaf shedding inside the seagrass bed [9–10]. Trapping results directly from the physical structure of the bed and from settling induced by changes in the hydrodynamic conditions - both are related in part to plant density and leaf characteristics [11–12]. Once POM is deposited within seagrass beds, the matter is ‘protected’ from re-suspension, and consequently, most POM degrades within the bed, releasing dissolved nutrients that may in turn be taken up by the seagrass [13–15] or released to the water column [9,16]. Seagrass beds however also export particulate nutrients via leaf shedding enhanced during strong hydrodynamic events and via marine herbivore consumption [17]. PLOS ONE | www.plosone.org 1 November 2014 | Volume 9 | Issue 11 | e111847
Transcript of Tiny is mighty: seagrass beds have a large role in the export of organic material in the tropical...

Tiny Is Mighty: Seagrass Beds Have a Large Role in theExport of Organic Material in the Tropical Coastal ZoneLucy G. Gillis1*, Alan D. Ziegler2, Dick van Oevelen3, Cecile Cathalot4, Peter M. J. Herman1,
Jan W. Wolters5, Tjeerd J. Bouma1
1 Spatial Ecology Department, Royal Netherlands Institute for Sea Research (NIOZ), Yerseke, Zealand, The Netherlands, 2 Geography Department, National University of
Singapore (NUS), Singapore, Singapore, 3 Ecosystems Studies Department, Royal Netherlands Institute for Sea Research (NIOZ), Yerseke, Zealand, The Netherlands,
4 Laboratoire Environnement Profond (LEP), French Research Institute for Exploitation of the Sea, Polouzane, Brittany, France, 5 Department of Biology, University of
Antwerp, Antwerp, Flanders, Belgium
Abstract
Ecosystems in the tropical coastal zone exchange particulate organic matter (POM) with adjacent systems, but differences inthis function among ecosystems remain poorly quantified. Seagrass beds are often a relatively small section of this coastalzone, but have a potentially much larger ecological influence than suggested by their surface area. Using stable isotopes astracers of oceanic, terrestrial, mangrove and seagrass sources, we investigated the origin of particulate organic matter innine mangrove bays around the island of Phuket (Thailand). We used a linear mixing model based on bulk organic carbon,total nitrogen and d13C and d15N and found that oceanic sources dominated suspended particulate organic matter samplesalong the mangrove-seagrass-ocean gradient. Sediment trap samples showed contributions from four sources oceanic,mangrove forest/terrestrial and seagrass beds where oceanic had the strongest contribution and seagrass beds the smallest.Based on ecosystem area, however, the contribution of suspended particulate organic matter derived from seagrass bedswas disproportionally high, relative to the entire area occupied by mangrove forests, the catchment area (terrestrial) andseagrass beds. The contribution from mangrove forests was approximately equal to their surface area, whereas terrestrialcontributions to suspended organic matter under contributed compared to their relative catchment area. Interestingly,mangrove forest contribution at 0 m on the transects showed a positive relationship with the exposed frontal width of themangrove, indicating that mangrove forest exposure to hydrodynamic energy may be a controlling factor in mangroveoutwelling. However we found no relationship between seagrass bed contribution and any physical factors, which wemeasured. Our results indicate that although seagrass beds occupy a relatively small area of the coastal zone, their role inthe export of organic matter is disproportional and should be considered in coastal management especially with respect totheir importance as a nutrient source for other ecosystems and organisms.
Citation: Gillis LG, Ziegler AD, van Oevelen D, Cathalot C, Herman PMJ, et al. (2014) Tiny Is Mighty: Seagrass Beds Have a Large Role in the Export of OrganicMaterial in the Tropical Coastal Zone. PLoS ONE 9(11): e111847. doi:10.1371/journal.pone.0111847
Editor: David William Pond, Scottish Association for Marine Science, United Kingdom
Received June 13, 2014; Accepted October 8, 2014; Published November 11, 2014
Copyright: � 2014 Gillis et al. This is an open-access article distributed under the terms of the Creative Commons Attribution License, which permits unrestricteduse, distribution, and reproduction in any medium, provided the original author and source are credited.
Data Availability: The authors confirm that all data underlying the findings are fully available without restriction. All relevant data are within the paper.
Funding: This research was funded by Ecoshape, Building with Nature (SDWI/Eco-Shape/Building with Nature grant R-303-001-020-414). The funders had no rolein study design, data collection and analysis, decision to publish, or preparation of the manuscript.
Competing Interests: The authors have declared that no competing interests exist.
* Email: [email protected]
Introduction
The tropical coastal zone is composed of ecosystems emerging
from the open ocean, extending over coral reefs and seagrass beds
towards the tidal zone, which may include mangrove forests. This
zone forms a well-structured and gradual interface between the
land and the sea that contains some of the most productive and
biogeochemically active ecosystems in the world [1]. Part of this
productivity is maintained by particulate and dissolved organic
matter (POM and DOM) inputs from both terrestrial and oceanic
sources [2].
The importance of external inputs to the coastal zone and the
exchanges between coastal ecosystems depends on various factors.
For example, the quantity of terrestrial organic matter (OM) input
to the coastal zone has been shown to depend on the size of the
catchment area and the land-use within [3]. Tidally-dominated
estuaries have large exchanges of water with the ocean, and
therefore, receive ocean-derived DOM and POM [4–6]. The
recognized mangrove outwelling hypothesis [7–8] postulates that
export of mangrove-derive OM supports adjacent ecosystems and
food webs.
Another potentially important OM source and sink within the
tropical coastal zone are seagrass beds. Seagrass plants trap
suspended POM originating from both external sources and from
leaf shedding inside the seagrass bed [9–10]. Trapping results
directly from the physical structure of the bed and from settling
induced by changes in the hydrodynamic conditions - both are
related in part to plant density and leaf characteristics [11–12].
Once POM is deposited within seagrass beds, the matter is
‘protected’ from re-suspension, and consequently, most POM
degrades within the bed, releasing dissolved nutrients that may in
turn be taken up by the seagrass [13–15] or released to the water
column [9,16]. Seagrass beds however also export particulate
nutrients via leaf shedding enhanced during strong hydrodynamic
events and via marine herbivore consumption [17].
PLOS ONE | www.plosone.org 1 November 2014 | Volume 9 | Issue 11 | e111847

Due to the different ecosystems in the seascape, the high
production of ecosystems and the potential for import and export
from a variety of sources, it is challenging to constrain the
contribution of the different resources to the exchange of or OM in
the tropical coastal zone. One classical approach is to use a
chemical tracer mixing model based on a combination of carbon
to nitrogen ratios (C:N) with carbon and nitrogen stable isotope
ratios (d13C and d15 N, respectively) [18–19]. Each of these tracers
has a specific signature for each source (oceanic, seagrass,
mangrove and terrestrial), which can be used to identify the
contribution of the different sources in a mixture [18–19].
Investigations of source contributions in Southern Thailand and
found that seagrasses contributed between 36–42% of OM to
sediment trap samples [4]. Other studies in Gazi Bay, Kenya
discovered that mangrove and seagrass matter dominated
suspended POM in the water column [17,20]. These studies
indicate that contributions from individual sources likely depend
on the local conditions. In this paper, we build upon the
foundations of previous work to investigate the origin of POM
in trap and suspended sediment samples in the coastal zone in
Phang-nga Bay in southern Thailand. We studied nine sites with
contrasting physical attributes of bays (width and length), of
ecosystems (aerial extent and width) and of catchment areas (aerial
extent and land use). This allowed us to gain a greater
understanding of export of POM from different ecosystems at
the tropical seascape scale. Specifically, we compared the amount
of OM originating from seagrass beds versus mangrove, oceanic,
and terrestrial sources across a number of different sub-habitats in
the region, comparing the contributions to their respective surface
areas.
Methods
Ethics statementThe work was conducted in collaboration with Rajabhat
University (Phuket) on public lands. No permit was required for
sampling. No live samples were collected.
Study Area and Physical attributesWithin the Andaman Sea, along the southwest coast of
Thailand is the province of Phuket, which borders Phang-nga
bay (Figure 1). Our sampling sites are located in Phang-nga Bay,
which is 68 km long (head to mouth) and has a surface area of
3000 km2. Mean tidal range is 1.8 m (Figure 1). The southern part
of the bay is open to the Andaman Sea and the northwest area is
open to the sea via the Pak Pra Inlet, which separates Phuket
Island from the mainland (Figure 1). Estuarine salinity conditions
dominate in the north, whilst marine conditions dominate in the
south [21]. Circulation in the bay changes depending on the dry
(May to October) or wet season (November to April), which alters
the wind direction from northeast in the dry season to southwest in
the wet season. Mean annual rainfall is about 2300 mm and mean
temperature is 28uC.
Land-use around Phang-nga Bay changed from natural forest to
initially tin mining (1600–1800) [21]. Other land-uses have gained
greater importance such as rubber and palm oil plantations as well
as shrimp (located on land) and fish farms (situated in coastal
zones) [21]. In recent decades, rapid urbanisation related to
tourism has occurred in Phuket.
Samples were collected from all the fully accessible mangrove
sites located in the west of Phang-nga Bay, on the islands of
Phuket, Yao Yai and Yao Noi. A total of 9 sites were sampled
(Figure 1) during March 2011. All sites were outside the reach of
direct river discharge and experienced a strong tidal exchange
(tidal range 0.5–2.5 m) with the ocean. Therefore, all sites are
classified as tidal mangroves [22].
Sample collection and data processingAt each site we established transects beginning at the edge of the
mangrove, extending towards the ocean through an adjacent
intertidal seagrass patch. Samples were taken, when logistically
possible, at distances of 0 (seaward edge of mangrove forest), 50,
100, 200, 300, 400, 500, 1000, 1500 and 2000 m along the
transect, perpendicular to the seaward edge of the mangrove forest
towards the open sea. Two types of samples were collected: trap
samples of suspended matter above the bed (0.05 m) and
suspended particulate matter in the water column. At least half
of the sampling points (for trap and water samples) were located in
the seagrass beds; the other half were taken at points landward or
seaward of the bed, depending on the physical constraints of the
different sites. Sediment traps at each point were secured to steel
rods and anchored to the substrate at a height of 0.05 m above the
sediment. They were emptied once after approximately 24 hours.
On the day of trap installation, 2-liter surface water samples were
taken at each point above the traps at the water surface during
high tide.
Four POM sources were considered in this study: terrestrial
vegetation, mangrove leaves, seagrass leaves and oceanic plankton.
For the terrestrial vegetation, three replicates of 3–4 leaves from
rice paddies, rubber trees (Hevea sp.) and native vegetation
(Delonix sp. and Terminalia sp.) were collected on the island of
Koh Yai. These were considered to be representative for terrestrial
vegetation of the province. This matter represents the source value
for the terrestrial OM used in the mixing model. Mangrove and
seagrass leaves were collected during the trap deployment.
Plankton and suspended particulate matter (SPM) samples were
collected at a point believed to have the majority of oceanic
influence (7u52.5739N and 98u35.6359E) and taken as proxy for
oceanic matter. Plankton samples were collected with weighted
nets of mesh sizes 400 mm and SPM with a five 1-litre water
sample. The mean of the C and N content and d13C and d15 N
value of each POM source was taken as the respective end-
member to determine the contribution of each source to the OM
along the transect.
All solid samples (sediment and leaves) were placed in separate
sample bags, stored in a cooling box and transported immediately
to the field laboratory where they were dried at 60uC for 48 hours.
Water samples for SPM and plankton were filtered through pre-
combusted glass fiber filters (GF/F, 0.7 mm pore diameter). The
GF/F filters were dried at 60uC for 48 hours. Both solid material
(sediment and leaves) and GF/F filters were packed in airtight
containers and transported to the laboratory of Royal Netherlands
Institute for Sea Research (NIOZ) for elemental and isotope
analysis.
Elemental and isotope analysisSediment and leaf material samples were ground for homog-
enisation. The trap, plankton and SPM samples were acidified to
remove carbonates [23]; the leaf samples were not acidified. All
samples were analysed for total organic carbon (TOC), total
nitrogen (TN), and the isotopes d13C and d15N by means of
elemental analysis isotope ratio mass spectrometry (EA-IRMS)
using a Thermo Finnigan Flash 1112.
Stable isotope ratios are expressed as d values (%) relative to
conventional standards (VPDB limestone for C and atmospheric
N2 for N):
Export of Organic Material in the Tropical Coastal Zone
PLOS ONE | www.plosone.org 2 November 2014 | Volume 9 | Issue 11 | e111847

dX~ Xsample Xstandard
� �=Xstandard
� �� 1000ð Þ ð1Þ
where dX is either d13C or d15N; Xsample is the 13C/12C or15N/14N ratio of the sample; Xstandard is the 13C/12C or 15N/14N
ratio of the standards (0.01118 for C and 0.00368 for N).
Mixing modelWe considered the following potential sources (Table 1):
terrestrial vegetation (Delonix sp., Terminalia sp. and Hevea sp.),mangrove leaves (Rhizophora sp.), seagrass leaves (Enhalus sp.,Halodule sp. and Halophile sp.) and oceanic production (plankton
and SPM). Mean values were taken as end member for each
source (Table 1). Only SPM and trap samples were analysed with
the mixing model (as discussed below).
A linear mixing model was used to determine the contributions
of the different sources to the SPM and trap samples [24–25]. The
mixing model uses the means of d13C, d15N and the C:N ratios
(corrected for differences in %C and %N between sources) of
individual trap or SPM samples to determine the contribution (f) of
each of the four sources (Table 1) to the mixture. The variation
between replicates is small justifying the use of the means. The
mixing model has the following four equations that are solved
simultaneously to recover a unique solution of the four source
contributions (foce, fter, fman, f ):sea
focezfterzfmanzfsea~1 ð2Þ
Figure 1. Map showing location of the nine sampling sites (black circles) in Phang Nga Bay, southern Thailand. The white starrepresents the point oceanic samples where collected.doi:10.1371/journal.pone.0111847.g001
Export of Organic Material in the Tropical Coastal Zone
PLOS ONE | www.plosone.org 3 November 2014 | Volume 9 | Issue 11 | e111847
{
d13Cmix~d13Coce:focezd13Cter
:fterzd13Cman:fmanzd13Csea
:fsea
ð3Þ
d15Nmix~d15Noce:focezd15Nter
:fterzd15Nman:fmanzd15Nsea
:fsea
ð4Þ
0~ %Coce{CNmix:%Nocað Þ:focez %Cter{CNmix
:%Nterð Þ:fterz
%Cman{CNmix:%Nmanð Þ:fmanz %Csea{CNmix
:%Nseað Þ:fsea
ð5Þ
Where oce = oceanic, ter = terrestrial, man = mangrove trees
and sea = seagrass plants.The model was implemented and solved
in R [26], using the lsei function available in the LIM package
[27]. Using the contribution for each source as returned by the
mixing model, we calculated if each source was under-contributing
or over-contributing compared to its relative surface:
Fx=Afx ð6Þ
This index was not calculated for POM derived from oceanic
sources, because no representative surface area for the ‘ocean’
could be defined. The contribution (Fx; %) per source in each
sample was then divided by the percent of total surface area (Afx)
occupied by the particular system (catchment area-terrestrial,
mangrove forest, seagrass bed). This gives a dimensionless
number, for which 1 implies that the ecosystem contributes
proportionally to its relative surface area; values below or above 1
indicates that the proportional contribution is lower or higher,
respectively.
Statistical analysisFrom the results of equation 6 we used step-wise regression
analysis to determine if the contribution of each resource was
related to relevant physical aspects of the nine sites. For this
analysis we only used the mixing model results at 0 and 100 m
along the transect, as data for these distances were available across
all nine sites. Contributions from terrestrial, mangrove and
seagrass to SPM and trap samples were correlated with physical
attributes of each site. The mangrove contribution was tested
against area of mangrove forest (m2), area of bay (m2),
urbanisation in the catchment area (%) and width of mangrove
forest (m) (Table 2). Terrestrial contribution was analysed against
catchment area (m2), area of bay (m2) and urbanisation in the
catchment area (%) (Table 2). Finally, seagrass was tested with
area of the seagrass bed (m2), area of bay (m2) and urbanisation in
the catchment area (%) (Table 2).
The physical characteristics (bay area, bay width/length),
surface areas of the mangrove forests and seagrass beds were
determined with ground truthing during the sampling campaign.
Land use in the catchment area, width of the bay, and length of
the bay were determined by analysing Quickbird, WorldView-1
and WorldView-2 satellite imagery. All statistical analysis was
completed in R [26], where probabilities (p) ,0.05 were
considered significant.
Results
All samples (both trap and SPM) along the gradient showed
different contributions of the different sources of OM (Figure 2).
At sites A and B, the signatures for the majority of samples were
between those of terrestrial, mangrove and oceanic sources
(Figure 2). The trap sample signatures from sites C and I were
spread from seagrass to the oceanic end members (Figure 2). At
sites D and F, the trap and SPM samples indicated a pattern from
terrestrial and mangrove sources to the mid-point between all the
sources (Figure 2). The majority of site E trap samples similarly
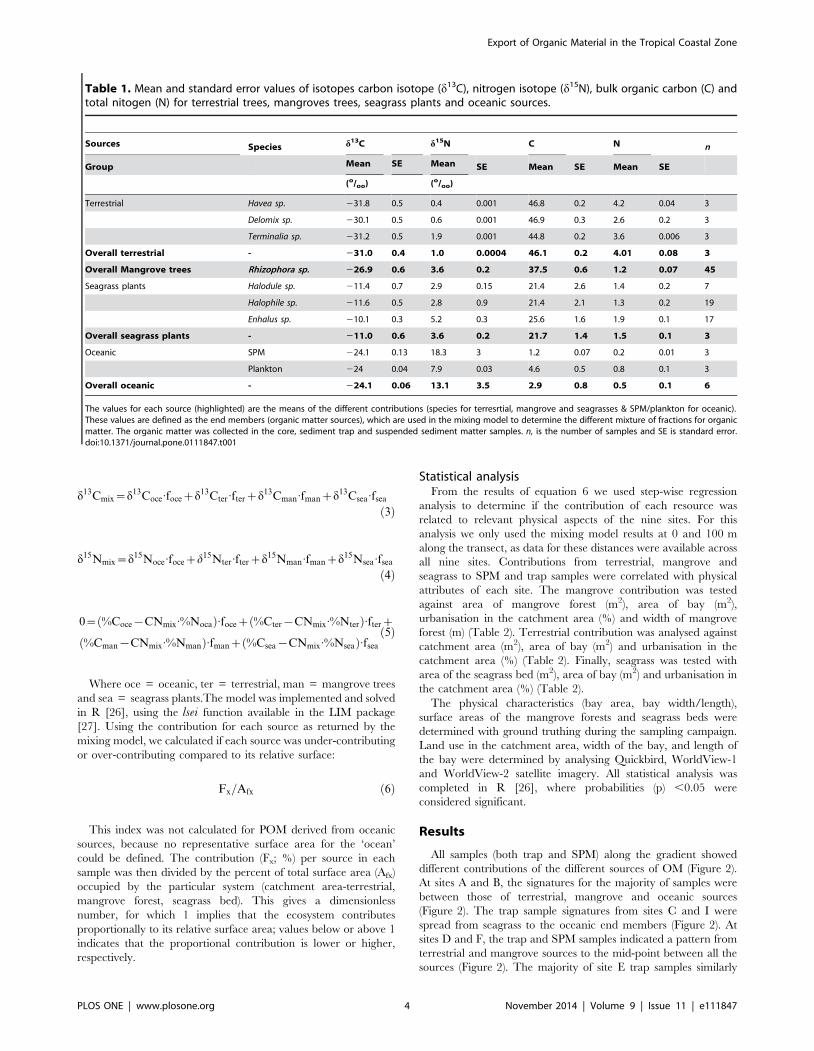
Table 1. Mean and standard error values of isotopes carbon isotope (d13C), nitrogen isotope (d15N), bulk organic carbon (C) andtotal nitogen (N) for terrestrial trees, mangroves trees, seagrass plants and oceanic sources.
Sources Species d13C d15N C N n
Group Mean SE Mean SE Mean SE Mean SE
(o/oo) (o/oo)
Terrestrial Havea sp. 231.8 0.5 0.4 0.001 46.8 0.2 4.2 0.04 3
Delomix sp. 230.1 0.5 0.6 0.001 46.9 0.3 2.6 0.2 3
Terminalia sp. 231.2 0.5 1.9 0.001 44.8 0.2 3.6 0.006 3
Overall terrestrial - 231.0 0.4 1.0 0.0004 46.1 0.2 4.01 0.08 3
Overall Mangrove trees Rhizophora sp. 226.9 0.6 3.6 0.2 37.5 0.6 1.2 0.07 45
Seagrass plants Halodule sp. 211.4 0.7 2.9 0.15 21.4 2.6 1.4 0.2 7
Halophile sp. 211.6 0.5 2.8 0.9 21.4 2.1 1.3 0.2 19
Enhalus sp. 210.1 0.3 5.2 0.3 25.6 1.6 1.9 0.1 17
Overall seagrass plants - 211.0 0.6 3.6 0.2 21.7 1.4 1.5 0.1 3
Oceanic SPM 224.1 0.13 18.3 3 1.2 0.07 0.2 0.01 3
Plankton 224 0.04 7.9 0.03 4.6 0.5 0.8 0.1 3
Overall oceanic - 224.1 0.06 13.1 3.5 2.9 0.8 0.5 0.1 6
The values for each source (highlighted) are the means of the different contributions (species for terresrtial, mangrove and seagrasses & SPM/plankton for oceanic).These values are defined as the end members (organic matter sources), which are used in the mixing model to determine the different mixture of fractions for organicmatter. The organic matter was collected in the core, sediment trap and suspended sediment matter samples. n, is the number of samples and SE is standard error.doi:10.1371/journal.pone.0111847.t001
Export of Organic Material in the Tropical Coastal Zone
PLOS ONE | www.plosone.org 4 November 2014 | Volume 9 | Issue 11 | e111847

plotted in the centre of the sources; and sites C, E and I SPM
samples followed this pattern too (Figure 2). Terrestrial sources
dominated trap samples from sites G and H, but in the case of
SPM samples they where spaced between terrestrial and mangrove
end numbers and the oceanic end number (Figure 2).
The mixing model determined the fraction of each source end-
member (mangrove and seagrass plants, terrestrial and oceanic) in
the mean of 2–3 individual sediment traps and SPM samples for
the three sites (Table 3). The majority of SPM samples (for sites B,
C, D, F, G, H and I) showed a spatial pattern for oceanic sources,
where the oceanic source contribution increased from 0 m to the
end of the transect (Table 3). This pattern (for oceanic sources)
was similarly repeated in six of the trap samples (sites A, B, C, D, F
and I) (Table 3). The bulk of mangrove plant contributions for
SPM samples showed a spatial pattern where the source influence
decreased with distance from 0 m to the end of the transect (B, C,
D, E, F, G, I). This same pattern was seen in the trap samples (A,
B, C, D, E, H and I) (Table 3). Only approximately half of
terrestrial plant contributions for SPM samples showed a gradient
through the transect (C, D, H and I) (Table 3). However, over half
of trap samples (A, B, C, D, G and I) did show a spatial pattern,
where terrestrial plant contribution was higher nearer the
landward side of the transect (Table 3). The seagrass contribution
was highest in the seagrass beds for SPM samples at sites A, B, F
and for trap samples at sites E and F (Figures 3, 4 and Table 3).
The remainder of the trap and SPM samples showed no spatial
pattern in the seagrass plant contribution (Figures 3, 4 and
Table 3). For SPM samples, variation of contributions across the
transect was very small (0.8–6%); and this was repeated for trap
samples (0.5–12%) (Table 3).
Step-wise regression indicated only two significant correlations.
A negative correlation between terrestrial trap contributions (y)
and catchment area (x) at 100 m (y = 20.78x+27.2, R2 = 0.5,
p = 0.04) and a positive correlation were shown for mangrove
contribution to trap samples at 0 m contributions with width of
mangrove forest (y = 12.8x+2.8, R2 = 0.6, p = 0.03).
Discussion
This study was designed to clarify the origin and exchange of
different OM sources within tropical coastal waters. Despite the
high local primary production in mangrove and seagrass stands,
we found that oceanic sources dominated trap and SPM samples
along the entire transect. The mixing model results however
showed that mangrove forests and terrestrial sources did contrib-
ute, especially to the trap samples. Interestingly we found a
correlation between the width of the mangrove forest and their
contribution, which provides new insights into physical processes
(such as exposure to hydrodynamics) associated with mangrove
outwelling.
However when taking into account the relative size of the
ecosystem (mangrove forest, catchment area and seagrass beds) we
found that seagrass beds, although occupying the smallest area of
all the potential sources, contributed significantly to the OM in
stations along land- to seaward transects. This provides further
evidence of their importance as a nutrient (dissolved and
particulate) source in the tropical coastal seascape. Before moving
to the implications of these findings, we first discuss the sampling
and modeling approach that we undertook.
Source contributions to organic matterMixing models are often used to estimate contributions to a
mixture [24–25]. Some samples could not be solved with the
model, which indicates that they violate some of the implicit
assumptions of the linear mixing model formulation, such as
imprecise measurement of end-members values, the existence of
unidentified sources, or degradation processes that have altered
the isotope or C:N ratio of the OM. For our study site, we are
confident that we included the dominant POM sources in our
design and the end-member values were consistent and estimated
with a low uncertainty (Table 1). We therefore believe that the few
samples that fell outside the mixing polygons (Figure 2) had
already undergone substantial biogeochemical modification that
lead to a decrease of d15N values and/or N content through
mineralization and denitrification [4,28]. We think that the trap
samples that fell out of the end-member polygon contained
predominantly re-suspended bottom sediment (not unlikely given
the close proximity to the sediment). Re-suspension of bottom
sediment is a potential source of matter caught in the trap that had
been subjected to biogeochemical modification.
There was a strong oceanic signal in the trap samples for the
nine sites, suggesting that oceanic-derived OM settled out
(Figure 2). The SPM and trap samples indicated a substantial
oceanic input, which is in agreement with previously studies on
coastal wetlands [29–30]. The OM of the trap samples at sites A,
B, G and H showed a strong contribution from mangrove sources.
These sites have large channels coming from the inner mangrove
area, which may explain the increased contribution of mangrove
OM. Sites G, H and I trap samples within the seagrass bed show
an strong inclination towards the seagrass plant end-member and
Table 2. Physical description of the sites and the physical attributes of the marine ecosystems for each of the nine sites (A to I) andtheir associated bay.
Physical attributes Site
A B C D E F G H I
Urbanized area (km2) 1.4 1.4 0.9 0.4 0.1 0.1 0.6 0.7 5.8
Mangrove forest area (km2) 3.3 3.3 10 0.6 7.5 3.2 2 9 4.7
Catchment area (km2) 29.6 29.6 3 0.2 0.6 0.7 1.5 2.1 0.4
Seagrass bed area (km2) 1 0.5 0.1 0.3 0.8 0.04 0.8 0.9 0.8
Width of bay (km) 0.97 0.97 NA 1.77 1.44 3.76 1.22 2 2
Length of bay (km) 1.47 1.47 NA 1.11 0.72 3.31 2.94 1.06 1.06
Width of mangrove forest (km) 3.4 3.4 0.06 0.71 1.18 0.89 1.84 0.96 0.31
NA means that these sites are situated in an open coast, all other sites are bays.doi:10.1371/journal.pone.0111847.t002
Export of Organic Material in the Tropical Coastal Zone
PLOS ONE | www.plosone.org 5 November 2014 | Volume 9 | Issue 11 | e111847

Figure 2. Carbon (d13C o/oo) and nitrogen (d15N o/oo) isotopic composition for organic matter from trap and suspended particulatematter (SPM) samples. The end members shown are: white circles represent the terrestrial value; white squares represent oceanic sources; whitetriangles represent seagrass plants; and white diamonds are mangrove trees. The trap and SPM samples are represented by crosses and black circles,respectively. Values for the end members are means (+/2 SE). For the end members of the oceanic, terrestrial, seagrass plants and mangrove plantssources, n = 6, 9, 44 and 45, respectively. Note that this is a 2-dimensional representation of isotope values only. Table 3 shows results using all threecomponents, i.e. carbon, nitrogen isotopes and C:N ratios.doi:10.1371/journal.pone.0111847.g002
Export of Organic Material in the Tropical Coastal Zone
PLOS ONE | www.plosone.org 6 November 2014 | Volume 9 | Issue 11 | e111847
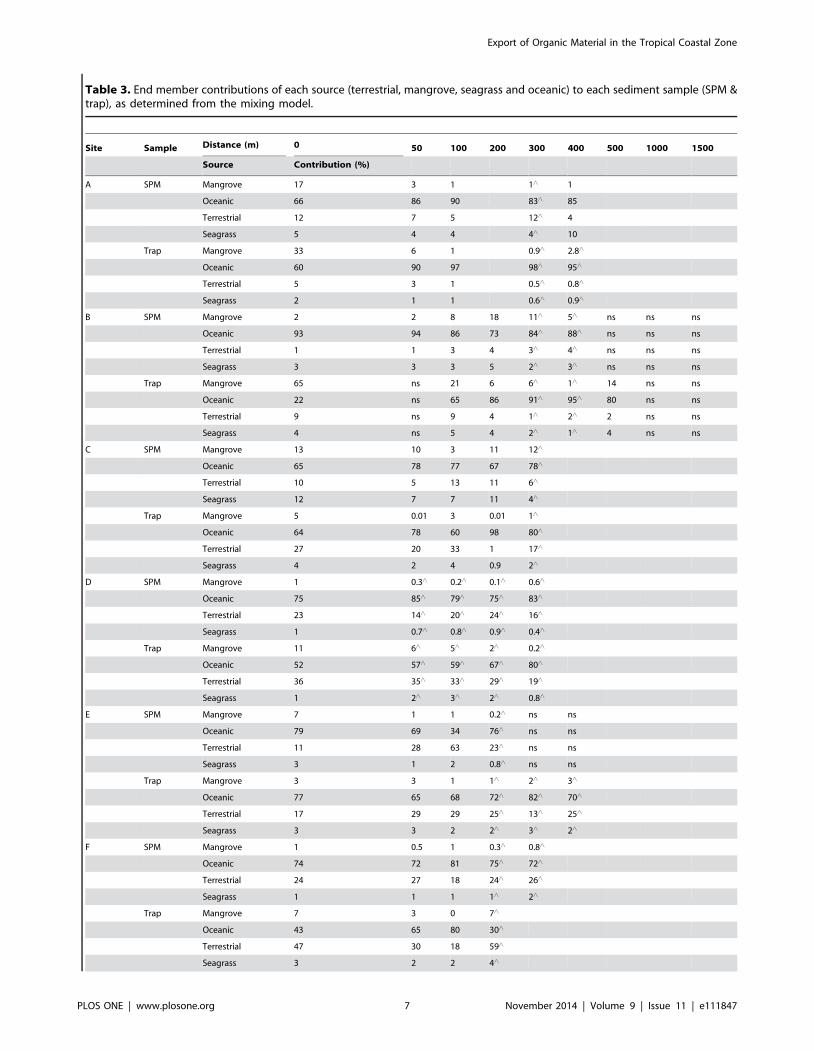
Table 3. End member contributions of each source (terrestrial, mangrove, seagrass and oceanic) to each sediment sample (SPM &trap), as determined from the mixing model.
Site Sample Distance (m) 0 50 100 200 300 400 500 1000 1500
Source Contribution (%)
A SPM Mangrove 17 3 1 1‘ 1
Oceanic 66 86 90 83‘ 85
Terrestrial 12 7 5 12‘ 4
Seagrass 5 4 4 4‘ 10
Trap Mangrove 33 6 1 0.9‘ 2.8‘
Oceanic 60 90 97 98‘ 95‘
Terrestrial 5 3 1 0.5‘ 0.8‘
Seagrass 2 1 1 0.6‘ 0.9‘
B SPM Mangrove 2 2 8 18 11‘ 5‘ ns ns ns
Oceanic 93 94 86 73 84‘ 88‘ ns ns ns
Terrestrial 1 1 3 4 3‘ 4‘ ns ns ns
Seagrass 3 3 3 5 2‘ 3‘ ns ns ns
Trap Mangrove 65 ns 21 6 6‘ 1‘ 14 ns ns
Oceanic 22 ns 65 86 91‘ 95‘ 80 ns ns
Terrestrial 9 ns 9 4 1‘ 2‘ 2 ns ns
Seagrass 4 ns 5 4 2‘ 1‘ 4 ns ns
C SPM Mangrove 13 10 3 11 12‘
Oceanic 65 78 77 67 78‘
Terrestrial 10 5 13 11 6‘
Seagrass 12 7 7 11 4‘
Trap Mangrove 5 0.01 3 0.01 1‘
Oceanic 64 78 60 98 80‘
Terrestrial 27 20 33 1 17‘
Seagrass 4 2 4 0.9 2‘
D SPM Mangrove 1 0.3‘ 0.2‘ 0.1‘ 0.6‘
Oceanic 75 85‘ 79‘ 75‘ 83‘
Terrestrial 23 14‘ 20‘ 24‘ 16‘
Seagrass 1 0.7‘ 0.8‘ 0.9‘ 0.4‘
Trap Mangrove 11 6‘ 5‘ 2‘ 0.2‘
Oceanic 52 57‘ 59‘ 67‘ 80‘
Terrestrial 36 35‘ 33‘ 29‘ 19‘
Seagrass 1 2‘ 3‘ 2‘ 0.8‘
E SPM Mangrove 7 1 1 0.2‘ ns ns
Oceanic 79 69 34 76‘ ns ns
Terrestrial 11 28 63 23‘ ns ns
Seagrass 3 1 2 0.8‘ ns ns
Trap Mangrove 3 3 1 1‘ 2‘ 3‘
Oceanic 77 65 68 72‘ 82‘ 70‘
Terrestrial 17 29 29 25‘ 13‘ 25‘
Seagrass 3 3 2 2‘ 3‘ 2‘
F SPM Mangrove 1 0.5 1 0.3‘ 0.8‘
Oceanic 74 72 81 75‘ 72‘
Terrestrial 24 27 18 24‘ 26‘
Seagrass 1 1 1 1‘ 2‘
Trap Mangrove 7 3 0 7‘
Oceanic 43 65 80 30‘
Terrestrial 47 30 18 59‘
Seagrass 3 2 2 4‘
Export of Organic Material in the Tropical Coastal Zone
PLOS ONE | www.plosone.org 7 November 2014 | Volume 9 | Issue 11 | e111847

this, indicates that the seagrass canopy traps seagrass OM [10,31–
32].
Landscape patterns of organic matter fluxesTerrestrial-derived organic material showed an under contri-
bution relative to the size of the catchment area. Different land
uses may donate particulate and dissolved nutrients to downstream
mangrove forests, but it is plausible that mangrove forests trap
much of the nutrients that are flowing into them [33–34]. The
negative correlation between catchment area and terrestrial OM is
a data artefact. This has occurred due to sites A and B having
catchment areas that are an order of magnitude bigger than the
others, conversely sites A and B display a minor terrestrial
contribution thus these two sites skew the correlation.
Mangrove derived organic matter contributed in proportion to
their surface area. The latter finding may be surprising because
mangrove forests are known to have a high productivity [7–8].
However, mangrove forests are also known to retain much of their
POM and associated nutrients within the forests due to retention
mechanisms as supported by other studies [33–35]. Our results
indicate that the magnitude of outwelling of OM at the mangrove
boundary (0 m) is correlated with the sea-facing width of the
mangrove forest and therefore the extent that the forest is exposed
to waves. Waves have been shown to decrease the trapping
capacity of mangrove roots and therefore increase the transport of
POM through mangrove roots [34]. The shape of the mangrove
forest may have a strong influence on retention of POM. This
suggests that mangrove forests that are distributed thinly along a
coastline or large delta would export more POM because of their
extensive frontal width, which is exposed to greater levels of
hydrodynamic energy. In contrast, mangrove forests that extend
inland or within protected bays may retain much of their POM
and other sources of nutrients (dissolved and particulate) flowing
into them. Our study sites are a mixture of these two categories
category (Figure 1).
If one compares the potential amount of influx of OM sources
in relation to their areal extent, seagrass is ‘‘relatively’’ a much
more important source than mangrove forests or terrestrial sources
(Figures 3 and 4). If seagrass beds are an important source of OM
they may donate this material to other ecosystems and organisms.
For example, stony corals have been found to assimilate
particulate seagrass as a food source [36] and seagrass leaves are
known to be an important food source for herbivore organisms
[40]. No relationships were found between seagrass plant
contribution and physical factors: hence there may be another
controlling factor that has not been measured in the present study.
Local hydrodynamics are a potential one. Indeed, as turbulence
and wave energy can be a structuring factor in seagrass habitats.
For instance, waves with an overlaying current have been found to
Table 3. Cont.
Site Sample Distance (m) 0 50 100 200 300 400 500 1000 1500
Source Contribution (%)
G SPM Mangrove 1.0 ns 1.6 ns ns 1.3‘ 1‘
Oceanic 74 ns 80 ns ns 94‘ 71‘
Terrestrial 17 ns 12 ns ns 2‘ 19‘
Seagrass 8 ns 6 ns ns 3‘ 9‘
Trap Mangrove 26 30 24 32 38‘
Oceanic 62 34 50 41 40‘
Terrestrial 5 17 10 9 6‘
Seagrass 7 19 16 18 16‘
H SPM Mangrove 1 6 9 11 7 15 22‘ 15‘
Oceanic 68 58 54 56 75 71 67‘ 74‘
Terrestrial 23 25 24 20 7 4 3‘ 1‘
Seagrass 8 11 13 13 11 10 8‘ 10‘
Trap Mangrove 20 ns 20 ns ns ns 16‘ 8‘ 7
Oceanic 48 ns 23 ns ns ns 31‘ 58‘ 40
Terrestrial 17 ns 34 ns ns ns 29‘ 19‘ 34
Seagrass 15 ns 23 ns ns ns 24‘ 15‘ 19
I SPM Mangrove 6 4 5 1 6 ns 4‘ 1‘
Oceanic 69 77 71 72 72 ns 76‘ 82‘
Terrestrial 14 11 11 14 10 ns 13‘ 10‘
Seagrass 11 8 13 13 13 ns 7‘ 7‘
Trap Mangrove 22 ns 9 10 3 4‘ 2‘ 3‘
Oceanic 59 ns 68 62 71 71‘ 84‘ 77‘
Terrestrial 6 ns 10 12 15 8‘ 5‘ 8‘
Seagrass 13 ns 13 16 11 17‘ 9‘ 12‘
Distance (m) represents the distance along the transect from land (0 m) to the ocean for each site. SPM and trap are sample type, SPM is suspended particulate mattertaken from the water column. (ns) means that the model did not find a solution. (‘) represents sediment trap and SPM samples located in seagrass beds. Blank spacesindicate that no samples were collected.doi:10.1371/journal.pone.0111847.t003
Export of Organic Material in the Tropical Coastal Zone
PLOS ONE | www.plosone.org 8 November 2014 | Volume 9 | Issue 11 | e111847
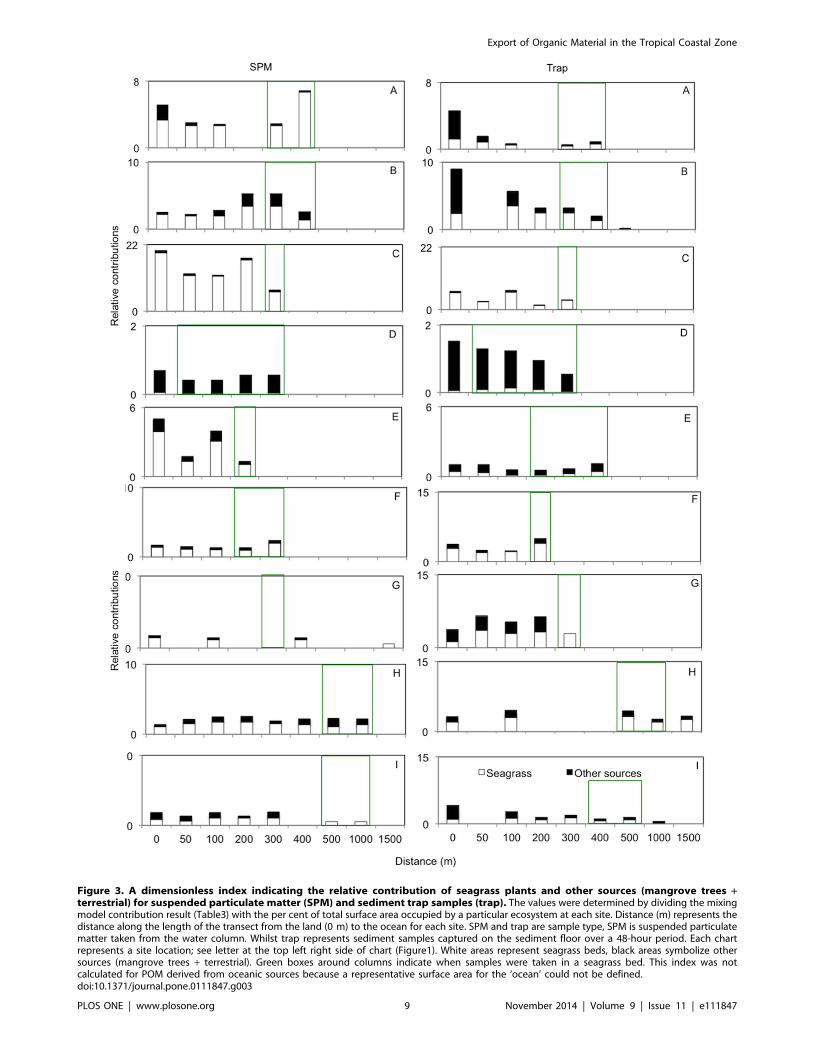
Figure 3. A dimensionless index indicating the relative contribution of seagrass plants and other sources (mangrove trees +terrestrial) for suspended particulate matter (SPM) and sediment trap samples (trap). The values were determined by dividing the mixingmodel contribution result (Table3) with the per cent of total surface area occupied by a particular ecosystem at each site. Distance (m) represents thedistance along the length of the transect from the land (0 m) to the ocean for each site. SPM and trap are sample type, SPM is suspended particulatematter taken from the water column. Whilst trap represents sediment samples captured on the sediment floor over a 48-hour period. Each chartrepresents a site location; see letter at the top left right side of chart (Figure1). White areas represent seagrass beds, black areas symbolize othersources (mangrove trees + terrestrial). Green boxes around columns indicate when samples were taken in a seagrass bed. This index was notcalculated for POM derived from oceanic sources because a representative surface area for the ‘ocean’ could not be defined.doi:10.1371/journal.pone.0111847.g003
Export of Organic Material in the Tropical Coastal Zone
PLOS ONE | www.plosone.org 9 November 2014 | Volume 9 | Issue 11 | e111847

Figure 4. Dimensionless index indicating the relative contribution of terrestrial, mangrove and seagrass sources for suspendedparticulate matter (SPM) and sediment trap samples (trap), plotted in a stacked column chart. Distance (m) represents the distancealong the length of the transect from the land (0 m) to the ocean for each site. SPM and trap are sample type, SPM is suspended particulate mattertaken from the water column. Whilst trap represents sediment samples captured on the sediment floor over a 48 hour period. Each chart represents asite location, see letter at top left right side of chart (Figure 1). White areas represent seagrass beds, grey and black areas symbolise mangrove forestsand terrestrial sources respectively. Green boxes around columns indicate when samples were taken in a seagrass bed. This index was not calculatedfor POM derived from oceanic sources, because no representative surface area for the ‘ocean’ could be defined.doi:10.1371/journal.pone.0111847.g004
Export of Organic Material in the Tropical Coastal Zone
PLOS ONE | www.plosone.org 10 November 2014 | Volume 9 | Issue 11 | e111847
increase litter movement through seagrass beds [34]. Herbivores
digesting the seagrass plants and transferring nutrients via faeces
across the tropical coastal seascape [37–39] may be another
undetected factor.Approximately one quarter of the samples showed a higher
seagrass contribution within the bed but otherwise, the seagrass
contribution seemed unrelated to the distance from or within
the seagrass bed (Figures 3 and 4). This indicates that seagrasses
have a spatially extended influence beyond the physical
boundaries of the bed. Although the mechanisms are still
unknown of what controls seagrass contribution, our results clearly
show that seagrasses are a important contributor of organic
matter in the tropical seascape of Phangnga bay relative to their
spatial coverage.
Future Perspective and Management ImplicationsThe high oceanic contribution (Table 3) shows how important
oceanic derived nutrients are to ecosystems and organisms in these
locations. We reason that this may be because of the high tidal
flushing in all of our sites allowing for a large exchange of water.
This could have implications for pollutants from industries such as
fish farms being easily flushed into seagrass beds or mangrove
forests from this tidal exchange.
Terrestrial input had the smallest contribution to the OM
(Figure 3 and Figure 4). The differences in urbanizations across
the 9 sites showed no significant correlation with terrestrial derived
OM. Additionally, mangrove forests were not found to be an
important input for OM in the coastal zone, compared to oceanic
or seagrass organic matter. Recent research has found that
mangrove forests may be an effective POM trap and therefore a
strong nutrient sink [34]. Mangrove forests are effective filters,
allowing them to retain most nutrients fluxes from terrestrial
sources. For this reason the integrity and a critical size of the forest
should always be ensured. Although many mangroves have been
reduced in aerial extent in the Phuket region of Thailand, our
results indicate that, though impoverished, mangroves may still
maintain important ecosystem services of retaining mangrove and
terrestrial derived nutrients in this region. However, continued
deforestation or non-sustainable use of the forests may jeopardize
this function.
An important consideration is that changes in mangrove forest
aerial extent or biomass could reduce buffering and therefore
increase the flux of terrestrial-derived nutrients to the coastal
waters. This in turn could cause nutrient enrichment or increased
turbidity for seagrass beds, causing physiological problems for the
seagrass plants that could reduce the area and biomass of this
ecosystem [42]. We have shown that seagrass beds are a
comparatively large source of POM for adjacent ecosystems.
However, seagrass beds can become unstable, for example
following eutrophication [41] or hurricane damage [15]. This
instability could have implications for the productivity of the
seagrass beds and thus, their role as a nutrient source for other
ecosystems and organisms could be affected. These alterations to
the integrity of the system could have consequences on their
ecosystem function as a nutrient sink or buffer for excess nutrients
for sensitive adjacent ecosystems such as coral reefs. Therefore, a
key role in management of these areas is to ensure the health and
physical/physiological structure of seagrass beds. Both factors
(health and physical/physiological structure of beds) can be related
to quantities of POM being trapped and outwelled [41,43].
This study provides further evidence that the existence of
connective particulate fluxes, which occur between ecosystems in
the tropical coastal seascape, do exist. These connections could
have implications for strengthening management especially from
an ecosystem-based perspective.
Author Contributions
Conceived and designed the experiments: LG Gillis: principle author, data
collection and analyses. AD Ziegler: daily supervision of paper, D Van
Oevelen: data analyses and feedback on paper, C. Cathalot: data
collection, analyses and feedback on paper, JW Wolters: data collection
and analyses, PMJ Herman: feedback on paper and idea, TJ Bouma:
perceived idea, daily supervision. Performed the experiments: LGG CC
JWW. Analyzed the data: LGG DVO CC JWW. Contributed reagents/
materials/analysis tools: LGG DVO CC. Wrote the paper: LGG ADZ
DVO CC PMJ TJB. Principal author: LGG. Data collection: LGG CC
JWW. Daily supervision of paper: ADZ TJB. Feedback on paper: DVO
CC. Feedback on paper and idea: PMJH. Perceived idea: TJB.
References
1. Barbier EB, Hacker SD, Kennedy C, Koch EW, Stier AC, et al. (2011) The
value of estuarine and coastal ecosystem services. Ecol Monog 81(2): 169–193.
2. Gattuso JP, Frankignoulle M, Wollast R (1998) Carbon and carbonate
metabolism in coastal aquatic ecosystems. Annu Rev Ecol Syst 29: 405–434.
3. Krusche AV, Martinelli LA, Victoria RL, Bernardes M, de Camargo PB, et al.
(2002) Compoistion of particulate and dissolved organic matter in a disturbed
watershed of souteast Brazil (Piracicaba River basin). Wat Res 36: 2743–2752.
4. Kuramoto T, Minagawa M (2001) Stable carbon and nitrogen isotopic
characterization of organic matter in a mangrove eocystem on the southwestern
coast of Thailand. 2001. J Oceanogr 57: 421–431.
5. Thimdee W, Deein G, Sangrungruang C, Nishioka J, Matsunaga K (2003)
Sources and fate of organic matter in Khung Krabaen Bay (Thailand) as traced
by d13C and C/N atomic ratios. Wetlands 23(4): 739–738.
6. Meksumpun S, Meksumpun C, Hoshika A, Mishima Y, Tanimoto T (2005)
Stable carbon and nitrogen isotope ratios of sediment in the gulf of Thailand:
Evidence for understanding of marine environment. Cont Shelf Res 25: 1905–
1915.
7. Odum EP (1968) A research challenge: evaluating the productivity of coastal and
estuarine water. In Proceedings of the Second Sea grant Conference, University
of Rhode Island, Kingston, USA: 63–64.
8. Lee SY (1995) Mangrove outwelling- A Review. Hydrobiologia 295(1–3): 203–
212.
9. Terrados J, Duarte CM (2000) Experimental evidence of reduced particle
resuspension within a seagrass (Posidonia oceanica L.) meadow. J Exp Mar Biol
Ecol 243: 45–53.
10. Vonk JA, Middelburg JJ, Stapel J, Bouma TJ (2008) Dissolved organic nitrogen
uptake by seagrasses. Limnol Oceanogr 53: 542–548
11. Fonseca MS, Cahalan JA (1992) A preliminary evaluation of wave attentuation
for four species of seagrass. Est Coast Shelf Sci 35: 565–576.
12. Hendriks IE, Sintes T, Bouma TJ, Duarte CM (2008) Experimental assessment
and modeling evaluation of the effects of the seagrass Posidonia oceanica on flow
and particle trapping. Mar Ecol Prog Ser 356: 163–173.
13. Hemminga MA, Marba N, Stapel J (1999) Leaf nutrient resorption, leaf lifespan
and the retention of nutrients in seagrass systems. Aquat Bot 65: 141–158.
14. Koch EW, Verduin JJ (2001) Measurements of physical parameters in seagrass
habitats. In Short FT, Short CA, Coles RG (Eds.). Global Seagrass Research
Methods. Amsterdam: Elsevier Science pp. 325–344.
15. Infantes E, Terrados J, Orfila A, Canellas B, Alvarez-Ellacuria A (2009) Wave
energy and the upper depth limit distribution of Posidonia oceanica. Bot Mar 52:
419–427.
16. Wilkie L, O’Hare MT, Davidson I (2012) Particle trapping and retention by
Zostera noltii: A flume and field study. Aquat Bot 102: 15–22.
17. Hemminga MA, Slim FJ, Kazungu J, Ganssen GM, Nieuwenhuize J, et al.
(1994) Carbon outwelling from a mangrove forest with adjacent seagrass beds
and coral reefs (Gazi Bay, Kenya). Mar Ecol Prog Ser 106(3): 291–301.
18. McConnachie JL, Petticrew EL (2006) Tracing organic matter sources in
riverine suspended sediment: Implications for fine sediment transfers. Geomor-
phology 79: 13–26.
19. Schindler Wildhaber Y, Liechti R, Alwell C (2012) Organic matter dynamics
and stable isotope signature as tracers of the sources of suspended sediment.
Biogeosciences 9: doi: 10.5194/bg-9-1985-2012.
20. Bouillon S, Dehairs F, Velimirov B, Abril G, Vieira Borges A (2007) Dynamics
of organic and inorganic carbon across contiguous mangrove and seagrass
Export of Organic Material in the Tropical Coastal Zone
PLOS ONE | www.plosone.org 11 November 2014 | Volume 9 | Issue 11 | e111847

Phang-nga bay, Thailand. Proceedings of the National Workshop on
Community-based Management. Phuket, Thailand (BOBP Report No 78):
85–120.
22. Woodroffe C (1992) Mangrove Sediments and Geomorphology. In: Robertson
AI and DM Alongi (eds.) Trophical Mangrove Ecosystems. American
Geophysical Union Washington, USA: 7–41.
23. Nieuwenhuize J, Maas EMY, Middelburg JJ (1994) Rapid analysis of organic
carbon and nitrogen in particulate materials. Mar Chem 45: 217–244.
24. Phillips DL, Gregg JW (2001) Uncertainty in source partioning using stablis
isotopes. Oecologia 127: 171–179.
25. Phillips DL, Koch PL (2002) Incorating concentration dependence in stable
isotope mixing modes. Oecologia 120: 114–125.
26. R Core Team (2012) R: A language and environment for statistical computing.
R Foundation for Statistical Computing, Vienna, Austria. ISBN 3-900051-07-0,
Available: http://www.R-project.org/. Accessed 2014 Oct 1.
27. Van Oevelen D, Van den Meersche K, Meysman F, Soetaert K, Middelburg JJ,
et al. (2010) Quantitative reconstruction of food webs using linear inverse
models. Ecosystems 13: 32–45.
28. Cline JD, Kaplan IR (1975) Isotopic fractionation of dissolved nitrate during
denitrification in the eastern tropical North Pacific Ocean. Mar Chem 3: 271–
299.
29. Dittmar T, Lara RJ (2001) Driving forces behind nutrient and organic matter
dynamics in a mangrove tidal creek in North Brazil. Est Coast Shelf Sci 52: 249–
259.
30. Hunsinger GB, Mitra S, Findlay SEG, Fischer DT (2010) Wetland-driven shifts
in suspended particulate organic matter compoistion of the Hudson River
estuary, New York. Limnol Oceanogr 55(4): 1653–1667.
31. Evrard V, Kiswara W, Bouma TJ, Middelburg JJ (2005) Nutrient dynamics of
seagrass ecosystems: N-15 evidence for the importance of particulate organic
matter and root systems. Mar Ecol Prog Ser 295: 49–55.
32. Van Engeland T, Bouma TJ, Morries EP, Brun FG, Peralta G, et al. (2011)
Potential uptake of dissolved organic matter by seagrasses and macroalage. MarEcol Prog Ser 427: 71–81.
33. Alongi DM (1990) Effect of mangrove detrital outwelling on nutrient
regeneration and oxygen fluxes in coastal sediments of the central-greater-barrier-reef lagoon. Est Coast Shelf Sci 31(5): 581–598.
34. Gillis LG, Bouma TJ, Kiswara W, Ziegler AD, Herman PMJ (2014) Leaftransport in mimic mangrove forests and seagrass beds. Mar Ecol Prog Ser 498:
95–102.
35. Bouillon S, Borges AV, Castaneda-Moya E, Diele K, Dittmar T, et al. (2008)Mangrove production and carbon sinks: A revision of global budget estimates.
Global Biogeochem cycles 22, doi: 10.1029/2007GB003052.36. Lai S, Gillis LG, Mueller C, Bouma TB, Guest JR, et al. (2013) First
experimental evidence of corals feeding on seagrass matter. Coral Reefs 32 (4):1061–1064.
37. Krumme U (2009) Dial and Tidal Movements by Fish and Decapods Linking
Tropical Coastal Ecosystems. In: Nagelkerken I (Ed.). Ecological Connectivityamong Tropical Coastal Ecosystems, Springer Netherlands: 271–324.
38. Forward RB, Tankersley RA (2001) Selective tidal-stream transport of marineanimals. Oceanogr Mar Biol 39: 305–353.
39. Kimirei IA, Nagelkerken I, Mgaya YD, Huijbers CM (2013) The Mangrove
Nursery Paradigm Revisited: Otolith Stable Isotopes Support Nursery-to-ReefMovements by Indo-Pacific Fishes. PLOS ONE 8 (6): e66320.
40. Heck KL, Valentine JF (2006) Plant-herbivore interactions in seagrass meadows.J Exp Mar Biol 330: 420–436.
41. Burkholder JM, Tomasko DA, Touchette BW (2007) Seagrasses andeutrophication. J Exp Mar Biol Ecol 350(1–2): 46–72.
42. Todd PA, Ong XY, Chou LM (2010) Impacts of pollution on marine life in
Southeast Asia. Biodiversity Conserv 19: 1063–1082.43. Perez M, Invers O, Ruiz JM, Frederiksen MS, Holmer M (2007) Physiological
responses of the seagrass Posidonia oceanica to elevated organic matter contentin sediments: An experimental assessment. J Exp Mar Biol Ecol 344: 149–160.
Export of Organic Material in the Tropical Coastal Zone
PLOS ONE | www.plosone.org 12 November 2014 | Volume 9 | Issue 11 | e111847
21. Limpsaichol P, Khotiattiwong S, Bussarwait N, Sojisuporn P (1998) Environ-
mental factors influencing the health and productivity of Phang-nga Bay. In
Nickerson D. J. (Ed.) 1992: Community-based fisheries management in the
systems (Gazi Bay, Kenya). J Geophys Res G02018, doi:10.1029/
2006JG000325.