Time-varying Integration in European Government Bond Markets
21
European Financial Management, Vol. 20, No. 2, 2014, 270–290 doi: 10.1111/j.1468-036X.2011.00633.x Time-varying Integration in European Government Bond Markets Pilar Abad Economic Analysis Department, University Rey Juan Carlos and RFA-IREA, Madrid, 28032, Spain E-mail: [email protected] Helena Chuli´ a Department of Econometrics, University of Barcelona and RFA-IREA, Barcelona, 08034, Spain E-mail: [email protected] Marta G´ omez-Puig Department of Economic Theory, University of Barcelona and RFA-IREA, Barcelona, 08034, Spain E-mail: [email protected] Abstract Bond market integration clearly changes in response to economic and financial conditions, since the level of risk aversion changes and investors require time- varying compensation for accepting a risky payoff from financial assets. In this paper we examine the dynamic behaviour of European Government bond market integration using an asset pricing model based on that of Bekaert and Harvey (1995). Our sample period begins in 2004, after a period of calm and tranquillity, and ends in 2009, with a significant widening of sovereign bond spreads. Our results show evidence of time-varying level of integration for all European countries and suggest that, from the beginning of the financial market tensions in August 2007, markets moved towards higher segmentation, and the differentiation of country risk factors increased substantially across countries. However, the impact of the financial and economic crisis has been much more harmful for EMU members’ sovereign bond markets, since it has prompted an important backward step in their integration process. Keywords: Monetary Union, sovereign securities markets, bond market integration JEL classification: E44, F36, G15 The authors thank the editor, an anonymous referee, and participants at the XII Conference on International Economics, the 2011 EFMA Annual Meetings and the 26th Congress of the European Economic Association for helpful comments and suggestions. All errors and omissions are our own. Pilar Abad and Helena Chuli´ a acknowledge financial support from Fundaci´ on Ramon Areces. This paper is based upon work supported by the Government of Spain and FEDER under grants number ECO2010-21787-C03-01, ECO2008-02752/ECON and ECO2009-14457-C04-04. A version of this paper has been previously published as a working paper n ◦ 611/2011 in the Working Paper Series of Fundaci´ on de las Cajas de Ahorros (FUNCAS). C 2011 Blackwell Publishing Ltd
-
Upload
independent -
Category
Documents
-
view
0 -
download
0
Transcript of Time-varying Integration in European Government Bond Markets
European Financial Management, Vol. 20, No. 2, 2014, 270–290doi: 10.1111/j.1468-036X.2011.00633.x
Time-varying Integration in EuropeanGovernment Bond Markets
Pilar AbadEconomic Analysis Department, University Rey Juan Carlos and RFA-IREA, Madrid, 28032, SpainE-mail: [email protected]
Helena ChuliaDepartment of Econometrics, University of Barcelona and RFA-IREA, Barcelona, 08034, SpainE-mail: [email protected]
Marta Gomez-PuigDepartment of Economic Theory, University of Barcelona and RFA-IREA, Barcelona, 08034, SpainE-mail: [email protected]
Abstract
Bond market integration clearly changes in response to economic and financialconditions, since the level of risk aversion changes and investors require time-varying compensation for accepting a risky payoff from financial assets. Inthis paper we examine the dynamic behaviour of European Government bondmarket integration using an asset pricing model based on that of Bekaertand Harvey (1995). Our sample period begins in 2004, after a period of calmand tranquillity, and ends in 2009, with a significant widening of sovereign bondspreads. Our results show evidence of time-varying level of integration for allEuropean countries and suggest that, from the beginning of the financial markettensions in August 2007, markets moved towards higher segmentation, and thedifferentiation of country risk factors increased substantially across countries.However, the impact of the financial and economic crisis has been much moreharmful for EMU members’ sovereign bond markets, since it has prompted animportant backward step in their integration process.
Keywords: Monetary Union, sovereign securities markets, bond market integration
JEL classification: E44, F36, G15
The authors thank the editor, an anonymous referee, and participants at the XII Conferenceon International Economics, the 2011 EFMA Annual Meetings and the 26th Congress ofthe European Economic Association for helpful comments and suggestions. All errors andomissions are our own. Pilar Abad and Helena Chulia acknowledge financial support fromFundacion Ramon Areces. This paper is based upon work supported by the Government ofSpain and FEDER under grants number ECO2010-21787-C03-01, ECO2008-02752/ECONand ECO2009-14457-C04-04. A version of this paper has been previously published as aworking paper n◦ 611/2011 in the Working Paper Series of Fundacion de las Cajas de Ahorros(FUNCAS).
C© 2011 Blackwell Publishing Ltd

Time-varying Integration in European Government Bond Markets 271
1. Introduction
Since the introduction of the single currency, euro area monetary policy authorities havehad a keen interest in the integration and efficient functioning of the financial systemin Europe, especially in European and Monetary Union (EMU) countries.1 Indeed,financial integration is of key importance for the application of the single monetarypolicy and for financial stability, and improves access to financial markets. However, itis worth noting that a high degree of financial integration may decrease the opportunityfor risk diversification and raise the likelihood of spillover effects and contagion, as thesovereign debt crisis in the eurozone has revealed.
In this paper, we will continue the analysis presented in Abad et al. (2010, ACGP 2010hereafter) and focus our attention on bond market integration in the European Union(EU). The main objective of our previous paper was to study whether the introductionof the euro had had an impact on the degree of integration of EU-15 government bondmarkets. Since the extent to which integration has progressed in the EU bond market canbe assessed by measuring the relative importance of country components versus otherfactors in explaining bond returns, we applied a CAPM based model and separated eachindividual country’s government bond return into two effects: a local (own country),and a systemic effect (either a regional/eurozone or a global/world effect). It is intuitivethat as integration advances, the proportion of the total return explained by local effectsshould decrease. Our results presented evidence that during the first ten years after itsintroduction, the euro had a major impact on the degree of integration of Europeangovernment bond markets. The main conclusions of our analysis were, on the one hand,that markets of countries which shared a monetary policy were less vulnerable to theinfluences of world risk factors and more vulnerable to EMU risk factors and, on theother, that eurozone markets were only partially integrated with the German market.The proportion of the total return explained by country effects was still important andinvestors were able to benefit from portfolio risk diversification.
An important restriction of the ACGP (2010) analysis was that, for each country,we estimated ‘the average level’ of integration with the US and the German bondmarkets during the ten year period (1999–2008) and disregarded the fact that bondmarket integration changes over time. Nevertheless, the financial market tensions thatstarted in August 2007 and were followed by a global financial and economic crisis ledto significantly rising yield spreads in European government bond markets along withincreased differentiation of country risk across the eurozone. This situation highlightedthe fact that bond market integration clearly changes in response to economic andfinancial conditions, since the level of risk aversion changes and investors requiretime-varying compensation for accepting a risky payoff from financial assets. For thisreason, some studies have allowed integration to vary over time and with events (seeBekaert and Harvey, 1995, or Hardouvelis et al., 2006 among them).
This paper aims to address this question and to provide empirical evidence onthe ‘dynamic nature of bond market integration’ among EU-152 (euro and non-europarticipants) and three economies from the central and eastern European (CEE) group
1 Allen and Song (2005) investigate the effect of European Monetary Union on the integrationof the financial services industry within Europe and find evidence that EMU has helpedfinancial integration within the euro area.2 With the exception of Luxembourg, due to the fact that its debt market is negligible.
C© 2011 Blackwell Publishing Ltd
Pilar Abad, Helena Chuliá and Marta Gómez-Puig272
of countries which became member States of the European Union in 2004, even thoughthey have not yet adopted the euro: Poland, Hungary and the Czech Republic. Theseeconomies were chosen because they are the largest amongst the new incoming membersand, compared to their neighbors, are large issuers of sovereign debt. In fact, among thenew EU members, they have the largest and most liquid government debt markets.
Although little has been written on the sources of co-movements in government bondmarkets in the EU-15 context (studies of this issue include ACGP, 2010; Geyer et al.,2004; Gomez-Puig, 2009a, b and Pagano and Von Thadden, 2004),3 literature on the newEU members (Gardo and Martin, 2010 or Kim et al., 2006) is even scarcer. Therefore,whilst there is some evidence of the degree of integration of bond markets within theEU-15, much less is known about the level and dynamics of financial integration withinthe new EU members. However, it is worth noting that, at varying speeds, these countriesare being integrated in the world economy and international financial markets. Accordingto some indicators, they still present the characteristics of emerging economies, butaccording to others (especially the more forward-looking ones) they should be classifiedas developed economies.
In this paper we will analyse the time-varying degree of integration of four differentgroups of European sovereign debt markets with the German one: (1) Non-EMU newEU (the Czech Republic, Hungary and Poland), (2) non-EMU EU-15 (Denmark, Swedenand UK), (3) EMU EU-15 peripheral (Greece, Ireland, Italy, Portugal and Spain), and(4) EMU EU-15 central bond markets (Austria, Belgium, Finland, France and theNetherlands).
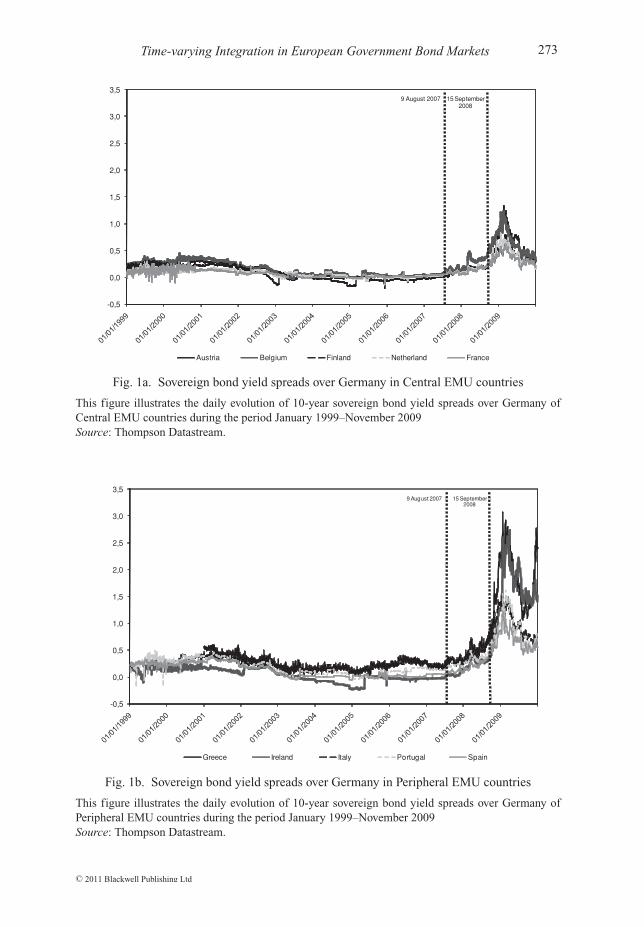
Because of the choice of the countries in our sample, our analysis covers the periodfrom January 2004, when Poland, the Czech Republic and Hungary joined the EuropeanUnion, and November 2009. This finishing date is chosen in order to avoid the influenceof the start of the huge sovereign debt crisis in Europe. We honestly think that it isbetter to omit data corresponding to 2010 from the study because the recent sovereigndebt crisis deserves independent analysis, since it may have been spurred not onlyby macroeconomic and fiscal risk perception but also by speculation regarding thesurvival of the euro. Moreover, as Jorion (2009) points out the ongoing crisis hashighlighted serious deficiencies in risk models and reinforced the importance for modernrisk measurement architecture. On the other hand, the omission of the 1999–2003 periodfrom our study will not substantially affect the results, since after the introduction ofthe euro in January 1999 and until the subprime crisis in global financial markets inAugust 2007, spreads on bonds of eurozone members had moved in a narrow rangewith only slight differentiation across countries (see Figure 1). In fact, the stability andconvergence of spreads was considered a hallmark of successful financial integrationwithin the eurozone.
Nevertheless, after the subprime crisis in 2007 severe tensions emerged in financialmarkets worldwide including the eurozone bond market. Following the collapse of theUS financial institution Lehman Brothers on 15 September 2008, the period of financialturmoil turned into a global financial crisis that began to spread to the real sector, witha rapid, synchronised deterioration in economic conditions in most major economies.At the same time the financial crisis showed that imbalances within the eurozone stillpersist since interest rate differentials between government bond issues of participating
3 On the other hand, some authors have examined the relationship between European and theUS bond markets (see Georgoutsos and Migiakis, 2011 and Christiansen, 2005).
C© 2011 Blackwell Publishing Ltd
2012
Time-varying Integration in European Government Bond Markets 273
-0,5
0,0
0,5
1,0
1,5
2,0
2,5
3,0
3,5
Austria Belgium Finland Netherland France
9 August 2007 15 September 2008
Fig. 1a. Sovereign bond yield spreads over Germany in Central EMU countries
This figure illustrates the daily evolution of 10-year sovereign bond yield spreads over Germany ofCentral EMU countries during the period January 1999–November 2009Source: Thompson Datastream.
-0,5
0,0
0,5
1,0
1,5
2,0
2,5
3,0
3,5
Greece Ireland Italy Portugal Spain
9 August 2007 15 September 2008
Fig. 1b. Sovereign bond yield spreads over Germany in Peripheral EMU countries
This figure illustrates the daily evolution of 10-year sovereign bond yield spreads over Germany ofPeripheral EMU countries during the period January 1999–November 2009Source: Thompson Datastream.
C© 2011 Blackwell Publishing Ltd
Pilar Abad, Helena Chuliá and Marta Gómez-Puig274
countries, which had reached levels close to zero between 2003 and 2007, now re-emerged. In fact, risk premia on EMU government bonds which had followed a seculardownward trend in the past (Figure 1) increased strongly in 2008, reflecting investorperceptions of upcoming macroeconomic and fiscal risks.
In this scenario, the aim of this paper is to study the dynamic behavior of bond marketintegration with the eurozone bond market, which is proxied by the German market, in the16 EU countries mentioned above: 13 EU-15 countries jointly with Poland, Hungary andthe Czech Republic, during a timespan beginning after a period of calm and tranquillityin EMU markets and ending with a significant widening of sovereign bond spreads. Inorder to analyse the dynamic nature of integration we use an asset pricing model basedon that of Bekaert and Harvey (1995) and consider that the time-varying coefficient thatcaptures the degree of integration with the eurozone market is dependent on a set ofdomestic economic instruments relative to Germany.
We find evidence of a time-varying level of integration, which decreases in all countriesas the financial market tensions which started in August 2007 developed into a globalfinancial and economic crisis. Our results suggest that the relative importance of countrycomponents versus other factors in explaining bond returns, and consequently bondmarket segmentation, increased with the deterioration of the economic situation inEurope which has accentuated imbalances across economies.
The time-series pattern of the degree of integration presents similar trends acrossour four categories of countries, but the impact of the financial and economic crisisclearly differs between groups and within countries in the same group. After September2008, the non-EMU and the EMU peripheral groups are the ones whose bond marketspresent the highest drop in their degree of integration with the German one. However,whilst the dispersion of the time-varying degree of integration remains relatively stablein non-EMU countries, it records an average increase of 128% in the case of EMUperipheral countries, reflecting clear differences in the dynamic behaviour of integrationbetween these countries.
These results suggest that the impact of the financial and economic crisis has beenmuch more harmful for EMU members’ sovereign bond markets, since it has promptedan important backward step in their integration process.
The remainder of the paper is organised as follows. Section 2 lays out the methodologywe use to estimate time-varying integration. Section 3 describes the bond market dataand the instruments for the price of risk and the time-varying integration parameter.Section 4 discusses the empirical results. Finally, Section 5 concludes.
2. Model
Following Hardovelius et al. (2006), who analyse European stock market integration,our model builds on Bekaert and Harvey (1995)’s CAPM-based model and assumes thatexcess returns in country i are generated by the following version of the conditionalinternational CAPM:
ri,t = θi,tλE,t covt−1(r E,t , r i,t ) + (1 − θi,t )λi,t vart−1(r i,t ) + ei,t (1)
where ri,t is the excess return on the local bond market, rE,t, is the excess return onthe eurozone bond market, covt−1 is the conditional covariance operator, vart−1 is theconditional variance operator, λE,t is the eurozone price of risk, and λi,t is the local priceof risk. The time-varying parameter θ i,t is interpreted as a measure of the conditional
C© 2011 Blackwell Publishing Ltd
Time-varying Integration in European Government Bond Markets 275
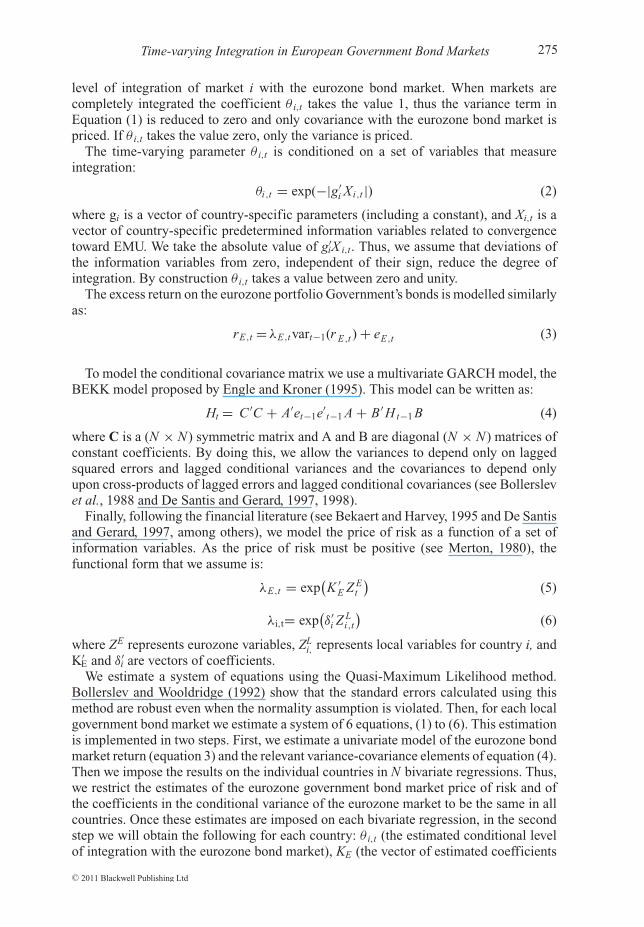
level of integration of market i with the eurozone bond market. When markets arecompletely integrated the coefficient θ i,t takes the value 1, thus the variance term inEquation (1) is reduced to zero and only covariance with the eurozone bond market ispriced. If θ i,t takes the value zero, only the variance is priced.
The time-varying parameter θ i,t is conditioned on a set of variables that measureintegration:
θi,t = exp(−|g′i Xi,t |) (2)
where gi is a vector of country-specific parameters (including a constant), and Xi,t is avector of country-specific predetermined information variables related to convergencetoward EMU. We take the absolute value of g′
iX i,t. Thus, we assume that deviations ofthe information variables from zero, independent of their sign, reduce the degree ofintegration. By construction θ i,t takes a value between zero and unity.
The excess return on the eurozone portfolio Government’s bonds is modelled similarlyas:
rE,t = λE,t vart−1(r E,t ) + eE,t (3)
To model the conditional covariance matrix we use a multivariate GARCH model, theBEKK model proposed by Engle and Kroner (1995). This model can be written as:
Ht = C ′C + A′et−1e′t−1 A + B ′ H t−1 B (4)
where C is a (N × N) symmetric matrix and A and B are diagonal (N × N) matrices ofconstant coefficients. By doing this, we allow the variances to depend only on laggedsquared errors and lagged conditional variances and the covariances to depend onlyupon cross-products of lagged errors and lagged conditional covariances (see Bollerslevet al., 1988 and De Santis and Gerard, 1997, 1998).
Finally, following the financial literature (see Bekaert and Harvey, 1995 and De Santisand Gerard, 1997, among others), we model the price of risk as a function of a set ofinformation variables. As the price of risk must be positive (see Merton, 1980), thefunctional form that we assume is:
λE,t = exp(K ′
E Z Et
)(5)
λi,t= exp(δ′
i Z Li,t
)(6)
where ZE represents eurozone variables, ZLi, represents local variables for country i, and
K′E and δ′
i are vectors of coefficients.We estimate a system of equations using the Quasi-Maximum Likelihood method.
Bollerslev and Wooldridge (1992) show that the standard errors calculated using thismethod are robust even when the normality assumption is violated. Then, for each localgovernment bond market we estimate a system of 6 equations, (1) to (6). This estimationis implemented in two steps. First, we estimate a univariate model of the eurozone bondmarket return (equation 3) and the relevant variance-covariance elements of equation (4).Then we impose the results on the individual countries in N bivariate regressions. Thus,we restrict the estimates of the eurozone government bond market price of risk and ofthe coefficients in the conditional variance of the eurozone market to be the same in allcountries. Once these estimates are imposed on each bivariate regression, in the secondstep we will obtain the following for each country: θ i,t (the estimated conditional levelof integration with the eurozone bond market), KE (the vector of estimated coefficients
C© 2011 Blackwell Publishing Ltd
Pilar Abad, Helena Chuliá and Marta Gómez-Puig276
for the eurozone price of risk) and δi (the vector of estimated coefficients for the localprice of risk).4
3. Data
3.1. Returns
The empirical analysis uses the 10-year JPMorgan Government Global Bond Index(JPMGBI), in terms of a common currency, the euro, and the sample includes 16European countries. Our study focuses on 10 EMU EU-15 (Austria, Belgium, France,Greece, Ireland, Italy, Finland, the Netherlands, Portugal and Spain) and 6 non-EMUcountries (Denmark, Czech Republic, Hungary, Poland, Sweden and UK). Data havebeen collected from Thompson Datastream. We use daily data5 covering the period fromJanuary 2004 to November 2009, except for two new EU countries: the Czech Republicand Hungary, where the start date is November 2004. Returns are calculated as first logdifferences.
The dependent variable in our model (rit,) is the excess return which is calculatedrelative to the appropriate 1-month euro-deposit offered rate quoted in London.6 In ouranalyses, we use the German government bond index as the proxy for the entire eurozonegiven that it has a correlation of 0.99 with the JP Morgan EMU government index (overthe same sample period) which can also be obtained from Thompson Datastream. Wethink that this is a better way to capture regional risk effect than using the return of asynthetic eurozone bond index which will always contain the evolution of the own localmarket return.
3.2. Instruments for the price of risk
Like ACGP (2010), we use the following instrumental variables to capture the differentprices of risk (eurozone and local risk): (1) the slope of the yield curve, as measured by thedifference between the 10-year and the 3-year government bond returns. Several studies(Campbell and Shiller, 1991; Ilmanen, 1996) have found that steeper yield curves areassociated with higher subsequent yields on longer-maturity bonds. The interpretationof this finding is that the yield curve steepens primarily because of an increase in therisk premium. Moreover, the slope of the yield curve is also a proxy of the businesscycle. (2) Lagged stock indexes returns are included to allow for the possibility thatstock returns lead bond returns. In recent years, important cross-asset linkages betweenstocks, bonds and money market instruments have been observed. Fleming et al. (1998)investigate the nature of volatility linkages between stocks, bonds and money markets andconclude that volatility linkages between the three markets are strong. In particular, stock
4 According to Bekaert and Harvey (1995), this procedure imposes the restriction that theprice of eurozone market risk is the same in each country, which leads to more powerful tests.A disadvantage of this approach is that the usual standard errors are likely to be understatedsince we ignore the sampling error in the first-stage parameter estimates.5 Bond markets for the countries under consideration are approximately open for the samehours during the day.6 Euro-deposit rates are used as a proxy for the risk free rate due to the lack of a liquidTreasury bill market in some of the countries.
C© 2011 Blackwell Publishing Ltd
Time-varying Integration in European Government Bond Markets 277
market weakness has been associated with economic weakness, which has correspondedto bond market strength.7 If equity market weakness gives rise to subsequent bondmarket strength, the coefficient on lagged stock indexes returns should be significantlynegative (see Hunter and Simon, 2005).8 Finally, (3) Lagged 10-year Government bondreturns are also added to the specification. Taking into account that some aspects of riskpremiums (related to domestic factors such as liquidity or credit risk) do not changeover the period considered, the objective will be to identify their relative importance inexplaining fluctuations, rather than returns levels. With this aim, a lag of the dependentvariable is introduced in the model, which will allow for a slow dynamic adjustment toa long-term equilibrium value of government returns.
Since we use German returns as proxies of the eurozone, the following eurozoneinstruments are applied: (1) the slope of the German yield curve, as measured by thedifference between the 10-year and the 3-year German government bond return. (2) Thelagged return of the DAX-30. We think that the use of this index is appropriate as itreflects the price evolution of the 30 most important firms in the German stock market.(3) The lagged value of the 10-year German government return.
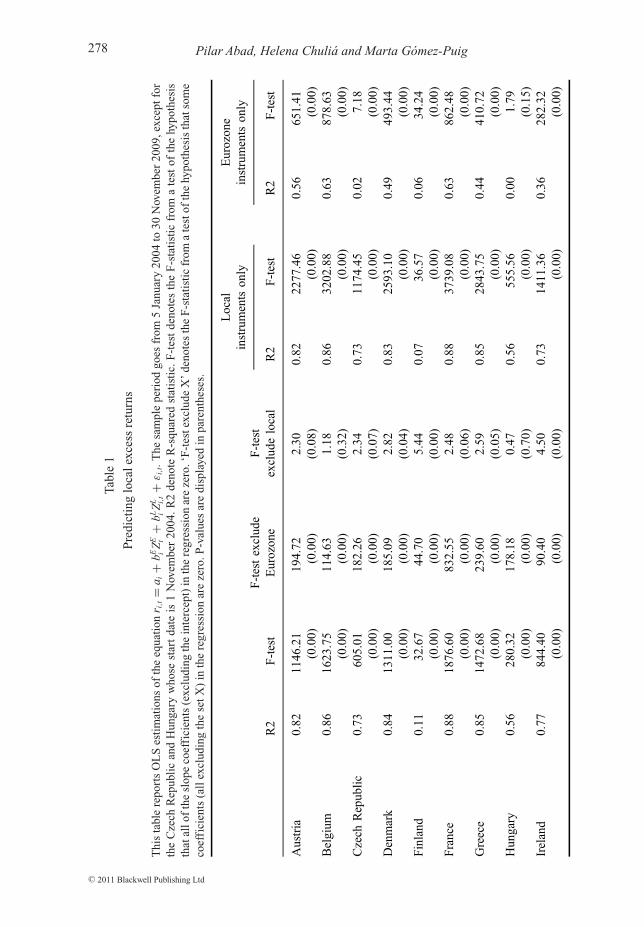
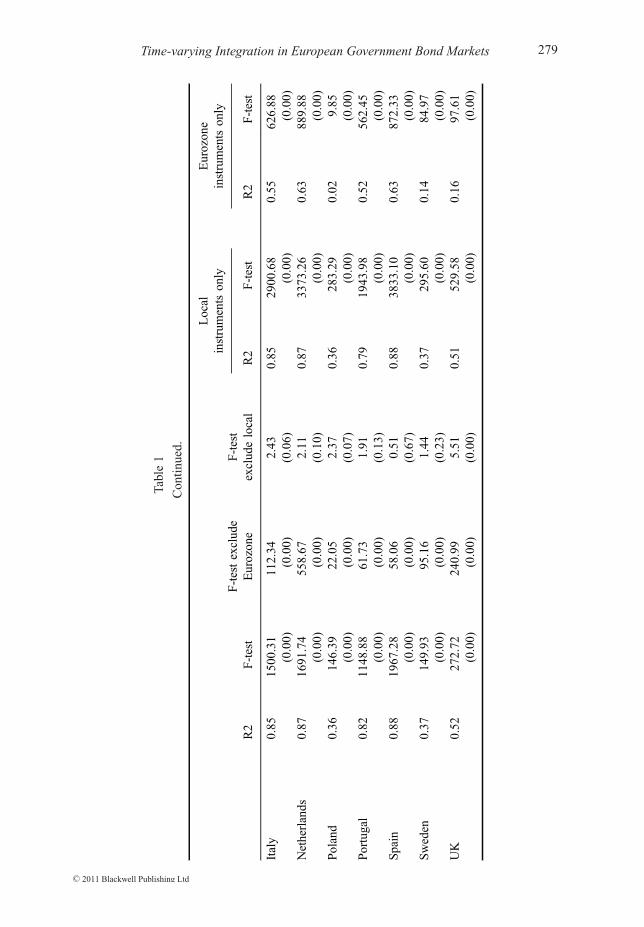
Table 1 records the results obtained by regressing the excess returns of the 16 localmarkets on both the local and the eurozone instruments, as follows:
ri,t = ai + bEi Z E
t−1 + bLi Z L
i,t−1 + εi,t (7)
where for every country i, we assume that government bond excess returns (ri,t) arelinearly related to eurozone (ZE) and local (ZL
i ) information variables. We estimate thisequation by OLS to identify the relevant instruments. Furthermore, we test the separatehypothesis that the coefficients associated with the eurozone and local variables are zero.
In most countries, R2s range from 70% to 80%, indicating a high degree ofpredictability in local bond markets. The F-tests reveal that each set of instrumentsis separately and jointly significant. For all countries, we reject the null hypothesisthat local instruments can be excluded. We also reject the null hypothesis that eurozoneinstruments can be excluded at the 10% significance level with the exceptions of Sweden,Spain, Portugal and Hungary.
Then, we estimate equation (7) using the local and eurozone instruments separately.The results show clear patterns of predictability in all local bond markets using localinstruments. We observe that when we only use local instruments the R2s are similar towhen we use all instruments, whilst when we only use eurozone instruments the R2s arelower. Thus, the predictability power of local instruments is higher than that of regionalinstruments in all countries. Moreover, in some countries (Czech Republic, Poland andHungary) the usefulness of regional instruments is substantially reduced, although theF-tests reveal that both sets of instruments are significant with the exception of Hungary.
7 Kim et al. (2006) present evidence that the introduction of the monetary union has Granger-caused an apparent segmentation between bond and stock markets within Europe. Hence,the EMU has increased the benefits of diversification across stocks and government bondsat the country level.8 Nevertheless, note that other authors (see McQueen and Roley, 1993) demonstrate that theopposite results are obtained when market participants are concerned about an overheatingeconomy. During these periods, data suggesting a weaker-than-expected economy lead tostronger bond and stock prices as this makes it less likely that the Federal Reserve willbe forced to tighten monetary policy aggressively and possibly drive the economy into arecession.
C© 2011 Blackwell Publishing Ltd
Pilar Abad, Helena Chuliá and Marta Gómez-Puig278
Tabl
e1
Pre
dict
ing
loca
lexc
ess
retu
rns
Thi
sta
ble
repo
rts
OL
Ses
tim
atio
nsof
the
equa
tion
r i,t
=a i
+bE i
ZE t
+bL i
ZL i,
t+
εi,
t.T
hesa
mpl
epe
riod
goes
from
5Ja
nuar
y20
04to
30N
ovem
ber
2009
,exc
eptf
orth
eC
zech
Rep
ubli
can
dH
unga
ryw
hose
star
tda
teis
1N
ovem
ber
2004
.R2
deno
teR
-squ
ared
stat
isti
c.F
-tes
tde
note
sth
eF
-sta
tist
icfr
oma
test
ofth
ehy
poth
esis
that
allo
fth
esl
ope
coef
fici
ents
(exc
ludi
ngth
ein
terc
ept)
inth
ere
gres
sion
are
zero
.‘F
-tes
texc
lude
X’
deno
tes
the
F-s
tati
stic
from
ate
stof
the
hypo
thes
isth
atso
me
coef
fici
ents
(all
excl
udin
gth
ese
tX)
inth
ere
gres
sion
are
zero
.P-v
alue
sar
edi
spla
yed
inpa
rent
hese
s.
Loc
alE
uroz
one
inst
rum
ents
only
inst
rum
ents
only
F-t
este
xclu
deF
-tes
tR
2F
-tes
tE
uroz
one
excl
ude
loca
lR
2F
-tes
tR
2F
-tes
t
Aus
tria
0.82
1146
.21
194.
722.
300.
8222
77.4
60.
5665
1.41
(0.0
0)(0
.00)
(0.0
8)(0
.00)
(0.0
0)B
elgi
um0.
8616
23.7
511
4.63
1.18
0.86
3202
.88
0.63
878.
63(0
.00)
(0.0
0)(0
.32)
(0.0
0)(0
.00)
Cze
chR
epub
lic
0.73
605.
0118
2.26
2.34
0.73
1174
.45
0.02
7.18
(0.0
0)(0
.00)
(0.0
7)(0
.00)
(0.0
0)D
enm
ark
0.84
1311
.00
185.
092.
820.
8325
93.1
00.
4949
3.44
(0.0
0)(0
.00)
(0.0
4)(0
.00)
(0.0
0)Fi
nlan
d0.
1132
.67
44.7
05.
440.
0736
.57
0.06
34.2
4(0
. 00)
(0.0
0)(0
.00)
(0.0
0)(0
.00)
Fran
ce0.
8818
76.6
083
2.55
2.48
0.88
3739
.08
0.63
862.
48(0
.00)
(0.0
0)(0
.06)
(0.0
0)(0
.00)
Gre
ece
0.85
1472
.68
239.
602.
590.
8528
43.7
50.
4441
0.72
(0.0
0)(0
.00)
(0.0
5)(0
.00)
(0.0
0)H
unga
ry0.
5628
0.32
178.
180.
47∗
0.56
555.
560.
001.
79∗
(0.0
0)(0
.00)
(0.7
0)(0
.00)
(0.1
5)Ir
elan
d0.
7784
4.40
90.4
04.
500.
7314
11.3
60.
3628
2.32
(0.0
0)(0
.00)
(0.0
0)(0
.00)
(0.0
0)
C© 2011 Blackwell Publishing Ltd
R2
F‐test
F‐testexclude
Eurozone
F‐test
excludelocal
Local
instrumentsonly
Eurozone
instruments
only
R2
F‐test
R2
F‐test
Austria
0.82
1146.21
194.72
2.30
0.82
2277.46
0.56
651.41
(0.00)
(0.00)
(0.08)
(0.00)
(0.00)
Belgium
0.86
1623.75
114.63
1.18
0.86
3202.88
0.63
878.63
(0.00)
(0.00)
(0.32)
(0.00)
(0.00)
Czech
Republic
0.73
605.01
182.26
2.34
0.73
1174.45
0.02
7.18
(0.00)
(0.00)
(0.07)
(0.00)
(0.00)
Denmark
0.84
1311.00
185.09
2.82
0.83
2593.10
0.49
493.44
(0.00)
(0.00)
(0.04)
(0.00)
(0.00)
Finland
0.11
32.67
44.70
5.44
0.07
36.57
0.06
34.24
(0.00)
(0.00)
(0.00)
(0.00)
(0.00)
France
0.88
1876.60
832.55
2.48
0.88
3739.08
0.63
862.48
(0.00)
(0.00)
(0.06)
(0.00)
(0.00)
Greece
0.85
1472.68
239.60
2.59
0.85
2843.75
0.44
410.72
(0.00)
(0.00)
(0.05)
(0.00)
(0.00)
Hungary
0.56
280.32
178.18
0.47
�0.56
555.56
0.00
1.79
�
(0.00)
(0.00)
(0.70)
(0.00)
(0.15)
Ireland
0.77
844.40
90.40
4.50
0.73
1411.36
0.36
282.32
(0.00)
(0.00)
(0.00)
(0.00)
(0.00)
Time-varying Integration in European Government Bond Markets 279
Tabl
e1
Con
tinu
ed.
Loc
alE
uroz
one
inst
rum
ents
only
inst
rum
ents
only
F-t
este
xclu
deF
-tes
tR
2F
-tes
tE
uroz
one
excl
ude
loca
lR
2F
-tes
tR
2F
-tes
t
Ital
y0.
8515
00.3
111
2.34
2.43
0.85
2900
.68
0.55
626.
88(0
.00)
(0.0
0)(0
.06)
(0.0
0)(0
.00)
Net
herl
ands
0.87
1691
.74
558.
672.
110.
8733
73.2
60.
6388
9.88
(0.0
0)(0
.00)
(0.1
0)(0
.00)
(0.0
0)Po
land
0.36
146.
3922
.05
2.37
0.36
283.
290.
029.
85(0
.00)
(0.0
0)(0
.07)
(0.0
0)(0
.00)
Port
ugal
0.82
1148
.88
61.7
31.
91∗
0.79
1943
.98
0.52
562.
45(0
.00)
(0.0
0)(0
.13)
(0.0
0)(0
.00)
Spa
in0.
8819
67.2
858
.06
0.51
∗0.
8838
33.1
00.
6387
2.33
(0.0
0)(0
.00)
(0.6
7)(0
.00)
(0.0
0)S
wed
en0.
3714
9.93
95.1
61.
44∗
0.37
295.
600.
1484
.97
(0.0
0)(0
.00)
(0.2
3)(0
.00)
(0.0
0)U
K0.
5227
2.72
240.
995.
510.
5152
9.58
0.16
97.6
1(0
.00)
(0.0
0)(0
.00)
(0.0
0)(0
.00)
C© 2011 Blackwell Publishing Ltd
R2
F‐test
F‐testexclude
Eurozone
F‐test
excludelocal
Local
instruments
only
Eurozone
instruments
only
R2
F‐test
R2
F‐test
Italy
0.85
1500.31
112.34
2.43
0.85
2900.68
0.55
626.88
(0.00)
(0.00)
(0.06)
(0.00)
(0.00)
Netherlands
0.87
1691.74
558.67
2.11
0.87
3373.26
0.63
889.88
(0.00)
(0.00)
(0.10)
(0.00)
(0.00)
Poland
0.36
146.39
22.05
2.37
0.36
283.29
0.02
9.85
(0.00)
(0.00)
(0.07)
(0.00)
(0.00)
Portugal
0.82
1148.88
61.73
1.91
�0.79
1943.98
0.52
562.45
(0.00)
(0.00)
(0.13)
(0.00)
(0.00)
Spain
0.88
1967.28
58.06
0.51
�0.88
3833.10
0.63
872.33
(0.00)
(0.00)
(0.67)
(0.00)
(0.00)
Sweden
0.37
149.93
95.16
1.44
�0.37
295.60
0.14
84.97
(0.00)
(0.00)
(0.23)
(0.00)
(0.00)
UK
0.52
272.72
240.99
5.51
0.51
529.58
0.16
97.61
(0.00)
(0.00)
(0.00)
(0.00)
(0.00)
Pilar Abad, Helena Chuliá and Marta Gómez-Puig280
Overall, the results show that a set of eurozone and local instruments are useful to predictlocal bond returns, suggesting incomplete integration.
3.3. Instruments for the time-varying integration parameter
In our model, each country has its own time-varying degree of integration. The degreeof integration is conditioned on a set of domestic economic instruments relative toGermany: (1) The inflation differential, (2) the industrial production index rate of thegrowth differential and (3) the debt-to-GDP rate of the growth differential.9 The use ofdomestic indicators to explain the behaviour of the time-varying degree of integration isjustified on the grounds that external imbalances necessarily have internal counterparts.
In particular, the inflation differential and the industrial production index rate of thegrowth differential (a proxy of the business cycle) relative to Germany are included totake account of the argument put forward by Mody (2009) that countries’ sensitivityto the financial crisis is more pronounced the greater the loss of competitiveness andgrowth potential.
On the other hand, as Mody (2009) points out, after the failure of Lehman Brotherscountries with higher debt levels faced more stress on their debt servicing capabilitiesand, hence, were penalised more as a consequence of the substantial reevaluation ofglobal growth prospects. Actually, an important point that Reinhart and Rogoff (2008)make is that the eventual rise in public debt is only partly due to the direct costs ofrescuing distressed financial institutions: the bulk of the rise in the public debt-to-GDPratio reflects the slowdown in growth associated with the banking/economic crisis. Thisis also likely to be the case for the ongoing crisis, which has revealed a rising influenceof the loss of competitiveness and slowdown in growth on the rise in the public debt-to-GDP ratio and government yield spreads. However, there are statistical challengesin identifying the relationship between public debt and the high-frequency changes inspreads (see Pagano and von Thadden, 2004). This is the reason why we will use aflow instead of a stock variable in our study. Specifically, the relative rate of growth ofdebt-to-GDP ratios will be the instrument that we will include to study the time-varyingdegree of integration with the German bond market.
All the variables that have been used to build up the instruments (the HarmonisedIndex of Consumer Prices, the Production Index,10 Government debt and the GDP) havebeen compiled from Eurostat. Daily data have been linearly interpolated from monthlyand quarterly observations.
4. Results
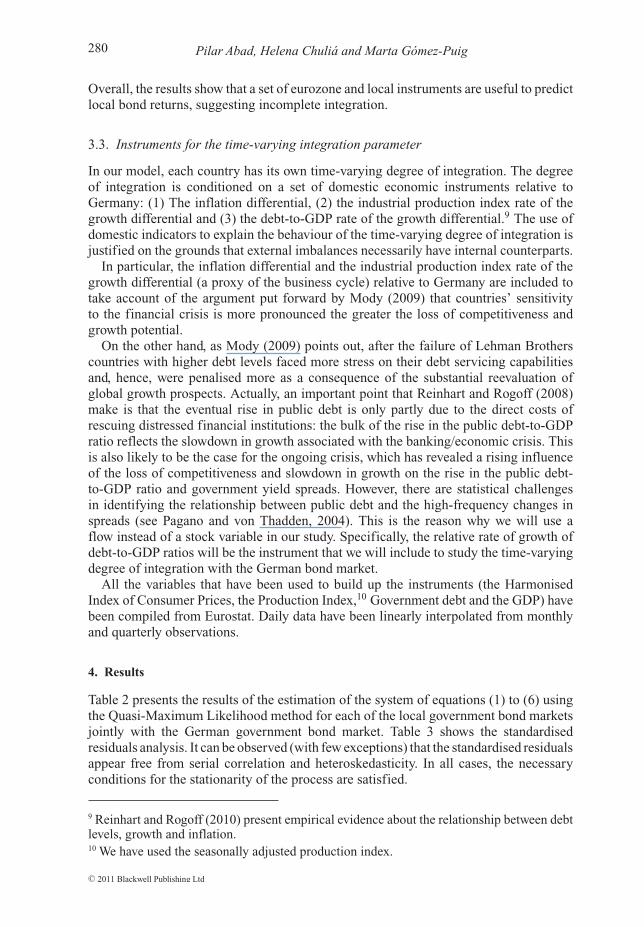
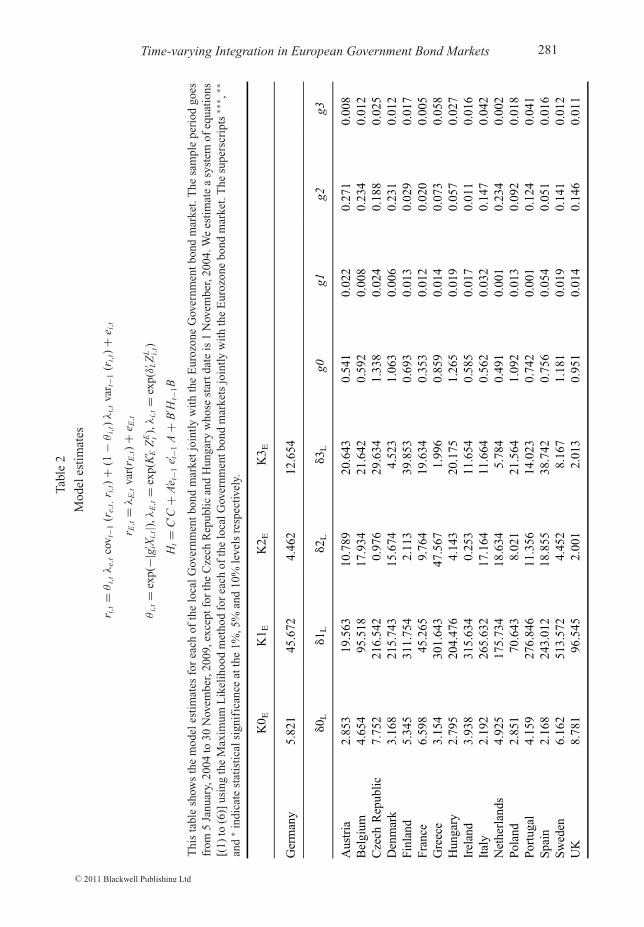
Table 2 presents the results of the estimation of the system of equations (1) to (6) usingthe Quasi-Maximum Likelihood method for each of the local government bond marketsjointly with the German government bond market. Table 3 shows the standardisedresiduals analysis. It can be observed (with few exceptions) that the standardised residualsappear free from serial correlation and heteroskedasticity. In all cases, the necessaryconditions for the stationarity of the process are satisfied.
9 Reinhart and Rogoff (2010) present empirical evidence about the relationship between debtlevels, growth and inflation.10 We have used the seasonally adjusted production index.
C© 2011 Blackwell Publishing Ltd
Time-varying Integration in European Government Bond Markets 281Ta
ble
2
Mod
eles
tim
ates
r i,t
=θ
i,tλ
e,t
cov t
−1(r
e,t,
r i,t)+
(1−
θi,
t)λ
i,t
var t−
1(r
i,t)
+e i
,t
r E,t
=λ
E,t
var(
r E,t)+
e E,t
θi,
t=
exp(
−|g′ iX
i,t|),
λE,t
=ex
p(K
′ EZ
E t),
λi,
t=
exp(
δ′ LZ
L i,t)
Ht=
C′ C
+A
′ e t−1
e′ t−1
A+
B′ H
t−1B
Thi
sta
ble
show
sth
em
odel
esti
mat
esfo
rea
chof
the
loca
lGov
ernm
entb
ond
mar
ketj
oint
lyw
ith
the
Eur
ozon
eG
over
nmen
tbon
dm
arke
t.T
hesa
mpl
epe
riod
goes
from
5Ja
nuar
y,20
04to
30N
ovem
ber,
2009
,exc
eptf
orth
eC
zech
Rep
ubli
can
dH
unga
ryw
hose
star
tdat
eis
1N
ovem
ber,
2004
.We
esti
mat
ea
syst
emof
equa
tion
s[(
1)to
(6)]
usin
gth
eM
axim
umL
ikel
ihoo
dm
etho
dfo
rea
chof
the
loca
lGov
ernm
entb
ond
mar
kets
join
tlyw
ith
the
Eur
ozon
ebo
ndm
arke
t.T
hesu
pers
crip
ts∗∗
∗ ,∗∗
and
∗in
dica
test
atis
tica
lsig
nifi
canc
eat
the
1%,5
%an
d10
%le
vels
resp
ectiv
ely.
K0 E
K1 E
K2 E
K3 E
Ger
man
y5.
821∗∗
∗45
.672
∗∗∗
4.46
2∗∗∗
12.6
54∗∗
δ0 L
δ1 L
δ2 L
δ3 L
g0g1
g2g3
Aus
tria
2.85
3∗∗∗
19.5
63∗∗
10.7
89∗∗
∗−2
0.64
3∗∗∗
0.54
1∗∗∗
0.02
2∗∗∗
0.27
1∗∗∗
0.00
8∗∗∗
Bel
gium
4.65
4∗∗∗
95.5
18∗∗
∗17
.934
∗∗∗
−21.
642∗∗
∗−0
.592
∗∗∗
−0.0
08∗∗
−0.2
34∗∗
∗−0
.012
∗∗∗
Cze
chR
epub
lic
7.75
2∗∗∗
216.
542∗∗
∗−0
.976
29.6
34∗∗
∗1.
338∗∗
∗−0
.024
0.18
8∗∗∗
0.02
5∗∗∗
Den
mar
k3.
168∗∗
∗21
5.74
3∗∗∗
15.6
74∗∗
∗4.
523∗∗
1.06
3∗∗∗
−0.0
060.
231∗∗
∗0.
012∗∗
∗Fi
nlan
d5.
345∗∗
∗31
1.75
4∗∗∗
2.11
3∗∗∗
−39.
853∗∗
∗−0
.693
∗∗∗
0.01
3∗∗∗
−0.0
29∗∗
∗−0
.017
∗∗∗
Fran
ce6.
598∗∗
∗−4
5.26
5∗∗∗
9.76
4∗∗∗
−19.
634∗∗
∗−0
.353
∗∗∗
−0.0
12∗∗
∗−0
.020
∗∗∗
−0.0
05∗∗
∗G
reec
e3.
154∗∗
∗30
1.64
3∗∗∗
47.5
67∗∗
1.99
6∗∗∗
0.85
9∗∗∗
0.01
4∗∗∗
0.07
3∗∗∗
0.05
8∗∗∗
Hun
gary
2.79
5∗∗∗
204.
476∗∗
∗−4
.143
20.1
75∗∗
∗−1
.265
∗∗∗
−0.0
19∗∗
−0.0
57∗∗
∗−0
.027
∗∗∗
Irel
and
3.93
8∗∗∗
315.
634∗∗
∗0.
253∗∗
11.6
54∗∗
∗0.
585∗∗
∗0.
017∗∗
∗−0
.011
∗∗∗
0.01
6∗∗It
aly
2.19
2∗∗∗
265.
632∗∗
∗17
.164
∗∗∗
−11.
664∗∗
∗0.
562∗∗
∗0.
032∗∗
∗0.
147∗∗
∗−0
.042
∗∗∗
Net
herl
ands
4.92
5∗∗∗
−175
.734
∗∗∗
18.6
34∗∗
∗5.
784∗∗
∗−0
.491
∗∗∗
−0.0
01∗∗
∗−0
.234
∗∗∗
−0.0
02∗∗
∗Po
land
2.85
1∗∗∗
70.6
43∗∗
∗8.
021∗∗
∗21
.564
∗1.
092∗∗
∗0.
013∗∗
∗0.
092∗∗
∗0.
018∗∗
Port
ugal
4.15
9∗∗∗
276.
846∗∗
∗11
.356
∗∗∗
−14.
023∗∗
∗−0
.742
∗∗∗
0.00
10.
124∗∗
∗0.
041∗∗
∗S
pain
2.16
8∗∗∗
243.
012∗∗
∗18
.855
∗∗∗
−38.
742∗∗
∗−0
.756
∗∗∗
−0.0
54∗∗
∗−0
.051
∗∗∗
−0.0
16∗∗
∗S
wed
en6.
162∗∗
∗51
3.57
2∗∗∗
−4.4
52−8
.167
1.18
1∗∗∗
0.01
9∗∗∗
0.14
1∗∗∗
0.01
2∗∗∗
UK
8.78
1∗∗∗
96.5
45∗∗
∗−2
.001
2.01
3∗∗0.
951∗∗
∗0.
014∗∗
∗0.
146∗∗
∗0.
011∗∗
∗
C© 2011 Blackwell Publishing Ltd
K0 E
K1 E
K2 E
K3 E
Germany
5.821�
��45.672
���
4.462�
��12.654
��
d0 L
d1 L
d2 L
d3 L
g0g1
g2g3
Austria
2.853�
��19.563
��10.789
���
�20.643�
��0.541�
��0.022�
��0.271�
��0.008�
��
Belgium
4.654�
��95.518
���
17.934
���
�21.642�
���0
.592
���
�0.008
���0
.234
���
�0.012
���
Czech
Republic
7.752�
��216.542�
���0
.976
29.634
���
1.338�
���0
.024
0.188�
��0.025�
��
Denmark
3.168�
��215.743�
��15.674
���
4.523�
�1.063�
���0
.006
0.231�
��0.012�
��
Finland
5.345�
��311.754�
��2.113�
���3
9.853�
���0
.693
���
0.013�
���0
.029
���
�0.017
���
France
6.598�
���4
5.265�
��9.764�
���1
9.634�
���0
.353
���
�0.012
���
�0.020
���
�0.005
���
Greece
3.154�
��301.643�
��47.567
��1.996�
��0.859�
��0.014�
��0.073�
��0.058�
��
Hun
gary
2.795�
��204.476�
���4
.143
20.175
���
�1.265
���
�0.019
���0
.057
���
�0.027
���
Ireland
3.938�
��315.634�
��0.253�
�11.654
���
0.585�
��0.017�
���0
.011
���
0.016�
�
Italy
2.192�
��265.632�
��17.164
���
�11.664�
��0.562�
��0.032�
��0.147�
���0
.042
���
Netherlands
4.925�
���1
75.734
���
18.634
���
5.784�
���0
.491
���
�0.001
���
�0.234
���
�0.002
���
Poland
2.851�
��70.643
���
8.021�
��21.564
�1.092�
��0.013�
��0.092�
��0.018�
�
Portugal
4.159�
��276.846�
��11.356
���
�14.023�
���0
.742
���
0.001
0.124�
��0.041�
��
Spain
2.168�
��243.012�
��18.855
���
�38.742�
���0
.756
���
�0.054
���
�0.051
���
�0.016
���
Sweden
6.162�
��513.572�
���4
.452
�8.167
1.181�
��0.019�
��0.141�
��0.012�
��
UK
8.781�
��96.545
���
�2.001
2.013�
�0.951�
��0.014�
��0.146�
��0.011�
��
Pilar Abad, Helena Chuliá and Marta Gómez-Puig282
Table 3
Standardised residuals analyses
This table reports summary statistics for the standardised residuals of the model estimates for each of thelocal Government bond markets jointly with the Eurozone (Germany) Government bond market. Q(20)is the Ljung-Box test for twentieth order serial correlation in the standardised residuals. ARCH(20)is Engle’s test for twentieth order ARCH, distributed as chi-square distribution with 20 degrees offreedom. The p-values of these tests are displayed in parentheses. In all cases the necessary conditionsfor the stationarity of the process are satisfied.
Most of the eurozone and local instruments displayed in the first four columns ofTable 2 are significant, suggesting that they are relevant in forecasting the eurozone andlocal price of risk. All the coefficients in the (co)variance equations (not reported) aresignificant, confirming the existence of time-varying volatilities. The estimates of the
C© 2011 Blackwell Publishing Ltd
Maximum likelihoodfunction value Q(20) ARCH(20)
Germany 31.005 3.934(0.06) (0.99)
Austria 14236.751 19.291 1.076(0.44) (0.99)
Belgium 14682.152 24.613 3.685(0.17) (0.99)
Czech Republic 9985.842 21.569 1.014(0.30) (0.99)
Denmark 13745.523 19.465 3.215(0.43) (0.99)
Finland 13652.453 23.521 1.845(0.17) (0.99)
France 15242.796 26.635 3.427(0.11) (0.99)
Greece 13395.175 21.928 2.667(0.28) (0.99)
Hungary 9339.347 27.996 42.529(0.08) (0.00)
Ireland 13506.742 19.538 2.421(0.45) (0.99)
Italy 13625.975 19.996 1.293(0.39) (0.99)
Netherlands 15135.856 26.058 7.010(0.12) (0.99)
Poland 11114.175 27.488 12.743(0.08) (0.99)
Portugal 13532.854 17.227 2.930(0.57) (0.99)
Spain 14375.784 25.721 7.120(0.14) (0.99)
Sweden 12298.752 15.710 2.860(0.67) (0.99)
UK 11806.811 26.652 2.017(0.11) (0.99)
Time-varying Integration in European Government Bond Markets 283
Table 4
Average level of the time-varying degree of integration
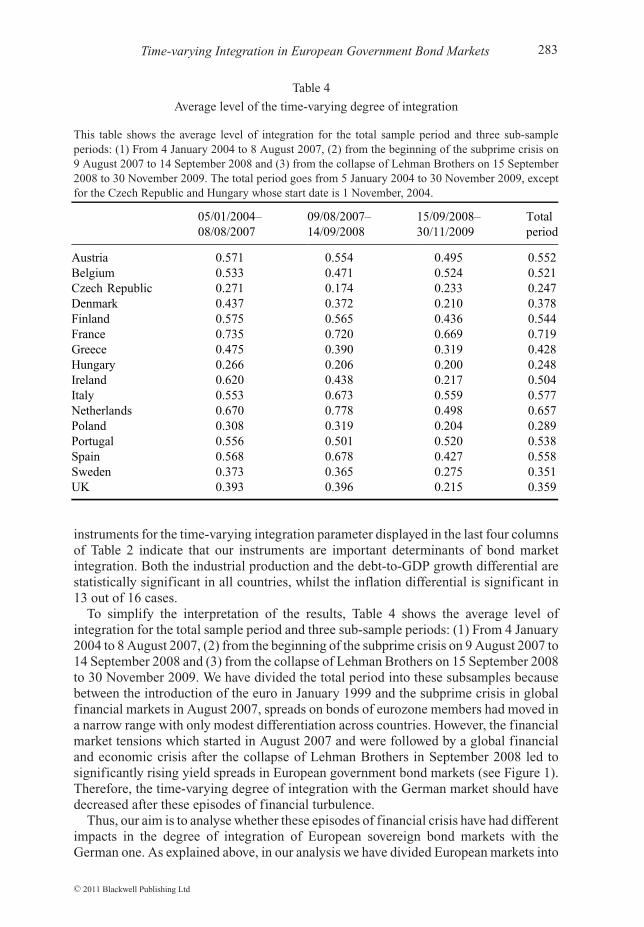
This table shows the average level of integration for the total sample period and three sub-sampleperiods: (1) From 4 January 2004 to 8 August 2007, (2) from the beginning of the subprime crisis on9 August 2007 to 14 September 2008 and (3) from the collapse of Lehman Brothers on 15 September2008 to 30 November 2009. The total period goes from 5 January 2004 to 30 November 2009, exceptfor the Czech Republic and Hungary whose start date is 1 November, 2004.
05/01/2004– 09/08/2007– 15/09/2008– Total08/08/2007 14/09/2008 30/11/2009 period
Austria 0.571 0.554 0.495 0.552Belgium 0.533 0.471 0.524 0.521Czech Republic 0.271 0.174 0.233 0.247Denmark 0.437 0.372 0.210 0.378Finland 0.575 0.565 0.436 0.544France 0.735 0.720 0.669 0.719Greece 0.475 0.390 0.319 0.428Hungary 0.266 0.206 0.200 0.248Ireland 0.620 0.438 0.217 0.504Italy 0.553 0.673 0.559 0.577Netherlands 0.670 0.778 0.498 0.657Poland 0.308 0.319 0.204 0.289Portugal 0.556 0.501 0.520 0.538Spain 0.568 0.678 0.427 0.558Sweden 0.373 0.365 0.275 0.351UK 0.393 0.396 0.215 0.359
instruments for the time-varying integration parameter displayed in the last four columnsof Table 2 indicate that our instruments are important determinants of bond marketintegration. Both the industrial production and the debt-to-GDP growth differential arestatistically significant in all countries, whilst the inflation differential is significant in13 out of 16 cases.
To simplify the interpretation of the results, Table 4 shows the average level ofintegration for the total sample period and three sub-sample periods: (1) From 4 January2004 to 8 August 2007, (2) from the beginning of the subprime crisis on 9 August 2007 to14 September 2008 and (3) from the collapse of Lehman Brothers on 15 September 2008to 30 November 2009. We have divided the total period into these subsamples becausebetween the introduction of the euro in January 1999 and the subprime crisis in globalfinancial markets in August 2007, spreads on bonds of eurozone members had moved ina narrow range with only modest differentiation across countries. However, the financialmarket tensions which started in August 2007 and were followed by a global financialand economic crisis after the collapse of Lehman Brothers in September 2008 led tosignificantly rising yield spreads in European government bond markets (see Figure 1).Therefore, the time-varying degree of integration with the German market should havedecreased after these episodes of financial turbulence.
Thus, our aim is to analyse whether these episodes of financial crisis have had differentimpacts in the degree of integration of European sovereign bond markets with theGerman one. As explained above, in our analysis we have divided European markets into
C© 2011 Blackwell Publishing Ltd
05/01/2004–08/08/2007
09/08/2007–14/09/2008
15/09/2008–30/11/2009
Totalperiod
Austria 0.571 0.554 0.495 0.552Belgium 0.533 0.471 0.524 0.521Czech Republic 0.271 0.174 0.233 0.247Denmark 0.437 0.372 0.210 0.378Finland 0.575 0.565 0.436 0.544France 0.735 0.720 0.669 0.719Greece 0.475 0.390 0.319 0.428Hungary 0.266 0.206 0.200 0.248Ireland 0.620 0.438 0.217 0.504Italy 0.553 0.673 0.559 0.577Netherlands 0.670 0.778 0.498 0.657Poland 0.308 0.319 0.204 0.289Portugal 0.556 0.501 0.520 0.538Spain 0.568 0.678 0.427 0.558Sweden 0.373 0.365 0.275 0.351UK 0.393 0.396 0.215 0.359
Pilar Abad, Helena Chuliá and Marta Gómez-Puig284
four different groups: (1) Non-EMU new EU (Czech Republic, Hungary and Poland),(2) non-EMU EU-15 (Denmark, Sweden and UK), (3) EMU EU-15 peripheral (Greece,Ireland, Italy, Portugal and Spain), and (4) EMU EU-15 central bond markets (Austria,Belgium, Finland, France and the Netherlands).
To test the equality of means of the level of integration in the three sub-sample periods,we carried out an ANOVA test with different null hypothesis. First we tested the nullhypothesis that the mean of the level of integration is the same before the beginning ofthe subprime crisis and after it; second, we tested the null hypothesis that the mean ofthe level of integration is equal in the second and third sub-periods, and finally, the jointtest with the null hypothesis that the mean of the level of integration is equal in the threesub-samples. In all cases, the results of the test (not reported) reject the null hypothesis,indicating that the means of the level of integration in the different sub-periods arestatistically different.
Table 4 shows that, as expected, the level of integration with the German market ishigher in EMU than in non-EMU countries. Within non-EMU countries, the averagelevel of integration throughout the period of the new EU countries (0.26) is lower thanthat of the non-EMU EU-15 countries (0.36). Within EMU countries, it is worth notingthat, on average, peripheral countries also present a level of integration (0.52) whichis lower than that of the central countries (0.60): Greece, Ireland and Portugal are theeurozone countries with the lowest degree of integration whilst the Netherlands andFrance are the ones with the highest level (the average level of integration is 0.42 in thecase of the Greek market and 0.69 in the case of the French one).
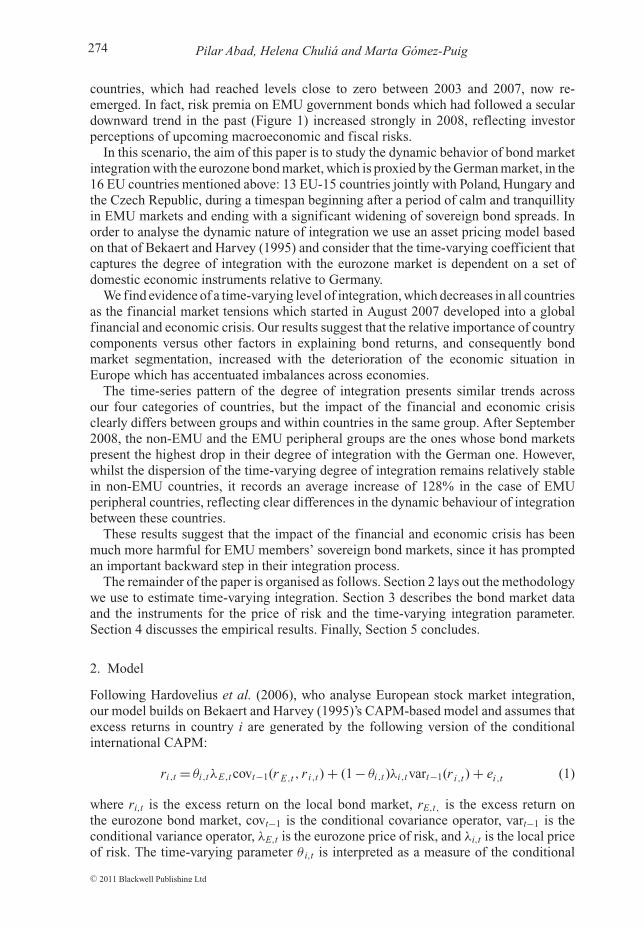
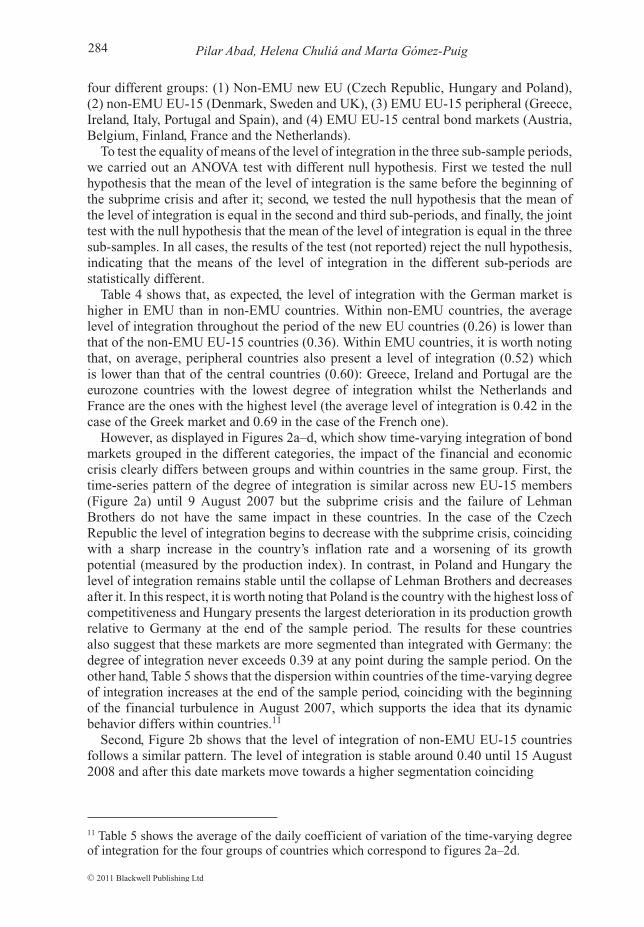
However, as displayed in Figures 2a–d, which show time-varying integration of bondmarkets grouped in the different categories, the impact of the financial and economiccrisis clearly differs between groups and within countries in the same group. First, thetime-series pattern of the degree of integration is similar across new EU-15 members(Figure 2a) until 9 August 2007 but the subprime crisis and the failure of LehmanBrothers do not have the same impact in these countries. In the case of the CzechRepublic the level of integration begins to decrease with the subprime crisis, coincidingwith a sharp increase in the country’s inflation rate and a worsening of its growthpotential (measured by the production index). In contrast, in Poland and Hungary thelevel of integration remains stable until the collapse of Lehman Brothers and decreasesafter it. In this respect, it is worth noting that Poland is the country with the highest loss ofcompetitiveness and Hungary presents the largest deterioration in its production growthrelative to Germany at the end of the sample period. The results for these countriesalso suggest that these markets are more segmented than integrated with Germany: thedegree of integration never exceeds 0.39 at any point during the sample period. On theother hand, Table 5 shows that the dispersion within countries of the time-varying degreeof integration increases at the end of the sample period, coinciding with the beginningof the financial turbulence in August 2007, which supports the idea that its dynamicbehavior differs within countries.11
Second, Figure 2b shows that the level of integration of non-EMU EU-15 countriesfollows a similar pattern. The level of integration is stable around 0.40 until 15 August2008 and after this date markets move towards a higher segmentation coinciding
11 Table 5 shows the average of the daily coefficient of variation of the time-varying degreeof integration for the four groups of countries which correspond to figures 2a–2d.
C© 2011 Blackwell Publishing Ltd
Time-varying Integration in European Government Bond Markets 285
0,0
0,2
0,4
0,6
0,8
1,0
Czech Republic Hungary Poland
9 August 2007 15 September 2008
Fig. 2a. Estimated time-varying level of integration in New EU countries
This figure illustrates the daily evolution of the estimated conditional level of integration of market iwith the German bond market (θ i,t−1) in the three New EU countries that are included in our sample
0,0
0,2
0,4
0,6
0,8
1,0
Denmark Sweden UK
9 August 2007 15 September 2008
Fig. 2b. Estimated time-varying level of integration in Non-EMU EU-15 countries
This figure illustrates the daily evolution of the estimated conditional level of integration of market iwith the German bond market (θ i,t−1) in the three Non EMU EU-15 countries that are included in oursample
C© 2011 Blackwell Publishing Ltd
Pilar Abad, Helena Chuliá and Marta Gómez-Puig286
0,0
0,2
0,4
0,6
0,8
1,0
Greece Ireland Italy Portugal Spain
9 August 2007 15 September 2008
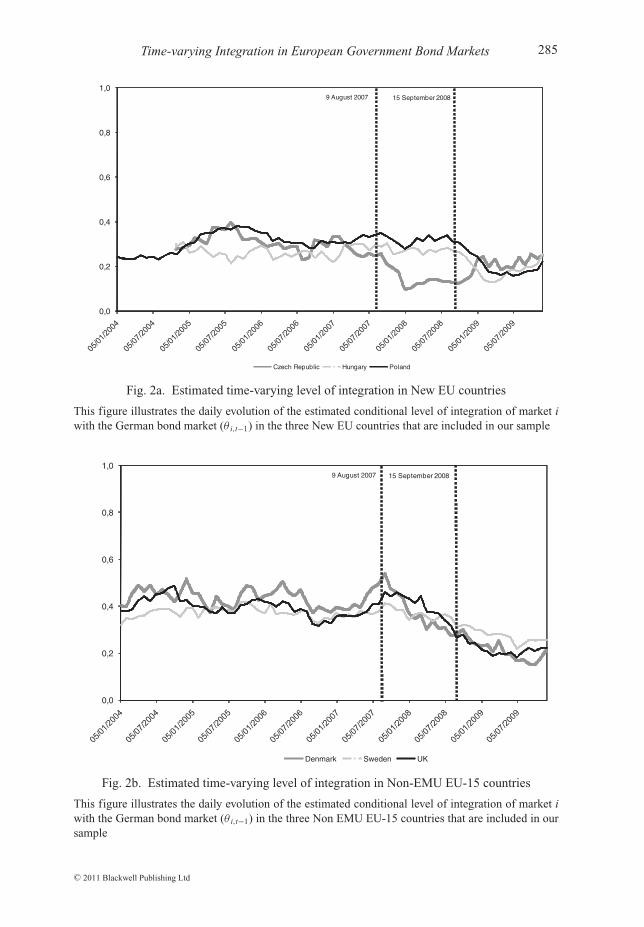
Fig. 2c. Estimated time-varying level of integration in Peripheral EMU EU-15 countries
This figure illustrates the daily evolution of the estimated conditional level of integration of market iwith the German bond market (θ i,t−1) in the five Peripheral EMU EU-15 countries that are included inour sample
0,0
0,2
0,4
0,6
0,8
1,0
Austria Belgium Finland France The Netherlands
9 August 2007 15 September 2008
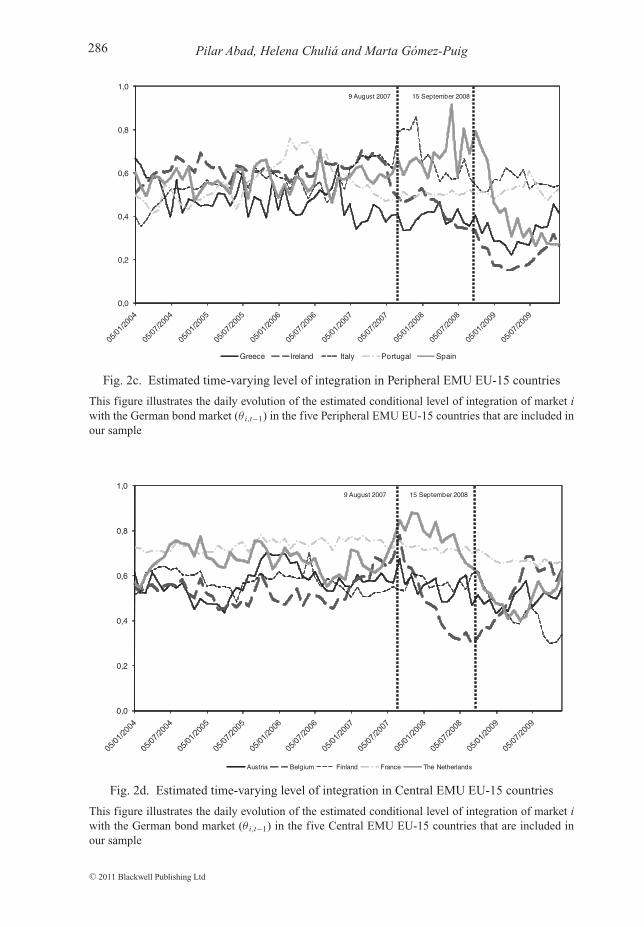
Fig. 2d. Estimated time-varying level of integration in Central EMU EU-15 countries
This figure illustrates the daily evolution of the estimated conditional level of integration of market iwith the German bond market (θ i,t−1) in the five Central EMU EU-15 countries that are included inour sample
C© 2011 Blackwell Publishing Ltd
Time-varying Integration in European Government Bond Markets 287
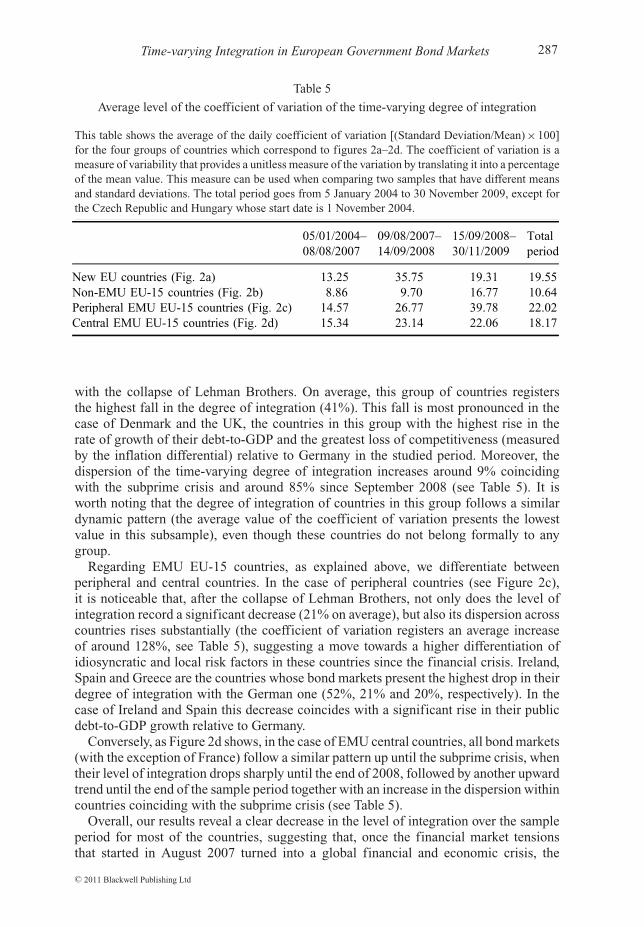
Table 5
Average level of the coefficient of variation of the time-varying degree of integration
This table shows the average of the daily coefficient of variation [(Standard Deviation/Mean)×100]for the four groups of countries which correspond to figures 2a–2d. The coefficient of variation is ameasure of variability that provides a unitless measure of the variation by translating it into a percentageof the mean value. This measure can be used when comparing two samples that have different meansand standard deviations. The total period goes from 5 January 2004 to 30 November 2009, except forthe Czech Republic and Hungary whose start date is 1 November 2004.
05/01/2004– 09/08/2007– 15/09/2008– Total08/08/2007 14/09/2008 30/11/2009 period
New EU countries (Fig. 2a) 13.25 35.75 19.31 19.55Non-EMU EU-15 countries (Fig. 2b) 8.86 9.70 16.77 10.64Peripheral EMU EU-15 countries (Fig. 2c) 14.57 26.77 39.78 22.02Central EMU EU-15 countries (Fig. 2d) 15.34 23.14 22.06 18.17
with the collapse of Lehman Brothers. On average, this group of countries registersthe highest fall in the degree of integration (41%). This fall is most pronounced in thecase of Denmark and the UK, the countries in this group with the highest rise in therate of growth of their debt-to-GDP and the greatest loss of competitiveness (measuredby the inflation differential) relative to Germany in the studied period. Moreover, thedispersion of the time-varying degree of integration increases around 9% coincidingwith the subprime crisis and around 85% since September 2008 (see Table 5). It isworth noting that the degree of integration of countries in this group follows a similardynamic pattern (the average value of the coefficient of variation presents the lowestvalue in this subsample), even though these countries do not belong formally to anygroup.
Regarding EMU EU-15 countries, as explained above, we differentiate betweenperipheral and central countries. In the case of peripheral countries (see Figure 2c),it is noticeable that, after the collapse of Lehman Brothers, not only does the level ofintegration record a significant decrease (21% on average), but also its dispersion acrosscountries rises substantially (the coefficient of variation registers an average increaseof around 128%, see Table 5), suggesting a move towards a higher differentiation ofidiosyncratic and local risk factors in these countries since the financial crisis. Ireland,Spain and Greece are the countries whose bond markets present the highest drop in theirdegree of integration with the German one (52%, 21% and 20%, respectively). In thecase of Ireland and Spain this decrease coincides with a significant rise in their publicdebt-to-GDP growth relative to Germany.
Conversely, as Figure 2d shows, in the case of EMU central countries, all bond markets(with the exception of France) follow a similar pattern up until the subprime crisis, whentheir level of integration drops sharply until the end of 2008, followed by another upwardtrend until the end of the sample period together with an increase in the dispersion withincountries coinciding with the subprime crisis (see Table 5).
Overall, our results reveal a clear decrease in the level of integration over the sampleperiod for most of the countries, suggesting that, once the financial market tensionsthat started in August 2007 turned into a global financial and economic crisis, the
C© 2011 Blackwell Publishing Ltd
05/01/2004–08/08/2007
09/08/2007–14/09/2008
15/09/2008–30/11/2009
Totalperiod
New EU countries (Fig. 2a) 13.25 35.75 19.31 19.55Non‐EMU EU‐15 countries (Fig. 2b) 8.86 9.70 16.77 10.64Peripheral EMU EU‐15 countries (Fig. 2c) 14.57 26.77 39.78 22.02Central EMU EU‐15 countries (Fig. 2d) 15.34 23.14 22.06 18.17
Pilar Abad, Helena Chuliá and Marta Gómez-Puig288
differentiation of country risk factors increased substantially across EU countries.12
Actually, one of the consequences of the global financial crisis is that it has stressedthe relevance of domestic imbalances and local risk factors in explaining bond returns,which were probably not accurately priced by agents during the period of stability thatpreceded it. As a consequence, the negative impact of the crisis has been higher in thegroup of countries that had achieved a higher degree of integration before it started. Thisis the case of EMU countries (in particular, peripheral countries) whose bond markets,after a large period of convergence with the German market, have found their integrationprocess seriously affected.
To conclude, since the relative importance of country components versus other factorsin explaining bond returns rises with the deterioration of the economic situation (theimpact of which differs across European countries) the dynamic CAPM based model wehave applied in the analysis seems to be suitable for examining the time-varying degreeof integration of European government bond markets.
5. Conclusion
The financial turmoil of 2007 and 2008 affected the sovereign bond markets in differentEuropean countries in very different ways. One consequence was a significant rise inyield spreads, along with an increased differentiation of domestic imbalances and localrisk factors. In this paper we analyse the evolving nature of bond market integration withthe eurozone bond market, which is proxied by the German market. Our sample includes16 EU countries, divided into four different groups: (1) Non-EMU new EU (the CzechRepublic, Hungary and Poland), (2) non-EMU EU-15 (Denmark, Sweden and UK),(3) EMU EU-15 peripheral (Greece, Ireland, Italy, Portugal and Spain), and (4) EMUEU-15 central bond markets (Austria, Belgium, Finland, France and the Netherlands).
Our sample period begins in 2004, after a period of calm and tranquillity in EMUmarkets, and ends in 2009, with a significant widening of sovereign bond spreads. Ourmodel builds on Bekaert and Harvey (1995)’s CAPM-based model, and we consider thatthe time-varying coefficient that captures the degree of integration with the eurozonemarket is dependent on a set of domestic economic instruments relative to Germany: theinflation differential, the industrial production index rate of growth differential, and thedebt-to-GDP rate of growth differential.
We provide empirical evidence for a time-varying level of integration, which decreasesin all countries after the beginning of the financial crisis in August 2007. Our resultssuggest that the relative importance of local factors versus other components inexplaining bond returns increases at the same time as the downturn in the economicenvironment in Europe, underlining the imbalances across economies.
The time-series pattern of the degree of integration presents similar trends acrossour four categories of countries (as expected, the average level of integration with theGerman market is higher in EMU than in non-EMU countries, and lower in non-EMU
12 This is in contrast to the rising degree of integration of stock markets during crisis periodsdue to the predominance of world risk factors. A simple correlation analysis of the stock andbond market of each country and those of Germany confirms this result. For example, whilecorrelations between peripheral bond markets and the German bond market have decreasedsince the Subprime crisis (23% in the case of Greece, 9% in Italy and around 2% in Spainand Portugal), the average correlations of their stock returns with Germany have increased.
C© 2011 Blackwell Publishing Ltd
Time-varying Integration in European Government Bond Markets 289
new EU countries than in non-EMU EU-15 countries and also in EMU peripheral thanin EMU central countries), but the impact of the financial and economic crisis clearlydiffers between groups and within countries in the same group.
Specifically, after September 2008, the level of integration records average decreasesof 41%, 22%, 21% and 11% in non-EMU EU-15, new EU, EMU peripheral, and EMUcentral countries respectively. Ireland (52%), Denmark (50%), the United Kingdom(45%), Greece (36%), Poland (28%), and Sweden (26%) are the countries whose bondmarkets present the highest drop in the degree of integration with the German one. Theseresults suggest that as the financial and economic crisis deepened, the relevance of localrisk factors rose, and that the domestic instruments used to describe the time-varyinglevel of integration (the relative inflation, industrial production and debt-to-GDP growth)seem to be important internal factors that explain the differences in its evolution acrosscountries.
Another important insight that emerges from the results is that the countries withthe highest increases in the coefficient of variation of their level of integration withthe German market at the end of the period are those that belong to the euro. This isparticularly the case of the peripheral countries (with increases of around 128% sinceSeptember 2008), suggesting a move towards a higher differentiation of idiosyncraticand local risk factors in these countries after the financial crisis. Conversely, in the caseof non-EMU countries the dispersion of the time-varying degree of integration presentsa more stable trend. This suggests that the impact of the financial and economic crisishas been much more harmful for EMU members’ sovereign bond markets.
In fact, following the launch of the euro, eurozone bond markets achieved a highdegree of integration, which was reflected in the stability and convergence of theiryield spreads over Germany. However, one of the consequences of the global financialcrisis was that it stressed the relevance of domestic imbalances and local risk factors inexplaining bond returns, which were probably not accurately priced by agents in euroarea markets during the period of stability that preceded it. Consequently, the crisis notonly slowed the process of financial integration among EMU bond markets, but alsorevealed the fragility and weaknesses associated with the conduct of the single monetarypolicy in Europe.
References
Abad, P., Chulia, H. and Gomez-Puig, M., ‘EMU and UE-15 government bond market integration’,Journal of Banking and Finance, Vol. 34(12), 2010, pp. 2851–60.
Allen, F. and Song, W. L., ‘Financial integration and EMU’, European Financial Management,Vol. 11(1), 2005, pp. 7–24.
Bekaert, G. and Harvey, C. R., ‘Time-varying world market integration’, Journal of Finance, Vol. 50,1995, pp. 403–44.
Bollerslev, T., Engle, R. F. and Wooldridge, J. M., ‘A capital asset pricing model with time-varyingcovariances’, Journal of Political Economy, Vol. 96, 1998, pp. 116–31.
Bollerslev, T. and Wooldridge, J. M., ‘Quasi-maximum likelihood estimation and inferencein dynamic models with time-varying covariances’, Econometric Review, Vol. 11(2), 1992,pp.143–72.
Campbell, J. Y. and Shiller, R. J., ‘Yield spreads and interest rate movements: a bird’s eye view’, Reviewof Economic Studies, Vol. 58(3), 1991, pp. 495–514.
Christiansen, C., ‘Volatility-spillover effects in European bond markets’, European Financial Manage-ment, Vol. 13(5), 2007, pp. 923–48.
C© 2011 Blackwell Publishing Ltd
Pilar Abad, Helena Chuliá and Marta Gómez-Puig290
De Santis, G. and Gerard, B., ‘International asset pricing and portfolio diversification with time-varyingrisk’, Journal of Finance, Vol. 52, 1997, pp. 1881–1912.
De Santis, G. and Gerard, B., ‘How big is the premium for currency risk?’ Journal of FinancialEconomics, Vol. 49, 1998, pp. 375–412.
Engle, R. F. and Kroner, K. F., ‘Multivariate simultaneous generalized arch’, Econometric Theory,Vol. 11, 1995, pp. 122–50.
Fleming, J., Kirby, C. and Ostdiek, B., ‘Information and volatility linkages in the stock, bond andmoney markets’, Journal of Financial Economics, Vol. 49, 1998, pp. 111–37.
Gardo, S. and Martin, R., ‘The impact of the global economic and financial crisis on central, eastern andsouth-eastern Europe: a stock-taking exercise’, Occasional Paper Series n. 114 (European CentralBank, 2010).
Georgoutsos, D. A. and Migiakis, P. M., ‘Benchmark bonds interactions under regime shifts’, EuropeanFinancial Management, 2011, forthcoming.
Geyer, A., Kossmeier, S. and Pichler, S., ‘Measuring systematic risk in EMU government yield spreads’,Review of Finance, Vol. 8(2), 2004, pp. 171–97.
Gomez-Puig, M., ‘The immediate effect of monetary union over UE-15’s sovereign debt yield spreads’,Applied Economics, Vol. 41, 2009a, pp. 929–39.
Gomez-Puig, M., ‘Systemic and idiosyncratic risk in UE-15 sovereign yield spreads after seven yearsof monetary union’, European Financial Management, Vol. 15(5), 2009b, pp. 971–1000.
Hardouvelis, G. A., Malliaropulos, D. and Priestley, R., ‘EMU and European stock market integration’,Journal of Business, Vol. 79(1), 2006, pp. 365–92.
Hunter, D. M. and Simon, D. P., ‘A conditional assessment of the relationships between the major worldbond markets’, European Financial Management, Vol. 11(4), 2005, pp. 463–82.
Ilmanen, A., ‘When do bond markets reward investors for interest rate risk?’, Journal of PortfolioManagement. Vol. 22(2), 1996, pp. 52–64.
Jorion, P., ‘Risk management lessons from the credit crisis’, European Financial Management,Vol. 15(5), 2009, pp. 923–33.
Kim, S. J., Fariborz, M. and Wu, E., ‘Evolution of international stock and bond market integration:influence of the European Monetary Union’, Journal of Banking and Finance, Vol. 30, 2006,pp. 1507–34.
McQueen, G. and Roley, V., ‘Stock prices, news, and business conditions’, Review of Financial Studies,Vol. 6, 1993, pp. 683–707.
Merton, R. C., ‘On estimating the expected return on the market: an exploratory investigation’, Journalof Financial Economics, Vol. 8(4), 1980, pp. 323–61.
Mody, A., ‘From Bear Stearns to Anglo Irish: how eurozone sovereign spreads related to financialsector vulnerability’, Working Paper 09/108 (International Monetary Fund, 2009).
Pagano, M. and von Thadden, E. L., ‘The European bond markets under EMU’, Oxford Review ofEconomic Policy, Vol. 20(4), 2004, pp. 531–54.
Reinhart, C. and Rogoff, K. S., ‘Banking crises: an equal opportunity’, Working Paper No. 14587(NBER, 2008).
Reinhart, C. and Rogoff, K. S., ‘Growth in a time of debt’, American Economic Review, Vol. 100(2),2010, pp. 573–78.
C© 2011 Blackwell Publishing Ltd
Vol. 18(3), 2012, pp. 389–409.