Bond Market overview - VCBS
151
BÁO CÁO TRIỂN VỌNG 2020 VCBS RESEARCH DEPARTMENT Nov.2020 OUTLOOK 2021
-
Upload
khangminh22 -
Category
Documents
-
view
6 -
download
0
Transcript of Bond Market overview - VCBS

BÁO CÁO TRIỂN VỌNG 2020
VCBS RESEARCH DEPARTMENT
Nov.2020
OUTLOOK 2021

MACROECONOMY
FIXED INCOME MARKET
EQUITY MARKET
INDUSTRY AND STOCK PICKS

MACROECONOMY EQUITY MARKET INDUSTRY & STOCK PICKS FIXED INCOME
WORLD SITUATION- CORRUPTION GROWTH DUE TO THE PANDEMIC
3
Estimated GDP growth in 2020
>6%
3 – 6%
0 – 3%
-3 – 0%
< -3%
Không có dữ liệu GDP Growth in 2019
Source: IMF, VCBS compile
MACROECONOMY EQUITY MARKET INDUSTRY & STOCK PICKS FIXED INCOME
The successive wave of epidemics in many countries, where the
epidemic was contained previously, harms prospects of future recovery.
China is a bright spot for economic recovery after the epidemic.
Pandemic shock reduces global potential growth.
However, the bright spot is that resistance to uncertainty has increased
significantly. Psychological readiness to respond, to live with
translation in a new normal scenario. Countries quite agree on the need
for unprecedented assistance packages.
In 2020, we observe the trend of central banks’ loosening monetary
policy, which increases massively in volume and time horizon. This
fact refers to an upward trend in asset price.
Financial markets benefit from the enormous inflow of capital, with
frontier and emerging markets no exception.
The year 2020 recorded a significant change in the relative strength of
currencies when the USD weakened while many other currencies such
as CNY or EUR tended to strengthen.
Global trade fell sharply due to the impact of the disease, and
commercial defense continued to take place on a global scale.
So far, thank to the successful effort to contain the pandemic, Vietnam
continues to be one of the attractive destinations for foreign investment
WORLD SITUATION- EXPANSIONARY MONETARY POLICY
4
Source: WB, VCBS compile
Global economy colapse due to the pandemic. State banks utilize expansionary monetary policy
0
100
200
300
400
500
600
700
0
1
2
3
4
5
6
01/1
2/0
1
01/1
1/0
2
01/1
0/0
3
01/0
9/0
4
01/0
8/0
5
01/0
7/0
6
01/0
6/0
7
01/0
5/0
8
01/0
4/0
9
01/0
3/1
0
01/0
2/1
1
01/0
1/1
2
01/1
2/1
2
01/1
1/1
3
01/1
0/1
4
01/0
9/1
5
01/0
8/1
6
01/0
7/1
7
01/0
6/1
8
01/0
5/1
9
01/0
4/2
0
Tiền cơ sở tại một số quốc gia
US, $bn billion EUR Japan, ¥ trillions

MACROECONOMY EQUITY MARKET INDUSTRY & STOCK PICKS FIXED INCOME
Growth in Q4 is forecast to reach 4% - 5% due to gradual growth drivers with a post-epidemic recovery. GDP growth in 2020 is expected
to reach 2.73% - 3.06%.
In 2020, GDP in 2021 shall increase by about 6.5% -7.0% based on the contributions of the following components:
We expect consumer demand to grow significantly from the low level of 2020. Retail sales of goods will continue to recover after
disease control efforts have proven effective, with the "new normal" regime, which helps consumer demand rebound even demand
in non-essential consumer goods.
The processing and manufacturing industry remains an important indicator of the health of the manufacturing industry, which
contributes a lot to GDP, showing signs of a positive recovery after the epidemic has been contained.
Along with that, the successful maintenance of macroeconomic stability and the consistent policy of the government in attracting the
influx of capital flows from China, contributing to promoting investment from both public sectors. private. In particular, we draw
attention to infrastructure investment activities not only in traditional economic centers but also in many surrounding satellite cities
such as Long An, Vung Tau, Dong Nai,… in the South or Hai Phong, Quang Ninh, Thanh Hoa… in the North. These are considered
to promote private investment, creating the foundation for sustainable growth of the economy.
ECONOMIC STATUS QUO 2020- OUTLOOK 2021
5
Source: CEIC, GSO, VCBS compile
GDP growth in 2021 shall reach 6,5% - 7,0%
2,8%-3,1%
6,50%-7%
0%
1%
2%
3%
4%
5%
6%
7%
8%
2013 2014 2015 2016 2017 2018 2019 E2020 E2021
GDP growth
Inflation 3,1% -
3,4%
Deposit rates tick down
50 bps
GDP growth
6,5%-7,0%
Exchange rate ±0.5%
CPI

MACROECONOMY EQUITY MARKET INDUSTRY & STOCK PICKS FIXED INCOME
OUTLOOK 2021: ADAPT TO DEVELOP
6
Governments shows consistence in policies to create favorable conditions to attract in inflows.
Preparation means of production: chuẩn bị
về tư liệu sản xuất cơ bản: soil, water,
electricity, infrastructure.
Human resource: especially the quality of
higher education, college and vocational
training
Invest in infrastructure in a number of key
areas, including cities in critical economic
regions in the Southern and Northern
regions.
Prerequisite for development: disease is
contained; smooth coordination of fiscal
and monetary policy; Utilize public
investment to promote private investment.
=> FDI inflows continue to be expected to
be an important source to promote
economic growth in the coming years.
0
5
10
15
20
25
2015 2016 2017 2018 2019 10T.2020
Vốn đầu tư trực tiếp FDI (tỷ USD)
FDI đăng ký (ytd) FDI giải ngân (ytd)

MACROECONOMY EQUITY MARKET INDUSTRY & STOCK PICKS FIXED INCOME
STABILITY - INFLATION
7
Source: CEIC, GSO, VCBS compile
Favorable movements will be maintained in 2021.
-2%
0%
2%
4%
6%
8%
-0.5%
0.0%
0.5%
1.0%
1.5%
01
/15
04
/15
07
/15
10
/15
01
/16
04
/16
07
/16
10
/16
01
/17
04
/17
07
/17
10
/17
01
/18
04
/18
07
/18
10
/18
01
/19
04
/19
07
/19
10
/19
01
/20
04
/20
07
/20
10
/20
01
/21
04
/21
07
/21
10
/21
CPI
CPI (mom) CPI (yoy)
VCBS assesses that 2021 will recognize many favorable factors:
The government will not increase the base salary for 2021.
Although consumer demand is still recovering well, but not strong
enough to create upward pressure on inflation.
Food and foodstuff groups: the price movements of rice and pork:
Vietnam, with the strength of agriculture, can be completely proactive
and control the supply. In addition, the re-herds and import of pig
breeds are also promoted.
Monetary policy is operated flexibly, minimizing impacts.
Prices of public goods, electricity, water under the Government's
control.
However, there are certain factors that put upward pressure on inflation:
Domestic consumption demand recorded a significant improvement in
the non-essential consumption group.
Oil prices depended on the world oil prices; however, oil prices are
unlikely to rise sharply amid global supply chain disruption.
Due to negative impacts from natural disasters, the demand for civil
and repair materials may increase.
The medical group can also record increased pressure according to
global needs, increasing need for treatment due to prevention.
The inflation rate in 2021 is forecasted to be less than 4%. Specifically,
VCBS forecast that inflation will increase by 3.1% - 3.4%.
Foodstuff
Grains
Outdoor
eating
Housing, water,
eletricity, gas
and other fuels
Transport Furniture,
household
equipment and maintenance
Clothing and
footwear
Education
Health
Entertainment
Beverage and
tobacco
Miscellanous
goods and
services
Communication

MACROECONOMY EQUITY MARKET INDUSTRY & STOCK PICKS FIXED INCOME
Exchange rates are expected to have stable movements:
The supply of foreign currency is quite abundant in the context of: (1) Capital
flows of direct and indirect investment and remittances are quite positive; (2)
Trade balance is forecasted to continue a large surplus.
The trend of loosening monetary policy of central banks in the world, cash flow
still looks to bright macroeconomic stability like Vietnam.
Uncertainty is still happening around the world, but investors have become
accustomed to the fact that uncertainties always exist and adapt to these events.
The State Bank still shows a flexible and consistent policy to support and
stabilize the macro-economy in general and exchange rates in particular.
Uncertainty as well as world movements are still a big question mark for the
market, thus, exchange rates may be under certain pressure around volatile events.
The exchange rate will fluctuate in a tight band of 0.5% for the whole year
2021.
STABILITY – EXCHANGE RATES
8
Source: CEIC, Bloomberg, SBV, VCBS compile
Exchange rates will remain stable in 2021.
0
20
40
60
80
100
120
2012 2013 2014 2015 2016 2017 2018 2019 2020E
Exchange reserve (USDbn)
85
87
89
91
93
95
97
99
101
103
105
01/18 04/18 07/18 10/18 01/19 04/19 07/19 10/19 01/20 04/20 07/20 10/20
DXY
20,000
20,400
20,800
21,200
21,600
22,000
22,400
22,800
23,200
23,600
24,000
24,400
03/15 11/15 07/16 03/17 11/17 07/18 03/19 11/19 07/20
Exchange rate USD/VND
Reference exchange rate Ceiling exchange rate
Floor exchange rate VCB spot bid exchange rate
VCB spot offer exchange rate

MACROECONOMY EQUITY MARKET INDUSTRY & STOCK PICKS FIXED INCOME
STABILITY – DEPOSIT AND LENDING RATES
9
Source: GSO, VCBS compile
Credit growth
The orientation of the State Bank towards commercial banks will continue to be
remained, focusing on quality instead of increasing outstanding loans.
Therefore, credit growth is expected to increase lower than 2016-2017, and
nearly equivalent to 2018-2019.
Accordingly, credit will focus on credit institutions with good asset, and will be
less for credit institutions that have not finished handling outstanding debts.
Deposit rates
We expect deposit rates may decrease further, then stabilize at the low levels:
Central banks over the world are expected to maintain loosening monetary
policy for a long time.
The central bank's direction is to reduce interest rates and spend resources to
deal with bad debts. Accordingly, VCBS will observe management actions,
especially the Circular amending Circular 01.
The increasing trend of deposit rates in the previous years mainly came from
mobilizing to adapt safety ratios, attracting customers, and having sources for
credit loans. By 2021, under the management of the State Bank, with credit will
focus on quality, thus, the trend of increasing interest rates is unlikely to return.
Risks: Upward pressure on deposit rates may appear at the end of the year,
when banks promote lending activities, as well as businesses and residents tend
to withdraw money from the system. However, VCBS believes that this
pressure, if any, will not be large, credit for the whole year is forecast to
increase by 11-12%, lower than the 2016-2017 period.
Lending rates
The target of reducing lending interest rates (for the whole year) to support growth
can be achieved thanks to the following factors:
Foreign investment cash flow creates favorable conditions for liquidity
The decreasing deposit rates is basic for the downward trend on lending rates.
Deposit rates are forecasted to decrease by 50 points and then stabilize on the
low levels. Lending rates may decrease by 30-50 points.
4%
9%
14%
19%
24%
29%
34%
2010 2011 2012 2013 2014 2015 2016 2017 2018 2019 E2020 E2021
Credit growth
3.00
3.50
4.00
4.50
5.00
5.50
6.00
6.50
7.00
7.50
8.00
Deposit rates (Unit: %)
HĐ 1 tháng HĐ 3 tháng HĐ 6 tháng HĐ trên 12 tháng

MACROECONOMY
FIXED INCOME MARKET
EQUITY MARKET
INDUSTRY AND STOCK PICKS

MACROECONOMY EQUITY MARKET INDUSTRY & STOCK PICKS FIXED INCOME
GOVERNMENT BOND MARKET- STATUS QUO 2020
11
Source: HNX, VCBS compile
0
2000
4000
6000
8000
10000
12000
14000
16000
18000
20000
0.00%
1.00%
2.00%
3.00%
4.00%
5.00%
6.00%
7.00%
Oct
07
- O
ct 1
1
Oct
21
- O
ct 2
5
Oct
28
- N
ov
01
No
v 1
1 -
No
v 1
5
No
v 2
5 -
No
v 2
9
Dec
09
- D
ec 1
3
Jan
06
- J
an 1
0
Jan
20
- J
an 2
4
Feb
10
- F
eb 1
4
Feb
24
- F
eb 2
8
Mar
09
- M
ar 1
3
Mar
23
- M
ar 2
7
Ap
r 0
6 -
Ap
r 1
0
Ap
r 2
0 -
Ap
r 2
4
May
04
- M
ay 0
8
May
18
- M
ay 2
2
Jun
01
- J
un
05
Jun
15
- J
un
19
Jun
29
- J
ul
03
Jul
13
- J
ul
17
Jul
27
- J
ul
31
Au
g 1
0 -
Au
g 1
4
Au
g 2
4 -
Au
g 2
8
Sep
07
-
Sep
11
Sep
21
-
Sep
25
Oct
05
-
Oct
09
Oct
19
-
Oct
23
No
v 0
2 -
No
v 0
6
Volume (VND bn) Winning rates Auction results
Volume 5Y 7Y 10Y 15Y 20Y 30Y
0
10,000
20,000
30,000
40,000
50,000
60,000
70,000
01
/19
02
/19
03
/19
04
/19
05
/19
06
/19
07
/19
08
/19
09
/19
10
/19
11
/19
12
/19
01
/20
02
/20
03
/20
04
/20
05
/20
06
/20
07
/20
08
/20
09
/20
10
/20
Primary market
KBNN NHCSXH NHPT
0.0%
1.0%
2.0%
3.0%
4.0%
5.0%
6.0%
7.0%
8.0%
01
/16
04
/16
07
/16
10
/16
01
/17
04
/17
07
/17
10
/17
01
/18
04
/18
07
/18
10
/18
01
/19
04
/19
07
/19
10
/19
01
/20
04
/20
07
/20
10
/20
Bond yields
2Y 3Y 5Y 7Y 10Y 15Y
After being under strong and rapidly increasing pressure at the end of Q1.2020, the
downtrend dominated the Government bond market.
The reasons for the increase in bond yields at the end of Q1: (1) Exchange rate
was under pressure; Along with that, (2) Interbank interest rates slightly increased
and (3) Market members were more cautious in the context of complicated Covid-
19 translation, affecting most of the manufacturing and business sectors.
The reasons explain the downward trend in bond yields later on: (1) Interbank
interest rates maintained at a record low level, indicating a surplus of liquidity in
the banking system, (2) Demand for investment in Risk-free assets continue to
increase in the context of existing uncertainties (3) Psychology of market
members is getting more confident as the Government's measures in the
implementation of dual goals are drastic and effective. (4) Recent legal
documents and draft sub-law documents refer to a closer inspection, which aims
at more sustainable development of other fixed-income product, recently
considered to be a replacement product to government bond.

MACROECONOMY EQUITY MARKET INDUSTRY & STOCK PICKS FIXED INCOME
In 2020, SBV cut rates three times. In the context of abundant liquidity due to slow credit growth, interbank record a downward force and
even reach a record-breaking low level.
OUTLOOK FOR INTERBANK MARKET
12
Source: NHNN. Bloomberg, VCBS compile
In the context of (1) ample liquidity, (2) stable exchange rates, (3) direct and indirect investment flows that continue to rush to the
Vietnamese market, we expect interbank interest rates to stabilize on the current low threshold.
However, interest rates may slightly tick up for some times due to: (1) seasonal factors, (2) credit growth rebounds, (3) deposits of the
State Treasury in the system Commercial banks as well as the progress of disbursement of public investment capital.
Besides, the interbank interest rate depends heavily on the management as well as the direction of the State Bank in the open market
through repo and treasury bills, which should be considered to be a factor.
Thus, market factors supporting the interbank interest rate level can remain at a low level, but still under upward pressure around
certain times.
Interbank rate settle at a record-breaking low level.
0.0%
2.0%
4.0%
6.0%
01
/16
03
/16
05
/16
07
/16
09
/16
11
/16
01
/17
03
/17
05
/17
07
/17
09
/17
11
/17
01
/18
03
/18
05
/18
07
/18
09
/18
11
/18
01
/19
03
/19
05
/19
07
/19
09
/19
11
/19
01
/20
03
/20
05
/20
07
/20
09
/20
11
/20
ON 1W 2W 1M
Interbank market Trước 16/3 12/5 1/10
Refinancing rate 6,00% 5,00% 4,50% 4,00%
Rediscounting rate 4,00% 3,50% 3,00% 2,50%
OMO rates 4,00% 3,50% 3,00% 2,50%
Ceiling rates time deposits < 1M 0,80% 0,50% 0,20% 0,20%
Ceiling rates time deposits 1-6M 5,00% 4,75% 4,25% 4,00%
Ceiling rates for short-term loan in prioity sector 6,00% 5,50% 5,00% 4,50%
MACROECONOMY EQUITY MARKET INDUSTRY & STOCK PICKS FIXED INCOME
GOVERNMENT BOND MARKET-– OUTLOOK 2021
13
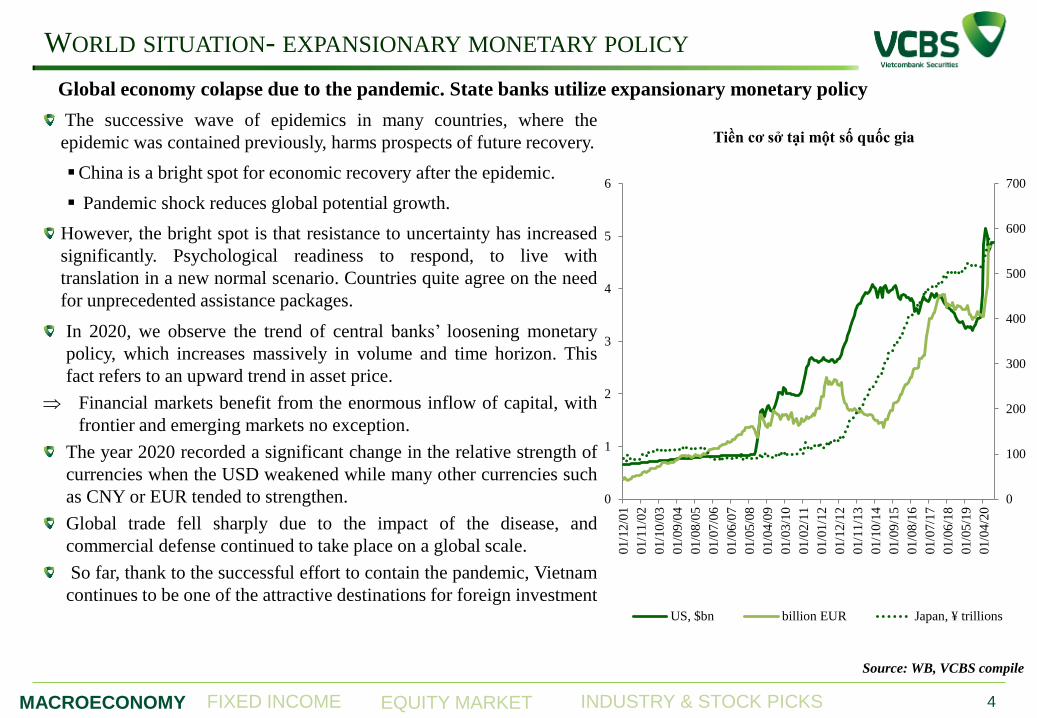
Demand for bond issuance increases, issue plan is forecasted
about 300-330 trillion (8% -10% compared to 2020).
On the demand side, the demand for investment in government
bonds can balance the demand for the amount of issuance.
The supply of foreign currency is relatively good. Liquidity of
the banking system is abundant.
The amount of matured government bonds increased compared
to 2020, but it is expected to be reinvested in government bonds
when credit demand does not increase dramatically.
Yield fluctuation trend: It is expected that the bond yields have
room to decrease further, but the degree and volatility will not
be as large as in 2020 because the market is quite consensus.
There may be short-term uptrends following the fluctuations in
world markets.
We forecast 10Y should fluctuate around 2% -2.85%.
The highest liquidity based on tenor should be 7-10Y and even
move to longer tenors (over 10Y) due to better yields than cost
of capital.
Source: HNX, VCBS Research
0
5,000
10,000
15,000
20,000
25,000
30,000
35,000
40,000
01
/21
02
/21
03
/21
04
/21
05
/21
06
/21
07
/21
08
/21
09
/21
10
/21
11
/21
12
/21
VND bn Bond matured in 2021
KBNN NHPT VBS Khác
300-330
0
50
100
150
200
250
300
350
2017 2018 2019 2020E 2021E
x 1
,00
0 V
ND
bn
Government bond issued
Bond Matured Bond issued
Risks
Stricter regulations on government bond replacement products such as bonds of credit institutions and enterprises; Orientation on
completing the legal framework for market management and management in stable market conditions.
An unexpected factor appeared in the market, causing tighten liquidity of the banking system, especially related to fluctuations in
world markets and exchange rates, if any.

MACROECONOMY EQUITY MARKET NGÀNH VÀ DOANH NGHIỆP TRIỂN VỌNG FIXED INCOME
BOND MARKET –2020
14
DIVERSIFICATION INTO CORPORATE BONDS
Source: HNX, VCBS
80,254
141,340 181,093
248,024 256,223
312,205
244,221
157,547
197,769 228,699
25,000
28,707
34,412
48,047
42,769
97,413
115,416
146,039
296,713 303,800
0
100,000
200,000
300,000
400,000
500,000
600,000Issued bond
Gov Bond Gov-Backed Bond Muni Bond Corp Bond
8.0% 9.7%
12.2% 14.3%
16.2%
27.3% 27.6% 27.9% 26.9% 27.9% 3.3% 2.0%
2.7% 2.5%
3.4%
5.3% 6.2% 7.9% 11.3%
14.4%
0%
5%
10%
15%
20%
25%
30%
35%
40%
45%
50%Outstanding bond/GDP
Gov Bond Gov-Backed Bond Muni Bond Corp Bond

MACROECONOMY EQUITY MARKET INDUSTRY & STOCK PICKS FIXED INCOME
BOND MARKET – Primary market
15
Source: HNX, VCBS
0
10,000
20,000
30,000
40,000
50,000
60,000
70,000
Jan 1
9
Feb
19
Mar
19
Apr
19
May
19
Jun
19
Jul
19
Aug
19
Sep
19
Oct
19
Nov
19
Dec
19
Jan 2
0
Feb
20
Mar
20
Apr
20
May
20
Jun
20
Jul
20
Aug
20
Sep
20
Oct
20
Primary market
ST VBSP VDB
0
2000
4000
6000
8000
10000
12000
14000
16000
18000
20000
0.00%
1.00%
2.00%
3.00%
4.00%
5.00%
6.00%
7.00%
Oct
07
- O
ct 1
1
Oct
21
- O
ct 2
5
Oct
28
- N
ov
01
No
v 1
1 -
No
v 1
5
No
v 2
5 -
No
v 2
9
Dec
09
- D
ec 1
3
Jan
06
- J
an 1
0
Jan
20
- J
an 2
4
Feb
10
- F
eb 1
4
Feb
24
- F
eb 2
8
Mar
09
- M
ar 1
3
Mar
23
- M
ar 2
7
Ap
r 0
6 -
Ap
r 1
0
Ap
r 2
0 -
Ap
r 2
4
May
04
- M
ay 0
8
May
18
- M
ay 2
2
Jun
01
- J
un
05
Jun
15
- J
un
19
Jun
29
- J
ul
03
Jul
13
- J
ul
17
Jul
27
- J
ul
31
Au
g 1
0 -
Au
g 1
4
Au
g 2
4 -
Au
g 2
8
Sep
07
-
Sep
11
Sep
21
-
Sep
25
Oct
05
-
Oct
09
Oct
19
-
Oct
23
No
v 0
2 -
No
v 0
6
Vol (VND bn) Wininng rates GB Auction results
Volume 5Y 7Y 10Y
15Y 20Y 30Y
5.05 5.75
8.7
13.03 12.41
13.45 13.67
3
5
7
9
11
13
15
Average issued tenors
0%
10%
20%
30%
40%
50%
60%
70%
80%
90%
100%
-
20000.0
40000.0
60000.0
80000.0
100000.0
120000.0
140000.0
160000.0
5Y 7Y 10Y 15Y 20Y 30Y
Goverment bond issuance 10M.2020
Offering volume Winning volume
Winning-to-offering ratio Issuing plan
Banks Other
financial
institutions
Government bond‟s holders

MACROECONOMY EQUITY MARKET INDUSTRY & STOCK PICKS FIXED INCOME
BOND MARKET – Secondary market
16
Source: HNX, Bloomberg, VCBS
DOWANWARD FORCE IS EXPECTED TO DOMINATE BOND MARKET
0.0%
2.0%
4.0%
6.0%
01
/16
03
/16
05
/16
07
/16
09
/16
11
/16
01
/17
03
/17
05
/17
07
/17
09
/17
11
/17
01
/18
03
/18
05
/18
07
/18
09
/18
11
/18
01
/19
03
/19
05
/19
07
/19
09
/19
11
/19
01
/20
03
/20
05
/20
07
/20
09
/20
11
/20
ON 1W 2W 1M
Interbank rates
0.0%
1.0%
2.0%
3.0%
4.0%
5.0%
6.0%
7.0%
8.0%
01
/16
04
/16
07
/16
10
/16
01
/17
04
/17
07
/17
10
/17
01
/18
04
/18
07
/18
10
/18
01
/19
04
/19
07
/19
10
/19
01
/20
04
/20
07
/20
10
/20
Bond Yields
2Y 3Y 5Y 7Y 10Y 15Y
0.0
1.0
2.0
3.0
4.0
1Y 2Y 3Y 5Y 7Y 10Y 15Y
Yield Curve
6/30/2020 9/30/2020
10/30/2020
1,429
789 270 422
-222
1,681
-275 -465
624
-655
1,209 963
2,121
1,445
2,933
48 720
2,870
1,721
907
2,240
-553 -672 37
938
-1,712 -1,880
1,254 1,768
2,269
43
-485
1,177
255
01
/18
04
/18
07
/18
10
/18
01
/19
04
/19
07
/19
10
/19
01
/20
04
/20
07
/20
10
/20
Foreign investors in the secondary market
Net position (Unit: bn.VND)0%
10%
20%
30%
40%
50%
60%
70%
80%
90%
100%
Outright
<3 3-5 5-7 7-10 > 10Y
1,668
3,642 3,655
6,354
8,962
8,756 7,977 7,861
0
1,000
2,000
3,000
4,000
5,000
6,000
7,000
8,000
9,000
10,000
0
300
600
900
1,200
1,500
1,800
2,100
2,400
VN
D b
n
x1
,00
0 V
ND
bn
Total volume (left side) Average daily volume (right side)

MACROECONOMY EQUITY MARKET INDUSTRY & STOCK PICKS FIXED INCOME
GOVERNMENT BOND MARKET – 2021 OUTLOOK
17
Volume of bond issuance is forecasted about VND 300-
330 trillion (+8%-10% yoy).
The investment demand for Government bonds can
completely balance the amount of forecasted bond
issuance.
Liquidity of the banking system, if seasonal effects are
excluded, is likely to be abundant.
Bond yields have room to decrease, however, the
volatility may appear more in 2021.
The highest liquidity based on tenors should be 7-10Y
tenors (and >10Y tenor).
Risks: An unexpected factor appeared in the market,
causing the operator to tighten the liquidity of the
banking system.
KEY FACTORS
Liquidity on interbank market.
SBV’s regulating policy
Disbursement for infrastructure speed up
Trend of higher asset prices in the world.
Sentiment over macro-economics foundation.
Source: HNX, VCBS Research
0
5,000
10,000
15,000
20,000
25,000
30,000
35,000
40,000
Jan-2
1
Feb
-21
Mar
-21
Apr-
21
May
-21
Jun
-21
Jul-
21
Aug
-21
Sep
-21
Oct
-21
Nov
-21
Dec
-21
VND Billion Matured Bonds in 2021
ST VDB VBSP Other

MACROECONOMY EQUITY MARKET INDUSTRY & STOCK PICKS FIXED INCOME
CORPORATE BOND MARKET – 3Q. 2020 RECAP
18
Real estate
Banks
Electricity,
Water
Securities
Construction
Other
financial
instutions Others
Issued bonds by industry
25,000
28,707
34,412
48,047
42,769
97,413
115,416
146,039
296,713 303,800
0
100,000
200,000
300,000
400,000
500,000
600,000
2011 2012 2013 2014 2015 2016 2017 2018 2019 9M.2020
Issued bond
Gov Bond Gov-Backed Bond Muni Bond Corp Bond
Decree 81/2020 / ND-CP effect from September 2020 has significantly reduced the amount of issued bonds issued in the last month
of the third quarter. However, the previous period saw the large amount of issued bonds.
On July 28, HNX issued Document No. 384/QD-SGDHN on the Regulation on operation of the Website corporate bond
information.
The SBV is drafting a Circular on purchase and sale of notes, treasury bills, certificates of deposit, bonds issued by other credit
institutions, foreign bank branches. In which, valuable papers can be purchased with tenor less than 12 months in secondary
market.
Source: Fiinpro, HNX, VCBS compiles

MACROECONOMY EQUITY MARKET INDUSTRY & STOCK PICKS FIXED INCOME
CORPORATE BOND MARKET – 3Q. 2020 RECAP
Volume
(VNDbn)
Average
tenors
Average
yields
HDBank 19,527 8.5 7.5%
Sovico 18.000 3 10.5%
Masan 14,085 3 9.5%
VIB 13.500 3 5.7%
Vinhomes 12.000 2.5 9.5%
Volume
(VNDbn)
Average
tenors
Average
yields
Phat Dat Corporation 510 1 13.0%
Centre of international
relation & investment 50 1 13.0%
IDJ 229 3 13.0%
Nam La Hydro power 100 3.5 13.0%
Trinh Gia Nguyen
Telecommunications 1,400 1 12.5%
0
1
2
3
4
5
6
7
8
Electricity,
Water
Banks Real estate Construction Securities Other
financialinstutions
Others
Average tenors
Average
0%
2%
4%
6%
8%
10%
12%
14%
Other
financialinstutions
Construction Real estate Electricity,
Water
Others Securities Banks
Average yields
Average
Table. Top 5 companies issue the largest volume of bonds Table. Top 5 companies issue the highest yield of bonds
Source: Fiinpro, HNX, VCBS compiles

MACROECONOMY
FIXED INCOME MARKET
EQUITY MARKET
INDUSTRY AND STOCK PICKS

MACROECONOMY EQUITY MARKET INDUSTRY & STOCK PICKS FIXED INCOME
STOCK MARKET HIGHLIGHTS IN 2020
21
Source: Bloomberg, VCBS
80
88
96
104
112
120
128
136
144
400
450
500
550
600
650
700
750
800
850
900
950
1,000
1,050
1,100
1,150
VN Index HNX Index
VN Index -4,6% HNX Index +31,4%
GDP Q1.2020
+3,82% yoy
The US - China
signed trade
agreement
Phase 1 China imposed
lockdown 3 cities in
Hubei province
Oil prices
plummeted
because Russia
and OPEC did not
reach an
agreement
WTI crude oil prices
delivered in May closed
at negative prices
The WHO declares Covid-
19 as a global pandemic
Vietnam airlines are
allowed to increase
their domestic flight
frequency by 2.5 times
SBV lowered the
executive interest
rate for the second
time this year
The Chinese
National Assembly
passed the National
Security Law in
Hong Kong
New developments
appeared in the US-
China trade war
GDP Q2.2020
+0,36% yoy
FED announced new
inflation approach
EVFTA is in
effect
SBV lowered the
executive interest rate
for the third time this
year
GDP Q3.2020
+2,62% yoy

MACROECONOMY EQUITY MARKET INDUSTRY & STOCK PICKS FIXED INCOME
STOCK MARKET HIGHLIGHTS IN 2020
Source: Fiinpro, Bloomberg, VCBS
Q1.2020 witnessed the largest drop of VN Index since
August 2001 as Covid-19 became a pandemic. Due to the
decrease of the majority of sectors, the benchmark index
declined by 24.9%, with the most affected sectors
including aviation, travel & entertainment. However,
thanks to the success in disease control and the timely
social distancing period, the uptrend dominated during Q2
and Q3. Bullish index along with improving liquidity
indicated the optimism of investors about the long-term
economic outlook. As most of the world has not been able
to effectively contain the pandemic, many developed
countries have to face shutdowns, Vietnam’s market
occupied the spotlight as an outperforming economy.
In the last quarter, VN Index suddenly surpassed 970
points, erasing the decline in first half of 2020 during the
announcement of listed companies’ Q3 business results in
October 2020. The gain was led by the banking sector and
several other large-cap stocks such as VNM, HPG, MSN,
etc. However, at the beginning of November, the lack of
supportive information and profit-realizing pressure
caused VN Index to fluctuate around 940 points.
4
0
100
200
300
400
500
600
700
800
400
500
600
700
800
900
1,000
1,100
Volume VN Index
-1.5%
-1.0%
-0.5%
0.0%
0.5%
1.0%
1.5%
MSN HPG CTG VNM GVR SAB BID VHM VIC GAS
Top contribution to VN Index in 2020

MACROECONOMY EQUITY MARKET INDUSTRY & STOCK PICKS FIXED INCOME
RELATIVE VALUATIONS OF VIETNAM’S STOCK MARKET IN 2020
Source: Fiinpro, Bloomberg, VCBS
0
5
10
15
20
25
30
35
40
45 Sectors‟ P/E in Vietnam
15.95
11.07
28.88
23.05 20.71
2.05 1.74 1.39 1.43 1.43
0
5
10
15
20
25
30
35
VN Index IDX Composite Index FTSE Bursa Malaysia
EMAS Index
PSE All shares Index SET Index
Vietnam Indonesia Malaysia Phillipines Thailand
Average P/E & P/B in ASEAN markets
P/E
P/B
5
0.0
0.5
1.0
1.5
2.0
2.5
3.0
3.5
Sectors' P/B in Vietnam
2019
2020

MACROECONOMY EQUITY MARKET INDUSTRY & STOCK PICKS FIXED INCOME
-40,000
-30,000
-20,000
-10,000
0
10,000
20,000
30,000
40,000
Jan-20 Feb-20 Mar-20 Apr-20 May-20 Jun-20 Jul-20 Aug-20 Sep-20 Oct-20
Foreign sector transaction volume (HSX, HNX & Upcom) (VND thousand billion)
Giá trị mua
Giá trị bán
Giá trị ròng
FOREIGN INVESTORS’ HIGHLIGHTS IN 2020
24
Source: Fiinpro
-4,000,000
-2,000,000
0
2,000,000
4,000,000
6,000,000
8,000,000
10,000,000
12,000,000
14,000,000
16,000,000
18,000,000
VHM PLX PGD MWG PHR VJC VRE VIC HPG MSN
Foreign sector net buy/(sell) (VND million) Due to the impact of economic distress from the
Covid-19 pandemic, foreign investors net sold
since February 2020, among which the most
aggressive selling periods were Q1, August and
October. Up until Nov 10th, net selling value of
foreign investors was VND 11,554 billion in all
three exchanges (namely HSX, HNX and
UpCom).
The most noticeable put-through transaction in
2020 belongs to the deal of VHM’s shares in
June with total value reaching VND 15,000
billion. On the other hand, VRE, VIC, MSN and
HPG were the most net-sold shares.

BRENT CRUDE OIL
25
Daily Weekly Monthly Quaterly Yearly YTD
-1.29% 7.85% -3.79% -4.60% -35.14% -38.79%
Price changes (as at November 06th, 2020)
• In 2020, Brent crude oil’s price fell below USD 20 per
barrel at times.
• The movement of global oil prices in 2020 is relatively
unstable, and we have seen many factors affecting oil
prices, from geopolitical fluctuations, advances in
science and technology or policy shifting of countries in
the world, especially crude oil producing countries. But
the strongest impact on oil price movements is still the
Covid-19 epidemic.
• Prestigious financial institutions in the world have
released many different forecasts for oil prices.
Specifically, International Monetary Fund predicts that
global oil price in 2021 will be in the range of USD 40-
50 per barrel, equivalent to half of the USD 80 per
barrel price that Saudi Arabia needs to achieve the
balance of its state budget.
• Meanwhile, the bank of Morgan Stanley forecasts that
Brent oil price will reach USD 50.00 per barrel in
1H.2021 thanks to a weak dollar and accelerating
inflation, while WTI oil prices will reach USD 47.50
per barrel in Q3.2021.
0.00
10.00
20.00
30.00
40.00
50.00
60.00
70.00
80.00
US
D/b
arr
el
Oil prices 2020
Source: Bloomberg, VCBS

NATURAL RUBBER
26
Daily Weekly Monthly Quaterly Yearly YTD
-2.29% -2.17% 10.11% 29.65% 13.12% 5.79%
Price changes (as at November 06th, 2020)
• In 2020, natural rubber price witnessed a new record:
Price reached the highest level in years on October 29th,
2020 after a Reuters poll showed that China's economy
in 2021 would recover strongly from the recession
caused by the Covid-19 pandemic.
• According to the Association of Natural Rubber
Producing Countries (ANRPC), in 2020, natural rubber
production will face difficulties due to epidemics,
which will limit labor force in the industry and make
transportation more difficult. The world’s natural rubber
production has decreased by 8.70% in the first 8 months
of 2020, reaching 7.778 million tons, and is expected to
decrease by 3.00% more in the remaining 4 months of
2020 and Q1.2021.
• However, ANRPC forecasts that the trend of rising
rubber prices will continue to exist in the coming
months, mainly due to the recovery of China's
manufacturing sector, amid an increase in car sales in
India and the prospect of a new economic stimulus
program in the U.S.. September was the first month the
automobile industry recovered almost globally, after a
long period of decline caused by the Covid-19
epidemic.
0.00
20.00
40.00
60.00
80.00
100.00
120.00
140.00
160.00
180.00
200.00
US
D/k
g
Rubber prices 2020
Source: Bloomberg, VCBS

STEEL
27
Daily Weekly Monthly Quaterly Yearly YTD
0.00% 3.33% 7.86% 10.49% 2.97% 4.42%
Price changes (as at November 06th, 2020)
• China’s spot steel prices have recovered towards the
end of 2020. In 2020, steel prices have fallen below
CNY 520.00 per ton at times due to the impact of trade
war tensions as well as signals of China’s decelerating
economic growth due to the effects of Covid-19
pandemic.
• Sales volume recovered in Q2.2020, due to higher
demand from real estate sector. Compared with the 14%
decrease over the same period in Q1.2020, 1 percentage
point lower than the same period in Q2.2020 can be
considered an impressive sign of recovery.
• Meanwhile, iron ore prices in 2020 and the following
years are forecast to decline due to more abundant
supply but lower demand.
• The World Steel Association (Worldsteel) forecasts that
global steel demand will decrease by 6.40% in 2020 due
to the negative impact of the Covid-19 epidemic, but
will gradually recover in 2021.
• According to Worldsteel’s experts, there is a possibility
that the decline in steel demand in most countries will
not be as serious as the situation of the global economy,
as Covid-19 has more serious effects on industries with
less usage steel, like consumption and services.
However, in many developed economies, steel demand
has not fully recovered since the 2008 financial crisis
and still remained low.
480.00
500.00
520.00
540.00
560.00
580.00
600.00
CN
Y/T
on
Chinese steel spot price 2020
Source: Bloomberg, VCBS

MACROECONOMY EQUITY MARKET INDUSTRY & STOCK PICKS FIXED INCOME
MSCI FRONTIER MARKET 100 INDEX RAISING VIETNAMESE
STOCKS’ WEIGHT
28
Source: Bloomberg, VCBS
As Kuwait has been upgraded to Emerging Market since
November 2020, MSCI also announced the new weight of the
constituents in MSCI Frontier Market 100. In particular, MSCI
Frontier Market 100 index will be restructured in 5 stages to
exclude Kuwait’s stocks from the index, from November 2020 to
November 2021.
After the first restructuring phase in November 2020, the weight of
Vietnamese stocks in MSCI Frontier Market 100 Index will
increase to 15.76% from the current 12.65%. We estimates that the
ETF Ishare MSCI Frontier Market 100 ETF will net buy about
VND 280 billion after the restructuring phase in November 2020
allocated to 28 Vietnamese stocks, with PDR and KDC being
newly added stocks.
Source: MSCI
Ticker
Current
Weight
(%)
Expected
Weight post-
phase 1 (%)
Expected
Value post-
phase 1
(USD)
Expected Net
Buy post-phase 1
(USD)
Expected Net Buy
post-phase 1
(VND)
1 VRE 0.47 0.58 2,274,680 421,272 9,794,567,424
2 VNM 2.06 2.55 10,033,295 1,911,947 44,452,758,336
3 VJC 0.45 0.55 2,177,885 403,107 9,372,230,266
4 VIC 2.1 2.55 10,033,295 1,777,391 41,324,345,751
5 VHM 1.45 1.78 7,017,630 1,312,620 30,518,421,498
6 VHC 0.1 0.12 483,974 76,353 1,775,206,904
7 VGC 0.16 0.20 774,359 154,201 3,585,173,534
8 VCB 0.83 1.02 4,016,988 736,366 17,120,502,517
9 TCH 0.1 0.12 483,974 102,596 2,385,367,814
10 STB 0.17 0.21 822,757 165,881 3,856,738,638
11 SSI 0.18 0.22 871,154 178,665 4,153,950,119
12 SHB 0.19 0.23 919,552 172,643 4,013,955,580
13 SBT 0.11 0.15 590,194 163,805 3,808,473,533
14 SAB 0.31 0.38 1,500,321 273,226 6,352,502,290
15 PVS 0.09 0.11 435,577 80,261 1,866,077,681
16 POW 0.12 0.15 580,769 100,996 2,348,156,167
17 PLX 0.14 0.17 677,564 120,467 2,800,867,124
18 NVL 0.39 0.48 1,887,501 371,421 8,635,533,392
19 MSN 1.07 1.32 5,178,527 984,823 22,897,132,843
20 KBC 0.08 0.10 387,180 62,804 1,460,188,957
21 HPG 1.29 1.59 6,243,271 1,165,985 27,109,151,419
22 HDB 0.26 0.32 1,258,334 217,097 5,047,507,979
23 GEX 0.15 0.18 725,962 154,940 3,602,362,968
24 GAS 0.13 0.16 629,167 115,805 2,692,457,036
25 BVH 0.08 0.10 387,180 72,216 1,679,015,865
26 BID 0.17 0.21 822,757 143,946 3,346,735,240
27 PDR 0 0.10 393,463 393,463 9,148,004,415
28 KDC 0 0.10 393,463 393,463 9,148,004,415

MACROECONOMY EQUITY MARKET INDUSTRY & STOCK PICKS FIXED INCOME
DERIVATIVE MARKET HIGHLIGHTS IN 2020
29
Source: Fiinpro, Bloomberg, VCBS
• After the sell-off in March, VN30 Index had an impressive recovery momentum, by the end of October 2020, the index had
increased by 54.00% compared to the lowest point of 600. During the highly volatile period in Q2 and Q3, the derivative
market was driven by speculators. However, from the end of Q3 until now, VN30 recovered strongly to 900 points with
positive cash flow returning to the underlying stock market and liquidity in the derivative market shrinking.
• As of now, the underlying index has increased 1.80% YTD while VN30F1M has increased by 2.50%. Market liquidity also
improved significantly compared to 2019’s, namely the average total trading volume per session reached more than 161,600
contracts (up by 90% compared to that in 2019) and the total average transaction by session reached VND12,700 billion
(67% higher than that in 2019). The average number of open interests (OI) per session also reached more than 23,500
contracts, which was an increase of 17.50% compared to that in 2019.
• Besides VN30 futures, Covered Warrants (CW) market also recorded many impressive milestones. The total number of CWs
on the market currently is 107, based on 21 underlying stocks. However, CW market is still one-way long market, only
allowing call options to be listed.
400.00
500.00
600.00
700.00
800.00
900.00
1,000.00
50,000
100,000
150,000
200,000
250,000
300,000
350,000
400,000
01/08/2020 02/08/2020 03/08/2020 04/08/2020 05/08/2020 06/08/2020 07/08/2020 08/08/2020 09/08/2020 10/08/2020
Khối lượng GD Vị thế mở VN30 VN30F1M

VIETNAM‟S
STOCK MARKET
OUTLOOK IN 2021

MACROECONOMY EQUITY MARKET INDUSTRY & STOCK PICKS FIXED INCOME
In 2021, we expect the Vietnam’s stock market outlook and market
size to achieve a certain growth compared to 2020’s but the growth
rate will somewhat be limited, due to the fact that most supportive
factors in 2020 are forecast to not improve but even weaken in
2021. Some key takeaways are as follows:
The peaks of benchmark indices in 2021 are projected to
increase by about 8-15% compared to those at the end of
2020, and will be greatly affected by the recovery rate of the
Vietnam’s economy in the context of the "new normal” in
Vietnam and the development of the Covid-19 pandemic
globally.
VN Index tends to move around a higher "base", but the
fluctuation range (the difference between the year's highest
and lowest) will be around 120-150 points and not as large as
in 2020, while HNX Index is projected to fluctuate in a
range of ~ 20 points.
Average trading volume in 2021 continued to improve
compared to that in 2020, reaching an average of 400-410
million shares per session on all three exchanges,
equivalent to an increase of about 5% yoy.
Trading value is expected to increase by about 8.00%
corresponding to an average trading value per session of
about VND 6,900-7,000 billion on all three exchanges.
STOCK MARKET’S OUTLOOK IN 2021
31
PROJECTIONS OF BENCHMARK INDICES
Source: Fireant, VCBS

MACROECONOMY EQUITY MARKET INDUSTRY & STOCK PICKS FIXED INCOME
PUBLIC INVESTMENT PLAN AND DISBURSEMENT IN 2021
15
Investing in new projects in 2021 will not be easy
Limited resources: Public investment in 2021 will slightly increase compared to the disbursement plan in 2020, at VND
477,300 billion (+ 1.4% yoy). However, according to the statistics of the Ministry of Planning and Investment, the capital
demands from ministries and provinces are 682,000 billion VND.
The gap time between submitting and approving mid-term public investment plans for the period 2021-2025 is
interpolated with 2021’s investment plan. 2021 is the first year of the five-year socio-economic development plan as well
as the first year of the mid-term public investment plan for the period of 2021-2025, but it is only until July 2021 that the
mid-term plan is officially approved.
With (1) limited funding and (2) late approval of the investment plan, highly prioritized investments for 2021 will be
transitional projects and those completing in 2021, focusing on projects that have been approved between 2016 and 2020,
major infrastructure projects, etc. Newly submitted projects will be delayed in the context of unapproved 2021-2025
public investment plan and the negative effects of Covid-19 on the economy.
No. Project Total Investment
(bil VND) Contractors
1 Nha Trang - Cam Lam 7,615 Bidding in progress.
2 Cam Lam - Vinh Hao 13,600 Bidding in progress.
3 Mai Son – Route 45 12,111 Bidding in progress.
4 Vinh Hao – Phan Thiet 11,183 Bidding in progress.
5 Phan Thiet – Dau Giay 14,356 Bidding in progress.
Transitional projects to be implemented in 2021*
Long Thanh Airport Phase 1
Total Investment (bil VND) 109,200
Expected completion 2025
Cost structure (bil VND) Clearance: 18.500
Construction: 90.700
Progress Clearance: 2,500 ha
Key project 2021*
*Source: VCBS

MACROECONOMY EQUITY MARKET INDUSTRY & STOCK PICKS FIXED INCOME
EVFTA – TARIFF CUT COMMITMENTS BETWEEN EU & VN
33
(Source: VCCI, VCBS)
Product Instant Effect Guideline
Machinery and
equipment 61% of tariff remove to 0% Remaining tariff remove to
Car and
Automobile
equipment
- Cars (over 2500 cm3 running diesel,
over 3000 cm3 running in cylinders)
will reduce tax to 0% after 9 years
- Other types of cars are subject to a 10-
year tax reduction commitment
- Auto spare parts are removed tax
import after 7 years
- Regular computers and computers
over 150 cm3 have import tax of 0%
after 10 years and 7 years
Alcohol beverage
- Wine and spirits will be exempt from
import tax after 7 years
- The schedule for tax elimination for
beer is 10 years
Fresh/Frozen
Meat
- Import tax on frozen pork will be 0%
after 7 years; Import duties on other
types of pork will be 0% after 9 years
- Chicken will be exempt from import
tax after 10 years
- Beef will be exempted from import tax
after 3 years
Medical drugs 71% of tariff remove to 0% The rest will be eliminated from tariffs
on a 5 to 7 year schedule
Chemical 70% of tariff remove to 0% The rest will be eliminated tariffs on a
maximum 7-year schedule
Texile and shoe
material 80% of tariff remove to 0%
The rest will be eliminated tariffs on a 3
to 5 year schedule
Milk and milk
product
44% of tariff is remove to
0%, some would take up to
3 years
The rest will be eliminated tariffs on a
5-year schedule
Oil and Gasoline Import duties will be cleared after 10
years
Product Instant Effect Guideline
Texiles 42.5% of tariff remove to
0% 3 - 7 years
Shoe Some tariff is remove to
0% 4 – 8 years
Yarn
Some industrial and
garment yarn remove to
0%
Remove to 0% within 4 years
Catfish/Seafood Tariff on seafood reduce to
0%
Catfish tariff reduce from 9% to 0%
in 3 years
Drugs and
Medical
Equipment
All Tariff remove to 0%
Electronic device
and equipment 74% of tariff remove to 0%
Other tariff reduce to 0% within 6
years
Agriculture
product
Raw agriculture product
tariff remove to 0%, apply
quota on rice export
Processed product tariff is reduce to
0% within 4 to 8 years
Processed food
and Frozen meat Most tariff remove to 0%
Poultry fillet, exotic organs remove
to 0% in 8 years
Car
Industrial, Specialized
vehicles tariff remove to
0%
Tariff remove from 10% to 0%
within 4 – 8 years, depend on engine
capacity
Motorbike Tariff on motorbike < 250
cm3 remove to 0%
Tariff on motorbike >250 cm3,
electrical bike remove to 0% within
4 to 6 years
Chemical and
material
Most tariff is remove to
0%
Remaining tariff remove 0% to 4
years
Woods and
Wooden product 74% of tariff remove to 0%
Remaining tariff remove to 0% after
4 years
EU TARIFF CUT COMMITMENTS VIETNAM TARIFF CUT COMMITMENTS

MACROECONOMY EQUITY MARKET INDUSTRY & STOCK PICKS FIXED INCOME
In the context of similar level of risk vs. opportunity, we believe that investment opportunities in 2021 will lean to basic industries
serving as essential inputs for the economic growth in Vietnam ("back to basics") for the time to come:
The shift of global supply chains, the industrialization (and digitization) of the domestic economy and the urbanization process in
Vietnam will all require essential inputs such as Electricity (both electricity transmitting and producing); Basic construction
materials (cement, steel, wood, stone); and Agricultural products. These sectors also benefit from the government's public
investment in building new infrastructure projects and upgrading existent infrastructures, as well as the overall recovery of the
domestic demand.
Another noteworthy group is companies that support the increase of trade between Vietnam and other partners thanks to the free
trade agreements signed recently and in the near future, typically seaport & logistics sectors. These companies also supports the
shift of manufacturing chains from China to other countries with more competitive labor costs, which includes Vietnam.
Although it seems contrary to the investment opinion that we outline above, we also want to emphasize on companies which
introduce and apply new technologies to its day-to-day business operations. The application of advanced technologies in
business, including the "digitization" of Vietnam’s economy, is inevitable and irreversible. Therefore, even though changes from
old to new always bring about risks, the potential positive outcomes, which are the improvements of productivity, business
performance and resource usage efficiency, still outweigh the risks caused by the transition process.
And lastly, we also want to include companies with their “specific catalysts“, i.e. seeking foreign strategic partners,
conducting M&A, IPOs, listing new shares and moving listed shares to other stock exchanges, etc.
SOME NOTEWORTHY INVESTMENT HINTS IN 2021
34
“A BIRD IN THE HAND IS WORTH TWO IN THE BUSH” So far, 2020 has witnessed many ups and downs of the global economy as well as major
stock markets in the world due to the impacts of Covid-19 pandemic. We believe that
what happened in the world in 2020 still potentially leaves over many negative
consequences and risks in 2021.
On the other hand, Vietnam's macro-economy remained stable, highlighted by
optimistic economic growth and inflation and exchange rates under control. Moreover,
low interest rates globally, with Vietnam being no exception, open up many
investment opportunities in industry-leading companies which are also the main
driving force behind the growth of Vietnam's stock market in the long run.

MACROECONOMY
FIXED INCOME MARKET
EQUITY MARKET
INDUSTRY AND STOCK PICKS

STOCK PICKS
36
• ACB MBB TPB BANKS
• VHM REAL ESTATE
• ACV GMD AVIATION -
SEAPORTS
• HPG PTB CONSTRUCTION MATERIALS
• PC1 ENERGY
• MWG PNJ RETAIL
• DCM FERTILIZERS
• STK TEXTILES
• DGC PLC FPT BWE OTHERS

BANKING
SECTOR

MACROECONOMY EQUITY MARKET INDUSTRY & STOCK PICKS FIXED INCOME Back
BANKING SECTOR – UPDATE
38
Source: SBV, Banks, VCBS sumary
Credit growth is slower than previous years but showing signs of
speeding again:
- Expected to be less than 10% for the whole of 2020.
- 9M.2020: credit growth from corporate bonds contributed 25% of
growth and credit growth from large corporate customers contributed
about 60% of the growth.
SBV has loosened “room” for credit growth for many banks:
- With the purpose of stimulating credit growth to support economic
growth, SBV has loosened the credit growth room for banks that meet
2 factors: (1) financial health, (2) capability of growth.
- Banks are given higher rooms: TCB, HDB, VPB, TPB, VIB, MBB
Credit growth is expected to recover and reach about 11-12% in
2021.
6.09%
0.0%
5.0%
10.0%
15.0%
20.0%
T1 T2 T3 T4 T5 T6 T7 T8 T9 T10 T11 T12
Credit growth ytd
2015 2016 20172018 2019 2020
-11% -1% 9% 19%
EIB
CTG
BID
STB
VCB
TCB
ACB
MBB
LPB
VIB
HDB
VPB
SHB
TPB
9M.2020 Credit growth
Customer loans Corporate bonds

MACROECONOMY EQUITY MARKET INDUSTRY & STOCK PICKS FIXED INCOME Back
BANKING SECTOR – UPDATE
39
Retail credit was slower in 9M.2020, however, it is still the segment many banks prioritize:
‐ Retail loans has low Weighted Risk when calculating CAR (depending on collateral or 80% if no real estate collateral)
‐ Retail loans improve loan yield and reduce concentration risk.
‐ Potential to increase retail credit proportion remains as Vietnam's proportion of retail loans is still lower than that of developed countries
and people's lifestyles are changing towards more debt acceptance. However, this segment will face a higher level of competition as more
and more banks switch focus to retail.
22.8%
25.7%
34.7%
39.7%
15.0%
20.0%
25.0%
30.0%
35.0%
40.0%
45.0%
Propotion of Retail credit
40% 40%
44%
48%
36%
38%
40%
42%
44%
46%
48%
50%
Viet Nam ASEAN-3 China US
Proportion of retail banking loans in 2019
Source: SBV, Banks, Bloomberg, VCBS sumary

MACROECONOMY EQUITY MARKET INDUSTRY & STOCK PICKS FIXED INCOME Back
BANKING SECTOR – UPDATE
40
Deposit from customers increased by 6.1% in 8M.2020. The average listed
deposit rate has decreased by 100 - 120 bps from the beginning of 2019
depending on the term.
Banks' cost of funds recorded a rapid decline in Q3.2020.
There has not been enough pressure to make deposit rates rise again:
- There has been no liquidity risk coming from bad debt.
- Less pressure on indicators: (1) credit growth partly based on corporate bonds
reduces the pressure on LDR as the numerator only takes into account loans to
customers; (2) not paying cash dividend according to SBV’s directive causing
CAR to increase; (3) pressure on the ratio of short-term capital for medium and
long-term loans was reduced slightly when SBV delayed the deadline of lowering
the ceiling rate.
- Liquidity pressure from credit growth is not expected to appear in 2020 and may
not appear until the end of 2021.
Lending rate is adjusted to decrease but at a slower pace than listed deposit
interest rate:
- Banks balance the impact of lowering deposit rates and lending rates on NIM.
- Corporate customers enjoy more preferences on lending rate reduction and debt
structure than individuals. In addition, new loans will have lower interest rates
than current outstanding loans.
NIM is expected to remain at 2020 level in 2021.
3.00
4.00
5.00
6.00
7.00
8.00
Average deposit rates (Unit: %)
D.R (1 month) D.R (3 months)
D.R (6 months) D.R (above 12 months)
2.0%
3.0%
4.0%
5.0%
6.0%
7.0%
8.0%
0.0%
5.0%
10.0%
15.0%
20.0%
25.0%
30.0%
35.0%
40.0%
VC
B
TC
B
MB
B
CT
G
TP
B
VIB
AC
B
BID
ST
B
HD
B
EIB
LP
B
VP
B
SG
B
KL
B
NA
B
VB
B
BV
B
SH
B
NV
B
BA
B
CASA ratio and Cost of funds
CASA 2019 CASA Q3.2020 Cost of fund Q3.2020
Source: SBV, Banks, VCBS sumary

MACROECONOMY EQUITY MARKET INDUSTRY & STOCK PICKS FIXED INCOME Back
7.50%
8.00%
8.50%
9.00%
9.50%
10.00%
10.50%
11.00%
Loans to customers's yield recorded on financial
statement
Banking system Banks listed on HOSE and HNX
Group of dynamic banks*
BANKING SECTOR – UPDATE
41
Note: banks can use different methods of statistic when announcing the amount
of restructured loans
NPLs and risk assets ratio increased from above 3% at the end of 2019 to 4.5% in Q3.2020 according to SBV data.
Many banks recorded recovery of restructured loans:
- Many banks recorded no increase in restructured loans in Q3.2020. In addition, yields recorded on customer loans recovered strongly in
some banks with good asset quality. The main reason comes from the fact that part of the restructured customers now has cash flows to
pay interests and even principals.
- With many customers recovering their production and business activities, the expected amount of restructured loans turning into bad
debts when Circular 01 expires is low.
*: ACB, MBB, HDB, TCB, TPB, VIB, VPB
NPL ratio
2019
NPL ratio
Q3.2020
Restructured loans
Under Cir.01/
Customer loans
Update time
ACB 0,54% 0,83% 3,20% 2020 Sep
CTG 1,16% 1,87% 0,90% 2020 Sep
EIB 1,17% 2,46% 6,00% 2020 May
HDB 1,36% 1,83% 4,50% 2020 Sep
MBB 1,16% 1,50% 3,20% 2020 Sep
TCB 1,33% 0,60% 3,07% 2020 Sep
TPB 1,29% 1,79% 7,40% 2020 Sep
VCB 0,79% 1,01% 1,34% 2020 Sep
VIB 1,96% 2,14% 0,40% 2020 June
VPB 3,42% 3,65% 10,50% 2020 Sep
Banking system 2,00% T7.2020
Banking system 3,90% 2020 Sep
Source: SBV, Banks, VCBS sumary

MACROECONOMY EQUITY MARKET INDUSTRY & STOCK PICKS FIXED INCOME Back
BANKING SECTOR – UPDATE
42
Free transfers have gradually become the trend among the group of
dynamic banks: Increasing transaction fees can help banks increase their
Non interest income, however the fee exemption combined with other
forms of customer experience enhancement helps banks attract regular
customers, thus reducing capital costs as CASA increases and gaining
deposits. In addition, attracting individual customers is also helpful for
increasing credit when this is the target customer group of many banks.
Decree 81/2020/ND-CP affects the bond retail-distribution activities of
some banks:
- Private placement: bond is locked for 1 year and now requires at least 6
months between 2 consecutive bond issuances. In addition, open-ended
bond investment funds are not allowed to buy bonds issued from private
placement.
- Public offering: higher requirement on issuers and the underwriter
cannot control demand.
Source: SBV, Banks, VCBS sumary
0%
50%
100%
150%
200%
0
500
1,000
1,500
2,000
2,500
2016 2017 2018 2019 9T.2020
Mil
lio
n t
ran
sact
ion
s
Number of money transfer transaction
Number of transaction yoy growth
0%
20%
40%
60%
80%
100%
0
20,000
40,000
60,000
80,000
100,000
120,000
140,000
2016 2017 2018 2019 9T.2020
VN
D t
rill
ion
Money transfer transaction value
Transaction value yoy growth

MACROECONOMY EQUITY MARKET INDUSTRY & STOCK PICKS FIXED INCOME Back
BANKING SECTOR – 2021 FORECAST
43
8%
9%
10%
11%
12%
13%
14%
15%
16%
TCB EIB HDB VPB ACB TPB MBB VIB VCB CTG BID LPB
Capital adequacy ratio - CAR 2019
Bank groups:
- Large banks (AGR, VCB, BID, CTG): continue to be under pressure to reduce lending rates when SBV doesn’t changed their monetary
policy.
- Dynamic banks (ACB, MBB, TCB, VPB, VIB, TPB): has higher credit growth due to better sources of capital (higher equity source from
retain earning) and smaller scale. In addition, the pressure to lower deposit rate is lower than the large banks, leading to a positive growth
in total income.
Circular 01 expected to expire in 2021, when Covid-19 pandemic ends since many countries can mass produce preventive vaccines.
- With good signs of recovery in restructured loans, an increase in bad debt coming from restructured customers is expected to account for
0.5 - 1% of total loan balance and there will be a strong variation between banks depending on asset quality.
- Impact on provision expense will spread gradually in 2021 and 2022 because outstanding loan still has a 360-day deferred payment process
from the new repayment term to switch from group 1 debt to group 5 debt.
Source: SBV, Banks, VCBS sumary
9.2% 9.2% 9.8% 9.6% 9.5%
10.4% 10.6% 10.7% 10.7% 10.7%
08%
09%
10%
11%
12%
CAR ratio of the group of banks that applies
Circular 41 (Basel II)
State owned banks Joint stock commercial Banks

MACROECONOMY EQUITY MARKET INDUSTRY & STOCK PICKS FIXED INCOME Back
2020 BANKING STOCKS RECOMENDATION
44
9T.2020
indicators Total Asset Total Equity EBT NIM ROE NPL LLCR Asset quality Earning outlook Recommendation
Unit VND billion VND billion VND billion % % % %
ACB 418,748 32,919 6,411 3.54% 22.11% 0.83% 117% High Increasing Buy
BAB 112,042 8,194 522.087 1.95% 8.14% 0.81% 124% No rating No forecast No recommendation
BID 1,467,806 81,441 7,062 2.45% 10.68% 1.97% 87% Average Increasing Outperform
BVB 54,561 3,840 138 2.10% 4.46% 2.98% 48% No rating No forecast No recommendation
CTG 1,261,204 83,322 10,364 2.84% 13.70% 1.87% 84% Average Stable Outperform
EIB 151,274 16,597 1103.612 2.20% 5.29% 2.46% 50% Low Stable No recommendation
HDB 273,290 23,885 4,381 5.10% 19.52% 1.83% 64% Average Increasing Outperform
KLB 55,592 3,907 144.573 1.82% -0.12% 6.63% 17% No rating No forecast No recommendation
LPB 211,978 13,765 1741.441 3.18% 12.81% 1.64% 73% No rating Stable Hold
MBB 427,175 48,254 8,134 4.93% 18.44% 1.50% 119% Average Increasing Buy
NAB 119,474 6,113 388 2.46% 11.04% 2.28% 38% No rating No forecast No recommendation
NVB 74,335 4,283 29 2.14% 1.05% 1.80% 65% Low No forecast Underperform
SGB 22,700 3,672 177 3.28% 2.55% 2.14% 40% No rating Stable No recommendation
SHB 401,926 23,876 2607.122 2.64% 12.93% 2.47% 57% Low Increasing Hold
STB 485,213 28,205 2325.693 2.47% 8.65% 2.14% 74% No rating No forecast No recommendation
TCB 401,462 70,608 10,711 4.85% 17.23% 0.60% 148% Average Increasing Outperform
TPB 193,461 15,438 3,024 4.02% 25.26% 1.79% 92% Average Increasing Buy
VBB 82,270 5,303 374 0.99% 7.98% 2.03% 54% No rating No forecast No recommendation
VCB 1,188,572 93,576 15,965 2.99% 19.41% 1.01% 215% High Increasing Outperform
VIB 213,086 16,552 4,025 3.95% 27.93% 2.14% 48% High Increasing Hold
VPB 413,892 49,726 9,398 8.57% 21.81% 3.65% 48% Low Stable Hold
Source: SBV, Banks, VCBS sumary

MACROECONOMY EQUITY MARKET INDUSTRY & STOCK PICKS FIXED INCOME Back
ASIA COMMERCIAL BANK (ACB) – OVERVIEW
45
Main business activities:
ACB is a joint stock commercial bank with a dynamic business model and
high risk management capabilities. The bank focuses most of its business
activities in the retail customer segment, with real estate collateral for
loans mainly. ACB's asset quality is well controlled with low NPLs ratio.
Shareholder structure:
Including 30% owned by foreign funds, 7% owned by Tran Hung Huy
(Chairman of the Board of Directors) and family members, the rest are
other shareholders.
Business results:
In 9M.2020, ACB recorded EBT of VND 6,411 billion (+15.3% yoy).
Positive growth rate was achieved thanks to good growth in net interest
income as well as non-interest income.
7% 6%
4%
5%
5%
3%
7% 63%
Share holder structure
Dragon Financial Holdings Limited
Vietnam Enterprise Investments Limited
First Burns Investments Limited
Sather Gate Investments Limited
Whistler Investments Limited
Asia Reach Investments Limited
Tran Hung Huy and familiy members
Others
Subsidiary Sector Charter capital
Ownership 2019 EBT
(VND billion) (VND billion)
ACBS Securities 1500 100% Na
ACBA Asset management 340 100% 7
ACBL Finance lease 300 100% 12
ACBC Fund management 50 100% 1
7,563
11,439
14,033
16,097
12,966
1,667 2,656
6,389 7,516
6,411
0
2,000
4,000
6,000
8,000
10,000
12,000
14,000
16,000
18,000
2016 2017 2018 2019 Q3.2020V
ND
bil
lio
n
TOI and EBT
TOI EBT
Source: SBV, ACB, VCBS sumary

MACROECONOMY EQUITY MARKET INDUSTRY & STOCK PICKS FIXED INCOME Back 46
INVESTMENT CATALYSTS
Credit growth of 10.7% after 9M.2020: in 2019 ACB has CAR of 11.7%, belonging to the group with optimal capital adequacy ratio to keep
balance between credit growth and target profit. We expect ACB will continue to be assigned a higher credit growth target than the industry
average in the coming years.
Potential for good growth in non-interest income:
⁃ ACB owns a portfolio of government bonds of VND 61,632 billion, bond yield recorded at 5.0% in Q3.2020. The recorded yield was much
higher than the government bond interest rate in the market at 1-2%. Thus, ACB can record an abnormal profit from investment securities if the
bank sells some of these government bonds.
⁃ According to the bank's expectation, ACB could sign an exclusive Bancassurance contract in 2020. With its position as one of the banks with the
highest insurance sales in the system and the negotiation process took place very thoroughly, we expect that ACB could get a higher upfront fee
than peer average.
ASIA COMMERCIAL BANK (ACB)
0
50
100
150
200
250
300
350
400
2017 2018 2019 Q3.2020
VN
D t
rill
ion
Loans and deposit
Net loan Customer deposit & valuable paper
3.6% 3.6% 3.6% 3.8% 3.7% 3.3%
3.7%
0.00%
2.00%
4.00%
6.00%
8.00%
10.00%
NIM
NIM Int earning asset yield Cost of fund
2.0%
3.0%
4.0%
5.0%
6.0%
7.0%
0
10,000
20,000
30,000
40,000
50,000
60,000
70,000
Q1.2019 Q3.2019 Q1.2020 Q3.2020
VN
D b
illi
on
ACB's government bond outstanding
Government bond outstanding
Yield recorded
Source: SBV, ACB, VCBS sumary

MACROECONOMY EQUITY MARKET INDUSTRY & STOCK PICKS FIXED INCOME Back 47
INVESTMENT CATALYSTS
Good asset quality with high quality assets:
⁃ ACB focuses on lending to high-income individual customers. The bank recorded the
lowest Credit cost / Outstanding balance ratio in the industry.
⁃ The collaterals for ACB's loans are mainly real estate with clear legal status and stable
market value in the long term. In case customers cannot pay their debts, the debt
recovery process of ACB is relatively favorable with recovery rate among the highest in
the industry.
Stable profitability helps BVPS continue to grow at an expected rate of 25% in 2020
and 26% in 2021.
High possibility of entering the VN-30 index basket in the restructuring period of
July 2021 after listing in HOSE.
ASIA COMMERCIAL BANK (ACB)
23.2%
45.5%
46.7%
49.4%
0% 20% 40% 60% 80% 100%
2017
2018
2019
9T.2020
Total income structure
Operating expense Provision expense EBT
0.7% 0.7% 0.7%
0.5% 0.7% 0.7%
0.8%
0.3%
0.5%
0.7%
0.9%
1.1%
1.3%
NPL
Net NPL ratio Overdue loan ratio
52 148 79
369
1,765
1,428
0
500
1,000
1,500
2,000
2014 2015 2016 2017 2018 2019
VN
D b
illi
on
Recovery of loans previously
written-off
Bad debt write off
Recovery of loans previously written-off
2%
52%
102%
152%
202%
0
500
1000
1500
2000
2500
3000
2016 2017 2018 2019 9T.2020
VN
D b
illi
on
Provision expense
Provision expense LLCR
Source: SBV, ACB, VCBS sumary
MACROECONOMY EQUITY MARKET INDUSTRY & STOCK PICKS FIXED INCOME Back 48
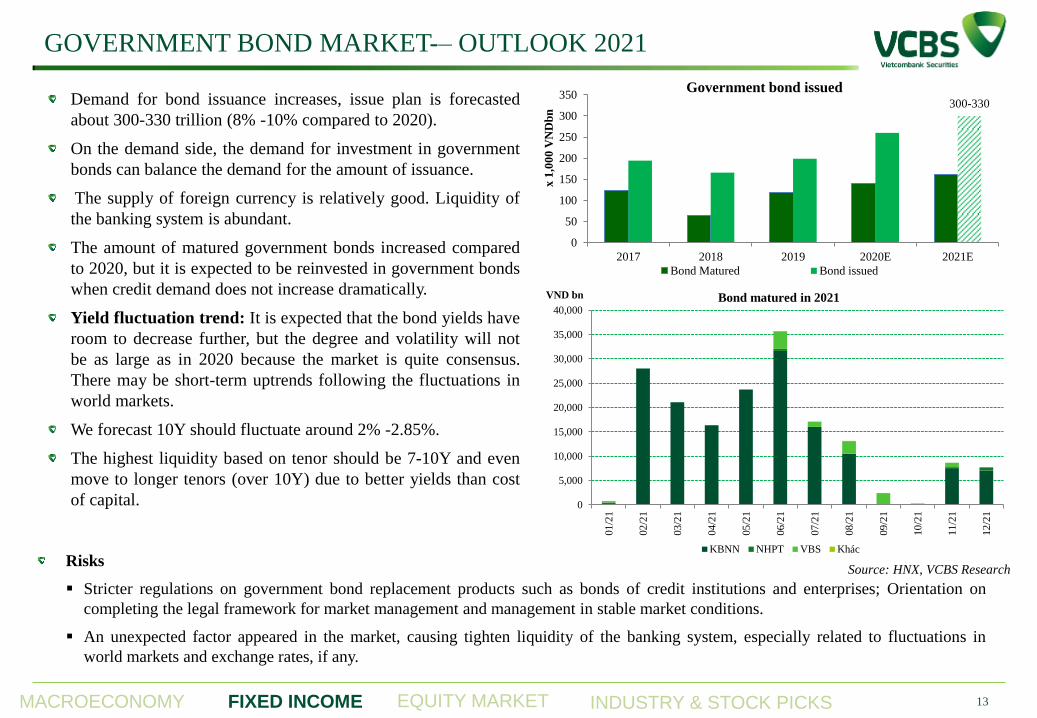
P/B Multiple 29,393
Residual Income 32,658
FORECAST
VALUATION
31,022 VND
TARGET PRICE
+15% UPSIDE
ASIA COMMERCIAL BANK (ACB)
10,00012,00014,00016,00018,00020,00022,00024,00026,00028,000
STOCK PRICE
ACB Relative VN-Index Estimated profit in 2021 includes VND 2,000 billion Upfront fee from exclusive Bancassurance
contract
VND Billion 2019 2020F 2021F
Total operating income 16,097 18,207 21,805
+/- yoy (%) 14.7% 13.1% 19.8%
Earning before tax 7,516 8,817 11,173
+/- % 17.6% 17.3% 26.7%
BVPS (VND/share) 16,699 16,043 19,595
Source: VCBS forecast

MACROECONOMY EQUITY MARKET INDUSTRY & STOCK PICKS FIXED INCOME Back
MILITARY COMMERCIAL JOINT STOCK BANK (MBB)
49
Main business activities
MBB is a joint stock commercial bank with a dynamic business
model, including many subsidiaries operating in the banking and
finance sector. MBB has special advantages thanks to standing in
the Army group.
Shareholder structure
Including 14% owned by Viettel, 9% owned by SCIC, 23% foreign
owned, the rest are other shareholders.
Business results
In 9M.2020, MBB recorded EBT of VND 8,134 billion (+ 6.8%
yoy). The Bank recorded positive growth in total income and has
made a conservative provision for outstanding loans affected by
Covid-19 since Q1.2020.
14%
9%
7%
7%
4% 3%
54%
Share holder structure
Viettel
SCIC
Vietnam Helicopter
Corporation
Saigon New Port
Vietcombank
Maritime Bank
Others
4%
36%
11%
48%
Share holder structure
M-Credit
Individual
State owned
companies
Other companies and
institution0
5,000
10,000
15,000
20,000
25,000
30,000
2017 2018 2019 Q3.2020
VN
D b
illi
on
TOI and EBT
TOI EBT
Source: SBV, MBB, VCBS sumary

MACROECONOMY EQUITY MARKET INDUSTRY & STOCK PICKS FIXED INCOME Back
MILITARY COMMERCIAL JOINT STOCK BANK (MBB)
50
INVESTMENT CATALYSTS
Credit growth of 11.8% in 9M.2020: CAR in 2019 reached 10.68%, belonging to the group of banks with optimal capital adequacy ratio to
balance the target of credit growth. We expect MBB will continue to be assigned a higher credit growth target than the industry average in the
coming years.
CASA is more sustainable thanks to the individual customer base: after the decline in Q1.2020 due to the group of corporate customers
affected by Covid-19, in Q3.2020 CASA grew again to 33.5% thanks to individual customer groups. The proportion of deposits of individual
customers increased to about 30% as the bank applied free money transfer program and launched many programs to attract customers.
0
50
100
150
200
250
300
350
2017 2018 2019 Q3.2020
VN
D t
rill
ion
Loans and deposit
Net loan Customer deposit & valuable paper
4.7% 4.8% 4.9% 5.1%
4.9% 4.8% 5.2%
0.0%
2.0%
4.0%
6.0%
8.0%
10.0%
NIM
NIMInt generating asset yieldCost of fund
2.0%
7.0%
12.0%
17.0%
22.0%
27.0%
32.0%
37.0%
42.0%
47.0%
0
2,000
4,000
6,000
8,000
10,000
12,000
2017 2018 2019 9T.2020
Operating expense
Operating expense CIR
Source: SBV, MBB, VCBS sumary

MACROECONOMY EQUITY MARKET INDUSTRY & STOCK PICKS FIXED INCOME Back
MILITARY COMMERCIAL JOINT STOCK BANK (MBB)
51
INVESTMENT CATALYSTS
Good asset quality: MBB's NPL ratio increased from 1.16% to 1.50%
in Q3.2020 and the bank made high provisions from Q1.2020 for NPL
which may rise due to Covid-19. Therefore, we expect MBB to incur
less increased provisioning expenses in the post-pandemic phase.
Maintaining a good profitability index helps book value continue to
grow: MBB's ROE is forecast to reach 22.5% for 2020 and 19% for
2021, BVPS forward 2021 at VND 19,884/share and P/B forward is at
0.97 times.
0% 20% 40% 60% 80% 100%
2017
2018
2019
9T.2020
Total operating expense structure
Operating expense Provision expense EBT
0.00%
0.50%
1.00%
1.50%
2.00%
2.50%
3.00%
3.50%
4.00%
NPL
Net NPL ratio Overdue loan ratio
2%
22%
42%
62%
82%
102%
122%
142%
0
1000
2000
3000
4000
5000
6000
2016 2017 2018 2019 9T.2020
VN
D b
illi
on
Provision expense
Provision expense LLCR
Source: SBV, MBB, VCBS sumary

MACROECONOMY EQUITY MARKET INDUSTRY & STOCK PICKS FIXED INCOME Back
MILITARY COMMERCIAL JOINT STOCK BANK (MBB)
52
P/B Multiple 26,608
Residual Income 22,713
FORECAST
VALUATION
24,660 VND
TARGET PRICE
+21% UPSIDE
VND Billion 2019 2020F 2021F
Total operating income 24,650 26,624 29,326
+/- yoy (%) 26.2% 8.0% 10.1%
Earning before tax 10,036 10,702 11,339
+/- % 29.2% 6.6% 6.0%
BVPS (VND/share) 16,014 16,989 19,884
10,000
12,000
14,000
16,000
18,000
20,000
22,000
STOCK PRICE
MBB Relative VN-Index
Source: VCBS forecast

MACROECONOMY EQUITY MARKET INDUSTRY & STOCK PICKS FIXED INCOME Back
TIENPHONG COMMERCIAL JOINT STOCK BANK (TPB)
53
Main business activities:
TPB is a bank with rapid growth in asset size and profitability on a
smaller scale. The bank also focuses on digital development to
increase customer experience.
Shareholder‟s structure:
Including 18% owned by Do Minh Phu, family and related entities;
10% belongs to FPT and former FPT's Vice Chairman Le Quang
Tien; 4% of the national reinsurance corporation, 30% foreign
ownership, the rest are other domestic shareholders.
Business results:
In 9M.2020, TPB recorded EBT of VND 3,024 billion (+ 25.8%
yoy). Positive growth comes from both net interest income and
non-interest income.
18%
6%
4%
5%
30%
37%
Share holder structure
Do Minh Phu, Families
and Related copanies
FPT
Le Quang Tien
Vinare
Foreign ownership
Other
9%
37%
22%
18%
14%
Loan structure
Big Corp
SME
Individual - Mortgage
Individual - Car loan
Individual - Other
0
1,000
2,000
3,000
4,000
5,000
6,000
7,000
8,000
9,000
2016 2017 2018 2019 9T.2020
VN
D b
illi
on
TOI and EBT
TOI EBT
Source: SBV, TPB, VCBS sumary

MACROECONOMY EQUITY MARKET INDUSTRY & STOCK PICKS FIXED INCOME Back
TIENPHONG COMMERCIAL JOINT STOCK BANK (TPB)
54
INVESTMENT CATALYSTS
Gradually improving cost of fund: The customer base increases rapidly as TPB is one of the pioneering banks that apply technology to
improve customer experience and launch marketing campaign including reducing service fee. In 9M.2020, TPB's CASA increased by 21% and
the ratio reach 16%. In addition, TPB maintains a high rate of mobilization from the interbank market with net borrowing equivalent to 22.5%
of customer deposits. With current abundant liquidity environment, raising more from the interbank market is less risky and helps TPB reduce
cost of fund.
Credit growth reached 23% after 9M.2020 and high growth rates can be maintained in the future: with the advantage of small-sized
bank, good data source and rapidly increasing individual customer base thanks to effective marketing campaign, TPB has the highest credit
growth in the industry. We expect TPB will be given higher credit room than the industry average in the coming years when the bank has
abundant capital from retained earnings
Car loans: although car loans incur more NPLs than home loans, the profit earned is still high when the bank requires higher lending rates to
offset incurred provision expense. Cars as collaterals are also easily to recall and sell when customers need the bank's confirmation for annual
registration.
9.0%
9.5%
10.0%
10.5%
11.0%
11.5%
0
20,000
40,000
60,000
80,000
100,000
120,000
Loans to customers
Loans to customers Yield on customer loans
4.1% 4.3% 4.2% 4.2% 4.4% 4.3% 3.9%
0.00%
2.00%
4.00%
6.00%
8.00%
10.00%
NIM
NIM Int earning asset yield
Cost of fund
2%
12%
22%
32%
42%
52%
62%
0
500
1,000
1,500
2,000
2,500
3,000
3,500
2016 2017 2018 2019 9T.2020
Operating expense
Operating expenses CIR
Source: SBV, TPB, VCBS sumary
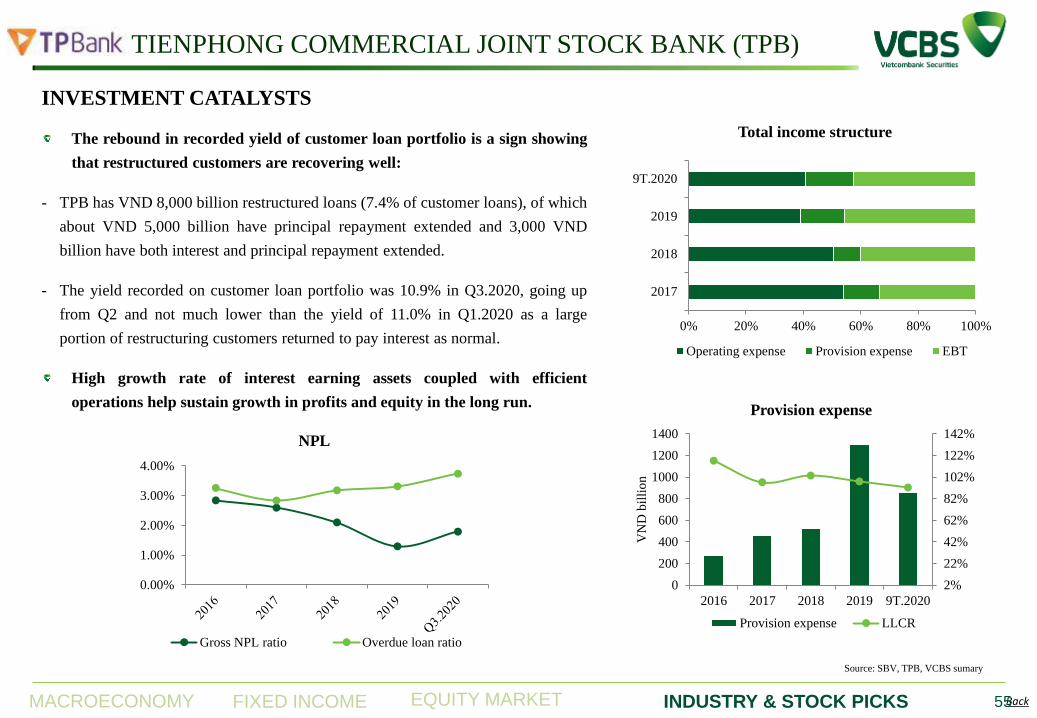
MACROECONOMY EQUITY MARKET INDUSTRY & STOCK PICKS FIXED INCOME Back
TIENPHONG COMMERCIAL JOINT STOCK BANK (TPB)
55
INVESTMENT CATALYSTS
The rebound in recorded yield of customer loan portfolio is a sign showing
that restructured customers are recovering well:
- TPB has VND 8,000 billion restructured loans (7.4% of customer loans), of which
about VND 5,000 billion have principal repayment extended and 3,000 VND
billion have both interest and principal repayment extended.
- The yield recorded on customer loan portfolio was 10.9% in Q3.2020, going up
from Q2 and not much lower than the yield of 11.0% in Q1.2020 as a large
portion of restructuring customers returned to pay interest as normal.
High growth rate of interest earning assets coupled with efficient
operations help sustain growth in profits and equity in the long run.
0% 20% 40% 60% 80% 100%
2017
2018
2019
9T.2020
Total income structure
Operating expense Provision expense EBT
0.00%
1.00%
2.00%
3.00%
4.00%
NPL
Gross NPL ratio Overdue loan ratio
2%
22%
42%
62%
82%
102%
122%
142%
0
200
400
600
800
1000
1200
1400
2016 2017 2018 2019 9T.2020
VN
D b
illi
on
Provision expense
Provision expense LLCR
Source: SBV, TPB, VCBS sumary
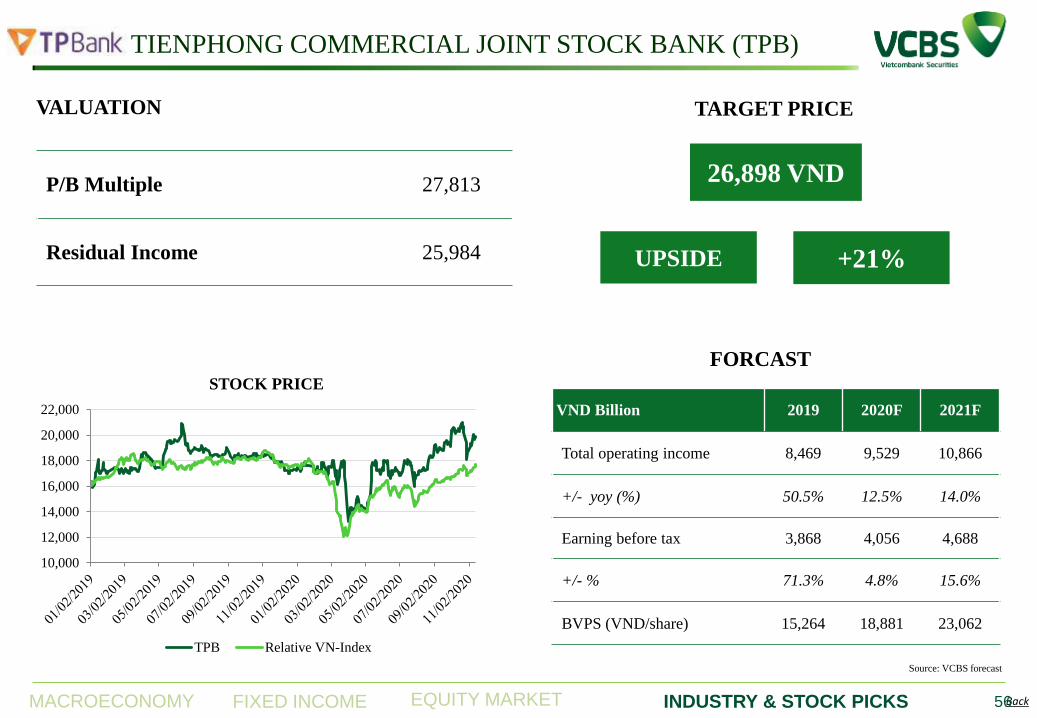
MACROECONOMY EQUITY MARKET INDUSTRY & STOCK PICKS FIXED INCOME Back
TIENPHONG COMMERCIAL JOINT STOCK BANK (TPB)
56
P/B Multiple 27,813
Residual Income 25,984
FORCAST
VALUATION
26,898 VND
TARGET PRICE
+21% UPSIDE
VND Billion 2019 2020F 2021F
Total operating income 8,469 9,529 10,866
+/- yoy (%) 50.5% 12.5% 14.0%
Earning before tax 3,868 4,056 4,688
+/- % 71.3% 4.8% 15.6%
BVPS (VND/share) 15,264 18,881 23,062
Source: VCBS forecast
10,000
12,000
14,000
16,000
18,000
20,000
22,000
STOCK PRICE
TPB Relative VN-Index

REAL ESTATE

MACROECONOMY EQUITY MARKET INDUSTRY & STOCK PICKS FIXED INCOME Back
Sources: Ministry of Construction, VCBS
OVERVIEW
Overview
• Despite experiencing two waves of Covid-19, the real estate market is
gradually recovering thanks to Vietnam's good disease control and
applications of new market support policies & legal documents.
• Demand for houses, production facilities is still very large, the price level
remains high. Public spending has been strongly disbursed into
infrastructure development, making real estate near big cities become more
appealing.
Sharp increase in commercial real estate & investment credit
• Outstanding debt for the real estate sector is currently VND 1.6 million
billion, accounting for more than 19% of the total credit balance of the
whole economy.
• While demand for housing credit decreased slightly, commercial real estate
& investment returned to a strong growth, estimated at +17.5% compared to
the beginning of 2020.
Outstanding new policies impacting the market:
Construction Law (amendment) 2020 Investment Law (amendment) 2020
Public Investment Law 2019 PPP Investment Law 2020
Directive No. 11/CT-TTg Decree No. 41/2020/ND-CP
Decree No. 81/2020/ND-CP
-
50,000
100,000
150,000
200,000
250,000
300,000
Căn hộ được
cấp phép
Căn hộ đang xây
dựng
Căn hộ hoàn
thành
Căn hộ đủ điều
kiện bán nhà ở
hình thành trong
tương lai
Giao dịch BĐS
thành công
Thị trường BĐS 9T.2020
Q1.2020 Q2.2020 Q3.2020
58
0
50000
100000
150000
200000
250000
300000
Licensed
apartments
Under construction
apartments
Completed
apartments
Successful
transactions
Real estate market 9M.2020 (units)
Q1.2020 Q2.2020 Q3.2020
17% 18% 19% 19%
46%
35% 33%
38%
0%
10%
20%
30%
40%
50%
0
500
1000
1500
2000
2017 2018 2019 Q3.2020E
Outstanding debt in the real estate sector (VND trn)
Outstanding debt for the real estate sector (trillion VND)
Outstanding debt for the real estate sector / whole economy (%)
Real estate investment & business credit / real estate sector (%)

MACROECONOMY EQUITY MARKET INDUSTRY & STOCK PICKS FIXED INCOME Back
0
2000
4000
6000
8000
10000
12000
14000
Q1 Q2 Q3 Q4 Q1 Q2 Q3 Q4 Q1 Q2 Q3
2018 2019 2020
Sold units, HCMC Condominium
Affordable Mid-end High-end Luxury
Sources: Ministry of Construction, CBRE, VCBS
CONDOMINIUM
HANOI
• The limited number of new apartments for sale in the first 3
quarters of 2020 helps maintain price level. However, the selling
price is still significantly lower than Ho Chi Minh City, big real
estate companies in the South are expected to develop new projects
in the North in the future.
• The Covid-19 pandemic makes real estate companies restructure
their products. Newly launched projects are mainly in mid-
end/affordable segments and located in the area outside the ring
road 3.
HCMC
• Projects in the “East City” area (especially with contributions from
Vinhomes Grand Park) led in both supply and sales, accounting for
97% and 89% of the total market, respectively.
• The absorption rate is maintained positively due to the limited
supply. The selling price in all segments is 3% -5% higher than
2019. Completion of legal procedures is expected to improve from
the beginning of 2021.
59
0
2000
4000
6000
8000
10000
12000
14000
Q1 Q2 Q3 Q4 Q1 Q2 Q3 Q4 Q1 Q2 Q3
2018 2019 2020
Sold units, Hanoi Condominium
Affordable Mid-end High-end Luxury
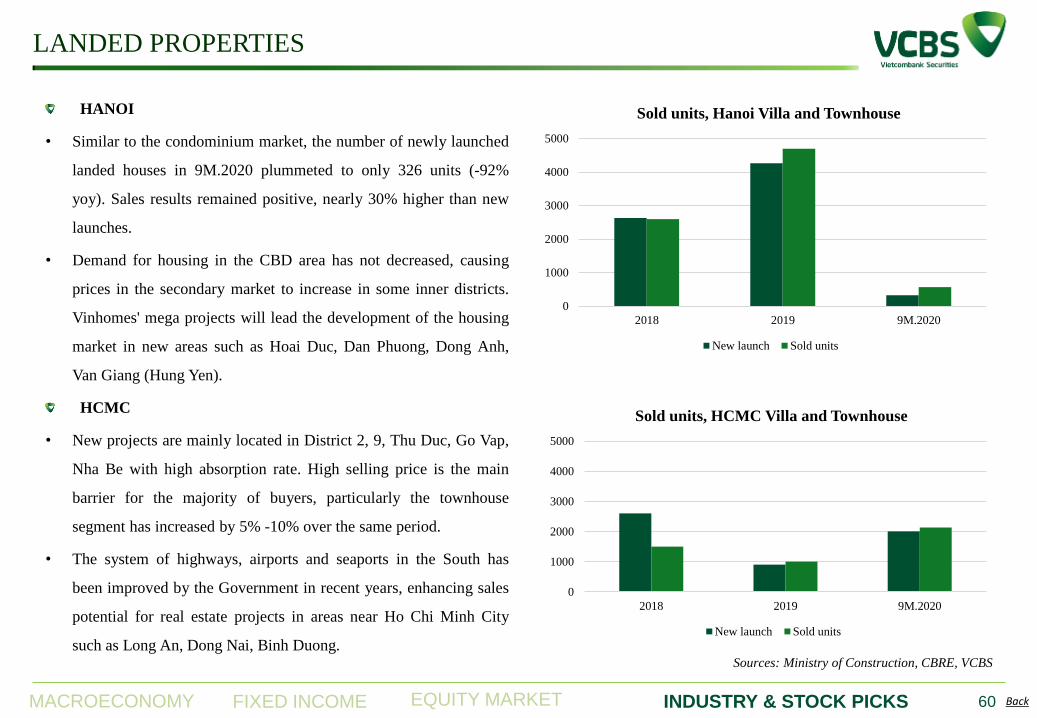
MACROECONOMY EQUITY MARKET INDUSTRY & STOCK PICKS FIXED INCOME Back
Sources: Ministry of Construction, CBRE, VCBS
LANDED PROPERTIES
HANOI
• Similar to the condominium market, the number of newly launched
landed houses in 9M.2020 plummeted to only 326 units (-92%
yoy). Sales results remained positive, nearly 30% higher than new
launches.
• Demand for housing in the CBD area has not decreased, causing
prices in the secondary market to increase in some inner districts.
Vinhomes' mega projects will lead the development of the housing
market in new areas such as Hoai Duc, Dan Phuong, Dong Anh,
Van Giang (Hung Yen).
HCMC
• New projects are mainly located in District 2, 9, Thu Duc, Go Vap,
Nha Be with high absorption rate. High selling price is the main
barrier for the majority of buyers, particularly the townhouse
segment has increased by 5% -10% over the same period.
• The system of highways, airports and seaports in the South has
been improved by the Government in recent years, enhancing sales
potential for real estate projects in areas near Ho Chi Minh City
such as Long An, Dong Nai, Binh Duong.
60
0
1000
2000
3000
4000
5000
2018 2019 9M.2020
Sold units, Hanoi Villa and Townhouse
New launch Sold units
0
1000
2000
3000
4000
5000
2018 2019 9M.2020
Sold units, HCMC Villa and Townhouse
New launch Sold units

MACROECONOMY EQUITY MARKET INDUSTRY & STOCK PICKS FIXED INCOME Back
Office: Hanoi (A class) Hanoi (B class) HCM (A class) HCM (B class)
Supply NLA (m2) 530,000 m2
(21 projects)
~940,930 m2
(70 projects)
445,313 m2
(17 projects)
925,501 m2
(67 projects)
Rate (USD/m2/month) 26.7 (▲1,3%) 13.8 (▼3,0%) 44.3 (▼5,0%) 25.3 (▲3,0%)
Vacancy (%) 24.1% (▲16,2%) 11.5% (▲2,4%) 11.5% (▲3,3%) 6.1% (▲1,3%)
• Capital Place (~93.000 m2 NLA A-class) – The
largest office building in Hanoi was put into
operation in Q3.2020.
• In 2021, high vacancy rate can cause rents to move
sideways or slightly decrease in both segments.
• Manufacturer, ICT, and e-commerce enterprises
prefer the non-CBD area, especially the east of the
city. There will be more new projects in this area
and attract more tenants.
• A-class rents are expected to decline slightly and
B-class will remain stable in 2021.
Sources: CBRE, VCBS
OFFICE/RETAIL
Retail: Hanoi
(CBD)
Hanoi
(Non-CBD)
HCM
(CBD)
HCM
(Non-CBD)
Supply NLA (m2) ~52,000 m2
(12 projects)
~950,000 m2
(41 projects)
103,453 m2
(11 projects)
942,575 m2
(47 projects)
Rate (USD/m2/month) 98.6 (▲0,5%) 24.5 (▼1,5%) 135.4 (►0,0%) 35.8 (▲0,2%)
Vacancy (%) 11,1% (▲9,7%) 11,2% (▲2,9%) 1,65% (▼0,6%) 13,1% (▲4,3%)
• The vacancy rate increased sharply despite no new
supply.
• New projects are being developed in the non-CBD
areas.
• Limited supply makes vacancy rate recover
slowly.
• Development towards the Eastern part of the city
and the impact of the Metro Line.
61

MACROECONOMY EQUITY MARKET INDUSTRY & STOCK PICKS FIXED INCOME Back
INDUSTRIAL PARK
Increasing scale of industrial parks
By the end of 10/2020, 280/369 industrial parks are in operation
with a total industrial land area of ~ 56.6 thousand ha, occupancy
rate is 70.1%.
Improve the quality & efficiency of investment attraction
The logistics, manufacturing and electronic technology industries
continue to expand their operations vigorously.
Land rental rates have risen sharply in areas with high demand and good infrastructure
Operating industrial parks in Hai Phong, Bac Ninh, Hai Duong, Ho Chi Minh City, Dong Nai, and Long An increased their rents by 20-30%.
62
68%
70%
72%
74%
76%
0
100
200
300
400
500
2018 2019 2020F 2021F
Number of Industrial Parks
Established Operating Occupancy rate (%)
19.2%
6.8%
5.5%
Industrial leasing enquiry by industry,
Q3.2020
Logistic
Electronic
Automotive
Plastic
Trading
Garment
0
100
200
300
0%
20%
40%
60%
80%
100%
Hanoi Hai Phong Bac Ninh Hai Duong Hung Yen
US
D/m
2/ter
m
Northern Industrial Region
Occupancy rate (%) Minimum asking rent Maximum asking rent
Sources: Ministry of Planning and Investment, Ministry of Construction, CBRE, VCBS
0
100
200
300
0%
20%
40%
60%
80%
100%
HCMC Long An Binh Duong Dong Nai BR-VT
US
D/m
2/ter
m
Southern Industrial Region
Occupancy rate (%) Minimum asking rent Maximum asking rent

MACROECONOMY EQUITY MARKET INDUSTRY & STOCK PICKS FIXED INCOME Back
2021 DEVELOPMENT TRENDS
Industrial real estate continues to be the catalyst to attract FDI Improve infrastructure investment
Enhance real estate potential in the suburbs
2021 Projects Investment
(VND bn)
5 component projects (under the North-South Expressway) 49,353
My Thuan – Can Tho Express Way 4,827
Long Thành Airport – Phase 1 109,112
Development trend toward the East
North of Vietnam: Improve connections between the three largest cities:
Hanoi - Hai Phong - Quang Ninh.
South of Vietnam: New project in Ho Chi Minh City developed along metro
line 1 & 2, towards the "Eastern City"; housing market in neighboring
provinces grew according to the construction progress of Long Thanh airport.
63
Source: VCBS

MACROECONOMY EQUITY MARKET INDUSTRY & STOCK PICKS FIXED INCOME Back
2021 POTENTIAL REAL ESTATE COMPANIES
Company MK Cap
(VND bn)
Total Asset
(VND bn)
Equity
(VND bn)
Gross Profit
Margin (%) ROA (%) ROE (%) P/E P/B
Residential
VHM 258,227 220,509 78,778 44.8% 10.6% 30.6% 11.6 3.4
NVL 60,744 129,389 31,200 35.6% 5.5% 21.5% 10.5 2.4
KDH 14,780 14,718 7,775 44.9% 8.4% 15.2% 12.7 1.9
NLG 7,832 11,803 6,224 35.8% 6.7% 12.1% 10.1 1.5
DXG 7,386 22,227 9,083 59.3% -0.4% -0.9% -94.4 1.1
DIG 6,487 7,980 4,094 27.8% 5.8% 11.7% 14.0 1.6
HDC 1,713 2,568 1,018 35.0% 7.4% 16.8% 9.0 1.7
CKG 570 4,878 715 25.2% 2.2% 15.9% 5.4 0.9
Industrial Parks
IDC 8,250 14,283 4,341 17.6% 2.1% 7.1% 27.2 2.3
KBC 7,281 19,361 10,430 65.4% 1.9% 3.3% 17.3 0.8
SZC 2,820 3,831 1,240 58.0% 5.4% 15.3% 15.4 2.3
LHG 1,440 2,419 1,219 35.7% 7.0% 14.0% 8.5 1.2
SZL 946 1,656 518 33.3% 6.2% 16.7% 9.2 1.8
TIP 824 843 573 64.0% 10.9% 16.4% 9.2 1.5
Retail
VRE 62,830 40,079 28,361 46.4% 6.0% 8.3% 27.6 2.2
Brokerage
CRE 2,328 2,968 2,071 32.2% 11.1% 15.5% 7.6 1.2
64
Source: VCBS

MACROECONOMY EQUITY MARKET INDUSTRY & STOCK PICKS FIXED INCOME Back
OVERVIEW
• Vinhomes is the largest developer of residential real estate in
Vietnam with a huge land bank of 164 million square meters,
outstanding quality and the ability to develop large-scale and
highly efficient projects.
• VHM also owns 29 million m2 of industrial real estate and
operates 120,000 m2 of office space for lease.
• As a subsidiary of Vingroup, VHM has great advantages from
the Group ecosystem in the long term.
9M.2020 PERFORMANCE
• Net revenue grew strongly +31.2% yoy to VND 49,378 billion,
mainly came from 3 major projects Vinhomes Ocean Park,
Grand Park and Smart City.
• Financial revenue reached VND 10,543 billion (+37.7%) with
about VND 7.6 trillion coming from the transfer of 80% stake
in Grand Park phase 2 to Mitsubishi and Nomura.
• Profit after tax reached VND 17,208 billion (-0.8%, 55.5% of
annual target).
VINHOMES JSC (VHM)
Sources: VHM, VCBS
65
22%
4%
2% 2%
2% 68%
Vietnam residential market share 2016 – 2019
Vinhomes
Hung Thinh
Dat Xanh
Ecopark
Novaland
Others
0%
10%
20%
30%
40%
50%
60%
0
10,000
20,000
30,000
40,000
50,000
60,000
2016 2017 2018 2019 9T.2020
Financial Results 2016 - 9M.2020 (VND bn)
Net Revenue Gross profit NPAT GPM (%) NPM (%)

MACROECONOMY EQUITY MARKET INDUSTRY & STOCK PICKS FIXED INCOME Back
Enhance wholesale strategy, sales progress and handover remain
positive: At the end of Q3.2020, VHM has handed over ~20,000 apartments,
sales that have yet been recorded remains positive, reaching VND 82 trillion
(+1% yoy). The company plans to continue handing over ~11,000 apartments
and recording a large number of wholesale transactions in Q4.2020.
Expanding industrial real estate investment: In the period of 2020 - 2021,
VHM plans to invest ~VND 3 trillion in industrial projects. Accordingly, 2
new industrial parks in Hai Phong with total NLA of 348 ha will contribute
to the revenue from 2022.
VINHOMES JSC (VHM) – OUTLOOK
Projects Ocean Park Smart City Grand Park Others
Floor area for sale („000 m2) 3,500 2,601 3,241 4,160
Total products 47,300 47,000 45,500 30,300
Number of products sold and
delivered 19,400 (41%) 13,900 (30%) 17,600 (39%) 27,400 (90%)
Number of products sold and
not-delivered 10,700 (23%) 10,800 (23%) 21,100 (46%)
1,500
(5%)
Un-earned revenue (VND bn) 23,040 16,810 36,470 6,440
Construction progress (%) 51% 37% 50%
Outstanding land bank, strategic location and
continuous expansion: Vinhomes dominates the real
estate market with a land bank of 164 million m2
GFA (146 million m2 NSA). In Q2.2020, VHM
bought Dai An project (~300 ha) at the cost of ~
VND 3.4 trillion. Legal procedures for Green Ha
Long (~4,110 ha) and Long Beach Can Gio (2,870
ha) are also being actively completed.
Ongoing housing projects by the end of 30/09/2020
Sources: VHM, VCBS
66
32%
26%
8%
19%
14%
Total Gross Development Value
(up to 2025)
Hanoi HCMC Quang Ninh Hung Yen Others
USD 48.2 bn

MACROECONOMY EQUITY MARKET INDUSTRY & STOCK PICKS FIXED INCOME Back
(VND bn) 2019 2020F 2021F
Revenue 51,627 74,437 86,857
+/- yoy (%) +33.5% +44.2% +16.7%
NPAT 24,319 25,329 28,674
+/- % +64.6% +4,2% +13.2%
EPS (VND/share) 6,502 6,762 7,655
FORECAST HISTORICAL PRICE
94,949 VND
TARGET PRICE
+15.0% UPSIDE
VINHOMES JSC (VHM) – PRICING
RNAV method 95,864
P/E method 91,292
VALUATION
67
0
20,000
40,000
60,000
80,000
100,000
120,000
VN
D
VHM Relative VN Index

AVIATION -
SEAPORTS

MACROECONOMY EQUITY MARKET INDUSTRY & STOCK PICKS FIXED INCOME Back 69
Source: CAA, GSO, Vietnam Tourism, VCBS
AVIATION: THE PRESSURE FROM COVID-19 REMAINS
1H.2020: After the period of social distancing, the number of
domestic passengers recorded a positive recovery due to :
Growth of flight number compared to the same period
of Vietnamese airlines in 2020
2H.2020: the second wave of Covid had impact on the recovery
trend of domestic passengers traffic in H2.2020, in particular :
Well-controlled pandemic situation in Vietnam.
Policies to stimulate domestic tourism demand.
Domestic airlines opened new flight routes and decreased ticket
price.
Flight ban order in Da Nang and increasing disease control
measures in many tourism destinations.
Domestic tourism market lost the final month of peak summer
season.
Domestic aviation market went into low season of the year.
In Q4.2020, a number of commercial international flight routes was
reopened but contributed minimally to the total volume due to: (1)
Low flight frequency; (2) Post-entry quarantine measures remains.
Sản lượng khách du lịch quốc tế đến Việt Nam (đv: lượt
khách)
-10%
-34%
-92%
-70%
-38%
-18%
-46%
-71%
-39%
-100%
-80%
-60%
-40%
-20%
0%
Feb Mar Apr May Jun Jul Aug Sep Oct
0
500,000
1,000,000
1,500,000
2,000,000
2,500,000
Jan Feb Mar Apr May Jun Jul Aug Sep Oct
2019 2020

MACROECONOMY EQUITY MARKET INDUSTRY & STOCK PICKS FIXED INCOME Back 70
Source: CAA, ACV, VCBS
AVIATION: POTENTIAL OF RECOVERY FROM 2021
In 2021, passengers traffic is expected to recover due to:
The number of passengers through airports
(unit: million passengers)
In the long-term, Vietnam aviation market retains strong growth
potential with main drivers :
The domestic passengers traffic possessed abundant room for
growth as: (1) Air travel frequency per capita is still low; (2)
Average income and middle-class population size increase
dramatically; (3) Vietnam’s long and divided topography brings
huge advantage to air travel; (4) Expansion in scale of low-cost
airlines.
The number of international passengers benefits from the
increasing global integration of Vietnam’s economy and
international tourism attraction policies are promoted.
Well-controlled pandemic situation in Vietnam.
The procedure of post-entry disease control and quarantine applied
to international commercial flights will soon be implemented.
The vaccine development process witnessed positive signals.
Many aviation infrastructure projects are being strongly invested in
2020, expected to ease the capacity constraint situation in many key
airports and bring about growth potential in the coming years.
30.3
36.7
41.8
11.7
25.6
40.3
0
5
10
15
20
25
30
35
40
45
2017 2018 2019 2020F 2021F 2022F
Important aviation infrastructure projects are being deployed

MACROECONOMY EQUITY MARKET INDUSTRY & STOCK PICKS FIXED INCOME Back 71
Source: Financial statements, VCBS
AVIATION: INVESTMENT OPPORTUNITY FOR LONG-TERM HORIZON
Air transportation companies are the most heavily damaged,
which requires a number of years to offset the lost recognized in
2020 and recover financially, due to:
Profit after tax of HVN & VJC (unit: billion VND)
Long-term investment opportunity for service providers in
airports that:
Low profit margin characteristic.
Recurring fixed costs such as aircraft rental, regular maintenance
and airport services putting great pressure on cash flows.
Have business performance and financial health not severely
affected by the pandemic.
Possess high competitive advantages and abundant room for
business scale expansion to capture \industry growth.
-5,000
-4,000
-3,000
-2,000
-1,000
0
1,000
2,000
Q1.2019 Q2.2019 Q3.2019 Q1.2020 Q2.2020 Q3.2020
HVN
VJC
-40%
-20%
0%
20%
40%
60%
80%
2016 2017 2018 2019 9T.2020
HVN VJC ACV SCS NCT SGN AST
NPAT margins trend of aviation companies

MACROECONOMY EQUITY MARKET INDUSTRY & STOCK PICKS FIXED INCOME Back 72
Source: Vinamarine, Finpro, VCBS
SEAPORTS: BENEFIT FROM THE PRODUCTION RELOCATION WAVE
Accumulated volume of goods through
seaports (unit: thousand tons)
The goods output through seaports in 10M.2020 slightly
increased compared to the same period despite the impact of
Covid-19, thanks to :
Business performance of seaport operators in the coming
years will benefit strongly from:
Marine transportation was less interrupted by the pandemic.
The export-import turnover of Vietnam still witnessed positive
growth during the period.
The manufacturing facilities relocation wave from China.
Trade agreements (CPTPP, EVFTA, RCEP,…) benefiting
many key export products of Vietnam.
The strong promotion of road infrastructures and deep-water
seaports projects, which will reinforce the connection between
key industrial areas, consumption markets and important ports
system.
The growth in traffic of ultra large containerships.
6.6%
10.5% 10.0%
5.1%
5.9%
-8.4%
7.0%
-10%
-5%
0%
5%
10%
15%
Q1.2019 Q2.2019 Q3.2019 Q4.2019 Q1.2020 Q2.2020 Q3.2020
The growth of export-import turnover compared
to the same period
0
100,000
200,000
300,000
400,000
500,000
600,000
700,000
4M 5M 6M 7M 8M 9M 10M
2019 2020

MACROECONOMY EQUITY MARKET INDUSTRY & STOCK PICKS FIXED INCOME Back 73
Source: Vinamarine, VPA, CEIC, VCBS
SEAPORTS: DRIVERS FOR DEEP-WATER SEAPORTS
The dramatically growth in export-import goods volume to US
and EU boost the traffic of ultra large vessels.
The trend of vessel upsizing of many large container carriers.
The improvement in deep-water ports strategic planning and
the support from government:
The volume of container cargo through seaports in Cai Mep (unit: TEU)
Export-Import turnover between Vietnam and US & EU
(unit: million USD)
The construction progress of seaports.
Connection infrastructures.
The promotion in ports relocation from Ho Chi
Minh city.
Decrease in competition pressure in Cai Mep – Thi Vai area.
Lach Huyen seaport will still bear considerable pressure in
attracting cargos.
0
500,000
1,000,000
1,500,000
2,000,000
2,500,000
2015 2016 2017 2018 2019
TCIT - TCCT CMIT TCTT SSIT
0
10,000
20,000
30,000
40,000
50,000
60,000
70,000
80,000
2014 2015 2016 2017 2018 2019
US
EU

MACROECONOMY EQUITY MARKET INDUSTRY & STOCK PICKS FIXED INCOME Back 74
Source: GSO Hai Phong, Financial Statements, VCBS
SEAPORTS: PORTS ON CAM RIVER (IN HAI PHONG)
The ports on the upstream of Cam river (Hai Phong) are likely to
enjoy positive growth in the coming years due to:
The trend of traffic relocation to downstream ports of shipping
companies has basically finished.
Benefit from the growth of cargo volume in the area.
Profit margin expands since many companies no longer have
much depreciation and interest expenses while benefiting from
financial revenue.
Volume of goods through seaports in Hai Phong (unit: million tons)
Depreciation & Interest expense of seaport operators (unit: billion VND)
6%
9%
6%
4%
6% 7%
9%
13%
9%
0%
2%
4%
6%
8%
10%
12%
14%
2017 2018 2019
PHP VSC DVP
Dividend yield of some seaport operators in Hai Phong
0
20
40
60
80
100
120
140
2014 2015 2016 2017 2018 2019 10M.2020
301.7
176.0 188.7
159.8
104.1 106.2
56.8 47.8
0
50
100
150
200
250
300
350
9M.2019 9M.2020
PHP VSC VGR DVP

MACROECONOMY EQUITY MARKET INDUSTRY & STOCK PICKS FIXED INCOME Back 75
Source: ACV, VCBS
AIRPORT CORPORATION OF VIETNAM - ACV
ACV is the largest airport operator in Vietnam.
Almost monopoly position with business operation at 21 airports
across the country.
Revenue and profit come from providing aviation and non-
aviation services at airports.
9M.2020 business results of ACV (unit: billion VND) OVERVIEW
9M.2020 BUSINESS RESULTS:
Net revenue of ACV in 9T.2020 was VND 6.124 billion,
decreased 54,7% compared to the same period due to: (1) Impact
from the pandemic and flight limitation order to the volume of
passengers and flights through airports (2) Service fee reduction
policies to support airlines.
NPAT in 9T 2020 was VND 1.332 billion (-77,4% yoy) since
fixed cost accounted for a large percentage in total cost.
The trend of profit margin of ACV
13,517
6,124 6,998
1,255
5,908
1,332
0
2,000
4,000
6,000
8,000
10,000
12,000
14,000
16,000
9M.2019 9M.2020
Revenue Gross profit NPAT
37% 41%
49% 51%
20% 33% 30%
38%
45%
22%
00%
10%
20%
30%
40%
50%
60%
2016 2017 2018 2019 9M.2020
Gross margin NPAT margin
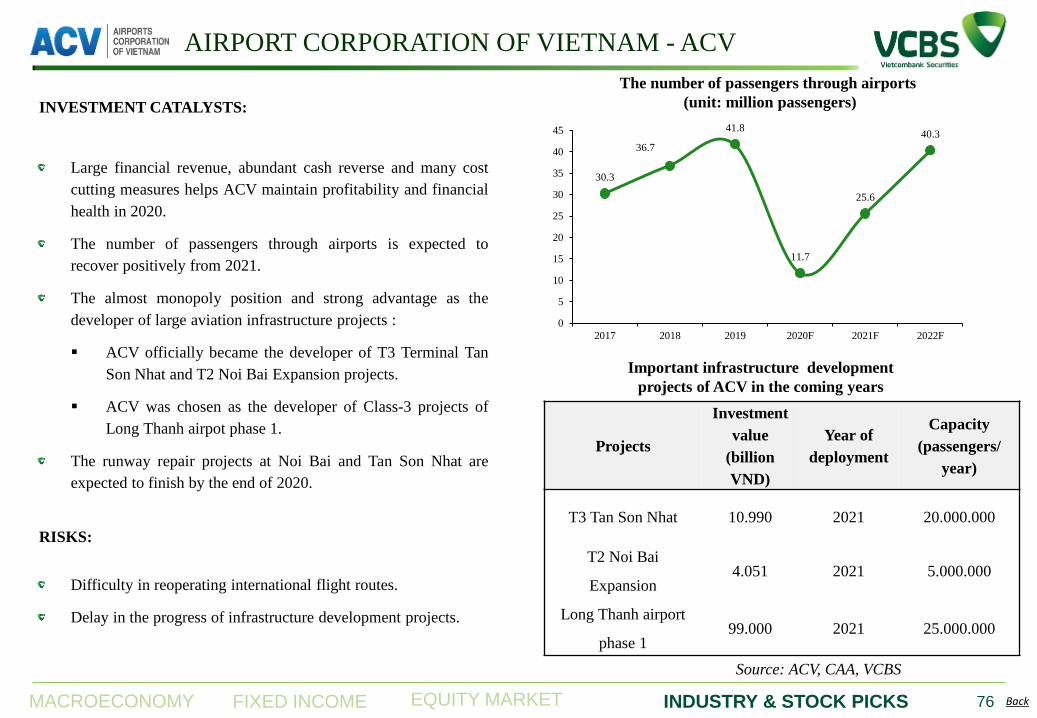
MACROECONOMY EQUITY MARKET INDUSTRY & STOCK PICKS FIXED INCOME Back 76
Large financial revenue, abundant cash reverse and many cost
cutting measures helps ACV maintain profitability and financial
health in 2020.
The number of passengers through airports is expected to
recover positively from 2021.
The almost monopoly position and strong advantage as the
developer of large aviation infrastructure projects :
ACV officially became the developer of T3 Terminal Tan
Son Nhat and T2 Noi Bai Expansion projects.
ACV was chosen as the developer of Class-3 projects of
Long Thanh airpot phase 1.
The runway repair projects at Noi Bai and Tan Son Nhat are
expected to finish by the end of 2020.
The number of passengers through airports
(unit: million passengers) INVESTMENT CATALYSTS:
RISKS:
Difficulty in reoperating international flight routes.
Delay in the progress of infrastructure development projects.
Important infrastructure development
projects of ACV in the coming years
AIRPORT CORPORATION OF VIETNAM - ACV
30.3
36.7
41.8
11.7
25.6
40.3
0
5
10
15
20
25
30
35
40
45
2017 2018 2019 2020F 2021F 2022F
Projects
Investment
value
(billion
VND)
Year of
deployment
Capacity
(passengers/
year)
T3 Tan Son Nhat 10.990 2021 20.000.000
T2 Noi Bai
Expansion 4.051 2021 5.000.000
Long Thanh airport
phase 1 99.000 2021 25.000.000
Source: ACV, CAA, VCBS

MACROECONOMY EQUITY MARKET INDUSTRY & STOCK PICKS FIXED INCOME Back 77
Unit: billion VND 2019 2020F 2021F
Net revenue 18,329 7,512 13,256
+/- yoy (%) 13.7% -59.0% 76.5%
Profit for common
shareholders 8,201 1,851 4,814
+/- % 32.9% -77.4% 160.0%
EPS (VND/ share) 3,450 765 1,990
P/B Method 90,177
EV/EBITDA Method 75,911
FORECAST
VALUATION
87,324 VND
TARGER PRICE
+14.1% UPSIDE
PRICE FLUCTUATION
AIRPORT CORPORATION OF VIETNAM - ACV
0
10,000
20,000
30,000
40,000
50,000
60,000
70,000
80,000
90,000
ACV Relative VN Index

MACROECONOMY EQUITY MARKET INDUSTRY & STOCK PICKS FIXED INCOME Back 78
GEMADEPT CORPORATION - GMD
GMD is one of the largest logistics and seaports operators, with
a port system and logistic infrastructures spreading across the
country, concentrating in Hai Phong and Cai Mep areas.
GMD is operating 06 seaports with the total capacity of 1,7
million TEUs/ year: Nam Hai, Nam Hai Dinh Vu, Binh Duong,
Nam Dinh Vu, Dung Quat, Phuoc Long and Nam Hai ICD.
The company is constructing the deep-water seaport Gemalink
in Cai Mep – Thi Vai, which is expected to come into operation
in 2021.
Shareholders structure of GMD (Updated 11/2020)
OVERVIEW
9M.2020 BUSINESS RESULTS:
Net revenue in 9M.2020 was VND 1.901 billion, decreased 4,8%
compared to the same period due to the impact from Covid-19
and the competition pressure in Hai Phong.
NPAT was VND 372 billion (-31,9% yoy), profit margin
declined due to: (1) Rising management cost along with the
progress of Gemalink construction, (2) In 9M.2020, the
company no longer recognized financial revenue from
investment transfers.
9M.2020 business results of GMD (unit: billion VND)
Source: GMD, VCBS
45.50%
3.76%
50.74% Major shareholders
Managers
Other shareholders
1,996 1,901
804 753
547
372
0
500
1,000
1,500
2,000
2,500
9M.2019 9M.2020
Revenue Gross profit NPAT

MACROECONOMY EQUITY MARKET INDUSTRY & STOCK PICKS FIXED INCOME Back 79
GEMADEPT CORPORATION - GMD
Competition pressure in Nam Dinh Vu port area is likely to
remain at high level due to :
Pressure in attracting cargos from Lach Huyen port.
A number of new ports nearby come into operation.
Business performance of Nam Hai, Nam Hai Dinh Vu and Binh
Duong ports are expected to accelerated in 2021.
Driver for long-term growth from Gemalink:
Growth trend of goods volume in Cai Mep area.
Benefits from the relocation of ports in HCMC.
Many seaports in the area have been operating above
designed capacity.
Benefit from the cargo volume of CMA-CGM shipping lines.
The volume of container cargo through seaports in Cai
Mep (unit: TEU)
INVESTMENT CATALYSTS:
RISKS:
Lach Huyen seaports continue to attract goods from middle-size
vessels.
The delay in development progress of transportation and
logistic service infrastructures in Cai Mep area.
The growth of export-import turnover compared to
the same period
Source: Fiinpro, VPA, VCBS
6.6%
10.5% 10.0%
5.1%
5.9%
-8.4%
7.0%
-10%
-5%
0%
5%
10%
15%
Q1.2019 Q2.2019 Q3.2019 Q4.2019 Q1.2020 Q2.2020 Q3.2020
0
500,000
1,000,000
1,500,000
2,000,000
2,500,000
2015 2016 2017 2018 2019
TCIT - TCCT CMIT TCTT SSIT

MACROECONOMY EQUITY MARKET INDUSTRY & STOCK PICKS FIXED INCOME Back 80
GEMADEPT CORPORATION - GMD
Unit: billion VND 2019 2020F 2021F
Net revenue 2,641 2,509 2,696
+/- yoy (%) -2.47% -5.06% 7.46%
Profit for common
shareholders 515 410 469
+/- % -67.7% -20.8% 14.5%
EPS (VND/ share) 1,595 1,242 1,421
P/B Method 28,700
FCFF Method 35,935
FORECAST
VALUATION
34,488 VND
TARGET PRICE
+12.2% UPSIDE
PRICE FLUCTUATION
0
5,000
10,000
15,000
20,000
25,000
30,000
GMD Relative VN Index

CONSTRUCTION
MATERIALS

MACROECONOMY EQUITY MARKET INDUSTRY & STOCK PICKS FIXED INCOME Back
17.3 16.6
20%
43%
28%
21% 21%
6%
-4%
-10%
0%
10%
20%
30%
40%
50%
0
5
10
15
20
25
2013 2014 2015 2016 2017 2018 2019 9M-
2019
9M-
2020
Million tons
Total consumption volume Growth
-2%
-10%
-13% -15%
3%
-19%
0%
-6%
-27%
-3%
-14% -16%
VGC VIT CVT TTC VTA TCR
+/- yoy revenue +/- yoy gross profit
Highlights in 9M/2020: The construction materials industry has faced many difficulties from the Covid-19 and almost
recorded a decline in consumption volume and selling price. However, the level of influence is different among sub-
sectors.
82
Figure 1: Revenue and gross profit of ceramic tile companies
Figure 2: Total consumption of steels
• Steel industry: Total steel consumption volume of the whole industry in
9M.2020 decreased by 4% yoy.
• In the country, the construction market begins to progress slowly from 2019. By
2020, the covid-19 epidemic slowed down the supply recovery and construction
progress of real estate projects.
• Domestic long steel selling price at the end of Q3 / 2020 is estimated to decrease
by 4.5% compared to early 2020. Especially in the Southern market, the selling
price is somewhat more competitive compared to the North when the supply
increases sharply from the factories of Nghi Son, Hoa Phat-Dung Quat, Tue
Minh and Tung Ho.
• In addition, in the segment of flat steel, covid-19 also makes the construction of
export markets and trade and transport between countries difficult. Besides
increasing commercial protection of flat steel segment in exporting countries.
• The ceramic tile industry in 9M/2020 has been heavily
influenced by the construction slowdown lasting from 2019
and the covid-19 epidemic in 2020.
• Most of the listed companies in the industry recorded a
significant decline in revenue and NPAT.
• According to a VCBS survey, the selling price of common
ceramic tiles at the end of Q3 / 2020 has decreased by 5-10%
compared to the beginning of 2020.
Source: Fiinpro Source: VSA

MACROECONOMY EQUITY MARKET INDUSTRY & STOCK PICKS FIXED INCOME Back
14%
3% 4%
9%
18%
3% 3%
0%
4%
8%
12%
16%
20%
0
20
40
60
80
100
120
Million tons
Domestic consumption Export (cement và clinker) Growth
Highlights in 9M/2020: The construction materials industry has faced many difficulties from the Covid-19 and almost
recorded a decline in consumption volume and selling price. However, the level of influence is different among sub-
sectors.
83
Figure 4: Fluctuation of crushed stone prices in the Southern region
• Crushed stone industry: Construction stone business activities in the Southern
region are evaluated positively in the context of the Covid-19 epidemic, specifically:
• The Mines at Bien Hoa, Vinh Cuu, Bac Tan Uyen still recorded growth in the
context of Covid-19 thanks to construction activities at Long Thanh, Kien Giang and
Can Tho areas continued to be positive. As a result, selling prices remained stable or
increased slightly compared to the end of 2019. Listed companies in this area such as
VLB (+ 12% yoy), DHA (+ 21% yoy) still recorded a positive growth in gross profit.
• The mines at Tan Dong Hiep was facing a difficult challenge to stop mining.
However, this pushed up selling prices due to scarcity, besides the positive real estate
projects in Di An and civil & infrastructure projects in HCM City also increased
demand for construction stone in the period. Revenue from some listed companies
represented in this area such as C32 (+ 5%), NNC (+ 11% yoy) recorded a positive
growth
160
180
200
220
240
260
280
300
1.000 VND/m3
Núi Gió Tân Cang 3 Thạnh Phú 2 Tân Đông Hiệp
Source: VCBS research
Figure 3: Total consumption volume of cement and clinker
• Cement industry: In 9M/2020, total consumption volume of the whole
industry reached a slight growth of 3% yoy thanks to a positive clinker
export volume. However, clinker export activities during the year did not
bring much profit for domestic manufacturers when the selling price of
clinker was insignificantly higher than the cost of production.
• Particularly, domestic consumption volume in 9M/2020 reached 45.5
million tons, down 6% yoy, affected by the slowdown in domestic
construction activities.
Source: Vietnam Cement Association

MACROECONOMY EQUITY MARKET INDUSTRY & STOCK PICKS FIXED INCOME Back
7.0%
12.3%
9.5%
23.5%
17.9%
0%
5%
10%
15%
20%
25%
0
1,000
2,000
3,000
4,000
5,000
6,000
7,000
8,000
9,000
2016 2017 2018 2019 9M/2019 9M/2020
Million
Furniture +/- yoy
Highlights in 9M/2020: The construction materials industry has faced many difficulties from the Covid-19 and almost
recorded a decline in consumption volume and selling price. However, the level of influence is different among sub-
sectors.
84
Figure 5: The export value of Vietnam's furniture
Source: MOIT
Figure 6: TOP 5 countries exporting furniture in the US market
20.8
8.1
4.9 3.9
0.8
16.0
6.8 6.7
3.2 1.4
0
5
10
15
20
25
30
35
40
China Mexico Viet Nam Canada Malaysia
Tỷ USD
2015 2016 2017 2018 2019 LK 9T/2019 LK 9T/2020
Source: U.S. Department of Commerce
-23% yoy -17% yoy
+36% yoy -17% yoy
+61% yoy
• Vietnam's furniture industry in 9M/2020 recorded a positive export growth with a value of US $ 6.4 billion, + 18% yoy.
• Notably, export activities in the US market continued to record strong growth +36% yoy as Vietnam's furniture industry is benefiting when
the US is imposing tariffs (20-25%) on Chinese furniture

MACROECONOMY EQUITY MARKET INDUSTRY & STOCK PICKS FIXED INCOME Back
85
• Public investment disbursement progress has been significantly improved: In 9M/2020, the total disbursement capital for
development investment from the state budget reached 322 trillion VND, up 40% yoy. Noted that the disbursement amount increased
significantly compared to the average for the 2016-2019 period.
• In which, disbursement activity recorded a sharp increase over the same period from June 2020 onwards. This has partly supported
a recovery in domestic cement and construction steel consumption in Q3 / 2020 (Figure 9 & 10).
PROSPECTS OF RECOVERY FROM BOOSTING PUBLIC INVESTMENT OF THE
GOVERNMENT
Figure 7: Disbursement of investment capital from the state budget, 2016-2020
81%
120%
-12%
27%
16%
52%
147%
3%
54%
140%
-20%
0%
20%
40%
60%
80%
100%
120%
140%
160%
0
10,000
20,000
30,000
40,000
50,000
60,000
T1 T2 T3 T4 T5 T6 T7 T8 T9 T10
Biliion VND
2019 2020 +/- yoy
Figure 8: Disbursement of investment capital from the state budget in 2020
Source: MOIT Source: MOIT
63%
47% 51%
45%
57%
4%
22%
-6%
40%
-10%
0%
10%
20%
30%
40%
50%
60%
70%
0
50
100
150
200
250
300
350
400
450
500
9T/2016 9T/2017 9T/2018 9T/2019 9T/2020
1.000 billion VND
Plan of Government Actual disbursement % Plan +/- yoy

MACROECONOMY EQUITY MARKET INDUSTRY & STOCK PICKS FIXED INCOME Back
86
FORECAST OF CONSTRUCTION MATERIALS INDUSTRY IN 2021
Figure 9: Total domestic construction steel consumption by quarter, 2019-2020
-16%
-1%
6%
-20%
-15%
-10%
-5%
0%
5%
10%
0.0
0.5
1.0
1.5
2.0
2.5
3.0
Q1 Q2 Q3 Q4
Million tons
2019 2020 +/- yoy
-18.0%
-7.4% -6.9%
-20%
-18%
-16%
-14%
-12%
-10%
-8%
-6%
-4%
-2%
0%
0
2
4
6
8
10
12
14
16
18
20
Q1 Q2 Q3 Q4
Million tons
2019 2020 +/- yoy
Source: VSA
Figure 10: Total production of the domestic cement consumption by quarter, 2019-2020
Figure 11: VCBS forecasts the prospects of the construction materials industry in 2021
Source: Vietnam Cement Association
Crushed Stone DHA, VLB
Asphalt PLC
Steel HPG, POM, HSG, NKG
Furniture PTB
Cement HT1
Construction plastic BMP, NTP
Ceramic tile CVT, VGC, TTC
Negative Neutral Positive Outstanding

MACROECONOMY EQUITY MARKET INDUSTRY & STOCK PICKS FIXED INCOME Back
Steel
84%
Argiculture
12%
Other industries
3%
Real estate
1%
HOA PHAT GROUP (HPG) – Overview
87
Core-business
Core business is steel production and commercial with the revenue
proportion of over 80% - number one position in market share of
long steel (32.6%, 10M/2020, VSA) and steel pipe (31.0%,
10M/2020, VSA).
Performance Updates
In 9M/2020, HPG's business activities showed strong growth:
• Revenue and NPAT of HPG reached VND 64,340 billion (+
41% yoy), and VND 8,845 billion (+ 56% yoy) respectively .
• Revenue and NPAT of the core business - steel products still
achieved outstanding growth, respectively 51% yoy and 48%
yoy in the context of the industry facing many difficulties
after putting the furnace No. 1 & 2 at Dung Quat factory into
operation.
• HPG's agricultural segment also recorded a sudden growth in
NPAT +573% yoy thanks to the increase in prices of
Australian pork and beef in this year.
Figure 12: Shareholder structure Figure 13: Revenue structure in 9M/2020
Figure 14: Revenue – NPAT – EPS, 2018- 2021F
Source: HPG
Source: HPG
46,162
55,836
63,658
81,968
8,015 8,601 7,578
8,960
5,895 4,037 2,742 3,245
0%
2%
4%
6%
8%
10%
12%
14%
16%
18%
20%
0
10,000
20,000
30,000
40,000
50,000
60,000
70,000
80,000
90,000
2017 2018 2019 2020F
Billion VND
Revenue NPAT EPS Net margin
Trần Đình Long &
relative, 32.69%
Dragon Capital,
5.01%
VOF, 3.70%
PENM Germany,
3.49%
The others,
55.04%

MACROECONOMY EQUITY MARKET INDUSTRY & STOCK PICKS FIXED INCOME Back
-10%
-5%
0%
5%
10%
15%
20%
25%
2018 2019 9M/2020
HPG POM TDS TNB VCA DNS VIS
9.1
10.3 10.2 10.9 10.9 10.8
10.2
HPG-BOF The
average
domestic
selling
price of
billet in
2019
CBI VCA TDS DNS EAF 120
tons/batch
Billion VND/ton
HPG – Outlook
88
STEEL
Great competitive advantage in low production costs: HPG's profit margin was 17.4% in 9M/2020 compared to EAF
furnace companies which only reached less than 3%. Steel capacity in the South and Central in 9M/2020 reached 935
thousand tons (+ 60% yoy in sales volume in the region thanks to good competitive selling prices).
Figure 16: Operating margin of some construction steel companies Figure 15: Production cost of 1 ton of billet in some companies in 2019
Source: Fiinpro Source: VCB research

MACROECONOMY EQUITY MARKET INDUSTRY & STOCK PICKS FIXED INCOME Back
HPG – Outlook
89
REAL ESTATE
Large land bank.
STEEL
The 3-year safeguard tax extension helps strengthen HPG's leadership position.
Public investment boost in the second half of the year could support steel demand.
Domestic demand for HRC steel is large relative to the domestic supply.
Long-term growth prospects for Vietnam's construction industry.
RISKS
In 2020, domestic construction industry might slow down.
In the medium term after 2021, there is a risk of a sharp increase in billet supply in Southeast Asia from large-scale steel projects
in Indonesia and Malaysia.
In the long term, HPG faces competition pressure if safeguard tax expires.

MACROECONOMY EQUITY MARKET INDUSTRY & STOCK PICKS FIXED INCOME Back
HPG – Valuation
90
FORECAST
VND
39,200/share
TARGET PRICE
+10.4% UPSIDE
CHANGE IN STOCK PRICE
DCF Method: VND 39,200/share
Valuation
Unit: VND bn 2019 2020F 2021F
Net revenue 63,658 90,292 103,617
+/- yoy (%) 14.0% 41.8% 14.8%
NPAT 7,570 12,708 14,904
+/- % -12.0% 67.7% 17.3%
EPS (VND 000/share) 2,742 3,835 4,498
600
650
700
750
800
850
900
950
1,000
1,050
10,000
15,000
20,000
25,000
30,000
35,000
40,000
12
/11
/20
18
1/1
1/2
01
9
2/1
1/2
01
9
3/1
1/2
01
9
4/1
1/2
01
9
5/1
1/2
01
9
6/1
1/2
01
9
7/1
1/2
01
9
8/1
1/2
01
9
9/1
1/2
01
9
10
/11
/20
19
11
/11
/20
19
12
/11
/20
19
1/1
1/2
02
0
2/1
1/2
02
0
3/1
1/2
02
0
4/1
1/2
02
0
5/1
1/2
02
0
6/1
1/2
02
0
7/1
1/2
02
0
8/1
1/2
02
0
9/1
1/2
02
0
10
/11
/20
20
11
/11
/20
20
VN-Index HPG
HPG
VN_INDEX

MACROECONOMY EQUITY MARKET INDUSTRY & STOCK PICKS FIXED INCOME Back
4,719
5,552 5,656
6,862
400 457 371 541
8,389
9,130
8,047
11,746
0%
1%
2%
3%
4%
5%
6%
7%
8%
9%
0
2,000
4,000
6,000
8,000
10,000
12,000
14,000
2018 2019 2020F 2021F
Billion VND
Revenue NPAT EPS (VND) Net margin
PHU TAI JSC (PTB) – Overview
91
Core business
PTB operates mainly in three areas: (1) exploiting and processing paving
stone, (2) manufacturing interior-exterior wood products and (3) Toyota
car sales.
Business performance
In 9M.2020, PTB's business activities were affected by the covid-19
epidemic as:
Although revenue recorded a slight increase of + 3.4% yoy, NPAT
recorded a decrease of 19% yoy. Inside:
• The paving stone segment recorded a slight growth of +9% yoy in
revenue thanks to the increase in capacity at factories (Dak Nong,
Binh Dinh Phu Cat, Thanh Chau Phu Yen) and an increase in
export orders. However, profit before tax decreased by 33% yoy,
mainly from lower selling prices during the period.
• The wood products manufacturing segment recorded outstanding
growth in both revenue and EBT, respectively +51% yoy and
+73% yoy from an increase in orders as US imposes a relatively
high tax of 20-25% on Chinese interior-exterior wood production
enterprises.
• Toyota sales segment recorded a negative EBT of VND 7.4 billion
– mainly due to reduced demand and intense competition in Da
Nang from a second Toyota distributor in this area.
.
Source: PTB
Source: PTB, VCBS forecast
Figure 17: Shareholder structure Figure 18: Revenue structure in 9M/2020
Figure 19: Revenue – NPAT – EPS, 2018- 2021F
Furniture
58%
Toyota trading
1%
Stone slab
39%
The other
commodities
0%
Services
2%
Board members
group, 43.8%
The others,
56.2%

MACROECONOMY EQUITY MARKET INDUSTRY & STOCK PICKS FIXED INCOME Back
PTB – Outlook
92
Construction stone has great advantage in quantity and reserve of quarries: Currently PTB owns 17 paving stone quarries and
01 construction quarry with a total reserve of 59.3 million m3, remaining mining time is 20-30 years on average.
Wood segment benefits from the US tax on Chinese interior/exterior wood products
Currently, China does not have many advantages in interior/exterior wood products compared to Vietnam as there is
similarity in technology, besides the labor costs of China is relatively high. Therefore, high taxes from US on China has
helped Vietnamese businesses to benefit.
This is partly reflected in the Q3.2020 financial statements of PTB when there are many new customers from the US, EU and
Japan countries. In addition, the two factories to expand capacity by the end of 2019, Phu Tai Dong Nai Plant (+67%
capacity) and Thang Loi Plant (+100% capacity), operated impressively in 2020 with capacity up to 90%.
Figure 20: Labor costs in some Asian countries Figure 21: TOP 5 countries exporting furniture in the US market
20.8
8.1
4.9 3.9
0.8
16.0
6.8 6.7
3.2 1.4
0
5
10
15
20
25
30
35
40
China Mexico Viet Nam Canada Malaysia
Tỷ USD
2015 2016 2017 2018 2019 LK 9T/2019 LK 9T/2020
-
1.0
2.0
3.0
4.0
5.0
2010 2011 2012 2013 2014 2015 2016 2017
USD/ giờ
Indonesia Việt Nam Thái Lan
Philippines Trung Quốc Malaysia
-23% yoy -17% yoy
+36% yoy
-17% yoy
+61% yoy
Source: U.S. Department of Commerce Source: IMA Asia

MACROECONOMY EQUITY MARKET INDUSTRY & STOCK PICKS FIXED INCOME Back
PTB – Outlook
93
In 2021, PTB's Revenue - NPAT – ROIC are expected to grow significantly as:
• The paving stone segment is expected to grow when Artificial Quartz Stone Factory starts to operate from Q4.2020.
• Wood segment is expected to continue to grow based on the number of existing orders. Also, the operation of Binh
Dinh plant phase 1 from the end of H1/2021 would increase PTB's total wood processing capacity by 15%.
• Hand-over of Phu Tai Residence project is expected to bring in VND 250 billion of EAT, which is expected to
start booking from Q3.2021 until 2022.
RISKS
In 2021, domestic construction industry might continue to progress slowly.
In the medium term after 2021, US might no longer impose tariffs on Chinese wooden products for interior and exterior from
China.
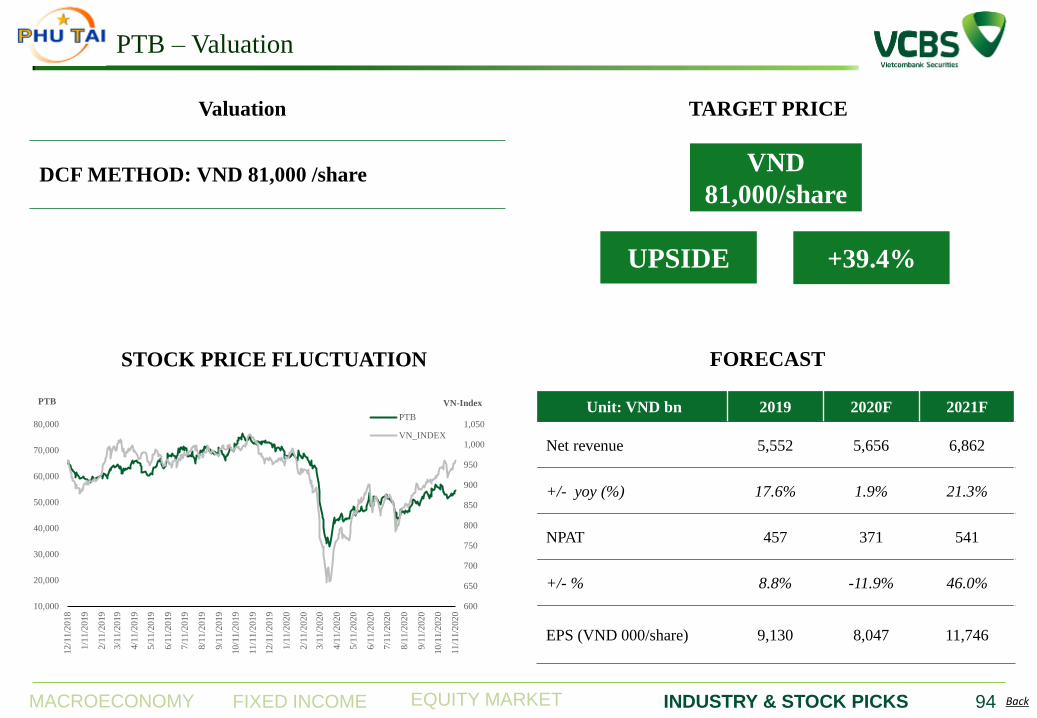
MACROECONOMY EQUITY MARKET INDUSTRY & STOCK PICKS FIXED INCOME Back
PTB – Valuation
94
FORECAST
VND
81,000/share
TARGET PRICE
+39.4% UPSIDE
DCF METHOD: VND 81,000 /share
Valuation
Unit: VND bn 2019 2020F 2021F
Net revenue 5,552 5,656 6,862
+/- yoy (%) 17.6% 1.9% 21.3%
NPAT 457 371 541
+/- % 8.8% -11.9% 46.0%
EPS (VND 000/share) 9,130 8,047 11,746
600
650
700
750
800
850
900
950
1,000
1,050
10,000
20,000
30,000
40,000
50,000
60,000
70,000
80,000
12/1
1/2
01
8
1/1
1/2
01
9
2/1
1/2
01
9
3/1
1/2
01
9
4/1
1/2
01
9
5/1
1/2
01
9
6/1
1/2
01
9
7/1
1/2
01
9
8/1
1/2
01
9
9/1
1/2
01
9
10/1
1/2
01
9
11/1
1/2
01
9
12/1
1/2
01
9
1/1
1/2
02
0
2/1
1/2
02
0
3/1
1/2
02
0
4/1
1/2
02
0
5/1
1/2
02
0
6/1
1/2
02
0
7/1
1/2
02
0
8/1
1/2
02
0
9/1
1/2
02
0
10/1
1/2
02
0
11/1
1/2
02
0
VN-Index PTB
PTB
VN_INDEX
STOCK PRICE FLUCTUATION

ENERGY SECTOR

MACROECONOMY EQUITY MARKET INDUSTRY & STOCK PICKS FIXED INCOME Back
Energy with Covid 19 pandemic.
Construction Industry and Consumer electricity Industry consume the most
electricity, account for 90%.
Economic and consumption activities were strongly influenced by Covid 19
which appeared at the beginning of the year and peaked at the social distancing
in April 2020 and August 2020.
Covid 19 has interrupted the supply of raw materials from the beginning of 2020,
causing a shortage of raw materials for the Vietnamese industry. Then, Covid 19
spread to all over the world, decreasing consumption and shopping demand.
Therefore, domestic industrial production is also affected, resulting in a slightly
growth in electricity demand.
Accumulation of 9M.2020, the industrial production index only increased by
2.7% YoY and GDP increased by only 2.1%, leading to an increase in electricity
consumption across the country by only 2.68% YoY compare to above 10% in
average before.
ENERGY SECTOR - UPDATE
96
Source: EVN
Source: EVN, Fiinpro
0%
2%
4%
6%
8%
10%
12%
14%
16%
2015 2016 2017 2018 2019 5T 6T 7T 8T 9T
Energy Production, GDP and IIP
Eletricity Production IIP GDP
55%
6%
32%
3% 4%
Energy consumption structure
Industrial,
ConstructionCommercial
Comsumer
Agriculture, Forestry
and fishery

MACROECONOMY EQUITY MARKET INDUSTRY & STOCK PICKS FIXED INCOME Back
El Nino – La Nina: Two facets in a year.
El Nino takes place from the end of 2019 to the first half of 2020, making the
water flowing very low, especially the North, causing the 5M.2020 power
generation output from hydropower to decrease 34% over the same period.
Increase mobilization of coal-fired thermal power in the first half of 2020: Coal
thermal power ran maximum capacity with more than 58% of total electricity
output. Total thermal power output increases 16% yoy due to the fact that the
remaining significant source gas thermal power faces the difficulty in reduction of
gas resources and new exploitation projects have not started to operate.
Hydropower benefits in the second half of 2020: Since June 2020, rain has begun
to appear more in the Northern mountainous region and especially more than 10
storms entering the Central from September until now due to the La Nina.
Full market price (FMP) drop significantly in Oct., because price of Hydropower
is much lower than thermal power price. In October, FMP is at only 328
VND/kWh – lowest in the past 5 years.
ENERGY SECTOR - UPDATE
97
-2
0
2
4
10/1
1
04/1
2
10/1
2
04/1
3
10/1
3
04/1
4
10/1
4
04/1
5
10/1
5
04/1
6
10/1
6
04/1
7
10/1
7
04/1
8
10/1
8
04/1
9
10/1
9
04/2
0
ONI Index (NOAA)
Soure: NOAA
0%
20%
40%
60%
80%
100%
201
4
201
5
201
6
201
7
201
8
201
9
6T
.202
0
7T
.202
0
8T
.202
0
9T
.202
0
Power generation structure
Hydropower Coal - fired power Gas power
Soure: EVN
0
500
1000
1500
1 2 3 4 5 6 7 8 9 10 11 12
Average FMP
2020 2019
Source: EVNGENCO 3, EVN

MACROECONOMY EQUITY MARKET INDUSTRY & STOCK PICKS FIXED INCOME Back
Renewable energy
New preferential tariff for solar PV: The selling price of solar PV has decreased to 7.09 cents/kWh compared to 9.35 cents/kWh
within 20 years for projects with commercial operation before 1/1/2021.
Installation costs fell sharply over the years: According to IRENA, the average installation cost for solar power in 2019 was only $
995/kW, a decrease of 78.8% vs 2010. Onshore wind power is only 1,473 USD/kW, down 24% from 2010. PV panel price also
decrease by 20 -30% in 2020 due to increase of capacity factor and productivity. LOCE also has a very strong decrease in Solar PV
and Wind power.
Strengthening the transmission system to release capacity, especially in Ninh Thuan and Binh Thuan areas: In 2020, 113 project have
been released with a total capacity of up to 5,700 MW. There are only 11 projects remain operating before June 30, 2019 (with a
capacity of roughly 360 MW) and a number of new solar power projects put in the planning have not been fully released.
Strong growth in capacity and output: 9M.2020 output reached 8,160 GWh (+160% yoy). The proportion of total generation output is
up to 4.4% compared to less than 1% in 2018 and 2.5% in 2019. Installed capacity is nearly 6,000 MW, accounting for 10% of total
installed capacity.
ENERGY SECTOR - UPDATE
98
Source: IRENA, VCBS
0
5000
201
0
201
1
201
2
201
3
201
4
201
5
201
6
201
7
201
8
201
9
Total Installed cost
On-shore WindpowerSolar PVHydropowerOff-shore Windpower
10%
20%
30%
40%
50%
60%
201
0
201
1
201
2
201
3
201
4
201
5
201
6
201
7
201
8
201
9
Capacity factor
On-shore Windpower
Solar PV
Hydropower
0
0.1
0.2
0.3
0.4
201
0
201
1
201
2
201
3
201
4
201
5
201
6
201
7
201
8
201
9
LOCE
On-shore WindpowerSolar PVHydropowerOff-shore Windpower
Cents/kW
9.35 9.35 9.35 8.5
9.8
7.69 7.09
8.38
0
2
4
6
8
10
12
Floating
Solar PV
Onshore
Solar PV
Rooftop
Solar PV
Onshore
Wind
power
Offshore
Wind
power
Output price
FIT 1 FIT2
US
cents/kWh

MACROECONOMY EQUITY MARKET INDUSTRY & STOCK PICKS FIXED INCOME Back
Hydropower will continue growing in the first half of 2021: La Nina will
continue in the second half of 2020 and the beginning of next year. The rain area
will be concentrated in the North Central region and move to the South Central
Coast and the North Central Highlands due to the combination of strong northeast
monsoons this year. Thermal power could be reduce. Solar power in storm-
affected areas also reduces radiation.
Thermal power: Thermal power plants will run more stably when La Nina passes
because these are base plants. Some plants are given high priority to allocate Qc to
assist in repayment period and operate efficiently like HND. However, re-signing
the PPA at a lower price after the repayment period expires will reduce the impact
of the interest rate reduction (HND, NT2)
Installation costs, LOCE continue to sharply decline in renewable energy due to
technology improvement and economic of scale advantage.
Renewable energy development policy: Expect to lengthen the policy of wind
power, solar power with attractive price due to great potential and incomplete
auction mechanism.
Invest in thermal power projects using LNG when domestic gas resources are
gradually exhausted.
Electricity demand continues to increase rapidly in the long term in correlation
with the expectation of rapid economic growth of Vietnam.
Developing power grid due to high demand of capacity clearance
ENERGY SECTOR - OUTLOOK
99
0%
50%
100%
10 11 12 1 2 3 4 5 6
Probability of El Nino, La Nina
according to CPC/IRI
La Niña Neutral El Niño
3%
5%
7%
9%
11%
13%
15%
17%
2009 2012 2015 2018 2026 - 2030
Adjusted
PP 7
Energy consumption and GDP
Source: EVN, revise PP7
Source: EVN, PP 7 Adjusted
2030 planning Unit 2016 - 2020 2021 - 2025 2026 - 2030
500 kV
substation MVA
26,700
26,400
23,550
220 kV
substation MVA
34,966
33,888
32,750
500kV grid line km
2,746
3,592
3,714
220 kV grid line km
7,488
4,076
3,435

MACROECONOMY EQUITY MARKET INDUSTRY & STOCK PICKS FIXED INCOME Back
Draft of power planning WIII would has some changes
Renewable energy such as wind and solar power will be significantly
increased in capacity. Wind power capacity is 3 times and solar power is
nearly 2 times higher than adjusted Power Master Plan VII. The total installed
capacity will increase by about 30 GW (accounting for 26% - 27% of the total
installed capacity of the whole system in 2030 compared to 9.5% in 2020).
Thermal power: More than 17GW of imported coal thermal power added to
the PMP VII will be passed through after 2030 or removed. Total additional
installed capacity by 2030 of thermal power plant is about 30 GW.
In addition, the new power source planning projects are mainly concentrated
in the South Central Coast, the Central Highlands and the South West - far
from the load, so there will be very high demand in developing the
transmission network. Specifically, it is expected that by 2030, if all registered
investment projects are approved, the South and South Central regions will
have a surplus of 80 GW and 18 GW of the Central Highlands.
ENERGY SECTOR - OUTLOOK
10
0
Source: EVN, Adjusted PP VII
0
100
200
300
400
500
600
700
2020 2025 2030
Hydro power Coal - fired thermal Gas thermal
Renewable Import Nuclear power
265
400
572
Billion kWh Energy structure according to
Adjusted PP VII

MACROECONOMY EQUITY MARKET INDUSTRY & STOCK PICKS FIXED INCOME Back
We believe that the electricity business outlook has the following characteristics
Benefit from La Nina: Companies hold Central and North hydropower plants.
Developers of wind power projects can run commercially before November 1, 2021.
Contractors of energy projects and power transmission networks.
Construction Materials suppliers.
Some typical enterprises in the industry
Source: Fiinpro, VCBS
Based on the above evaluation, we choose PC1 stock due to expectation of hydropower segment to improve significantly when LaNina continue,
investing in wind power projects and grid installation will take advantage of capital flows into wind power field.
ENERGY SECTOR - OUTLOOK
101
No. Tiker Market cap
(VND billion) P/E P/B EV/EBITDA
Dividend yield
in 2019 Type of energy
1 POW 23,325.04 14.85 0.83 6.32 3.01% Gas power, Thermal power, Hydropower
2 REE 13,797.27 9.75 1.27 13.76 3.60% Hydropower, Thermal…
3 HND 8,971.00 5.92 1.37 3.19 8.92% Coal - fired
4 NT2 6,707.51 10.6 1.64 5.17 10.73% Gas power
5 VSH 4,093.89 52.86 1.29 55.87 0.00% Hydor power
6 PC1 3,951.22 9.25 1.02 7.76 0.00% Energy contractor, Hydropower, Wind power
7 SBH 3,503.15 11.78 1.68 7.59 7.09% Hydropower
8 CHP 2,894.18 13.38 1.74 15.83 5.08% Hydropower, Solar PV
9 TV2 1,676.50 7.6 1.6 5.58 0.00% Energy contractor, consultant, Solar PV
10 TBC 1,555.75 10.87 1.58 6.38 8.16% Hydropower

MACROECONOMY EQUITY MARKET INDUSTRY & STOCK PICKS FIXED INCOME Back
Policy risk: The FIT price that is not extended and takes a long time to come up with new policy will delay investment decisions
for projects.
The possibility of releasing capacity for new projects that have been added to the plan is not high: Only 20-23% of RE
capacity has been added to the 2020 that could be released due to insufficient infrastructure, which will reduce capacity
generation, affecting the profitability of those project (in 2021, the clearance plan is 11,000 MW, 2023 will release 11,745 MW but
the remaining of 2,300 MW in 2021 and 1,555 MW 2023.
Input risks: For renewable energy, hydropower will depend heavily on Weather such as rainfall, radiation or wind speed, so we still
depend on the thermal power (coal – fired and gas – fired) . For thermal power projects, domestic coal output does not meet the
demand for coal-fired thermal power generation (it is expected that by 2030 only meets 50% of the required output) and must
depend on imports from Indonesia, Australia…. Gas reserves are declining, the Southeast region needs to subsidize LNG from
2021 - 2022 and import gas from Malaysia.
ENERGY SECTOR - RISKS
102

MACROECONOMY EQUITY MARKET INDUSTRY & STOCK PICKS FIXED INCOME Back
POWER CONSTRUCTION JSC No.1 (PC1) – Overview
103
Business activities
Four main sectors, the electricity transmission network construction and
installation segment (36% of net revenue), electricity pole structure
production (17% of net revenue), real estate (16% of net revenue), power
source development (13% of net revenue) and other businesses.
Shareholder
The major shareholder is Mr. Nguyen Van Tuan (Chairman) and his family
(20.03%), followed by BEHS, who just joined in early 2020 with 17.76%,
Vietnam Holding Ltd (4.14%), Nguyen Nhat. Tan (3.23%), and other
shareholders.
9M.2020 Result
9M.2020's revenue reached VND 4,170 billion (-2.4% yoy, 59.5% of the year
plan). GPM reached 20%, improved 4.9% over the same period. Profit after
tax for parent company shareholders reached VND 373 billion (+ 24% YoY,
79% of the year plan).
Revenue decreased slightly by 2.4% yoy due to a sharp decline in
commercial trading and other activities (-42% yoy); Construction revenue
decreased due to the same period being the peak of handover of solar power
EPC projects, while 9M.2020, Covid epidemic affected. However, revenue
from energy and industrial production grew very well, especially the
hydropower segment, which has modest revenue but contributes the most to
PC1's gross profit; Real estate segment increases considerably from PCC1
Thanh Xuan project.
Source: PC1, fiinpro, VCBS
Source: PC1, VCBS
20.03%
17.76%
4.14% 3.23%
54.34%
Shareholder portion
Trinh Van
Tuan
HEHS
Vietnam
Holding Ltd
Nguyen Nhat
Tan
Norges Bank
Others
51%
17%
4%
9%
19% 36%
17%
16%
13%
17% Construction
Industrial
production
Real Estate
Power
Commercial
Revenue structure
Insdie: 2019
Outside: 9T.2020
237 467 358 302 372
15.2% 17%
14% 15.1%
19.9%
0.0%
5.0%
10.0%
15.0%
20.0%
25.0%
-
1,000
2,000
3,000
4,000
5,000
6,000
7,000
2017 2018 2019 9T.2019 9T.2020
Business performance
Total Revenue Gross profits
Profit after Tax Gross Profit margin
VND Bil

MACROECONOMY EQUITY MARKET INDUSTRY & STOCK PICKS FIXED INCOME Back
PC1 - OUTLOOK
104
CATALYST
Hydropower segment has increased since the return of La Nina in Q2/2020. According to the General Department of Meteorology
and Hydrology, La Nina is likely to extend to the end of the spring causing many storms and air disturbance to increase rain in Northern
region - where PC1's hydropower plants are located. In addition, PC1 ran several hydropower plants in 2020 (Song Nhiem 4, Bao Lac
B, Mong An - a 50% increase in capacity).
Investing in wind power with a total capacity of 144 MW in Quang Tri expected to be completed in Q4.2021 with a selling price of
8.5 cents/kWh will help the power generation segment become the most profitable segment for PC1 activities.
The electrical construction segment will utilize capital inflows to the wind power and Solar PV market in the future.
Construction, industrial production has great benefits from renewable energy incentives and the demand for electricity has steadily
increased over the years.
Prospects of further real estate projects: PCC1 Vinh Hung, Thang Long and potential project will add more value to the business.
Risk
Weather, Account receivable, Wind project’s construction progress can’t meet the deadline of FIT2.
Source: VCBS estimated Source: VCBS estimated
-
2,000
4,000
6,000
8,000
FY 2020E FY 2021E FY 2022E FY 2023E FY 2024E
Revenue estimated
Construction Industrial production Real Estate
Power Commercial
-
200
400
600
800
1,000
1,200
1,400
1,600
1,800
FY 2020E FY 2021E FY 2022E FY 2023E FY 2024E
Gross margin structure forecast
Construction Industrial production Real Estate Power Commercial

MACROECONOMY EQUITY MARKET INDUSTRY & STOCK PICKS FIXED INCOME Back
PC1 – Valuation
105
Logo DN
Unit: VND billion 2019 2020F 2021F
Net revenue 5,845 5,904 6,147
+/- yoy (%) 14.96% 1.00% 4.13%
NPAT 358 570 460
+/- % -23.31% 59.42% -19.34%
EPS (VND) 2,246 3,580 2,888
DCF Model 22,500
FORECAST
VALUATION
VND 22,500/share
TARGET PRICE
+5.0% UPSIDE
5,000
8,000
11,000
14,000
17,000
20,000
23,000
STOCK PRICE FLUCTUATION
PC1 Relative VNINDEX

RETAIL INDUSTRY

MACROECONOMY EQUITY MARKET INDUSTRY & STOCK PICKS FIXED INCOME Back
GAINING BACK TO THE GROWTH MOMENTUM WHILE FACING THE
CHALLENGE OF COVID-19
In the recent 5-year period 2015-2020, Vietnam's retail industry has been considered very attractive with a 2-
digit growth rate
Generally in 10M2020, the total retail sales of consumer goods and services reached VND 4,122.96 trillion (+ 1.27%
yoy) although it was the most heavily affected in Q42020 when the country did Social distancing that resulted in a sharp
drop in revenue from accommodation and tourism services, decreasing over 26% yoy. Retail sales of goods in the first 9
months of the year were recorded at 3,263.36 billion VND (+5.44% yoy) because the supply of essential goods is still
ensured by supermarkets and commercial center and customer’s shopping behavior has been shifted to online channels.
Purchasing power is decreased mainly due to: The unemployment rate of first 9 months of 2020 is 2.48%, which is 1.14
times higher than the same period last year. Average monthly income of employed workers in 9 months of 2020 is
proximately 5.5 million VND, 83 thousand VND less than the same period last year. Although the average income in
3Q.2020 has been improved compared to the previous quarter, this is the first year the income of employed workers in
the third quarter decreased compared to the same period last year in the past 5 years.
Source: GSO VCBS compiles
9.4%
1.6%
6.3%
-1.0%
-1.1%
Food
Textile
Household goods
Education
Vehicle
Retail sale growth by categories 10M.2020
Vietnam
Thailand Indonesia
China
Malaysia
Korea
-20.00%
-15.00%
-10.00%
-5.00%
0.00%
5.00%
10.00%
Correlation of GDP / person and retail growth (mom) in
the first 9 months of the year of some regional countries
Total retail sale of goods and services in Vietnam
10M.2020
1. Overview
0
100,000
200,000
300,000
400,000
500,000
Total retail sale of goods and services Retail sale of goodsFood TextileHousehold goods Education

MACROECONOMY EQUITY MARKET INDUSTRY & STOCK PICKS FIXED INCOME Back
Mobile devices, electronics, especially non-essential products such as gold and silver jewelry, are facing difficulties due to the impact of covid-19 on consumers' purchasing
power. In which, MWG closes its affordable phone chain, strongly converts mobile stores to groceries stroers (ĐMX), PNJ closes shop-in-shops in shopping malls,…
Meanwhile the essential product group includes the consumer goods, especially FMCG are prioritized.
22
2019 9M.2020
8
12
5
2 5
FMCG Packaged
foods Personal
care
Beverages Dairy
12
14
12
13
8
12
8
10
5 5
Spend
Per trip
2 2
5
3
FMCG
Spend Transactions Avg.paid
price per
unit
Unit
per trip
Source: Kantar world panel
108
2. The trend varied among products segment under the pandemic effect. FMCG and F&B showed positive performance
Department stores have faced declining margins due to declining customer traffic as well as increasing costs of transportation and input during the epidemic evidenced by
declined market share of grocery stores. traditional markets, the market share of supermarkets and online channels grew after the first 9 months of the year. However, we
highly appreciate the possibility that from 2021 when the epidemic has been controlled, the market share will gradually shift from supermarkets to small department stores
and convenience stores, which have lower cost and better convenience for consumers to have access to.
Due to concerns about recurrence of covid-19 outbreaks, department stores need to prepare e-commerce options and shipping solutions. In addition, the development of e-
commerce can help retailers have better approach to customers. We also note that consumers still prioritize spending on FMCG and spending on luxury products, meals to go,
and entertainment compared to the previous period which had slower recovery.
Online channel shows long-term growth potential as it continues to expand market share in value as well as leads in growth post social-distancing.
54.0% 52.8% 52.7%
8.9% 8.8% 8.8%
8.8% 6.1% 6.2%
14.2% 14.9% 14.4%
5.2% 6.1% 5.9%
5.0% 6.1% 6.6%
FY2019 YTD 9M.2020 Sau giãn cách
XH
Other
Online
Minimarket
Cash & Carry
Hyper & Super
Speciality stores
Wet market
Street shop
% Value share across %yoy Change in FMCG across key metrics and sectors
in urban and rural
INDUSTRY HIGHLIGHTS GAINING BACK TO THE GROWTH MOMENTUM WHILE FACING THE CHALLENGE OF COVID-19

MACROECONOMY EQUITY MARKET INDUSTRY & STOCK PICKS FIXED INCOME Back
Apr 19 2020
Trial phase
Quickly expand the
number of stores after a
successful trial
Testing and replicating the shop-in-
shop model to open more stores to sell
other products from the existing store)
Adapting phase
Adjust sales
strategy
Focus on
efficiency of
operation/store
Close down
ineffective
stores
2018 2019
Adjust store layout to expland shop-in-shop
At the time of 30/09/2020
Convert TGDĐ stores to shop-in-shop
BHX started implementing a new business model: BHX: "5
billion", Super mini ĐMX in remote areas to increase market
share.
Speed up the development of Long Chau pharmacy chain, start to
produce a number of supplemental products and medical equipment
Close down ineffective store; Continue to expand shop-in-shop
model.
Expanding to tier 2 cities - which are currently
dominated by traditional retail models
Covid 19
109
Omni-channel sales strategy: Cooperate with mobile brands those
are strong in e-commerce such as Xiaomi, Honor, Realme; Partner
with other retailers (such as Nguyen Kim) to provide new product
categories; cross-border shopping (through a partnership with
Fado).
3. Movements of retailers to deal with Covid 19
INDUSTRY HIGHLIGHTS GAINING BACK TO THE GROWTH MOMENTUM WHILE FACING THE CHALLENGE OF COVID-19

MACROECONOMY EQUITY MARKET INDUSTRY & STOCK PICKS FIXED INCOME Back
Y = -0,273 -0,552*I +5,281*G +2,327C
Y: Retail sales and goods services growth rate
I: Average wage growth
G GDP growth rate of Vietnam
C CPI of Vietnam
Forecast of retail sales of consumer goods and services
VCBS forecasts a decrease in consumer purchasing power compared to the previous
year due to concerns about epidemics in the world and the decline in income of a
part of consumers due to covid-19 epidemic has yet to be improved in the short term.
VCBS forecast growth rate of total retail sales of goods and services increased in the
last quarter of the year -4.24% yoy and strongly recovered in the middle of Q2.2021
with the growth rate of 14.49%.
4. Purchasing power is forecasted to decline in short-term
Forecast of total retail sale of goods and services
Source: GSO, VCBS forecast
% yoy Retail sale of goods and services, average salary, GDP and CPI
110
INDUSTRY HIGHLIGHTS GAINING BACK TO THE GROWTH MOMENTUM WHILE FACING THE CHALLENGE OF COVID-19
-5%
0%
5%
10%
15%
20%
25%
-30%
-20%
-10%
0%
10%
20%
30%
%yoy average salary
%yoy retail sale of goods and services
-25%
-20%
-15%
-10%
-5%
0%
5%
10%
15%
20%
25%
Q1
.20
16
Q2
.20
16
Q3
.20
16
Q4
.20
16
Q1
.20
17
Q2
.20
17
Q3
.20
17
Q4
.20
18
Q1
.20
18
Q2
.20
18
Q3
.20
18
Q4
.20
18
Q1
.20
19
Q2
.20
19
Q3
.20
19
Q4
.20
19
Q1
.20
20
Q2
.20
20
Q3
.20
20
Q4
.20
20
Q1
.20
21
Q2
.20
21
% yoy retail sale of goods and services % yoy average salary GDP

MACROECONOMY EQUITY MARKET INDUSTRY & STOCK PICKS FIXED INCOME Back
Source: Digital 2020 Vietnam, DataReportal
SECTOR OUTLOOK Still being attractive to foreign investors with long-term growth potential
1. Growth potential of the merchandise differentiation
70 bn USD
5,9 bn USD
7 bn USD
4 bn USD
0,6 bn USD
1 bn USD
0,75 bn USD
Market size Industry outlook Potential growth level
Modern retail channels (supermarkets, convenience stores, shopping centers) only account for 25% - 26% of
the total retail sales. Currently, traditional retail accounts for 74% of the market share, but the growth rate is
only 1% / year, while modern retail channels only account for 26% of the market share but the growth rate is
11.8% / year.
Pharmaceutical industry is still very potential in Vietnam. Revenue from the Vietnamese pharmaceutical
market will reach USD 7.7 billion in 2021 and USD 16.1 billion in 2026 with a growth rate of about 10.6% per
year (from 2012 to 2021) (according to BMI). Spending on pharmaceuticals per capita in Vietnam is about 50
USD / person / year by 2020 with the growth rate of 14% / year. (from IMS Health)
Jewelry consumption per capita remains low compared to other countries in the region.
The 2010-2019 CAGR of the world market reached 0.33%, while in Vietnam it was 2.24%. Looking back on
2019, the consumption of gold bars in the domestic and international markets both recorded a decline. However,
Vietnam only recorded a decrease of 5.32% yoy which is considered positive compared to the sharp decline of
the world of 23.41% yoy.
The eyewear and watches market is very fragmented with market share in the hands of most small-scale
businesses and unidentified imported goods.
Gross profit margin remains 30-40% (depends on different segments). Retailers can combine to implement a
shop-in-shop model, without increasing operating costs for existing stores.
Electronics buying demand has been slowdown as over 70% of Vietnamese households owning basic items
such as refrigerators, washing machines, televisions, personal computers, and rice cookers. About 30% of
households own more advanced items such as air conditioners, microwave ovens, vacuum cleaners ...
The percentage of mobile phone users has reached over 90% of population, but since August 2020, Viettel has
officially turned down 2G network in some areas, and encouraged users to change to use 4G. Boosting demand
of upgrading from featured phones to smartphones (featured phones, despite having 25% market share in
volume, only 4% market share in value.)
111

MACROECONOMY EQUITY MARKET INDUSTRY & STOCK PICKS FIXED INCOME Back
Currently, MT model is being applied in some big merchandise such as grocery, pharmaceuticals, ICT, etc while GT model which comprises traditional small size stores is
dominating in other product segment. The emergence of MT model has made GT decelerate from double digit rate to about 5% per year.
2. Modern trade retail model is becoming popular
Source:Deloitte, Euromonitor, VCBS
47%
46%
32%
17%
8%
Thailand
Malaysia
Philipines
Indonesia
Vietnam
MT share in grocery market MT market size and CAGR 2018 –
2023F
4 bn
USD 25.8% pa
20 bn
USD 11.1% pa
10 bn
USD 11.2% pa
8 bn
USD 7.0% pa
30 bn
USD 6.4% pa
Penetration rate
% G
row
th
20% 60% 40% 80%
10%
20%
30%
40%
VND bn 2014 2015 2016 2017 2018 2019
CVs
2,65
2,82
2,64
2,82
3,11
3,41
Super market
58,84
38,47
25,72
20,26
18,62
17,07
Modern
grocery
49,71
34,82
26,41
21,98
20,57
18,87
Traditional
grocery
1,27
1,32
1,36
1,42
1,49
1,54
Annual sale per store
CAGR
In volume
CAGR
In value
24,3%
10,6%
8,5%
4,7%
17,9%
41,6%
31,7%
0,8%
Potential of merchandise
112
SECTOR OUTLOOK Still being attractive to foreign investors with long-term growth potential
12% 5% 4%
5% 5% 4%
34% 33%
29% 23%
19% 18%
14% 12% 8% 8% 10% 16%
2014 2015 2016 2017 2018 2019
Number of stores by channel and revenue growth by channel
Traditional grocery Convenient store Supermarket

MACROECONOMY EQUITY MARKET INDUSTRY & STOCK PICKS FIXED INCOME Back
1. 9M2020 performance
By the end of 9M.2020, net revenue reached VND 81,352.32 billion (+ 5.98% yoy), NI
reached VND 2,977.57 billion VND, (+ 0.05% yoy)
GPM was significantly improved to 21.7% (up 3.3% from 18.4% in 2019, NPM remained
at 3.7% (equal to 2019).
MWG has a total of 3,709 stores (an increase of 670 stores compared to the end of 2019).
113
Source: MWG
2. Company outlook
The “VND 5 billion” BHX model initially recorded positive results after a
3-month testing period.
Continuing focus on improving GPM comes from: (1) improving purchasing
efficiency (2) improving terms of trade with suppliers due to the advantage of
increasing sales scale. Accordingly, BHX's GPM (after cancellation and loss
rate) in 3Q.2020 remained at 25% (increased by nearly 5% compared to 20%
in 3Q.2019).
Continuing to actively adjust the speed of new store opening in parallel with
the increase in the number of “VND 5 billion " BHX models from upgrading
existing stores with high average revenue and aiming to have 100 “VND 5
billion” BHX stores by the end of 2020.
In 3Q.2020, the average revenue per store returned to VND1.2
billion/store/month.
Average area 400-500m2
SKUs 5.500-6.000
approaching 6.000-
8.000 products
Revenue VND 150 million/day
Customer
traffic
1.000 customer/day
Coverage HCM, Dong Nai, Long
An, Bình Dương, Bình
Phước, Bến Tre.
1072
642
283
1032
750
405
1013 1018 1008 962 1124
1623
0
500
1000
1500
2000
TGDĐ ĐMX BHX
Number of stores by chain
2017 2018 2019 9T.2020
0
200
400
600
800
1000
1200
1400
1600
1800
T1 T2 T3 T4 T5 T6 T7 T8 T9 T10 T11 T12
BHX revenue/shop/month
2018 2019 2020
MWG - Mobile world investment corporation – Overview

MACROECONOMY EQUITY MARKET INDUSTRY & STOCK PICKS FIXED INCOME Back
DMX implemented supermini DMX model (“DMS”) with initial
positive results in the context of saturated mobile phone market. By
the end of September2020, the company had 52 DMS stores (33 new stores
opened in September 2020) in 12 provinces in the West, East and South
Central region, contributing to accumulated revenue nearly VND100
billion, equivalent to the average revenue per store reached more than
VND 1 billion /month. MWG plans to continue speeding up DMS store
expansion to explore this market and increase the consumer electronics
market share in the coming time.
Completed the transformation of Bigphone chain to the Bluetronics
chain (mobile devices and electronics chain), reaching 20 stores by the end
of September in Phnom Penh, Cambodia. MWG is aiming to expand to 50
stores by the end of 2020 to cover other provinces outside Phnom Penh,
including Siem Reap, Sihanoukville, ... In addition, the localization during
operation is shown when MWG uses all staff is Cambodian and sales
culture (store decoration, promotional activities,….)
2. Outlook
114
Large
DMX Mini DMX Super mini DMX
Area 800-
1.000m2
300-250m2 By ½ area of mini DMX: 120-150m2
SKUs By 60-70% SKUs of mini DMX
Capex VND 5 bil VND 3 bil VND600-700 mil
Targets /
customers
Major roads, densely
populated areas
Remote districts, communes/towns with 20
shops / province (distance between stores
from 15 to 20km).
Revenue/store/mo
nth >VND10 bil ~ VND 4 bil
VND 1 billion/store/month, focusing on
items in the segment below VND 1 million
(higher than with installment policy)
GPM The overall GPM of the
whole chain is currently
21.7%.
~23%
Proportion of
household goods
with a high GPM
15% 20%
Advantages
Operating costs are reduced thanks to: (1)
2 employees/shift/day and no need for
additional senior management team, help
staff cost only 1/3 of mini DMX; (2) make
use of existing logistic systems; (3) the rent
cost is as cheap as ¼ compared to the mini
DMX.
MWG - Mobile world investment corporation – Outlook
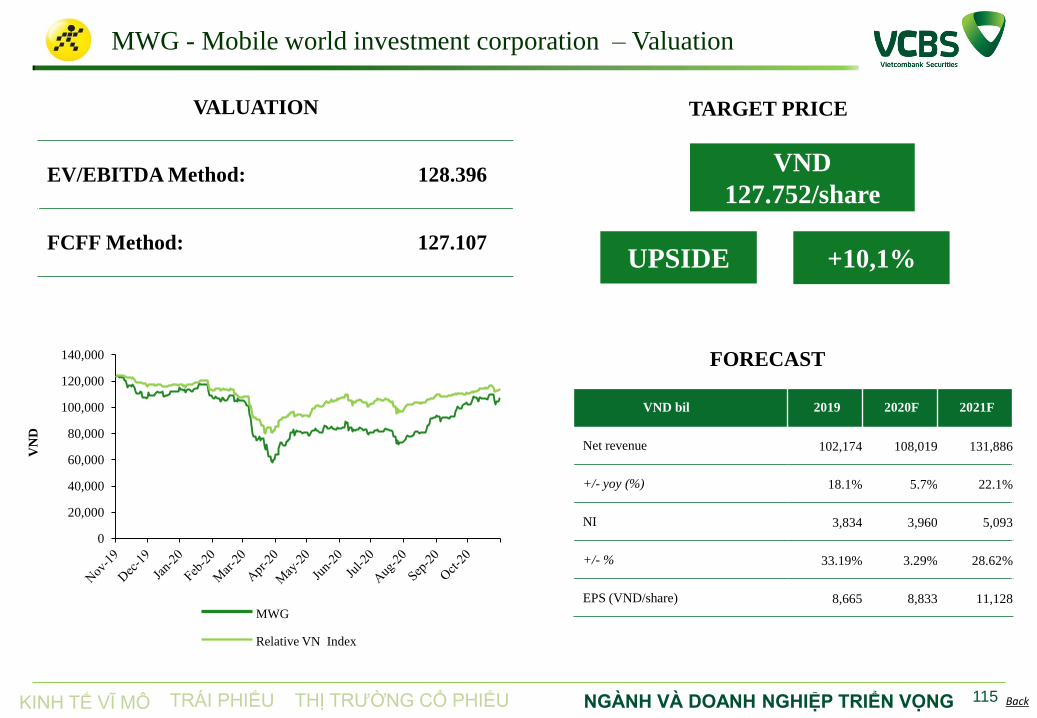
KINH TẾ VĨ MÔ THỊ TRƯỜNG CỔ PHIẾU NGÀNH VÀ DOANH NGHIỆP TRIỂN VỌNG TRÁI PHIẾU Back
MWG - Mobile world investment corporation – Valuation
115
EV/EBITDA Method: 128.396
FCFF Method: 127.107
FORECAST
VALUATION
VND
127.752/share
TARGET PRICE
+10,1% UPSIDE
VND bil 2019 2020F 2021F
Net revenue 102,174 108,019 131,886
+/- yoy (%) 18.1% 5.7% 22.1%
NI 3,834 3,960 5,093
+/- % 33.19% 3.29% 28.62%
EPS (VND/share) 8,665 8,833 11,128
0
20,000
40,000
60,000
80,000
100,000
120,000
140,000
VN
D
MWG
Relative VN Index

MACROECONOMY EQUITY MARKET INDUSTRY & STOCK PICKS FIXED INCOME Back
3Q.2020's business result decreased with net revenue of VND 3,922 billion (-0.31% yoy) and net income
reached VND 202 billion (-2.84% yoy). In the first 9 months of the year, business results reflect the industry's
leading position in the face of short-term challenges from Covid-19 pandemic with net revenue reached VND
11,668.07 billion (-0.09% yoy), NI reached VND 642.01 billion (-20.34 % yoy).
(1) The retail segment of gold and silver jewelry was heavily influenced when the second wave of covid-19
broke out in Da Nang in early August, 2020. However, in the first 9 months of the year, the retail channel still
recorded a slight increase of 4.09% yoy.
(2) Gold bar business still recorded growth of 19% yoy in 3Q.2020. Accumulated 9M.2020 revenue from gold
bar trading increased by 15.63% yoy due to the hoarding demand for gold bar during the Covid-19 pandemic.
(3) The wholesale segment recorded a decline of 40% yoy in 3Q.2020. Accumulated 9M.2020 wholesale
revenue decreased by 27.17% yoy.
Accumulated 9M.2929 GPM is 19.34% (last year recorded 20.87%), of which, GPM in 3Q.2020 is 18.72%.
During 9 months, PNJ opened 23 new stores and upgraded 8 PNJ Gold stores, closed 30 stores (13 Silver stores
and 17 Gold stores).
296 gold stores
3 CAO stores
38 silver stores
53 watches stores
Number of stores
at the time of
September 2020
Source: PNJ
1. 9M2020 performance
116
154 174
202
258 273
288 296
61 59 63 63 62 54 38
4 4 4 3 4 4 3
12.2016 6.2017 12.2017 12.2018 06.2019 12.2019 T9.2020
Total number of stores
PNJ Gold PNJ Silver CAO Fine
57.20%
57%
54.90%
59.20%
58%
57.20%
19.10%
20.60%
21.40%
15.20%
16.60%
15.60%
21.90%
20.30%
22%
24.10%
23.10%
25%
0% 20% 40% 60% 80% 100%
1Q.2019
6T.2019
9T.2019
1Q.2020
6T.2020
9T.2020
PNJ's revenue structure
Retail Whole sale Gold bar B2B Export
PNJ – Phu Nhuan Jewelry Joint Stock Company- Overview
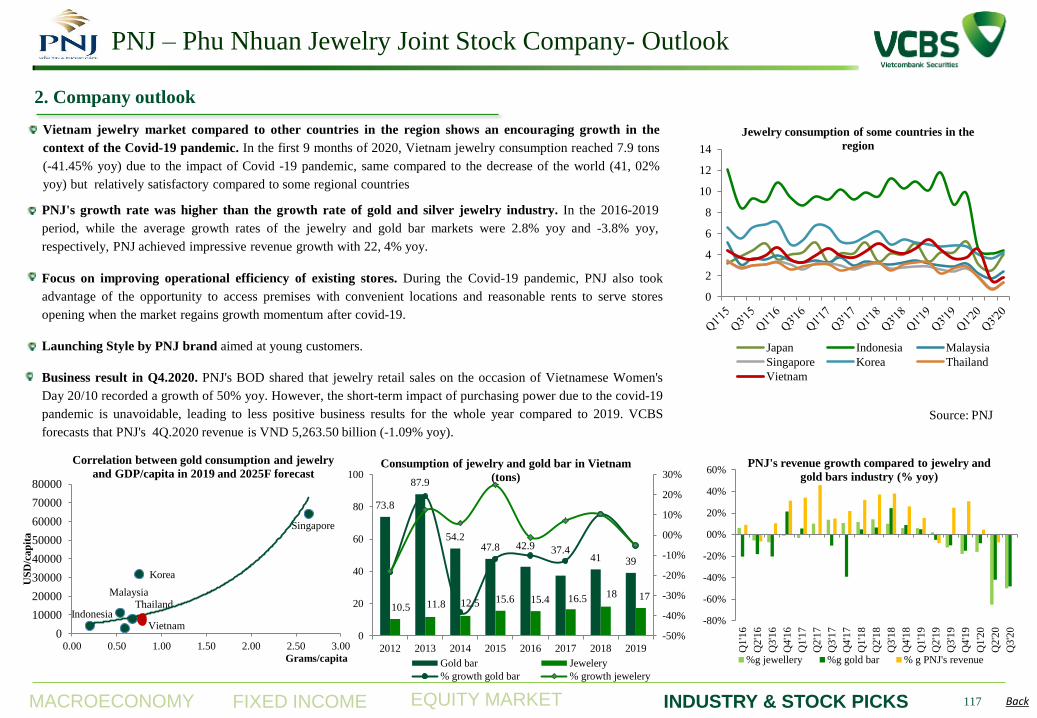
MACROECONOMY EQUITY MARKET INDUSTRY & STOCK PICKS FIXED INCOME Back
Vietnam jewelry market compared to other countries in the region shows an encouraging growth in the
context of the Covid-19 pandemic. In the first 9 months of 2020, Vietnam jewelry consumption reached 7.9 tons
(-41.45% yoy) due to the impact of Covid -19 pandemic, same compared to the decrease of the world (41, 02%
yoy) but relatively satisfactory compared to some regional countries
2. Company outlook
PNJ's growth rate was higher than the growth rate of gold and silver jewelry industry. In the 2016-2019
period, while the average growth rates of the jewelry and gold bar markets were 2.8% yoy and -3.8% yoy,
respectively, PNJ achieved impressive revenue growth with 22, 4% yoy.
Focus on improving operational efficiency of existing stores. During the Covid-19 pandemic, PNJ also took
advantage of the opportunity to access premises with convenient locations and reasonable rents to serve stores
opening when the market regains growth momentum after covid-19.
Launching Style by PNJ brand aimed at young customers.
Business result in Q4.2020. PNJ's BOD shared that jewelry retail sales on the occasion of Vietnamese Women's
Day 20/10 recorded a growth of 50% yoy. However, the short-term impact of purchasing power due to the covid-19
pandemic is unavoidable, leading to less positive business results for the whole year compared to 2019. VCBS
forecasts that PNJ's 4Q.2020 revenue is VND 5,263.50 billion (-1.09% yoy).
117
Indonesia
Malaysia
Singapore
Korea
Thailand
Vietnam 0
10000
20000
30000
40000
50000
60000
70000
80000
0.00 0.50 1.00 1.50 2.00 2.50 3.00
US
D/c
ap
ita
Grams/capita
Correlation between gold consumption and jewelry
and GDP/capita in 2019 and 2025F forecast
73.8
87.9
54.2 47.8 42.9 37.4
41 39
10.5 11.8 12.5 15.6 15.4 16.5 18 17
-50%
-40%
-30%
-20%
-10%
00%
10%
20%
30%
0
20
40
60
80
100
2012 2013 2014 2015 2016 2017 2018 2019
Consumption of jewelry and gold bar in Vietnam
(tons)
Gold bar Jewelery
% growth gold bar % growth jewelery
-80%
-60%
-40%
-20%
00%
20%
40%
60%
Q1'1
6
Q2'1
6
Q3'1
6
Q4'1
6
Q1'1
7
Q2'1
7
Q3'1
7
Q4'1
7
Q1'1
8
Q2'1
8
Q3'1
8
Q4'1
8
Q1'1
9
Q2'1
9
Q3'1
9
Q4'1
9
Q1'2
0
Q2'2
0
Q3'2
0
PNJ's revenue growth compared to jewelry and
gold bars industry (% yoy)
%g jewellery %g gold bar % g PNJ's revenue
0
2
4
6
8
10
12
14
Jewelry consumption of some countries in the
region
Japan Indonesia Malaysia
Singapore Korea Thailand
Vietnam
Source: PNJ
PNJ – Phu Nhuan Jewelry Joint Stock Company- Outlook

KINH TẾ VĨ MÔ THỊ TRƯỜNG CỔ PHIẾU NGÀNH VÀ DOANH NGHIỆP TRIỂN VỌNG TRÁI PHIẾU Back
PNJ – Phu Nhuan Jewelry Joint Stock Company- Valuation
118
P/E Method: 78.188
FCFF Method: 85.514
FORECAST
VALUATION
VND
81.851/share
TARGET PRICE
+5,87% UPSIDE
0
10,000
20,000
30,000
40,000
50,000
60,000
70,000
80,000
90,000
100,000
VN
D
PNJ
Relative VN Index
VND billion 2019 2020F 2021F
Revenue 17.000 16.932 19.524
+/- yoy (%) 16.7% -0.4% 15.3%
NI 1,193,925 973,95 1.269,993
+/- % 24.38% -18.4% 30.4%
EPS (VND/share) 4,896 4,896 5,209

FERTILIZER
INDUSTRY

MACROECONOMY EQUITY MARKET INDUSTRY & STOCK PICKS FIXED INCOME Back
Urea: Urea price has gone up by 12% in the third quarter of 2020 thanks to a recovery of urea consumption as well as a turnaround in its material
price in input such as coal, oil, natural gas…
Kali Clorua: Meanwhile Urea price has shown a good performance, KCl price has moved in a contrary direction by dropping 8% in the third
quarter . It has experienced 9 consecutive months of decline since early of 2020.
DAP: Due to the interruption of supply at Chinese market, DAP price has dropped sharply in the third quarter of 2020. Chinese market is known
as the largest supplier in global
FERTILIZER INDUSTRY
120
Source: VCBS compiles
1. Global market highlights
150
200
250
300
350
400
450
201
7
201
8
201
9
202
0
Fertilizer Price Movement
Urea DAP MOP
$/ton
0
10
20
30
40
50
201
42
01
52
01
62
01
72
01
82
01
92
02
0
201
42
01
52
01
62
01
72
01
82
01
92
02
0
201
42
01
52
01
62
01
72
01
82
01
92
02
0
Ure DAP KCL
Fertilizer Production %
0
5
10
15
20
25
30
Chin
a
Un
ited
Sta
tes
Ind
ia
Russ
ia
Ind
ones
ia
Chin
a
Un
ited
Sta
tes
Ind
ia
Russ
ia
Mo
rocc
o
Can
ada
Bel
arus
Russ
ia
Chin
a
Isra
el
Ure Phốt phát Kali
Fertilizer‟s market share %

MACROECONOMY EQUITY MARKET INDUSTRY & STOCK PICKS FIXED INCOME Back
Supply side: Thanks to the good anti-epidemic measures from the government and the people, no local factories had to shut down, so the
domestic fertilizer supply chain was not interrupted meanwhile the volume and value of fertilizer import in 1H.2020 dumped sharply due to
the disruption of global supply and freight.
Demand side: 2020 is considered a milestone for the fertilizer export activities. As of September 2020, accumulated volume and value
increased by more than 35% year-on-year. Although the overall domestic fertilizer supply in 9M.2020 was still assured at a high level,
domestic fertilizer demand also increased positively.
FERTILIZER INDUSTRY
121
Source: VCBS compiles
1. Domestic market movement
-45.0%
-30.0%
-15.0%
0.0%
15.0%
30.0%
45.0%
60.0%
75.0%
-300000
-200000
-100000
0
100000
200000
300000
400000
500000
Jan Feb Mar Apr May Jun Jul Aug Sep
Volume of Fertilizer Import – Export
Import Export % YoY Import (Lũy kế) % YoY Import
-60.0%
-40.0%
-20.0%
0.0%
20.0%
40.0%
60.0%
80.0%
100.0%
120.0%
-60000
-40000
-20000
0
20000
40000
60000
80000
100000
120000
Jan Feb Mar Apr May Jun Jul Aug Sep
Value of Fertilizer Import – Export
Import Export % YoY Import (Lũy kế) % YoY Import
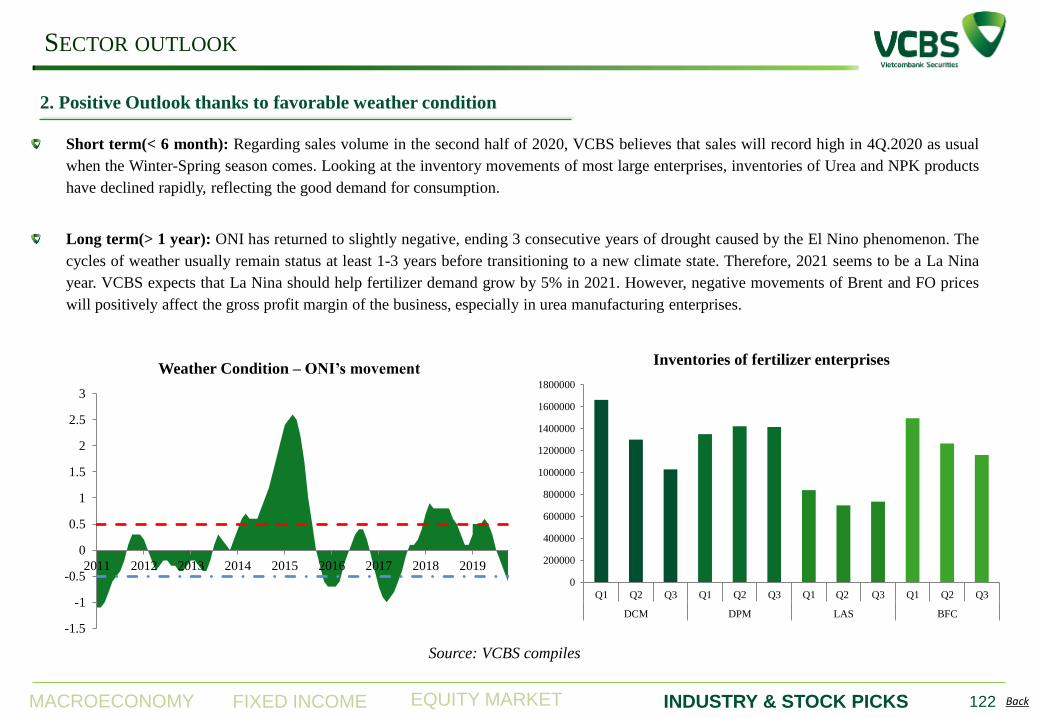
MACROECONOMY EQUITY MARKET INDUSTRY & STOCK PICKS FIXED INCOME Back
Short term(< 6 month): Regarding sales volume in the second half of 2020, VCBS believes that sales will record high in 4Q.2020 as usual
when the Winter-Spring season comes. Looking at the inventory movements of most large enterprises, inventories of Urea and NPK products
have declined rapidly, reflecting the good demand for consumption.
Long term(> 1 year): ONI has returned to slightly negative, ending 3 consecutive years of drought caused by the El Nino phenomenon. The
cycles of weather usually remain status at least 1-3 years before transitioning to a new climate state. Therefore, 2021 seems to be a La Nina
year. VCBS expects that La Nina should help fertilizer demand grow by 5% in 2021. However, negative movements of Brent and FO prices
will positively affect the gross profit margin of the business, especially in urea manufacturing enterprises.
SECTOR OUTLOOK
122
Source: VCBS compiles
2. Positive Outlook thanks to favorable weather condition
-1.5
-1
-0.5
0
0.5
1
1.5
2
2.5
3
2011 2012 2013 2014 2015 2016 2017 2018 2019
Weather Condition – ONI‟s movement
0
200000
400000
600000
800000
1000000
1200000
1400000
1600000
1800000
Q1 Q2 Q3 Q1 Q2 Q3 Q1 Q2 Q3 Q1 Q2 Q3
DCM DPM LAS BFC
Inventories of fertilizer enterprises

MACROECONOMY EQUITY MARKET INDUSTRY & STOCK PICKS FIXED INCOME Back
PETROVIETNAM CA MAU FERTILIZER JSC– GENERAL
123
Business Activities
After successfully upgrading the factory, DCM is
currently operating at around 110% of the designed
capacity for the Ca Mau brand granular urea factory.
From Q42020, the DCM plant will put the NPK plant
with a capacity of 360,000 tons of molten urea
technology into operation.
Shareholder Structure
PVN is still a controlling shareholder with over 75%
stake in DCM. PVN still ranks DCM in the list of
divestments in the short term. However, VCBS realizes
DCM's outstanding problem is that the State has not
approved the equitization settlement. Therefore, it will be
difficult for PVN to continue divesting from DCM.
Business Result
9M2020's sale reached VND 5,458 billion (+ 7.7% yoy);
Profit after tax reached 461.9 billion VND (+49.9% yoy)
thanks to favorable movements from low oil prices,
helping to improve gross profit.
Shareholder Structure
PVN PVI Others
80%
Revenue mix
Ure NPK NH3
4,910
5,747
6,689 6,266
619 637 656 426 588
1,171 1,205 1,239 805
1,112
0
1,000
2,000
3,000
4,000
5,000
6,000
7,000
2016 2017 2018 2019 2020
Business Result
Sales
NPAT
EPS
Gross
Margin
Source: DCM, VCBS compiles

MACROECONOMY EQUITY MARKET INDUSTRY & STOCK PICKS FIXED INCOME Back
Advantages of NPK Fertilizer Segment
VCBS sees many advantages of DCM in terms of new NPK fertilizer
plant thanks to its low capital expenditure but outstanding quality.
Strong Cashflow
DCM generates ample amount of cash flow from operating activities
each year despite low corporate profit due to fluctuations in the input
gas price mechanism thanks to the high proportion of depreciation in
COGS.
PETROVIETNAM CA MAU FERTILIZER JSC
124
Phu My NPK Viet – Han NPK Ca Mau NPK Binh Dien
NPK
Capex 5,000 bn VND
(included MH3 ) 1,300 bn VND 800 bn VND 120 bn VND
Technology Chemical Blast Furnace Molten Urea Mixing by
Barrel swivel
Capacity 250.000 tons per
year
300.000 tons per
year
300.000 tons
per year
50.000 tons per
year
Investment
rate/ton NPK/
year
20 mn
VND/ton/year
3.6 mn
VND/ton/year
2.9 mn
VND/ton/year
2.4 mn
VND/ton/year
Source: VCBS compiles
0
2,000
4,000
6,000
8,000
10,000
12,000
14,000
16,000
2015
2016
2017
2018
2019
2020
2021
2022
2023
2024
2025
Th
ou
san
ds
Asset - Liabilities
Total asset Total debt
(3,000)
(2,000)
(1,000)
0
1,000
2,000
3,000
Th
ou
san
ds
Cash Flow
+/-CF CFO CFI CFF
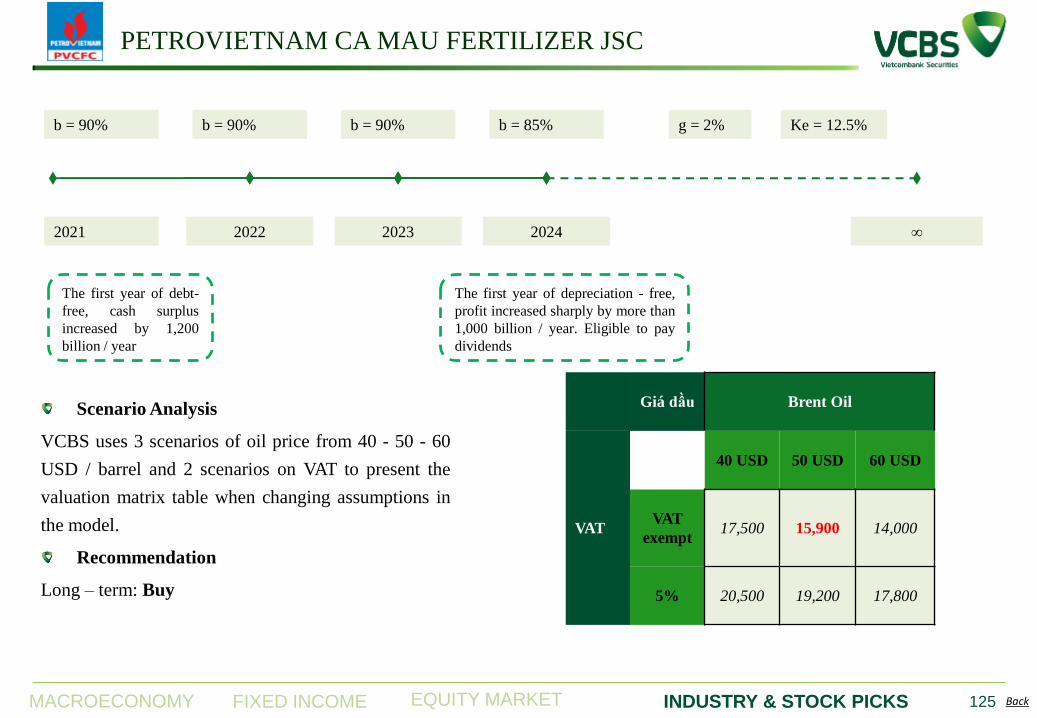
MACROECONOMY EQUITY MARKET INDUSTRY & STOCK PICKS FIXED INCOME Back
PETROVIETNAM CA MAU FERTILIZER JSC
125
Scenario Analysis
VCBS uses 3 scenarios of oil price from 40 - 50 - 60
USD / barrel and 2 scenarios on VAT to present the
valuation matrix table when changing assumptions in
the model.
Recommendation
Long – term: Buy
2021 2022 ∞ 2023 2024
The first year of debt-
free, cash surplus
increased by 1,200
billion / year
The first year of depreciation - free,
profit increased sharply by more than
1,000 billion / year. Eligible to pay
dividends
b = 90% b = 90% b = 90% b = 85% g = 2% Ke = 12.5%
Giá dầu Brent Oil
VAT
40 USD 50 USD 60 USD
VAT
exempt 17,500 15,900 14,000
5% 20,500 19,200 17,800

MACROECONOMY EQUITY MARKET INDUSTRY & STOCK PICKS FIXED INCOME Back
PETROVIETNAM CA MAU FERTILIZER JSC
126
Unit: bn VND 2019 2020E 2021F
Revenue 7,042 6,266 7,539
+/- yoy (%) 5.3% -11% 20.3%
NPAT 427 591 262
+/- % -35.1% 38.2% -46.3%
EPS (Thousan VND/share) 620 1,112 496
DDM METHOD 15.202
FORECAST
Valuation
15.202/CP
TARGET PRICE
+25 % UPSIDE
0
2,000
4,000
6,000
8,000
10,000
12,000
14,000
DCM Relative VN Index

GARMENT AND
TEXTILE
INDUSTRY

MACROECONOMY EQUITY MARKET INDUSTRY & STOCK PICKS FIXED INCOME Back
In 2019 before the pandemic, the global’s
textile and clothing decreased by 2.4% and
0.4%, respectively. It was due to the
economic slowdown and the escalating trade
tensions, particular the tariff between the US
and China. However, China and Vietnam
remained positive growth.
Textile: In the first time in history, Vietnam
exceeded Taiwan, ranking seventh-largest
textile exporter in 2019 (USD8.8 bn, up
8.3% yoy).
Apparel: Vietnam continued to rank 4th with
an export value of USD 30.6 bn, up to 7.7%
yoy.
INDUSTRY HIGHLIGHTS
128
1. Overview
8.3%
-15%
-10%
-5%
0%
5%
10%
0
20
40
60
80
100
120
140
Billion USD Top 10 Exporters of Textile- 2019
Value of export % yoy
7.7%
-15%
-10%
-5%
0%
5%
10%
0
40
80
120
160
Billion USD Top 10 Exporters of Apparel- 2019
Value of export % yoy
Apparel export:
USD 22.16 bn
(-10.0 % yoy)
In which, FDI companies:
% of total VN: 56%
(-13.7% yoy)
Textile export:
2.57 tỷ USD
(-16.9 % yoy)
In which, FDI companies:
% of total VN: 71%
(-16.1 % yoy)
Textile import:
USD 1.43 bn
(-21.0 % yoy)
In which, FDI companies :
% of total VN: 65%
(-25.2 % yoy)
Fabric import:
USD 8.43 bn
(-13.4 % yoy)
In which, FDI companies :
% of total VN: 54%
(-15.9 % yoy)
Source: Vitas, Customs, VCBS compiles

MACROECONOMY EQUITY MARKET INDUSTRY & STOCK PICKS FIXED INCOME Back
9M2020: There is not much change in
Vietnam’s textile export compared to
the same period last year. Top 3
importers (the US, Japan and South
Korea) accounted for 70% (in 2019:
69%), of which the US market
registered the highest portion.
Vietnam imported total USD9.73 bn of
fiber, yarn and fabric. And China
remained the top supplier for
Vietnam’s garment.
INDUSTRY HIGHLIGHTS
129
2. Export – Import
48%
12%
10%
10%
5%
15%
Top 5 importers of Vietnam's apparel -
9M.2020
USA
Japan
Korea
EU (27)
China
Others
-6.7%
-13.6%
-11.2%
-14.3%
-16.1%
-2.9%
-10.3%
-16%
-12%
-8%
-4%
0%
USA
EU
(27) Japan Korea China Canada
Impact of Covid-19 on Vietnam's textile
export growth - 9M.2020
Total
39.8%
17.1%
9.5%
4.1%
10.8%
16.4%
-9.4% -10.0%
-20%
-10%
0%
10%
20%
30%
40%
50%
-
5
10
15
20
25
30
35
40
2013 2014 2015 2016 2017 2018 2019 9T.20
Bn USD Value of Vietnam's textile export
FDI Local % yoy
-
200
400
600
800
1,000
1,200
1,400
2016 2017 2018 2019 9T.20
Mn USD Import fibers, yarns of Vietnam
China
Taiwan
Korea
Thailand
Others
-
1,000
2,000
3,000
4,000
5,000
6,000
7,000
8,000
2016 2017 2018 2019 9T.20
Mn USD Import fabric of Vietnam
China
Korea
Taiwan
Japan
Others
Source: Vitas, Customs, VCBS compiles

MACROECONOMY EQUITY MARKET INDUSTRY & STOCK PICKS FIXED INCOME Back
SECTOR OUTLOOK
130
Source: ITC, VCBS
CPTPP is a proposed FTA among 11 countries in Asia-Pacific region,
including Malaysia, Peru, Australia, Mexico, Canada, Japan, Singapore,
Brunei, Chile, New Zealand and Vietnam. It took effect from 14 Jan 2019.
Currently, Vietnam exports to 10 countries in CPTPP area (excluding
Brunei).
RULE OF ORIGIN
Yarn forward
CPTPP
Fabric forward
EVFTA
3. Raw material plays as the essential key for Vietnam to
enjoy the benefit from FTAs
0%
2%
4%
6%
8%
10%
12%
Japan Tariff Phaseout Schedule for
Textile & Apparel in CPTPP
EIF
B11
0%
4%
8%
12%
16%
20%
Base
yeartariff
Year 1 Year 2 Year 3 Year 4 Year 5 Year 6
Canda Tariff Phaseout Schedule for
Textile and Apparel in CPTPP
EIF
B4
B6
0
1,000
2,000
3,000
4,000
Mn USD Value of Vietnam‟s textile and apparel
export to 11 countries in CPTPP
Yarn
Garment
0%
4%
8%
12%
16%Market share of Vietnam in total imported
value of 11 countries in CPTPP
Rule of origin of CPTPP is stricter than EVFTA
Will the US rejoin TPP?
16.2%
83.8%
Proportion of 11 countries in
CPTPP of Vietnam‟s total export
CPTPP Others

MACROECONOMY EQUITY MARKET INDUSTRY & STOCK PICKS FIXED INCOME Back
SECTOR OUTLOOK
131
Source: ITC, FASH455, Vitas, VCBS
Potential market – EU:
Export value to EU reached USD 4bn annually
which is equivalent to 2% EU import turnover and
12% of VN export turnover
When EVFTA takes effect
42.5% of tariffs will be abolished as soon as the
agreement takes effect. The rest will be diminished
in the period of 3-7 years.
In general, 77% of VN export garment and textile
products remain taxed in the next 5 years after
EVFTA takes effect.
Competition pressure
Regarding price: Bangladesh may offer lower price due to their advantage in wage
Regarding quick delivery: Turkey is located near EU. 0%
2%
4%
6%
8%
10%
12%
14%
Year
1
Year
2
Year
3
Year
4
Year
5
Year
6
Year
7
Year
8
EU Tariff Phaseout Schedule for
Apparel in EVFTA
AB3B5
Base
tariff
rate
-
5
10
15
20
25
30
35
40
45
200
0
200
1
200
2
200
3
200
4
200
5
200
6
200
7
200
8
200
9
201
0
201
1
201
2
201
3
201
4
201
5
201
6
201
7
201
8
201
9
Bn USD Value of EU Apparel Imports
China Bangladesh Vietnam Cambodia
-15%
-10%
-5%
0%
5%
10%
15%
0
5
10
15
20
25
30
35
40
2015 2016 2017 2018 2019 9M.20
Bn USD Value of Vietnam's textile &
apparel to EU
EU Total Vietnam's export % yoy
Category
Base
tarrif
rate
Year 1 Year 2 Year 3 Year 4 Year 5 Year 6 Year 7 Year 8
A 11,4% 0%
B3 11,7% 8,8% 5,8% 2,9% 0%
B5 11,7% 9,7% 7,8% 5,8% 3,9% 1,9% 0%
B7 12,0% 10,5% 9,0% 7,5% 6,0% 4,5% 3,0% 1,5% 0%
A
12% B3
11%
B5
58%
B7
19%
Value of EU Apparel
Imports from VN (2018-
19)
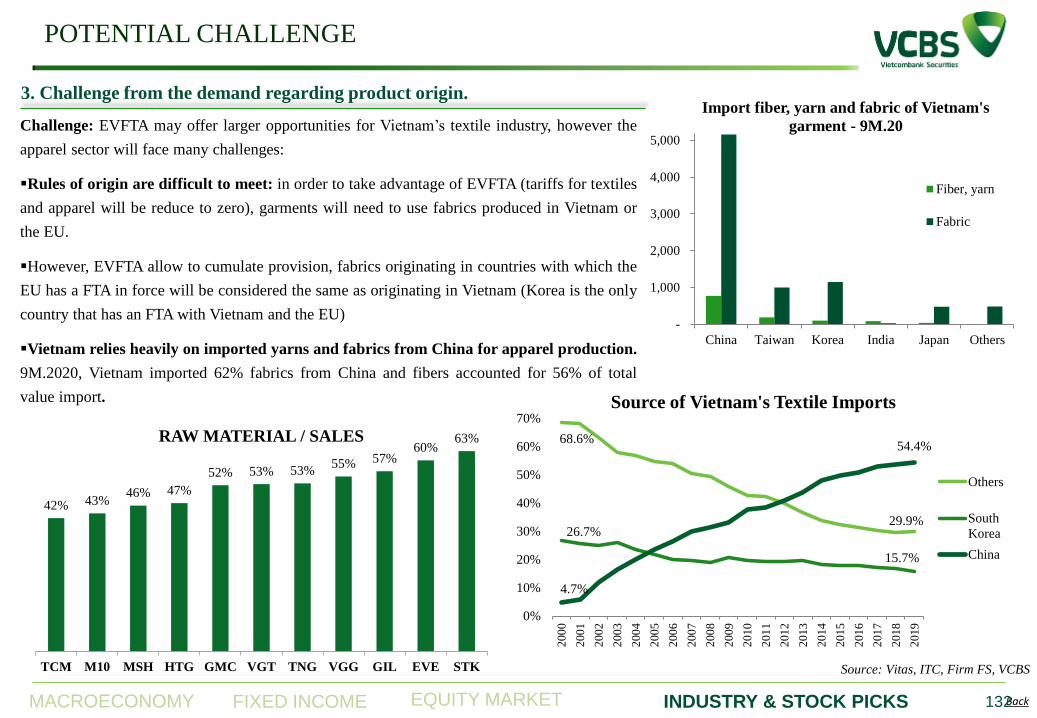
MACROECONOMY EQUITY MARKET INDUSTRY & STOCK PICKS FIXED INCOME Back
POTENTIAL CHALLENGE
132
Source: Vitas, ITC, Firm FS, VCBS
Challenge: EVFTA may offer larger opportunities for Vietnam’s textile industry, however the
apparel sector will face many challenges:
Rules of origin are difficult to meet: in order to take advantage of EVFTA (tariffs for textiles
and apparel will be reduce to zero), garments will need to use fabrics produced in Vietnam or
the EU.
However, EVFTA allow to cumulate provision, fabrics originating in countries with which the
EU has a FTA in force will be considered the same as originating in Vietnam (Korea is the only
country that has an FTA with Vietnam and the EU)
Vietnam relies heavily on imported yarns and fabrics from China for apparel production.
9M.2020, Vietnam imported 62% fabrics from China and fibers accounted for 56% of total
value import.
3. Challenge from the demand regarding product origin.
-
1,000
2,000
3,000
4,000
5,000
China Taiwan Korea India Japan Others
Import fiber, yarn and fabric of Vietnam's
garment - 9M.20
Fiber, yarn
Fabric
63% 60%
57% 55% 53% 53% 52%
47% 46% 43% 42%
STKEVEGILVGGTNGVGTGMCHTGMSHM10TCM
RAW MATERIAL / SALES 68.6%
29.9% 26.7%
15.7%
4.7%
54.4%
0%
10%
20%
30%
40%
50%
60%
70%
200
0
200
1
200
2
200
3
200
4
200
5
200
6
200
7
200
8
200
9
201
0
201
1
201
2
201
3
201
4
201
5
201
6
201
7
201
8
201
9
Source of Vietnam's Textile Imports
Others
South
Korea
China

MACROECONOMY EQUITY MARKET INDUSTRY & STOCK PICKS FIXED INCOME Back
LISTED TEXTILE & GARMENT COMPANIES
133
Source: Fiin Pro, VCBS
No. Ticker Company Exchange 9M2020 % yoy 2020 Cash
dividend
ROE
(TTM) P/E P/B
Sale NPAT Sale NPAT
1 EVE Everpia HOSE 596 11 -16,9% -68,8% 5,1% 8,1 0,4
2 GIL Binh Thanh HOSE 2.546 189 45,1% 109,0% 30% 27,4% 3,3 1,0
3 GMC May Sai Gon HOSE 1.114 11 -16,7% -83,8% 5% 7,5% 10,2 0,8
4 HTG Hoa Tho Textile
Garment UpCom 2.465 43 -23,5% -46,2% 15% 16,4% 4,9 0,9
5 M10 May 10 UpCom 2.782 42 13,7% -18,7% 8% 15,4% 9,3 1,5
6 MNB Nha Be Garment UpCom 3.126 27 -13,3% -23,0% 15% 10,4% 12,4 1,5
7 MSH Song Hong
Garment HOSE 2.970 165 -14,1% -53,7% 35% 19,8% 6,4 1,3
8 PPH Phong Phu Corp. UpCom 1.570 251 -38,1% 33,5% 15% 16,9% 4,2 0,7
9 STK Century Synthetic
Fiber HOSE 1.197 75 -27,6% -53,5% 12,2% 9,8 1,2
10 TCM Thanh Cong
Textile Garment HOSE 2.717 201 -2,6% 30,6% 10% 18,0% 5,9 1,0
11 TNG TNG HNX 3.529 129 -1,1% -25,9% 16% 17,2% 5,1 0,8
12 VGG Viet Tien Garment UpCom 5.170 71 -19,4% -75,6% 9,5% 8,8 0,8
13 VGT Vinatex UpCom 10.335 409 -23,3% -23,4% 3,3% 16,4 0,7

MACROECONOMY EQUITY MARKET INDUSTRY & STOCK PICKS FIXED INCOME Back 134
Source: Fiin Pro, Vitas, STK, VCBS
Core business
STK is one of the two leading manufacturers of polyester filament yarn in
Vietnam. STK focuses on medium and high-end yarn segments. STK supplies
yarn for garment companies such as: Nike, Adidas, Uniqlo, Decathlon. Puma…
Shareholder structure
Strategic shareholder - Eland (Korea) hold 36.8% and Huong Viet Invesment
possesses 20,7%.
Business results
Net revenue reached VND1,196.7 bn (-27.6% yoy) and NI plummeted 53.5%
yoy to VND75 bn.
Recycled yarn contributed 38% (in Q3.20 was 43%). Customer orders have
shown improvement since Sept 2020 (the capacity was nearly full).
Sportswear and leisurewear contributed 42% of total revenue.
Century Synthetic Fiber Co. (STK - HOSE)
12%
-39% -31%
1%
212%
191%
40%
-4%
-33% -36%
13%
96%
117%
12%
Korea Thailand Taiwan Japan Local export Pakistan Total
Vietnam Polyester filament yarn export -
9M.2020
2,229
1,665
2,044
214 122 170 195 212
-
500
1,000
1,500
2,000
2019A 2020F 2021F 2022F 2023F
Net revenue & Net income
20.0%
36.8%
43.2%
Shareholder structure
Huong Viet
Invesment ConsultanJsc
BoD & relatives
Others

MACROECONOMY EQUITY MARKET INDUSTRY & STOCK PICKS FIXED INCOME Back
Century Synthetic Fiber Co. (STK - HOSE)
135
Source: STK, VCBS
INVESTMENT THESISES
Short term:
‐ The demand of sportswear outperformed other traditional products. Price gap of STK declined not much as compare to
the last year (<5% yoy).
Long term:
‐ High demand for recycled yarn remains main catalyst for long term outlook.
‐ The demand for recycled fiber is still huge potential, while the global supply is in shortage. To adapt the green
consumerism, major fashion brands are increasing the proportion of recycled and sustainable sourcing in their products.
Major global brands such as Nike, Adidas, Puma, Decathlon ... committed to increase the use of recycled materials.
‐ STK's recycled polyester yarn has been granted GRS (Global Recycling Standard) certification, capable of meeting the
stringent quality requirements from international brands.
‐ On the other hand, the current spinning-chip technology helps STK completely switch from virgin yarn (DTY, FDY) to
recycled yarn products.
Risk:
- Customer demand
(global) declined
- Chinese producers
continue to dumping
polyester filament.
- Oil price may
plummet.
35%
39% 39% 41% 42%
2019A 2020F 2021F 2022F 2023F
Proportion of recycled yarn 2025
50%
Begin to use
recycled
resource
2018
19%
2020
80%
2024
100%
2025
100%
2030
100%

MACROECONOMY EQUITY MARKET INDUSTRY & STOCK PICKS FIXED INCOME Back 136
Multiple method 19,161
FCFF method 22,473
FORECAST
Century Synthetic Fiber Co. (STK - HOSE)
VALUATION
Unit: Bn VND 2019 2020F 2021F
Net revenue 2,232 1,665 1,948
+/- yoy (%) -7.4% -25.3% 17.0%
NI 214 118 154
+/- % 20.1% -44.7% 29.7%
EPS (VND/share) 3,163 1,738 2,253
Stock price movement
600
650
700
750
800
850
900
950
1,000
1,050
1,100
10,000
14,000
18,000
22,000
STK Relative VN Index
22,100 VND
TARGET PRICE
+9.9% UPSIDE

Others

MACROECONOMY EQUITY MARKET INDUSTRY & STOCK PICKS FIXED INCOME Back
Duc Giang Chemicals Corp (DGC) – OVERVIEW
138
Business Activities
DGC focus on phosphorus chemical products with a closed chain from
Apatite ore to phosphorus derivatives such as yellow, red phosphorus
(48% Revenue), phosphoric acid (22% Revenue), and fertilizers (DAP,
MAP, DSP, SSP ...) (13% of Revenue), animal feed additive…
Shareholder Structures
The largest shareholder is the chairman's family - Dao Huu Huyen with
more than 27%, the institutional shareholder is Vinachem Group with
nearly 9%, and the others.
Business Results
Accumulated revenue of 9M.2020 reached VND 4,653 billion (+27.7%
yoy, reaching 76% of the year plan). Consolidated EAT is 704.8 billion
VND (+77.5% yoy, 101% of the year plan). Export activities account for
80% of the revenue structure, mainly export to India, Korea, Japan (P4,
H3PO4); Malaysia (fertilizer).
Business results growth very well in most segments due to: (1) India's
demand for P4 and fertilizer increased sharply; (2) Pure phosphorus used
for electronic equipment has increased demand despite Covid 19; (3)
Fertilizer export to ASEAN countries is also good; (4) Thanks to decling
prices of raw materials (apatite, electricity, sulfur).
Source: DGC, VCBS
Source: DGC, VCBS
2,622
626
6,092
5,092
3,642
4653
320 128
873 572 397
705
0.0%
5.0%
10.0%
15.0%
20.0%
25.0%
-
1,000
2,000
3,000
4,000
5,000
6,000
7,000
2016 2017 2018 2019 9T.2019 9T.2020
Business performance
Total Revenue Profit after Tax Gross Profit margin
VND bil
27%
9% 64%
Dao Huu
Huyen and
family
Vinachem
Others
DGC‟s Shareholder structure
48%
12%
13%
8%
5% 10%
4% Yellow & Red
phosphorus
Photphoric acid
WPA 50%
MAP, DAP
Animal feed additive
DSP, SSP, FDCP
fertilizer
H3PO4
Other
1H.2020 Revenue structure

MACROECONOMY EQUITY MARKET INDUSTRY & STOCK PICKS FIXED INCOME Back
DGC - OUTLOOK
139
CATALYST
Demand for P4, Electronic phosphoric acid is expected to increase: P4, Electronic phosphoric acid is in very high
demand for electronic devices and used in transistors, liquid crystal displays, especially, the 5G race must use new chips.
Increase capacity of electronic Phosphoric acid chain (to 50,000 tons – already had a contract of 30,000 tons) to produce
LCD screens.
Continue deep processing Yellow phosphorus: Red phosphorus, P2O5
Geopolitical tensions between India and China have increased demand for P4, DAP, MAP fertilizers for NPK
production.
Potential for EU market expansion due to EVFTA: The proportion of Yellow phosphorus exports to the EU accounts
for 20%, and is expected to increase to over 30% after tax reduction.
Mining Project 25: Start mining from Q2.2020 will help DGC be proactive about 25% - 30% of the input Phosphate
rock, avoid material risks and increase the power to negotiate with supplier.
Duc Giang - Nghi Son project is the driving force for long-term growth and help DGC reach to new heights. Phase I is
expected to start in Q1.2021 with a total capital of about VND 2,400 billion, expected to produce Solid Sodium
hydroxide, chloramine B from Q1/2022. Solid Sodium hydroxide, Chloramine B with good product consumption ability
due to a large customer who plans to open a paper factory next to DGC's factory and high domestic demand but lack of
domestic supply.
Prospects from future real estate projects: Duc Giang apartment building at 18/44 Duc Giang street, Thuong Thanh, Long
Bien, Hanoi - The company's headquarters is currently planned 1:500.
Risk: Competition risk, input

MACROECONOMY EQUITY MARKET INDUSTRY & STOCK PICKS FIXED INCOME Back
DGC – Valuation
140
Unit: VND billion 2019 2020F 2021F
Net Revenue 5,092 6,121 6,714
+/- yoy (%) -16.41% 20.22% 9.68%
NPAT 572 902 964
+/- % 57.85% 6.90% 3.33%
EPS (VND) 4,418 6,064 6,483
P/E 49,000
FCFF 46,600
ESTIMATION
VALUATION
VND 47,800/share
TARGET PRICE
+1.6% UPSIDE
12,000
17,000
22,000
27,000
32,000
37,000
42,000
47,000
52,000
HISTORICAL PRICE
DGC Relative VNINDEX

MACROECONOMY EQUITY MARKET INDUSTRY & STOCK PICKS FIXED INCOME Back
Petrolimex Petrochemical Corp (PLC) – OVERVIEW
141
Business activities
PLC is a popular in lubricants, asphalt and industrial chemical solvents with
9M.2020 revenue ratios of 27%, 47% and 26% respectively. Asphalt product
ranks first in the market with a market share of 30% - 40%, followed by
Adco and Transimex. Lubricant products ranked second in the market after
Castrol with about 10-12%.
Shareholder structure
The largest shareholder is Vietnam Petroleum Corporation - Petrolimex with
79.07%, the rest are internal shareholders and other shareholders.
9M.2020 Result
Accumulated revenue in 9M.2020 reached 3,914 billion VND (-10% yoy,
61% of the year plan) due to the influence of Covid 19. GPM reached 17.5%
(+ 3.5% compared to 2019) - highest in the past 5 years. Net income reached
124 billion VND (+9.7% yoy, 74% of the year plan).
Business results improved because: (1) Increased asphalt sales (+ 26% yoy in
revenue); (2) More Polymer asphalt portion with higher selling price and GP;
(3) Input prices such as base oil for blending lubricants, as well as raw
asphalt sharply decreased according to oil prices, which reduced input prices,
(4) Inefficiencies in the chemical segment were narrowed due to the
influence of Covid. 19
Source: PLC, VCBS
Source: PLC, VCBS
24%
36%
40%
27%
47%
26%
Revenue structure
Lubricant Asphalt Chemical
Inside: 2018
Outside: 2019
79.07%
20.93%
Shareholder structure
PLX Others
5,049
6,436 6,160
3,914
171 153 145 124
15.5%
14% 14%
17.5%
0.0%
2.0%
4.0%
6.0%
8.0%
10.0%
12.0%
14.0%
16.0%
18.0%
20.0%
-
1,000
2,000
3,000
4,000
5,000
6,000
7,000
2017 2018 2019 9T.2020
Total Revenue Gross profits
Profit after Tax Gross Profit margin
VND bil Business performance

MACROECONOMY EQUITY MARKET INDUSTRY & STOCK PICKS FIXED INCOME Back
PLC - OUTLOOK
142
CATALYST
Prospects of asphalt from Government stimulus, mainly focusing on transport
infrastructure projects. PLC's asphalt is cyclical with high correlate to
Government expenditure.
In 2020 – 2021, there are several projects are going to be groundbreaking such
as the North-South Expressway are expected to need more 500,000 tons of
asphalt in the next 4 years (twice the sales volume / year of PLC) with a value
of more than 5,000 billion. In addition, Trung Luong - My Thuan, Cao Bo -
Mai Son, Cam Lo - La Son highway, 2nd Beltway (HN), 3rd Beltway (HN),
TSN, Noi Bai Airport improvement will increases demand for Polymer
asphalt.
High demand of Polymer asphalt with high GMP (20% - 30%) for
expressways will increase PLC's business efficiency.
Maintain the sale of asphalt for road surface maintenance and repair and other
road projects in the provinces due to PLC’s warehouses throughout the
country.
Construction machinery highway construction also increases the demand for
lubricants. (PLX currently sells mainly to trucks and industrial machinery).
RISK:
• Competition, raw material, receivables
• Government expenditure progess.
2020 2021 2022 2023 2024
Cao Bo - Mai Son
Trung Luong - My Thuan
Cam Lo - La Son
My Thuan 2 bridge
My Thuan - Can Tho
Mai Son – 45 NR
Vinh Hao - Phan Thiet
Phan Thiet - Dau Day
Dien Chau - Bai Vot
Can Lam - Vinh Hao
Nha Trang - Can Lam
QL45 - Nghi Son
Nghi Sơn - Dien Chau
Thick Propotion Tons/m3
Total
weight Antilside
asphalt
concrete 4 cm 6,5 - 6,8% 2,4 - 2,7 79.077
Fine grain
asphalt
concrete 5 cm 5,50% 2,4 - 2,7 94.354
Middle grain 7 cm 4,6% - 5,1% 2,32 - 2,35 101.739
Coarse grain 7 cm 4,6% - 5,1% 2,32 - 2,35 101.739
Emulsion 0,6 - 1,5l/m2 44.930
Total 421.840
Source: VCBS
Source: VCBS

MACROECONOMY EQUITY MARKET INDUSTRY & STOCK PICKS FIXED INCOME Back
PLC – VALUATION
143
Unit: VND billion 2019 2020F 2021F
Net Revenue 6,160 5,655 5,721
+/- yoy (%) -4.29% -8.19% 1.15%
NPAT 145 173 186
+/- % -5.12% 19.06% 7.40%
EPS (VND) 1,797 2,139 2,297
P/E Multiple 25,200
FCFF 28,637
FORECAST
VALUATION
VND 26,900/Share
TARGET PRICE
+8.9% UPSIDE
5,000
10,000
15,000
20,000
25,000
30,000
STOCK PRICE FLUCTUATION
PLC Relative VNINDEX

MACROECONOMY EQUITY MARKET INDUSTRY & STOCK PICKS FIXED INCOME Back
FPT CORPORATION (FPT)
OVERVIEW
• FPT is a leading IT – Telecommunication enterprise in
Vietnam, especially the export of software is growing rapidly
with global growth strategy. The company is present in 45
countries in Asia, Europe, the Americas and Australia, with
CAGR of global IT services revenue of 24.6% over the past 3
years.
• The company is also among the three enterprises with the
largest share in the broadband Internet market. The education
segment is expected to provided FPT and the whole IT
industry with skilled human resources.
BUSINESS PERFORMANCE
• After 10M.2020, FPT recovered its growth with accumulated
revenue reaching VND 23,635 billion (+7.4% yoy) and net
EBT reaching VND 4,349 billion (+8.9% yoy).
• Business activities of the company were maintained despite
the difficulties from Covid-19. EBT margin improved slightly
to 18.4%, compared with 18.1% of last year.
Sources: FPT, VCBS
144
42%
38%
20%
PBT by sector 2019 – 10M.2020
Technology Telecom Education, Investments, Others
-20%
-10%
0%
10%
20%
30%
40%
50%
0
10000
20000
30000
40000
50000
2016 2017 2018 2019 10T.2020
Financial Results 2016 - 10M.2020 (VND bn)
Net revenue PBT PBT growth (% yoy) PBT margin (%)

MACROECONOMY EQUITY MARKET INDUSTRY & STOCK PICKS FIXED INCOME Back
FPT CORPORATION (FPT) – OUTLOOK
Sources: FPT, VCBS
INVESTMENT CATALYSTs
• FPT Software will continue to growth strongly in the long term.
Improved deployment capacity, competitive labor cost and recovered global IT
spending have helped the value of newly signed contracts increase strongly. By
continuously winning mega-deals in America and the APAC market recently
(relating to cloud service, AI processing for e-commerce), CAGR of software
export is forecasted to reach 21% for the period of 2020-2024.
Domestic spending for IT services is also expected to increase again in the
beginning of 2021 after the 13th National Congress ends. Products made-by-FPT
such as AkaBot, Akachain, FPT Spro, FPT Smart Cloud… with high quality
continue to serve clients on the market.
• The contribution of the Education segment in the structure of Net profit
before tax is increasing with the growing demand for IT sector.
145
• Profitability in the telecom sector is gradually improving thanks to
economies of scales.
The number of subscribers and services users maintains a stable growth as FPT
continues to penetrate deeper into the tier 2 and 3 provinces. Pay TV and data
center also maintain positive prospects in the “new normal” context with rising
demand for digital content.
RISK
Main risks include: limited supply of highly qualified software engineers; fierce
competition in Telecommunications sector with Viettel and VNPT; the return of
Covid-19 may have a more profound impact on IT spending and slow down
growth in global market.
4693
1817
779 1154
5534
2672
986 1656
4525
2070
734
1450
0
1000
2000
3000
4000
5000
6000
Japan US EU APAC
Global IT Services Revenue (VND billion)
2018 2019 10M.2020
52%
24%
8%
16%
Global IT Services by market 2018 – 10M.2020 (%)
Japan US EU APAC

MACROECONOMY EQUITY MARKET INDUSTRY & STOCK PICKS FIXED INCOME Back
(VND bn) 2019 2020F 2021F
Revenue 27,717 30,147 35,290
+/- yoy (%) +19.4% +8.8% +17.1%
NPAT 3,135 3,692 4,481
+/- % +19.7% +17.7% +21.4%
EPS (VND/share) 3,670 5,049 5,701
FORECAST HISTORICAL PRICE
63,619 VND
TARGET PRICE
+14.8% UPSIDE
FPT CORPORATION (FPT) – PRICING
FCFF method 64,927
SoTP method 62,311
VALUATION
146
0
10,000
20,000
30,000
40,000
50,000
60,000
VN
D
FPT Relative VN Index
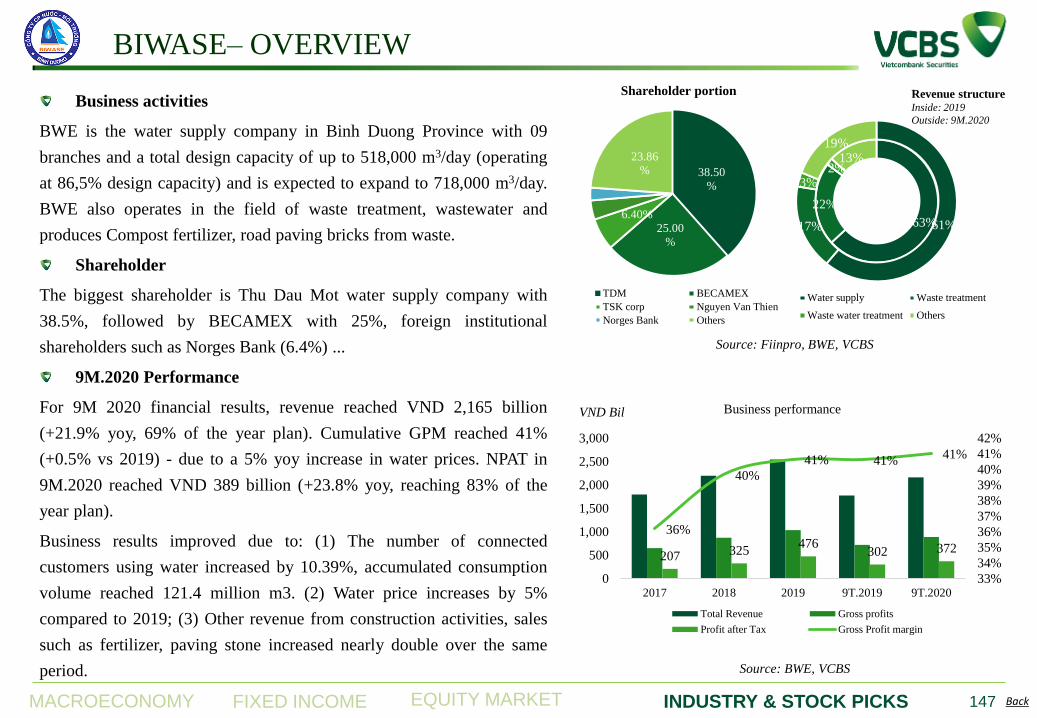
MACROECONOMY EQUITY MARKET INDUSTRY & STOCK PICKS FIXED INCOME Back
BIWASE– OVERVIEW
147
Business activities
BWE is the water supply company in Binh Duong Province with 09
branches and a total design capacity of up to 518,000 m3/day (operating
at 86,5% design capacity) and is expected to expand to 718,000 m3/day.
BWE also operates in the field of waste treatment, wastewater and
produces Compost fertilizer, road paving bricks from waste.
Shareholder
The biggest shareholder is Thu Dau Mot water supply company with
38.5%, followed by BECAMEX with 25%, foreign institutional
shareholders such as Norges Bank (6.4%) ...
9M.2020 Performance
For 9M 2020 financial results, revenue reached VND 2,165 billion
(+21.9% yoy, 69% of the year plan). Cumulative GPM reached 41%
(+0.5% vs 2019) - due to a 5% yoy increase in water prices. NPAT in
9M.2020 reached VND 389 billion (+23.8% yoy, reaching 83% of the
year plan).
Business results improved due to: (1) The number of connected
customers using water increased by 10.39%, accumulated consumption
volume reached 121.4 million m3. (2) Water price increases by 5%
compared to 2019; (3) Other revenue from construction activities, sales
such as fertilizer, paving stone increased nearly double over the same
period.
Source: Fiinpro, BWE, VCBS
Source: BWE, VCBS
38.50
%
25.00
%
6.40%
23.86
%
Shareholder portion
TDM BECAMEX
TSK corp Nguyen Van Thien
Norges Bank Others
207 325 476
302 372
36%
40%
41% 41% 41%
33%
34%
35%
36%
37%
38%
39%
40%
41%
42%
0
500
1,000
1,500
2,000
2,500
3,000
2017 2018 2019 9T.2019 9T.2020
Business performance
Total Revenue Gross profits
Profit after Tax Gross Profit margin
VND Bil
63%
22%
2% 13%
61% 17%
3%
19%
Water supply Waste treatment
Waste water treatment Others
Revenue structure Inside: 2019
Outside: 9M.2020

MACROECONOMY EQUITY MARKET INDUSTRY & STOCK PICKS FIXED INCOME Back
Binh Duong Water – Environment JSC
148
CATALYST
100% of water supply market share and accounting for 30-45% market share of waste treatment for Binh Duong.
Growth of water living demand and industrial activities thanks to strong FDI inflows. Binh Duong is one of the largest attractive
places for FDI especially in industrial production, helping to increase the demand for water resources for production and daily life.
Increasing water supply capacity with expansion projects ensures future growth in demand. Currently, KLH and TDM plants have
exceeded their designed capacity due to large demand continue increasing.
The lowest water loss rate in the industry at only 5.3% in 2019 due to a new and modern investment water supply system to increase
the company's efficiency..
Increasing the capacity of the South Binh Duong waste treatment complex (a closed, modern process) to increase the capacity of
waste and wastewater treatment and at the same time double the capacity of organic fertilizer products: Elephant Binh Duong..
RISK:
Water resource quality.
Water supply system.
Source: Annual report of those company
0%
10%
20%
30%
0
50,000
100,000
150,000
200,000
DNW TDW GDW BTW NBW CLW BWE
Ouput and water loss ratio
Water supply output Water loss ratio
'000 m3 Expand project Capacity
Tan Hiep Water plants 100.000 m3/day
Nam Tan Uyen Water plants 30.000 m3/day
Uyen Hung Water plants 30.000 m3/day
Compost fertilizer 840 tons/day (double)
Incinerator 840 kg/h
Solid watse treatment complex 400 ha
65%
70%
75%
80%
85%
90%
-
100
200
300
Water supply capacity (million m3/year)
Current Expand Productivity
Source: BWE, VCBS

MACROECONOMY EQUITY MARKET INDUSTRY & STOCK PICKS FIXED INCOME Back
BWE – Valuation
149
UNIT: billion VND 2019 2020F 2021F
Net Revenue 2,546 2,984 3,335
+/- yoy (%) 15.86% 17.20% 11.76%
NPAT 476 554 646
+/- % 46.58% 16.25% 16.71%
EPS 3,175 2,953 3,446
P/E 33,700
FCFF 35,000
FORECAST
VALUATION
34,400/Share
TARGET PRICE
+11.0% UPSIDE
10,000
15,000
20,000
25,000
30,000
35,000
HISTORICAL PRICE
BWE Relative VNINDEX

MACROECONOMY EQUITY MARKET INDUSTRY & STOCK PICKS FIXED INCOME
This report is designed to provide updated information on macroeconomics, fixed-income, including
bonds, interest rates, industries, equity outlook and some other related. The VCBS analysts exert
their best efforts to obtain the most accurate and timely information available from various sources,
including information pertaining to market prices, yields and rates. All information stated in the
report has been collected and assessed as carefully as possible.
It must be stressed that all opinions, judgments, estimations and projections in this report represent
independent views of the analyst at the date of publication. Therefore, this report should be best
considered a reference and indicative only. It is not an offer or advice to buy or sell or any actions
related to any assets. VCBS and/or Departments of VCBS as well as any affiliate of VCBS or
affiliate that VCBS belongs to or is related to (thereafter, VCBS), provide no warranty or
undertaking of any kind in respect to the information and materials found on, or linked to the report
and no obligation to update the information after the report was released. VCBS does not bear any
responsibility for the accuracy of the material posted or the information contained therein, or for any
consequences arising from its use, and does not invite or accept reliance being placed on any
materials or information so provided.
This report may not be copied, reproduced, published or redistributed for any purpose without the
written permission of an authorized representative of VCBS. Please cite sources when quoting.
Copyright 2012 Vietcombank Securities Company. All rights reserved.
DISCLAIMER

CONTACT INFORMATION
151
Tran Minh Hoang
Head of Research
Tran Minh Hoang
Head of Research
Ly Hoang Anh Thi
Deputy Head of Research
Mac Dinh Tuan
Research manager
Le Duc Quang
Research manager
Le Thu Ha
Senior analyst
Macro & fixed income
Nguyen Hoang Minh
Market strategist
Luong Van Hoan
Banking
Nguyen Thi Thuy Dung
Fishery, Consumer goods,
Trinh Van Ha
Energy, Chemicals
Hoang Tung Vu
Equity market, commodities
Nguyen Thien Toan
Real estate, Technology
Ngo Duy Tai
Oil & gas, fertilizers
Tran Ky Anh
Construction materials
Dang Khanh Linh
Macro & fixed income
Pham Hong Quan
Aviation & Seaport
Nguyen Thi Thu Hang
Consumer goods, Textile
Nguyen Huu Quang
Equity market, Derivatives
Nguyen Nam Anh
Equity market, Derivatives