Time-Use-Data-and-the-Living-Standards-Measurement ...
82
LSM -18 LEIfliS JULY 1982 Living Standards Measurement Stuclv Working Paper No. 18 Time Use Data and the Living Standards Measurement Study heilA Mhp" Public Disclosure Authorized Public Disclosure Authorized Public Disclosure Authorized Public Disclosure Authorized Public Disclosure Authorized Public Disclosure Authorized Public Disclosure Authorized Public Disclosure Authorized
-
Upload
khangminh22 -
Category
Documents
-
view
1 -
download
0
Transcript of Time-Use-Data-and-the-Living-Standards-Measurement ...
LSM -18LEIfliS JULY 1982
Living StandardsMeasurement StuclvWorking Paper No. 18
Time Use Data and the Living StandardsMeasurement Study
heilA Mhp"
Pub
lic D
iscl
osur
e A
utho
rized
Pub
lic D
iscl
osur
e A
utho
rized
Pub
lic D
iscl
osur
e A
utho
rized
Pub
lic D
iscl
osur
e A
utho
rized
Pub
lic D
iscl
osur
e A
utho
rized
Pub
lic D
iscl
osur
e A
utho
rized
Pub
lic D
iscl
osur
e A
utho
rized
Pub
lic D
iscl
osur
e A
utho
rized

LSMS Working Papers
No. 6 Household Survey Experience in Africa
No. 7 Measurement of Welfare: Theory and Practical Guidelines
No. 8 Employment Data for the Measurement of Living Standards
No. 9 Income and Expenditure Surveys in Developing Countries: Sample Design and Execution
No. 10 Reflections on the LSMS Group Meeting
No.11 Three Essays on a Sri Lanka Household Survey
No. 12 The ECIEL Study of Household Income and Consumption in Urban Latin America: An AnalyticalHistory
No. 13 Nutrition and Health Status Indicators: Suggestions for Surveys of the Standard of Living inDeveloping Countries
No.14 Child Schooling and the Measurement of Living Standards
No. 15 Measuring Health as a Component of Living Standards
No. 16 Procedures for Collecting and Analyzing Mortality Data in LSMS
No. 17 The Labor Market and Social Accounting: A Framework of Data Presentation
No. 18 Time Use Data and the Living Standards Measurement Study
No. 19 The Conceptual Basis of Measures of Household Welfare and Their Implied Survey Data Requirements
No.20 Statistical Experimentation for Household Surveys: Two Case Studies of Hong Kong
No.21 The Collection of Price Data for the Measurement of Living Standards
No.22 Household Expenditure Surveys: Some Methodological Issues
No.23 Collecting Panel Data in Developing Countries: Does It Make Sense?
No.24 Measuring and Analyzing Levels of Living in Developing Countries: An Annotated Questionnaire
No.25 The Demand for Urban Housing in the Ivory Coast
No.26 The COte d'Ivoire Living Standards Survey: Design and Implementation
No.27 The Role of Employment and Earnings in Analyzing Levels of Living: A General Methodology withApplications to Malaysia and Thailand
No.28 Analysis of Household Expenditures
No.29 The Distribution of Welfare in Cote d'Ivoire in 1985
No.30 Quality, Quantity, and Spatial Variation of Price: Estimating Price Elasticities from Cross-SectionalData
No.31 Financing the Health Sector in Peru
No.32 Informal Sector, Labor Markets, and Returns to Education in Peru
No.33 Wage Determinants in Cote d'Ivoire
No.34 Guidelines for Adapting the LSMS Living Standards Questionnaires to Local Conditions
No.35 The Demand for Medical Care in Developing Countries: Quantity Rationing in Rural Cote d'Ivoire
No.36 Labor Market Activity in C6te d'Ivoire and Peru
No.37 Health Care Financing and the Demand for Medical Care
No.38 Wage Determinants and School Attainment among Men in Peru
No.39 The Allocation of Goods within the Household: Adults, Children, and Gender
No.40 The Effects of Household and Community Characteristics on the Nutrition of Preschool Children:Evidence from Rural Cote d'Ivoire
No.41 Public-Private Sector Wage Differentials in Peru, 1985-86
No.42 The Distribution of Welfare in Peru in 1985-86
(List continues on the inside back cover)
Time Use Data and the Living StandardsMeasurement Study
The Living Standards Measurement Study
The Living Standards Measurement Study (LSMS) was established by the World Bank in1980 to explore ways of improving the type and quality of household data collected by ThirdWorld statistical offices. Its goal is to foster increased use of household data as a basis for policydecision making. Specifically, the LSMS is working to develop new methods to monitorprogress in raising levels of living, to identify the consequences for households of past andproposed government policies, and to improve communications between survey statisticians,analysts, and policy makers.
The LSMS Working Paper series was started to disseminate intermediate products from theLSMS. Publications in the series include critical surveys covering different aspects of the LSMSdata collection program and reports on improved methodologies for using Living StandardsSurvey (LSS) data. Future publications will recommend specific survey, questionnaire and dataprocessing designs, and demonstrate the breadth of policy analysis that can be carried out usingLSS data.
LSMS Working PapersNumber 18
Time Use Data and the Living StandardsMeasurement Study
Meena Acharya
The World BankWashington, D.C., U.S.A.
Copyright © 1982The International Bank for Reconstructionand Development/THE WORLD BANK1818 H Street, N.W.Washington, D.C. 20433, U.S.A.
All rights reservedManufactured in the United States of AmericaFirst printing July 1982Third printing August 1986
This is a working document published informally by the World Bank. To present theresults of research with the least possible delay, the typescript has not been preparedin accordance with the procedures appropriate to formal printed texts, and the WorldBank accepts no responsibility for errors. The publication is supplied at a token chargeto defray part of the cost of manufacture and distribution.
The World Bank does not accept responsibility for the views expressed herein, whichare those of the authors and should not be attributed to the World Bank or to itsaffiliated organizations. The findings, interpretations, and conclusions are the resultsof research supported by the Bank; they do not necessarily represent official policy ofthe Bank. The designations employed, the presentation of material, and any maps usedin this document are solely for the convenience of the reader and do not imply theexpression of any opinion whatsoever on the part of the World Bank or its affiliatesconcerning the legal status of any country, territory, city, area, or of its authorities, orconcerning the delimitation of its boundaries, or national affiliation.
The most recent World Bank publications are described in the annual spring and falllists; the continuing research program is described in the annual Abstracts of CurrentStudies. The latest edition of each is available free of charge from the Publications SalesUnit, Department T, The World Bank, 1818 H Street, N.W., Washington, D.C. 20433,U.S.A., or from the European Office of the Bank, 66 avenue dlena, 75116 Paris, France.
When this paper was first published Meena Acharya was an economist in theEmployment and Income Distribution Division, Development Research Departmentof the World Bank.
Library of Congress Cataloging-in-Publication Data
Acharya, Meena.Time use data and the living standards measurement study.
(LSMS working paper; no. 18)"July 1982"Bibliography: p.1. Time management surveys-Developing countries. 2. Cost and standard of
living-Developing countries. I. Title. II. Series.HN981.T5A28 1985 640'.43 85-17845ISBN 0-8213-0094-6

Acknowledgements
I would like to express my sincere thanks to Susan Cochrane and
Timothy King who found time to read the draft and made valuable comments.
Thanks are also due to Martha Ainsworth for her editorial assistance and
Margaret Hoyle and Nellie Artis for their excellent secretarial services.
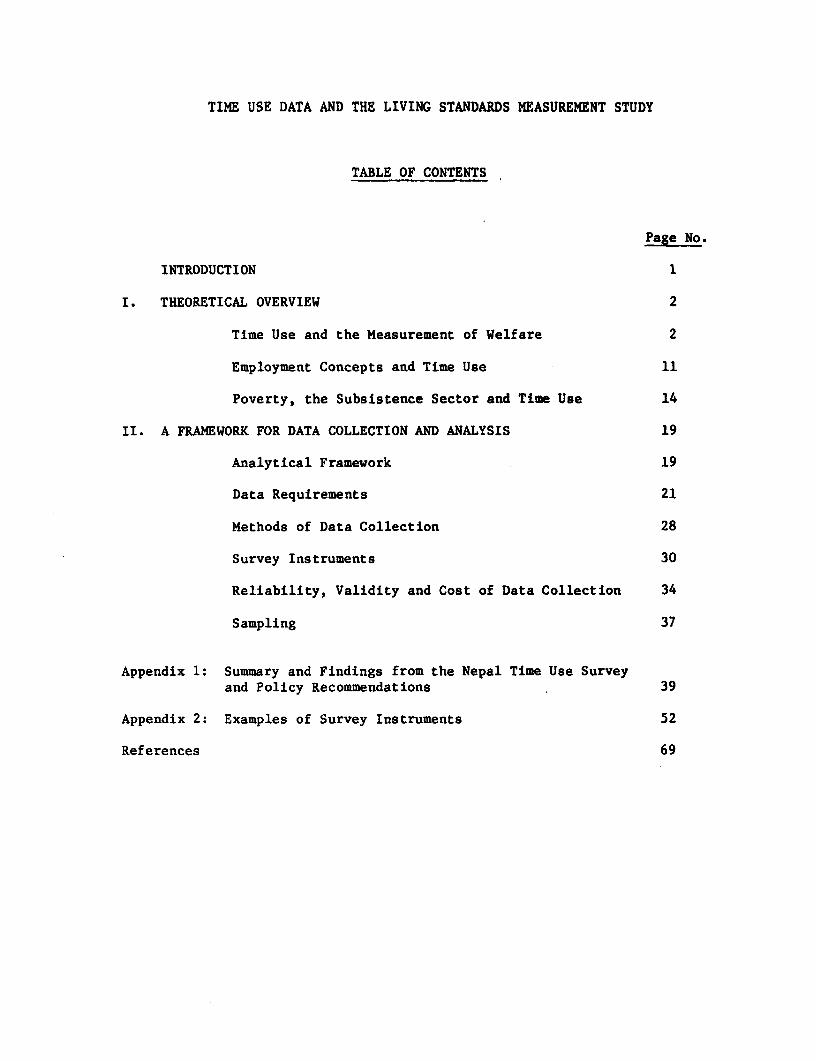
TIME USE DATA AND THE LIVING STANDARDS MEASUREMENT STUDY
TABLE OF CONTENTS
Page No.
INTRODUCTION 1
I. THEORETICAL OVERVIEW 2
Time Use and the Measurement of Welfare 2
Employment Concepts and Time Use 11
Poverty, the Subsistence Sector and Time Use 14
II. A FRAMEWORK FOR DATA COLLECTION AND ANALYSIS 19
Analytical Framework 19
Data Requirements 21
Methods of Data Collection 28
Survey Instruments 30
Reliability, Validity and Cost of Data Collection 34
Sampling 37
Appendix 1: Summary and Findings from the Nepal Time Use Surveyand Policy Recommendations 39
Appendix 2: Examples of Survey Instruments 52
References 69
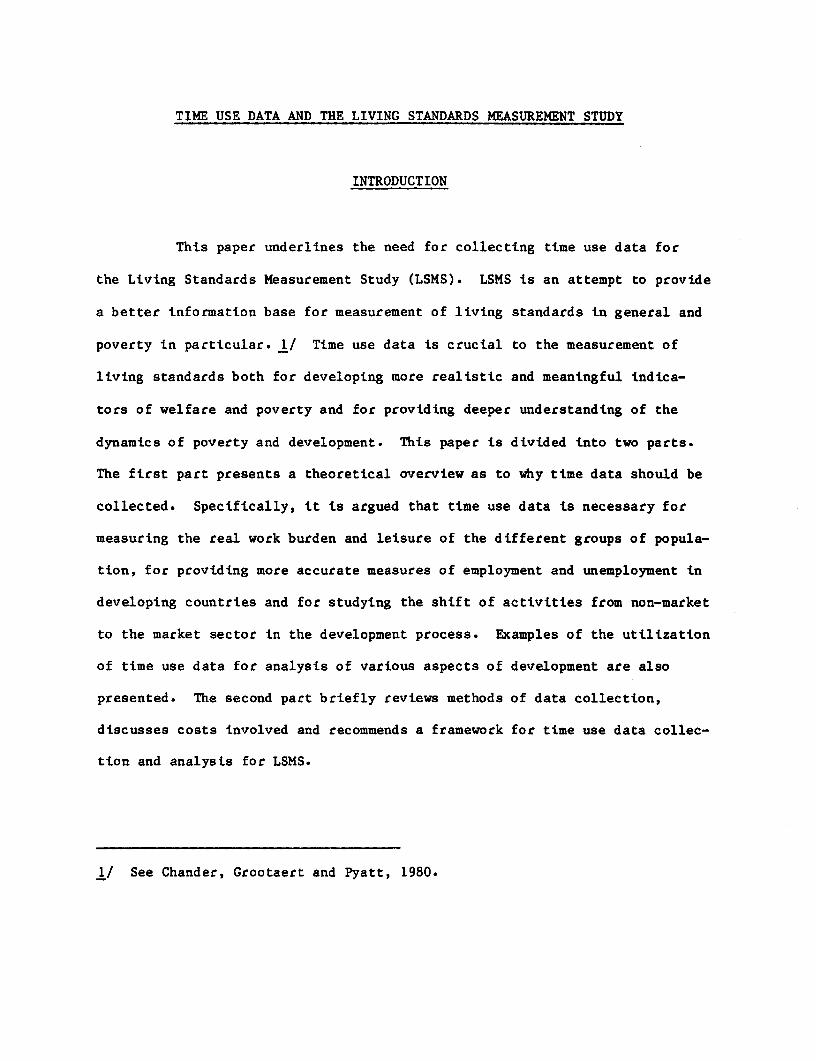
TINE USE DATA AND THE LIVING STANDARDS MEASUREMENT STUDY
INTRODUCTION
This paper underlines the need for collecting time use data for
the Living Standards Measurement Study (LSMS). LSMS is an attempt to provide
a better information base for measurement of living standards in general and
poverty in particular. 1/ Time use data is crucial to the measurement of
living standards both for developing more realistic and meaningful indica-
tors of welfare and poverty and for providing deeper understanding of the
dynamics of poverty and development. This paper is divided into two parts.
The first part presents a theoretical overview as to why time data should be
collected. Specifically, it is argued that time use data is necessary for
measuring the real work burden and leisure of the different groups of popula-
tion, for providing more accurate measures of employment and unemployment in
developing countries and for studying the shift of activities from non-market
to the market sector in the development process. Examples of the utilization
of time use data for analysis of various aspects of development are also
presented. The second part briefly reviews methods of data collection,
discusses costs involved and recommends a framework for time use data collec-
tion and analysis for LSMS.
1/ See Chander, Grootaert and Pyatt, 1980.
-2-
1. THEORETICAL OVERVIEW
Time Use and the Measurement of Welfare
Time use data is relevant to the measurement of welfare directly
because time is a source of utility and indirectly because it provides
a valuable guide to the estimation of value generated and services performed
within the household.
The utility attribute of time has long been ignored in economics.
Linder's (1970) explanation of why and how this happened is lucid and instruc-
tive. At the early stages of civilization, productivity was so low that tihe
marginal utility of goods which could be produced, say in one hour, was always
greater than the marginal utility of time, if consumed directly. Therefore,
time in itself did not seem to have utility. With the increase in productivity
and the more intensive utilization of time, the marginal utility of goods has
declined and that of time has increased. People in developed countries have
now reached a point where they can afford to choose whether to enjoy time
directly or to use it to produce more goods. Wealthier people in developing
countries also may have reached this point. If this point is chosen voluntari-
ly, then non-work time is a source of welfare. If living standards are to be
measured in welfare terms, then they should include the utility derived from
leisure, or direct consumption of time.
Leisure becomes important in the measurement of poverty because
many of the extremely poor are also often overworked. Accumulating evidence
from micro-level studies in Asia does not support the frequently held presump-
tion that idleness is a key feature of rural poverty. Time use data from
eight village case studies in Nepal (Appendix 1, Table 2) show that adult
men in Nepal on the average work 7.5 hours a day and women 10.8 hours a day.
Male Children in the 10-14 age group work 4.8 hours a day and female children
7.3 hours. Furthermore, working hours for children are negatively related to
income status of the family (Appendix 1, Table 4). 1/ Hart (1980), from her
study of 518 households in a village in central Java, concluded that the
landless are in a precarious welfare position not only in terms of general
quality of life, but also because they worked "extremely long hours in arduous
income earning activities yielding low returns to labor." Raj Krishna (1974),
analyzing employment data for 487 males from four villages in Rajasthan, found
that 32.6% of the sample population were poor and that only 12.2 percent were
poor and unemployed--that is to say, only 37 percent of the poor had extra
leisure. problem of poverty. Faruqee's (1980) conclusions from a countrywide
24-hour time allocation study of 700 households in Bangladesh are similar. He
found that male heads of household worked about 10 hours per day, while their
wives worked 10 to 11 hours per day.He writes, "hours of productive work 2/
increase when a person's family capital becomes smaller. Among the nonindustrial
population both in the city and village, income has negative relation to produc-
tive work hours." Cain, Khanam and Nahar (1979) also find poor women working
very hard. Kusnic and DaVanzo's (1980) analysis of "full income" in Malaysia
1/ No such pattern is visible in adult working hours, however. This mightbe due to the very conservative definition of economic strata. Therelationship between income status and work burden is being analyzedfurther.
2/ In this study, productive work included: (a) work for cash earnings; (b)self-employment; (c) family expenditure saving work; (d) study andtraining; and (e) work unpaid but needed due to scarcity or externalinefficiencies.
- 4 -
illustrates that the poor work longer than average hours. 1/ Only Mueller's
study from Botswana (1979) showed a high incidence of unutilized time
among all economic strata.
It is evident from the above examples that leisure cannot be
ignored in the analysis of quality of life and poverty. Human beings need a
certain amount of time for rest and recuperation. Some people have no time
for rest while others might have an excessive amount of time for it. The
amount of time available to an individual for leisure activities should,
therefore, be considered as an indication of well-being and thus of a stalndard
of living.
This is specifically important in the light of basic needs approach
to development. The basic needs approach is concerned with creating condi-
tions whereby the absolute poor may have access to a minimum of food, she:Lter,
primary health care, basic education and clean water (Leipziger, 1981). Ak
minimum amount of leisure is also a basic need. Development strategies should
not put an excessive work burden on the poor.
At this point it is necessary to define what is meant by leisurea.
In classical economic theory, all non-market time was classified as leisure.
In subsistence economies, however, a large proportion of total goods and
services is produced within the household, and withdrawal from the market does
1/ "Full income" in this analysis included value of all market production,production at home, domestic services and leisure. Income from leisurevalued at the market wage rate, however, could be either negative orpositive, depending upon whether people worked more or less hours thanthe average derived from the sample. Leisure income was added to incomefrom three other sources described above in order to derive "full income."Addition of income from leisure made the poor households even poorer whencompared to earlier comparisons based on income derived only from threeother sources.
not always imply availability of free time. For example, in a study of
approximately 1200 individuals from 192 households in eight villages in Nepal
(Acharya and Bennett, 1981), we found that market employment 1/ within the
village constituted only a fraction of the total working hours spent in the
village. Men spent only 1.24 hours on market activities out of a total of
7.51 working hours per day. The proportion of market time (0.46 hours) in the
total number of working hours (10.81 hours) for women was still smaller
(Appendix 1, Table 2). According to the production data, the degree of market
intermediation in the generation of per-household income varied from slightly
below fifty percent for a village about 2 hours' drive from the heart of the
capital, to only about 17 percent for a village in the Middle Hills. In
another village (Sirsia), located near a thriving city in eastern Nepal and
within 10 miles of the Indian border, only 19 percent of average household
income passed through the market. 2/ Studies from Africa have shown similar
results (UNECA, 1974). Thus, the classical definition of leisure as all
non-market time is too broad and does not reflect the realities of subsistence
economies.
At the other extreme, Linder's (1970) definition of leisure, which
he terms as "direct consumption of time", includes only the time which is
spent on pure passivity. According to Linder, people may spend their time in
any of the following five activities: specialized production, personal work,
consumption, cultural activities and passivity. Specialized production
1/ Work for wage and trading, shopkeeping, etc.
2/ It is also interesting to note that market intermediation in the genera-tion of income seems to be positively correlated with the income statusof the households (see Acharya and Bennett, 1981).
- 6 -
includes all activities generating income or resulting in products. PerEsonal
work consists of all kinds of services and may be subdivided into two parts:
maintenance of one's own body (sleep, personal hygiene, etc.) and maintenance
of goods. Consumption consists of final use of goods and services. Cult:ural
activities include various exercises related to the cultivation of mind and
spirit. Differentiating between consumption and culture time, Linder writes,
"consumption goods play a central role for consumption but only an incidental
role for culture time." Passivity is pure idleness.
Measurement of leisure according to Linder's classification of
activities would be extremely complicated, however. It is hard to separate
leisure consumption and culture time in practice. People may sleep longer,
go to a movie or read a book because they have free time. What difference
does it make to welfare whether people read a novel or watch movies?
For practical purposes, the classical definition of leisure is too
broad, while Linder's definition is too difficult to operationalize. An
alternative, more easily measurable definition of leisure was utilized in the
Nepal study (Acharya and Bennett, 1981): leisure was defined as the total
time available to a person, less time spent on production of goods or services,
either at home or market, less minimum time required for reproductive, educa-
tional and social activities.
Furthermore, it is important to differentiate between voluntary
leisure and forced leisure. The 'choice' between work and non-work does not
always exist for people in very poor households at low stages of technology.
Therefore, if a poor person is not working, in the face of starvation he is
not deriving any 'welfare' from the leisure he has. Leisure acquires welfare
value only when voluntarily chosen.

- 7 -
There has been some confusion as to how to account for leisure as
an indicator of human development. There have been attempts to measure the
"utility" derived from leisure in terms of foregone earnings and include it
in the overall concept of income (Kusnic and DaVanzo, 1980). The attempt
to attribute a value to the utility of time in terms of foregone earnings,
however, is fraught with difficulties.
First, utility is measurable only if the constant marginal utility
of money is assumed. Assumption of constant marginal utility of money is not
plausible empirically.
Second, a foregone earnings approach seems of doubtful value for
analysis of poverty because it implies valuing leisure at different prices
for different people. According to this approach, value of leisure imputed to
each individual's welfare will depend on his earnings. A loaf of bread is
valued at its market price irrespective of by whom it is consumed, however.
It is not inherently clear as to why leisure should be valued any differently.
This approach would also be misleading for derivation of aggregate
welfare maximization functions. For example, A works 12 hours and earns $1
per hour and B works 8 hours and earns $10 per hour. The forgone earnings or
opportunity cost approach would impute $10 to B's ninth hour and $1 to A's
13th hour. In the aggregate welfare function, B's leisure would enter with
greater weight leading to misallocation of leisure among the individuals.
This seems to gloss over the very question of equity, which is one of the major
concerns of LSMS.
Third, valuation of leisure by the foregone earnings approach
implies the existence of a market for all kinds of labor equally at all hours
- 8 -
of the day and all times of the year. Labor markets in most developing
countries are seasonal, however. The value of leisure is overestimated in
cases where there are no earning opportunities in the market.
Finally, the foregone earnings approach assumes that every action
has a foregone, quantifiable value. But, in practice, many decisions are
unexplainable in quantitative terms. The labor and commodity markets in
the developing world are influenced by so many non-quantifiable variables that
it is hard to take the market wage as a guideline for valuation of home
produced goods, domestic work, child care or leisure. For example, people
from higher socioeconomic groups will never join the labor force in their
lifetime. What price should be attached to their leisure?
Becker (1965) introduced and Gronau (1977) expanded the concept of
"full income" as a measure of total welfare. Although the existence of a
household utility function and its maximization by the average household is a
plausible assumption, there is no way the arguments of the utility function
could be captured fully. The alternative is to assume proportionality of
utility to measurable concepts like "full income" and to construct "full
income" maximization models for households. But the role of other factors is
too strong in household decisions to be ignored in this way.
The alternative of deriving a shadow price of leisure from the
household production function (Deaton, 1980), though not free from other
defects, would yield a closer estimate of real productive value of leisure
for the household. The idea is to derive a shadow price of leisure from a
household's production maximization function where time enters as a resource.
This, however, implies that the price of leisure will depend upon the pro-
ductive assets of the household. Productivity of labor depends on technology
- 9 -
and technology depends on the availability of capital. Low-capital households
will end up with a lower shadow price of leisure and vice versa. Use of
these shadow prices in the aggregate welfare function will once again result
in inequitable distribution of leisure.
There is a simpler, although theoretically less attractive, way of
taking account of leisure in the measurement of living standards: Time use
data can be used for deriving the real amount of voluntary leisure enjoyed
by households. The proportion of time spent on voluntary leisure could be
added as one more indicator of the standard of living, along with other
indicators, such as schooling, health status, etc. (U.N., 1975). Generally,
one would expect that societies at higher stages of development would be able
to spend a greater proportion of their time on leisure. At the individual
level, however, people in developed countries seem to be devoting a larger
proportion of their time to income earning activities. But at the aggregate
level, this might not be so if leisure is defined so as to include time spent
on consumption, recreation and other cultural activities. Time spent on
education and research activities could be another useful indicator of levels
of development.
An overall time balance could also be used for analysis of national
or group welfare. Feldheim, Patrushem and Manz, in their respective articles
on time use (Szalai, ed., 1972), have illustrated how the proportion of time
allocated to different groups of activities could be taken as a yardstick of
human development and used for socioeconomic planning. For example, develop-
ment may be defined as a process in which time needed for the production of
basic human needs declines progressively. As such, the time devoted to pro-
duction of basic needs by society as a whole may be taken as an indicator
- 10 -
of the levels of development and social productivity. A country at an
advanced level of development might be expected to devote a minimum of
its social time to the fulfillment of basic needs and services, while a
poor country might devote all of its time to such activities. It would
also be useful to compare the time allocated to producing the basic needs
of life among different population groups within a country. Some groups
might be devoting all of their time to the production of goods and services
without being able to fulfill their basic needs, while others might be
devoting minimum amounts of time to income generating activities. This kind
of analysis would require time use data classified by type of goods, however,
which may be beyond the scope of the LSMS.
From a policy point of view, the question of attainable levels of
welfare for households and nations at given levels of productivity and a
given socioeconomic structure is crucial to analysis of many aspects of
human capital development. Examples from Nepal, Upper Volta, Guatemala and
Indonesia show that the reason why poor children do not attend school is not
because their parents do not want them to or are calculating some low future
return on the capital invested in education, but simply because they are not
able to support the child through school. Income and productivity of the poor
must increase before they can make substantial investment in human capital.
In the Nepal study, for example, it was found that children in poor
households had to work longer hours than children in wealthier households if
the family was to meet its subsistence needs (Appendix 1, Table 4). Poor
households could not afford to send their children to school. Similarly, need
for their labor at home was first among the reasons given by parents for not

- 11 -
sending their children to school (Acharya and Bennett, 1981; Nag, White and
Peet, 1980). In their evaluation of the Project on Equal Access of Women and
Girls to Education in Upper Volta, McSweeney and Freedman (1980) concluded
that "after the age factor, the fact that children helped with the work was
cited as the most important obstacle to schooling and it was cited more
frequently with reference to girls than to boys." Hart (1980), in her study
on Indonesian villages, also confirmed that poor families cannot afford to
send their children to school. From a study of four villages from eastern
Guatemala, Clark (1981) concluded that for some children work opportunities
may compete with education.
Employment Concepts and Time Use
Time use data is a valuable complement for deriving realistic
measures of employment and unemployment in developing countries.
In conventional employment surveys, the category of employed
includes all persons who work in the organized market sector or are self-
employed in a family enterprise, with or without pay, during the reference
period. The unemployed includes those who are seeking work as well as those
who have never worked before but are looking for jobs. Economically active
includes both of these categories.
The categories of work for which information is collected are ill-
defined and biased toward market activity, however. Work is generally defined
as receipt of cash or in-kind income in the form of wage, salary, or profit
for activities in agriculture, trade, industry (usually defined by sectors
such as weaving, sewing, iron works) or services (teaching, portering, domes-
tic services for pay, etc.). Unpaid domestic work is specifically excluded
- 12 -
from the definition of work in U.N. census manuals (U.N.,1968). But nowhere
is domestic work defined. As a result, it becomes a residual category including,
besides cooking, child care and domestic services, all food processing,
kitchen gardening, animal tending, fuel and water collection, fishing, hunting
and gathering and manufacturing for home use, activities generally perfonmed
on a large scale within the household in the subsistence sector.
This restrictive definition of employment has resulted in an under-
estimation of the amount of work performed in the subsistence sector in
general and the work done by women and children in particular. Time use
studies from Nepal (Acharya and Bennett, 1981), Indonesia (Hart, 1980),
Bangladesh (Faruqee, 1980), Philippines (Quizon-King, 1978) and India (JaiLn
and Chand, 1980) illustrate that non-market activities represent a substantial
percentage of work time in poor households.
For example, the 1971 Nepal census reported an economic activity
rate for population aged 10 years and above of approximately 83 percent for
males and 35 perceilt for females. In contrast, the time use study of eighl:
villages in Nepal cited earlier (Acharya and Bennett, 1981) reported that
adult females spend 4.62 hours daily on activities which fall within the
conventional definition of employment, while men spend 5.81 hours on these
activities (Appendix 1, Table 2). Anthropological literature on Nepal des-
cribes Nepalese women performing most of the farmwork. 1/ There seems to be
no consistency in defining 83 percent of the males as economically active and
only 35 percent of the females so. Thus, economic activities performed by
1/ For a review of anthropological literature on division of work in Nepalsee Acharya, 1979.
- 13 -
women and children are greatly underestimated in conventional employment
statistics. Jain and Chand (1980) compared the employment figures reported
by the Indian National Sample Survey with time disposition studies from
six villages in two states and came to similar conclusions. These findings
point not only to the urgent need for refining the concepts of employment
and economic activity rates, but also to the value of time use data in mea-
suring employment in the subsistence sector.
In recent years the inadequacy of the present definition of these
concepts of employment has been discussed widely. Some consensus has emerged
on the need for making employment categories more realistic (U.N., 1978; The
Asia Society, 1978), but there is still a great reluctance to introduce
conceptual changes in the definition of employment and unemployment used in
census work. The U.N. approach in this respect has been to emphasize the
elimination of bias in practical aspects of data collection, such as inter-
viewer and respondent bias. Improvement in the conceptual framework is still
left to the experimental studies undertaken by specialized agencies like FAO
and ILO. In this context it is important to collect more realistic measures
of employment in the household surveys proposed under LSMS.
From a policy point of view, the importance of deriving realistic
employment data cannot be overemphasized. Incorrect perceptions usually
result in incorrect policies. The Nepal case may be cited once again to
illustrate this contention. Since it is assumed that Nepal is a labor surplus
country, low-technology labor-intensive programs are emphasized. This is
particularly true for programs devised for women. Most of these programs have
failed to attract the necessary labor; an influx of Indian labor is evident

- 14 -
in all branches of the economy. Time allocation data from eight village
case studies reveal that, given the level of technology, labor surplus is only
seasonal. The major problem is that of long hours of work and low productivity.
Consequently, only projects of higher productivity will be attractive for
Nepalese labor. The macro-level question, therefore, is whether to import
low-productivity labor or high-productivity capital rather than whether to
employ more domestic labor or imported capital. The policy importance of
deriving time-based unemployment figures for India has been well illustrated
by Raj Krishna (1974).
Poverty, the Subsistence Sector and Time Use
Time is the basic resource for a poor subsistence household and
all major household decisions are linked to the allocation of available
time. In subsistence households, the bulk of goods and services are produced
and consumed within the household. Capital plays a minor role in the produc-
tion process. The total time available to the household from its members is
the major source of income. Consequently, household decisions on marriage,
fertility, education and other investments in human capital and supply of
labor to the market, all matters of vital importance to the nation, are
influenced by considerations of time.
Time puts an absolute limit to all human activity. Labor, which is
equivalent to working time, has always been considered as one of the basic
factors in production. In the macro-level one-sector models used for invest-
ment planning, the work force is an important aspect of discussion. Given the
size of the working age population, labor time is a fixed resource in thle
static models. With the transition to two-sector models, however, this

- 15 -
important constraint on human resources is relaxed. The analysis centers on
the market sector on the assumption that there exists a free pool of labor in
the traditional sector waiting to be drawn into the modern sector. Given the
very low productivity of labor in the traditional sector and comparatively
high productivity in the modern sector, the cost of transfer of labor to the
modern sector seems negligible to planners. This is the demand side of the
story.
The value of time, however, is quite different to those who supply
labor, the subsistence and poor households. Poor households often face a
scarcity of both time and material resources. Failure to understand this
basic fact of poverty has resulted in erroneous policy conclusions in the
past.
In recent years, this time constraint has been recognized by the
school of new-household economics, which, despite several measurement problems
discussed earlier, has made an important contribution to understanding house-
hold behavior. In classical economics, households are considered only as
consuming units. In the new-household economics, households are viewed as
mini-factories which combine time and market goods to maximize household
utility. The time of the household members and capital stock constitute
the major constraints in these models. Several examples of this kind of
maximization model constructed for developing countries can be found in recent
literature. Questions studied in these models include: market supply of
female and child labor (Quizon-King, 1978; Rosenzweig, 1981); demand for child
services, investment in schooling and child leisure (Banskota and Evenson,
1978); and nutrition levels and women's work (Popkin, 1978; DaVanzo and Poh,
- 16 -
forthcoming). All of these models, however, are based on the assumption of an
unlimited market for labor, which is true neither in developed nor developing
countries (Deaton, 1980; Deaton and Muellbauer, 1980). The conclusions
derived from application of these models can be taken only as tentative at
present.
Moreover, the data requirements for household models are more
complex than for overall time balance, mean or average analysis. Time use
studies completed so far have not been able to generate data that are accurate
enough for this kind of mathematical analysis (Engle and Butz, 1981). More
accurate data needs could only be satisfied by extended observation, which is
not possible on a large scale given the limited institutional framework of
most developing countries.
After a review of studies completed on Laguna households in the
Philippines, several researchers involved in the study (Evenson, Popkin
and Quizon-King, 1979) concluded that "the understanding of the behaviour of
rural households is not so complete that simple and seemingly unsophisticated
analysis does not have much to tell." There are simpler and more meaningful
frameworks for analyzing time use data. A well thought out time balance for
households or nations, for example, would provide valuable insight into the
development process and help to clarify the policy implications.
The Nepal study (Acharya and Bennett, 1981) is an example of this
type of analysis. In the Nepal time-use analysis, activities were divided
into four categories: (1) conventional economic; (2) extended or subsistence
economic; (3) domestic; and (4) leisure.
- 17 -
Conventional economic activities are those activities which are con-
ventionally included in the economic activity rates, at least conceptually
(see Appendix 1, Table 2).
Extended economic activities include food processing, fuel and water
collection and manufacturing for home use, i.e., all activities which result
in increasing material resources within the household. In industrial coun-
tries, the major part of food processing, fuel and water collection and home
construction are performed outside the household and, hence, are considered
income generating activities. The fact that these same activities are often
performed within the household in Nepal and other developing countries is
not sufficient reason for excluding them from the definition of economic
activities. In the Nepal study, food processing alone accounted for 16 percent of
the physical product generated in the household. 1/ Current census practices
in developing countries recognize agricultural work, either for market or
domestic use, as economic activity. By the same logic, food processing, manu-
facturing for home use, and fuel and water collection, as well as services,
should be included in the economic analysis of the household. Products
generated from these activities could be valued easily on the basis of market
cost or "replacement cost" basis.
1/ The valuation procedure used was rather conservative, however. First,immediate pre-cooking processing was not included. Thus, while par-boiling, post-parboiling, milling and husking were considered as foodprocessing, pre-cooking cleaning of rice was included in cooking ratherthan in food processing. Second, the value added from one unit of foodprocessing was considered equal to the local market price of similarprocessed product, less the local market price of the raw materials usedand other costs involved, such as milling cost for paddy.
- 18 -
Domestic activities include cooking, cleaning, child care and all
other work not included in economic or extended economic activities and
conventionally termed as services. The valuation of these kinds of services
is still very controversial. If valued and added to GDP, they might double
the GDP instantly (see U.N., 1977). Valuation attempts are still at the
experimental stage (see Kusnic and DaVanzo, 1980). Moreover, the controversy
regarding the valuation of domestic activities seems to be irrelevant to the
development issues facing Nepal at this stage. The immediate choice before
poor households is producing subsistence goods at home or in the market.
Services play lesser roles in this choice. Only the material production
process is amenable to immediate intervention from outside the household and
capable of yielding direct results in terms of increases in productivity mnd
income. Therefore, we decided to keep the category of domestic activities
separate in our time use analysis.
The fourth category in our classification--leisure--includes
education, personal maintenance, socialization and passive time.
The purpose of the Nepal study was to highlight the role of women
in Nepalese society. The analytical framework concentrated on the analysis
of division of labor within and without the household. The results of the
study and policy conclusions for Nepal are summarized in Appendix 1.
For LSMS, a new framework is needed because the questions of
concern are slightly different. The time balance constructed must provide
adequate information for assessment of welfare status of individuals and
countries and for understanding the dynamics of poverty.
- 19 -
II. A FRAMEWORK FOR DATA COLLECTION AND ANALYSIS
a. Analytical Framework
LSMS analysis should start with the construction of a time balance
sheet for the nations under study and the average households in different
economic strata. For analysis of poverty, a time balance should have four
vertical and two horizontal classifications of activities. The four vertical
classifications should be the following: (1) specialized production;
(2) services; (3) reproductive activities; and (4) leisure. Horizontally,
activities should be divided between market and non-market activities. The
detailed content of each group of activities is discussed in the next section.
A brief description and logic for this classification will be dealt with in
this section.
Specialized production should include all work which results in
products, irrespective of whether it is performed at home or in the market.
People in poor countries, in general, may be expected to be devoting a
much larger proportion of their time to production of goods than people in
wealthier countries. Production of goods needs to be analyzed separately
from production of services because, for development, creation of goods has
a different significance than creation of services. No one can survive on
services alone: one must be able to exchange them for goods. Development
policy has often ignored the fact that production of goods is the basis of
human development; in many cases, concentration of efforts on services has
resulted in inflationary situations.
Services are important in improving the quality of life and for
human survival. Services include three groups of activities: (1) maintenance
of body, if performed for others (e.g., barbers' services); (2) maintenance of
- 20 -
goods; and (3) professional, cultural and entertainment services performed for
income. Maintenance of body and maintenance of goods should be separated for
analyses of time use because, while time spent on the first kind of service
may not vary much with the stage of development, time spent on maintenance of
goods will rise quickly with the increase in the amount of goods available for
consumption. Cultural, educational or professional activities, if performed
for income, have to be included in services because they are direct income
generating activities for individuals, although they generate income only
indirectly for society. From society's point of view, there is no difference
between a cultural activity undertaken for income and one undertaken for
enjoyment. However, for an individual there is a big difference in these two
kinds of activities.
The third group--reproductive activities-should include all
activities concerned with maintenance of self, e.g., time spent on personal
hygiene, eating, sleeping, childbearing, illness, education, socialization,
etc.
Leisure, as defined in the first section of this paper, should
exclude time devoted to specialized production and services, and exclude a
minimum of time spent on reproduction and socio-political activities. The
problem is how to define this minimum. There is no difficulty in ascertaining
mimimum time needed for basic education, but for sleep and socio-political
activities, some subjective criteria has to be used. The other alternative is
to define leisure broadly as all time other than that spent on specialized
production, services and a minimum of reproductive activities necessary for
physical survival (i.e., exclude education, socialization and political
- 21 -
activities from this latter category and include them in leisure). These
questions could be resolved at the analytical stage, provided the data is
detailed enough for regrouping.
Time, however, has to be further divided into market and non-
market time for a meaningful analysis of the subsistence sector in developing
countries. Developing economies are predominated by household production
of both material goods and services. Market intermediation in consumption
and cultural activities is also negligible. The development process is
associated with a deeper and deeper penetration of the market into the subsis-
tence sector. This process might have positive as well as negative effects on
work distribution, consumption and nutrition within the household. It is also
related to the demand for and supply of goods to the modern sector. Any
analysis of time use data for developing countries would be incomplete and
misleading if it did not deal with the market and non-market distribution of
time.
b. Data Requirements
Although all data collection is problematic, data on time use
are considered to be more difficult to generate. Human activity has both
temporal and spatial dimensions. Comprehensive data on time use should
contain information on all dimensions of time use: timing, duration, sequence
and frequency of the activity, place of the activity and form of organization
within which the activity takes place. All dimensions of time use are interest-
ing in themselves and useful for various types of analysis (see Szalai,
1972), but generating data on all of the above aspects of time use can be very
complicated. We do not need data on all dimensions of time use for LSMS.

- 22 -
Information on duration, seasonality, timing and place (market/non-market) of
the activity are the most important aspects of time use from the LSMS point
of view, i.e., for programming purposes in the host countries and for project
work in the Bank. This discussion, therefore, will be limited to generating
the data on these four dimensions of time use.
(i) Activity List
The methods and instruments used to collect data on the four
aspects of time use relevant to LSMS--duration, seasonality, timing and place
of work--will depend on the details of the activity breakdown wanted. A
structured, comprehensive activity list is a must for all time budget stuldies
in order to minimize the chances of mis-definition of activities into work
and non-work and to derive accurate employment figures.
An activity list must have four features. First, activities must be
classified according to the type of activity and whether or not the activity
is performed in the market. For example, work at home, such as food process-
ing, should be matched with similar work in the market, given comparable
primary codes and assigned to similar analytical categories. A separate code
should designate whether the activity is performed in the market. Morever,
activities in the household sector should be specified to the same level of
detail as those in the market sector. Only then will LSMS be able to provide
an adequate data base for an accurate assessment of the actual employment
status of the population and an analysis of the shift of activities from the
non-market to the market sector in the process of development. A study of
this shift is necessary for evaluating the real increase in goods and services
generated in the economy in the process of commercialization. A second
- 23 -
important requirement is that the activity list provide enough information for
a cross classification of time use by the four categories outlined above and
into market and non-market orientation of specialized production and services.
Third, the activity list must be comprehensive enough to serve as a guide for
the field survey. Finally, it must be precise enough to be amenable to
different groupings, because different groupings may be necessary
for answering different kinds of questions.
Whatever the format of the form for the interview, there must be an
activity list so that the effect of perceived value judgments on the part of
both interviewer and interviewee is minimized. The major problem in current
employment data, apart from conceptual vagueness of the definition of work, is
the effect of cultural value judgments. This effect can be minimized only if
a pre-defined activity list is provided to the interviewer. The time oriented
form, i.e., where the observer writes down the activity as it is observed in a
sequence without a predefined activity list, also reduces the effect of value
judgements to a certain extent by pinning down the use of time, but the
activity list is a better instrument for minimizing this kind of error. In
addition, a precoded structured list of activities reduces both the cost of
subsequent processing and the inconsistencies in recording due to the diffe
ing perceptions of the interviewers.
In order to capture the division of labor within the household,
most productive activities must be subdivided into processes; division of
labor by sex and age often corresponds with processes rather than products
or sectors. Therefore, to be useful for programming purposes as well as for
assessing the economic role of women and children in the household economy,
- 24 -
the list of activities should be detailed enough to capture this division of
labor within the household. In the modern sector, it is easy to assess the
contribution of women and children through labor and income statistics. For
the subsistence household and unorganized small enterprises, study of the
division of labor is the only way to do so.
Market/non-market classification of activities is very difficult.
Goods produced at home as a result of a series of activities are often neither
completely for market nor completely for home use. Part of the product
enters the market, while another part does not. The proportion between
marketed and non-marketed parts will vary from household to household depend-
ing upon its orientation (subsistence or non-subsistence). The practical
solution to this problem is recording the activity according to the place of
work, unless the work is explicitly performed for wages. Market/non-market
orientation of the product should be handled at the analytical stage. S'imilar-
ly, transportation time presents another difficulty. It seems reasonable
to include time spent on transportation of goods in the category of specialized
production. Passenger transportation time might be included in services.
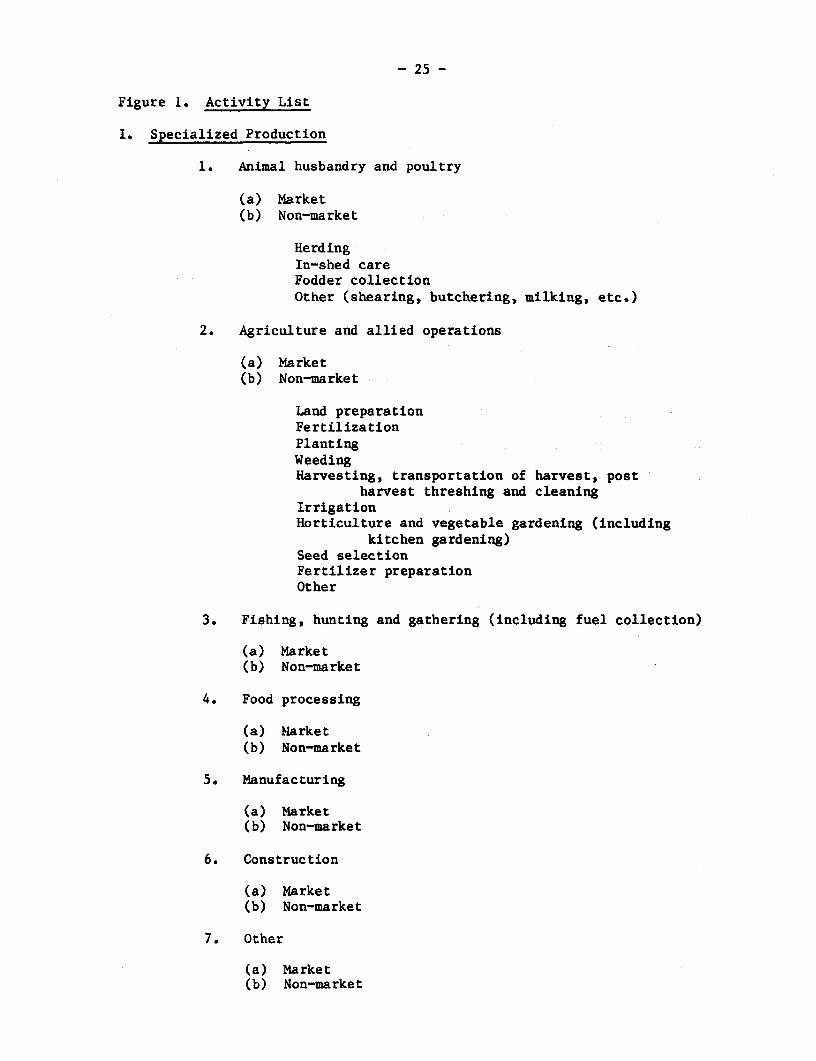
It is very difficult to draw a universal list of activities
applicable to all countries. The activity list presented below is intended as
an example (Figure 1). The concrete shape of the listing will depend on the
nature of the economy.
- 25 -
Figure 1. Activity List
I. Specialized Production
1. Animal husbandry and poultry
(a) Market(b) Non-market
HerdingIn-shed careFodder collectionOther (shearing, butchering, milking, etc.)
2. Agriculture and allied operations
(a) Market(b) Non-market
Land preparationFertilizationPlantingWeedingHarvesting, transportation of harvest, post
harvest threshing and cleaningIrrigationHorticulture and vegetable gardening (including
kitchen gardening)Seed selectionFertilizer preparationOther
3. Fishing, hunting and gathering (including fuel collection)
(a) Market(b) Non-market
4. Food processing
(a) Mlarket(b) Non-market
5. Manufacturing
(a) Market(b) Non-market
6. Construction
(a) Market(b) Non-market
7. Other
(a) Market(b) Non-market
- 26 -
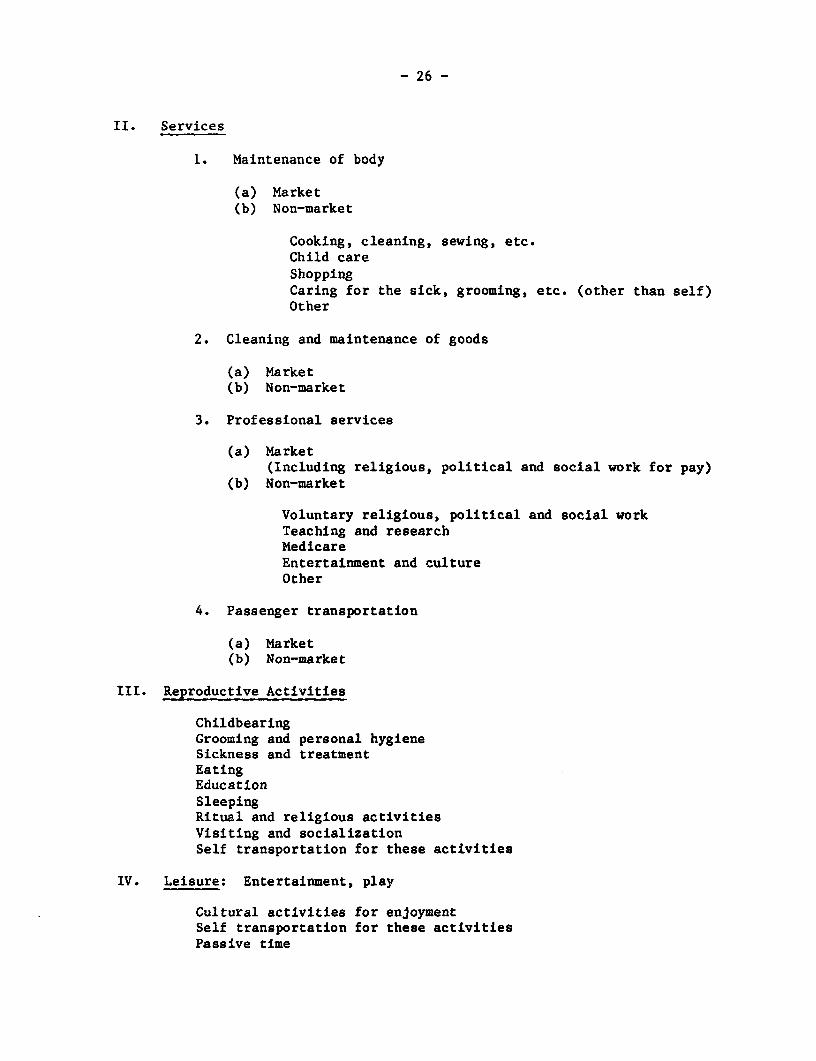
II. Services
1. Maintenance of body
(a) Market(b) Non-market
Cooking, cleaning, sewing, etc.Child careShoppingCaring for the sick, grooming, etc. (other than self)Other
2. Cleaning and maintenance of goods
(a) Market(b) Non-market
3. Professional services
(a) Market(Including religious, political and social work for pay)
(b) Non-market
Voluntary religious, political and social workTeaching and researchMedicareEntertainment and cultureOther
4. Passenger transportation
(a) Market(b) Non-market
III. Reproductive Activities
ChildbearingGrooming and personal hygieneSickness and treatmentEatingEducationSleepingRitual and religious activitiesVisiting and socializationSelf transportation for these activities
IV. Leisure: Entertainment, play
Cultural activities for enjoymentSelf transportation for these activitiesPassive time
- 27 -
(ii) Time Breakdown
The most problematic question in collection of the time use data
is perhaps the time breakdown. Time breakdown required would depend on the
degree of details wanted on activity. For example, "hour" would be a suffi-
cient unit of breakdown if the information wanted is on just work and non-work.
If we want to break down the category of work between market and non-market
activities, "hour" as a unit of time measurement might still be acceptable.
But if the information wanted is on breakdown of non-market work on agricul-
ture, animal husbandry, cooking, child care, food processing, fuel and water
collection, etc., the hour would be too gross a unit of measurement, for it
would tend to minimize the chances of reporting activites which take less than
an hour per day. Half an hour or even a 20-minute breakdown would be more
acceptable for this kind of activity. Further, if information on personal
hygiene and on-the-job rest is also required, the unit of measurement might
have to be 5 or 10 minutes. The unit of time adopted, however, also depends
on the method of survey to be used.
What should be the unit of temporal recording for LSMS? Choice
of analytical framework and activity list, in a way, leads to choice of
the appropriate time interval. Given the activity list cited above, a
30-minute recording is necessary.
(iii) Other data requirements
The kind of analysis proposed above requires many other kinds
of data besides those on time use. It is assumed that other parts of LSMS
would generate data on:
1. Age/sex distribution of the sample population.
2. Spatial distribution of the sample population.
3. Income status of the households and the population.

- 28 -
c. Methods of Data Collection
Time use data may be collected by recall, observation or diary
keeping. In the recall method, the respondents are asked to report what they
did during the reference period, which may be a day, week, month or year. For
observation, the interviewer has to record the activities of a single person
chosen or of all household members. In the diary method, respondents are
asked to keep their own diaries. The diary method is out of the question for
developing countries, where literacy rates are very low.
Several variations of the recall method or observation method, or
a combination of both, may be adopted. Most technical and anthropological
studies record information by observation, while most economic and socio-
logical information is generated by interviews. Time use surveys have
used both methodologies. Mueller (1978), Quizon-King (1977) and White (1976)
have observed that the data generated by observation tend to be more accurate
than those generated by recall. The recall method of interview, by defini-
tion, relies on the recollection of the respondent. There is always a lapse
of time between the occurrence and the recording of an activity. This creates
problems of memory lapse and of selective recall on the part of the informant.
Activities of a recurrent nature but of shorter duration tend to be underre-
ported. This is specifically so for activities connected with domestic work
and personal hygiene. Observation would eliminate errors due to memory lapse
of the respondent, but the costs of large-scale observation are huge.
In the Nepal study, a combined method of survey and observation
techniques was adopted. This method was used earlier by Erasmus (1955) and
Johnson (1975). In this method, what is observed is a frequency of people
performing different activities at a predetermined, randomly chosen moment.
- 29 -
The interviewer is provided with a form which has precoded activities listed
vertically, a list of sample households and a chart of randomly chosen
moments for observation of each household. He is asked to write the names of
the household members across the horizontal axis at the top of the form. He
visits the household at the predetermined randomly chosen moment and marks the
activity observed for each person in the household. He goes to the next
household included in the sample and repeats this exercise. The time distri-
bution per activity is derived from the frequency of observations. 1/
The question of observation versus recall should also be considered
in the light of the LSMS survey machinery visualized. If the LSMS is going to
be a one-round survey, there is no question of generating time use data by
observation because the pattern of time use varies with the time of the day,
the day of the week and season. Besides, there needs to be one observer per
person, or at least per household, per day. Therefore, a sample of 4000 would
require at least 4000 simultaneous observers for one day. Training this
number of observers for one day would be too expensive and wasteful. If the
LSMS is conceived as a multi-round survey (at least four times a year), hiring
the same observers for all rounds of the survey would be desirable but not
practical. Therefore, observation as a method of data collection is ruled out
if the period observed has to be continuous and sequential and at the same
time cover a large sample.
In the Nepalese study (Acharya and Bennett, 1981) this problem
was solved by adopting a method of frequency observation rather than longi-
tudinal observation. This method, however, can be applied only if the survey
1/ This method is described in detail in Appendix 2.
- 30 -
period is long enough so that there is a high probability of covering all
hours of the day in random sampling. All days of the week and all seasons
must also be covered by observation. The frequency observation method is;
very simple and the training needs of the interviewers are minimal. It can
generate data on four dimensions of time use--time, duration, frequency and
seasonality of the activity. There is, however, a major assumption in deriva-
tion of duration of activity from frequency of activity. It is assumed that
distribution of observations is equal to distribution time use. This method,
moreover, cannot be adopted as a one-time or two-time survey.
The method of data collection chosen will also depend on staffing
arrangements. If the LSMS utilizes a permanent household survey staff,
training and supervision needs are greatly reduced. But even in this case,
adoption of an observational method for collection of time use data becomes
very expensive for a reasonably acceptable sample. The interviewer is tied up
for the whole day with one individual or with one household. But a method of
frequency observation becomes feasible if there is a permanent household
survey staff. Since the method of frequency observation is very easy to
supervise and takes only one or two hours per day, it could serve as part: time
employment for local people, e.g., primary school teachers or secondary school
students.
d. Survey instruments
The instruments for LSMS should be simple and easily comprehensible.
Many of the instruments utilized for time use surveys have been too comp]Lica-
ted for the interviewer (see Forms B, C and D in Appendix 2). Interviewers in
developing countries are usually high school graduates or people with minimal
- 31 -
education. The majority of them will never have seen a calculating machine.
From my experience, it is unreasonable to expect an interviewer with a high
school or lower level education to fill out these complicated forms correctly,
no matter how much training they are given.
There is also a huge time cost involved in the use of unnecessarily
complex forms, both for the interviewers and the respondents. For example,
according to my estimates, completion of forms such as those proposed by
Anker or those used in the Malaysian Family Life Survey (Forms B and C in
Appendix 2) with reasonable accuracy would take at least 2 hours per inter-
view, not per household. In many cases, too much information is sought on one
instrument, adding to its length and complexity. Often, less than half of the
data obtained is used in the analysis. The form used in the Philippines (Form
E) must have taken considerably less time. The Indian form (D) would take
about an hour per household. The information requested on these last two
forms is very limited and not adequate for welfare analyses, however. The
LSMS activity list needs to be somewhat more extended.
Fortunately, some of the information required for the LSMS can be
obtained by methods other than household questionnaires. Data on wages and
other payments are easier to collect at the community level, and the rates
usually do not vary from person to person. Variables such as work organiza-
tion and labor contract systems are usually community-specific in developing
countries and would be more easily observable at the community level. This kind
of collection is less intensive in time and training.
The merits and demerits of using different kinds of forms for
data collection on time use have been discussed in detail by Mueller (1978)
and Anker (1980). These studies divide the forms into those oriented towards
time and those oriented towards activity. In the time-oriented forms, the

- 32 -
hours are printed sequentially and the respondents are asked to describe their
activities sequentially. In the activity-oriented forms, activities are
printed and the respondent is asked whether he/she performed any of them
during the reference period. In case of positive answers, the respondent is
asked how long he/she performed that activity. Examples of instruments
utilized in a number of time use studies are provided in Appendix 2.
For LSMS, it is necessary to generate data on two temporal dimen-
sions of time use--duration and timing--and one spatial dimension--place of
work. Except in the frequency method of observation, it would be inconvelaient,
though not impossible, to record duration and timing if an activity-oriented
form is adopted. A time-oriented form will easily provide information on
duration and timing, as well as on the sequence of activities. Information on
place of work can be accommodated on either type of form by providing market
and non-market classifications for all activities and by providing a specific
code for each.
A time-oriented form seems preferable to an activity-oriented
form on considerations of cost and convenience. It enables recording the
time use of several persons in a household on the same form. If an activity-
oriented instrument is used, each member of the household must be supplied
with one form in order to collect information on both timing and duration.
If this is not done, the information on timing and duration would have to
be precoded and the coding may become rather complicated.
From my experience, the time-oriented form seems to stimulate
the process of recall. Often it is argued that people in agricultural
societies have no time orientation (Szalai, 1972). This statement is true
- 33 -
to the extent that agricultural societies do not measure time by the same
scale, i.e., the clock. But according to my observation, they have their own
time scale, which aids them for daily activities. On visiting the fields in
Asia during cropping or harvesting season, one finds people doing almost the
same thing at the same hour every day. For example, in the Nepal Terai or in
North India, during the harvesting period people wake up early before dawn,
perform hygiene in the early hours and go to the fields. In the late morning,
around 7 or 8, it is usual to see the same persons carrying the food to the
fields. One finds them having a mid-day meal at noon and resting about one
hour. Without a conception of daily time distribution, it is hard to perform
these activities with such accuracy. White (1972) reported that people in the
Javanese village studied by him had a fairly accurate sense of time. It seems
to me that translating the scale of daily timing used by the rural society to
our scale of timing, i.e., the clock, is less problematic than overcoming the
inaccuracies introduced by long periods of recall and dates.
The type of form to be used for the interview also depends on the
period of recall desired. If the period of recall is more than a day in one
round of the survey, it becomes difficult to use the time-oriented form.
Both the time breakdown and the details of the activity list can be
flexible from country to country, provided the information collected can
be grouped afterward under the same major headings and time intervals. In
other words, there is a limit to aggregation of activites as well as time
reference, but there is no limit to disaggregation. The degree of disaggrega-
tion could be decided by each country according to its programming needs and
the resources available.
- 34 -
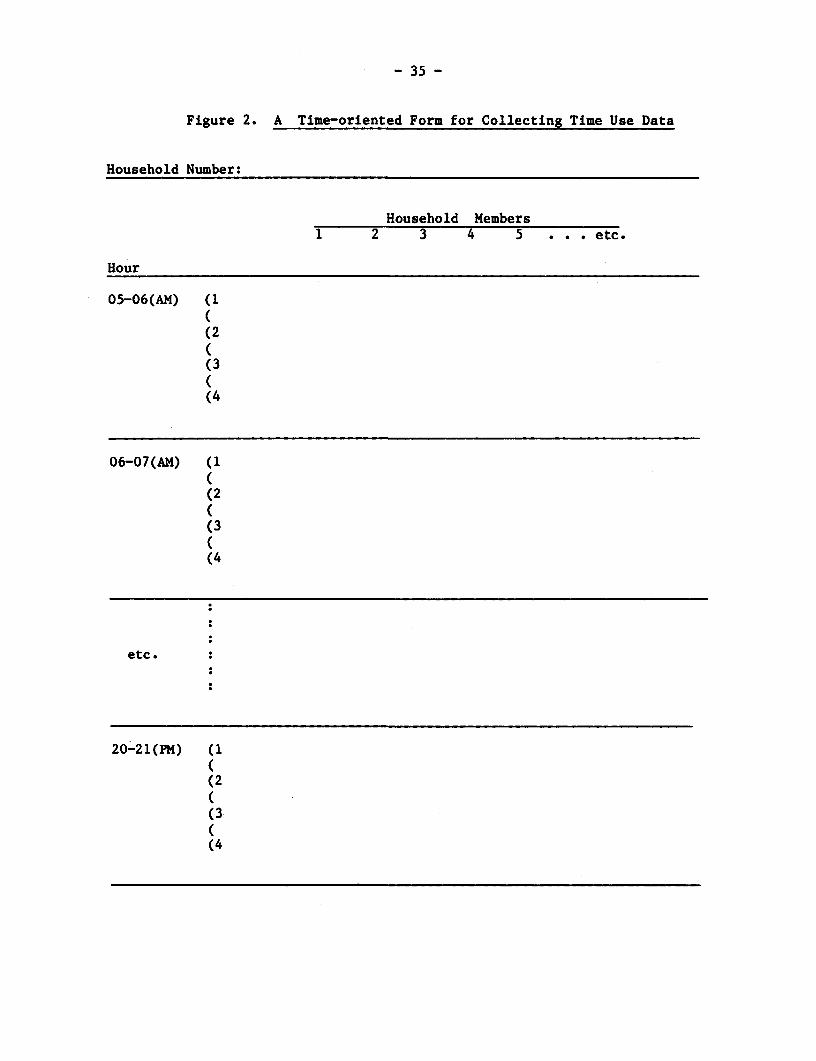
A sample time-oriented form for collecting time-use data is pre-
sented below (Figure 2). Each hour is broken into four 15-minute intervals.
The interviewer would be given a precoded activity list in addition to this
form. He would record the code of activity reported in the appropriate space
against the person's number listed on the top line. Simultaneous activities
can be recorded concurrently in the same space. Whether an activity is for
market or non-market may be indicated by a letter or a number code. Similarly,
the primary or secondary status of the activity may also be identified by
providing a special code for them.
One very specific problem in this kind of interview is the diffi-
culty of capturing the precise time distribution of very frequent activities.
How many minutes of an eight-hour workday are taken by consumption and
personal maintenance? Is the time devoted to consumption and maintenance
activities during working hours included in work or personal maintenance? Is
it possible to classify this time into a separate category from work and
collect information on it? Can the reported time spent on personal mainte-
nance ever be accurate? This kind of information cannot be captured except
by direct 24-hour observation or diary keeping. For data collected by all.
other methods, it should be kept in mind that the reported time on personal
maintenance is most inaccurate and probably always less than actual.
e. Reliability, Validity and Cost of Data Collection
The reliability and validity of any data collected in developing
countries--particularly that which is obtained by recall--may be questioned.
The reliability of time use data has been discussed extensively (see Boulier,
1977; Mueller, 1978; and Engel and Butz, 1981). It is true that it is much
more difficult to remember which activities you did yesterday or last month
- 35 -
Figure 2. A Time-oriented Form for Collecting Time Use Data
Household Number:
Household Members1 2 3 4 5 ... etc.
Hour
05-06(AM) (1((2((3((4
06-07(AM) (1
(2
(3(4
etc.
20-21(PM) (1
(2
(3(4
- 36 -
than what you earned, if your income is received as a lump sum. But for a
poor household, whose source of income is precarious and irregular, it is
equally difficult to remember what was earned during the month or the year.
For example, in an experimental study in Nepal (Campbell, Shrestha and Stone,
1979), in 38 percent of the sample households the income reported to two
groups of interviewers by the same respondents differed by more than ten
percent. Discrepancy in the total reported income for these same households
amounted to 233 percent. We do not discard the use of income data, however.
They are the best approximates available. Similarly, data on time use should
be taken as the best approximation of reality and treated accordingly.
All of the doubts about the reliability of time use data, i.e.,
inaccuracy of reported duration, influence of the interviewer on the respondent,
intentional distortion by the respondents, are equally relevant to other
types of data collected in developing countries. For example, the age
reporting in demographic surveys in developing countries is a subject of
constant concern. Still, it is not considered appropriate to abandon all
demographic analysis based on age breakdowns. These analyses have been quite
useful for practical purposes. Similarly, time use data, though imperfect,
would be very useful for clarifying certain development issues. The effort,
therefore, should be concentrated on improving the reliability and validity
of the data rather than discarding it.
The reliability of data, besides the nature of the data itself
depends on the complexity of the instruments used as well as willingness of
the respondent to answer the questions correctly, the possibility of minimiz-
ing memory lapse on the part of the respondents, and the training level and
understanding of the interviewers.
- 37 -
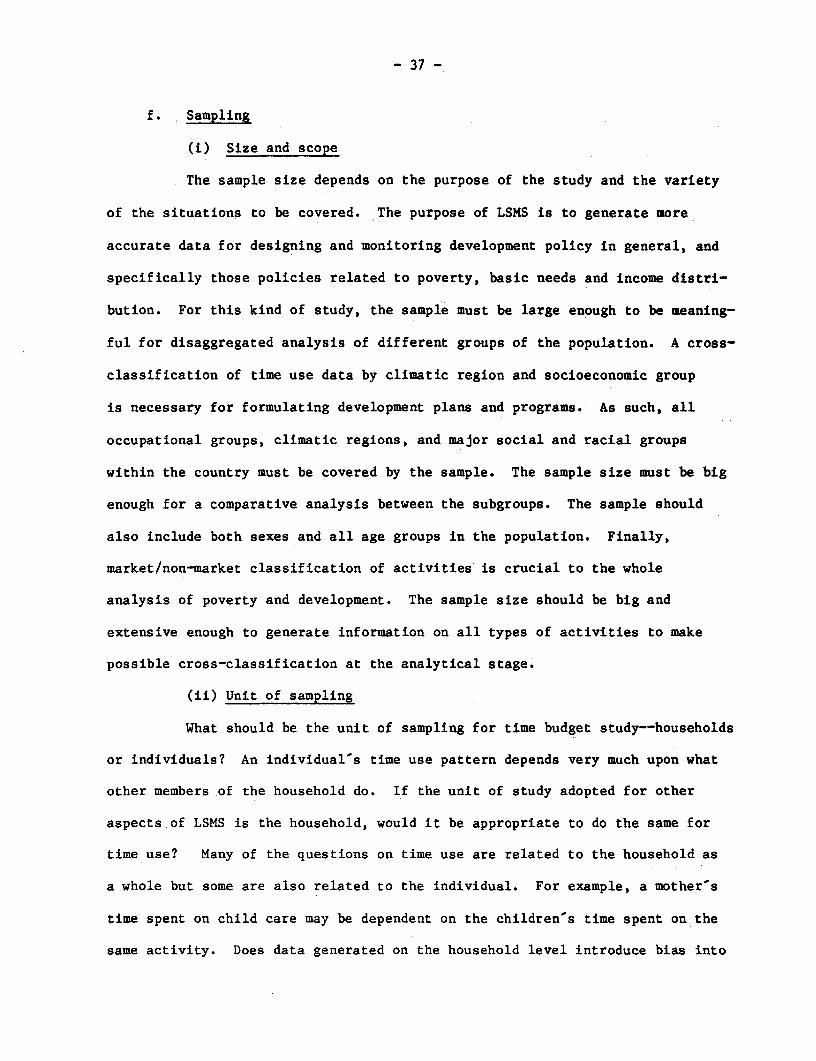
f. Sampling
(i) Size and scope
The sample size depends on the purpose of the study and the variety
of the situations to be covered. The purpose of LSMS is to generate more
accurate data for designing and monitoring development policy in general, and
specifically those policies related to poverty, basic needs and income distri-
bution. For this kind of study, the sample must be large enough to be meaning-
ful for disaggregated analysis of different groups of the population. A cross-
classification of time use data by climatic region and socioeconomic group
is necessary for formulating development plans and programs. As such, all
occupational groups, climatic regions, and major social and racial groups
within the country must be covered by the sample. The sample size must be big
enough for a comparative analysis between the subgroups. The sample should
also include both sexes and all age groups in the population. Finally,
market/non-market classification of activities is crucial to the whole
analysis of poverty and development. The sample size should be big and
extensive enough to generate information on all types of activities to make
possible cross-classification at the analytical stage.
(ii) Unit of sampling
What should be the unit of sampling for time budget study--households
or individuals? An individual's time use pattern depends very much upon what
other members of the household do. If the unit of study adopted for other
aspects of LSMS is the household, would it be appropriate to do the same for
time use? Many of the questions on time use are related to the household as
a whole but some are also related to the individual. For example, a mother's
time spent on child care may be dependent on the children's time spent on the
same activity. Does data generated on the household level introduce bias into
- 38 -
the study of mothers' time use or children's time use? In the Nepal
study, we examined the time-use pattern of mothers-in-law and daughters-
in-law from the same households. Was it valid to make a statement such
as: mothers-in-law spent on the average xm hours on the activity while
daughters-in-law spent xd hours on the same activity? Or should we have
chosen daughters-in-law and mothers-in-law in separate samplings?
(iii) Respondents
It has usually been noted that time recording should be first hand,
in other words, that the respondents should report only for themselves. In
the recall method, however, it is not possible to interview young children.
The reporting has to be by a third person. In such cases, mothers would be in
a better position to report on activities of young children because they are
more closely associated with their activities.
- 39 -
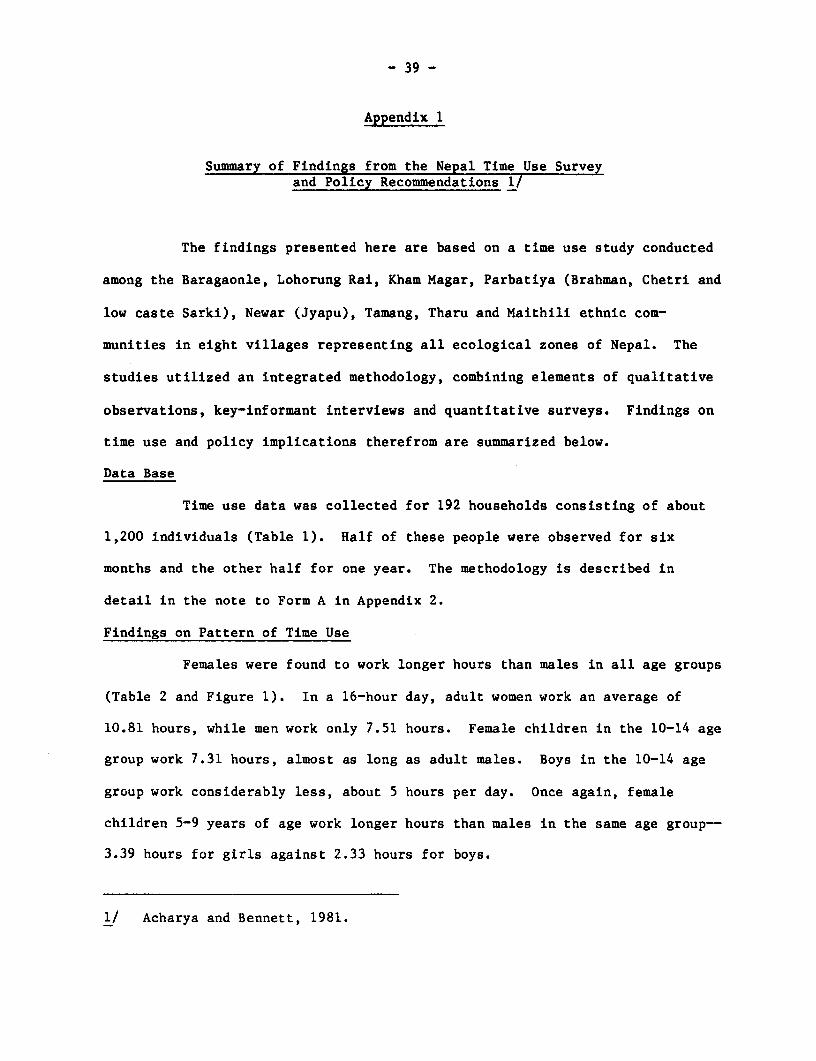
Appendix 1
Summary of Findings from the Nepal Time Use Surveyand Policy Recommendations 1/
The findings presented here are based on a time use study conducted
among the Baragaonle, Lohorung Rai, Kham Magar, Parbatiya (Brahman, Chetri and
low caste Sarki), Newar (Jyapu), Tamang, Tharu and Maithili ethnic com-
munities in eight villages representing all ecological zones of Nepal. The
studies utilized an integrated methodology, combining elements of qualitative
observations, key-informant interviews and quantitative surveys. Findings on
time use and policy implications therefrom are summarized below.
Data Base
Time use data was collected for 192 households consisting of about
1,200 individuals (Table 1). Half of these people were observed for six
months and the other half for one year. The methodology is described in
detail in the note to Form A in Appendix 2.
Findings on Pattern of Time Use
Females were found to work longer hours than males in all age groups
(Table 2 and Figure 1). In a 16-hour day, adult women work an average of
10.81 hours, while men work only 7.51 hours. Female children in the 10-14 age
group work 7.31 hours, almost as long as adult males. Boys in the 10-14 age
group work considerably less, about 5 hours per day. Once again, female
children 5-9 years of age work longer hours than males in the same age group--
3.39 hours for girls against 2.33 hours for boys.
1/ Acharya and Bennett, 1981.
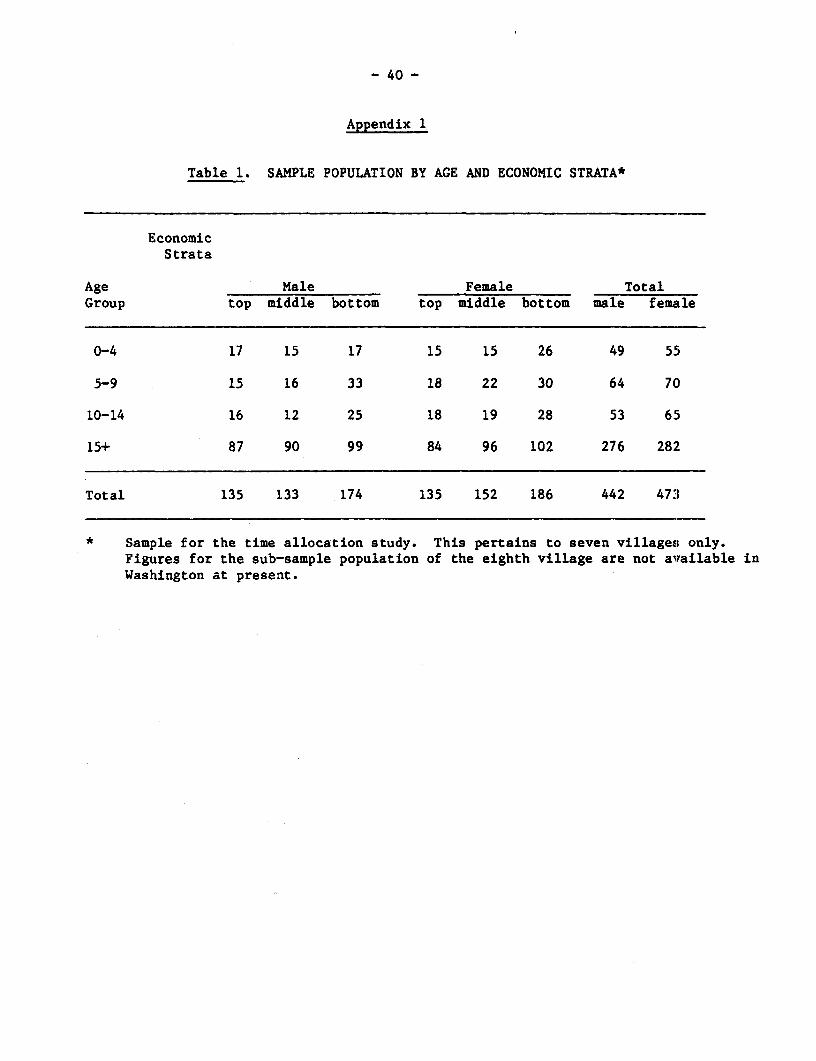
- 40 -
Appendix 1
Table 1. SAMPLE POPULATION BY AGE AND ECONOMIC STRATA*
EconomicStrata
Age Male Female TotalGroup top middle bottom top middle bottom male female
0-4 17 15 17 15 15 26 49 55
5-9 15 16 33 18 22 30 64 70
10-14 16 12 25 18 19 28 53 65
15+ 87 90 99 84 96 102 276 282
Total 135 133 174 135 152 186 442 473
* Sample for the time allocation study. This pertains to seven villages only.Figures for the sub-sample population of the eighth village are not available inWashington at present.

- 41 -
Appendix 1
Table 2. COMPARATIVE TIME USE PATTERN FOR MALES AND FEMALES BY AGE GROUP(For 6 Villages, hours per day)
Age Group/SexAbove 15 Years 10 - 14 Years 5 - 9 Years
Activities Male Female Both Male Female Both Male Female Both
Animal Husbandry 1.43 0.97 1.17 2.46 2.44 2.45 1.10 1.17 1.13Agriculture 2.73 2.74 2.72 0.90 1.51 1.25 0.53 0.72 0.63Manufacturing 0.42 0.45 0.44 0.03 0.08 0.06 0.01 0.01 0.01Market Activities 1.24 0.46 0.81 0.25 0.13 0.18 0.13 0.35 0.24
(In-Village)1. Labor Force Participation 5.81 4.62 5.15 3.63 4.17 3.94 1.77 2.25 2.01
Hunting and Gathering 0.17 0.05 0.11 0.08 0.03 0.03 0.02 0.03 0.2Fuel Collection 0.24 0.38 0.32 0.15 0.43 0.31 0.06 0.14 0.10Fetching Water 0.07 0.67 0.40 0.23 0.70 0.50 0.11 0.21 0.16House Construction 0.25 0.08 0.16 0.06 0.02 0.04 0.03 0.03 0.03Food Processing 0.18 0.97 0.62 0.12 0.34 0.24 0.07 0.09 0.08
2. Subsistence Economic 0.91 2.16 1.60 0.64 1.15 1.'14 0.29 0.49 0.40Cooking/Serving 0.27 2.05 1.25 0.15 0.63 T. U 0.03 007 07Cleaning Dishes and Pots 0.03 0.39 0.23 0.03 0.23 0.15 0.01 0.07 0.04Cleaning House/Mud 0.04 0.46 0.27 0.04 0.24 0.15 0.02 0.05 0.04Laundry 0.02 0.15 0.09 0.01 0.06 0.04 0.01 0.03 0.02Shopping 0.24 0.17 0.20 0.06 0.06 0.06 0.02 0.06 0.04Other Domestic 0.04 0.13 0.09 0.05 0.06 0.06 0.03 0.03 0.03Child Care & Rearing 0.16 0.69 0.45 0.22 0.35 0.29 0.15 0.34 0.24
3. Domestic 0.79 4.03 2.57 0.55 1.63 1.18 0.26 0.65 0.46
I. WORK BURDEN (1 + 2 + 3) 7.51 10.81 9.32 4.83 7.31 6.23 2.33 3.39 2.87
4. Education 0.43 0.10 0.25 1.72 0.83 1.22 0.96 0.14 0.545. Personal Maintenance 1.45 1.12 1.27 1.35 1.33 1.33 1.40 1.45 1.426. Social Activities 0.31 0.16 0.23 0.12 0.23 0.19 0.10 0.10 0.107. Leisure 6.30 3.81 4.93 7.98 6.30 7.03 11.21 10.92 11.07
II. Total IN-VILLAGE ACTIVITIES 16.00 16.00 16.00 16.00 16.00 16.00 16.00 16.00 16.00
Source: Acharya and Bennett, 1981.
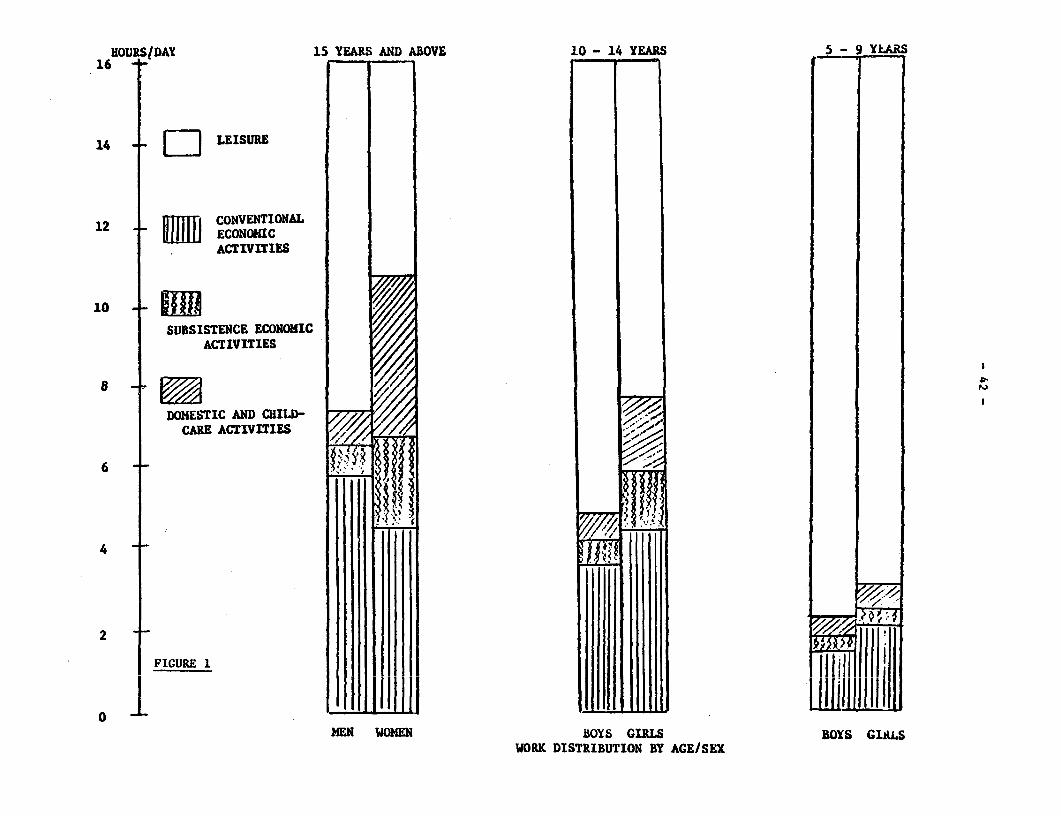
HOURS DAY 15 YEARS AND ABOVE 10 - 14 YEARS 5 - 9 YLARS16
14 -_ ] LEISURE
12 ItTIhCONVENTIONAL12UJ] ECONONICACTIVITIES
10 /SUBSISTENCE ECONONIC
ACTIVITIES
DOMESTIC AND CHILD- 7CARE ACTIVITIES |
FIGURE:I I *
HEN WONEN BOYS GIRLS BOYS GIALSWORK DISTRIBUTION BY AGE/SEX
- 43 -
Women on the average devote 4.62 hours a day to conventional
economic work, while men spend 5.81 hours daily on these activities. The
conventional census practice of classifying a majority of women as economi-
cally inactive while classifying men as active, therefore, has no empirical
foundation. If subsistence economic activities are included in the definition
of economic activity, women spend roughly the same amount of time (6.78 hours)
in sustaining the household as men (6.72 hours).
Women are involved in all types of conventional economic activities:
they are engaged to a greater degree in agriculture and manufacturing and
to a lesser degree in animal husbandry and outside income earning activities.
Economic need and suitable opportunities appear to play an important role in
drawing women to market activities within the village. Women become involved
in market activities even in those communities where women's seclusion is
idealized. Only when market participation involves overnight stays away from
home do cultural patterns start to have a noticeable effect. Thus, the two
villages with the greatest participation of women in market activities within
the village displayed markedly different cultural characteristics: one was
strongly influenced by Hindu concerns with sexual purity and the ideal of
female seclusion (Bakundol), and the other, a Tibetan-speaking Buddhist
community, exhibited minimum concern for female purity (Baragaun). Among
the villages in our sample, both Bakundol and Baragaun had the best employ-
ment opportunities for women. Bakundol is near Kathmandu, the capital, and
Baragaun is on an important tourist route. When employment outside the
village is considered, however, only the women from Tibeto-Burman group
(Baragaun, Thabang and Katarche) showed a significant level of short-term
migration for employment (Table 3).
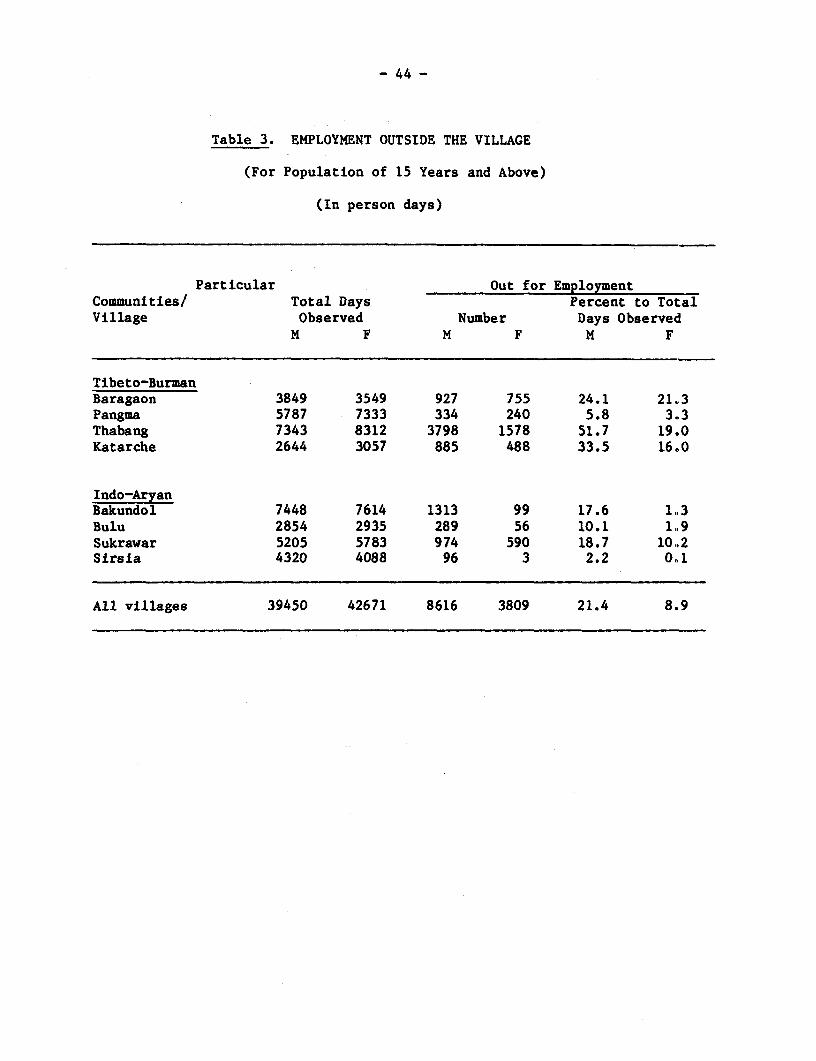
- 44 -
Table 3. EMPLOYMENT OUTSIDE THE VILLAGE
(For Population of 15 Years and Above)
(In person days)
Particular Out for EmploymentCommunities/ Total Days Percent to TotalVillage Observed Number Days Observecd
M F M F M F
Tibeto-BurmanBaragaon 3849 3549 927 755 24.1 21.3Pangma 5787 7333 334 240 5.8 3.3Thabang 7343 8312 3798 1578 51.7 19.,0Katarche 2644 3057 885 488 33.5 16.0
Indo-AryanBakundol 7448 7614 1313 99 17.6 1.,3Bulu 2854 2935 289 56 10.1 1.,9Sukrawar 5205 5783 974 590 18.7 10,2Sirsia 4320 4088 96 3 2.2 0.1
All villages 39450 42671 8616 3809 21.4 8.9
- 45 -
Women in most villages are engaged in trading and keeping of food
and tea stalls. Bulk trading and visits to far-away markets are mostly
undertaken by men. Cottage industry products, either for sale or domestic
use, are produced jointly by men and women, each sex specializing in certain
processes.
As elsewhere in the world, the major part of domestic work is
women's responsibility: women spend 4.03 hours per day on domestic activi-
ties, including child care, compared to only 47 minutes (0.72 hours) spent by
men. Child care takes about 41 minutes of a woman's time per day. A division
of labor between male and female for domestic work is distinct in the Indo-
Aryan group of the villages (Bakundol and Sirsia). Men in these villages seem
to specialize in shopping, while in the Tibeto-Burman group (Baragaun and
Thabang) no such specialization is apparent (Acharya and Bennett, 1981).
From aggregate data, economic strata 1/ does not seem to make much
difference to the work burden of the adult population in the household.
Productivity is very low and all have to work hard. 2/ On the average, men of
all economic strata work about 7 hours per day, while women work about 10
hours daily (Table 4). The work burden for children, however, does indicate
an inverse relationship with the economic status of the family.
1/ National per capita income (US$100) was taken as the yardstick fordefining economic strata. Households earning less than 75% of nationalper capita income were classified as bottom strata, those earning 75-125%of national per capita income were considered as middle economic strata,and households earning over 125% of national per capita income were putin the top strata.
2/ This might be a result of either too low productivity of Nepaleseagriculture, so that even in relatively better off households all membershave to work very hard for subsistence, or a conservative definition oftop economic strata. We are exploring this question further.
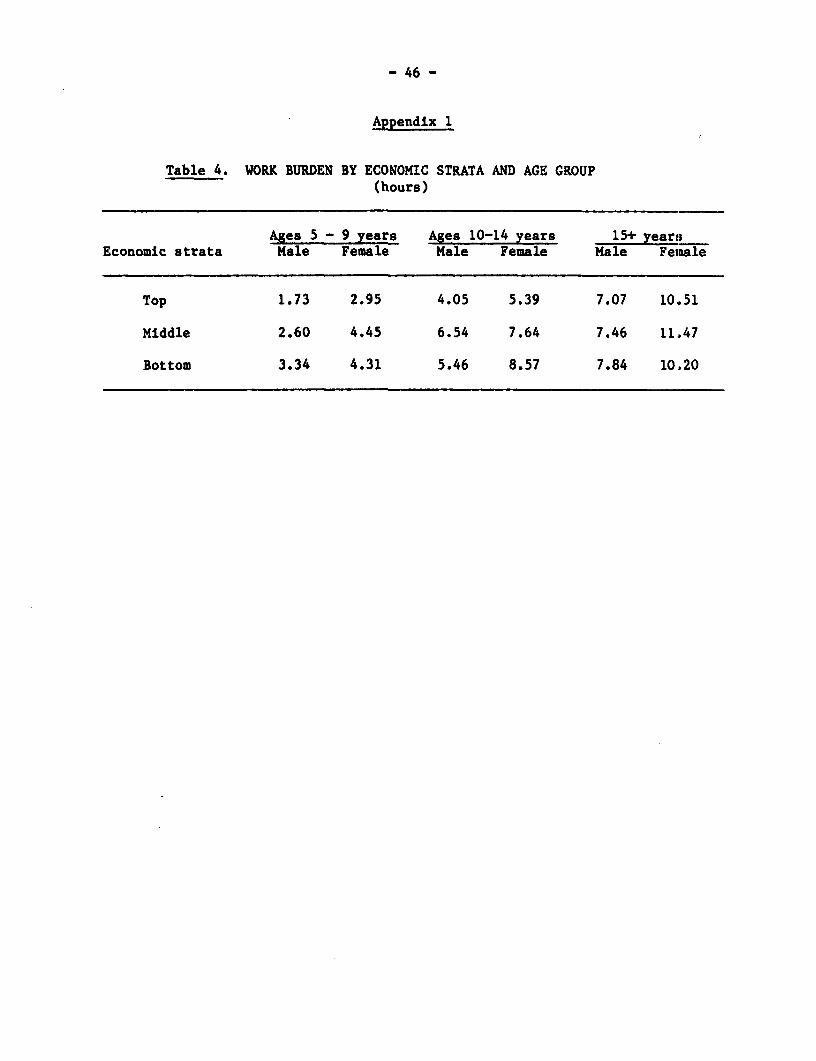
- 46 -
Appendix 1
Table 4. WORK BURDEN BY ECONOMIC STRATA AND AGE GROUP(hours)
Ages 5 - 9 years Ages 10-14 years 15+ yearsEconomic strata Male Female Male Female Male Female
Top 1.73 2.95 4.05 5.39 7.07 10.51
Middle 2.60 4.45 6.54 7.64 7.46 11.47
Bottom 3.34 4.31 5.46 8.57 7.84 10.20
- 47 -
Female children in the 10-14 age group spend a greater proportion of
work time on conventional economic activities than adult women. They also
spend more time (4.17 hours) on conventional economic activities than male
children in the same age group (3.63 hours). The same is true for subsistence
economic activities and domestic activities. Animal husbandry and agriculture
seem to be the major fields of activity for both girls and boys. Girls spend
more time on water supply, fuel collection and food processing than do boys.
Children in the 5-9 age group spend the largest proportion of their time on
animal husbandry and agriculture. Compared to their total time input in
economic and subsistence economic activities, they spend less time on domestic
work. Thus, their contribution to household production is more direct than
indirect. 1/
Adult men seem to spend more time on personal maintenance than adult
women. Participation in education is lower for females in all age groups.
This corresponds to the fact that women carry a larger daily work burden than
men and have less leisure.
Policy Conclusions and Implications for Development
Surplus Labor and Development Strategy. In recent years, planners
and aid agencies in Nepal have been paying some attention to questions of
integrating women in development. Their plans and programs, however, seem to
emanate from two assumptions, namely: (1) that women are only partly employed;
and (2) that women do little economically productive work.
1/ This conclusion is only tentative because the work moment in our defini-tion is very strict. For example, if a child of 9 is playing with hersister of 5, it is not considered child care.
- 48 -
In light of the time allocation data, both of the above assump-
tions seem to be unfounded. The question is not one of providing more work
for women but of making their work more productive The assumption that a
pool of unemployed labor exists in the rural areas needs to be reexamined
from several points of view. First, is there extra time available for new
employment opportunities, given the constant level of technology and organi-
zation of production? Average working hours for adults is 9.32 hours per day.
Given a more egalitarian distribution of work within the household, theret
seems to be no scope for asking people to work harder. Second, the workload
is divided very unequally between the sexes and people of different economic
strata. Workload also depends upon the season, more so for men than for
women. A concentration of work at certain times of the day is also observed.
Irrespective of economic strata, women's workload remains very high. Only
the nature of the work differs: women from wealthier households devote
relatively more time to in-household activities while women from poorer
families participate to a greater extent in outside employment.
Before deciding upon the choice of development strategy, these
questions need to be considered carefully. Technologies conducive to more
even distribution of workload throughout the year and leading to a reduction
of the work burden of women seem more appropriate than those technologies
which increase the workload at the peak seasons of the year.
It should be noted that, although the marginal productivity in
the subsistence sector is very low, it is not zero. Some earlier case
studies presented statistical evidence that the marginal productivity of
- 49 -
labor is above zero in the areas studied. 1/ The current study shows that
people prefer to devote a large part of their time to household production,
even though in some cases outside employment opportunities are available in
nearby cities. Many of the outside employment programs offered are not
productive enough to compensate for the production foregone by not working
at home. Therefore, new employment programs must be more productive than
household subsistence work and provide more income than the corresponding
income foregone at home.
Women seem to be more than occupied, and it is necessary to
introduce innovative labor-saving technology for household production so
that these women can participate in more productive income generating
activities and other development programs.
Fertility and Work. Comparison of time allocation and fertility
data showed no relationship between women's participation in economically
productive work and fertility decisions. Women in all comunities work very
hard and participate in all kinds of activities to a certain degree. But only
in those villages where they have alternative role models and channels of
power (Baragaun and Thabang) do women have lower fertility rates. Fertility
behavior seems to have been affected via two intermediate variables: age at
marriage and proportion of never-married women who remain single throughout
their lives. It was only in Baragaun, Thabang and Katarche, villages with
1/ See M. Acharya, "Surplus Labour in Nepalese Agriculture", The Journalof Development and Administrative Studies (Kathmandu), vol. 5, no. 2(Jan. 1979) and S. R. Sharma, "Technical Efficiency in TraditionalAgriculture," M. S. Thesis, Australian National University, n.d.
- 50 -
alternative role models for women, that we found unmarried women above 25
years of age. Moreover, the percentages of never-married women in the
population of 26 and above was quite significant for Barabaun (14.3 percent)
and Thabang (10.2 percent).
Education and Training. It is evident from the time allocation
data that children from poorer families, particularly those in the 10-14 age
group, work as many hours in combined conventional economic and subsistence
activities as adults. 1/ It seems futile to expect that families at low
levels of income would be willing to forego the earnings of children and
support their children far beyond the minimum necessary age. They have
no economic capacity to do so. Girls in the 10-14 age group are made to
work much harder than boys in most communities and, therefore, have even
less of a chance to go to school. Throughout Nepal, patrilocal residence
and patrilineal inheritance patterns with consequent transfer of girls to
their husbands' households, further reduce the likelihood of girls parents
making much investment in their education.
Some fundamental rethinking is needed as to how to draw rural girls
into schools in Nepal. It is necessary to study the work schedules of these
children and devise special educational programs for them that may be dif--
ferent for boys and girls. We saw from the time allocation data that for
these children working life starts very early. To take them away from their
work for educational purposes is counter-productive. It is hard to convince
the poor of the need for this kind of education. In one of the villages
1/ Centre for Economic Development and Administration, Status of Women Project(Tribhuban University, Khatmandu), unpublished data.
- 51 -
covered in our study (Bulu), parents take their five to nine year old children
to work in order to teach them the skills they practice. Sending them instead
to the formal school system would only aggravate the problem of educated
unemployment, since education is looked upon as a stepping stone for getting
out of manual work. These children should be taught reading and writing in
special schools that operate during off-work times, 2 or 3 hours a day. On
the completion of such a program, the brighter ones may be drawn into a voca-
tional school with architecture or engineering careers ultimately open to
them.
Since the number of rural women with primary or higher education
is very small and mostly concentrated in the higher economic strata, the
educational requirements demanded of the applicants for different kinds of
training should be waived. Training women might also mean teaching them
functional literacy or providing training by using only visual aids.
It is evident from their work pattern that women should be
given training in agricultural extension, fuel conservation, health and
nutrition, family planning, etc. These women, however, do not have the time
or flexibility to leave their households for an extended period. This kind
of training, therefore, must be moved to the villages.
Data on time use and the pattern of household production in the
villages forms the basis of our analysis. The rural picture presented
above is startlingly different from that which is usually assumed on the
basis of conventional statistics and perceptions. The real situation calls
for a radically different set of policies and programs than that which is
usually prescribed.
- 52 -
APPENDIX 2
Examples of Time-Use Survey Instruments
Sample forms used or proposed for five different time-use surveys
are presented in this appendix. Notes and intstructions are attached to the
respective forms.

- 53 -
Apend±z 2
Form A - Nepal, Status of Women in Nepal
Daila Ac!ivtY
VLlAgo. Naah@ld la. Month Date amuz
YIt7 ?"Person Cod"Cod 01 C 02 03 04 05 06 07 018 09
Cade Des_ XTt _l
01010---------
0102:Fora_tofhciii le ii i===- iIH -=
7LL II 111.11_= = l Yw +=2l
=- I -- I I <
S - -
,/ or* o t at<tts *sAc z 3et, 98
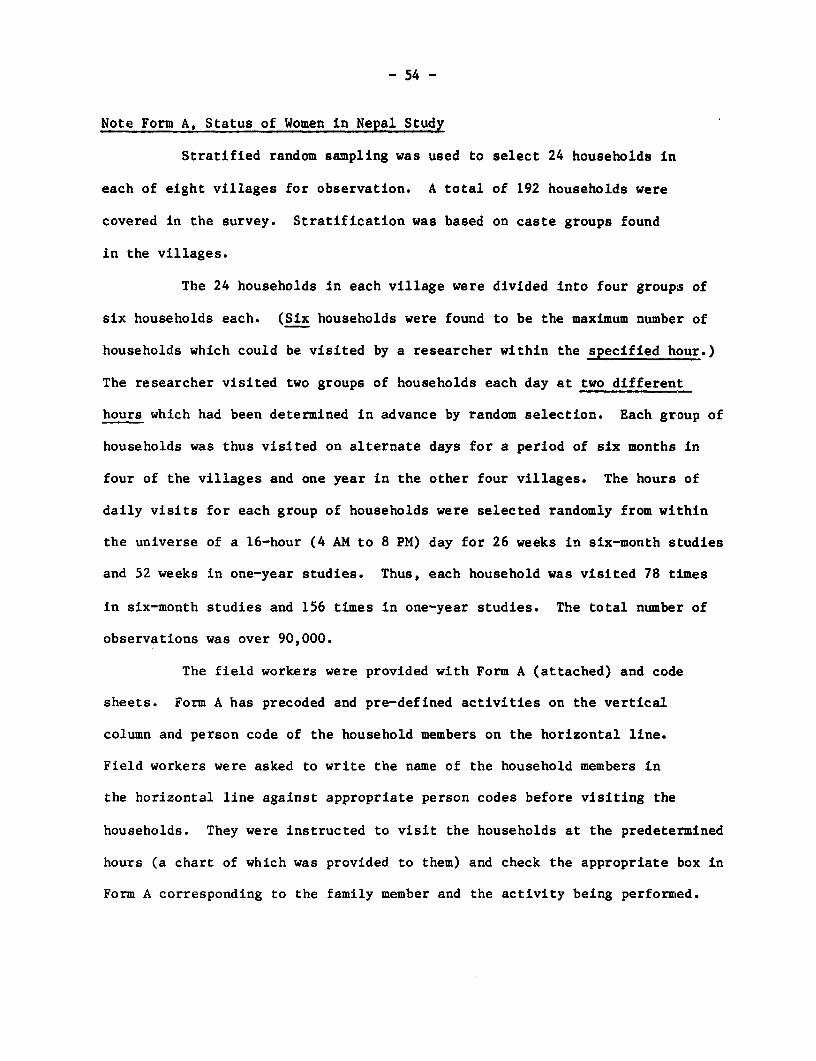
- 54 -
Note Form A, Status of Women in Nepal Study
Stratified random sampling was used to select 24 households in
each of eight villages for observation. A total of 192 households were
covered in the survey. Stratification was based on caste groups found
in the villages.
The 24 households in each village were divided into four groups of
six households each. (Six households were found to be the maximum number of
households which could be visited by a researcher within the specified hour.)
The researcher visited two groups of households each day at two different
hours which had been determined in advance by random selection. Each group of
households was thus visited on alternate days for a period of six months in
four of the villages and one year in the other four villages. The hours of
daily visits for each group of households were selected randomly from within
the universe of a 16-hour (4 AM to 8 PM) day for 26 weeks in six-month studies
and 52 weeks in one-year studies. Thus, each household was visited 78 times
in six-month studies and 156 times in one-year studies. The total number of
observations was over 90,000.
The field workers were provided with Form A (attached) and code
sheets. Form A has precoded and pre-defined activities on the vertical
column and person code of the household members on the horizontal line.
Field workers were asked to write the name of the household members in
the horizontal line against appropriate person codes before visiting the
households. They were instructed to visit the households at the predetermined
hours (a chart of which was provided to them) and check the appropriate box in
Form A corresponding to the family member and the activity being perforated.
- 55 -
Concurrent activities were recorded as two separate activities. Since
the activities were "moment-recorded", very few cases of joint activities
were encountered in this method. Field workers were also required to
complete the code sheet on the same day of the observation.
The data collected by this method represent frequency of activity
observations within the time horizon used. This was taken as frequency
of time distribution and the resulting time allocation data derived.
There is an implicit assumption in this jump that if people devote generally
more time to activity A than to activity B, they will be observed more times
performing activity A than B. In other words, it was assumed that if people
spend more time cooking than washing their hands, we would encounter more
people cooking than washing their hands. This assumption is statistically
valid, provided the group of households being visited within the hour are
more or less homogeneous in their major activity patterns. Since the
settlements studied were fairly small and each settlement represented only
one cultural group, the assumption of homogeneity is close to reality.
Data collected by this method would tend to represent more accurately
the density of working and non-working time than those collected by
longitudinal recall.
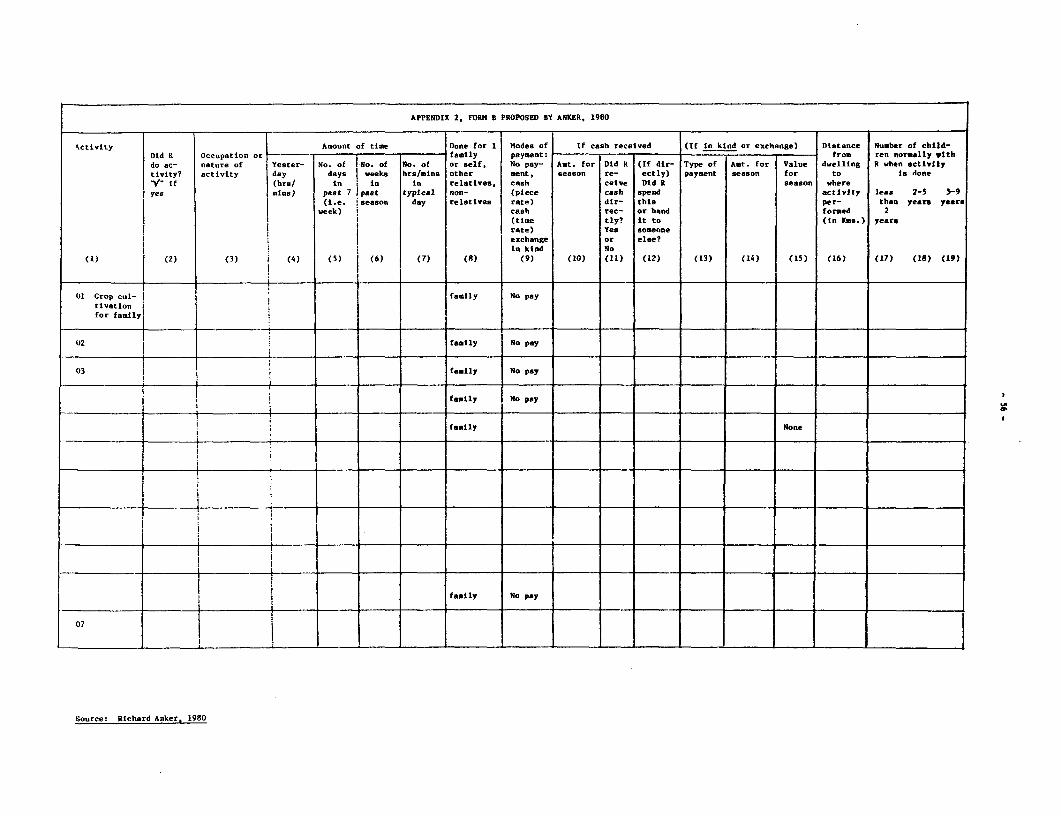
APPENDIX 2, FORM B PROPOSED BY ANKER, 1980
*Xctivity Amount of time Done for 1 Modes of If cash received (If in kind or exchange) Distance Number of child-
Did R Occupation or family payment _ _ _ _ - from ren normally wlth
do ac- nature of Yester- No. of I-No. of No. of or self, No pay- Amt. for Did R (If dir- Type of Amt for Value dwelling R when activitytivity? activity day days weeks brs/mins other ment, season re- ectly) payment season for to Is done
V" if (hrs/ in I in in relatives, cash ceive Did R season where
yea mine) past 7 l past typical non- (piece cash spend activity less 2-5 5-9
(i.e. i season day relatives rate) dir- this per- than years yearsweek) cash rec- or hand formed 2
I ~~~~~~~~~(time tly' it to (In Bum.) yearsrate) Yes someone
i I l eiexchange or else?in kind No
(1) (2) (3) (4) (5) (6) (7) (8) (9) (10) (11) (12) (13) (14) (15) (16) (17) (18) (19)
01 Crop cul- i faily No pay
tivetion ifor family|
02 family No pay
03 . family No pay
family No payg ~ ~ ~ i- i___ .___ _ __ __ ___ ___0
family None
_ _ _ _ ! !_ __ .__ __ _ __family No pay
Source: Richard Anker, 1980

Appendix 2. Form C Malaysian Family Life Survey* (SRM 9338) Page 1
Survey Research Malaysia Sdn. Bhd., OFFICE USE Round E (os)SaN House, Jalan Terap,P.O. 50x 2231, Kuala Lumpur. QNo. 1 u51 (02)
Summary Card Eil (03)4ain Respondent s Other Respondentss CASE NO. I Ii|lii1 (04-C7)
Address: SKIPi (08- il)
P.S.U. No. /EiJ/LE I ]/ l (12-17)
Primary Respondent No. EiT-= '1 (18-20)
Interviewer's Names Numbers Supplementary E - j (24-26)
witnessed By: Numbers Intervitwor's No. |I|E| (27-28)
VIltnera (Supervisor'. No.) |iI |iii(29-30)'Call Record: Date Day Time Started Time Ended SKIP (29-30)
First SKIP (~~~~~~~~~~~~~~~~~~~~~~~~~~~~~~C31-33)Second: Interview Completed at Call No. F1 ( 34)'
Third : Date Completed IiII|/|'I (35-40)
Fourth: ________ Total Length of Interview EF |i |I |(41-43)
Fifth s _ (minutes) Ln
Language of Interview |4 | 44-4S)
Language: Malay 01 Mandarin 06
Tamil 02 Hakke 07
English 03 llainanese 08
Cantonese 04 Teocew 09
Hokkien 05 Other (SPECIFY)
10
"I hereby certify that this interview hes been conducted honestly and to the bestof mly ability.'
Date . ... Interviewer'* signatures .......
* Page 4 is only for women.
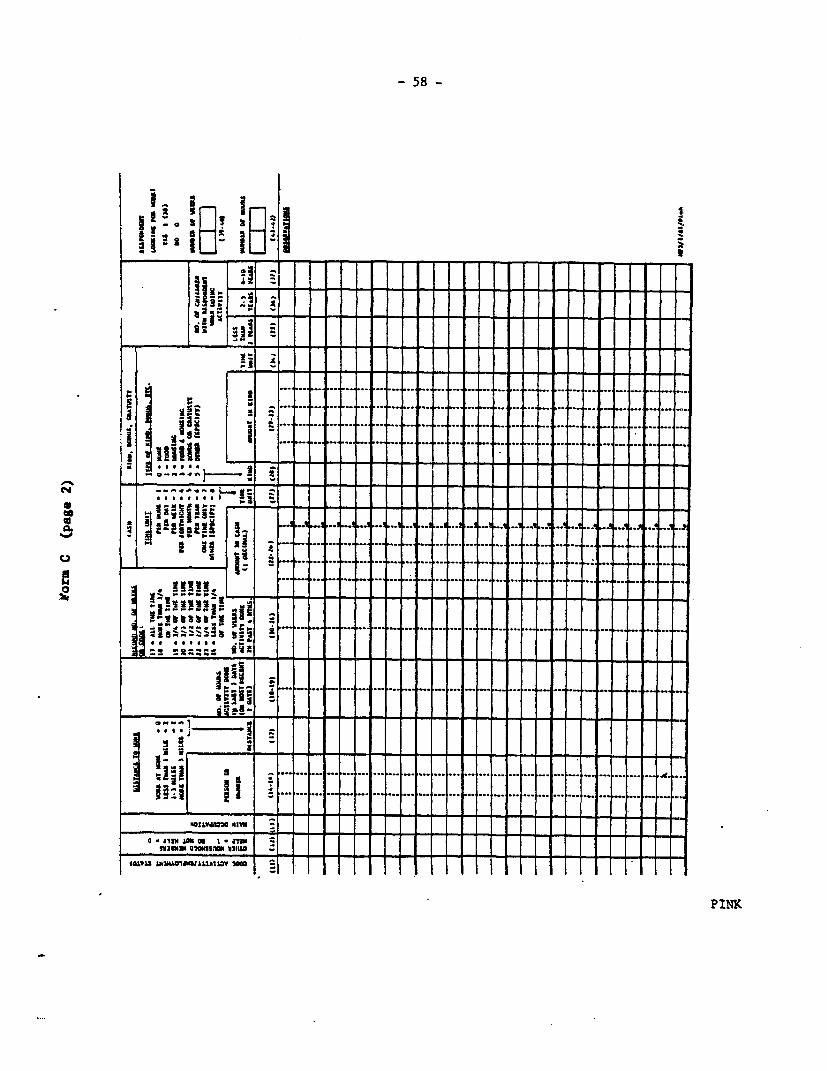
- 58 -
_ I ___ * * e X i_* L:l ^ _ _ _ _ _ _ _- _.I _ J _ J
iii . -. .. - . X-......
]~ ~ ~~~I ......... ._ . ........... . .._....t ... .... .. ........ .._... _. - __..
-- 'l,-g,2 1.- .... i= . ........
]......................j - - ... .- . .. .. .. .. .. .... .. ..... ..
a ~~..,,..-,.~~..--. ,..-... . . . . .................. .....
a .*>z IlN.^.a JOW _ _ _ _ _ X T ¶ 2 _ _ _ _
PIN1K
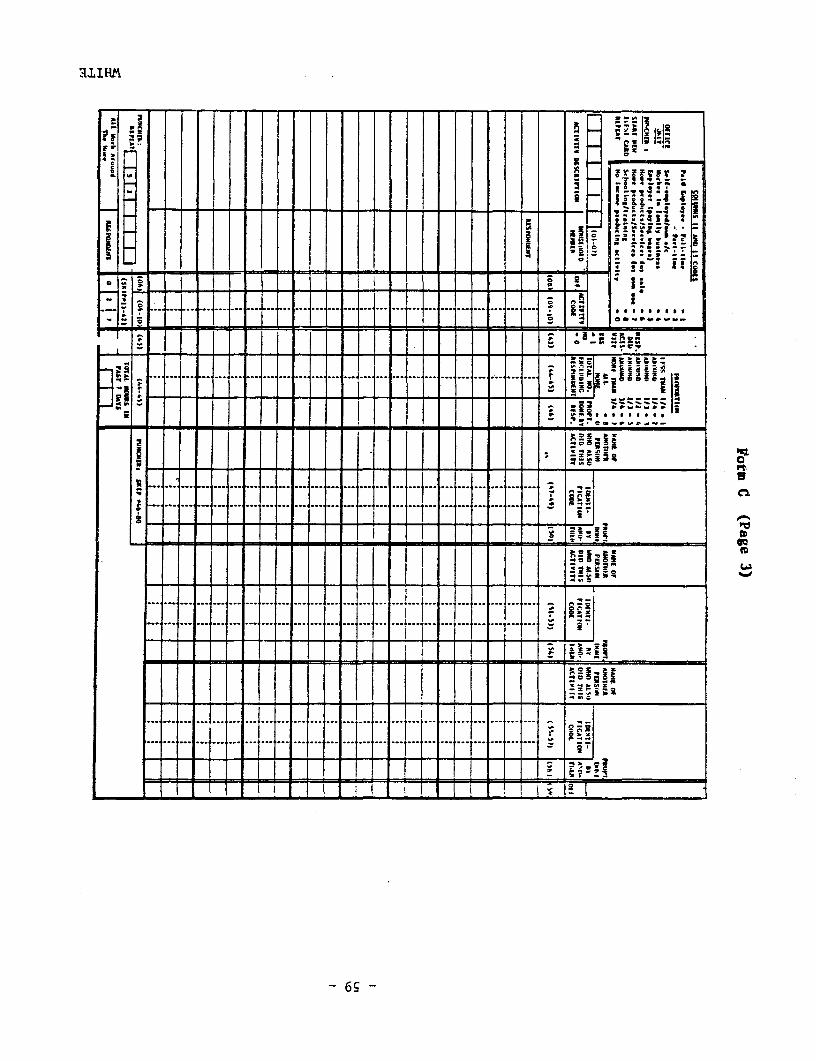
I f .7~~~~~~~~~~ f
tSX X:11 ''41 1--|~~~~~~~~~~~~~~~~~~~~~~~~. ... <0 .-.- 3. ...
_ v- _i. I1 _____l____
- Z > r …-........ - - - - iI
_A = L M II
t~~~~~~~~~~~. .. .. ... .. .. 2.
_i 1_ as 5*5 I 1, ! i 1 1 IS* 1 - 1 1 - 1. - - oce
. 1 _ 0 X LL S L I I I lyss;B W~~~~~~~~~jI
-- 4. -A --- -… -FI 5-LIt------
... . ... ...'-t' .. ''t' ''t''t' .. 1''- ''i'' '' ........... ... '' t .. .. z°'l.. . .... .
. _4. **a*ISSS, ... . .
i a _ lII I 1 1 1 -0 C*Wefln_
- ... L..4 ... - -'''1''1''' - >- __...... ...
-- I_ - __ _ _i _ Ii __w
- - - - a S - a *a a--- 5 a a a a a
I ,~~~~ ~=
*~~~~~~~6
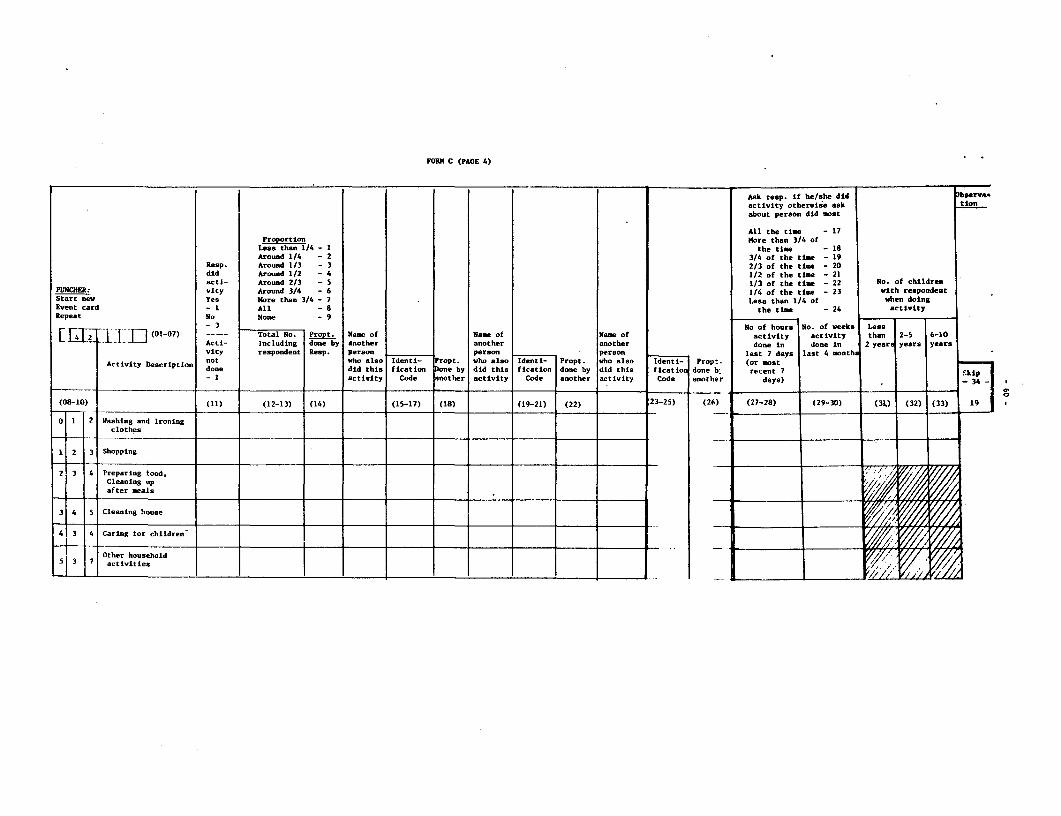
FORK C (PACE 4)
Ask reap. if he/she did Xsrva'activity otherlise ask tioinabout person did mOt
All the tim - 17Proportion More than 3/4 of
Less than 1/4 - 2 the time - 18Around 1/4 -2 3/4 of the time - 19
Resp Around 1/3 - 3 2/3 of the time - 20dtid Around 1/2 - 4 1/2 of the tie - 21acti- Around 2/3 - 5 1/3 of the time - 22 No. of children
PUNCHER: vity Around 3/4 - 6 1/4 of the time - 23 with respondentStart new Yes More than 3/4 - 7 less than 1/4 of when doinEvent card - L All - 8 the time - 24 activityRepeat No None - 9
_ r No of hours No. of weeks LessL 1 41 2 H I0C1 (01-07) Total No. Propt. Name of Name of Name of activity activity than 2-5 6-10
Acti- Including done by snother another another done in done in 2 year years yearsvity respondent Resp. lerson person person last 7 days last 4 month
Activity Description not who also ldenti- Propt. who alsoIdni Propt. who also Identi- Propt. (or mostdone did this ficatin Done by did this fication done by did this fication done b: recent 7 Skip
-I activity Code another activity Code another activity Code another days) -34 -
3_25 _____ .33 _1__.9._
(08-10) (11) (12-13) (14) (15-17) (18) (19-21) (22) 23-25) (26) (27-28) (29-30) (3.) (32) (33) 19
0 1 2 Washing and Ironingclothes
1 2 3 Shopping
2 3 4 Preparing fond.Cleaning upafter meals
3 4 5 Cleaning house
4 3 4 Caring for children
Other household 53 171 7. ..iie
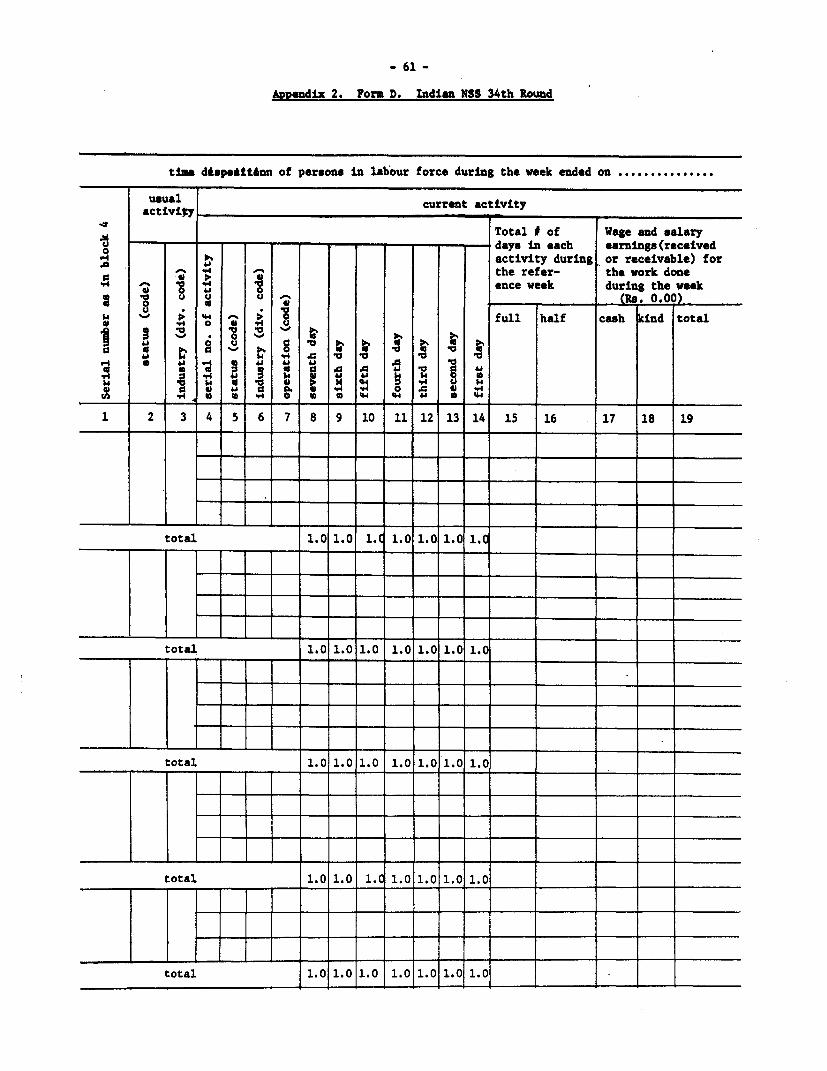
- 61 -
Appendix 2. Form D. Indian NSS 34th Round
time dtlpeitton of persons in labour force during the week ended on .. .
usual current activityactivity _ _ _ _ _ _ _ _ _ _ _ _ _ _ _ _ __ _ _ _ _ __ _ _ _ _ _ _ _ _ _ _
Total t of Wage and salaryYQ - -_ - _ …t - ,days in each earnings(receivedD s > *activity during or receivable) for
-% .Y4 -% ~~~~~~~~the refer- the work done3fi o o Z 8 *ence week during the week
~~ .~~~~ u g ______ ~~~~~~~~~~(R. 0. 0 0
c _ l W U $ i t full half cash dnd total
* v~~~ ~~.4 1 410 .. .00 . AC~~~4 -~~~~% A la l.a la 14
0 ~~.4 41 ~~ 1..la 4
14 ~~~~614 6106 .Mq VA Vr4 UGo 0. 6 4. 0 0. a v r 0 6 .
1 2 3 4 5 6 7 8 9 1 11 12 13 14 15 16 17 18 19
total 1.0 1.0 1. 1.0 1.0 1.0 1.
total 1.0 1.0 1.0 1.0 1.0 1.0 1.0
total 1.0 1.0 1.0 1.0 1.0 1.011.0
total 1.0 1.0 1. 1.0 1.0 1.0 1.0
total 1.0 1.0 1.0 1.0 1.0 1.011.0
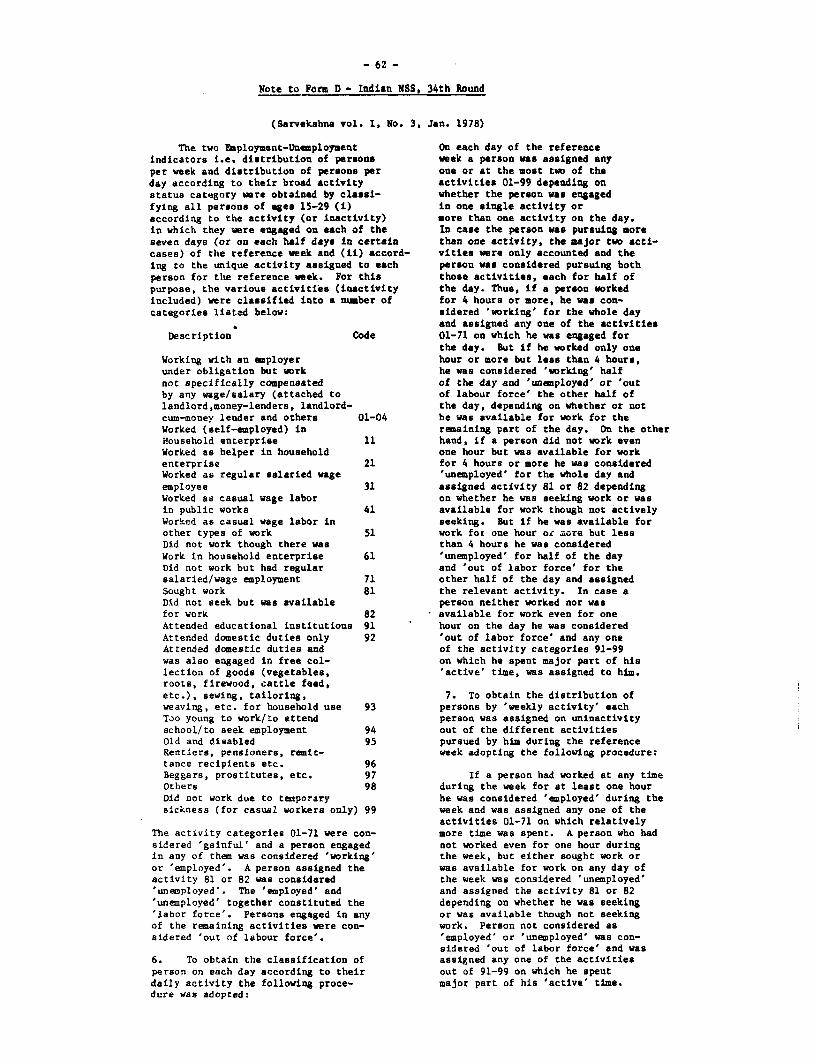
- 62 -
Note to Form D - Indian NSS, 34th Round
(Sarvekshna vol. I, No. 3, Jan. 1978)
The two Employment-Unemployment On each day of the referenceindicators i.e. distribution of persons week a person was assigned anyper week and distribution of persons per one or at the most two of theday according to their broad activity activities 01-99 depending onstatus category were obtained by classi- whether the person wes engagedfying all persons of ages 15-29 (i) in one single activity oraccording to the activity (or inactivity) more than one activity on the day.in which they were engaged on each of the In case the person was pursuing moreseven days (or on each half days in certain than one activity, the major two acti-cases) of the reference week and (ti) accord- vities were only accounted and theing to the unique activity assigned to each person was considered pursuing bothperson for the reference week. For this those activities, each for half ofpurpose, the various activities (inactivity the day. Thus, if a person workedincluded) were classified into a number of for 4 hours or more, he was con-categories listed below: sidered 'working' for the whole day
and assigned any one of the activitiesDeecription Code 01-71 an which he was engaged for
the day. But if he worked only oneWorking with an employer hour or more but less than 4 hours,under obligation but work he was considered 'working' halfnot specifically compensated of the day and 'unemployed' or 'outby any wage/salary (attached to of labour force' the other half oflandlord,money-lenders, landlord- the day, depending on whether or notcum-money lender and others 01-04 he was available for work for theWorked (self-employed) in remaining part of the day. On the otherHousehold enterprise 11 hand, if a person did not work evenWorked as helper in household one hour but was available for workenterprise 21 for 4 hours or more he was consideredWorked as regular salaried wage 'unemployed' for the whole day andemployee 31 assigned activity 81 or 82 dependingWorked as casual wage labor on whether he was seeking work or wasin public works 41 available for work though not activelyWorked as casual wage labor in seeking. But if he was available forother types of work 51 work fox one hour or more but lessDid not work though there was than 4 hours he was consideredWork in household enterprise 61 'unemployed' for half of the dayDid not work but had regular and 'out of labor force' for thesalaried/wage employment 71 other half of the day and assignedSought work 81 the relevant activity. In case aDid not seek but was available person neither worked nor wasfor work 82 available for work even for oneAttended educational institutions 91 hour on the day he was consideredAttended domestic duties only 92 'out of labor force' and any oneAttended domestic duties and of the activity categories 91-99was also engaged in free col- on which he spent major part of hislection of goods (vegetables, 'active' time, was assigned to him.roots, firewood, cattle feed,etc.), sewing, tailoring, 7. To obtain the distribution ofweaving, etc. for household use 93 persons by 'weekly activity' eachTao young to work/to attend person was assigned on uninactivityschool/to aeek employment 94 out of the different activitiesOld and disabled 95 pursued by him during the referenceRentiers, pensioners, remit- week adopting the following procedure:tance recipients etc. 96Beggars, prostitutes, etc. 97 If a person had worked at any timeOthers 98 during the week for at least one hourDid not work due to tenporary he was considered 'employed' during thesickness (for casual workers only) 99 week and was assigned any one of the
activities 01-71 on which relativelyThe activity categories 01-71 were con- more time was spent. A person who hadsidered 'gainful' and a person engaged not worked even for one hour duringin any of them was considered 'working' the week, but either sought work oror 'employed'. A person assigned the was available for work on any day ofactivity 81 or 82 was considered the week was considered 'unemployed''unemployed'. The 'employed' and and assigned the activity 81 or 82'unemployed' together constituted the depending on whether he was seeking'labor force'. Persons engaged in any or was available though not seekingof the remaining activities were con- work. Person not considered assidered 'out of labour force'. 'employed' or 'unemployed' was con-
sidered 'out of labor force' and was6. To obtain the classification of assigned any one of the activitiesperson on each day according to their out of 91-99 on which he spentdaily activity the following proce- major part of his 'active' time.dure was adopted:
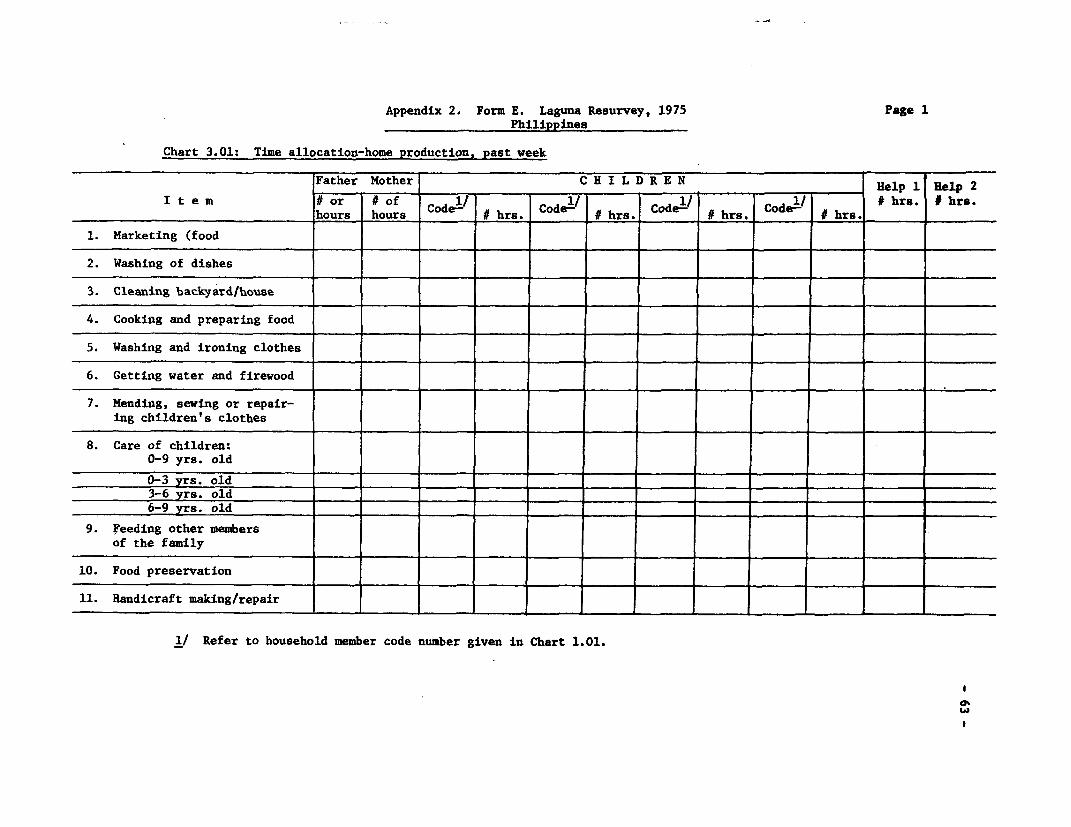
Appendix 2. Form E. Laguna Resurvey, 1975 Page 1Philippines
Chart 3.01: Time allocation-home production, past week
Father Mother C H I L D R E N Help 1 Help 2
I t em ito-r #of 1 / Code1 hr' reI________________ t mhours hours Code b hrs. Code- h rs* Cde_ hrs. Cd # hrs. hrs.
1. Marketing (food
2. Washing of dishes
3. Cleaning backyard/house
4. Cooking and preparing food
5. Washing and ironing clothes
6. Getting water and firewood
7. Mending, sewing or repair-ing children's clothes
8. Care of children:0-9 yrs. old
0-3 yrs. old _3-6 y_rs._old _ _ _ _ _ __ _ _ _ _ _ _ _ _ _
6-9 yrs. old
9. feeding other membersof the family
10. Food preservation
11. Handicraft making/repair
1/ Refer to household member code number given in Chart 1.01.
w
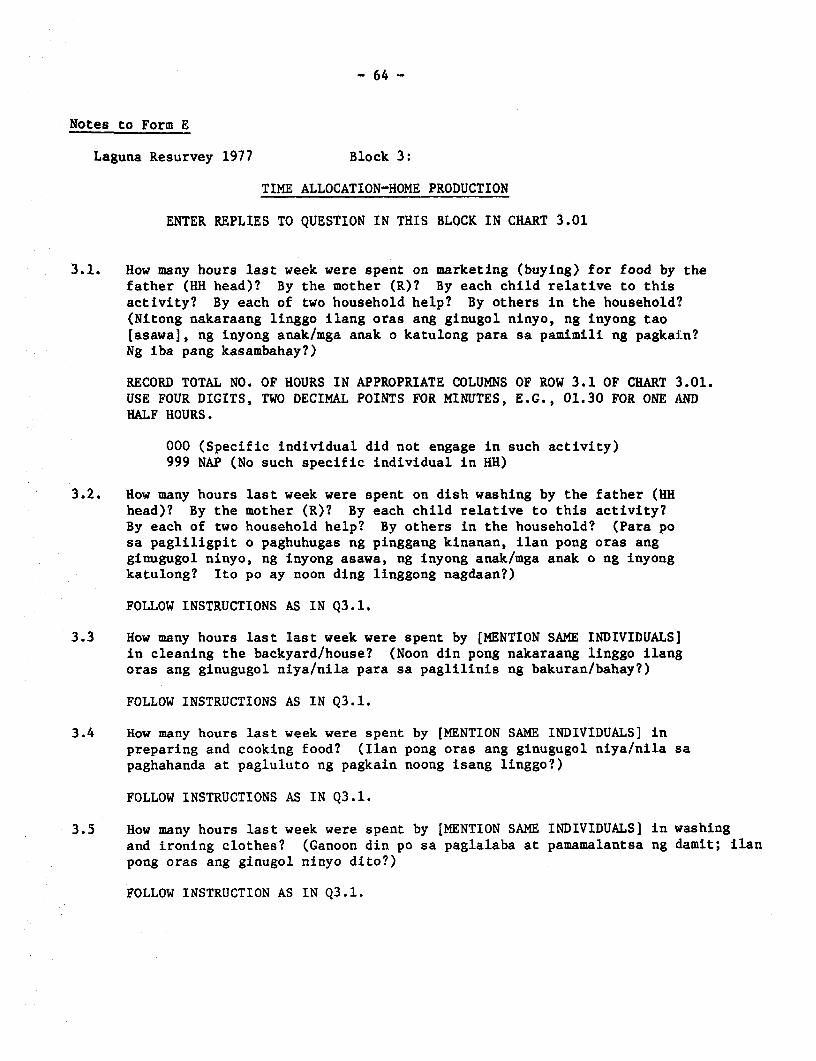
- 64 -
Notes to Form E
Laguna Resurvey 1977 Block 3:
TIME ALLOCATION-HOME PRODUCTION
ENTER REPLIES TO QUESTION IN THIS BLOCK IN CHART 3.01
3.1. How many hours last week were spent on marketing (buying) for food by thefather (HH head)? By the mother (R)? By each child relative to thisactivity? By each of two household help? By others in the household?(Nitong nakaraang linggo ilang oras ang ginugol ninyo, ng inyong tao[asawa], ng inyong anak/mga anak o katulong para sa pamimili ng pagkaiLn?Ng iba pang kasambahay?)
RECORD TOTAL NO. OF HOURS IN APPROPRIATE COLUMNS OF ROW 3.1 OF CHART 3.01.USE FOUR DIGITS, TWO DECIMAL POINTS FOR MINUTES, E.G., 01.30 FOR ONE ANDHALF HOURS.
000 (Specific individual did not engage in such activity)999 NAP (No such specific individual in HH)
3.2. How many hours last week were spent on dish washing by the father (HHhead)? By the mother (R)? By each child relative to this activity?By each of two household help? By others in the household? (Para posa pagliligpit o paghuhugas ng pinggang kinanan, ilan pong oras angginugugol ninyo, ng inyong asawa, ng inyong anak/mga anak o ng inyongkatulong? Ito po ay noon ding linggong nagdaan?)
FOLLOW INSTRUCTIONS AS IN Q3.1.
3.3 How many hours last last week were spent by (MENTION SAME INDIVIDUALS]in cleaning the backyard/house? (Noon din pong nakaraang linggo ilangoras ang ginugugol niya/nila para sa paglilinis ng bakuran/bahay?)
FOLLOW INSTRUCTIONS AS IN Q3.1.
3.4 How many hours last week were spent by [MENTION SAME INDIVIDUALS] inpreparing and cooking food? (Ilan pong oras ang ginugugol niya/nila sapaghahanda at pagluluto ng pagkain noong isang linggo?)
FOLLOW INSTRUCTIONS AS IN Q3.1.
3.5 How many hours last week were spent by [MENTION SAME INDIVIDUALS] in washingand ironing clothes? (Ganoon din po sa paglalaba at pamamalantsa ng damit; ilanpong oras ang ginugol ninyo dito?)
FOLLOW INSTRUCTION AS IN Q3.1.
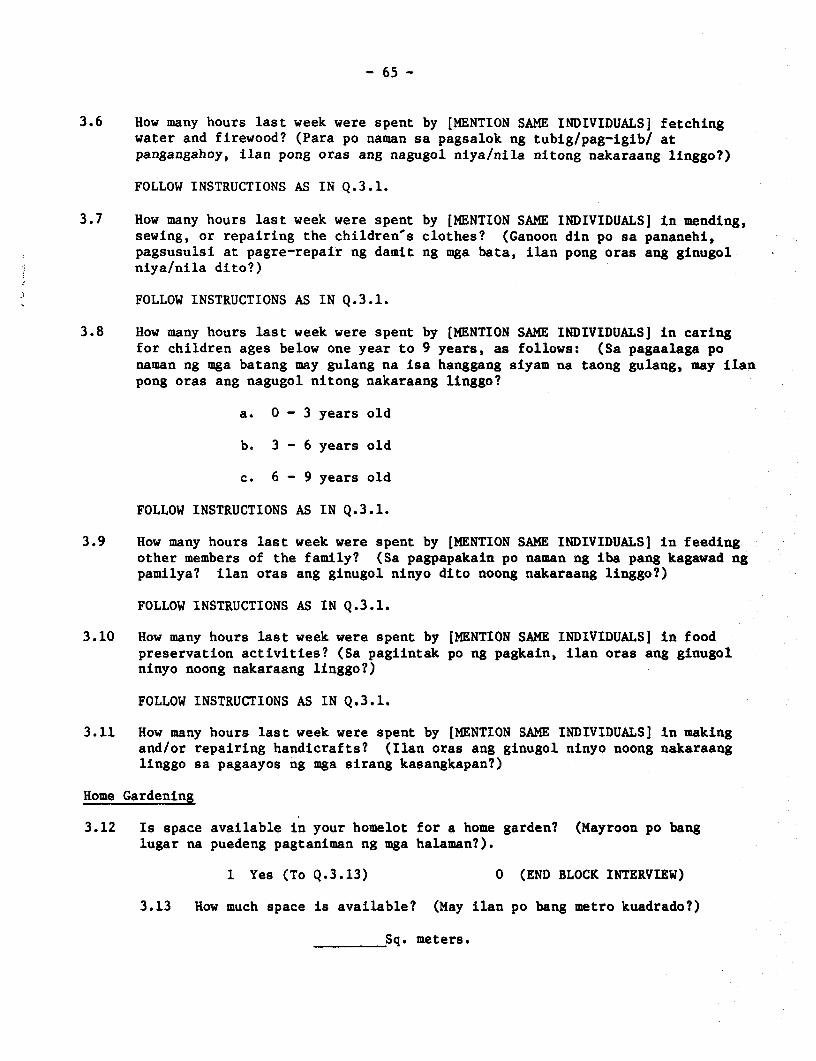
- 65 -
3.6 How many hours last week were spent by [MENTION SAME INDIVIDUALS] fetchingwater and firewood? (Para po naman sa pagsalok ng tubig/pag-igib/ atpangangahoy, ilan pong oras ang nagugol niya/nila nitong nakaraang linggo?)
FOLLOW INSTRUCTIONS AS IN Q.3.1.
3.7 How many hours last week were spent by [MENTION SAME INDIVIDUALS] in mending,sewing, or repairing the children's clothes? (Ganoon din po sa pananehi,pagsusulsi at pagre-repair ng damit ng mga bata, ilan pong oras ang ginugolniya/nila dito?)
FOLLOW INSTRUCTIONS AS IN Q.3.1.
3.8 How many hours last week were spent by [MENTION SAME INDIVIDUALS] in caringfor children ages below one year to 9 years, as follows: (Sa pagaalaga ponaman ng mga batang may gulang na isa hanggang siyam na taong gulang, may ilanpong oras ang nagugol nitong nakaraang linggo?
a. 0 - 3 years old
b. 3 - 6 years old
c. 6 - 9 years old
FOLLOW INSTRUCTIONS AS IN Q.3.1.
3.9 How many hours last week were spent by [MENTION SAME INDIVIDUALS] in feedingother members of the family? (Sa pagpapakain po naman ng iba pang kagawad ngpamilya? ilan oras ang ginugol ninyo dito noong nakaraang linggo?)
FOLLOW INSTRUCTIONS AS IN Q.3.1.
3.10 How many hours last week were spent by [MENTION SAME INDIVIDUALS] in foodpreservation activities? (Sa pagiintak po ng pagkain, ilan oras ang ginugolninyo noong nakaraang linggo?)
FOLLOW INSTRUCTIONS AS IN Q.3.1.
3.11 How many hours last week were spent by [MENTION SAME INDIVIDUALS] in makingand/or repairing handicrafts? (Ilan oras ang ginugol ninyo noong nakaraanglinggo sa pagaayos ng mga sirang kasangkapan?)
Home Gardening
3.12 Is space available in your homelot for a home garden? (Mayroon po banglugar na puedeng pagtaniman ng mga halaman?).
1 Yes (To Q.3.13) 0 (END BLOCK INTERVIEW)
3.13 How much space is available? (May ilan po bang metro kuadrado?)
________Sq. meters.

- 66 -
3.14 During the past 12 months, did you or any member of the householdengage in home gardening? (Sa loob po ng 12 buwan, mayroon po besa inyo na nagtrabaho sa paghahalaman?)
1 Yes (To Q.3.15) 0 No (END BLOCK INTERVIEW)
RECORD REPLIES TO Q.3.15 - 3.18 IN CHART 3.01 BELOW:
3.15 Which members of your household worked in the home garden inthe past 12 months? (Sino po sa kanila ang nagtrabaho nitongnakaraan, 12 buwan?)
3.16 How many hours did [EACH HH MEMBER WHO WORKED] work in the gardenper week last month? (Ilan oras po sa loob ng isang linggo siyanagtrabaho nitong nakaraang buwan?)
3.17 How many weeks did [EACH HH MEMBER WHO WORKED] work in the gardenlast month? (Ilan pong linggo?)
3.18 How many months did [EACH HH MEMBER WHO WORKED] work in thegarden in the past 12 months? (Ilan pong buwan?)
Chart 3.01. Family labor in home garden - past 12 months
3.15 3.16 3.17 3.18HH member # hrs./week # week # monthsand code no. last month last month last year
RECORD REPLIES TO Q.3.19 - 3.20. IN CHART 3.02.
3.19 Are vegetables grown in your home garden? Fruits? Tubers? Legumes? Others(specify) (May tanim po ba kayong mga gulay, prutas -- a kmoteng kahoy, munggoat iba?)
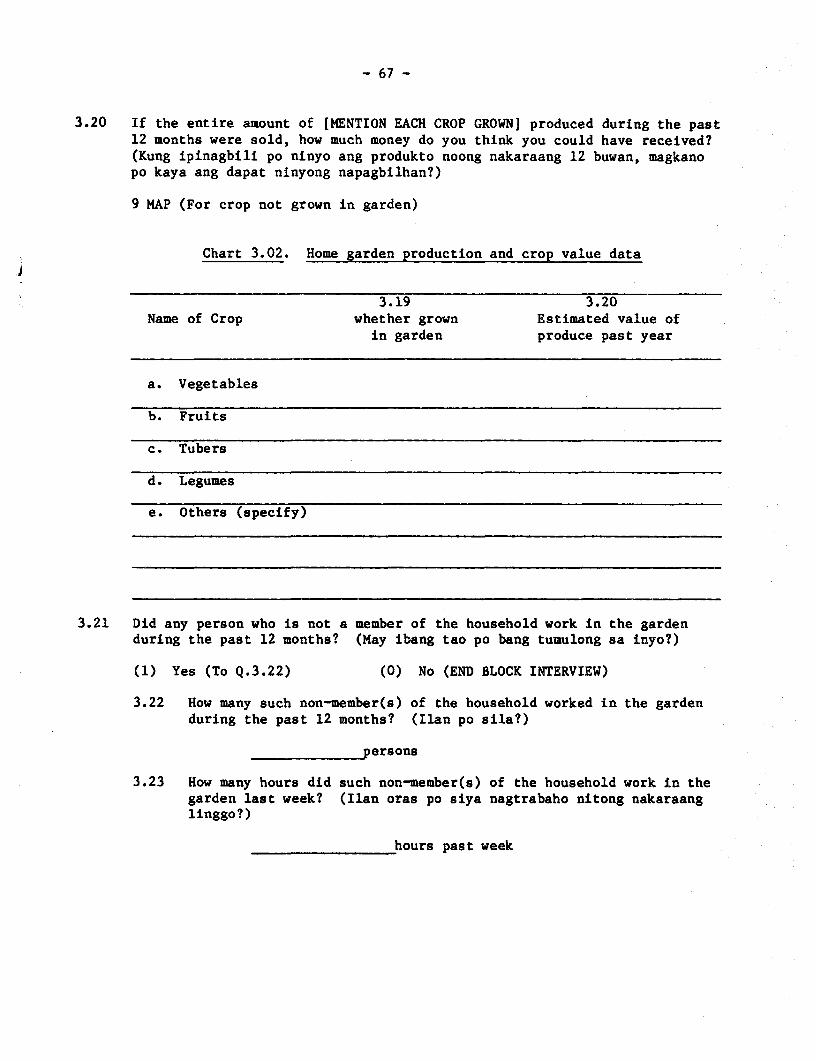
- 67 -
3.20 If the entire amount of [MENTION EACH CROP GROWN] produced during the past12 months were sold, how much money do you think you could have received?(Kung ipinagbili po ninyo ang produkto noong nakaraang 12 buwan, magkanopo kaya ang dapat ninyong napagbilhan?)
9 MAP (For crop not grown in garden)
Chart 3.02. Home garden production and crop value data
j~~~~~~~~~~~~~~~~~~~~~~~~~~~~~~~~~~~~~~~~~~~~~~~~~~~~~~~~~~~
3.19 3.20Name of Crop whether grown Estimated value of
in garden produce past year
a. Vegetables
b. Fruits
c. Tubers
d. Legumes
e. Others (specify)
3.21 Did any person who is not a member of the household work in the gardenduring the past 12 months? (May ibang tao po bang tumulong sa inyo?)
(1) Yes (To Q.3.22) (0) No (END BLOCK INTERVIEW)
3.22 How many such non-member(s) of the household worked in the gardenduring the past 12 months? (Ilan po sila?)
persons
3.23 How many hours did such non-member(s) of the household work in thegarden last week? (Ilan oras po siya nagtrabaho nitong nakaraanglinggo?)
hours past week
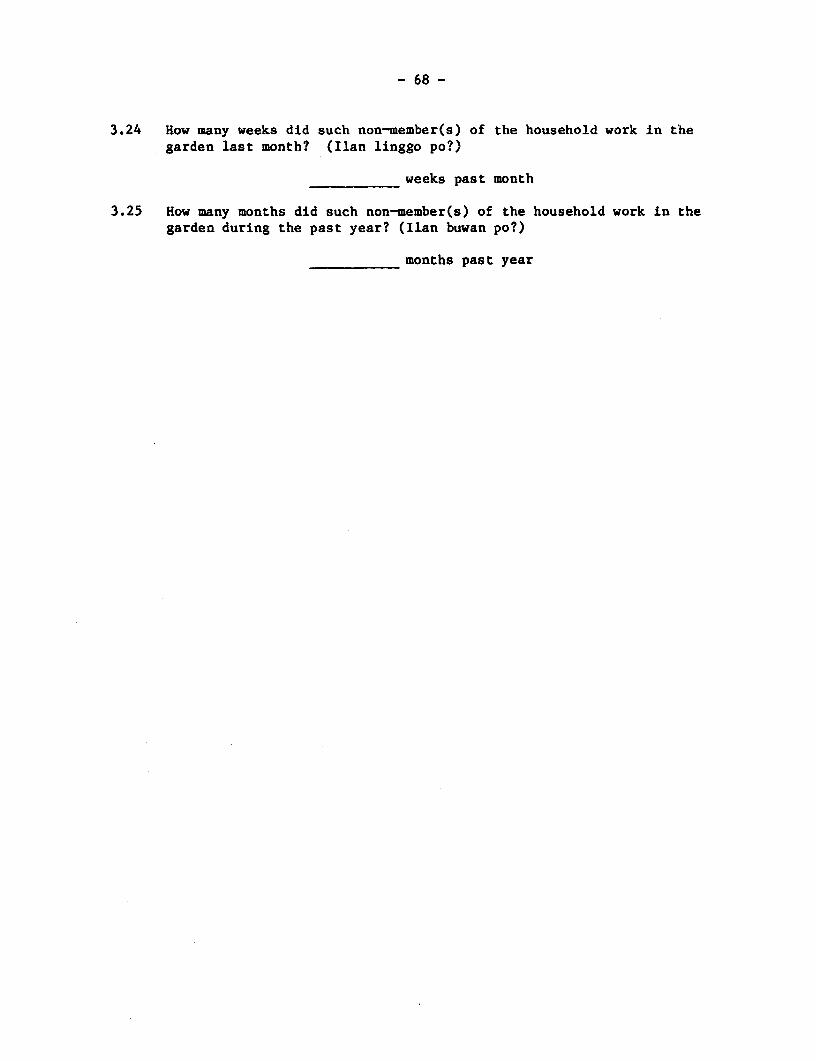
- 68 -
3.24 How many weeks did such non-member(s) of the household work in t'hegarden last month? (Ilan linggo po?)
weeks past month
3.25 How many months did such non-member(s) of the household work in thegarden during the past year? (Ilan buwan po?)
months past year
- 69-
References
Acharya, Meena. Statistical Profile of Nepalese Women: A Critical Review.The Status of Women in Nepal, vol. I, part I. Kathmandu:Tribhuban University, Centre for Economic Development and Administration,1979.
. "Time Use Data from Nepalese Villages (A Preliminary Analysis)."Paper presented at the Anniversary Meeting of the Population Associationof America, Washington, D.C., March 1981.
, and Lynn Bennett. The Rural Women of Nepal: An Aggregate Analysis andSummary of Eight Village Studies. The Status of Women in Nepal,vol. II, part 9. Kathmandu: Tribhuban University, Centre forEconomic Development and Administration, 1981.
Anker, Richard. Research on Women's Roles and Demographic Change: SurveyQuestionnaires for Households, Women, Men and Communities with BackgroundExplanations. Geneva: ILO, 1980.
The Asia Society, Inc. "Time Use Data: Policy Uses and Methods of Collection."Report of an Asian Development Seminar, New York, September 1978.
Banskota, K., and R. E. Evenson. "Fertility, Schooling and Home Technology inRural Philippine Households." The Philippine Economic Journal, vol. XVII,no. 1 and 2 (1978).
Becker, Gary S. "A Theory of the Allocation of Time." The Economic Journal,September 1965.
Birdsall, Nancy. "Measuring Time Use and Non-Market Exchange." In Third WorldPoverty. Edited by Paul W. McGreevey. Lexington, Mass.: D.C. Heath & Company,Lexington Books, 1980.
Boulier, Bryan L. "Evaluation of Time Budget Studies as Complements toConventional Labor Force Surveys." Paper presented at the AnnualMeeting of the Population Association of America, St. Louis, Missouri, 1977.
Cain, M., R. K. Khanam, and S. Nahar. "Clans, Patriarchy and Women's Work inBangladesh." Population and Development Review, vol. 5, no. 3 (1979).
Campbell, J. G., R. Shrestha, and L. Stone. "The Use and Misuse of SocialScience Research Methods in Nepal." Kathmandu: TribhubanUniversity, Center for Nepal and Asian Studies, 1979.
Chander, R., C. Grootaert, and G. Pyatt. "Living Standards Surveys inDeveloping Countries." LSMS Working Paper, no. 1. Washington, D.C.:World Bank, 1980.
Clark, Carol A.M. "Children-s Economic Activities and Primary School Attendance inRural Guatemala." The Rand Corporation Paper Series, P-6603, 1981.
. "Women's Work and Child Nutrition." The Rand Corporation Paper Series,P-6605, 1981.
- 70 -
DaVanzo, Julie, and Lee Donald Lye Poh. "The Compatibility of Child Carewith Labor Force Participation and Non-Market Activities: PreliminaryEvidence from Malaysian Time Budget Data." Forthcoming.
Deaton, Angus. "The Measurement of Welfare: Theory and Practical Guidelines."LSMS Working Paper, no. 7. Washington, D.C.: World Bank, 1980.
, and J. Muellbauer. "Economics and Consumer Behavior." London:Cambridge University Press, 1980.
Engel, Patricia L., and William P. Butz. "Methodological Issues in CollectingTime Use Data in Developing Countries." Paper presented at SRCD Symposium,April 5, 1981.
Erasmus, Charles. "Work Patterns in a Maya Village." American Anthropologist 57,1955.
Evenson, R. E., B. M. Popkin and E. Quizon-King. "Nutrition, Work and DemographicBehavior in Rural Philippine Households: A Synopsis of Several Laguna House-hold Studies." Economic Growth Center Discussion Paper, no. 308, New Haven,Conn.: Yale University, January 1979.
Farouk, A. "Use of Time by Individuals: A Survey in Bangladesh." In RuralHousehold Studies in Asia. Edited by H. P. Binswanger and others.Singapore: Singapore University Press, 1980.
Feldheim, Pierre. "Time Budget Studies and Social Planning." In The Use of Time.Edited by A. Szalai and others. The Hague: Mouten, 1972.
Government of India, Ministry of Planning, Department of Statistics.Sarvekshana, vol. 1, no. 3 (1978).
Gronau, Reuben. "Leisure, Home Production, and Work: The Theory of the Alloca-tion of Time Revisited." Journal of Political Economy, December 1977.
Hart, Gillian. "Pattern of Household Labour Allocation in a Javanese Village."In The Rural Household in Asia. Edited by H. P. Binswanger and others.Singapore: Singapore University Press, 1980.
Jain, Devaki, and Chand Malini. "An Investigation into the Time Allocation ofMen, Women and Children in Selected Rural Households." Paper presentedto the Seminar on Women in the Indian Labour Force, Trivandrum, India,July 24-25, 1980.
Johnson, Allen. "Time Allocation in Machiguenga Community." Ethnology 14,1975.
Krishna, Raj. "Unemployment in India." Agricultural Development CouncilTeaching Forum (New York), no. 38 (March 1974).
Kusnic, M. W., and J. DaVanzo, "Income Inequality and the Definition ofIncome: The Case of Malaysia." Prepared for the U.S. Agency for Inter-national Development (R-2416). Santa Monica, California: The RandCorporation, 1980.
- 71 -
Leipziger, Danny M., ed. Basic Needs and Development. Cambridge, Mass.:Oelgeschlager, Gunn and Hain, Inc., 1981.
Linder, Staffan Burenstam. The Harried Leisure Class New York: ColumbiaUniverslty Press, 1970.
Manz, Gunter. "Progress of Living Standards and Time Budget Analysis."In The Use of Time. Edited by A. Szalai and others. The Hague: Mouten,1972.
McSweeney, B. C., and M. Freedman. "Lack of Time as an Obstacle to Women'sEducation: The Case of Upper Volta." Comparative Education Review,vol. 24, no. 2, part 2 (1980).
Minge-Klevana, Wanda. "Does Labour Time Decrease with Industrialization?A Survey of Time Allocation Studies." Current Anthropology, vol. 21,no. 3 (June 1980).
Mueller, Eva. "Time Use Data." Ann Arbor: University of Michigan,Population Studies Center, September 1978.
. "Time Use in Rural Botswana." Ann Arbor: University of Michigan,Population Studies Center, 1979.
_ with Carol Clark and Sharris Kossondji. "The Design of EmploymentSurveys for Developing Countries." Ann Arbor: University of Michigan,Population Studies Center, September 1978.
Nag, Moni, B. N. F. White, and R. C. Peet. "An Anthropoligcal Approach tothe Study of the Economic Value of Children in Java and Nepal." InRural Household Studies in Asia. Edited by H. P. Binswanger andothers. Singapore: Singapore University Press, 1980.
Patrushev, V. D. "Aggregate Time Balances and Their Meaning for Socio-economic Planning." In The Use of Time. Edited by A. Szalaiand others. The Hague: Mouten, 1972.
The Philippine Economic Society. The Philippine Economic Journal, SpecialIssue on Household Economics, vol. XVII, no. 1 and 2 (1978).
Popkin, Barry M. "Women, Work, and Child Welfare." Paper read at theInternational Center for Research on Women (ICRW) Workshop on Women inPoverty: What do we Know? Elkridge, Maryland, April 30 - May 2, 1978.
Quizon-King, Elizabeth. "The Economics of Time Allocation in Philippine RuralHouseholds." M. A. Thesis. University of the Philippines, 1977.
_ "Time Allocation and Home Production in Rural PhilippineHouseholds." The Philippine Economic Journal, vol. XVII, no. 1 and 2(1978).
- 72 -
Rosenzweig, Mark. "Household Demands and Economic Development: A Frame-work for Empirical Research." Paper presented at the AnniversaryMeeting of the Population Association of America, Washington, D.C.,March 1981.
Scheuch, Erwin K. "The Time Budget Interview." In The Use of Time. Ed:Ltedby A. Szalai and others. The Hague: Mouten, 1972.
Scott, Christopher. "Experiments on Recall Error in African HouseholdBudget Surveys." International Association of Survey Statistics.Vienna, August 1973.
Szalai, Alexander. Introduction to The Use of Time: Daily Activitiesof Urban and Suburban Population in Twelve Countries. Edited byAlexander Szalai and others. The Hague: Mouten, 1972.
United Nations. The Feasibility of Welfare-Oriented Measures to Supplement theNational Accounts and Balances: A Technical Report. New York, 1977.
__ . Methods of Analyzing Census Data on Economic Activities of thePopulation. 1968.
. "Progress Report on the Development of Statistics on TimeUse." Report of the Secretary General. (E/CN 3/519). New York, 1978.
. Towards a System of Social and Demographic Statistics. New York,1975.
, Economic Commission for Africa. "The Data Base for Discussion ofthe Interrelations Between Integration of Women in Development, TheirSituation and Population Factors in Africa." Addis Ababa, 1974.
LSMS Working Papers (continued)
No.43 Profits from Self-Employment: A Case Study of C8te d'lvoire
No.44 The Living Standards Survey and Price Policy Reforn: A Study of Cocoa and Coffee Production inC8te d'Ivoire
No.45 Measuring the Willingness to Pay for Social Services in Developing Countries
No.46 Nonagricultural Family Enterprises in C6te d'lvoire: A Descriptive Analysis
No.47 The Poor during Adjustment: A Case Study of C8te d'Iwire
No.48 Confronting Poverty in Developing Countries: Definitions, Information, and Policies
No.49 Sample Designs for the Living Standards Surveys in Ghana and Mauritania/Plans de sondage pourles enquetes sur le niveau de vie au Ghana et en Mauritanie
No.50 Food Subsidies: A Case Study of Price Reform in Morocco (also in French, 50F)
No.51 Child Anthropometry in C6te d'Ivoire: Estimates from Two Surveys, 1985 and 1986
No.52 Public-Private Sector Wage Comparisons and Moonlighting in Developing Countries: EvidencefromC6te d'Ivoire and Peru
No. 53 Socioeconomic Determinants of Fertility in C6te d'Ivoire
No.54 The Willingness to Pay for Education in Developing Countries: Evidence from Rural Peru
No.55 Rigidite des salaires: Donnees microeconomiques et macroeconomiques sur l'ajustement du marche dutravail dans le secteur moderne (in French only)
No.56 The Poor in Latin America during Adjustment: A Case Study of Peru
No.57 The Substitutability of Public and Private Health Carefor the Treatment of Children in Pakistan
No.58 Identifying the Poor: Is "Headship" a Useful Concept?
No.59 Labor Market Performnance as a Determinant of Migration
No.60 The Relative Effectiveness of Private and Public Schools: Evidence from Two Developing Countries
No.61 Large Sample Distribution of Several Inequality Measures: With Application to C6te d'Ivoire
No.62 Testing for Significance of Poverty Differences: With Application to C8te d'Ivoire
No.63 Poverty and Economic Growth: With Application to C8te d'Ivoire
No.64 Education and Earnings in Peru's Informal Nonfarm Family Enterprises
No.65 Fonnal and Informal Sector Wage Deternination in Urban Low-Income Neighborhoods in Pakistan
No.66 Testing for Labor Market Duality: The Private Wage Sector in Cote d'Ivoire
No.67 Does Education Pay in the Labor Market? The Labor Force Participation, Occupation, and Earningsof Peruvian Women
No.68 The Composition and Distnbution of Income in C6te d'Ivoire
No.69 Price Elasticities from Survey Data: Extensions and Indonesian Results
No.70 Efficient Allocation of Transfers to the Poor: The Problem of Unobserved Household Income
No.71 Investigating the Detenninants of Household Welfare in C6te d'Ivoire
No.72 The Selectivity of Fertility and the Detenninants of Human Capital Investments: Parametric andSemiparametric Estimates
No.73 Shadow Wages and Peasant Family Labor Supply: An Econometric Application to the Peruvian Sierra
No.74 The Action of Human Resources and Poverty on One Another: What We Have Yet to Learn
No.75 The Distribution of Welfare in Ghana, 1987-88
No.76 Schooling, Skills, and the Returns to Government Investment in Education: An Exploration UsingData from Ghana
No.77 Workers' Benefits from Bolivia's Emergency Social Fund

The World Bank
Headquarters European Office Tokyo Office1818 H Street, N.W. 66, avenue d'Iena Kokusai BuildingWashington, D.C. 20433, U.S.A. 75116 Paris, France 1-1 Marunouchi 3-chome
Telephone: (202) 477-1234 Telephone: (1) 723-54.21 Chiyoda-ku, Tokyo 100, JapanTelex: WUI 64145 WORLDBANK Telex: 842-620628 Telephone: (03) 214-5001
RCA 248423 WORLDBK Telex: 781-26838Cable Address: INTBAFRAD
WASHINGTONDC