Time delay correction of the synchrogram for optimized detection of cardiorespiratory coordination
11
ORIGINAL ARTICLE Time delay correction of the synchrogram for optimized detection of cardiorespiratory coordination Muammar M. Kabir • David A. Saint • Eugene Nalivaiko • Derek Abbott • Mathias Baumert Received: 4 March 2011 / Accepted: 2 July 2011 / Published online: 10 August 2011 Ó International Federation for Medical and Biological Engineering 2011 Abstract The cardiorespiratory synchrogram, a graphical tool based on the stroboscopic technique, is an established method for evaluating phase-locking between cardiac and respiratory oscillators. In the original method, the phase of the respiratory oscillator is observed at the instants of time when the phase of the cardiac oscillator attains a certain value. In this article, we introduced an additional adaptive delay in the cardiac oscillator based on the maximisation of the cross-correlation or symbolic coupling traces between the phases of respiration and the delayed R–R intervals. We then investigated phase coordination in thirteen normal subjects (five males, eight females; age: 19–24 years) for different body postures. Cardiorespiratory coordination was observed to be significantly reduced in the upright position (supine vs. upright: 11.9 ± 5.1 vs. 6.9 ± 3.6, P \ 0.05). Compared to the original algorithm we observed an increase in the detection of average cardiore- spiratory coordination (supine original vs. delay: 11.9 vs. 18.9%), together with a decrease in standard deviation of the percentage of coordination in all the subjects, after introducing the heart rate delay (supine original vs. delay: 5.1 vs. 4.4%). In conclusion, the performance of the synchrogram technique was improved by including an adaptive delay in the cardiac oscillator. Keywords Heart Heart rate variability Coupling Breathing frequency Respiratory sinus arrhythmia Phase locking Synchronization 1 Introduction The appearance of a relationship between two periodic oscillators in the form of locking of their phases or adjust- ment of rhythms can be thought of in terms of synchroni- zation. In the field of medical physics, cardiorespiratory coordination is a concept that aims to quantify the interac- tion [39] between respiratory rate and heart rhythm, assuming they are generated by two weakly interacting systems. It was initially described within short intermittent periods [15, 36] during which the phases of heart rate and respiratory rate coincide with different m:n ratios (mostly, m = 2,4,5,7,9,11; n = 1,2) known as phase locking ratios [9, 24, 37]. Cardiorespiratory coordination has been reported in healthy adults [21, 24], athletes [36, 37], infants [26], and anesthetized rats [38]. Although the mechanisms and physiological significance underlying coordination between respiration and heart rate are not completely understood, its quantification might have clinical merit, for example in risk- stratifying patients after myocardial infarction [17, 23] and diagnosing obstructive sleep apnea [12, 19]. It has previously been reported that delays in coupling between two systems can have significant influence on their dynamical behaviour [28, 29, 44]. From the point of view of measurement it has been demonstrated that higher M. M. Kabir D. A. Saint D. Abbott M. Baumert Centre for Heart Rhythm Disorders, The University of Adelaide, Adelaide, SA 5005, Australia M. M. Kabir (&) D. Abbott M. Baumert School of Electrical and Electronic Engineering, The University of Adelaide, Adelaide, SA 5005, Australia e-mail: [email protected] D. A. Saint School of Medical Sciences, The University of Adelaide, Adelaide, SA 5005, Australia E. Nalivaiko School of Biomedical Sciences and Pharmacy, University of Newcastle, Callaghan, NSW 2308, Australia 123 Med Biol Eng Comput (2011) 49:1249–1259 DOI 10.1007/s11517-011-0822-3
Transcript of Time delay correction of the synchrogram for optimized detection of cardiorespiratory coordination

ORIGINAL ARTICLE
Time delay correction of the synchrogram for optimized detectionof cardiorespiratory coordination
Muammar M. Kabir • David A. Saint •
Eugene Nalivaiko • Derek Abbott • Mathias Baumert
Received: 4 March 2011 / Accepted: 2 July 2011 / Published online: 10 August 2011
� International Federation for Medical and Biological Engineering 2011
Abstract The cardiorespiratory synchrogram, a graphical
tool based on the stroboscopic technique, is an established
method for evaluating phase-locking between cardiac and
respiratory oscillators. In the original method, the phase of
the respiratory oscillator is observed at the instants of time
when the phase of the cardiac oscillator attains a certain
value. In this article, we introduced an additional adaptive
delay in the cardiac oscillator based on the maximisation of
the cross-correlation or symbolic coupling traces between
the phases of respiration and the delayed R–R intervals.
We then investigated phase coordination in thirteen normal
subjects (five males, eight females; age: 19–24 years) for
different body postures. Cardiorespiratory coordination
was observed to be significantly reduced in the upright
position (supine vs. upright: 11.9 ± 5.1 vs. 6.9 ± 3.6,
P \ 0.05). Compared to the original algorithm we
observed an increase in the detection of average cardiore-
spiratory coordination (supine original vs. delay: 11.9 vs.
18.9%), together with a decrease in standard deviation of
the percentage of coordination in all the subjects, after
introducing the heart rate delay (supine original vs. delay:
5.1 vs. 4.4%). In conclusion, the performance of the
synchrogram technique was improved by including an
adaptive delay in the cardiac oscillator.
Keywords Heart � Heart rate variability � Coupling �Breathing frequency � Respiratory sinus arrhythmia �Phase locking � Synchronization
1 Introduction
The appearance of a relationship between two periodic
oscillators in the form of locking of their phases or adjust-
ment of rhythms can be thought of in terms of synchroni-
zation. In the field of medical physics, cardiorespiratory
coordination is a concept that aims to quantify the interac-
tion [39] between respiratory rate and heart rhythm,
assuming they are generated by two weakly interacting
systems. It was initially described within short intermittent
periods [15, 36] during which the phases of heart rate and
respiratory rate coincide with different m:n ratios (mostly,
m = 2,4,5,7,9,11; n = 1,2) known as phase locking ratios
[9, 24, 37]. Cardiorespiratory coordination has been reported
in healthy adults [21, 24], athletes [36, 37], infants [26], and
anesthetized rats [38]. Although the mechanisms and
physiological significance underlying coordination between
respiration and heart rate are not completely understood, its
quantification might have clinical merit, for example in risk-
stratifying patients after myocardial infarction [17, 23] and
diagnosing obstructive sleep apnea [12, 19].
It has previously been reported that delays in coupling
between two systems can have significant influence on
their dynamical behaviour [28, 29, 44]. From the point of
view of measurement it has been demonstrated that higher
M. M. Kabir � D. A. Saint � D. Abbott � M. Baumert
Centre for Heart Rhythm Disorders, The University of Adelaide,
Adelaide, SA 5005, Australia
M. M. Kabir (&) � D. Abbott � M. Baumert
School of Electrical and Electronic Engineering, The University
of Adelaide, Adelaide, SA 5005, Australia
e-mail: [email protected]
D. A. Saint
School of Medical Sciences, The University of Adelaide,
Adelaide, SA 5005, Australia
E. Nalivaiko
School of Biomedical Sciences and Pharmacy, University
of Newcastle, Callaghan, NSW 2308, Australia
123
Med Biol Eng Comput (2011) 49:1249–1259
DOI 10.1007/s11517-011-0822-3

coordination between two time series of delayed systems
can be observed by introducing a delay, e.g., a time-shifted
synchronization index [35].
Gilad et al. [14] and Tzeng et al. [41] have shown a
delay between the phase of respiration and R–R interval
which is further affected by body posture [14]. Alvarez-
Ramirez et al. [1] suggested that the prolongation of phase
delay in RR time series can be used to discriminate healthy
subjects from patients with congestive heart failure.
However, phase delay has never been considered in the
synchrogram method—a standard visual tool for the
detection of cardiorespiratory coordination.
In this article we introduce a modification of the syn-
chrogram method that incorporates an adaptive delay. We
validated the modified algorithm by comparing its perfor-
mance with that of the original method, investigating the
phase-locking between cardiac and respiratory rhythms
during postural changes in normal subjects.
2 Methods
2.1 Subjects/experimental protocol
Thirteen healthy subjects (five males, eight females) par-
ticipated in this study. The age of the subjects ranged from
19 to 24 years. The study conformed to the principles
outlined in the Declaration of Helsinki and was approved
by the institution’s human research ethics committee.
Subjects gave informed consent.
The protocol included 10 min of recording for different
body postures as described previously [20]. A group of
eight subjects (four males, four females) was investigated
in the supine position and while standing during sponta-
neous normal breathing. A second group of five subjects
(one male, four females) underwent graded head-up tilt test
at: 0, 30, and 60� angles during controlled metronomic
breathing at 15 bpm.
Here, ECG (leads I and II) and respiratory signals (from
abdomen impedance belts) were sampled at 1 kHz and
recorded using a PowerLab data acquisition system and the
ChartPro 6.0 software (ADInstruments, Sydney, Australia).
2.2 Data analysis
2.2.1 ECG
Custom written computer software developed under
MATLAB� was used to detect the R-peaks from the
recorded ECG signal using parabolic fitting, where a
parabola of the length based on the sampling frequency is
fitted around the R-wave to determine the R-wave maxi-
mum. The R–R time series were visually scanned for
artifacts. Although the R-peaks were correctly identified,
we encountered a few ectopic beats which were manually
replaced with the average RR interval calculated from the
beats prior to and after the ectopy.
2.2.2 Respiration
Respiratory signals were low-pass filtered at 1.0 Hz to
remove noise, using a zero-phase forward and reverse
digital filter, which first filtered the raw signal in the for-
ward direction using a fourth order Butterworth filter, and
subsequently filtered the reversed signal. The resultant
signal has zero phase distortion. Custom written computer
software developed under MATLAB� was used to detect
inspiratory onsets for each respiratory cycle. First, the
offset of the signal was removed by subtracting the mean
value. Subsequently, the inspiratory and expiratory onsets
were determined as the zero-crossings of the first derivative
of the respiratory signal. All zero-crossings less than 1.0 s
apart were considered as artifacts and hence discarded. The
inspiratory onsets of respiration were later used to calculate
the average respiratory time period.
2.2.3 Cardiorespiratory coordination analysis
We used the Hilbert transform to calculate the phases of the
respiratory signal, and subsequently determined the rela-
tionship between the respiratory phases at different R-peak
instants. For a discrete signal x[n] with samples N, if the
discrete Fourier transform is given as
Fðx½n�Þ ¼ X½k� ¼XN�1
n¼0
x½n�e�jnk2pN ; k 2 f0;N � 1g
then the discrete Hilbert transform can be defined as
Hðx½n�Þ ¼ x̂½n� ¼ 1
N
XN�1
k¼0
X̂½k�ejnk2pN ; k 2 f0;N � 1g
where for N—even
X̂ðkÞ ¼� jX½k�; k ¼ f1;N
2� 1g for N even
jX½k�; k ¼ fN2þ 1;N � 1g for N even :
8><
>:
Here, the continuous and Nyquist components are excluded
(for k = 0 and k = N/2). While for N—odd
X̂ðkÞ ¼� jX½k�; k ¼ f1;N � 1
2g for N odd
jX½k�; k ¼ fN þ 1
2;N � 1g for N odd :
8><
>:
Here, the continuous component is excluded. If we denote
the phase of heartbeat as uc and of respiratory signal as ur
1250 Med Biol Eng Comput (2011) 49:1249–1259
123
and considering that the heart beats m times in n respiratory
cycles, then phase coordination is defined as the locking of
the corresponding phases given by
muc � nurj j � i;
where i is a constant. In other words, if the phase difference
between the two oscillators was within a certain threshold
value i, and remained stable for n respiratory cycles, the
oscillators were considered coordinated. If tk is the time of
the appearance of a kth R-peak, then we can generate the
cardiorespiratory synchrogram by observing the phase of
the respiration at the instants tk, denoted by ur(tk) and
wrapping the respiratory phase into a [0, 2pm] interval.
This approach also provides a visual tool to detect
cardiorespiratory coordination (Fig. 1, bottom panel) by
plotting wn, given by equation
wn ¼1
2pðurðtkÞmod 2pnÞ
against tk. In case of m:n coordination, the plot displays
m horizontal lines (Fig. 1, bottom panel).
We preselected the value of n and looked for coordination
at different values of m. The values were chosen based on the
possible number of heart beats in n respiratory cycles and
such that there is no overlap between the chosen m:n ratios—
for example, a m:n ratio of 6:2 is equivalent to 3:1 and hence
the selection of m = 6 is redundant for n = 2. Consequently,
the study was carried for the following m:n coordination:
n = 1: m = 2,3,…,7,8; n = 2: m = 5,7,9,11,13 and n = 3:
m = 7,8,10,11,13,14,16,17,19,20. We used a threshold
value of i = 0.025 for the phase difference as suggested by
Cysarz et al. [12].
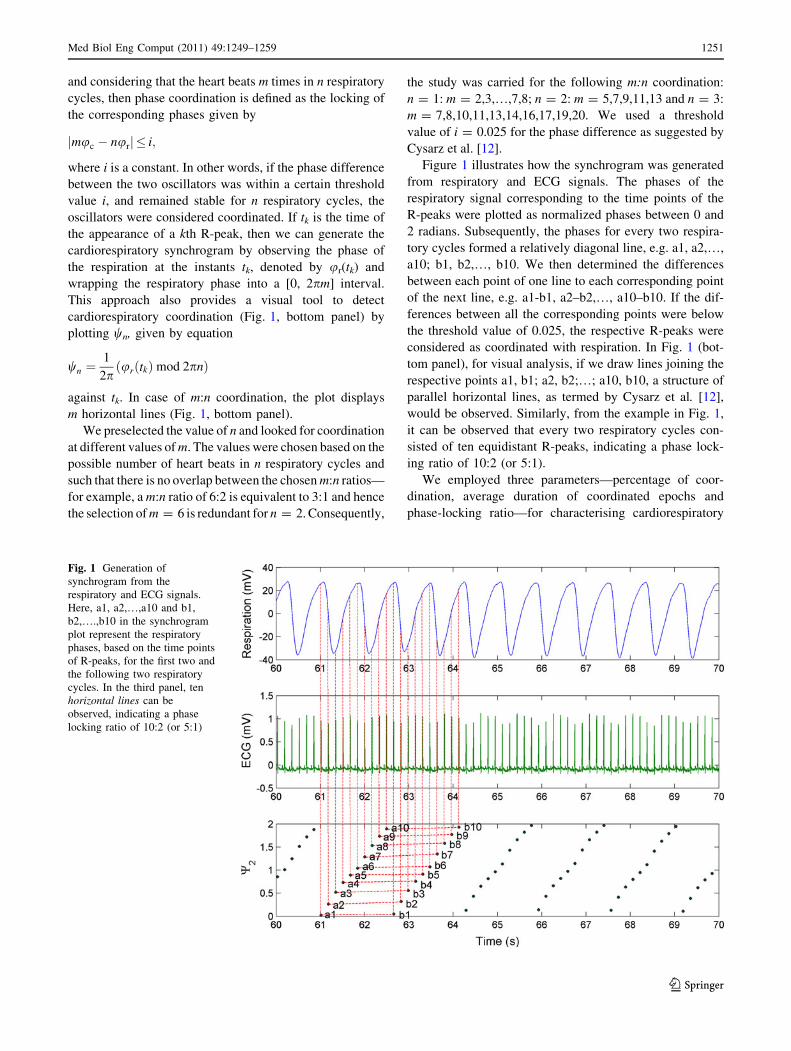
Figure 1 illustrates how the synchrogram was generated
from respiratory and ECG signals. The phases of the
respiratory signal corresponding to the time points of the
R-peaks were plotted as normalized phases between 0 and
2 radians. Subsequently, the phases for every two respira-
tory cycles formed a relatively diagonal line, e.g. a1, a2,…,
a10; b1, b2,…, b10. We then determined the differences
between each point of one line to each corresponding point
of the next line, e.g. a1-b1, a2–b2,…, a10–b10. If the dif-
ferences between all the corresponding points were below
the threshold value of 0.025, the respective R-peaks were
considered as coordinated with respiration. In Fig. 1 (bot-
tom panel), for visual analysis, if we draw lines joining the
respective points a1, b1; a2, b2;…; a10, b10, a structure of
parallel horizontal lines, as termed by Cysarz et al. [12],
would be observed. Similarly, from the example in Fig. 1,
it can be observed that every two respiratory cycles con-
sisted of ten equidistant R-peaks, indicating a phase lock-
ing ratio of 10:2 (or 5:1).
We employed three parameters—percentage of coor-
dination, average duration of coordinated epochs and
phase-locking ratio—for characterising cardiorespiratory
Fig. 1 Generation of
synchrogram from the
respiratory and ECG signals.
Here, a1, a2,…,a10 and b1,
b2,….,b10 in the synchrogram
plot represent the respiratory
phases, based on the time points
of R-peaks, for the first two and
the following two respiratory
cycles. In the third panel, ten
horizontal lines can be
observed, indicating a phase
locking ratio of 10:2 (or 5:1)
Med Biol Eng Comput (2011) 49:1249–1259 1251
123

coordination. If pj and qj are the start and end time points
of the jth coordinated epoch (j = 1,2,…,N) and ttotal is the
total duration of the recording, then the equations for
calculating the parameters can be given as
Percentage of coordination ¼PN
j¼1 ðqj� pjÞttotal
� 100 ;
Average duration of coordinated epochs
¼PN
j¼1 ðqj� pjÞN
;
Phase-locking ratios ¼ mj : nj :
2.2.4 Calculation of time delays for enhanced detection
of coordination
2.2.4.1 Cross-correlation function The cross-correlation
function is the most common and widely used tool that can
be used for the calculation of time delay. The linear
association between the respiratory phases, ur, and R–R
intervals, RR, can be assessed by determining the Pearson
correlation coefficients for the correlation between RR and
cos ur, rRC = c(RR(t), cos ur(t)), RR and sin ur,
rRS = c(RR(t), sin ur(t)), and cos ur and sin ur,
rCS = c(cos ur(t), sin ur(t)), and subsequently the angular-
linear correlation coefficient, rRP, defined as [45]
rRP ¼
ffiffiffiffiffiffiffiffiffiffiffiffiffiffiffiffiffiffiffiffiffiffiffiffiffiffiffiffiffiffiffiffiffiffiffiffiffiffiffiffiffiffiffiffiffiffiffir2
RCþ r2RS�2 rRC rRS rCS
1� r2CS
s
:
The parameters rRC, rRS and rCS were substituted by
r0RC = c(RR(i ? s), cos ur(ki)), r0RS = c(RR(i ? s), sin
ur(ki)), r0CS = c(cos ur(ki), sin ur(ki)) to introduce a delay
of s R-peaks, where s = -6,-5,…,0,…,?5,?6 beats.
Circular statistics analysis was performed using the Circ-
Stat MATLAB� toolbox and codes described in [5].
2.2.4.2 Symbolic coupling traces The method of sym-
bolic coupling traces is based on the analysis of structural
patterns through transformation of time series into dis-
cretized symbols. From the vectors of the R–R time series
and the series of respiratory phases ur at the instants of R-
peaks, RP, two symbolic sequences, sHR (HR denoting the
heart rate) and sRP, were formed using the transformation
rule below, based on the differences between successive R–
R intervals and R-instant respiratory phases, respectively,
sHRi ¼
0 if RRiþ1 � RRi [ 0
1 if RRiþ1 � RRi\0
2 if RRiþ1 � RRi ¼ 0
8><
>:
sRPi ¼
0 if RPiþ1j j � RPij j[ 0
1 if RPiþ1j j � RPij j\0
2 if RPiþ1j j � RPij j ¼ 0:
8><
>:
Using the symbol vectors sHR and sRP, we constructed
words of length 3, wHR and wRP—each containing three
successive symbols. Subsequently, the word distribution
density as described in [3] was estimated after introducing
delays, s (s = -6,-5,…,0,…,?5,?6 beats), in R-peaks—
providing probabilities that a certain word in the series wHR
at time (t ? s) appears in wRP at time t [43].
The negative delays in the R–R time series resulted by
shifting the respiratory phases while preserving the original
R–R intervals. For our analysis we selected the s-delayed RR
time series that either provided the highest correlation
between the delayed R–R intervals and respiratory phases or
showed highest probability of word similarity between the
two series using symbolic coupling traces. Subsequently, the
parameters for quantifying the cardiorespiratory coordina-
tion were obtained using the method explained in Sect. 2.3,
after replacing the original with the delayed RR time series,
i.e. by shifting the appropriate R-peaks based on the delay, s.
2.2.5 Statistical analysis
GraphPad Prism version 5.01 for Windows (GraphPad
Software, San Diego California USA, http://www.
graphpad.com) was used for statistical analysis. The mea-
sures of cardiorespiratory coordination obtained with the
original synchrogram technique for different body postures
were compared to those obtained with the modified tech-
nique using non-parametric repeated measure analysis of
variance (Wilcoxon matched pairs test, Friedman test and
Dunn’s multiple comparison test). Values with P \ 0.05
were considered statistically significant. Data were expres-
sed as mean ± standard deviation (SD).
3 Results
3.1 Effect of changes in body posture on R–R interval
and respiratory interval
A significant shortening in R–R intervals was observed
with the change in body posture from supine to upright
(0.87 ± 0.07 vs. 0.67 ± 0.05 s, respectively, P \ 0.001)
and increase in head-up tilt angles from 0 to 30 and 60�(0 vs. 30 and 60�: 0.90 ± 0.06 vs. 0.83 ± 0.05 and
0.71 ± 0.05 s, P \ 0.01 and P \ 0.001, respectively).
In spontaneously breathing subjects, the average respi-
ratory interval increased with the change in body posture
from supine to upright for all but one subject, who showed
a slight decrease in respiratory interval (Table 1, subject 3:
supine versus upright: 5.95 ± 0.7 vs. 5.29 ± 0.2 s). Owing
to this variation in one subject, the overall difference in
respiratory intervals with the change in body posture failed
to reach statistical significance.
1252 Med Biol Eng Comput (2011) 49:1249–1259
123
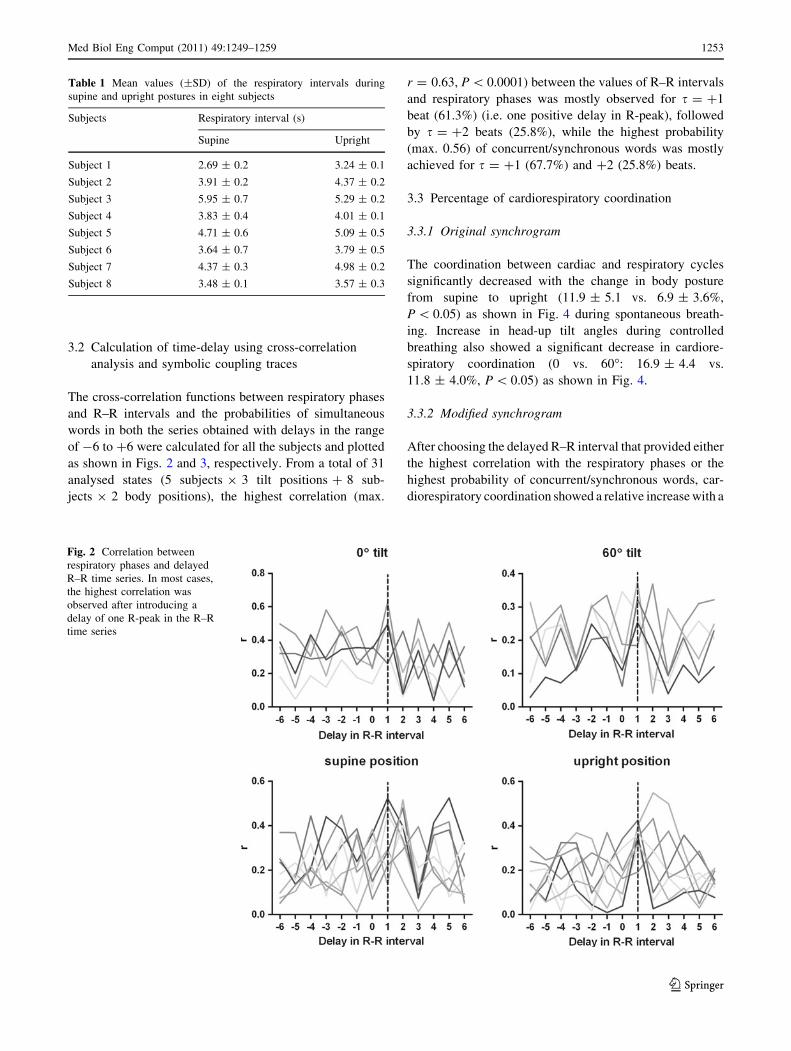
3.2 Calculation of time-delay using cross-correlation
analysis and symbolic coupling traces
The cross-correlation functions between respiratory phases
and R–R intervals and the probabilities of simultaneous
words in both the series obtained with delays in the range
of -6 to ?6 were calculated for all the subjects and plotted
as shown in Figs. 2 and 3, respectively. From a total of 31
analysed states (5 subjects 9 3 tilt positions ? 8 sub-
jects 9 2 body positions), the highest correlation (max.
r = 0.63, P \ 0.0001) between the values of R–R intervals
and respiratory phases was mostly observed for s = ?1
beat (61.3%) (i.e. one positive delay in R-peak), followed
by s = ?2 beats (25.8%), while the highest probability
(max. 0.56) of concurrent/synchronous words was mostly
achieved for s = ?1 (67.7%) and ?2 (25.8%) beats.
3.3 Percentage of cardiorespiratory coordination
3.3.1 Original synchrogram
The coordination between cardiac and respiratory cycles
significantly decreased with the change in body posture
from supine to upright (11.9 ± 5.1 vs. 6.9 ± 3.6%,
P \ 0.05) as shown in Fig. 4 during spontaneous breath-
ing. Increase in head-up tilt angles during controlled
breathing also showed a significant decrease in cardiore-
spiratory coordination (0 vs. 60�: 16.9 ± 4.4 vs.
11.8 ± 4.0%, P \ 0.05) as shown in Fig. 4.
3.3.2 Modified synchrogram
After choosing the delayed R–R interval that provided either
the highest correlation with the respiratory phases or the
highest probability of concurrent/synchronous words, car-
diorespiratory coordination showed a relative increase with a
Table 1 Mean values (±SD) of the respiratory intervals during
supine and upright postures in eight subjects
Subjects Respiratory interval (s)
Supine Upright
Subject 1 2.69 ± 0.2 3.24 ± 0.1
Subject 2 3.91 ± 0.2 4.37 ± 0.2
Subject 3 5.95 ± 0.7 5.29 ± 0.2
Subject 4 3.83 ± 0.4 4.01 ± 0.1
Subject 5 4.71 ± 0.6 5.09 ± 0.5
Subject 6 3.64 ± 0.7 3.79 ± 0.5
Subject 7 4.37 ± 0.3 4.98 ± 0.2
Subject 8 3.48 ± 0.1 3.57 ± 0.3
Fig. 2 Correlation between
respiratory phases and delayed
R–R time series. In most cases,
the highest correlation was
observed after introducing a
delay of one R-peak in the R–R
time series
Med Biol Eng Comput (2011) 49:1249–1259 1253
123

reduction in standard deviation when considering all subjects
(supine position—mean using original data versus mean
using delayed data through analysis of cross-correlation and
symbolic traces: 11.9 vs. 18.0%, P \ 0.05 and 18.9%,
P \ 0.05, respectively, and SD: 5.1 vs. 2.8%, P \ 0.05 and
4.4%, P \ 0.05, respectively) as seen in Fig. 4.
Fig. 3 Probability of
occurrence of similar words
from the series of respiratory
phases and delayed R–R time
series. In most cases, the highest
probability was observed after
introducing a delay of one
R-peak in the R–R time series
Fig. 4 Percentage of
coordination using original and
delayed R–R intervals
(calculated using cross-
correlation and symbolic traces)
for supine and upright postures
and different body tilt-angles.
Higher tilt-angles showed a
lower percentage of
coordination. By appropriate
delaying of the R–R time series,
an increase in the overall
percentage of coordination was
observed together with a
decrease in standard deviation.
The lines connecting the points
are notional for illustrative
purposes only, for grouping
pairs of points. The lines are not
intended for describing a linear
relationship
1254 Med Biol Eng Comput (2011) 49:1249–1259
123

3.4 Average duration of coordinated epochs
3.4.1 Original synchrogram
The average duration of coordination between cardiac and
respiratory cycles significantly decreased with the change
in body posture from supine to upright during spontaneous
breathing (7.5 ± 3.1 vs. 5.0 ± 2.1 s, P \ 0.01) as shown
in Fig. 5. Increase in head-up tilt angles during controlled
breathing also showed a significant decrease in the average
duration of coordinated epoch (0 vs. 60�: 8.6 ± 3.4 vs.
5.9 ± 2.3 s, P \ 0.05) as shown in Fig. 5.
3.4.2 Modified synchrogram
The delay in R–R interval based on either the highest corre-
lation between the delayed R–R time series and respiratory
phases or the highest probability of synchronous words caused
an overall, but not significant, increase in average duration of
coordination (supine position—mean using original data
versus mean using delayed data through analysis of cross-
correlation and symbolic traces: 7.5 vs. 9.2 s, P [ 0.05 and
9.2 s, P [ 0.05, respectively, and SD: 3.1 vs. 2.3 s, P [ 0.05
and 2.3 s, P [ 0.05, respectively) as shown in Fig. 5.
3.5 Phase-locking ratio
The different phase-locking ratios observed in the subjects
include 2:1, 3:1, 4:1, 5:1, 6:1, 7:2 and 9:2. The most fre-
quent phase locking ratios observed in the supine posture
during spontaneous breathing were 3:1 (3 subjects), 4:1
(3 subjects) and 5:1 (2 subjects), and during metronomic
breathing 4:1 (4 subjects) and 9:2 (1 subject), as seen in
Table 2. The change in posture from supine to upright and
higher tilt angles showed slight variations in the phase-
locking ratios (Table 2). The phase-locking ratios observed
with the modified synchrogram technique also varied but
were not notably different from those observed with the
original method (Table 2).
4 Discussion
The major findings of this study are: (1) the detection of
epochs of cardiorespiratory coordination can be increased
by appropriate delaying of R–R intervals, (2) a R–R
interval delay of one was required to maximise the
detection process in most cases and (3) the percentage
and average duration of cardiorespiratory coordination
decreases with the change in body posture from supine to
upright.
In physics, phase synchronization is considered as a
locking procedure due to weak interaction between two
systems [32, 37]. But since the durations of synchroniza-
tion are usually very short and the underlying mechanisms
causing the synchronization are not yet completely under-
stood, it is difficult to claim that the adjustments in rhythms
are caused by couplings. As explained by Bettermann et al.
[6], the term coordination is less restrictive and hence has
been used throughout this article.
Fig. 5 Average duration of
coordinated epochs using
original and delayed R–R
intervals for different body
postures and tilt-angles. Higher
tilt-angles caused a significant
decrease in the average duration
of coordinated epochs.
However, delaying of R–R time
series had no significant effect
on the duration of coordination.
The lines connecting the points
are notional for illustrative
purposes only, for grouping
pairs of points. The lines are not
intended for describing a linear
relationship
Med Biol Eng Comput (2011) 49:1249–1259 1255
123

Our results show that the upright posture, as compared
to supine, causes a shortening in the R–R intervals with no
significant change in respiratory intervals, which is con-
sistent with the findings by Gilad et al. [14]. It is well-
known that a postural change in human body from upright
to supine causes an increase in vagus nerve activity and a
decrease in sympathetic nerve activity [7, 30, 34].
There are mechanical effects of posture on both the
respiratory and cardiovascular systems. Passive head up tilt
(HUT) greater than 60� increases minute ventilation and
tidal volume and increases functional residual capacity
[10, 25]. The mechanisms are not clear, but it has been
suggested that descent of the diaphragm may alter the point
at which tidal breathing occurs on the volume pressure curve
[27], leading to an increase in lung compliance. This is
consistent with the observation that moving from a supine to
a sitting posture produces a progressive reduction of rib cage
displacement and a concomitant increase of abdominal
contribution to breathing mechanics [8, 42]. However,
effects on tidal volume and ventilation for passive HUT, as
opposed to active standing, tend to be minor. Romei et al.
[31] showed that absolute tidal volume and minute ventila-
tion were increased when sitting without back support (by
about 20% for each), but these effects were not seen when
the values were normalised to subject body weight, and no
change was seen with 80� sitting with back support. In this
study, respiratory rate was not changed by posture.
Importantly, these effects appear to be wholly mechanical—
no change in neural drive to the respiratory muscles has been
demonstrated following passive tilting or active standing
[8]. Although many studies have been done on the effect of
posture on HRV, demonstrating, for example a phase shift in
RSA with posture [22], no studies have examined the effect
of posture on cardiorespiratory phase coordination.
The association between cardiac and respiratory
rhythms has long been recognised. Traditionally, the cou-
pling between heart rate and respiration, termed as car-
dioventilatory coupling (CVC), has been studied based on
the temporary alignment between the R waves of the ECG
and inspiratory onsets; the plot used to study the temporary
alignment being named as the RI (R-peak to Inspiratory-
onset interval) plot. A recent study by Tzeng et al. [40]
suggested that, in addition to the RI plot, the respiratory
period and the ratio of heart rate to respiratory rate should
also be considered for accurate determination of CVC,
since the presence of CVC observed on the RI plot is
dependent on the ratio of heart rate to respiratory rate,
which further reflects the strength of coupling.
The technique used in this study assesses the interaction
between heart and respiratory rate based on phase-locking
and has some technical advantages over the traditional
approach. Importantly, it does not require the detection of
the inspiratory onset, which can be challenging, in partic-
ular when large amounts of data need to be processed. The
Table 2 Most frequent phase locking ratios using original and modified synchrograms in two groups of subjects for different body positions
Group 1
Subjects Supine Upright
Original (%) Modified (%) Original (%) Modified (%)
Subject 1 3:1 (59) 3:1 (63) 4:1 (75) 4:1 (83)
Subject 2 3:1 (60) 4:1 (70) 2:1 (70) 3:1 (87)
Subject 3 4:1 (44) 4:1 (40) 5:1 (56) 4:1 (34)
Subject 4 5:1 (37) 5:1 (47) 6:1 (50) 5:1 (50)
Subject 5 4:1 (65) 3:1 (75) 5:1 (60) 5:1 (67)
Subject 6 3:1 (40) 3:1 (47) 4:1 (75) 4:1 (78)
Subject 7 4:1 (55) 4:1 (67) 2:1 (50) 3:1 (50)
Subject 8 5:1 (50) 5:1 (45) 6:1 (36) 6:1 (55)
Group 2
Subjects 08 tilt 308 tilt 608 tilt
Original (%) Modified (%) Original (%) Modified (%) Original (%) Modified (%)
Subject 1 4:1 (60) 5:1 (90) 2:1 (75) 3:1 (75) 6:1 (50) 4:1 (40)
Subject 2 9:2 (65) 9:2 (50) 5:1 (80) 5:1 (67) 5:1 (83) 5:1 (67)
Subject 3 4:1 (79) 4:1 (67) 5:1 (94) 5:1 (95) 6:1 (96) 6:1 (93)
Subject 4 4:1 (91) 4:1 (89) 5:1 (60) 9:2 (67) 5:1 (83) 5:1 (89)
Subject 5 4:1 (75) 4:1 (80) 2:1 (40) 3:1 (45) 2:1 (67) 2:1 (75)
1256 Med Biol Eng Comput (2011) 49:1249–1259
123

phase analysis technique has the advantage of tracing
transitions between synchronous and non-synchronous
epochs using the synchrogram plot [33] and has been
employed in several studies [2, 19, 46].
In this study, a significant decrease in cardiorespiratory
coordination was observed in upright and higher tilt-angled
postures as compared to a supine posture. Also, there were
variations in the average phase locking ratio with the
change in body posture. Cysarz et al. [13] reported that a
strong cardiorespiratory coordination can be obtained
through a breathing pattern caused by poetry recitation as
compared to controlled breathing. Our results suggest that
autonomic nervous activity has an influence on cardiore-
spiratory coordination. This observation has further been
supported by a recent study [18].
The analyses of physiological systems are complicated
as they are highly non-linear and -stationary and are usu-
ally contaminated with intrinsic and measurement noise.
As a result, the conventional techniques such as linear
cross-correlation analysis often prove to be inadequate for
characterizing their complex dynamics [16, 32]. Symbolic
coupling traces analysis, which is based on simplified
description of the system’s dynamics through symbolic
representation by employing a coarse-graining procedure
[3, 4], has been suggested to be more reliable due to its
insensitivity towards noise and non-stationery phenomena
compared to cross-correlation analysis [43]. By employing
cross-correlation functions and symbolic coupling traces,
we found that the highest correlation between R–R inter-
vals and respiratory phases is obtained through a delay of
usually one heart beat in R–R time series. The delay in
heart rhythm in regard to the respiratory cycle is apparent
in the example displayed in Fig. 6. Rybski et al. suggested
that the coordination between two time-delayed systems
can be increased by introducing a synchronization index
into the phase synchronization method [35]. The method
based on synchronization index has been compared with
the traditional cross-correlation technique and also with a
technique based on a model reconstruction and suggested
to be the most efficient technique [11]. A recent study has
also reported the existence of delay between the respiratory
phase and R–R interval pattern [14]. Consequently, we
added the appropriate delay in R–R time series for the
cardiorespiratory coordination analysis which showed a
significant increase in the detection of the phase-locking
between cardiac and respiratory rhythms and yields more
consistent results. However, there was no significant
change in the average duration of coordination or phase-
locking ratio after the delay. This would suggest that the
cardiac and respiratory cycles are usually phase-locked
within short intermittent periods as described in [15, 36].
Although the physiological origin of cardiorespiratory
coordination still needs to be explored in more detail, the
increase in detection of the interaction between cardiac and
respiratory rhythms after incorporating the delay in
R-peaks could be explained by the possible involvement of
mechanisms such as the well-known respiratory influence
on cardiac timing known as respiratory sinus arrhythmia
and influences of heart on respiratory timing through the
baroreceptor nerves [40].
One limitation of this study is that the results, using the
proposed time delay correction of the synchrogram, were
obtained by analyzing the data from a small number of
subjects. However, from a statistical point of view the
study was sufficiently powered to detect a significant
increase in cardiorespiratory coupling with the phase delay
method compared to the standard method. We were able to
show this effect in two independent study groups under
different conditions (active standing vs. tilt; spontaneous
breathing vs. metronomic breathing).
In conclusion, a change in body posture is associated with
the changes in cardiorespiratory coordination in humans and
there exists a delay in heart rhythm in regard to the respira-
tory cycle which should be taken into account during the
study of phase coordination between cardiac and respiratory
rhythms. This modification substantially enhances the sen-
sitivity of the detection of cardiorespiratory coordination,
and this may facilitate unravelling its physiological role.
Acknowledgments The research was supported by the Australian
Research Council (Grant # DP 110102049).
References
1. Alvarez-Ramirez J, Rodriguez E, Echeverria JC (2009) Delays in
the human heartbeat dynamics. Chaos 19:028502
Fig. 6 Respiratory signal (top) and ECG signal together with R–R
interval (bottom). The delay is calculated as the time between the
expiratory onset of respiration and the start of the increase in R–R
interval
Med Biol Eng Comput (2011) 49:1249–1259 1257
123

2. Bahraminasab A, Kenwright D, Stefanovska A, Ghasemi F,
McClintock PVE (2008) Phase coupling in the cardiorespiratory
interaction. IET Syst Biol 2:48–54
3. Baumert M, Walther T, Hopfe J, Stepan H, Faber R, Voss A
(2002) Joint symbolic dynamic analysis of beat-to-beat interac-
tions of heart rate and systolic blood pressure in normal preg-
nancy. Med Biol Eng Comput 40:241–245
4. Baumert M, Baier V, Truebner S, Schirdewan A, Voss A (2005)
Short- and long-term joint symbolic dynamics of heart rate and
blood pressure in dilated cardiomyopathy. IEEE Trans Biomed
Eng 52:2112–2115
5. Berens P (2009) CircStat: a matlab toolbox for circular statistics.
J Stat Softw 31:1–21
6. Bettermann H, Cysarz D, Leeuwen PV (2000) Detecting car-
diorespiratory coordination by respiratory pattern analysis of
heart period dynamics: the musical rhythm approach. Int J
Bifurcat Chaos 10:2349–2360
7. Buchheit M, Haddad HA, Laursen PB, Ahmaidi S (2009) Effect
of body posture on postexercise parasympathetic reactivation in
men. Exp Physiol 94:795–804
8. Butler JE, McKenzie DK, Gandevia SC (2001) Discharge fre-
quencies of single motor units in human diaphragm and para-
sternal muscles in lying and standing. J Appl Physiol 90:147–154
9. Censi F, Calcagnini G, Lino S, Seydnejad S, Kitney R, Cerutti S
(2000) Transient phase locking patterns among respiration, heart
rate and blood pressure during cardiorespiratory synchronisation
in humans. Med Biol Eng Comput 38:416–426
10. Chang AT, Boots RJ, Brown MG, Paratz JD, Hodges PW (2005)
Ventilatory changes following head-up tilt and standing in heal-
thy subjects. Eur J Appl Physiol 95:409–417
11. Cimponeriu L, Rosenblum M, Pikovsky A (2004) Estimation of
delay in coupling from time series. Phys Rev E 70:046213
12. Cysarz D, Bettermann H, Lange S, Geue D, van Leeuwen P
(2004) A quantitative comparison of different methods to detect
cardiorespiratory coordination during night-time sleep. Biomed
Eng Online 3:44
13. Cysarz D, von Bonin D, Lackner H, Heusser P, Moser M, Bet-
termann H (2004) Oscillations of heart rate and respiration syn-
chronize during poetry recitation. Am J Physiol Heart Circ
Physiol 287:H579–H587
14. Gilad O, Swenne CA, Davrath LR, Akselrod S (2005) Phase-
averaged characterization of respiratory sinus arrhythmia pattern.
Am J Physiol Heart Circ Physiol 288:H504–H510
15. Hoyer D, Hader O, Zwiener U (1997) Relative and intermittent
cardiorespiratory coordination. IEEE Eng Med Biol Mag 16:
97–104
16. Hoyer D, Kaplan D, Schaaff F, Eiselt M (1998) Determinism in
bivariate cardiorespiratory phase-space sets. IEEE Eng Med Biol
Mag 17:26–31
17. Hoyer D, Leder U, Hoyer H, Pompe B, Sommer M, Zwiener U
(2002) Mutual information and phase dependencies: measures of
reduced nonlinear cardiorespiratory interactions after myocardial
infarction. Med Eng Phys 24:33–43
18. Kabir MM, Beig MI, Nalivaiko E, Abbott D, Baumert M (2009)
Cardiorespiratory coordination in rats is influenced by autonomic
blockade. In: 13th International conference on biomedical engi-
neering, Singapore, p 456–459
19. Kabir MM, Dimitri H, Sanders P, Antic R, Nalivaiko E, Abbott
D, Baumert M (2010) Cardiorespiratory phase-coupling is
reduced in patients with obstructive sleep apnea. PLoS ONE
5:e10602
20. Kabir MM, Saint DA, Nalivaiko E, Abbott D, Voss A, Baumert
M (2011) Quantification of cardiorespiratory interactions based
on joint symbolic dynamics. Ann Biomed Eng. doi:10.1007/
s10439-10011-10332-10433
21. Kotani K, Takamasu K, Ashkenazy Y, Stanley HE, Yamamoto Y
(2002) Model for cardiorespiratory synchronization in humans.
Phys Rev E Stat Nonlin Soft Matter Phys 65:051923
22. Kotani K, Takamasu K, Jimbo Y, Yamamoto Y (2008) Postural-
induced phase shift of respiratory sinus arrhythmia and blood
pressure variations: insight from respiratory-phase domain anal-
ysis. Am J Physiol Heart Circ Physiol 294:H1481–H1489
23. Leder U, Hoyer D, Sommer M, Baier V, Haueisen J, Zwiener U,
Figulla HR (2000) Cardiorespiratory desynchronization after
acute myocardial infarct. Z Kardiol 89:630–637
24. Lotric MB, Stefanovska A (2000) Synchronization and modula-
tion in the human cardiorespiratory system. Physica A
283:451–461
25. Miyamoto Y, Tamura T, Hiura T, Nakamura T, Higuchi J, Mi-
kami T (1982) The dynamic response of the cardiopulmonary
parameters to passive head-up tilt. Jpn J Physiol 32:245–258
26. Mrowka R, Patzak A, Rosenblum M (2000) Quantitative analysis
of cardiorespiratory synchronization in infants. Int J Bifurcat
Chaos 10:2479–2488
27. Navajas D, Farre R, Rotger MM, Milic-Emili J, Sanchis J (1988)
Effect of body posture on respiratory impedance. J Appl Physiol
64:194–199
28. Niebur E, Schuster HG, Kammen DM (1991) Collective fre-
quencies and metastability in networks of limit-cycle oscillators
with time delay. Phys Rev Lett 67:2753–2756
29. Ramana Reddy DV, Sen A, Johnston GL (2000) Experimental
evidence of time-delay-induced death in coupled limit-cycle
oscillators. Phys Rev Lett 85:3381–3384
30. Robinson BF, Epstein SE, Beiser GD, Braunwald E (1966)
Control of heart rate by the autonomic nervous system: studies in
man on the interrelation between baroreceptors mechanisms and
exercise. Circ Res 19:400–411
31. Romei M, Mauro AL, D’Angelo MG, Turconi AC, Bresolin N,
Pedotti A, Aliverti A (2010) Effects of gender and posture on
thoraco-abdominal kinematics during quiet breathing in healthy
adults. Respir Physiol Neurobiol 172:184–191
32. Rosenblum MG, Kurths J, Pikovsky A, Schafer C, Tass P, Abel
HH (1998) Synchronization in noisy systems and cardiorespira-
tory interaction. IEEE Eng Med Biol Mag 17:46–53
33. Rosenblum MG, Pikovsky A, Kurths J, Schafer C, Tass PA
(2001) Phase synchronization: from theory to data analysis. In:
Moss F, Gielen S (eds) Handbook of biological physics. Elsevier
Science, Amsterdam, pp 279–321
34. Rowell LB (1993) Reflex control during orthostasis. In: Rowell
LB (ed) Human cardiovascular control. Oxford University Press,
New York, pp 37–80
35. Rybski D, Havlin S, Bunde A (2003) Phase synchronization in
temperature and precipitation records. Phys A Stat Mech Appl
320:601–610
36. Schafer C, Rosenblum MG, Kurths J, Abel HH (1998) Heartbeat
synchronized with ventilation. Nature 392:239–240
37. Schafer C, Rosenblum MG, Abel HH, Kurths J (1999) Syn-
chronization in the human cardiorespiratory system. Phys Rev E
Stat Phys Plasmas Fluids Relat Interdiscip Topics 60:857–870
38. Stefanovska A, Haken H, McClintock PVE, Hozic M, Bajrovic F,
Ribaric S (2000) Reversible transitions between synchroniza-
tion states of the cardiorespiratory system. Phys Rev Lett 85:
4831–4834
39. Toledo E, Akselrod S, Pinhas I, Aravot D (2002) Does syn-
chronization reflect a true interaction in the cardiorespiratory
system? Med Eng Phys 24:45–52
40. Tzeng YC, Larsen PD, Galletly DC (2007) Mechanism of car-
dioventilatory coupling: insights from cardiac pacing, vagotomy,
and sinoaortic denervation in the anesthetized rat. Am J Physiol
Heart Circ Physiol 292:H1967–H1977
1258 Med Biol Eng Comput (2011) 49:1249–1259
123

41. Tzeng YC, Sin PYW, Galletly DC (2009) Human sinus
arrhythmia: inconsistencies of a teleological hypothesis. Am J
Physiol Heart Circ Physiol 296:H65–H70
42. Vellody VP, Nassery M, Druz WS, Sharp JT (1978) Effects of
body position change on thoracoabdominal motion. J Appl
Physiol 45:581–589
43. Wessel N et al (2009) Detection of time-delayed interactions in
biosignals using symbolic coupling traces. EPL 87:10004
44. Yeung MKS, Strogatz SH (1999) Time delay in the Kuramoto
model of coupled oscillators. Phys Rev Lett 82:648–651
45. Zar JH (1999) Circular distributions: hypothesis testing. In: Ryu
T (ed) Biostatistical analysis. Prentice-Hall, New Jersey,
pp 616–663
46. Zhang J, Yu X, Xie D (2010) Effects of mental tasks on the
cardiorespiratory synchronization. Respir Physiol Neurobiol
170:91–95
Med Biol Eng Comput (2011) 49:1249–1259 1259
123