Dietary patterns and the risk of mortality: impact of cardiorespiratory fitness
13
DIABETES Dietary patterns and the risk of mortality: impact of cardiorespiratory fitness Mariane He ´roux, 1 Ian Janssen, 1,2 * Miu Lam, 1 Duck-chul Lee, 3 James R Hebert, 4,5 Xuemei Sui 3 and Steven N Blair 3,4 Accepted 17 March 2009 Background While dietary patterns that are both predictive of chronic disease and mortality have been identified, the confounding effects of cardiorespiratory fitness have not been properly addressed. The pri- mary objective was to assess the relation between dietary patterns with all-cause mortality, while controlling for the potentially confounding effects of fitness. Methods This was a prospective cohort study. Participants consisted of 13 621 men and women from the Aerobics Center Longitudinal Study (ACLS). Participants completed a clinical exam and 3-day diet record between 1987 and 1999. Participants were followed for mortality until 2003. Reduced rank regression (RRR) was used to identify dietary patterns that predicted unfavourable total and high-density lipoprotein-cholesterol, triglyceride, glucose, blood pressure, uric acid, white blood cell and body mass index values. Results One primary dietary pattern emerged and was labelled the Unhealthy Eating Index. This pattern was characterized by elevated consumption of processed and red meat, white potato products, non- whole grains, added fat and reduced consumption of non-citrus fruits. The hazard ratio for all-cause mortality in the fifth vs the first quintile of the Unhealthy Eating Index was 1.40 (1.02–1.91). This risk estimate was reduced by 13.5 and 55.0% after controlling for self-reported physical activity and fitness, respectively. Conclusion In this study the association between diet and overall mortality was, in large part, confounded by fitness. Keywords All-cause mortality, cardiorespiratory fitness, reduced rank regression Background A prudent diet is recognized by the scientific and medical communities and the general public as being a fundamental part of healthy living. Histori- cally, studies in nutrition and health have examined chronic disease risk in relation to a single nutrient or food. 1,2 However, because people eat meals com- prised of a variety of nutrients and foods, studying individuals’ complete diets, through their overall diet- ary pattern, more closely approximates real-world eating conditions. * Corresponding author. School of Kinesiology and Health Studies, Queen’s University, Kingston, ON, Canada K7L 3N6. E-mail: [email protected] 1 Department of Community Health and Epidemiology, Queen’s University, Kingston, ON, Canada. 2 School of Kinesiology and Health Studies, Queen’s University, Kingston, ON, Canada. 3 Department of Exercise Science, University of South Carolina, Columbia, SC, USA. 4 Department of Epidemiology and Biostatistics, University of South Carolina, Columbia, SC, USA. 5 South Carolina Statewide Cancer Prevention and Control Program, University of South Carolina, Columbia, SC, USA. Published by Oxford University Press on behalf of the International Epidemiological Association ß The Author 2009; all rights reserved. Advance Access publication 20 April 2009 International Journal of Epidemiology 2010;39:197–209 doi:10.1093/ije/dyp191 197
-
Upload
independent -
Category
Documents
-
view
0 -
download
0
Transcript of Dietary patterns and the risk of mortality: impact of cardiorespiratory fitness

DIABETES
Dietary patterns and the risk of mortality:impact of cardiorespiratory fitnessMariane Heroux,1 Ian Janssen,1,2* Miu Lam,1 Duck-chul Lee,3 James R Hebert,4,5 Xuemei Sui3 andSteven N Blair3,4
Accepted 17 March 2009
Background While dietary patterns that are both predictive of chronic diseaseand mortality have been identified, the confounding effects ofcardiorespiratory fitness have not been properly addressed. The pri-mary objective was to assess the relation between dietary patternswith all-cause mortality, while controlling for the potentiallyconfounding effects of fitness.
Methods This was a prospective cohort study. Participants consisted of 13 621men and women from the Aerobics Center Longitudinal Study(ACLS). Participants completed a clinical exam and 3-day dietrecord between 1987 and 1999. Participants were followed formortality until 2003. Reduced rank regression (RRR) was usedto identify dietary patterns that predicted unfavourable total andhigh-density lipoprotein-cholesterol, triglyceride, glucose, bloodpressure, uric acid, white blood cell and body mass index values.
Results One primary dietary pattern emerged and was labelled theUnhealthy Eating Index. This pattern was characterized by elevatedconsumption of processed and red meat, white potato products, non-whole grains, added fat and reduced consumption of non-citrusfruits. The hazard ratio for all-cause mortality in the fifth vs thefirst quintile of the Unhealthy Eating Index was 1.40 (1.02–1.91).This risk estimate was reduced by 13.5 and 55.0% after controllingfor self-reported physical activity and fitness, respectively.
Conclusion In this study the association between diet and overall mortalitywas, in large part, confounded by fitness.
Keywords All-cause mortality, cardiorespiratory fitness, reduced rank regression
BackgroundA prudent diet is recognized by the scientific andmedical communities and the general public asbeing a fundamental part of healthy living. Histori-cally, studies in nutrition and health have examined
chronic disease risk in relation to a single nutrientor food.1,2 However, because people eat meals com-prised of a variety of nutrients and foods, studyingindividuals’ complete diets, through their overall diet-ary pattern, more closely approximates real-worldeating conditions.
* Corresponding author. School of Kinesiology and HealthStudies, Queen’s University, Kingston, ON, Canada K7L3N6. E-mail: [email protected]
1 Department of Community Health and Epidemiology, Queen’sUniversity, Kingston, ON, Canada.
2 School of Kinesiology and Health Studies, Queen’s University,Kingston, ON, Canada.
3 Department of Exercise Science, University of South Carolina,Columbia, SC, USA.
4 Department of Epidemiology and Biostatistics, University ofSouth Carolina, Columbia, SC, USA.
5 South Carolina Statewide Cancer Prevention and ControlProgram, University of South Carolina, Columbia, SC, USA.
Published by Oxford University Press on behalf of the International Epidemiological Association
� The Author 2009; all rights reserved. Advance Access publication 20 April 2009
International Journal of Epidemiology 2010;39:197–209
doi:10.1093/ije/dyp191
197

Recent literature reviews have summarized theevidence linking dietary patterns with chronic diseaseand mortality risk.3–6 Their findings suggest that diet-ary patterns characterized by a high consumption ofprocessed, refined and fried foods and a low con-sumption of fresh fruit, vegetables and whole grains,are a modest to strong risk factor for chronic diseaseand mortality risk in both sexes.3–6
When studying the relationship between dietary pat-terns with chronic disease and mortality risk, it isimportant to realize that self-report biases in dietarymeasures can distort estimates of effect.7,8 It is alsoimportant to consider the potentially confoundingeffect of other lifestyle characteristics. Physical activ-ity, for example, is related to both dietary patterns9
and chronic disease risk.10,11 While most studiesassessing the relation between dietary patterns andchronic disease risk have controlled for physicalactivity, the physical activity measures employedhave been, without exception, based on self-reportedquestionnaires. Such measures of physical activity areonly modestly correlated with objective measuresobtained using criterion methods.12–14 Thus, thepotentially confounding effects of physical activityon the relation between dietary patterns and chronicdisease risk may not have been fully captured inthe existing literature. One approach to objectivelydetermine a persons’ recent physical activity level isto assess their cardiorespiratory fitness (hereafterreferred to as fitness).12,15
The primary objective of this study was to assess therelationship between dietary patterns with mortalityrisk from all-cause and cardiovascular disease (CVD)while controlling for the potentially confoundingeffects of fitness. The secondary objective was toexamine the combined effects of dietary patternsand fitness on mortality risk.
MethodsStudy overviewThe study was divided into two parts, with theAerobics Center Longitudinal Study (ACLS) cohortforming the subject pool for both. In Part A, datareduction techniques were employed to identify diet-ary patterns from 3-day food records, which wererelated to clinical markers of chronic disease andmortality risk. In Part B, the risk of CVD and all-cause mortality according to the dietary patternscore (identified in Part A) were determined. Thepotential confounding influence of physical activityand fitness on the relation between dietary patternsand mortality were considered.
Study populationThe study sample consisted of 13 621 participantsfrom the ACLS who completed a standardized medicalexamination and 3-day diet record between 1987 and
1999. The ACLS is a prospective, observational studyof men and women who participated in a clinicalexamination at the Cooper Clinic in Dallas, TX,USA. ACLS participants are predominantly (495%)non-Hispanic white, well educated, employed in pro-fessional or executive occupations and of middle tohigh socio-economic status. Participants who did notachieve 585% of their age-predicted maximal heartrate on the treadmill test were excluded.
The standardized data collection proceduresemployed in the ACLS are described in greater detailin previous studies.11,16 Briefly, data collected includeda medical history questionnaire, a thorough medicaland physical exam, fasting blood chemistry analyses,symptom-limited maximal exercise test for the mea-surement of fitness and a dietary assessment. Themedical history questionnaire was self administeredand included a demographic, family history and perso-nal health habits questionnaire. Physical examinationprocedures were conducted in a standardized mannerby trained personnel. All participants gave writteninformed consent. The study was reviewed andapproved annually by the institutional review boardat the Cooper Institute.10,11,17 Ethics approval for thecompletion of the secondary analyses for this studywas granted by the Queen’s University HealthSciences Ethics Review Board.
Part A: identification of dietary patternsSeveral different approaches can be used to measureindividuals’ dietary patterns, as reviewed else-where.18,19 Of the available methods, reduced rankregression (RRR) has been shown to be the bestapproach for developing dietary patterns that arepredictive of chronic disease risk,20 and was, therefore,employed here. RRR is a statistical data reduction tech-nique that determines linear functions of predictors(e.g. food groups from diet records) by explaining asmuch variation as possible in a group of responsevariables (e.g. biomarkers that are in the pathwaysbetween the foods and health outcomes).18,19
Dietary variables (predictor variables for RRR)The dietary assessment consisted of a 3-day dietrecord that required respondents to keep detailedrecords of everything they ate over 2 pre-assignedweekdays and 1 weekend day. Participants were pro-vided with written instructions on how to accuratelydescribe foods and estimate portion sizes. Participantskept an on-going, real-time written record of foodsconsumed during and between meals, includingassessing portion sizes in common householdmeasures. Registered dieticians at the Cooper Cliniccoded and analysed the diet records using theCooper Clinic Nutrition and Exercise Evaluationsystem.17 This provided detailed dietary informationon the overall diet such as the number of foods con-sumed from specific food groups, total caloric content,the volume of micronutrients (vitamins and minerals)
198 INTERNATIONAL JOURNAL OF EPIDEMIOLOGY

and the volume and caloric content of macronutrients(fat, protein, carbohydrate and alcohol).
For the purpose of this study, food items fromthe diet records were initially divided into specificfood groups. For example, nut varieties (peanuts,cashews and almonds) were combined into an overallnuts variable. These food groups were then used asthe predictor variables in the RRR analysis. The fol-lowing 24 food groups were considered: alcohol,added sugar, cheese, milk, yogurt, added fats, citrusfruit, non-citrus fruit, non-whole grains, whole grains,legumes, eggs, seafood, processed meat, red meat,nuts, poultry, soy, deep-yellow vegetables, green vege-tables, other vegetables, potatoes, starchy vegetablesand tomatoes. Food components included withineach food group are listed in Appendix 1A (availableas Supplementary data at IJE online).
Clinical variables (response variables for RRR)Eight biomarkers that are related to diet, predictiveof chronic disease and mortality risk, availablewithin the ACLS database, and routinely measuredwithin the clinical setting were used as response vari-ables in the RRR analysis. The biomarkers consistedof the body mass index [BMI¼weight (kg)/height(m)2] as a measure of adiposity, blood pressure,total cholesterol, high-density lipoprotein (HDL)-cholesterol, triglycerides, uric acid, white blood cellcount and fasting glucose. The response variablesrepresent the biological pathways by which dietary pat-terns may influence chronic disease and mortality risk.
Height and weight were measured using a stadio-metre and balance beam scale, respectively, and wereused to calculate the BMI. Resting systolic and dia-stolic blood pressure were measured with a mercurysphygmomanometer following standard procedures.16
Mean arterial blood pressure was calculated by addingtwo-third of diastolic to one-third of systolic bloodpressure.21 Fasting plasma levels of total cholesterol,HDL-cholesterol, triglycerides, white blood cell countand glucose were determined by automated techni-ques in the Cooper Clinic laboratory, which meetsquality control standards of the Centres for DiseaseControl and Prevention Lipid StandardizationProgram.16 Finally, serum uric acid was measuredby the URCA method using a Dimension clinicalchemistry system.22
Part B: relation between dietarypatterns with mortalityThe purpose of this section was to determine whetherthe dietary patterns identified in Part A were relatedto CVD mortality and all-cause mortality, andwhether these associations were confounded by phy-sical activity and fitness.
Cardiovascular disease and all-cause mortalityAfter their baseline exam, participants were followeduntil they died, or until 31 December 2003. Possible
decedents were identified from the National DeathIndex and verified with official death certificatesfrom their home states. The National Death Indexhas a sensitivity of 96% and specificity of 100% incohort studies.23 A nosologist coded the deathcertificates for the underlying and up to four contri-buting causes of death. CVD mortality was definedby International Classification of Diseases, NinthRevision (ICD-9) codes 390�449.9 before 1999 andTenth Revision (ICD-10) codes I00�I78 from 1999to 2003.
CovariatesCovariates included age, sex, year of examination,parental history of premature CVD (0¼no, 1¼ eitherparent had stroke or myocardial infarction beforeage 50), history of cancer (0¼no, 1¼ any form ofcancer prior to baseline), prevalent CVD (0¼no,1¼ stroke or myocardial infarction prior to baseline),smoking (never, former and current), alcohol,physical activity and fitness. Alcohol was coded asheavy drinker (5 drinks or more/week) or light ornon-drinker (less than 5 drinks/week). One unit ofalcohol was defined as 12 ounces (3.41 dl) of beer,5 ounces (1.42 dl) of wine or 1.5 ounces (0.43 dl) ofliquor. Physical activity was measured through aself-report questionnaire, which assessed participant’sphysical activity patterns over the last 3 months.24 Ifthe participant reported partaking in an activity, theywere asked to provide additional information aboutthe frequency and distance or time spent in the activ-ity. This information was then used to divide partici-pants into three categories: (i) inactive (no activity);(ii) moderately active (sporting or leisure-time physi-cal activity other than walking or jogging; or walk orjog up to 16 km/week); and (iii) highly active (walk orjog 516 km/week).24 Cardiorespiratory fitness wasassessed by a symptom-limited maximal exercisetreadmill test using a modified Balke protocol.25
Participants began walking on the treadmill with noelevation at 5.3 km/h. At the end of the first minutethe elevation was increased to 2%. Thereafter, the ele-vation was increased 1% /min until the 25th minute.For the few participants who were able to continue425 min, elevation remained constant and speed wasincreased each minute by 0.32 km/h. Participants con-tinued the test to the limits of volitional fatigue. Wedefined low, moderate and high fitness according tothe lowest 20%, the middle 40% and the upper 40%,respectively, of the age- and sex-specific distributionof maximal exercise duration in the overall ACLSpopulation. These cut-points are from previous reportson the relation between fitness and all-cause mortal-ity in the ACLS.10 Because there is no widely acceptedcategorization of fitness, and because we wanted tomaintain consistency in our study methods, we con-tinue to use the above approach. Note that totalenergy intake was not included as a covariate inany of the regression analyses as we felt that this
DIETARY PATTERNS AND THE RISK OF MORTALITY 199

was, at least in part, within the causal pathway bywhich dietary patterns influence chronic disease andmortality risk. Furthermore, caloric intake is positivelyinfluenced by physical activity.26 Regardless, inclusionof absolute (kcal/day) or relative (kcal/kg bodyweight/day) energy intake values as an additionalcovariate in the regression models had a negligibleeffect on the risk estimates that are presented(data not shown).
Statistical analysis
Part A: identification of dietary patternsRRR was used to identify dietary patterns that arepredictive of chronic disease risk. RRR is a true multi-variate statistical test in that several predictor andseveral response variables are included within asingle analysis. The goal of RRR is to identify linearfunctions of the predictor variables (e.g. 24 foodgroups) by explaining as much variation as possiblein the group of response variables (e.g. eight biomark-ers indicative of chronic disease risk).18,19 In orderto choose the number of dietary patterns, a randomsample cross-validation procedure was performed27,28
in which 50 random subsets (each had 2% of the datarandomly selected) were used as test sets. For eachtest set, the complete dataset, excluding observationsin the test set, formed a training set. RRR was per-formed 50 times on the 50 different training sets.Their predictions to the observations in the corre-sponding test sets were summarized [predictedresidual sum of squares (PRESS)] and comparedwith several different dietary patterns. The choice ofthe number of dietary patterns for use was based onthe comparison of these PRESSes. Once the appropri-ate number of patterns was determined, those foodgroups with loadings of 50.2 within each dietarypattern were retained.20,29 RRR was then repeatedusing only those food groups retained.
Part B: relation between dietary patterns withmortalityQuintiles of the dietary pattern scores developed inPart A were created. Significant differences acrossquintiles for the covariates were assessed using a �2
test for categorical variables and general linear modelfor continuous variables. Linear regression for contin-uous covariates and polytomous regression for catego-rical variables were further applied to identify trendsacross quintiles.30,31
Next, quintiles of the dietary pattern scores wereused in a series of Cox proportional hazard regressionanalyses to predict the presence of CVD and all-causemortality over the follow-up period. For eachoutcome, four models were run. The first modelincluded age, sex and year of examination as covari-ates. In addition to these covariates, the second modelincluded smoking, alcohol, parental history of CVD,prevalent CVD and history of cancer. The thirdmodel included the aforementioned covariates as
well as self-reported physical activity categories. Thefourth model differed from the third in that physicalactivity was replaced by fitness categories. To examinethe extent to which physical activity and fitness con-founded the effect of dietary patterns on chronic dis-ease and mortality risk, we examined the magnitudeof change in the hazard ratios when physical activityor fitness were excluded (Model 2) and included(Models 3 and 4) in the models. The proportion ofthe risk of a poor dietary pattern explained by theconfounding effects of physical activity (or fitness)were then calculated as: (HRModel2–HRModel3(or
Model4))/(HRModel2 –1)� 100%.Cox regression analyses also were used to examine
the relationship between fitness categories, and com-bination of dietary and fitness categories, with thestudy outcomes.
Data management and statistical analyses wereperformed with SAS version 9.1 (SAS Institute,Cary, NC, USA).
ResultsPart A: identification of dietary patternsBaseline characteristics of the participants are sum-marized in Table 1. Participants were primarily male(75.7%) with an average age at baseline of 47 years(range 20�84). Based on self-reported physical activ-ity, 49.1% of participants were moderately active,while 25.0% were highly active. Sixty percent, how-ever, had a high cardiorespiratory fitness. The averagecaloric intake was 2151 kcal/day. Participants had anaverage BMI of 25.7 kg/m2, with 39.7% falling in theoverweight range and 13.0% falling in the obeserange. Within the cohort, 190 participants had a his-tory of CVD and 792 had a history of cancer. Over thefollow-up period there were 445 deaths within thecohort, 136 of which were attributed to CVD.
The correlation matrix between the biomarkers isshown in Table 2. The correlations were weak tomodest in strength, with the strongest found betweenBMI and uric acid (r¼ 0.47) and the weakest betweentotal cholesterol and HDL-cholesterol (r¼ 0.06).
Results from the RRR suggested that five dietarypatterns existed, with 18 of the 24 food groupshaving loadings of 50.2 for at least one of thesepatterns. Table 3 shows the percent variation in themultivariate biomarker index (labelled ‘Total’) andthe eight individual biomarkers that were explainedby the five identified dietary patterns. Together, thefive patterns explained 5.66% of the variation withinthe total biomarker index. Pattern 1 explained 4.33%of the overall variation with the other four patternsonly explaining an additional 1.33% between them.
It is important to note that the patterns that arederived from RRR are mutually independent. Thus,because the amount of variation explained byPattern 1 accounted for 76.50% of the total variation
200 INTERNATIONAL JOURNAL OF EPIDEMIOLOGY
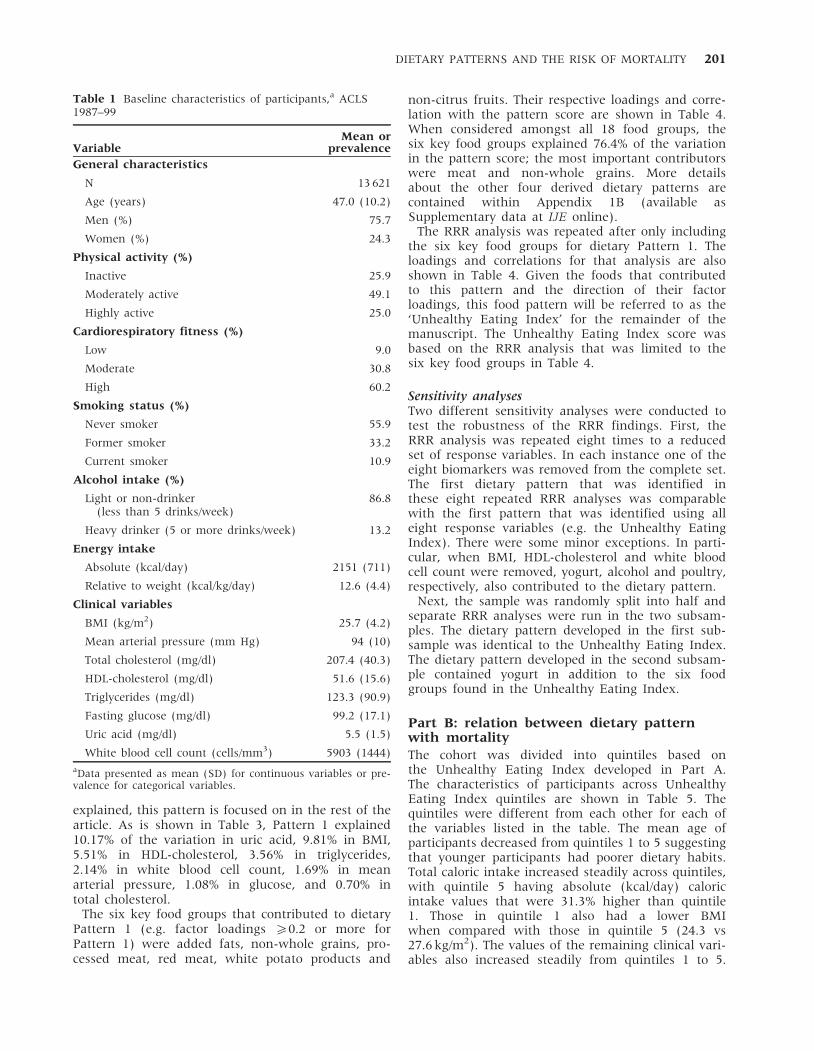
explained, this pattern is focused on in the rest of thearticle. As is shown in Table 3, Pattern 1 explained10.17% of the variation in uric acid, 9.81% in BMI,5.51% in HDL-cholesterol, 3.56% in triglycerides,2.14% in white blood cell count, 1.69% in meanarterial pressure, 1.08% in glucose, and 0.70% intotal cholesterol.
The six key food groups that contributed to dietaryPattern 1 (e.g. factor loadings 50.2 or more forPattern 1) were added fats, non-whole grains, pro-cessed meat, red meat, white potato products and
non-citrus fruits. Their respective loadings and corre-lation with the pattern score are shown in Table 4.When considered amongst all 18 food groups, thesix key food groups explained 76.4% of the variationin the pattern score; the most important contributorswere meat and non-whole grains. More detailsabout the other four derived dietary patterns arecontained within Appendix 1B (available asSupplementary data at IJE online).
The RRR analysis was repeated after only includingthe six key food groups for dietary Pattern 1. Theloadings and correlations for that analysis are alsoshown in Table 4. Given the foods that contributedto this pattern and the direction of their factorloadings, this food pattern will be referred to as the‘Unhealthy Eating Index’ for the remainder of themanuscript. The Unhealthy Eating Index score wasbased on the RRR analysis that was limited to thesix key food groups in Table 4.
Sensitivity analysesTwo different sensitivity analyses were conducted totest the robustness of the RRR findings. First, theRRR analysis was repeated eight times to a reducedset of response variables. In each instance one of theeight biomarkers was removed from the complete set.The first dietary pattern that was identified inthese eight repeated RRR analyses was comparablewith the first pattern that was identified using alleight response variables (e.g. the Unhealthy EatingIndex). There were some minor exceptions. In parti-cular, when BMI, HDL-cholesterol and white bloodcell count were removed, yogurt, alcohol and poultry,respectively, also contributed to the dietary pattern.
Next, the sample was randomly split into half andseparate RRR analyses were run in the two subsam-ples. The dietary pattern developed in the first sub-sample was identical to the Unhealthy Eating Index.The dietary pattern developed in the second subsam-ple contained yogurt in addition to the six foodgroups found in the Unhealthy Eating Index.
Part B: relation between dietary patternwith mortalityThe cohort was divided into quintiles based onthe Unhealthy Eating Index developed in Part A.The characteristics of participants across UnhealthyEating Index quintiles are shown in Table 5. Thequintiles were different from each other for each ofthe variables listed in the table. The mean age ofparticipants decreased from quintiles 1 to 5 suggestingthat younger participants had poorer dietary habits.Total caloric intake increased steadily across quintiles,with quintile 5 having absolute (kcal/day) caloricintake values that were 31.3% higher than quintile1. Those in quintile 1 also had a lower BMIwhen compared with those in quintile 5 (24.3 vs27.6 kg/m2). The values of the remaining clinical vari-ables also increased steadily from quintiles 1 to 5.
Table 1 Baseline characteristics of participants,a ACLS1987–99
VariableMean or
prevalence
General characteristics
N 13 621
Age (years) 47.0 (10.2)
Men (%) 75.7
Women (%) 24.3
Physical activity (%)
Inactive 25.9
Moderately active 49.1
Highly active 25.0
Cardiorespiratory fitness (%)
Low 9.0
Moderate 30.8
High 60.2
Smoking status (%)
Never smoker 55.9
Former smoker 33.2
Current smoker 10.9
Alcohol intake (%)
Light or non-drinker(less than 5 drinks/week)
86.8
Heavy drinker (5 or more drinks/week) 13.2
Energy intake
Absolute (kcal/day) 2151 (711)
Relative to weight (kcal/kg/day) 12.6 (4.4)
Clinical variables
BMI (kg/m2) 25.7 (4.2)
Mean arterial pressure (mm Hg) 94 (10)
Total cholesterol (mg/dl) 207.4 (40.3)
HDL-cholesterol (mg/dl) 51.6 (15.6)
Triglycerides (mg/dl) 123.3 (90.9)
Fasting glucose (mg/dl) 99.2 (17.1)
Uric acid (mg/dl) 5.5 (1.5)
White blood cell count (cells/mm3) 5903 (1444)
aData presented as mean (SD) for continuous variables or pre-valence for categorical variables.
DIETARY PATTERNS AND THE RISK OF MORTALITY 201

Finally, there were gradients in physical activity andfitness across the Unhealthy Eating Index quintiles.The percentage of those in the inactive categoryincreased from 15.2% in quintile 1 to 39.5% in quintile5. A similar trend was seen for fitness where the pre-valence of those in the low-fitness category increasedfrom 4.6% in quintile 1 to 16.8% in quintile 5.
Table 6 lists the results of the regression analyses inwhich quintiles of the Unhealthy Eating Index wereassociated with CVD and all-cause mortality over thefollow-up period. After adjusting for age, sex andyear of examination in Model 1, none of the hazardratios for CVD mortality in quintiles 2�5 was appre-ciably different from quintile 1. For all-cause mortal-ity, the risks were not elevated in quintiles 2�4relative to quintile 1. However, quintile 5 had a mod-estly increased hazard ratio of 1.39 [95% confidenceinterval (CI) 1.02�1.90]. For each of the two outcomemeasures, further adjustment for family history ofCVD, prevalent CVD, history of cancer, smoking andalcohol in Model 2 had a minimal impact on the riskestimates that were observed in Model 1.
We next considered whether the relation betweenthe Unhealthy Eating Index and all-cause mortality
was confounded by physical activity (Table 6,Model 3) and fitness (Table 6, Model 4). The riskestimates for all-cause mortality did not change con-siderably after further controlling for physical activity(Model 2 vs Model 3); however, the risk estimateschanged considerably after further controlling for fit-ness (Model 2 vs Model 4). Only 10.0% of the increasedrisk for all-cause mortality for participants withinquintile 5 of the Unhealthy Eating Index was due tothe confounding effect of physical activity. Conversely,55.0% of the increased risk for all-cause mortality forparticipants in quintile 5 of the Unhealthy EatingIndex was due to the confounding effect of fitness.
The differences in risk across high, moderate andlow physical activity categories for model 3 inTable 6 were as follows: 1.00, 0.70 (95% CI0.48�1.04) and 1.01 (95% CI 0.64�1.60) for CVDmortality; and 1.00, 0.89 (95% CI 0.71�1.11) and1.16 (95% CI 0.89�1.49) for all-cause mortality.When looking at Model 4, the differences in riskacross high, moderate and low fitness categorieswere: 1.00, 1.26 (95% CI 0.85�1.88) and 3.16(95% CI 1.99�5.12) for CVD mortality; and 1.00,1.32 (95% CI 1.06�1.62) and 2.41 (95% CI
Table 3 Percent variation in clinical biomarkers explained by the five identified dietary patterns, ACLS 1987–99
Dietary pattern
Clinical biomarker 1 (Unhealthy Eating Index) 2 3 4 5 Totala
Total biomarker indexb 4.33 0.86 0.29 0.11 0.07 5.66
Uric acid 10.17 0.57 0.54 0.04 0.09 11.39
BMI 9.81 0.03 0.16 0.16 0.1 10.26
HDL-cholesterol 5.51 3.67 0.03 0.17 0.01 9.39
Triglycerides 3.56 0.07 0.01 0.06 0.04 3.74
White blood cell count 2.14 0.03 1.24 0.01 0.02 3.44
Mean arterial pressure 1.69 0.16 0.24 0.03 0.26 2.38
Fasting glucose 1.08 0.16 0.01 0.08 0.06 1.39
Total cholesterol 0.70 2.22 0.13 0.34 0.02 3.28
a‘Total’ column represents the total percentage of variation in biomarkers explained by the five dietary patterns combined.b‘Total biomarker index’ row represents the total percentage of variation for all eight biomarkers combined explained by theidentified dietary patterns.
Table 2 Pearson correlation coefficientsa (r-values) between the biomarker response variables, ACLS 1987–99
Mean arterialpressure
Totalcholesterol
HDL-cholesterol Triglycerides
Fastingglucose
Uricacid
White bloodcell count
BMI 0.35 0.19 �0.39 0.35 0.24 0.47 0.23
Mean arterial pressure 0.20 �0.17 0.24 0.20 0.30 0.09
Cholesterol 0.06 0.36 0.12 0.21 0.09
HDL-cholesterol �0.42 �0.15 �0.40 �0.18
Triglycerides 0.22 0.34 0.20
Fasting glucose 0.14 0.09
Uric acid 0.16
aAll correlations had P < 0.0001.
202 INTERNATIONAL JOURNAL OF EPIDEMIOLOGY

1.80�3.22) for all-cause mortality. Removal of theUnhealthy Eating Index quintile from the modelshad a minimal impact on the risk estimates for bothphysical activity and fitness (data not shown).
To further illustrate the independent effects of dietand fitness, participants were divided into groupsbased on their fitness and Unhealthy Eating Index.For this analysis, the Unhealthy Eating Index scoreswere grouped into three categories: low (quintiles1�2), medium (quintiles 3�4) and high (quintile 5)in a similar but inverted manner to which the threefitness groups were created (e.g. the lowest quintilefor fitness vs the highest quintile for the UnhealthyEating Index indicate the highest-risk participants).The fitness and dietary pattern groups were thencross-tabulated to create nine total groups (three fit-ness� three dietary pattern groups). As shown inFigure 1, fitness was a strong predictor of all-causemortality after consideration of the Unhealthy EatingIndex (Ptrend <0.0001). Conversely, the UnhealthyEating Index was only modestly related to all-cause mortality after consideration of fitness(Ptrend¼ 0.071). Thus, for any given level of fitness therisk of all-cause mortality was only modestly differentacross the Unhealthy Eating Index categories. No inter-actions between the fitness and unhealthy eatingcategories were found for all-cause mortality (P¼ 0.26).
DiscussionIn this large sample of men and women, one domi-nant dietary pattern emerged. This pattern, labelledthe Unhealthy Eating Index, was characterized by ahigher intake of red meat, added fat and simplecarbohydrates, and a lower intake of non-citrusfruits. The Unhealthy Eating Index was associatedwith all-cause mortality risk; however, these relationswere highly confounded by cardiorespiratory fitness.
Part A: identification of dietary patternsPrincipal component and cluster analyses have tradi-tionally been used in nutrition research to derive diet-ary patterns. In principal component analysis, factorscores are derived by combining food items/groupsbased on the degree to which they are correlatedwith one another. In cluster analysis, groups of indi-viduals with similar dietary habits are identified.Conversely, the RRR employed in the present studydetermined dietary patterns by identifying foodgroups that were predictive of chronic disease riskfactors in a multivariate model. RRR is a mix of anexploratory and a hypothesis-oriented approach thatis considered to be more methodologically sound thantraditional approaches.6
The Unhealthy Eating Index derived using RRR inthe present study is similar to dietary patterns thathave previously been derived using the same statisti-cal approach. For example, within a large cohort ofT
ab
le4
Fo
od
gro
up
com
po
nen
tso
fth
eU
nh
ealt
hy
Eati
ng
Ind
ex(t
he
firs
td
ieta
ryp
att
ern
)an
dco
rres
po
nd
ing
load
ings,
AC
LS
19
87
–9
9
RR
Ru
sin
g1
8fo
od
gro
up
sR
RR
usi
ng
6k
ey
foo
dg
rou
ps
on
ly
Fo
od
gro
up
Fo
od
gro
up
con
ten
ts
Sta
nd
ard
ized
para
met
ersc
ore
(lo
ad
ing)
Pea
rson
corr
elati
on
wit
hd
ieta
ryp
att
ern
sco
re
Ex
pla
ined
pro
po
rtio
no
fsc
ore
vari
ati
on
a(%
)
Sta
nd
ard
ized
para
met
ersc
ore
(lo
ad
ing)
Pea
rso
nco
rrel
ati
on
wit
hd
ieta
ryp
att
ern
sco
re
Ex
pla
ined
pro
po
rtio
no
fsc
ore
vari
ati
on
a(%
)
Red
mea
tC
ook
edm
eat
from
bee
f,p
ork
,ve
al,
lam
ban
dgam
e0
.50
0.6
92
5.0
00
.57
0.7
73
2.7
4
Ad
ded
fat
Ad
ded
bu
tter
,m
arg
ari
ne,
oil
san
dd
ress
ings
0.3
70
.51
13
.69
0.4
20
.57
17
.86
Wh
ite
po
tato
pro
du
cts
Wh
ite
po
tato
esin
clu
din
gsu
chth
ings
as
fren
chfr
ies
an
dm
ash
edp
ota
toes
0.3
50
.48
12
.25
0.4
00
.54
16
.33
No
n-w
ho
legra
ins
All
gra
inp
rod
uct
sth
at
are
enri
ched
,u
nen
-ri
ched
,or
fort
ifie
d(e
.g.
wh
ite
bre
ad
,w
hit
ep
ast
a,
cere
als
)
0.3
10
.42
9.6
10
.35
0.4
71
2.5
0
Pro
cess
edm
eat
Fra
nk
furt
ers,
sau
sages
an
dlu
nch
eon
mea
ts0
.25
0.3
46
.25
0.2
80
.38
7.9
9
No
n-c
itru
sfr
uit
All
fru
itex
cep
tfo
rci
tru
s(l
emo
n,
lim
e,o
ran
ge,
gra
pef
ruit
)�
0.3
1�
0.4
39
.61
�0
.35
�0
.48
12
.58
To
tal
76
.41
10
0
aC
alc
ula
ted
as
the
squ
are
of
the
stan
dard
ized
para
met
ersc
ore
mu
ltip
lied
by
10
0%
.
DIETARY PATTERNS AND THE RISK OF MORTALITY 203

European adults a dietary pattern characterized byhigh consumption of red meat, processed meat, poul-try, non-whole grains, legumes, beer and sugary softdrinks, and a low consumption of fresh fruit wasidentified using glycosylated haemoglobin (HbA1c),HDL-cholesterol, C-reactive protein and adiponectinas the response variables.32 Within the CoronaryRisk Factors for Atherosclerosis in Women Study, adietary pattern high in meat, margarine, poultryand sauce; and low in vegetarian dishes, wine, vege-tables and whole-grain cereals was identified using
HDL-cholesterol, low-density lipoprotein (LDL)-cho-lesterol, lipoprotein(a), C-peptide and C-reactive pro-tein.33 Within these two studies the food patternsexplained 7.432 and 7.8%33 of the variation in theresponse variables, which is slightly higher than thevariation of 4.3% that was observed in the presentstudy. This difference is likely due to the increasednumber of biomarker response variables (n¼ 8)included in the current RRR analysis. That similardietary patterns to the Unhealthy Eating Index wereidentified in different cohorts, despite the fact that
Table 5 Baseline characteristicsa across quintiles of the Unhealthy Eating Index, ACLS 1987–99
Quintiles of the Unhealthy Eating Indexb
Q1 (Healthiest) Q2 Q3 Q4 Q5 (Least Healthy)
General characteristics
N 2724 2724 2725 2724 2724
Age (years) 50.0 (10.7) 48.1 (10.0) 47.3 (10.2) 45.2 (9.6) 43.7 (9.3)
Men (%) 60.7 65.5 74.6 83.6 94.1
Women (%) 39.3 34.5 25.4 16.4 5.9
Physical activity (%)
Inactive 15.2 19.9 25.8 29.0 39.5
Moderately active 49.7 51.6 50.0 49.5 44.7
Highly active 35.1 28.5 24.2 21.5 15.8
Cardiorespiratory fitness (%)
Low 4.6 5.4 7.6 10.6 16.8
Moderate 21.6 27.0 30.6 34.5 40.3
High 73.8 67.6 61.8 54.9 42.9
Smoking status (%)
Never smoker 60.1 57.9 56.0 55.3 50.3
Former smoker 35.0 24.7 34.1 31.4 31.1
Current smoker 5.0 7.4 9.9 13.4 18.6
Alcohol intake (%)
Light or non-drinker(less than 5 drinks/week)
92.9 90.3 87.8 83.3 79.6
Heavy drinker (5 drinks or more/week) 7.1 9.7 12.2 16.7 20.5
Energy intake
Absolute (kcal/day) 1834 (576) 1922 (558) 2064 (553) 2265 (585) 2668 (894)
Relative to weight (kcal/kg/day) 11.9 (4.2) 11.9 (3.8) 12.3 (3.9) 12.8 (3.9) 14.1 (5.5)
Clinical variables
BMI (kg/m2) 24.3 (3.9) 24.9 (3.6) 25.5 (3.9) 26.3 (4.3) 27.6 (4.5)
Mean arterial pressure (mm Hg) 92 (11) 93 (10) 93 (10) 94 (10) 96 (10)
Total cholesterol (mg/dl) 203.6 (39.2) 206.2 (40.7) 207.6 (40.0) 208.3 (40.8) 211.3 (40.5)
HDL-cholesterol (mg/dl) 55.9 (16.7) 54.0 (16.3) 52.3 (15.6) 49.5 (14.4) 46.3 (13.0)
Triglycerides (mg/dl) 101.2 (65.1) 113.0 (86.2) 119.8 (78.6) 133.1 (97.0) 149.2 (112.6)
Fasting glucose (mg/dl) 97.1 (14.2) 98.5 (16.5) 98.8 (14.4) 100.1 (19.8) 101.6 (19.3)
Uric acid (mg/dl) 5.0 (1.4) 5.2 (1.4) 5.5 (1.4) 5.8 (1.4) 6.1 (1.4)
White blood cell count (cells/mm3) 5641 (1411) 5764 (1418) 5906 (1427) 5964 (1394) 6239 (1505)
aData presented as mean (SD) for continuous variables or prevalence for categorical variables.bP < 0.05 between quintiles for all variables.
204 INTERNATIONAL JOURNAL OF EPIDEMIOLOGY

Ta
ble
6R
isk
of
card
iova
scu
lar
dis
ease
mo
rtali
ty,
an
dall
-cau
sem
ort
ali
tyacr
oss
qu
inti
les
of
the
Un
hea
lth
yE
ati
ng
Ind
ex;
AC
LS
19
87
–9
9
Qu
inti
les
of
Un
he
alt
hy
Ea
tin
gIn
de
x
Q1
(Hea
lth
iest
)Q
2Q
3Q
4Q
5(L
east
Hea
lth
y)
Ref
eren
tH
R9
5%
CI
HR
95
%C
IH
R9
5%
CI
HR
95
%C
IP
for
tre
nd
CV
Dm
ort
ali
ty
Mo
del
1a
1.0
01
.19
0.7
4–1
.93
0.9
30
.55
–1
.57
1.2
60
.74
–2
.15
1.3
60
.77
–2
.42
0.3
6
Mo
del
2b
1.0
01
.25
0.7
7–2
.02
0.9
80
.58
–1
.67
1.2
90
.75
–2
.23
1.3
80
.77
–2
.47
0.3
4
Mo
del
3c
1.0
01
.25
0.7
7–2
.03
0.9
90
.58
–1
.68
1.3
00
.75
–2
.25
1.3
90
.77
–2
.53
0.3
3
Mo
del
4d
1.0
01
.23
0.7
6–2
.00
0.9
20
.54
–1
.57
1.1
60
.67
–2
.01
1.1
00
.61
–2
.01
0.8
6
Dea
ths
(to
tal
13
6)
35
32
24
24
21
All
-ca
use
mo
rta
lity
Mo
del
1a
1.0
01
.05
0.8
0–1
.37
1.0
60
.80
–1
.39
1.0
30
.76
–1
.41
1.3
91
.02
–1
.90
0.1
0
Mo
del
2b
1.0
01
.06
0.8
1–1
.39
1.0
90
.82
–1
.43
1.0
40
.76
–1
.43
1.4
01
.02
–1
.91
0.1
0
Mo
del
3c
1.0
01
.05
0.8
0–1
.38
1.0
70
.80
–1
.41
1.0
30
.75
–1
.41
1.3
60
.99
–1
.87
0.1
5
Mo
del
4d
1.0
01
.05
0.8
0–1
.37
1.0
30
.78
–1
.36
0.9
60
.70
–1
.31
1.1
80
.86
–1
.64
0.5
5
Dea
ths
(to
tal
44
5)
11
89
59
16
77
4
aA
dju
sted
for
age,
gen
der
an
dye
ar
of
exam
inati
on
.bA
dju
sted
for
age,
gen
der
,ye
ar
of
exam
inati
on
,p
are
nta
lh
isto
ryo
fca
rdio
vasc
ula
rd
isea
se,
his
tory
of
card
iova
scu
lar
dis
ease
,h
isto
ryo
fca
nce
r,sm
ok
ing
an
dalc
oh
ol.
c Ad
just
edfo
rage,
gen
der
,ye
ar
of
exam
inati
on
,p
are
nta
lh
isto
ryo
fca
rdio
vasc
ula
rd
isea
se,
his
tory
of
card
iova
scu
lar
dis
ease
,h
isto
ryo
fca
nce
r,sm
ok
ing,
alc
oh
ol
an
dp
hys
ical
act
ivit
y.dH
R:
haza
rdra
tio
.A
dju
sted
for
age,
gen
der
,ye
ar
of
exam
inati
on
,p
are
nta
lh
isto
ryo
fca
rdio
vasc
ula
rd
isea
se,
his
tory
of
card
iova
scu
lar
dis
ease
,h
isto
ryo
fca
nce
r,sm
ok
ing,
alc
oh
ol
an
dfi
tnes
s.
DIETARY PATTERNS AND THE RISK OF MORTALITY 205

different dietary assessment tools and different bio-marker response variables were considered, demon-strates the robustness of these findings.
Part B: relation between dietary patternwith mortalityWithin our study, higher Unhealthy Eating Indexscores were not associated with a greater risk ofCVD mortality. This may be a result of the lownumber of cardiovascular deaths that occurred inthe cohort. It could further be explained by the factthat BMI and uric acid were the two biomarkers thatwere the most strongly related to the UnhealthyEating Index, and that these biomarkers are strongerrisk factors for chronic diseases such as diabetes34,35
than they are for CVD.36–39
Several recent studies have reported, increased risksof morbidity and mortality in relation to dietary pat-terns identified using RRR.20,33,40–42 For example,Hoffmann and colleagues reported that individualswith unhealthy diets were 61% more likely to die ofall causes than those with healthier diets.20 Severalstudies using other methods to derive dietarypatterns, such as principal component analysis, alsohave found moderate to strong relationships betweendietary patterns with CVD43,44 and all-causemortality.45,46
Although previous studies controlled for physicalactivity when examining the relation between dietarypatterns with chronic disease and mortality risk,without exception these studies relied on self-reportedmeasures of physical activity. For instance,McNaughton and colleagues examined dietary pat-terns that were predictive of diabetes within theWhitehall II study.42 The physical activity question-naire employed in that study asked participants how
often they participated in sports or activates that weremildly energetic, moderately energetic or vigorous.Participants had four response options ranging from‘three times a week or more’ to ‘never/hardly ever’.Participants were then asked to give the averagenumber of hours per week spent in each intensity.47
Measuring physical activity as such is problematic asit is well established that both the volume and inten-sity of physical activity is likely to be over reported.12
Moreover, questionnaire measures of physical activityare only modestly correlated with objective mea-sures.12,13,48 Thus, the confounding effects of physicalactivity on the relation between dietary patterns withchronic disease and mortality risk may not have beenfully controlled for in the existing literature.
Cardiorespiratory fitness was used as a marker ofphysical activity in our study, and our findingsconcur that by employing an objective measure, wewere better able to control for the confounding influ-ence of physical activity. Although fitness has agenetic component,49 fitness is in large measurea reflection of an individual’s physical activityhabits over recent months and weeks.12,17 The ACLS6-month physical activity records obtained before anexercise test showed correlations ranging from 0.66 to0.83 for the activity records and treadmill test results,indicating that fitness is primarily determined byrecent exercise habits.50 Within the present study, fit-ness was strongly related to the Unhealthy EatingIndex and was a strong independent risk factor forthe mortality outcomes examined, confirming that itwas an important confounder to consider. Indeed,after controlling for fitness, the relation between theUnhealthy Eating Index and all-cause mortality wasattenuated to the point that it was no longer signifi-cant. Conversely, after controlling for physical activity,the relation between the Unhealthy Eating Index andall-cause mortality was only minimally attenuated.These findings confirm the a priori research hypoth-esis, and suggest that future studies need to employobjective measures of physical activity.
As with any study, this one had several limitations.Self-reported dietary data are prone to a varietyof unintentional measurement errors. One such biasthat has become well established is a response setreflecting a tendency to present a diet that adheresmore closely to social norms and public health recom-mendations.7,8,51 The ACLS participants who com-pleted 3-day diet records did so voluntarily withthe knowledge that they would be reviewing theirdiet records with a dietician. Therefore, additionalselection and reporting biases may have been intro-duced. Furthermore, 3 days of dietary intake maynot be an accurate representation of habitual intake.Validation studies have suggested that obtainingdiet records for a minimum of 7 days would bemore appropriate for establishing long-termintake.52,53 Despite the limitations of the methodsused to assess dietary intake, 3-day diet records
Figure 1 All-cause mortality risk according to categories ofcardiorespiratory fitness and the unhealthy eating index,ACLS 1987–99
206 INTERNATIONAL JOURNAL OF EPIDEMIOLOGY
have been shown to be a more accurate repre-sentation of actual food intake than foodfrequency questionnaires,54,55 which have been routi-nely used in similar studies.32,33,40 In addition tothe limitations inherent to the measurement of diet-ary intake, it is important to recognize that the gen-eralizability of the results is restricted, given that theACLS cohort is predominantly white and from middleand upper socio-economic strata. Nevertheless, thehomogenous nature of the sample ensures internalcontrol over factors such as ethnicity and socio-economic status.
In conclusion, a dietary pattern high in processedmeat, red meat, added fats, non-whole grains andwhite potato products and low in fresh fruit was arisk factor for all-cause mortality. However, the diet-disease relationship was largely confounded by fitness.Future research in nutritional epidemiology needs todevelop improved methods for both measuringand controlling physical activity as well as diet.
Supplementary DataSupplementary data are available at IJE online.
FundingNational Institutes of Health (AG06945 and HL62508to S.B.); New Investigator Award from the CanadianInstitutes of Health Research (to I.J.); an EarlyResearcher Award from the Ontario Ministry ofResearch and Innovation (to I.J.).
AcknowledgementsWe thank the Cooper Clinic physicians and techni-cians for collecting the baseline data, and staff atthe Cooper Institute for data entry and datamanagement.
Conflict of interest: None declared.
References1 Committee on Diet and Health NRC. Diet and Health:
Implications for Reducing Chronic Disease Risk. Washington,DC: National Academy Press, 1989.
2 Lopez-Garcia E, Schulze MB, Fung TT et al. Major dietarypatterns are related to plasma concentrations of markersof inflammation and endothelial dysfunction. Am J ClinNutr 2004;80:1029–35.
3 Baxter AJ, Coyne T, McClintock C. Dietary patterns andmetabolic syndrome–a review of epidemiologic evidence.Asia Pac J Clin Nutr 2006;15:134–42.
4 Kant AK. Dietary patterns and health outcomes. J Am DietAssoc 2004;104:615–35.
5 Newby PK, Tucker KL. Empirically derived eating pat-terns using factor or cluster analysis: a review. Nutr Rev2004;62:177–203.
6 Schulze MB, Hoffmann K. Methodological approaches tostudy dietary patterns in relation to risk of coronary heartdisease and stroke. Br J Nutr 2006;95:860–69.
7 Hebert JR, Clemow L, Pbert L, Ockene IS, Ockene JK.Social desirability bias in dietary self-report may compro-mise the validity of dietary intake measures. Int JEpidemiol 1995;24:389–98.
8 Hebert JR, Hurley TG, Peterson KE et al. Social desirabil-ity trait influences on self-reported dietary measuresamong diverse participants in a multicenter multiplerisk factor trial. J Nutr 2008;138:226S–34S.
9 Gillman MW, Pinto BM, Tennstedt S, Glanz K, Marcus B,Friedman RH. Relationships of physical activity with diet-ary behaviors among adults. Prev Med 2001;32:295–301.
10 Blair SN, Kampert JB, Kohl HW 3rd et al. Influences ofcardiorespiratory fitness and other precursors on cardio-vascular disease and all-cause mortality in men andwomen. JAMA 1996;276:205–10.
11 Blair SN, Kohl HW 3rd, Paffenbarger RS Jr, Clark DG,Cooper KH, Gibbons LW. Physical fitness and all-causemortality. A prospective study of healthy men andwomen. JAMA 1989;262:2395–401.
12 Aadahl M, Kjaer M, Kristensen JH, Mollerup B,Jorgensen T. Self-reported physical activity comparedwith maximal oxygen uptake in adults. Eur J CardiovascPrev Rehabil 2007;14:422–28.
13 Tudor-Locke CE, Myers AM. Challenges and opportunitiesfor measuring physical activity in sedentary adults.Sports Med 2001;31:91–100.
14 Siconolfi SF, Lasater TM, Snow RC, Carleton RA. Self-reported physical activity compared with maximaloxygen uptake. Am J Epidemiol 1985;122:101–5.
15 American College of Sports Medicine Position Stand. Therecommended quantity and quality of exercise for devel-oping and maintaining cardiorespiratory and muscularfitness, and flexibility in healthy adults. Med Sci SportsExerc 1998;30:975–91.
16 Lee CD, Blair SN, Jackson AS. Cardiorespiratoryfitness, body composition, and all-cause and
KEY MESSAGES
� A dietary pattern high in processed and red meat, white potato products, non-whole grains, added fatand a smaller consumption of non-citrus fruits is a modest risk factor for all-cause mortality.
� Fitness is an important confounder in the diet–mortality relationship.
DIETARY PATTERNS AND THE RISK OF MORTALITY 207

cardiovascular disease mortality in men. Am J Clin Nutr1999;69:373–80.
17 Finley CE, LaMonte MJ, Waslien CI, Barlow CE, Blair SN,Nichaman MZ. Cardiorespiratory fitness, macronutrientintake, and the metabolic syndrome: the AerobicsCenter Longitudinal Study. J Am Diet Assoc2006;106:673–79.
18 Moeller SM, Reedy J, Millen AE et al. Dietary patterns:challenges and opportunities in dietary patterns researchan Experimental Biology workshop, April 1, 2006. J AmDiet Assoc 2007;107:1233–39.
19 Jinlin F, Binyou W, Terry C. A new approach to the studyof diet and risk of type 2 diabetes. J Postgrad Med2007;53:139–43.
20 Hoffmann K, Boeing H, Boffetta P et al. Comparison oftwo statistical approaches to predict all-cause mortalityby dietary patterns in German elderly subjects.[see com-ment]. Br J Nutr 2005;93:709–16.
21 McArdle W, Katch F, Katch V. Exercise Physiology: Energy,Nutrition and Human Performance. 5th edn. Maryland:Lippincott Williams & Wilkins, 2001, p. 312.
22 Church TS, Finley CE, Earnest CP, Kampert JB,Gibbons LW, Blair SN. Relative associations of fitnessand fatness to fibrinogen, white blood cell count, uricacid and metabolic syndrome. Int J Obes Relat MetabDisord 2002;26:805–13.
23 National Death Index: National Center for Health Statistics,2003.
24 Kampert JB, Blair SN, Barlow CE, Kohl HW 3rd. Physicalactivity, physical fitness, and all-cause and cancermortality: a prospective study of men and women.Ann Epidemiol 1996;6:452–57.
25 Balke B, Ware RW. An experimental study of physicalfitness of Air Force personnel. US Armed Forces Med J1959;10:675–88.
26 Brodney S, McPherson RS, Carpenter RS, Welten D,Blair SN. Nutrient intake of physically fit andunfit men and women. Med Sci Sports Exerc 2001;33:459–67.
27 Krzanowski W, Kline P. Cross-Validation for choosing thenumber of important components in principal componentanalysis. Multivariate Behav Res 1995;30:6.
28 Giancarlo D, Tommasi C. Cross-validation methods inprincipal component analysis: a comparison. Stat MethodsAppl 2002;11:11.
29 Raubenheimer J. An item selection procedure to maxi-mize scale reliability and validity. S Afr J Ind Psychol2004;30:5.
30 Hosmer D, Lemeshow S. Applied Logisitc Regression.New York: Wiley, 2000.
31 Selvin S. Statistical Analysis of Epidemiologic Data. 2nd edn.Oxford: Oxford Univeristy Press, 1996, p. 227.
32 Heidemann C, Hoffmann K, Spranger J et al. A dietarypattern protective against type 2 diabetes in the EuropeanProspective Investigation into Cancer and Nutrition(EPIC)–Potsdam Study cohort. Diabetologia 2005;48:1126–34.
33 Hoffmann K, Zyriax BC, Boeing H, Windler E. A dietarypattern derived to explain biomarker variation is stronglyassociated with the risk of coronary artery disease. Am JClin Nutr 2004;80:633–40.
34 Katzmarzyk PT, Janssen I. The economic costs associatedwith physical inactivity and obesity in Canada: an update.Can J Appl Physiol 2004;29:90–115.
35 Dehghan A, van Hoek M, Sijbrands EJ, Hofman A,Witteman JC. High serum uric acid as a novel riskfactor for type 2 diabetes. Diabetes Care 2008;31:361–62.
36 Montalcini T, Gorgone G, Gazzaruso C, Sesti G,Perticone F, Pujia A. Relation between serum uric acidand carotid intima-media thickness in healthy postmeno-pausal women. Intern Emerg Med 2007;2:19–23.
37 Culleton BF, Larson MG, Kannel WB, Levy D. Serum uricacid and risk for cardiovascular disease and death: theFramingham Heart Study. Ann Intern Med 1999;131:7–13.
38 Manzato E. Uric acid: an old actor for a new role. InternEmerg Med 2007;2:1–2.
39 Toschi V. Elevated uric acid and cardiovascular disease.How strong is the evidence of a pathogenetic link? InternEmerg Med 2007;2:320–21.
40 Hoffmann K, Schulze MB, Schienkiewitz A, Nothlings U,Boeing H. Application of a new statistical method toderive dietary patterns in nutritional epidemiology. Am JEpidemiol 2004;159:935–44.
41 Schulze MB, Hoffmann K, Manson JE et al. Dietarypattern, inflammation, and incidence of type 2 diabetesin women. Am J Clin Nutr 2005;82:675–84; quiz 714–15.
42 McNaughton SA, Mishra GD, Brunner EJ. Dietary pat-terns, insulin resistance, and incidence of type 2 diabetesin the Whitehall II Study. Diabetes Care 2008;31:1343–48.
43 Fung TT, Willett WC, Stampfer MJ, Manson JE, Hu FB.Dietary patterns and the risk of coronary heart disease inwomen. Arch Intern Med 2001;161:1857–62.
44 Hu FB, Rimm EB, Stampfer MJ, Ascherio A,Spiegelman D, Willett WC. Prospective study of majordietary patterns and risk of coronary heart disease inmen. Am J Clin Nutr 2000;72:912–21.
45 Heidemann C, Schulze MB, Franco OH, van Dam RM,Mantzoros CS, Hu FB. Dietary patterns and risk of mor-tality from cardiovascular disease, cancer, and all causesin a prospective cohort of women. Circulation2008;118:230–37.
46 Osler M, Heitmann BL, Gerdes LU, Jorgensen LM,Schroll M. Dietary patterns and mortality in Danishmen and women: a prospective observational study. BrJ Nutr 2001;85:219–25.
47 Civil Service Occupational Health Service. Health Survey:Whitehall II Study, 1993.
48 LaPorte RE, Montoye HJ, Caspersen CJ. Assessment ofphysical activity in epidemiologic research: problemsand prospects. Public Health Rep 1985;100:131–46.
49 Bouchard C, Malina R, Perusse L. Genetics of Fitness andPhysical Performance. 1st edn. Champaign: HumanKinetics, 1997.
50 Paffenbarger RS Jr, Blair SN, Lee IM, Hyde RT.Measurement of physical activity to assess health effectsin free-living populations. Med Sci Sports Exerc1993;25:60–70.
51 Hebert JR, Ma Y, Clemow L et al. Gender differences insocial desirability and social approval bias in dietary self-report. Am J Epidemiol 1997;146:1046–55.
52 Basiotis PP, Welsh SO, Cronin FJ, Kelsay JL, Mertz W.Number of days of food intake records required to
208 INTERNATIONAL JOURNAL OF EPIDEMIOLOGY

estimate individual and group nutrient intakes withdefined confidence. J Nutr 1987;117:1638–41.
53 Acheson KJ, Campbell IT, Edholm OG, Miller DS,Stock MJ. The measurement of food and energy intakein man-an evaluation of some techniques. Am J Clin Nutr1980;33:1147–54.
54 Tokudome Y, Goto C, Imaeda N et al. Relative validity of ashort food frequency questionnaire for assessing nutrient
intake versus three-day weighed diet records in middle-aged Japanese. J Epidemiol 2005;15:135–45.
55 Day N, McKeown N, Wong M, Welch A, Bingham S.Epidemiological assessment of diet: a comparison of a7-day diary with a food frequency questionnaire usingurinary markers of nitrogen, potassium and sodium.Int J Epidemiol 2001;30:309–17.
Published by Oxford University Press on behalf of the International Epidemiological Association
� The Author 2009; all rights reserved. Advance Access publication 3 December 2009
International Journal of Epidemiology 2010;39:209–211
doi:10.1093/ije/dyp348
Commentary: Relative importance of diet vsphysical activity for healthEric L Ding1 and Frank B Hu1,2*
1Department of Nutrition, Harvard School of Public Health, Boston, MA, USA and 2Department of Epidemiology, Harvard School ofPublic Health, Boston, MA, USA.
Corresponding author. Department of Nutrition, Harvard School of Public Health, 655 Huntington Avenue, Boston, MA 02115,USA. E-mail: [email protected]
Accepted 30 July 2009
Physical inactivity and poor diet are both commonlyreported to be associated with a wide range of chronicdiseases, including hypertension, type 2 diabetes, cor-onary heart disease (CHD) and stroke, and, together,contribute to substantial burden of disease.1 Althoughit is well known that those who follow a healthy dietalso frequently have higher levels of physical activity,which may lead to confounding, diet and physicalactivity may also share and affect many commonbiological disease mechanisms, such as blood pres-sure, lipids, glucose, inflammation and adiposity.Therefore, some questions still remain whether diet-ary associations are (i) confounded by physical activ-ity, (ii) causally independent of physical activity and/or (iii) obviated by physical activity supersedingdietary effects in mutually shared intermediatedisease pathways.
In this issue of the IJE, Heroux et al.2 conducted acareful analysis to investigate the association of dis-ease intermediate-derived dietary patterns and risk ofmortality, and whether such a derived dietary patternis associated with risk independent of physical activ-ity. Conducted in a unique cohort comprising partici-pants visiting an aerobic fitness centre, the authorsused reduced rank regression (RRR) on a battery ofbiological intermediates—including body mass index,blood pressure, high-density lipoprotein and totalcholesterol, triglyceride, fasting glucose, uric acid
and white blood cell levels—to derive a dietary pat-tern score predictive of adverse levels of these inter-mediates. They found that adverse dietary patternscore associations were attenuated and the scorewas not predictive of mortality after controlling forself-reported physical activity and treadmill-assessedcardiorespiratory fitness levels in particular.
The findings, at first glance, appear to suggest thatdietary associations with mortality are either con-founded or trumped by physical activity. However,such a conclusion should be interpreted in the contextof numerous previous epidemiological studies, wheredietary factors have been found to be associated withrisk of type 2 diabetes, CHD, stroke, cancer and mor-tality, independent of lifestyle factors including phys-ical activity levels.3 With a modest number ofendpoints (136 cardiovascular deaths and 445 totaldeaths), statistical power of this analysis is somewhatlimited, which may explain the lack of overall signif-icant trends between the RRR dietary pattern andCVD and total mortality, even before adjustment forphysical activity or fitness. Conceptually, becausedietary factors may influence physical fitness directlyor indirectly through body weight, it can be arguedthat dietary associations are mediated rather thansimply confounded by physical fitness.
Diet is a highly complex exposure, which can beanalysed in many ways, including macronutrient
DIETARY PATTERNS AND THE RISK OF MORTALITY 209