Tilling the Soil in Tanzania - Open Research Online oro.open ...
323
Open Research Online The Open University’s repository of research publications and other research outputs Tilling the Soil in Tanzania: What Do Emerging Economies Have to Offer? Thesis How to cite: Agyei-Holmes, Andrew (2014). Tilling the Soil in Tanzania: What Do Emerging Economies Have to Offer? PhD thesis The Open University. For guidance on citations see FAQs . c 2014 The Author https://creativecommons.org/licenses/by-nc-nd/4.0/ Version: Version of Record Link(s) to article on publisher’s website: http://dx.doi.org/doi:10.21954/ou.ro.0000f00f Copyright and Moral Rights for the articles on this site are retained by the individual authors and/or other copyright owners. For more information on Open Research Online’s data policy on reuse of materials please consult the policies page. oro.open.ac.uk
-
Upload
khangminh22 -
Category
Documents
-
view
4 -
download
0
Transcript of Tilling the Soil in Tanzania - Open Research Online oro.open ...

Open Research OnlineThe Open University’s repository of research publicationsand other research outputs
Tilling the Soil in Tanzania: What Do EmergingEconomies Have to Offer?ThesisHow to cite:
Agyei-Holmes, Andrew (2014). Tilling the Soil in Tanzania: What Do Emerging Economies Have to Offer?PhD thesis The Open University.
For guidance on citations see FAQs.
c© 2014 The Author
https://creativecommons.org/licenses/by-nc-nd/4.0/
Version: Version of Record
Link(s) to article on publisher’s website:http://dx.doi.org/doi:10.21954/ou.ro.0000f00f
Copyright and Moral Rights for the articles on this site are retained by the individual authors and/or other copyrightowners. For more information on Open Research Online’s data policy on reuse of materials please consult the policiespage.
oro.open.ac.uk

the Soil in Tanzania: What Do Emerging Economies Have to Offer?
Thesis submitted for the Degree of Doctor of Philosophy International Development Economics
(Development Policy and Practice)The Open University
Andrew Agyei-HolmesBSc Agriculture (Kumasi)
MPhil Agricultural Economics (Ghana)
August, 2014

ProQuest N um ber: 13835442
All rights reserved
INFORMATION TO ALL USERS The qua lity of this reproduction is d e p e n d e n t upon the qua lity of the copy subm itted.
In the unlikely e ve n t that the au tho r did not send a co m p le te m anuscrip t and there are missing pages, these will be no ted . Also, if m ateria l had to be rem oved,
a no te will ind ica te the de le tion .
uestProQuest 13835442
Published by ProQuest LLC(2019). C opyrigh t of the Dissertation is held by the Author.
All rights reserved.This work is protected aga inst unauthorized copying under Title 17, United States C o de
M icroform Edition © ProQuest LLC.
ProQuest LLC.789 East Eisenhower Parkway
P.O. Box 1346 Ann Arbor, Ml 4 81 06 - 1346

ABSTRACT
Close to 70% of Tanzanian farmers are small scale resource-poor subsistence
operators, cultivating an average of less than 1 to 3 hectares of mainly rain-fed land,
deteriorated by continuous cropping and lack of fertility management. In the farmers’
effort to move up the commercialisation continuum and alleviate poverty through
increased output and incomes, innovation and technical change is key. However,
liquidity constraints and prohibitive prices have in the past discouraged farmer
investment in capital goods (power tillers and tractors). This is a limiting factor for
increased cropping area and timeliness of operation which has the potential to positively
affect crop output and incomes. In the face of these difficulties, the farmer is prepared to
trade-off quality and variety, for relatively low priced capital goods, provided they are
good enough and rely less on heavily built infrastructure. In recent decades, the capital
goods market for power tillers and tractors has become dynamic with respect to cost,
quality and origin of production. With new entrants like China, India and Pakistan joining
Western Europe, USA and Japan in the supply of farm machinery, the range of choice
for the Tanzanian farmer is increasing. Chinese, Indian and Pakistani power tillers and
tractors have some distinctiveness in their engineering, acquisition cost, operational cost
and their supply chains which may be useful in more ways to the small farmer in
Tanzania. This thesis appraises the pro-poor nature of emerging economy tillage capital
goods, placing particular emphases on how an optimal technological choice is made. It
examines the role that cost innovators’ from emerging economies (China/India/Pakistan)
are playing in meeting the farmers’ choice objective particularly with regard to cost,
labour intensity and scale of operation. In as far as Tanzanian farmers are concerned the
study discusses the role that local institutions can play to enhance choice, access and
efficient use of such capital goods for higher productivity which may translate into
increased incomes. The study draws on both qualitative and quantitative data to

compare advanced country tractors and power tillers with those from emerging
economies and finds that; First, aid/government support, trade and FDI/licencing are key
conduits for technology imports into Tanzania. Flowever, trade has been very important
for emerging economy machines whilst aid/government support has been found to be
key for advanced country machines. Second, in terms of penetration and extent of use
among Tanzanian farmers emerging economy machines are more popular than
advanced country ones when it comes to power tillers. Nevertheless, the total stock of
advanced country tractors in Tanzania are known to be larger than emerging economy
ones; though we are recently witnessing a recent rapid increase in the former than the
latter. Third, advanced country machines are generally superior in terms of engineering
performance and work efficiency when compared with emerging economy ones. That
said, it is worth noting that the advanced country machines are capital intensive and
involve higher maintenance costs because of higher spare parts and repair cost. Finally,
emerging economy machines are more pro-poor than matured market ones since they
create more opportunities for employment and capability building among capital
constrained users and dealers.

In memory of grandma, Nana Ama Pokua, you taught me how to spell my name!

ACKNOWLEDGEMENTS
The conceptualization of this research enquiry, the field work activities, data analyses
and discussions took a period of three years within the UK and Tanzania. There were
also pre-studies preparations in Ghana. During this three-year period, several individuals
were helpful and supported me in diverse ways. I am particularly grateful to my
supervisors, Prof Raphael Kaplinsky and Dr Rebecca Hanlin who provided unrivalled
guidance during the whole process- I am most grateful to them. I am indebted to my
fellow student team, Richmond Atta-Ankomah and David Botchie who provided both
intellectual and emotional support. I am grateful to Joseph Kuzilwa, Vice Chancellor of
Mzumbe University whose interest in my work moved him to provide accommodation on
the University Campus in Morogoro and the necessary social networks required to get
every stage of the data collection process kick-started. Jacob Salisu was a very reliable
research assistant who provided several forms of help. Felix Temu, a retired extension
officer was perhaps the most influential person in terms of shaping the structure of the
fieldwork across regions and districts of Tanzania. My thanks goes to him for being there
whenever needed. My thanks also goes to Lameck Hazare, an officer at the
mechanisation department in Dar es Salaam for his guidance and support throughout the
field work. There were several other people within the Tanzanian local government,
agricultural sector and the tractor industry whose help contributed significantly to this
work but are not named here, my appreciation goes to them all. My thanks also goes to
Prof Mike Morris of University of Cape Town and Prof George Owusu of University of
Ghana - their advice made me decide to study at the OU and also participate in this
study. I couldn’t forget Jenny Wright, Marlene Gordon, Olivia Acquah and Donna Deacon
whose secretarial support saw me through my stay at the OU - your help is appreciated.
Further appreciation goes to all the staff and students within the Development Policy and
Practice Unit for the interest shown in my work and personal wellbeing.
TABLE OF CONTENTS
ABSTRACT......................................................................................................................... i
ACKNOWLEDGEMENTS..................................................................................................iv
TABLE OF CONTENTS..................... v
LIST OF TABLES...............................................................................................................x
LIST OF FIGURES...........................................................................................................xii
LIST OF ACRONYMS..................................................................................................... xiii
Chapter 1 : Introduction..................................................................................................... 1
1.1 The economic impasse....................................................................................... 1
1.2 Agriculture as a strategy for poverty reduction....................................................2
1.3 Technology: a necessary tool for agricultural sector growth................................2
1.4 Traditional north and indigenous technologies....................................................4
1.5 Filling the gap....................................................................................................... 5
1.6 Organization of the thesis.....................................................................................8
Chapter 2 : Tanzania, Mechanisation and Rural Development........................................11
2.1 Introduction.........................................................................................................11
2.2 Economic situation, national accounts and trade............................................... 13
2.2.1 Institutions and infrastructure in Tanzania...................................................23
2.2.2 Labour force capabilities, core competence and employment....................27
2.2.3 Diplomatic relations and international trade................................................29
2.3 Agricultural mechanisation in Tanzania: how far so far?....................................35
2.3.1 Brief history of tractors and power tillers in the last century.............................37
2.3.2 Current demand and supply of power tillers and tractors............................39
2.3.3 Where should Tanzanian farmers look?..................................................... 47
2.4 Conclusion...................................................................................................... :..48
Chapter 3 : Innovation, Technological Choice and Technology Transfer........................ 50
3.1 Introduction.........................................................................................................50
3.2 Importance of mechanisation in SSA..................................................................50
3.3 Changing economic fortunes of SSA and the emerging economies..................54
3.3.1 New possibilities for revamping the sector and choice of technique............... 55
3.3.2 Empirical studies.............................................................................................. 55
3.3.3 Changing innovation landscape.......................................................................58
3.4 Optimality and appropriateness of technology choice........................................... 61
3.5 Induced technical change and technical bias.........................................................66
v

3.6 The measurement problem: contribution of K and L to productivity..................... 67
3.7 Technology transfer and diffusion..................................................................... 70
3.8 Conclusion......................................................................................................... 75
Chapter 4 : Methodology................................................................................................ 77
4.1 Introduction........................................................................................................ 77
4.2 Conceptual framework and research design..................................................... 77
4.3 Sampling and data considerations.....................................................................80
4.3.1 Institutional survey protocol for market structure and key informants 83
4.3.2 Farm survey and protocol used...................................................................84
4.3.3 Operational and performance data............................................................. 88
4.3.4 Sector overview data..................................................................................89
4.4 Data collection process...................................................................................... 89
4.5 Data analyses.....................................................................................................91
4.5.1 Research question 1...................................................................................91
4.5.2 Research question 2 ................................................................................... 92
4.5.3 Research question 3 ................................................................................... 92
4.5.4 Research question 4 ....................................................................................... 92
4.6 Conclusion..........................................................................................................94
Chapter 5 : Users and Capital Goods Classification....................................................... 95
5.1 Introduction.........................................................................................................95
5.2 Farm mechanisation...........................................................................................97
5.3 Soils, capital goods and farming systems.........................................................99
5.3.1 Soils...........................................................................................................100
5.3.2 Tillage capital goods: engineering characteristics and quality.................. 102
5.3.3 Farming systems, common crops and appropriate capital goods 105
5.3.4 Summary....................................................................................................... I l l
5.4 Study sites and farming systems.............................................................. 114
5.4.1 Morogoro (Mvomero District- Dakawa and Turiani)................................... 115
5.4.2 Mbeya (Mbarali District- Ubaruku and Mbuyuni)....................................... 117
5.4.3 Iringa (Iringa District - Pawaga and Nzihi)..................................................120
5.4.4 Manyara (Babati District- Gallapo and Magugu)........................................122
5.4.5 Dodoma (Kongua District- Hembahemba and Ngomai)............................. 123
5.5 Mechanisation choice sets and alternatives................................................... 126
5.5.1 Brands from the international market............................................................ 126
5.5.2 Local manufacturing of tractors and power tillers...........................................131
vi

5.6 Operating conditions (OC)................................................................................132
5.6.1 OC1: Power tillers on paddy fields (small scale)....................................... 132
5.6.2 OC2: Tractors on sandy maize fields which (small/medium/large scale) .133
5.6.3 OC3: Tractors on Maize and Tobacco fields (medium/large scale)........... 134
5.6.4 OC4: Tractors on upland rice and sugarcane (small/medium/large)......... 134
5.6.5 OC5: Tractors on irrigated rice and sugarcane (medium/large scale)........134
5.7 Conclusion........................................................................................................136
Chapter 6 : Technology Transfer, Diffusion and Penetration.........................................138
6.1 Introduction.......................................................................................................138
6.2 Mode of technology transfer and diffusion........................................................139
6.2.1 Tractors..................................................................................................... 140
6.2.2 Power Tillers.............................................................................................. 144
6.3 Importer, distributer and farmer linkages..........................................................149
6.4 Dealers’ transactions costs.............................................................................. 153
6.5 Penetration and extent of use.......................................................................... 157
6.5.1 National level penetration of power tillers.................................................. 157
6.5.2 National level penetration of tractors......................................................... 158
6.5.3 Penetration of power tillers within study sites.............................................160
6.5.4 Penetration of tractors within study sites.................................................... 161
6.5.5 Extent of use: a micro level discussion......................................................162
6.6 Financing investment and running costs.................................................. 165
6.6.1 Savings from farm businesses................................................................... 166
6.6.2 Savings from non-farm business................................................................167
6.6.3 Borrowing from family and friends..............................................................167
6.6.4 Loans without interest from local traders................................................... 168
6.6.5 Loans from commercial banks without intermediaries............................... 169
6.6.6 Loans from commercial and development banks with intermediaries........169
6.7 Conclusion........................................................................................................171
Chapter 7 : The Distinctive Nature of Capital Goods..................................................... 173
7.1 Introduction.......................................................................................................173
7.2 The field survey................................................................................................ 175
7.3 Basic engineering distinctions of capital goods................................................177
7.3.1 MM (MM0and MMi) power tillers................................................................177
7.3.2 EE (EE-! and EE0) power tillers................................................................... 178
7.3.3 MM (MM0 and MMO Tractors...................................................................... 179
vii

7.3.4 EEi and EE0 Tractors................................................................................179
7.4 Machine performance: land preparation, transportation and other uses 180
7.5 Output and coefficients of production.............................................................182
7.5.1 Revenue and costs......................................................................................187
7.5.2 Gross revenue..........................................................................................188
7.5.3 Cost structure: investment and running costs........................................... 189
7.5.4 Net revenue per annum............................................................................ 202
7.6 Rates of return: dynamic optimality..................................................................204
7.7 Capacity utilisation...............................................................................................210
7.8 Conclusion....................................................................................................... 211
Chapter 8 : Economic Profitability, Diffusion and Social Optimality...............................213
8.1 Introduction...................................................................................................... 213
8.2 Physical ratios, return on investment and diffusion of technologies.................213
8.2.1 Relationship between coefficients of production and diffusion.................. 217
8.2.2 Economic profitability and diffusion.......................................................... 222
8.2.3 Explaining profit and diffusion convergence or divergence.......................224
8.3 Financing......................................................................................................... 228
8.3.1 Farm profits and savings...........................................................................228
8.3.2 Commercial Bank loans and Agricultural Input Trust Fund...................... 235
8.3.3 Impact of choice on actors in value chain..................................................237
8.4 Fitness for purpose, environment and health issues........................................241
8.4.1 Fitness for purpose ...........................................................................242
8.4.2 Health, safety and environment................................................................244
8.5 Conclusion .................................................................................................. 247
Chapter 9 : Summary, Conclusion and Implications for Policy......................................248
9.1 Introduction..........................................................................................................248
9.2 Brief summary.................................................................................................. 248
9.2.1 Scale, sources, categories and users........................................................... 250
9.2.2 Role of actors and institutions.......................................................................251
9.3 Originality of thesis and answers to research questions......................................253
9.3.1 Research question 1..................................................................................... 258
9.3.2 Research question 2 ..................................................................................... 258
9.3.3 Research question 3 ..................................................................................... 260
9.3.4 Research question 4 ..................................................................................... 263
9.4 Implications for theory......................................................................................... 266
viii

9.4.1. The impact of China/lndia-SSA engagements..............................................267
9.3.2. The BRI literature..........................................................................................267
9.4.3. Schumacher meets Schumpeter...................................................................268
9.4.4. Absorptive capacity..................................................................................................................... 269
9.4.5. Diverse patterns of mechanisation and value chain impacts........................ 270
9.5 Implications for policy...........................................................................................271
9.5.1 Regulatory policies........................................................................................ 272
9.5.2 Manufacturing policies...................................................................................272
9.5.3 Policies which target transfer and diffusion processes.................................. 275
9.5.4 User absorptive capacity policies...................................................................275
9.5.5 Credit policies................................................................................................ 277
9.5.6 Information asymmetry.................................................................................. 277
9.6 Directions for future research...............................................................................279
9.6.1 Completing matrix for discussion and outcome of new entrants....................279
9.8.2 Factors influencing choice..............................................................................279
9.6.3 Skill gaps........................................................................................................280
9.6.4 Understanding the manufacturers..................................................................280
9.6.5 Lessons for other crops, sectors and countries............................................. 281
9.7 Conclusion........................................................................................................... 282
References.................................................................................................................... 285
ix

LIST OF TABLES
Table 1.1: Approximate farm size by world region............................................................ 6Table 2.1: GDP Growth and GDP per capita by country and groups, 1990-2010........... 15Table 2.2: Yield per hectare (maize) by country and selected years...............................19Table 4.1: Key informant interviews by region and by type of informant (count).............84Table 4.2: Regions, communities and samples drawn.................................................... 88Table 4.3: Research questions and data needs.............................................................. 93Table 5.1: Classification of capital goods features, scale and technology.....................103Table 5.2: Durability and quality ratings of capital goods...............................................105Table 5.3: Farming systems, crops and soils................................................................ 112Table 5.4: Optimal technologies (engineering and quality)........................................... 113Table 5.5: Study sites and agro-economic indicators.................................................... 125Table 5.6: Scale of technology, source and brand available in Tanzania......................130Table 5.7: Photographs of the selected machines for comparison................................135Table 5.8: Analytical matrix .................................................................................. 137Table 6.1: Tabular summary of mode of tractor technology transfer: Aid, Trade & FDI 144 Table 6.2: Tabular summary of mode of power tiller technology transfer: aid &government support, Trade and FDI.............................. 148Table 6.3: Power tiller utilization across study sites...................................................... 161Table 6.4: Tractor brands within sample by country of origin (Frequency and Percent) 161Table 6.5: Sources of credit for farmers purchasing their machines with debt...............171Table 7.1: Users, crops, soils, scale and origin of machines covered........................... 176Table 7.2: Average age, economic life and horsepower by scale and category............180Table 7.3: Farm operations that tractors and power tillers can perform.........................181Table 7.4: Tillage performance of technologies: output and labour inputs (ploughing). 185 Table 7.5: Tillage performance of technologies: output and labour inputs (paddling and harrowing)......................................................................................................................186Table 7.6: Average acquisition cost of machines, by category and scale. (TSH 000,000)...................................................................................................................................... 191Table 7.7: Annual investment cost at prevailing interest rate of 8.05% (TSH ‘000,000)193 Table 7.8: Productivity ratios using annual investment costs (adjusted & unadjustedversion)..........................................................................................................................194Table 8.1: Ranking of technologies by employment, labour intensity, benefit-cost ratioand capacity utilization.................................................................................................. 215Table 8.2: Coefficients of production and diffusion, OC1............................................. 218Table 8.3: Coefficients of production and diffusion, OC2............................................. 219Table 8.4: Coefficients of production and diffusion, OC3............................................. 220Table 8.5: Coefficients of production and diffusion**, OC4.......................................... 220Table 8.6: Coefficients of production and diffusion, OC5............................................. 221Table 8.7: Economic optimality and diffusion**............................................................. 223Table 8.8: Farm size, crops, national output, household wealth and savings from farming ...................................................................................................................................... 230
Table 8.9: Operating conditions and number of years required to save by small, mediumand large scale farmers for the purposes of purchasing the different technologies 234Table 8.10: Financing MM and EE procurement with a fixed annual loan from banks.. 236

Table 8.11: Choice under OC1 and employment effects..............................................238Table 8.12: Choice under OC2 and employment effects..............................................239Table 8.13: Choice under OC3 and employment effects..............................................240Table 8.14: Choice of technique under OC4 and employment effects...................240Table 8.15: Choice of technique under OC5 and employment effects...................241Table 8.16: Pollution and ergonomic Indicators............................................................. 247Table 9.1: Characteristics of operating conditions.........................................................250Table 9.2: Summary of findings......................................................................................256
xi

LIST OF FIGURES
Figure 2.1: Agricultural map of Tanzania.........................................................................14Figure 2.2: Sector contribution to GDP by country and country groups (%).................... 16Figure 2.3: Food and cash crops composition, 1998-2008 .......................................... 18Figure 2.4: Depth of food deficit in East Africa (kcal/capita/day, 3-year average), % ......20Figure 2.5: Cost of capital (real interest rates) in East Africa, 2000 and 2010 (%).........22Figure 2.6: Ease of doing business in Tanzania compared with other countries.............23Figure 2.7: Lead time to clear imported goods from the Dar es Salaam Port (days)..... 26Figure 2.8: Imports, source and value (‘000 of current US$, 1988-2010).......................34Figure 2.9: Exports destination and total Value (‘000 of current US$, 1988 to 2010)....... 34Figure 2.10: Volume of world tractor production, 2012 (’000)......................................... 40Figure 2.11: Tractor Imports into Tanzania, 1988-2008 (US$ ‘000)................................ 48Figure 4.1: Conceptual framework.................................................................................. 78Figure 5.1: Soil triangle................................................................................................. 101Figure 7.1: Gross revenue from land preparation, transportation and other activates byscale of machine and source per season (000,000 of TSH)..........................................189Figure 7.2: Efficiency ratios using acquisition and replacement costs........................... 192Figure 7.3: Fuel and lubricant costs by category of machine (TSH ‘000,000)................197Figure 7.4: Maintenance cost per annum...................................................................... 199Figure 7.5: Labour cost under the different operating conditions per annum (TSH‘000,000) 201Figure 7.6: Net profit margins by OCs and category of machine................................... 203Figure 7.7: Benefit-Cost Ratios......................................................................................207Figure 7.8: Benefit-Cost Ratios (all government subsidies removed)............................ 209Figure 7.9: Capacity utilization of technologies by category and OCs........................... 211Figure 8.1: User satisfaction, power tillers (ranks on a scale of 1 to 7)......................... 243Figure 8.2: User satisfaction, tractors (ranks on a scale of 1 to 7).................................243

LIST OF ACRONYMS
2WD Two Wheeled Drive4WD Four Wheel DriveAICD Africa Infrastructure Country DiagnosticAITF Agricultural Input Trust FundAMECCO Changzhou Agricultural Machinery and Equipment Company Ltd of ChinaBOT Bank of TanzaniaBCAs Benefit-Cost-AnalysesCAMARTEC Centre For Agricultural Mechanisation And Rural technologyCRDB Cooperatives Rural and Development BankEE Emerging EconomiesEP Engine PropelledEU European UnionFWA Front Wheel AssistFWD Four Wheel DriveGDP Gross Domestic ProductIBRD International Bank of Reconstruction and DevelopmentICRA Investment Information and Credit Rating Agency of India LimitedIFAD International Fund for Agricultural DevelopmentIMF International Monetary FundLFS Labour Force SurveyMAFAP Monitoring Food and Agricultural Policies in AfricaMAFF Ministry of Agriculture, Forestry and Fisheries (Japan)MAFC Ministry of Agriculture, Food Security and CooperativesMDG Millennium Development GoalsMM Matured Market EconomiesMoFEA Ministry of Finance and Economic AffairsMP Motion PropelledNBC National Bank of CommerceNBS National Bureau of StatisticsNMB National Microfinance BankOC Operating ConditionsSCCULT Savings and credit Cooperative Union of TanzaniaSSA Sub-Saharan AfricaTRAMA The Tanzania Tractor Manufacturing Assembly PlantTAFE Tractors And Farm Equipment LimitedUNECA United nations Economic Commission for AfricaUNIDO United Nations Industrial Organization
United Nations Office of the High Representative for the Least DevelopedUN- Countries, Landlocked Developing Countries and Small Island DevelopingOHRLLS StatesURT United Republic of TanzaniaUSA United States of AmericaUSCB United States Census BureauUSDA United States Department for Agriculture

Chapter 1 : Introduction
1.1 The economic impasse
Between 2001 and 2007, GDP growth in Tanzania averaged 7%, peaking at 7.8% in
2004. This made Tanzania one of the fastest growing economies in sub-Saharan Africa
(SSA). Tanzania Mainland total GDP in 2007 was 51% higher in real terms than in 2001
(Atkinson & Lugo, 2010). During the same period however, the incidence of basic needs
poverty in Tanzania, using the head count poverty index, stood at 36.7% in 2001 and
33.6% in 2007. Food poverty also remained relatively static, 18.7% (2001) and 16.6%
(2007) (NBS, Tanzania in Figures , 2010). Econometric estimations suggest that the
marginal decline in poverty observed over this period is simply due to sampling
variability; poverty did not decline at all (Mkenda et al., 2009). This has led some
scholars to argue that Tanzania is off-track in reaching the MDG target of halving poverty
in 2015 (Hoogeveen & Ruhinduka, 2009). Instead of poverty reduction, this impressive
growth has rather led to increased income inequality (Mkenda et al., 2009).
Many economies are growing while at the same time livelihoods are not improving for
those at the bottom of the income pyramid (Fan et al., 2010). To address this economic
impasse of high-growth high-poverty, the sources and the beneficiaries of growth require
examination. The Tanzanian economy is dominated by three major sectors: agriculture,
industry and services. In 2009, when agriculture’s share of GDP stood at 25%, it
employed nearly 74% of the workforce. Services and industry on the other hand had a
share of 45% and 20% respectively; altogether employing 25% of the workforce
(MoFEA, 2009). In 2001, when the GDP of Tanzania grew by 6%, the agricultural sector
(a major employer) grew by a little over 4%. In 2007, the margin widened, with the
economy growing over 7% while agriculture remained below 4% (NBS, 2010). Thus,
though an important sector in terms of employment creation, growth in the agricultural
sector stagnated in the noughties. Undoubtedly, without growth, households depending
on agriculture will be poor, barring any external transfers. It thus comes as no surprise

that in 2007, 38.7% of the population whose primary source of cash income came from
agriculture were poor, a slight decline from the 2001 figure of 39.9%. Of all the poor in
Tanzania, 81% and 74% constitute those engaged in agricultural activities in 2001 and
2007 respectively (NBS, 2009).
1.2 Agriculture as a strategy for poverty reduction
The low agricultural growth in Tanzania is underpinned by over-reliance on unpredictable
natural precipitation, minimum use of improved seeds and fertilizer and the use of
manual labour (MAFAP, 2013). Coupled with inefficient allocation and use of scarce
resources across and within sectors of the economy, agriculture has remained
underdeveloped. A cross country study in Africa suggests that paying attention to
agriculture as an engine of growth has a higher potential for reducing poverty than other
mechanisms (Diao et al., 2007).
The consensus is thus to focus on the importance of agriculture and rural development
as a viable response mechanism to new challenges for growth and poverty reduction
(Sarris, et al., 2006; Fan et al 2010). Transforming the agricultural sector into a viable
growth pathway requires appropriate mechanisation technologies in the context of the
rural poor to augment other inputs (Biggs et al., 2011). Thus any attempt to gradually
replace hand hoe and oxen plough which dominates Tanzanian agriculture with
mechanical power where possible to do so, is essential. This could help reduce the
challenges posed by manual labour use: limitations on area cultivated per season,
inadequate seed bed preparation and timeliness of tillage operations (IFAD, 1998).
1.3 Technology: a necessary tool for agricultural sector growth
Technological progress and innovation determine productivity, and hence the rate of
growth (Solow, 1956). Technological progress is also dependent on both physical and
soft infrastructure, which is sometimes unevenly spread within and across countries of
the world. The physical environment and social context within which technology evolves

also shapes the nature and character of the technology (Kaplinsky, 2009). Farm
mechanisation technologies also operate under a similar framework. What constitutes
appropriate mechanisation technology in a developing country context can sometimes
overlap, conflict and confuse: becoming a source of debate for agricultural engineers and
agricultural economists (Eicher & Baker, 1982). However, the potency of mechanical
power in contributing to agricultural productivity, especially at the land preparation stage
has not been challenged (FAO/UNIDO, 2008). Despite this potential, mechanical power
use on Tanzanian farms has not seen significant expansion in recent decades.
The most common forms of mechanical power on farms are two-wheeled or walk- behind
tractors (power tillers) and four-wheeled tractors. Current estimates suggest that out of
every 100 farms in Tanzania, only 16% use power tillers or tractors for tillage. The
remaining 84% farms are tilled with hand hoe and oxen plough. Thus the agricultural
landscape is dominated by hand hoes (Menenwa and Maliti, 2010; Lyimo, 2011).
Farmers benefiting from the use of mechanical power (tractors and power tillers) are
mostly large scale farms constituting 8.5% of the area cultivated by all farms in the
country (URT, National Sample Census of Agriculture 2007/08: Large Scale Farms,
2012) and producing mostly commercial crops for export or relatively richer small scale
farms cultivating high value crops. This clearly indicates that small scale food crop
producers are not using the few tractors available. Without intervention (policy wise),
there is little evidence that the status quo will change especially when farming
investment finance is scarce among rural dwellers.
Over 60% of all rural households do not have access to any form of formal financial
services (Jessop, et al., 2012). Thus, resources for investment are scarce. This makes it
difficult, especially for small farmers to purchase farm inputs generally, and tillage
equipment in particular. Only 15.4% of all commercial bank loans went to Tanzanian
farming households in 2011 (Bank Of Tanzania, 2012). This represents less than 20% of
farmers’ demand for credit per annum. The gap between demand and supply is not met

by farm profits either. A study by Ellis et al., (2010) investigating the impact of access to
financial service on household investment revealed that in Tanzania, only 3% of
respondents in their sample saved towards the purchase of farm implements. The rather
lean farm profits, resulting mainly from smaller farm sizes and low productivity are
competed for by household consumption and savings. In most instances, consumption
triumphs over savings, leaving very little for investment. Thus, in the midst of a high
population growth rate (2.3% per annum for rural households), requiring increased food
production, there is limited use of modern agricultural technologies including
mechanisation (power tillers and tractors), which are essential for any modernized
farming.
1.4 Traditional north and indigenous technologies
In the backdrop of the constraints described in the previous section, power tillers and
tractors, like other capital goods on the Tanzanian market have in the past predominantly
come from EU, USA and Japanese producers (matured markets). Thus for most
companies or planning agencies considering the start of a production process or
replacing equipment, the choice then belonged to a spectrum of advanced country
technologies. Historically, machines from these matured markets, hereafter MM, were
described as efficient. There was the notion that these ‘efficient’ techniques from
advance countries maximizes output on large scale, spurs economic growth and
development for both developed and developing countries. With time, it became clear
that this conception of efficiency was flawed, in that this pattern of technological
development was associated with undesirable social and environmental developments
(Kaplinsky, 1990). Driven by institutional R&D of industrially advanced northern
countries, innovation and technological progress did not cater for all the needs of the
developing south (emerging economies, hereafter EE). Especially in the 1970s and
1980s, these innovations rather created a state of technological dependence (Soete,
2009).
4

Empirical studies have shown that imported techniques from MMs were not always
suitable for the developing country context. In terms of scale, labour requirements,
availability of accompanying infrastructure and distribution of benefits so derived were
modelled around the endowments of the developed world (Stewart 1977; Kaplinsky
1990). These efficient technologies also came at a higher cost, reflecting the income
levels of advanced country users. In the face of inadequate finance and high cost of
products, only a few users could afford power tillers and tractors. Consequently,
whereas, the latent demand for tractors in Tanzania is between 1500 and 1800 units;
and that of power tillers is estimated at 1500 and 2000 units per annum; between 2005
and 2009, supply rarely reached a third of this because of lack of effective demand
(Lyimo, 2011).
Alongside the so called efficient technologies evolved an indigenous set of technologies
which were considered to be inefficient, small scale and usually locally produced with
little or no formal research. Some of these indigenous technology developments stem
from the appropriate technology movements. Underpinned by acts of charity, they did not
suffice either. Investment in animal draft power for instance, has diminished overtime.
To meet desired development targets, Gurak (2003) notes that developing countries had
two options: first encouraging indigenous technological development and second
transferring already existing technologies from MM. The question which kept many
writers busy in the 70s and 80s was which of these sources will be an appropriate one
for the developing world, especially sub-Saharan Africa (SSA)? However, both sources
had a limited impact in transforming the agricultural sector in SSA into an engine of
growth and poverty reduction, including the Tanzanian case.
1.5 Filling the gap
Recent developments in the world economic order has seen the rise of emerging
economies like China and India (EE) as well Brazil, Turkey and Pakistan. The noughties
5

saw a substantial increase in the share of global manufacturing value added in low
income countries in general and in China in particular (Kaplinsky, 2011). By 2000, more
than one-fifth of global R&D was located in the emerging economies (Hollander, 1965;
Soete, 2010; Kaplinsky 2011). This increase is of major significance given the estimated
share in 1970 of only 2% (Singer et al, 1970; Kaplinsky, 2011). An increasing share of
this dispersed R&D occurred as a result of outsourcing by global Trans National
Corporations (TNCs), particularly to EEs (Bruche, 2009). The EEs possess resource
endowments and income levels similar to those of other developing countries in SSA
such as Tanzania. There is thus, some justification to believe that technologies they
produce for themselves may as well be suitable for the operating conditions of other
developing countries, including Tanzania. For instance, trends in average farm sizes
across continents as shown in Table 1.1 suggests that holdings in Africa were more
similar to those in Asia than they are to the Americas or Europe. The average farm sizes
for Africa and Asia are both 1.6 hectares. Consequently, it is possible that production
techniques appropriate for Asian farms (especially the EEs) may more readily fit the SSA
terrain of which Tanzania is part.
Table 1.1: Approximate farm size by world regionWorld region Average farm size, hectaresAfrica 1.6Asia 1.6Latin America and the Caribbean 67.0Europe a 27.0North America 121.0Source: von Braun 2005. a Data include Western Europe only
Historically, China and India have interacted with Tanzania through Friendship
Agreements at the diplomatic level and through cultural and knowledge exchange as a
result of migration. These relationships have helped establish trade routes between
Tanzania and these EEs. In recent years therefore, there has been a rise of both
consumer and capital goods on the Tanzanian market from China and India in particular.
6

Machines from the EEs compete with MM products, and most importantly meet the
demand and purchasing power of low income groups in Tanzania. Other products from
Brazil and Turkey are much more like MM ones in character, sometimes possessing
state-of-the-art technologies of global manufacturers and at other times of reduced
quality. Products from EEs are usually not of very high quality, but they are regarded by
some consumers as “good enough”. In a broader sense however, in meeting the needs
of lower income groups who might have otherwise been neglected in the value chain, the
usefulness of EE machines cannot be overlooked in Tanzania.
The recent trade boom between EEs and Tanzania has also been reflected in the tractor
and power tiller market. The rise and presence of EEs in the Tanzanian market provides
a wider scope for the selection and use of power tillers and tractors by Tanzanian
farmers. Thus, in addition to the advanced country and indigenous technologies, now
farmers have a third alternative from EEs. The question is how might this new market
dynamic affect technique choice of the decision maker (the farmer)? And again how
could this choice influence productivity (and therefore growth) at the farm level and
distribution of the gains across low income groups within the value chain?
This central theoretical issue is explored in this thesis through a comparative study of
power tillers and tractors from MMs and EEs being used in Tanzania with a view to
addressing the tractorisation debate and contributing to the appropriate technology
literature. The thesis isolates the engineering and economic distinctiveness of the
technologies from the two sources (MM and EE), and the extent to which one is pro-poor
in more ways than the other along the chain of technology transfer, diffusion and use.
The overarching research question is: Do MM and EE tillage technologies have different
characteristics under Tanzanian conditions?
7

Specifically, the thesis attempts to respond to four research questions using small,
medium and large scale farms operating under five different agro-economic conditions in
Tanzania as a focusing device:
1. What is the mode of transfer and diffusion of MM and EE tillage technologies in
Tanzania?
2. To what extent are MM and EE tillage capital goods being used in Tanzania?
3. In what ways are MM tillage technologies distinctive from EE ones?
4. Do the inherent distinctive characteristics (if any) of EE tillage technologies help
address the needs of resource constrained farmers and other participants in the value
chain and hence reduce poverty?
1.6 Organization of the thesis
To answer the above research questions, Chapter 2 discusses Tanzania in the context
of rural development, agriculture and mechanisation. Here, the importance of agriculture
in the Tanzanian economy and how it could serve as a wealth creation tool is
emphasised. The role that mechanical technology can play is also explored. An overview
of the international tractor market is also undertaken to help our understanding of where
mechanisation technologies are developed and sold and the marketing models adopted.
After a historical overview of the global development of farm mechanisation, the most
important players in terms of demand and supply are characterized. Attention is paid to
the different regions of the world where tractors are produced and sold and the
characteristics of the farmers and farms. At the end of Chapter 2, an examination of
which sources of supply are more similar in character as the Tanzanian terrain is also
undertaken.
In Chapter 3, literature related to technique choice, technology transfer and diffusion are
surveyed. The evolution of technological choice on the global stage between advanced

and developing countries since the 1970s are tracked. Efforts to improve the diffusion
and use of technologies by low income groups are also discussed with a view of
establishing why different waves of technology transfer could not deliver the promised
gains. Empirical studies conducted in the 1960s and 1970s to establish the viability of
the different trajectories of technical choice is also reviewed. To bring the literature
survey home to our discussion of current trends on the world stage, the emergence of
the Emerging Economies and their associated cost innovations are also examined in the
context of possible contribution to Tanzanian agriculture.
In Chapter 4, the methods used in collecting and analysing the data in this study are
discussed. Here the sampling procedures used in selecting each group of respondents
at the various links of the value chain are presented. Characteristics of the study sites
are also presented in brief and then the methods adopted in analysing each set of data
are also explained. In Chapter 5, an attempt is made to define what an appropriate
choice of tillage technology is for small, medium and large scale farmers cultivating
different crops under different soil and water supply regimes. This exercise is carried out
by first establishing who the farmers under consideration are; what they do; how they do
it; and what technology alternatives are available to them for these assignments.
Chapter 6 establishes the value chain that is responsible for the transfer and diffusion of
these technologies and the role various actors play and the mechanisms these actors
employ to accomplish their roles. The discussion for tractors is organized to capture the
pre- and post- Structural Adjustment days: with different market regions during the two
periods, the discussion throws light on how participants and their activities in the value
chain are changing over time. In Chapter 7, a critical examination of distinctiveness of
the various strands of techniques is done by comparing their engineering and quality
features. This then naturally leads us into a discussion of the coefficients of production.
These productivity ratios are in most cases organized around the output generated and
labour and capital consumed per season. To get an understanding of how well a

particular category of technology is doing or otherwise for a technical efficiency measure,
their performance are ranked. To further enhance our technique choice tools, the Net
Present Values (NPVs) of costs and benefits streams associated with each category of
technology is calculated and compared. In addition, a sensitivity analyses are carried out
on the assumption that current government subsidies on power tiller and tractor
technologies are removed: this is to ascertain the effect of subsidy removal on the
benefit-cost ratios.
Chapter 8 examines why users sometimes choose inefficient techniques. To link the
discussion to inclusive innovation through growth and distribution to excluded portions of
society, we examine the extent to which the choice of various techniques impact on
employment and output and who benefits from these. For instance we discuss the
growth in farm size and which types of crops (cash/food security crops) which benefit
most from the technology. The environmental and health impacts are then considered:
emphases is laid on the release of C02 through smoke, noise pollution, scrap metal
waste, ergonomics and potential injuries that users could sustain during usage. In
Chapter 9, findings from the thesis are summarised and implications drawn for policy,
future research and the extent to which they can be generalized for other sectors of the
economy.
10

Chapter 2 : Tanzania, Mechanisation and Rural Development
2.1 Introduction
Agricultural growth, rural development and employment creation are policy fundamentals
that caught and engaged the attention of many African governments in the post
independence era. These policy foundations did not however carry a similar impetus
after structural adjustment days. With political independence, many SSA states were
hopeful that they would attain economic independence in the ensuing years.
Unfortunately, flawed understanding of the order of world trade and economies
embedded in rudimentary agriculture shattered such hopes. In addition, lack of a reliable
supply of skilled labour, entrepreneurial scarcity, inadequate financing of the private
sector and government control of productive sectors, coupled with political instability
were detrimental. The non-existence of appropriate technology or inability to make a
right choice from a range of technologies has also contributed to the lack of progress.
The economic structure designed and implemented during the colonial days did not
change after independence. SSA economies were peripheries of European colonisers
(Rweyemamu, 1973). Consequently, this created a state of technological dependence,
mostly through trade and aid (Stewart, 1977). SSA countries continued to rely on trade
links with Europe, mainly in agricultural commodities and minerals, as the main source of
exchange (Vickers, 2011). Global recession in the 1970s and particular problems
encountered by different countries stifled economic activities and exacerbated poverty.
Many SSA countries were left indebted to multilateral and bilateral financiers and could
not meet the payment schedules of such loans (UNECA, 2011). Through IMF and World
Bank prescriptions, a policy of liberalisation and an adjustment of the general economic
structure was adopted and pursued by some African countries in the 1980s and 1990s
(Mohan, 2000). What later became known as the “Washington Consensus” in the late
1980s was a set of policies that underpinned economic adjustments in the developing
11

world, notably Latin America and SSA, and supported by Western governments to
promote economic liberalization.
The main proponent of the consensus included Fiscal Discipline, Reordering Public
Expenditure Priorities, Tax Reform, Liberalizing Interest Rates, A Competitive Exchange
Rate, Trade Liberalization, Liberalization of Inward Foreign Direct Investment,
Privatization, Deregulation and Property Rights (Williamson, 1990). There were costs
and benefits accruing to different countries in different ways. However the challenges
pertaining to employment and poverty remained. This led to the Millennium Development
Goals (MDGs) of the United Nations at the turn of the century. Among other things, the
MDGs targeted improvements in education, health and poverty reduction within the
populations of the bottom billion of the global income pyramid.
Efforts to reach the MDG targets have been pursued in many SSA countries but it is
believed that those related to halving poverty by 2015 are likely to be missed. Tanzania,
an example of an independent African country that has distinguished itself as a safe
haven for peace and stability in the past 50 years has not performed differently from
other SSA countries when it comes to poverty reduction (Erickson, 2012). Despite the
political stability enjoyed by the country, general welfare of its ever growing and
predominantly rural population engaged in agriculture has not improved significantly.
Though agriculture is an important economic activity for the rural population in Tanzania,
it has seen slow growth in terms of biological, chemical and mechanical technology
transformation (Pfitzer, Krishnaswamy, & Genier, 2009). The mechanical aspect is the
most neglected. Farm mechanisation seems to have become, to a certain extent, the
neglected waif of agricultural and rural development. As an essential input,
mechanisation can transform farm family economies by facilitating increased output and
reducing the drudgery of hand-powered production. Mechanisation, when carefully
selected and appropriate to the task, is also capable of protecting the environment whilst
boosting food production. However, the pace and rate of growth in terms of mechanizing
12

agriculture in SSA, including Tanzania has been relatively slow compared with other
parts of the world (FAO, 2013).
To understand the position of Tanzania in terms of the potential to mechanise agriculture
for enhancement of growth in output, employment generation and skill development, an
overview of the economic structure will be helpful. This Chapter therefore provides a
profile of Tanzania’s political economy, and as far as welfare of the citizens is concerned,
discusses the role that agriculture is playing, the challenges being faced and the support
that mechanisation can give in a changing landscape of world tractor supply and
demand.
2.2 Economic situation, national accounts and trade
Tanzania is an East African coastal country, officially known as the United Republic of
Tanzania. After the independence of Tanganyika and Zanzibar in 1961 and 1963
respectively, the two sovereign states came together to form the United Republic of
Tanzania. The population size of Tanzania was estimated to be 12.3 million in 1967 and
44.9 million in 2012. In 2012, Tanzania had a population growth rate of 1.83% per
annum (NBS, 2013). At the time of this study, the country was made up of 21
administrative regions with its commercial capital being Dar es Salaam and Dodoma the
administrative capital. See Figure 2.1 for an agricultural map of Tanzania, showing the
regions and the major crops grown.
GDP growth of Tanzania outperformed those of its neighbours (Uganda and Kenya)
between 2003 and 2012. Compared with developed economies such as EU27, Japan
and US averages, growth in Tanzania has also been high. Other developing countries
such as India and China had higher or comparable growth rates with Tanzania between
2003 and 2012 (See Table 2.1). Nevertheless, because of the ever growing population
in Tanzania, its GDP per capita has not seen significant growth. GDP per capita needs to
rise if societal welfare improvement is to gain momentum.
13

Figure 2.1: Agricultural map of Tanzania
O u q a n d a
R w anda♦ •
LacV ic to r ia
Kenya
-A%
Rep. ' D em .
du Conqt
R U K W A
M W A N Z A
S H IN Y A N G A
7 A B O R A
-*3 3 Y
BABAT:
A R U S H A
/. a t r 'i^ i. >; l ,-^V rJ
K'AVYAHA * * •
SING HO A^ D O D O M A
T A N G A
<* ♦ i• Dodoma
M O R O G O ftO
Y , PWANJ
Y
O cean tnd icn >
P em ba
Z a n z ib a r
0 Dar es Salaam
Mafia
Z a m b ie
Sorghum £ C o ffe e
M illet Y Cotton ftice M o t/e
Wheat
• It iN O I
■ A
^ Cashew nuts
| Tea
SEES Tobacco
I Sisal
Ojwa*
R U V U M A
• a
Mai.am bic
ism100
Source: http://commons.wikimeclia.ora/wiki/Atlas of Tanzania
Whilst the income per capita in a developed economy like Japan was about 80 times
higher than that of Tanzania between 2008 and 2012, that of an emerging economy like
China is about 9 times higher. However, per capita incomes in China were only about 5
times higher than those in Tanzania between 2003 and 2007. This signifies that the high
growth rate observed in Tanzania is not keeping up with other developing economies
high population growth rates. Thus a change in the nature of growth will be essential to
ensure adequate distribution of the gains.
14

Table 2.1: GDP Growth and GDP per capita by country and groups, 1990-2010
Country and country GDP growth rate (%)GDP per capita (USD in constant 2000 prices)
groups 2003-2007 2008-2012 2003-2007 2008-2012EU27 2.6 -0.2 31,593 38,055Japan 1.9 -0.1 34,822 42,685USA 2.9 0.8 44,087 49,073
China 11 8.7 1,843 4,626India 9 7.1 770 1,042
Tanzania 7.2 6.7 378 534Uganda 7.8 6.4 314 472Kenya 5.4 5.2 551 816
Source: World Development Indicators, 2012
Different sectors of the economy contribute differently to the GDP. As noted in Chapter
1, the main sectors of the economy are agriculture, industry and services. The structure
and contribution of these sectors to GDP in Tanzania has seen significant changes in the
last two decades. In the early 1990s, at the height of liberalization, the contribution of
agriculture to GDP stood close to 50%. Today the value of agriculture is less than 30% in
total GDP (See Figure 2.2)
The industrial sector’s contribution to GDP in Tanzania between 1990 and 2010 grew
from below 19% to 25%. The main driver of the industrial sector growth is the mining
sub-sector (especially gold) which expanded in the second half of the 1990s. In 2010
services contributed 50% to the GDP. The growth in the services sector was no surprise,
since economies around the world in general are becoming service-based and Tanzania
is no exception. However, the changing landscape from agriculture-based economy to
services has happened at a slower pace for Tanzania when compared with the rest of
the world.
Despite the fact that the agricultural sector’s contribution to GDP in Tanzania is
shrinking, it is still higher than other countries in East Africa, SSA and the world as a
whole (See Figure 2.2). The expectation is that as a sector’s contribution to the GDP
shrinks, labour employed by the sector would also decline. As demonstrated by the
15

Lewis two-sector model, labour will migrate into the more productive sectors from less
productive sectors where surpluses exist (Lewis, 1954). This has not happened in
Tanzania. The shrinking incomes in agriculture are still shared by a majority of the
population (Mkenda et al., 2009). In the following Sub-sections, we shall look at each of
the three sub-sectors in turn.
Figure 2.2: Sector contribution to GDP by country and country groups (%)
80
70
60
50
40
30
20
10
01990 1990 1990
Agriculture Industry Services2000 2000 2000
Agriculture Industry Services2010 2010 2010
Agriculture Industry Services
Tanzania ■ Uganda ■ Kenya *S S A eW orld
Source: Generated using World Development Indicators Data, 2011
a. Agricultural sector
Tanzania’s economy is predominately agro-based characterized by low technology
peasants engaged in shifting cultivation. The only exceptions are some large scale sisal,
sugar cane, coffee and tea farms (Carr, 1985). In Tanzania, the colonial agricultural
structure where peasants gradually become commodity producers or labour working on
an existing plantation did not change much until 1967. The Arusha Declaration signed by
the first president Julius Nyerere in 1967 was supposed to reorganise the structure of
16

agriculture. The declaration emphasised a village system with a series of individual plots
worked by households and a bloc farm worked collectively by the whole village. The
system also promoted appropriate technologies that were relevant to the scale of
operation of these village based farms and the skills possessed by the farmers.
After economic liberalization in the late 1980s, the collective ownership of land was
replaced with a free market system which was hoped would encourage the efficient use
of resources. The status quo did not change: most farmers continued to use basic tools
that did not lead to increased productivity. With a land area of 94 million ha, 44 million ha
are classified as suitable for agriculture and about 10.1 million ha or 23% is under
cultivation (URT, 2011). Accounting for about 26% of GDP and 33.9% of export
earnings, agriculture is the main economic activity for the rural populations.
Over 80% of the people who live in the rural areas engage in agriculture as the main
economic activity. These rural dwellers are dominated by smallholder farmers.
Smallholder farmers cultivate less thanl ha to 3 ha of land per annum (Sarris et al.,
2006). Consequently, the agricultural landscape in Tanzania is dominated by the use of
hand hoes, and to a lesser extent by oxen ploughs and mechanical power. Today, based
on the type of major implements used, three classes of farmers exist in Tanzania:
Mechanized (16%); Animal Power (22%); Hoe and Cutlass (64%), (Lyimo, 2011).
Agriculture is also mainly rain-fed. Only 3 to 4% of cultivated lands are irrigated and thus
of the 29 million ha of irrigable land, a mere 0.45 million is being utilized for irrigation.
As at 2011 when agriculture employed 75% of the over 20 million labour force, the crops
sub-sector made up 72% of the entire sector. Of those employed in the agricultural
sector 56% were women cultivating mainly food staples. The main staple crops produced
and consumed in Tanzania are roots and tubers and cereals. Predominant among these
are cassava, maize and potatoes. Between 1998 and 2008, over a third of all crop output
in the country was cassava. This was followed by maize, a little under a fifth, and then by
potatoes. The main cash crops were cotton, sugar and tea. In volume terms, cotton and
sugar cane constitute about half of all cash crops produced (See Figure 2.3).
17

Figure 2.3: Food and cash crops composition, 1998-2008
</>Q.OL -
O
CassavaMaize
T3 PotatoesOO Bananas
Ll_ PaddyOthersPulses
Cotton
(/505o
SugarTea
CashewnutsTobacco m m
CoffeeSisal mmm
others m10 15 20 25 30 35
%
Source: Ministry of Food and Agriculture, November 2008
Between 2000 and 2010, yield of major staple crops in Tanzania declined when
compared with those of its neighbours, Uganda and Kenya. For example whilst the yield
of maize per hectare stood at 1.9 in the year 2000, in 2010 it had declined to 1.6. During
the same period, yields in Uganda rose from 1.7 to 2.3 and those in Kenya from 1.4 to
1.7 per ha (See Table 2.2 below). These occurrences cast doubts on the possibility of
attaining the objectives of the Tanzanian Agricultural Sector Development Strategy
adopted in 2006. The strategy aimed to sustain a 5% growth of the agricultural sector per
annum. With current declines in productivity, it is unlikely that such targets will be
attained.
18

Table 2.2: Yield per hectare (maize) by country and selected years
Country 2000 2005 2010Tanzania 1.9 1.0 1.6Uganda 1.7 1.6 2.3Kenya 1.4 1.6 1.7
Source: FA OS TA T
Consequently, the depth of food deficit has also worsened in the country. For instance in
the year 2000 a three-year average of the kcal/capita/day indicated that food deficit
stood at less than 17%. However in 2010, the figure stood close to 80%, which is a
cause for concern. Despite the fact that these levels are much better than its neighbours,
there is alarm because the situation is deteriorating. Uganda for instance is making good
progress in terms of reducing food deficit levels, whilst Kenya’s case is worsening at a
relatively slower rate compared to Tanzania.
Food security is a consequence of availability, accessibility and affordability. To make
food available farm lands must be productive. And the productivity of farms is influenced
by the quality of production inputs. One of such inputs is farm implements: hoes,
cutlasses, oxen ploughs, power tillers and tractors. Regardless of the farm size and
crops produced, farm implements are required for the production process. Whilst it is
possible to obtain the hand hoe/cutlass and oxen plough from local industries in
Tanzania, it is practically impossible to do same for power tillers and tractors. Tanzania
does not currently have the requisite competence to manufacture power tillers and
tractors. As we shall see in the next sub-section the underdeveloped nature of metal
fabrication and auto industries in Tanzania means that local production of these
machines is currently beyond reach. Thus the country’s demand for tractors and power
tillers must be met by foreign sources through importation, an important point which
underlies this study.
19

Figure 2.4: Depth of food deficit in East Africa (kcal/capita/day, 3-year average), %
300
cuCiCm 200
100
283
165213
254
173202
2000 2005
iTanzania ■ Uganda ■ Kenya
243214
170
jjrelprfi /7-'u’V
2010
Source: FAOSTAT
b. Industrial and manufacturing sector
Tanzanian industrial policy in the 1960s and 1970s sought to facilitate the production of
capital goods. It was hoped then that firms producing such capital goods would adapt
them to and support the local manufacturing regimes to meet basic needs of the entire
populace. Thus central government invested heavily in the sector at that time in order to
kick-start it. These industries were also expected to provide training where necessary
and develop new skills where possible. It was however difficult for such manufacturing
firms to thrive and deliver the expected gains.
Nonetheless, there are still over 700 manufacturing firms in Tanzania and the number
continues to grow. Of these, 6% were into the manufacture of basic metal sheets and
fabricated metal products. This statistics shows the extent to which competence and
capabilities for the manufacture and maintenance of agricultural capital goods made
mainly of iron and steel are lacking in the country. It must however be noted that the
growth rate of the manufacturing sector was 8.2% in 2012 (NBS, 2012 Population and
Housing Census, Tanzania, 2013). Thus there is evidence that the sector could expand
in the future to provide the platforms required to manufacture capital goods locally.
There is also a cautious optimism that the existence of a bus assembly plant in Tanzania
could become the starting point in developing other products such as tractors and power
tillers. There are numerous car garages scattered across the country but their main
clients are not the agricultural machinery users although sometimes they provide support
20

to the sector. These businesses hold the potential for the future growth of local
manufacturing of agricultural capital goods. There have also been a few signals that Iran
Tractors and M&M may start assembling tractors in the country in the near future. While
we wait for the development of the metal work industry to support agricultural capital
goods production, there is the need to find and facilitate a reliable supplier abroad,
through trade and related services. To facilitate smooth imports from abroad and
distribute them across the country, well-functioning financial services, healthy business
environment and port infrastructure are key. We discuss these in the next sub-section.
c. Services and the business environment
The liberalization of the Tanzanian banking business in the early 1990s and insurance
business in the late 1990s attracted several players in the financial services sector,
including world class banking institutions such as Barclays, Citibank, Standard
Chartered, as well as regional banks such as ABSA and Standard Bank of South Africa.
The insurance sector has a number of regional players such as Jubilee, Royal, Lion and
Phoenix. In total there are over 30 registered banks and other financial institutions and
more than 10 registered insurers operating across the nation. Though micro-insurance
schemes are at their infant stages and mainly concentrate on health and life premiums,
there are considerations to insure the agricultural sector provided weather forecast
infrastructure could be improved and expanded across the county.
The development of the financial sector is important for both importers and users. The
swiftness with which bank transactions can be carried out, access to capital and cost of
the capital accessed are all key variables that feed into an effective environment for
doing business. The cost of capital has fallen in the last decade with real interest rate
declining from 13% in 2000 to 6.4% in 2010 (See Figure 2.5). There are also further
subsidies on the cost of capital for borrowers requiring credit for agricultural inputs. The
cost of borrowing in Tanzania has been on average comparable to or even better than
those of its neighbours, Kenya and Uganda in the last decade. However, lending to the
informal sector and agriculture in particular by commercial banks remains scanty
21

because of the high risk involved. Only about 12% to 15% of commercial banking credits
go to finance the agricultural value chain. Of this proportion, over 90% goes into
agricultural marketing chains with a small proportion going to production and input supply
(Jessop, et al., 2012).
The key constraints financial institutions face in lending to agriculture include: inherent
risks due to unpredictability of weather; lack of collateral due to low market value of land
and in some cases lack of land title, un-surveyed land; price volatility of crops;
underdeveloped local markets due to poor rural infrastructure (roads,
telecommunication) and outdated agricultural technology. In view of these, the banks
usually decline to offer long term loans to farmers who usually do not have bank
accounts (Seluhinga, 2013).
The business environment is also crucial for the importation of agricultural capital goods.
This is an area where Tanzania has performed poorly (Figure 2.6). Out of 183 countries,
Tanzania ranked 122 and 123 in 2009 and 2010 respectively on the scale of ease of
doing business. This position on the ranking is neither better than Kenya nor Uganda. It
is much worse when compared with other SSA countries such as Ghana and South
Africa’s. Improvements are needed to facilitate trade, investment and other economic
activities that could assist in smoothing transactions pertaining to tractor imports.
Figure 2.5: Cost of capital (real interest rates) in East Africa, 2000 and 2010 (%)
l .Tanzania Uganda Kenya
■ 2000 «2010
Source: Generated using World Development Indicators Data, 2011
22

Figure 2.6: Ease of doing business in Tanzania compared with other countries
150
100
50
i ■■Tanzania Uganda Kenya Ghana South Afruca
■ 2009 «2010
Source: Generated using World Development Indicators Data, 2011
2.2.1 Institutions and infrastructure in Tanzania
Government and Non-Government institutions as well as physical infrastructure are
important fundamentals for technology transfer, diffusion and adoption. They define the
ease with which business can be undertaken. This sub-section looks at how institutions
and infrastructure in Tanzania impact on the innovation systems of farm mechanisation,
a. Government
Despite liberalization of many sectors of the economy, central government presence in
the day to day activities of businesses in Tanzania is pervasive. This is because
government still has shares in a number of parastatal companies. In the agricultural
sector, the importance of government is felt through the Ministry of Agriculture, Food
Security and Cooperatives (MAFC). As part of its vision of modernising agriculture
through the Kilimo Kwanza policy embarked upon in 2009, the Ministry has targeted the
development, promotion and use of appropriate agricultural technologies. The objective
is to modernise and commercialise agriculture for peasant, small, medium and large
scale producers (Rutta, 2012). To this end, the Ministry collaborates with the private
sector, local government and other service providers to make relevant technical inputs
into research, extension, irrigation, plant protection, land use, mechanisation, agricultural
inputs importation, information services and cooperative development.
23

For instance, to deal with financial challenges being faced by the agricultural sector,
there are attempts by government to transform the Tanzanian Investment Bank into an
Agricultural Development Bank. The objective is to create a bank that will serve as a
lending agent for government and other international lending institutions that target the
needs of farmers. To remove some of the capital constraints, the Bank will train, provide
consultancy services and monitoring of activities of other lenders in the sector. Apart
from these, the Agricultural Input Trust Fund established in 1994 provides wholesale
lending for the procurement of inputs and equipment (tractors and power tillers). The
trust also subsidises land titling procedures for prospective borrowers. Beneficiaries of
such subsidies can use their title for other transactions even if the requested credit from
the trust does not go through. It must be noted however that for a farmer to source many
of these assistance, he/she must be a member of a recognised association. (Key
informant interview with the Director of the Fund, 2012).
b. Cooperatives and NGOs
Tanzania has been home to many marketing cooperatives composed mainly of peasants
without titled estates, producing mainly coffee and cotton for export. Cooperatives are so
important in Tanzania that it has a department under the agricultural ministry. Between
1930 and 1960, they were very vibrant in the purchasing of pesticides and seeds in bulk
from manufacturers and distributing them to their members. Some of the unions were
also known to have bought and loaned tractors to their members. In a rather rare
instance, one big cooperative built and operated a warehouse for the sale and servicing
of tractors for members to access in the Mwanza region and became very useful to
farmers in the 1960s. The cooperatives were also instrumental in export trade
(Maghimbi, 1990; Maghimbi, 2010).
Cooperatives increased rapidly in number with firm support from government and a
motivation to help peasants keep a greater proportion of their sales profit. Aside from
marketing cooperatives, there were also consumer, credit and transport cooperatives
with diverse objectives. Indeed the marketing cooperatives in the cotton industry
24

provided the initial drive for the establishment of ginneries in the cotton growing areas.
Allegations about cooperative managers of being corrupt after independence led to a
government enquiry, which eventually led to their dissolution and their marketing powers
devolved to village leaders.
The cooperatives resurfaced in the 1980s but they have not performed as well as before,
especially the crop marketing ones (Maghimbi, 2006). Their fund-raising ability for the
purchase of crops of members has declined from over 35% to about 0.75% of the value
of sale by members. Though the savings and credit cooperatives were not so vibrant in
the 1960s, they currently form about 50% of all cooperatives and had over 1.6 million
members in 2008. The vibrant nature of cooperatives in Tanzania gives them a voice in
lobbying government agencies and other support institutions such as finance and trade.
These activities put the cooperatives in a position to give voice to the farmers in terms of
discussions pertaining to sourcing inputs, pricing and terms of supply; a tool that could
be useful for the importation of appropriate tractors and power tillers,
c. Infrastructure
Most of the Tanzanian population are rural. However, the infrastructural design and
spatial distribution across the country are mainly in and around the urban centres, cutting
most rural dwellers from all year round roads and electricity supply. Though electricity is
relatively cheap in Tanzania compared to Kenya and Uganda, less than 20% of the
Tanzanian population have access to electricity. Most rural roads are unpaved.
Nevertheless, there is an extensive connectivity of urban centres by trunk roads and
neighbouring countries via rail. Despite privatization of 51% stakes in the rail
infrastructure, to an Indian investor in Tanzania, expected gains are yet to be seen
(AICD, 2010). The rail network also links the Dar es Salaam port to the interior of the
country and facilitates the haulage of imported goods and goods going to be exported.
The frequency of rail services are however very low and sometimes unreliable.
Closely linked with the rail and road infrastructure is Dar es Salaam port. The Dar es
Salaam port handles about 200,000 containers and 3.8million tons of cargo annually.
25

This is half of the operations of Mombasa, the Kenyan counterpart. Compared with other
SSA countries, it is an efficient port. There is a low container dwell time of 6.8 days
which is not significantly different from the SSA average. It is however much better than
Uganda (14 days), probably because of its landlocked nature but greater than Kenya’s (6
days) which has a long standing reputation of a busy port (See Figure 2.7). There is also
low truck processing time of 5 hours and a productivity of 20 containers per crane hour.
The port is however yet to fully apply the Landlord Port System1 which has been found to
be more efficient in the experience of other countries.
Figure 2.7: Lead time to clear imported goods from the Dar es Salaam Port (days)16.014.0 _12.010.0
§ I I l I . I iTanzania Uganda Kenya Ghana South SSA World
Afruca
■ 2009
Source: Generated using World Development Indicators Data, 2011
Communication is also important for any business transaction. It is even more crucial for
farmers since their main place of work is usually far away from input suppliers. Soft
infrastructure, especially mobile phone technology has removed many of the
communication barriers for the rural population as a result of its liberalization in the early
2000s. Thus rural farmers are able to engage with input suppliers, repairers and
operators via the mobile phone. Today, the mobile phone system is used as a money
transfer platform in Tanzania. This has the potential of transforming payment systems
1 The landlord port system is characterized by its mixed public-private orientation. Under this model, the port authority acts as regulatory body and as landlord, while port operations (especially cargo handling) are carried out by private companies.
26

especially for farm tools, spare parts and other inputs. Mobile phone penetration
currently stands at 56 units per every 100 persons compared with 44 and 71 for Uganda
and Kenya respectively in 2013. However, as it is common in SSA to share mobile
phones or to use public mobile phones, mobile services extend far beyond actual
penetration levels (World Bank, 2013).
Other on-farm infrastructure such as irrigation is also important. This is so because, to
realise the full benefits of investments in power tillers and tractors, reliable water supply
cannot be taken for granted. Irrigation potential in Tanzania is great because of the
abundance of lakes across the country. This potential is however yet to be harnessed.
Irrigated lands (184,000 ha) is about 9% of irrigable land. (URT, 2011).The prevalence of
a uni-modal rainfall pattern in some parts of the country requires irrigation infrastructure
investments to ensure maximum use of land resources. The expensive nature of
irrigation equipment and infrastructure has made such ventures prohibitive.
2.2.2 Labour force capabilities, core competence and employment
Beyond well-functioning institutions and reliable physical infrastructure, a well-trained
labour force is required to man and maintain mechanised capital goods if the sector is to
serve as an employment creation mechanism. Unemployment rate for all classes of
labour force in Tanzania decreased slightly from 12.9% in 2001 to 11% in 2006 (NBS,
2007). However according to the National Integrated Labour Force Survey, over the
same period youth unemployment increased from 13.6% to 14.9%. Econometric
estimations using the integrated labour force survey data for Tanzania suggests that
among other things, education and skill training are important drivers of the rise in youth
unemployment in the country (Msigwa & Kipesha, 2013). There are skill gaps which
need to be addressed if youth unemployment is to be curtailed.
Formal academic education in Tanzania has traditionally been preferred to vocational
and technical training. After independence, government policy focused on a self-reliant
strategy that targeted every stage of education as a useful tool for community
27

development. For this reason, primary education was supposed to go hand-in-hand with
vocational and agricultural technology training. However parents and teachers felt that
there was better paying jobs in urban centres and the only way for their children to get
them was to concentrate on formal training and not the rudimentary knowledge in
agriculture and craftsmanship. Despite these setbacks, the remnants of such legislation
in the late 1970s and 1980s continue to give students the opportunity to enter vocational
and technical colleges at different points along the educational path.
In Tanzania the two most common paths are to enter vocational school after primary or
to enter technical colleges after O-level. Both public and private institutions provide
vocational and technical training. There are over 250 post primary technical centres
scattered around the country with the objective of equipping primary school leavers with
training in carpentry, brick laying/masonry, blacksmithing, auto mechanic and other
trades. The Technical Schools (about ten of them in total) specialize in training students
in workshop technology associated with Electrical, Civil and Mechanical Engineering
(motor vehicle mechanics).
The main weakness of these otherwise useful institutions is that in the past it has not
offered courses pertaining to entrepreneurship and financial literacy that will help the
students manage their skills when they graduate. There have also been situations where
teaching staff and equipment have been inadequate (Mbelle, 2008). Some companies
also give on-the-job training. There are also NGOs and religious groups which support
and operate technical training centres. Youth apprenticeship under artisans and
tradesmen after standard VII also exists. This form of training is informal but very useful
in providing skills for school leavers. After completion of such training young ‘gradates’
are free to set up their own business. However, for them to gain formal employment
there is the need to pass the trades’ test which is nationally recognized for artisans.
These kinds of artisans, especially auto mechanics, have been found indispensable on
medium and large scale farms where mechanized equipment such as tractors are used
and need regular maintenance (Bennell, 1999).
28

At the formal front, as per the results of the Tanzanian Household Budget Survey 2008,
the literacy rate among 15-24 year olds (youth literacy rate) is 80.0%. On average 83.0%
of males and 76.9% of females are literate, and this compares well with the World and
SSA averages of 89.3% (male: 91.9; female: 86.8) and 74.3% (male: 79.0; female: 69.9)
respectively (URT, 2011). While literacy rates may be an important measure, the skills
and technical capabilities of the labour force have a more direct bearing on the
agricultural mechanisation value chain and how well it is managed. Managers who
understand how the world trade order works are required to import and distribute the
machines; entrepreneurs who can run the tractor business profitably are also needed to
buy, use/hire out machines at the farm level, and operators and repairers are also
needed to keep the machines running. Building such core competence and capability
through learning by doing should engage the educational system if rapid transformation
of the labour market in Tanzania is to be realized.
2.2.3 Diplomatic relations and international trade
Trade and diplomatic relations, as well as migration are ways through which countries
engage. Through such engagements, there is cultural exchange. Beyond culture, some
of these engagements also facilitate the transfer of knowledge, skills and technology.
Tanzania’s pre-colonial, colonial and contemporary history suggests that it has engaged
with different people from different countries across the globe. This is demonstrated
through the diversity of people across the world who have made Tanzania their home
(Rweyemamu, 1973). This Section touches briefly on Tanzania’s engagement with some
Matured Market Economy countries and Emerging Economies. Specifically, we
emphasise the countries which matter when it comes to Tanzania’s international trade
and which are also important as a source of tillage technologies for the country.
a. International relations
The EU, Japan and USA are the three main advanced country groups which are
important in the Tanzanian tractor markets. On the other hand, China and India are the
29

two main emerging economies which have strong diplomatic and trade relations with
Tanzania. We discuss these countries and their diplomatic relations with Tanzania in turn
with the view of briefly understanding how such relations could affect tractor imports.
European Union and others
Tanzania began the 20th century as a colony of Germany, and ended up in the hands of
the British after the First World War (WWI). Tanzania thus had strong ties with the British
through trade, exporting mainly primary agricultural products to Britain. Tanzania’s
decision to support the liberation of other Southern African states meant that its
diplomatic relations with Britain were severed in the early 1960s, after independence.
Though diplomatic relations were restored in 1968, it was not until 1974 when Britain
decided to restore aid and support to the country again. Since then, the nature of trade
between the two countries has not changed significantly: Tanzania exports primary
commodities to Britain and imports manufactured goods. Similar trade relations exist
between Tanzania and other European nations. In terms of the tractor trade the UK,
Italy, Finland, Russia and Poland were very important for Tanzania between the 1960s
and 1990s.
USA
The USA Government provides assistance to Tanzania to support programs in the areas
of health, environment, democracy, and development of the private sector. The U.S.
Agency for International Development's program in Tanzania averages about $20 million
per year. Trade ties between the USA and Tanzania are however on the low side when
compared with other developed countries. Nevertheless, US tractor brands like John
Deer and CASE IH are very popular on large scale commercial farms in Tanzania.
Japan
Japan recognized Tanganyika immediately after its independence from the United
Kingdom in December 1961. Zanzibar became independent in 1963 and Tanzania was
founded in April 1964 when Tanganyika and Zanzibar formed a union. Since then, Japan
has enjoyed friendly and cordial relations with Tanzania. Throughout the history of
30

friendship between Tanzania and Japan, there have been numerous important visits in
both ways by diplomats.
Japan started to assist Tanzania in its endeavour to develop the country as early as
1966, when Japan extended its first concessional credit to Tanzania. In 1967 the first
young volunteers were sent to Tanzania and they mixed with ordinary citizens, and
farmers to teach their children in schools, help patients in hospitals and work together in
local governments. Now the accumulated number of young volunteers exceeds one
thousand. Specific to agriculture, Japan built the Kilimanjaro Agricultural Training Centre
for Tanzania in the 1980s and has made several donations of tractors and power tillers
through JICA (Key Informant Interview with the Director of the Centre, 2012).
China
China established diplomatic relations with Tanzania in the early 1960s when
Tanganyika and Zanzibar (two independent states) joined to form the United Republic of
Tanzania. The bilateral relations are extensive and encompass political, economic,
military and cultural cooperation (Jansson, Burke, & Hon, 2009). Because of the location
of Tanzania in the East African coast, it is an important country as a point of entry for
China’s trade with southern African states (Alden & Alves, 2008).
The government of Tanzania’s long standing relationship and a reputation as an early
aid recipient from China has created a very fluid diplomatic link at the state level between
the two countries. From major constructions such as a railway line between Tanzania
and neighbouring countries in the 1960s, irrigation infrastructure at the Mbarali rice
estates in the 1970s, textile manufacturing plant in the Dar es Salaam in the 1970s,
China continues to support Tanzania through aid. China also regularly sends medical
teams from one of its provinces to provide support in the health sector.
In 2006 China pledged to build an agricultural demonstration centre in the Morogoro
region to enhance agricultural technology transfer to farmers in the country (Brautigam,
2009) . The construction is under way at a site near Dakawa. In addition to its embassy
in China which gives information to prospective Chinese investors in Tanzania and vice
31

versa they also established a Business Chamber in 1997 (Jansson, Burke, & Hon,
2009). This centre has the motive of establishing links between producers of consumer
and capital goods in China and other players involved in the value chain responsible for
the import and export process. The two countries have also signed a number of
economic, trade, aid and technical cooperation agreement (Moshi & Mtui, 2008).
India
Shared ideologies in anti-colonialism, anti-racism, socialism and desire for cooperation
among southern states drove the political relationship between Tanzania and India from
the 1960s to the 1980s. In 1961 India opened its high commission in Dar es Salaam. The
large presence of people of Indian nationals in Tanzania has also driven the business
and commercial relations between the two countries. India has become an important
source of machinery and pharmaceutical products for Tanzania. There is also a large
presence of Indian companies in the financial, minerals and trading sectors of the
economy. Some of them are also involved in the Agricultural sector, mainly producing
cash crops and certified seeds.
Aside from two cashew nut processing plants donated by the Indian government to
Tanzania in 2012, they have also established a centre of excellence in ICT and another
project in the University of Dar es Salaam aimed at providing up-to-date IT education. In
2010, India extended a line of credit of $50 million to Tanzania for financing the
agricultural sector. Tanzania has since used the money for the importation of tractors
from India.
b. Trade
Aside from the political relationships reflected through aid and various forms of
agreements, trade has also played a strong role in shaping the relationship between
Tanzania her partners. In 2010, whilst merchandise exports from Tanzania to the rest of
the world totalled over $3 billion its merchandise imports totalled over $7 billion. In 2008,
commercial services exports totalled over $1.9 billion while commercial services imports
totalled over $1.6 billion. The top five export categories for Tanzania in 2010, along with
32

the percentage of total exports, were: Pearls, precious stones, metals, coins, etc.
(12.4%), Fish, crustaceans, molluscs, and aquatic invertebrates (10.2%), Coffee, tea,
mate, and spices (8.4%), Tobacco and manufactured tobacco substitutes (7.3%), Ores,
slag, and ash (7%).
The top five import categories for Tanzania in 2010, along with percentage of total
imports, were: Boilers, machinery, nuclear reactors, etc. (12.6%), Mineral fuels, oils,
distillation products, etc. (12%), Electrical and electronic equipment (10%), Vehicles
other than railway (9.4%), Iron and steel (4.2%). The top three countries to
which Tanzania exports merchandise, along with percentage of exports, are: India
(8.1%), Japan (6.5%), and China (6.3%). The top three countries which export
merchandise to Tanzania, along with percentage of imports, are: China (14.4%), India
(9%), and South Africa (7.7%)2. See Figure 2.8 and Figure 2.9 for the Tanzanian trade
partners and the import and export values to and from these countries.
The graphs in Figure 2.8 and Figure 2.9 show that Tanzanian imports from and exports
to all the top eight countries begun to rise quickly in 2003, probably as a result of the
significant growth rate witnessed within the economy in the previous years. Worthy of
note is how much more quickly the imports and exports related to China and India fared
during the same period. There were significantly higher levels of commodity trade
between Tanzania and China/India between 2007 and 2010, while their engagement
with other economies grew at a slower pace.
2 Sources: World Trade Organization, International Trade Centre, and World Factbook
33

Figure 2.8: Imports, source and value (‘000 of current US$, 1988-2010)
1400000
1200000
1000000
800000
600000
400000
200000
0# -d>O ju r tw js p c # < # < #
■China
•India
SA
•UAE
•Kenya
Japan
•Singapore
•UK
■FRA
Source: Generated using WITS Data, 2012
These growing trade ties between Tanzania and China/India can equally serve as a
platform for importing agricultural capital goods, a subject matter of this study. In the next
Section therefore, we discuss the Tanzanian and international tractor and power tiller
markets and how the presence of China and India in the global trade is creating a new
platform through which Tanzania can source capital goods.
Figure 2.9: Exports destination and total Value (‘000 of current US$, 1988 to 2010)
600000
500000
400000
300000
200000
100000
0
c # c # c # csNVJp c£$ ^ ^
Source: Generated using WITS Data, 2011
•UAE
•China
India
•Japan
Kenya
Nerthalands
•Germany
•SA
■USA
■France
34

2.3 Agricultural mechanisation in Tanzania: how far so far?
Over the past fifty years, policy makers in Tanzania have recognised the importance of
mechanizing agriculture. For instance in the defining moment of appropriate technology
debate in the 1960s and 1970s, Tanzania played an important role. The first President of
the country, Julius Nyerere, half a decade into independence, declared that it was
incorrect for the country to depend on the North for their progress in terms of technology
and policy. He and his contemporaries argued that there should be efforts to develop or
select from intermediate technologies. To this end, the country’s agricultural sector
received some attention in terms of investment in intermediate tillage technologies such
as animal drawn implements and simple irrigation wells (Rweyemamu 1973; Carr, 1985).
The status quo has however not changed significantly in the last five decades: the hand
hoe is still a predominant tool on the farm.
Some of its policies of the Arusha Declaration left some good legacies for agriculture,
including well defined land rights vested in the hands of village committees. However
saturation of the sector with rudimentary tools made production beyond subsistence
difficult. Labour capability and skills were also generally conditioned by these simple
farm tools. In addition agriculture was mostly rain-fed and periodically affected by
droughts, resulting in low productivity (Sarris, et al., 2006; NBS 2010). Economic
difficulties encountered by the country’s economy in the 1980s reduced the attention that
Tanzanian policy makers gave to appropriate technologies. Policy shifted toward
liberalization and structural adjustment. Casual empiricism suggests that despite the
policy shift, the agricultural landscape has not changed much and the sector is still
dominated by smallholder farmers producing mainly for subsistence.
The level of mechanisation is low with the hand hoe dominating in farming systems
(Mashindano et al., 2011). In 2006, 68% of all farms in the country used the hand hoe as
the main tool for tillage. In the same year, the proportion of farms using animal power
and mechanical power stood at 22% and 10% respectively (Menenwa & Maliti, 2010). In
35

2010, there was a decline in hand hoe use to 64%. In the same year, the use of animal
power reduced to 20% while mechanical power usage rose to 16% (URT, 2012).
Attempts to commercialize agriculture among small and medium scale farmers in the
country as proposed by the Agricultural Sector Development Strategy of Tanzania, 2001,
require the selection and use of appropriate mechanisation equipment. A strategy
targeting a gradual increase in the use of low cost intermediate technologies such as
power tillers and small tractors which are easy to handle by farmers and the prevailing
infrastructure could be a viable option. Moving on to more complex technologies that
may be expensive and capital intensive will demand improvement in incomes,
infrastructure and support services: a maze of activities and physical assets which the
country does not currently possess.
Miniature tractors (power tillers) are a much more likely improvement over the oxen
plough which some farmers are already used to. Therefore a transition into their use may
present lower skill barriers for the farmer. However, as per differences in soil
characteristics across the country, not all geographical locations will find such small
tractors and power tillers useful- iron pan soil concretions may require heavy duty
tractors to carry out tillage activities. Thus one cannot also totally rule out the use and
need for large tractors. Therefore with the revamping of the mechanisation drive in
Tanzania in the 2000s, the watch-word should be appropriateness of the technologies
selected from the existing range on the market. Attention should be paid to the different
classes of farmers in the country and their particular needs. Presently, Tanzania does
not produce power tillers and tractors; there is very little evidence to show that this is
going to change soon. Therefore choice of mechanisation technique in Tanzania derives
from a global value chain dominated by European, American and Asian manufacturers.
We are in a disruptive stage in the world economy. The centre of world manufacturing is
shifting to emerging economies like China and India. Similar observations have been
made in the tractor industry. In the last decade, the significance of China and India has
grown tremendously when it comes to the manufacture and use of tractors and power
36

tillers. Since China and India have incomes, farm sizes and cultural characteristics that
differ from the advanced countries, it is likely that the tractors and power tillers they
produce will differ in character. The international market for power tillers and tractors is
changing and so the range of technologies available for the Tanzanian farmer to make a
choice is also widening. To understand the dynamics of the tractor market and the extent
to which the characteristics of the machines produced reflects endowments of the
societies which produce them, the sub-sections which follow discusses the structure of
the global market of tractors and power tillers.
2.3.1 Brief history of tractors and power tillers in the last century
The introduction and use of tractors on farms around the globe is eleven decades old.
Starting with USA and Western European agriculture, the use of tractors began around
1902. Based on steam engine designs developed in the 1800s by Scottish engineers,
further innovations generated gasoline engines in the early 1900s (Hodge, 1973). The
steam powered engines were first used in Britain. However the heavy and wet nature of
soils in England meant that a pair of oxen was more economically efficient than the
steam ploughs. In the USA where soil conditions were suitable, steam powered ploughs
were used well into the 20th century until reliable internal combustion engines were
developed.
Meanwhile, attempts to build and commercially sell petrol powered engines in the 1890s
in the US failed. However, between 1901 and 1902, British engineers produced and sold
the diesel engine. The major participating companies in these developments were
located in the USA and in Western Europe. Major break-through in the automobile
industry by the Ford company were relied upon to modify tractor designs to make them
simpler, relatively lower cost and more accessible to farmers in the 1910s and 1920s. By
the late 1910s companies in Italy and Germany developed their own brands and this
pushed the technology further. Spreading to other Eastern European countries like
Ukraine and Belarus in the USSR, the use of tractors become widespread in the 1930s.
37
In the 1950s, the technology spread to other parts of the world. India and China joined in
the production of these machines around the 1950s through collaboration with well-
established companies in the West. Though Japan had joined in the process earlier, it
was not until the 1960s when their brands which were typically small in nature but very
robust become popular.
Tractor use on farms has become ubiquitous in the developed world. It is however
uncommon on farms in developing countries in SSA. In Africa and in Tanzania in
particular, tractors were introduced by European settlers in the 1950s who worked on
cash crop farms (Kjaerby, 1986). After independence Tanzania showed strong
commitments to modernize its agriculture and so invested state resources to develop
access to tractors by farmers. Economic challenges in the early 1970s and 1980s
curtailed such interests. Economic recovery in the 1990s and 2000s has triggered new
interests in tractorisation (Hatibu, 2013). Thus in 2009, the government launched the
Kilimo Kwanza3 scheme which among other things sought to revamp mechanisation in
the country (Mmari & Mpanduji, 2014).
Similar to the evolution of tractors, the first design and appearance of power tillers on the
market were started by Swiss manufacturers in 1910 and filtered through other parts of
Europe particularly Germany and Italy but also the USA in the 1910s. After the WWI, a
returning Japanese combatant who had seen the Swiss design being demonstrated in a
nearby village by his government made his own version of the power tiller in 1926. His
initiative was triggered when the agent who imported the Swiss machines stopped in
1925 and those models were also found not to be suitable for the Japanese soil. With
further modifications to the Japanese designs using other tractor technologies from the
USA, the technology spread through other Asian countries like Thailand, Bangladesh, Sri
Lanka, India and the Philippines (Francks, 1996). With smaller 4-wheeled tractors
becoming popular in Japan in the 1960s, the demand for power tillers declined but they
3 Kilimo Kwanza is a Swahili phrase for 'Agriculture First' coined to represent the new drive for a green revolution in Tanzania
38

are still popular on very small farms. Their importance in Thailand, Bangladesh, Sri
Lanka, India and China cannot be overemphasized. In the late 1990s and the 2000s,
power tillers from the Japan, the Philippines, India and Later China were brought into the
Tanzanian tillage technology mix. Though local manufacturing is insignificant, the
importance of power tillers on small scale rice fields continue to grow in Tanzania.
2.3.2 Current demand and supply of power tillers and tractors
Each year over 600,000 power tillers are manufactured worldwide. Of this figure, close to
300,000 are produced in China, about 60,000 in India and 70,000 in Thailand. The
remaining 170,000 are accounted for by plants across the rest of the world. In Japan
Kubota Corporation is the most popular manufacturer of power tillers. The main
producers on the Indian market are VST Shakti and KAMCO. In China, Changzhou
Dongfeng Agricultural Machinery Group Co, Zhejiang Sifang Group and Huaxing
Machinery Co Ltd are the major manufacturers. In Thailand, Siam Kubota Industry Co
Ltd4, STI International Flying Star and Talaythong Factory Company Ltd are present.
When the global agricultural tractor market grew by 10% in 2013, 2.15 million units were
produced into a market worth US$125 billion (Figure 2.6). India and China were at the
top of this market producing 619,000 and 445,000 units respectively. This is followed by
the US and the EU with a total of 201,851 and 190,000 units respectively. Other
important producers are Brazil (65,115) and Turkey (50,320) (Agrievolution, 2014). The
following Sub-sections look at the characteristics of the different segments of the global
market in terms of the nature of demand and supply.
4 A joint venture between The Siam Cement Pic., Kubota Corporation, Marubeni Corporation, and Min Sen Machinery Co Ltd
39

Figure 2.10: Volume of world tractor production, 2012 (’000)700 600 500 400 300 200 100
0 I I^ <$P
* < / c f ^ ^ ^ & #
£ ° ip<F
Source: Agrievolution Alliance, 2014
a. North America and South America
There are two major centres of demand for farm tractors in North America: USA and
Canada. These two countries have predominantly large scale farms. Farm sizes in the
USA averaged 441 acres in 2002 and 418 acres in 2007 (USCB, 2012). Canadian farms
averaged 728 acres in 2006 and 778 acres in 2011. These farms cultivate mainly
sweetcorn and wheat for human and animal feed. However, recent demand for ethanol
has increased the demand for these crops (sweet corn, especially) resulting in
aggregation of farms. The share of their population in agriculture and its contribution to
the national GDP is also very low. In the year 2000, 1.9% of the labour force in USA
worked in agriculture and in 2002 agricultural GDP as a share of the total GDP stood at
0.7% (Dimitri, Effland, & Conklin, 2005). In 2006, the farm population accounted for 2.2%
of all Canadians and in the same year, the share of agriculture in the total GDP stood at
1.6% (Statistics Canada, 2006).
Average incomes of farming households are also comparable to the national averages or
even better. In 2004, the average farm household in the US had an annual net income of
US$81,480, while the average U.S. household netted $60,528 (USDA, 2004). By
40

contrast, In Canada, average income stood at Canadian $35,000 per farm, while the
national average stood at $53,634 per household in 2006 (Agri-Food Canada, 2012).
The farms in Canada have grown bigger while those in the USA have experienced a
slow reduction in size in the last decade. The demand for higher engine horsepower in
these two markets also grew in the last century. The Nebraska Tractor Test Lab last year
reported that the average and maximum horsepower of tractors tested at the lab has
been increasing at a rate of 3% a year since 1950. Because of the larger farm sizes,
farmers have relatively higher turnovers and profits that allow them to invest in high-end
tractor technologies. Financial markets for agricultural investments also work well, giving
farmers facilities that make long term investments in capital goods possible.
The main country in South America where the market of tractors is globally significant is
Brazil. Brazil is the world’s largest exporter of sugar, coffee, orange juice and soybeans.
Brazil is considered as an important emerging economy in terms of global food security
(Fan & Brzeska, 2010). It ranks third behind the US and Europe in overall farm exports. It
is also one of the few places in the world where new land can be put into production.
Over time South American countries like Brazil and Argentina are also experiencing an
expansion in farm sizes and the structure of their production (especially soya and sugar
cane) production is beginning to mimic their North American counterparts.
North and South American markets are dominated by three big groups of manufacturers
plus other smaller players, and together they produce high end, high tech and high
quality tractors. The top three brands are CNH (Case and New Holland), AGCO
(Challenger, Fendt, Valtra and MF) and John Deere. Whilst their main target is to
produce for the North American Markets, CNH, AGCO and John Deere do have plants
across the world producing and serving high end markets in Europe, South America and
other parts of the world (Hatibu, 2013).
41

The distribution of farms especially in North America clearly suggests that a substantial
proportion of the tractors produced for these markets have higher horsepower (between
120Hp and 360Hp). Quality standards are also high. A combination of high quality and
high horse power consequently results in high prices. Exports to other countries also
targets farms which are very large. Small and medium sized tractors are mainly
produced for the use by hobby farmers and large housing property management. There
are also smaller utility tractors mostly supplied by Japanese, Indian and South Korean
firms either with plants in the USA or in their home country. Their exports mainly target
hobby farmers and environmental management companies with horsepower between 25
and 50.
b. European Union and Eastern Europe
The EU, in terms of value is the largest tractor manufacturer in the world, and is home to
the single largest exporting country, Germany. In 2011 Germany had an export share of
21% of total world exports. Average farm sizes range from about 8ha in Italy to 54ha in in
the UK. (Jorgensen & Persson, 2013). Though not as big as farms in North and South
America, they are relatively bigger than those in Japan and South Korea.
The major manufacturers in this market are Case IH, AGCO, John Deere, SAME Deutz-
Fahr, Argo and Class. Together these companies accounted for 85% of total sales in
Western Europe in 2007. Both the production and demand is concentrated in Finland,
France, Germany, Italy, Netherlands, Sweden and UK. The reason for the concentration
of the markets here is the economies of scale in relation to farm size and the large
horsepower (80Hp to over 200Hp) tractors produced by the dominant companies. Most
tractors in these countries are used for about 4 to 5 years and then exported to the rest
of the world as second hand machines, especially to Eastern Europe. Small tractors are
gradually disappearing from the scene as farms become bigger and bigger. With new
markets opening up especially on large farms in Russia, these companies are now
42

investing heavily in research to improve quality, technology and size. For instance, in
2010, John Deere invested Euros 784 million in R&D corresponding to 4% of its sales
volume (European Commission, 2011).
c. Japan and Korea
The average farm size in Japan stood at 2 ha in 2010 ( MAFF, 2012b). This typically
small average farm size stems from the post-war redistribution of land from large estate
holders to small farmers under the land-to-the-tiller act which until 1970 limited land
holdings to three hectares (Yoshikawa, 2010). Whilst mechanisation and competition
increased farm sizes in most developed countries, in Japan it encouraged full-time
farmers to shift to part-time farming. In Japan, less than 4% of the population is engaged
in agriculture and the contribution of agriculture to national GDP is less than 2%. In 2010,
farm household income, on a per capita basis, exceeded that of non-farm households by
21% in 2010. At that time non-farm households earned Yen1839, whilst that of farm
households was Yen2230 (Jones & Kimura, 2013).
Korean agriculture is characterized by small farms. Although the average area farmed
per household in 2005 was almost 50% higher than in 1970, it was still only 1.4 hectares.
More than 60% of farms have less than 1 hectare and only 1% have more than 3
hectares. The share of agriculture in the national economy and in total employment is
approximately 3% and 7% respectively in 2005 (OECD, 2008).
Despite the fact that farm sizes in Japan and Korea are very small compared with other
regions of the world, they are very productive allowing farmers to accumulate enough
capital for investment in machinery. Farmers in these two countries have financial
surpluses that allow them to purchase high quality tractors and power tillers, but rarely
large horsepower because of their farm size. Similar farming environments exist in Japan
and Korea, though things are changing faster in Korea than in Japan. Both countries are
43

engaged in the production of intensive cultivation of irrigated rice and over time have
developed smaller but high quality tractors suited for their production situation.
The two common names in these markets are Kubota and Daedong. Producing both
tractors and power tillers, a lot of research has gone into product development and
improvement resulting in high quality products which are durable but expensive. The
Japanese Kubota has a plant in Japan and several others in the USA specifically
producing utility tractors for small farm usage and landscape maintenance. The Kubota
Company is also collaborating with Siam Cement in Thailand to Produce Siam Kubota
Power tillers. Just like Kubota, Daedong also produces tractors and power tillers for
consumers in Korea and also operates plants in the US that produce relatively smaller
horsepower machines.
d. India
In terms of volume, India is the worlds’ largest producer of compact tractors and the
country’s output rose rapidly in the 2000s reaching an all-time high of 0.6 million units in
the year 2012. It also doubles as the largest market for tractors in terms of quantity,
exporting a little below 30,000 pieces of the total produced in 2012. Indian annual
production represents about 33% of total global output by volume and it is expected to
grow. According to the Annual Report, 2010-11, of the Department of Heavy Industry,
Ministry of Heavy Industries and Public Enterprises, Government of India, “the Indian
tractor industry is the largest in the world (excluding sub 20 HP belt driven tractors used
in China), accounting for one third of global production.”
There are currently 13 national and a few regional players in tractor manufacturing in
India, M&M being the leading manufacturer. Other major players are TAFE (Massey
Ferguson and Eicher), ITL (Sonalika), Punjab Tractors ltd., Escorts, John Deere, New
Holland India, HMT, Forcemotors, Mahindra Gujarat. However, the market share is
concentrated amongst the top-five manufacturers, accounting for over 90% of total
volumes. M&M which currently controls about 40% of the Indian market is also becoming
44

an important global player and competes with traditional household names like Kubota in
the US.
The 2001 Census of India indicates that farming in India is very small scale - 68% of
farms are less than two acres in size and 95% are less than five acres in terms of owned
holdings. With high population growth rate, and expanding households and household
sizes, farm size in India have fallen from 2.3 ha in 1970 to 1.4 ha in 1996 on average and
continues to decline (Chand, Prasanna, & Singh, 2011). Thus tractor manufacturers
concentrate on the production of small to medium sized tractors ranging from 20Hp to
50Hp. Farmer demand for tractors in India is influenced positively by factors such as
support from the Government of India for rural development and agri-mechanisation;
scarcity of farm labour especially during the sowing season; increase in credit flow to
agriculture; increase in non-agricultural application of tractors as in infrastructure
projects; growth in niche power tiller segments and untapped territories; besides healthy
export sales.
India tractor exports are targeted at markets which demand medium sized machines just
like in their own country. For instance exports of Mahindra and Farmtrac to US are in the
range of about 30Hp to 60Hp, targeting hobby farmers and managers of utilities such as
golf courses. In Pakistan where farm sizes are not very different from those in India,
Millat Tractors has been assembling small to medium sized Massey Ferguson tractors
for the local markets mainly, and in recent times has started exporting to other countries
with similar farm and farmer characteristics, especially in SSA. Though the quality of
machines produced in India and Pakistan are not as high as those from Europe, North
America they are relatively simpler in terms of technology.
e. China
The collective agricultural system in China was dissolved in 1978. At that time,
community administrations in charge of land management allocated an average of 2ha of
45

land per household. This allocation made farm lands more fragmented and smaller
making farm mechanisation on these fields difficult. This kind of land tenure arrangement
for the household could be held for a period of 15 to 30 years and then they could ask for
a renewal from the community authorities. With the Chinese industrialization and
opening up in the 1990s and 2000s, rural labour supply became scarce as young people
who worked on the agricultural lands preferred to move into the urban centres for
manufacturing and related jobs.
As labour shifted to urban centres, households losing labour to migration naturally
relinquished their farmlands to others who decided to stay and continue farming. In
addition, with liberalization of the land markets, it is now possible to rent or lease land. A
combination of these developments has allowed farm sizes to increase again and to
justify the case of mechanisation. Nevertheless, the average farm sizes continue to be
much smaller than those in North America and Europe. Increased farmer income,
availability of credit and government subsidies has further strengthened the drive to
mechanisation.
In terms of manufacturers, CFT and Foton Lovol control 43% of the market, with 46% of
the remaining 57% shared among Yueda, Benye, John Deere, Donfeng and SNH. The
11% share left is occupied by smaller firms. To meet the demand of the market, driven
by relatively smaller average farm sizes in the country, most of these companies produce
tractors and power tillers of up to about 20Hp (mainly power tillers). For this end of the
market, China produces about one third of the total units produced across the world.
Some of these power tillers are exported to India and other Asian countries as well as
Africa, including Tanzania. The quality of these small machines are much lower than
those from Japan or South Korea, however prices are lower.
46

2.3.3 Where should Tanzanian farmers look?
North American, South American and European farms are several fold bigger than
Tanzanian farms on average. Japanese and Korean farms are relatively smaller and
comparably similar to those in Tanzania. However, American, European, Japanese and
Korean farmers are several times richer than the Tanzanian farmer. Thus machines
produced for American farms are relatively very big and possess capacity that is beyond
the average needed by the Tanzanian farmer. The Japanese and Korean machines
could have been a good alternative for the Tanzanian farmer; however the high quality
machines they produce come at a higher cost. Therefore, the scale economies in North
America and Europe and the very high quality and cost in Japan and Korea tend to
exclude the poor farmer in Tanzania in terms of access. Nevertheless, the high quality
nature of machines from these sources could mean that they will be cost effective in the
long run for the Tanzanian farmer. In addition large scale farmers in Tanzania may also
need such large and expensive machines to meet the demands of their operations.
Therefore whilst their high cost nature may mean that smaller and poorer farmers cannot
afford them, there are some participants in the farming business who may need them for
scale reasons.
The Tanzanian terrain is similar to those in India and China in terms of farm size and
farmer incomes. There is however a division of labour between the two countries. Whilst
the Indians dominate the production of medium-sized tractors, the Chinese are more
engaged in the manufacture of power tillers. Therefore it is possible for the Tanzanian
farmer, especially the smallholders to consider India as a source of tractors, whilst they
also consider China for walk-behind power tillers.
The possibilities in terms of choice between MM and EE sources will be discussed in
detail for most part of this thesis. Figure 2.11 suggests a trend that may be a pointer as
to what choices are currently being made in Tanzania. That is, there is a current shift
from the importation of tractors from Europe to importation from China and India into
47

Tanzania. This change in the source of imported tractors became more visible in the
mid-2000s. We shall concern ourselves in establishing some of the push factors of such
changes and how they are affecting choice of technique in Tanzania.
Figure 2.11: Tractor Imports into Tanzania, 1988-2008 (US$ ‘000)
25000
e 20000
15000
10000
5 5000
0
^ jP J? / JP / / / / 4? / ' jP / / / /^ — China - * - G e r m a n v —# “ UK — I ndi a —+ 1— Iran
Source: Generated from WITS database, 2011
2.4 Conclusion
Though agriculture’s contribution to GDP in Tanzania is not as high as services, it plays
a crucial role in terms of employment, especially in the rural areas. Output in terms of
annual crop production per capita is declining. This is an indication that labour
productivity is falling in the agricultural sector. Such trends are associated with long term
unemployment and food security risks which call for policy attention. To move production
levels beyond the current state without altering the factors of production, technology
needs to change. One of such technologies which could be modified is those related to
primary tillage- moving from simple tools to machines (power tillers and tractors).
48

There is however a paucity of both institutional physical infrastructure that supports the
agricultural sector, including agricultural technology transfer. These sets of infrastructure,
especially those related to financing of the agricultural sector are unlikely to change
dramatically in the next few years. This calls for creative ways of using the little available
to make the most out of the present situation. The world market for tractors and power
tillers is growing. Currently, China and India have become important producers in the
market. The presence of China and India on the global market has created a wider
choice for farm machinery. Trade ties between Tanzania and China, as well as India
continues to grow; and it is within this framework of continual trade growth that capital
goods for farmers could be harnessed to support the predominantly low tech farming
systems in Tanzania. In the next Chapter, we explore the global innovation landscape,
and how specific changes which are occurring in the way in which innovations are
created and the shifting geography innovation landscape could influence technical
choice on Tanzanian farms.
49

Chapter 3 : Innovation, Technological Choice and Technology Transfer
3.1 Introduction
This theory Chapter discusses the importance of agricultural mechanisation in SSA. The
Chapter seeks to understand why mechanisation efforts on the continent have generally
not yielded the desired outcomes. Having established how important technology is we
demonstrate that there is a change in the global innovation landscape. We are
witnessing a shift in the geography of the centres of innovation generation and
development from the Global North to the Emerging South and this change might offer
new opportunities for SSA producers to realise their mechanisation potential.
A spread in the centres of innovation might also suggest that the technology choice sets
from which SSA can select are widening. Thus there is a choice to be made, but this
must be an informed choice. An understanding of how this choice is made is crucial, if
benefits to the farmer are to be maximised. We therefore give a brief exposition on what
constitutes appropriate technology and technique choice. The factors inducing technical
change and the biases that come with technical change are then considered. We argue
that whilst appropriate technology movements in the past emphasised acts of charity as
a means of technology transfer to developing countries and had limited success, the new
wave of innovations from the emerging south presents a profit-driven Schumpeterian
motor that may hold the key for success.
The final discussion of this Chapter considers the processes through which technology is
transferred and the role played by government in ensuring that market imperfections are
minimized within the context of absorptive capacity. We shall begin with agricultural
mechanisation and rural development in the next Section.
3.2 Importance of mechanisation in SSA
SSA countries have long recognised that agricultural mechanisation had the potential of
transforming the rural economy into a viable engine of growth and in response many
50

African states at independence spent resources in trying to develop agriculture through
tractor imports (FAO, 1966). Mechanisation has the potential of increasing area under
cultivation and also freeing labour to concentrate on other aspects of the farming process
which enhances productivity (Irz et al., 2001). The resultant increased productivity from
growth should translate into increased employment, food security and poverty reduction
all things being equal (Mellor, 1999). However for the past 40 years, efforts targeting the
use of tractors and especially on small farms in the region have not worked (Hatibu,
2013). More recently, an assessment of the provision of government subsidies for the
establishment of private sector run mechanisation centres in Ghana revealed a mixed
impact on different outcome indicators. For example, whereas the program has
contributed to improving availability of mechanization services, reduced drudgery,
promoting adoption of good practices, and raising yield, it has had no impact on the
change in the prices paid by farmers for the services used and the change in the amount
of area ploughed. (Benin, 2014).
Several reasons have been advanced in the farm mechanisation literature for the failure
of African governments and farmers to push mechanisation to optimal levels.
Infrastructural factors, capital constraints and the nature of, and choice sets of
technologies available were some of the factors cited for such failures (Sims & Kienzle,
2006). More importantly the profitability of mechanising agriculture is also critical. In both
Mali and Ghana, there is agreement that mechanisation is profitable and hence
economic for crops with a good or fair local market price and ready market (Fonteh,
2010).
There were also debates about the intended and unintended outcomes of mechanisation
on employment (Biggs et al., 2002). Many writers argued that mechanisation will leave
rural farm labour unemployed; others argued that mechanisation had the potential of
improving productivity outcomes (Eicher & Baker, 1982). The debate became more
focused on whether it was a good thing to mechanise instead of concentrating on which
51

forms of mechanical technologies were viable (ILO, 1973). Proponents of mechanisation
argued that the use of tractors and draught animal could increase productivity of land
through timeliness of farm activities; overcoming seasonal labour shortages; reduction of
farm drudgery and could also be used for other off-farm activities (FAO, 2011). A seminal
paper by Giles of North Carolina State University showed that together with other farm
inputs, farm power influenced agricultural productivity and production in general (Giles,
1967). This paper became widely accepted and influenced the mechanisation debate
across the world. It appealed to newly independent African countries including Tanzania
to emphasise mechanical farm power (IBRD, 1960).
Experts in the development community who opposed the above views argued for a
cautious path of mechanisation as it could lead to displacement of labour, landlessness,
rural-urban migration, inequitable distribution of wealth and increases in absolute poverty
(ILO, 1973). They argued for a gradual transition from hand tools, to improved
implements and animal power, moving in tandem with changes in the technological,
cultural and socio-economic development of society (Mrema, Baker, & Kaha, 2008).
Further work undertaken by the ILO between 1970 and 1973 supported the potential
unemployment effects of mechanisation. However recent studies have shown that
specific patterns of rural and agricultural mechanisation created net positive effects on
productivity and income distribution (Mandal et al., 2002). Again the thinking that
unemployment will be exacerbated if farms were mechanised failed to recognise the
distinction between drudgery intensive technologies and skill intensive technologies
(Biggs et al., 2002). That is, retraining the labour freed from highly drudgery-based
activities could prepare them for different forms of employment related to the
mechanisation process (Jackson & Palmer-Jones, 1997).
Deteriorating economies across SSA and the consequent liberalization of the productive
and markets sectors led by the Washington Consensus (Williamson, 1990) derailed
mechanisation objectives of many African governments in the 1980s and 1990s (Gabre-
52

Madhin & Haggblade, 2004). However, it was not the only the Washington Consensus
policy that caused decline in interest in mechanisation. That is, there were also several
policy initiatives by developing country governments underpinned by a linear pathway to
mechanisation thinking which did not work and caused further slow-down in spending on
mechanisation (Starkey, 1998). This thinking, suggested by some engineering and social
science literature at the time, made many developing countries assume that
mechanisation is a stage by stage process (Gass & Biggs, 1993; Biggs et al., 2011).
Some of the views against rapid mechanisation argued that until the social, cultural and
infrastructural settings improved it will be wrong to employ mechanical tools on farms
(Mrema et al., 2008).
With mechanical power, tractors mostly imported from advanced countries unable to
create desired growth paradigms, development communities turned to other types of
technologies. More attention was paid to the proponents of gradual mechanisation. Thus
In the late 1970s and 1980s, efforts aimed at intermediate tractor technologies supported
by the tenets of appropriate technology movements5 gained grounds. For instance
Kabanyolo and Tinkabi mini-tractors respectively in Uganda and Swaziland were
developed (Holtkamp, 1991). Not fully supported by international policy, the success rate
was low and these efforts ended in the 1990s. However, overall efforts to promote
animal traction fared better (Starkey, 1998). A review of material related to the gradual
progress on the mechanisation ladder made it quite clear that there is no fixed set of
stages to be followed when considering mechanisation. Different processes may be
mechanized at different times for different reasons in different places, with different
actors playing different roles in each situation (Biggs et al., 2002).
In another development, an analytical literature review by Pingali et al. (1987)
complemented by field visits to 50 locations in 10 African countries including Tanzania
5 The main tenets of this movement was that if low cost and small scale technologies were made available to developing country producers and these producers in turn produced affordable consumer goods for the poor, then higher growth, poverty reduction and improved distribution would result.
53

revealed that it has been impossible to use tractors to accelerate the evolution of farming
systems on the continent because of the nature of land and its resources being
cultivated by farmers. In many areas, farms are typically forest fallow and virtually
impractical to introduce tractors. Tractors only become popular at the late bush fallow
stages or early grass fallow stage of evolution. The study further suggests that the
introduction of tractors at the late bush fallow stage or early grass fallow stage is not cost
effective in comparison with animal power. The study argues that at this point, the cost of
maintaining animals reduces since there is an abundance of forage for animals to feed
on. Thus the persistent failure of tractor hire schemes introduced by some African
governments and donor agencies could be explained by a combination of these factors.
3.3 Changing economic fortunes of SSA and the emerging economies
Regardless of the divergent views on the benefits and challenges of mechanisation
access can only be created if farmers have the requisite financial standing. And as
discussed in the previous section, many SSA economies performed poorly in the 1980s
and early 1990s. However, the good news today is that stability and growth are being
restored in many SSA countries including Tanzania. Specifically in the last decade
governments of SSA countries where rapid growth has occurred are rethinking
mechanisation (FAO, 2011). For example, since 2007 the government of Ghana has
provided subsidies for private businesses and farmers to set up tractor hire service
(Houssou, et al., 2013)
This second look at the viability of mechanisation and the need for policy is happening at
a time when the world order of technology generation is shifting from the traditional North
to South. Globally, Emerging Economies like China and India are becoming an important
force to reckon with in terms of capability and competence in producing consumer and
capital goods especially for low income markets (Clark et al., 2009). These emerging
economies are using cost innovations to produce consumer and capital goods that are
accessible to low income populations at the bottom of the income pyramid (Zeng &
54

Williamson, 2006). This new dynamic may hold the key to unlocking the challenge that
has prevented poor producers (farmers) in SSA from using mechanical tillage
technologies on their farms (Khan et al., 2009), a matter we shall consider in the next
sub-section.
3.3.1 New possibilities for revamping the sector and choice of technique
SSA’s recent mechanisation policies are occurring in a dynamic world. The rise of China
and India as global economic and political powers is one of the most important
transformative processes of our time - challenging the international political economy
dominated by the “transatlantic West.” Recent literature on the engagement between
China/India and SSA suggests that there could be diverse impacts on African economies
as they open up to, and relate with these emerging economies through trade, aid and
production/FDI. The distinctive and significant impact which these emerging economies
are likely to have on the global economy and SSA in particular, are likely to arise not just
from their size, but also from their distinctive public and private actors (Kaplinsky, 2008).
The impacts that these engagements are likely to have on SSA could be competitive or
complementary; whether it is through trade, aid or FDI. The complementarities or
competitiveness will either be observed directly or indirectly on consumers and
producers within SSA countries or in third countries outside the particular SSA economy
(Kaplinsky et. al., 2007; Khan & Baye, 2008; Morris & Einhorn, 2008). We consider
some the studies which have attempted to examine this matter in the next sub-section.
3.3.2 Empirical studies
Studies in Africa on the direct effects that SSA trade engagement with China and other
emerging economies are having on African producers and consumers have largely
ignored the impacts that capital goods may have on producers on the continent. For
example, using three case studies in Cameroon, Khan, et al. (2009) found that imports of
consumer and transportation equipment (motorcycles) from China had both positive and
negative impacts on local consumers and producers. In the direct sense, cheaper
55

consumer goods from China created access for the poor who otherwise could not afford
locally manufactured products or those imported from developed economies, like the EU.
Further, relatively less expensive motorcycles have not only eased the burden created
by a malfunctioning public transport system and poor road infrastructure, but also
created jobs for the drivers. There are however concerns about increases in the number
of road accidents and the stress created for policing and public health service. In terms
of effects on third country markets, the same study finds that hitherto, producers of
batteries in Cameroon were able to export to other African countries, but such markets
have been taken over by low cost Chinese products, resulting in cut backs in local
employment.
Morris and Einhorn (2008), when studying the South African clothing and textile sector
found that the competitive and complementary, direct and indirect impact of Chinese
imports on industry is complex and multi-faceted. Productivity increases in production
were observed as a result of increased competition. There were equally lower logistics
costs to producers as a result of improved efficiency and infrastructure as well as
diminishing bureaucracy. The informalisation of the sector has also resulted in falling real
wages. There are also falling prices of imported inputs and changes in the distribution of
rents along the value chain. Unemployment fears could not be justified to the extent that
new forms of jobs have been created for new actors within the chain, who otherwise
could not have participated.
A more recent pilot study by Mmari & Mpanduji (2014) directly related to agricultural
mechanisation concentrated on understanding the role of frugal innovation6, technology
transfer and technology networks in Africa’s economic transformation. Using the power
tillers and small farmers as objects of the research, the study identified the process
through which machines were imported (how choice was made), the role of government
6 Frugal innovation is viewed as a process of transforming products from their technical complexities while retaining their basic functionality, plus reduction in aspects of costs to make them more accessible to the poor.
56

and other market institutions which coordinated to facilitate the process. The study
concludes that import of power tillers into Tanzania was state-led and was not
adequately informed by technical and agro-ecological differences. As a result, power
tillers were imported from different Asian countries and no reengineering was carried out
in their designs to suit the local needs.
In addition, no thorough preparation was put in place in terms of identifying the needs of
users, training of operators, and setting up maintenance and service system. The study
suggests that frugal innovation entails more than just reducing the complexity and costs
of products or services while retaining basic functionality. It also entails a functional
interface between technological and institutional dynamics. This study by Mmari &
Mpanduji (2014) did not examine appropriateness through the computation of
productivity and profitability measures of the different power tillers from the various Asian
countries. This is an area which our present study will seek to contribute to and also
expand the thesis beyond power tillers to include tractors.
Finally, (Biggs et al., 2011) in sketching the diverse patterns of rural mechanisation in
South Asia, first called for a reopening of the mechanisation debate in the developing
world which had been left dormant for almost two decades. In the view of the writers,
under some demographic projections, neither local urban development nor the growth of
the international remittance economy will provide adequate employment for rural people.
The role of engineering, energy and trade policy in influencing patterns of agricultural
and rural mechanisation and employment remains central. In the account of the study,
despite the high level of the agricultural engineering industry in Japan, Korea and India,
they failed to develop machines that would improve the mechanisation levels in
developing countries in Asia. It was the Chinese industry which has created technologies
that have transformed small scale agriculture in Bangladesh, India and Nepal. In each of
these countries an initial entry by the high quality versions of power tillers from Japan are
57

followed by relatively lower quality versions from China, which are more affordable to the
user.
In conclusion, the Biggs et al., (2011) study draw attention to four themes that provide
entry points into a renewed debate about agricultural mechanisation (1) the important
role played by public policy and it’s diverse outcomes; (2) the significance of increasing
markets for technology-based services; (3) the importance of revisiting income and asset
distributional outcomes produced by technological change; and (4) the need to link up
“old” themes around technology with current realities. Aside from this thesis seeking to
empirically test the extent to which Chinese and Indian technologies are more profitable
when compared with their Korean and Japanese counterparts, we shall also attempt to
contribute to themes 1, 2 and 3.
Clearly these studies have tackled some aspects of the potential effects that SSA
engagement with Emerging Economies can have on African producers. However, the all-
important area of what benefits producers can accrue in terms of the use of Emerging
Economy capital goods has not been given the needed attention- a matter this study
hopes to address..
3.3.3 Changing innovation landscape
To contribute to the debate on how emerging economy capital goods can contribute to
productivity growth of poor producers in SSA, an understanding of how technology drives
economic growth is essential. The discovery of the Solow residual in 1957 in US
manufacturing showed that the rate of economic growth could not be totally explained by
known causal variables. Only 12.5% of the improvement in productivity, after taking into
consideration the stock of capital and labour, could be accounted for. Thus, beyond the
rate of investment, other factors also influenced productivity; particularly science and
technology (S&T) investment. This drew the attention of policy makers and researchers
then, to the usefulness of S&T to economic growth, and the consequent impact on
58

underemployment and unemployment which underlies poverty and inequality across the
globe (Clark, et al., 2009).
Thus the potential contributions that S&T could make in addressing poverty and
inequality were without doubt. However, how to make this happen kept the development
community busy in the 1960s and 1970s. During this period, when a group of social
scientist were asked for recommendations by the UN on S&T for development in low
income countries, the scholars proposed what is now known as the Sussex Manifesto
(SM). The SM argued that S&T development was overly skewed to advanced countries.
As a result high levels of human capital were built up in advanced countries or advanced
sectors in developing economies with very little positive effect on local economies. As an
antidote, the SM suggested that beyond institutional change within and outside the S&T
systems, developing economies should raise their R&D expenditure to 0.5% of GDP. In
addition developed countries should support R&D of low income economies through aid,
and spending a portion of their own R&D efforts to meet the needs of developing
countries (Singer, et al., 1970).
At the time (1960s) when the SM saw formal public sector R&D institutions as the major
source of innovation, only one-fiftieth of global R&D was located in low income countries.
In the year 2000, the figure stood at one-fifth: representing a tenfold increase. However,
these phenomenal increases in R&D expenditures in developing countries failed to
change the state of innovation capacity in many low income economies. Because the
technologies so developed relied heavily on advanced country inputs, they were usually
inappropriate for poor consumers and their operating environments (Clark, et al., 2009).
To deal with these shortcomings, the appropriate technology (AT) movement led by
Schumacher suggested widening the range of efficient techniques to include mainly less
capital-intensive innovation (Schumacher, 1973). The AT movement did have some
recognition, but failed to address the challenge of shifting the production of technologies
59

from supply-driven to demand driven to meet the needs of consumers in low income
countries (Kaplinsky, 1990).
Some of the challenges that might have caused the failure of the AT movement, lies in
the seemingly concentrated nature of technology generation in the advanced world. Over
the past two or three centuries, the dominant source of technological change and
innovation has been in Europe and North America, joined in recent decades by a group
of north-East Asian economies (like Japan, Korea and Taiwan), increasingly integrated
into large-volume global markets (Kaplinsky, 2009). However, several decades of
investment in education, training and capital goods sectors in emerging economies like
China and India have helped them develop science and technology capabilities for
innovation (Mani, 2005). These economies have dynamic markets which are growing in
terms of size and purchasing power. This allows for innovations to reap economies of
scale and scope. The market is however distinctive in the sense that it is dominated by
low income consumers with associated trade-offs between cost, quality and variety. Low
labour costs also allows for less mechanised forms of production. Infrastructure is
generally poor and unreliable, and labour relations are also different. These
characteristics of the emerging economy markets have triggered the development of
Below the Rader Innovations (BRI)7 which may go unnoticed. Because the nature of
these markets and production has been around for a long time, BRI tenets anticipate that
they will produce appropriate technologies that are suitable for production skills and
technological capabilities in other low income countries. (Clark, et al., 2009).
At the very least, BRI innovations could complement the technologies available to poor
country producers, or possibly find more space because of the social and cultural context
within which they have evolved. Insights into how distinctive they are from advanced
7 A term pioneered by Raphael Kaplinsky and other researchers at The Open University to emphasise the point that some technological innovations, both rudimentary and advanced, which usually go unnoticed may hold the key for providing access for low income consumers to products and services which they might otherwise not have.
60

country technologies and the extent to which they are pro-poor is crucial. Studies which
target this area of research are relevant for two reasons. First, technological innovations
do not always follow a sequential process of generation, transfer and diffusion, but are
usually socially constructed. Thus a technology generated by a particular social context
is more likely to be suitable for other societies which share similar characteristics, as
opposed to if they were developed in a completely different social environment. Second
because China and India are themselves developing, just like other SSA countries, they
are likely to develop technologies (capital goods) which are suitable, not just for their
own operating conditions but also for other developing countries with similar social,
cultural and economic contexts.
As the Emerging Economies join Advanced Countries to produce capital goods (such as
tillage technologies), the fundamental question of choice of technique becomes
imperative for users and SSA governments. The innovations and technique choice
literature in the past four decades has been dominated by how appropriate advanced
country technologies can be useful for the developing world (Bhalla, 1977; Stewart,
1977; Kaplinsky 1981; Clark, 1985; Kaplinsky 1990). Whilst most writers concentrated on
a comparison between advanced country technologies and indigenous versions, it is now
imperative that we do the same for the advanced country and emerging economy
dichotomy. In much of the growth literature, the distributional consequences of
technological progress and innovation are generally ignored (Cozzens and Kaplinsky,
2009). Therefore, this study will not end with just a comparison of the distinctiveness of
the two sets of techniques (advanced country verses emerging economy), but also
concentrate on the extent to which they are pro-poor. In the meantime let us start with a
discussion on how choice is made.
3.4 Optimality and appropriateness of technology choice
In any production process, there are infinite possibilities of technically combining labour
and capital to produce an output (Farrell, 1957; Sen, 1968). However, because of
61
engineering limitations not all technically possible combinations of labour and capital are
feasible (Eckaus, 1955). Economically optimal technique choice is therefore constrained
by a set of limited engineering production functions (Clark, 1985). Depending on the
prices of labour and capital in the society under consideration an economically optimal
choice of technique can be made with the view of minimising total cost. Depending on
the size of the market in which the production process is taking place, there are also
scale considerations to be made (Kaplinsky, 1990). That is though there could be scale
economies to be realised, if the market under consideration cannot absorb all what is
produced, then the producer may have to cut back on total product. Further, depending
on the characteristics of consumers (rich or poor), the quality of products must either be
high quality or low cost to cater for the purchasing power and demands of buyers.
Historically, the production of efficient technologies was concentrated in advanced
countries where capital is relatively abundant. This narrowed the range of economically
efficient technologies for labour abundant developing countries (Emmanuel, 1982).
For technologies to be considered appropriate environmental, cultural and employment
concerns of society must be given some attention when a choice of technology is being
made. Societies who are final consumers of technologies may also demand that
whatever technique choice is made the health of the environment and user satisfaction
are catered for. The technological choice should also take care of employment objectives
of society to the extent that unemployment is curtailed. Appropriateness is thus a relative
concept influenced by the objectives of the decision maker (Floor, 1979)
Economic agents (households, firms and governments) across the world of decision
makers have different goals and face different constraints in terms of resource
availability, prices, type of consumers and other environmental standards. The choice of
a technique from a stream of available ones depends on the goals of the decision maker,
the constraints they face and the characteristics of the techniques. Thus an appropriate
technology can be a normative one depending on whose welfare is considered or a
62

positive one reflecting economic and climatic conditions in which the technology is to be
utilised (Lipsey, 1966). The actual decision therefore varies according to the nature of
the decision maker and for the economy as a whole.
Richer societies (advanced countries), have capital intensive techniques and relatively
poorer ones (developing countries), which have labour in abundance usually have labour
intensive techniques. These two markets have different requirements in terms of
technology needs based on the fact that the availability of capital in advanced countries
is high and comes with relatively lower interest rates. In the developing countries, labour
costs are relatively lower and there are often lower levels of skills. In any given
environment, a set of techniques which makes optimum use of available resources is
considered appropriate. For each process or project, it is the technique that maximises
social welfare if factors were shadow priced. This concept deals with the inter
relationship between patterns of human living and technological choice. That is the role
that technology can play in meeting the needs of various segments of society.
(Kaplinsky, 1990).
The creation and provision of techniques (capital goods) was formerly dominated by
advanced countries making the efficient technologies produced disproportionately
suitable for developed economies or the developed sectors of developing countries
(Eckaus, 1987; Emmanuel, 1982; Stewart, 1977). For many years the developing
countries had to adopt and use these technologies sometimes without modifications to
suit the local requirements. With new forms of capital goods being developed by
emerging economies, what criteria will ensure that the selection made accounts for the
welfare of the decision maker, society and the environment especially in SSA?
Kaplinsky (1990) makes a number of recommendations that may help determine what
considerations to be made if appropriate technologies are to be made. The organization
of production of the firms; income levels; skill limitations; products and linkages or
63

technical factors are key elements to be considered. If the production organisation is
such that firms are bigger with many employees and producing at a large scale then the
scale of technologies developed should be commensurate with firm/farm size. Income
per capita is an important determinant of what the average producer or consumer in an
economy can pay for a product and will influence the pricing of capital goods produced
for those markets.
Different technologies may also require different levels of labour training and skills to
man them. Though some individuals within a society may have very high skills, there are
general trends of what the average person can do as a reflection of the education
system and investment in skill development. This too, must be given attention when
developing technologies for a particular society. Attention must also be given to the kinds
of products developed and whether they fit the environment in question. For instance
whilst tractors developed for temperate regions may require a glass cabin to protect
users from cold, no such thing will be needed in the tropics. Again technologies will fit a
society if there is an existing infrastructure and institutional support that would facilitate
its use. Where there is paucity of infrastructure, there may be the need to consider
technologies which are more robust and can depend on stand-alone structures to work.
Stewart (1977) argued that technological development has been such that it creates
inappropriate techniques, and leaves underdeveloped and undeveloped the techniques
which suites conditions in poor countries. As such she argues that a technology that
targets the rural economy in the developing countries should aim at increasing labour
productivity, keep technology within the capacity of the local entrepreneurs, minimise
skill requirements. It should also provide employment for local labour and through the
use of local inputs stimulates several productive activities within the society. In the urban
societies of the developed countries where firms are engaged in large scale production
and adopting cutting edge technologies in an attempt to fit into a more globalized market
place appropriateness may take a different tone. Appropriate technology should increase
64

access by local entrepreneurs, increase employment opportunities, develop the existing
knowledge that firms have and gradually transform them from a dependence stage to
firms which also produce innovation. (Stewart, 1977).
To address the needs of relatively poorer households and countries as they access
technology for production and consumption, the appropriate technology movements in
the 1970s and 1980s promoted intermediate technologies that were low cost and smaller
in scale to meet the infrastructure and skill circumstances of the poor. These movements
were generally based on acts of charity. The tenets of the appropriate technology
movements led by Schumacher were based on the idea that growth, poverty reduction
and distribution in low income countries will be greatly enhanced if producers had access
to labour-intensive technologies which were small in scale, and if they produced products
which were low cost and accessible to low income consumers (Kaplinsky, 2009).
The absence of entrepreneurship in low income countries, inadequate skill sets to
develop innovation and the lack of effective demand made the ideas of the appropriate
technology very difficult to implement. The producers and consumers in low income
countries had unfilled needs, but they lacked what it takes to meet these needs.
However, in the last two decades some of these limitations of the appropriate technology
movement have seen significant changes, especially in China and India.
Entrepreneurship in these two economies have become vibrant, skill sets have improved
thanks to heavy investments in training and skill development and as incomes also rise
as a result of high growth, effective demand is soaring. These changes could enhance
technical change in other developing countries by circumventing the need to use charity
as the main engine of technology transfer. We shall consider some of the inducements to
technical change and the factors that may influence the direction of technical change
(technical bias) in the next Section.
65

3.5 Induced technical change and technical bias
Movements along the production function from one point to another represents a change
in technical choice. However, if the whole production function shifts towards the origin,
there is a technological change. Basic neo-classical economic theory suggests that the
rational producer will use each input to the point where the marginal productivity of that
input equals the unit price of that input (Mowery & Rosenberg, 1998). However, there are
other factors that may induce technical change aside from the usual equation of cost of
output and input prices. As noted by Ruttan (2001) both demand and supply factors can
induce technical change. First when the nature of demand changes, there is the
likelihood that technology leaders will innovate to meet the demands of the new market.
Consider the incomes of consumers in a spectrum. When high income consumers
induce innovation it results in the choice of highly-differentiated “positional” products,
commensurate with the status of the consumer. Emphasis is placed on quality rather
than just price and acquisition costs. On the other hand, low income consumers need
function, rather than “position”, they are prepared to settle for low quality low acquisition
costs. (Prahalad, 2005; Kaplinsky, 2009).
Second, when a particular input becomes expensive in a particular production
environment, firms will use less of that input and more of the relatively abundant one.
That is the change in the relative price of the factors of production is itself a spur to
innovation and to inventions of a particular kind. Thus innovations will be directed at
economising factors which are becoming more expensive. (Hicks, 1932; Ruttan, 2001).
Future expectations about changes in factor price could also drive innovation and the
direction it takes (Fellner, 1961).
The third factor inducing patterns of technical change relates to the trajectories of
innovating firms. Firms will have imperfect information and will scan their known contacts
and data-sources in the search for improvements in process and products. They will also
do so in the context of the routines which they have developed to master their past
66

operations. These firms thus have their own path-dependencies and trajectories (Dosi,
1982).
Regardless of the source of technical change either more of labour or less of capital or
vice versa would be saved (Clark, 1985). In a developing country context therefore,
attention must be paid to technologies which takes into account the incomes of
consumers or users as well as the availability of factor inputs. Under labour abundant
conditions typical of some of the sectors in developing countries, capital saving
technologies (that is technologies which are labour bias) might be preferred to those
which are capital biased.
3.6 The measurement problem: contribution of K and L to productivity
Since this study intends to compare technologies on the bases of their contribution to
growth and productivity, there is the need to measure the efficiency of capital (K) and
labour (L) use. Whilst theoretically it is relatively easy to discuss technology and
technological choice, the actual measurements of what an efficient technology is, can be
very difficult in the real world. It makes both theoretical and policy sense to measure
efficiency. To subject the theoretical arguments like relative efficiency to empirical
testing, actual measurement of efficiency is required (Farrell, 1957). However various
methods have been suggested and used by scholars in the area of technical choice.
Prominent among these methods are physical productivity ratios of labour, capital and
output (Stewart, 1977). The challenge with this method is the limitation imposed by
heterogeneity of products and the fear that sometimes we may not be comparing like
with like. In cases where these differences can be brought to a minimum, technologies
are ranked based on their capital or labour intensity and sometimes the productivity of
capital or labour. To support the results that are obtained from these productivity
coefficients, further analyses which rely on profitability using benefit-cost analyses have
also been widely employed in the literature.
67

Productivity of inputs (that is the contribution of inputs to output generation) can either be
done in the total factor sense or a single factor sense. Total factor productivity is defined
as the ratio of the value of output to the value of all inputs. It gives an idea of how
productively inputs are used. To facilitate ease of calculation and isolate individual
contribution of different resources, the analysis is carried out in terms of single factors,
either L or K. For labour, the average productivity is defined in terms of output per worker
over a given period of time.
The different measures, either total or individual factor productivity, can give quite
different results. It is possible for total factor productivity to fall, while labour productivity
is rising. It is important thus to be clear and consistent when using these forms of
measures. In measuring contributions of labour and capital to productivity, ratios of the
three basic variables of the production function are used, mainly to examine how
intensively a factor is being employed. The Capital-Labour ratio (K/L) refers to capital
per unit of labour employed; that is the extent to which the two factors of production are
being used relative to each other. Output-labour ratio or the output per worker - (O/L) is
a measure of labour productivity. Output-capital ratio which is the output per unit of
capital (O/K), on the other hand, measures productivity of capital.
The accuracy of these ratios depends on the extent to which factors and output are
correctly measured. In theoretical analysis especially from neoclassical perspective,
measurement is not so problematic. The neoclassical school argue that abstraction from
the real world can be made based on some assumptions: (i) Homogeneity of factors and
products; (ii) Perfect competition of markets (in terms of both factors and products). Thus
based on the homogeneity assumption, calculating O/L for example, only involves finding
the ratio of the sum of output to the sum of labour. However in reality, some problems
exist when one is measuring factors and outputs of production. Factors, that is, labour
and capital are not homogenous in the real world. In addition factor markets are not
perfect - as a result of information asymmetry, monopoly control of resources, minimum
68

wage policies, etc. Therefore, factor prices cannot be used as weights in creating indices
(See Kaplinsky, 1990).
On the product front, the non-homogeneity problem of products cannot be overlooked
and a linear sum of product value will be misleading. Product quality and other forms of
product differentiation such as packaging and standards inherent in the product are
different. The same kind of product coming from different firms from the consumers’
perspective may be different and as such valued differently. For Example Divine
chocolate and Golden Tree chocolate all produced in Ghana, may look the same on the
shelf however they have different prices because the former is certified and comes at a
higher cost. The production processes of the cocoa beans are different. Whilst Divine
accounts for environmental sustainability, Golden Tree may not. In the same vein
product markets are also not perfect, and come with its inherent price differentials.
With the given problems above, how then do we empirically measure the contributions of
these inputs to productivity? A number of ways have been suggested by different
authors, depending on the situation in which one finds himself/herself. In measuring
Capital (investment) - labour ratio, Stewart (1977) calculates K/L as acquisition cost
divided by man-days for block manufacture in Kenya. In an attempt to make allowance
for different asset lives, acquisition costs are converted into annual investment cost using
the equation;
PV = -r ( l - ^ ) 8 (3.1)
Thus annual investment cost can be expressed as;
= rPV/{ (3.2)
8 Where A constant annual cash flow; PV is present value of the cash flow which is equal to in itia l acquisitions cost; r=interest rate; and n=number of years
69

Labour productivity (O/L) has also been measured in an empirical study in the bread
making industry in Kenya by Kaplinsky (1990). Here, labour was measured in a way
similar to Stewart’s method. The main assumption is that labour in the bread industry is
largely unskilled and fairly homogenous in that respect; but the point is if over time some
of them become skilled through formal training, then some weight must be applied to
account for the training. Efforts in measuring output is relatively difficult because firms
produce different mixes of bread and confessionary. Therefore based on observed
differences in time and other inputs, the output of the firms is converted to ordinary-bread
equivalents. Thus, for example, O/L will be equal 4000 loaves per year for a technique
that employs 30 workers and produces 120,000 loaf equivalents in a year. Capital
productivity (O/K) has also been done in the Kaplinsky’s (1990) example of bread
industry. Capital was measured in a slightly different way from Stewart (1975). Stewart
used annualised acquisition cost while Kaplinsky used annualised replacement cost
based on economic life of the equipment. With already measured output, O/L is
calculated by dividing the output by the value of annual investment (either calculated by
Kaplinsky’s or Stewart’s approach).
3.7 Technology transfer and diffusion
Underdeveloped countries are at a huge disadvantage in the global high tech economy.
Until recent changes in China and India, underdeveloped countries had fallen behind the
developed world in both acquired and domestically developed technologies. There are
two main ways through which nations and firms can acquire technologies: produce their
own or procure from other nations or firms. Thus one of the ways to bridge the
technological gap is to enhance the international transfer of technologies. The
importance of international technology transfer for economic development can hardly be
overstated. A fundamental process that influences the economic performance of nations
and firms is technology transfer (Mansfield, et al., 1982). Both the acquisition of
70

technology and its diffusion foster productivity growth (Hoekman, Maskus, & Saggi,
2004).
Technology transfer has been described as an intersection between business, science,
engineering, law and government. The process by which a party in one country gains
access to, and absorbs technical information into their own production process from a
foreign party is referred to as international technology transfer. International technology
transfer has the potential to encourage economic growth, and some writers have argued
that the gap between incomes of developed and developing countries can be explained
by the barriers to technology adoption that exists between the two worlds.
The foundations of international technology transfer is built upon the exchange of
information and knowledge (Tassey, 1992) which maybe codified or uncodified;
embodied in products or people; or disembodied in ideas or people. Technology transfer
can be a market-based transaction between unrelated parties or through a non-market
mediated approach (Kim, 1991). When the technology transfer is market mediated, the
seller and buyer are able to negotiate the cost of the technology using market
mechanisms. These market-based technology transfer mechanisms may come in the
form of FDI, foreign licensing, technological consultancy, made-to-order technologies
and standard machinery or capital goods purchase. The non-market channels of
technology transfer also take place without a formal agreement between the two parties.
They come in the form of technical assistance by foreign buyer or vendor, and the
supplier takes an active role in the process. The supplier in non-market mediation may
also take a passive role when the transfer process occurs through imitation, observation,
trade journals or technical information service.
Another classification of technology transfer puts the channels into two broad categories,
public and private (Van Tho, 1993). When the public is the main driver of technology
transfer, the technology so transferred can be considered as a public good. For example
governments of developed countries or development agencies may facilitate the transfer
71

of technologies with the view to providing assistance (aid) to a developing country. In the
case of private channels, it consists of technologies that have been developed by the
private firms and transferred on a commercial basis. Multinational corporations are the
main suppliers using this channel and they employ FDI, licensing agreements, plant
export (capital goods) and original equipment manufacturing.
In the framework of this study, the main kinds of technologies being considered are
power tillers and tractors exported as capital goods either through markets or non-market
channels as delineated by Kim (1991) or through public or private channels as sketched
by (Van Tho, 1993). The import of capital goods and machinery is among the major
modes of technology transfer for building industrial infrastructure and strengthening the
recipient country's technological capability (Jafarieh, 2001). This channel of technology
transfer, which was used by many developing countries in East Asia, assisted these
countries in accessing the advanced technologies embodied in the machinery and
equipment. However, the success of this method of technology transfer in the
development of the recipient country's local technological capability relies on the level of
industrial development (infrastructure) together with the degree of technical and
managerial expertise and its absorptive capacity (Mowery & Oxley, 1995).
Cohen & Levinthal, (1990) defined absorptive capacity as the ability of a firm to
recognise the value of new external information, assimilate it and apply it to commercial
ends. It focuses on the firms’ ability to sense their information environment, to recognise
new technological opportunities and to capture and integrate new information and
knowledge into the firms’ processes and routines with the subsequent aim and result of
increased competitive advantage (Lane et al., 2001). In fact, for the three pillars of
absorptive capacity in relation to mechanisation, it is abundantly clear that Tanzania
recognises the importance of the new knowledge embedded in tillage capital goods by
embarking on policies which seeks to make power tillers and tractors available to
farmers (Mmari & Mpanduji, 2014). However, whether the country can assimilate and
72

use them for a commercial gain depends on market and managerial infrastructure
requisite for technology transfer and diffusion.
Important questions to be asked here are whether market players have the requisite
knowledge, competence and financial resources to facilitate the international transfer of
capital goods in a manner that benefit the rural poor farmer. Paucity of infrastructure
comes to bear. For instance importers of tractors and power tillers may have the
intention of importing tillage technologies for diffusion locally. However their ability to
source the requisite financial services, identify reliable and trustworthy suppliers are all
crucial. When the machines have finally arrived in the country, what forms of dealership
infrastructure exists to support their diffusion? Transport infrastructure as well as ware
housing are both key. To provide after sales service, the technical knowhow and skill
requirements cannot be overlooked. Creation of linkages between importers, local
dealers and users as well as financial institutions are very important fundamentals that
enhance the importation and distribution of capital goods. On the part of users, knowing
how to operate the machines is critical for it to last its economic life and also provide the
requisite benefits.
When Mmari & Mpanduji (2014) studied the diffusion of power tillers in the Mbarali and
Kolombero Districts of Tanzania, they found that generally the factors which enhances
farmers’ ability to assimilate the technologies were lacking. At the time of introduction of
power tillers, very little knowhow existed on the use and maintenance of power tillers,
neither at the Ministry and other institutions or the farmers or operators of power tillers. In
addition, competent power tiller operators who are required to make the technology
useful to farmers were also lacking because of the absence of requisite training. Most of
the operators had an informal training through learning by doing from another operator
who might have also been trained through trial and error. In some situations spare parts
markets functioned poorly and users had to travel up to 80km to find the spare parts. The
73

study concludes that there were design limitations in the technologies transferred,
institutional limitations (market failure) and the need to scale up trainingg for users.
Again the mere fact that developing countries lag behind in technology generation
suggests that there is opportunity for technologies to be transferred from abroad through
an international technology transfer approach. The use of the word ‘transfer’ in the
international technology transfer concept may suggest that it is a smooth and automatic
process without barriers. In reality, for international technology transfer to occur,
providers of technology and acquirers must deliberately invest in the process. It is a
more complex iterative process (Edquist & Jacobsson, 1988). Aside from this investment
constraint, international technology transfer may be undermined by market failures
embedded in the presence of asymmetric information or market power (Jafarieh, 2001).
Market transactions in technologies could also be hampered by externalities (Hoekman
et al., 2004).
Since technology transfer involves the exchange of information between those who have
it and those who do not, the former cannot reveal all the information about the
technology without destroying the basis of trade, and this result in asymmetric
information problems. Buyers cannot determine the value of all the information given
before procuring it. Technology leaders (firms receiving or leading the development of
particular technologies) usually have significant amounts of market power. This might
result in pricing of technologies above their socially optimal levels. The difference in
pricing and actual cost may increase the profits of innovators, but social benefits are
greatly sacrificed.
When costs and benefits associated with technologies are not fully internalised,
externalities occur - they can be positive or negative. Because of these market failures,
there is room for government policy to improve welfare. Even though in practice the
potential for policy to improve welfare may not work because of mistakes or rent seeking
74

behaviour, Hoekman, et al. (2004) suggest that for policy to be effective, it must alter the
incentives of private agents that possess innovative technologies. For government to
know the right incentive to pursue an understanding of the loopholes in the system is
required and this needs localised forms of research which this thesis hopes to contribute
to.
3.8 Conclusion
SSA governments, international development organisations and farmers on the continent
remain puzzled about why for several decades mechanisation of farms on other
continents has occurred smoothly whilst in their own backyard, several attempts have
failed. This challenge could lie in the fact that for so long a time, the limited scope of
efficient technologies were mainly developed in, and tailored for advanced country
conditions. China and India’s rise on the globe could potentially change the status quo.
Technologies suitable for developing world conditions are being generated by China and
India. This new development presents new opportunities for a change, but they can only
be harnessed if there is an in depth understanding of how an appropriate choice is made
in the context of abundant labour supply, limited skills and capital constraints as is in the
case of Tanzania.
To make an optimal choice under developing country conditions, it must be recognised
that not all technically efficient technologies are economically efficient because of
differences in factor prices within different economies. Some economically efficient
technologies may also not be feasible because of engineering limitations in the real
world. To ensure that technologies are optimal, the scale of operation, quality of output in
relation to the size of markets and characteristics of consumers must be given adequate
attention. Since Tanzanian farmers are generally low income earners and operate
relatively smaller farms, choices made should address these peculiar limitations, and it
might be that Chinese and Indian Technologies may provide these options which the
developed world ones have not met fully in the past. The environment, health and
75

employment concerns of users must also be kept in the balance as we consider
technological change, to ensure that whilst we hope to satisfy the requirements of limited
financial resources, other aspects of the production environment are also protected.
Technological change is socially constructed. Thus factor endowments of the society and
what societies believe in may shape the dominant technologies so developed. Since
China and India are in themselves developing, their own circumstances which may be
similar to other developing countries are likely to shape their technologies. Thus tillage
technologies coming from these two emerging economies are worth considering by
Tanzanian farmers. To make them accessible technology transfer and diffusion is key.
However, because of market imperfections, not all externalities generated through the
technology transfer process are internalised by the agents responsible. This may call for
government regulations which must be kept in a balance if the right incentives are to be
created for markets to adjust positively. Beyond market imperfections, there could be
challenges with user absorptive capacity for the technologies transferred. To improve
absorptive capacity, training for users is crucial. In the following Chapters, we shall
attempt to establish whether emerging economy tillage technologies are profitable and if
they are in the first instance and in the second whether they are worthwhile choice for
the poor farmer in Tanzania.
76

Chapter 4 : Methodology
4.1 Introduction
This Chapter describes the methods used in sample selection, data collection and data
analyses. The chapter begins by defining the alternative choices of mechanisation
technologies within the agricultural sector used by Tanzanian farmers and the pathways
through which their choice influence growth, productivity and capability building along the
value chain. The second section describes the sampling procedure and the sample
selected along the value chain and why each participant was selected. In section three,
the strategies adopted in collecting data on the field and how it evolved as well as how
challenges were dealt with are discussed. In section four, the methods employed in
analysing the data in an attempt to answer the research questions are presented.
Section five concludes the chapter.
4.2 Conceptual framework and research design
Farmers can either invest in indigenous technologies (hand hoe or oxen plough) or
invest in mechanized technology (power tillers and tractors). Indigenous technologies
have proved to be inefficient in terms of quality of output and timeliness of operation. For
example it takes an average man 12 days of 5 hours of intensive work to plough 1 acre
with a hand hoe. For the same parcel of land, it will take a pair of oxen with two
operators two days of 5 hours’ work each. When a power tiller is employed for the same
assignment, it takes an average of 3.5 hours with one man. The average tractor ploughs
an acre within an hour with one operator (Key informant Interview, 2012). The quality
and quantity of output per labour hour, all things being equal, improves as one move
from hand hoe, through oxen to tractors. In an instance where the soil structure is
undulating as it occurs in mountainous areas, it becomes impractical to use oxen or
tractors: hand hoes or zero tillage becomes ideal.
If soil structure were conducive, then the ‘progressive’ farmer might naturally move from
the use of hand hoes and oxen ploughs to the use of power tillers and tractors for tillage.
77

Figure 4.1: Conceptual framework
Tillage Technologies
Indigenous Imported
Oxen ploughHand hoe Power tillers and Tractors
C-CHOICE
F-GOVENMENT
Finance andsupportinstitutions
Dealers: Importers and
distributors
Spare partssellers,repairers
Farmers: small, medium
& large
E-OUTCOMES- Output - Employment -Income -Skills
Source: Author; 2013
Limiting factors to the ownership or use of power tillers and tractors may include finance
and availability of a reliable supply chain, skill requirements, technological complexities
and the scale of operation of the user. Users thus consider these limitations in making
decisions about technology choice. Under our present considerations therefore, each
farmer can choose a power tiller or tractor from a Mature Economy (MM) or Emerging
Economy (EE) source, assuming that with the present objective of improving
productivity, hand hoe and oxen ploughs are not promising enough.
78

Choosing an MM or EE machine will have varying implications on employment, output,
incomes and capability building of actors in the value chain9. That is if the two sources of
technologies have different characteristics, then these differences are likely to impact
differently on participants in the value chain. Figure 4.1 is a diagram showing the main
types of tillage technologies available to the Tanzanian farmer. Route A on the diagram
represents indigenous technologies which are excluded in the analyses in this thesis.
The study concentrates on Route B. Under Route B, there is a choice C, to be made
between tractors and power tillers with MM or EE origins. There are also actors, D
comprising of users (farmers and operators), financial institutions, dealers and service
providers. Finally, there is government F, which also participate in the system. Each of
the actors in the system plays a different role and these roles, depending on the choice
affects the outcomes, E.
Dealers as actors in this technology system are responsible for the importation of the
technologies and distribution within the country to sales agents and sometimes directly to
farmers. The machines they import are dictated by what manufacturers have on offer,
signals from users and their own financial situation. The dealers may borrow from
financial institutions to finance the imports and so they also collaborate with the banks.
Farmers (users) buy the imported machines and use them on their farms for tillage. They
sometimes borrow to finance their investments and so are highly reliant on financial
institutions for such purchases. Some farmers, usually large scale ones, buy their own
tractors from abroad, without the help of importers. The service providers like repairers
and spare parts sellers also work in close collaboration with users and dealers. They
provide parts for replacement and also provide regular maintenance and repair when
machines break down. Some spare part sellers also depend on financial institutions for
capital for their business. All these actors operate in a policy framework defined by
9 In the same vein the intersection of MM and EE which represents machines which combine characteristics of the two sources will also have varying impacts on output, income, employment and skills.
79
government. The government among other things makes decisions on tax and subsidies
and is also supposed to inspect machines to ensure that they meet the quality standards
as specified by the laws of the country through testing. Education, training and expertise
building through extension activities and traditional schools is also supposed to be led by
government.
4.3 Sampling and data considerations
Four main types of data sets were collected: survey data from farmers owning power
tillers and tractors; market structure data from key informants (farmers, dealers, financial
institutions and government officials - local, regional and national); operational
performance data from machine operators, repairers, educational and testing institutions
and through physical observations while machines are in use; and secondary data
through desk review of documents related to the sector. This study used the hybrid or
mixed methods approach, combining the traditions of different ways of doing research in
designing the field work. That is both qualitative and quantitative methods were
employed in data collection. The objective of this approach was to ensure that data
collected from one source could be corroborated or triangulated with other sources
through more than just one means. We discuss these methods in turn and present some
of the precautions taken to ensure rigour, credibility, validity and reliability of the data
collected.
a. Flexible research design approaches and qualitative data
Qualitative studies vary by type, purpose and quality. Qualitative study findings can
either grow out of an in-depth or open-ended interviews; direct observation; and written
documents. Through interviews, direct quotations of people about their experiences,
opinions, feelings and knowledge can be generated. Open-ended questions and probes
yield in-depth responses, and the data generated consists of verbatim quotations with
sufficient context to be interpreted. Data from observations are made up of descriptions
80

of activities, behaviours, actions and processes that are part of their experiences which
can be seen. Here the data consists of field notes which are rich, detailed descriptions,
including the context within which the observations were made. To analyse documents,
studies of expert quotations or entire passages from various forms of records,
correspondence, official publications, reports, dairies and open-ended responses to
questionnaires and surveys are required. (Patton, 2002).
b. Fixed designs for quantitative data
These are theory driven research designs in which the phenomena of interest are usually
quantified. The concept of variables is important. Fixed designs require that variables to
be included in the study must be specified in advance. There should be a conceptual
understanding about how one variable drives the other. This understanding may be in
the form of a model. This suggests that the mechanisms that are likely to be in operation
are clearly understood by the researcher. Fixed designs are usually piloted before the
main phase of the study. This is important to ensure that the phenomena being studied
have been captured sufficiently well for meaningful data to be collected. Fixed design
rely heavily on measures of central tendencies (averages) and so the larger the sample
the better. There are several strategies which can be adopted for fixed designs. One of
such methods is the survey where enumerators are used for the administration of
structured are semi structured instruments. Enumerator bias could affect the validity and
reliability of the data. This challenge requires that data collectors are given thorough
training beforehand. (See Robson, 1994).
c. Trustworthiness, validity and reliability of data of qualitative data
Though the trustworthiness or otherwise of findings from flexible, qualitative research is
a subject of much debate (Robson, 2002), if the same research cannot not be replicated
using a similar methodology to obtain consistent results, then it casts doubt on the level
of acceptability of whatever recommendations are made. However, whilst the standard
81

practice for the natural sciences to test validity of a finding is for it to be replicated by an
independent scientist, this approach may not be feasible when a flexible qualitative
research procedure is used. Whilst some social scientists accept that the predictive
power of qualitative methods is limited because societal characteristics cannot be held
constant (Bloor, 1997) and some do not believe that the tenets of scientific enquiry are
significant (Guba and Lincoln, 1989). Maxwell (1992) notes that some of the threats to
the validity of flexible designs could be captured under three areas: description;
interpretation; and theory. First the main challenge in describing what you have heard
lies in the inaccuracy or incompleteness of the data. The writer suggests that where
possible, taping of conversation should be carried out. Threats to valid interpretation
occur when the researcher attempts to impose a framework on the meaning of what is
happening rather than allowing the framework to emerge from the setting. If one gets
stuck in a particular theory and does not attempt to seek alternative explanations for
understanding of the phenomena they are studying, it can become a threat to validity.
Robson (2002) suggests a number of general skills needed for flexible qualitative
research in an attempt to improve the validity of the data so collected, and these were
heavily relied upon during the field work. First, he suggests an enquiring mind that is
prepared to ask questions at all times during the field work. This may be mentally and
emotionally exhausting, but it is the only way to know why events are happening the way
they do. Second, good listening is also required. The main tenet of good listening is that
the researcher is prepared to take in a lot of information without bias and noting down
exactly what was said. If possible, the mood can be an effective component that will help
capture the context. Simply put, the data collector must have an open mind. Third,
because such field studies do not always end the way planned, the researcher must be
adaptive and flexible. That is you have to be willing to change, and the implications of
any change must be taken on board. Some of these changes can have consequences
for research design. Fourth, the fact that the investigator needs to interpret data means
82

that the issues must be grasped and not just recorded. Without a firm grasps of issues,
clues, contradictions and requirements for further evidence may be missed. Fifth, all the
above skills become futile if the researcher is biased and has a pre-conceived position.
Investigators should be open to contrary findings. These tools were always at the back of
my mind especially during observations, interviews and review of documents in the hope
that trustworthiness of what I find will be upheld.
4.3.1 Institutional survey protocol for market structure and key informants
The main institutions targeted were government (Ministry of Agriculture, Ministry of
Trade-Border Agencies (customs) and Science and Technology Institutions), non
government (religious, international and farmer groups) and private businesses
(importers, distributors and service providers). The objective of speaking with the
government institutions was to gain an understanding of government policy, the role that
government is playing at each level of the supply chain (technology transfer from abroad
and diffusion within country) and the challenges being faced. The NGOs, especially the
cooperatives, are also very important in the agricultural marketing and finance chain in
Tanzania, and so understanding the resources they have and how they were being used
to facilitate farmer access of technologies was key to the study. Finally, the private
businesses which are involved in the importation, distribution, service and finance had a
lot to say about the diffusion process including their sources of supply and the
inducements to what they bring in for sale.
Key informants at the government departments were contacted and interviewed to throw
some light on what is being done generally and what government in particular is doing in
connection with mechanisation, technology transfer and diffusion. Through these
interviews some of the main institutions participating in the sourcing and distribution of
power tillers and tractors were identified and interviewed. The identification process was
also supported with desk reviews of country reports. Finally, the private businesses were
contacted through a list produced by the Agricultural Mechanisation Department of the
83

Ministry of Agriculture, Food and Cooperatives. Other businesses which were not on this
list were also brought into the frame through snowballing strategy. Since most of the
importers are based in Dar es Salaam, it was the starting base and I then moved to other
centres where they were found as per the information obtained from other importers and
distributors. Room was made for proportional representation of MM and EE capital
goods, to facilitate the comparative approach of the study.
Table 4.1: Key informant interviews by region and by type of informant (count)
Type of key informant interviews and surveys
RegionMorogoro
Iringa
Mbeya
Manyera
Dodom
a
Mw
anza
Dfi>
Arusha
Moshi
District executives 1 2 2 1 2 5 2 15Mechanisation officer 5 1 2 1 1 4 1 15Extension officer 5 6 2 3 2 1 19Research scientist 4 1 1 3 3 12Mechanisation tutors 1 1 2Mechanisation students 2 2Managers of schools 2 2 4Large scale farmers 2 3 5Mechanics/fabricators/engineers 8 4 2 1 15Importers/dealers 7 4 1 3 2 17Operators (drivers) 7 2 3 2 3 17Financial Institutions/cooperatives 7 1 1 4 1 14Total 51 12 17 8 17 3 11 6 12 137Source: Author’s compilation, 2012/2014
4.3.2 Farm survey and protocol used
Based on discussions with mechanisation officers at the national, regional and district
offices of the Ministry of Agriculture, Food Security and Cooperatives, and with the help
of key informants at the village level, 12 communities were selected from five of the 30
regions in Tanzania (Wilson, 2005). These five regions were purposively selected for the
study based on factors that were anticipated to possess the potential for examination of
particular environmental and institutional influences on technology transfer and diffusion
after a literature survey.
84

Manyera (Babati) the first of the five regions selected is home to a substantial proportion
of all tractors in Tanzania, according to the Agricultural Sample Census 2007. It was
selected to give room for comparing various ranges of power tillers and tractors across
farms of different scale of operation and examination of the extent of use. In this region
also, there are two distinct growing seasons as a result of a bi-modal rainfall regime and
this could also affect the annual profitability of machinery use. It was anticipated that this
region could throw more light on resource endowment and choice of technology.
The second region selected, Dodoma, is characteristic of relatively drier but lighter soils
which may allow the use of smaller tractors in terms of horsepower. As the new
administrative capital of Tanzania, a lot of institutions including NGOs supporting
agriculture and financial institutions are springing up in the region and this gives room for
understanding institutional role in the mechanisms of technology transfer and how their
presence or otherwise influences technological choice. There has also been a long
presence of Indian tractors in the region, and this was of particular interest to the study.
Morogoro, the third region selected for the study, by contrast has heavy, water-logged
and clayey soils which may require more robust machines with larger horsepower for
tillage. The nature of the soil is a characteristic which could have influenced the path for
the types of technology selected. Thus it offered the opportunity to study the tillage
equipment under irrigated conditions. In addition, the presence of large scale sugarcane
and rice farms meant that the study could also examine the choice of technique by
commercial farms.
Mbeya was selected as the fourth region for field studies because it has the highest
population of power tillers in the country (20% of the total) and small paddy fields were
common on irrigation schemes. This character of the region facilitated the comparison of
various types of power tillers. This was because for most of the irrigation schemes, there
was a critical mass of power tillers with similar vintages. Co-operative society support for
machinery procurement was also popular, and this dynamic was important to understand
since the issue of funding is very crucial for mechanisation.
85
Last is the Iringa region. The purpose for choosing this region was to examine how the
choice of technique has been influenced by the origin of foreign investors in commercial
farming. Europeans, especially Greek and German farmers, cultivate large tracts of land
in this region, and it was interesting to find out whether those who bring in FDI also bring
in technologies from their own countries.
In each region, the most important district, in terms of mechanisation was chosen, with
the help of the District Mechanisation Officer. In situations where this criterion was
impossible because more than one district qualified as the most important in terms of
number of tractors and power tillers, the district which is closest to the regional capital
was chosen. The idea behind this strategy was that in the broader scheme of things,
data collection was going to happen in both the regional capital and the district in
question, and so the closer they are, the better for logistical limitations. Within the district
a similar strategy was used for the selection of communities with a little modification.
First, communities selected should be an important mechanisation area. Whilst towns or
villages closer to the district capital were desirable for easy access, the study also
wanted to determine whether more rural farms had different technology choice trajectory
compared to those closer to urban centres. Thus at least one of the communities
selected was closer to a main road, while the other was not. For almost all the towns
considered here, institutional memory of extension officers and other key informants as
well as a register of farmers owning tractors and power tillers obtained from the district
office were used in the decision making (Burgess, 1984; Wilson, 2005). Using the
register to locate a few farmers at the onset, the remaining farmers were reached
through a snowball approach (Coleman, 1958).
In total, 194 farms which owned at least one power tiller or tractor were drawn from the
communities for the study. From the Dodoma region, two communities (Flembahemba
and Ngomai) were selected and the sample drawn from here constitute over one fifth of
the total. From the Iringa region where a little below one fifth of the total sample was
drawn, three communities consisting of Hula, Nzihi and Pawaga were considered.
86

Gallapo and Magugu were the two communities selected from the Babati region and in
total, farms considered from these two communities constituted about 15% of the total
sample. A little over one third of the total sample was drawn from the Mbeya region
where Mabadaga, Mbuyuni and Ubaruku were the communities of interest. Of this
proportion more than half came from the Ubaruku village where close to one third of all
the power tillers in the district are located. The last region, Morogoro, provided two
research sites, Dakawa and Turiani which together served as a source of more than one
tenth of the total sample.
The original target was that at least for each region, 60 farmers should be interviewed-
so that the total sample would comprise 300: a figure which could allow for statistical
tests of means. At the end of the data collection exercise, 225 farmer surveys were
completed. Of these 225, 194 were in a form that was good enough for the purposes of
this study. The surveys discarded were either incomplete or the respondents had not
used their machines to a significant extent in the season under review. There were
others where the responses deviated from believable averages as triangulated from
extension officers. Some of them were also answered by caretakers of the machines and
so did not have full insights about the data we intended to collect. Table 4.2 shows the
distribution of farmers surveyed and used in the analyses in this study by region, district
and community.
87

Table 4.2: Regions, communities and samples drawnRegional
population of (...), 2011
Regionname
Districtname
Frequency(%)
Communityname
Frequency(%)
Power T ractors Tillers
Dodoma Kongua 44(22.8) HembahembaNgomai
36 (18.6) 8(4.1) 215 781
Iringa Iringarural
36(18.7) HulaNzihi
9 (4.6) 7 (3.6)
Pawaga 20 (10.3) 477 306Manyera Babati 29(15.0) Gallapo
Magugu14 (7.2) 15(7.7) 186 1092
Mbeya Mbarali 64(33.2) MabadagaMbuyuniUbaruku
18 (9.3) 10(5.2)
36 (18.6) 1073 405Morogoro Invomero 20(10.3) Dakawa
Turiani8(4.1)
12(6.2) 327 1134SampleNational
194 22784571
37188466
Source: Field Work, 2012/2013; Ministry of Agriculture, Food Security and Cooperatives, 2011
4.3.3 Operational and performance data
The main source of data for how well different technologies perform on different terrains
were obtained from power tiller and tractor operators, mechanics, educational institutions
and machine testing units. In identifying operators and mechanics for in-depth interviews,
farmers participating in the surveys were asked to direct me to the operator and
mechanics they used during the season. As many operators as possible who were
available and accessible at the time of the data collection were contacted for interviews.
There was also a direct attempt made to interview equal proportions of operators of MM
and EE machines where possible. In most of the communities visited, there were a
handful of repairers and all those available at the time of the data collection exercise,
were interviewed (usually an average of 4).
In addition, a focus group discussion with operators who have had the opportunity to use
both MM and EE machines was carried out in one of the communities. To get an
understanding of the gender effects on choice, another focus group discussion was also
carried out with women owning power tillers. Two of the educational institutions
88

mandated to train experts and farmers in using and maintaining farm machinery were
contacted: the Morogoro Agro-Mechanisation Institute and Moshi Irrigation Development
Scheme. Students, farmers under training and instructors in the two institutes were
interviewed - there were also field observations in the training centres as the two types of
machines performed duties. Other field observations were undertaken on farms which
were not related to the training institutes. In selecting these farms, farmers who had been
surveyed and agreed to allow me to accompany them to their fields were targeted.
4.3.4 Sector overview data
Data on the national and regional distribution of power tillers and tractors and the history
on how the sector has evolved were obtained from secondary sources. These sources
included reports by government institutions, especially those generated by the Ministry of
Food, Agriculture and Cooperatives of Tanzania. Others were obtained from the review
of literature as well as key informant interviews with staff of the Mechanisation
Department.
4.4 Data collection process
The data collection exercise spanned a period of 7 months with a total of 29 different
research assistants involved during the process. There was however one main assistant
who was involved from the beginning to the end of the process. Survey instruments
(questionnaires, cognitive specimens, check lists and key words) for the study were first
translated from English to Swahili in the first week of August. Before pre-testing the
questionnaires in the second week, I had the opportunity to attend two national
agricultural shows. There was also a seminar organized by the Economics Department
of the Mzumbe University for experts in the industry to comment on the methodology
proposed for the study. Outcomes of these two separate activities were used to modify
the data collection instruments.
The questionnaires were then pre-tested in the second week of August, 2012 at Dakawa
in the Invomero District of the Morogoro Region. After the pre-test, data was entered into
89

a spread sheet; an evaluation with the research assistant revealed questions which were
not answered properly or were not properly understood by farmers, dealers, operators,
mechanics or government officials. The instruments were thus reviewed for
improvement. With the survey instruments ready and the necessary contacts obtained in
the different regions proposed for data collection, the exercise begun in Mbeya in
September 2012 and ended in Mwanza in February 2013. There were however
intermittent trips to Dar es Salaam to speak with key informants in the value chain
whenever they agreed for an interview.
In each of the communities, the mechanisation officer at the district office and the village
executive officers helped in identifying prospective data collectors who were then trained
with the help of my main research assistant. These data collectors were mainly
responsible for interviewing farmers who owned power tillers or tractors. Whilst this
exercise went on, the research assistant and I carried out the institutional data collection
part of the process. Concurrently, we also supervised the survey and provided
explanation and clarifications to data collectors on issues that were confusing. The
surveyed questionnaires were reviewed by me, and where necessary the data collector
revisited the farmer for further questioning. Most often, I sat in the first 1 or 2 surveys
conducted by an enumerator to ensure that they understood what they had been asked
to do. Where there were misunderstandings, we regrouped and explained things again
before further interviews were done.
As the data collection exercise moved from one region to the next and my understanding
of the industry improved some questions were modified greatly or removed entirely if
their contribution to the research was not great. The data sets that these field interviews
and surveys collected, and the research questions they addressed are captured in Table
4.3 below.
90

4.5 Data analyses
The main analytical tools for the study were simple means, percentages and ratios that
identify differences and distinctiveness between MM and EE mechanisation
technologies. Statistical tests like the f-test were also used in some instances to test the
significance of the differences observed. Other qualitative analyses based on narratives
and observations were also undertaken. Further empirical computations of input and
output co-efficient were generated. Qualitative data collected from focus groups and key
informants were organized, transcribed and sorted under various themes ranging from
policy, technology diffusion channels, motivations of choice and services along the
channels. The themes generated and the text thereof is presented under the four
research questions outlined in Chapter 1 (page 8) with the objective of comparing the
findings with what theory and historical evidence suggests.
4.5.1 Research question 1
What is the mode of transfer and diffusion of MM and EE tillage technology in Tanzania?
In addressing the question of the transfer and diffusion mode, a historical view is taken.
Thus policies, activities, sources of supply and quantities imported at the national level
since Tanzania became a republic are discussed. The discussions on tractors are
divided into the pre-Structural Adjustment and post-Structural Adjustment periods. The
market fundamentals for the two time periods were very different and affected technical
choice in different ways. The power tiller transfer and diffusion story is also told with a
pre-2005 and a post-2005 view. The period before 2005 was dominated by MM power
tillers. Post-2005 saw a market dominated by EE power tillers and the idea is to study
the factors that influenced this change. The numbers used in this section to compare
diffusion are presented using mainly bar charts.
In studying the mode of diffusion, major participants in the value chain form the matrix for
the discussion. Foreign investors, traders, government and NGOs as participants in the
91

value chain are evaluated with the view of showing the ways in which they transfer and
diffuse tractors and power tillers in Tanzania.
4.5.2 Research question 2
To what extent are MM and EE tillage capital goods being used in Tanzania?
The extent of use of MM and EE power tillers are studied at two levels. First within the
sample a comparison of the frequencies of MM and EE is undertaken. On farms,
proportions of MM and EE owners using their machines for various farm operations are
also compared. In both instances, percentages are used to make the differences clearer
and presented pictorially with bar charts.
4.5.3 Research question 3
In what ways are MM tillage technologies distinctive from EE ones?
The distinctive nature of MM and EE power tillers are discussed using both qualitative
and quantitative data. Age, lifespan and horsepower are presented and compared using
averages of data reported by users within the sample. Other characteristics pertaining to
satisfaction of users are ranked and an average of these ranks is presented with their
significance levels.
4.5.4 Research question 4
Do the inherent distinctive characteristics thereof, (if any), of EE tillage
technologies help address the needs of resource constrained farmers and other
participants in the value chain and hence reduce poverty?
The economic appropriateness is based on the analysis of the coefficients of production
and hence required the measurement of output per season, labour employed and capital
costs. Averages for these measurements are presented for power tillers and tractors
within sub-groups of MM and EE machines. The economic discussion ends with
computations of efficiency ratios and benefit-cost estimations. The benefit-cost
discussions are enriched with sensitivity analyses, mainly based on a realistic scenario
92

of government subsidies on farm machinery being removed in future. The social
appropriateness discusses which technologies get diffused by ranking and comparing
the physical ratios, benefit-costs and level of diffusion. Simulations are also carried out to
find the impact of choosing each of the technologies on employment impact and skills.
In general, this thesis assumes that output (measured in number of acres10 of land
ploughed) is generally homogeneous in terms of the quality of ploughing, harrowing or
rotavation. To cater for the slight differences across machines an attempt is made to
increase our sample size to as large as possible so that our measures of central
tendency could be as accurate as possible. We measure labour as the person hours per
acre of work done, and here again we hope that the large sample size adopted will give
further confidence to the mean values generated. Capital is measured using both the
acquisition and the replacement costs, following Stewart’s method (see Chapter 3).
Table 4.3 gives an overview of the kinds of data collected for each of the research
questions and the methods adopted.
Table 4.3: Research questions and data needsResearchquestions
Data needs Samplingapproach
Data collection methods
Transfer and Open market, relational, Focus groups/ Focus groupdiffusion mode sourcing from abroad, Snowballing interviews
targeting mainly qualitative, but also quantitative
Extent of use Number imported; Purposive random Quantitative dataIncidence of use within sampling/ using desk review,sampled farms Snowballing sampled farmers
Distinctive nature Scale, Cost, Durability, Purposive random PhysicalLabour, Infrastructure, sampling/ inspection, farmEfficiency, energy Snowballing records, survey
Instrument
Economic & Farm and farmer Purposive random Survey instrumentsocial features, environmental sampling/ administered toappropriateness features Snowballing sampled farmersSource: Generated by author, 2013
10 2.47105 acres is equivalent to 1 hectare
93

4.6 Conclusion
This chapter presented the conceptual framework upon which this thesis is based. The
methods that are used to collect and analyse the data collected to answer the research
questions posed by the study were also discussed. A mixed method approach is adopted
for the data analyses with the view of using different sources of data to triangulate and
validate each of the answers provided for each research question by respondents. From
the point of view of comparing matured market technologies with emerging economy
ones, each technology is examined at the different levels of the value chain: importation;
local diffusion; usage at the farm level; maintenance service provision; and financial
support available to users and dealers. In Chapter 5, users and the capital goods
available to them are classified and discussed.
94

Chapter 5 : Users and Capital Goods Classification
5.1 Introduction
The choice of tillage technology by Tanzanian farmers is constrained by technical
requirements at the production level defined by soils, crops and farming systems. Their
decisions are equally affected by economic requirements bounded by the social context
and the labour supply in terms of quality and quantity. Availability of investment capital
(amounts, cost and timeliness) is also a crucial determinant of choice. Output (nature,
quantity and value) which has direct implications on farm profits and consequently
resources available for financing purchases of capital goods is also key. Finally, access
to and distribution of soft infrastructure such as repair and maintenance and a well-
functioning spare parts market is important.
The influence of economic agents in the value chain (manufacturers, importers and
distributors) as well as government policy and standard regimes shapes the supply side
of tillage technologies to a large extent. An optimal technique choice (in the economic
sense) means the maximization of the positive benefits presented by these factors whilst
at the same time minimizing the negative risks and uncertainties they pose. Whilst social
optimality is beyond the central scope of this study (since it is difficult to establish what is
socially desirable for all agents), choice of technique in a broader scheme should also
not turn a blind eye to social, cultural and environmental values embedded in
inclusiveness, food security and sustainability objectives (Ruttan, 1959). We shall
however, in Chapter 8, touch briefly on social optimality when we discuss the effects of
technique choice in Tanzania on area cultivated, employment and skill development.
This Chapter seeks to define what an optimal choice of tillage technology is for small,
medium and large scale farmers cultivating different crops under different agro-economic
conditions. Thus, we first establish who our farmers are; what they do; how they do it;
and what technology alternatives are available to them for these assignments. We
discuss in turn the activities constituting farm mechanisation - that is, the nature and
95

character of farming systems and the optimal types of equipment under those regimes.
In addition, the Chapter specifically takes each of the regions under consideration and
classifies them under farming systems. Here attention is paid to the common soil types in
those regions and the crops grown. To understand the alternatives of technologies that
exist for the farmer to choose from depending on his farm characteristics, a description
and categorization of techniques is undertaken, first by their engineering attributes and
then second, by the soil conditions which they are best suited.
Apart from engineering characteristics, we further categorize capital goods on the basis
of their country of origin, which is the main subject matter of this study. We argue that
there are two broad categories of technologies: advanced country and developing world.
Under each of these two broad categories, there are two sub-divisions. That is, there are
advanced country technologies which are produced in advanced countries and those
produced in developing countries with the aim of taking advantage of competitive input
prices or bringing production sites close to the market (Stewart, 1977) . For developing
country technologies, there are those which have been developed locally and are
produced locally and there are those which have been adapted from the advanced
countries through collaborative work or outright purchase of intellectual property rights
and also produced locally (Field work interviews, 2012).
With these classifications in mind, this Chapter sets up a matrix in the concluding section
which then enables a discussion on the distinctive nature of technologies in Chapter 6,
Chapter 7 and Chapter 8. The question of scale of operation is captured using the small
walk-behind tillage equipment (power tillers) and large four-wheeled machines (tractors)
dichotomy. The discussions are also undertaken in relation to farming systems, specific
alternative brands of power tillers and tractors that may be suitable under these systems
and the economic and productivity outcomes observed when they are selected.
96

The main concern in the discussions in this Chapter and those that follow is to establish
the extent to which emerging economy power tillers and tractors are pro-poor in more
ways than advanced country ones. With this concern in mind, we shall classify in
Chapter 8, farm households as poor and non-poor using the basic needs poverty line11
as a distinguishing criterion (Sarris, Savastano, & Christiaensen, 2006) when theoretical
and policy implications are discussed. Benefits accruing to, and challenges faced by
participants along the chain of technology transfer, diffusion and usage are also
examined. In Section 5.2, we start off with a general overview of what constitutes farm
mechanisation amongst the respondents under consideration.
5.2 Farm mechanisation
Agricultural productivity depends upon biological, hydrological, chemical and mechanical
inputs. Contribution of mechanical inputs in farming is considered in terms of farm
mechanisation. To optimize the use of biological, hydrological and chemical inputs, farm
mechanisation plays a pivotal role (Yamin, Tahir, Nasir, & Yaseen, 2011). Essential for
crop production in any system of agriculture, is how well the soil is prepared. Properly
prepared soil serves as a reliable seed bed for sowing, germination and consequently
supporting the gestation period of the crop. The soil or seed bed should be fine enough
to hold adequate soil water, allow for air percolation and movement of soil micro
organisms. It should also allow for root and soil contact to an extent that water and
nutrient absorption is high enough to facilitate proper plant growth and development.
Beyond land preparation, are other field operations related to seeding, fertility
management, plant protection, weed control and harvesting. There are also off-farm
activities directly linked with what happens on the field such as transportation and
processing of harvested products. This chain of on-farm and off-farm activities can also
be mechanized totally, partially, or not at all (in the case of zero tillage).
11 In rural areas where most farming households are located, the 2000/01 National Household Budget Survey suggests that 39.9 percent of all households fall under the basic needs poverty line, accounting for 81% of the poor in Tanzania (National Bureau of Statistics, 2002)
97

Regardless of the extent of mechanisation on a farm, a power unit is required. The three
main farm power sources are human, animal and mechanical (Sims & Kienzle, 2006).
Over time and space, farms may transit12 from a pure human power based operations,
through the introduction of animal power and then finally the use of mechanical power.
Nevertheless, the choice amongst these three power sources will depend on availability
of technologies in the first instance, technological know-how by the user, scale of
operation and access to capital. The nature of the land also matters. For instance soils in
hilly and mountainous areas may not support the use of animal power or tractors
because of the steep slopes. Commercialization motivation of farmers could also
influence the need to mechanize (Dixon, Gulliver, & Gibbon, 2001)
Human power on the farm is harnessed through the use of hand hoes and machetes.
Machetes are used for weeding and holing. Hoes can be used for weeding, ploughing,
mounding and ridging. Off-farm activities carried out by human beings include carting of
farm produce usually on the head to the home or market, de-husking, shelling and
grinding using simple tools or bare hands. Animal power is harnessed through the use
of yokes that are hinged with simple implements. For transportation purposes, carts are
yoked to the animals or saddles built on their back to carry loads tied firmly on the saddle
(Rampokanyo, 2012). On the other hand, mechanical power produced by power tillers
and tractors is transferred from the engine through power take-offs which are connected
to drawbars for onward transmission to implements designed for farm work. For
transportation purposes, the tractor is fitted with a trailer. Special equipment designed to
draw power from stationary tractors, come in handy for postharvest handling. In capital
constrained developing countries such as Tanzania, farmers rarely use the power tillers
for tine cultivation/chiselling, agro-chemical application, weeding and post -harvest
activities like de-husking, shelling and grinding (Field work interviews, 2012). Land
preparation is by far the most important farm activity demanding mechanical power
12 This transition is likely to occur in instances where soil structure support the use of animal and mechanical power- the availability of these technologies to the user is also key
98

because of the high energy requirements and the timeliness of operation, especially
under rain-fed agriculture. As we shall see in the next Section, the soils, capital goods
and farming systems are key considerations for land preparation.
5.3 Soils, capital goods and farming systems
Crops and the soils on which they are planted influence farm operations adopted,
especially in relation to land preparation. Different crops can only be supported by
particular types of soils and water supply regimes. Texture and structure of the soil has
telling implications on the tillage operations carried out on the farm. The crop, and the
planting methods adopted (broadcasting or precision seeding) will also inform the land
preparation procedure followed. The interplay of the soil and crops consequently affect
the kinds of capital goods (power tillers and tractors) required to accomplish each farm
operation. Each type of capital good is inherently different and performs farming
operations with differing engineering characteristics. In the same vein different farming
systems require power tillers or tractors of varying scale, engineering technology and
quality (strength and efficiency).
A power tiller or a tractor which is fit for purpose should complete farm work on time,
adequately prepare the soil to suit the crops and also be easily operated and repaired by
the users. A power tiller or tractor may possess all the characteristics that makes it fit for
the operation and technical conditions of the farmer in question, but if the farmer’s/farm’s
financial circumstances (availability of savings or opportunity to borrow investment
capital) is inadequate, then access may be impossible through personal or communal
ownership. Availability of savings usually depends on farm income which is influenced by
crop type, farm size, soil fertility and the markets for inputs and products. Investment
capital availability also depends on the presence and willingness of financial institutions
and intermediaries to lend to farmers. Under circumstances of capital constraint, farmers
resort to hiring from neighbouring farmers or rural entrepreneurs who own power tillers
and tractors for contract work. Such a strategy is not always reliable, since owners will
99

normally finish their own farm work before considering hiring their machine out to other
farmers. Whether the farmer decides to buy or hire tillage equipment for land
preparation, a good choice can be made if the texture and structure of the soil is
considered.
5.3.1 Soils
Soil classifications are important for choice of power tiller and tractor discussions. This is
because, different soil textures have telling implications on soil resistance faced by
power tillers and tractors during traction. This consequently tests the quality of the
machine, all things being equal. Soil texture, based on broad particle classes can be
sandy, loamy or clayey; and on this gradation of sand, silt and clay combinations, energy
requirements for tillage generated by power tillers and tractors will also vary. Texture
refers to the size of the particles that make up the soil.
The terms sand, silt, and clay refer to relative sizes of the soil particles. Sand, being the
larger size of particles, feels gritty (coarse). Silt, being moderate in size, has a smooth or
floury texture (medium). Clay, being the smaller size of particles, feels sticky (fine). Soil
particles whose diameter is below 0.002mm are considered to be clay; 0.002 to 0.05mm,
being silt; and 0.05 to 2mm is sand. Particles above 2mm are considered to be gravels.
Soils in general do not however occur as independent sand, silt and clay. They occur in
a combination of these particles, and depending on the type of particles which dominate
we can have general classifications as sandy (usually constituted by 50% or more sand),
clayey (constituted by more than 50% clay) and loamy (in which the proportions of the
three particles are approximately equal). Figure 5.1 is a soil triangle showing the various
combinations of sand silt and clay possible, with the area coloured red being clayey,
yellow being loamy and green being sandy. (Whiting et al., 2011).
100

Figure 5.1: Soil triangle
SJtty clay loamr ^ T\ / loom \
SHt loam
Percent Sand
Source: Adapted from Whiting et al., 2011
On average soil resistance to traction machines (in the case of farmers under study,
ploughs) for sandy (coarse and soft soils), loam (medium textured or tilled soils), and
clayey (fine textured and firm soils) are 600 pounds per foot, 920 pounds per foot and
1200 pounds per feet respectively. This is approximately in the ratio of 1:1.5:2 (Siemens
& Bowers, 1999). Thus for the same kind of land preparation operation on the farm, more
energy is required to accomplish it on firm and fine textured clay soils than medium
textured loam soils, and lose sandy soils in that order. The nature of the soil surface
(concrete, firm, tilled or soft) also defines to some extent the friction generated between
the soil and the tyres of tractors. This friction effectively affects the draft force for pulling
farm implements. Thus whether the soil is clayey, loamy or sandy will inform the choice
of power tillers and tractors in terms of quality and power. Because action and reaction
are opposite and equal, the soil exerts a force proportionate to that exerted by tractors or
power tillers. Thus for heavy textured soils, power tillers made of hardened metals are
101

needed to forestall frequent damage. Below in Sub-section 5.3.2 we discuss some
characteristics of power tillers and tractors, and further delineate the soils on which
particular machines are fit for purpose (Walters, 2013).
5.3.2 Tillage capital goods: engineering characteristics and quality
Having established the types of soils and the relative resistance they pose during tillage,
we turn our attention to the capital goods available for mechanisation. Here we bear in
mind that the main use to which farmers in the study area put their machines are land
preparation and to some extent, transportation. Discussing the design and technical
characteristics that differentiate various types of power tillers and tractors and the soils
on which they perform best, we must not ignore the differences in materials used in
fabrication and standardizations adopted by producers. Thus, though two machines may
be comparable engineering wise, if the metals used for fabrication are not of the same
quality, then their performance on similar soil conditions will differ. As a result,
differences in breakdown frequency and machine lifespan will also be observed.
Based on the engineering design, power tillers can be classified into two types; those
whose rotary implements are propelled by power from the engine through a drawbar and
those which are propelled by the force created by the moving power tiller: engine
propelled (EP) and motion propelled (MP), respectively (Field survey, 2012). Generally
power tillers are supposed to be walk-behind, but in some cases it is provided with a rear
wheel to support a seat for the operator. Large tractors on the other hand can be
categorized into three types, based on the wheel systems: two-wheel drive (2WD), front-
wheel assist/unequal four-wheel drive (FWA) and four-wheel drive (FWD). Another way
of categorizing power tillers and tractors is based on their horsepower. The horsepower
of power tillers and tractors is a measure of the rate with which work or farm operations
are carried out. In sum, one horsepower is the amount of energy required to move
33,000 pounds of soil a distance of one foot in a time span of one second. It is a
measure of a machine’s ability to move a load. By horsepower classifications we have
102

small (5 to 24Hp), medium (25 to 49Hp) and large (50Hp and above). The maximum
power developed by the engine of the tractor is known as the brake horsepower. The
power-take-off (PTO) horsepower which is about 85% of the brake horsepower is the
stationary power generated at the end of the shaft of the tractor connected to the engine.
(Sumner & Williams, 2007).
A third classification of the horsepower is the drawbar horsepower which measures the
pulling power of the engine in relation to the wheels. It is also a percentage of the PTO
power and varies depending on whether the soil surface is compact or soft and the type
of tractor (Walters, 2013). Thus, as the strength of the contact surface decreases, the
drawbar horsepower also decreases because the grip and friction between the soil and
the capital good declines. This means that on more compact soils, tractors are likely to
develop higher drawbar horsepower. Generally, as horsepower increases, the weight of
the capital goods which influences its stability during operation also increases by
engineering design.
These different horsepower ranges of tractors also come with differing weights, number
of engine cylinders and fuel tank volumes. A typical small power tiller of less than 25Hp
has one or two cylinders. Medium sized tractors of less than 50Hp will have 2 to 3
cylinders while large ones have between 3 and 6 cylinders. Generally the higher the
horsepower the more cylinders the machine possess, the heavier it is and the bigger the
volume of the fuel tank. See Table 5.1 showing these broad categories and basic
characteristics.
Table 5.1: Classification of capital goods features, scale and technology
FeaturesScale
Power tiller TractorSize Small Medium Large (tier 1) Large (tier 2)Number of engine cylinders 1 to 2 2 to 3 3 to 5 4 to 6Brake horsepower <25 25-49 50-84 85-450Wheel system EP/MP 2WD FWA/4WD 4WDWeight of machine (kg) 225-599 600-999 1000-1399 1400-2500Volume of fuel tank (litres) 2 to 3 6 to 8 20 to 30 up to 300Source: Field Work, 2012
103

In discussing optimal equipment under various farming systems, the study assumes that
soil conditions are well drained, undulating and without heavy gravels and stones. In this
light, machines with higher horsepower will be required to produce higher draft for heavy
soils and vice versa. On very muddy soils FWA and FWD tractors are recommended for
high quality traction. In addition, the strength of the machinery must also match the soil
terrain. Tougher machines are recommended on fields which are rough, with high
presence of rubbles and stones. At the same time not so tough machines would survive
on relatively smoother and softer soils without difficulty.
The size of the farm in acres, which is sometimes related to the type of crop, also
matters. For many crops13, larger farms will require larger and faster machines that can
complete operations on time. On smaller farms, small machines are sometimes ideal for
easy negotiation of curves at the corners of the field and general manoeuvrability.
However, no matter how small the field is, if the soils are very heavy, then small
machines selected should be very tough. In the case of very wet grounds, the machine
should not be too heavy so as not to sink and get stuck. It should also not be too light to
prevent slipping. If they are heavy, then the wheels must be specifically designed to
handle wet terrains. As small machines would take longer time to complete a unit area of
work, labour availability is also important.
Whilst the question of quality of machine can be a subjective matter, and any
assessment of quality by a user can be biased by personal views, its measurement or
implied measurement is crucial to the analyses in this study. This is because, for most of
the characteristics described above, emerging economy manufacturers tend to produce
an array of products that mimic the advanced country products. However, their quality,
durability and robustness in the view of importers, distributors and users are not always
the same. To measure power tiller and tractor quality, average economic life of groups of
13 In the case of a crop like tea, high quality objectives may require that cultivation by hand is maintained
104

machines is used as a proxy14. User experiences suggest that the durability of different
brands of power tillers and tractors vary. Agents in the various links of the value chain
put different brands of power tillers and tractors under a lifespan related quality class
(Field interviews, 2012).
In reference to this assessment by users in particular, the study classifies machines
which operate for up to 3 years from the time of purchase and then require major engine
repairs as lower quality (Q1) and those which do so after 10 years are classified as
higher quality (Q5). In between these two extremes of quality, we have 3 to 4 years (low
- Q2); 4 to 6 years (medium - Q3); and finally 6 to 10 years (High - Q4). A breakdown of
these quality classes is presented in Table 5.2. Despite the fact that these classifications
may raise questions about justification of groupings, we argue here that more durable
machines are likely to be made of high quality materials and hence likely to be tougher
and more resilient to soil resistance.
Table 5.2: Durability and quality ratings of capital goods
Economic life (years) 0 to 3 3 to 4 4 to 6 6 to 10 10 and above
Quality ratings Lower Low Medium High Higher
Codes Q1 Q2 Q3 Q4 Q5Source: Key informant interviews, 2012/2013
5.3.3 Farming systems, common crops and appropriate capital goods
There are two broad groupings of agricultural systems in Tanzania reflecting the main
source of water supply: rain-fed and irrigated (See Dixon et al, 2001 for categorization of
farming systems in sub-Saharan Africa). Rain-fed systems are mainly reliant on rainfall.
Land preparation is done just before the onset of rains, or in some instances the early
days of the rainfall. Ploughing and harrowing are timed to occur before the rains.
However activities like mounding and ridging are left until the rains come since those
operations are better done with some amount of moisture in the soil. Irrigated systems
are fed with water directed from a river through canals or artificially pumping water from
14 Repair and maintenance costs and frequency of breakdown are also considered
105

a dam or an intake point on a river. Underground water sources may also be used.
Under this system, plots can either be totally flooded as in the case of paddy cultivation
or just sprinkled in the case vegetables. These irrigated fields in Tanzania are usually
found around river basins. A case in point is the paddy farms in the Mbeya region which
derive water from the River Ruaha (Field interviews, 2012).
Common crops grown by Tanzanian farmers in our sample include maize, paddy (rice),
pulses and legumes, sunflower, tobacco and sugarcane and some vegetables (onion,
tomato - on very small number of seed beds generally not requiring mechanisation).
Pulses and legumes (groundnuts and pigeon peas) and sunflower are grown as
intercrops with maize. Pure stands of sunflower or pulses are usually uncommon. Maize
farms are on average larger than paddy farms and paddy farms are also on average
larger than sugar cane fields. Tobacco fields are generally commercial. The value of crop
harvested per acre from these different crops in different parts of the country is not the
same. Availability of suitable lands, ability to irrigate, intensity of cultivation, and general
crop husbandry practices accounts for these differences. Below we consider each of the
crops, their soil requirements and the associated capital good required to match them.
Maize and rice are mainly produced by small and medium scale farmers for food with the
intention of selling the surplus, whilst large scale farms mainly cultivate them for
commercial purposes. Tobacco and sugarcane farmers have commercial orientation and
produce for cash (See Sarris et al, 2006).
a. Typical food crops
/. Maize
Maize can be grown on a wide variety of soils, but performs best on well-drained, well-
aerated, deep loams and silt-loams containing adequate organic matter and well
supplied with available nutrients. Although it grows on a wide range of soils, it does not
yield well on poor sandy soils, except with heavy application of fertilizers. On heavy clay
106

soils, deep cultivation and ridging is necessary to improve drainage. It does not tolerate
water logging; it can be killed if it stands in water for as long as two days and thus is
rarely cultivated on deep clays where water logging is common. Therefore maize and
millet farms intercropped with pulses are rarely irrigated; they are mostly rain-fed on
relatively light to medium sols.
Most often small and medium scale maize farmers rarely have tractors. They usually
prepare their land with hand hoe, oxen plough or hire the services of a tractor from other
owners. Some medium sized farms and most large scale ones have tractors. Because of
the relatively larger farm sizes, power tillers are rarely an option for farmers considering
buying machines for their maize fields. However, because the soils on which maize is
cultivated are lighter in texture, medium-sized tractors (25 to 49Hp) are very convenient.
Under the rare occasion of medium textured soils, large tractors (tier 1) with FWA are
preferred. Depending on how large the farm is and the time available to the farm
operator for land preparation, some farms require more than one unit of the tractors
described above; or simply work the single tractor for longer hours. The predominantly
lighter nature of soils on which maize grows means that tractors with the two-wheeled
drive technology are convenient, and it is not always necessary to have a four cylinder-
engine; the three-cylinder versions can perform equally well.
With soil fertility declining in many regions of Tanzania, one way to compensate for
decline in output is to increase area under cultivation, especially in the absence of
fertilizers. To mitigate the negative effects of unexpected shocks like drought,
households are cultivating larger area in places where the land is available at low cost.
Consequently maize farms are growing in size in the sampled districts. Thus, larger
machines (horsepower wise) are needed for timely completion of field operations. The
sandy nature of the soils also means that not so much stress is put on the tractors- thus
tractors made with low to medium carbon steel can withstand the soil resistance without
breaking down.
107

//. Rice
Wetland rice is grown on practically all types of soils, from sandy loam to heavy clay. It is
however well established that the heavy soil characteristic of river valleys and deltas are
better suited for wetland rice production than lighter soils. An ideal rice soil should
contain up to 50-60% of finer fractions of silt and clay. Many wetland rice farmers
practice paddling on demarcated plots. During land preparation paddling is done to level
rice fields to evenly distribute irrigation water and to prevent pockets of stagnant water.
Upland rice refers to rice grown on both flat and sloping fields, prepared and seeded
under dry conditions, and depends on rainfall for moisture. Here, the soil is mostly clay
and silt-loams reflecting the capability of the soil to absorb and hold enough water after
the rains to support plant growth. Thus for rice, there are both rain-fed and irrigated
systems, with the irrigated system having much heavier clays (Ceesay, 2004).
Rice farms can be small, medium or large scale. The intensity of farming operations on
rice farms is high. Thus no matter the farm size, mechanisation is recommended to make
farm work easier for the farmer and also help overcome challenges associated with
labour supply. For both upland and irrigated fields, the soils are heavy and require power
tillers and tractors made of high quality material and high horse power for medium to
large scale fields. For the ploughing process on small fields, high quality and robust
power tillers (small technologies) are recommended. Any attempt to use fragile and less
robust machines on such farms will destroy the power tillers after a few days of usage.
Depending on the nature of the soil, one can use one of three technologies. On relatively
smooth soils without debris, power tillers with the rake technology15 can be used for
paddling. However if the soil particles are rough with a lot of debris, then a relatively low
quality power tiller with high horse power (16-20), or a high quality power tiller with lower
15 The rake technology does not draw energy direct from the engine; it works using energy from the motion of the power tiller
108

horse power (12-14) which comes with the rotor16 technology can be used to break soil
clods and agglomerations of soil underwater (Field interviews, 2012).
On large upland farms, bigger and stronger machines are required (Tier 1 large tractors
with FWA). Low quality machines can barely get any work done without breaking down.
Tractors with 2WD complete work much slower; making it a risky choice under rain-fed
conditions where timeliness is key. Here again, though 4WD drive technology is not a
necessary engine technology requirement, it is an added advantage.
Large irrigated rice fields on the other hand, have much heavier soils. Thus soil
resistance to tractors working on them is very high; the window for completion of the
farming operation can also be limited. Thus tougher and more rugged machines are fit
for purpose. The tyres must be well designed to create enough friction on wet soils to
prevent slipping. The engine capacity must be high (Tier 1 large tractors with 4WD or
Tier 2 large tractors) to create the desired furrow depth in the soil. Here 4WD is desired.
However, high-end high-quality medium-sized tractors between 50 and 60Hp may also
work; but not at a very fast pace. Low quality tractors usually lose some parts through
breakages each time it is subjected to such conditions.
b. Typical cash crops
/. Tobacco
Grown in well-drained, sandy to loam soils tobacco is mainly cultivated for export
markets from Tanzania. The soils are light and usually slightly sloping to prevent water
stagnation. They are rarely planted on clay soils and mostly rain-fed. Because the soil is
light, organic matter content is also low and most farmers fertilize their farms. Some
farms inter-crop tobacco with onion and tomato, also under rain-fed conditions. Much like
maize, soils on tobacco farms are usually sandy to sandy loams, very light in texture,
and this poses lower resistance to tractors and their implements during land preparation.
16 The rotor technology draws power from the engine during usage
109

Most tobacco farms are very large, and in cases where they are small the cultivation is
by a collection of farmers under an out-grower scheme and sharing machinery
resources. To cater for the larger farm sizes, machines with higher horse power (Medium
sized and Tier 1 large tractors) are preferred by users to get farm operations completed
on time. However, the material quality for fabrication of the machine need not be very
high, though this can be an advantage in terms of lifespan of the machine. The activities
carried out on tobacco fields are not so demanding when considering the soil resistance,
but in terms of land area and the number of operations per acre, it is. To get the seed
bed ready, the farmer ploughs, harrow and make ridges. This requires higher machine
capacity to complete the work on time. Thus even if the farmer cannot buy machines of
high quality and horse power, he/she could buy a number of medium-sized machines of
relatively lower quality (in terms of strength of material used). Because of the large scale
of nature of tobacco fields, 4WD engine technology is desirable.
//'. Sugarcane
A well-drained loamy soil is considered ideal for sugarcane production. The soil should
be loose and friable with a minimum depth of 45 cm. However, deep and friable soils are
not very common in loams. Clay soils offer the opportunity for deep top soils, thus most
sugarcane farms in our study are found on heavy clay fields where water supply is
adequate. Where the soils are hard due to clayey structure, more elaborate preparatory
cultivation practices like deep-ploughing or chiselling are necessary before formation of
furrows. Sugarcane has the potential for deep rooting and the crop growing in deep soils
have appreciable drought tolerance. However the need to stimulate sugar contents at
particular times of the year requires that irrigation water be pumped on the crop
especially on large scale farms. Thus sugarcane falls under the irrigable lands, and
particularly so under heavy clayey conditions.
110

Depending on the size of the farm, tractors of 60Hp and above can be used to prepare
sugar cane fields. However for the purpose of sub-soiling or chisel ploughing, if a tractor
is used it should have a horse power of about 80, otherwise chisel depth will not be good
enough to prepare the whole topsoil for holding adequate water for the entire cane sugar
plant life. Low quality and low horse power tractors will not survive a season on sugar
cane fields especially in alluvial river basins. For best performance, materials used for
such tractors must be hardened carbon steel. Power tillers are rarely used on sugar cane
fields. But if the plot is very small, about an acre or two, high quality power tillers can
perform the required task. Four-wheel drive tractors are usually of more value on such
fields than tractors which have only the rear tyres being driven by the engine.
5.3.4 Summary
Table 5.3 presents a summary of the farming systems, the textural combinations (sand,
silt and clay) of predominant soils and their associated common farm sizes. Maize and
tobacco farms cluster around rain-fed systems on light to medium textured soils (Cell 1
and Cell 4 in Table 5.3). Upland rice and semi-irrigated sugarcane are rain-fed but
usually found on medium to heavy textured classes of soils (Cell 2 and Cell 5 in Table
5.3). Finally we have irrigated rice and sugarcane occupying Cells 3 and Cell 6 in Table
5.3, where the soils are medium to heavy textured under the irrigated systems.
Vegetables, legumes, sunflower and pulses are mostly intercropped with maize and
tobacco in Cell 1 and Cell 4.
i l l

Table 5.3: Farming systems, crops and soilsFarmingSystem Soil texture
Food Crops Cash CropsMaize Rice Tobacco Sugarcane
Rain-fed Sandy (coarse and loose) Loamy (medium and light) Clayey (fine, firm and heavy)
Cell 4Cell 2 Cell 5
Irrigated Sandy (coarse and loose) Loamy (medium and light) Clayey (fine, firm and heavy) Cell 3 Cell 6
Area Red- Maize Cell 1- Rain-fed maize sandy-loam Cell 4- Rain-fed tobacco sandy-loamArea Blue- Rice Cell 2- Rain-fed rice clayey-loam Cell5-Rain-fed sugarcane clayey-loamArea Yellow- Tobacco Cell 3- Irrigated rice clayey-loam Cell6-lreigated sugarcane clayey-loam Area Green- Sugarcane Source: Field work, 2012/2013
These sets of farms (characterized by crops, soils and water source) on average have
minimum technology requirements for best performance defined by the horsepower, the
wheel-system and the quality of the tractors or power tillers (See Table 5.4). Based on
key informant interviews in 2012, the study found that small scale maize farms under
rain-fed conditions would require a tractor with a minimum of 25Hp to 49Hp, 2WD and at
least a quality grade of Q2. In the case of medium scale maize farms, the specifications
required are at least 25Hp to 65Hp, 2WD and Q1 to Q2 quality rating. A 35Hp to 65Hp,
FWA, and Q2 are best suited for large scale maize farms. Tobacco fields are similar to
rain-fed maize, apart from the fact that they are usually medium to large scale and so the
machines specified for maize are equally fit for purpose.
112
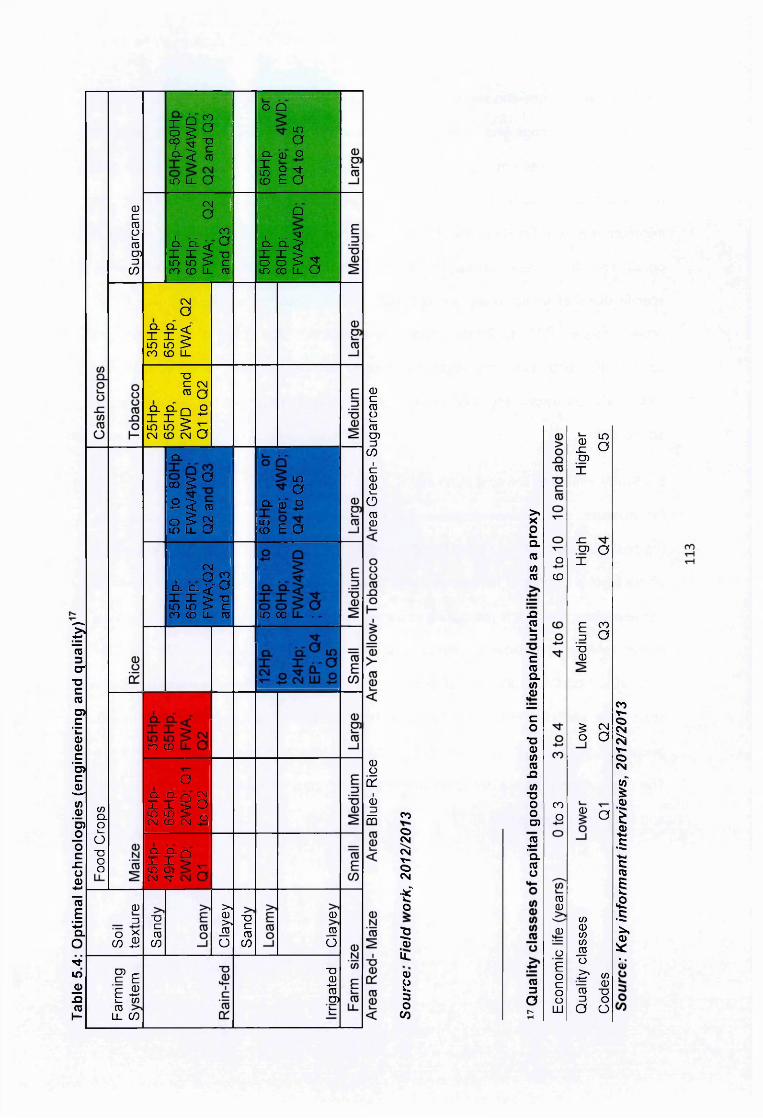
Table
5.
4: O
ptim
al t
echn
olog
ies
(eng
inee
ring
and
qual
ity)
0C lOi_oT3OO
(DC03Oi_0303|=3
CO
Q)=3
O * CO £
03 c-£= E E £t (0 03
LL CO
X P coo g O00 T-I
i l l
in i l O
CNa
COi . c L < 0 I I 9 T 3 id to > c CO CD LL 03
CNO
CL C L ^
1 X Sid id >CO CO LL
T3C CN 03 O
Q_ CL o OX X ^ ~CO I D > X CN CD CN O
Q .XIDCO
r>
C 0 ^ °-2 ^ 03
O ^ £ in l l O ______
CNO 00
i L O L ^ O X X ^ -OID ID > C CO CD LL 03
CO CD
oa d n cmx x g aCD ID <■ n CN CD CN £
C L Q - qx x 1-1CD 03 CN N-
~o£Z03
CO
>> CD >>lTOO
O Q
COaCD O O N-e a
Q. . -3;
CL C L >X X ^ _O o > %CO 00 LL U
IDaOCL 0
S E O
CD CD
~oc05
CO
0_ro
O
■a 0 «4—'TOcm
0CTOO!_03030
CO1c00
6TO0
00ix
10=5 _^ CO
osCNr-3■S'o;g0LL0
S23OCO
>»Xoa.TO(ATO
JQTOk .3CTOQ .(/)
. 0
Co■O0COTOn(A
T3OO03
TO*->"a.TOO
TO3a
oCD
COO
030
0
OEoc:ooLU
0.c03X
CDa
-C03 a X
EoID0
COa
| CNo a
0 a
C/3000_TOO^ 0 — 0 TO "O =5 OO O
>; Ke
y in
form
ant
inte
rvie
ws,
201
2/20
13

Similarly, rain-fed rice and sugarcane are grown on loamy to clayey soils under medium
to large scale holdings and so machine specifications appropriate for one are good for
the other. On the medium scale, a 35Hp to 65Hp, FWA and Q2 or Q3 quality is the best
bet; whilst on the large scale farms, 50 to 80Hp, FWA/4WD and Q2 or Q3 is the
minimum required. Finally on the irrigated systems where we have rice being cultivated
on all three farm sizes and sugarcane on medium to large scale, higher technology
specifications of technologies are required. However, for the small scale rice fields,
power tillers of 12Hp to 24Hp, engine-propelled and of Q4 to Q5 quality rating, are
optimal. For both rice and sugar on medium and large scale, a 50Hp to 80Hp,
FWA/4WD, Q4 tractor and a 65Hp or more, 4WD, and Q4/Q5 tractor respectively are
adequate.
5.4 Study sites and farming systems
On average, the distance between the communities under consideration and their
regional capitals is about 80km. The distance to the commercial capital Dar es Salaam
where quite a number of farmers buy machines and spares, on the eastern coast, varies
between sites. Dakawa is the closest to Dar es Salaam, 244km; and Mbuyuni is the most
distant (746km). The closest community to a regional capital is Gallapo (17km) and the
furthest is Ubaruku (130km). (Table 5.5) In the following subsections, we describe the
study sites and identify the common soils and farming systems and then finally match
these communities with common agro-economic blocks identified in Table 5.3 and 5.4.
The discussions here are based on interviews conducted with users, community leaders
and other key informants in 2012.
114

Table 5.5: Regions, communities and samples drawn
Region Community Distance to regional capital (km)
Distance to Dar es Salaam (km)
Dodoma Hembahemba 111 354Ngomai 112 356
Iringa llula 47 454Nzihi 40 541Pawaga 72 573
Manyera Gallapo 17 653Magugu 58 715
Mbeya Mabadaga 106 738Mbuyuni 98 746Ubaruku 132 719
Morogoro Dakawa 50 244Turiani 95 289
Source: Field Work, 2012/2013
5.4.1 Morogoro (Mvomero District- Dakawa and Turiani)
Dakawa hosts the Dakawa Irrigation Scheme, formerly government controlled and over
time transferred to individual farmers. Farming activities here are mainly organized
around paddy cultivation; however other crops like maize are cultivated on a relatively
smaller scale. The soils are thick black clays that experiences cracks during the dry
season. The soils are very heavy and many farmers dread its impact on farm machinery.
Even in the wet season, there is evidence to suggest that it takes quite a long time
before water is able to percolate and rebind the soil particles. The heaviness and
stickiness of soils in this area is also demonstrated through the existence of many small
scale brick factories which depend on the abundance of this natural raw material, clay.
The soils are also characteristically black because of the presence of a lot of organic
matter mainly from fibrous rooted grasses and sometimes some stumps of shrubs or
broad-leaved weeds. There is a lot of sunshine in this area and the soil fertility, is very
high and good for the cultivation of rice. However continuous usage of the parcels of land
in the area without inorganic fertilizer application, especially in the early days, has
resulted in declining fertility. Dakawa’s agriculture generally involves either rain-fed or
irrigated rice fields, dominated by heavy clay soils (See Cell 2 and Cell 3 on Table 5.3).

Dakawa is on the main road between Morogoro town and Dodoma town. Thus access to
regular commuter transport, reliable pipe borne water and electricity exists. The town is
dotted with small corner shops which sell spare parts for motor bikes and also repairs
them. Some of these shops have stocks of tractor spare parts. During the land
preparation season- around October, November and December, shop keepers increase
the stocks of such spare parts. During these months, tractors from other regions like
Dodoma and Manyera, where land preparation begin in January come around to
participate in contract hiring. This increases the tractor stock and causes a surge in
demand for spare parts. There is also a common rice storage facility in the town centre,
which doubles as a marketing point for paddy or milled rice where people from Dar es
Salam and Morogoro come to buy in bulk.
Turiani area (which means settlement), is about 60km from Dakawa. This settlement has
evolved with the establishment and development of the Mtibwa Sugar Estates one of
four cane production and processing sites in the country. The estate farms as well as
out-growers and its accompanying processing plant currently produces and distributes
about a sixth of all table sugar consumed in Tanzania (Key informant interview, 2012).
Economic activities around the estate, in terms of trade, commerce and artisanal
services are intense. Though more than 50km off the Morogoro-Dodoma main road, it is
more urbanized and active than Dakawa. The soils are even heavier and deeper.
Farmers around the estate, cultivating sugarcane and paddy, usually use tine cultivators
as a pre-primary tillage technique before setting out to do an ordinary ploughing (either
dry or wet). The soils here are much heavier than those in Dakawa and it is evident in
the fact that many of the tractors are large and with higher horse power. As one
businessman who sells spare parts and also doubles as a trained mechanic puts it:
...’in Turiani a farmer cannot be in business without a Ford or New Holland; they
have been tried and tested here, but even so anything below 70Hp is a non
starter"’.
116

Muddy areas are also common and the area looks much greener than the Dakawa area.
The sugar fields, especially those operated by the estates are irrigated with river water
available during most of the year. The fertility of the soils is also higher and the farmers
here grow a variety of other food crops. Aside from the usual sugar cane, rice and maize
are also cultivated. The rice and sugarcane fields which dominate in this area are mostly
irrigated on clay soils, but a few are rain-fed. Thus typical farms here fit Cell 3, Cell 5 and
6 in Table 5.3.
With unreliable sugar content in cane, and low prices of sugar which are generally not
paid on time by the estates, an extension officer made me aware that most of the out
growers are now allocating more farm lands to the cultivation of rice instead of the
traditional cane sugar. The town is also dotted with a lot of repair shops for maintaining
tractors. There are however three large repair shops which most owners use. Expertise
in the maintenance of Ford, Fiat and New Holland tractors is widespread. Most of the
mechanics operating these garages were formally employees of the sugar estates and
upon retrenchment, opened their own garages. Activities in terms of service provision
are swift and the connection between owners of tractors and particular garages is also
very relational.
5.4.2 Mbeya (Mbarali District- Ubaruku and Mbuyuni)
Mbeya is characterized by dry spells, dusty and windy conditions. There are two
separate irrigation schemes, Mbuyuni and Ubaruku. The Mbuyuni scheme is manned
and managed by farmers on the scheme and supervised by extension officers from the
Ministry of Agriculture, while the Ubaruku scheme, a formally government controlled
estate known as Mbarali Estate has now been diversified and it is operated with private
equity. Central government have very little oversight of the estate now. Covering an area
of about 3,100 acres and with about 150 members, the Mbuyuni scheme which is on the
Iringa-Mbeya main road, was renovated with the support of the Japan International
Cooperation Agency (JICA) in the late 1990s with redevelopment of canals and
117

preparation of the sub and top soils and then levelling. Water intake points were also
improved. In addition to the improvement of physical infrastructure, soft technologies
were also transferred to members of the scheme by the Japanese to improve their
production strategies and consequently improve output and ultimately income. Prior to
the 2000s, the scheme was mainly tilled with animal power. However, the extension
officer reports that the animal power stock on the field has declined greatly and scheme
members have agreed that by end of 2013 season, the use of animal power should be
eliminated altogether (Key interview with extension officer at Mabadaga, September,
2012).
There are thus currently 120 power tillers and about 5 tractors on the scheme mainly for
primary tillage operations and gradually phasing out the use of animal power. One fifth of
all power tillers on this scheme are owned by women and of the three spare parts shops
in the community, one is owned by a woman. The rural market and entrepreneurship in
terms of sale of farm machinery, spare parts and expertise in repairing power tillers and
tractors is at an infant stage. This is because Mbuyuni is surrounded by relatively bigger
and more active communities including the district capital Rujewa, about 32km away and
Chimalla, another big town in an adjacent district. Thus with reliable transport, farmers
are not worried about commuting for purposes of purchasing whatever spare parts they
may need.
The Ubaruku scheme is privately owned by an Indian investor. There are two plots which
altogether comprise 3,200 hectares. While the managers of this estate reserve a
substantial part of the land for their own cultivation, there is also a portion given to
interested community members to use for their household production. In such an
arrangement between households and estate owners, usually with a three year
renewable contract, the company ploughs the land and supplies water to the users at an
annual fee of TZS100,000 (£42.00). What the households do on these fields is usually
secondary, tillage mainly paddling, planting and weeding. However in cases when the
118

ploughing done by the company is not to the users’ satisfaction, then they will plough
again before paddling. There is another open source scheme, managed by the
community to supply water to farms which are outside the Mbarali Estate Scheme. Here,
farmers only pay an annual fee to use the water, but carry out all other activities by
themselves. Present in Ubaruku are other large farms managed by private individuals
which are rain fed.
The local Roman Catholic Church also has a fleet of tractors, which they use to till their
irrigated fields. With a population of about 35,000 people, the streets of Ubaruku are
lined with power tillers either being displayed for hiring, waiting to be repaired or just an
operator who has pulled off to get a drink. Once in a while, the ear-shattering noise of a
power tiller carrying bricks or bags of paddy rice from one point to another is heard. In
total, there are over 300 power tillers owned and used by farmers in this area. Large
scale farmers also have between 30 and 35 tractors working on their fields. This
excludes about 50 tractors owned and used by the Catholic Church and Mbarali Estate.
This is based on estimates made by extension officers and other farmers who have been
working in the area for years.
In the industrial area of Ubaruku warehouses built specifically to store paddy rice and
serves as a trading point for people who have come from other regions and neighbouring
countries to buy rice. There are four large scale rice milling plants owned by local
entrepreneurs who are themselves farmers. They provide storage facilities for farmers
and also mill and grade their produce for them at a fee. The predominant crop grown
here is paddy, but some farms also grow maize, though not irrigated and mainly
produced for household consumption. Both Mbuyuni and Ubaruku schemes clearly fit on
Cell 3 whilst the upland farms in Ubaruku fits in Cell 2 in Table 5.3.
119

5.4.3 Iringa (Iringa District - Pawaga and Nzihi)
Iringa is a relatively cooler region with temperatures sometimes falling to 7°C in
mountainous areas. The standard of living is also quite high in terms of average
household incomes compared with other regions considered in this study and the rest of
the country as a whole. Soils here are not very heavy but not too light also, especially for
areas in the district under consideration where tobacco, tomato and maize are grown.
The soils can be described as sandy to light loams in the tobacco and tomato growing
areas to medium clays on the paddy fields. The abundance of grasslands is also an
attraction for a number of nomads rearing ruminants like cattle and donkeys. Supplied
with a lot of water from the Ruaha River, some farmers along the basin cultivate paddy
(especially in the Pawaga area) and others cultivate vegetables like tomato and onions
around the Nzihi area. With large tracts of arable land in the low lying areas, the Iringa
region and the district has been a source of attraction to many white settlers from Europe
wanting to do business in the agricultural sector or just for tourism. To this end, there are
several acres of land allocated to European investors who are mainly Greeks and a few
of German origin.
The arrival of the Greek and German investors in the late 1950s and early 1960s in the
Nzihi area (about 40km from Iringa town) served as a driver of mechanisation and the
consequent introduction of tractors and other machinery mainly from Europe. In a small
town around Iringa, legend has it that a particular Massey Ferguson tractor which I did
not have the privilege to see during my study tour had been working since 1954. These
Greek and German farms are usually large scale commercial farms mainly growing
tobacco. Their estates are built in such a way that a village is artificially developed
around it as home for migrants seeking jobs on the farms. The tradition has been that
most Tanzanian farmers living around the estates usually buy second hand tractors from
the large farms when they purchase new tractors. Thus until the early 2000s, not many
120

locally owned farms in the towns in which this work was done, had bought their tractors
as brand new.
In the Pawaga area, about 72km from the regional capital, Iringa, where there is very
little participation of white settlers in the rural economy, farms were mainly operated with
animal power until a few co-operative societies in the 2000s, started to buy tractors- for
their members. Because the tractors were few, access was also limited, requiring the
continual dependence on depleting animal power stocks and the hand hoe. However,
with the advent of power tillers in the mid-2000s, the two main irrigation schemes around
the Pawaga area cultivating rice, begun to purchase power tillers either on an individual
farmer basis or through their co-operative societies. One of the two irrigation schemes
have been well developed, with canals dredged and water supply maintained. The other
scheme lacks structural and managerial excellence and so farmers on the latter scheme
turn to rely more on hand hoes and animal power, compared with the former where there
is evidence to suggest that they are mechanizing at a very fast rate. In addition farm
animals, especially donkeys are also very prominent on the rice fields in this area. There
is however anecdotal evidence to suggest that there is a latent demand for more power
tillers, but the transportation cost associated with bringing the machines from Iringa or
Morogoro is a disincentive to interested formers. It is likely that if road infrastructure
improves, more power tillers will find their way into the area.
Road infrastructure between the regional capital and both study sites is not well
developed. Frequent and reliable mini bus service between Nzihi and Iringa, the regional
capital exists. On the other hand, there are only two big buses which make a daily round
trip to Pawaga. On market days, which is once in a month there are more buses plying
the route. The Pawaga area is also not connected with the national electricity grid and
households power their homes with kerosene or power tillers connected to dynamos.
The spare parts market, and repair shops especially for tractors are mainly found in the
regional capital and so farmers usually travel to Iringa for service and spares. However
121

on large (white) settler farms, they usually have their own mechanics and for people who
have recently bought new tractors, they can call the dealer to come over for servicing if
the warranty has not expired. Generally, the soils in Nzihi area are rain-fed loamy soils to
light clays and those around Pawaga are irrigated fields of medium to light clay.
5.4.4 Manyara (Babati District- Gallapo and Magugu)
Babati is a newly formed region, but formerly part of the Manyara region (home to the
highest number of tractors, as historical evidence suggests). Farmers in this area are
mainly involved in the cultivation of maize, groundnuts and sunflower especially around
Gallapo, about 17 km from Babati the regional capital. Magugu is also about 58km from
the regional capital and cultivates mainly maize, paddy and sugar cane. Whilst maize is
mainly cultivated by the locals, with a few on the irrigation scheme cultivating paddy,
some Finish and Indian settler farmers cultivate sugar cane, rice as well as certified
seeds for farmers. This region has two growing seasons per year; thus giving farming in
the area better prospects than the other regions where the rains are usually once a year.
Their location close to the Kenyan boarder and a traditionally prosperous region in terms
of agriculture makes it integrated with other African countries in terms of input markets
as well as an outlet for their produce.
This region has attracted a lot of investment in terms of coffee growers in the Arusha and
Moshi areas as well as government support through the Lower Moshi Irrigation Scheme.
They have also benefited immensely from an Agricultural Training Centre18 in Moshi
mainly concerned with paddy cultivation. In recent times, a research centre for the
advancement of zero tillage technologies has also been sited at Babati and farmers in
the area are receiving training in agro-forestry and conservation agriculture. Because of
the high fertility of the existing loamy soils in the region, it has in the past and present
attracted a lot of high quality mechanisation equipment.
18This is a training centre for equipping farmers with rice production technologies
122
In the Magugu area some small scale farmers have started taking delivery of power
tillers, especially in the last two years through the assistance of the local government or
their own personal savings. Their irrigation system is currently being improved through
reconstruction, canal improvement and field levelling. Some farmers are of the view that
when the scheme improvement is completed, coupled with the fact that there is a dealer
of power tillers currently in Babati, demand for mechanisation equipment will surge. Soils
in Gallapo are rain-fed sandy loam to loam (Cell 1 in Table 5.3) and those in Magugu are
heavy loam to light clay (cell 3 in Table 5.3).
5.4.5 Dodoma (Kongua District- Hembahemba and Ngomai)
Soils in Dodoma are sandy to sandy loam. They are relatively lighter compared with all
the other regions under consideration. Soil fertility is relatively lower, so are household
incomes and levels of education. The rains are usually once per year, and very erratic.
Deforestation has become a major problem as farmers clear large tracts of land to
cultivate their crops as a risk coping mechanism. Thus in years when the weather is bad,
because of the large area cultivated, the little they harvest per acre comes together to
create enough output for household consumption and a little excess for sale. Most
farmers in this area grow maize, sunflower and groundnut intercrops. Some of the farms
are very close to the settlements; others are very far away from where they live. Some
farmers in these two communities considered under our study actually go as far as the
Manyera region (about 350km) to cultivate the maize crop, as land in their locality have
degraded so fast, and further allocations made by central government as forest and
game reserves has constrained supply.
The availability of fertile and unreserved lands in the area continue to diminish, in the
midst of a surging demand for maize, after the opening of the maize market in Kibaigwa
(a commercial centre in the district) a few years ago. Kibaigwa is about 15km from
Hembahemba and 8km from Ngomai. Most of the villages that surround Kibaigwa are
actively involved in the cultivation of maize and under very conducive environmental
123

conditions they are able to produce as much as 10 bags per acre, while in bad years
some farmers harvest as little as 2 bags per acre or nothing at all. Kibaigwa also serves
as a market for spare parts and tractors. Mechanics specializing in the repair of mainly
Indian Swaraj tractors are dotted around Kibaigwa and tractor owners from
Hembahemba and Ngomai use them. Quite recently, the Swaraj Company also opened
a distribution and service centre at Kibaigwa and they also serve farmers in the area.
Though there are a lot of farm animals in the Ngomai area, animal power usage on farms
has diminished greatly, and nowadays most of the primary tillage practices are
conducted using tractors.
In the Hembahemba village where most of the surveys were done in this region, they
trace their early experience with tractors as far back as the late 1970s when a rural
entrepreneur had a milling machine which used a German made International tractor to
operate. The same entrepreneur also used his tractor during the cultivation season to
plough his land and those of other village members who were interested, and to the
extent that time constraints allowed. Subsequently, the village took delivery of three
International Harvester tractors under a government initiative to support agriculture in the
rural areas. These machines were managed by the village committee and they served
farmers under a hiring scheme.
During the Structural Adjustment Programmes, these machines were sold to some
community members. This was probably the tipping point for private farmers to own
tractors. At the onset, there were a few tractors which individual farmers bought either
new or second hand, mainly from advanced countries. In the mid-1980s, some models of
Swaraj were imported from India and overtime they became popular. Between 1988 and
1994, there was another initiative by government to encourage farmers to own tractors.
Under this programme Hembahemba imported Escort tractors also from India. The
Swaraj groups continued actively marketing throughout the 1990s and towards the end
124

of that decade, a few Powertrac tractors were also imported from India. Generally, soils
in Dodoma fit Cell 1 in Table 5.5.
In Table 5.5, each of the study sites is placed in the Cell that matches its predominant
farming system, soils, crops and farm size. Table 5.5 forms the basis for our comparison
of technique choice.
Table 5.5: Study sites and agro-economic indicators
FarmingSystem Soil texture
CropsFood CashMaize Rice Tobacco Sugarcane
Rain-fedSandy (coarse and loose)
Loamy (medium and light)Clayey (fine, firm and heavy)
Cell 4Nzihi
Cel! 2UbarukuPawagaDakawa
Cell 5TurianiMagugu
IrrigatedSandy (coarse and loose)
Loamy (medium and light)
Clayey (fine, firm and heavy)
Cell 3DakawaUbarukuMbuyuniMaguguMabadaga
Cell 6TurianiMagugu
Average farm size Small/Medium/Large Medium/LargeArea Red-Maize Area Blue-Rice Area Yellow-Tobacco Area Green-Sugarcane Source: Generated from Table 5.3 and Discussions in Section 5.5
In effect, these indices generate three distinctive situations under which a choice
between advanced country and emerging economy tillage technologies can be made.
First, Cell 1 and Cell 4 have similar agro-economic characteristics. Thus for Cell 1 (llula,
Gallapo, Ngomai and Hembahemba) and Cell 4 (Nzihi) in Table 5.5 which have same
farming systems and soils, tractors that are fit for purpose in the former case will also be
fit in the case of the latter. Second, taking a similar approach, Cell 2 (Dakawa, Ubaruku,
Mbuyuni, Magugu and Mabadaga) and Cell 5 (Turiani and Magugu) can be combined for
the analyses of choice of technique as farmers under those two farming systems have
similar soil characteristics. Third, Cell 3 (Dakawa, Ubaruku, Mbuyuni, Magugu and
125

Mabadaga) and Cell 6 (Turiani and Magugu) are also comparable and so can be
combined when considering technologies which are fit for purpose.
It must be stated here that while tractors can be used under all the three scenarios
categorized here, power tillers are mainly useful under small scale rice fields. Though
manufacturers usually specify several conditions under which they can be used, field
visits to most farms revealed that only a small proportion of farmers (6 out of the 95
power tiller owners interviewed) used their power tillers outside paddy fields. In Section
5.6, groupings of power tillers and tractors on the Tanzanian market based on the source
of the soft and hard technologies are made. At the end of the Section 5.6, the five
operating conditions discussed here are revisited and alternative brands from which the
farmers within each scenario can choose from are presented referencing the farm level
data. This will serve as the bases of our discussion on distinctive nature of capital goods
in Chapter 8.
5.5 Mechanisation choice sets and alternatives
Beyond technical and engineering differences, there are global value chain structures
and target markets which influence cost, quality and volumes produced of power tillers
and tractors. As discussed in Chapter 2 of this thesis, there are four major centres for the
production of tractors and three major centres for the production of power tillers in the
world. These centres are dominated by fewer than fifteen large conglomerates. Aside
from sourcing machines from these centres, attempts are also being made to produce
power tillers and tractors locally in Tanzania. We shall discuss the options available to
the farmer in Tanzania on the global market and the potential, in the future to buy from
local manufacturers in the following sub-sections.
5.5.1 Brands from the international market
Power tillers are mainly produced in Japan (with subsidiaries in other Asian countries like
Thailand), Korea, India and China. Historically, the original source of power tiller
126

technology was Japan and production subsequently migrated to Thailand, Korea, India
and China. The main centres of tractor production include USA (with plants in South
America), Western Europe and India.
As was shown in Chapter 2, tractor manufacturing started in the UK and USA and
gradually moved to other parts of the world (a case in point is India where in the 1960s
joint ventures with American and European companies produced tractors locally). Global
annual production of tractors stood at 1.8m in 2011. A third of this number was produced
in India, making it the world’s leading maker of tractors in volume terms (Rao, 2013) Of
all the tractors produced in India, only 11% in terms of sales is exported (ICRA, 2012;
Mandal & Maity, 2013). That is, in year 2012 when the volume of tractors produced in
India were over 450,000 units, a little over 50,000 units were exported. This means that
producers in India target mainly their home markets. European and American tractor
makers target large scale farms in their own back yard and others across the world with
better access to capital. India on the other hand produces for relatively smaller farms
with capital constraints.
China is currently the largest producer of power tillers (both in value and volume terms)
in the world. Chinese manufacturers of power tillers have their eyes set on local markets
which are generally characterized by low income peasants who are gradually becoming
mechanized. Japanese and Korean power tillers are produced in lower volumes and
predominantly target relatively richer farmers in their own home and other well to do
hobby farmers or companies maintaining housing facilities in advanced countries. Thus
the old production centres are characterized by high cost high quality as opposed to the
newer production centres which concentrate on cost innovations to meet budget
constraints of users.
We therefore characterize the older centres of production associated with high quality
and high cost (that is USA, Western Europe, Japan and Korea as) matured markets
127

(MM). Relatively newer centres of production like India, China and more recently
Pakistan, are classified as emerging economies (EE) in this study. It must be
emphasized here again that some MM companies have manufacturing sites located in
EE either to take advantage of relatively cheaper factors of production or to produce for
the local market (Stewart, 1977). Power tillers and tractors produced under such
conditions rarely match the quality standards and cost of their original versions, though
the deviations are not so high. As suggested by a farmer in the Dakawa area during an
interview:
....I have two New Holland tractors, one from India and the other from Turkey...! have used the Indian machine for about 18 months and that from Turkey for nearly 24 months, as you can see, the one from India is already showing signs of old age...though I assign both of them practically equal amount of work per time. (Field work interview, 2012)
Furthermore, there are some MM machines which have been adapted to local conditions
in the EE through licensing from original brand owners or joint ventures which are not as
robust as those produced in the MM. As we shall see in later chapters of this thesis, the
materials used in the fabrication of machines adapted to EE markets are not very strong
and so there are frequent breakdowns associated during usage compared with the MM
ones. As noted by a female power tiller owner in the Ubaruku area during a focus group
discussion:
“...my power tiller from China is relatively cheaper compared with those from Japan or Thailand. Sometimes I wonder if the machine is made of clay...because parts of it easily gets destroyed and in the past season I have had to make about 18 round trips to the district capital just to buy spare parts to replace broken down ones (Focus group discussions, 2012)
The main elements or features that constitute adaptation are cost reduction, and
subsequently quality reduction. There are however instances in which electrical systems
are simplified for easy operation and repair and in other instances air filters are doubled
to prevent excessive gathering of dust in the engine. Finally, some technologies have
also been developed in the EE and are produced locally. Thus the study classifies MM
128

machines produced in advanced countries as MM0; MM machines produced in
developing countries as MM^ MM technologies adapted to developing country conditions
and produced in developing economies as EE-i; and EE technologies produced in
developing countries and designed specifically for the EE, as EE0. Table 5.6 presents
these categories and their country of origin. There are some EE technologies which are
also produced in and for advanced country users; these groups of machines are
however not considered in this study.
Table 5.6 gives a list of the tractors and power tillers under the categories defined above.
It must be emphasized here that the list in Table 5.6 is not exhaustive of all the brands in
Tanzania.
The brands listed here represent all the machines in the data set from the field work.
Typical MM0 power tillers are Kubota, Kukje and Daedong. Siam Kubota made in
Thailand, is an example of MM-! power tiller on the Tanzanian Market. In the case of EE1t
VST Shakti and Greeves are examples, and they are produced based on engineering
designs of Mitsubishi power tillers from Japan in India, Amec, Changfa, Dongfeng are
typical examples of EE0. Generally, spare parts of Amec, Changfa and Dongfeng can be
interchanged for one another.
With reference to tractors, Ford, Fiat, Massey Ferguson, International Harvester, Valmet
and Belarus are historical MM0 brands that are still in use in Tanzania. It is possible to
still purchase second-hand versions of Massey Ferguson and International Harvester in
Tanzania. But second-hand Ford, Fiat, Valmet and Belarus are no longer available.
Kubota tractor, SAME, John Deere, Case and New Holland are MM0 tractor brands in
Tanzania that can be purchased brand-new. Valtra (new trade name for Valmet from
Finland and Brazil), Massey Ferguson (Brazil), New Holland (Brazil and Turkey) and
John Deere (India) represent MMi tractors.
129

Table 5.6: Scale of technology, source and brand available in TanzaniaBrand Name Country of origin
Powertillers MM MM0(MM made in the North) Kubota Japan
Kukje S. KoreaDaedong S. Korea
MMt (MM made in the South) Siam Kubota ThailandEEi (MM adapted to EE, made in
EE the South) VST Shakti19 India
EE0 (EE made in the South) Greaves IndiaAmec ChinaChangfa ChinaDongfeng China
Tractors MM MM0(MM made in the North) Ford11 UKMasseyFerguson h UK/USAFiath ItalySAMEhInternationalHarvesterh GermanyValmeth FinlandBelarush RussiaValtra FinlandKubotatractor JapanJohn Deere USANew Holland UK/US/ltalyCASE USA
MMi (MM made in the South) Valtra BrazilMasseyFerguson BrazilNew Holland Brazil/TurkeyJohn Deere India
EE-i (MM adapted to EE, made in MasseyEE the South) Ferguson Pakistan
TAFE IndiaNew Holland IndiaPowertrac/Farmtrac India
EE0 (EE made in the South) Escort IndiaMahindra IndiaSwaraj IndiaYTO ChinaKAMA China
All machines labelled with superscript h are historical brands; new versions do not exist now so at best users can only procure second-hand versions
Source: Field Work Data, 2012
19 VST Shakti has been adapted (cost innovation wise) using Mitsubishi power tiller technology from Japan.
130

Massey Ferguson (Pakistan), TAFE, Powertrac/Farmtrac and New Holland (all from
India) are examples of EE-i tractors. EE0 tractors include Escorts, Mahindra, Swaraj, YTO
and KAMA. Escort and Swaraj have been on the Tanzanian market for several decades;
however Mahindra (the world’s largest tractor producer in terms of volume) entered the
market in 2010 and is yet to make significant inroads.
5.5.2 Local manufacturing of tractors and power tillers
Currently there is no full scale power tiller or tractor manufacturing in Tanzania.
However, there is evidence of assembly of power tillers in Mwanza in the North Western
part of the country by a private businessman. The company imports engines and gear
boxes from Spain. Other parts of the power tiller are then fabricated in their own
workshop and then manual assembly is done. This activity has been going on for well
over 20 years. The quantities produced especially in the 2000s declined significantly as
the business owner experienced a number of financial challenges. The engine
manufacturer in Spain is also believed to have folded after the 2008 financial crises and
this has created a further input supply gap. The machines they produce are robust, but
come with advanced country cost, which are prohibitive to low income households. The
plant manager and technicians were of the view that as the name suggests, capital
goods must be durable and robust. To get these qualities of robustness and durability,
prices cannot be reduced further. The company however plans to now import Indian
engines and gear boxes in the future when the business rebounds (Key informant
interviews with power tiller Plant Manager in Mwanza, 2013).
In the tractor market, government research institute (CAMARTEC) is leading the way for
domestic manufacture. The institute imports engines from the UK and fabricates the
other components locally. Though yet to go commercial, field trials with prototypes
across the various regions of the country is currently underway. In its current form, the
Director of Research believes it will be affordable to users and also meet the needs of
the Tanzanian terrains. They are however concerned that raising local capital to
131

commence production has been extremely difficult, and they do not think that
government in its present form will participate to an appreciable extent (Key informant
interview with Testing Officers and Mechanical Engineers in Arusha, 2013).
On the FDI front, there are negotiations by some international manufacturers such as
Iran Tractors and M&M of India to begin feasibility studies for producing tractors in
Tanzania. Several industry players are explicit about the fact that with the current
demand structure, anyone who wants to manufacture tractors in Tanzania must consider
pricing as very important. Household incomes are low, there is low country-wide capital
base and banks lend more to non-agricultural businesses. These capital constraints
requires extensive planning for local manufacturing to thrive and it should be pursued in
the context of the East African market, rather than concentrating solely on Tanzania (Key
informant Interview with M&M Sales Manager, Dar es Salaam). In the empirical
discussions that follow in Chapters 6, 7 and 8, tractors and power tillers manufactured
locally are not considered because they have a very limited presence on the Tanzanian
market.
We now turn our attention back to the operating conditions (hereafter, OCs) delineated in
the Section 5.5 and identify five situations under which the farmer is presented with a
choice of technology. We discuss these OCs in turn by presenting the alternative brands
from MMi, MM0, EE1f and EE0 that were found to be in use in each case and set them up
for technical and engineering comparison in Chapter 7. In Chapter 6 however, the broad
categories of MM and EE will be used as a framework for discussing technology transfer,
diffusion and penetration.
5.6 Operating conditions (OC)
5.6.1 OC1: Power tillers on paddy fields (small scale)
Here we have power tillers preparing the soil for rice cultivation mostly on small clay
fields ranging from 1 to 25 acres. These farms produce between 25 and 35 bags of
132

paddy rice per acre per season depending on the rice variety and whether or not artificial
fertilizers are applied. They are mostly irrigated and the farming system is very intensive
requiring the attention of the farmer throughout the year for field maintenance, if
productivity levels specified here are to be achieved. On the farms visited, Kubota (MM0),
Siam Kubota (MM-i), Greeves (EE-i) and Amec (EE0) were the most common alternative
powers. It must however be noted that Siam Kubota and Amec are the most widely used.
5.6.2 OC2: Tractors on sandy maize fields which (small/medium/large scale)
The soils here are largely sandy and light and any type of tractor, usually 25Hp and
above, can work well. However, when the horsepower is lower it takes a longer period to
get all the farm work completed and when the horsepower is too high there is excess
capacity. Thus in relation to the farm size, there should be a balance with the
horsepower chosen. Most farmers operating under these conditions have between 10
and 40 acres harvesting about 6 to 10 bags of maize per acre without soil fertility
management (artificial fertilizer application) and under rain fed conditions. The farm sizes
are mostly medium, though farm sizes below 10 acres and above 40 acres are not
uncommon. Consequently we mostly find tractors with horsepower between 25 and 50
being used.
There are however some large farms which use machines with higher horsepower,
though many of them, even if the farms are large, tend to invest in 2 or 3 tractors of the
25 to 50Hp rather than have one 80Hp tractor. Under this condition, the study will
compare Farmtrac 45 from India (EE^ with Swaraj also from India (EE0). We shall
however make reference to other MM tractors without undertaking a detailed economic
analysis on them because they are usually of excess capacity under this OC, and
represent a sub-optimal choice especially when we consider the common range of farm
sizes. Unless owners of such large tractors have contract-hiring intentions as rural
entrepreneurs, ownership of higher horsepower tractors results in low capacity utilization
under this OC.
133

5.6.3 OC3: Tractors on Maize and Tobacco fields (medium/large scale)
Farmers under this OC are relatively wealthier than those under OC2. This is because in
the case of maize, inter-cropped with vegetables and pulses, the productivity of the land
is higher as a result of higher soil fertility under loam conditions. In the case of tobacco,
output prices are also higher compared with maize, and the market for tobacco is
relatively stable and reliable. On a per acre basis, maize farms achieve 12 to 15 bags
per season. Other benefits also accrue from sunflower in the Babati area and vegetables
(onion and tomato) in the Iringa area. Farm sizes here are usually medium to large scale.
Here we shall compare Finish Valtra (MM0), Brazilian MF (MM-i) and Pakistani MF (EEi)
which are in the 50 to 65Hp range. The study does not have enough data to make
estimation for an EE0 example. In this case Mahindra would have been an ideal example
but its usage in Tanzania is at the infant stage, and the only sources of data were those
obtained from the importers and distributors rather than from farmers. Farmers reported
that they could only give a complete evaluation of the machine after about 4 to 5 years.
5.6.4 OC4: Tractors on upland rice and sugarcane (small/medium/large)
Productivity on farms here are not as high as those on OC1 especially in the case of
paddy. Output per acre is about 18 bags per acre within a single season for paddy rice.
The farm sizes here range from small through medium to large scale. Large scale farms
(above 40 acres) are however more common than the small and medium scale ones.
The common tractors used under this OC have horsepower ranging between 65 and 80,
or sometimes even higher. We shall compare New Holland from UK/Italy (MMO) with MF
from Brazil (MM1) and Farmtrac 70 from India (EE1).
5.6.5 OC5: Tractors on irrigated rice and sugarcane (medium/large scale)
Here productivity for both paddy and sugarcane is much higher than OC4 because of the
reliable supply of water throughout the year. The soils are deep and heavy and so
machines with horsepower greater than 70 are usually popular. Four Wheel Drives are
134

preferred to prevent slipping. Rice farms produce about 25 bags of paddy per acre each
season. Sugar content for sugarcane is also relatively stable during the harvesting
period.
Table 5.7: Photographs of the selected machines for comparison
Siam Kubota- Thailand Amec-ChinaKubota-Japan
SwarajFarmtrac-45
MF-Brazil MF- PakistanValmet Finland
Farmtrac70 (India)New Holland (EU)
CATIC (China)New Holland (EU) New Holland Turkey) New Holland (India)
Source: Compiled from field photographs plus web-based sources dealers, 2012
Natured Markets (MM) Technologies Emerging Economies (EE) Technologiesmade in the
Northmade in the South adapted to EE-
made in the SouthEE made in the South
135

Typical tractors for comparison under this OC are New Holland (Italy/UK) - MMO, New
Holland (Turkey/Brazil)- MM1, New Holland (India) EE1 and YTO (China) - EEO. Other
machines which could have served an equal purpose are Kubota tractors from Japan,
John Deere from the US or India and Sonalika from India. But Kubota tractors are poorly
supplied locally while John Deere, especially those of Indian origin and Sonalika are
relatively new to the market. Table 5.7 presents pictures of the various capital goods to
be compared under each of the operating conditions discussed above.
5.7 Conclusion
So far we have established that plant growth requires a good seed bed prepared with
human, animal or mechanical power. When farms become commercial and there are
labour constraints, mechanical power can help. Land preparation is the most common
activity in which farmers are likely to mechanize. Off-farm activities like transportation
and processing are also seeing significant levels of mechanisation within the sample.
Different crops grow under either rain-fed or irrigated systems. Predominant soils on
non-irrigated fields are light to medium in texture. Those on irrigated fields are medium to
heavy textured gradations. Three of the study regions (Dodoma as a whole and Manyera
and Iringa, in part) match the rain-fed, light to medium textured soil classification.
Morogoro and Mbeya fit the irrigated systems with medium to heavy textured soils.
Nevertheless some parts of Iringa also fits the latter classification while at the same time
some parts in Morogoro and Mbeya are found somewhere between the two extremes.
Depending on the soil type and the farm size, particular specifications of farm machinery
(power tillers or tractors) are required to produce adequate draft. With adequate power
the farmer can complete tillage practices on time. Good soil regimes for plant growth and
development are also guaranteed if the farm power is able to break all clods and level
the soil to prevent water stagnation. The size of the machine (horse power), the quality of
the machine (in terms of the material used for its fabrication) and finally the technology in
136

use (whether it is four wheel drive or not or whether the implements draw energy direct
from the engine or they are pulled by the machine in motion) generally affects power tiller
and tractor performance during usage.
To meet the tillage technology requirements for the different agro-economic
classifications, the farmer has two broad categories of farm machinery to choose from:
advanced country technologies which we classify as MM and developing country
technologies, denoted EE. Machines from the two sources are not the same in character
and it is this distinction in character that this study seeks to delineate, and consequently
examine their effects on low income households.
To understand how distinctive these machines are, we set up a discussion in the next
two chapters (using the matrix in Table 5.8), considering MM power tillers verses EE
power tillers and MM tractors verses EE tractors. Under these two broad categories, the
study further classifies two sub-groups. The sub-groups reflect the country of origin of
soft and hard components of the technology. The study emphasises penetration levels,
mode of diffusion and technical differences relating to efficiency and quality of these
techniques.
Table 5.8: Analytical matrix
Scale of technology
SourceIVM EE
MM0 MMi EE! m m o
Power tillersTractorsMM-Matured Markets; MM0- MM technologies made in MM; MMr MM technologies made in EE EE- Emerging Markets: EEi-MM technologies adapted to EE: EEn- EE technologies made in EE
Source: Generated by author, 2013
137

Chapter 6 : Technology Transfer, Diffusion and Penetration
6.1 Introduction
In a perfectly competitive capital goods market, different dealers (importers and
distributors of power tillers and tractors) are expected to interact with manufacturers to
respond to user needs. In this competitive world, there is a general assumption of the
existence of perfect knowledge: importers know the needs of the users and the users in
turn know the characteristics of the capital goods. Thus, by liaising between
manufacturers and users, importers balance supply both in terms of quality and quantity.
Farmer demand for capital goods with a peculiar bundle of features is influenced by their
own characteristics embedded in farm size, soils and farming systems. The financial
position of the farmer cannot be overlooked. That is, for farmers to access these capital
goods, they need money. These financial resources can be generated from the farm
business through savings or sourced from elsewhere.
In instances when the farmer cannot find the capital themselves, some form of financial
intermediation is required. Thus financial institutions such as commercial banks,
cooperatives and money lenders are also important in this process of technology
transfer. At the very least, importers of power tillers and tractors will require some form of
financing, especially if manufacturers do not advance stocks on credit. Even if they did,
other expenses for transporting and clearing the goods from the port must be paid for. As
we shall see in this Chapter, the need for financing the technology transfer process at
the importer; distributor; and farmer level is key, and requires innovative ways especially
in a capital constrained country like Tanzania to make it successful.
Government agencies are also expected to protect the interests of importers and users
by playing a refereeing role that ensures markets operate effectively and standards are
maintained. In this instance product standards rather than process standards are very
important (Kaplinsky, 2010). We argue in this chapter that either by design or
circumstance, central government participation in the tractor technology transfer process
138

has not always allowed for a free market environment. For a large part of the tractor
technology transfer history of Tanzania; central government has been very active. The
consequences of being a player and a referee cannot be over emphasized. This status
quo is however changing with time.
This chapter builds on the foregoing arguments by discussing the technology transfer
process from the two main sources delineated in chapter 6 , (MM and EE) and the
associated transaction costs. An attempt is then made to characterize the distribution
networks which importers use to promote the technologies, emphasizing the strategies
adopted by government and private sector actors and the signals transmitted by
manufacturers and users within the system. We also examine the level of penetration of
MM and EE machines in the framework of small machines (power tillers) and large ones
(tractors) nationwide and within the sampled farms. Activities of the machinery testing
unit in the country and how it is affecting the value chain is then presented. Before the
chapter is concluded, the sources of finance and the costs associated with them as
farmers purchase capital goods are also discussed.
6.2 Mode of technology transfer and diffusion
There are three general ways through which technology can be transferred from one
country to another: aid, trade and foreign direct investment. Licencing is also noted as a
fourth channel (as a form of FDI) (See Chapter 3). These modes are however not
mutually exclusive. When the technology has arrived in the destination country, a
network of distributional infrastructure or system is then required. These processes of
transfer and diffusion of technology can be systematically planned and executed. In
other instances, the process is not planned. The process may evolve depending on how
actors in the system respond to supply and demand forces. In the case of Tanzania, with
reference to power tillers and tractors from MM and EE sources, each of the three
modes of technology transfer (aid, trade and FDI) have played different roles to different
extents in making MM and EE technologies available on the market and farms. In this
139

sub-section, we describe these modes in a historical perspective and the extent to which
they have varied over time and space.
6.2.1 Tractors
Four wheeled farm tractors have been in use on Tanzanian farms since the second half
of the 20th century. Throughout the last six decades, the trajectory of technology transfer
strategies can be classified into two waves: pre- and post- the Structural Adjustment
Programme (SAP). Before the 1990s, decisions on whether to import tractors or to
produce them locally was centrally planned and controlled by government agencies, with
little emphases on private sector participation. At best private sector participants were
agents of the government, if they were given any role at all. However, during the
structural adjustment period, the emphases shifted from state led activities to private
sector led growth with central government only facilitating the process. Here we discuss
the role that aid, trade and FDI has played in transferring tractor technologies from MM
and EE sources into Tanzania.
a. Aid
The aid landscape for tractor imports was dominated by Japan during the pre-SAP days.
In the 1970s and 1980s, the Japanese development agency, JICA, assisted the
Tanzanian government to develop the Lower Moshi Irrigation Scheme20. As part of this
project the Japanese also made available to the Tanzanian government about 400
Kubota tractors over the period (Key informant interview the director of KATC, 2012).
Though the quantities of such gifts have declined in number over the years, the
Kilimanjaro Agricultural Training Centre21 continues to benefit from such aid
arrangements. These tractors given to Tanzania through aid are of the MM classification
and are very robust. After several years of use, most of these Kubota tractors were
20 This is a rice irrigation scheme managed by farmers with government assistance in the Moshi area21 It is an institution set up through collaboration between the Tanzanian and Japanese governments to provide short term training for extension workers in the production of paddy rice.
140

auctioned by government to farmers. Most of the farmers are still using those tractors
today, though spare parts are difficult to find.
In recent years, 2009 to 2012, India has become the main source of aid to Tanzania in
terms of the importation of tractors. There is however some difference between the
Japanese and Indian aid. While the Japanese aid was a gift and they specified the kind
of equipment they gave as a gift, the Indians gave the Tanzanian government a soft loan
and allowed them to use it to import any tractor they considered appropriate for their
situation and purpose from India. Thus the Indian aid had some level of flexibility and
responsibility attached to it. First because the choice of technique was only constrained
by the country of origin, but not the quality, cost and scale. Second, because the
Tanzanians were going to pay back the loan, they had to develop a strategy that would
ensure that farmers who took the machines could make good use of them and pay back
within a specified time frame. We therefore see a gradual shift from aid as charity, as in
the case of the Japanese, to the development of commercial entrepreneurs in the Indian
case.
b. Trade
In the 1950s, prior to independence, foreign owned private commercial farms were the
main importers of tractors; mainly to cultivate cash crops like tea, coffee, sisal, tobacco
and wheat. After independence, in the early 1960s, commercial Tanzanian farmers of
medium to large scale used tractors to cultivate maize in Iringa, wheat in Arusha and
Cotton in Shinyanga. These farmers were encouraged by the newly independent
government through easy access to land and the fact that they could either buy second
hand tractors from foreign commercial farmers or import units from abroad on their own.
In addition to access to credit from cooperatives, the national development credit agency
and a few private tractor dealers on the local market also helped farmers in obtaining
imported tractors (Key informant interview with operations manager of the AITF, 2012).
With most of these settler farmers being European and as an example to the emerging
141

local farmers, almost all of the tractors used then were from Europe (MM). In addition,
tractor manufacture in India and Asia in general (apart from in Japan), was at the infant
stages, and just entering the second decade of production. Direct participation by the
Tanzanian government was minimal in the process of importation of tractors at this time.
Between 1965 and 1970, central government took an active role in importing and
distributing tractors to state farms and village development block farming schemes. Both
MM and EE machines were imported, though the EE ones were very few. Generally,
most state farms imported MM machines directly from the manufacturer or through local
agents. Friendship farms (mainly developed by the Chinese for Tanzania) imported EE
tractors from China.
The period between 1970 and 1984 saw the Tanzanian government becoming the sole
importer of tractors and they did so mainly through trade. Most of the imports undertaken
by government then were from MM sources (Great Britain, Japan, USA and Germany). A
few tractors were however imported from EE sources mainly India.
Post structural adjustment trade and imports of tractors saw reduced central government
participation. However in cases when government participated, the machines imported
were mainly from India. A typical example is the Escort brand of tractor imported from
India through government assistance and sold to farmers in the 1990s. During this period
new tractor companies were registered and companies dealing in other vehicles opened
tractor departments. While some of the old companies continued to import MM brands,
the new participants typically with Tanzanian-lndian owners, concentrated on importing
EE brands from India. Other companies which had previously folded up re-entered the
market; a case in point is Hughes Motors in Arusha.
c. FDI
In 1985, imports of tractors from abroad into Tanzania were stopped. This was in
conformity with an import substitution strategy adopted by the country. The Tanzania
142

Tractor Manufacturing Assembly Plant (TRAMA) was set up in 1982 as a joint venture
between the State Motor Corporation and the Valmet Tractor Company of Finland.
Valmet by our broad categorization is an MM tractor. The share capital of the Tanzanian
government was 90% and the remaining 10% was held by the Finish Company. The
production of Valmet tractors at the plant started in 1983. Between 1983 and 1989, the
company produced a total of about 2,300 tractors, peaking in 1985 at 730 units a year. In
the first two years, the company assembled parts imported from Finland. In the ensuing
years, it started to incorporate locally made parts into tractors.
With the country returning to a free market economy in the 1990s, and demand for
tractors (estimated at 1,500 to 2,000 per annum) outstripping Valmet’s Tanzania based
plant’s ability to supply (of about 300 to 700 units per annum), other private companies
were allowed to import tractors again (TRAMA, 1989). In 1995, Valmet had stopped
tractor production altogether, since those imported were cheaper and arguably much
more reliable. Since, then the country has yet to see another foreign direct investment
that targets the local assembly or production of tractors. There have however been
discussions in 2011 by M&M Tractors, an Indian company, to start the assembly of
Mahindra Tractors in the country.
Thus while the pre-SAP period witnessed FDI as a significant player in the tractor
technology transfer in Tanzania, the post-SAP period has seen very little cross country
partnerships to produce tractors locally. We observe trade playing a key role in the
technology transfer process in both the pre- and post-SAP periods. Today, more than 7
out of every 10 tractors in the country came in through open market transactions. Non
governmental organizations like churches importing tractors for their farms mainly target
MM sources through trade. Aid is also important and we also find FDI contributing to the
process of technology transfer especially during the pre-SAP days. See Table 6.1 for a
summary.
143
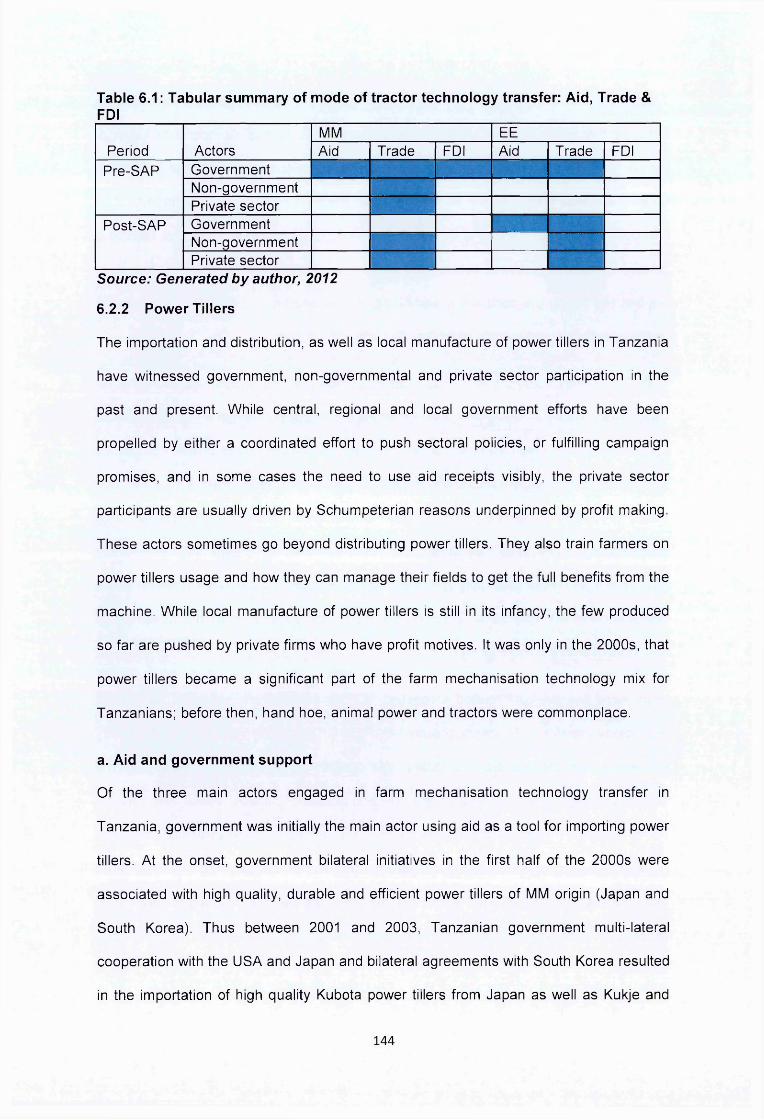
Table 6.1: Tabular summary of mode of tractor technology transfer: Aid, Trade & FDI
Period ActorsMM EEAid Trade FDI Aid Trade FDI
Pre-SAP GovernmentNon-governmentPrivate sector
Post-SAP GovernmentNon-governmentPrivate sector
Source: Generated by author, 2012
6.2.2 Power Tillers
The importation and distribution, as well as local manufacture of power tillers in Tanzania
have witnessed government, non-governmental and private sector participation in the
past and present. While central, regional and local government efforts have been
propelled by either a coordinated effort to push sectoral policies, or fulfilling campaign
promises, and in some cases the need to use aid receipts visibly, the private sector
participants are usually driven by Schumpeterian reasons underpinned by profit making.
These actors sometimes go beyond distributing power tillers. They also train farmers on
power tillers usage and how they can manage their fields to get the full benefits from the
machine. While local manufacture of power tillers is still in its infancy, the few produced
so far are pushed by private firms who have profit motives. It was only in the 2000s, that
power tillers became a significant part of the farm mechanisation technology mix for
Tanzanians; before then, hand hoe, animal power and tractors were commonplace.
a. Aid and government support
Of the three main actors engaged in farm mechanisation technology transfer in
Tanzania, government was initially the main actor using aid as a tool for importing power
tillers. At the onset, government bilateral initiatives in the first half of the 2000s were
associated with high quality, durable and efficient power tillers of MM origin (Japan and
South Korea). Thus between 2001 and 2003, Tanzanian government multi-lateral
cooperation with the USA and Japan and bilateral agreements with South Korea resulted
in the importation of high quality Kubota power tillers from Japan as well as Kukje and
144

Daedong power tillers from Korea. These power tillers were distributed to farmers under
a subsidy at about half the actual price (Key informant interview with a retired
mechanisation expert in Morogoro, 2012).
In 2009 and 2010, using a grant from the Indian government, the Tanzanian government
imported Greaves power tillers (an EE category) from India through Noble Motors
Company Limited and Suma JKT22. These power tillers are of intermediate quality and
durability. Thus while in the early years, central government aid agreements centred on
high quality and high cost power tillers, we see a shift towards relatively lower cost and
lower quality ones with emphasis on cheaper capital goods in order to share the benefits
between as many farmers as possible. Occasionally, aid agencies like DFID imported
and distributed power tillers to farmers through aid. The private sector has rarely been
involved in aid as a tool for the importation of power tillers. Thus while the pre-2005
imports through aid targeted MM machines (from Japan and Korea); the post 2005
importations were from EE (specifically India). Chinese power tillers have not been
involved in aid during the period under consideration. It is evident, at least in the
instances discussed here that the source of power tillers transferred to Tanzania through
bilateral or multilateral aid receipts depends more on the source of the aid, and not
necessarily what is fit for purpose.
b. Trade
Trade is by far the most important mode of power tiller technology transfer. Estimates by
experts in the field suggest that it could account for more than 80% of total imports. The
private sector is the main actor using this mode. Their emergence was in response to a
latent demand created at the end of government collaborations with the American,
Japanese and Korean governments. The private sector began importing low quality, low
cost machines from EE (mainly China, and sometimes India), in significant volumes after
22 Suma JKT is an arm of the Tanzanian military engaged in trading in the country. The Tanzanian government sourced a loan of $50m from India. The money was advanced to Suma-JKT to procure and import 1868 tractors and about 400 power tillers from India in the year 2010.
145

2003. The main objective of the private businessmen and women then was to create
access to power tillers which would undercut the ones imported and subsidized by
government in terms of pricing, and also overcome some of the challenges faced by MM
machines such as availability of spare parts (Key informant interview with an importer of
power tillers in Dares Salaam, 2012).
The private businessmen and women envisaged that without government subsidies,
resource constrained peasants could not afford the Japanese and South Korean brands.
In addition, dealership rights from Kubota, Daedong and Kukje were difficult to obtain
compared with Chinese manufacturers. Furthermore, Kubota especially would not
advance stocks until full payments are made for every product in a consignment. Dealers
acknowledged the high quality of MM products, but the size of their business capital and
the characteristics of the markets (farmers) did not encourage this technology source.
The most common brand which dominated this wave of imports, and continues to
dominate the power tiller landscape in Tanzania today is the Amec power tiller from
China. One prominent importer and distributor, Auto Sokoini Limited led the importation
and marketing of the Amec brand. In the past ten years both the company and the brand
have become household names. Auto Sokoini Limited has been in the agricultural
machinery (especially small shelling machines) business since the 1990s. The company
secured the distribution rights from Changzhou Agricultural Machinery and Equipment
Ltd of China (AMECCO). Auto Sokoini Limited had been in business with AMECCO
since the early 1990s. With the privatization of AMECCO in the 1990s in China, new
management wanted to diversify by moving into the production of small diesel engine
tractors and generators. Auto Sokoini found itself in a market where the demand existed
for such capital goods, but supply was very low. The main Japanese sources were at
that time unwilling to give distribution rights to local dealers. As in the words of one
leading industry informant,
146

“...they (the Japanese) were afraid of counterfeits and they were not also willing to give their technology out on a silver platter” (Source: Field interviews, 2012).
This link with AMECCO by Auto Sokoini encouraged other businesses to import various
brands of power tillers from China. Most of these brands had spare parts which could be
cannibalized for others from the same country. In addition, some private importers
transferred JST Shakti power tillers from India to Tanzania during the same period. The
Indian machines were generally of higher quality and higher cost, compared with the
Chinese ones, though these specifications were lower quality compared with the Korean
and Japanese machines.
Since 2006, though Amec’s prominence has not declined, some traders imported
relatively higher quality machines from Thailand (Siam Kubota). The Siam Kubota is not
as robust as Kubota, Daedong or Kukje, but better than Amec and JST Shakti. It is
produced by the Kubota Company in collaboration with Siam Cement Company in
Thailand. It is a reduced form of the Kubota power tiller with some of the original features
simplified. The manufacturing process has also been made more labour intensive,
compared with what is produced in Japanese plants where production is highly
automated and robots do most of the assembly. With this arrangement, it became easier
for Farm Equip Limited, a Tanzanian company to obtain the dealership rights for these
power tillers from Thailand. Thus presently, it competes with Amec on the Tanzanian
market. Other brands from India are not in keen competition because of the numbers
supplied.
In 2009 the government legislated that each district in the country should procure
between 20 and 50 power tillers and subsequently make them available to farmer groups
on a credit basis. To respond to this demand, the private sector operators who won the
bid to supply these power tillers mainly imported EE ones from China. Specifically
Chinese brands like the Changfa and Dongfeng have been the most popular under this
programme.
147

c. FDI
Partnerships and Transnational Co-operations manufacturing power tillers in Tanzania is
non-existent. Power tillers are generally used on small farms, ranging from an acre to
about ten acres in size. Investors coming from outside of Tanzania will do not operate on
such small scales usually preferring to invest in large scale commercial farming
operations. FDI features less as a mode of transferring power tiller technologies from any
of our two main sources, MM and EE. However, one commercial farm controlled by
Indian investors is known to import power tillers from China to be distributed to out-
growers on their scheme. Apart from this case, foreigners participating in food production
in Tanzania rarely import walk-behind tractors for use on their farms.
Table 6.2 gives an idea of the different actors and the modes of technology transfer they
have used to import power tillers from MM and EE sources and how it is changing over
time. Trade dominates the mode of imports, followed by aid, with FDI rarely playing a
role. Of all the power tillers in use in Tanzania today, more than 90% were brought in
through trade by the private sector.
Table 6.2: Tabular summary of mode of power tiller technology transfer: aid & government support, Trade and FDI
Actors Trade TradePeriodGovernmentNon-government2000 to 2005Private sectorGovernmentNon-government2006 to 2011Private sector
Source: Author, 2012
On the whole, the search by both private and public institutions for an optimal kind of
power tiller for the Tanzanian market has followed different paths. There is however
evidence from casual empiricism to suggest that government, non-government and
private sector actors are converging in terms of choice of technique since the latter part
of the 2000s. While government initially begun with aid as a main tool of importation
148

(concentrating on MM machines), today it is involved in a bundle of both aid and trade
emphasizing intermediate techniques whose quality and cost lie between MM and EE
specifications. What remains unchanged is the use of financial instruments (subsidies) to
make technologies more accessible to resource constrained farmers. Private businesses
on the other hand have used trade over the entire period, starting off with low quality and
low cost machines. Presently, power tillers imported through trade by the private sector
encourages medium quality and cost, though low quality and low cost machines continue
to dominate the market. FDI as a means of technology transfer is generally negligible or
non-existent.
The patterns observed here in terms of time line and phasing are similar to experiences
in other Asian countries like Bangladesh where the use of power tillers is quite popular.
First, high quality Japanese power tillers are promoted through aid. Private sector
dealers observe the interest of users and also acknowledge their purchasing power and
bring power tillers from China which is relatively cheaper (50% of the Japanese prices).
These are then followed by Korean machines, but in relatively small quantities. The
quantity of machines brought in from China is expanded and then finally other suppliers
from India and elsewhere including China are introduced into the country. (Biggs et al.,
2002)
6.3 Importer, distributer and farmer linkages
There are over 40 companies currently importing and distributing agricultural machinery
(including power tillers and tractors) in Tanzania. Of these, 12 are very active in terms of
quantities imported. The head offices of these companies are mostly concentrated in Dar
es Salaam, the economic capital, and some in Arusha, an important trading and
agricultural centre in the northern part of the country. There are also a few companies
head-quartered in Morogoro, a region singled out as the grain basket of the country and
Tanga, in the north eastern part of the country. While some of these companies have
149

metamorphosed from state owned enterprises after the inception of SAP into privatized
firms; others are private companies which have existed for several years.
In recent years, some companies have also sprung up in response to the national
mechanisation drive. There are two main types of companies undertaking the business
of importing and distribution of tractors. The first small group consist of those whose
main business is farm machinery only. The second group is made up of companies
engaged in the dealership of general automobiles and have departments responsible for
tractors and power tillers. There is however a third category which has strong
government support and linkage: Suma JKT, an arm of Tanzanian military which has
been involved in the bulk import and distribution of tractors since 2010. However, Suma
JKT’s presence on the tractor market is unlikely to continue when the government grant
they are operating with runs out. Generally, older companies participating in the
Tanzanian tractor market have a higher tendency to import from MM sources, whiles
newer firms are more EE oriented.
The three categories of companies described above have networks of dealers across the
country. The older companies have their own sales centres in Tanzanian cities; the
newer and younger firms usually form alliances with already existing businessmen and
women who are interested in selling their products. Suma JKT on the other hand adopts
both market structures having its own sales centres and alliances with interested
distributors across the country.
Worthy of note is another group of companies, mainly family businesses which specialise
in the importation of spare parts for various brands of power tillers and tractors from both
MM and EE sources. Such companies are usually located close to the farming centres
so that farmers can reach them easily. They also have a network across the regions and
some of them have been operating for more than three decades. It is a requirement by
the Tanzanian regulatory framework for all licensed importers to have a minimum
150

number of distribution networks to facilitate after sales services. However, such
infrastructure is poorly developed. Dealers argue that it is difficult to comply with this
requirement. They argue that the levels of demand are not high enough to provide a
critical mass that will support sales and service centres in each region. In the words of
one dealer:
“...the highest number of tractors and power tillers I have sold in a year is 60, coming to an average of 2 per region across Tanzania. Imagine I had a sales and service centre in those regions, it would be impossible to finance the housing, labour and taxes associated with it. That is why we ask the owners and users to give us a call when there is a problem; then we can dispatch technicians in a day or two to handle it for them” (Key informant interview with a marketing and sales manager of a tractor importing company in Dar es Salaam, 2012).
Generally, sales agents and service centres for MM power tillers are fewer than those
trading in EE power tillers, mainly because of the capital requirements. Nevertheless for
tractors, it is easier to get access to spare parts for MM machines than the EE ones
because of the long standing presence of the MM dealers. The opposite is true for the
power tillers: access to spare parts for MM brands is very difficult, because the
distributors are fewer and the imports are also low. The power tiller units from EE
sources and their spare parts are ubiquitous because there are many distributors spread
across several districts and communities. In addition spare parts for different brands from
China can fit one another. MM importers are most often prepared to give tractors and
power tillers to distributors without having to make full payments on condition that the
distributors’ premises are insured and able to provide the technicians who can give after
sales service.
These requirements make it difficult for medium sized distributors across the districts to
have the capacity to distribute these machines. To get around this problem, especially in
the case of MM power tillers, the importers work together with co-operative societies
across the regions which can facilitate the bulk purchase by members through loans
secured from commercial banks. Such loans are sometimes taken from SCCULT, an
151

umbrella group of all cooperatives in the country. In this way, the importer is able to
deliver in bulk a number of power tillers to the co-operative group for onward distribution
to interested members.
The difficulties associated with securing a right to distribute MM tractors, is making them
quite unpopular of late. Thus most of the buyers nowadays are very large scale
commercial farms. The only exception is one company in Morogoro which sells second
hand MM machines which has over the years created a relationship with farmers that
allows them to import machines based on what the farmer specifies.
The case of EE tractors and power tillers is quite different. For the tractors, the importers
either establish a full sales centre in the district where demand is highest or form a
strong alliance with already existing distributors of other brands. A case in point for the
former is Swaraj Company in Kibaigwa in the Dodoma region. An example of the latter is
Agripak Tanzania Ltd which imports Massey Ferguson tractors from Pakistan23. The
company operates a central depot in Tanga but with 3 networks in the regions where
they are particularly active (that is Iringa, Morogoro and Dodoma).
In the specific case of EE power tillers, it is essential to emphasize that except for those
facilitated by government importation; very few of them are sold on credit. Thus
distributors generally buy them with cash at wholesale prices in Dar es Salaam and bring
them into their districts (localities) for onward sales to the farmer. Another informal, but
significant arrangement through which local dealers sell EE power tillers to farmers is to
give them out on credit without any down-payment just before the cropping season
starts. This arrangement is undertaken in the hope that at the end of the season the
farmer will pay with proceeds from his/her harvest. It is typical for small scale paddy
23 These tractors came into Tanzania between 2009 and 2010. The machines breakdown often especially in areas where the soil is heavy. Recently a delegation from the company in Pakistan visited Tanzania to take soil samples that will be used for improving machine quality through laboratory tests (Key informant interview with a spare parts dealer in Morogoro, 2012)
152

farmers to access this facility. In addition to this, the main importer, Auto Sokoini Ltd, has
representation in 5 regions and has plans to expand in the near future to others.
6.4 Dealers’ transactions costs
In a capital constrained environment where farmers wanting to buy capital goods are
mostly poor, attempts to curtail auxiliary costs in the marketing and distribution of
products is important. Distributors pass on all transaction costs to buyers. Thus
examining the sources of additional costs could serve as a first step for cost minimization
as an attempt is made to create access for the poor. There are six main costs associated
with the importation, marketing and distribution of power tillers and tractors in Tanzania:
transportation and duties; warehousing; advertisements; and servicing (in the case of
machines sold under warranty); testing and certification in the case of new model
introduction; and management and other auxiliary labour costs.
The costs of transportation are twofold. First is the cost of shipping from the country of
origin and second is the cost of transporting the machine from the point of sale to the
farmers’ farm. Companies importing power tillers and tractors generally agree that it is
more expensive to transport them from MM than from the EE, with the exception of
Japan and Korea. On average, a 40 foot container filled with tractors from Europe,
America or Brazil costs about $8,000 to $10,000 to transport and takes an average of 4
to 6 weeks to arrive in Tanzania. A similar container from Asia on average costs $4,000
to $6,000 to transport and arrives within 3 to 4 weeks after it has been dispatched.
Another difference between the two sources is the fact that MM suppliers always have
stocks, and so as soon as an order is made, it can be dispatched.
The EE markets rarely keep inventory and they will only produce when an order is made.
The fact that EE manufacturers only produce when an order is placed means that it can
take up to a month or two before a consignment is dispatched especially if it is a
153

complete tractor unit or a spare part which is not very common. This automatically evens
out the time lags.
In terms of local transport within Tanzania, farmers who buy their equipment through
loans have it delivered to their homes or in some cases a central point in their village and
the cost is worked into the acquisition cost. Farmers buying machines with cash from
importers, distributors or local dealers have to make their own transportation
arrangements and this can cost up to an additional 2% of the value of the equipment
(Survey data, 2012). Other costs associated with local transportation are the risks
associated with highway accidents which can cause machinery damage beyond repairs.
In the absence of insurance to cover goods in transit, the dealer bears the total cost of
such damages. EE distributors are usually susceptible to this risk, since the importers
rarely take charge of such transport arrangements.
On the issue of duties and taxes, agricultural machinery in Tanzania is import duty and
VAT exempt. In addition, spare parts worth 10% of each tractor or power tiller imported
are also duty and VAT free (at the time of writing this thesis). Though importers are
generally comfortable with port arrangements in Tanzania, some asserted that they have
recently noticed long delays in clearing their goods. Specifically they refer to the time
when import and VAT duties were lifted from agricultural machinery. The impact of these
delays on the importer is the need to pay for housing of their consignment at the port for
as long as it is not cleared. They argue further that when the goods stay in the port for a
long time, the accumulated housing fees take a chunk of the benefits they derive from
the tax exemption and they have no other means of recouping that money than to pass it
onto the farmer.
Warehousing and office spaces costs are not necessarily dependent on the origin of the
machine. There are however higher risks associated with losing more expensive
machines to theft or fire outbreaks from MM sources than those coming from EE. Thus
154

insurance for more expensive machines in storage are consequently higher because
they are computed on the basis of their market value.
Advertising is also a crucial aspect of the job of importers and distributors and requires
labour and capital. The main modes of advertising by importers and distributors are
through television, radio, newspapers and brochures. Some companies also engage in
active campaigns moving from village to village to speak with farmers about what they
have in stock for sale on market days. Another important mode of advertising is through
national agricultural and industrial exhibition shows. Throughout the period of this
research, I found that intensity of advertisement by newer firms dealing in EE machines
was higher than MM ones and their presence at two national exhibitions I attended were
very visible. It was clear that to compete with the already established MM brands, they
had to do more in terms of making farmers aware of what they stood to gain if they
bought from them as first time tractor owners, or switched over, if they are already used
to an MM brand. Older companies selling household brands barely advertised. Some
distributors give conservative estimates of advertising costs as being about 1 % of the
value of each machine sold but also stated that this falls as the brand and model
becomes popular among users.
Usually when new machines are sold, the seller gives a warranty of between one and
two years. This warrant entitles the buyer to full repair and replacement of parts at no fee
if there is a problem with the machine within the period. However technicians would have
to establish that such a breakdown is as a result of factory defect and not user
negligence. Both tractors and power tillers of MM origin have this kind of warranty in
Tanzania. However, though tractors of EE origin have warranty, the power tillers do not
always have it. Thus, for Amec users for instance, if there is an engine failure in the first
year, they have to bear the full cost of repair and spare parts replacements. Though
importers and distributers see meeting the demands of warranty as an important cost,
155

several users who have had to make claims said the service support usually comes too
late and the farmer would have already found and paid for a solution.
A final but controversial cost associated with the import of a new model is testing of the
machine to ensure that it meets the minimum safety and quality standards as specified
by Tanzanian law. CAMATEC is a government agency situated in Arusha charged with
testing agricultural machinery including tractors and power tillers. The controversy arises
from the fact that even though such testing is required by law, it is not being enforced
and the certificate is only required when the importer wants to participate in a
government procurement tender or bid. Thus the basic tenet of the law to safeguard the
interest of farmers is not enforced. While some importers go through the laborious and
expensive process of having to give one unit of the new model they intend to import to
the testing agency and paying for the fuel and spare parts as the testing is carried out for
about 6 months to one year, others do not. It has, in effect become voluntary. The results
of such tests are rarely published and so farmers do not get the opportunity to make a
choice based on such information.
Officials at the testing agency however mentioned that importers of the MM machines
usually comply with the testing requirement and even generally incorporate any changes
or improvements required as specified by the test report. There are five testing officers at
the agency. All five obtained their testing training from Japanese Institutions. This thus
leaves the question of whether they are suitably equipped enough to test machines
manufactured outside Japan, especially Indian and Chinese machines in the face of
changing technology and a world where cost innovation may sometimes mean
concealing the effects of some reduction in material quality or other more detailed
processes such as hardening of metals.
156

6.5 Penetration and extent of use
Depending on the interaction between supply and demand factors, different technologies
are diffused to varying extents across and within regions. While profitability in use,
access and availability of particular technologies at any one point in time may explain
why they get diffused, sectoral policies by central government also affect the nature and
extent of diffusion. In the case of Tanzania, as clearly mentioned in Chapter 1, MM
machines dominated the market between 1950 and 2000. Thus MM machines were the
main capital goods which were popular among farmers then. However, in the 2000s
there were new entrants from the EE in significant quantities. In this section the level of
penetration of technologies from the two sources (MM and EE) is examined. The
discussion is undertaken with reference to the pre-SAP and post-SAP periods for
tractors; and before and after 2005 for power tillers, using a snap shot for each reference
period.
6.5.1 National level penetration of power tillers
With less than 100 power tillers on Tanzanian farms in the year 2000, their population
increased by about 50 fold reaching the 5,000 mark at the end of 2012 (Focus group
discussions with mechanisation experts at the MOFAC, 2012). About 25% of all power
tillers in the country today are found in the Mbeya Region and specifically in the Mbarali
District where they are mainly used on paddy fields. At the onset, when the technology
was being introduced in the early 2000s, it was dominated by MM machines mainly from
Japan and South Korea. Thus in 2002 when the population of power tillers was about
350, more than 95% of them were from Japan and South Korea with the Japanese
Kubota dominating the landscape. During this time the Kubota power tillers were evenly
spread across several districts in the country. The most popular South Korean brand
then was the Kukje, which was mainly concentrated in the Morogoro Region. At the time,
there were few EE power tillers, representing less than 5% of the entire population. The
common EE brand then was Amec from China with negligible numbers of JST Shakti
157

from India (Key informant interviews with deputy director at the mechanisation
department, 2012).
In the ensuing years, the number of Kubota and Kukje power tillers stagnated, and their
proportion in the population diminished. Other brands like Daedong from South Korea
were introduced, but did not gain much prominence. The number and proportion of EE
machines, especially Amec, continued to rise overtaking the MM brands in 2004. Other
brands like JST Shakti from India continued to grow albeit slowly. The introduction of
Siam Kubota in 2007 (from Thailand), a reduced from of the Japanese Kubota, also
gained some popularity among farmers who were members of cooperatives. It did not
however gain as much momentum as the Amec. At the end of 2012, the picture had
changed with seven out of every ten power tillers coming from an EE source. Figure 6.1
gives a snapshot of the population dynamics of power tillers in 2002 and 2012 by their
country of origin.
Figure 6.1: Penetration of power tillers in Tanzania by country of origin, 2002/2012[%L
-Q
(/>q5
Q _ CDEo 3
cz O o w00
75cCDQ_
90.080.070.060.050.040.030.020.0 10.00.0 ■
w2002
H2012
Japan SouthKorea
Thailand
Country of origin
China India
Source: Key informant interviews at the Mechanisation Department o f The Ministry of Food, Agriculture and Cooperatives, 2012
6.5.2 National level penetration of tractors
Between 1989 and 1998, the brands of tractors which dominated the Tanzanian farming
landscape did not change much. Over the period, more than 95% of all tractors in use
158

had MM origins. MF and Ford from the UK and Valmet from Finland constituted more
than 65% of the entire population. CASE and John Deere from the USA were also
important constituting about 15% of the population. Other MM brands were Fiat, SAME,
Deutz and Kubota. The odd one out then was Swaraj, the only EE brand from India
representing about 4% over the period. Thus key brands on the market were from
Europe, USA or Japan in the 1990s (Mpanduji, 2000). See Figure 6.2.
Figure 6.2: Penetration of tractor brands in Tanzania by country of origin, 1989/1998 (%)
COnootoLU
.QCO
c
H1989
a 1998
UK ITALY GER FIN USA Japan India SwazilandCountry of origin of brand
Source: Ministry o f Agriculture, Livestock Development and Cooperatives, 1991/1999; Clarke, 2008
With the production of MF, Ford and Fiat curtailed in Europe, the importation of both
brand-new and second-hand versions of these brands into Tanzania stalled in the 2000s.
Production centres of MF and Valmet moved to South America, specifically Brazil and
Argentina. Trade relations between Brazil and Tanzania were not very developed then,
and so over time importation of such brands were also curtailed. American farms also
grew in size, consequently CASE and John Deere products also became bigger in scale,
making them unattractive for the relatively smaller farm sizes in Tanzania.
What finally triggered a gradual shift in the choice of technique was the opening of plants
by New Holland (as a result of Ford/Fiat/New Holland merger) in Turkey and India and
by John Deere in India and China. In addition, some companies like Massey Ferguson
also licensed plants in Pakistan and India to use their technology and in some cases also
159
their trade names. Though not openly accepted by manufacturers under such licensing
arrangements, distributors and users observe that the quality of products from these
newer production plants in EEs is not as high as those from their original plants in
Europe. In addition, traditional brands in India like Escorts also expanded output and
consequently exports. Mahindra, a very popular brand in India is however yet to gain any
real footing in the Tanzanian market.
These developments, together with cost innovation coming from the EE sources led
several importers to consider doing business in China, India and Pakistan. Thus in 2011,
when the number of tractors in use in Tanzania stood at 8,466, more than 35% of them
were estimated to have come from China, India and Pakistan. Today some of the old
stocks of Massey Ferguson, Ford, Fiat and Valmet are still operating and some
commercial farms also continue to procure the new makes of CASE, John Deere (USA)
and New Holland (Italy), however at a reducing rate. The share of MM machines is
diminishing over time as farms now replace old MM stocks with EE ones, except for very
large farms whose orientation are yet to change (though some of them are now doing the
number crunching in terms of what is profitable). Emphases is now being placed on EE
machines and this emphases was given a further boost in 2009 and 2010 when central
government assisted the importation of 1,486 units of Farmtrac tractors and about 400
units of New Holland tractors, all from India.
6.5.3 Penetration of power tillers within study sites
Power tillers in the study area in the case of MM were dominated by Siam Kubota from
Thailand and for EE by Amec. This finding generally mimics the national situation, in
which the dominance of EE power tillers; specifically Amec was evident in the previous
section. This provides evidence that different technology trajectories dominate the stage
at different times. See Table 6.3.
160

Table 6.3: Power tiller utilization across study sitesSource Category Country of origin Brand name Frequency PercentMM MM0 Japan Kubota 4 4.21
MMi Thailand Siam Kubota 32 33.68
EE EE-i India Greaves 3 3.21EE0 China Amec 57 59.00
Total 95 100Source: Field Work, 2012/2013
6.5.4 Penetration of tractors within study sites
The distribution of tractor makes across the study sites is shown Table 6.4. MM
machines are dominated by Ford, MF and New Holland. There are two main countries
from which Tanzania imports EE tractors: India and Pakistan. The most common brands
from these two countries dominating our sample are Swaraj, Farmtrac and Massey
Ferguson. There are more brands coming from India than from China. It must however
be mentioned that there are other brands like YTO, KAMA and Europard which originate
from China but these are yet to gain the popularity possessed by those from India and
Pakistan.
Table 6.4: Tractor brands within sample by country of origin (Frequency and Percent)Broad Detailed Country ofcategory category origin Brand name Frequency PercentMM MM0 USA IH/CASE 3 3.06
Japan Kubota 2 2.04UK Ford 10 10.20
Massey Ferguson 8 8.16New Holland 1 1.02
Italy Same 1 1.02Fiat 7 7.14New Holland 1 1.02
Finland Valmet 5 5.10MM-i Brazil MF 1 1.02
New Holland 1 1.02Turkey New Holland 4 4.08India New Holland 3 3.06
EE EE-i India Powertrac/Farmtrac 14 14.28TAFE 1 1.02
Pakistan Massey Fergusson 9 9.18
oLUHI India Swaraj 24 24.49
Escort 3 3.06Total 98 100
Source: Field Work, 2012/2013
161

6.5.5 Extent of use: a micro level discussion
In Chapter 5 we established that though power tillers and tractors can be used for
primary, secondary, post-harvest and off farm-activities, farmers rarely achieve full
capacity utilization. We noted that most users of power tillers and tractors concentrate on
land preparation activities and in some cases transportation of farm produce (The World
Bank, 2012). We also mentioned that in communities which are not connected to the
national electricity grid, some owners generate power with their tillage equipment by
connecting them to dynamos. Field maintenance, plant protection and post-harvest
practices are on the low side in terms of tractor and power tiller use. Figure 6.3 gives an
idea of the proportion of farmers in our sample using their machines for various farm
activities. This was generally consistent across regions. Across regions, the activities for
which farmers use their machines for do not differ significantly. There is a difference
however, in the way farmers with different crop types use the machines - maize farms
mostly use their tractors for dry ploughing. On sugar cane farms, the machines are
mostly used for sub-soiling and wet ploughing. Rice farms used them for ploughing and
rotavating whilst tobacco farms typically used the tractors for dry ploughing and
harrowing
Figure 6.3: Respondents using their tractors and power tillers for various on-farm and off-farm activities (%)24
s? 100 — 80 E 60 g 40 E 20 £ 0 I I I11 « . . . . il
2 2 2 2 2 E E E E E s'I i I f 4 J H I MS i 2o 8 2 2 1 1 | I I 11 ! i ! I •= i f s8. * S ^ S x % s I r ° p ?2 o 5 ‘1 i f I f
eg■8rr
Primary farm (Land preparation) Secondary farm Post-harvest Others
On-farm Off-farm
■ Tractors ■ Power tillers
Source: Field Work, 2012/2013
24 In to ta l the sample size is 193 (95 power tille r owners and 98 tractor owners)
162

For the purposes of land preparation, MM and EE machines can perform to varying
degrees of intensity, quality of output and efficiency. Sub-soiling or chisel ploughing
requires very robust machines and so power tillers are rarely used for that purpose. For
tractors to efficiently work on sub-soils, especially on irrigated fields very stable tractors
are required. The stability of EE tractors during such activities is relatively lower
compared with MM tractors. Thus for good sub-soiling work using tine cultivators MM
tractors are mostly recommended. One main problem encountered by EE machines
during sub-soiling is the loss of a firm grip by hinge bars connected to the implements.
There is also a tendency for the tines to merely scratch the top soil rather than turn the
sub-soil because not enough torque is transmitted to the power take off.
In the case of dry ploughing and wet ploughing, both tractors and power tillers are used.
However on very dry soils, EE tractors are likely to lose some fragile parts during
traction. Thus though the quality of output in terms of the physical appearance of the soil
after dry ploughing by EE and MM tractors may be comparable, the impact on the capital
good itself after the farm operation varies. For example, while an MM machine used for
dry ploughing in very heavy and dry soils will rarely break any hinges or drawbars in the
first 6 to 10 years of use, it is very common to find it happening in EE tractors during the
first 18 months of usage.
Thus to successfully use EE tractors for ploughing before the rains, which is a prudent
thing to do, requires very experienced operators who correctly set the furrow depth,
plough direction and speed so that excessive pressure is not placed on parts which are
susceptible to frequent breakage. In other instances some owners adopt a strategy of
replacing these susceptible parts with genuine MM spares before they start using their
tractors to prevent such breakages. Though the MM machines are better for dry
ploughing, except for extremely harsh soil characteristics, the EE ones are also being
used, with little or no differences in the quality of work but require more time and
163

patience, and sometimes extra repair cost to get the work done with minimal damage to
the capital good. However, if the moisture content of the soil is high enough, say after the
first three rains in the season then, the EE tractors can manage the process with less
difficulty.
Using the power tiller for dry ploughing can be very cumbersome, especially EE power
tillers at the very low end of quality. Thus while some Indian made power tillers can be
successfully used for dry ploughing, Chinese ones are rarely successful. The challenge
here is also related to the potential damage to delicate parts. The low quality of the
materials used in making these EE machines mean that even a very small amount of
stress on them leads to break downs. Thus for most users, only the MM power tillers are
used for dry ploughing. The MM power tillers produce very good tillage, and at the same
time the risk of machine damage is reduced to the barest minimum. In addition, MM
power tillers are faster during dry ploughing, saving labour cost in terms of time, and
getting more acreage tilled per day. Here even if there have been some rains, EE power
tillers are still fragile when used for ploughing.
MM tractors do better when rotavating on irrigated paddy fields than EE ones (Key
informant interview with mechanisation officer in the Kongua District, 2012). Thus MM
tractors are more popular on such terrains. They are less likely to slip during usage on
wet grounds. The design of the wheel system also helps to minimize the likelihood of the
machine sinking. Though very high end (quality wise) power tillers like Kubota, Daedong
and Kukje (MM) can perform rotavation better than Amec (EE), they are rarely used in
such circumstances mainly because they are not easily found on the market. Siam
Kubota (MM) can be used to rotavate; however the quality of tillage25 is not as high as
the others, including Amec from China. Because harrowing and levelling exerts relatively
25 The implement is not propelled by the engine but by the motion of the machine and as such the draft force produced is not high enough to pulverize the soil and debris into a very fine texture.
164

less stress on capital goods, the use of MM and EE machines for this activity depends
on what is available to the farmer and not the requirements of the operation.
6.6 Financing investment and running costs
Procurement of farm machinery and its transportation from the point of purchase to the
farmers’ home requires capital outlays. Running costs including fuel and oil, as well as
operator fees and maintenance of the machinery require money. The sources of capital
for the farmer are mainly savings from their farm business and non-farm businesses,
loans from family members and sometimes friends. These modes of finance are
informal. Some farmers also obtain loans without interest from traders who sell the
equipment. Other groups of farmers finance the procurement of their equipment from
formal loans obtained from commercial or development banks. These loans may come
with intermediaries such as cooperative societies, district assemblies, input support trust
funds and special private agricultural support units.
Operational costs were usually handled with revenue accruing from the use of the
machine- contract hiring. It should be noted here that for many farmers, benefits accruing
from hiring out their machines rarely covers the investment cost. Thus, farmers see
contract hiring as a subsidy or a kind gesture to other small farmers, and must be
compensated for by government. The inability of farmers to cover the investment cost
through hiring out is greater when dealing with very large tractors: at full capacity
utilization, most power tiller brands, regardless of their source are profitable, but the
same cannot be said of four wheeled tractors. As we shall see in Chapter 8 , using the
current market prices paid for an acre of tillage work done by a tractor the service does
not breakeven. Most owners considering this kind of service provision to other farmers
are not likely to breakeven over the entire life of the machine at current real interest rates
of 8.05%. For those farmers who do not hire it out at all, but use their tractor or power
tiller on their own farm, the capital and running costs for the machine were allocated as
part of the farm budget and paid for with revenue from the previous years’ earnings.
165

An interesting observation made during the field visits was a gradual shift of large scale
settler farms especially in the tobacco growing areas from owning their own tractors to
hiring from other rural entrepreneurs. This may be signalling that the price per acre of
tillage in most places where this study was carried out is sub-optimal and clever farmers,
even if they did have the capital to invest in machinery will not do so but hire from others
who might have not taken the time off to do the necessary computations. It is in the light
of these and other issues that the Private Agricultural Sector Support (PASS) initiative
which links farmers with markets has evolved in Tanzania to help farmers develop
feasible proposals as they attempt to source money for financing farm machinery
procurement.
6.6.1 Savings from farm businesses
A substantial proportion of the farmers in our sample (159 out of the 194 machines
bought) financed the procurement of their equipment with their own funds accrued
usually from the sale of their farm produce for between two to four seasons. This group
of farmers financing their investment cost with their own savings were usually those
buying power tillers of Chinese origin in the absence of warranty.
Relatively bigger and more successful farmers tend to import their own tractors from
Europe, usually second-hand machines which had been used for about three to four
years. This practice was common in the Mbeya area where irrigated rice fields were
common. There were also a number of farmers especially in the Babati area who went to
Zambia and Kenya to buy second tractors being disposed-off by large commercial farms.
In such cases transactions are on a ‘cash and carry’ basis and financed using savings.
The savings are sometimes complemented with loans from family members.
Large commercial farms with a long and established history of doing business with the
manufacturing companies of tractors, usually receive new models of the machines from
the manufacturer to be tried for a period. If they are happy with the model, they go ahead
166

and buy them; using farm profits to cover some of the cost and the manufacturer also
gives them additional machines to be paid for over an agreed term, usually with little or
no interest.
6.6.2 Savings from non-farm business
The rural economy of Tanzania is rarely anything but agriculture. Formal sector workers
such as teachers, health officers or workers at the district assemblies also invest in the
rural economy. There are also rural businessmen and women engaged in trading,
transportation and housing services who may also double as farmers. Such people
sometimes finance the procurement of farm equipment (tractors and power tillers) with
income from the non-farm activities they participate in. Households owning farm animals
may also sell off a number of their farm animals in order to buy a tractor.
For the formal workers, they are able to either save towards the procurement of the
equipment or finance a debt using their status as a government employee to secure a
loan. For retiring civil servants or formerly employed private sector workers, some of
them use their pension benefits to pay for farm equipment. Others in the informal sector
use profits accruing to other businesses they operate to buy tractors and power tillers. In
instances as those elaborated here, the farmer may complement what they are able to
raise personally with other formal credit lines from commercial and development banks.
6.6.3 Borrowing from family and friends
The nature of farming in the study areas is a household based activity. Thus as young
men and women grow up and become of age, their fathers especially, help them to
establish their own farms by supporting them to acquire the requisite farm tools,
especially in the rice growing areas. Usually such support given to young people by their
parents is not a gift; they are to pay back within a period of one to four years. They are
not always completely sufficient to buy the farm equipment and so the young person
must have also raised some money from his or her own farm to augment what is coming
167
from their parents. Such arrangements are rarely with interest, but come with informally
agreed conditions that the machine will be used first to complete family member plots
before being hired out to other people.
Friends, who are in most cases also farmers themselves, provide financial support when
one decides to buy a machine. This support does not always come in the form of money.
It can relate to the transferring of their second hand machines to the prospective buyers
and allowing them to pay for it over time. There are instances when there is a down
payment required before the buyer takes the machine with payment of the remaining
amount settled over a specified time with or without an interest.
6.6.4 Loans without interest from local traders
For small machines, especially those from China without a warranty and sometimes
some Indian machines (EE), some local dealers give them to farmers to use for a season
and afterwards pay back without any initial down payment. This arrangement is usually
based on trust and a long relationship between the farmer and the seller. Some sellers
undertake such arrangements if they know that the farmer has unsold farm produce in
their barns that they can easily get police (court) order to confiscate if the farmer
defaults.
As one trader at Rujewa, the district capital of Mbarali, made me aware:
“...such arrangements usually do not go bad, the farmers make good of their promise and so the relation and goodwill continue.” (Key informant interviews 2012)
It is a very flexible means of financing the investment cost by farmers, and as the seller
puts it in the above quote, for very serious farmers, hiring out the power tiller alone in
one season alone can cover the acquisition cost. If they are unable to cover it with
income from hiring, then they would have to find additional money obtained from their
own harvest.
168

6.6.5 Loans from commercial banks without intermediaries
Commercial banks like Cooperatives Rural and Development Bank (CRDB), National
Microfinance Bank (NMB) and National Bank of Commerce (NBC) and others have
financial facilities that are available to farmers who want to buy farm machinery. Such
credit lines were very popular in the 1980s and 1990s. In those days, cost of such credits
ranged from 6% to 20% interest rates (Survey Data, 2012/2013). However since the
2000s such arrangements were curtailed. This curtailment was warranted by commercial
banks’ effort to mitigate risks associated with direct lending to farmers. Thus members of
farmer groups or those identified with the Private Agricultural Sector Support (PASS)
initiative stand a better chance of obtaining a bank loan for machinery purchases. Whilst
in the past there were facilities for financing second hand machines, current attention by
commercial banks is on brand-new ones. With the quality of tractors generally declining
on the Tanzanian market (as suggested by distributors and users), it is rare to find a
commercial bank which is willing to finance a loan for second hand machinery, though in
some cases as suggested by most sellers, some of the second hand machines are of a
higher quality than the new ones (Key informant interview with the director of a company
which imports second hand tractors from Europe in Morogoro, 2012).
In instances when the commercial bank decides to lend to a farmer directly, then they
must do the due diligence themselves to establish that the farmer actually qualifies for
the loan. This usually adds to the cost of capital. Therefore most banks are now shying
away from this system and shifting the investigation assignment that establishes the
credit worthiness of the farmer to cooperative societies, district assemblies, the
Agricultural Input Trust Fund (AITF) and Private Agricultural Sector Support (PASS)
initiative.
6.6.6 Loans from commercial and development banks with intermediaries
In the 2000s, there was a general recognition that commercial banks were not allocating
enough money to the agricultural sector. Prior to that government anticipated such a
169

future happening and so set up the Agricultural Input Trust Fund (AITF) which was
hitherto mainly involved in farm inputs like fertilizers and seeds. With a renewed
commitment, the AITF redirected some of its funds to finance agricultural inputs. With
demands rising, and the AITF unable to meet all such demands, central government
decided to start an agricultural development bank to meet farmers’ needs.
Again, the funds for capitalizing an agricultural development bank were not easily
available. The initial quantum of money raised by central government was given to
Tanzania Investment Bank (TIB). TIB is an established development bank and it was
tasked to operate this fund off its balance sheet. Characteristically, TIB has urban-based
branches. To create farmer access, the bank formed a network with other banks which
have more branches across the country. Therefore, TIB lends to other commercial banks
at 4% or 5% for onward lending to farmers between 8 and 10% interest rate.
The relationship between commercial banks and farmers is no longer a direct one. The
farmer must develop a business plan with the help of the PASS initiative, AITF or their
cooperative society. Feasibility studies, land titling and proof of enough assets to be
liquidated to cover the loan in case of default are carried out. For farmers wanting to get
loans for a power tiller, they must be cultivating at least 10 acres of farm land and for
those wanting to buy tractors; they should have at least 40 acres under cultivation. This
entry requirement cuts off some poorer households from ever owning machines if their
intention is to do so through a credit line. As we shall see in later Chapters, an important
characteristic of poor households, as opposed to non-poor households is the quantity
and quality of their production asset and this effectively affects their savings and the
propensity to accumulate funds for the procurement of capital goods (Sarris et al 2006).
Table 6.5 gives an idea of the sources of credit used by MM and EE capital goods
owners in financing their investment. Out of the 194 power tillers and tractors under
study, 51 of them were obtained through loans. The most important source of credit to
170

MM users in our sample as a proportion of those using credit is cooperatives (56%). This
finding is consistent with the stand point of executives of a cooperative society in
Ubaruku, who posited during a focus group discussion that after careful research and
consideration, they found that MM power tillers were ideal for their operating conditions
and for farmers to be able to pay back their loan, they need power tillers of such quality
and durability. Thus, all the 35 machines they have financed since 2006 were of MM
origin (Key informant interview with the secretary of Ubaruku SACCOS, 2012).
Government sources of credit such as district assemblies and the AITF are also very
important for EE owners financing their investment with loans (30.77%). In an interview
with an official at the AITF, he mentioned that usually when farmers are asked to get
quotations from sellers when they apply for loans, they usually bring in invoices from
traders who sell EE machines. They, at the AITF do not put any restrictions on farmers’
choice, but probably because the EE machines are cheaper, farmers find it easy to make
the 20% down payment required.
Table 6.5: Sources of credit for farmers purchasing their machines with debtSource of Credit MM (%) EE (%) Combined (%)Commercial banks26 20 23.1 21.6Cooperatives 56 7.7 31.4Government27 0 30.8 15.7Friends 8 7.7 7.8Relatives 8 26.9 17.6Distributors/dealers 8 3.8 5.9Total 100 100 100
Source: Field work, 2012/2013
6.7 Conclusion
In relation to the three constituents of technology transfer and diffusion (importation,
distribution and usage), various actors play different roles either in a solitary or
interactive way with a view to maximizing their utility as government, NGOs, businesses
or users (mostly farming households). While the objective of government is to use fiscal
and monetary policies to influence the way market systems work, with a view to protect
26 Commercial Banks here include NMB, TIB, CRDB and NBC27 Government sources is defined to include District Councils, Suma-JKT and Agricultural Input Trust Fund
171

consumer welfare, businesses respond to such government stimuli to maximize
marketing margins. The users (who in our case are farmers) are price/product takers in
most instances. For example when a farmer in the Turiani area was asked why he chose
to buy the kind of tractor he is using, he responded by saying that:
“...this is what the government agents had on sale, and the financial institution which provided the loan was prepared to finance a transaction supported by government: actually I had no choice...giving the choice I would have gone for something else...” (Survey response from a farmer in the Turiani area, 2012)
Having established the value chain that is responsible for the transfer, diffusion and
penetration of MM and EE mechanisation technologies and the role various actors play
and the mechanisms these actors employ to accomplish their roles, we now turn our
attention to the distinctive nature of characteristics embodied in the technologies in the
next chapter. An attempt is made to delineate the engineering and economic
distinctiveness of the alternative techniques and how these differences make them
suitable or otherwise for different users. We also discuss the productivity ratios (of
investment/capital, labour and output) and economic rates of return or profitability of
investment associated with different categories of tillage techniques, mainly defined by
the origin of the soft technology and where the hardware is produced.
172

Chapter 7 : The Distinctive Nature of Capital Goods
7.1 Introduction
This Chapter assumes that the origin of the power tiller or tractor technology influences
its engineering, physical features and engineering performance. Manufacturer
differentiation affects the physical, inherent efficiency and costs associated with any
power tiller or tractor from a particular country of origin. The characteristics of a power
tiller or tractor reflects the social, economic, institutional standards and industrial
governance of the source of innovation (Ruttan, 2001). Manufacturers consider the
characteristics of local demand: focusing on the purchasing power of users and
standards regulatory regimes impose. The endowments, capabilities and knowledge
base of the industrial sector of the country of origin are also crucial. It determines the
character of technologies that are developed. Invariably what is sold to the farmer in
Tanzania reflects the cultural, social, and economic as well as factor endowments of the
country of origin and the characteristics or business objectives of importers and
distributors within the value chain.
For a critical examination of the distinctiveness of the various strands of techniques, we
make a comparison of their engineering and quality features, building on details outlined
in Chapters 5 and 6. This then naturally leads us into a discussion of the coefficients of
production. The physical productivity ratios are determined by the output generated in
relation to the labour and capital consumed per season28 and where relevant on a per
acre basis. To get an understanding of how well a particular category of technology is
doing or otherwise, technical efficiency measures are compared across power tiller or
tractor groupings (Stewart, 1977).
Beyond the technical characteristics of the capital goods is their profitability for users. To
assess the Net Present Values (NPV), costs and benefits streams associated with each
28 In our case the season consists of all farm and non-farm activities carried out with the capital good by the farmer 12 months before the day of interview.
173

category of technology is calculated. They are thus compared using the real interest rate
for Tanzania (8.05%). The associated benefit-cost ratios (BCR) are also computed.
These computations are made with the five operational conditions outlined in Chapter 6
in mind: first, power tillers on paddy fields (small scale farms); second, tractors on maize
fields (small, medium, large); third, tractors on maize and tobacco fields (medium and
large scale); fourth, tractors on upland rice and sugar cane fields (small, medium and
large scale) and; fifth, tractors on irrigated rice and sugar cane fields (small, medium and
large scale). In addition, one sensitivity analysis is estimated. This sensitivity scenario
assumes that current government subsidies on all the machine categories under the five
operating conditions are removed, and a similar computation for NPV and BCR is
undertaken. All computations in this chapter and those that follow are presented in
Tanzanian Shillings (TSH). At the time of the data collection in 2012, £1.00 was
equivalent to TSH2380.00. In addition each computation is presented reflects both the
actual and rated capacity utilization of each capital good under consideration. The actual
computations are based on the observed utilization levels during the season under
consideration whilst the rated scores are based on the maximum potential utilization
levels of the machine.
The discussions in this chapter are in two tiers. First, engineering and quality
distinctiveness, which essentially reflects factory level differences, are discussed. They
are presented using the aggregate means of MM0, MM-i, EE-i and EE0 categories in the
sample. Performance computations (productivity ratios, gross margins and benefit-cost
analyses) are presented using specific examples of brands of MM0, MMi, EE-, and EE0.
The objective for this analysis is to assess farmer benefits when they choose an MM or
EE machine. The second objective is to establish the economic outcomes of alternative
choices under particular farming systems. We begin in section 7.2 by giving a general
overview of the field survey. Some characteristics of the participating farmers are
discussed, laying out the background of their regions, crops, soils and farm sizes and
174

other features pertaining to access. We shall expand this discussion on farm household
characteristics in the next chapter when the effects of choice on poor and non-poor users
are discussed.
7.2 The field survey
As we saw in Chapter 4, 194 capital goods were surveyed. These 194 machines
belonged to 192 farmers. Of these, 115 had EE origins, with the remainder coming from
MM sources. By scale, there were 95 and 99 power tiller and tractor units respectively in
the sample. As shown in Table 7.1, there were 36 MM power tillers and 59 EE ones. A
similar sub sample was drawn for tractors, with MM and EE machines comprising 43 and
56 respectively. In total, 192 machine owners and caretakers were interviewed across
five regions. Two respondents had more than 1 machine in the study. A majority of the
power tillers studied were located in the Mbeya region (57) and a greater number of the
tractors were located in the Dodoma region (43). The remaining power tillers and tractors
spread across the other three regions. Officials and workers in a large scale sugar
plantation with over 5029 tractors in use were also interviewed in the Morogoro Region.
The four main crops grown by respondents were maize, rice, sugarcane and tobacco. A
few of them cultivated pulses and vegetables. In order of importance, each farmer was
asked to list three crops he/she cultivated in the previous season. For power tiller
owners, the main crop they cultivated was rice. Only a handful cultivated maize,
regardless of the source of the machine. In the case of tractors, we find that users of MM
capital goods mostly cultivated rice as their most important crop, followed by maize. On
the contrary, most EE tractor users, cultivated maize as the most important crop,
followed by vegetables and pulses. In the case of sugarcane and tobacco cultivation as
main crops, more MM users participated than their EE counterparts. Thus generally, MM
machines especially at the large scale level concentrate more on cash crops while the
29 These 50 tractors are however not included in the survey
175

EE ones concentrates on food crops- an observation which may have pro-poor
implications (See Chapter 9).
Table 7.1: Users, crops, soils, scale and origin of machines coveredMM EE
Variable MM0 MM1 EE1 m m o TotalScale Power Tillers 4 32 3 56 95
LocationTractors Power tillers
33 10 28 28 99
Dodoma 1 1Iringa T 2 16 19Manyera 1 8 6 15Mbeya 2 22 7 32 57Morogoro
T ractors- - 2 1 3
Dodoma 3 2 12 26 43Iringa 4 12 16Manyara 11 T 2 7 15Mbeya 7 7
Primary cropsMorogoro
Power tillers8 7 2 7 18
Maize 3 3Rice 4 32 3 51 90TobaccoSugar canePulses
Tractors- - - 2 2
Maize 14 2 15 23 54Rice 15 4 3 3 25Tobacco 1 2 2 0 5Sugar cane 2 2 1 1 6
SoilsPulses
Power tillers1 - 7 1 9
Sandy 1 3 7Loamy 2 5
Clayey T ractors
2 32 3 49 85
Sandy 14 2 15 23 60Loamy 2 2 9 1 5
Sample total
Clayey
CO
6 4 4
115
32
194MM- Matured Markets; MM0- MM technologies made in MM; MMr MM technologies made in EE EE- Emerging Markets; EEj-MM technologies adapted to EE; EE0- EE technologies made in EE
Source: Field Survey, 2012/2013
Considering the soils on which the machines are used, the study finds that most power
tillers, whether from MM or EE, were used on clay textured fields. A few of them were
176

used on sandy soils. By origin, tractors on the other hand had some differences in terms
of the soil texture on which they were used. While more MM tractors were found on clay
regimes, the EE tractors concentrated around loamy and sandy soils. See Table 7.1.
7.3 Basic engineering distinctions of capital goods
From field interviews in 2012, we find that on average, the age of the capital goods within
our sample were 3.4 years and 7.0 years for power tillers (n=95) and tractors (n=99)
respectively (Table 7.2). Within the origin sub-groups, the ages of power tillers and
tractors were significantly different at the 1% level. MM0 power tillers were the oldest (3.5
years), with EE-i machines being the least (2.3) in terms of age. For tractors, MM0 were
the oldest with an average age close to 14 years and the least were MM1t at 2.5 years
old; EE-i and EE0 tractors were aged between these two extremes, though much closer to
the minimum than the maximum.
These findings suggest that while MM and EE power tillers had comparable vintages,
tractors did not. That is to say, recent acquisitions of tractors by farmers were mainly
from EE sources. Thus whilst about a decade ago, more farmers within the sample
bought an MM machine, current trends show that procurement of EE tractors in the past
three or four years is on the ascendency. Aside from these vintage differences, there
were also engineering distinctiveness. We discuss these differences in the following sub
sections for MM and EE capital goods in turn and summarize some of the indicators in
Table 7.2. The information in these sub-sections is based on detailed information
received from field research in Tanzania in 2012/2013. Some sections are supported
with a review of relevant literature.
7.3.1 MM (MM0 and MMi) power tillers
MM0 power tillers had the lowest horsepower among the four categories (13.5Hp on
average). Their power-take-off shaft is located on the side of the machine and not at the
rear. Implements attached to MM0 power tillers were propelled by drawbar horsepower
harnessed from the engine and not the pull of the machine. MM0 power tillers are
177

believed by users to be assembled by robots and so the parts are well fitted together. In
addition, they are fabricated with metals of high carbon steel. In the estimation of users
and experts, these machines can be used for over 10 to 12 years, given adequate
servicing and maintenance. On the other hand, the average horsepower of an MM-!
power tiller was a little over 14Hp. For most of them in use today, they do not deliver
their power through the draw bar, but through the motion of the machine. However, there
has been a recent introduction of models which deliver their power through the drawbar.
Estimates by users suggest that Ml^h machines can be used for over 6 years without
major engine problems. For both groups of power tillers (i.e. MM0 and MMO the gears
within the engine and gear box are smaller in size and also hardened to produce a
higher power per unit of fuel combusted. They have faster speed, both on the road and
on farms when compared with EE power tillers. MM0 power tillers are however more
stable on the field than MM1f though they have comparable weights.
7.3.2 EE (EEi and EE0) power tillers
The EEi power tillers are also of the 14Hp range, on average, but slightly heavier in
weight than the MM models, though not as stable. Implements attached to them draw
power from the engine through the drawbar. They have an average economic life of
close to 4 years. The materials used in their fabrication and the robustness in terms of
how well the parts fit together are lower than the MM-i sub-group.
EE0 power tillers are by far the heaviest in weight and highest in horsepower (about
16Hp) on average. They however possess the lowest expected economic life of about 3
years, and this age attained only if used with a lot of care and consideration. According
to users, EE0 power tillers bought during the early 2000s had a longer lifespan than those
being imported today, though prices in real terms have not declined significantly. They
also draw power for the implements from the engine through a drawbar at the rear. The
fitting of parts especially within the engine and gear box is generally not well executed.
The carbon content of the metals used for casting parts is lower when compared with
178

other brands. These engineering defects generally cause a lot of leakages of engine oil
and grease during usage. In general, EE power tillers have a lower speed on rural roads
and on the farm as well. During usage, it makes a lot of noise, produces intense smoke
and generates a lot of heat. Some parts get ripped off easily and can cause injury to
users. It vibrates a lot, and creates discomfort for the user.
7.3.3 MM (MM0 and MM^ Tractors
MM0 tractors mostly had a horsepower averaging 70. They are usually FWA, but some of
them in the low horsepower ranges are 2WD (especially the very old ones). MM0
machines which are 80Hp and above are 4WD. The engine systems are typically four
cylinder engines and have an economic life of between 12 and 15 years with the need
for engine refurbishment at the end of every 6 to 8 years. They are relatively heavier
than the other sub groups and more stable when used on farms. Older vintages are very
robust and made up of extremely strong metals and operate with manual steering.
Newer vintages use power steering and more sophisticated electrical systems that can
allow for programming of the tractors with computers. These electrical additions
sometimes pose a challenge for mechanics during repairs.
MMi tractors are lighter in weight and less stable than their MM0 counterparts on
average. Those in our sample had an average horsepower higher than the MM0 ones;
about 77Hp on average. Typically, users of MM-i tractors estimated that they have an
economic life of about 8 years on average. They are mostly FWA or 4WD, and the
engine system is composed of at least 4 cylinders. Metals used in their fabrication are
not as robust as those of the MM0.
7.3.4 EE! and EE0 Tractors
EEi tractors had a horsepower of 62 on average and an expected economic life of a little
over 4 years. They mostly have four-cylinder engines, but a few of them have three
cylinder engines. They are mostly 2WD, but occasionally may have a FWA wheel
system. The teeth of the gears within the engine and gearbox are usually brittle and
179

often break during usage. They are quite stable, but some of the parts are relatively
fragile and are usually damaged on rough terrains. EE0 tractors dominating our sample
are somewhat different from the other groups in terms of the engine make-up. They are
usually three-cylinder engines constructed using the hammer mill30 principle. In this case
each of the cylinders can be serviced separately without the need to dismantle the whole
engine. Almost all of them are 2WD with a horsepower range averaging 48. They are
lighter in weight, with less stability compared with all the others and generally include
power steering. Gear boxes of most of these tractors were often too small to match the
engine of the tractor. Both EE-i and EE0 tractors produces a lot of noise during usage
(Table 7.2).
Table 7.2: Average age, economic life and horsepower by scale and category_____Scale Variable MM0 MM-i EE-i m m o Mean
Power Age (years) 3.50 3.53 2.33 3.39 3.41
tiller Economic life (years) 10.25 6.22 3.66 3.33 4.69Horsepower 13.50 14.13 14.00 15.92 15.16
T ractor Age (years) 13.97 2.50 3.46 3.81 7.00Economic life (years) 12.70 5.25 6.61 4.21 7.44Horsepower 69.21 77.00 57.68 62.39 48.62
Source: Field Survey, 2012/2013
7.4 Machine performance: land preparation, transportation and other uses
As we saw in Chapter 6, field operations adopted on farms in this study followed the
chain of activities listed in Table 7.3. Generally, for farm lands with heavy sub-soils, tine
cultivation (sub-soiling) is done first. On well drained sub-soils, ploughing is carried out
first (for all crops), followed by paddling (in the case of swamp rice and sometimes
sugarcane) or harrowing (for maize and tobacco fields). Paddling and harrowing are
sometimes followed by levelling, and for crops grown on moulded soils, ridges or
mounds are constructed using tractor or power tiller drawn implements when
construction is not manually done.
30 This type of engine, according to repairers in the study is very easy to service and maintain
180

With the land ready for planting, tractors and power tillers can be fitted with implements
that can sow seeds in rows (with precision) or broadcast seeds. For crops like rice,
especially when seedlings are used or sugarcane where the planting materials are
usually cuttings, they are either sown manually or with specialized planting machines.
These machines are not attached onto tractors or power tillers. Tractors and power tillers
fitted with pump-sets are also used to pump water from dams to irrigate crops. During
the growing period of crops, tractor or power tiller drawn implements can be used to
apply fertilizers, weedicides and pesticides. Mechanical weeding within rows of crops
can also be done using implements hitched on to the tractor or power tiller.
Table 7.3: Farm operations that tractors and power tillers can perform
Operation Stage of operation Activities
Sampled farmers (Count)
T ractors Power tillers
On-farm Primary farm Sub-soiling 5 0(Land preparation) Dry ploughing 98 60
Wet ploughing 80 65Rotavation/Paddling 45 80Harrowing 45 5Levelling 25 30
Secondary farm Precision sowing 0 0Irrigation 0 10Agrochemicals app 5 0Weeding 10 0Harvesting 12 0
Off-farm Post-harvest De-husking 0 0Shelling 10 0Grinding 1 0
Others Transportation 85 60Power generation 0 3
Source: Field Survey, 2012/2013
During harvesting, a tractor drawn trailer, moving in tandem with a combine harvester
serves as a bucket for the harvested crop. De-husking, shelling, grinding and winnowing
of grains can also be done with post-harvest implements hooked onto stationary tractors
or power tillers. Transportation of inputs onto the farm, and farm produce from the farm
to the farm house or the market centre is also carried out by these technologies. For
181

rural communities without access to electricity supply from the national grid, power tillers
are sometimes used to generate energy to power lights and other home appliances.
For the analyses of machine performance (which compares MM and EE tractors and
power tillers), the study concentrates on land preparation and transportation. The output
in terms of land preparation is captured using area cultivated. For transportation, total
earnings the farmer made from all transportation services sold in the season under
consideration are used. The time dimension of the analyses covers the activities for
which farmers used their capital goods in the year prior to my field visit (that is the past
12 months before the interview).
7.5 Output and coefficients of production
Power tiller operators in the sample spend an 8-hour day in the field on average either
ploughing or paddling. Sometimes, work goes on into the night to compensate for time
lost as a result of machine breakdowns during the day. Assignments needing urgent
completion are continued at night. The predominant operating conditions (hereafter, OC)
under which power tillers work is small scale paddy fields, which for the purposes of the
tables in this Chapter are designated as OC1 (Refer to Section 5.6 of Chapter 5). Under
OC1, we compare four power tillers: Kubota (MM0) from Japan, Siam Kubota (MM-i) from
Thailand, Greaves (EE-i) from India and Amec (EE0) from China.
A typical day for a tractor operator is 8 to 12 hours but some of this time goes into driving
the tractor from home to the field and loading the tractor with fuel and lubricants. When
tractors are faulty, downtime during usage may also take a significant amount of the
period. The operators may spend some time working at night, when they have contracts
far away from home. In other instances when there is an urgent need to complete an
assignment so as to move to another town or area the next day, night work may be
carried out. It will be difficult, and in some respect misleading to compare the
performance of tractors without recognising the fact that generally, MM tractors in our
182

sample work on relatively heavier textured soils compared with the EE ones, even under
similar farming systems. Thus average computations here are made in relation to the
area in which these tractors worked most of the time during the year. Thus as discussed
in Chapter 5, there are four typical OCs under which tractors work, which in our
tabulations are represented by OC2, OC3, OC4 and OC5. Under OC2, we have maize
being cultivated on largely sandy soils with legumes and pulses as intercrops. OC2 is
typical in the Dodoma area and we discuss two tractor models as alternatives: Farmtrac
45 and Swaraj (Medium sized tractors with horsepower between 40 and 49).
OC3 is predominantly sandy-loam to loam and they typically cultivate maize and tobacco
with vegetables as intercrops. In cases where the rains are bimodal, the maize crop is
cultivated twice in a year. Under this condition we compare Finish Valtra (MM0), Brazilian
Massey Ferguson (MM^ and Pakistani MF (EE^ - all in the medium sized tractor range
with horsepower between 50 and 65. For an EE0 alternative for OC3 we could have had
Mahindra tractors. However, they are very new on the Tanzanian market and so
respondents did not have enough experience to tell us about performance indicators for
computation of distinctiveness. OC3 are found mainly in Iringa and Babati regions.
OC4 consists of upland rice or sugar cane on heavy textured but relatively drier clays,
found mainly in Mbeya, Morogoro and Babati. The machines to be compared under OC4
are New Holland-ltaly (MM0), Massey Ferguson-Brazil (MM-i) and Farmtrac 70-lndia
(EEi). Finally, New Holland-ltaly (MM0), New Holland- Turkey (MM^, New Holland- India
(EEt) and YTO -China (EE0) are compared under OC5 where conditions are like OC4
except for the presence of artificial irrigation. Tractors under OC4 and OC5 mostly have
horsepower between 65 and 85 or sometimes even higher.
It must be emphasized that the tractor brands compared here are not the exhaustive list
from which farmers can choose. The list of brands and models of tractors being
compared here has been carefully selected by the author to reflect machines which were
183

known to, and used by, farmers for at least one year prior to the interviews. There are
some models which are not in themselves represented in the computations we make
here, but other models which find space in our tables serves as a proxy for them. For
instance, Farmtrac computations could easily be used as a proxy for Powertrac and
Escorts, since they all come from the same manufacturer and we can assume, are of the
similar engineering configuration with only slight differences. Similarly, Massey Ferguson
from Pakistan and TAFE from India can be substituted for one another provided their
horsepower ranges are similar.
In Table 7.4 and 7.5, we compare the performance of power tillers, using acreage
cultivated per man hour for each OC. Generally for power tillers in our sample, being
used under OC1, MM-i machines achieve the maximum average of acreage ploughed per
day (3.22) whilst EE-i machines paddle the largest area (2.91) per day. At the bottom, in
terms of acres ploughed and paddled per day we find EE0 and MM0 power tillers
respectively. However, in terms of the quality of ploughing, farmers generally prefer MM0
followed by MMi. MM0 again produces the best quality of paddling in the opinion of
farmers. This is followed closely by EE0. Labour requirements for a day’s full employment
of power tillers is highest for EE0 (2 men per day) mainly because of the weight of the
machine and the vibration levels experienced by the operator during usage which exerts
more pressure on the muscles of the operator compared with other categories of power
tillers. The number of operators used per day does not always effectively influence the
number of hours spent working per day since the operators sometimes work in turn,
though in most cases they both mind the machine throughout the usage period.
As one moves from MM to EE tractors, for all OC2 to OC5, there is a general decline of
acres tilled per day by the various brands under consideration, regardless of the
operating conditions. Variation in employment per day in terms of total men hired
depends more on the operating conditions rather than the specific brand. Consequently
as one moves from OC2 (sandy conditions) to OC5 (heavy clay), we see a rise in the
184

number of people employed per day. This in turn affects the man hours per day. On the
whole, we find that EE tractors are more labour intensive than MM ones.
Table 7.4: Tillage performance of technologies: output and labour inputs (ploughing)____________________________________________________
Variable MMo MMi EE-, EE0Power tillers
SiamKubota Kubota Greeves Amec
Output per day in acres (0) 2.84 3.22 2.46 2.2Average employment (count) 1.00 1.00 1.50 2.00Man hours per day (L) 8.00 8.00 12.00 16.00
OC1 Acres per man hour (O/L) 0.36 0.40 0.21 0.14Man hours per acre (L/0) 2.82 2.48 4.88 7.28Hours spent per acre (H) 2.82 2.48 3.25 3.64
T ractorsFarmtrac
Specific brands 45 SwarajOC2 Output per day in acres (0) 13.76 8.54
Average employment (count) 1.50 1.00Man hours per day (L) 12.00 8.00Acres per man hour (O/L) 1.15 1.07Man hours per acre (L/0) 0.87 0.94
Massey MasseyValtra Ferguson Ferguson
Specific brands (Finland) (Brazil) (Pakistan)Output per day in acres (0) 15.00 15.00 14.40
OC3 Average employment (count) 1.50 1.50 1.50Man hours per day (L) 12.00 12.00 12.00Acres per man hour (O/L) 1.25 1.25 1.20Man hours per acre (L/0) 0.80 0.80 0.83
NewHolland MF Farmtrac7
(EU) (Brazil) 0 (India)Output per day in acres (0) 10.78 8.00 7.00Average employment (count) 2.00 2.00 2.00
OC4 Man hours per day (L) 16.00 16.00 16.00Acres per man hour (O/L) 0.67 0.50 0.44Man hours per acre (L/0) 1.48 2.00 2.29
New New NewHolland Holland Holland YTO
(EU) (T urkey) (India) (China)Output per day in acres (O) 8.00 7.50 6.00 6.00
OC5 Average employment (count) 2.00 2.00 2.00 2.00Man hours per day (L) 16.00 16.00 16.00 16.00Acres per man hour (O/L) 0.50 0.47 0.38 0.38Man hours per acre (L/0) 2.00 2.13 2.67 2.67
MM- Matured Markets; MMo- MM technologies made in MM; MMr MM technologies made in EEEE- Emerging Markets EEi-MM technologies adapted to EE; EEr EE technologies made in EESource: Field Survey, 2012/2013
185

Table 7.5: Tillage performance of technologies: output and labour inputs (paddling and harrowing)_________________________________________________________Variable MMo MMi EE, m m o
Power tillers (paddling)Siam
OC1 Kubota Kubota G reeves AmecAcres per day (0) 2.67 2.78 2.91 2.72Employment (count) 1.00 1.00 1.50 2.00Man hours per day (L) 8.00 8.00 12.00 16.00Acres per man hour (O/L) 0.33 0.35 0.24 0.17Man hours per acre (L/0) 2.99 2.88 4.12 5.88
Tractors (Harrowing)Farmtrac
Specific brands 45 SwarajOutput per day (0) 14.00 12.00
OC2 Employment (count) 1.50 1.00Man hours per day (L) 12.00 8.00Acres per man hour (O/L) 1.33 1.50Man hours per acre (L/0) 0.75 0.67
Valtra MF MFSpecific brands (Finland) (Brazil) (Pakistan)Output per day (O) 18.00 18.00 16.00
OC3 Employment (count) 1.50 1.50 1.50Man hours per day (L) 12.00 12.00 12.00Acres per man hour (O/L) 1.50 1.50 1.33Man hours per acre (L/0) 0.67 0.67 0.75
NewHolland MF Farmtrac
Specific brands (Italy) (Brazil) 70 (India)Output per day (0) 15.00 15.00 12.00Employment (count) 2.00 2.00 2.00
OC4 Man hours per day (L) 16.00 16.00 16.00Acres per man hour (O/L) 0.94 0.94 0.75Man hours per acre (L/O) 1.07 1.07 1.33
Tractors (Paddling)New New New
Holland Holland Holland YTOSpecific brands (EU) (Turkey) (India) (China)Output per day (0) 14.00 13.00 12.00 12.00Employment (count) 2.00 2.00 2.00 2.00
OC5 Man hours per day (L) 16.00 16.00 16.00 16.00Acres per man hour (O/L) 0.88 0.81 0.75 0.75Man hours per acre (L/O) 1.14 1.23 1.33 1.33
MM- Matured Markets; MMo- MM technologies made in MM; MMr MM technologies made in EEEE- Emerging Markets EErMM technologies adapted to EE; EEr EE technologies made in EESource: Field Survey, 2012/2013
186

7.5.1 Revenue and costs
We now turn our attention to a discussion that examines the revenues and cost structure
of the different types of capital goods under the five OCs. The computations are done in
terms of actual and rated area cultivated (ploughing, paddling and harrowing) during the
season under consideration. The difference between the actual and rated work done per
season gives ample indication of capacity utilization of the various categories of
machines. In addition, a computation of the benefits31 realised from services rendered
with the machine is done. These services include transportation, water pumping,
shelling, grinding and power generation.
A model for the prediction of suitable field work days for agricultural tractors under
Tanzanian conditions was developed using historical weather data. The model suggests
that in the case of tillage operations, the work days vary between 19 and 50 days
(Simalenga T. E., 1989). In computing the rated revenue for each brand under the
various OCs, an average of the range of work days predicted (34.5 days) is used. In
computing the rated revenue, the study relies on simple proportions. The simple
proportion formulation assumes that the relationship between the area cultivated, cost
incurred in cultivating that area and the benefits realized have a linear relationship. This
may not be the case. But the current study does not have enough data to establish and
use an appropriate functional form for the three variables. In the next sub-section we
begin with an estimation of gross revenue.
31 Benefits that this study fails to capture include those from transportation activities on a farmers’ own farm.
While we tried to do so, it was very difficult for the farmers to recollect for instance transportation of their own
products using their machines and how much it would have cost if it was to be paid for. A weak proxy for going around this measurement problem was to multiply their farm output (bags of rice, maize, sugarcane or
tobacco) by the average cost of transporting each bag from the farm to the farm house assuming that all of them were indeed transported using power tillers or tractors. This strategy and assumption will however introduce data noise which we cannot assume to be randomly distributed. We therefore limit our comparison
to revenue from tillage activities (on own farm and contract hire services) and other activities, mainly
transportation of goods for others at a fee.
187

7.5.2 Gross revenue
On a per acre basis, whether ploughing or paddling, power tillers charge higher than a
tractor on contract hire because of the labour and time intensities. However, power tillers
on average charge higher prices for paddling than for ploughing. There are however
slight differences amongst the different categories of capital goods by origin. In the case
of hiring tractors, charges for ploughing and paddling are generally more expensive than
harrowing. In 2012 power tillers on contract high generated TSH55000 to TSH58000 per
acre whilst a tractor generates between TSH35000 to TSH36000 per acre on average to
the owner. These figures largely depend on the type of machine, the soils on which they
are working and the community. There are also significant differences in terms of the
amount charged for use of the different categories of tractors and relative to the
community in which they work.
There is ample evidence from the data to suggest that because power tillers generally
operate under similar soil conditions (clayey), the prices they charge are not particularly
affected by soil texture. The price charged is rather influenced by the degree of
competition between the machines in the community. That is, when supply is high, prices
fall and vice versa. However for tractors, as one moves from EE machines which are
mostly used on sandy soils to MM ones which are predominately found on clayey soils,
there is a gradual increase in the average charges, for ploughing especially. Based on
the per acre charge, reported cultivated area and benefits from other activities, revenue
realized per season for each of the four categories of machines, by scale, is estimated
for each OC. Figure 7.1 gives a summary.
Computations for both power tillers and tractors show that revenues obtained by MM
machines are consistently higher than the EE ones. This is an effect of both the average
price charged per acre and the total work done (acres tilled) during the season. These
revenue computations, in and of themselves are not enough grounds for justifying
economic profitability. We shall therefore proceed in the next three sub-sections to
188

discuss profitability in a more elaborate way. Attention is paid to the cost components
associated with these revenues. The impact of the lifespan of machines and the impact
of the degree and frequency of maintenance and repair have on the profitability is also
examined.
Figure 7.1: Gross revenue from land preparation, transportation and other activates by scale of machine and source per season (000,000 of TSH) _____
25
20oo
ooX 10COH 5
0
■ MMO ■ MM1 ■ EE1 ■ EE0
Source: Author’s computation, 2013
7.5.3 Cost structure: investment and running costs
a. Fixed costs (acquisition costs: historical and replacement)
Any measure of capital assumed here will raise a number of theoretical questions
regarding their comparability and homogeneity since the machines were bought at
different times in different markets (Stewart, 1977). Some of the machines are still sold
new, whilst others are no longer on the market. The number and value of implements
attached to each power tiller or tractor at the point of purchase was also different. In
addition some of the machines were purchased brand-new while others were second
hand. Users, who bought their capital goods on credit, may have different loan
arrangements. Consequently, this affects the interest to be paid (percentage and spread)
and the effective cost of the machine.
Actual Rated
189

The average ages of power tillers in the sample are comparable for both MM and EE
machines. That is their vintage are not significantly different. A bigger problem arises
when considering tractors. The average ages of MM and EE tractors are significantly
different. To deal with some of these challenges, in the first instance, the owners of the
tillage equipment supplied the acquisition costs. Second, information on current prices
was collected from distributors and regulatory authorities to serve as replacement costs.
To further adjust for differences at the purchasing point; the average cost of
transportation to the home of the user is also computed. In the case of this study, almost
all the machines in use still had a current market. Even though a few of them had
experienced some engineering modifications and could affect their current prices, the
study assumes that such changes are small and do not affect real prices significantly.
The average acquisition, transportation and replacement costs are presented in Table
7.6.
It is important to note here that the relatively low average cost of MM0 tractors should not
come as a surprise. Some of these machines were either obtained as second-hand or
even third-hand several years ago. Thus, even for those obtained as new machines,
their prices would have depreciated a great deal. The current prices however suggest
that MM machines have a consistently higher acquisition cost than the EE machines.
In terms of access, MM users generally travelled longer distances to buy their machine
compared with EE users. Power tiller users who had MM machines on average
journeyed about 329 km to buy their capital goods, while EE power tiller users travelled
273km. The difference in the distance was however not statistically significant at the 10%
level. Users of MM and EE tractors within the sample bought their equipment by
travelling an average of 252km and 171km respectively and the difference was
significant at 10%. Thus on the whole, users of EE machines have easier access in
terms of where sellers are located than their counterparts who use MM machines.
190

Table 7.6: Average acquisition cost32 of machines, by category and scale. (TSH 000,000)____________________________________________________________Technology/OC MM0 MMt EE-i m m o
Power tillersSiam
OC1 Kubota Kubota Greeves AmecTotal acquisition cost 8.73 7.73 7.44 3.65
Acquisition cost 8.71 7.68 7.36 3.57Transportation cost 0.02 0.05 0.08 0.08
Replacement cost 16.00 13.00 8.00 6.00TractorsOC2 Farmtrac 45 SwarajTotal acquisition cost 15.43 22.47
Acquisition cost 15.33 22.43Transportation cost 0.10 0.04
Replacement cost 18.00 24.00OC 3 Valtra (Finland) MF (Brazil) MF (Pakistan)Total acquisition cost 60.6 60.77 26.20
Acquisition cost 60.00 60.00 26.00Transportation cost 0.60 0.77 0.20
Replacement cost 65.00 68.00 26.00New Holland
OC 4 (EU) MF (Brazil) Farmtrac 70Total acquisition cost 65.6 60.77 24.93
Acquisition cost 65.00 60.00 24.83Transportation cost 0.60 0.77 0.10
Replacement cost 70 68.00 25.00New Holland New Holland New Holland YTO
OC5 (Italy) (Turkey) (India) (China)Total acquisition cost 65.60 50.60 44.63 22.60
Acquisition cost 65.00 50.00 44.00 22.00Transportation cost 0.60 0.60 0.63 0.60
Replacement cost 70.00 55.00 46.00 24.00MM- Matured Markets; MMo- MM technologies made in MM; IVIMi- MM technologies made in EEEE- Emerging Markets EErMM technologies adapted to EE; IEEo- EE technologies made in EE
Source: Field Survey, 2012/2013
Using the current prices, we find that the ratios generally rise for all machine categories;
both at the power tiller and tractor scale under the various OCs. Investment requirements
per unit of labour and output are also higher for MM machines than it is for EE machines
32 This is the same as the historical costs supplied by the farmers
191

regardless of the scale. On the other hand, EE machines are more labour intensive than
their MM counterparts.
Figure 7.2: Efficiency ratios using acquisition and replacement costs A. Acquisition cost B. Replacement cost
0.800.700.600.500.400.300.200.100.00
r n
i 1
1i t 1 11 i l
l i . 1 1 - i l l l f c it— CM CO Lfo o o o c o o o o c
Actual
) r- CM CO ^ in ) O O O O O ) O O O O O
Rated
■ MMO ■ MM1 EE1 ■ EE0
- CM CO M" LOO O O O OO O O O O
Actual
T— CM CO M- LX>o o o o oO O O O O
Rated
MMO ■ MM1 EE1 ■ EE0
0.90.80.70.60.50.40.30.20.1
0 E.- 1 I ii__I ■ a lix- CM CO M- Uo o o o c o o o o c
Actual
r~ CM CO M- LO> o o o o o ) O O O O O
Rated
MMO ■ MM1 EE1 ■ EE0
t- CM CO M-O O O O OO O O O O
Actual
CM CO M" LOo o o o oo o o o o
Rated
MMO ■ MM1 EE1 ■ EE0
35.0030.0025.00
^ 20.00
O 15.0010.00
5.00 0.00
*o
n r i i 1 1
3025201510
50
■ IV
CM co Lf) CM CO x r ino O O o O o O O O Oo O O o O o O O O O
M0Actual ■ MM1 EE1
Rated ■ EE0
i11 [
III i1 I j A
t- CM CO M- IX)o o o o o O O O O O
Actual
t— CM CO LOo o o o o o o o o o
Rated
MMO ■ MM1 EE1 ■ EE0
Source: Field work, 2012/2013
192

Figure 7.2, demonstrates the investment per man hours and investment productivity in
one season of power tiller and tractor usage. Generally, from power tillers to tractors,
investment costs per labour hours rises, but investment productivity declines. This is
more so in rated terms when acquisition costs are used for computation (Column A, in
Figure 7.2). Generalizations based on these unadjusted figures are unsound because of
differences in the time of purchases and whether the machine was new or used.
Therefore in Column B, we normalize our computations using the current market prices.
Table 7.7: Annual investment cost at prevailing interest rate of 8.05%33 (TSH ‘000,000)____________________________________________________________
MMo MM-i EE-i m m o
OC1 Kubota Siam Kubota Greeves AmecEstimated life (years) 12.00 7.00 4.00 3.00Annual investment cost 1 1.16 1.49 2.25 1.42Annual investment cost 2 2.13 2.50 2.42 2.33OC2 Farmtrac 45 SwarajEstimated life (years) 4.00 5.00Annual investment cost 1 3.87 5.64Annual investment cost 2 5.44 6.02
MasseyValtra Massey Ferguson
OC3 (Finland) Ferguson (Brazil) (Pakistan)Estimated life (years) 12.00 10.00 5.00Annual investment cost 1 8.06 9.08 6.57Annual investment cost 2 8.65 10.16 6.52
New Holland Massey Farmtrac 70OC4 (EU) Ferguson (Brazil) (India)Estimated life (years) 10.00 10.00 4.00Annual investment cost 1 9.80 9.08 7.54Annual investment cost 2 10.46 10.16 7.56
New Holland New Holland New Holland YTOOC5 (EU) (Turkey/Brazil) (India) (China)Estimated life (years) 10.00 7.00 5.00 3.00Annual investment cost 1 9.80 9.74 11.19 8.78Annual investment cost 2 10.46 10.58 11.54 9.32
MM- Matured Markets; MMo- MM technologies made in MM; MMr■ MM technologies made in EEEE- Emerging Markets EEi-MM technologies adapted to EE; EEo- EE technologies made in EE
Annual investment cost 1- based on historical cost Annual investment cost 2- based on replacement cost
Source: Field Survey, 2012/2013
The fact that different machines have different economic lives means that computing the
efficiency ratios based on just the initial investment cost may give a distorted picture of
33 This is the real interest rate in Tanzania during 2011/2012
193

reality. That is to say, for any two machines purchased at the same time and at the same
price, if their economic lives are different, then their annual investment costs will also
differ. Therefore in Table 7.7, investment costs are transformed into their annual
equivalents34 using the prevailing real interest rates of 8.05%. These adjusted
(annualized) investment costs are then used to compute the efficiency ratios in Table 7.8
using both acquisition and replacement costs.
Table 7.8: Productivity ratios using annual investment costs (adjusted & unadjusted version)______________________________ ______________
MMO MM1 EE1 EE0Power tillers
Actual Rated Actual Rated Actual Rated Actual RatedOC1 Kubota Siam Kubota G reeves AmecK^L 0.01 0.00 0.01 0.01 0.02 0.01 0.01 0.00O/K, 42.37 79.37 52.91 64.52 14.01 44.64 32.26 66.23k2/l 0.01 0.01 0.01 0.01 0.02 0.01 0.01 0.00o /k2 23.09 43.29 31.45 38.31 13.02 41.49 19.65 40.32T ractorsOC2 Farmtrac 45 Swaraj (India)K-i/L 0.03 0.01 0.04 0.03O/K-i 38.76 121.95 36.23 52.36k2/l 0.05 0.02 0.04 0.03o /k2 27.55 86.96 33.90 49.02OC3 Valtra (Finland) MF (Brazil) MF (Pakistan)ICi/L 0.08 0.02 0.11 0.02 0.07 0.020/K-, 17.76 71.94 12.30 60.98 19.42 84.75k2/l 0.08 0.02 0.12 0.02 0.07 0.02o /k2 17.76 71.94 12.30 60.98 19.42 84.75OC4 New Holland (EU) MF (Brazil) Farmtrac 60 (India)K^L 0.06 0.03 0.07 0.03 0.08 0.03O/K-i 18.05 38.02 13.77 30.40 12.61 32.05k2/l 0.06 0.03 0.08 0.03 0.06 0.02o /k2 16.92 35.59 12.30 27.17 12.58 31.95
OC5 New Holland (EU) New Holland (T urkey/Brazil)
New Holland (India)
YTO(China)
Ki/L 0.05 0.02 0.07 0.02 0.08 0.02 0.07 0.02O/Ki 16.86 49.26 11.92 46.08 9.82 37.04 10.82 47.17k2/l 0.06 0.02 0.07 0.02 0.08 0.02 0.07 0.02o /k2 15.80 46.30 10.96 42.37 9.53 35.84 10.19 44.44
Ratios with subscript 1 uses historical costs and subscript 2 uses replacement costs for computation
MM- Matured Markets; EE- Emerging Markets
MMo- MM technologies made in MM; EEi-MM technologies adapted to EE;
MMr MM technologies made in EE EEo- EE technologies made in EE
Source: Field Survey, 2012/2013
34 The formula for computing the annual investment cost (A) is given as A = 1 / Jl — 1H n] /r ; where 1=
initial investment cost, r=interest rate and n=number of years.
194

b. Variable costs (fuel, lubricants, maintenance and labour)
The different techniques are associated with different running costs. The main running
costs can be categorized into three: fuel and lubricants; maintenance (repair and spare
parts costs) and; labour cost. These running costs are discussed in turn.
Estimates of fuel consumption were given by respondents on a per acre bases which
was then converted into monetary values using the prevailing market prices per litre. The
per annum equivalents were computed using the average work done per season by each
category of machine. In the case of power tillers, though MM machines are more fuel
efficient on a per acre basis than EE machines, the absolute amount of fuel consumed
by the former per season is higher than the latter under OC1. This is expected because
on the whole, and as stated when machine performance was discussed in earlier
sections of this chapter, MM machines cultivated larger area per season than EE
machines.
A similar relationship is observed for lubricant consumption. That is, power tillers which
cultivated more acres per annum also consumed more lubricants both in actual and
rated terms. Amec (EE0) has notoriously high lubricant consumption because the engine
over-heats due to leakages from both the gear box and engine especially in comparison
with the total work done per season. Fuel consumption under the different OCs for
tractors does not vary much per acre. However, lubricants consumption on the other
hand does, (Figure 7.3).
The challenge of fuel consumption goes beyond the number of litres consumed per acre.
Availability of quality diesel that is unadulterated is also important. Because of
inadequate infrastructure, especially in rural areas, private businesses participating in the
sale of fuel to tractor users do so in containers. Fuel stored under such conditions can
easily be contaminated with dust. In other instances, there are suspicions by owners of
tractors to suggest that sellers of diesel sometimes adulterate it with kerosene. Because
195

the engines are not made to run on such combinations of diesel and kerosene, they tend
to knock and get damaged quickly, warranting frequent repairs.
The bright spot in this rather imperfect supply of diesel is the recent improvements in the
supply chain as a result of the booming motor cycle industry which has brought in market
expansion and encouraged more rural entrepreneurs to sell diesel. For many farmers, it
is their hope that the competition that is being bred by the surge in demand will
eventually drive out sellers of low quality diesel products. In other developments, some
repair shops reported that some of their clients do not know the right kind of lubricants to
use. Even in instances where they do have the right knowledge of lubricants, the lubes
are not changed on time. This puts an unnecessary stress on the engine and eventually
reduces its lifespan. Repairers mentioned that for the more fragile EE machines, if strict
adherence to lubrication instructions is not maintained, the likelihood of owners losing
their engine parts earlier than expected is high. Users on the other hand argue that most
Chinese machines come with instructions and manuals written in Mandarin. The
preferred language for these manuals would have been Swahili, but in its absence,
English would have been helpful.
An importer of a very popular EE tractor in Dar es Salaam who organises training for
farmers buying new equipment from his shop was disappointed with regard to the
response of farmers to training. He mentioned that for any new buyer, the company gave
a -four day training programme to the owner and the operator especially on issues
concerning routine maintenance. The company covers the full cost of the training, with
the farmer paying for accommodation and feeding. However most farmers never attend
the training and only come in and pick their machines once the financial transactions
have been sealed. In his opinion, even if EE machines were as robust as MM ones,
without training for users, they will not stand the test of time. This importer is very aware
that their customers are at the bottom of the pyramid in terms of incomes and innovative
ways should be pursued to help them overcome the financial constraints. This, he said
his company in India is doing through cost reduction.
196

Figure 7.3: Fuel and lubricant^costs by category of machine (TSH ‘000,000)
Actual Rated
Fuel ■Lubricants
Source: Field Work, 2012/2013
Maintenance costs can be divided into two: the labour and transportation costs
associated with getting the machine repaired or routinely maintained and the costs of
spare parts and the transportation costs associated with accessing them (Figure 8.4).
Generally, regardless of scale, repair charges were more expensive than spare parts for
all brands of machines under the various operating conditions.
In both actual and rated terms, the Kubota (MM0) power tiller was the most expensive to
maintain per season compared with the other three power tiller makes under OC1. While
it was relatively easier for users to access spare parts for Amec and Greeves, Kubota
and Siam Kubota spare parts were very scarce. Thus aside from the actual cost of the
spare parts, MM power tiller owners had the unpleasant experience of having to spend
very expensive field days in search of spare parts when there is a breakdown, though
breakdowns are not very frequent35. MM power tiller owners repaired their machines in
workshops which were on average 2.9km from their home and significantly different
(10% level) from EE power tiller users who had repair shops within about 1.8km radius
from their home.
35 Spare parts for Kubota were difficult to find all over the country. Siam Kubota spare parts were very difficult to find in the Mbeya area, but they were available in Babati
197

The tractor story was no different. MM users have to move from their home an average
distance of 29.6km whilst EE tractor users had their repair shops located 8.2km from
their home on average (this difference is statistically significant at the 1% level). Thus
access to repairers was relatively easier for EE users than MM users. For tractors, YTO
from China had the highest maintenance cost per annum, if operating at full capacity
compared with the other brands, both within and across OCs. Repairers, operators and
extension officers confirmed that though YTO was a good tractor in terms of the work
output, the fact that it breaks down frequently makes it unpopular among farmers. We
also found that as we move from sandy, through loam to clayey OCs, maintenance costs
generally increase for all machines.
The issue of availability of spare parts for tractors is a daunting challenge for EE owners,
mainly. However, for EE brands which have been modelled after MM ones, for example
Massey Ferguson from Pakistan and New Holland from India, users simply buy spare
parts from Europe or Brazil and use them. Users of Farmtrac and YTO especially face
challenges of availability of spare parts. Distributors were very concerned about the
situation and for one of them in the Morogoro area, plans were very advanced for a team
from Tanzania to be sent to the Farmtrac plant in India to see if a deal can be secured
for the regular supply of these spare parts.
Repairers spoken with during field interviews in 2012, especially those engaged with
power tillers, revealed that though they charge higher prices for the repair of MM
machines (usually as an insurance against the event of damaging a part), close to two
thirds of their annual incomes are realized from the repair of EE machines. In their
opinion, this is because the EE machines break down more often and users frequent
their shops more during the land preparation stage than the MM machines. Some
repairers however feared that because the EE machines were relatively simpler to repair,
in future most operators will become conversant with how to fix most problems and this
will have a negative impact on their revenue. Because of the frequent breakdowns of EE
power tillers, apprentices learning the repair and maintenance trade had more room to
198

Actual
build capability in EE machines than MM machines. Thus most mechanics are more
familiar with how the EE power tillers work than the MM power tillers.
Figure 7.4: Maintenance cost per annum
T - OLU LU LU LU
LU LU LU LU
Rated
■ Spare parts cost per annum Repair charges per annumm
Source: Field Work, 2012/2013
In the case of labour costs, there were two categories: managerial and operator costs.
Whilst it was straightforward to get the price charged by the operator on a per acre basis
and subsequently multiplying it with the total acreage ploughed during the season to get
the annual version, it was very difficult and practically impossible to account for the costs
associated with the owner managing the use of the machine. One way of going around
this was to estimate the time committed by the owner to manage the machine for the
whole season. And then find an appropriate compensation for them based on the
prevailing minimum wage. The minimum wage approach was practically impossible
because farmers could not specify how much of their time was used in managing the
machine per season. In these analyses therefore, only the operator cost is included.
The wage rates per acre as reported by machine operators and owners are determined
by a number of factors. First amongst these factors is the number of power tillers or
tractors in the community. If there are so many machines around, then the amount of
work each machine gets to do during the season declines significantly and so owners
are unable to pay higher wages to operators and vice versa. Second, more experienced
199

operators tend to work for owners with newer and more robust machines of MM origin.
Thus for an older machine of EE origin which breaks down more often, as an incentive to
attract a very good operator, owners must pay higher wages. This situation has led to
many inexperienced workers operating EE power tillers, while experienced and more
efficient ones work with MM machines.
A third factor which influences the wage rate is the type of machine: because power
tillers are generally labour intensive, operators charge more than tractors which is less
labour intensive. Finally the type of crop for which the tractor is cultivating the land also
affects the wage. For example operators under predominantly maize farms charge less
than those on rice fields and this presumably is a function of the soil type.
Figure 7.5 presents the labour costs per annum. For power tillers, in actual and rated
terms, the labour cost is highest for Siam Kubota (MM0) per annum, in comparison with
the other three alternatives. Per season an operator working with Siam Kubota on paddy
fields can potentially earn TSFI800,000 if he works for 35 days. On maize fields in the
Dodoma area and elsewhere, Farmtrac 45 (EE-i) operators earn over TSFI1.2 million per
annum in comparison with Swaraj (EE0) operators who can earn a little over TSFI
800,000. Flowever considering the actual levels of income obtained by Farmtrac-45
operators in relation to their rated levels, Swaraj operators actually earn higher wages
per annum under the current operating conditions. Under maize and tobacco fields (in
Iringa and Babati, OC3), Pakistani Massey Ferguson wages are higher (a little over TSH
1.5), than Massey Ferguson from Brazil and Valmet from Finland.
200
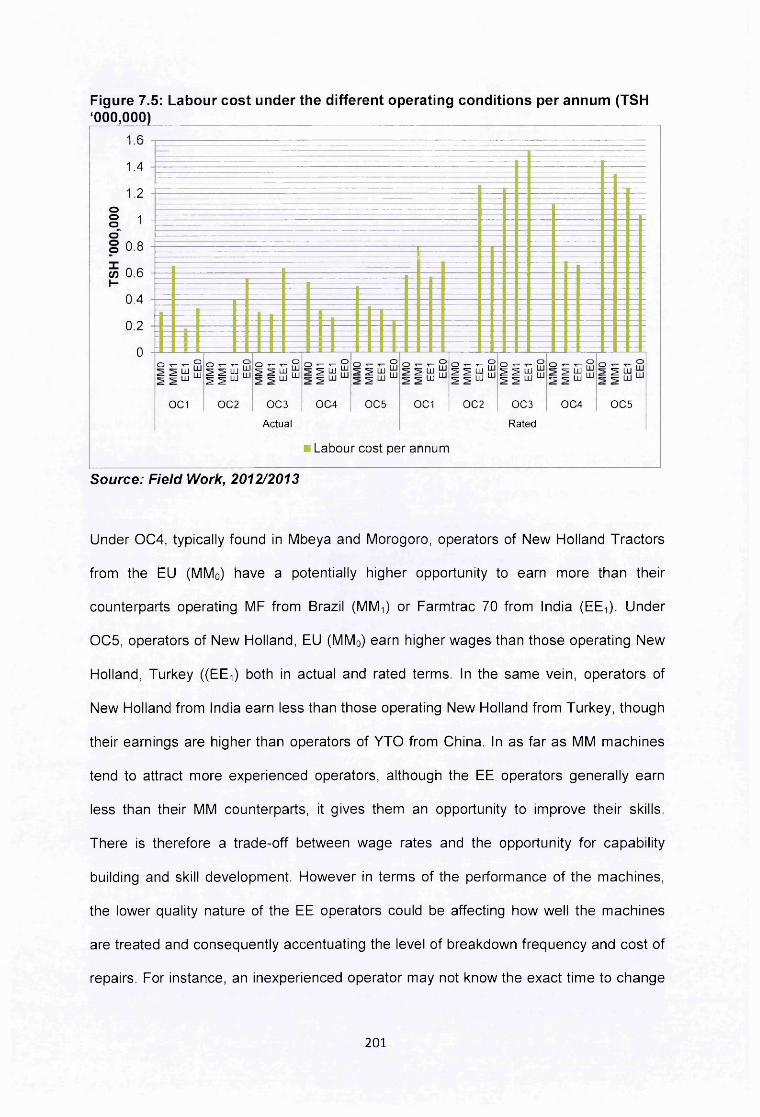
Figure 7.5: Labour cost under the different operating conditions per annum (TSH ‘000,000)
a a
1 4
. _ .. ... __........ .. .. . ...... _________ _ __ . .. . . . . .
_ _ _ _ _ _1 .2
oo >1o 1 o© 0 .8
w 0 6
:
1-
0 .4
0 2 I T
0CD t-E 2 E ^
C
_ _ o5 m LU = LU m
)C1
► a a
qUAIIAI
O
0IAIIAI
_ c j u- j “■
2
i 3 TE " E "
C
A
> u 1 u
)C
:tu
_ o j mj w
3
al
c
1
D T- T > ^ u E ^ u
OC
Lat
_ o J LU
4
)OU
c
r
D TE E 2
C
cc
> u 1 u
)C
)St
_ o j m J ^
5
Pe
c
?r
D TE E '
C
a
> u 1 u
)C
in
_ cJ LL J LL
1
un
LZ’Z. ^
UAIIAI O
0IAIIAI
_ c1 LL
j u-
2
s1D TE 2 E S
C
R
; uI u
)C
ate
_ o j lu j UJ
3
d
c*D T-E S E "
C
; u 1 u
)C
_ oJ 1X1 J LU
4
cD TE E '
C
; u 1 u
)C
_ cLI U-
5
Source: Field Work, 2012/2013
Under OC4, typically found in Mbeya and Morogoro, operators of New Holland Tractors
from the EU (MM0) have a potentially higher opportunity to earn more than their
counterparts operating MF from Brazil (MMt) or Farmtrac 70 from India (EEi). Under
OC5, operators of New Holland, EU (MM0) earn higher wages than those operating New
Holland, Turkey ((EE-i) both in actual and rated terms. In the same vein, operators of
New Holland from India earn less than those operating New Holland from Turkey, though
their earnings are higher than operators of YTO from China. In as far as MM machines
tend to attract more experienced operators, although the EE operators generally earn
less than their MM counterparts, it gives them an opportunity to improve their skills.
There is therefore a trade-off between wage rates and the opportunity for capability
building and skill development. However in terms of the performance of the machines,
the lower quality nature of the EE operators could be affecting how well the machines
are treated and consequently accentuating the level of breakdown frequency and cost of
repairs. For instance, an inexperienced operator may not know the exact time to change
201
the oil, or refill the water tank of the cooling system. This may affect the performance of
the machine. As suggested by an engineer in charge of Suma JKT workshops:
“...in the Tanzanian situation where capital is scarce, cost innovation is inevitable. Though innovating in the cost sense may sacrifice some level of quality, if operators are properly trained to know the depth, speed and draft force to operate, maybe some of these Indian and Chinese machines may last longer than they do today...it will however be interesting to know how much it costs to train an operator properly as compared with quality reduction in machines to make them affordable and which way we should look as a country...” (Keyinformant interview with SUMA-JKT engineer, 2012).
7.5.4 Net revenue per annum
Figure 7.6 presents a computation of the net margins per annum by subtracting the sum
of the fixed and variable costs from the total revenue per annum. On the whole, annual
capital costs (depreciation or investment cost) ranks highest amongst all costs for both
power tillers and tractors, regardless of the category (whether MM or EE). This is
followed by repair and maintenance, fuel and lubricants and then by labour cost. In
detail, we find that aside from Siam Kubota, none of the power tillers posted positive
margins in actual terms per annum36. However, under full employment during the
season, all four power tillers have the potential of posting positive margins. Taking output
into account, the estimates also suggests that for power tillers, MM-i versions are the
most expensive to run per annum whilst for tractors, MM0 is found to be the most
expensive. In the same vein, for both tractors and power tillers, EE-i versions are the
least expensive to run per annum.
36 However these technologies are still diffusing suggesting that the neo-classical economics do not always capture the reasons for choice of technology

Figure 7.6: Net profit margins by OCs and category of machine
uO0)>
(U13c3CDCIEuroE
<4-O>■1_0M01 4->roo
s zuro(U>4-OCDoCroE
CDQ.13CD
13Cro
in
MM1MMO
EEO
... ..... ... C ).. EE!o M M l
MMO
13CD
EEOEE1
"O MM1MMO
EEOEE1
o M M lMMO
EE1
M M l
M M l
EEOEE1
M M lMMO
EEOin
EE1M M lMMO
EEO
MMOli
-16 -14 -12 -10 -4
Net profit margin per annum in '000,000 of
Source: Field Work, 2012/2013
203

7.6 Rates of return: dynamic optimality
To model investments in agricultural mechanisation services (own farm and contract
hire), the study adopted a modified version of the firm investment theory described in
Diao et al. (1998) (see also Kaplinsky (1990) and Stewart (1977)). Mechanisation service
provision is considered a business run by a firm. The firm’s goal is to maximize its inter
temporal net profit tt, taking existing capital costs, market prices for service provision,
fuel and other inputs, and labour wage rates as given (that is the various input and
output variables we have discussed extensively in the sub-sections before this one). The
firm as an investor decides between either a tillage service business by investing in the
various brands of power tillers or tractors. The opportunity cost of doing so is the interest
which would have been earned if the money was saved in a bank. In principle, the farm
will only invest in a particular power tiller or tractor when the returns to such investment
are higher than the interest to be earned on saving the same amount of capital in a bank.
Beyond the decision to invest, the farmer must choose between a range of alternative
power tillers and tractors (MM0, MM-i, EE-i and EE0). This decision among alternatives will
depend on which one of them brings the most benefits (income) in an inter-temporal
sense.
Thus, it is assumed that once the farm invests in a power tiller or tractor, it lasts for a
certain period, n years depending on the source and brand (MM0, MM1f EE-i and EE0).
With the required annual maintenance, the productivity of the tractor is not affected by its
depreciation (an assumption which could be relaxed in a developing country context
where such strict maintenance culture is not always adhered to). After n years, the old
power tiller or tractor will be replaced by a new one, the cost of which is covered by the
accumulated depreciation as part of investment profit. Mathematically, this farm’s
investment decision in any one n-year period can be modelled as maximizing the value
of the following equations:
204

where tt is the total discounted net profit over n years (as the power tiller or tractor’s
lifetime has been shown to vary according to the source and brand), Rt is the annual
discount factor, r is the annual saving interest rate (real interest rate), and / is the actual
power tiller or tractor cost paid by the farm initially, assuming that the farm invests its
own money and ignoring the cost of borrowing. Gt is the gross margin for the farm (that
is, the annual service provision revenue minus variable costs). The gross margin in year
t can be estimated as follows:
Gt = P * A t - At{F + L) - M - (7.3)
Where P is the market-determined tillage service charge per acre, At is the acreage
tilled, F represents the fuel and lubricant costs per acre, L represents the labour costs
per acre, and M represents the maintenance and repair costs per year. P, F, L, and M
are assumed to be constant over time. Solving this inter-temporal profit maximization
problem by taking into consideration capital depreciation yields the following condition:
G = 81 = r l - (7.4)
Where S is the capital depreciation rate. Equation 7.4 indicates that the condition
requires that the gross margin G minus the annual depreciation cost of the tractor
investment equals the interest earned from saving the same capital at a bank. At this
equilibrium point, the investor is indifferent between investing in a tractor and saving.
Given that once the investment in the power tiller or tractor is made, the farm cannot sell
it and save the capital, equation 7.4 needs to hold over the entire time horizon of n years,
although it may not hold in each of the n years. To simplify the analysis, however, we
assume that Ai = A2 = ... = Anand r is constant, so that equation 7.4 holds for each year.
In other words, to make power tiller or tractor investment more attractive than simply

earning annual interest from savings, the profits from power tiller or tractor service
provision (own farm and contract hire) minus tractor annual depreciation cost must be
higher than the returns (interest) from saving the capital (tractor investment cost) at a
bank in each year. And again for the choice between different categories of tractors and
power tillers, a ranking of these profits must be done.
Let N = G - (r-8) define the annual net profit from investing in a power tiller or tractor—
that is, the profit minus the interest earned from saving the capital. Substituting the right-
hand side of equation (3) for G yields:
N = P* A - A ( F + L) ~ M - ( r + 8)1. - (7.5)
Given P, F, L, M, r and 8, the net profit N depends on two key factors: the acreage tilled,
A, and the initial investment, I. Based on these discussions we generate the NPV
(discounted streams of benefits and costs) and the BCR (ratio of the NPV to I) in Figure
7.7 and 7.8.
All power tiller categories had a positive NPV and consequently BCRs were also greater
than 0, when costs and benefit streams are discounted with the real interest rate of
8.05% in the rated sense. Computations based on actual work done using power tillers
for the season under consideration also revealed that apart from Kubota (MM-i) all the
other brands had a positive NPV. Analyses for tractors from OC2 to OC5 revealed a
gloomier picture: generally, aside from the potential computations for MM0and EE-i under
OC3, all other NPVs for all tractors are negative. This suggests that under the current
interest rates, most tractors operating under current factor prices and the value for an
acre of land tilled cannot break even, despite government subsidies.
206

Figure 7.7: Benefit-Cost Ratios
m
MMOEEO
EE1MM1
CM
MMCpEEO
EE1coMM1MMO
EEO
MM1MMO
EEOEE1
MM1MMO
EEOEE1
MM1MMO
EEOEE1
MM1MMO
EEOj jE E l]MMlMMO
EEOEE1
in
co
MM1MMO
EEOEE1
MM1MMO
-0.5 0.5-1.5
Benefit Cost Ratio
Source: Author’s computation, 2012/2013
207

We also noted in Chapter 6 that there are government subsidies on imported farm
machinery in Tanzania, including power tillers and tractors. An import duty of about 20%
of the value of the product is waived and a VAT of about 17% is also taken off the
acquisition cost. In Figure 7.8, we re-impose these taxes and test the outcomes on the
investment profitability measures assuming marketing margins of importers and
distributers were 10% (this is a modest estimate as some industry players say it could be
as high as 30%) of the total price. This scenario suggests that for power tillers NPV for
all categories of technologies declines considerably, but all BCRs maintain their signs.
As expected, the profitability of tractors under the various OCs worsened with the
removal of subsidies. This may confirm the belief of many tractor owners in our sample
that running a tractor hiring service, whether you have an MM or EE tractor is purely
philanthropic or at best is done to increase the capacity utilization. Otherwise, the main
source of repayment for tractors especially, is the benefit from crops grown on the land
which the tractor helps to cultivate.
Nevertheless, the predominantly negative profitability of many of the technologies under
study is consistent with the findings obtained by Houssou et al. (2013) when they studied
tractor hire services in Ghana. They found that mechanisation service provsion was not a
viable business and that most large tractors are unlikely to make profit because of low
capacity utilisation. They suggested that smaller tractors which are low cost may have a
better potential in terms of profitability. See also Paman et al. (2010) who found that low
cost and smaller tractors helped owners in Indonesia to realise full capacity utilisation.
A further explanation for our finding here may lie in the manner in which output is
calculated here. We do this by multiplying the acres ploughed on own farm and rented
service by the price which farmers charge for renting out their equipment. However,
farmers may only be renting out their power tillers or tractors to cover their marginal
costs and something extra to contribute to their fixed cost which has already been borne.
And so the output figures may well be underestimated. This potential underestimation of
208
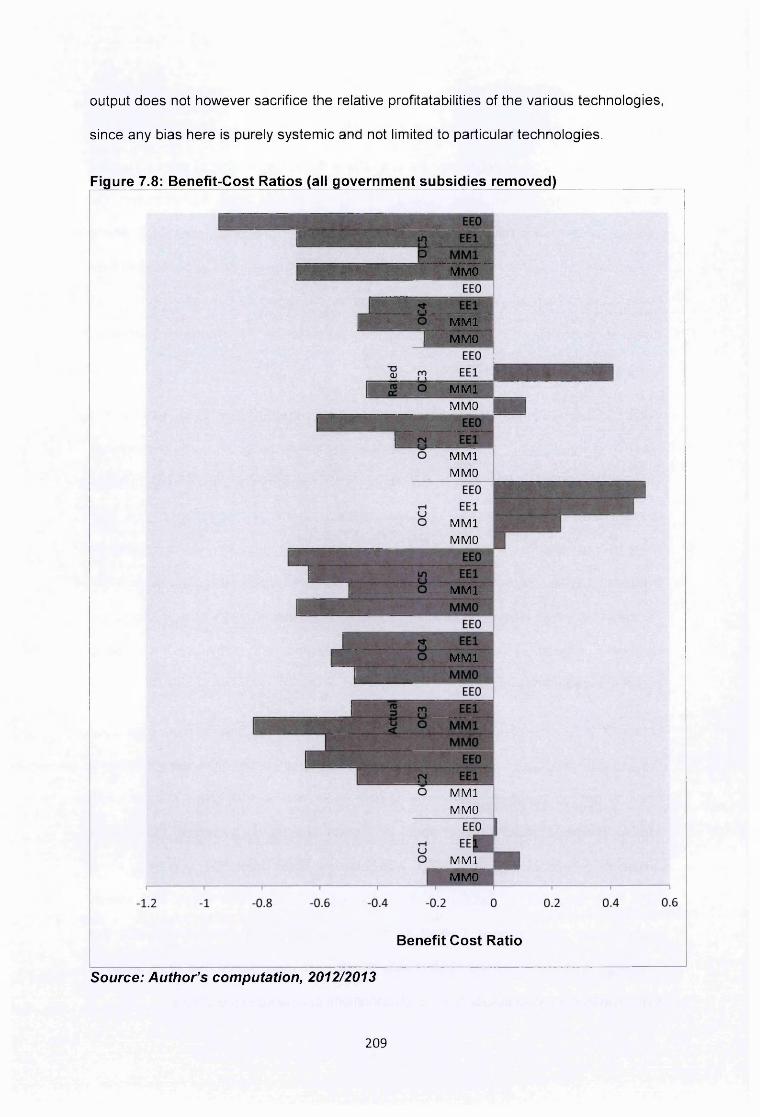
output does not however sacrifice the relative profitatabilities of the various technologies,
since any bias here is purely systemic and not limited to particular technologies.
Figure 7.8: Benefit-Cost Ratios (all government subsidies removed)
MMO
i M M lI MMO
M M l
MMO
MMlMMO
MMlMMO
4M M l
M M l
MMlMMO
MMlMMO
Benefit Cost Ratio
Source: Author’s computation, 2012/2013
209

7.7 Capacity utilisation
Figure 7.9 presents the annual capacity utilization of the various technologies under the
five distinct OCs. The computation here is a ratio of the actual number of acres cultivated
to the maximum possible rated capacity during the season under consideration. On
average, power tillers have higher capacity utilization than tractors. Under OC1, where
power tillers are used, MlVh machines (specifically Siam Kubota) uses about 82% of their
capacity per annum, representing the highest within the group. At the bottom in the OC1
range of technologies in terms of capacity utilization is the EE-i (Greaves) machines,
using about a third of their capacity per annum.
Within OC2 to OC5, where tractors are used, we find that OC3 technologies have the
least capacity utilization on average. The relatively low capacity utilization of machines
under OC3 could be explained in two ways. First, these machines are predominantly
found in areas of the country (Iringa and Babati) where mechanisation is very high
compared to other regions as a result of large scale commercial farms dominated by
European settlers. Second, there has also been a recent supply side push by Agri-Pak
Tanzania Ltd which is importing machines made in Pakistan. Thus there is a stock of old
reliable European, Japanese and American tractors and they are now being
complemented by new entrants from EE markets.
Under OC2, EE0 (Swaraj) uses close to 70% of its capacity per annum, more than twice
the capacity used by EE-i (Farmtrac 45). Technologies used under OC4 operated around
one-half of their capacities during the season under review. MM0 (New Holland - EU)
topped the group; making use of about 57% of its capacity. As expected, the capacity
utilization of technologies under OC5 was relatively lower than OC4, averaging about
25%. The plausible explanation is the challenging terrains that come with muddy
grounds and the consequent effect on the tractor down times. Notwithstanding this
challenge, MM0 (New Holland - EU) is able to use up to more than a third of its capacity,
signalling their relative suitability for such conditions compared to the others.
210

Figure 7.9: Capacity utilization^of technologies by category and OCs
OC5
(/).2 OC4
c
° OC3O)c(Z
<j> OC2Q.oOC1
0.00 0.10 0.20 0.30 0.40 0.50 0.60 0.70 0.80 0.90Ratio of actual area cultivated per annum to rated area that can be
cultivated by machine
■ EE0 EE1 ■ MM1 ■ MM0
Source: Authors computation
7.8 Conclusion
This chapter has established the economic optimality of the various categories of
technologies, by the use of the productivity ratios and the NPV ratings. In the next
chapter we would want to know why sometimes users choose unprofitable techniques.
To do this we first discuss the factors which influence choice. These factors are broadly
grouped into four: characteristics of the technology itself (cost, quality and efficiency);
characteristics of the market (sales, service, spares, finance, information and propensity
for contract hire), characteristics of the farm (farm size, crops, farming system and
distance to main market) and the farmer (age, income, family size, education, member of
cooperative group, extension contact and view about emerging market products).
To bring our discussion home to optimal technology and inclusive innovation through
growth and distribution to excluded portions of society, we discuss in the next chapter
the extent to which the choice of various techniques impact on employment and outputs
and who benefits from these. Growth in farm size and output, as well as which types of
211

crops (cash crops or food security crops) benefit most from different categories of
technologies. Issues about ease of repair and capability development, financial
arrangements for procurement and gender outcomes are also discussed. The
environmental and health impacts are not left out: emphases is laid on the release of
C02 through smoke, noise pollution, scrap metal waste, ergonomics and potential
injuries that users could sustain during the machine’s operation.
212

Chapter 8 : Economic Profitability, Diffusion and Social Optimality
8.1 Introduction
This chapter first of all establishes the relationship between physical coefficients,
economic profitability and diffusion in Section 8.2. An attempt is made also to explain
why sometimes economically inefficient or socially inappropriate technologies are
selected and diffused at the expense of more desirable ones. In Section 8.3, an
examination of the social appropriateness of the different techniques is undertaken. Here
attention is paid to output, employment, incomes and human capital development
outcomes. In Section 8.4, the discussion touches briefly on some aspects of
environmental impact, health and user satisfaction with the two sources of technologies.
Some chapter conclusions are then made in Section 8.5 with the view of drawing an
overall implication for policy.
8.2 Physical ratios, return on investment and diffusion of technologies
If the object of ranking projects and industries is to explore their employment generating
capacity, then the share of employment in total, that is the absolute size, is as relevant
as the ratios that reflect labour intensity (Bhalla, 1981). The Benefit-Cost Analyses which
generates some measure for the relative rates of return on investment is also essential
for the decision maker (who in this case is the Tanzanian farmer) to make a choice
amongst alternative technologies under different operating conditions (Kaplinsky, 1981).
In addition, capacity utilization levels are also crucial information for the farmer, since
they have implications on employment and output (Stewart, 1977). In Table 8.1, the four
sub-categories of technologies are ranked according to the size of employment, the
three indices of labour intensity, BCR and capacity utilization. Under each OC, every
sub-category of technology is ranked between 1 and 4 for employment, productivity
ratios and BCR. Here, the higher the rank the more labour intensive that technology is.
The rankings are presented for both actual performance and rated capacity of the
machine.
213

Under 0C1 where power tillers are used on small scale rice fields which are pre
dominantly clayey, in actual terms, EE0 (Amec) rank highest for total employment and for
all the three productivity ratios signifying a higher labour intensity compared with the
other technologies.
This observation generally remains the same under full capacity utilization of the
machine, except total employment in which Amec ranks the least. Under full capacity
utilization, EE-i (Greaves) out-performs MM-i (Siame Kubota), which followed Amec for
actual performance. Though MM power tillers have higher capacity utilization than EE
ones, on average their Benefit-Cost-Analyses (BCA) are rated higher than the MM
machines.
Comparing EE-i (Farmtrac-45) and EE0 (Swaraj) under OC2 where maize and pulses are
grown on mainly sandy soils, the former ranks higher than the later for all the labour
intensity indices and for the BCA than the later. Nevertheless, the capacity utilization of
EE0 is higher than the EE-i. This suggests that higher capacity utilization does not
necessarily increase employment intensity or profitability under OC2.
Apart from size of employment, EE-i machines (Massey Ferguson- Pakistan) rank higher
than the other alternative technologies for all the coefficient of production estimation
under OC3. Again the same category of tractors posted the highest rank in terms of
BCA. However, MM0 machines had higher capacity utilization under OC3 than other
technologies in the same group.
Under OC4, labour intensity indices are in favour of EE-i (Farmtrac-60). However MM0
(New Holland- EU) ranks highest in terms of total labour employed per annum,
profitability based on the BCA and capacity utilization. Under OC5, EE machines are pre
dominantly labour intensive, but the same cannot be said of the profitability and capacity
utilization.
214

>»n ^ oTO $ Q. E ro ~O 3
3
£Otoa(0a■ocTOO3(0
©c©SI
3oSIto
c©E>oaEa>>sz</>©'5ooc.coa>
O)c!Sc(0
00©A(0
C■O 0c OTO it="c 0i0 oE a>% co oQ. U-»oE 3LU ~o
oQ.
TO
>Q_
W C (D (0 Db E 2
O 0 §
oa:
•acTOm
do _ 0> .c 0 o0 TOh- O
oEocoo0
O§ ? o TO
T ~ W O T3 — hL C O5? o c/3< O w
CO CM T— CD LO 00 CO M"O CD CD OCO M" CM
co cnT ^
CO c\T
CMCO
CO,c\f
co S2-SCM ^
CM, CO CM ^ co" mF
^ C\T CO
^ CMCO M"" CM
CO M- CM
M" CO CM
T3CTOC 1 TO £Q-h"TO
TO^ TOT3 C ■!=TO T -CTO-I—»OJD3
co o 0
C/j O
T- O LU LD LU LU
TOi go ®0 >, .2 TOa: o - 0 o tor\ ° O u)
cm aT G) o ' CO oo' cd' oTCO CDCM CM CM M" M" COO O 0 ,0 ,0 , 0 ,0 ,0
cm" co ^ cm" co" C\T
S £ S S S ■S S Scm"
CM
CM
CM,CM
CMCM
CM,CM
CMCM
CM
I I
CM
TOTDCLO .toM- -a0 E to J_-t TO1 |TO > LL C/)
t- O LU LU LU LU
0 TO TOE o a)
0BTO0 iH w
NoS2 TO _ 0^ E «=. . 3 > ,CM'u^8 p SO b u>
coco"
CMCM,CO CM" CM CO"
COCO
CM,£l,tO,co cm"
v-^CM,^cm" co"
CO^ " cm" co
CO CO
CM CO
cTO-t—>
i - 8TOAC TOm Q.
T- O LU LU LU LU
0O)O O_ O
■2j§2 2E 03 =3 © £ "6 n w0 TOS E I. . . . to CO 2 o O to _X O cO o) o
CO,co
CMCMCO, cm" cm" co"
CO,co
CM, t— CO,co" cm"
CO
-0 0 CMcm" co" "
CO CM
CO CM
to3 V-LU E
o— CDT3cto == N o0 TO TO
1 ®2 ^ LL
T- O LU LU LU LU
i_ TJTO CO) > TOV) TO EID o 3C c TDTO o 0Q.X 0,o
E’i_ TO
o T3 (— Eo TO
M- co co CO CM CM CMd o o o^ cm" co"
CO CM,c\T^Tco
^CM CO ^c\T^co"^r
CO M- CO CO ^csfco CO
CM, to ^cnT t— CO
CO CO CO^"csfco ^
C0 CM co" cm"
S2.SCO
M" CO CM CM
M" CO CM
>>0AC
T3C_ro
oX
0 0 0
T- O LU LU LU LU
c o0 o
S ra®1TOO
TO aco __
0 LO COB O §> J O «
E3
0ETO 0)E E>TO m 73E C O TO
COOOc0S0OCO¥p:
COr-o
SisJD
a>i£Q>fc3O
CO
215

Depending on the endowments of users, either labour intensive or capital intensive
technologies will be economically optimal (Clark, 1985). That is in societies where labour is
abundant, technologies which economise on capital might be expected to be favoured and
vice versa (Cooper & Kaplinsky, 1975). Assuming perfectly competitive markets, profitable
technologies are likely to be transferred, distributed and diffused among users more than
unprofitable ones in comparative terms. The profitability of any technology is influenced by
the engineering efficiency and the input and output prices. Assuming our analyses of
physical coefficients of capital, labour and output were correct, and NPV and BCR
computations in the previous chapter were a true representation of reality in Tanzania, we
expect that for profit maximizing households, power tillers and tractors which give the
highest profit will be accessed and used under the different OCs.
In the same vein, for importers and distributors, attention is likely to be given to developing a
value chain for technologies which users want to buy and not what they have to offer. An
overarching constraint that might influence the technologies which have a better chance of
being distributed is finance, especially in a developing country context where the cost of
capital is very high. The challenge of finance is thus not only a user constraint but also an
importer one.
In the sub-sections which follow we examine how productivity ratios and returns on
investment influence technology diffusion and the extent of use. Possible explanations for
why profitable technologies (in the economic sense) may not be diffused or otherwise are
also presented. The discussions here draw on the rankings presented in Table 8.1 above
and extend the ranks to cover the level of penetration37 of each of the technologies. The
higher the rank, the higher the penetration level of the technology within the country.
37 Based on casual empiricism and data from the Mechanization Department of Tanzania
216

8.2.1 Relationship between coefficients of production and diffusion
With increased output as a desired objective, the area cultivated by each technology is just
as important as how efficiently it is done. But here as mentioned earlier capital saving
technologies are more desirable especially for the poor. For relatively richer producers,
technologies which complete work on time may appeal more than those which save on
capital. In other instances, the nature of the soil and scale of operation will not permit the use
of low quality machines- high quality, high cost becomes an inevitable choice. We examine
these foundations under the various OCs in turn.
Under OC1 as shown in Table 8.2, the Thai Siam Kubota cultivates the largest area per
season. It is however the most capital intensive after the Japanese Kubota. It is the second
most diffused technology on small paddy rice fields. The Chinese Amec which has the
lowest capital intensity and the highest capital efficiency is the most diffused. It also employs
the highest labour hours per annum, but sits nearly at the bottom of the rankings in terms of
area cultivated which is essential for total farm output. The point here is that though Chinese
Amec does not cultivate an area as large as the Thai Siam Kubota, it is more popular among
low income farmers because their farms are relatively smaller and they may not need the
higher capacity offered by the Siam Kubota. However if growth in farm output is desired,
then this ought to be of concern, since higher capacity is required for expanding the area
under cultivation.
217
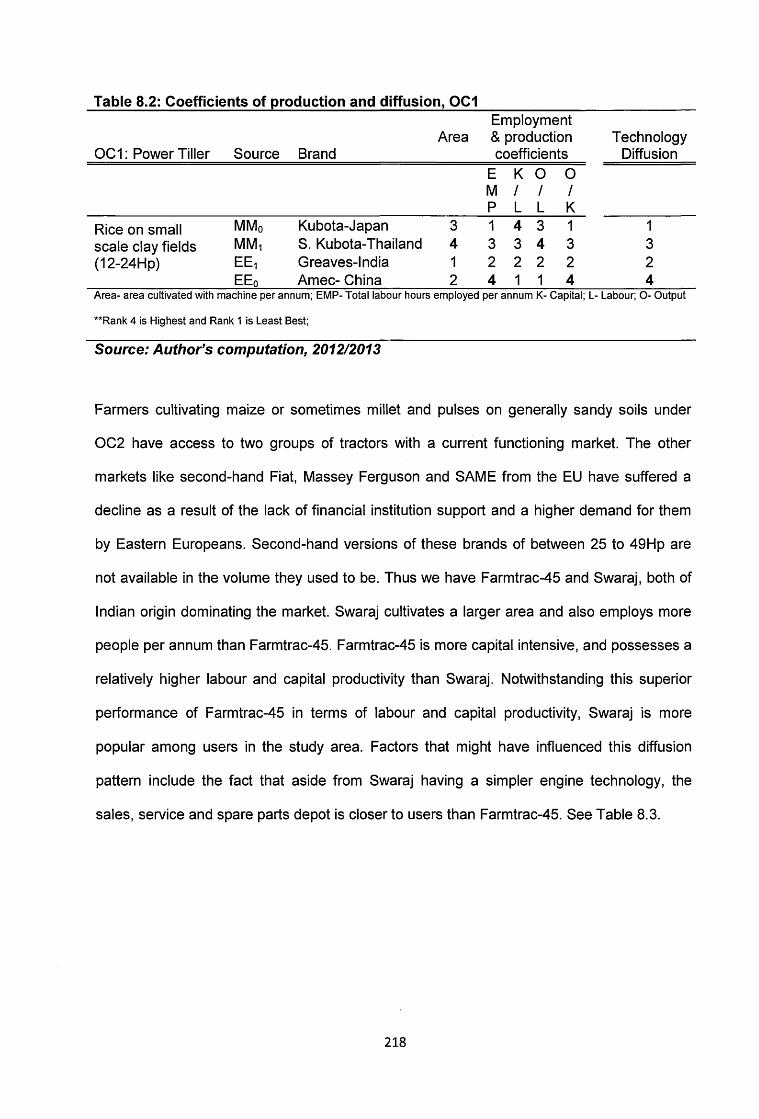
Table 8.2: Coefficients of production and diffusion, OC1
OC1: Power Tiller Source BrandArea
Employment & production coefficients
TechnologyDiffusion
E K 0 0M / / /P L L K
Rice on small MM0 Kubota-Japan 3 1 4 3 1 1scale clay fields MM, S. Kubota-Thailand 4 3 3 4 3 3(12-24Hp) EE, Greaves-lndia 1 2 2 2 2 2
EE0 Amec- China 2 4 1 1 4 4Area- area cultivated with machine per annum; EMP- Total labour hours employed per annum K- Capital; L- Labour; 0 - Output
**Rank 4 is Highest and Rank 1 is Least Best;
Source: Author’s computation, 2012/2013
Farmers cultivating maize or sometimes millet and pulses on generally sandy soils under
OC2 have access to two groups of tractors with a current functioning market. The other
markets like second-hand Fiat, Massey Ferguson and SAME from the EU have suffered a
decline as a result of the lack of financial institution support and a higher demand for them
by Eastern Europeans. Second-hand versions of these brands of between 25 to 49Flp are
not available in the volume they used to be. Thus we have Farmtrac-45 and Swaraj, both of
Indian origin dominating the market. Swaraj cultivates a larger area and also employs more
people per annum than Farmtrac-45. Farmtrac-45 is more capital intensive, and possesses a
relatively higher labour and capital productivity than Swaraj. Notwithstanding this superior
performance of Farmtrac-45 in terms of labour and capital productivity, Swaraj is more
popular among users in the study area. Factors that might have influenced this diffusion
pattern include the fact that aside from Swaraj having a simpler engine technology, the
sales, service and spare parts depot is closer to users than Farmtrac-45. See Table 8.3.
218
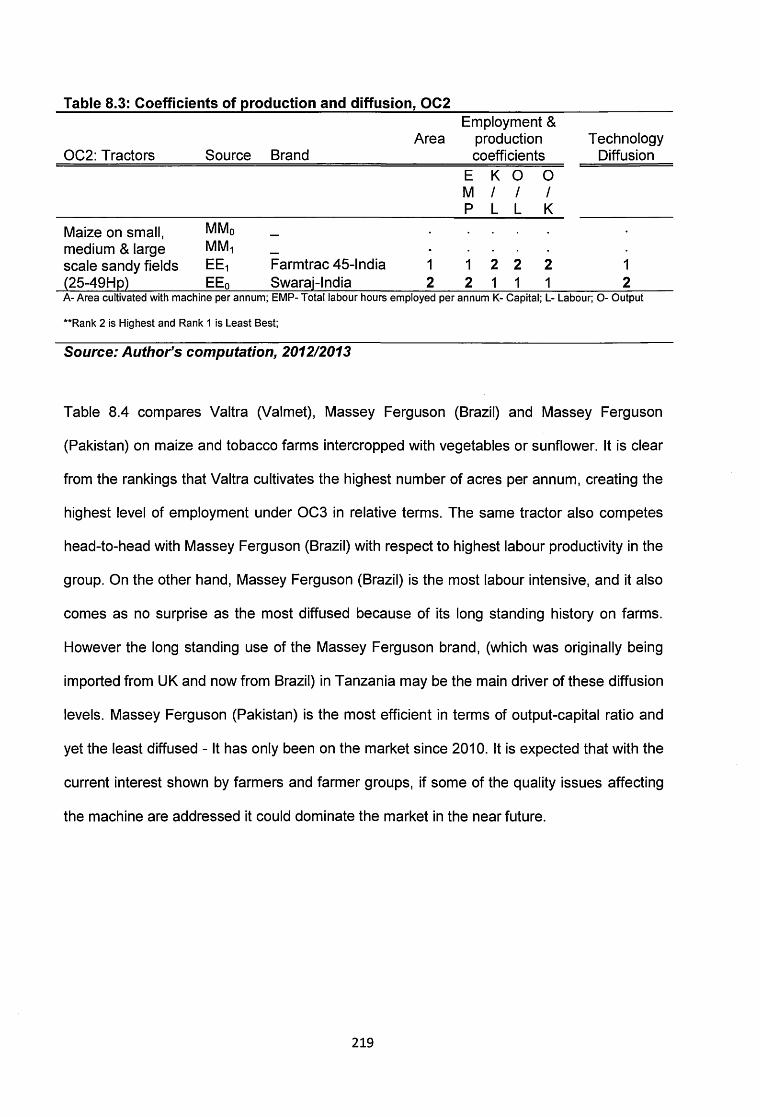
Table 8.3: Coefficients of production and diffusion, OC2
OC2: Tractors Source BrandArea
Employment & production coefficients
TechnologyDiffusion
E K 0 0 M I I I P L L K
Maize on small, MM0 •
medium & large MM! ■
scale sandy fields EE! Farmtrac 45-lndia 1 1 2 2 2 1(25-49Hp) EE0 Swaraj-lndia 2 2 1 1 1 2A- Area cultivated with machine per annum; EMP- Total labour hours employed per annum K- Capital; L- Labour; 0 - Output
**Rank 2 is Highest and Rank 1 is Least Best;
Source: Author’s computation, 2012/2013
Table 8.4 compares Valtra (Valmet), Massey Ferguson (Brazil) and Massey Ferguson
(Pakistan) on maize and tobacco farms intercropped with vegetables or sunflower. It is clear
from the rankings that Valtra cultivates the highest number of acres per annum, creating the
highest level of employment under OC3 in relative terms. The same tractor also competes
head-to-head with Massey Ferguson (Brazil) with respect to highest labour productivity in the
group. On the other hand, Massey Ferguson (Brazil) is the most labour intensive, and it also
comes as no surprise as the most diffused because of its long standing history on farms.
However the long standing use of the Massey Ferguson brand, (which was originally being
imported from UK and now from Brazil) in Tanzania may be the main driver of these diffusion
levels. Massey Ferguson (Pakistan) is the most efficient in terms of output-capital ratio and
yet the least diffused - It has only been on the market since 2010. It is expected that with the
current interest shown by farmers and farmer groups, if some of the quality issues affecting
the machine are addressed it could dominate the market in the near future.
219

Table 8.4: Coefficients of production and diffusion, OC3
OC3: Tractors Source BrandArea
Employment & production coefficients
TechnologyDiffusion
E K O 0M / / /P L L K
Medium to large MM0 Valtra- Finland 3 3 2 3 2 2scale maize & MM) MF- Brazil 1 1 3 3 1 3tobacco on loamy EE) MF- Pakistan 2 2 1 2 3 1soils (50-65Hp) EE0A- Area cultivated with machine per annum; EMP- Total labour hours employed per annum K- Capital; L- Labour; O- Output
**Rank 3 is Best and Rank 1 is Least Best;
Source: Author’s computation, 2012/2013
Under OC4, Massey Ferguson (Brazil) with its earlier versions from UK are the most diffused
and comes through as the most capital intensive and labour productive - though it shares the
highest rank with New Holland (EU) in terms of labour productivity. Farmtrac-60 is the most
capital efficient, producing the highest level of output per unit of capital. Farmtrac-60 is
however the least diffused. Though there have been a recent surge in the distribution of
Farmtrac-60, it is only as a result of central government subsidies. Under capital constrained
conditions, one would have also expected that Farmtrac-60 would have been the most
diffused under OC3, but it is not. In the past, it has been out-competed by second-hand
Massey Fergusson from the UK and Poland because of its high breakdown frequency. See
Table 8.5 for a presentation of these rankings.
Table 8.5: Coefficients of production and diffusion**, OC4
OC4: Tractors Source BrandArea
Employment & production coefficients
TechnologyDiffusion
E K 0 0M / / /P L L K
Upland sugar and MM0 New Holland-EU 3 3 2 3 2 2rice on clay (All MM) MF- Brazil 2 2 3 3 1 3farm sizes) EE-i Farmtrac 60- India 1 1 1 1 3 1(65Hp+) EE0A- Area cultivated with machine per annum; EMP- Total labour hours employed per annum K- Capital; L- Labour; O- Output
**Rank 4 is Best and Rank 1 is Least Best;
Source: Author’s computation, 2012/2013
220

With respect to OC5 in Table 8.6, it was observed that in recent times New Holland (India)
dominates as the most diffused across the entire landscape. But what is diffused here also
depends more on the type of farmer. Relatively lower income farmers go in for the New
Holland (India), while those wishing to upgrade after using the Indian type purchase and use
the New Holland (Turkey). For large scale commercial farms, New Holland (EU) is common.
Under OC5 where sugar cane and rice are produced on irrigated fields, New Holland (EU)
does more work per annum, employs more labour hours and also has the highest labour
productivity compared with the rest. Though YTO-China is the most capital efficient, it is the
least diffused - the high breakdown frequency and absence of a well-functioning spare parts
supply market might have influenced this pattern of diffusion.
In general, the productivity of capital in under most OCs tends to favour EE0 machines.
However, the total area cultivated which is a key variable to be considered when targeting
growth in output tends to be higher for MM machines. Thus while the level of output per a
unit of EE tractors or power tillers are higher relative to MM ones, total output in terms of
area tilled is relatively lower.
Table 8.6: Coefficients of production and diffusion, OC5
OC5:Tractors Source BrandArea
Employment & production coefficients
TechnologyDiffusion
E K 0 0M / / /P L L K
MM0 New Holland-EU 4 4 3 4 2 3Irrigated sugarcane New Holland-and rice on clay MMi Turkey 3 2 4 3 1 2(All sizes) (65Hp+) New Holland- India 2 3 2 2 3 4
EE0 YTO- China 1 1 1 2 4 1A- Area cultivated with machine per annum; EMP- Total labour hours employed per annum K- Capital; L- Labour; 0 - Output
**Rank 4 is Best and Rank 1 is Least Best;
Source: Author’s computation, 2012/2013
221

8.2.2 Economic profitability and diffusion
Table 8.6 ranks the various techniques under the different OCs using the Benefit-Cost-Ratio
(BCR), capacity utilization and diffusion. In the same table, some reasons are assigned for
instances where profitability and diffusion levels do not go together.
As stated earlier, economically profitable technologies should naturally penetrate more than
less profitable ones. However, aside from OC1 where the most profitable power tiller (using
the BCR measure) doubles as the most diffused technology, all other OCs do not show such
correlations. Under OC1, Amec from China has the highest BCA, and also tops the national
statistics in terms of diffusion. In terms of capacity utilization however Amec is second from
the bottom. OC2 presents a criss-cross relationship between BCA and diffusion. That is,
though Farmtrac-45 is the most profitable and has lower capacity utilization, Swaraj has a
higher level of penetration. Whilst Massey Ferguson (Pakistan) is the most profitable
according to the BCA computations, Valtra has the highest capacity utilization when OC3 is
considered. Nonetheless, Massey Ferguson (Brazil) and its earlier variants from UK are the
most diffused here. This evidence supports the argument that profitable technologies do not
always get diffused. This is a key point which will be examined in detail per each OC in the
following discussions.
222

(03it
■ac0
(0Ei tQjooEocooLU
000)A(0
co■(/)3i t
£ <0tO 0
S I 8 80 3 «- O TJ0 -*—>(O0O)D)3CO
Cx: .2 o 0 0
> C.t=: oO 4= 0 0 Q_ (O 0 ■= o ^
TJ c 0
O JO
E o c o0 01o
oCOco ^ it: w -a aj ^ c o
S > ° h < o O
CO CM ^
TJC_0
c <5 0
*0 flj -r
i l i
CM
00 CM ^
0 O
T— O LU LU LU LU
0w CL
CD g 5g S o*r~ = CM
0 E0
0
O0.
0 TJ
§ 50 >J
O .2 0 1 O a: o
00 °0“ 0 tz g 5 o>CL C0 ® 1—0 *4- Q. O 0
0C =ic -Q o 011•+—o 0XI>
0
D)3O
TJ003i t
0 -Q o jS E
o w | ro
>1 < g
00 0
£ cco E
CM
CM
CM
0TJ_Cin .2
t j o £0 _i_- t 0
g §0 ^I LL CO
T - O LU LU LU LU
0 v N oQ
l l0 XD O ® O t 0
■r.i3 “O o
>»TJ .C CL|0 X w C) 00 If) O CM 00 wD) 12
*5,2
0 0 ^ ;g £
0 O _ £ TJ O 0 0 c ±= = 0_ N 0g s-° c °? sp i0 £ * 0 0 - ) x: 0 i
>» LL0 0 ^ 0 M=
‘V S - l>
CM CO
00s_0>0XI-i—<
TJC000
TJ0O0
TJ
00 CM
CM CO
£1 = 0
1 H I. i— 00 m a.
LL LL
T~ O LU LU LU LU
00 O -iiJ a O 0 **
00 T3O 0
C l
£ X O LOO CD
8 ° 0 !£
o -2~ o oS 00 >1lN E 0 0 E o
1Ll
L_0
D )c
03 >
>4—O 0XI TJX 0o TJ X2o c+->0 0 P
>» 30 TJ O0 0 aEi_0
0i_0 -4—» c
L_M— E x5 0•4— 0 «MO 0
4—► 0
CL0
0Q.4—> >%
0JJ C
0 0 o_o 0XI
Oc0
03U—TJ c ‘l- 4—
£1 0 TJ0i_ CLx 0CO 3 0 XI
CM CO
CO CM
CO CM
>»0 0
x0
3 TJ 3 i—3
TJcLU C LU HTJ i
o TJ T3 TJC (A C C C0
NVL/ 0 0 0
o 0 U0 o o oX CO 1_ 4—> X X X
<: 1 E £ £0 LL 0 0 0 0
X LL | X X X
t- O LU LU LU LU
TJC JO_0 o CL C 3 0 ^0 0 'to' o .2 cu£ -ZZ N o 73 0E C p —I- « E +■ • J= ro D- O ° ) = in O 0
0 0X) £1 o TJXI >> 0 co3
0E
4-40 0i—
U—o
0 CL 0 4-44—*c 4—> 0 3XIo
0X1_
CoL_o4—< O
H—0 0 o 44—E E 03 0I—TJ<4—o
0XI
itTS
4-4
00i—04—*0 00 0o tro 0 C 0
co on
XI XIO
CL0
0 0 i_0>, D)XI CL*3 4—» C •M 0
cro0
s0
oc0
XI 0 D )£3
0 3 O 0o > 44— XI o_J 0 (I L— O
CO CM Tt
Tf CM 00
CM ^ OO
0cXIOi
OH>-
T - O LU UJ LU LU
0 -=C S,0 ^o > .__m 0 X s0 -TT +O) ° o.^ c 0 O LO TJ 0 CO0 O X 0 'to'D)TJ 0’C C N ^ = 0 0
0a:4-*0oo0C0COI
01oCO
00004-*000
0
c0CLTJC04->00000
XLc001**
POrMCM
Sour
ce:
Aut
hor’s
com
puta
tion,
201
2/20
13

The dominance of Massey Ferguson (Brazil) under OC4 does not stem from economic
profitability or higher capacity utilisation. New Holland (EU) is the most profitable
technology under OC4 and uses the highest level of its capacity. The same tractor (New
Holland (EU)) is however second to Massey Ferguson when it comes to level of
diffusion. The long-standing brand loyalty that farmers have for Massey Ferguson and
the capability built by users over the years for its management and maintenance is key.
Finally, under OC5, the dynamics of profitability and diffusion are also not correlated.
The highly profitable New Holland (Turkey) is number two from the bottom in terms of
diffusion. The second most profitable technology (New Holland-lndia) happens to be the
most widely diffused under OC5. Whilst New Holland (EU) uses the most capacity
compared to the rest, the Chinese YTO performs poorly under all three measures. YTO
is the least profitable, has the lowest capacity utilization and is also the least diffused
(See Table 8.6). The relatively lower acquisition cost of the Indian New Holland,
compared with the Turkish New Holland, could be the driver of this diffusion pattern.
8.2.3 Explaining profit and diffusion convergence or divergence
At the small scale level, power tillers with higher profitability tend to diffuse more. One
would have however expected that with the notoriously high levels of breakdown of EE0
power tillers, even if they were profitable, users would show little interest. It is however
worth noting here that spare parts for EE0 power tillers are cheaper and easily obtained
in most villages where they are used. Therefore its repar is relatively easy. The fact that
they are also capital efficient means that the strain on household consumption during the
initial purchase is also lower. Thus for new users in Pawaga and Magugu who have not
experienced any other power tillers apart from Amec, they are very happy with it.
However, for second and third time buyers who have accumulated some resources over
the period, and have also seen other people use MM0 and MM-i machines, their tastes
and preferences have shifted upward for higher quality machines. Some of the farmers in
224

this second group of users desire to move up the quality scale, but the supply of the MM
power tillers and spare parts are limited on the market.
For example some farmers in the study sample had cash in hand for close to two years
with the hope of purchasing Siam Kubota power tillers. They have made several
telephone calls and trips to distributors in search of the machines without success. This
market constraint was confirmed when, at a national exhibition, a salesman for the main
importer of Siam Kubota informed me that the power tiller on display had already been
bought by a farmer three months ago and they had asked him to bring it around for
exhibition because they had no stocks left in stores. The supply side story is also
important in explaining this diffusion pattern where EE0 machines have an upper hand.
There are many sellers of EE0 power tillers and the quantities available on the market at
any one point in time are very high. Perhaps, if there were a balanced supply level of
MM-i and EE0 power tillers on the market, we might have observed an increasingly
balanced diffusion pattern, as farmers accumulate capital over time.
The groups of tractors in use by OC2 farmers are mainly Farmtrac-45 and Swaraj. There
are however pockets of historical brands like Fiat and Massey Fergusson (UK). There is
no active market for these historical brands currently because it might be that Farmtrac-
45 and Swaraj are serving the needs of users well or perhaps they are not available
when needed. While the profitability analyses suggest that Farmtrac-45 should lead the
way, in terms of diffusion, this has not happened. Many users attest to the fact that
Farmtrac-45 is more stable and produces more power when in use than Swaraj. Yet
diffusion of Farmtrac-45 has not been greater than Swaraj. Frequent breakdown is an
important drawback for Farmtrac-45. There are major problems with the gear box. The
carbon steel with which the gears are made is not hardened enough, and so the teeth
are lost frequently, resulting in oil leakages and constant need for servicing. This can be
time wasting and not good for a business which relies heavily on timeliness of operation.
225

Subsidies38 made Farmtrac-45 market prices lower. As a result we assume a number of
users had bought them mainly because of the lower price and not the value it can
contribute to the farm business. Aside from these challenges, spare parts39 are very
difficult to come by. Swaraj on the other hand does not break down often, and spare
parts supply is not a challenge. And as one user put it, when buying a tractor you must
look for one which gives you peace of mind; to him Swaraj does this better than the
Farmtrac-45. He however mentioned that an improvement in the gear box capacity of
Swaraj to match the engine size would be welcomed. The broad inference that can be
drawn here is that when government does business it may not do it as well as private
sector. For instance, other private businessmen argued that the non-existent of spare
parts for Farmtrac is because the staff at Suma-JKT will be paid whether they make
sales or not. But for the private business which is aware that salaries are directly paid
from revenues, there is no way they will look on as their investment goes bad.
Brand loyalty and brand reliability, as well as knowledge and skill development through
time by users of Massy Ferguson (MMO has meant that under any condition in which
they are used in Tanzania, they tend to have a higher level of diffusion than others.
Users agreed that Massey Ferguson was easy to operate and the spare parts are always
available compared with other competing brands. Therefore even many years after the
last production from its plant in Coventry, UK, users are happy to use them whether they
are produced in the USA or Brazil. Since the termination of production of medium sized
versions from the USA plants in 2008, it has meant that the next most reliable source is
Brazil. Even though it is the least profitable tractor under OC4, Massey Ferguson (Brazil)
leads the penetration levels. The total change of name from the time when Ford and Fiat
were combined to create the New Holland might have also confused some farmers, to
38 Under the Suma-JKT distribution scheme, public opinion and pressure forced the government to reduce prices to a level that farmers could afford.OQ
During two separate key informant interviewers, spare parts sellers thought I might know why the spare parts supply for Farmtrac in general was not meeting demand.
226

the extent that the demand for New Holland is not as high as demand for Ford and Fiat
where in the 1980s and early 1990s.
Until recently, not many farmers knew that it was their favourite Ford and Fiat
technologies which had been combined to produce the New Holland they see around.
Therefore the excellent performance by New Holland (EU) in terms of the BCA, has not
translated into high levels of penetration. It is worth noting that the main supplier of New
Holland in Tanzania (Hughes Motors) folded at some point and then re-entered the
market not too long ago. There is a likelihood that this break might have also militated
against diffusion. Nonetheless, the presence of New Holland is being felt again, mainly
because of its reliability. Challenges faced by Farmtrac-60 under OC4 are similar to
those discussed for Farmtrac-45 under OC3. However in addition, the fuel inefficiency of
Farmtrac-60 also makes some farmers disinterested. They argued that Farmtrac 70 for
instance had a Perkins engine from UK and was more fuel efficient than lower
horsepower ranges of the same brand made with Indian-based engine technology. It
may also be correct to say that with the recent pace of diffusion for Farmtrac 60 since
2010, if it continues this way, we will see their sales overtaking Massey Ferguson (Brazil)
very quickly.
The story does not change significantly for OC5. Neither of those machines with the
highest BCR nor capacity utilization were the most diffused. New Holland (Turkey) is the
most profitable tractor whilst New Holland (EU) has the highest capacity utilization. There
is however a mismatch between these findings and the fact that New Holland (India) is
the most diffused. In terms of quality, the Indian versions of New Holland are probably at
the bottom. Two main factors are likely drivers of the diffusion patterns observed. First, is
the fact that the Indian New Holland is ‘good enough’ for the rather difficult terrains of
irrigated clay fields and also comes at a relatively affordable price, making it the most
capital efficient after the Chinese YTO. Second, government participation in its imports
has increased supply and with an already existing open market, the spare parts
227

challenges faced by Farmtrac are generally overcome. The fact that spare parts for the
EU or Turkish New Holland tractors can be used for the Indian machines ensures that
the supply side challenges are minimised. YTO could have appealed to users much
more if the spare parts market was reliable. Often when breakdowns occur, accessing
spares for YTO is a daunting task mainly because of the importation monopoly held by
the company, AFRICATIC Ltd, Tanzania. Having discussed the factors influencing
diffusion patterns, in the next sub-section we examine the impact of choice of technique
(techniques so diffused) on low income groups.
8.3 Financing
As we shall see in the following sub-sections, farmers either use savings from their own
production, pool resources with other farmers, or borrow money from financial institutions
to buy tractors and power tillers. The first two options as a source of finance present
challenges especially to low income farmers. For instance because farm profits are also
used for household consumption, they are rarely available to finance machinery
purchases. There are also management difficulties when farmers pool resources to
jointly procure and use power tillers or tractors. Thus a more reliable source of financing
machinery procurement is borrowing. We discuss these sources in turn.
8.3.1 Farm profits and savings
For low income groups, the first and most important step to growth is access to the
inputs which enhances productivity. The obvious barrier to peasants in accessing capital
goods, as mentioned several times in this study is finance. The financial barrier tends to
vary across farms. In general smaller sized farms are more capital constrained
compared to larger ones.
228

As an identification of the financial position of small, medium and large scale farms in
terms of profits available for machine purchases, Table 8.3 computes farm surpluses40
for each of the four crops under consideration. Based on average gross margins and
associated costs for maize (Burke, Hichaambwa, Banda, & Jayne, 2011), rice (RLDC,
2009) sugarcane (Field Data, 2012) and tobacco (Kuboja & Temu, 2013), average farm
profits are generated for each of the three groups of farms: small (4.5 acres), medium
(19.5 acres) and large (70 acres). Using data from the 2007 Household Budget Survey,
annual consumption by average households for the five poverty quintiles41 are also
computed (Mkenda, Luvanda, & Ruhinduka, 2009).
Subtracting average household consumption from net farm profits gives the surpluses
available for investment. Households with smaller farms are more likely to consume a
higher proportion of their output than larger farms. This leaves little savings for
investment. Aside from sugarcane growing households, where the proportion of small
and medium scale farms to large scale farms is 50%, farmers cultivating maize, rice and
tobacco are dominated by smallholders. Small scale farms represent more than 80% in
each of the crop sub-groupings of farmers. Therefore household savings are critically
low, assuming farming is the main source of income.
Table 8.8 clearly shows that profits accruing to farming households are progressive with
farm size for each particular crop. Across crops however, tobacco outperforms the others
in all instances, regardless of the farm sizes. It is also evident that the least profitable
among the four crops is maize. This places maize producers a step below other farmers
in terms of saving for investment in capital goods. Our attention must be drawn to the
fact that maize is a very important food security crop in Tanzania, aside being produced
by the highest proportion of farmers in the country. Thus in a broader perspective, it is
40 This represents the savings made by the farm household after cost of production and household consumption are catered for.41 To allow for simplicity of the analyses, the first and second and the fourth and fifth quintiles are combined
229

more likely that cash crops like tobacco which is not very important to the majority of the
poor and cultivated by fewer and richer households (about 80,000) would have enough
resources to invest in capital goods. At the same time maize producers have limited
financial resources accruing to them as surpluses for investment. The profitability of rice
is second to tobacco, but the quantity of rice produced per annum in Tanzania is a fifth in
value terms when compared with maize.
Table 8.8: Farm size, crops, national output, household wealth and savings from farming________________________________________________________________
Food crops Cash cropsMaize Rice Sugarcane Tobacco
Cultivated area and output in TanzaniaArea cultivated (millions of Ha) 1.5 0.7 0.05 0.1Output (millions of metric tons) 4.5 1.1 2.9 0.09Current supply gap (%) 5 10 42 -
Proportion of farms by size (%) in TanzaniaSmall (<9 acres) 85 90 25 95Medium (10 to 39 acres) 10 8 25 3Large (>40 acres) 5 2 50 2
Farm profit per acre (TSH ‘000,000) 0.2 0.9 0.6 1.1Small (<9 acres) 0.9 4.1 2.9 4.9Medium (10 to 39 acres) 4.1 17.7 12.6 21.1Large (>40 acres) 14.6 63.6 45.1 75.9
Household sizesQuintile 1 and 2 5.9 5.9 5.9 5.9Quintile 3 5.0 5.0 5.0 5.0Quintile 4 and 5 3.7 3.7 3.7 3.7
Household consumption (TSH 000,000)Quintile 1 and 2 0.4 0.4 0.4 0.4Quintile 3 0.6 0.6 0.6 0.6Quintile 4 and 5 0.9 0.9 0.9 0.9
Net farm profit less consumption (TSH‘000,000)Small (<9 acres) 0.7 3.7 2.5 4.5Medium (10 to 39 acres) 3.5 17.2 12.0 20.6Large (>40 acres) 13.7 62.7 44.2 74.9
Source: Authors computation, 2013
230

Besides the fact that sugarcane is over three times more profitable than maize, the
dominance of medium and large scale farms also gives sugarcane producers a greater
impetus when it comes to capital accumulation for investment. Larger farms also provide
a greater scope for full capacity utilization. In addition, a greater proportion of sugarcane
farmers are in an out-grower scheme. The nucleus farms responsible for the
establishment of these schemes sometimes assist sugarcane farmers when it comes to
machine purchases through loans guaranteed by expected farm produce. Consequently
different producers face different levels of financial constraints, and more acute for small
scale farmers producing mainly food crops, like maize.
For some households, it is unrealistic to assume that they can save over any specified
number of years to buy a tractor, for example if the household cultivates just an acre of
land. Under the present assumptions, they may borrow to smooth their seasonal
consumption budget lines if there are unexpected income shocks. They are in deficit and
cannot set money aside to buy a tractor. Small scale maize farmers cultivating one acre
are in a deficit of about TSH160,000 per annum, and there is no room to save. For
others like large scale tobacco farmers, a year’s profit is enough to buy them several
power tillers or tractors.
One way of measuring how difficult it is for various farmers to access different categories
of tillage technologies is the number of years it will take them to save and raise enough
money for the purchase. In Table 8.8 therefore estimation is made of savings period
necessary for the average farmer to raise money for a particular machine under their
OC. Generally for all OCs, farmers cultivating an acre of land per year are not likely to
ever raise enough money during their lifetime to buy a power tiller or tractor. It is
however possible for a number of farmers to come together and combine resources to
buy a single machine to be used by all members. Clearly because of the need for
timeliness of farm work and the fact that power tillers and tractors are indivisible, the
smaller the group, the better. Tractor and power tiller categories that can better support
231
these resource pooling strategies with the time constraint of land preparation in mind are
EE ones. Though resource pooling strategies and use of own farm profits are possible
alternatives for buying machines, the challenges involved in managing such groups
makes it unattractive. A more viable way is for individual farmers to use bank loans, a
point we shall return to later.
Similar arguments can be made for the other OCs. For OC2, profits for very small maize
farms are so low that coming together to buy a tractor of any size by a group of famers
will be a difficult thing to do. Thus one way of getting around this problem is to hire
equipment when it is needed. But as we saw throughout our discussions in earlier
chapters, under OC2, there are very few MM machines on offer for hiring by rural
entrepreneurs. Formerly, there were smaller horsepower versions of Massey Ferguson,
International Harvester and Fiat (mainly second hand from the EU and sometimes
Poland) for farmers to hire. However, with farms in Europe becoming larger in size, these
options are becoming limited.
Present day tractors like New Holland (EU, Turkey or Brazil) are all usually above 50Hp.
Using tractors which have a horsepower higher than 50 on mainly sandy soils can be
inefficient. This inefficiency stems from the fact that the excess horsepower could have
been used on other fields where it is needed most. The other alternative would have
been to buy Kubota tractors from Japan. Kubota has a wide range of horsepower which
can be fit for purpose under OC2. The prices of brand new Kubota are however
extremely high and second-hand versions are non-existent for the Tanzanian farmer.
Thus the alternatives left are the EE-i and EE0.
Persistent across farm sizes under OC2 is the fact that it takes approximately 30% more
time for farmers to save and buy an EE0 than to buy an EE-i machine. Thus in terms of
how quickly OC2 farmers can save and buy a machine, EEi gives them a greater
232
advantage. But the fact that EEi machines are bedevilled with a poor spare parts market
makes them unattractive.
The average medium-sized maize farmers wanting to buy an MM tractor for their
operations will take close to two decades to save and realize this dream. If they wished
for an EE machine it will take a less than a decade. As we saw earlier, the BCA measure
of profitability under OC3 suggests that EE-i (Massey Ferguson- Pakistan) machines are
the most profitable. Thus it may be an unnecessary waiting time to buy a Finish Valtra or
a Brazilian Massey Ferguson, when Massey Ferguson (Pakistan) can be obtained within
a shorter time of savings or by a fewer number of farmers coming together. On the other
side of the coin, tobacco producers under OC3 can go for machines from either source.
They have the resources and it takes a little over 3 years for medium-sized farmers to
buy an MM-i tractor. However, within the same period, they could have also obtained 3
machines from EE-i and perhaps created more jobs in the value chain.
The story is consistent under OC4 and OC5. For farms operating on 1 to 3 acre plots, it
is difficult to buy their own machines, except through selling of assets or other financial
arrangements. They will have to settle for hiring and if the differences in prices charged
by MM and EE machines is anything to go by, then we expect small farmers who are
capital constrained to be more interested in EE machines. Rice farmers can generally
save faster and buy tractors more easily than their sugarcane counterparts. If it takes 2
years of savings for a rice farmer under OC4 and OC5 to buy a tractor, it will take a
sugarcane farmer 3 years. Across categories of technologies, EE0 users take
approximately a third of the time taken by MM0 users to save and buy their tractor under
OC4 and OC5. See Table 8.9.
These findings certainly have implications for policy, especially when it comes to
government assistance. Fundamental questions being raised include which farmers are
vulnerable and thus deserve assistance and what are the likely outcomes for such
233

interventions? In the next sub-section, discussions on debt financing of capital goods is
discussed with a view of knowing how many machines can be purchased with all the
loans available vis-a-viz the source chosen.
Table 8.9: Operating conditions and number of years required to save by small, medium and large scale farmers for the purposes of purchasing the different technologies________________________________________________________
TechnologyFarm size/savings period (years)
small medium LargeMMO 4.3 0.9MM1 3.5 0.8
OC1 EE1 2.2 0.5Rice EEO 1.6 0.3
MMOMM1
OC2 EE1 31.8 5.2 1.3Maize EEO 42.3 6.9 1.8
MMO 18.6 4.8MM1 19.5 5.0
OC3 EE1 7.4 1.9Maize EEO
MMO 3.2 0.9MM1 3.3 0.9
OC3 EE1 1.3 0.3Tobacco EEO
MMO 18.8 4.1 1.1MM1 18.3 4.0 1.1
OC4 EE1 6.7 1.5 0.4Rice EEO
MMO 27.7 5.8 1.6MM1 26.9 5.7 1.5
OC4 EE1 9.9 2.1 0.6Sugarcane EEO
MMO 18.8 4.1 1.1MM1 14.8 3.2 0.9
OC5 EE1 12.4 2.7 0.7Rice EEO 6.5 1.4 0.4
MMO 27.7 5.8 1.6MM1 21.8 4.6 1.2
OC5 EE1 18.2 3.8 1.0Sugarcane EEO 9.5 2.0 0.5
Source: Author’s computation, 2013
234

8.3.2 Commercial Bank loans and Agricultural Input Trust Fund
As demonstrated in the discussions in Section 8.3.1, saving to buy a machine can
sometimes be challenging for small scale farmers. Again group formation that attempts
to pool resources also has its own challenges. Thus a more viable approach is for the
farmer to borrow to finance investment. This section looks at the opportunities available
to the farmer by financial institutions in Tanzania.
Commercial bank loans that go to agriculture per annum are between 10% and 15% of
the total for all sectors in the Tanzanian economy. In 2011 when total commercial bank
lending stood at TZS7.6 trillion, at least TZS1.15 trillion went to the agricultural sector.
This was to finance investment in land, irrigation and irrigation infrastructure, labour,
seeds, agrochemicals, processing, marketing, draft power, implements and farm
machinery. If we assume that farmers allocate 90%42 of these loans to all other inputs
except mechanical tillage equipment, then about TZS115 billion will be available for the
procurement of power tillers and tractors. Let us assume for the sake of our discussion
that this allocation to farm machinery can be spent only on the five operating conditions
in this study and each operating condition is entitled to a fifth of the total amount. Then
by simple proportion computations, all producers in each of the OCs have access to
TZS23 billion to invest in MM or EE power tillers or tractors suitable for their operating
purposes. Table 8.10 gives a breakdown of the number of power tillers and tractors from
MM or EE sources that can be bought with these loan allocations.
From the last two columns of Table 8.10, it is clear that with the same amount of money,
all small scale farmers cultivating rice under OC1 can purchase twice as many power
tillers from EE than if they chose to do so from MM sources. Farmers under OC2 to OC5
can acquire four times as many tractors from EE sources than they would from MM
sources. These proportions have implications on income, employment and skill
42 For example in the United States about 8.3 percent of farm expenditures went to farm machinery and other mechanical power in 2012 (USDA- National Agricultural Statistics Service, 2013).
235

development of value chain participants. We shall discuss these in turn later in this
section.
Table 8.10: Financing MM and EE procurement with a fixed annual loan from banks
Loans perTotal farm Tech Tech Potential
Tech loans TZS TZS cost TZS purchases(Trillions) (Billions) (Millions) (count)
MMO 16 1438OC1 MM1 23 13 1769RICE EE1
EEO86
28753833
OC2 MMOMAIZE MM1 23EE1 18 1278
EEO 24 958MMO 65 354
OC3 MM1 11.5 68 338MAIZE EE1
EEO**26 885
MMO 65 177OC3 MM1 11.5 68 169TABACCO EE1
EEO** lO26 885
MMO 70 165OC4 MM1 11.5 68 169RICE EE1
EEO**25 920
MMO 70 165
OC4SUGAR
MM1EE1EEO**
11.5 6825
169920
MMO 70 165OC5 MM1 11.5 55 209RICE EE1
EEO4624
250479
MMO 70 165OC5 MM1 11.5 55 209SUGAR EE1
EEO4624
250479
**Loan allocation for cells without brands have been added to their closest match for the computations
Source: Author’s computation, 2013
236

In addition to bank loans, the Agricultural Input Trust Fund of Tanzania also sets aside
some money for farm machinery purchases. Whilst AITF does not decide for farmers the
kind of machines they should buy, their grant limits indirectly influences the farmer’s
purchasing power, and consequently the bundle of power tillers and tractors they can
afford. Any farmer applying for an AITF loan is entitled to at most (TZS37400000). With
this amount, it is practically impossible for any farmer to buy an MM tractor at current
prices. When the farmer adds his/her 20% down payment, the highest quality they can
get are EE-i tractors. In the case of power tillers, this figure can buy as many as six EE0
technologies as against two MM0 ones. If employment and distribution of growth gains is
of concern to economic agents, then these dynamics are also crucial for policy and
practice.
8.3.3 Impact of choice on actors in value chain
Table 8.11 to 8.15 illustrate simulations of output and value chain outcomes that are
likely to be observed when farmers within the different OCs spend investment resources
available to them for machinery purchases on MM0, MM1f EE-i or EE0 technologies.
There are potential outcomes on the quantities of power tillers and tractors that could be
purchased per year (as shown in Table 8.10) and the number of acres that can be tilled
per annum. There are equally important effects on jobs created along the value chain.
Under each OC, Tables 8.11 to 8.15 show how many dealers (importers of machinery)
are required to manage the importation; farmers (owners) required to man the tractors
for hiring or use on their own farms; operators to use the power tillers/tractors for work;
and repairers to maintain them when they break down. The jobs so created, also impacts
on incomes and capability development through learning by doing. In this sub-section
these issues are discussed for each OC in turn.
The discussion here assumes that currently 500 power tillers and 300 tractors are
imported into Tanzania annually. We further assume that the brands used for the
computations under each OC are typical for each of the four classification of machine
237

source, MM0) MM,, EE, and EE0. Thus the acquisition costs used in the computations
represent the average price of technologies within those sources. Dealers participating in
these imports are 42 in number. Each power tiller or tractor employs at least one
operator per time and there are on average of 4 repair shops in communities where
power tillers and tractors are used. Each shop has one or two workers, usually the
repairer and his apprentice or just the repairer. There can however be more workers
especially for bigger repair shops in larger communities. Area cultivated by the machine
is chosen as a measure of output instead of crop harvested because of the multiple
factors associated with computing the partial contribution it makes in a stream of other
input variables. The computations in Tables 8.11 to 8.15 are based on these
assumptions.
Generally, moving down within columns of OC1, there is an increase in the number of
acres that can be tilled with the machines bought given the available financial resources.
Consequently, the number of people who are employed for each group of actors in the
chain also increases. For instance, under OC1 spending all the farms’ investment
resources on EE machines will provide jobs for more than twice as many dealers than if
the resources were used for MM machines. Also farmers who will own and manage
power tillers under OC1 when MM, machines are bought are about a third of the number
that will be employed if EE0 machines were chosen. A similar observation is made for
tractor drivers on farms and repair shops in each of the communities where these
machines are going to be used. See Table 8.11.
Table 8.11: Choice under OC1 and employment effects
TechTillage
(acres ’000) Dealers Owners Operators RepairersMM0 141 60 1438 1438 12MMi 197 74 1769 1769 14EE, 244 121 2875 2875 23
OC1 Rice EE0 291 161 3833 3833 31Source: Author’s computation, 2013
238

Under 0C2, where there are only EE machines under review, Table 8.12 shows that
when EEi machines are chosen over EE0 there is more room for higher increases in
tillage output and employment generated along the value chain. The EE-i machines
generate more than twice the output in terms of area tilled per season when compared
with the EE0. Again, a little above two-thirds of dealers required to handle the EE-i
tractors will be needed than if the technique chosen are EE0. The number of rural
enterprises that will be formed, operators employed and repairers needed are all in
similar ratio in favour of the EE1 tractors.
Table 8.12: Choice under OC2 and employment effects
TechTillage
(acres '000) Dealers Owners Operators Repairers
OC2
MM0MM!EE! 607 89 639 1278 17
MAIZE EE0 282 67 479 958 13Source: Author’s computation, 2013
Under OC3, the amount of money available for purchasing these technologies is shared
between maize and tobacco farmers and the outcomes on the value chain are presented
in Table 8.13. The area that can be cultivated under OC3 when EE-i machines are
selected is more than double the area that could be cultivated if either MM0 or MM-i
machines are selected for both maize and tobacco farmers. Consequently, close to three
times as many dealers are needed to handle the tractor imports if EEi versions of
technologies are chosen as opposed to the MM0 or MM-i versions. The ratio of
enterprises created as well as operators required to man the machines are well over 2:1
in favour of the EE-i tractors. Twice as many repair shops are also likely to be created if
the EEt machines are chosen over any of the two MM versions on maize or tobacco
farms.
239

Table 8.13: Choice under OC3 and employment effects
TechTillage (acres
’000)Dealer
sOwner
s Operators RepairersMM0 92 12 89 177 3MMi 88 12 85 169 3EE-i 210 31 221 442 6
OC3 Maize EE0MM0 92 12 89 177 3MMi 88 12 85 169 3
OC3 EE-i 210 31 221 442 6Tobacco EE0Source: Author’s computation, 2013
Under OC4 similar observations are made to those in OC3. EE-i machines procured with
the financial resources available to the farmer cultivate more area per season and
require close to three times the number of importers needed to handle MM0 and MM-i
machines. In a similar fashion, for every one operator that can be employed when MM
machines are chosen, EE will employ three. The repair shops so required also follow a
similar trend. These estimations follow the same structure for both rice and sugarcane
farmers under OC4. See Table 8.14.
Table 8.14: Choice of technique under OC4 and employment effects
TechTillage (acres
’000)Dealer
sOwner
s Operators RepairersMMO 61 12 82 165 2MM1 47 12 85 169 2
OC4 EE1 111 32 230 460 6Rice EEO
MMO 61 12 82 165 2MM1 47 12 85 169 2
OC4 Sugar EE1 111 64 230 460 6Cane EEOSource: Author’s computation, 2013
Moving down the columns (away from matured markets to emerging economies
technologies) under OC5, there is a general increase in the number of acres that can be
tilled per season. This in effect influences the number dealers in the value chain required
for importing the machines as well as the enterprises created. Operators and repairers
also increases as one moves from MM machines to EE ones. See Table 8.15.
240

Table 8.15: Choice of technique under OC5 and employment effects
TechTillage (acres
’000)Dealer
s Owners Operators RepairersMMO 46 12 82 165 2MM1 54 15 105 209 3EE1 52 18 125 250 3
OC5 Rice EEO 99 34 240 479 6MMO 46 12 82 165 2MM1 54 15 105 209 3
OC5 EE1 52 18 125 250 3Sugarcane EEO 99 34 240 479 6Source: Author’s computation, 2013
The foregoing discussions suggest that there is more opportunity to increase production
through area expansion when EE machines are employed with the same amount of
capital. With area expanded, more labour in the different links in the value chain are
needed to fill the employment spaces created. As these participants in the value chain
get the opportunity to participate in importing, managing, operating and maintaining
these machines, opportunities for capability building and absorptive capacity develops.
These opportunities are opened up to more people if EE machines are selected. In the
next section, we discuss how fit the choice made is for purpose, their impact on
environment and the health of users as rated by owners of the machines.
8.4 Fitness for purpose, environment and health issues
The best economic agent to judge the fitness for purpose of a particular technology is the
user. In this case, the farmer who uses the power tillers and tractors for his production
and transportation activities can judge their appropriateness. Outcomes on the
environment and the effect on health and safety of users can be best judged by those
who come into contact with the machine as it is being used. In this sub-section, we refer
to ordinal (ranking) responses obtained from the survey data using all the respondents.
The respondents were asked to rate their machines in relation to the environment in
which they are used on a Likert scale of 1 to 7. Here, a response of 1 meant that the
machine was inappropriate for the variable in question, a response of 7 meant that the
machine was appropriate. The responses from this exercise are summarised in Figure
241

8.1 and 8.2 by computing the mean rank for each variable by the source of the machine
(MM/EE) and the type (Power tillers/Tractors). In addition, a t-test of the mean responses
are computed to find out whether the differences observed across groups are significant
or merely due to chance.
8.4.1 Fitness for purpose
a. Power tillers
In the case of power tillers appropriateness of machines in relation to the soil on which
they worked was significantly different at the 1% confidence level. MM machines were
rated by the users to be more appropriate than the EE ones in terms of how well it resists
soil debris and works through very difficult terrains without being damaged.
Consequently, the quality of ploughing was in favour of MM machines at the 5%
confidence level; whilst it came as no surprise that the quality of paddling was
inconclusive since EE power tillers on average come with higher horse power than MM
ones, and in a way compensates for some of its inefficiencies thereof. Power tiller users
of MM rated their machines very high when it came to durability and quality of machine
and this was significantly different from the EE machine user ratings at the 1% level.
Users also found EE machines more appropriate in terms of acquisition cost in relation to
their incomes and this was significant at 1%.
A more challenging outcome which is important for policy is the fact that EE power tiller
users found it more difficult to get an operator who was interested in manning their
machines for them and this was significant at the 5% confidence level. Because of the
frequent breakdown of EE machines, operators shy away from them. Some operators
are also uncomfortable with the relatively high weight of EE machines which puts a lot of
stress on their muscles. Spare parts availability for EE power tillers is rated by users to
be more of an issue than for the MM machines at 10% significance level. See Figure 8.1.
242

Figure 8.1: User satisfaction, power tillers (ranks on a scale of 1 to 7)P o w e r t i l le rs
S c a l e o f o p e r a t io n
T e c h n o l o g y in u s e
A c q u is i t io n co
la b i l i ty o f s p a r e s *
E a s e o f o p e r a t io n
P lo u g h q u a l i t y * *
P a d d l e q u a l i t y
u ra b i l i ty a n d q u a l i t y * * *
S o il t y p e ’E a s e o f f in d in g a n
o p e r a t o r * *
M a i n t e n a n c e c o s t
Significance level: 1% * * * , 5% * * , 10% *
Source: Field work, 2012/2013
b. Tractors
At the 10% confidence level, user rating of EE tractor performance during paddling was
better than the MM ones. However, users of MM tractors found it to be of higher quality
and durability than their EE counterparts at the 1% confidence level. The cost of
maintaining tractors were however significantly different for the two sources and in favour
of EE users. See Figure 8.2.
P a d d l
Figure 8.2: User satisfaction, tractors (ranks on a scale of 1 to 7)T r a c t o r s
M M E E
S o il t y p eE a s e o f f in d in g a n _ - ___ ,___ ..__a c A v a i la b i l i ty o f s p a r e so p e r a t o r ° ^
M a i n t e n a n c e c o s t * * % -'Ssx,. E a s e o f o p e r a t io n
S c a l e o f o p e r a t io n P lo u g h q u a l i ty
T e c h n o l o g y in u s e
A c q u is i t io n
e q u a l i t y ’
u ra b i l i ty a n d qu a lity '*
Significance level: 1% ***, 5% **, 10% *
Source: Field work, 2012/2013
243

8.4.2 Health, safety and environment
a. Power tillers
Manufacturers of Kubota, and obviously Siam Kubota have through research established
that beyond the range of 12HP and 14HP, the vibration and the force that the moving
power tiller exerts on the muscles and indeed the whole body of the operator is
extremely discomforting. It thus has long term occupational hazards implications for
farmers to use power tillers which are beyond this range of HP. Thus for most Kubota
power tillers in use in Tanzania, the HP is 12. For Siam Kubota, the average HP is 14.
Power tillers from Korea (Kukuje and Daedong) are also usually in this range. The
Kubota group has however invested in innovation to ensure that the gears are efficient
enough so that the pressure exerted per unit area of torque is comparable with other
power tillers which may have higher horse power. The Chinese power tillers are usually
of between 16Hp and 20Hp. The continual use of power tillers of high Hp and its
associated high vibration is known to have short term discomfort such as body aches
and headaches on the user. In the long run, both the spine and the nervous system of
the user could be damaged.
From the least to the highest in terms of weight, it is in the order of Siam Kubota, Kubota,
Daedong (Kukuje), Greeves, JST Shakt, and Amec (Dongfeng/Changchai/Changfa/JD)
(455 to 490kg). Therefore, an operator using an Amec power tiller would require more
energy to push behind it. For the purposes of rotavation, both Kubota and Amec make
provisions for the operator to sit, with the addition of a third wheel and seat. However,
more often than not, especially in the case of the Amec, this facility gets damaged in the
first few months of use. Siam Kubota does not have this facility. Sometimes (or most
often) even when the seating facility is available to the operator, they prefer to disable it
and push the machine for ease of operation. In this way, the operator exposes himself to
the dangers of cuts from loose metallic parts of the machine. This problem is quite
common with the Amec group, where many of the parts are not tightly fitted and thus
244

easily coming off under very little pressure from iron pan and heavy soils. The operators
report that users of Amec are more likely to sustain bruises and cuts on their feet than
the Siam Kubota whose parts are tightly fitted and rarely come off during usage.
Over-heating is also a serious issue both for the progress of tillage operations and the
comfort of the operator (sometimes resulting in feverishness after a day’s work). While
very high temperatures of the engine could create a lot of discomfort for the operator, it is
also very important in the work efficiency sense. That is, under very high levels of over
heated engine, the machine must be stopped for at least an hour to prevent the shafts
and the engine parts from being damaged. This could take valuable time from the
operator, requiring that work that could be done in say 3 hours will now be done in 4
hours. This over-heating also requires that after some specified period, the radiator water
is topped up or changed completely. This is also a common fault of most of the Chinese
machines. Indian ones are relatively better. Operators argue that it is very rare for them
to use their Amec machines for more than 2.5 hours without having to stop it to let it cool
down. For Siam Kubota users, there is no such thing as resting the machine while in use.
For their 8 hour day job, they only stop the machine when they are tired themselves. All
they need to do is to follow the manufacturer’s routine maintenance instructions.
Other pollutants such as incompletely combusted fuel in the form of smoke, oil leakages
and noise levels are also to varying degrees a cause for concern for both the user and
the environment. Amec is quite noisy and irritating to the ear. What one cannot say from
this research is whether these noise levels are at a threshold that can damage the ear
drum of the user. By contrast, Siam Kubota is not very noisy, but then again the
acceptable levels of noise decibels may be controversial. However, in relative terms, the
Amec engine is more likely to create hearing impairment for the user over time than the
Siam Kubota.
245

For either of the two machines (Amec and Siame Kubota) of the same age, smoke and
oil leakage levels from the Amec is higher. The smoke does not only create discomfort
for the eyes of the user, but also contributes to the greenhouse gas accumulation in the
long run.
While the release into the soil of leaking grease and machine oils onto the rice fields may
be minimal in the short run, long term accumulation may be of concern. In as far as
scrap metals is concerned, for every kg that Japanese Siam Kubota assembled in
Thailand releases into the Tanzanian environment, the Chinese Amec releases 3.5kg,
that is to say for every one purchase a user makes of Siam Kubota, another user buying
an Amec must purchase at least three to make up for the life span of the Siam Kubota.
To add to this discussion, one may also draw on how often the user must replace Amec
spare parts. Evidence from a focus group with women users of the two groups of
machines in the Mabadaga village suggests that in the cultivation season of 60 days per
year, the users of Amec are likely to visit the spare parts shops as many as 18 times
compared with 2 or 3 times by their Siam Kubota/Kubota counterparts.
b. Tractors
Across the two groups of tractors, none of the environmental measures were assessed
to be different from the other. However, EE tractors vibrated more and generated more
noise than the MM ones. Because most of the MM tractors were older, they also
generated more smoke than the EE ones. In terms of release of exhaust smoke, since
some EE machines consume more fuel per acre, there is the likelihood that in general
their combined effect of total smoke released into the atmosphere could be higher. See
Table 8.16 below.
246

Table 8.16: Pollution and ergonomic IndicatorsSource and farmer rating a
Scale of Technology Indicator MM EE p-value1. Power Tillers Vibration 3.06 4.13
Noise 2.89 4.27 ***Smoke 2.47 4.00
2. Tractors Vibration 2.78 3.02Noise 3.68 3.23Smoke 3.97 3.22
a1-lowest; 2-very low; 3-low; 4-neutral; 5-high; 6-very high; 7-highest Significance level: 1% ***, 5% **, 10% *
Source: Field work, 2012/2013
8.5 Conclusion
This chapter has shown that a direct relationship between physical coefficients,
profitability and diffusion is complex. It is however evident that the technologies which
are likely to be diffused depends mostly on the incomes of farmers and their access to
finance. The availability of the machines and their spare parts upon demand is also
crucial. Thus in a predominantly smallholder environment where farm profits are low,
demand for tillage equipment is dictated by how much savings the household can make.
There are also limited opportunities from commercial banks for capital goods investment
financing. With expanded output, employment, and capability building at the forefront of
national policy, a choice of technique that gives as many people the opportunity to
participate in the input market, production process and services associated with the
agricultural sector is important. Computations about possibilities in terms of output,
income and employment increases that are likely to unfold when EE machines are
chosen over MM are also key. However, the broad outcomes are clear- most national
and farm level objectives can be reached twice as fast if EE machines are chosen over
MM ones. The challenge is how to remove bottlenecks like unreliable spare parts supply
especially in the case of tractors and in the case of EE power tillers and tractors, the
unavailability of operators who are willing to staff such machines.
247

Chapter 9 : Summary, Conclusion and Implications for Policy
9.1 Introduction
This thesis examined the distinctive nature of tillage technologies from different sources
outside Tanzania: mainly Matured Markets (MM) and Emerging Economies (EE). To do
this, four research questions were defined related to the following issues: mode of
transfer of technologies; penetration level and extent of use of the technologies;
distinctive features of technologies; and how pro-poor the technologies are. In this
Chapter, we present the findings of the study and discuss the implications they have on
theory and policy. First the general findings about the nature of the sources, scale and
users of technologies are presented. This is followed by a brief discussion of the roles
each actor play and the gaps that exist between what is expected of an actor and what
they are currently able to do within the chain of technology transfer. Detailed findings per
each research question are then presented including a clear and precise answer to each
question. The implications for theory and policy are then analysed. After some directions
for future research are given, a brief conclusion is made.
9.2 Brief summary
Growth in Tanzania has resulted in disproportionate gains to different sections of the
population (Chapter 1). Tanzania is a relatively poor country dominated by smallholder
farmers operating under resource constrained conditions. The industrial sector is unable
to produce mechanical tillage technologies locally and the country must import them from
abroad (Chapter 2). The importance of mechanical technologies on farms in promoting
growth is well recognised and there is a choice to be made from advanced country and
emerging economy technologies. The effectiveness of this choice will have significant
ramifications for poor producers. The rise of China and India in the development and
generation of technologies could be a game changer in the choice environment (Chapter
3). To understand how this choice is made and the outcome of the choice, an empirical
study targeting importers, financial institutions, repairers, regulators and users is
248

required. Economically more profitable technologies are likely to diffuse, and so an
estimation of this profitability is also needed (Chapter 4).
There are four emerging and distinct sources of technologies being used by
small/medium/large scale rice, maize, sugarcane and tobacco farms in Tanzania. Their
farms are either irrigated or rain-fed and they employ either small machines (power
tillers) or large machines (tractors) (Chapter 5). The main modes of transferring
technologies into Tanzania are through trade, FDI, aid and licensing. In the past, the
main sources from which technologies were transferred to Tanzania were the EU, USA
and Japan. Presently, more tillage technologies are imported from China, India and
Pakistan. The advanced country machines are pre-dominantly engaged in cash crop
production whiles those engaged in food crops are from emerging economies (Chapter
6).
The advanced country machines are high quality and come at a higher cost compared
with the emerging economy ones. Availability of spare parts is an issue for emerging
economy tractors whilst, advanced country power tillers are also bedevilled with the
same problem. Small machines are generally more profitable than large ones. Most large
machines, regardless of their source do not break-even in terms of profitability. However
emerging economy tractors are generally less profitable than their advanced country
counterparts (Chapter 7). That said, emerging economy machines are more pro-poor
because they are used mainly by food crop producers. Because of their low cost,
emerging economy machines reduce the entry barriers for users in terms of cost and the
time required to save towards their purchase. Emerging economy machines are however
less friendly to the environment and users by releasing more fumes, noise and vibration
during usage. However, they create more room for employment per unit of output and for
a fixed amount of capital more users can have access and cultivate a greater land area
when compared with matured market ones (Chapter 8). In the next two sub-sections we
present some general findings of the study.
249

9.2.1 Scale, sources, categories and users
The study found that there were two broad scales of mechanical tillage technologies
being used in Tanzania: power tillers and tractors. Power tillers are two-wheeled walk
behind machines with horsepower between 12 and 24. Within power tillers, there are two
kinds: those whose implements are propelled by the engine through a drawbar and those
propelled by the motion of the machine. Tractors usually come with a horsepower of 25
and above. Based on the wheel system there are three kinds of tractors: 2WD, FWA and
4WD.
Power tillers and tractors are imported from two main sources: Matured Markets (MM)
and Emerging Economies (EE). Major economies participating in the MM sources are
EU, Japan and USA. India, China and Pakistan are the major EE countries supplying
tractors and power tillers to Tanzania. Some of the power tillers and tractors are also
imported from Thailand, Brazil, Turkey and South Korea. The Turkish and Brazilian
companies are mainly subsidiaries of businesses in the USA or Europe or sometimes
operating under license. From these two main sources, MM and EE, four broad
categories of technologies were classified: MM made in the North (MM0); MM made in
the south (MM-i); MM adapted to EE made in the south (EE-i); and EE made in the south
(EE0). Altogether, there were close to 38 brands of tractors and power tillers on the
Tanzanian market. These machines were used under different operating conditions
characterised and summarised in Table 9.1 based on discussions in section 5.6.
Table 9.1: Characteristics of operating conditionsOCs Farm size Crops System Hp.
OC1 Small Rice on clay soilsMaize intercropped with pulses
Irrigated up to 24
OC2 Small, Medium, Large sandy soilsMaize and Tobaccointercropped with vegetables
Rain-fed 25 to 49
OC3 Medium, Large loamy soils Rain-fed 50 to 75 60 and
OC4 Small, Medium, Large Rice and Sugarcane clay soils Rain-fed above 60 and
OC5 Small, Medium, Large Rice and Sugarcane clay soils Irrigated aboveSource: Based on discussions in Section 5.6
250
9.2.2 Role of actors and institutions
In Chapter 4, we showed that different actors within the power tiller and tractor markets
in Tanzania have different roles. These actors consisted of government institutions,
manufacturers, dealers, financial institutions, repairers and users/user groups.
Government, government institutions and donors which tend to act as a referee, govern
or support the market in an attempt to control imperfections. Aside from government all
other actors are primarily driven by the Schumpeterian motor of profit maximisation.
Once equipped with information on farmer needs, agents within the power tiller and
tractor value chain are set for the importation, distribution and maintenance of tillage
technologies with the view of making profit. To achieve this goal requires that the
challenges presented within the market must be minimised while satisfying the needs of
the final consumer.
Government’s role as a regulator and as a facilitator has been pervasive. Government
engages in the setting up of trade rules such as subsidies and taxes. It also provides
extension services through the Ministry of Agriculture and Cooperatives to users. The
formal institutions responsible for training operators and mechanics are also run by
government. Quality testing and assurance are all maintained by the institutions set up
by government. More recently, research and design of tractor prototypes have also been
undertaken by government institutions, with field trials being carried out presently. One
key gap between what governments ought to do and what it is able to do include the fact
that testing rules which are supposed to ensure that the right standards of machinery are
imported into the country are not strictly enforced. In cases when they are applied, test
results are not published for the benefit of prospective buyers.
Manufacturers on the world market produce mostly for their own countries and export a
few tractors to other countries. For instance only about 5% of all the tractors produced in
India are exported. However some manufacturers including M&M have recently opened
outlets in Tanzania with the view of studying the East African market for further
251

expansion. The same company has signalled its intentions of starting an assembly plant
soon.
Critically, spare parts supply for MM power tillers and some EE tractors are major
challenges within the market that can be attributed to manufacturers and their rules of
engagement with importers. The very low quality of spare parts, especially for EE power
tillers and tractors is also a problem.
In all, there are 42 dealers engaged in the importation and distribution of agricultural
machinery in Tanzania. They are mostly concentrated in Dar es Salaam but have
affiliates and networks across the country. The MM dealers have a very long history in
the country, whilst the EE ones are relatively newer but are growing quite rapidly. Some
of the dealers have taken advantage of the subsidies given by government on tractors
and power tillers to import the farm machinery. However, because the subsidies do not
cover the flow of spare parts needed to cover the entire lifespan of the machines, some
dealers only sell the tractors and refuse to import the needed spare parts. This creates
shortage of spare parts, and the few dealers who import them therefore charge very high
prices.
The main forms of finance for buying farm machinery include personal savings of
farmers, resources from co-operative groups, government trust funds and commercial
banks. Commercial Banks are the most popular sources of financing machinery
purchases. The average interest rate for buying agricultural machinery ranges from 8 to
20% depending on the source. There is evidence from the survey that more users of MM
machines borrow money to buy their machines than EE users. Commercial Banks only
lend money to farmers who have a minimum acreage of 10 acres when they want to buy
power tillers or 40 acres for those wanting to buy tractors. This criterion excludes a lot of
farmers from being able to own a tractor or power tiller. There is also a down-payment of
20% to be made and this adds to the challenges faced by prospective buyers. What is
252

quite worrying is that this criterion is across the board whether the machine is of MM or
EE origin, without taking cognisance of the fact that EE machines are generally lower
cost.
The users of tractors and power tillers are small, medium and large scale farmers. The
small scale farmers usually have food security objectives, and then sell the surplus. The
medium and large scale farmers have greater market orientation.
Repairers deal directly with the owners and their operators and provide a critical service
to keep the machines running. About 65% of incomes obtained by repairers per annum
come from the service they provide to EE machine owners. There is a higher tendency
for more experienced power tiller operators to be attracted to MM machines than EE
ones. This makes the already fragile EE machines more susceptible to damages during
usage.
9.3 Originality of thesis and answers to research questions
In the past four decades, researchers in the area of technical choice concerned with
appropriate technology, development and inclusive growth undertook various empirical
studies to compare advanced country technologies with indigenous ones (Bhalla, 1981).
They further engaged with how producers in poor countries could make an appropriate
choice from these two sets of technologies (Schumacher, 1973; Emmanuel, 1982;
Eckaus, 1987). General conclusions were that indigenous technologies were more often
than not inefficient. Advanced country technologies were found to be efficient but
because they had been developed with rich societies in mind developing country
production infrastructure and market characteristics were inappropriate for developing
economies. The call then was that new technologies which were medium scale, easy to
operate and relied less on heavily built infrastructure should be developed and made
available to poor producers in developing countries. The success stories of these
initiatives by developing country governments and the donor community in general
253

yielded minimal results, and with time the movement died down. Over the same period, a
third set of technologies have evolved from emerging economies such as India and
China, but has received very little attention in terms of how they compare with the
advanced country and indigenous technologies, a research gap that needs attention.
In the last two to three decades capabilities and skill sets for the development and
manufacture of production technologies in emerging economies, mainly China and India
have seen substantial growth. Through investments in R&D, education and emphases
on producing to meet the demands of a large market with a growing but smaller
purchasing power compared with advanced countries, less robust but ‘good enough’
technologies are being made available to users in these emerging economies.
Because China and India are in themselves developing, we believe that the technologies
they produce for their own production environment may hold the key to unlocking
economic and social change through higher productivity levels that have been elusive in
other developing countries, particularly SSA. Biggs et al., (2011) have for instance
shown that Japan and Korea with all their industrial advancement have failed to develop
machines that will create farm mechanisation technologies needed by developing
countries in Asia. It was the Chinese industry which has created technologies that have
transformed small scale agriculture in Bangladesh, India and Nepal- an experience
which we believe could occur not only in SSA agriculture, but also other sectors including
wood and metal working and clothing and textiles industries. There is however limited
research in this area on SSA either to confirm or deny the potential that exists for
Chinese and Indian technologies to contribute to increased productivity on the African
continent.
The originality of this thesis therefore lies in the fact that it has uniquely compared
emerging economy machines with advanced country ones to examine the hypothesis
that Chinese and Indian tillage technologies could be useful to poor producers in more
254
ways than those from the EU, Japan and the USA in SSA. Using Tanzanian agriculture
as a case study, we have addressed four research questions and demonstrated that
emerging economy sources of machines may not address all the tensions and needs of
the farmer and his/her environment. In so far as access for low income groups is
concerned they provide a stepping stone for the poor producer and other actors along
the value chain to expand output, increase incomes and develop skills and competences
that advanced country machines may not afford them.
Table 9.2 summarises the answers to the four research questions set out on page 8 of
Chapter 1 of this thesis and the locations in this thesis where they are examined. First,
on the question of mode of transfer, aid/government support, trade, and FDI/licencing
are key conduits for technology imports. However, trade has been very important for EE
machines whilst aid/government support has been found to be key for MM machines
especially the small scale ones. Second, in terms of penetration and extent of use, EE
machines are more popular when it comes to small scale power tillers than MM ones.
However the total stock of MM tractors is known to be greater than EE ones though we
are recently witnessing EE tractor numbers increasing more rapidly than MM ones.
Third, MM machines are generally superior in terms of engineering performance and
efficiency in terms of output when compared with EE ones. Nevertheless the MM
machines are capital intensive and involve higher maintenance costs because of the
higher cost of spare parts and repairs. Finally, for the fourth research question we find
that EE machines are more pro-poor than MM ones since they create more opportunities
for employment and capability building among capital constrained users and dealers. In
the following sub-sections we discuss these answers in detail.
255

Tabl
e 9.
2: S
umm
ary
of fin
ding
s
oc.E ■2 «o 3 w X (0 0)9 ® £
LULU
0i_Ooro
0+■»3(0a)01
0
OCL
0a'■5 S
i =
2-8 (0 "o
£ cO TO
0coV003c r
TOa0001
- cm" § co (O .2s- ^ O 0 § 0
CM COc\i _0CO = o3
a - ~ V ^ oTO O _Q ■ t5
■C 0 3 ^ (0 O co CO CO .b
0
cTO-eOQ.E
cTO CO "E TO O CL CLE 0
CTO-eoCLE
cTO■EOCLE
c0Ecs_0> -C O) Q j
I =< CO
cTO-E
^ ° C. Q l
5 . 1
cTO■EOCLE
cTO■EOCLE
0>
cTO■EOCLE
cTO•EOCLE
S -TO CO ■E TO O QJ
1 5
CTO•EOCLE
cTO■EOQE
O)c'0c0o
Q
o _ c 0 -n .2 O)
o « J E | = ,(D T ! LU —
-C LU CO
"m c "O C“- ■ — TO C f? TO -t; i- ro ^ 'pTO 0 __ o is r S r rag £ l l £
_ i n CO (Q 1—0
0 IT)
'■i= CO m O
Q - l 7^-TO O -Q •
C 0 D LOO CO CO CO
D)_c0
= 2 > 5> >10E j o
< £ .£ .2
C 3 ^
R c cO O TO
O)C C
^ "o .2q C CD
O 0 c ^ T3 O
= 0 to a)
E
= 0 0 CD
co E
TO g CD i— ^
0 ~ ~o 2 ro .5
® c l2 2 , 1 -«—i m i_
_COo01_0
£D)
C
W rr\0 i?4-> L.aj 7=
8 .2 8c Q --C _
o c c o O o o 0
0
0 c 0 2
TO >„ § . ° TO >t O TOO Q_ J-V CD
CC C 0 O TO CD
0 n \0 g> Co
5 rCD
c 3g oc _ o c C TO
O O TO
TO •E O
o O.u 75 0
o 73 co c c
00 c 3 D) §
u— C. ■— O Z TO
CD >
I l f. 2 9 9
c o
'■+—■ TO ■E O Q 0 C TOi_1—
0
E a>= S ’ 0 0
X ^O LUTO LU
f co CO 1- ^ CM ^
O)C O" CD
8 ^D)
CTO —
. t i T3 CL 0 TO 0 O 3
O•4—•CO
!_ 0 0 C
TO O SZ Q)O CO
c 0“ S i l oI i 0
>%
T3C
CO 0 TOc E ^ _>> O O T o
TO0CDE ° 0 c c > i * _ o o T O - £ z;
,? £ 8 ",<?§■•§• I £ I ®£ E eg CD o Q ..O ) ^ a3 ro CD S l l j o J 5 ^ - 0 o x : o t x ^ _q
>>+J iCM
ro o3 E OC n CO1—X I r- c Oc d £ o T— roX ^ o
0<+—o 0
>
c co c o 9 - o 3
ro0 0 _
o u X" o■— H -iz: CO -^3 oW ° TO ° roC £ i - r W T30 TO 0 O
o x: 3oCD
^ CD CNJo .E - 0 0— • — j— ^ -7-t
ro 0 0 o ' g0 _ > 0 i— Q 0> Z? ^ CD O-<-> ,-ti 0 ^ f- o— ro ^ -o 0 ~ ^ o 2 - £ 1 ^ 8
0
o
g ^ o
L r U 3 '!?
S ^ E j J S I o d
O .9XT 0 = X2 TO 03 E O ° CT CD ^ TJx: ~o oCD "2 0
ro 0 j- s-j. ,n ro.t± c CD 0 i iQ 0 f 0 0 0
i* - o Q. 0 o o o
S ® E 2 3. S >-£0 s_ O O
0 0 E- Q.
0 0 cm ro r0 3 Q t- o .E
co+J00
CD —
i .2 >> S - 00 c O ° cm c C ^ CZg O a) ° o
o) o .2 0 o c o i t o o
LU LU LU O LU1 i i i i
00
3 >> >»
g 0E CL u~> ro
§-9
CO
0TD000 'm
O" 0 0 C
CD OS i m
= O LUx= c
^ o o ■S 0 E
256

oc .E
.2 0 *-» a 0 2 3 0X 10 v
0 JZ
TJcCO
_ CO00 00 000 c c Q..2 .2“ -4—» +-»03 O O
J= 0 0 O CO CO
-t-> 0 -*-±
c fc £ ro =I 8 'S “ I.■ti 0 Q_ ■— Cc/3 0 0 £ ro3 +J- ^ T3c r c/) "a c/) 0o o c 0 xro o m— ^ i*—
>*® m 0f §Jro E >-0° r ® Q-2 ro w
M— L . ^o o .2 ,
0ro § . * ■ s 1
O)
00
O '
05 cr “D 0 co —~ O C Q- O -XX ro ro o o 0
0 c ^ -c o 0 ro 30 ^ .!= w o c ro ro »- a-1 s. M
2 £ ro X E 5
0o _ o 00 .2 £ t o ro
_ i JO
2
c I - 0
o .0 0 ro— n « /ft
0 . 0Lb L—ro ^ ro0 o 0o0c 0 «o 0 0 ro . b .«=
- ^ o . - 0 - 2 - E ^ r o Q - o ^ t o o - ^ c LE r o E r o - c ^ r o ® 0 Q. J3 Q. > E 0 0 -
0> TO *= Cro it— 0 o
0ro ^ ^
§ 2 1 - 3 s I je
a i f f l l l i
croo00c
O)X
*— 0 __I /-> -t-> u./ vu .=0 ± i = . 0 -2 q . w .2 jcE 3 E . - K 0 Q - S . 0 - P O O *— tn vJ W s c “ ■ r _ r nia 3 0 o o m ^ Q - ^ n 3 ' 5 c^ 2 c r o o ^ 0 o - ^ = Q - ^ E
13 -a 0 c-Q i4=
0a
■■§ s
S =o ro 2*22 ro T3O ro
00JOro
Q_+± ro
1 =^ - i o ' ro _ -Q. Q..2 70 0-i—< *; r— ~ — uc 3 E j*: 3 o
LJJ O LU CO JO <
0i—0
' i_ro
JO
ro a.0o o 0 o
0i—0L_
' roQ.0
00 C 0
00O
< E <
oCMCo£
ro
«Q■Q
20 c 0 CD0
1O
CO
0
003C7
ro000a:
o 0 0
2 ro0 ..ia LU
hi 0 LU
o o c
0 Q- " a 0 0
^ s0 0
•— <~ D )±=.2 0 O 0 C 0
0 Oc_ 0
^ m 0 J=
TO 0 C
'ro 2
0
g - p o cro
o ct= ro0
0
a - co ro o T3TOro
3 0° E0 E0 ro
0 ■t—<c .. ro sz .2- o 02 0
c > ro
o
"m ~ "0ro ro 0
257
9.3.1 Research question 1
What is the mode of transfer and diffusion of MM and EE tillage technologies in
Tanzania?
The main modes of technology transfer for both MM and EE power tillers and tractors
were through aid/government support, trade and FDI/licensing. However FDI as a means
of transfer is absent when considering power tillers. FDI was however important in the
pre-SAP days for tractor assembling in Tanzania when the country had a production
license agreement with a Finnish company. Whilst aid featured significantly in the pre-
2005 wave of imports for power tillers and pre-SAP wave for tractors, the periods after
2005 and SAP has seen the importance of aid declining or being modified. When power
tillers are considered, the importance of aid as a tool for importing MM machines has
been very high and mainly came in from Japan through JICA. Trade features prominently
for EE power tiller imports. The nature of aid for MM tractor imports is also different from
the kind of aid used in importing EE tractors. Whilst MM tractor aid is mostly gifts, EE
tractor aid is based on soft grants which must be paid back. Overall, the importance of
trade for importing tractors and power tillers surpasses those of aid and FDI. Currently,
more than 7 out of 10 tractors in Tanzania were transferred through the open market. For
a detailed discussion, see Chapter 6.
9.3.2 Research question 2
To what extent are MM and EE tillage capital goods being used in Tanzania?
In 2012 the global supply of power tillers and tractors stood at 0.5 million and 1.8 million
units respectively. The annual latent demand for power tillers and tractors in Tanzania
were in the order of 1800 and 1500 respectively in 2011. In the same year, the actual
purchases of power tillers in Tanzania were 699 units and that of tractors were 645 units.
By the end of 2011, there were 4,571 power tillers and 8,466 tractors in good working
condition in Tanzania. At the regional level, 25% of the power tillers were located in the
258

Mbeya region (see Chapter 1, 2 and 6). One out of every two power tillers in the country
is located in the five regions considered in this study. The remaining 50% are spread
across the other regions of the country. One quarter of all tractors in use in the country
are located in the Manyera and Morogoro regions. Altogether, 44% of tractors in good
working condition in Tanzania were in the five regions considered in this study. (MAFC,
2011)
Over 70% of the power tillers in use had an EE origin. Between 40 and 50% of the
tractors in use were also estimated to have come from the EE and this proportion was
forecasted to rise. On one of the irrigation schemes visited during the field study, 20% of
the owners of power tillers were women and three out of four of these women possessed
EE machines. Out of the 95 power tillers sampled across five of the 21 regions in
Tanzania, 62% came from EE sources. Of the 99 tractors studied, 57% were of EE
origin. Power tillers were mainly used on small scale rice fields where irrigation facilities
were present. This finding attests to the fact that differences in agro-climatic conditions
may mean that not all farmers benefit from a new technological innovation (Barker &
Herdt, 1985). For instance maize farmers under rain-fed regimes rarely used power
tillers. However, EE power tillers dominated activities like paddling (rotavation) and
power generation. MM power tillers were popular when it comes to ploughing and
transportation. Thus there were some complementarities between the two sources when
it comes to farm work. This is not to say that each of them could not carry out all the
activities.
Tractors were used on maize, rice, tobacco and sugarcane fields. EE tractors were
common on maize and tobacco fields because the soils were lighter. The presence or
absence of MM tractors on a farm was influenced by both the soil type and by the
affordability to the user. MM tractors were common on clayey rice and sugarcane fields
where the users had relatively higher incomes. These clay fields required more robust
259

machines, a characteristic which the EE tractors on average, did not possess to an
appreciable extent.
9.3.3 Research question 3
In what ways are MM tillage technologies distinctive from EE ones?
The lifespan, efficiency, breakdown frequency, cost, physical ratios, profitability, user
satisfaction, environmental effects and impact on the health of users were all critical
characteristics for the user and were examined in Chapter 7. These characteristics were
distinctive for MM and EE power tillers and tractors under the different OCs. In general,
whilst MM machines were made of high quality and durable materials, they were more
expensive to purchase. For instance whilst an average MM power tiller could last for
between 7 and 12 years, their EE counterparts had an average lifespan of 3 to 4 years.
Whilst MM tractors had an economic life of up to 10 years, the EE ones could manage
between 4 and 6 years. The technology in use in terms of engine, gear box and lighting
are much simpler for EE machines than for MM ones. Generally, EE power tillers were
heavier and had an average horsepower of 15 compared with MM power tillers which
were lighter in weight and had an average horsepower of 14.
There are also high levels of breakdown among EE machines. However EE machines
from India are usually more resilient than the Chinese ones. Gears and engine parts in
MM power tillers were firmly fitted and there were rarely oil leakages during usage.
Unlike the MM machines, the gear box and the engine blocks of EE power tillers were
usually fragile, and could rarely run for a week without breakdowns, especially in the
second year of usage. Engine overheating is also common for EE power tillers. EE
tractors on the other hand had relatively lower average horsepower of 60, compared with
the MM ones which averaged 73Hp (See Chapter 7). EE power tillers consumed more
fuel and lubricants per acre than MM ones. On per acre bases, the output of MM power
tillers and tractors per day were consistently higher and required fewer man hours per
260

acre when compared with EE ones. Fuel and lubricant consumption for MM and EE
tractors were not significantly different, except for a couple of brands from EE sources
which were known to be fuel inefficient, for example Farmtrac from India. During
operation, MM tractors were more stable on the field than the EE ones. The MM
machines also had a reputation of making very straight furrow during ploughing.
In comparative terms, MM machines were capital intensive while EE ones were labour
intensive regardless of the scale. The output-capital ratio were in most cases averagely
higher for EE machines than MM ones. That is to say, the efficiency of a unit of EE
capital used was greater when compared with the efficiency of a unit of MM capital used.
Returns to the labour intensive technologies from the EEs were higher at a lower scale
(power tiller level) than they were at a higher scale (tractor level). Under full capacity
utilisation, EE power tillers were in general more profitable than MM ones. Aside from
one out of the four operating conditions for tractors where EE machines were found to be
more profitable than MM ones, MM tractors generally performed better in terms of
profitability. The challenge posed to EE tractors in some instances is the fact that they
break down often and yet the spare parts are difficult to find.
On average, it costs twice as much to buy an MM power tiller when compared with an
EE one. The ratio widened further when considering a comparison between MM-i and
EE0, to 3:1. The ratio for MM and EE tractor acquisition and replacement costs were
similar to those observed for the power tillers with slight differences across the different
OCs. Maintenance costs (costs of spare parts and repair costs) were generally higher for
MM machines in terms of actual usage. However, when the rated capacities are
considered, some EE machines under OC4 and OC5 for instance have their
maintenance costs rising quickly.
The all important issue of profitability as a driver of investment is depressing. Aside from
power tillers where at full capacity we see positive profits, most of the tractors regardless
261

of their source do not post positive benefit-cost ratios (Chapter 7). This brings up the
question of why farmers would want to continue to invest in a capital good which in the
first place is not profitable? The value of an acre of work done by a power tiller in this
study has been computed using how much farmers receive when they rent out their
machine. This value has been argued by some farmers to be lower than the actual value
of the service they provide.
Thus the decision to rent their machines out has philanthropic underpinnings. It is a
gesture to help other small scale farmers. Their main objective for buying their machines
is to use them on their own farms. And so the real payment for the machine comes from
the contribution the power tiller or tractor makes to the crops produced. There is a further
possible explanation. They rent out the machines to cover marginal costs (since they
have purchased them anyway, and don’t have to bother about recouping capital costs).
Nonetheless, the relative profitability suggests that at both actual and full capacity EE
power tillers are more profitable than MM ones. On the other hand MM tractors are in
general more profitable than EE ones.
User satisfaction had mixed outcomes across scale and source depending on the
character under review. Nonetheless the general trend was that while users of EE were
happy about the low cost nature of owning and maintaining their machines, MM users
were particularly happy about the quality, durability and the peace of mind that comes
with low levels of breakdown frequency. There were also critical concerns about
availability of spare parts. Whilst power tillers from EE had easy access to spares, MM
power tillers were lacking in spare parts supply. On the contrary, MM tractors and MM
tractors adapted to the EE environment had spare parts available. However, EE tractors
especially some of the EE0 had a poorly functioning spare parts market - a case in point
is YTO from China. There were also slight differences in terms of the quality of output,
usually in favour of MM machines but sometimes the other way round depending on the
tillage operation in question.
262

EE machines had higher negative effects on the environment: by using higher quantities
of lubricants and fuel they release more by-products into the soil. EE machines vibrate
more and contribute more to noise pollution. The high vibration and noise that EE power
tillers especially generate have dire consequences on the health of users (see Chapter
8).
9.3.4 Research question 4
Do the inherent distinctive characteristics thereof, (if any), of EE tillage
technologies help address the needs of resource constrained farmers and other
participants in the value chain and hence reduce poverty?
The first and most important point here is that EE machines and their spare parts are low
cost and so poorer farmers can afford them. For the poor, generation of employment and
incomes is important. In satisfying these needs, more jobs must be created. And for
more jobs to be created output must grow in a manner that encourages higher levels of
labour participation along the value chain. Given a fixed amount of capital and
acquisition costs, different quantities of power tillers and tractors from MM and EE can
be purchased under each OC. Simulations on output growth, employment and capability
building outcomes when economic agents choose to spend resources on either MM or
EE technologies suggests that the latter gives more desirable outcomes on the variables
of interest (see Chapter 8).
а. Tillage output and incomes
If land resources are not a constraint, and other inputs such as seeds, fertilizer and
labour are available to the farmer, then with a fixed sum of capital, more EE technologies
can be procured regardless of the OC, and area cultivated can be expanded more than if
MM machines were bought. For instance, under OC1, with an amount of TSH23 billion,
б,708 power tillers could be bought from EE sources on average. This same fixed capital
can only bring in 3,207 power tillers from MM sources. The 6,708 EE power tillers are
263

capable of tilling 535,000 acres of land, as against that attainable by the MM machines of
338,000 acres. Assuming productivity of land is similar across farms; then the EE power
tillers can support the production of more bags of rice than the MM ones. This will
translate into more incomes that are shared across more farming households - an
important point for inclusive growth. Similar trends are observed for the other OCs (See
Chapter 8, Table 8.10 to 8.11).
b. Employment creation and capability building
Directly derived from point (a) above are the various forms of employment that are
generated as the machines to be procured by a fixed capital are imported - more
dealers, operators and repairers are needed if EE machines are chosen. For instance
under the same OC1, dealers required to handle (import and distribute) the EE and MM
machines are in the ratio of 2:1. Similar ratios are observed for repairers and operators
needed to maintain and man the machines. As more people get the opportunity to
participate in the import market, repair the machines or use them on farms, capabilities
are built along the value chain.
c. Lower entry costs for users
One of the main barriers to entry and exclusion of the poor from owning power tillers and
tractors are the cost associated with them. Estimations in Chapter 8, Sub-section 8.3.1
indicates that EE power tillers are relatively low cost. And that in relation to farm profits
across the four different crops studied, a farmer under any of the systems desiring to
raise money to buy a tillage technology could do so quicker if he/she considered EE
machines.
d. Access to repairers, reparability and nature of market
Generally, the high levels of breakdown of EE machines allow mechanics the opportunity
to continually work on the machines (See Chapter 7; Sub-section 7.5.3). And as they do
264

so repeatedly, they build technical capabilities through learning by doing. This situation
occurred mostly with Chinese power tillers which broke down often. On the contrary, MM
machines such as those from Japan rarely break down, and so repairers do not have
enough opportunity to familiarise themselves with the technology and master the art of
repairing them. The consistent breakdown of EE machines in itself is not a good thing.
However, the opportunity it gives for capability building is a bright spot.
Consequently, it was easier for EE users to get access to repairers than their MM
counterparts. On average an EE power tiller owner could access a repair shop within a
1,8km radius whilest MM users had to travel an average of 2.9km radius. Similarly, EE
tractor repairers were within 8.2km whilst their MM counterparts were 29.6km from the
home of the user. These distances were statistically significant and have obvious
implications on travel cost and time of the poor farmer. For some EE tractors from India,
the engines had been considerably simplified for easy repair. One such tractor is the
Swaraj which uses the hammer mill technology. This technology allows repairers to
mend one cylinder of the engine per time without dismounting the whole block (See
Chapter 7).
Currently EE machines, especially power tillers and some tractor brands have outlets
and dealers very close to the users (Chapter 6). This makes it easier for farmers to go to
the shops and transact business including familiarising themselves with what is available
on the market. These same shops have spare parts for EE power tillers. The springing
up of such outlets is mainly due to the low cost of the machines which makes it easier for
entrepreneurs to enter the business. The proximity of such shops to the users means
that farmer travel time in search of spare parts for EE power tillers is reduced. This
advantage may however be eroded if the frequency of breakdown of the machine is very
high. For example in the Ubaruku rice production enclave in the Mbeya region, five out of
six dealers in spare parts specialised in the sale of EE power tiller products. This creates
easy access for the poor farmer.
265

e. Support for less profitable crops like maize
EE machines (tractors in particular) were predominantly found on maize farms. It is
important to note here again that maize is not only an important food crop, but also
cultivated by a large proportion of crop farmers in Tanzania. Among the four crops
considered in this study, maize is the least profitable on per acre basis. Consequently,
incomes of maize farmers are comparably lower. Maize farmers within our sample
especially those in the Dodoma region operate under very precarious and unpredictable
weather conditions. Maize is mainly rain-fed and so farmers engaged in it cannot crop
twice per year if the rainfall pattern is uni-modal (a climatic condition which is quite
common in Tanzania). This important environmental constraint cuts back farmer
incomes. The fact that EE tractors are low cost means that relatively lower income
maize farmers can afford them. (See Chapter 7, Table 7.1).
9.4 Implications for theory
This study makes some important contributions to the various bodies of theories relating
to the concepts of appropriate technologies in a changing geography of innovation
development and production across the globe from the traditional North to South. First,
the potential outcomes of SSA engagement with Emerging Economies (China/India) are
addressed (Khan et al. 2009; Morris & Einhorn, 2008; Kaplinsky et. al, 2007). Second,
the distinctive nature of emerging economy-sourced Below the Radar Innovations (BRIs)
is discussed. Here we pay attention to the view that because technologies are socially
constructed those adopted/adapted from sources with similar characteristics could work
better for SSA (Clark, et al., 2009). Third the possibility that Schumacher tenets of
technology transfer to developing economies may converge with those of pure
Schumpeterian machinery are also examined (Kaplinsky, 2009). Fourth, the implicit
absorptive capacity issues raised by Mmari and Mpanduji (2014) as a limiting factor to
the success rate of frugal innovations are given some attention here (See Chapter 3).
Fifth we respond to some of the questions raised by Biggs et al., (2010) in relation to
266

Chinese mechanisation technologies: the role of public policy; the importance of
increasing markets for technology based services; and the income distributional
outcomes. We discuss these five areas in turn.
9.4.1. The impact of China/lndia-SSA engagements
This empirical study has brought into the discussion the uncharted course of how
Chinese and Indian capital goods (in this case tillage technologies) can directly affect
poor producers (farmers). Earlier studies by Khan et al. (2009) and Morris & Einhorn
(2008) concentrated mainly on consumer goods and on China in particular in other
sectors. Similar to the results obtained by Khan et al. (2009) in Cameroon and Morris &
Einhorn (2008) in South Africa, this thesis finds that Chinese and Indian capital goods
contribute to increased productivity on farms through area expansion; capability building
and employment creation at the farm level as well as along the supply chain. The Indian
and Chinese capital goods are more complementary and less competitive in the sense
that they have not entirely removed advanced country power tillers and tractors from the
system. They are filling a gap by meeting the needs of poor farmers who do not have
enough money to purchase expensive machines and cultivating rice on small scale and
maize on medium to large scale in areas where the soil texture is lighter. They are
however out-competing second-hand machines from advanced countries. This is
because the second-hand machines do not have warranty and rarely benefit from bank
loans.
9.3.2. The BRI literature
This thesis finds that some of the characteristics identified by the BRI literature are met
by emerging economy power tillers and tractors, whilst others are not. Clerk et al (2009)
suggests that several decades of investment in the development of new technologies
which are fit for purpose by emerging economies for their own environments could
trigger benefits in other developing countries (see Chapter 3). The technologies coming
267

from India and China are significantly different from those from the well established firms
in advanced countries. They are low cost and sometimes with simplified operational
requirements to suit the low skills in low income economies.
The recognition by the BRI literature that low-income economies have unreliable
infrastructure and thus require more robust machines is crucial. Unfortunately, the quality
of some of the machines coming from the emerging economies is very low. They are
fragile, breakdown often and sometimes spare parts to keep them running are difficult to
find. Because of their fragile nature, higher skill levels and attention is required to keep
them running. There are however slight differences in the challenges presented by
Indian and Chinese capital goods. The incidence of breakdown of Chinese machines
(usually power tillers) is high compared to Indian machines. However, the Chinese
suppliers make available relatively cheaper spare parts that are easily accessible and
help circumvent the problem. Some Indian machines (usually tractors) breakdown often
but there is limited supply of spare parts and this makes it impossible for users to
manage the machines.
9.4.3. Schumacher meets Schumpeter
Kaplinsky (2009) argued that emerging economy technologies possessed certain
characteristics that could merge Schumacherian and Schumpeterian tenets. This thesis
contributes empirically to this theoretical view. That is, the idea that both poverty
reduction and distribution can be enhanced in developing countries if they had access to
labour intensive technologies and produced products which were low cost and
accessible to low income consumers (see Kaplinsky, 2009) is seeing some day light in
Tanzanian agriculture, as was the wish of Schumacher. However, the ‘charity’ approach
adopted by the appropriate technology movements supported by Schumacher is not the
main driver of this change. For instance the introduction of Japanese power tillers in the
early 2000s in Tanzania through aid, failed to create the needed levels of access to
farmers. However, when more affordable Chinese power tillers entered the market, we
268

have observed the annual import of power tillers climbed from about 100 pieces per
annum in 2005 to 3,325 in 2010. This tremendous growth has not come about by
chance; the Schumpeterian motor is at work.
The low cost nature of emerging economy machines has not only met some of the latent
demand for technologies, it has also made financial institutions43 become interested in
giving loans to farmers who in the past would have not qualified for it. Thus an effective
demand is being created. These conditions are still in embryonic development, it is work
in progress and with time we may well see a buoyant market where relatively low income
consumers can participate fully.
As advocated by Schumpeter (1939), we have seen the entrepreneurial drive within the
communities under study increase, and disproportionately higher for those engaged in
the dealership of emerging economy machines than advanced country ones. Through
learning by doing, as a result of gaining access to the machines, some level of skills and
capabilities required to develop ideas and make innovations work are also being
developed within the communities where power tillers are found.
9.4.4. Absorptive capacity
As noted in Chapter 3 of this thesis, the ability of a firm to recognise the value of external
information, assimilate it and apply it to commercial use is known as its absorptive
capacity. The findings in this study corroborate those obtained by Mmari & Mpanduji
(2014) that there are capacity and knowhow limitations when it comes to the operation
and maintenance of technologies. These capacity shortcomings of users, operators and
repairers are crucial for emerging economy machines because of their distinctive nature
when it comes to quality. Mmari & Mpanduji (2014) showed that there was lack of
preparation in some cases by users through training and capability building before the
purchase of power tillers. We however find that the lack of knowhow is not always due to
43 In some cases central government supported the capitalisation of these financial institutions specifically to lend to farmers
269

the unavailability of training programmes. The training programmes to prepare farmers
before or just after purchasing equipment exists but sometimes farmers are uninterested
or deem it too expensive for them to commit. There are training programmes which are
being offered by some dealers but some farmers refuse to participate even though it is
free. Other training sessions are being offered by government institutions at a fee but
farmers find it difficult to make time for it. This presents more questions for theory,
especially in terms of understanding the incentives which can generate user interests in
training programmes for capability building.
9.4.5. Diverse patterns of mechanisation and value chain impacts
Biggs et al. (2011) called for a reopening of the mechanisation debate in the developing
world which has been dormant for decades. This thesis does so with some important
points of departure and addresses some the issues pertaining to the role of government
in an increasingly private sector dominated market; the significance of increasing
markets and distributional outcomes of emerging economy technologies. First this thesis
moves away from the usual comparison of rudimentary tools and animal power with
power tillers and tractors. We compared advanced country power tillers with emerging
economy ones in a more nuanced way. We have established that regardless of the
source of power tillers and tractors, they are in grades which reflect quality and cost.
Thus from the same source more optimal mechanisation choices could be made for
different users.
Our results corroborate those of Biggs et al. (2011) with respect to the failure of
machines from more matured markets like Japan and Korea to meet the cost
requirements of users in South Asia. However, despite India’s limited role in meeting the
mechanisation needs of small farmers in South Asia, as elaborated by Biggs et al.
(2011), we find their medium sized tractors becoming very important for small to medium
scale maize producers in Tanzania.
270

Government’s role in Tanzania in supporting these diverse forms of mechanisation
emanating from Chinese and Indian machines is taking a bigger scope, but with more
focus on a market approach. That is whilst government financial support for importation
of machines and their purchase by users is subsidised, such support are mainly passed
through commercial banks which establish the viability of given out such resources.
Because of the low cost nature of Chinese and Indian machines, we are seeing some
expansion in the market demand and this has ramifications for the size of the value
chain. More people are now needed for dealerships, servicing and operation and this
creates more avenues for employment. On the question of incomes and distribution, we
find that the sorts of employment being created are those accessible to the poor and
thus ensuring desirable distributional outcomes.
9.5 Implications for policy
Emerging economy power tillers and tractors are generally not always economically
more profitable than matured market ones (Chapter 7). The EE machines did not also
show positive performance in relation to the environment and health of users. However,
we have seen their diffusion rates rising in Tanzania recently (Chapter 5). These findings
suggest that, the EE machines may be socially more desirable, despite some supply
chain challenges. Policy is required to address market imperfections related to
regulation, manufacturing, transfer process, user absorptive capacity, credit policies and
information asymmetry if the poor are to derive maximum benefits from EE machines.
We shall consider these in turn bearing in mind that some of the policy instruments can
be carried out independently by the Tanzanian government, others will require
collaboration with local partners in the value chain, and yet some policies will require the
indulgence of the governments of other countries (development partners) to make them
work.
271

9.5.1 Regulatory policies
Government as a regulator performs two main roles: maintenance of standards; and
application of monetary instruments to support poorer users. Stricter enforcement of
standards testing rules and information flow between the testing office and potential
buyers needs improved regulation. Current standards testing regimes do not mandate
importers to test their machines. Changes to this status quo are required to ensure that
specifications in machine manuals present the true quality of machines.
Recent proposals to develop a mechanisation policy for Tanzania could be a vehicle for
addressing regulatory gaps. The policy could be used as a tool for setting quality bench
marks. These bench marks must however be considerate of the fact that demand for
higher engineering quality will come with machine price increases. The standards should
be moderate, recognising many users are capital constrained and any bench mark which
eliminates emerging economy machines could inhibit access.
The development of an accurate bench marking regime will require strong collaboration
amongst officers at the Mechanisation Department, Testing Officers, Project Managers
of Financial Institutions, Dealers, Manufacturers (if possible) and Farmer Group
leadership to ensure that the interest of all agents are catered for. There should be a
strong participation among all stake holders to ensure that the right framework for
determining what is appropriate is generated. When these bench-marks are clearly
defined government institutions can then be charged to enforce them.
9.5.2 Manufacturing policies
Government policies which target manufacturing regimes to create incentives for an
improved value chain are two pronged. First government policies that ensure that
manufacturers outside the country produce standardised machines and genuine
machine parts are required to curb the importation of inferior products. Second policies
which facilitate local manufacturing are also required to build capability and core
272

competence within the country. Manufacturers abroad especially those from emerging
economies must be engaged through dialogue to ensure that they produce and export
machines and spare parts with minimum quality standards to Tanzania. These minimum
quality standards should reflect the bench-marks discussed in the previous sub-section.
The Tanzanian Embassies in China, India and other emerging economies could be used
as conduits for such negotiations.
As discussed in Chapter 2, both China and India are involved in various forms of aid
targeting poverty reduction in Tanzania. Some of these aid resources should be spent in
enhancing and facilitating Tanzania’s ability to make an appropriate tillage technology
choice. Resources accruing from Chinese and Indian aid to Tanzania could be
channelled into creating platforms for Tanzanian Mechanisation Officials and
Businessmen to meet with manufacturers with a view of establishing a memorandum of
understanding of what constitute appropriate tractors and power tillers for Tanzania. For
instance when India granted Tanzania close to $50 million for the importation of farm
machinery, the machines brought in were predominantly Farmtrac, which our study have
demonstrated to be less efficient when compared with Swaraj. Farmtrac was chosen
despite the fact that its acquisition cost is comparable with Swaraj and besides Swaraj
has a more reliable spare parts regime and more simplified engine for easy repair. A
more appropriate choice could have been made from the same country. These are areas
where decision makers in Tanzania may need help and aid resources could provide such
support.
Since negotiations must take cognisance of the fact that increases in quality comes with
additional cost the team responsible for such discussions should be armed with the basic
fact that almost all power tiller users rarely use them to plant seeds, weed or to harrow,
presently. In future they may use them for such activities but currently that is not
happening. They mostly use them for primary tillage like ploughing and rotavation. Thus
the attachments for these secondary tillage activities can be traded-off for improved
273

quality of the engine and gearbox at least in the short to medium term. This will also help
address some of the negative environmental and health effects.
With regards to local manufacturing, policies which relates to ensuring that the tax
incentives enjoyed by those who import machines must also be extended to them. And in
exchange, government must insist that private companies especially, develop machines
that are appropriate for low income farmers in Tanzania. In the same vein, private
manufacturing firms trying to enter the business who agree to take the tax incentives
should be bound by the agreement to manufacture the spare parts that are difficult to
find on the market. This may require further government support for them to obtain the
manufacturing license from the parent companies. The existence of cordial relationships
between Tanzanian government and those of the emerging economies as demonstrated
in Chapter 2 should facilitate such negotiations. As a starting point for local
manufacturing, companies could target the production of parts whose engineering and
technical requirements are low. For instance power tiller and tractor trailers for haulage
have very low engineering barriers and could be easily fabricated by local companies.
The challenge is about the cost of manufacturing them locally. At the initial stages, local
companies may have higher overhead costs, and may be out-competed by imported
once. Removal of subsidies on imported trailers to ensure that local companies have the
briefing space to build the needed competence will be useful.
Again, it is surprising to know that at least two companies engaged in some form of local
manufacturing activities to produce power tillers and tractors are targeting Spanish and
British technologies. This comes as a surprise when we find that the Chinese and Indian
machines are actually the ones creating the needed paradigms. Prior to licencing of
manufacturing companies, government can have a clause in such agreements to ensure
that the machines manufactured are within the reach of the users in terms of cost. This
does not entirely rule out the need for the development of competence in the
manufacture of advanced country machines. It only suggests that the product mix of all
274

producers should pay more attention to emerging economy machines since they are
more socially desirable.
9.5.3 Policies which target transfer and diffusion processes
The main challenges associated with the transfer are those related to the inadequate
supply of spare parts of a particular kind, especially those for tractors from India in
particular and sometimes China and high cost of spare parts, which makes most of the
machines economically unprofitable. Second there are challenges with the supply of
advanced country power tillers and spare parts and this inhibits farmers who want to
upgrade after using the emerging economy machines and accumulating some
resources. The main reason why some companies refuse to supply spare parts of a
particular kind is the fact that not all spare parts enjoy the tax incentive regime for
agricultural machines.
In order that the tax regimes are applied appropriately to protect the interest of
government and genuine traders importing spare parts for the agricultural sector the
Tanga Port could be used as the main entry point of agricultural machinery spare parts
instead of the Dar es Salaam Port which is very busy and may reduce attention paid to
this issue. This change could allow port officials enough time to examine who is bringing
in what and for what purpose. On the issue of upgrading, the main confounding factor is
the limited number of importers who have license to bring in advanced country power
tillers from Japan, Korea and Thailand. There are also issues about the level of effective
demand, but it is currently growing. To ease the stickiness in supply, little can be
achieved unless government support private firms through negotiations to obtain these
licenses using the diplomatic relations they have with those countries in question.
9.5.4 User absorptive capacity policies
For absorptive capacity to grow and mature, some extension, training and skills
development for users and their immediate networks of operators and repairers are
275

needed. The fragile nature of the emerging economy machines means that skill
requirements for operation and maintenance should be high enough for them to attain
their expected lifespan. As noted by an engineer (Chapter 7):
“...in the Tanzanian situation where capital is scarce, cost innovation is inevitable. Though innovating in the cost sense may sacrifice some level of quality, if operators are properly trained to know the depth, speed and draft force to operate, maybe some of these Indian and Chinese machines may last longer than they do today...it will however be interesting to know how much it costs to train an operator properly as compared with quality reduction in machines to make them affordable and which way we should look as a country...” (Key informant interview with SUMA-JKT engineer, 2012).
In the view of the engineer if we establish the tipping point between how much it costs to
train users, operators and repairers to handle fragile machines rather than spend more
resources on buying expensive machines it could give directions for future polices.
Whichever way we look at it, training is important even if it is not targeting the
management of fragile machines. But the question is what forms of training could be
appropriate for users giving the limited resources available to the state and the farmers
themselves?
Further considerations to be made, or require government interventions which are
instructive has to do with whether farmers should be free to buy whatever brand of
machine he or she likes. Or there should be a conscious effort to recommend and
influence users in a particular geographic location growing particular crops on similar soil
regimes to adopt particular models which have been found to work well under those
conditions. Any steps in this direction may be controversial and could be seen as
crossing the paths of a free market economy. However, I would recommend that it
should be given a thought since it is easier to develop a well-functioning market, repair
and operational skills regime for fewer brands than when every other farmer seems to
have a different machine that requires its own sets of skills and supply chains. The latter
scenario presents a jack of all trades master of none regime which may breed thinly
spread competence and capability which cannot deal with difficult challenges.
276

9.5.5 Credit policies
Improvements in financial intermediation are needed to trigger inclusive growth. The
smallholder farmer, who is capital constrained usually go in for Chinese power tillers
which are of low quality and may not have warranty. Banks do not finance the purchase
of such machines. With evidence from the field suggesting that these Chinese power
tillers post positive profits, banks have to redo some number crunching to see whether
exclusion using the warranty criterion is still valid. Additionally the minimum farm size
requirement for farmers to qualify for credit from financial institutions tends to exclude a
number of asset poor farmers operating less than 10 acres using power tillers or less
than 40 acres using tractors. Meanwhile, prices of power tillers and tractors from
emerging economies and advanced countries differ significantly. There should be a
change in banking regulations to reflect these price differences: the universal 10 and 40
acre minimum for all buyers are disadvantageous to farmers who demand emerging
economy machines which are low cost.
9.5.6 Information asymmetry
There are three important links within the value chain where information flow is
inadequate. First manufacturers do not know about the needs of users and their
operating conditions. Second, dealers are sometimes not sure why they cannot get hold
of particular spare parts for onward distribution. Third, users do not know about all the
available technologies and sometimes the exact places where they can find spare parts.
Government policies and interventions which seek to bridge this information gap will
certainly help. Trade is about information: knowing what to produce as a manufacturer
and in what quantities; knowing what to distribute as a dealer and were to get suppliers;
and finally knowing what is available and where to get what to buy as a consumer.
Through field trials, CAMARTEC has accumulated a lot of information on Tanzanian soils
and the suitability of machines with different tensile strength. A lot of resources could be
saved if manufacturers collaborated with this government agency (CAMARTEC) through
277

data and information sharing. This will not only ensure that the cost of machines do not
unduly rise because of spending on an information gathering when the data set already
exists, but also speed up the process of manufacturing machines which are fit for the
purpose of the Tanzanian terrain. Central government through its diplomatic relations
with the countries of interest (China/India/Pakistan) should engage the business
community through their chamber of commerce to fashion out modalities as to how such
information can be shared for mutual benefit.
Whilst some dealers knew why some spare parts were not easily obtained from
manufacturers, others did not know at all. Some dealers actually thought I might know
why this problem existed (Chapter 7). They continue to make contact with manufacturers
without any feed-back. For instance a dealer in tractor spare parts in Morogoro planned
a visit to India in 2013 to find out why Farmtrac spare parts were not available. This is
certainly an expensive trip which can be avoided if state apparatus of representing
Tanzania in India can be called to action. For some of these cross country challenges,
government interventions through the use of experts at their mission abroad can help
save the dealers some money and time. This is an area where government policy can
help, but can only happen if there is close collaboration with the dealers to know their
pertinent problems.
The desirable thing is for farmers to get access to affordable machines, use them for
production; expand output and then where possible graduate to the use of high quality
machines (Chapter 8). There are however information constraints.
Moving forward, district mechanisation officers could collect and share information on
venders and what they have on sale with other mechanisation officers in other districts.
This way, when farmers intending to buy machines make initial discussions with their
district mechanisation officers, they would have some data to share for appropriate
procurement processes to occur.
278

9.6 Directions for future research
There are a number of relevant issues that this study could not deal with, or stumbled
upon but fell a little out of its scale and scope. These issues ranging from data points to
other sectors within the economy and beyond will require further attention. This sub
section presents the areas this study could not tackle and provide pointers as to the
kinds of research that could help understand them and also advance theory.
9.6.1 Completing matrix for discussion and outcome of new entrants
The set-up for this study in terms of the matrix of technology categories, scale of
operation and operating conditions generated 20 distinct cells. This study was able to
study 16 of the 20 typologies. The other four were not feasible, generally because of lack
of data on those machines. Specifically, MM0 and MMi machines under OC2 (maize
intercropped with pulses on sandy soils under rain-fed conditions); EE0 under OC3
(maize and Tobacco intercropped with vegetables on loamy soils under rain-fed); and
EE0 under OC4 (rice and Sugarcane on clay soils under rain-fed) were not captured. An
additional research that will complete the table could provide a complete picture of all the
machines that exists under the different operating conditions delineated. There were new
products (tractors especially) from the EEs which this study did not capture, it will be
interesting to look at them. Studies in future could consider this area and also include
other crops aside from maize, rice, tobacco and sugarcane.
9.8.2 Factors influencing choice
The factors which influence the choice of technique captured in a dichotomy of advanced
country and emerging economy tractors and power tillers will also be an area of study to
consider. This is critically important because to shape the behaviour of agents in the
market, the drivers of their actions must be understood- especially in an attempt to
address gaps or imperfections. This will be important if explicit inputs are to be made into
the various stages of the technology transfer. Such information will be useful to both
manufacturers and importers, with the view of modifying the products and the process
279

through which they transferred to the user. Though this study collected some data that
could allow for aspects of such an investigation, it is not presented in this thesis. The
data collection exercise could be expanded through more targeted questions which elicit
the drivers of choice and user satisfaction. By extension, the factors that influence choice
could be expanded to examine the willingness to pay by users for EE and MM machines,
and this too, will require further data collection.
9.6.3 Skill gaps
We have also demonstrated that improved skills in the use, maintenance and repair of
emerging economy machines have the potential of improving their profitability. Further
investigations that will adequately bring out the farmers’ need in terms of skill
development may help offer some tools for developing training curricula. That is to
design training programmes for users; we need to know what they currently do not have
and how that could be satisfied. This will help in the development of training tool kits as
well as for theory. Again the methods to be adopted in delivering such training and where
the training should be conducted will also be crucial; and knowing what users think will
suit them is key. A search for such nuanced training requirements can only be done
properly through another field investigation- an area which other researchers interested
in this field can consider.
9.6.4 Understanding the manufacturers
At different levels, this study calls for government to negotiate with emerging economy
producers to improve the supply of spare parts and also quality of products. To enhance
the negotiation tools available to the Tanzanian government, an understanding of the
manufacturing firms in those emerging economies cannot be overlooked. This area too,
will need further attention in future. In order to, produce machines adapted for different
markets, manufacturers should know the characteristics of the market in question.
Presently, the assumption is that importers of the power tillers and tractors from the EE
markets are providing signals about the Tanzanian markets to producers. It will be
280

interesting to know the kind of signals the different producers in China, India and
Pakistan are receiving. Are these signals the same? Or do different producing countries
have, different understandings of what the market is? Are these differences in
understanding of the Tanzanian market resulting in mixed supply gaps from the different
sources? Are there policy and practice changes that could be implemented to reduce
the extent to which low quality spare parts are exported into Tanzania? Could there also
be some modifications in the spare parts supply process, so that those which are lacking
could be increased? To answer these questions further studies requiring investigators to
visit these manufacturing plants could be helpful. The primary concern is the sorts of
changes that can be made to improve the machines without increasing acquisition costs
significantly.
9.6.5 Lessons for other crops, sectors and countries
The findings here may not be limited to the agricultural sector, but also in other sectors
within Tanzania and the agricultural sectors of other countries within the sub-region.
Other sectors outside agriculture in other countries may also benefit from this new
paradigm of emerging economy-sourced BRIs which have been found useful in
Tanzanian agriculture. Research into these issues will also be useful for comparing
outcomes within sectors and across countries for broader policy suggestions. We
suspect that the importance of EE technologies may not be limited to mechanisation of
the maize, rice, sugarcane and tobacco sub-sectors in the agricultural sector. There are
also positive signs to believe that other cash crop producers like those doing sisal,
cotton, cashew, coffee, pyrethrum and tea could also benefit. Again, EE technologies
may not only work for the agricultural sector, but could also find use in other sectors of
the Tanzanian economy. Examples are garments and textiles, wood and metal work
industries, transportation industry and many more. These areas could definitely benefit
from further studies.
281

Some countries within the East African sub-region and SSA in general have in recent
times embarked on new mechanisation drives. For example Ghana, Burkina Faso and
Mali have made some investments in the importation of tractors from emerging
economies during the last decade. A cross country study using a similar methodology
applied in this thesis could help broaden our understanding of how country specific
endowments affect the outcomes of EE mechanisation technologies. The different
cultures, infrastructural regimes, technological knowhow of users and innovations
systems within those countries could influence issues pertaining to technology transfer,
penetration, distinctiveness and more importantly inclusiveness and pro-poor effects.
This is an area which can be considered in future and the research questions
investigated in this study could be tried elsewhere.
9.7 Conclusion
The question of growth in the agricultural sector of Tanzania is important for two
reasons. First it is a key conduit for resource distribution and inclusiveness for an
otherwise neglected rural population; a greater proportion of the rural population
constitute the majority of the poor in Tanzanian society. Second, with relatively higher
comparative advantage with regards to crop production in relation to other countries in
the sub-region, its success or failure has derived implications on East African food
security. To ensure that the agricultural sector grows and play its role as an attractive
employment creation mechanism and food security strategy, effective production
technologies are needed. The shift of the innovation landscape from the global north to
south may hold the key to unlocking the provision of appropriate techniques. The search
for such technologies has engaged the Tanzanian policy makers and academics for
decades. To push agriculture beyond subsistence and make it an engine of growth, there
should be a gradual shift towards mechanising some aspects of production. Primary
tillage such as land preparation could be mechanised in instances where the topography
of the land permits. Tanzania does not possess the industrial capability and core
282

competence to produce mechanisation technologies like power tillers and tractors. In the
short run, such capabilities are not likely to be developed. Therefore there is the need to
transfer these technologies from abroad.
An earlier attempt to transfer power tillers and tractors from advanced countries yielded
minimal results, especially for the resource-constrained small and medium scale farmers.
However, we are witnessing a historically important change in the geography of
innovation and manufacturing competences from the global North to the global South.
This global shift of centres of innovation from North to South has important ramifications
for technology generation and use. Emerging Economies in Asia especially China and
India are leading the way in this new paradigm. This new dynamic could offer poor
producers in SSA an opportunity to select from small scale and low cost machines which
are fit for their operating conditions, nature of infrastructure, skill sets and capital
endowments.
It has become more important now than ever that the widening market presents the
farmer with choice sets which must be carefully considered. There is a choice to be
made between machines coming from the developed world (capital intensive) and those
from emerging economies (labour intensive). Whichever of the two choices is made
comes with their own costs and benefits. There are distributional, inclusiveness and pro
poor objectives on the policy agenda of Tanzania. Thus in making this choice, the target
is to ensure that the technologies favoured contribute to meeting these policy objectives.
Once a choice is made, the technologies are ready to be transferred and diffused. This
process of technology transfer requires a well-functioning market that consists of
importers, distributers, repairers, financial institutions and users. These markets are
sometimes bedevilled with imperfections which must be addressed if more profitable
technologies are to be diffused.
283

It is essential to recognise also that in transferring techniques from abroad, the choice
sets available are not infinite, and not all the choices in the finite set are efficient (Clark,
1985). Some efficient technologies may also be inappropriate (Kaplinsky, 1990). To
make the most out of the available options requires a careful selection underpinned by a
depth of understanding of user needs. User technological needs are shaped by the
dynamic interrelationships among their resource endowments, cultural endowments,
technologies available and institutions (Ruttan, 2001). The nature of production
infrastructure, skill sets of labour, the cost and availability of capital and the level of
development of supporting institutions such as finance, insurance and government
regulation within the markets are very critical (Mmari & Mpanduji, 2014).
Thus, the introduction, successful adoption, adaptation and use of mechanical power
(power tillers and tractors) on farms transiting from subsistence to small and medium
scale commercial farms can be very challenging. This is very much so especially in a
developing country context where capital is scarce and unskilled or semi-skilled labour is
relatively abundant and there is paucity of basic infrastructure. (Eicher & Baker, 1982).
There are contestations about the rationality of introducing machines when there is
unemployed labour to carry out farm activities (ILO, 1973). Technologies which tend to
absorb the surplus factor of production, i.e. Labour is key (Bhalla, 1981). However in the
case of Tanzania where land is also in relative abundance, such contests are minimal.
And in fact while some technologies may sacrifice some jobs at the initial stage, they
may open up more jobs in other stages of the production process (Stewart, 1977).
Moving forward, other important barriers to successful mechanisation by smallholders in
particular relates to the scale of operation and how to manage excess capacity of
equipment (power tillers and tractors) (Kaplinsky, 1990). The EE sources of machines
may not address all the tensions raised here, but in as far as access for low income
groups are concerned they provide a stepping stone for the poor farmer.
284

References
Adelman, I. & Morris, C. (1988). Comparative Patterns of Economic Development, 1850-1914. Baltimore, United States: John Hopkins University Press.
Agrievolution. (2014). Agrievolution. Retrieved August 10, 2014, from
http://www.agrievolution.com/PDF/2014-02_WorldMarketForTractors.pdf
Agri-Food Canada. (2012). An Overview of the Canadian Agriculture and Agri-Food System. Ottawa, Ontario: Her Majesty the Queen in Right of Canada, 2012.
AICD. (2010). Tanzania's Infrastructure: A Continental Perspective. Washington, DC: The
International Bank for Reconstruction and Developm ent/The World Bank.
Alden, C. & Alves, C. (2008). History and Identity in Construction of China's Africa Policy. Review of African political Economy, 1(35), 43-58.
Alexiusy, A. & Carlssonz, M. (2007). Production Function Residuals, VAR Technology Shocks and
Hours Worked: Evidence from Industry Data. Economic Letters, 96(2), 259-263.
Atkinson, A. B. & Lugo, M . A. (2010, November). Growth Poverty and Distribution in Tanzania.
International Growth Centre Working Paper 10/0831.
Bank Of Tanzania. (2012). Annual Report 2010/2011: Director of Economic Research and Policy. Dar es Salaam: Bank of Tanzania.
Barker, R., & Herdt, R. (1985). The Rice Economy of Asia. Washington, D.C.: Resources for the
Future, Johns Hopkins University Press.
Barrett, C. B. (1998). Immiserized Growth in Liberalized Agriculture. World Development, 5(26),
743-753.
Benin, S. (2014, March). Impact of Ghana's Agricultural Mechanisation Services Center Program.
International Food Policy Research Institute Discussion Paper 01330, pp. 1-40.
Bennell, P. (1999). Learning to Change: Skills Development among the Economically Vulnerable and Socially Excluded in Developing Countries. ILO: Geneva.
Bhalla, A. (1981). Technology and employment in industry: a case study approach (2nd ed.).
Geneva: International Labour Office.
Biesebroeck, V. (2003). Productivity Dynamics with Technology choice: An Application to
Automobile Assembly. Review of Economic Studies, 70,167-198.
Biggs, S., Justice, S. & Lewis, D. (2011, February 26). Patterns Rural Mechanisation, Energy and
Employment in South Asia: Reopening the Debate. Economic and Political Weekly, pp.
78-82.
285

Biggs, S., Justice, S., Gurung, C., Tripathi, J. & Sah, G. (2002). The Changing Power TillerInnovation System in Nepal: An Actor-Oriented Analysis (1). Mymensingh, Bangladesh:
Bangladesh Agricultural University.
Bloor, M . (1997). Techniques of validation in qualitative research: a critical commentary. In G.
Miller, & R. Dingwall, Context and method in qualitative research (pp. 37-50). London:
SAGE Publications.
Brautigam, D. (2009). The Dragon's Gift: The Real Story of China in Africa. New York: Oxford
University Press.
Bruche, G. (2009, April 29). A New Geography of linnovation - China and India Rising. Columbia FDI Perspectives, No. 4.
Burgess, R. G. (1984). In the Field: An Introduction to Field Research. Abingdon: Routledge.
Burke, W . J., Hichaambwa, M ., Banda, D. & Jayne, T. S. (2011, March). The Cost of Maize
Production by Smallholder Farmers in Zambia . Food Security Research Project Working Paper 50 , pp. 1-27.
Carr, M . (1985). The AT Reader: Theory and Practice in Appropriate Technology. Bath: The
Pitman Press.
Ceesay, M . (2004). Management of Rice Production Systems to Increase Productivity in the Gambia, West Africa. Ithaca: Cornell University Faculty of the Graduate School.
Chand, R., Prasanna, P., & Singh, A. (2011, June 25). Farm Size and Productivity: Understanding
the Strengths of Smallholders and Improving Their Livelihoods. Economic and Political Weekly, XLVI{26&27), pp. 5-11.
Clark, N. (1985). The political Economy of Science and Technology. Oxford: Basil Blackwell.
Clark, N., Chataway, J., Hanlin, R., Kale, D., Kaplinsky, R., Muraguri, L .,. . . Wamae, W. (2009,
January). Below the radar: what does the Asian driver economies: have to offer low
income economies. Innogen Working Paper No. 69.
Clarke, L. J. (1997). Agricultural Mechanization Strategy Formulation, Concepts and Methodology and the Roles of the Private Sector and the Government. Rome, Italy: FAO Agricultural
Support Systems Division.
Cohen, W ., & Levinthal, D. (1990). Absorptive Capacity: A New Perspective on Learning and
Innovation. Administrative Science Quarterly, 36 ,128-152.
Coleman, J. S. (1958). Relational Analyses: The Study of Social Organisation with Survey
Methods. Human Organisation, 17, 28-36.
Cooper, C., & Kaplinsky, R. (1975). Second-Hand Equipment in Developing Countries: Jute
Processing Machinery in Kenya. In A. S. Bhalla (Ed.), Technology and Employment in Industry (pp. 129-153). Geneva: International Labour Office.
286

Cuong, N. V. (2009). Does Agriculture Help Poverty and Inequality Reduction? Evidence from
Vietnam. Agricultural Economics Review, 11(1), 44-56.
Diao, X., Hazell, P., Resnick, D. & Thurlow, J. (2007). The role of agriculture in development:implications fo r Sub-Sahran Africa. Washington D.C.: International Food Policy Research
Institute.
Diao, X., Yeldan, A. E. & Roe, T. (1998). A Simple Dynamic Applied General Equilibrium Model of
a Small Open Economy:Transitional Dynamics and Trade Policy. Journal of Economic Development, 23 (1), 77-101.
Dimitri, C., Effland, A. & Conklin, N. (2005). The 20th Century Transformation of U.S. Agriculture and Farm Policy. Washington, DC: USDA.
Dixon, J., Gulliver, A. & Gibbon, D. (2001). Farming Systems and Poverty: Improving Farmers'Livelihoods in a Chaging World. Rome & Washington: Food and Agriculture Organization
& World Bank.
Dosi, G. (1982). Technological Paradigms and Technological Trajectories. Research Policy, 11(3).
Dumont, R. (1966). False Start in Africa. London: Andrew Deutsche.
Easterly, W . (2009). Can the West Save Africa? Journal of Economic Literature, 47(2), 373^447.
Eckaus, R. S. (1955). The Factor Proportions Problem in Underdeveloped Areas. American Economic Review, 45(4), 539-565.
Eckaus, R. S. (1987). Appropriate Technology: The Movem ent Has Only a Few Clothes On. In
Issues in Science and Technology (pp. 62-71). W inter.
Edquist, C. & Jacobsson, S. (1988). Flexible automation. The global diffusion of new technology in the engineering industry. London: Basil Blackwell.
Eicher, C. & Baker, D. (1982). Rsearch on agricultural development in sub-Saharan Africa:
acritical survey. MSU International Development Paper 1, Michigan State university, USA.
Ellis, K., Lemma, A. & Rud, J. (2010). Investigating the Impact of Access to Financial Services on Household Investment. London: Overseas Development Institute.
Emmanuel, A. (1982). Appropriate Technology and Underdevelopment. Chichester: J. Wiley.
Erickson, A. (2012). Peace in Tanzania: An Island of Stability in sub-Saharan Africa. Research Discourse, 3(1), 18-31.
European Commission. (2011). Monitoring Industrial Research: The 2011 EU Industrial R&DInvestment Scoreboard and Directorate-General fo r Research & Innovation. Luxembourg:
European Commission : Publications Office of the European Union.
Fan, S. & Brzeska, J. (2010, December). The Role o f Emerging Countries in Global Food Security. Washington D.C.: IFPRI.
287

Fan, S., Nestorova, B. & Olofinbiyi, T. (2010). China's agricultural and rural development:
implications for Africa. Bamako, April 27-28, 2010: China-DAC Study Group on
Agriculture, Food Security and Rural Development.
FAO. (1966). Agricultural development in Nigeria. Rome: Food and Agricultural Organization.
FAO. (2005). Contribution of Farm Power to Sustainable Rural Livelihoods in sub-Saharan Africa. Rome: C. Bishop-Sambrook, Agricultural and Food Engineering Technical Report No.2,
Agricultural Support Systems Division.
FAO. (2011). Investment in Agricultural Mechanization in Africa. Conclusions andrecommendations of a round table of meeting of experts, 3-5 June 2009. Arusha,
Tanzania: FAO.
FAO. (2013). Mechanisation fo r Rural Development: A review of patterns from around the world. Rome: FAO.
FAO/UNIDO. (2008). Agricultural Mechanization in Africa: Planning Investment fo r Enhanced Agricultural Productivity. Rome/Vienna: FAO/UNIDO.
Farrell, M . J. (1957). The Measurement of Productive Effiency. Journal of the Royal Statistical Society, 120(3), 253-290.
Fellner, W . (1961). Two Propositions in the Theory of Induced Innovation. Economic Journal, 71, 305-308.
Floor, W . M . (1979). Activities of the UN System on Appropriate Technology. In A. S. Bhalla (Ed.),
Towards Global Action fo r Appropriate Technology (p. p 144). Geneva: ILO.
Fonteh, F. M . (2010). Agricultural Mechanisation in Mali and Ghana: Strategies, experiences and Lessons fo r Sustained Impacts. Rome: Food and Agricultural Organisation of the United
Natios.
Francks, P. (1996). Mechanizing Small-Scale Rice Cultivation in an Industrializing Economy: The
Development of the Power-Tiller in Prewar Japan . World Development, 4(24), 781-796.
Gabre-Madhin, E. & Haggblade, S. (2004). Successes in African Agriculture: Results of an Expert
Survey. World Development, 5(32), 745-766.
Gass, G. & Biggs, S. D. (1993). Rural Mechanisation: A Review of Processes, Polices, Practice and
Literature. Project Appraisal, 8(3), 157-187 .
Gibb, A. (1988). Agricultural Engineering Perspective: Celebration of Golden Jubilee 1938-88. Bedford: Silsoe, Institution of Agricultural Engineers.
Giles, G. (1967). Agricultural power and equipment. The World Food Problems, III, 175-216.
Guba, E. & Lincoln, Y. (1989). Fourth Generation Evaluation. California: Sage Publications.
288
Gurak, H. (2003). Hidden Costs of Technology Transfer: Adverse Impacts of Package Deals with
Restrictive Clauses. Yepi Kredi Economic Review, 14(1), 31-50.
Hatibu, N. (2013). Investing in Agricultural Mechanisation for Development in East Africa. In J. E.
Josef Kienzle (Ed.), Mechanization fo r Rural Development: A Review of Patterns and Progress from Around the World (pp. 1-12). Rome: FAO.
Hazell, P. & Haddad, L. (2000). CGIAR Research and Poverty Reduction. Washington, D.C.: IFPRI.
Hicks, J. (1932). The Theory of Wages. London: Macmillan.
Hodge, J. (1973). Lifelines (6 ed.). Colchester: Shire Publications.
Hoekman, B. M ., Maskus, K. E. &Saggi, K. (2004, May). Transfer of Technology to Developing
Countries: Unilateral and Multilateral Policy Options. Institute o f Behavioral Science, University of Colorado at Boulder, Working Paper PEC2004-0003.
Hollander, S. (1965). The Sources of Increased Efficiency: A Study of Dupont Rayon Plants. Cambridge, Mass: M IT Press.
Holtkamp, R. (1991). Small Four-Wheel Tractors fo r the Tropics and Subtropics: Their Role in Agricultural and Industrial Development. Weikersheim : Eschborn .
Hoogeveen, J. & Ruhinduka, R. (2009). Lost in Transition? Income and Poverty Reduction inTanzania since 2001. Dares Salaam: Background paper to the Tanzanian Population and
Human Development Report 2009.
Houssou, N., Diao, X., Cossar, F., Kolavalli, S., Jimah, K., & Aboagye, P. (2013, January).
Agricultural Mechanisation in Ghana: Is Specialisation in Agricultural Mechanisation a
Viable Business Option? Ghana Strategy Support Program, IFPRI.
IBRD. (1960). The economic development of Tanganyika.., Baltimore, USA: Johns Hopkins
University Pres for IBRD.
ICRA. (2012). Indian Tracor Industry: Weak Monsoons Dampen Demand in Struggling Market.
New Delhi: ICRA Limited.
IFAD. (1998). Agricultural Implements Used by Women Farmers in Africa. Rome: International
Fund fo Agricultural Development.
ILO. (1973). Mechanization and Employment in Agriculture: Case Studies From Four Continents. Geneva: International Labour Organization.
Imai, M. (1986). Kyizen: The Key to Japan's Competitive Succes. New York: McGraw-Hill.
Inns, F. M. (1995). Selection, Testing and Evaluation of Agricultural Machines and Equipment
Theory. FAO Agricultural Services Bulletin No. 115.
Irz, X., Lin, L., Thirtle, C. & Wiggins, S. (2001). Agricultural Productivity Growth and Poverty
Alleviation. Development Policy Review, 4(19), 449-466.
289

Jackson, C. & Palmer-Jones, R. (1997). Work intensity, gender and sustainable development.
Food Policy, 22(1), 39-62 .
Jafarieh, H. ( PhD thesis, 2001). Technology transfer to developing countries: a quantitative approach. Manchester, UK: University of Salford.
Jansson, J., Burke, C. & Hon, T. (2009). Patterns of Chinese investment, aid and trade in Tanzania. London: WWF.
Jessop, R., Diallo, B., Duursma, M ., Mallek, A., Harms, J. & van Manen, B. (2012). Creating Access toAgricultural Finance: Based on a horizontal study of Cambodia, Mali, Senegal,Tanzania, Thailand and Tunisia. Paris France: AFD.
Jones, R. & Kimura, S. (2013). Reforming Agriculture and Promoting Japan's Integration in the World Economy. Paris: Organisation for Economic Co-operation and Development.
Jorgensen, C., & Persson, M . (2013, February). The M arket for Tractors in the EU Price
Differences and Convergence. Factor Markets: Working Paper No. 35.
Kaplinsky, R. (1981). Appropriate technology in a Developing Country: The Bakery Industry in Kenya. Sussex : D Phil Dissertation Submitted at the University of Sussex.
Kaplinsky, R. (1990). The Economics of Small: Appropriate Technology in a Changing World. Washington, D.C.: IT publications.
Kaplinsky, R. (2007). The Impact of China and India on the Sub-Saharan Africa: A Methodological Framewrk. A Framework Paper fo r the AERC Project on The Impact of Asian Drivers on sub-Sharan Africa. SSA: African Economic Research Consortium.
Kaplinsky, R., McCormick, D. & Morris, M . (2007). The Impact of China on sub-Saharan Africa. IDS Working Paper 291, pp. 1-48.
Kaplinsky, R. (2008). Introduction: The Impact of Asian Drivers on the Developing World. World Development, 36(2), 197-209.
Kaplinsky, R. (2009). Schumacher Meets Schumpeter: Appropriate Technology Below The Radar.
IKD Working Paper No. 54.
Kaplinsky, R. (2010). The Role of Standards in Global Value Chains and their Impact on Economic
and Social Upgrading. Policy Research Working Paper 5396, The World Bank: Washington.
Kaplinsky, R. (2011, November). Bottom of The Pyramid Innovation and Pro-Poor Growth. IKD Working Paper No. 62.
Khan, S. A. & Baye, F. M . (2008). China-Africa Economic Relations: The Case of Cameroon.
Scoping Study for the AERC Project. The Impact of Asian Driers on sub-Saharan Africa: Paper No. SCC16.
290

Khan, S. A., Baye, F. M . & Tange, G. K. (2009). The impact of Chin a-Africa trade Relations: case study of Cameroon. Yaounde: African Economic Research Consortium.
Kim, L. (1991). Pros and Cons of Internationational Technology Transfer: A Developing Country's
View. In T. Agmon, & M . von Glinow (Eds.), Technology Transfer in International Business. Oxford University Press: Oxford.
Kjaerby, F. (1986). The Development of Agricultural Mechanisation in Tanzania. In J. Boesen
(Ed.), Tanzania Crises and Struggle fo r Survival (pp. 173-190). Uppsala: Scandinavian
Institute of African Studies.
Krueger, A., Valdes, A. & Schiff, M . (1991). Political Economy of Agricultural Pricing Policy: Latin America. Baltimore, United States: Johns Hopkins University Press.
Kuboja, N. M ., & Temu, A. E. (2013). A Comparative Economic Analysis of Tobacco and
Groundnut Farming in Urambo District, Tabora Region, Tanzania. Journal of Economics and Sustainable Development, 4(19), 104-111.
Lane, P., Salk, J. E., & Lyles, M . (2001). Absorptive Capacity, Learning and Performance in
International Joint Ventures. Strategic Management Journal, 22 ,1139-1161.
Levin, J. & Mbamba, R. (2004). Economic growth, sectoral linkages and poverty reduction in
Tanzania, background paper fo r the Tanzania CEM.
Lewis, W . A. (1954). Economic Development with Unlimited Supplies of Labour. Manchester School, 22 ,139-191.
Lipsey, R. (1966). Positive statements Concern What Is, Was or Will Be and NormativeStatements Concerns What Ought to Be: Anlintroduction to Positive Economics (2nd ed.).
London: Weidenfeld and Nicholson.
Ludena, C. E. (2010, May). Agricultural Productivity Growth, Efficiency Change and Technical
Progress in Latin America and the Caribbean. Inter-American Development Bank Working Paper Series.
Lyimo, M . (2011). Country presentation on Agricultural Mechanization in Tanzania. Saint Louis:
Senegal: Presentation to Workshop on "Boosting agricultural mechanization in rice-
based systems in sub-Saharan Africa".
MAFAP. (2013). Review of Food and Agricultural Policies In the United Republic o ff Tanzania 2005-2011. Rome: MAFAP/FAO.
MAFF. (2012b). Food Balance Sheet FY2012. Tokyo: Ministry of Agriculture, Forestry and
Fisheries.
Maghimbi, S. (1990). Cooperatives in agricltural development. In O. Norman, & K. Mustafa (Eds.),
Capitalism, socialism and development crisis in Tanzania. Aldershot: Avebury.
291

Maghimbi, S. (2006). The Organization Capacity of Cooperatives fo r Peasants and Small Farmers and Small Farmers: A View From an Outsider. Zanzibar, Tanzania: REDET's Training
Workshop for Leaders of Cooperatives.
Maghimbi, S. (2010). Cooperatives in Tanzania Mainland: Revival and Growth. Switzerland:
International Labour Organization and Coop Africa.
Mandal, M ., Sattar, A., & Asaduzzaman, M . ( 2002). Rural Non-Farm Economy in Bangladesh: Characteristics and Issues fo r Development. Dhaka : DFID Bangladesh Office.
Mandal, S. K., & Maity, A. (2013). Current Trends of Indian Tractor Industry: A Critical Review.
Applied Science Reports, 3(2), 132-139.
Mani, S. (2005). The Dragon vs the Elephant: Comparative Analysis of Innovation Capability in
the Telecommunications Equipment Industry in China and India. Centre fo r Development Studies, Trivendrum Working Papers 373.
Mansfield, E., Romeo, A., Schwartz, M ., Teece, D., Wagner, S. & Brach, P. (1982). Technology Transfer, Productivity and Economic Policy. New York.: Norton & Company.
Mashindano, O., Kayunze, K., da Corta, L. & Maro, F. (2011, June). Agricultural Growth and
Poverty Reduction in Tanzania 2000-2010: where has Agriculture Worked for the Poor
and W hat can we Learn from This? Chronic Poverty Research Centre, Working Papar No. 208.
Maxwell, J. A. (1992). Understanding and Validity in Qualitative Research. Harvard Educational Review, 62, 279-300.
Mbelle, A. (2008). The Impact of Reforms on the Quality of Primary Education in Tanzania. Dar es
Salaam Tanzania: REPOA.
Mellor, J. (1999). Faster, More Equitable Growth - The Relation Between Growth in Agriculture and Poverty Reduction. Washington, D.C.: Agency for International Development.
Menenwa, R. & Maliti, E. (2010). A Comparative Analyses of Poverty Incidence in Farming Systems of Tanzania. Dar es Salaam: REPOA.
Mishra, D. (2011). VST Tillers Tractors Ltd. Mumbai: Sushil Financial Services Private Limited.
Mkenda, A., Luvanda, E., & Ruhinduka, R. (2009). Growth and Distribution in Tanzania: Recent Experience and Lessons. Dar es Salaam: Interim report to REPOA.
Mmari, D., & Mpanduji, S. (2014). Frugal Innovation for Inclusive Development: A Case Study on
Power Tillers in Tanzania. Policy Research For Development.
MoFEA. (2009). The Economic Survey 2008. Dar e Salaam, Tanzania: Ministry of Finance and
Economic Affairs.
Mohan, G. (2000). Structural Adjustment: Theory, Practice and Impacts. London, New York:
Routledge.
292

Morris, M . & Einhorn, G. (2008). Globalisation, Welfare and Competitiveness: The Impacts of
Chinese Imports on the South African Clothing and Textile Industry. COMPETITION & CHANGE, 12{4), 355-376.
Moshi, H. & Mtui, J. (2008). Scoping Studies in China-Africa Economic Relations: The Case of Tanzania. Dar es Salaam: Economic Research Bureau, 2008;.
Mowery, D. & Oxley, J. E. (1995). Inward technology transfer and competitiveness: The role of
national innovations system. Cambridge Journal of Economics, 19, 67-93.
Mowery, D. & Rosenberg, N. (1998). Paths of Innovation: Technological Change in 20th Century America. New York, NY: Cambridge University Press.
Mrema, G. (1984). Agricultural Mechanization in Tanzania: Constraints and Prospects. In M . &.
Siegman (Ed.), Development of agricultural machinery industry in developing countries. Wageningen.: Pudoc.
Mrema, G. C., Baker, D. & Kaha, D. (2008). Agricultural Mechanization in Africa: Time fo r Action. Vienna, Austria: FAO.
Msigwa, R. & Kipesha, E. F. (2013). Determinants of Youth unemployment in Developing
Countries: Evidences from Tanzania. Journal of Economics and Sustainable Development, 4(14), 68-76.
NBS. (2007). LFS 2006, Analytical Report. Dar es Salaam, Tanzania: National Bureau of Statistics.
NBS. (2009). Household Budget Survey 2007. Dares Salaam: National Bureau of Statistics.
NBS. (2010). Tanzania in Figures. Dar es Salam: National Bureau of Statistics.
NBS. (2013). 2012 Population and Housing Census, Tanzania. Dar es Salaam: National Bureau.
Nkamleu, G., Gokowski, J., & Kazianga, H. (2003). Explaining The Failure of Agricultural
Production in Sub-Saharan Africa. Durban, South Africa: Contributed paper selected for
presentation at the 25th International Conference of Agricultural Economists.
OECD. (2008). Evaluation of Agricultural Policy Reforms in Korea. OECD.
Paman, U., Uchida, S., & Inabaz, S. (2010). The Economic Potential of Tractor Hire Business in
Riau Province, Indonesia: A case of small tractor use for small rice farms. Agricultural Engineering International: the CIGR Ejournal, 12(1), 135 -1 4 2 .
Patton, M. Q. (2002). Qualitative Research and Evaluation Methods. Sage Publications Inc.
Thousand Oaks: London, New Delhi.
Pfitzer, M ., Krishnaswamy, R., & Genier, C. (2009). Market Development Investments by Agricultural Input Companies and their Foundations: Transforming Smallholder Agriculture. Basel, Switzerland: The Syngenta Foundation for Sustainable Agriculture.
293

Pingali, P. L., Bigot, Y. & Binswanger, H. (1987). Agricultural Mechanization and the Evolution of Farming in sub Saharan Africa. Baltimore: John Hopkins University Press.
Prahalad, C. K. (2005). The Fortune at the Bottom of the Pyramid: Eradicating Poverty Through Profits. Upper Saddle River, NJ: Pearson.
Rampokanyo, L. M. (2012). Impact of Animal Traction Power on Agricultural Productivity: The Case of Lowlands ofMohales Hoek District of Lesotho. Fort Hare, Lesotho: University of
Fort Hare.
Rao, R. (2013). Academia.edu: Tractor Industry Outlook. Retrieved October 30, 2014, from
http://www.academia.edu/3842991/Tractor_lndustry_Outlook
RLDC. (2009). Rice Sector Strategy: Improving Rice Profitability Through Increased Productivity and Better Marketing Focusing on Tanzania's Central Corridor. Dar es Salaam: Rural
Livelihood Development Company (RLDC).
Robson, C. (2002). Real World Research (2nd ed.). Oxford, Massachusetts: Blackwell Publishers
Inc.
Rutta, E. (2012). Current and Emerging Youth Policies and Initiatives with a Special Focus and Links to Agriculture. Pretoria, South Africa: Food, Agriculture and Natural Resources
Policy Analysis Network.
Ruttan, V. W. (1959). Usher and Schumpeter on Invention, Innovation and Technological Change.
Quarterly Journal of Economics, 596-606.
Ruttan, V. W . (2001). Technology, growth and development: an induced innovation perspective. Oxford: Oxford University Press.
Rweyemamu, J. (1973). Underdevelopment and Industrialization in Tanzania: A Study ofPererse Capitalist Development. London: Oxford University Press.
Sarris, A., Savastano, S., & Christiaensen, L. (2006, June). The Role of Agriculture in Reducing
Poverty in Tanzania: A Household Perspective from Rural Kilimanjaro and Ruvuma. FAO Commodity and Trade Policy Research Working Paper No. 19.
Schumacher, F. (1973). Small is Beautiful. London: Blond and Briggs .
Schumpeter, J. A. (1939). Business Cycles. New York: McGraw Hill.
Seluhinga, N. S. (2013). Determinants of the Probability of Obtaining Formal Financial Services in
Tanzania. Journal of Sustainable Development in Africa, 15(2), 68-80.
Sen, A. K. (1968). The Choice of Techniques (3rd ed.). Oxford: Blackwell.
Siemens, J. C. & Bowers, W. W. (1999). Machinery Management: How to Select Machinery to Fit the Real Needs of Farm Managers. Farm Business Management Series. Davenport, Iowa:
John Deere Publishing.
294

Simalenga, T. E. (1989). Simulation model to Predict Field Work Days and its Use in Machinery Selection Under Tropical Conditions. Copenhagan, Denmark: Unpublished PhD Thesis,
Institute of Agricultural Engineering, Royal Verterinary and Agricultural university.
Simalenga, T., Belete, A., Mseleni, N., & Jongisa, L. (2000). Assessing Profitability of Using Animal
Traction Under Smallholder Farming Conditions. South African Journal of Agricultural Extension, 29, 230-234.
Sims, B. G., & Kienzle, J. (2006). Farm power and mechanization fo r small farms in sub-Saharan Africa. Rome: FAO.
Singer, H., Cooper, C .,. Desai, R. C., Freeman, C., Gish, O., Hall, S., & Oldham, G. (1970)., The Sussex Manifesto: Science and Technology fo r Developing Countries During the Second Development Decade. Brighton: IDS Reprints No. 101: Institute of Development Studies.
Singh, P., & Singh, A. (2012). Decomposition of Technical Change and Productivity Growth in
Indian Agriculture Using Non-Parametric Malmquist Index. Eurasian Journal of Business and Economics 2012, 5(9), 187-202.
Soete, L. (2009). Science, Technology and Development: Emerging Concepts and Visions.
SLPTMD Working Paper Series, 017.
Solow, R. M. (1956). A Contribution to the Theory of Economic Growth. The Quarterly Journal of Economics, 70(1), 65-94.
Starkey, P. (1998). Integrating Mechanization into Strategies for Sustainable Agriculture.
Summery report and recommendations, CTA Seminar, 24-29 November 1997. Ouagadougou, Burkina Faso : Technical Centre for Agriculture and Rural Development.
Statistics Canada. (2006). 2006 Census of Agriculture. Retrieved July 25, 2014, from
http://www.statcan.gc.ca/ca-ra2006/index-eng.htm
Stewart, F. (1977). Technology and Underdevelopment. Hong Kong: The MacMillan Press Ltd.
Sumner, P., & Williams, J. (2007). What Size Farm Tractor Do i Need? Atlanta: University of
Georgia, College of Agriculture.
Tassey, G. (1992). Technology Infrastructure and Competition Position. Norwell, MA: Kluwer.
UNECA. (2011). Economic Report on Africa 2011: Governing Development in Africa - The Role of the State in Economic Transformation. Addis Ababa: United Nations Economic
Commission for Africa.
URT. (2011). Tanzania In Figures, 2010. Dar es Salaam: National Bureau of Statistics and Ministry
of Finance.
URT. (2012). National Sample Census of Agriculture 2007/08: Large Scale Farms. Dar es Salaam:
The United Republic of Tanzania.
295

USCB. (2012). The 2012 Statistical Abstract. Retrieved July 25, 2012, from
http://www.census.gov/compendia/statab/cats/agriculture.html
USDA. (2004). Farm Bill Forum Comment Summary and Background. Washington DC: USDA.
Van Tho, T. (1993). Technology Transfer in the Asian Pacific Region: Implications of Trends since
the Mid-1980s. In T. Ito, & A. 0 . Krueger (Eds.), Trade and Protectionism {pp. 244-249).
Chicago : The University of Chicago Press.
Vickers, B. (2011). Between a Rock and a Hard Place: Small States in the EU-SADC EPA
Negotiations. The Round Table: The Commonwealth Journal of International Affairs, 100(413), 183-197.
Walters, D. (2013, March). Soil, Draft, and Traction - The Open Furrow. Dirt Hog's Companion: Technical Notes 21.
Whiting, D., Card, A. & Wilson, C. (2011, December). Estimating Soil Texture: Sandy, Loamy or
Clayey? Colorado Master Gardener Program: Garden Notes #214.
Williamson, J. (1990). Latin American Adjustment: How Much Has Happened? Washington:
Institute for International Economics.
Wilson, I. M . (2005). Some Practical Sampling Procedures for Development Research. In J.
Holland, & J. Campbell (Eds.), Methods of Development Research: Combining Qualitative and Quantitative Approaches (pp. 37-51). Colchester: ITDG Publishing.
World Bank. (2013). World Development Indicators. Retrieved July 25, 2014, from
http://data.worldbank.org/indicator/IT.CEL.SETS.P2
Yamin, M ., Tahir, A. R., Nasir, A. & Yaseen, M. (2011). Short Communication Studying the Impact
of Farm Mechanization on W heat Production in Punjab-Pakistan. Soil Environment, 30(2), 151-154.
Yoshikawa, Y. (2010). Can Japanese Agriculture Overcome Dependence and Decline? Japan Focus: 28.
Zeng, M . & Williamson, P. (2006). Dragons at Your Door: How Cost Innovation is Disrupting Global Competition. Cambridge, MA: Harvard Busisness School Press.
296

C/>LUoc
zoh(0LUDa><QZLUCL0 .<
asecos</>as3a
asu.
Oo<4->as>asXW0)Eoeoo111cc
asELUOa
easN£asI -
o(/)
§ | £ |I ■ a t §
OS CL ^ £ 2 CO p = 0 ” C w > T 3 ~ 0 CO CD wr (1) o rC r 0 - O — =C ‘J r O ° O O O
o-gP '§D ) CD CO CL
.E C >* 0) 0) c
E « I “0E fi P 'a
co c
=3 .2CO
«>ro « § 0 Q. 2 o-'g5 0 CD
CO CO o = CO 0r 5 d)£ §H o ■»_ c E _0 CD (p ^r= 0 -£ 0H fc ~ £as ^ 0S 0 05 §■o OT - Q£ i!
asc'u05
O o
c 5 E ~ m o o r i.r r os o m- $ «- o ° :E ? OS1^ g §| ® £.2 0 ■*-1L o— 0 = 0C T3 CO >_
03 >-p-£
012>, 0 o as
00 — ^ > 0 cp 0)0o
SZ _0 CL CO 0 £ T3-■w ■— nCO >— TS X>».E o -O as co o = c a os” .9 -0®S! If S s1 * | 2 r 2o K f£ 0 ~ 0 0 -C-O £CO 3 £ O 0 O
£0|0
ao>*
I p
O -O *- 0 as o c £ o 0 ■■£= > 0 T3 0 0o' E > 0
p tE 0 o3
0 0 CL
_ Em a o
0 a P o 5
3
o E s>» O 3 Z* £0 rr0 g O
E ^ ® 00 lu — c•DC0
w00oa.i—3CL
as o E ° ‘o 0
§ JF I i f -n 73
as ro
53 g 0 •§ 9 n E c 0C ® -o£ I— 0 2 p- o <+= .E 0
XX0EH■o£LU
0E-e0co
XX
03a .0x:
T30os0>0X3L_0>0
o
oa
0o
3a:CM
C0■e
pisL.
1£CM
POfi
0E0z5*C0Q.Eoo*0E0
£O'as0Cd
£3EEoO
0xsE3
0CoszCL
c3EEoo0
sz
»• 1— 0
£0Ea .'3cr0L_3O>0
a CMa 00a
1- OP o *= 0
00 5Q. °O ~i_ 0O •£o P 0 o £ 0"co ® ■go• - 0 £ SZ 0 *- 0 p
SZ 3
& £ i_ co
P 2 0 0 ■> s z
= i § 0 >>
3 0 t.O O o>4 Q.t*—O
0 3 £ a . sz
0 0 SZ
O CO > 0 '— 1- 0 ^ 0
0 ^ 0 0 h= >0 3 5 -g o oQ_ >, Q.
t ? o oO Li- 0 ■ LU
m ® § £ S oCO CM t
0 _ o 50 3®-o * S
p . a l PCO Is-
oCM
O 0 0 3 i=’ E
0 LU 0
_ 3 < 00
CM CO O -M- CD
OTO 2t. tz0 0 0 LU
t l l S : *i5 5 Q- ' - g
: co 00 .9 -LO CSS t— t— CO
0.s■co0s■41o0
&0
o- s 0 ■« 005:
o c: 0fT\ ^
i €
0£'szo0E1—3o>4
05oCL0J2oX0
sz
0sz
297

CD CD CD CD ■C
I-3£cm
0CDOs
Co42&■5.c
c
CM
isCCO
I8 §l-C Q_o c: 50 «=0 -9J
2 :^° § CD c&£ 42CO CD5 Q:co <3 SBos
CM CM CM5
£COCD C
>: § ; s *4 ^co -d
c oCD ■*
i s42 o < —1
o£a■Q£COCOCD■Q(2Cs-0>CO
o o COi_1—3o >>CO 0 oTO
E 0 to >» coD)C
Q o42 cCD
0szoI—3a
coa0.c
>: ac03 o,
sz co 3)
cz0EQ.3D"|0
3O>JM—Oe'g■i_ov*—o
0CO0
szo1—3a
c'oa0
sz
c3oo
CO0>-T3C0.CCO
CO0
o
oSZ
■0■a0c0tn0Q.
h-
d0CO0a.i_05sC0CLE0OM—O0E0
7—TO0CZ0.OOC0O005 (S-
F a.0 c-
sz co■S c
nP0
11I
00L_
CM
a00
a0
CO
a
O)czo5o
szCOCO0c'co3
szD)c
£ s1_ o 3 58 ° 0
E w o o 4= co
® §ijo o E es. .52 co £ o 0 "0 CO o
'2 3
2 ^ 0 c
0 ^ s 0
tn05sii-CS-ca)>CO)tn0c000.c--*—<F,pCl)JOtncz0F5s0CLC50■05sC0Cl)-V0 c
E 3O0 E0)
CO> 00.cz 03 it)O 05s tn
mO 0a a.
inin0ao1—Q.0
SZ
%o
3o5sc oo 0 Q.E
_ is— c 1 0
£ s>
in0 0 ■a .c 0 d: co 0 0 0 E . 0 Id
_0CLCS>1S0 o c
cr00c0o
cotnc0EEoo
0 'c 1- o 0c c 0 0 CD 5
0tn0sz23Q.
^ 0 0 SZ Cs-i_ c3 0 0
TO ‘ TO C 0
5 «
E oC 0 4=10 0 O o tn sz
£ l l
o5s•gTO
00.c5TOCZ0 CS-
0cz0 "0E tnQ. 0-3CO"0 TO
c0 0sz , ■
cszCO)
0E3 CL
OS3 ‘3
CT3 0O5s tn
'szE0 Z3sz O5 S3
E0
050ccz
0tn1— O0 i_Q_ 01_ 0O J=c 'T3 O*“ c , .2 => 0R" 0 D)E0 0O S3 O5s«4- r-0 0 ■g0 a TO£ 50 a> 0z £ X
298

03
Ifto 2Q. O 0 2 ■£ co > , o
co52'oCD3L_13o>»3(DOCCD3
0 _ £ s2 50 0 5 E? | £ S1
(0ocoa
ax5oa2"c•coQ.E0oE0x
2 0 CO E0 Q. tn '5 0 §■2 <d°-0 ■a x 0 — 0 ^® O > 2x c3 ~o 52 > o
0 0 3sz u-
o 3 .0 «O£ 0 5= 3 n- q=O .E
0 .c v -c
§ 9
0 g a. 0 E 0 tn0
sz2 • otni—ooo >% sc O 0 sz0 O
0 0 c 0 •=o oa E
& 0 c £1 = o mQ .3o E 0 roX ^
p o3 *= O 0*= o
0c'szoE
c0Ea.'3cr0E cm0 CO 3 O
t E 2 * 2 => a. 003 02 0
l !
c■a 03 -o§ ©> QJ
0 0 Oc 0 0 £ Tn Z
1 1'o 0 0 0
5 ®5 .52i_ £ 0 ~ ■ac w => 2
0c
'sz00E.30>»03C"i_O3003
03M—03C33O_C
CO03OCL0 c-C0
x:M—03O 3, ■ O0 X!OO 3O0 >
SZ CZtn 00 X
51 . 00£ E<:
0X
3o>»0£O0co0000l_005*0Co00Q.
0 £ 0 2 r 5'«£ 0 ~E 0■•?= 0 M— 3 Oi_ O 0 Cu3 o
000tn^
30030E0303_C
003
3O£'I20031—0X3cz0r00X X
030 X>c &0— >0 N-5 3
CZu.O 05O 0
£0>
X< T-
_C£3O>so3O)Co
tn1—
0 00 CT1E 0 0 <i= 0 c1 1 i^,
; l$ & c »0 0 ^ 0 X) .tso 0 0 2I f ® « i s1 10 0 x
0>0x23O53O>.0
20X
5o0Eo■30030XIcs0cxm 00 C E oo | >> c 0 0
i £I ®£ 0
gSj0 .52—l 3
CM
>■>X3 0 0 3O)C '0 X3 0 3 C 0 i_X3 1—0£OO3 0 L_0 Q.E o“ c- 0 >>0 r - ■° 3
1 §0 O ~ O
Q. 0 3 00 .52i_ £S.Er ec 0 Z Ei f>> 0 O £ □ O
299

3Oa:
£CD1 CDS
-CO
■O ■*- o
"CD 5g.CLCr*<2.5 ^cb’o ?§ g-l.CO "O CD
o q52 ^=5CD -Qf S£
2 73 3 CD.CO «=
c.52 «$ Sa> 2CDc >.O CD
- 3 ' ■CD C■o -23: -3^ 5 ^ ;Q 5 S
I I•2 b &" § JgN.ro g "a cd ■§ c CUS CD ‘
N. cs■o -2C*§ 2 ■2 §i§ c? cd 3CDcd -3 .co - o 3oX CDqT-2 > o.CO ^-S.'t- .Ojsd -3
2 b|I s
N.t33CDJco2CO-3.05CDXA:§ iCO co^ .2 g :£
| d
bs■2N."O3CD3«§oCD5s.-K»O3.CO
fi 3JB -2■g £fc s o
-2 -c2 ;§>.co -
CD 2 £ j£ 3s
CDQ-d
C\J
Co2
CD■'fc
N-CD0i—CDCOIc
T3c_0<+-O2OCDcCDcoatL_o5oCDACTOCDC!coCDE
h-j-a00*3-a
JOE0L-0£.oo~a0L—0Q.Eoo0c'sza0E.CO!cM—O05_c!c053Oa.4—N-O ■>%0Id 0 i_3 0O' tn0 'sz0 c0 0i—00 _c0 'sz0 a0 0CL E
05C0■g‘cocooCO0oTJ0_c!coCDECOSZ
roSZ
o5 00 Q. SZ X
£ o '5 «C 3■s ^CO CDro cdCO c
ill i=
0c'sz K CJ JdCD qE 2CO ^2 'sz X cu "3 ^ »•§ O)3 -2 .3«_ 3 Ki3 Cr 0 O 3 X 3 3
0 .. 05 05 CD .3S -2CD ? "O -2>2 CD X S> £
w ^-3 0 - 0 0 05.2 g c -3 E0 §= s 0JS-SSO ro 05 <- Q..3 0 ^ 33 -2 O S'cDvg r > 0 321 § a. 2 3A c0 N
Co *2 g T31 §
CD &3 0 05.0E -2 ? _ -6 -2 0-22 H ^ 2
50Q.O0Q.>.
SZ0Co■a0szO N- "O 0 0
I t> oil_ 03 '- O C ^ 0 c O CD -0
• - >
o =■ ° ' i0C 0 'sz aj O oCD 0E °\.CO PSZ CDZ 2o 5
0 .SZ 0r : o4— £ -
0oc0c0c‘0E0c3Oi_o■O■Oc0020a.oo0co0Eo0c 0
' 0 >>L_ 0■*-' Q0 ToT3 £01— c
03O ’0 '—L_ 00 cE -cM—
CJ0O E
SZ 005 SZc ■+—'0 c_l 0
0cotoCLoL_Q.0
0 c 'sz o ^ roE ®0 ''sz 'O0£ E05 a)
1 I I >>•=J= §
00 c .2 0
fc"§1 Q
0AC COc3° 3 >- >O 0O -c
300

CDC
I§ :CD <d — -*—< o CD0 c > Q .
P
•v- CD CD -Q O "Q
CD .O CD O
•P -C
c o oCD CO
CM
o
CD.o
■ 5 0T3O
CM
c.0
CDOO-J
CDOc■2.to(5
un
c S E 33 2.§ Ic CD
3OS£■6
sN -
TO*CDCD
b
s
0COoQ . .3 -£ Q . O
3 i
& CD
*= &CO
CMCDO
COcCD1—3O>»cjoQ .XLU
COCDa
O to
° °J * OO CD> CO> CDO ®_
E 2*Ix TO0 TOt! o2 >?0 • = _
1 ro ^O- 'cd r—o > 0 q . CD to
ro 0 <0c ^c - 0 — 0 E o CO
8cr ° > 0TO £1c 0 CD
a E %
rt 2 1- 3 2 g
. x0 g 5 o
T3 J= 3 .9
I fSZ COa roSZ 0 5 X
0 ^
I I 8 ? a 8TO -S
00 TO TO
33
> * !_ E a
o ^% “ ■ 0 >_g £
>* EC CD CD X 0 CO c H
•2 03
§ E■ti CO TO x
CO
2 g 0 0 0 53 o
c^-
CD 0to aro 3 0 o >»
coCOa
05TOcro3o>>croo .X00TOCD0CL
c2 ^ 1- T3
3 I3 2 O 0 >» CO - 3
0 ^ E 2
.9 - ^ 3 £ O '0 CO
I s■c CO 0 I - 2 03 o Er- CM
■g 2 !
2co
0 0 2 - -
5 =
I ^d 0c- 0 > £
8 E E oc *= 5 CD o O
■o ETO -2 -X .TOro -a2 . c sz *s ~ 5 c c 0 o
■> ro > o>N Oto d.g lC ro
> . c1 ro o . E
TO0O
■0O )co
5o
c:0 EQ .
5 - O cr o 0I—=3
^ CO TO >—
.9 CDro cl & o
o 0£ E
£ 8
0 0.9 o£ ' E8 0 03 COTO l_
■E 0
ISTO v 5 TO
.> CDa> 30 2 JZ 5 *5 Ci_ 00 -§ CD >
2 3TJ o CD TO~ 0 — D>
•oC
3O5^O
■o>
' toro0
5o
301

0 0 0_c _c C0 0 JCo o oro ro roE E E0 0 0
sz sz sz
0 0 0CO 0 03 3 3ro ro roo o o0 0 0 0"JQ S3 .o 073 73 T3 ro0 O" 0 0 Q"ro 1_ "ro "ro 0sz 'ro 0 sz ro3d a. 3d. 01_ 0 1_ 0o 4. o o
o o-0 5 >434-0
4. ■e o3 3 ron3
o c o O O>4 o >» >>"4—'0ro
0E
0ro
2ro
0ro
>40
5 o CL o0 0 0 0 0 E0 73 0 ■o 0
0>E Ccf= E £=
t^ E, . , . ro
>» O >* O >4-Cc c c c c ( .roE
o
T33OO
roE5o
■O3oo
roE5o
oc■g■o
sz 3 0 3 0 3co
O>4 co
o>• co
O>0 73 0 73 0 73ro c ro C ro C0 ro 0 ro 0 ro0 c 0 c 0 c0 5 "to 5 0 5ro o ro o ro o0 73 0T J 0.-00 0 0 0 0 00 3d 0 0 3d
o o o_C 0 _c L_
S3 c 0
I[2
ro "3;
c C0 0E E0 0"3 "3cr 00 0
1—3 30 0>. >*0 0
i i0 0O) 033 3O O0 03 3O O>» 5*
73 7373 7373 73C C_ro ro4— 4—0 00 00 04-0 0ro ro>» >*c cro roE E
5 E0 0 L_0
p-0
c00
E1—roc00
00ro ro 0
0 0 00 > 0 0> 4-J 00 O 0
_ro L_ _ro 00
3O 0 0
0 > 0 0
c OO _c c
0
o§303.C■5o&c:
£
CO
&
o03.c>45<5)
•O§oSCOCD
§c03.C-2i
u -aE gf *0
l l
•e <1> ro o)m 3ro o
8 1ro ST^ ro
ro
ro E - o2 5 £4_ O [O
o 0 roO T3 ° -
" S ®ro o0 C O
55 0 o 0 $ >^ CO >
2 00 ~ ° - ro — ro — .ti- | E 0 ~ oto ro ^
30 — 03 > » T 3 0
-O 'TO > •— ro ro Q 0 0
c_oroo3■o0
7 30
ro0Eoo
4—o01—ro0
c oro o ro3 .b!
7 3 CO L U ^M— —° E0
_ J 0
CM
3O>sc’roc’roE
7 3Cro0ro0o.o
■d00c
3O o ^ to ^ ro E .ro£ D- 3 ro| £ ^ oO CO T3 0 03 ro o- .E o ro t5 ro4— 'o 0 0 0 = >»■*= i_IS 0 ro -01
CM
OCl4.o04.o13ro4 -H*3O
J 3rocoroEL-£cco"0c03<0>4cro■o t>2 ro ro ^0 03 O0 §Jro ro
X £
0.o
0Qc>-7 30>0O0i—coroE£c4 —o0
roc0SI0ro
coCO4-00
coroN’cro0 3
o4 —o0Ero
c -coroEU.£c00
0>0o0
3o>4■g7 3
Eo05Eo
ooa
302

I
CM
CO
£
CM
3.Oc05
•2.■o.c5
CM
-C -v CO CD CD OO 5
co
CM
.E£
CM
0 O
•C*» "O CD c
■2E I3c
It£ ^
"cd .CD
- I 1 °
®£ fe 0^-0"cd 2t3 c -2c -S o
CD c CD ^ ^ £
^ CM ^
I£
oo
£
cCD3
o
CDECDC
ICJ
0ECDCI
o
CDECDC
IO
c^-E
3O>o
Q
00COO
oCDQ .XCD3O
s—o5CD
CDO
T3O
0.QCD
C0EQ .'3cr0L_3O> *<0co
■1% o c5.0 o>> 3
-E &
T3C0
05oQ .l_OoCD
0■C
0E
0>CDc.. >> 5 *
CL 5 3 -Q 0 ^o 00 0 5 E£ o 2 o E 0
l lo >05 =
0E
* V
® !o. C3 ro0 T3
° £
>»c0E0
L_ 0 .
0S .
0St333Ox:0JnC
— 5
> IO >“ 05 =2= 5
it_ TO
c 0
3 OO 0 >* 0■8 fe
0
c5s05
CMQ.Oi_
o
c5g05
COaoi_
O
ao1—
O
a
303

CD
ID
M-
00
CM
cCO3O
€ VSONIe
b§
SfcoCObs
E EID 00 00 CDX X CD CD H I-
O E 00
X X CD CD I- I-
03 -Q
b:2 q3 ° § E o k a.
CM
co(1)203
SZa.oO
oT“T-o
ooto0
203_£ZQ.OL_
o
02ro.cM—O2oCOco'■c001o
0203
szM—o2oCOco'■coQ.OL_CL
00203.£=
<4-Oo0co'•coQ.oL_o.
cn-0_303>0_£I0
JZt223O
rosz
3Q.3O0
SZ
T3C_ro0.c03_c'l.3■o000£05'5CD
003ro0co
03Q.0L_Q.
T3C_ro0szo:c3■o0l_3O3
0
‘oCD
3O>»00
SZ
0
roEb03Ei—Q.C'roE0£E2M—E£i—3O>»0 0-ro o**- 35 73 | oX QJ
05oa.73c03i- 0O 3a = 03 0
030 £03- c '0 =3 (2 !00 0— "O D- C O 03 0
£ «1 ° cO (0
03 o 0 -Q *“ 03
O c
l go ro Q .c
oo2O)C'03
T30■cro03o>»0
£0.QEa1—3o
0£003S ' *03 2£ ° £.0
0$oQ.ToL_oaroi_03C-03"O0■cro03o>*2£0.QQ.0 1 Oc
‘ r oE3o>
3Q."3O0£003
ro 2 sz 0
<: =
03s |0 jD £ X3 .CO 2C 3
s a
>» 03
■82
CM
o
03s | 0 0 £ S 0 2
C 3
§ .§> 03
■8 sto -c g S> 0
Q.O° -x ro W£ to d-- 0 0>- 2 _0 .2^ 03 05 0R E
s io — ro ■=;
ro £ O E 0 0 o 0 c © o-.E 0 «£ E0 "O £3 C2 m 3 5 O O
SZ c w -O~ SJ=£ 033 £ o ro >, oo ro ■o 0
ro ro sz 0
£ '£
0c!co03E0£H—O>."ro3O'0£C
•o0o3CT0>03■C3O>*ro£00oQ-cn-0 0^ -Q
c-03c'szo3o-Q0303C£C03Oc■o030
SZ3O>.0>ro
X
o
304

o
<13-Q
-S>COOCO
0EM0
sz
00ro0a.roc
szO3O
SZtro0o :T3_05oc
co
0EEoO
Q . CO
• i §IICO c~ 0 3 S
ro0 COoS3 ° O -C0 O >
ro £ o o Q.CQ ro 0 ro oo
szro 0 c
H0 CM Oc 030 S0 &22 0 ° - /p 0 roc •
| |
a l lo c X Q O 0
3=o
0.Qoit=o
o5ro'croNcroI -0
T3COEroc1cO0COX
c -roc
x :O3OXICO0C0EEoo
0c003>c<
o-roc
'szOEo
ro_0ro‘croNcroHc
IOCO
o
CDCOT”a
CO
arococoa
3O.QroT30.x
0>rosz050cXoroE
Eo»♦-troa.ro
£
o>*coO)cIS1-o$22ro■ocro0>rosz3o>»+■>rosz•4-122oo2•DCro0
0£oac0xo1_0X
ro*■>to
0 o 0 220 'I
0- c
£ =S2 w co a>« 3 O a -
Age
(Yea
rs)
Prop
ortio
n of
work
it
does
on
your
far
m
(%)
Num
ber
Nam
e/Br
and
of An
imal
/Eq
uipm
ent
305

Q13
9. P
lease
he
lp us
to co
mpl
ete
this
table
on sp
are
parts
yo
u ha
ve
boug
ht f
or y
our
mac
hine
in
the
last
seas
on3oroT3 Oo -*=
S ro r -
- ~ °to ro jr ro O) >,
I T3 2 12
rooo .tn wS)i3§ | < .2
cotororocoO)cQ.Q.O
ro E o 2Q.
i* - ro o to ro _ro oro oc _ ro ro ^3 £-.2O o «i
o §>, £ ro 1.1o' iS ro co
ro .c
3 ^ro ^.2ro ro ro ^ ro o<:
roo .toM—oro| t ® ro2 Gi
ro-QE3
ro€ro■2
s |■S- * ro "o ■*= cro
-Qro4■c -c3 -TO53Iro£•cofc 4*
o «ro cCO
3 ■Q
roS£3 <0
| 5 o ro<0
■3 c ro42 c roS 5 o oro€ oc '^
£ro£42«h.o■3C3suro-3ro•c
cro3codrroDC
£3roc.3)c/5
306

307