The Open University of Tanzania - African Journals Online
218
HURIA Journal of The Open University of Tanzania Volume 27(1) March, 2020 ISSN 0856 6739 The Open University of Tanzania P. O. Box 23409 DAR ES SALAAM TANZANIA Fax (255) 022-2668759 Website http://www.out.ac.tz
-
Upload
khangminh22 -
Category
Documents
-
view
0 -
download
0
Transcript of The Open University of Tanzania - African Journals Online

HURIA Journal of The Open University of Tanzania
Volume 27(1) March, 2020 ISSN 0856 6739
The Open University of Tanzania
P. O. Box 23409 DAR ES SALAAM
TANZANIA Fax (255) 022-2668759
Website http://www.out.ac.tz

ii
EDITORS
Chief Editor: Prof. Magreth S. Bushesha The Open University of Tanzania
TECHNICAL EDITORS
Ms. Brenda Mallinson
Mr. Ezra Kaimukilwa
Mr. Augustine Kitulo
Rhodes University, South Africa
The Open University of Tanzania
The Open University of Tanzania
EDITORIAL BOARD
Prof. Elinami Swai, The Open University of Tanzania
Prof. Jephias Mapuva Bindura University of Science
Education, Zimbabwe
Prof. Rotimi Ogidan National University of Nigeria
Prof. Alexander Makulilo University of Dar es Salaam,
Tanzania
Prof. Happy Kayuni University of Malawi
Dr. Thomas Molony University of Edinburgh, UK
Dr. Joram Tarusarira University of Groningen, The
Netherlands
Dr. Felix Masiye University of Zambia
Dr. Hadija Jilala The Open University of Tanzania
Dr. Oscar Otele University of Nairobi, Kenya
ADVISORY BOARD
Prof. Ezra K. Martim Egerton University, Kenya
Prof. Uswege Minga Tumaini University, Tanzania
Dr. Moses Khisa North Carolina State University,
USA
Dr. Ruth Carlitz University of Gothenburg, Sweden
Dr. Bossman Asare, University of Ghana
Dr. Steve Kerr Imternational School of Muscat,
Oman
Editorial Office
Ms. Josephine A. Temu
The Open University of Tanzania,
Kawawa Road, Kinondoni Municipality,
P. O. Box 23409,

iii
Dar es Salaam, Tanzania
Tel: (255) 022-2668835, 022-2668820
Fax: (255) 022-2668759
E-mail: [email protected]
Website: http://www.out.ac.tz
© The Open University of Tanzania 2020
All rights reserved.
NOTE
Opinions expressed in this journal are those of the authors and not necessarily those of
the publishers – The Open University of Tanzania.
Huria Journal vol. 27(1) March,2020
iv
Contents
Editorial v Lack of Parental Gender Socialization of Children at Family Level and its Effects on Adulthood Gender
Discrimination in Rwanda
Christine Kapita Umumararungu, Appoline Kabera Bazubagira 1
Determinants of Pension Uptake in the Informal Sector of Tanzania
Shadrack Elia Kibona 17
Reasons for Patronage of Traditional Bone Setting as an Alternative to Orthodox Fracture Treatment
A case of Muleba District, Kagera Tanzania
Straton Kakoko Ruhinda 29
Plastic Packaging Materials as Possible Source of Hazardous Chemicals to Food and human health: A
Review
Leonard W.T. Fweja 45
Gender Discrimination in Politics: A Critical Review of Liberalism
Alexander Makulilo 76
A Rule-based Approach for Resolving Cybercrime in Financial Institutions: The Tanzania case
George S. Oreku 93
Fee-free Basic Education Policy Implementation in Tanzania: A ‘Phenomenon’ Worth Rethinking
Richard Shukia 117
Behavioural Predictors of Students’ Career Intentions in the Hospitality and Tourism Industry in Tanzania
Proches Ngatuni, Eunice Nderingo Ulomi 141
Challenges facing Wastewater Management in Fast Growing Cities in Tanzania: A Case of Dodoma City
Council
Anna I. Wawa 170
Assessment of Beekeeping as an Adaptation Strategy to Climate Change in Iramba District
Ziwa Elia Yohana, Josephat Saria 193
Guide for Authors 217

Huria Journal vol. 27(1) March,2020
v
Editorial Prof. Magreth S. Bushesha Editor-in-Chief Huria Journal
Huria Journal vol. 27 (1), March 2020
Lack of Parental Gender Socialization of Children at
Family Level and its Effects on Adulthood Gender
Discrimination in Rwanda
Christine Kapita Umumararungu1 Appoline Kabera Bazubagira2
University of Lay Adventists of Kigali (UNILAK); [email protected]
University of Kigali (UoK); [email protected]
ABSTRACT
The paper discusses holistic integration of gender concepts at tender
ages. This study aimed toinvestigate parents’ participation in socializing
children to gender equality and assess the effect of lack of parental
socialization of children to gender equality. Three hundred and fifty (350)
respondents were purposively selected from Kicukiro, Bugesera,
Musanze, Nyanza and Nyamasheke. Data were collected through
questionnaire, interviews and focus group discussion and qualitatively
analyzed using content analysis. Findings revealed that there is lack of
parental gender socialization of children as it is negatively perceived in
Rwandan families. Gender equality is perceived by 75 % of respondents
to be the cause of family conflicts and violence. Furthermore, 69% of all
respondents accuse the theory of gender equality to divert females from
their responsibilities which results in family dysfunctionality. In addition,
42% of respondents consider gender equality as a way of western people
to disorganize developing countries. Lack of parental gender
socialization of children at family level affects children's adulthood. It
presents enormous and long-lasting consequences to both females and
males. Respondents confirmed that there is a considerable number of
females who did not attend school because fees were reserved to boys. On
the other hand, male respondents confirmed that being overpowered in
childhood negatively affects adulthood relationship with their wives.
Socializing children to gender equality at family level from their tender
ages would be one of the best strategies to eradicate Gender-Based
Violence (GBV) and discrimination.
Keywords: Gender Socialization, gender perceptions, gender
discrimination
1
Lack of Parental Gender Socialization of Children at Family Level and its
Effects on Adulthood Gender Discrimination in Rwanda
Christine Kapita Umumararungu, Appoline Kabera Bazubagira
INTRODUCTION
Families provide a solid foundation on how children view, analyze and
interpret the world. The child development is a continuous process even if
it can change with time, education and other circumstances where a child
establishes new ways of thinking, solving problems, developing
relationships and decision making (Bukatko& Daehler, 2012). Families
are able to provide to its offspring constructive or destructive cultural
values and norms, among them gender social construct is a vibrant
example (Muasya and Muasya, 2020). A stable life is constructed during
children’s socialization and influences the rest of their lives (Halpern and
Jenkins, 2016; Halim et al., 2017).This socialization process is not only
what is taught as ‘do or do not do this’; it is mostly what children observe,
touch, sense, see, hears around. The stability of children characters took
its roots in family basic initiation. It is social integration that ensures
continuity and consensus of shared values in the community (Giddens
&Sutton, 2017).
Socialization is a process by which children learn cultural norms and
values of the society into which they are born. It is a range of practices by
which the child internalizes values of social system to conform and
transform from an asocial being into a fully social adult. Though
development of human personality is constructed in families, they
accused to nourish at tender ages discriminating ideas. Human personality
requires a certain level of stability to build up social relationship and to
conform to the constraint of social-cultural context. Conflicted
atmosphere at home becomes a handicap to its functions and a heritage to
the offspring (Haralambos and Holborn, 2018; Kollmayer et al., 2018).
The notion of gender took its roots firstly in the family. It is an
environment of trust where children are socialized with gender social
construct. It becomes a legacy which dictates adulthood’s behaviors
which may not be easily changed with time. Children’s gender identities
and expressions are shaped within family interactions. It is transmitted
throughout generations and accepted as a reality and this situation is not
yet tackled. There is lack of parental gender education at tender ages
(Eliot, 2010, Halim, 2016). Gender refers to rules, norms and practices by
which biological differences are culturally constructed over time and
results in unequal treatment and opportunities (Ogato, 2013; Babatunde,
2015; Bayeh, 2016). Gender is recognized as natural; it is considered as
an identity and an expression of roles (Newman, 2016; Kroeger et al,
2019). It is socially constructed whereby norms, values and roles are
2

Huria Journal vol. 27 (1), March 2020
assigned to males and females based on patriarchal principles which
create differences and form two worlds of masculinity and femininity.
Male and female children are expected to identify and express themselves
as such throughout their lives (Gunn & MacNaughton, 2007). Once
children are not socialized with the notion of gender at young age,
understanding and respecting gender equality norms and values in
adulthood would be reluctant. Hence, gender violence and discrimination
originate from lack of parental orientation to gender equality in
childhood. Gender equality is a fundamental human right and a necessary
foundation for a peaceful, prosperous and sustainable nation where
females and males have equal rights. Equality does not mean sameness
between females and males. This understanding is engrained in children’s
life through socialization to gender equality and complementarity (Amato,
2012; Baker et al., 2016; Cutas & Smajdor, 2017).
After the Beijing Platform of Action in 1995, all countries have been very
sensitive to the problem of gender inequalities and its effect to social
capital. This consciousness resulted in the formulation of National Gender
Policy to eradicate gender discrimination and all forms of inequalities
(Ferrant et al., 2015). It aims at increasing awareness on gender as a
development concern, integrates women in decision making, promote
their education and strengthening partnerships for the advancement of
gender equality (Tundi, 2015). The policy itself does not mention clearly
with specific context how to socialize children with values of gender
equality it only defines child protection against GBV and the role of
grassroots level committees (MIGEPROF, 2010; Bayer, 2016; Ekpe et.
al., 2016). The world tends to be divided into two major social groups
(females and males). The relationship of these two is exploitation,
domination, submission and overpower. It is a social hierarchy of power
where the elite is reserved specifically to some outstanding men and to all
men in comparison to women (Wilbourn& Kee, 2010; Patterson et al.,
2017).
Rwanda has approved ten years ago National Gender Policy that
addresses gender inequalities and focuses on programs that empower
women and girls. However, the organ in charge of its implementation has
not yet reached family level (MIGEPROF, 2010). The culture of gender
equality is not yet at its success stories in Rwandan families.
Discriminating words and actions are still sensed among all categories of
ages including children. They are still adapting discriminating behaviors
from parents. The early socialization of gender equality at family level
3
Lack of Parental Gender Socialization of Children at Family Level and its
Effects on Adulthood Gender Discrimination in Rwanda
Christine Kapita Umumararungu, Appoline Kabera Bazubagira
has been overlooked and this resulted in weak program at cell level to
focus on program of gender equality in families as prevention to Gender-
Based Violence.
Parents are not yet putting an effort to take advantage to socialize young
children with values of gender equality. They are not yet active players in
changing home environment of gender bias and discriminations as the
ones who first inculcate cultural and social values to young children.
Even though women have demonstrated power in different
responsibilities at national level, it is not yet the case in families. There is
still lack of parental education to gender equality. Families are tight to
cultural background which has marginalized women and who in turn
accepted passively (Debusscher&Ansoms, 2013, Ekpe et al., 2016). There
is a gap concerning children’s socialization to gender equality at early age
which is a big challenge to the eradication of gender discrimination. From
the highlighted gender inequalities which are still observed, there is a
need of conducting a study which addresses the root causes of the issue.
The purpose of the study was to investigate the effect of lack of parental
gender socialization of children at family level on adulthood gender
discrimination in Rwanda. It also highlighted the necessity of socializing
children with gender equality as a way of eradicating gender
discrimination. The study was motivated by persistent discriminating
behavior observed despite Rwanda effort made to stamp it out. The
specific objectives were to investigate parents’ participation in socializing
children to gender equality and assess the effect of lack of parental
socialization of children to gender equality.
METHODOLOGY
The study aimed at examining the effect of lack of parental children’s
gender socialization on adulthood gender discrimination in Rwanda. It
was qualitative in its design where researchers attempted to study
human action from the perspective of social actors. The primary goal of
studies using this approach is to describe and understand human
behaviors (Babbie and Mouton, 2010; Neuman, 2011). It intended to
address the roots causes of discriminating behaviors in Rwandan
communities. Primary data were collected through questionnaire,
interviews and focus group discussions from three hundred and fifty
(350) respondents purposively selected from Kicukiro, Bugesera,
4

Huria Journal vol. 27 (1), March 2020
Musanze, Nyanza and Nyamasheke Districts. The five selected Districts
covered urban and rural areas. Seventy respondents were selected in
each including both males and females. Purposive sampling was used to
select cases that would enable researchers discover information
(Saunders et al., 2019). Content analysis was used to systematically
categorize, classify and summarize data (Babbie & Mouton, 2010;
Kitchin &Tate, 2013). Respondents’ ideas were grouped, analysed and
interpreted according to themes. In representing respondents’ ideas, they
were given unreal names for confidentiality.
FINDINGS AND DISCUSSION
The section presents and discusses findings related to the topic under
study. It highlights respondents’ views about the concept of gender
discrimination, social construct and beliefs about gender equality.
Collected data were related to parents’ participation in socializing
children to gender equality and effects of lack of parental socialization of
children to gender equality.
Parents’ participation in socializing children to gender equality
Gender is perceived differently; people misunderstand and misinterpret it.
It is perceived as a political issue that has nothing to do with everyday life
in the family; a western concept which cannot fit in Africa. A
considerable number of respondents (42%) negatively stereotype the
concept of gender. The following misconception of gender captures
parents’ bias on the idea of gender equality. Sharing his point of view,
Mia articulated that:
Gender equality is a business of western people to disorganize
underdeveloped countries. White people are imposing their culture to
Africans; it is a feminist concern that incites African women to rebellion
to their husbands. If there are men who are teaching gender equality, it
is a way of gaining bread or they are weak men dominated by their
wives.
This wrong perception of gender constitutes a barrier to gender education
in families and this position has been significantly supported. Early
children’s education to gender cannot take place in families with such
perceptions. Building strong foundation of gender equality necessitates
parents’ mindset change. Children’s socialization to gender equality is not
about telling them the ideal behavior. It is providing a good role model to
imitate instead of telling them ‘do or do not do this’. Children are great
imitators, give them something great to imitate. It is mostly what children
5

Lack of Parental Gender Socialization of Children at Family Level and its
Effects on Adulthood Gender Discrimination in Rwanda
Christine Kapita Umumararungu, Appoline Kabera Bazubagira
observe, touch, sense, see and hear around which shape their values and
beliefs. The stability of children characters took its roots in family basic
initiation. It is social integration that ensures continuity and consensus of
shared values in the community (Giddens &Sutton, 2017). From this
family environment where parents negate the essence of gender equality,
they accordingly educate their children. Sharing her experience in group,
Fides expressed that: ‘My parents gave more value to my young brother
and educated him. Discouraged by my parents, I did not attend school
and I got married very early.’
On the other hand, 58 % of respondents clearly understand the concept of
gender but supported its contextual consideration. To them, gender refers
to socially constructed relationship between men and women where
societies determine what deserves to men and women, separation of
work, education, resources, family authorities, and so forth. People
interpret differently this discriminating family environment because it
finds its good reason in societal values and norms. Amongst those who
support the genuine definition of gender (58%), a good number of them
are female, 67% and males are 33%. Even though they give value to
gender equality, they passively accept gender discrimination. Mat
explained that: ‘If gender discrimination finds its good reason in societal
values and norms, there is nothing we can do to change this mindset.’
They are passive consumers of discrimination. Fils emotionally pointed
out that: ‘It is not good to be negatively labeled in the community. There
is no reason to claim about what others have accepted.’ Change has to
come from decision makers. This statement got applause in group
discussion. Faz strongly supported this position uttering that ‘wise wives
keep quiet and are submissive to social norms and values in their families
to get favor from their husbands.’ Reacting to this point of view, M₂
expressed that: ‘Gender discrimination is a problem but time will resolve
it, there is no need to fight for gender equality.’ They understand and
interpret gender discrimination as a crucial problem, but they fear and
negate their role in changing the situation. Families are the foremost
actors for changes even though parents have not yet realized that they are
engine of positive change. Perceptions of gender do not only consider
how it is defined by both females and males. It also tackles how they
value each other in family decision making. Gender is accused to have
brought in families a strange situation where a husband cannot take
decision and inform his wife. If husbands are
6
Huria Journal vol. 27 (1), March 2020
looking for the best of their families, there is no need of taking a long
time to discuss and have consensus. It would take more time which
would be used in implementing decisions. Ziz, quoting the Bible, he
alleged that ‘there is an exaggeration in gender equality consideration.
Created different, gender inequalities is natural, not socially constructed.
Before those theories were focused on, family decisions were taken by
husbands and no problem was observed.’ To support this position, Xum
underlined that: ‘Family decision maker is the husband not the wife.’
Zuzu accentuated that: ‘the reality is that husbands own the family
authority.’ The discussion was too hot because women expressed their
anguish to be considered as passive in family decisions. The question on
how to change the situation through children socialization to gender
equality that empowers family consensus in decision making is not yet
clear. Nana articulated that: ‘Some of the decisions taken at home affect
children and wives are powerless to change them.’ It has been proved
that most of family decisions are taken by men without informing their
partners. Rwandan society is still tight to its cultural background which
has marginalized women and who in turn accepted passively. Fifi
emphasized that: ‘mostly, what husbands fear to discuss with their wives
has some discrete information they do not want to disclose.’ There is a
hide and seek game between partners and it does not offer to children
something great to imitate and develop a sense of gender equality.
Articulating his view, Kin said that: ‘Wives have good ideas; they are
able to contribute to the development of the family but it is not a must to
involve them in family decisions.’ Another issue which was raised by
Chak n group discussion was: ‘What can happen if the one who takes
decision is a wife and informs her husband to adhere to the decision?’
The question brought opposition between women and men. Men did not
stand at the same point. They were in two opposing sides. One side of
men (85 %) supported the fact that women have to be submissive to
men’s decisions. This matches with a Rwandan saying which states that
‘when a family is led by a wife, it does not prosper.’ In the same line, men
have been socialized from their early age with cultural background of
gender discrimination and this tends to remain firm in most of families
which is a barrier to children’s socialization with values of gender
equality.
Nik stated that: ‘the ideal is discussing all family issues together and
come up with a common decision. Otherwise, wives should also take
decision and inform their husbands as they do.’ This position was
supported by 15% of men. From the two polemic stands of male
7

Lack of Parental Gender Socialization of Children at Family Level and its
Effects on Adulthood Gender Discrimination in Rwanda
Christine Kapita Umumararungu, Appoline Kabera Bazubagira
respondents, both do not reflect the real target and aim of family gender
equality where parents give a safe platform to their offspring to learn
from what they observe at home. On the other hand, Weno voiced that:
‘family decisions have to be taken by husbands and inform their wives’
and this position was supported by the majority of female respondents
(53%). Opposing this position, Yowe alleged that: ‘family decisions have
to be taken jointly’ and she was supported by 46% of women.
Challenging the situation where a husband may take decision and inform
his wife, Zetu expressed that: ‘If my husband can take a decision and
inform me, I am also able to do so’ and 1% of female respondents
supported the position. The polemic discussion around family decision
making revealed that gender equality is not yet well understood at family
level which makes complex children’s socialization to gender equality
where family atmosphere vehiculates unequal power in family decision
making.
There is a problem to initiate children to gender equality at early age.
Eloy highlighted that: ‘women are overloaded by housework without help
from their husbands; they are there to give orders and children learn by
observation. When they play at tender age, they imitate those behaviors.’
There is a saying supporting this trend which states that ‘a man who treats
himself as a dog can fetch water’ (because fetching water in Rwandan
culture has always been a role of women and children). Men could simply
be finding a pretext to escape hard work in the name of culture. Fetching
water in some rural areas in Rwanda is a very hard work reason why men
abdicate the work to their wives. Women consideration did not change
with empowerment of girls and women education, entrepreneurs, head of
families and bread winners. The modern and postmodern eras still have
and entertain gender discrimination (Shen-Miller et al., 2011). Religious
beliefs, men selfishness, women’s biological nature and passivity
regarding their rights are barriers. Men’s power to dominate and women’s
weakness to naïve submission to male’s orders do not frame a safe
platform for better children’s education to gender equality. Passivity is
understood and interpreted as a peaceful approach.
The necessity to socialize children to gender equality is not the focus in
various families. Maz stated that: ‘the theory of gender equality is the root
8

Huria Journal vol. 27 (1), March 2020
cause of family conflicts because of none submission of women to men
and lack of respect. Gender Based Violence (GBV) is the result of
women’s insubordination.’ This statement has been supported by 75 % of
respondents. In the same line, Lulu underscored that: ‘If the government
gives too much power to women than ever before, it is a way of inciting
family divorce because two heads cannot be cooked in the same pot.’ This
is a Rwandan saying that means two powers cannot be together; the
subordination is compulsory. If changes that are taking place to promote
gender equality are negatively considered, family initiatives may be
limited to few that are active agent of changing behaviors. Jig said that:
‘focusing on socializing children to gender equality in early childhood
destroys calm and simplicity between girls and boys and affects their
future families. As a result, any simple conflict in families leads to
separation and divorce because they all have power.’ Gender equality is
accused to be the root cause of family dysfunctions and divorce. The idea
was emphasized by Kal who stated that: ‘Gender equality is the origin of
family disorder, instead of bringing complementarity, it has brought
separation.’ This position was considerably supported by 69 % of
respondents. Gender equality is accused to be the major cause of family
dysfunction. ‘If there is equality in families, it is hard to achieve
consensus. One of partners should hold authoritative decision’ uttered
Gaj.
Rwandan family environment is full of gender stereotypes and
assumptions about gender equality. It continues to nurture gender
discrimination and they have justifications. Gender equality is not yet
well understood, parents have a lower level of understanding its necessity.
This makes complex the application of gender equality in families. If
parents themselves do not value gender equality in their families,
children’s socialization to gender is still far to be reached. Men are
considered to be the ones who have power to change things.
Discriminating women is an advantage to men; it is a weapon of
domination and power. However, women have to peacefully fight for
their rights instead of passively accept what is imposed to them. Thus,
there is a need of sensitizing parents on the importance of mutually
sharing ideas and responsibilities within families. This will help to create
conducive family environment to socialize children with gender equality
and eradicate gender discrimination.
9
Lack of Parental Gender Socialization of Children at Family Level and its
Effects on Adulthood Gender Discrimination in Rwanda
Christine Kapita Umumararungu, Appoline Kabera Bazubagira
Effect of lack of parental socialization of children to gender equality
Masculinity and femininity do not wait for formal education to emerge or
to be taught. Children are born with physical differences and in relation
with their parents; they internalize and socialize with these differences.
Through social interactions and play, children set off activities and assert
control over their surrounding world. They begin to explore their family
environment, learn new concepts and actions (Coles et al., 2002;
Alexander & Wilcox, 2012). Till this age, children are under their
parents’ influence. Negative early experiences of discrimination present
consequences in adulthood behaviors. Regarding early children’s
socialization to gender at family level, Pinc pointed out that:
I grew up in family full of domestic violence, torture, exchange of
frustrating words. I have never seen my parents together in sitting room. I
considered it as normal till when I was eight years. I went to my uncle’s
family and I was surprised to see my uncle and his wife laughing,
discussing and exchanging encouraging words. This intimidated me at the
first time. I could not understand what went wrong in my family. Back
home, I started to question my family environment as having a problem.
This discriminating family environment has affected me and my brothers’
gender identity. Educated, we are not gender sensitive and all the time my
brothers consider female as not equal to them even if two of them are
married. I do fight to understand what gender equality means but
sometimes, I have a self-discriminating behavior.
Quality education at early children’s life leads to continued success in
their future families (Lancet, 2011). Gender education should start at
early age to equip children with positive thinking regarding equal rights
and opportunities between males and females. If not done, negative early
experience of gender discrimination has long lasting consequences in
future. Self-discrimination, insensitivity to gender equality and passive
submission to male were acquired in the family atmosphere. At early age,
children start to discover that girls and boys are different and if these
anatomical differences are not transformed into complementarities by
parents and family environment, they are used as a weapon to domination
and discrimination. Fofo articulated that:
I am the first born in a family of six girls. My parents were unhappy
since the third born and ignored our presence because of a desire
to have a baby boy. Sympathizing with their worries, at four years I
started behaving like boys. Fighting in vain to be a boy, I was
frustrated and confused. I grew up with an inferiority complex in
front of males.
10

Huria Journal vol. 27 (1), March 2020
Children are very active players in their life development but it is the
family environment that equips them with social constructs and ways of
thinking, feeling and communicating (Bukatko & Daehler, 2012; Muasya
&Kahiga, 2018). If gender bias has to be eradicated, it has to take place
firstly in the family to reflect deeply parents’ understandings of gender
equality. Parents can make more informed decisions and create
opportunities to address gender inequalities and biases at family level.
Wenu sharing his tender age socialization, expressed that:
I was born in a family of four boys, the whole village named my family to
be blessed. I started mistreating girls in nursery school. Even if I received
several times teachers’ punishments, I felt confident because my Dad
addressed ladies as weak and not intelligent. This has affected the
relationship with my wife. I am still struggling to adjust my behavior.
When parents consciously or unconsciously engage with children, they
are constantly emitting delicate beliefs and values on gender. M₈’s parents
did not directly address discrimination to their children, but their family
discussion has nourished gender discrimination to them. Physical
differences are transformed into constructed weakness to make girls
inferior and boys superior.
Due to cyclical gender discrimination encountered in families, Chichi
expressed that ‘The problem of gender discrimination has become so
natural and sometimes we do not feel it. As children grow, the sense of
self, autonomy and belongingness would pave a way of understanding the
opposite sex with mutual respect. Children reflect in the community the
language and behavior from parents.’ Family gender expressions affect
children’s way of thinking, reacting and interacting in adulthood (Bjorklund,
2012). The point was highlighted by Ian stating that: ‘at young age, children
play and project their future roles. The kind of role they play is grounded
on what they observe in their families. A male child may play giving
orders to a female child reflecting how his father gives orders to his
mother.’ In the same views, Hab described that:
Discriminating words and behaviors are commonly observed. Females are
frequently embarrassed by words and behaviors displaying that they are
not like males, they cannot be equal to them, they have to be protected and
secured by males. In many cases, these behaviors, words are considered to
be normal and once you consider them as part of gender discrimination,
mostly you are not understood, you become a problem. The language
people have got from their families continues to stress them.
11

Lack of Parental Gender Socialization of Children at Family Level and its
Effects on Adulthood Gender Discrimination in Rwanda
Christine Kapita Umumararungu, Appoline Kabera Bazubagira
Describing endured gender inequalities, Biya stated that: ‘In our family,
we were many ladies and two twin boys who were the last born. All of us
(ladies) did not complete high school. Parents said that they are keeping
school fees for boys. That is the reason why I dropped out school.’ From
this chocking family experience, those privileged boys were initiated to
give much value to boys than girls and during their adulthood, they are
likely to do the same. To illustrate this point of view Quata highlighted
that:
Parents who discriminate their children are paving to them a wrong path
to follow in their future families. Overpowered by my dad, my sisters were
doing everything for me. Once I got married, the first year I struggled to
understand some of my wife’s behaviour because she was very sensitive to
gender equality.
Fata fights to understand his wife’s behavior was not easy as he was still
viewing her using the eye glasses of his family environment where boys
were seating and watching movies and giving orders to their old sisters.
He said that:
What makes the situation worse is when women claim for their rights
and raise their voice to educate their daughters as equal to boys; they
are negatively labelled as masculinised. My wife had a conflict with
my parents relating to how she socialized our three children to gender
equality. My Dad was unhappy of the situation and started blaming
me. ‘You are no more a husband. When did you decide to be feminine?
You have lost your identity. You are dominated, powerless in your
home. Think about it.
Parents who understand, defend and socialize their children to gender
equality are considered to be masculinised (wife) or feminized (husband).
From the analysed cases, it has been observed that gender socialization is
still an issue to be debated on. A good way of gender discrimination
eradication should start at early age when children are still in their
parents’ hands for guidance and imitation.
12

Huria Journal vol. 27 (1), March 2020
CONCLUSION
Parents play a big role in shaping children’s ways of thinking, norms and
values. The way they have been socialized to gender is replicated to their
children. This lack of parental socialization to gender equality at tender
age constitutes a barrier to a good understanding of gender concept. Risk
factors of being socialized with gender discrimination continue to be
entertained in families and local communities. Approaches that are
essential to ensure children’s family gender socialization that may create
protective factors in the environment are not utilized and less exploited.
Children are raised up with potential vectors of gender discrimination
such as words, behaviors, beliefs, games, initiation to home activities and
all this expose them to gender bias and discrimination. During the period
where children are not able to logically understand and manipulate
received information, family has substantial influence on the language to
use, behavior, not only using their authorities but also parents’ behaviors
and family environment. Parents are not yet active players in changing
home environment of gender bias and discriminations as the ones who
first inculcate cultural and social values to young children. There is a need
of sensitizing parents and make them understand their role of empowering
girls and boys equally in education that reduces and eradicates gender
inequalities. Gender does not separate family responsibilities as two
blocs. It focuses on human rights and respect; gives responsibility to each
family member and being accountable to each other. It reinforces saying
‘we’ than ‘I’ in family unity.
REFERENCES
Alexander, G. M. and Wilcox, T. (2012). Sex differences in early infancy.
Child Development Perspectives, 6, 400–406.
Amato, P. R. (2012). The Consequences of Divorce for Adults and
Children: An Update. Pennsylvania State University, University
Park, PA, US.
Babatunde, J. O. (2015). African union and gender equality in the last ten
years: some issues and prospects for consideration. Journal of
Integrated Social Sciences, 5 (1), 92-104.
Babbie, E. and Mouton, J. (2010). The Practice of Social Research, 10th
edition. Oxford: Oxford University Press.
13

Lack of Parental Gender Socialization of Children at Family Level and its Effects on
Adulthood Gender Discrimination in Rwanda
Christine Kapita Umumararungu, Appoline Kabera Bazubagira
Baker, E.R., Tisak, M.S. and Tisak, J. (2016). What can boys and girls
do? Preschoolers’ perspectives regarding gender roles across
domains of behavior. Social Psychology of Education 19, 23–39.
Bayer, E. (2016). The role of empowering women and achieving gender
equality to the sustainable development of Ethiopia: Journal
Elsevier Pacific Science Review: Humanities and social science, 2,
37-42.
Bjorklund, D. F. (2012). Children’s Thinking: Cognitive Development
and Individual Differences, 5th Edition. USA: Wadsworth.
Bukatko, D. and Daehler, M. W. (2012). Child development, A Thematic
Approach, 6th Ed. USA: Wadsworth.
Coles, R., Hunt, R. and Maher, B. (2002). Erik Erikson: Faculty of Arts
and Sciences Memorial Minute. Harvard Gazette Archives.
Cutas, D. and Smajdor, A. (2017). The moral status of the (nuclear)
family. Etikk I Praksis – Nordic Journal of Applied Ethics, 11(1), 5
- 15.
Debusscher, P. and Ansoms, A. (2013). Gender Equality Policies in
Rwanda: public Relations or Real Transformation. Journal of
Development and Change, 44 (5), 1111-1134.
Ekpe, D.E. Omenka, J.I. and Bisong, F.A. (2016). Strategies for
Achieving National Gender Policy in Nigeria: A Critical
Analysis. Advances in Social Sciences Research Journal, 3
(6);137-144.
Eliot, L. (2010). Pink Brain, Blue Brain: How small differences grow into
trouble some gaps and what we can do about it. Boston, Mass:
Mariner Books
Ferrant, G., Nowacka, K. and Thim, A. (2015). Living up to Beijing’s
vision of gender equality: Social norms and transformative change.
OECD Development Centre Issue Paper
Giddens, A. and Sutton, P. W. (2017). Sociology, 8th Edition. India: New
Delhi
Gunn, A. & MacNaughton, G. (2007). Boys and Boyhoods: The Problems
and Possibilities of Equity and Gender Diversity in Early Childhood
Settings. Theorising Early Childhood Practice: Emerging
Dialogues, ed. by L. Keesing-Styles & H. Hedges, 121–136. Castle
Hill, NSW: Pademelon Press.
Halim, M. L. D. (2016). Princesses and superheroes: social-cognitive
influences on early gender rigidity. Child Development and
Perspectives, 10, 155–160.
14

Lack of Parental Gender Socialization of Children at Family Level and its Effects on
Adulthood Gender Discrimination in Rwanda
Christine Kapita Umumararungu, Appoline Kabera Bazubagira
Halim, M. L. D., Ruble, D. N., Tamis-LeMonda, C. S., Shrout, P. E. and
Amodio, D. M. (2017).
Gender attitudes in early childhood: behavioral consequences and
cognitive antecedents. Child Development, 88, 882–899.
Halpern, H. and Jenkins, M.P. (2016). Parents’ Gender Ideology and
Gendered Behavior as Predictors of Children’s Gender-Role
Attitudes: A Longitudinal Exploration. Sex Roles,74 (11), 527-542.
Haralambos, M. and Holborn, M. (2018). Sociology: Themes and
Perspectives, 8th Edition. London: Collins.
International Alert (2012). Women’s political participation and economic
empowerment in post-conflict countries: Lessons from the Great
Lakes region in Africa Report. Eastern Africa Sub-Regional
Support Initiative’s report.
Kitchin, R. and Tate N. (2013). Conducting Research in Human
Geography. Theory, Methodology and Practice. London :
Routledge.
Knafo, A. and Spinath, F. M. (2011). Genetic and Environmental
Influences on Girls’ and Boys’ Gender-Typed and Gender-Neutral
Values. Developmental Psychology, 47 (3), 726 –731.
Kollmayer, M., Schober, B. and Spiel, C. (2018). Gender stereotypes in
education: Development, consequences, and interventions.
European Journal of Developmental Psychology, 15 (4), 361-377.
Kroeger, J., Recker, A. E. and Gunn, A. C. (2019). Tate and the Pink
Coat: Exploring Gender and Enacting Anti-Bias Principles. Young
Children,74 (1), 83-92.
Lawrence, M. B. and Sarah, A. F. (2015). The Role of the Family and
Family-Centered Programs and Policies. The Future of Children, 25
(1), 155-176.
MIGEPROF (2010). National Gender Policy. Kigali, Rwanda.
Muasya, J. and Kahiga, R.W.M. (2018). Invisible Obstacle to Gender
Equality: Gender Stereotype Messages in Early Childhood
Education Books in Kenya. Global Journal of Educational Studies,
4 (1), 69-89.
Muasya, J. and Muasya, I. (2020). A Study of Children’s Perceptions of
Gender Identity and Stereotype in Public Pre-Primary Schools in
Nairobi County, Kenya. International Journal of Elementary
Education, 9 (1), 1-7
Neuman, W.L. (2011). Social Research Methods: Qualitative and
Quantitative Approaches, 7th Edition. Pearson: Boston.
15
Lack of Parental Gender Socialization of Children at Family Level and its Effects on
Adulthood Gender Discrimination in Rwanda
Christine Kapita Umumararungu, Appoline Kabera Bazubagira
Newman, B. (2016). Mother Goose Goes to Mardi Gras: Connecting with
LGBT+ Families and Children. The Anti-Bias Approach in Early
Childhood, ed. R.R. Scarlet, 51–68. Sydney, AU: MultiVerse
Publishing.
OECD (2020). Do boys and girls have similar attitudes towards
competition and failure? Focus, No. 105. Paris: OECD Publishing. Ogato, G. S. (2013). The quest for gender equality and women’s empowerment
in least developed countries: Policy and strategy implications for
achieving millennium development goals in Ethiopia. International
Journal of Sociology and Anthropology, 5(9), 358-372.
Patterson, C. J., Sumontha, J. and Farr, R. H. (2017). Children’s Gender
Development: Associations with Parental Sexual Orientation,
Division of Labor, and Gender Ideology.
Saunders, M.N.K., Lewis, P. and Thornhill, A. (2019). Research Methods
Business Students,8th Edition. New York: Pearson.
Shen-Miller, D. S., Olson, D. and Boling, T. (2011). Masculinity in Non-
traditional Occupations: Ecological Constructions. American
Journal of Men’s Health, 5 (1), 18–29.
The Lancet (2011). Child development in developing countries, series
2. The Lancet, 378, 1325- 28, 1339-53.
Tundi, T. E. (2015). Factors influencing women participation in political
leadership- the case of
Kimilili constituency of Bungoma county, Kenya. Global Advanced
Research Journals, 4 (1), 001-031.
Wilbourn, M. P. and Kee D. W. (2010). Henry the nurse is a doctor too:
implicitly examining children’s gender stereotype flexibility for
male and female occupational roles. Sex Roles. A Journal of
Research, 62 (9-10), 670-683.
UNDP (2018). Gender Equality Strategy: UNDP Rwanda (2019-2022)
16

Huria Journal vol. 27 (1), March 2020
Determinants of Pension Uptake in the Informal Sector of
Tanzania
Shadrack Elia Kibona
University of Dar es Salaam
ABSTRACT
Pension is important for persons in both formal and informal sectors of
the economy. In developing countries, formal sector is much covered in
terms of pension compared to informal sector though people employed in
the two sectors are equally in need during retirement age. This study
aimed at determining the factors for pension uptake in the informal sector
in Tanzania, secondary data collected by FinScope Tanzania in 2017
were used. To determine the factors for pension uptake in the informal
sector, the binary multiple logistic regression model was applied. The
dependent variable is pension status and the independent variables
include age, gender, highest education level, income, location, and main
income generating activity. Individuals working in farming and fishing,
trade, service provision, and casual work are less likely to uptake pension
compared to informal salaried. Likewise, females are less likely to uptake
pension compared to male category in the informal sector. Individuals at
age forty and above are more likely to uptake pension compared to those
aged less than 20 years. Middle and the two highest quintiles of income
are more likely to uptake pension compared to those in the two lowest
quintiles of income. Persons in urban are more likely to have pension
compared to rural residents. Pension uptake is common to individuals
with above secondary education, at least middle-income quintiles, urban
residents, males, and those aged forty years and above in the informal
sector.
Key Words: Pension, uptake, informal sector
17

Determinants of Pension Uptake in the Informal Sector of Tanzania
Shadrack Elia Kibona
INTRODUCTION
The evolution of pension is based on the Bismarckian social welfare in
German and it was very common for formal sector but recently following
the millennium development goals, the focus is also on informal sector
(Hu and Stewart, 2009). Pension is purposely for helping persons at the
time when they get retired from working (Modigliani and Muralidhar,
2004). Population in countries with no universal pension schemes for old
age are more likely to be affected by poverty during old age (Joust and
Rattenhuber, 2018). The life-cycle theory of saving illustrates that people
save at a young age for consumption at old age (Ando and Modigliani,
1963). Pensioners get rid of poverty after retirement from working to
sustain their life through pension at the time their contribution to the
workforce is believed to diminish.
The government of Tanzania implements all labour regulations and has
developed the national security policy which is consistent with the ILO
social security convention of 1952 ((ILO, 2008). Pension as a social
protection is important for every individual for use during retirement age
regardless of employment in either formal or informal sector (Damerau,
2015). The informal sector is broadly defined as units engaged in the
production of goods or services with the main objective of generating
employment and incomes to the persons involved (ILO, 1993). The
informal sector in Africa employs 85.8 percent of employed persons
(ILO, 2018). In Tanzania, about 4.3 million people are engaged in the
informal sector as their main economic activity and considering the
SMEs, most of them fall in the informal economy (FinScope Tanzania,
2013; ILO, 2017; NBS, 2015).
Therefore, in order to ensure poverty reduction during old age, uptake of
pension through social security schemes is necessary for both formal and
informal sectors. In Tanzania, there were five pension funds which
included GEPF, LAPF, NSSF, PPF, and PSPF before the decision by the
government to merge some of them (SSRA, 2019). Recently, the
government has merged some of these pension funds to form two major
pension funds one for public sector employees and the other for private
sector employees. The PSSSF has been established officially 2018 after
merging GEPF, LAPF, PPF, and PSPF for public sector employees and
NSSF has been uniquely for private sector employees, informal sector
employees and the self-employed (URT, 2018).
18
Huria Journal vol. 27 (1), March 2020
The factor which is commonly known to influence people to join pension
funds in Tanzania is the compulsory scheme for formal sector. Recently
from implementation of millennium development goals, even the informal
sector is considered for pension uptake. According to the report by
FinScope Tanzania (2017) in Tanzania, 16 percent of pensioners joined
voluntarily to private pension fund and 84 percent joined as a statutory by
the employer. Beside the requirement by the government requiring
employers to contribute for their employees with some percents
contributed from salary, other factors influencing uptake of pension in
Tanzania are not known. Social protection is inadequate for the majority
of workers especially in the informal sector even though the ILO
framework redirects workers to get social protection (Ackson and
Masabo, 2013). Pensioners in Tanzania are directly attracted by formal
employment and particularly biased with serving in the government
institutions as a way to secure old age pensions after retirement form
employment (Ahmed and Wang, 2018; Songstad et al., 2012). The formal
sector and the informal sector play a mutual role in providing
employment to people such that neither formal nor informal sector can
completely absorb the whole working population in the country.
Researchers Adzawla, Baanni and Wontumi (2015) in their study point
out that elderly, single, highly educated, highly depended, and high-
income earners have high a probability of contributing to the pension
scheme. A study by Heenkenda (2016) identified the number of
dependants, income, asset index, financial literacy and social capital index
as some of the factors for dropping out from the voluntary pension
scheme in Sri Lanka. A study by Ingrid and Russell (2008) identify lack
of information by migrants in China as a barrier to utilize social security
scheme in a situation where employers are not willing to get involved
with social protection through pension schemes. Factors for pension
uptake have been examined for the general population that include formal
sector that is under compulsory pension scheme and informal sector that
depends on voluntary scheme. There is a need to understand factors that
determine pension uptake in the informal sector which is not based on
compulsory scheme. Therefore, this study aimed at determining factors
that influence pension uptake in the informal sector in Tanzania.
METHODOLOGY
The study used secondary data collected by FinScope Tanzania in 2017.
This survey collected information related to pension and other related
financial inclusion variables in Tanzania for persons aged 16 years with
19

Determinants of Pension Uptake in the Informal Sector of Tanzania
Shadrack Elia Kibona
the sample size targeted to 10,000 persons with a response rate of 95
percent equal to 9,459 respondents. From this data, the informal sector
domain analysis was utilized to suit the objectives of this study which
targeted factors for pension uptake in the informal sector. From the
sample collected by FinScope Tanzania, 9033 respondents belong to the
informal sector after omitting those in the formal sector. Multiple binary
logistic regression analysis was used to model the relationship between
pension uptake and its determining factors in the country. The dependent
variable, in this model, is pension uptake which is a dummy variable
taking value “1” if an individual is a pensioner and “0” otherwise.
Multiple binary logistic regression determines the likelihood of factors
influencing a dependent variable. The independent variables identified
from the review of related studies include age, gender, cluster location,
the main source of income, level of education and income. Progressive
out of Poverty Index (PPI) was used as a proxy variable for income. The
general mathematical representation of multiple binary logistic regression
model is given in equation 1. The central role of the logistic regression
model is to estimate the log odds of the event in this case pension uptake.
The variables , are the independent variables which
determine pension uptake expressed in a linear model.
FINDINGS
The findings of this study are presented in forms of descriptive and
inferential statistics. Table 1 presents the descriptive statistics of variables
used in this study. Most of the respondents 63.24% and 88.53% of males
and females respectively in this study had married marital status and
single accounted the least 5.71% and 1.39% of males and females
respectively. Most of the respondents in this study were aged forty years
and above accounting 39.5% and 33.87% of males and females
respectively with very few aged below 20 years accounting 10.23% and
11.74% of males and females respectively. Farming and fishing were the
main sources of income for most of the respondents for both males and
females. Among males, 56.96% were farmers and fishers and 54.44% of
females were farmers and fishers. This is in line with statistics from the
World Bank showing that agriculture which employs a large number of
20

Huria Journal vol. 27 (1), March 2020
people in the informal sector and in the country have a share of 65% in
2019 (World Bank, 2020).
Similarly, a study by Idris (2018) confirms that the agriculture sector
employs the largest number of females. Very few depend on other
economic activities as their main sources of income. Therefore, most of
the listed economic activities presented were conducted by individuals in
the informal sector. In this study, most of the individuals working in the
informal sector completed primary level of education where males and
females accounted 52.3% and 49.1% respectively. Very few had at least a
university level of education with males and females accounting 1.78%
and 1% respectively. Working in the informal sector does not require any
educational qualification which is contrary to formal sector where the
qualification in terms of education is required.
Table 1: Descriptive statistics of variables used in the study
Variables Frequency
Male Female
Cluster
Rural 2,925(75.81%) 3,760(72.65%)
Urban 933(24.18%) 1,415(27.34%)
Total 3,858(100%) 5,175(100%)
Marital status
Married/living together 487(63.24%) 2,910(88.53%)
Divorced/separated 77(10%) 104(3.16%)
Widowed 162(21.03%) 227(6.9%)
Single/never married 44(5.71%) 46(1.39%)
Total 770(100%) 3,287(100%)
Age
Below 20 395(10.23%) 608(11.74%)
20-30 1,066(27.63%) 1,630(31.49%)
30-40 873(22.62%) 1,184(22.87%)
40+ 1,524(39.5%) 1,753(33.87%)
Total 3,858(100%) 5,175(100%)
Main source of income
Informal sector salaried 69(1.93%) 61(1.57%)
Farmer & fishers 2,033(56.96%) 2,102(54.44%)
Trader 59(1.65%) 127(3.28%)
Service provider 269(7.53%) 414(10.72%)
21

Determinants of Pension Uptake in the Informal Sector of Tanzania
Shadrack Elia Kibona
Piece work/casual labor 172(4.81%) 209(5.41%)
Welfare 950(26.61%) 931(24.11%)
Other 17(0.46%) 17(0.43%)
The general relationship between pension uptake and associated factors
shows that age, PPI, highest education attained, gender, and location of
the cluster are statistically influencing pension uptake in the informal
sector. These variables are statistically significant at 5% level of
significance as presented in Table 2.
Table 2: Determinants of pension uptake in the informal sector,
general relationship
Pension dummy Coef. Std. Err. z P>z
Main income generating activity -0.126 0.072 -1.750 0.081
Age 0.323 0.132 2.440 0.015
PPI Category 1.247 0.170 7.350 0.000
Highest Education 0.242 0.092 2.630 0.009
Gender -0.894 0.270 -3.310 0.001
Cluster 1.130 0.294 3.840 0.000
Constant -8.420 0.845 -9.960 0.000
Binary multiple logistic regression model was fitted to determine the
factors for pension uptake in the informal sector. Table 3 presents the
odds ratio from the multiple binary logistic regression model with their P-
values. The odds of farmers and fishers, traders, service providers, piece
worker/casual labour, welfare and dependents are 77.5%, 85.5%, 85.5%,
78.5%, 83.1%, and 88.95% lower than informal individuals who are
salaried to uptake pension respectively. Individuals aged 40 and above
Total 3,569(100%) 3,861(100%)
Highest Education
No formal education 485(12.57%) 1,108(21.41%)
Primary 2,018(52.3%) 2,541(49.1%)
Secondary 386(10%) 398(7.69%)
University or other higher 69(1.78%) 52(1%)
Other 900(23.32%) 1,076(20.79%)
Total 3,858(100%) 5,175(100%)
22
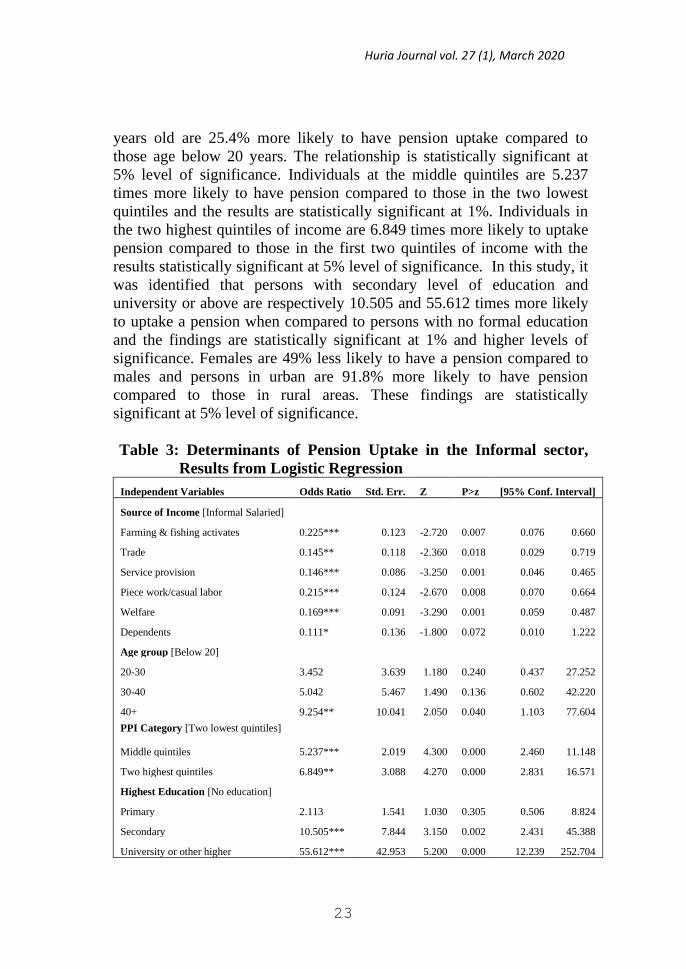
Huria Journal vol. 27 (1), March 2020
years old are 25.4% more likely to have pension uptake compared to
those age below 20 years. The relationship is statistically significant at
5% level of significance. Individuals at the middle quintiles are 5.237
times more likely to have pension compared to those in the two lowest
quintiles and the results are statistically significant at 1%. Individuals in
the two highest quintiles of income are 6.849 times more likely to uptake
pension compared to those in the first two quintiles of income with the
results statistically significant at 5% level of significance. In this study, it
was identified that persons with secondary level of education and
university or above are respectively 10.505 and 55.612 times more likely
to uptake a pension when compared to persons with no formal education
and the findings are statistically significant at 1% and higher levels of
significance. Females are 49% less likely to have a pension compared to
males and persons in urban are 91.8% more likely to have pension
compared to those in rural areas. These findings are statistically
significant at 5% level of significance.
Table 3: Determinants of Pension Uptake in the Informal sector,
Results from Logistic Regression
Independent Variables Odds Ratio Std. Err. Z P>z [95% Conf. Interval]
Source of Income [Informal Salaried]
Farming & fishing activates 0.225*** 0.123 -2.720 0.007 0.076 0.660
Trade 0.145** 0.118 -2.360 0.018 0.029 0.719
Service provision 0.146*** 0.086 -3.250 0.001 0.046 0.465
Piece work/casual labor 0.215*** 0.124 -2.670 0.008 0.070 0.664
Welfare 0.169*** 0.091 -3.290 0.001 0.059 0.487
Dependents 0.111* 0.136 -1.800 0.072 0.010 1.222
Age group [Below 20]
20-30 3.452 3.639 1.180 0.240 0.437 27.252
30-40 5.042 5.467 1.490 0.136 0.602 42.220
40+ 9.254** 10.041 2.050 0.040 1.103 77.604
PPI Category [Two lowest quintiles]
Middle quintiles 5.237*** 2.019 4.300 0.000 2.460 11.148
Two highest quintiles 6.849** 3.088 4.270 0.000 2.831 16.571
Highest Education [No education]
Primary 2.113 1.541 1.030 0.305 0.506 8.824
Secondary 10.505*** 7.844 3.150 0.002 2.431 45.388
University or other higher 55.612*** 42.953 5.200 0.000 12.239 252.704
23

Determinants of Pension Uptake in the Informal Sector of Tanzania
Shadrack Elia Kibona
Other 1.310 1.110 0.320 0.750 0.249 6.895
Gender [Male]
Female 0.510** 0.147 -2.340 0.020 0.290 0.898
Cluster [Rural]
Urban 1.918** 0.586 2.130 0.033 1.054 3.491
Constant 0.001 0.001 -5.260 0.000 0.000 0.012
Note: ***, **, and * means statistically significant at 1%, 5%, and 10%
respectively and categories in brackets are the reference categories for
each categorical independent variable.
DISCUSSION
Individuals working in farming and fishing activities are less likely to
have pension uptake compared to informal salaried individuals. People
and or households depending on farming and fishing as their main sources
of income are concentrated in rural areas and information about pension
services are not well distributed compared to those in urban where there is
a possibility of receiving some salary in the same production chain (Lotto,
2018; FAO, 2003). People employed in farming and fishing industry stay
for so long period of time in their field and travel to urbanized areas for
very short period of time that leads to a small chance of being accessed by
pension institutions for information. Pension services have a close
similarity with financial services such that they are largely concentrated in
urban areas leaving rural areas with limited information and access to
these services (Lotto, 2018). According to Adzawla et al. (2015) in their
study on factors influencing pension uptake in the Tamale metropolis of
Ghana pointed out that traders use to contribute a large amount to pension
funds on monthly basis. Casual workers get only income for daily
consumption and serve little or nothing which limit them to get involved
in pension uptake. The increasing casualization of labours is one of the
structural problems (Pellissery and Walker, 2007). Persons in middle and
the two highest quintiles of income are more likely to uptake pension
compared to those in the two lowest quintiles since at least they have
something to save from their income. In the informal economy,
individuals have low and unstable income to pay for social security and
this influence exclusion from benefiting from social security (Holmes and
Scott, 2016; ILO, 2013). Most of them can afford their basic needs, are
found in urban areas where financial institutions are spread and get
24

Huria Journal vol. 27 (1), March 2020
involved to the pension as their saving for the future. A study by Kwena
and Turner (2013) identified that poor people are not financially included
though they have the same needs as others in the higher levels of income.
It was also concluded by Agravat and Kaplelach (2017) that higher
income is positively related to pension uptake in their study.
Individuals with secondary and at least university level of education are
more likely to have a pension compared to those with no education. This
is due to the fact that those with such levels of education are financially
included, have knowledge of pension, and found in urban areas. Similar
studies conducted by Agravat and Kaplelach (2017) and Muller (2001)
revealed that respondents with higher education are likely to join the
micro-pension scheme in Kenya which has a similar background of
economic development to Tanzania. Males are more likely to have
pension than females since in the country males are dominating decision
at the household level and are more empowered than females and it is that
reason women empowerment have been emphasized for a long period of
time. A similar study conducted by researchers Agravat and Kaplelach
(2017) found that demographic factors influence pension uptake among
informal employees of Kenya Ports Authority. Financial inclusion in
urban areas is at high level compared to rural (Lopez and Winkler, 2018)
which contributes to the likelihood of urban dwellers to have the high
odds of pension uptake relative to rural settings.
CONCLUSION
In this study, farmers and fishers, traders, service providers, piece
worker/casual labour, welfare, dependents, and females are less likely to
uptake a pension. Persons aged forty years and above, persons in the
middle and two highest quintiles of income, individuals with secondary
and at least university level of education, and those in urban residences
are more likely to uptake pension. The government, private sector and
international organizations that are stakeholders to pension coverage
should cooperate so that large population of the country and the world at
large is covered by pension.
Acknowledgements
The author acknowledges the FinScope Tanzania for conducting a survey
which made the data available for legitimately non-profit use. The
findings in this manuscript are based on data collected by FinScope
25

Determinants of Pension Uptake in the Informal Sector of Tanzania
Shadrack Elia Kibona
Tanzania 2017. The findings, interpretations, and conclusions expressed
in this manuscript are entirely those of the author and do not necessarily
represent the views of FinScope Tanzania 2017.
REFERENCES
Ackson, T. and Masabo, J. (2013). Social protection for the informal
sector in Tanzania. Retrieved from http://www.saspen.org/
conferences/informal2013/Paper_Ackson-Masabo_FES-SASPEN-
16SEP2013-INT-CONF-SP4IE.pdf on 8th June, 2020.
Adzawla, W., Baanni, S. A. and Wontumi, R. F. (2015). Factors
influencing informal sector workers’ contribution to pension
scheme in the tamale metropolis of Ghana. Journal of Asian
Business Strategy, 5(2), 37.
Agravat, D. R. and Kaplelach, M. S. (2017). Effect of demographic
characteristics on micro-pension uptake among informal
employees of Kenya Ports Authority. Journal of Business and
Strategic Management, 2(2), 95–117.
Ahmed, S. M. and Wang, B. (2018). A Review on Retirement Practices
Towards Public Employees in Zanzibar in Tanzania. American
Scientific Research Journal for Engineering, Technology, and
Sciences (ASRJETS), 42(1), 231-241.
Ando, A. and Modigliani, F. (1963). The" life cycle" hypothesis of
saving: Aggregate implications and tests. The American Economic
Review, 53(1), 55–84.
Damerau, V. (2015). Enabling informal workers to access Social Security.
Deutsche Gesellschaft Für Internationale Zusammenarbeit (GIZ)
GmbH. Retrieved from https://www.giz.de/ expertise/ downloads/
giz2015-en-Enabling-informal-workers-to-access-social-
security.pdf
FinScope Tanzania. (2013). FinScope Bronchure Summary. Retrieved at
https://www.fsdt.or.tz/wp-content/uploads/2016/05/FinScope-
Brochure-2013-Summary-2.pdf
FinScope Tanzania. (2017). FinScope Tanzania 2017-Insurance &
Pension. Retrieved from http://www.fsdt.or.tz/finscope/
Food and Agriculture Organization of the United Nations [FAO] (2003).
Microfinance in fisheries and aquaculture Guidelines and case
studies, FAO Fisheries Technical Paper 440
26

Huria Journal vol. 27 (1), March 2020
Heenkenda, S. (2016). The Determinants of Dropouts from Voluntary
Pension Scheme: Evidence from Sri Lanka. Germany University
Library of Munich.
Holmes, R., & Scott, L. (2016). Extending social insurance to informal
workers. ODI Working Paper April 2016, London 49.
Hu, Y.-W. and Stewart, F. (2009). Pension Coverage and informal sector
workers: International experiences. Paris, OECD Publishing.
(Working Papers on Insurance and Private Pensions).
Idris, I. (2018). Mapping women’s economic exclusion in Tanzania.
GSDRC: University of Birmingham.
ILO (1993). Resolution concerning statistics of employment in the
informal sector, adopted by the 15th International Conference of
Labour Statisticians (15th ICLS resolution on informality).
Retrieved on Sunday 14th June 2020 at:
https://ww.ilo.org/global/statistics‐and‐atabases/standards‐and‐gui
delines/resolutions‐adopted‐by‐international‐conferences‐of‐
labour‐statisticians/WCMS_087484/lang‐‐en/index.htm
ILO (2018). Decent Work for Sustainable Development in Tanzania,
Retrieved at: https://www.ilo.org/wcmsp5/groups/public/---africa/
---ro-abidjan/---ilo-dar_es_salaam/
documents/publication/wcms_617295.pdf
ILO (2020). Report on informal sector. Retrieved from
https://www.ilo.org/global/about-the-ilo/newsroom/ news/WCMS
_627189/lang--en/index.htm
ILO. (2008). Tanzania Mainland: Social Protection Expenditure and
Performance Review and Social Budget. International Labour
Office, Social Security Department – Geneva: ILO. Retrieved
from http://www.social-protection.org/gimi/ RessourceDownload.
action?ressource.ressourceId=7452
Ingrid, N. and Russell, S. (2008). Migration and social protection in
China (Vol. 14). World Scientific.
ILO. (2013). The informal economy and decent work: A policy resource
guide supporting transitions to formality. International Labour
Organization Geneva.
Joust, M. and Rattenhuber, P. (2018). A role for universal pension?
Simulating universal pensions in Ecuador, Ghana, Tanzania, and
South Africa (No. 2018/23). WIDER Working Paper.
Kwena, R. M. and Turner, J. A. (2013). Extending pension and savings
scheme coverage to the informal sector: Kenya’s Mbao Pension
Plan. International Social Security Review, 66(2), 79–99.
27
Determinants of Pension Uptake in the Informal Sector of Tanzania
Shadrack Elia Kibona
Lopez, T. and Winkler, A. (2018). The challenge of rural financial
inclusion–evidence from microfinance. Applied conomics, 50(14),
1555-1577.
Lotto, J. (2018). Examination of the Status of Financial Inclusion and its
Determinants in Tanzania. Sustainability, 10(8), 2873.
Modigliani, F. and Muralidhar, A. (2004). Rethinking pension reform.
Cambridge University Press.
Muller, L. A. (2001). Does retirement education teach people to save
pension distributions? Soc. Sec. Bull., 64, 48.
NBS. (2015). Integrated Labour Force Survey Analytical Report, Dar es
Salaam, Tanzania. Retrieved from https://www.nbs.go.tz/
nbstz/index.php/english/statistics-by-subject/labour-statistics/614-
the-2014-integrated-labour-force-survey-ilfs
Pellissery, S. and Walker, R. (2007). Social security options for informal
sector workers in emergent economies and the Asia and Pacific
region. Social Policy & Administration, 41(4), 401–409.
Songstad, N. G., Moland, K. M., Massay, D. A. and Blystad, A. (2012).
Why do health workers in rural Tanzania prefer public sector
employment? BMC Health Services Research, 12(1), 92.
SSRA. (2019). Social Security Regulatory Authority Website. United
Republic of Tanzania. Retrieved from http://www.ssra.go.tz
/sw/kuhusu/wigo/mifuko-ya-pensheni
United Republic of Tanzania [URT]. (2018). The Public Service Social
Security Fund Act, 2018. Retrieved from http://www.
utumishi.go.tz/utumishiweb/index.php?option=com_phocadownlo
ad&view=file&id=507: public-service-social-security-fund-act-
no-2-of-2018&Itemid=180&start=10&lang=en
World Bank (2020). World Bank Data. Retrieved on 7th June, 2020 from
https://data.worldbank.org/indicator/SL.AGR.EMPL.ZS?locations
=TZ
28

Huria Journal vol. 27 (1), March 2020
Reasons for Patronage of Traditional Bone Setting as an
Alternative to Orthodox Fracture Treatment
A case of Muleba District, Kagera Tanzania
Straton Kakoko Ruhinda The Open University of Tanzania
ABSTRACT
The study examined the factors for the preference of Traditional Bone
Setting (TBS) in the treatment of fractures among Tanzanians. It sought to
unfold other reasons for consulting TBS practitioners besides poverty,
ignorance and inaccessibility to modern orthopedic services which are
commonly associated with the pull factors. From the available literature,
though very popular, TBS is associated with complications like malunion,
non-union of the fractured bones, and limb gangrene. In order to find out
why there is a paradox, the investigation was mainly done in Muleba, a
district of Kagera Region where the treatment is most common according
to the Institute of Traditional and Alternative Medicine, at Muhimbili
University of Health and Allied Sciences. The study revealed that the
therapy management groups were often more vocal than their fractured
individuals in deciding the model of treatment. And, the fractured people
who are financially able, formally educated and geographically closer to
orthopedic services are among the adherents of TBS. Besides, the
respondents unanimously expressed their dislike of orthopedic
amputation, Plaster of Paris (POP), internal and external fixation let
alone the length of time spent in hospital for treatment. All these have
significant implications including continued use of TBS by rural and
urban people for themselves and livestock. Combining X-ray reading and
alternative medicine makes TBS sustainable. Thus, in future, it is
suggested TBS services be integrated to orthodox treatment so as to
control its negative aspects while harnessing its positive aspects.
Key Words: Fracture(s), Traditional Bone Setting, traditional bone
setters, orthopedic, orthodox treatment
29

Reasons for Patronage of Traditional Bone Setting as an Alternative to Orthodox
Fracture Treatment A case of Muleba District, Kagera Tanzania
Straton Kakoko Ruhinda
INTRODUCTION
Traditional bone setting which is a traditional mode of treating fractures is
gaining a number of adherents despite the development of scientific
orthodox treatment and the complications which are normally
accompanied by its use. Wedam and Amoah (2017), assert that traditional
bone setting is a branch of traditional medicine which is deep-rooted in
many countries across the world though with slight differences in style,
name and practice from one region to another. In Tanzania, the practice is
common in different regions and it is known by different names. For
example, it is called kayunga magufa in Muleba, Omubhunga Magufa in
Karagwe and bhalungi maguwha among the Sukuma.
Literature from different scholars such as Manjunatha (2016); Dada,
Yinusa and Giwa (2011) and Sina et al. (2014), associate the adherence
of traditional bone setting with high cost of orthodox treatment,
ignorance of the adherents and inaccessibility of the orthodox treatment
especially in rural areas. Based on Nigerian experience, Owumi et al.
(2013) assert that traditional bone setting as an alternative health service
is a recognized and specialized form of healing which is available and
accessible to all people in rural and urban areas. It is admitted by scholars
that traditional bone setting as a component of traditional medicine
existed long before the advent of modern or orthodox treatment (ibid.).
The same scholars show in the literature that orthodox practitioners are
against the promotion of traditional bone setting (because of being
unreliable and unscientific). Despite the impediments, the treatment still
thrives to the extent of having fracture patients who leave orthodox
treatment for traditional bone setting. The paper attempted to establish the
reasons for adherence to traditional bone setting other than cost,
ignorance and inaccessibility of orthodox treatment which are mostly
proclaimed as a source of such a patronage. The said reasons are not
refuted altogether. However, the said reasons seem not to accommodate
all adherents of traditional bone setting who come from different
backgrounds such as the affluent who can cover their treatment costs and
the educated who are fond of traditional bone setting despite being aware
of the complications which might arise out of its uses. The study also
aimed at finding out why in some cases the majority of the contemporary
fracture victims start by using orthodox treatment before they resort to
ending their treatment with traditional bone setting if accessibility and
30
Huria Journal vol. 27 (1), March 2020
inaccessibility of orthodox treatment is the major cause of the patronage
of traditional bone setting.
As earlier stated, the major reasons for the patronage of traditional bone
setting are mostly associated with diversion from high costs of orthodox
treatment, ignorance of patients and inaccessibility of orthodox health
services especially in rural areas. Dada et al. (2009) identified two major
reasons for the patronage of traditional bone setting namely cheaper and
its accessibility to many people. Khan et al. (2015), in their study about
the practice and preference of traditional bone setting, in addition to cost
and accessibility, found out another reason as being cultural beliefs. The
mentioned reasons for the patronage of traditional bone setting seem not
to cut across all fracture patients who in fact, come from different
backgrounds. The given reasons consider the fracture victims necessarily
as being economically disabled, rural dwellers and uneducated. The
facts/reasons for the patronage of traditional bone setting which came out
of this study, in a way contradict the traditional reasons for the same
(cost, ignorance and inaccessibility of orthodox treatment) in a sense that
there are fracture victims who are financially capable of covering their
treatment costs; in fact some of them are beneficiaries of health insurance.
It is also vividly evident that some of the adherents of traditional bone
setting begin fracture treatment with orthodox treatment before going to
traditional bone setting. Hence, a question arises as to whether
inaccessibility to orthodox health services counts. As regards ignorance
of patients who visit traditional bone setting, Manjunatha (2016) observes
that education has nothing to do with people patronizing traditional bone
setting since the patients who attend traditional bone setting have
different educational statuses.
Patients from all education levels use traditional bone setting at different
times and places. Scholars such as Oluwadia (2015) asserts that the
patronage of traditional bone setting cuts across social status, educational
qualifications and religious beliefs. On the same opinion, Sina et al.
(2015) asserts that, “in spite of the complications, TBS continues to
have patronage from both the highly educated and the illiterate mainly
because of culture, beliefs as well as overcrowding of hospitals with
traumatic cases.” The popularly mentioned reasons for the preference or
use of traditional bone setting are not refuted altogether, they are good
and sound but not for all the fracture patients. These reasons, therefore,
enhance the need for studies that will accommodate patients from all
backgrounds. Basing on the literature consulted and the researcher’s
31

Reasons for Patronage of Traditional Bone Setting as an Alternative to Orthodox
Fracture Treatment A case of Muleba District, Kagera Tanzania
Straton Kakoko Ruhinda
experience and interest, this current study about the patronage of
traditional bone setting sought to identify the reasons other than those
normally proclaimed and set as the benchmark for future studies about the
therapy.
METHODOLOGY
The study involved a total of 103 respondents who were receiving TBS
services at the time this study was conducted, or had at one time received
fracture treatment at Kazirantemwe traditional bone setting clinic in
Muleba, Kagera Tanzania. Since the study was qualitative, respondents
were subjected to an in-depth interview in order to extract first-hand
information from them. Other few respondents were identified through
the information available at the centre (the patients’ register) especially
their phone numbers which facilitated their encounter with the researcher.
The researcher also interviewed five (four males and one female) different
traditional bone setters from different areas of Muleba, a district which
was purposely selected following the report from Institute of Traditional
and Alternative Medicine, at Muhimbili University of Health and Allied
Sciences which showed that TBS as a new area of research in Tanzania
despite the fact TBS is applicable throughout the country and that Lake
Victoria region is known to have a number of prominent registered
traditional bone setters, one among them resides at Kazirantemwa,
Muleba and attracts many fracture victims from all over the country the
factor which influenced the sampling of Kazirantemwa Traditional bone
Setting Centre. Convenience sampling was utilized to capture the fracture
patients as well as their relatives who were visiting TBS services at the
time of collecting data for this study. The study employed interview guide
in order to elicit participants’ opinions and perceptions about the reasons
for patronizing traditional bone setting. Interview responses were tape
recorded and transcribed. Later, qualitative analysis was subjected to
respondents’ explanatory responses which were later summarized and
categorized according to their themes. Representative reliability was
enhanced by using the same tool across the study to different groups.
Data was analyzed by applying cross-sectional indexing and non-cross-
sectional indexing. On one hand, cross-sectional indexing obliged the
author to read the entire text (transcribed data) and create labels or codes
to the related data. Non cross-sectional indexing on the other hand was
32

Huria Journal vol. 27 (1), March 2020
employed to tape or identify scenarios or situations in the respondents’
understanding which could later add new input to the study. Data analysis
was accomplished at the end by matching or aligning the emerging factors
from the respondents’ understanding of health seeking behavior and
objectives of the study.
FINDINGS
The findings of this study were organized into sub- themes according
respondents’ preference and reasons for their choice of traditional bone
setting as their fracture treatment and in line with the specific objective of
the study which needed to examine other factors for the patronage of TBS
other than the commonly mentioned reasons which are matters
concerning cost, ignorance and inaccessibility of orthodox health
services. The major thing in this study was to examine the influence of
cost, ignorance and inaccessibility of orthodox health treatment in
influencing preference of traditional bone setting.
Table 1: Social demographic characteristics of the study participants
Variable Label Frequency %
Gender
Male 87 84
Female 16 16
Total 103 100
Occupation
Civil Servants 25 42
Peasants 20 19
Petty traders and Boda Boda
(motorcyclists)
56 54
Dependants 02 02
Total 103 100
Health
Insurance
Insured 73 70
Not insured 30 30
Education
Level
Primary school level (standard
seven)
18 17
Secondary level and certificate
level professional skills
74 71
Diploma and graduate level 08 08
Above graduate level 03 03
Total 103 100
33
Reasons for Patronage of Traditional Bone Setting as an Alternative to Orthodox
Fracture Treatment A case of Muleba District, Kagera Tanzania
Straton Kakoko Ruhinda
According to the findings, out of one hundred and three respondents, only
two asserted to have opted for traditional bone setting because of having
insufficient funds and thus unable to attend the orthodox treatment.
Despite being forced into traditional bone setting by lack of sufficient
funds they did not regret or feel disadvantaged for being treated in a
traditional way because they believed in the effectiveness of the
treatment. Financial problem as a as a reason for the patronage of
traditional bone setting cannot be neglected even though only two out of
one hundred and three participants worried about it. The fact that
ignorance (in the sense of patients having low education level) as one of
the motives for the preference of traditional bone setting was also
examined and it was found out that all the respondents had a certain level
of education in the sense that some were primary school leavers, while
others had secondary school education. The findings show that 74% of
the respondents (71 out of 103) had secondary level education and their
number made a big portion of the sample which participated in the study
by reason of having attended the traditional bone setting. Regarding
inaccessibility of orthodox health services as a reason that drove many
victims of fracture to attend traditional bone setting instead of orthopedic
treatment, the study found out that it ought not to be neglected despite the
fact that it was rarely mentioned being one of the factors. As a matter of
fact, no single respondent admitted not to have attended orthodox
treatment because of its inaccessibility.
In fact, almost all respondents at one time or another attended hospital
treatment. Actually, they started with hospital treatment before seeking
alternative treatment. Quantitatively, only two patients out of a hundred
and three (103) did not go to hospital. According to them (those two), cost
and distance from hospital was not a reason that influenced their choices
but rather a belief in the efficacy of traditional bone setting. The above
findings indicate that high cost in using orthodox treatment, inaccessible
orthodox health services and ignorance among the patients are some of
the factors which influence fracture patients to opt for treatment by
traditional bone setting. They were, however not mentioned by the
patients as their pulling factors towards TBS. They were found to be
minor. The study examined other reasons for the preference of traditional
bone setting and organized them into five groups.
34
Huria Journal vol. 27 (1), March 2020
Persistence of illness
More than half of all the respondents (sixty-nine) left the orthodox
treatment due to what they considered as persistence of illness. Their
fracture took too long to heal when receiving the orthodox treatment.
Some stayed in bed for months or years receiving orthodox treatment
which made them start looking for an alternative treatment that could
hasten their healing. One patient who had resorted to traditional bone
setting after having been on orthodox treatment for a long time had this to
say,
“The need to opt or choose traditional bone setting
for fracture treatment is mainly caused by
persistence of illness and lack of symptomatic relief
after using modern medicine for a long time”
This reaction expresses something similar to what was said by another
fracture victim explaining why he had to leave the orthodox treatment in
favour of traditional bone setting, he said,
“I did not abscond from hospital, but I was
discharged after being admitted for three months, my
leg wrapped in a plaster of Paris (POP). I left the
hospital still in pains in my leg and the doctors had
not told me to return for a check-up after another
month. I could not bear the pains, I had to look for
an alternative treatment because hospital treatment
had taken too long without significant relief.”
Other reasons, more or less similar to those given above, were given by
several other respondents who participated in the study. All those
respondents who had previously reported to hospital did not assert the
preference of traditional bone setting to have been caused by
inaccessibility of orthodox health facilities. More than half of all
respondents (73 out of 103) had health insurance; the other 30% of the
respondents (103) had no health insurance but asserted that the cost of
hospital treatment was not a problem or the cause for their shift from
orthodox treatment to the traditional one.
35
Reasons for Patronage of Traditional Bone Setting as an Alternative to Orthodox
Fracture Treatment A case of Muleba District, Kagera Tanzania
Straton Kakoko Ruhinda
Past Fracture Experience
Another paramount reason for the preference of patronage or use of
traditional bone setting to the orthodox treatment is the past fracture
history of a patient himself/herself or a relative. One remarkable example
of such a patient who became interested in traditional bone setting as a
result of past experience of other fracture treatments is a patient aged 59
who was involved in a boda boda accident and had a leg broken. He
attended hospital treatment for two weeks and left the hospital for
traditional bone setting. When explaining the reason for his decision, he
said:
“Back in my twenties, my uncle was involved in an
accident in which his legs were terribly broken. His
fractures were severe than mine and we thought he
would never walk. He was brought here at this same
centre. I used to bring him food for a couple of
months until he fully recovered. When I got this
fracture, my first thought was to come here (at the
traditional bone setter), but my relatives took me for
hospital treatment where I stayed for two weeks. I
insisted on being traditionally treated. I am now
doing fine than I was doing at the hospital”.
During the time of interview, the patient referred to above, had stayed
three months at the traditional bone setting centre. His hopes of getting
healed were very high and he commented:
“I came here from hospital in a very serious
condition, both legs had fractured. Even sitting was
a problem but now I can stand on my own; only that
I cannot walk yet. Nevertheless, I believe soon I will
be walking as my uncle did.”
Other participants had more or less the same experience. They said they
opted for traditional bone setting not because they didn’t trust modern
medicine but because of their past experience with the traditional bone
setting through other fracture victims who were treated in the same
manner or their own past experience of being healed by the traditional
36

Huria Journal vol. 27 (1), March 2020
bone setter. More than a third (36/103) of all the participants had the same
reason for choosing traditional bone setting. One fracture patient had the
same experience. He had a relative who was healed by the traditional
bone setter; he had gone through the same process by reporting to the
hospital but later abandoned the modern treatment for traditional bone
setting. After he had spent about ninety days at the traditional bone setting
centre, his leg bone had already had union when it was found out that the
bone had a malunion and had to be broken again so as to allow proper
bone alignment. Unfortunately, the method of breaking the already united
bone was very manual and crude. The patient could not tolerate such pain
and he opted to have an about turn to hospital. He narrated his experience
saying,
“I was treated by the bone setter for three months
and frankly speaking, I had a relief although the leg
had a mal-union. He told me to break the leg again
so that it may have a proper union. The problem is
that they (traditional bone setters) do not use
anaesthesia. I felt I would not bare the pain, so I
went back to hospital where the leg was broken
again, and was treated for another five months until
I got healed as you see me now”
He admitted being very fond of traditional bone setting and wished he
could have used the treatment to an end, but he was discouraged by the
barbaric way of breaking the already united pieces of bone in a leg. He
still insists to have a belief in the efficacy of traditional bone setting and
that always fracture patients tend to make their choice of fracture
treatment in favour of traditional bone setting.
Fear of Internal and External Fixation
It was found out in this study that fear of internal or external fixation was
a motive behind the choice of some of the fracture patients (participants)
to opt for traditional bone setting as a method of treatment for their
fractures. Twelve respondents left the orthodox fracture treatment because
of the fear of having iron bars internally or externally inserted to support
the union of a broken bone. According to the information gathered from
the orthopedic surgeon, there are several ways of treating a broken bone,
and one of the common ways is medically known as Open Reduction with
External Fixation.
37
Reasons for Patronage of Traditional Bone Setting as an Alternative to Orthodox
Fracture Treatment A case of Muleba District, Kagera Tanzania
Straton Kakoko Ruhinda
This is a procedure which involves placing an extended device on to the
injured bone after surgery whereby a surgeon places metal pins or screws
above the fracture site to support and immobilize the bones while it heals.
The bars used for external fixation are locally termed and “antena” in
Swahili trying to relate them with the television antenna. Patients have a
belief that iron bars fixed in their bodies would in future be harmful. They
believe that they might cause cancer and referred to their relatives thought
to have been acquired cancer due to having the iron bars inserted in their
bodies. External fixation is also disliked because it makes a patient
uncomfortable for a long time. Some of the patients claimed that they
delay the healing process.
Categorization of Illnesses according to their Treatment
It was interestingly found that some patients have ‘readymade’ choices to
some of health problems. There are health problems which are said to be
healed by traditional medicine and others which can be managed by
orthodox medicine. As far as fractures are concerned, some patients said
that some of the accidents are not caused by normal accidents but are sent
or created by people with bad eyes. In that matter, they believed not all
fractures are treated in hospital, some need traditional expertise. Despite
the fact that the researcher did not find any of the respondents who
claimed his or her accident to be caused by people with bad eyes yet some
of them still recommended some of the health problems to be treated
traditionally, fractures included.
What they think about such health problems resembles what Mbiti (1969)
asserts that in some cases patients employ a particular method of
treatment depending on their belief about the course of an illness. The
same is also observed by Owumi et al. (2013) who assert that there is a
belief that some diseases and accidents have spiritual components that
need to be tackled along with traditional treatment. For example, it was a
common phenomenon among the participants of this study to say that
they left the hospital after the wound accompanying the fracture had been
healed. This is because some patients have a belief that traditional bone
setters do much better with fractures than they do with wounds which are
well managed by modern treatment. It was also found out by the study
that some patients left the orthodox treatment for traditional bone setting
believing that the services given by both are equal only that orthodox
treatment is too demanding in terms of time and the relationship between
38

Huria Journal vol. 27 (1), March 2020
the patient and physician is not balanced. Despite the cost incurred, a
patient is considered a subordinate. Patients and their relatives were not
happy with hospital routines and timetables such as time for visitation,
fixed time for taking medicine, time to rest and the like. Traditional bone
setting is relatively flexible hence attractive to facture victims.
Belief that Traditional Bone Setting Heals Quickly
A number of patients who participated in the study said they had left the
orthodox treatment because it heals very slowly as compared to
traditional bone setting. The same belief is also held by the traditional
bone setters themselves who claim to have a treatment mechanism which
fastens the healing process of the bone which is called a “bone union”.
One of the traditional bone setters commented;
“Patients come because we make them heal quickly;
our treatment is not trial and error because we only
deal with the problem which is manageable with our
capacity”.
Some fracture patients also agree with the traditional bone setters that
traditional bone setting works very quickly on the fractured bone. For
instance, a patient who had left the hospital after two weeks of fracture
treatment said,
“I did not leave the hospital without permission, but
I was discharged after I was dressed with the POP
and I was not told when I should go back to hospital.
I saw it as a delay; that is why I decided to go for a
popular traditional bone setter in the village. I went
to him because of his history in treating many people
with severe injury than mine. I witnessed that many
people were healed quickly than those who stayed at
the hospital for the same treatment.”
Some of the patients complained to have stayed long in hospital
undergoing orthodox treatment but without significant improvement on
their fractures. The same patients reported to have experienced quick
union of the fractured bones when they started visiting the traditional
bone setters. Such people created trust of the public in traditional bone
setting. It is also evidently true that traditional bone setters do not
advertise their services. Their fame spreads through such witnesses of the
fracture patients and their relatives.
39
Reasons for Patronage of Traditional Bone Setting as an Alternative to Orthodox
Fracture Treatment A case of Muleba District, Kagera Tanzania
Straton Kakoko Ruhinda
DISCUSSION
The study findings clearly articulate that not all fracture victims who
choose to be treated by traditional bone setters do so out of ignorance,
inaccessibility to health orthodox services or costs of treatment. The study
also revealed that some fracture victims start treatment in hospital and end
up using traditional treatment. It is also true that some other fracture
victims start with traditional treatment and end up in hospital. From the
findings, statistics show that more males visited TBS than females. This
may be mainly because of the economic activities each group engages in.
For example, to be precise, more than half of all the participants of this
study who were petty traders and motorcyclists and thus more prone to
accidents, were men. That shows why a bigger number of men attended
the traditional bone setting. The study revealed that a good number of
traditional bone setter attendees were not much faced by cost implications
as far as orthodox medicine is concerned, because they were insured.
Seventy percent of the participants had health insurance, either directly or
indirectly (being a beneficially of an insured person). Traditional bone
setter adherents in this study were found to belong to a group of people
who are fairly educated to a level above that of secondary school. Only
17% of the participants were primary school leavers. This implies that
education plays little or no role in the selection of treatment and in this
case, fractures treatment as it was reported by Baffour-awuah,
Acheampong and Francis (2018) that education level plays an
insignificant role in health seeking behaviour. As per researcher’s
findings, the health seeking behavior is greatly influenced by the ‘need to
recover’ which in turn determines the means.
Since the ‘need to recover’ seems to be the drive towards seeking ways of
getting better and efficient treatment, a patient is influenced by several
factors before he/she selects a type of treatment or changes the type of
treatment when one is dissatisfied with the treatment given. This can be
well explained by an incident whereby an affluent and well-educated
person who flew all the way from Muscat where he lives to Muleba, a
study area, to see a traditional bone setter, after having attended treatment
in the best orthopedic departments he had been to for a long time but with
no positive progress. The ‘need to recover’ and to recover very quickly is
supplemented by the ‘Persistence of illness’. Once an illness persists for a
long time, a patient loses patience and begins to think of looking for an
40

Huria Journal vol. 27 (1), March 2020
alternative treatment. Such an idea makes a patient start questioning the
orthodox treatment as being the cause of his ‘healing delays’. This
explains why a good number of respondents who started their treatment in
hospital ultimately left for traditional bone setting. The reason behind
their shift was “Nilikaa muda mrefu hopitali, ila nikaona kama sipati
nafuu, ndio maana nimekuja huku” (I stayed at the hospital for a long
time without relief, that is why I came here). Something in common
among them was lack of patience. The same is expressed by the
orthopedic surgeon who is very upset by the exodus of fracture patients
from hospitals to traditional bone setters when commenting that “they
have no patience; they must know that the process of a bone union (a
proper union) is not done overnight”. A campaign is suggested by the
researcher to the general public about fractures and their treatment so that
people may be aware of the treatment process. ‘Hear say’ and past
experience of people who had had fractures and went to traditional bone
setters play a big role in influencing those who are sometimes desperate
after having been in treatment in hospitals for a long time.
It has also been revealed by the study that most of the times those stories
are always positive. Negative side effects of traditional bone setting such
as complications associated with it are not aired out. The stories are so
sweet that they attract patients to exit from orthodox treatment. It was
found out in the study that only two (2) fracture victims out of one
hundred and three (103) who participated in the study reported at the
hospital before shifting to traditional bone setters. The phenomenon is not
by accident but implies that fracture victims and their relatives consider
the orthodox treatment (as far as fracture is concerned) as an emergence
treatment which is useful for first aid, diagnosis and pain reliever. Having
all that done they find their way to the traditional bone setters. This means
nothing than the fact that the members of the public are aware of the
efficiency of orthodox treatment in diagnosis of the illness. The same
people have a belief that traditional bone setters heal better and quickly
than the orthodox treatment does. It is also a plea of a researcher that a
general public be helped to shift the “belief” from tradition bone setting to
orthodox healing in order to avoid complications which are accompanied
by the traditional treatment. According to Kumma et al. (2013), the
majority believe in the importance of the role of traditional bone setting in
fracture treatment despite the fact that the treatment is associated with a
lot of complications which might be avoided by the orthopedic
treatments. It is evident that people have incorporated their health seeking
behaviour to their culture hence, made it hard to change in some of the
41
Reasons for Patronage of Traditional Bone Setting as an Alternative to Orthodox
Fracture Treatment A case of Muleba District, Kagera Tanzania
Straton Kakoko Ruhinda
perspectives about treatment.
In that line, Varnum et al. (2017), assert that there are possible features
that facilitate or impede cultural change which include things like tight
against loose social norms, whether the society is relatively isolated
versus frequent contacts with other cultures and the like; all may affect
the degree to which culture is stable or malleable. In the case of this
study, it is obvious that the employment of the traditional bone setting is a
component culture and health seeking behaviour and is very stable.
This is expressed by the component of the adherents of the traditional
bone setting as they come from different social backgrounds (the rich and
the poor; the educated and the non-educated; rural and urban dwellers; to
mention but a few). A lot of campaigns are needed to make the change
possible. It was also revealed that not all fracture victims who visit the
traditional bone setters get healed. Some of them go back to hospitals
after facing complications when using the traditional fracture treatment.
The complications include malunion which necessitates the bone to be
broken again so that it may be realigned. The traditional bone setter does
that manually without using anaesthesia. The researcher interviewed a
few victims, two out of one hundred and three to be exact, who faced this
situation and had to return to hospital from which they had earlier
vacated. This implies that traditional bone setting, despite being
patronized by some of the fracture victims, is not safe per se. In addition,
it was found out that traditional bone setters have no prescribed fee to be
paid by the patient. This is because they believe their ancestors handled
them treatment for free and it should be served to others for free.
However, the service is not free per se but a patient is let free to decide
what to offer or what one can manage. Before treatment starts, a patient is
obliged to pay a small fee which locally goes by the name entela bishaka
which can be translated as bush clearing fee. After the treatment has been
completed the patient offers another fee out of what he can afford,
however small. This after treatment fee is called entashurano or parting
fee. This makes the traditional bone setters to earn very little from the
trade which in turn makes it impossible for them to develop in terms of
innovations and technological advancement. In short, the trade is static. A
kind of integration between traditional and orthopedic bone setting needs
to be introduced in order to reduce complications which are associated
with traditional bone setting.
42
Huria Journal vol. 27 (1), March 2020
CONCLUSION AND RECOMMENDATIONS
It has been clearly found that traditional bone setting is patronized by
patients from different backgrounds in terms of education, occupation,
income and residence. However, it is also evident that it is accompanied
by several complications which sometimes face the users of the treatment.
To avoid these complications, it is suggested that a massive campaign
which aims at synthesizing about the causes and treatment of fractures be
launched all over the country. Secondly, it has been observed that the
Council of Traditional and Alternative Health Practitioners of Tanzania
engages itself in matters of registration of traditional bone setters. This
helps to identify them and know where they are but does not go further to
finding out what and how they do their activities. Some trainings should
be conducted with the traditional bone setters and of course other
traditional healers. This will in a way avoid the complications which
traditional bone setter cause to the patients unknowingly. The study gives
credit on the traditional bone setters who participated in this study for
their adherence to their ethical code of conduct especially, non-publicity
for their activities. No poster or any advertisement was found which
aimed at influencing the patients to use their services. Though the study
did not go into the details of efficacy of the traditional bone setting, it is
likely that in some cases, it works. And that is a reason for its patronage
by people from different backgrounds.
REFERENCES
Baffour-awuah, D., Acheampong, K. and Francis, Y. (2018). Health-
Seeking Behaviour of Orthopedic Trauma Patients Attending Saint
Joseph Hospital in Koforidua , Ghana Abstract :, 7(1), 43–50.
https://doi.org/10.9790/1959-0701064350
Dada, A. A., Yinusa, W. and Giwa, S. O. (2011). Review of the practice
of traditional bone setting in Nigeria. African Health Sciences, 11(2),
262–265.
Dada, A., Giwa, S. O., Yinusa, W., Ugbeye, M. and Gbadegesin, S.
(2009). Complications of treatment of musculoskeletal injuries by
bone setters. West African Journal of Medicine, 28(1), 43–47.
Khan, D. I., Saeed, D. M., Inam, D. M. and Arif, D. M. (2015).
Traditional Bone Setters; Preference and Patronage. The
Professional Medical Journal, 20(09), 1181–1185.
43

Reasons for Patronage of Traditional Bone Setting as an Alternative to Orthodox
Fracture Treatment A case of Muleba District, Kagera Tanzania
Straton Kakoko Ruhinda
https://doi.org/10.17957/tpmj/15.2944
Kumma, W. P., Kabalo, B. Y. and Woticha, E. W. (2013). Complications
of Fracture Treatment by Traditional Bone Setters in Wolaita Sodo ,
southern Ethiopia, 3(12).
Manjunatha, V. (2016). Patronising raditional Bone Setting and its
Complications. A study in Bangalore. IOSR-Journal of Dental and
Medical Services (IOSR-JDMS, 15, 125–130.
Mbiti, J. (1969). African Religion and Philosophy. Heinnman,London.
Ndubuisi, O., Omolade, L., Itodo, E., Sunday, P. and Kehinde, O. (2015).
Patronage of traditional bonesetters in Makurdi, north-central
Nigeria. Patient Preference and Adherence, 9, 275–279.
https://doi.org/10.2147/PPA.S76877
Owumi, B. E., Taiwo, P. A. and Olorunnisola, A. S. (2013). Utilization of
traditional bone-setters in the treatment of bone fracture in Ibadan
North Local Government. Intern J Hum Social Sci Invent, 2(5), 47–
57.
Sina, O. J. and M, I. A. (2015). Alternative & Integrative Medicine
Traditional Bone-Setters and Fracture Care in Ekiti State , Nigeria,
4(1), 1–5. https://doi.org/10.4172/2327-5162.1000182
Sina, O. J., Taiwo, O. C. and Ayodele, I. M. (2014). Traditional Bone-
Setters and Fracture Care in Nigeria. Journal of Art, Social Science
and Humanities (ISSN: 2350-2258), 2(6), 74–80.
Varnum, M. E. W. and Grossmann, I. (2017). Cultural Change : The How
and the Why Cultural Change : The How and the Why, (September).
https://doi.org/10.1177/1745691617699971
Wedam, E. A. and Amoah, S. T. (2017). Traditional Bone Setting:
Analysis of Contribution and Patronage in Northern Ghana. Ghana
Journal of Development Studies, 14(2), 23. https:// doi.org/
10.4314/gjds.v14i2.2
44
Huria Journal vol. 27 (1), March 2020
Plastic Packaging Materials as Possible Source of
Hazardous Chemicals to Food and human health: A
Review
Leonard W.T. Fweja
The Open University of Tanzania
ABSTRACT
Plastic packaging has been implicated as a source of food packaging
material (FPM) borne compounds transfer into food. These chemical
migrants from packaging materials to food products are associated with
human health risks. However, opinions on plastic packaging safety differ
greatly and scientific agreement on product safety is still indefinable. The
present review intends to explore and present the state of science about
the safety of plastics, the potential for consumer exposure and discuss the
major issues with respect to associated health risks safety.
Key words: Plastic packaging, chemical migrants, plastic packaging
safety, health risk, consumer exposure
INTRODUCTION
Food packaging has become a modern civilization culture due to the
importance and functional roles of packaging materials; as such nearly all
food stuff available on market are packaged. There are numerous
packaging materials but each of which provides different advantages,
however, of interest in the present write up is plastic packaging materials
(PPM). Plastic packages constitute the largest fraction of food packaging
materials due to their flexibility, portability (light weight), inert nature,
durability, versatility, their potential for diverse applications (Proshad et
al., 2018) and other advantages over other packaging materials. It is
indicated that the number of plastics produced globally in the first decade
of the present century is comparable to the total world production in the
century earlier (Mathur et al., 2014). According to GEF (2018) the
making of plastics increased by more than twenty-fold between 1964 and
2015, with yearly output of 322 million metric tonnes (Mt), and is
projected to double by 2035, and almost quadruple by 2050. By
definition, plastics are polymer chains of molecules (usually made of
45
Plastic Packaging Materials as Possible Source of Hazardous Chemicals to Food
and human health: A Review
Leonard W.T. Fweja
carbon, hydrogen, oxygen, and/or silicon) which are hooked or joined
together. The raw materials for making polymers include petroleum-based
products and other products, which are heated together under pre-
determined conditions (Halden, 2010). Monomers are the building units
of polymers and determinant of their polymeric properties. Different
combinations of monomers produce plastic resins with different
characteristics, such as strength or molding capability (Halden, 2010).
Plastic materials used in packaging are greatly varied in their chemical
structure, offering dissimilar properties based on the processing,
incorporated additives and combination with other polymers (Tatiane et
al., 2018). Several categories of additives, such as antioxidants,
stabilizers, lubricants, anti-static, anti-blocking agents etc., have been
produced to advance the performance of polymeric packaging materials
(Al-Dayel et al., 2012). Additive materials enrich plastics with such
properties like elasticity, flexibility and resistance to breakage and
transparency to light (Al-Dayel et al., 2012). The addition of plasticizers,
antioxidants, fillers, flare retardants, and colorings to plastic polymers
imparts preferred functionalities and generates hundreds of different
assortments of plastic materials of deviating properties (Halden 2010). It
is also indicated that such additives like antioxidants, ultraviolet (UV)
stabilizers or plasticizers (softeners) are compulsory to (i) safeguard
packaging material from UV power-driven or oxidative deterioration, (ii)
increase softness and (iii) enhance the general appearance or quality of
the plastic package. Nonetheless, additives are non-covalently bound to
the polymer and are consequently vulnerable to migration when subjected
to heat or during long-term storage (Mathur et al., 2014). Several
contributions in the literature (Tatiane et al., 2018) illustrate that there is
likelihood of migration of components from the packaging to the product.
Key findings documented by FSANZ (2014) on chemical migration from
packaging into food (CMPF) indicate availability of evidences on the
migration of chemical into food from packaging. They concluded that
unintentional leaching of certain chemicals from packaging could pose a
health risk to community but there is a high degree of doubt about the
exact nature of the problem. It is also reported by Mathur et al. (2014)
that though plastic polymers are not regarded as toxic, there could be
toxic residual remnant chemicals, chemical additives and decomposition
products in the plastic products that can leach out since are not bound to
46

Huria Journal vol. 27 (1), March 2020
the plastic polymer. Halden (2010) associated human health risks with
plastics monomeric building units notably bisphenol A (BPA), their
additives e.g., plasticizers and a blend of the two e.g., antimicrobial
polycarbonate. As such, the present review intended to examine the
potential health risks associated with chemical migration into food from
plastic packaging.
METHODOLOGY
The current work employed a narrative review to provide an insight on
health implications that are associated with PPM under the following
methodological review approach:
(a) Brief description of different types of plastic packaging including
their categorization based on assigned number codes, highlighting the
composition, uses and safety implication.
(b) Discussion on the monomeric building units and/ or additives (e.g.
BPA, phthalates, etc.) with great potential for adverse human health
risks.
(c) Explanation of the ways through which human exposure to chemicals
migrating from plastic packages can occur and factors affecting their
migration.
(d) Description of the underlined potential health risks due to plastic
packaging chemical migrations into foods.
(e) Description of the established main observations from the revisited
literature.
The data collection was achieved through searching a variety of relevant
literatures from different electronic sources of scientific literature
(PubMed, Google Scholar) and “grey” literature (government
publications, trade body and industrial collections). Several keywords
were used during search, either individually or in combinations; under
which the articles were sought and finally selected. Examples of key
words include plastic packaging, plasticisers, additives, chemical
migration, health risks of plastic package and bisphenol A.
47

Plastic Packaging Materials as Possible Source of Hazardous Chemicals to Food
and human health: A Review
Leonard W.T. Fweja
FINDINGS AND DISCUSSION
Types of Plastic Packaging
Plastics can be divided into two major categories namely (i) thermoset or
thermosetting plastic and (ii) thermoplastics.
(i) Thermoset or Thermosetting Plastics
Thermoset are materials which stay in a stable solid state after being
cured once. Polymers inside the material cross-link in the course of curing
process to make an unbreakable, irreversible bond. This implies that
thermosets won’t melt even when exposed to exceedingly high
temperatures (ROMEORIM, undated). Thermoset are valuable due to
their hardness, strength and durability. They are used mostly for aircraft
parts, auto parts, tires and constructions applications (Halden, 2010).
Additional uses include adhesives, inks, and coatings (Halden, 2010).
Examples include silicone, epoxy, phenolic and polyurethane. In addition,
some materials such as polyester can occur in both thermoplastic and
thermoset versions (ROMEORIM, undated).
(ii) Thermoplastics
A thermoplastic is any plastic material which melts into a soft, flexible
form beyond a certain temperature and hardens upon cooling. In contrast
to thermoset, thermoplastics can be re-melted and re-shaped several times
(ROMEORIM, undated). Thermoplastic molecules are held together by
weak bonds, making plastics soften upon heating and return to their
original form at room temperature (Halden, 2010). They can be easily
moulded, shaped and extruded into films, fibers, packaging and products
such as milk jugs, floor coverings, credit cards, and carpet fibers
(Freudenrich, 2007; Halden, 2010). Examples include polypropylene
(PP), polyethylene (PE), and polyvinyl chloride (PVC) (Freudenrich,
2007).
Classification of Plastics based on Number Code
Plastics are categorized in seven main categories based on the
classification system established by the Society of the Plastic Industry
(SPI) namely SPI or number code. The SPI code ranges from 1 – 7 and
48

Huria Journal vol. 27 (1), March 2020
the SPI code on each plastic product is commonly molded into the bottom
(Yadav, undated). However, from personal observation sometimes the
SPI code is placed on the label of the plastic packaging. The description
of each of this category is given below.
Polyethylene Terephthalate (PET) – Type 1
Polyethylene terephthalate is usually abbreviated PET. It is the most
common thermoplastic polymer resin of the polyester clan (Mepex
Consult AS, 2017). An alternative abbreviation PETE originates from
Polyethylene Terephthalate Ethylene (Schuler, 2008). PET is
biodegradable and semi-crystalline. PET is a clear tough plastic with good
gas and moisture barrier properties and in some instances, there is little
need for additional barriers (Mepex Consult AS, 2017). It exhibits some
exceptional characteristics superior to other types such as distinctive
appearance, food grade i.e., non-toxic, chemical resistance, good creep
resistance, impact resistance, unbreakable and recyclability. PET is
frequently used in making disposable containers or bottles for liquids, soft
drinks and foods such as water, various types of juice, butter, salad
dressing, vegetable oil, mouthwash, detergents, cleaner, cosmetics, etc.
(Schuler, 2008; Proshad et al., 2018), jars and tubs, thermoformed trays
and bags and snack wrappers because it is strong, heat resistant and
resistant to gases and acidic foods (Mathur et al., 2014) and it is
manufactured for single use only (Proshad et al., 2018). It can be either
transparent or opaque (Mathur et al., 2014).
High-Density Polyethylene (HDPE) – Type 2
Polyethylene is the most used plastic in the world. HDPE is a harder
plastic with a higher melting point than low density polyethylene (LDPE)
(Freudenrich, 2007), (see Type 4) and it is stiff and strong (Mathur et al.,
2014). It is made from petroleum product, giving rise to a heat-resistant
plastic (Proshad et al., 2018). It has a clear and even surface and has some
good barrier characteristics; nonetheless it is not a good barrier to oxygen.
However, if enriched with polyamide (nylon) – (PA) or other additives,
HDPE becomes a good barrier against gases. It is similarly durable
against shocks and heat (Mepex Consult AS, 2017).
According to Proshad et al. (2018) HDPE does not contain harmful BPA
or phthalates and is presumed to have no identified health risk for food
use. Compared to PET, HDPE made container is regarded safer for food
49

Plastic Packaging Materials as Possible Source of Hazardous Chemicals to Food
and human health: A Review
Leonard W.T. Fweja
and drink (Proshad et al., 2018). HDPE is used in making opaque plastic
milk, juice and water bottles and jugs, bottles for bleach, detergent
(household cleaner containers) and shampoo, some plastic bags (Schuler,
2008), cereal box liners and several other types of bottles and tubs
(Mepex Consult AS, 2017). Furthermore, HDPE is used in making toys,
various types of plastic grocery, rubbish and retail bags (Mathur et al.,
2014; Proshad et al., 2018). Nevertheless, HDPE is heat sensitive as it
melts at a relatively low temperature (Mathur et al., 2014).
Polyvinyl Chloride (PVC or V) – Type 3
PVC is a thermoplastic that is made by polymerization of vinyl chloride
(Freudenrich, 2007). It's however, fragile as such it requires additives and
stabilizers to make it useable (Freudenrich, 2007; Schuler, 2008). Usually,
phthalates or adipates are used as plasticizers to make PVC flexible and
mouldable (Mathur et al., 2014). However, phthalates are harmful to
human upon exposure. Plasticized PVC pipes contain phthalates and
many other toxic chemical substances including BPA, lead, dioxin and
cadmium (Proshad et al., 2018). While plasticizers are added for
softening and creating flexibility, lead is often added for strength. These
toxic additives contribute to pollution and human exposure (Schuler,
2008). PVC are used for making containers for fruit juice and cooking oil
(Proshad et al., 2018), peanut butter containers, cling wrap, and bottles
for plastic squeeze, detergent and window cleaners (Schuler, 2008),
making pipes and plumbing (Freudenrich, 2007), as well as commercial-
grade cling films for over-wrap of trays in supermarkets and filled rolls at
delicatessens (Mathur et al. 2014).
Low Density Polyethylene (LDPE) – Type 4
LDPE is a thermoplastic made from the monomer ethylene. It is the most
common polymer in plastics. In LDPE, the polymer strands are
interlinked and loosely organized, so it is soft and flexible (Freudenrich,
2007). It is a 'heat-resistant' polymer, which can be both clear and opaque
(Proshad et al., 2018). It is used in making grocery store bags, zip-lock
bags, most plastic wraps, bottles (Schuler, 2008), films of various sorts
(including domestic/ household cling film) (Mathur et al., 2014),
disposable gloves, garbage bags (Freudenrich, 2007), freezer bags, juices
50

Huria Journal vol. 27 (1), March 2020
and milk cartons (Proshad et al., 2018), bread bags, flexible lids and
squeezable food bottles (Mathur et al., 2014). It is presumed that LDPE do
not contain any harmful components and are therefore safe for food and
beverages uses (Proshad et al., 2018).
Polypropylene (PP) – Type 5
Polypropylene is a type of plastic polymer, which is prepared from
propylene monomers (Freudenrich, 2007). PP is usually harder, strong,
hydrophobic, more heat resistant, denser and more transparent than
polyethylene (Mathur et al., 2014; Proshad et al., 2018) and has a high
melting point (Mepex Consult AS, 2017). The different forms of
polypropylene have dissimilar melting points and hardness (Freudenrich,
2007). PP has low oxygen barrier quality and is thus frequently used in
packaging that does not need a specific oxygen barrier (Mepex Consult
AS, 2017). It is typically used for packing yogurt, beverage, ketchup,
medicine (Proshad et al., 2018), soup, syrup containers, straws and for
making baby bottles (Schuler, 2008), car trim, battery cases, bottles,
tubes, filaments and bags (Freudenrich, 2017) microwavable packaging
and sauce and salad dressing bottles (Mathur et al., 2014). It is a good
material for storing acids, bases and other solvents (Mepex Consult AS,
2017). Like LDPE, PP containers are considered safe since no harmful
substances are found in food or water and beverages from PP plastic
(Proshad et al., 2018).
Polystyrene (PS) - Type 6
Polystyrene is made of styrene molecules (Freudenrich, 2007). According
to Proshad et al. (2018) styrene is very risky for health. The International
Agency for Research on Cancer (IARC) has acknowledged that styrene is
human carcinogen (Proshad et al. 2018). PS is used in several
applications, though its use is declining. It is used for production of
containers such as pots, clamshells, bottles, lids, food trays and opaque
disposable cutleries. PS is regularly found in compact disc cases, egg
cartons, meat trays, carry-out containers, and disposable plates, bowls and
cups (Mepex Consult AS, 2017; Schuler, 2008). It is also extensively
used in producing packaging and insulating materials (Proshad et al.,
2018). PP can make hard impact-resistant plastics for cabinets (for
computer monitors and TVs), furniture, glasses and utensils. Once
polystyrene is heated and air blown through the mixture, stryfoam is
formed, which is used in making styrofoam based items (Schuler, 2008).
Styrofoam is lightweight, moldable and an excellent insulator
51

Plastic Packaging Materials as Possible Source of Hazardous Chemicals to Food
and human health: A Review
Leonard W.T. Fweja
(Freudenrich, 2007) that has a good stability for heat, though it is not
flame retardant (Mepex Consult AS, 2017).
Polycarbonate (PC) – Type 7
With exception of the types already mentioned, all the remaining plastics
are labelled as Type 7 plastics. Polycarbonate container is made of BPA,
which can leach out into beverage or food stored in them. Owing to the
BPA's health risk reflected in multiple studies, the use of type 7 or
polycarbonate plastic materials has of late declined greatly (Proshad et
al., 2018). Polycarbonate is essentially used for packaging consumer
goods (Proshad et al., 2018). It is clear, durable and heat resistant and
normally used as a replacement for glass in objects like refillable water
bottles, sterilisable baby bottles (Mathur et al., 2014), “sippy” cups, baby
food jars, plastic dinnerware and clear plastic cutlery (Schuler, 2008). PC
is also at times used in epoxy-based lacquers on the inner part of food and
drink cans to inhibit the contents reacting with the metal of the can
(Mathur et al., 2014). The assigned number codes are used internationally
as described in Table 1. The code number provides a guide to consumers
and recyclers to identify and verify each plastic product (Yadav, undated).
Table 1: Different types of plastics and their classification
SPI Code Name and
Abbreviation
Density Properties Usage area
Polyethylene
terephthalate
(PET)
1.34 – 1.39 • Clear &
smooth surface
• Barrier against
air & water
• Durable against
shocks & heat
Widely used for drink
& detergent bottles
bottles, but also as
packaging for other
products including
trays & cups
High Density
Polyethylene
(HDPE)
0.91 – 0.94 • Rigid & tough
materials
• Good
properties in
terms of
solvents
• Stretchable
Widely used for
bottles, also for
chemical products.
Heavily used in
building materials & in
car parts
52

Huria Journal vol. 27 (1), March 2020
Polyvinylchloride
(PVC)
1.16 – 1.30 • Resistant
against fats and
oils
• Very strong
material
Mainly used within
construction for pipes,
flooring, but also for
garden furniture,
shower curtains & toys.
Found in rigid & soft
products
Low Density
Polyethylene
(LDPE)
0.90 – 0.92 • Soft, flexible,
waxy surface,
scratches
easily,
translucent
Garbage bags, squeeze
bottles, black irrigation
tube, silage & much
films, rubbish bins,
shrink wrap, food
packaging
Poly propylene
(PP)
0.90 – 0.92 • Good container
for acids,
alkalis &
solvents
• A strong
material with
high melting
point
Moulded products for
buildings & cars.
Flexible and rigid
packaging products,
straws, lunch boxes,
compost bins
Polystyrene (PS) 1.04 – 1.09 • Good
protection
against liquids
that have a
short life time
• Rigid & foam
shaped
• Poor
transporter of
heat
• Low melting
temperature
Other used for food
packaging and for
drinks e.g., water cups,
safety helmets, brittle
toys
Acrylonitrile
butadiene
styrene, (ABS)
Polyamide (PA)
Polymethyl
methacrylate
Other
plastic181
types and
laminates
1.13 – 1.15
• A range of
different types
of plastics with
varying
properties
Products that are based
on other types of
plastic or a
combination of
plastics, for instance
laminated plastics used
for packaging
Source: (Schuler, 2008; Plastic New Zealand, 2009; Grigore, 2017)
53
Plastic Packaging Materials as Possible Source of Hazardous Chemicals to Food
and human health: A Review
Leonard W.T. Fweja
Safer Choices of Plastics for Food and Beverage
According to Schuler (2008) and Proshad et al. (2018) safer plastics for
food and beverage include PETE (Type 1), HDPE (Type 2), LDPE (Type
4) and PP (Type 5), whereas plastics to be avoided include PVC (Type 3),
PS (Type 6) and PC (Type 7). This implies that the basic knowledge
about plastic classification based on SPI or number code is important to
the consumers from the food safety perspective.
Monomeric with Potential Health Risks
As indicated earlier, plastics play a great role in almost every phase of
food production and preparation. Food is processed on plastic equipment,
and packed and dispatched in plastic containers or plastic-lined boxes and
cans. Similarly, at household level, foods are stored in and leftovers
reheated in plastic containers (Mathur et al., 2014) whose building slabs
are monomers. It is accepted that plastic polymers on their own are non-
toxic since are unreactive and their big size restricts transport through
biological membranes (Mathur et al., 2014). According to Proshad et al.
(2018) human health risks due to plastics can originate from their
monomeric building units (e.g., Bisphenol A), their additives (e.g.,
phthalates) or from a combination of the two (e.g., antimicrobial
polycarbonate). Among the numerous toxic materials generated by
plastics, constituents and additives of principal concern are Bisphenol A
(BPA) and phthalates which is the focus of the present review.
Bisphenol A (BPA)
As presented before, BPA is among the Food Contact Materials (FCMs),
implying that it is used in the preparation of plastics for the production of
materials that have direct interaction with food (Konieczna et al., 2015).
It is a building block of polycarbonate plastics and a common additive of
PVC (Halden, 2010). In the course of polymerization, BPA tends to leave
some unbound monomers, which can be released from packages into food
and drinks over time. When plastics degrade, they can release BPA
through normal use and/ or due to high temperature and exposure to
alkaline or acidic solutions foods and beverage products (Halden, 2010;
Lee et al., 2016). Repeated washing of packages similarly accelerates
leaching (Halden, 2010). Food and drinks stored in such containers
54

Huria Journal vol. 27 (1), March 2020
including the ubiquitous clear water bottles can have a trace amount of
BPA (Proshad et al., 2018). According to Lee et al. (2016) the daily
human intake of BPA is ~ 1 μg/kg/bw.
Phthalates
Phthalates is an assemblage of organic lipophilic chemicals
fundamentally used as plasticizers. Phthalate plasticizers (PAE's) are
defined as benzene-di-carboxylic acid esters with dissimilar degrees of
toxic results particularly endocrine disrupting changes (Saad et al., 2015).
Phthalates are extensively used as plasticizers in PVC products.
Phthalates are non-covalently bonded with PVC; thus, they are free to
migrate and are released into the surroundings by direct release,
evaporation, migration, leakage and abrasion (Lee et al., 2016). As a
result, phthalates are capable of transferring into food, drink, skin, and the
environment. The daily human intake is ~ 0.1-2 μg/kg/bw (Lee et al.,
2016).
Chemicals Migrating from Plastic Packages
People may be exposed to Food Package Material (FPM) migrating
chemicals e.g., phthalates and others (Table 2) through different routes
such as ingestion, inhalation, and absorption through the skin, that is,
dermal exposure (Saad et al., 2015) or parenteral administration (Mathur
et al., 2014). Both dermal exposure and inhalation are normal to short
chain phthalates such as dimethyl and diethyl phthalates (DMP and DEP)
owing to the day-to-day usage of soap, shampoo, conditioner and other
personal care products. Oral exposure is largely due to consumption of
phthalate-contaminated food with the long chain phthalates like di-
ethylhexyl and di-n-octyl phthalates (DEHP and DOP).
However, human exposure to phthalate esters mostly arises through
dietary intake, particularly plastic packaged foods owing to the weak
covalent bond between phthalates and their parent materials (polymer)
which cause release and bioaccumulation of phthalate esters into the
packaged foods (Saad et al., 2015). Direct interaction with food for
primary packaging has been recognized as the major way in which
chemical migration occurs. The migration of additives or contaminants
from polymeric food packaging to food could be through three different,
but inter-related, phases namely (i) diffusion within the polymer, (ii)
solvation (association) at the polymer food interface, and (ii) dispersion
55
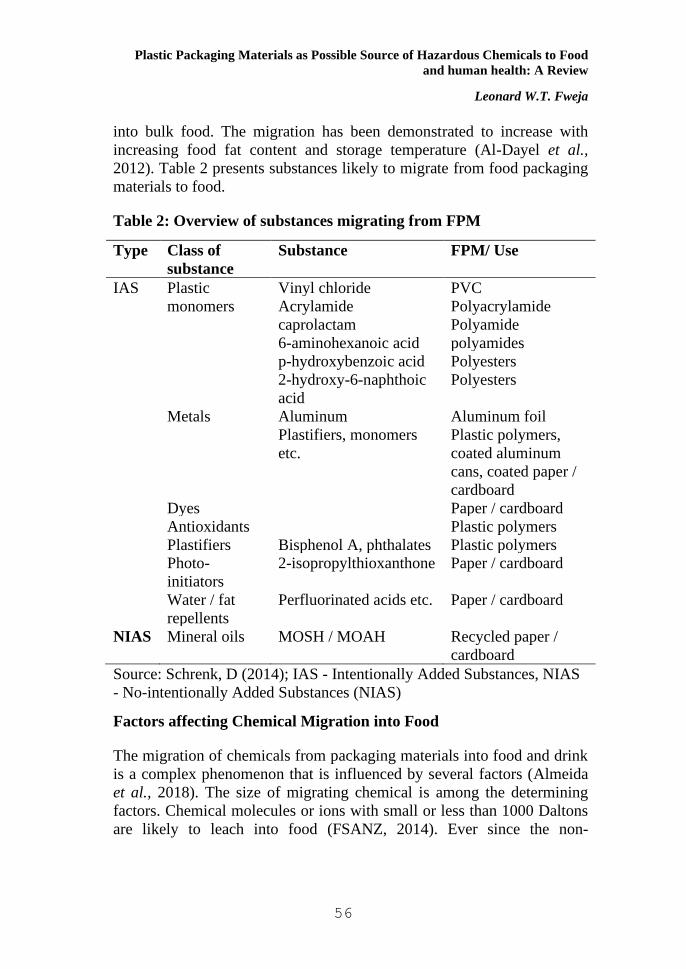
Plastic Packaging Materials as Possible Source of Hazardous Chemicals to Food
and human health: A Review
Leonard W.T. Fweja
into bulk food. The migration has been demonstrated to increase with
increasing food fat content and storage temperature (Al-Dayel et al.,
2012). Table 2 presents substances likely to migrate from food packaging
materials to food.
Table 2: Overview of substances migrating from FPM
Type Class of
substance
Substance FPM/ Use
IAS Plastic
monomers
Vinyl chloride PVC
Acrylamide Polyacrylamide
caprolactam Polyamide
6-aminohexanoic acid polyamides
p-hydroxybenzoic acid Polyesters
2-hydroxy-6-naphthoic
acid
Polyesters
Metals Aluminum Aluminum foil
Plastifiers, monomers
etc.
Plastic polymers,
coated aluminum
cans, coated paper /
cardboard
Dyes Paper / cardboard
Antioxidants Plastic polymers
Plastifiers Bisphenol A, phthalates Plastic polymers
Photo-
initiators
2-isopropylthioxanthone Paper / cardboard
Water / fat
repellents
Perfluorinated acids etc. Paper / cardboard
NIAS Mineral oils MOSH / MOAH Recycled paper /
cardboard
Source: Schrenk, D (2014); IAS - Intentionally Added Substances, NIAS
- No-intentionally Added Substances (NIAS)
Factors affecting Chemical Migration into Food
The migration of chemicals from packaging materials into food and drink
is a complex phenomenon that is influenced by several factors (Almeida
et al., 2018). The size of migrating chemical is among the determining
factors. Chemical molecules or ions with small or less than 1000 Daltons
are likely to leach into food (FSANZ, 2014). Ever since the non-
56
Huria Journal vol. 27 (1), March 2020
polymeric compounds mostly are of low molecular weight and are either
delicately bound or not bound completely to the polymeric macro-
molecules, they or their degradation products, can be detached from the
plastic product to other contact media e.g., food, water and beverages
(Mathur et al., 2014).
The incompleteness of the polymerization process enables BPA monomer
residues to migrate into food in the course of storage and processing at
high temperatures in bottles or other containers (Almeida et al., 2018).
Chemical composition of food also affects the migration rate of the
contaminants. For example, polarity and functional properties of the food
packaging material like crystallinity and permeability may alter the
migration of the additive or plasticizer into the food. Furthermore, the
amount of fat in the food is vital in determining the rate of migration
since most packaging chemicals are lipophilic (that is, dissolve readily in
fat); thus, can freely migrate into fat foods at superior rates and levels
(FSANZ, 2014). Chemical migration is also influenced by product filling
conditions, storage environments, shelf life and food product: pack ratio.
Impairment to the food product packaging might potentially lead to
greater chemical migration through alterations in ambient oxygen,
moisture, light and temperature (FSANZ, 2014). Almeida et al. (2018)
further highlights other influencing factors to include the specific
interaction between packaging material and food (direct or indirect
contact), interaction time (since the concentration of the migratory
chemical element in food is directly proportional to the square root of the
interaction time), temperature during contact (higher temperatures appear
to be associated with a higher migration rate due to increased diffusion
rate), type of packaging / food contact material (finer packages are
associated with higher migration rates) and the nature and amount of the
compound migrating into food and drink (Almeida et al., 2018). The
transfer of BPA from food contact materials to food is amplified by
heating, contact with alkaline or acidic substances, excessive use, and
exposure to microwaves (Almeida et al., 2018). Chemical migration from
a variety of plastic packages into food products have been demonstrated
by several researchers (Zugravu and Cilincă, 2009; Tatiane et al., 2018).
This generally implies that though other factors can hardly be controlled,
others can be controlled to minimize the rate of chemical migration and
hence human exposure through ingestion.
57
Plastic Packaging Materials as Possible Source of Hazardous Chemicals to Food
and human health: A Review
Leonard W.T. Fweja
Potential Health Risks due BPA and Phthalates Migration to Food
The functional role of food and beverage packaging as a source of
pollutants has caused many concerns due to their extensive use. These
pollutants originate from Food Packaging Material (FPM) constituents
(monomers and other raw materials, additives, residues) which migrate
from the packaging into the food (Al-Dayel et al., 2012). It has also been
indicated that some additives comprise of heavy metals (lead, cobalt,
nickel, copper, etc.), highly toxic phthalates (Dibutyl phtalate or DBP)
and other non-intentionally added substances (Lahimer et al., 2013).
However, the ingredients on which most health concerns have been
placed to are BPA, which is applied in tough polycarbonate products and
epoxy resins which line tin cans and a group of plastic softeners termed
phthalates (Mathur et al., 2014). Their health risks to human have
attracted many investigations which have led to the accumulation of
literatures in connection with human exposure to these compounds.
Bisphenol A (BPA)
BPA is regarded an endocrine disruptor and there is a relationship
between exposure to BPA and the appearance of adverse health effects
(Almeida et al., 2018), such as cancer, infertility, diabetes, and obesity,
among others. BPA has been shown to interact with estrogen receptors
and act as agonist or antagonist through endocrine receptor (ER)
dependent signaling pathways due to its phenolic structure. Lee et al.
(2016) have also documented that BPA displays hormone like properties
which might interrupt endocrine system function, obesity, cancer, heart
disease, neurological effects, reproductive and sexual development
deviation.
According to Warner and Flaws (2018) more hormones in the body can
be interrupted by imitators in addition to estrogen. For instance, BPA can
bind to androgen, estrogen, thyroid, estrogen-related, and peroxisome
proliferator-activated receptors. More evidences have been documented
by the European Parliament (2019) which implicates BPA to interact with
a good number of nuclear receptors, including oestrogen receptors. Even
though the intensity of the binding of BPA with the oestrogen receptor is
58

Huria Journal vol. 27 (1), March 2020
much weaker than that of natural (endogenous) oestrogen, this
multiplicity of the receptors (some binding to BPA with strong affinity)
and indicating pathways that may be activated or influenced by BPA
could describe the great number of biological and health parameters likely
to be influenced by BPA at very low doses. According to Konieczna et al.
(2015), BPA play a role in the development of several endocrine
disorders including female and male infertility, precocious puberty,
hormone dependent tumours such as breast and prostate cancer and
several metabolic disorders including polycystic ovary syndrome (PCOS).
Elevated levels of urinary BPA concentration were correlated with a
decreased number of sperm in the ejaculate, as well as its decreased
motility and viability.
Studies experimented in men with prostate cancer revealed a much higher
concentration of BPA in the urine of those patients in comparison with
the control group (Konieczna et al., 2015). Furthermore, BPA has been
associated with obesity. Results from animal studies have been correlated
with prenatal exposure to endocrine disrupting chemicals, BPA inclusive,
and the incidences of obesity, impaired glucose tolerance and lipid
metabolism in mice. Mice subjected to 10 mg BPA/kg body weight per
day had greater concentrations of plasma triglycerides, and elevated body
weight in four months of age as compared to the control group
(Konieczna et al., 2015). The relationship between obesity and plasma
triglyceride concentrations has been demonstrated elsewhere (Després et
al., 1989). Their results documented significantly higher plasma levels of
very low-density lipoprotein triglyceride (VLDL-TG), low density
lipoprotein-cholesterol (LDL-CHOL), LDL-TG, LDL-apolipoprotein
(apo) B and reduced high density lipoprotein-cholesterol (HDL-CHOL)
levels in obese women compared to non-obese controls. As per Almeida
et al. (2018), BPA being lipophilic, it can accumulate in adipose tissue
which could also explain the levels of plasma triglycerides. According to
Kelly et al. (2015) since BPA can be detoxified by the body and does not
normally accumulate, it is debatable whether or not its serum
concentrations can be high enough to affect the normal estrogen related
functions. However, Calafat et al. (2005) in evaluating urinary
concentration of BPA reported the detection of BPA in 95% of the
samples studied at concentrations ≥0.1 μg/L urine; the geometric mean
and median concentrations were 1.33 μg/L (1.36 μg/g creatinine) and 1.28
μg/L (1.32 μg/g creatinine), respectively; the 95th percentile concentration
was 5.18 μg/L (7.95 μg/gcreatinine). On the other hand, Teeguarden at al.
(2013) demonstrated the convergence of robust methods for measuring or
59

Plastic Packaging Materials as Possible Source of Hazardous Chemicals to Food
and human health: A Review
Leonard W.T. Fweja
calculating BPA serum concentration from several published research
outcomes.
They reported that characteristic serum BPA concentrations are in orders
of magnitude lower than levels quantifiable by modern analytical
techniques and below concentrations desired to occupy more than
0.0009% of Type II Estrogen Binding Sites, GPR30, ERα or ERβ
receptors. Their results illustrated inadequate or no potential for
estrogenicity in humans which in turn poses questions to reports of
quantifiable BPA in human serum. Moreover, according to FSANZ
(2014) migration of chemical from packaging to food are
characteristically too little to cause acute adverse health effects. But,
repeated dietary exposure to migrating chemicals over a long period could
results to chronic exposure (FSANZ, 2014). It can thus be presumed that
regardless of the low levels of migrating contaminants, the total exposure
and health risks will depend on their overall accumulation overtime and
toxicity level. Such accumulations of chemicals have been demonstrated
in earlier studies (Almeida et al., 2018). Moreover, according to Warner
and Flaws (2018) the prototype of “the dose makes the poison” does not
apply to BPA, phthalates, and other endocrine disrupting chemicals. The
unique properties of BPA and phthalates, including low-dose effects, non-
monotonic dose response curves (NMDRCs), and rapid metabolism,
break up traditional principles of toxicology. On the other hand, FSANZ
(2014) reported that allegations about a causal relation between BPA and
a variety of public health effects are unproven. However, as reported by
the European Parliament (2019) several studies have recorded effects of
BPA at doses believed safe by regulatory thresholds operative in the EU.
Cases in point include the hypothalamic and hippocampal outcomes on
gene transcription in rats, in vitro work on mouse and human pancreas
demonstrating environmentally applicable levels (exposures in the 1-20
μg/kg body weight/day range) to modify insulin signals and other organ
systems. Furthermore, according to Gerona et al. (2020), CLARITY data
(i.e. data extracted from the Clarity database which is a large subset of
data that comes from the PennChart (Epic) application) offer proof of
significant adverse effects at the lowest dose studied (2·5 μg/kg per day),
far lower than the lowermost discovered adverse effect level (5000 μg/kg
per day) applied to establish the tolerable daily intake for BPA.
Nevertheless, based on the hypothesis that human exposure to BPA is
60

Huria Journal vol. 27 (1), March 2020
negligible, the US Food and Drug Administration (FDA) has not taken
into account the adverse low dose effects in CLARITY data and many
other studies (Gerona et al., 2020). These data suggest disagreements in
threshold value which could even undermine the exposure toxicity. It is
well appreciated that knowledge about the amount of BPA that go into the
human body is vital for risk assessment. Nevertheless, quick metabolism
of orally ingested BPA means accurate evaluation in humans needs not
only measurement of BPA but also of its major conjugated metabolites
(the primary metabolite, BPA glucuronide, and secondary metabolite,
BPA sulfate) which are however excreted in urine. As such (Gerona et al.,
2020) biomonitoring of urine over time offers the best understanding to
human exposure to BPA. Differences in BPA measurement techniques
have also been associated with discrepancies in BPA threshold value.
According to Gerona et al. (2020) indirect techniques used in BPA
exposure estimation underestimates actual human levels of BPA. The
evidence established from the comparative analysis of urine samples
using both indirect and direct methods demonstrated that the geometric
mean established using indirect method was nearly 19 times lower than
the direct method.
These inconsistence in BPA estimation and difficulties in its direct health
effects characterization in human is due to BPA great changeability in the
body over time (European Parliament, 2019), owing to a short half-life.
Furthermore, the inconsistence could be linked with repeated exposures
during the course of the day and dependence on a single bio-specimen
collected in each subject, which is a design used so far in most
epidemiological cohorts. They indicated that (European Parliament, 2019)
this strong time-based variability will, on average, lead to a strong under-
estimation of the slope of dose-response functions and a reduction in the
ability of studies to demonstrate any effect of the compound. This
observation suggests that even though direct methods can provide an
estimation that could be more or less reflective of the actual exposure this
could certainly be achieved if several bi-specimen are sampled over time
for estimation of the mean exposure. Fisher et al. (2015) on the other
hand reported low reproducibility and sensitivity of BPA and all phthalate
metabolites all the way through pregnancy and into the postpartum period
but much higher replicability within a day. The time of a day when the
urine was amassed was a significant predictor of specific gravity adjusted
exposure levels. This led to the conclusion that, if the intention is in
average exposures across gestation, maternal/fetal exposure,
approximation may be more accurate if multiple measurements, gathered
61

Plastic Packaging Materials as Possible Source of Hazardous Chemicals to Food
and human health: A Review
Leonard W.T. Fweja
across the course of the entire pregnancy, rather than a single spot
measure, are implemented. Available data indicate that estimates of
human exposure have been based nearly fully on data from indirect
methods, which implies underestimation of human exposure to BPA and
proposes higher exposure than has been presumed formerly.
These different standings in threshold value suggest the need for extra
studies to reconcile the differences. However, apart from the
demonstrated disagreements among researchers in the currently available
literature particularly with respect to the dose–effect relationship and
threshold value of the migrating chemicals, overwhelming evidence still
illustrate adverse effects associated with BPA and phthalates. Evidences
of chemical migration are undisputable and the limits set by the EU have
been demonstrated to be attained. Fasano et al. (2012) assessed the
migration of BPA and phthalates (DMP, DBP, BBP, DEHP, OP, NP, and
DEHA) from a variety of common food packaging and correlated their
levels with the limits developed by the EU and compared the migration
potential of plasticizers and additives from plastic wine tops at an
incubation temperature of 40°C (Extreme Conditions) and ultrasonic
extraction. The results indicated comparable levels of phthalates (NP, OP,
BPA and DEHA) with EU maximum levels, all samples displayed
chemical migration lower than specific migration limit (SML) and overall
migration limit (OML) established (Reg 10/2011). Plastic wine tops
exhibited the uppermost level of migration even though wine tops are not
in contact with the wine but in the headspace of the bottle on the other
hand, available reports indicate the potential role of BPA in the
pathogenesis of breast cancer (Konieczna et al., 2015) which could be
among the factors that contribute to the development of prostate cancer as
well. Evidence from animal studies documented by European Parliament
(2019) strongly suggest effects of BPA on fat weight/obesity, metabolic
disorders leading to type-2 diabetes, neuro development and behaviour
such as hyperactivity, reproductive processes and memory performance.
Presently, BPA is prohibited from food contact materials intended for
children under three years old in the EU but not for food contact materials
in general (European Parliament, 2019). BPA is also linked with breast
and prostate cancer due to its tumor enhancing properties (European
Parliament, 2019). Determination of systemic levels of BPA in patients
with type 2 diabetes mellitus (T2DM) was done (Soundararajan et al.,
62

Huria Journal vol. 27 (1), March 2020
2019) and compared to individuals with normal glucose tolerance (n = 30
each) signifies the European Parliament (2019) report on diabetes. Their
results demonstrated significantly higher serum levels of BPA in patients
with T2DM compared to control individuals and established a significant
association of elevated BPA levels with cellular senescence, pro-
inflammation, poor glycemic control, insulin resistance, and shortened
telomeres (chromosome ends) in patients with T2DM. Such evidences
suggest the role of BPA in the development of T2DM. In another
investigation in which Comparative Toxicogenomics Database (CTD)
was used (Hassan et al., 2020), it was revealed that BPA has 1932
interactions with genes/proteins and few often used phthalates (DEHP,
MEHP, DBP, BBP, and MBP) indicated 484 gene/protein interactions.
Analogous toxicogenomics and adversative effects of BPA and phthalates
on human healthiness are associated with their 89 common interacting
genes / proteins (Hassan et al., 2020). Such genes interactions are likely
to affect the genetic pattern which provides evidence of the contaminant
effects. The effects of BPA exposure in inducing abnormal DNA
methylation of specific genes related to childhood asthma is also reported
(Yang et al., 2020).
The result showed that MAPK1 protein methylation was minor in
children with asthma than in children without asthma. Mediation analysis
proposed that MAPK1 methylation works as a mediation variable
between BPA exposure and asthma. In view of the results, it was
concluded that the mechanism of BPA exposure on childhood asthma
could, therefore, be through the alteration of MAPK1 methylation. A
more or less similar study (Miura et al., 2019) examined the relationship
of prenatal BPA exposure with genome-wide DNA methylation
modifications in cord blood in 277 mother-child pairs. It was witnessed
that a big share of BPA-associated differentially methylated CpGs was
characterized with a decrease in epigenetic methylation in DNA (hypo-
methylation) among all new-born (91%) and female infants (98%), as
opposed to an increase in epigenetic methylation in DNA (88%) among
males (hyper-methylation). They also found 27 and 16 CpGs with a False
Discovery Rate (FDR) < 0.05 in the analytical study for both male and
female, respectively. They concluded that epigenome-wide analysis of
cord blood DNA methylation proposes potential sex specific epigenome
reactions to BPA exposure (Miura et al., 2019). This implies that similar
exposure may have different outcomes based on an individual’s sex.
According to Almeida et al. (2018) age, gender, liver function, and
physiological status are other factors that influence BPA metabolism.
63

Plastic Packaging Materials as Possible Source of Hazardous Chemicals to Food
and human health: A Review
Leonard W.T. Fweja
Associations of urinary BPA levels (exposure) with sperm parameters
including sperm movement characteristics among fertile men have been
recognized (Honglei et al., 2018). The available data indicate that
exposure to BPA would reduce both sperm concentration and sperm
swing characteristics [amplitude of lateral head (ALH) and mean angular
displacement (MAD)], and raise sperm velocity ratios [linearity (LIN),
straightness (STR) and wobbler (WOB)], which might facilitate
additional effects on impaired male fertility.
Weakened spermatogenesis and sperm movement could illuminate some
light on male subfertility resulting from exposure to BPA. The adverse
effects of BPA on spermatogenesis have been associated with its
interaction with Sertoli cells (somatic cell of the testis) and block the
meiotic progression of germ cells (Honglei et al., 2018). It is further
documented that BPA can interact with steroid receptors, reduce
steroidogenic enzymes, and generate reactive oxygen species (ROS),
which might affect spermatogenesis. Rodent studies of both low- and
high-dose BPA exposure have reported declines of sperm count and
testosterone concentration, damage of sperm motility and sperm DNA
impairment (Honglei et al., 2018). The observation suggests the effect in
spermatogenesis can occur at a wide range of BPA exposure doses.
Earlier animal studies (NRDC, 2008) have also associated BPA with
reproductive deformities such as lower sperm counts, hormonal changes,
enlarged prostate glands, anomalies in the number of chromosomes in
eggs, and pre-cancerous alterations in the breast and prostate. It has
likewise been linked with obesity and insulin resistance, an ailment that
usually precedes the development of diabetes. Similarly, it is documented
that BPA offers a good illustration of complex receptor interactions
(Cwiek-Ludwicka and Ludwicki, 2014). This is demonstrated by in vitro
studies which show it to be both an oestrogenic receptor agonist and an
androgenic receptor antagonist. In vivo studies also observed lots of
different responses signifying a potential endocrine effect that was
nonetheless expressed above its threshold value, that is, 5 mg/kg body
weight (bw) per day. Toxicological studies on BPA permitted the No
Observed Adverse Effect Level (NOAEL) to be established as 5 mg/kg
bw/day, and as a result a Tolerably Daily Intake (TDI) level established to
be 0.05 mg/kg bw/day (Cwiek-Ludwicka and Ludwicki, 2014).
64

Huria Journal vol. 27 (1), March 2020
An earlier review (Posnack, 2014) based on in vitro, in vivo and
epidemiological studies indicate adverse effects of BPA on cardiac
function, the cardiac electrical conduction effect being concentration-
dependent. However, according to Warner and Flaws (2018) the
prototype of “the dose makes the poison” does not apply to BPA,
phthalates, and other endocrine disrupting chemicals. Data from
mammalian model (Posnack, 2014) demonstrated modification in cardiac
structure and function in mice. Other observations included sex-specific
variances after BPA exposure, comprising of concentric remodelling
(male), raised systolic and diastolic blood pressure (female) and altered
calcium handling protein expression (male & female). These documented
results generally indicate that while other adverse effects are sex linked
others are sex independent. Epidemiological results indicate association
between higher BPA urine levels and intensified risk of coronary artery
disease, hypertension, carotid atherosclerosis, angina (inflammatory
infection of the throat) and myocardial infarction (heart attack), and
declined heart rate inconsistency. Higher BPA urinary levels have also
been associated with LDL and HDL cholesterol levels, and the
echogenicity of vascular plaques. Experimental data also advocate that
BPA can affect a diversity of endocrine signaling pathways, taking
account of those mediated by oestrogens, androgens, progestins, and
thyroid hormone (Gerona et al., 2020). Exposure during pregnancy has
been associated with changes in a wide array of developing tissues, with
corresponding postnatal effects on behaviour, fertility, growth,
metabolism and cancer risk.
Phthalates
Though the epigenetic effects of phthalates have not been entirely
clarified, but gathering evidence proposes that they may be connected
with adverse health effects, some of which may be heritable (Bowman
and Choudhury, 2016). Phthalate migration into a variety of milk product
have been illustrated and the levels of migration established. Saad et al.
(2015) examined. the migration of the six most common phthalates of di-
ethyl phthalate (DEP), di-methyl phthalate (DMP), benzylbrobyl
phthalate (BBP), di-brobyl phthalate (DBP), di-ethylhexyl phthalate
(DEHP) and dsi-n-octylphthalate (DOP) in samples of pasteurized milk,
fermented milk "Rayeb" and Domuatti cheese packaged in plastic bottles
and containers. Nonetheless, the results indicated that none of the 6
phthalates of DMP, DEP, DBP, BBP, DEHP and DOP were detected in
any sample of milk, Rayeb and Domuatti cheese examined during the first
65

Plastic Packaging Materials as Possible Source of Hazardous Chemicals to Food
and human health: A Review
Leonard W.T. Fweja
month of production in both bottle and container sizes. Similarly, none of
the four phthalates namely DMP, DEP, DBP and/ or BBP were
discovered in the three examined products up to the last month of expiry.
Only 2 and 3, each out of 24 and 2 out of 18 samples of milk, Rayeb and
Domuatti cheese, respectively displayed low levels of contamination with
DEHP or DOP. The determined residues of DEHP or DOP phthalates
ranged from 30 - 88 ng/ml. It is shown that adverse health risks among
consumers depend on the type, nature and levels of chemical
contamination which indicates consumer exposure. This could explain the
variation in migration phenomenon of the six phthalates. The results
further indicate that the total concentration of the contaminant (e.g.,
phthalate in this case) might not be reflective of the toxicity since not all
types of phthalate might contribute to the contamination and hence
toxicity.
Available data indicates that phthalates, which exist in more than 10
congeners in business and uncountable metabolites, can similarly interact
with multiple hormone systems. Endocrine disrupting action might or
might not be receptor driven and might be agonistic, antagonistic, or a
mixture of both (Warner and Flaws, 2018). Even though the clinical
consequence of phthalate exposure has been tough to assess with
epidemiologic studies, the evidence that physiological variations occur
due to exposure to phthalates is increasing and points toward the need for
more examination at a molecular, specifically epigenetic level (Bowman
and Choudhury, 2016). Phthalates, as is the case with BPA, are normally
believed to disrupt endocrine function and badly affect sex and thyroid
hormones, reproduction, and neuro development. Several in-vitro and in-
vivo investigations have revealed that phthalates have functions
analogous to the thyroid hormone and the capacity to bind thyroid
receptors and, consequently, affect thyroid homeostasis (Kuo et al.,
2015). In a study of the relationship of phthalates exposure with thyroid
function in pregnant women and their newborns (Kuo et al., 2015)
observed that the greater the urinary mono-benzyl phthalate (MBzP) level
in pregnant mothers, the lesser the Thyroid Stimulating Hormone (TSH)
level in cord blood serum. It was concluded that maternal urinary MBzP
may affect TSH activity in newborns. The modification of thyroid
homeostasis by certain phthalates in the initial life, which is a critical
period for neurodevelopment, is a pressing concern. Among the
phthalates, dibutyl phthalate (DBP) and bis(2-ethylhexyl) phthalate
(DEHP) have a common mode of action, but different active metabolites
66

Huria Journal vol. 27 (1), March 2020
(monobutyl phthalate (MBP) versus mono-(2-ethylhexyl) phthalate
(MEHP)) and are thought to have the biggest effect on development of
metabolic disorders (Baralić et al., 2020). Examination of the association
between phthalate exposure and central precocious puberty (CPP) in girls
(Jung et al., 2019) demonstrated no significant difference in the five
urinary phthalate levels between the CPP and pubertal control groups.
Furthermore, phthalate metabolites were significantly lesser in the CPP
group than in the pre-pubertal control group. Earlier studies also reported
conflicting results on CPP and phthalate concentration. Whereas Chen et
al. (2013) indicated significantly higher levels of seven urinary phthalates
[(1) MMP, (2) mono-ethyl phthalate (MEP), (3) MBP, (4) mono-benzyl
phthalate (MBzP),and (5) MEHP; and two oxidized metabolites:(6)
mono-(2-ethyl-5-hydroxyhexyl) phthalate (MEHHP) and (7) mono-(2-
ethyl-5-oxohexyl) phthalate (MEOHP)] in the CPP group than in pre-
pubertal controls, Lomenick et al. (2010) revealed no difference in nine
urinary phthalates [DBP (Di-n-butyl phthalate), DEHP (Di-(2-ethylhexyl)
phthalate), MBP (Mono-n-butyl phthalate), MBzP (Monobenzyl
phthalate), MCPP (Mono-3-carboxypropyl phthalate), MECPP (Mono (2-
ethyl-5-carboxypentyl) phthalate), MEHP (Mono (2-ethylhexyl)
phthalate), MEHPP (Mono (2-ethyl-5-hydroxyhexyl) phthalate), MEOHP
(Mono (2-ethyl-5-oxohexyl) phthalate)] between girls with CPP and pre-
pubertal controls, proposing that phthalate exposure is not linked with
CPP. Several studies (as reviewed by Posnack, 2014) have similarly
documented toxic effects of Di-(2-ethylhexyl) phthalate (DEHP) and its
byproducts based on in vitro, in vivo and epidemiological studies.
The documented toxicity includes cardiac toxicity leading to termination
of contractile function in chick embryonic cardiomyocytes, reduction in
systolic and diastolic blood pressures in male offspring after in utero
exposure to DEHP and a rise in blood pressure in rat offspring after
maternal exposure to DEHP. Epidemiology data on the other hand
indicated a direct relationship between elevated urinary phthalate levels
and both increased blood pressure in adolescent population and increased
coronary risk in the elderly people. Posnack (2014) also documented
significant relationship between elevated MEHP (Mono (2-ethylhexyl)
phthalate) urinary levels and Low Density Lipolipid (LDL) cholesterol
levels and the echogenicity of vascular plaques, but not blood pressure.
Echogenicity of vascular plaques is an indicator of lipid infiltration and a
foreteller of future cardiovascular demise.
67

Plastic Packaging Materials as Possible Source of Hazardous Chemicals to Food
and human health: A Review
Leonard W.T. Fweja
Synergistic Effects of Phthalates and Bisphenol A
Though several studies which have been conducted so far are based on
single endocrine disrupting chemical (EDC), that is, (phthalate or BPA)
recent data conflicts such documented observation on the basis of
combined effects. Baralić et al. (2020) compared the subacute toxic
effects of low doses of single compounds (bis (2 –ethylhexyl) phthalate
(DEHP), di-butyl phthalate (DBP), and bisphenol A (BPA)) with the
effects of their mixture through different biochemical, hormonal, and
hematological parameters in-vitro using rats. It was observed that a blend
of low doses of DEHP, DBP and BPA caused significant alterations in
body weight gain, water and food consumption, thyroid hormone and
testosterone levels, lipid profile, liver-related biochemical parameters, and
the glucose level as opposed to single substance doses on compared
parameters. It was concluded that more noticeable effects witnessed at
certain parameters with mixture exposure are due to the elevated total
exposure amount, suggestive of the dose addition.
The results of the study challenge the results of toxicity studies of single
chemicals and further contribute to the understanding of the health effects
triggered by exposure to chemical mixtures. The results imply that
exposure effects estimated based on single endocrine disrupting chemical
(EDC) might have underestimated the overall effects of its blend.
Reproductive toxicity of phthalates and BPA was examined (Baralić et
al., 2020) in binary and multicomponent blends, commonly targeting
male reproductive tract disorders, mostly after the perinatal exposure. It
was shown that prenatal exposure to the blend of DBP and DEHP
changes fetal testosterone production and insl3 gene manifestation in a
manner that resulted in cumulative dose-additive escalations in
reproductive tract malformations (Baralić et al., 2020). Manikkam et al.
(2013) also examined the effect of mixed EDCs bisphenol-A (BPA) and
phthalates [bis (2-ethylhexyl) phthalate (DEHP) and di-butyl phthalate
(DBP)] at two dissimilar doses in promoting epigenetic transgenerational
inheritance of adult-onset disease and associated DNA methylation
epimutations in sperm. The results showed significant increases in the
prevalence of total disease / abnormalities in F1 and F3 generation male
and female animals from plastics lineages. Pubertal anomalies, testis
disease, obesity, and ovarian disease (primary ovarian inadequacy and
polycystic ovaries) were increased in the F3 generation animals. Prostate
and kidney disease were only witnessed in the direct fatally exposed F1
68

Huria Journal vol. 27 (1), March 2020
generation plastic lineage animals. Examination of the plastics lineage F3
generation sperm epigenome earlier identified 197 differential DNA
methylation regions (DMR) in gene promoters, termed epimutations. The
results show that a blend of plastic derived compounds, BPA and
phthalates, can boost epigenetic transgenerational inheritance of adult-
onset disease. The sperm DMR provide potential epigenetic biomarkers
for transgenerational disease and/or ancestral environmental exposures.
This observation further justifies the need for consideration of the
synergistic effect of the plastic derived EDCs in particular BPA and
phthalate. Another study (Pednekar et al., 2018) evaluated the exposure of
BPA and phthalates in plasma samples of fertile and infertile women.
BPA and four phthalate monoester metabolites [namely mono-benzyl
phthalate (MBzP), mono-methyl phthalate (MMP), mono-2-ethylhexyl
phthalate (MEHP) and mono-(2-ethyl-5-hydroxyhexyl) phthalate
(MEHHP)] were quantified in human plasma. BPA was evident in 77% of
plasma samples of infertile women and 29% of fertile women. All the
four phthalate metabolites were identified in plasma samples of both
fertile and infertile women. The infertile women indicated significantly
higher plasma levels of MBzP, BPA and MEHHP as compared to fertile
women.
The concentrations of MMP and MEHP did not vary significantly
between the two groups. The results generally suggest the likely
association of BPA, MBzP and MEHHP with infertility implying their
combined infertility effect. Furthermore, the observation implies that
some phthalates (MMP and MEHP) have insignificant effects on women
infertility. This could on the other hand suggest that the total
concentration of a particular plastic monomer (phthalate in this case)
might not be indicative of the reflective dose effect for a particular health
risk.
CONCLUSION
Available literature provides evidences which demonstrate that chemical
migration from plastics packaging is an unquestionable reality. Though
several chemicals are migrating from plastic packages, however, the
chemicals of great health concerns are BPA and phthalates. There is
accumulated evidence of the human health risks associated with BPA and
phthalate leakage into packaged food with dietary intake being the major
69

Plastic Packaging Materials as Possible Source of Hazardous Chemicals to Food
and human health: A Review
Leonard W.T. Fweja
root for human exposure. The health effects due to migrating chemicals is
demonstrated to be through their interactivity with multiple hormone
systems, implying a wider range of effects that can occur depending on
the number of affected hormonal receptors. Although disagreements
among researchers are still demonstrated in available literature
particularly with respect to the dose-effect relationship and the threshold
value of the migrating chemicals, however, overwhelming evidence still
illustrate several adverse effects associated with BPA and phthalates
which can hardly be undermined. Such effects include adverse effects on
spermatogenesis, obesity, type two diabetes mellitus, raised systolic and
diastolic blood pressure (female) and altered calcium handling protein
expression (male & female), coronary artery disease, hypertension,
carotid atherosclerosis, cancer risks, angina etc. Even though several
studies have been done for a single chemical (BPA or phthalates) the
comparative results indicate a cumulative dose-additive amplification
when a mixture of the two is examined which implies the need for further
reexamination of the synergistic effect of the plastic derived EDCs in
particular BPA and phthalate.
REFERENCES
Al-Dayel, O., Al-Horayess O, Hefni, J., Al-Durahim, A. and Alajyan, T.
(2012). Contamination of Foods by Migration of Some Elements
from Plastics Packaging. DOI: 10.5772/33161 · Source: In Tech.
https://www.researchgate.net/publication/224830682
Almeida, S., Raposo, A., Almeida‐González, M. and Carrascosa, C.
(2018). Bisphenol A: Food Exposure and Impact on Human Health.
Comprehensive Reviews in Food Science and Food Safety, 17 (6):
1503-1517. https://doi.org/10.1111/1541-4337.12388
Baralić, K., Djordjevic., B, Živančević, K., Antonijević, E., Anđelković.,
M, Javorac, D., Ćurčić, M., Bulat, Z., Đukić-Ćosić, D. and Buha, A.
(2020). Toxic Effects of the Mixture of Phthalates and Bisphenol
A—Subacute Oral Toxicity Study in Wistar Rats. International
Journal of Environmental Research and Public Health
Bowman, J.D. and Choudhury, M. (2016). Phthalates in neonatal health:
friend or foe? Journal of Developmental Origins of Health
and Disease, 7(6):652-664, DOI: https://doi.org/ 10.1017/
S2040174416000349
70

Huria Journal vol. 27 (1), March 2020
Calafat, A. M., Kuklenyik, Z., Reidy, J.A., Caudill, S.P., Ekong, J. and
Needham, L.L. (2005) Urinary concentrations of bisphenol A and 4-
nonylphenol in a human reference population. Environ Health
Perspect 113: 391-395
Chen, C.Y., Chou, Y.Y., Wu, Y.M., Lin, C.C., Lin, S.J. and Lee, C.C.
(2013). Phthalates may promote female puberty by increasing
kisspeptin activity. Hum Reprod. 28: 2765-73. DOI:
10.1093/humrep/det325
Cwiek-Ludwicka, K. and Ludwicki, J.K. (2014). Endocrine disruptors in
food contact materials; Is there a health threat? Rocz Panstw Zakl
Hig. 65(3):169–177.
Després, J.P., Moorjani, S., Tremblay, A., Ferland, M., Lupien, P.J.,
Nadeau, A. and Bouchard, C. (1989). Relation of High Plasma
Triglyceride Levels Associated with Obesity and Regional Adipose
Tissue Distribution to Plasma Lipoprotein-Lipid Composition in
Premenopausal Women. Clin Invest Med 12 (6): 374-80
European Parliament (2019). Endocrine Disruptors: from Scientific
Evidence to Human Health Protection. Study requested by the PETI
committee. Policy Department for Citizens' Rights and
Constitutional Affairs Directorate General for Internal Policies of
the Union PE 608.866 - March 2019
Fasano, E., Bono-Blay, F., Cirillo, T., Montuori, P. and Lacorte, S.
(2012). Migration of phthalates, alkylphenols, bisphenol A and
di(2-ethylhexyl) adipate from food packaging. Food Control.
27(1):132-138. DO - 10.1016/j.foodcont.2012.03.005
Freudenrich, C (2007). "How Plastics Work" 14 December 2007.
HowStuffWorks.com. <https://science.howstuffworks.com/ plastic.
htm> 18 March 2020
Fisher, M., Arbuckle, T.E., Mallick, R., LeBlanc, A., Hauser, R., Feeley,
M., Koniecki, D., Ramsay, T., Provencher, G., Bérubé, R. and
Walker, M. (2015). Bisphenol A and phthalate metabolite urinary
concentrations: Daily and across pregnancy variability. Journal of
exposure science & environmental epidemiology, 25(3), 231–239.
https://doi.org/10.1038/jes.2014.65
FSANZ-Food Standards Australia New Zealand (2014). Consultation
Paper-Proposal P1034. Chemical Migration from Packaging into
Food.https://www.foodstandards.gov.au/code/proposals/
Documents/ P1034%20Abandonment.pdf
GEF (2018). Global Environment Facility. Plastics and the circular
economy: A STAP document. GEF/STAP/C.54/Inf.05
71

Plastic Packaging Materials as Possible Source of Hazardous Chemicals to Food
and human health: A Review
Leonard W.T. Fweja
Gerona, R., vom Saal, F.S. and Hunt, P.A. (2020). BPA: have flawed
analytical techniques compromised risk assessments? www.
thelancet.com/diabetes-endocrinology Vol 8 January 2020,
https://doi.org/10.1016/S2213-8587 (19)30381-X
Grigore, M. E. (2017). Methods of Recycling, properties and application
of recycled thermoplastic polymers. Recycling 2: (24); doi:
10.3390/recycling2040024
Halden, R.U. (2010). Plastics and Health Risks. Annu. Rev. Public
Health. 31:179–94
Hassan, S., Ali, R., Shah, D., Sajjad, N. and Qadir, J. (2020). Bisphenol A
and Phthalates Exhibit Similar Toxicogenomics and Health Effects.
In: Source Title: Handbook of Research on Environmental and
Human Health Impacts of Plastic Pollution. Copyright: © 2020
|Pages: 25, DOI: 10.4018/978-1-5225-9452-9.ch014 (Recheck DOI)
Honglei, J., Maohua, M., Hong, L., Huijuan, S., Dasheng, R., Yongbo, L.,
Jian, W. and Wei, Y. (2018). Exposure of environmental Bisphenol
A in relation to routine sperm parameters and sperm movement
characteristics among fertile men. Scientific Reports. 8(1). DOI:
10.1038/s41598-018-35787-5
Jung, M.K., Choi, H.S., Suh, J., Kwon, A., Chae, H.W., Lee, W.J., Yoo,
E. and Kim, H. (2019). The analysis of endocrine disruptors in
patients with central precocious puberty. BMC Pediatr, 19(1):323.
Doi:10.1186/s12887-019-1703-4
Kelley, M., Wetie, A.G.N. and Darie, C.C (2015). Correlation between
Bisphenol A Exposure and Adverse Health Effects. Mod Chem appl
2015, 3:1, DOI: 10.4172/2329-6798.100014
Konieczna, A., Rutkowska, A. and Rachoń, D. (2015). Health risk of
exposure to Bisphenol A (BPA). Roczniki Państwowego Zakładu
Higieny. 66: 5 - 11
Kuo, F.C., Su, S.W., Wu, C.F., Huang, M.C., Shiea, J., Chen, B.H. et al.
(2015). Relationship of Urinary Phthalate Metabolites with Serum
Thyroid Hormones in Pregnant Women and Their Newborns: A
Prospective Birth Cohort in Taiwan. PLoS ONE 10 (6): e0123884.
doi: 10.1371/journal.pone.0123884
Lahimer, M., Ayed, N., Horriche, J. and Belgaied, S. (2013).
Characterization of plastic packaging additives: Food contact,
stability and toxicity. Arabian Journal of Chemistry. 50(S2). DOI:
10.1016/j.arabjc.2013.07.022
72

Huria Journal vol. 27 (1), March 2020
Lee, T., Nilawat, T. and Romano, C. (2016). Chemical Mixtures in the
Environment: Endocrine Disruption Properties of Phthalates and
BPA. California State University (CSUN): 11th Alumni Annual
Environmental and Occupational Health Technical Symposium
March 2nd 2016 http://scholarworks. csun.edu/ handle/ 10211.3/
197589?show=ful
Lomenick, J.P., Calafat, A.M., Melguizo, C.M.S., Mier, R., Stenger, P.,
Foster, M.B. et al. (2010). Phthalate exposure and precocious
puberty in females. J Pediatr; 156:221–5.
Manikkam, M., Tracey, R., Guerrero-Bosagna, C. and Skinner, M.K.
(2013). Plastics Derived Endocrine Disruptors (BPA, DEHP and
DBP) Induce Epigenetic Transgenerational Inheritance of Obesity,
Reproductive Disease and Sperm Epimutations. PLoS ONE 8(1):
e55387. doi: 10.1371/journal.pone.0055387
Mathur, N., Mathur, N. and Singh, S. (2014). Toxigenic Effects of
Plastics on Human Health. Int. J. Chem. Sci.: 12(3), 2014, 1044-
1052
Mepex Consult AS (2017) Basic Facts Report on Design for Plastic
Packaging Recyclability Version 0.2. https://www. grontpunkt.no
/media/2777/report-gpn-design-for-recycling-0704174.pdf.
Accessed 20/02/2020
Miura, R., Araki, A., Minatoya, M., Miyake, K., Chen, M., Kobayashi, S.,
Miyashita, C., Yamamoto, J., Matsumura, T., Ishizuka, M., Kubota,
T. and Kishi, R. (2019). An epigenome-wide analysis of cord blood
DNA methylation reveals sex-specific effect of exposure to
bisphenol A. Sci Rep. 2019;9(1):12369. Published 2019 Aug 26.
doi:10.1038/s41598-019-48916-5
NRDC - Natural Resource Defense Council (2008): Health Facts:
Chemicals in Plastic Bottles: How to Know What’s Safe for Your
Family. https://www.nrdc.org/sites/default/files/bpa.pdf. Accessed
25/02/2020 at 2:30 Pm
Pednekar, P.P., Gajbhiye, R.K., Patil, A.D., Surve, S.V., Datar, A.G.,
Balsarkar, G.D., Chuahan, A.R. and Vanage, G.R. (2018).
Estimation of plasma levels of bisphenol-A & phthalates in fertile &
infertile women by gas chromatography-mass spectrometry. Indian
J Med Res. 148:734-742
Plastic New Zealand (2009). Grigore (2017). https://www.plastics.org.
nz/images/documents/PDFs/pnz-id-code-web-2009-1.pdf. Accessed
4/3/2020
73

Huria Journal vol. 27 (1), March 2020
Posnack, N.G. (2014). The Adverse Cardiac Effects of Di (2-ethylhexyl)
phthalate and Bisphenol A. Cardiovasc Toxicol. 14(4): 339–357.
Doi: 10.1007/s12012-014-9258-y.
Proshad, R., Kormoker, T., Islam, S., Haque, M. A., Rahman, M. and
Mithu, M.R. (2018). Toxic effects of plastic on human health and
environment: A consequence of health risk assessment in
Bangladesh. International Journal of Health, 6(1):1-5. doi:
10.14419/ijh.v6i1.8655
Romeo, R.I.M. (undated). Reaction Injection Molding. 74000 Van Dyke
Ave, Romeo, MI 48065 https://romeorim.com/thermoset-vs-
thermoplastics/, Accessed 3rd/03/2020 at 11:56 am.
Saad, M.M., Ahmed, M.B. and Sultan, Y.Y. (2015). Phthalate Residues
in Plastic Packaged Milk and Dairy Products. World Journal of
Pharmaceutical Research, 4(12), 1799-1807.
Schrenk, D. (2014). Literature report on food packaging materials and
their potential impact on human health. Professor of Food
Chemistry and Toxicology, Technische Universität Kaiserslautern,
Germany
Schuler, K. (2008), Smart Plastics Guide Healthier Food Uses of Plastics.
Institute for Agriculture and Trade Policy, Food and Health
Program. https://www.iatp.org/ sites/default/ files/421_2
_102202.pdf. Accessed on 10/02/2020 at 4.40 am pyright Institute
for Agriculture and Trade Policy
Soundararajan, A., Prabu, P., Mohan, V., Gibert, Y. and
Balasubramanyam, M. (2019). Novel insights of elevated systemic
levels of bisphenol-A (BPA) linked to poor glycemic control,
accelerated cellular senescence and insulin resistance in patients
with type 2 diabetes. Mol Cell Biochem. 458(1-2),171–183.
doi:10.1007/s11010-019-03540-9
Tatiane, M.G., Diogo, N.O., Carlos, F.O.R.M., Estela, O.L. and Rodrigo,
R.C. (2018). Migration from plastic packaging into meat. Food
Research International, doi: 10.1016/j.foodres.2018.04.026
Teeguarden, J., Hanson-Drury, S., Fisher, J.W. and Doerge, D.R. (2013)
Are typical human serum BPA concentrations measurable and
sufficient to be estrogenic in the general population? Food and
Chemical Toxicology 62: 949-963.
Warner, G.R. and Flaws, J.A. (2018). Bisphenol A and Phthalates: How
Environmental Chemicals Are Reshaping Toxicology.
Toxicological Sciences, 166(2):246–249, https://doi.org/
10.1093/toxsci/kfy232
74

Huria Journal vol. 27 (1), March 2020
Yadav, R. (undated). The Different Types of Plastic and Their Number
Classifications (Codes) - Quality Logo Products, Inc. https://
www.scribd.com/document/319748198/The-Different-Types-of-
Plastic-and-Their-Number-Classifications-Codes-Quality-Logo-
Products-Inc. Accessed on 7th March 2020 at 12:53 pm
Yang, C., Karmaus, W.J.J., Yang, C., Chen, M. and Wang. I. (2020).
Bisphenol an Exposure, DNA Methylation, and Asthma in
Children. International Journal of Environmental Research and
Public Health; 17(1): 298. doi: 10.3390/ijerph17010298
Zugravu, C.A. and Cilincă, G. (2009). Safety of plastic packages in
contact with cheeses. Journal of Agro-alimentary Processes and
Technologies 15(4):530-535
75

Huria Journal vol. 27 (1), March 2020
Gender Discrimination in Politics: A Critical Review of
Liberalism
Alexander Makulilo
University of Dodoma
ABSTRACT
Liberal political theory assumes that the separation of the public from the
private sphere is natural and therefore woman’s subordination to man is
inherent. The backdrop of this dichotomy appears to reinforce gender
stereotyping since it constructs woman to reflect an apolitical nature of a
subject in a political system. Man’s behaviour, on the other hand, is
portrayed as the standard political behaviour against which a woman is
supposed to measure. Viewed from the perspective of the dichotomy,
politics is reduced to “man” and hence its masculinisation.
Camouflaging its exclusionary tendencies, liberal theory purports to
employ “universal”- neutral static language which is “sexual-blind”
such as “individual”, “citizen”, “worker”, “equality”, and
“representation”. Liberalism therefore makes universal rationality the
essence of humanity and the basis of its epistemology and politics. This
article examines the core of liberalism as one of the sources of gender
discrimination in politics.
Keywords: Liberalism, gender, discrimination, politics, masculinization,
rationality
INTRODUCTION
Political theories are not neutral and natural. They were formulated to
reflect the socio-economic and political context of a given space and time.
The theories are therefore infused with the experiences, perspectives,
understandings and assumptions of their creators about human nature and
relationships. By the same token, the language that is imbedded within the
body of these theories reflects the context within which they originate. In
the Western and colonial societies, for example, the creators of the
language, norms, laws, and practices of the dominant culture and ideology
were white, economically privileged, formally educated, able-bodied,
heterosexual (or at least not openly homosexual or bisexual) men. Men
76

Gender Discrimination in Politics: A Critical Review of Liberalism
Alexander Makulilo
with power created the dominant cultural discourses - languages,
symbols, disciplines and institutions that control political, legal,
economic, social, scientific and organizational practices governing a
gendered society (Bender 1990). Arguably, women were inevitably
excluded from the studies designed to produce knowledge of the
dominant discourses, theories and practices. It is through this
exclusionary process that the language of political theories carries with it
the fallacy of gender stereotyping by constructing woman as apolitical
subject of the political system. In this article, the liberal philosophy and
theories are critically examined. Toward that grand objective, the
public/private paradigm and its underpinning social contract (consent)
theory form the core of this discussion. The intention is to revisit and
destabilize the fallacy of gender stereotyping as imbedded in the language
of political theory. The main argument of this article is that political
theories and classical studies have been at the centre stage of perpetuating
gender stereotyping with the effects of rendering women incompetent
political beings and hence their exclusion from participating in political
affairs.
METHODOLOGY
This is a literature review-based article. It employs mainly secondary
materials particularly classical and contemporary works on liberalism.
The materials are critically reviewed using three thematic areas namely
gender stereotyping, rationality, and universality. The purpose is to
delineate exclusionary tendencies of liberalism based on gender. This
approach is useful in so far as it interrogates the controversial facets of
liberalism on its inclusivity and exclusivity along a gendered perspective.
FINDINGS AND DISCUSSION
Gender Stereotyping in Politics
Theorizing politics is a discourse which has yet to be closed. With the
publication of the Aristotle’s The Politics, in which various constitutions
are studied to establish the best method of a government, the debate on
what constitutes “the political” began. The central questions in the
discourse revolve around two definitional issues: the scope and nature of
politics as well as who should participate in politics and why. In
examining this discourse, two frames of references are considered here
for the sake of space. The first frame is called institutionalist perspective.
This views politics as confined to the state and its related institutions.
77
Huria Journal vol. 27 (1), March 2020
Politics, in this sense, comprises of public and formal affairs of the
government.
Putting this point in perspective, Nnoli (1986) posits that an action of the
bishop can be differentiated from that by a president in that the
president’s order is authoritative since it has the back-up of the
sanctioning power of the state. With coercive forces such as police, army,
prison and courts, the president is fully vested with powers that can be
used to implement his or her decisions. In contrast, the bishop, without
these supportive instruments is unable to effectively sanction his or her
followers. This view seems to carry the problem of academic
reductionism. For one thing, if the same activities, such as elections,
conflicts, and decision-making take place within the church, schools,
trade unions and so forth, can’t one argue that these are church politics,
school politics, union politics respectively? To define politics strictly
around the affairs of the state is to fail to appreciate other spaces and
forms of politics. This view restricts the meaning of politics to the old
fashion of the Westphalia Treaty of 1648 that recognised state as a
sovereign entity with the right to exercise power in a hierarchical order. In
contrast, the instrumentalist perspective views politics as an exercise of
power game. It is argued that when “X” influences “Y” so that the latter
accomplishes the wishes of the former which without that influence
nothing would have happened, power is assumed to have been exercised
(French and Raven, 1959).
This definition is broader in the sense that it views power to transcend the
state to other non-state actors. It allows one to appreciate politics at both
micro and macro level organisations. One omission in this definition is
that it does not state who should own and exercise that power against
who. It also assumes that power is static and exercised in one direction.
Power, in this way, seems to be a means to an end an end in itself. To put
it differently, power as we shall see later, is seen to be confined to the
public sphere, the sphere of man. If that is the correct interpretation as
given by the public/private paradigm, one is supposed to see power
flowing from men to women in their private sphere. In a way, men are the
ones who possess power and exercise the same over women. From these
derivations, politics is inherently infused with patriarchal assumptions of
power that control knowledge – reasoning and rationality. In the Estonian
System theory, political system is arranged in terms of ‘demand-political
system-supply’ logic (Easton, 1965). It assumes that the system operates
in response to the demands from the environment i.e., citizens. These
78
Gender Discrimination in Politics: A Critical Review of Liberalism
Alexander Makulilo
should have the capacity to demand from the state: activities and services
since the government through a social contract (formed during election)
promised to deliver them in exchange for votes and support, mainly
through compulsory taxation. To be sure, politics being a formal activity
in the public sphere automatically excludes women to play their role.
Thus, one may put that the premise on which politics and its discipline –
political science is founded, is essentially a male domain. And therefore,
all theories, research and studies derived from politics are biased to
favour men. Pateman (1989) aptly argues that the power of men over
women “is excluded from scrutiny and deemed irrelevant to political life
and democracy by the patriarchal construction of the categories within
which political theorists work”.
Attesting to this view Lovenduski (1981) posits that the dominant
conception of political studies excludes women “largely because women
usually do not dispose of public power, belong to political elites or hold
influential positions in government institutions”. As it can be deduced
from these authors, Pateman primarily criticises the institutional focus of
liberal political theory while Lovenduski questions the instrumentalist
view of positivist political science. Indeed, both the institutional and
instrumental conceptions of politics focus on the public sphere of decision
making. It is from this backdrop that Pateman (1989) proceeds to claim,
“both women’s exclusion from the public world and the manner of our
inclusion have escaped from the notice of political theory”. The
instrumental and institutional views of politics are criticised to be
restrictive and biased. The feminist assertion that “the personal is
political” destabilized the previous definitions of politics. Phillips (1998)
went further to say that “politics” was subjected to such devastating
criticism that it threatened to dissolve as a distinct category of analysis.
From the above observations, it can be noted that the definition of politics
is intertwined with gender stereotyping. In that sense, the relationships
between men and women are shaped by using “constructs” which mask
world’s reality about the nature of man and woman (Archer and Lloyd,
2002). From the work of social psychologists, a stereotype is employed to
connote a set of beliefs typical to personal attributes of a group of people.
Koch (2000) argues that, though “stereotype” was once considered a
pejorative term, the cognitive approach in social psychology now regards
it in a more neutral manner, viewing it as a heuristic employed to decide
whether a target possesses a particular attribute.
79
Huria Journal vol. 27 (1), March 2020
Thus, gender stereotypes are mere social and cultural constructs. They are
essentially rooted in the historically socialized roles that have
encompassed the lives of men and women. To that extent, they constitute
beliefs people hold about members of the categories man and woman.
Existing in a bipolar axis, these stereotypes provide mainly three
assumptions: that women and men are fundamentally different; that men
are superior to women and that men are logical and rational, the attributes
which women seem to lack. From the outset, stereotypes are basically of
two types. The first type is named belief stereotypes. These refer to the
ideologies and policy preferences that are ascribed to men and women,
and the second one is called trait stereotypes which concern with personal
qualities that are inferred about men and women (Fox and Oxley, 2003).
In line with this view, Archer and Lloyd (2002) for example point out that
in the Judaeo-Christian tradition, God created woman as the helpmate of
man but not his equal. This divine view seems to take woman’s
subordination to man as the natural order of the day. It is not uncommon
to find that in most teachings of other major religions, woman occupies
this inferior status. Sabbah (1984) puts that, “Muslim culture has built-in
ideological blindness to economic dimension of women, who are
ordinarily perceived, conceived and defined as exclusively sexual
objects.” One peculiar element about stereotype is generalization. Women
are clustered and lumped together as if they form a homogeneous social
category. Almond and Verba (1963) study on civic competence is
exemplary to bring this point home.
In this study, women are generalized as incompetent political beings.
They dislike politics and would not participate in that game. Meena
(2001) seems to concur with Almond and Verba when she observed those
people who never follow politics in Tanzania to be women who
accounted for 61 percent against men who comprised 39 percent. The
simple reason advanced for this difference is that most women live in
rural areas and particularly those who did not attend the formal schooling.
One of the omissions in Meena’s analysis is to fail to question the nature
of that education. If the theories, discourses, as well as practices of
education are infused with gender stereotyping, it is no wonder that such
education will perpetuate the gender gap between men and women. In this
context, education is in itself insufficient to correct the past gender
imbalances.
80

Gender Discrimination in Politics: A Critical Review of Liberalism
Alexander Makulilo
Rationality in Liberalism
The emergence of liberal political theory is associated with the rise of
capitalism in Western Europe around 17th Century. The theory is
essentially grounded on the conception of human beings as rational
agents. Rationality has three distinct elements: firstly, the mental
capacity; secondly, as a property of individuals rather than of groups; and
thirdly, as a capacity that is possessed in approximately equal measure at
least by all men (Jaggar, 1983). Like any other political theory, in
developing its vision of the good society, liberal political theory
incorporates some assumptions about the nature of men and women. To
be sure, the liberal conception of the good society naturally is the one that
advocates the basic liberal values of protecting the dignity of each
individual and promote individual autonomy and self-fulfilment. This
means that individuals should enjoy maximum freedom that is not
impeded by others. Paradoxically, impediment is a likely permanent
human condition.
Liberal theorists therefore devise a state as a social institution that will
protect each individual’s right to a fair maximum autonomy and self-
fulfilment. They are however, very cautious of the potential dangers of a
state to abuse its role as a custodian of protection of liberty. Hence, they
limit the legitimate state intervention in the life of individuals. This
limitation resulted into what is commonly referred to as the public and
private spheres. The public/private paradigm contends that society is
broadly divided into two spheres i.e. the public and private spheres. The
public sphere according to this paradigm is characterized by power,
wealth, rule, rationality, career and reasoning. In contrast, the private
sphere is predominated by domestic activities as well as child bearing
(Arneil, 2001). It should be noted right from the outset that, political
theory and the classical studies are accused to have a share in reinforcing
and widening this dichotomy. They construct woman to reflect the
apolitical nature of a subject in a political system. Man’s behaviour, on
the other hand, is always taken as the standard political behaviour against
which a woman is supposed to measure herself. The dichotomy thus
reduces politics to “man”. By so doing, politics is being masculinised.
Nikolas (1987) reaffirms this view in a more explicit way:
The division between public and private is traced back in political
and social philosophy at least as far as Aristotle's distinction
between polis and oikos and up to the natural rights theories of
John Locke. However, in the eighteenth and nineteenth centuries
81

Huria Journal vol. 27 (1), March 2020
the distinction is reposed in terms of the division between home
and market. It is given a philosophical foundation in the liberal
political philosophy of J. S. Mill and his followers, with the
opposition between the realm of legitimate public regulation and
the realm of freedom from intrusion, personal autonomy and
private choice. Writers point to the particular associations in
these texts between the public sphere - the world of work, the
market, individualism, competition, politics and the state - and
men, and the corollary association of women with the private,
domestic, intimate, altruistic and humanitarian world of the home.
Stevens claims that, “The traditional division confined women largely to
the domestic sphere and to the reproduction and nurture of children as
their primary role, while generally affording a much greater share of both
power and resources to men. However, this division is being
undermined...In particular, modern market-driven capitalism tends to treat
everyone alike, whether as a factor of production (a worker) or a
consumer” (Stevens, 2007). This position asserts that capitalism is fair to
everyone, something which is not true. It ignores critical questions like
ownership of the major means of production and factors of production.
Gatens (1992) posits that “Liberal feminists conceive the problem of
women’s confinement to the private sphere as central to their low socio-
political status. Equality, wealthy and opportunity are located in the
public sphere. Hence the issue of providing women with access to power
becomes the issue of providing them with equal access to the public
sphere. The state is obliged to provide women with the same
opportunities it provides for men.” Nonetheless, the question as to what
constitutes a state is side skipped. In A Vindication of the Rights of
Women (1792), Mary Wollstonecraft argued forcefully that women had
the potential of full rationality and as a result were as capable as men of
complete moral responsibility. She specifically argued that:
Men and women must be educated, in great degree, by the
opinions and manners of the society that they live in. In every age
there has been a stream of popular opinion that has all carried
before it, and given a family character, as it were, to the century.
It may then fairly be inferred, that, till society be differently
constituted, much cannot be expected from education. It is,
however, sufficient for my present purpose to assert, that,
whatever effect circumstances have on the abilities, every being
may become virtuous by the exercise of its own reason; for if but
82

Gender Discrimination in Politics: A Critical Review of Liberalism
Alexander Makulilo
one being was created with vicious inclinations, that is positively
bad, what can save us from atheism? Or if we worship a God, is
not that God a devil?
The above quotation is instructive to the solution of women’s invisibility
in the private sphere. It shows that the problem lays in the whole issue of
“rationality” which seems to be deficient in women. Mary thinks that
education is the only way to strengthen women. In his The Subjection of
Man (1869), John Stuart Mill dismisses the natural difference on
rationality between men and women. He contends that if men had ever
been found in a society without women, or women without men, or if
there had been a society of men and women in which the women were not
under the control of men, something might have been positively known
about the mental and moral differences which may be inherent in the
nature of each. And therefore, what is now called as the nature of women
is eminently artificial thing – the result of forced oppression in some
directions, unnatural stimulation in others. Mill’s view sharply contradicts
John Locke’s social contract theory that the separation between the public
and private spheres is natural and therefore for woman to be subordinate
to man is inherent. In the Sexual Contract, Pateman (1988) vehemently
criticizes the “social contract theory” and reduces it to “sexual contract”:
The logic of contract as exhibited in ‘surrogate’ motherhood
shows very starkly how the extension of the standing on
‘individual’ to women can reinforce and transform patriarchy as
well as challenge patriarchal institutions. To extend to women the
masculine conception of the individual as owner, and the
conception of freedom as the capacity to do what you will with
your own, is to sweep away any intrinsic relation between the
female and owner, her body and reproductive capacities. She
stands to her property in exactly the same external relation as the
male owner stands to his labour power or sperm; there is nothing
distinctive about womanhood.
The point to be noted here is that sex matters and there is no legitimate
way to avoid referring to it. The social contract theorists want us to
believe that such contract is entered between and among individuals. It is
the contract of freedom and is done under individuals’ consent. Pateman
claims that to view a contract in that perspective is to ignore the existence
of both sexes in bodily form. And therefore, one is able to advance
83

Huria Journal vol. 27 (1), March 2020
women’s interests if and only if he or she first and foremost appreciates
the sexual differences.
The Pretence of Universality
The first pillar of pretence is citizenship. Citizenship is a precondition to
participate in public politics (Stevens, 2007). Being a citizen means
having formal civil and political rights. As we argued elsewhere in this
article, citizenship is inextricably tied to the public as opposed to the
private sphere. Here the public comprises of both the state and civil
society and the private is defined institutionally as the relations and
activities of domestic life (Squires, 1999). It was John Locke who
proposed the relation between men and women along the public and
private spheres. According to him, the state of nature forced individuals to
fear death and therefore the need to form a social contract.
That means a contract that is based on consent, and the one that would
protect all against all. Interestingly, Locke’s state of nature shows that
prior to the consent men were already dominant in their families. He
argued that a wife’s subjection to her husband had a foundation in nature.
This implies that women were excluded from the status of being
“individual” which is basic to consent theory. The argument which is
always advanced by feminists is that if a wife’s subjection to her husband
has a “natural” foundation, she cannot at the same time be “naturally” free
and equal individual. This means that citizenship is a natural property of
man in his public sphere. Supporting this view, Pateman (1989) argues
that “citizenship has been made in the male image”. The artificial
inclusion of women as citizen works differently from the original
inclusion of men. Pateman (1980) furthers that:
Consent is central to liberal democracy, because it is essential to
maintain individual freedom and equality; but it is a problem for
liberal democracy, because individual freedom and equality is
also a pre-condition for the practice of consent. The identification
of enforced submission with consent in rape is a stark example of
the wider failure in liberal democratic theory and practice to
distinguish free commitment and agreement by equals from
domination, subordination, and inequality.
84
Gender Discrimination in Politics: A Critical Review of Liberalism
Alexander Makulilo
The above quotation suggests that citizenship is an ideological
euphemism of liberalism founded on a false consent. Using that “consent”
men are able to enjoy freedom and equality while women are subjected to
men’s domination. And therefore, men are considered to be citizens, the
fact which allows them to participate fully in politics. The second pillar of
pretence is equality. This means, treating all human beings equally. In the
Subjection of Woman, Mills advocated “a principle of perfect equality,
admitting no power or privilege on the one side, nor disability on the
other” (Mill, 1985). But it has to be stated that equality in liberalism is
equality of opportunity as opposed to outcome. As Stevens (2007)
maintains, “women’s access to full social citizenship requires formal
equality of opportunity on a basis of equal treatment”.
The author fails to state clearly how that state of affairs can be achieved.
To be emphasized here, though in risk of repetition, is that the
development of capitalism was the driving force in separating the public
from the private sphere. In a way, it was capitalism which accorded men a
sense of citizenship and the associated bourgeois rights in their public
sphere. Paradoxically, liberalism does not seek fundamental changes of
the system to ensure equal treatment instead it advocates for equal
opportunity without dismantling the unequal system of capitalism.
Einhorn (2005) thus argues that “The neo-liberal market paradigm
empowers the male economic actor as the citizen with the capacity to
exchange contracts in the market-place. Without social entitlements, for
example to adequate and affordable childcare, in a context where women
are still seen as primarily responsible for looking after children, they do
not have an equal capacity to access the public spheres of either the
market or the polity”. Stevens (2007) posits that women’s economic
position, status and power in the societies of OECD (Organization for
Economic Co-operation and Development) countries at the start of
twenty-first century fail to measure up to that of men. This observation is
instructive insofar as it places men to be the standard measure of women
demands to access the public sphere and equality. This shortly suggests
women should be like men, or pretend to be so.
Phillips (1992) submits that “the male body has been the reference point
in all our phallocratic discourse, and discussions of even sexual equality
continue to privilege his body. Women can say they want to be treated the
same – but this means being treated as if they were men; or they can
demand laws that are specific to their needs- but this means being
85

Huria Journal vol. 27 (1), March 2020
compensated for their lesser abilities or role”. It is along this line of
reasoning, Gatens (1992) argues that equality in this context can involve
only the abstract opportunity to become equal to men. It is the male body,
and its historical and culturally determined powers and capacities, that is
taken as the norm or the standard of the liberal “individual” or citizen.
The third pillar of pretence is representation. Historically women have
been excluded from participation in the formal institutions of politics. As
we argued elsewhere, the reason to this phenomenon is found in the
artificial separation between the public and private spheres which denies
women to be citizen. Stevens (2007) puts:
Men in western societies acquired a substantial body of civil
rights- rights to justice and to own property- before the
achievement of political rights. The right of all men to participate
fully in the political life of the state, an aspiration of the
revolutionaries of the late eighteen century, was acquired only
gradually as autocratic and absolute rule was replaced by liberal
democratic systems. However, for women the position has largely
been reversed. Civil as well as political rights have had to be
fought for and the acquisition of political rights has often been
seen not only as an end in itself but an essential means of securing
equality in other spheres of rights.
Women are under-represented in the formal institutions of political and
economic life. According to IPU (2019) the worldwide average women
representation in the parliaments is only 24%. One of the simple
advanced reason is that women are less interested in politics than men. In
Great Britain, for example, the government’s Central Statistical Office
report on women states that “women are not particularly interested in
politics” (Stephenson quoted in Squires, 1999).
This position was supported by a government survey which showed that
only 7 per cent of women claimed to be “very interested” in politics, and
a MORI poll to accompany the 75th anniversary of women’s rights
showed that 76 per cent of women were not involved in any form of
party-political activity (Squires ibid.: 196). If representation connotes
representation of interests, beliefs, constituencies and identities, how are
women included in the formal politics? If male dominates the public
sphere how can they really represent women? Through the mythology of
the “affirmative action” women continue to suffer male domination. The
centrality of that action is to effect inclusion of the marginalised groups
86
Gender Discrimination in Politics: A Critical Review of Liberalism
Alexander Makulilo
into the major decision-making organs, employment, and education. Brest
and Oshige (1995) define an affirmative action as a program initiated to
seek remedy of the significant underrepresentation of members of certain
racial, ethnic or other groups through measures that take group
membership or identity into account. This definition emphasizes on two
things. The first one is the question to cure exclusion by inclusion and the
second is the issue of who should benefit out of the program, which is the
group that has suffered exclusion and not the third party or an individual
member. However, critics of affirmative action pose one fundamental
question: Is affirmative action inherently preferential, discriminatory, and
thus inconsistent with the constitution’s guarantee of equal protection?
(Collier, 1995). Collier responds this question in affirmative. Consistent
with this view, Farber (1994) sees affirmative action as the reverse
discrimination.
To them if the constitution stipulates the equality of opportunity and
avoids in any way to mention any sort of discrimination, that alone is
sufficient to protect every individual. Writing on the American political
system, Jeffrey (1997) puts that “No matter how hard politicians run from
it, this issue is not going away. The Declaration of Independence, for
example, does not say that because of past discrimination some are more
equal than others. It does not say that for some pursuit of happiness needs
to be constrained because of past privileges; no, it insists, boldly, that here
in America, we are all equal under the law”. While this argument is
convincing, it is narrow and too legalistic. For one thing, it misses out to
raise important questions like who enacted that Declaration and for whose
interests. It is ridiculous to argue emphatically that all people are equal
before the law without looking deeper into those laws themselves. One
may raise questions, for example, were women in the process of enacting
that Declaration? How are their concerns taken into account? The fact that
women in America won the voting franchise around 1920s raises doubt
on the fairness of the laws themselves. Writing on the parliaments of the
advanced industrial democracies, Caul (1999) argues that women
participate little in the national decision-making process which not only
limits diversity but also contradicts one of the central tenets of
representative democracy. It is along this line of reasoning that Brown
(2001) submits that, “No process could adequately address gender
interests without taking into account female representation within formal
political institutions. Higher levels of women's representation can
empower women as a result of both the creation of more equitable
87
Huria Journal vol. 27 (1), March 2020
opportunities for women to participate in politics and the greater concern
with gender interests that female policy-makers are supposed to have”.
The fourth pillar of pretence is the use of gender-neutral language.
Liberalism always strives to avoid any mention of sex. It, therefore,
makes use of “universal”, neutral and static terms such as “individuals”,
“citizen”, and “worker”. But this “gender-neutral abstraction” camouflage
the male dominance. Phillips (1992) argues that “Human identity is
sexually differentiated, and exists in a bodily form. Those who seek to
deny the body, who deal only in the abstraction of ‘the individual’ or ‘the
citizen’, who think it should not make any difference whether these
individuals are women or men, will be writing in one sex alone as their
standard. Women can be encompassed on an equality with men only if
sexual difference is first of all acknowledged”. While I share Phillips’
language argument, I do not agree on the fact that women will attain
equality once they become like men. It should be acknowledged that
language is a product of society and it must carry with it the culture,
norms, and practices of time and space. Swila (2004) submits that:
Language is a product of social conventions in that linguistic
structures, their meanings and uses are shared by the entire
community; the individual’s freedom in her or his linguistic
choices only has meaning within these conventions. Language is a
crucial aspect of culture: it expresses cultural values and
preoccupations and transmits these new generations. Gendered
relations found in other social aspects are necessarily present and
enacted in language as well. Therefore, by examining language,
we are able to reconstitute the values and beliefs of a community
through time. Language is dynamic and evolves to reflect changes
in the society it serves; if more positive and equal gender relations
are created, they will be reflected in language.
The above quoted paragraph shows clearly that language is not neutral. In
political studies, the field of international relations is for example
perceived to be a man’s game. With very few exceptions, men are the
government leaders, diplomats, and high-ranking international military
and civil servants. Ferris (2004) maintains that sexual language is used to
mobilize male soldiers, foster their camaraderie, and inspire them to
assert their masculinity. She observes that US and allied pilots in the Gulf
War were shown pornographic films as part of their pre-aid preparations.
88
Gender Discrimination in Politics: A Critical Review of Liberalism
Alexander Makulilo
CONCLUSION
This article notes that the language of political theory is infused with
gender stereotyping. Supported by capitalism and the consent theory,
liberalism locates women in the private sphere. In masking its exclusion
tendencies, liberalism purports to employ neutral vocabularies such as
“citizen”, “individual”, “worker”, “representation”, “equality”, and
“freedom.” Macdonell (1986) submits that liberalism subscribes to the
idea of individuality and sameness. That is, on the one hand, we are all
free to do what we please; and, on the other hand, we all speak the same
language, hold the same values and know the same truths unless, that is,
we are aberrant and abnormal. This is indeed fallacious. Young (1997)
argues that the paradox of individualism and sameness underlies
liberalism’s notion that there exists a universal standard of rationality that
forms the core essence common to all “normal” people. Those who act
against such standard do so because they are in the first-place irrational in
their lives. And therefore, liberalism makes this notion of universal
rationality as the essence of humanity, the basis of its epistemology and
politics, which valorise rational objectivity and its supported embodiment
of scientific inquiry and institutions of government.
To de-construct the political theory and the task of engendering is still a
challenge amid centuries of women’s movements. One is either to look
for theories of identity and subjectivity that will find women’s vocabulary
in the contemporary political theory. This would mean reversing the
situation by seeking women’s domination. Secondly, is to reconstruct the
theories to be neutral and this entails confirming the status quo. Finally, is
to seek rights as men are treated which would imply that the male
political behaviour is the standard and desirable one for women to aspire.
The current choice is to unpack the language of political theories so as to
iron out gender bias. In liberal societies, this should see the fundamental
change of the capitalist system which supports the public/private
dichotomy and its associated consequences.
89

Huria Journal vol. 27 (1), March 2020
REFERENCES
Almond, G. A. and Verba, S. (1963). The Civil Culture: Political
Attitudes and Democracy in Five Nations. New Jersey:
Princeton University Press.
Archer, J. and Lloyd, B. (2002). Sex and Gender, 2nd Edition. Cambridge
University Press.
Arneil, B. (2001). “Women as Wives, Servants and Slaves: Rethinking
the Public/Private Divide”, Canadian Journal of Political
Science, 34(1): 29-54.
Bender, L. (1990). “Symposium: From Gender Difference to Feminist
Solidarity: Using Carol Gilligan and an Ethic of Care in Law”,
Vermont Law Review, 15(1): 1-48.
Brest, P. and Oshige, M. (1995). “Affirmative Action for Whom?”
Stanford Law Review, 47(5): 855-900.
Brown, A. M. (2001). “Democratization and the Tanzanian State:
Emerging Opportunities for Achieving Women’s
Empowerment”, Canadian Journal of African Studies 35(1): 67-
98.
Caul, M. (1999). “Women’s Representation in Parliament: The Role of
Political Parties”, Party Politics, 5(1): 79-98.
Collier, C. W. (1995). “The New Logic of Affirmative Action”, Duke
Law Journal, 45(3): 559-578.
Easton, D. (1965). A Systems Analysis of Political Life. New York: Wiley.
Einhorn, B. (2005). “Citizenship, Civil Society and Gender
Mainstreaming: Contested Priorities in an Enlarging Europe”. In
Conference on ‘Gendering Democracy in an Enlarged Europe’,
Prague 20 June; http:/qub.ac.uk/egg/ accessed 18 May 2020.
Farber, D. A. (1994). “The Outmoded Debate over Affirmative Action”
California Law Review, 82(4): 893-934.
Ferris, E. (2004). Women, War and Peace. Uppsala: Life & Peace
Institute.
Fox, R. L. and Oxley, Z. M. (2003). “Gender Stereotyping in State
Executive Elections: Candidate Selection and Success”, Journal
of Politics, 65(3): 833-850.
French, J.R.P. and Raven, B. (1959). 'The bases of social power,' in D.
Cartwright (ed.) Studies in Social Power. Ann Arbor, MI:
University of Michigan Press. 259-269.
Gatens, M. (1992). “Power, Bodies and Difference” in Barrett, Michele
and Phillips, Anne (eds.) Destabilizing Theory: Contemporary
Feminist Debates, Polity Press.
90

Gender Discrimination in Politics: A Critical Review of Liberalism
Alexander Makulilo
Gavison, R. (1992). “Feminism and the Public/Private Distinction”,
Stanford Law Review, 45(1): 1-45.
Jaggar, A. (1983). Feminist Politics and Human Nature. Brighton:
Harvester.
Jeffrey, C. F. (1997). “Rethinking Affirmative Action”, Public
Productivity & Management Review, 20(3): 228-236.
Koch, J. W. (2000). “Do Citizens Apply Gender Stereotypes to infer
Candidates’ Ideological Orientations?” Journal of Politics,
62(2): 414 – 429.
Lovenduski, J. (1981). “Toward the Emasculation of Political Science” in
Dale, Spander (ed.), Men’s Studies Modified. Oxford: Pergamon.
Macdonell, D. (1986). Theories of Discourse: An Introduction. Oxford
and New York: Basil Blackwell.
Meena, R. (2001). “Gender Differences in Political Orientation” in
Mushi, Samuel S., Mukandala, Rwekaza S. and Baregu,
Mwesiga L. (eds) Tanzania’s Political Culture: A Baseline
Survey, Department of Political Science, University of Dar es
Salaam.
Mill, J. S. (1970). “The Subjection of Women”, in Alice S. Rossi, (ed.),
Essays on Sex Equality. Chicago: University of Chicago Press.
Mill, J. S. (1985). The Subjection of Women. London: Dent Everyman.
Nikolas, R. (1987). “Beyond the Public/Private Division: Law, Power and
the Family”, Journal of Law and Society, 14 (1): 61-71.
Nnoli, O. (1986). Introduction to Politics. Longman.
Pateman, C. (1980). “Women and Consent”, Political Theory, 8(2): 149-
168.
Pateman, C. (1988). The Sexual Contract. Cambridge: Polity Press.
Pateman, C. (1989). The Disorder of Women. Cambridge: Polity Press.
Phillips, A. (1992). “Universal Pretentions in Political Thought” in
Barrett, M. and Phillips, A. (eds). Destabilizing Theory:
Contemporary Feminist Debates. Polity Press.
Phillips, A. (ed.), (1998). Feminism and Politics. Oxford: Oxford
University Press.
Sabbah, F. A. (1984). Women in the Muslim Unconscious, Translated by
Mary Jo Lakeland, New York: Pergamon Press.
Siltanen, J. and Stanworth, M. (1984). “The Politics of Private Woman
and Public Man”, Theory and Society, 13(1): 91-118.
Squires, J. (1999). Gender in Political Theory. Polity Press.
Stevens, A. (2007). Women, Power and Politics. Palgrave Macmillan.
91

Huria Journal vol. 27 (1), March 2020
Swila, I. (2004). “Gender Bias in Language” in Mruma, Njau (ed.)
Gender and Development in Tanzania: Past, Present and
Future. Women Research and Documentation Project
Young, S. (1997). Changing the Wor(l)d: Discourse, Politics and
Feminist Movement. New York: Routledge.
Wollstonecraft, M. (1967). A Vindication of the Rights of Women. New
York: W.W. Norton.
92

Huria Journal vol. 27 (1), March 2020
A Rule-based Approach for Resolving Cybercrime in
Financial Institutions: The Tanzania case
George S. Oreku
The Open University of Tanzania
ABSTRACT
It is widely accepted that technology is an agent of change in the
society. However, the current rate of change in technology,
particularly ICT, mobile and ATM machines, leaves room for it to be
exploited and be used for things it was not meant for. The paper aims
at examining the challenges to electronic banking and initiatives taken
to address cyber-crimes among financial institutions in Tanzania.
Using the data gathered based on employed comparative analysis
methods from our studies and research undertaken by researchers, we
examine in detail, technical factors that are continually shaping the
landscape of cybercrime and its impact on financial Institutions.
Picking a leaf on how to deal with challenges brought by information
and communication technology-induced innovations in the banking
sector a Platform for Organization Security Threat Analytic and
Management (POSTAM) approach to address the cyber security
problems in Tanzania was re-introduced. The data model approach
was used to analyze collected data stored from the survey to test the
security prototype developed.
Key Word: Cybercrime; model; legislation; cyber-attacks; security
INTRODUCTION
The security study literature has shown that system's users are the weak
link for security breaches (Anagement, 2010) and therefore hackers use
this loop hole to break the system for their personal gain or otherwise.
Despite the user being a weak link, the advancement in computer
technology also produces a huge amount of data i.e., information
overload compared to the organizational ability to manipulate in order
to extract potential useful information for informed decision-making
(Mbowe et al 2014) and (Mijatov et al, 2013). According to (Mbowe et
al 2014) the security awareness and maturity level for selected
organizations in Tanzania are not satisfactory in many aspects.
93

A Rule-based Approach for Resolving Cybercrime in Financial Institutions: The
Tanzania case
George S. Oreku
Acknowledgements: The author acknowledges Tanzania Police Defense Force (TPDF), which
provided platform for conducting research and archival data sources used by the study.
Electronic banking In Tanzania (or e-banking) has grown largely
different from previouslyyears of an overwhelming response in its
applicability and reception. Apart from the banks, other financial
institutions have also adopted new methods of electronic financial
transactions. The adoption of the Automated Teller Machines (ATMs)
by various banks and financial institutions and mobile banking by
various communication companies such as Tigo, Vodacom and Airtel
have encouraged the adoption of habits for deposits and quick transfers
of money or payments via electronic payment services (Kato, 2019). The
adoption of electronic banking by (CRDB, 2020) (NMB, 2020) (DCB,
2020) Exim Bank and (NBC 2020) for example, confirms the
development of electronic banking in the country.
It was noted that, the top management (e.g., directors, managers,
supervisors or executive officers exercising the organization’s powers)
considers information security management as a technical issue rather
than a business issue, in which there exists little or no close eye from top
management to oversee information security compliance. The poor
realization of information security as a corporate governance
responsibility has promoted the deadly sins of information security
management (Vagias, 2006). As a result, it causes the security
management imbalances among internal stakeholders due to inadequate
security sense and commitment across the organization structure. In this
context, security management imbalance is the phenomenon of
uncoordinated efforts among top management and security managers in
protecting an organization’s infrastructure and data and hence with the
new era of computing ubiquitous resulting in lots of cyber-attacks. The
definition of “cyber-crime”, in the Tanzanian context, varies across the
industry as it covers a wide scope of overlapping crime committed with
the aid of growing technology. These crimes are classified according to
how majority of the people involved make use of the internet and
technologies to exchange ideas, keep in touch with family and friends,
buying and selling products (including online transactions, M-Pesa) and
accessing online services. Cybercrime in Tanzania is mainly committed
by two groups of people. Namely, those who perform the act without the
knowledge that what they are doing is wrong and those who know what
94

Huria Journal vol. 27 (1), March 2020
they are doing but are determined to perform the act in order to distract
the country’s equilibrium through different angles; from destabilizing
peace in a country through misuse of social media and other
communication media to stealing money through online transactions.
Tanzania has a high rate of cybercrime and hate speech as highlighted in
Mtanzania Newspaper, (Mtanzania, 2013) “There is fear of high rate of
individuals who made use of the internet to threaten national security
(Tanzania) due to misuse of the blogs and social media along with
mobile phones to spread hate speech among communities in Tanzania
and the number of cyber criminals worldwide has now increased.” In the
past, there were a few cases where criminals made use of technology to
tamper with ATM machines in Tanzania. Nowadays the act is growing
faster and the fear among ATM users has increased due to the fact that
each day cyber criminals are coming up with new techniques to steal
money from ATMs. People were shocked and surprised when the
opposition leader spokesman for the Ministry of Communication,
Science and Technology announced that the country has lost 892.18
billion Tanzanian Shillings in Cyber-crimes according to the official
reports of the police (http://www.tech360magaz.com). Some
sophisticated criminals have been stealing money from the Banks
directly; 250 million was reported in Mwananchi Newspaper
(Mwananchi, 2012), as being stolen from Uchumi Commercial Bank
through the ATM's in Moshi region in Tanzania. Cybercrime has
become a global threat which needs an urgent attention at national,
regional and international level.
“Cyber criminals are always ahead of us,” this fact was backed up by the
deputy minister for Home Affair’s speech by then on opening conference
which took place in Tanzania (http://www.thecitizen.co.tz) “Many
people are ignorant of cyber-crimes while our police force has low
capacity,” he said in Arusha where IT specialists, lawyers, police officers
and others from the East African region had a meeting to devise ways to
tackle the problem. He added that currently there were more than 300
cybercrime cases which are being investigated by the police in Tanzania
but admitted the exercise was slow because the police and other agencies
were ill-equipped and not conversant with such crimes. The wave of
hacking underscores the financial industry’s battle to thwart cybercrime
and comes as consumers and banks are reeling from several high-profile
data breaches at retailers that have exposed millions of credit cards and
debit cards to potential fraud. The statistically presentations from the
95

A Rule-based Approach for Resolving Cybercrime in Financial Institutions: The
Tanzania case
George S. Oreku
research carried out presents the general trend of cyber-attacks within the
past six years from different regions in Tanzania (Figure 1).
Criminal Stealing Techniques
From January to April 9, 2015, the number of attacks on debit cards used
at ATMs reached the highest level for that period in at least 20 years,
according to FICO, a credit-scoring and analytics firm. The company
tracks such incidents through its card- monitoring service for financial
institutions that represent more than 65% of all U.S. debit cards
(Marginally,2015). Debit-card compromises at ATMs located on bank
property jumped 174% from January 1 to April 9, compared with the
same period last year, while successful attacks at nonbank machines
soared by 317%, according to Fair Isaac Corporation FICO (Sidel,2015).
The article went further by clarifying that, the incidents come as banks are
racing to issue new credit and debit cards with computer chips that make
it more difficult for thieves to create counterfeits. However, most ATMs
don’t yet accept the new technology, though J.P. Morgan Chase & Co.
and Bank of America Corp. have recently begun to install the more
advanced machines. Criminals send phishing emails or text messages via
mobile phones and trick the victims by convincing them to provide their
bank details and Automatic Teller Machines (ATM) pins. Using different
telephone numbers as request send by the Bank officials requesting some
client’s details for banks details amendments. Card skimming occurs in
the country, whereby cyber criminal’s use and record card details by
using a device called a “card skimmer” which is placed right over the card
slot or over the keypad of the ATM machine and captures card and PIN
96

Huria Journal vol. 27 (1), March 2020
information. Web based attacks are becoming more popular in Tanzania
which occur when criminals hack websites. Cyber criminals hack the
websites to gain unauthorized access to the personal information of
clients or web visitors. This in Tanzania imitates how globally the country
is positioned in responding to cyber-attacks issues. Hackers are now using
the technique to destabilize websites by performing attacks to deny and/or
destroy information, steal information, manipulate information, alter the
context in which the information is viewed or change the perceptions of
people towards the information.
The findings also recognized that there is a case in the Kilimanjaro region
in Tanzania concerning theft of money from Mobile Money agents by the
same perpetrator (an unidentified female) who is very good at it. She
apparently does so by approaching agents pretending to want to draw
some money but after a while the agent will find all his money gone after
she left the place. It is hard to tell what she does but most of the agents
have confirmed that the criminal is the same woman, (Unknown, 2013).
Such a report comes after a study that shows that transactions through
mobiles are growing rapidly in Tanzania. The use of M-money in
Tanzania started in 2005 when Airtel introduced phone-to-phone airtime
credit transfer. In 2008 Vodacom launched its M-money service called M-
Pesa. Zantel Tanzania also introduced its M-money service in the same
year, which was first called Z-Pesa (now called EasyPesa). In 2010, Tigo,
the first mobile network operator (MNO) in the country launched its M-
money service called TigoPesa. The report by Inter Media in 2013 there
are four M-money services brands in Tanzania: M-Pesa, TigoPesa, Airtel
Money and EasyPesa. Up to April 2013, the registered customer base of
mobile payment services was 28.8 million in Tanzania, 8.5 million being
active users Bank of Tanzania (Bank of Tanzania, 2013) Currently, with
the new players like Halotel and Tanzania Telecommunications Company
Limited (TTCL) Mobile, coming on board by 2016 there were more than
39 million mobile subscribers in the country, of which 16.5 million were
mobile money subscribers (Edda et al, 2017)
The weak link that can let a hacker clone the so-called “chip-and-pin”
credit and bank cards stems from the fact that use of prepaid debit cards
for everything from gift certificates to disaster relief handouts is making it
easier for hackers to withdraw large amounts of money before detection
(Emily et al, 2018) as the Cambridge researchers showed, the Europay,
MasterCard (EMV) scheme has, in too many cases, not been carried out
as planned. The authentication process, as originally envisioned, was
97

A Rule-based Approach for Resolving Cybercrime in Financial Institutions: The
Tanzania case
George S. Oreku
supposed to depend on the issuing bank to generate a random number for
every unique transaction. In practice, where saving money often trumps
security, it was left to point-of-sale terminals or cash machines to
generate the number. A large percentage of mobile usage in Tanzania can
be attributed to its use as a means of money transfer posing it as a
significant threat to become a weak link, as accessibility to mobile money
transaction is done through punching in four digits to access the
authenticity. This makes it all too easy for a hacker. “If you can predict
the number, you can record everything you need from momentary access
to a sim card and play it back and impersonate the card at a future date
and location (Bond, 2012) The mentioned attacks might seem outdated in
developed world but are the most common and fast-growing techniques
used by criminals in Tanzania and it is unfortunate that the majority of the
population is unaware of this. There have been an increasing number of
incidents where victims of credit card fraud had their requests for refunds
refused by the issuing banks on the grounds that there is no way to
explain the card having been authenticated without the cardholder’s
involvement. During our research we found that all these are facilitated
due to:
The Use of More than One type of Customer ID’s
One security weakness of M-Pesa is to allow the use of more than one
type of customer ID. For example, a customer who used employer ID to
register for M-Pesa account can later withdraw money by using another
ID such as driving license, voter’s ID or any other ID. This situation
makes it possible for an incorrect or forged ID to be used.
Weak Pin
M-pesa PIN is a four-digit number. Moreover, the PIN never expires and
is written in plain text during the transaction.
Poor Verification of Customer ID
Another security challenge that M-Pesa agents are facing is on how to
authenticate M-pesa customers. The agent usually inspects customer ID
physically without having any other mechanism for proving or
referencing the validity of that ID from the authorities which issued those
IDs. This creates a loophole for a person to register for M-Pesa account
with a forged ID.
98

A Rule-based Approach for Resolving Cybercrime in Financial Institutions: The
Tanzania case
George S. Oreku
Poor Transaction Confirmation Procedure
Before a sender completes a transaction, the M-Pesa system requires the
sender to confirm each transaction before it is fully executed. For
example, when a person withdraws money, the last stage is to confirm the
amount of the money to be withdrawn and to whom that money is
transferred. Generally, the name of the recipient, amount to be transferred
and the account number is displayed for verification. The aim is to avoid
wrong or unintended transfer of money. Despite this procedure, several
cases of transferring money to unintended recipient have been reported.
Inaccurate data entry is the main cause of transferring money to
unintended recipient. Some of the reasons that contribute to this problem
include poor sender concentration when carrying out the transaction, user
illiteracy and unfamiliarity with mobile phones.
Lack of End-to-End Verification
Unlike in banking systems where the bank teller has to verify customer
signature and photograph physically and then compare them with
electronic copies stored in the system, the agent relies on one side
authentication by just examining customer ID. If the customer has forged
the ID and places his photo, the agent will not detect it. This loophole
allows for a fake customer to use a forged ID to access M-Pesa Services.
Lack of Printed Receipts
Another weakness in M-pesa services is that the agent does not issue a
printed receipt to the customer once the money withdrawal or deposit
transaction is completed. As already explained, each transaction is issued
with a unique receipt number that is included in the confirmation SMS.
However, if the SMS is compromised, there will be no evidence to
indicate that the transaction was carried out between an M-Pesa agent and
a customer. From the analysis above based on our previously findings
originated from consolidated research and practical work in the area of
cybercrime, emerging perspectives, paradigms and trends which were
more based on theoretical aspects mostly (Oreku et al, 2017) deliberate
efforts are made in making sure that the role of proposing solutions is
undertaken to respond to cyber security problem in Tanzania as additional
to what was done previously in research analysis.
99
A Rule-based Approach for Resolving Cybercrime in Financial Institutions: The
Tanzania case
George S. Oreku
Impact of Cyber Crime
From January to June 2017, 3,340 cases were reported to the police
stations. The real impact of the growing interest in fake news however has
been the realization that the public might not be well-equipped to separate
true information from false information. It is paramount that governments
and social media platform owners lay down stringent measures to clamp
down on fake news, none the less, we do appreciate that fabricated stories
are not likely to go away as they have become a means for some writers
to push their narrow agendas, manipulate emotions, make money and
potentially influence public opinion. A significant proportion of this cost
comes from the insider threat, which we estimate at $30M per annum. In
all probability, and in line with our worst-case scenarios, the real impact
of Cybercrime is likely to be much greater. As for measuring costs, this
report deconstructs the cost based on these four categories:
• Costs in anticipation of Cybercrime, such as antivirus software,
insurance and compliance.
• Costs as a consequence of Cybercrime, such as direct losses and
indirect costs such as weakened competitiveness as a result of
intellectual property compromise.
• Costs in response to Cybercrime, such as compensation payments
to victims and fines paid to regulatory bodies.
• Indirect costs such as reputational damage to firms, loss of
confidence in Cyber transactions by individuals and businesses,
reduced public-sector revenues and the growth of the underground
economy.
Cybercrime in Financial Institutions
Loss of money, system downtime and inconvenience were identified as
the top impacts of cybercrime. This presents one’s conclusion that
majority of attacks in Tanzania are motivated by financial gain and the
reason why Financial Institutions, Savings and Credit Cooperative
Societies (SACCOS) and Organization that deal with transaction
processing are primary targets for the cyber- attacks. When the study was
conducted, particularly with financial institutions, the response to the
question, “How has cybercrime impacted you?” majority of respondents
indicated an impact of Cybercrime portrayed below.
100

Huria Journal vol. 27 (1), March 2020
Managing Cyber Security
79.3% of organizations including Financial Institutions manage their
cyber security in-house as follows: - 17.9% being handled by a dedicated
in-house Computer Emergency Responses Team (CERT) and 61.4%
handled by an individual in charge of security within the organization.
This is an increase of 8.3% from the year 2016. Only 6.4% have
outsourced these services to an external party managed security service
provider and Internet Service Provider (MSSP or ISP). More and more
companies are now developing in house capabilities to manage cyber
security, this is particularly the case with Banking and financial
institutions. Our survey on the question “how is your Organization’s
cyber-Security being managed” revealed that majority of respondents
(55%) who did not know how their cyber security was managed came
from the Government sector. This was closely followed by by insurance
(11%) then Academia (10%).
Proposed Rule Based Data Mining Model
101

A Rule-based Approach for Resolving Cybercrime in Financial Institutions: The
Tanzania case
George S. Oreku
It is based on the foundation of (Mbowe et al 2016) research work
conceptualized in a previously developed prototype which integrated the
information security policies to enhance the security strategies for
effective protection of critical assets. The generated radar and line graphs
for assessing inside threats and security awareness and maturity level in
public organization have provided a practical approach for improving the
internal security strategies for preserving confidentiality, integrity and
availability as core services in security management. After field research
and data collections, the study proposed the rule-based data mining
approach. Data Mining (DM) has emerged for knowledge discovery
especially from big data aimed at predicting the future state of the data for
decision making. In so doing, our approach has adopted ruled-based data
mining technique for useful information extraction or knowledge
discovery (see Figure 2) for visualization of organizational security
threats from computer logs, awareness data, security maturity data and
other security sources or files.
From traditional DM process model perspective, we have integrated the
spoofing, tampering, repudiation, information disclosure, denial of
service, and elevation of privilege model (STRIDE) model and
organization’s security policies into the data mining process model in
order to streamline the data mining processes as shown by Figure 7a and
7b contrary to traditional DM approach. By using the classification
technique; the security log data, awareness and maturity data were
classified at different levels of representation or organizational security
threats: spoofing, tempering, repudiation, information disclosure, denial
of service and elevated privileges. Five organizations were selected to
pilot our approach by testing our model as per table 1 below.
102

Huria Journal vol. 27 (1), March 2020
Figure 2. The Conceptual Interface Design Model
Table 1: About 108 participants: 23 IT technical staff and 85 non-IT
staff were interviewed using structured questionnaires
103
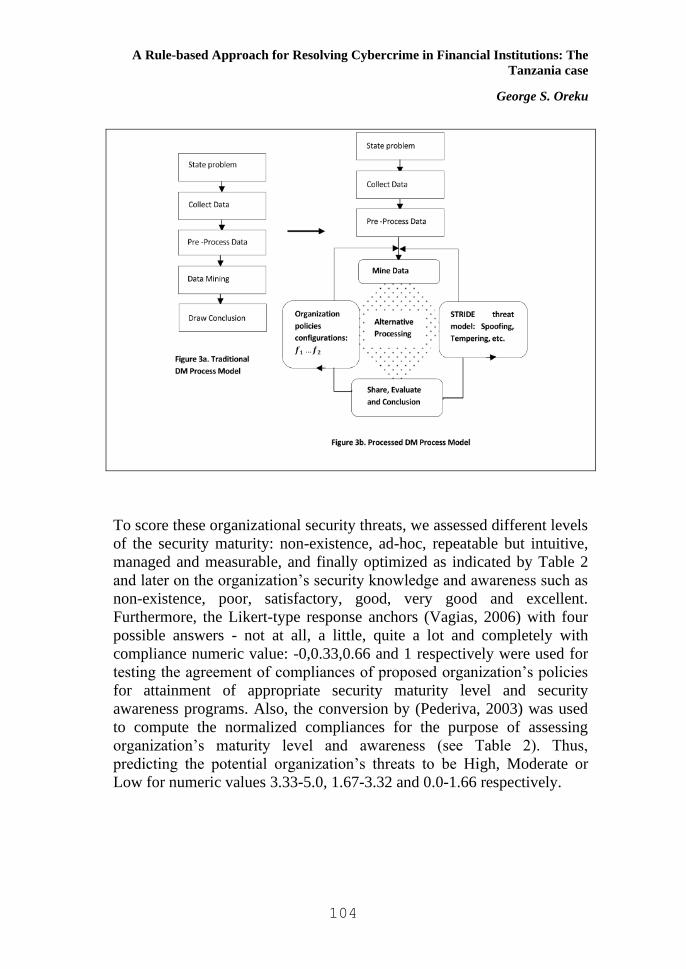
A Rule-based Approach for Resolving Cybercrime in Financial Institutions: The
Tanzania case
George S. Oreku
To score these organizational security threats, we assessed different levels
of the security maturity: non-existence, ad-hoc, repeatable but intuitive,
managed and measurable, and finally optimized as indicated by Table 2
and later on the organization’s security knowledge and awareness such as
non-existence, poor, satisfactory, good, very good and excellent.
Furthermore, the Likert-type response anchors (Vagias, 2006) with four
possible answers - not at all, a little, quite a lot and completely with
compliance numeric value: -0,0.33,0.66 and 1 respectively were used for
testing the agreement of compliances of proposed organization’s policies
for attainment of appropriate security maturity level and security
awareness programs. Also, the conversion by (Pederiva, 2003) was used
to compute the normalized compliances for the purpose of assessing
organization’s maturity level and awareness (see Table 2). Thus,
predicting the potential organization’s threats to be High, Moderate or
Low for numeric values 3.33-5.0, 1.67-3.32 and 0.0-1.66 respectively.
104

Huria Journal vol. 27 (1), March 2020
Experiment Prototype and Results
After the design phase, the study adopted Web scripting languages and
MySQL for web interface and database implementation respectively. The
web interface was modeled very simply and intuitively to ensure easy
interactivity in security analytic and thus increasing the possibility for
wide adaptability across the organization structure. One of the
organizations was selected as a case study for experimental prototype
implementation. The selected organization has established Information
Communication Technology (ICT) policy and its associated ICT
information security policy for managing their information assets.
However, during data collection we found that its information security
policy was based on ISO27001:2005 and thus the controls do not evolve
based on organizational risks. Our study adopted ISO27001:2013
information security management framework which rolls based on
organizational emerging risks. However, the controls defined by the
organization’s information security policy were used in order to maintain
their existing policy structure. After this technical alignment, the data
collected in (Mbowe, 2013) during assessment of security awareness and
maturity levels were used as pilot data for testing the experimental
prototype while on development stage. The statics of the survey from five
companies are presented in the table 1 above.
105

A Rule-based Approach for Resolving Cybercrime in Financial Institutions: The
Tanzania case
George S. Oreku
Prototype Experimentation
The functions provided by the prototype were developed using PHP and R
scripting languages. The back-end operations (e.g., analytic engine) was
implemented by R scripting language R Core Team (2015) and MySQL
database engines. On the other hand, the front-end operations (e.g., web
interface for user interactions and data presentation) PHP scripting
language was used. The web interface was modeled to be very simple and
intuitive to ensure easy interactivity and thus increasing the possibility for
wide adaptability across the organization structure.
For experimentation purposes, the organization which was selected as a
case study had computer logs collected for analytics and visualization. The
output of the prototype is presented by the screen snapshots shown by
Figure 4. Our experiment was focused on Windows Logon by analyzing
different types of logon or logoff activities prompted by a particular event
and thus monitoring unusual logon/logoff for type 2, 3, 8 and 10. The
study found that, selected logon types may have high impact on security
when window policy configurations are inadequately configured. For
example, the check-indicator of each type is described in Table 3.
106
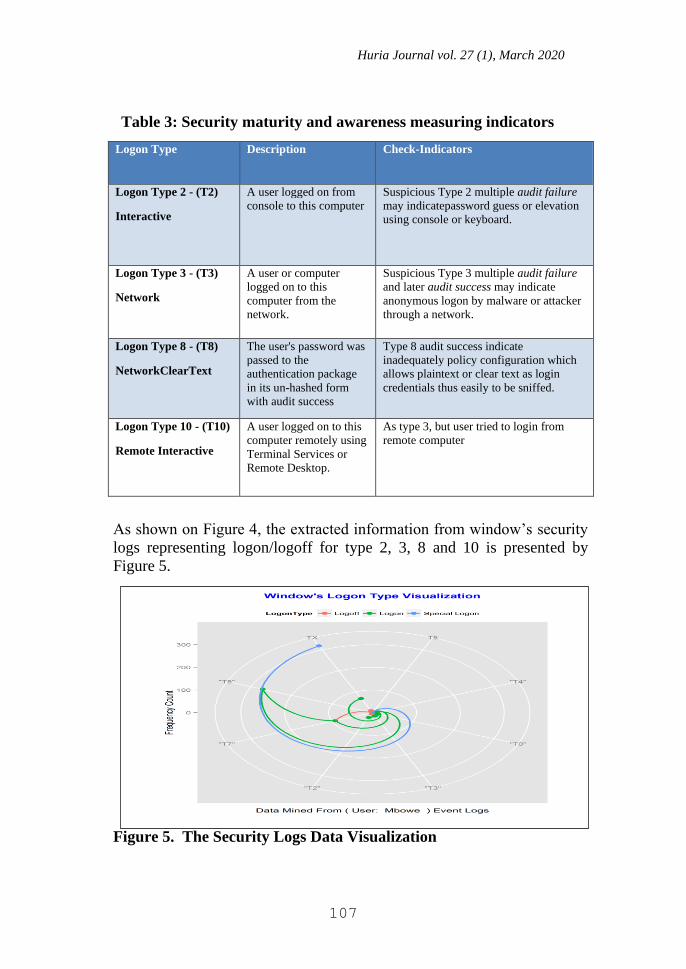
Huria Journal vol. 27 (1), March 2020
Table 3: Security maturity and awareness measuring indicators
Logon Type Description Check-Indicators
Logon Type 2 - (T2)
Interactive
A user logged on from
console to this computer
Suspicious Type 2 multiple audit failure
may indicatepassword guess or elevation
using console or keyboard.
Logon Type 3 - (T3)
Network
A user or computer
logged on to this
computer from the
network.
Suspicious Type 3 multiple audit failure
and later audit success may indicate
anonymous logon by malware or attacker
through a network.
Logon Type 8 - (T8)
NetworkClearText
The user's password was
passed to the
authentication package
in its un-hashed form
with audit success
Type 8 audit success indicate
inadequately policy configuration which
allows plaintext or clear text as login
credentials thus easily to be sniffed.
Logon Type 10 - (T10)
Remote Interactive
A user logged on to this
computer remotely using
Terminal Services or
Remote Desktop.
As type 3, but user tried to login from
remote computer
As shown on Figure 4, the extracted information from window’s security
logs representing logon/logoff for type 2, 3, 8 and 10 is presented by
Figure 5.
Figure 5. The Security Logs Data Visualization
107

A Rule-based Approach for Resolving Cybercrime in Financial Institutions: The
Tanzania case
George S. Oreku
Prototype Overview
The data visualization using the proposed prototype has shown that it can
be useful for leaders, systems administrators and security officers to keep
an “eye” on critical systems or computer attached to their cyberspace.
Also, the use of pictorial presentation of security logs based on logon
types have simplified the visualization of big data such as security logs
generated by Windows security logs. For example, the quick-scan of the
summary data showed that about 3% (238) of audit failure occurred
compared to 97% (7,920) of audit success for a given time interval.
Actually, if more Audit failure occurs, it gives an insight for further
follow-up to see what is happening in the background to ensure the
success or failure is not occurring due to attack through various security
loopholes. Also, the processed information presented by the radar graph
(see Figure 5) can be used for decision-making in regard to information
security management.
The platform also has demonstrated the practical ways for automation of
an organization’s information security policy for provision of effective
strategies for security management. It illustrates the extent of potential
inside threats and the user-compliance for a particular organizational
environment and culture. Furthermore, it’s of our opinion that, the greater
understanding of the security awareness across the organization structure
will be a catalyst for management accountability to enhance security
management. This proposed platform generates graphs and internal risks
notifications which can be the source of information for preparing the
effective security strategies including security seminars, workshops and
training so as to ensure all security domains are well covered to preserve
security confidentiality, integrity, accountability and availability.
The Key Findings of the Research
Whilst there was no clear consensus on the trends of cyber security in
Tanzania, there was a definite agreement that the top cyber security
breaches in Tanzania result from social engineering attacks such as
phishing, 419 scams, identity theft and unauthorized access. Breaches
resulting in financial fraud and embezzlement through internal collusion
and involving e-delivery channels such as ATMs, mobile channels and
the web were also rated high, particularly for the financial sector. The
third highest category of cyber security breaches is information asset
Research by Wolf Park, (2014). Perfecting the findings done previously
108

Huria Journal vol. 27 (1), March 2020
in (Oreku et al 2017, & Mbowe et al, 2016) to supplement the foundation
put forward. This paper has expanded to reflect the changing emphasis on
cyber security extent. Similarly, the small changes and improvements on
Theft through session hijacking, email hijacking and website hijacking
was also noted throughout. Moreover, respondents rated the internet as
the leading source of cyber security breaches in Tanzania, followed by
insider collusion, pharming and phishing. Furthermore, the research
identified the following results:
• An overwhelming majority of respondents selected social
engineering as the key cyber-attack method in Tanzania and also
identified malware and key loggers as other frequently used methods.
• For example, from the research conducted, about 92.1% respondents
indicated that their organizations had no effective strategies for
managing their ICT assets with regard to security breaches and only
41.2% respondents were aware of the existing security awareness
programs.
• According to other respondents, they were of the observation that
leading cyber vulnerability in Tanzania is the lack of user awareness
for both employees and customers. The vulnerabilities arising from
weak technical security practices such as poor patch management,
outdated anti-virus software and unsecured or misconfigured
networks were also highly rated as per our findings.
• According to the survey, the use of monitoring tools and other
detection mechanisms could be the principal way of detecting
cybercrime threats in Tanzania today. Customer reports also could be
the next most prevalent detection method. The use of internal audits
and routine staff checks are also key detection methods.
• As currently there is no accurate data addressing the cost of
cybercrime cost in Tanzania and most of the loss still goes
unreported, the respondents were only able to estimate a conservative
loss in excess of 892.18 billion Tanzanian Shillings on Cyber-crimes
by the year 2012 annually whilst noting that the key emerging threat
to cyber security in Tanzania today is related to e-delivery channels
(ATM fraud, mobile fraud & card holder data theft), followed by
social engineering attacks.
• However, it is estimated that governments could lose more than USD
50 billion to deal with the costs associated with malware on pirated
software by article “’Microsoft Reminds Consumers to be Vigilant to
avoid Unintentional Purchase of Counterfeit Software,” (2016)
• Respondents from financial institutions and telecoms sectors reported
109
A Rule-based Approach for Resolving Cybercrime in Financial Institutions: The
Tanzania case
George S. Oreku
having in-house staff with requisite Information Security training and
certifications. The in-house staff and external service providers used
to detect incidents and conduct investigations as experts; though the
number of these people was low and hence the need for more experts
was paramount.
• Our research also found that many Tanzanian organizations,
especially financial institutions, do not report many cybercrime
incidents, out of fear of reputation damage. Other reasons include a
lack of confidence in the ability of law enforcement agencies to
handle cybercrime incidents and the absence of consequences for not
reporting cybercrime.
• Many respondents noted the absence of a legal and regulatory
framework being in place as a glaring impediment to cyber security
in Tanzania. It was, however, noted that the Cybercrime Bill 2013 is
awaiting passage by the National Assembly. This bill, together with
the existing Task Force (comprising of members from Bank of
Tanzania (BoT), Tanzania Communication Regulatory Authority
(TCRA), Financial Intelligence Unit (FIU), Tanzania Bankers
Association (TBA) and the Police Force Cyber Crime Unit) will have
mandate to attain compliance to the ISO27001 and ISO27002
international standards and are regarded as the top initiatives to
develop and strengthen Tanzania’s legal and regulatory framework.
• Respondents also noted a number of key collaborative initiatives
aimed at addressing the cyber threat quandary include the Tanzania
Communication Regulatory Authority (TCRA), Police Force Cyber
Crime Unit, the UDOM Cyber project, and Professional Association
led initiatives. Most respondent organizations participate in various
public-private partnerships for the purpose of preventing and
detecting cybercrime. However, suggestions were made towards
collaborating on a National, Pan- African and International scale.
Moreover, respondents felt the need for research to drive these
initiatives and combat cybercrime as a whole and this should be
driven by public-private partnerships.
• According to the survey, the top skill sets needed in Tanzania are
computer and digital forensics, forensics investigation, cybercrime
prevention, detection and incident handling and technical ethical
hacking skills. Respondents felt that the training needs could best be
addressed by a National Cyber Security Training Task Force, in
conjunction with private training institutions, which should be
properly regulated and accredited.
110
Huria Journal vol. 27 (1), March 2020
• The study revealed cyber security related training received by
government and regulatory authorities is particularly deficient,
whereas, e-payment companies appear to receive adequate training in
this regard. Respondents identified various training interventions
ranging from general awareness to highly skilled information security
courses addressing incident response, attack and defense, secure
coding, ethical hacking and forensic investigation.
• An overwhelming majority of respondents do not believe Tanzania is
investing enough resources in mitigating cybercrime, although it was
noted that considerable investment had been made by Tanzania
Communication Regulatory Authority (TCRA), mainly in response to
its mandate.
• Most respondents agreed that there should be an inclusive large scale
and sustained national awareness campaign on cyber security across
the country addressing all stakeholder groups with an emphasis on
the key sectors of the economy and targeted at the top tier of
organizations.
Further Enhancements of the Prototype
Currently, the prototype includes threats associated with violation of
organization information security policy which used for experiment based
on ISO 27001:2005 security domains and sample data loaded for STRIDE
threats evaluation. However, further work is required to review the
existing policy to comply with ISO27001:2013 and also to integrate the
automatic assessment of vulnerabilities from security logs and known
loop holes associated with malware activities, unmanaged configurations,
active Trojan ports and security logs from big data (e.g., security warning
and error logs). As part of the future enhancements, the prototype could
be developed to be used in other types of threats as well as different
operating system apart from Windows only.
CONCLUSION
Cyber security is today without doubt, an issue of national concern
demanding urgent, focused and far-reaching measures to address it. Given
the results of this paper and lessons learnt on a global, regional and
national level we have identified one of the challenges in Tanzania is to
build a nation that is aware of the importance of information security. We
urge the passing and enforcement of the Cybercrime Bill 2013 to provide
a basis for securing the nation’s cyber space. Also, we recommend a
111
A Rule-based Approach for Resolving Cybercrime in Financial Institutions: The
Tanzania case
George S. Oreku
national CERT to be an initiative with private sector input. During
prototype testing; we selected one organization from five different
organizations which participated in the previous study to run the
prototype developed. The graphs generated for visual demonstration have
provide evidence that, the policies can be automated to support security
management based on pre-defined set of rules. The paper encourages the
adoption of global best practice standards, with a bias for information
security, on a national level to strengthen institutional controls, processes,
systems and skills. Taking the lead from the banking regulator, other
regulators should follow suit to adopt these standards within their sectors.
Taking the lead from the banking regulator, other regulators should
follow suit to adopt these standards within their sectors. Key sectors of
the economy such as telecoms, public sector, non-bank financial
institutions, oil and gas would be a priority as would-be emerging sectors
such as mobile and e-payment providers and large retailers.
REFERENCES
Anagement M, et al, (2010) “User Participation in Information
Systems,” vol. 34, no. 3, pp. 503–522
Bond M, Omar Choudary O, Murdoch S.J, Skorobogatov S., and
Anderso R., (2012) “Chip and Skim: cloning EMV cards with the
pre-play attack”, Computer Laboratory, University of Cambridge,
UK
Bank of Tanzania (2013), Monetary Policy Statement 2013/2014, ISSN
08556-6976.
Kato C.I, (2019) “Legal framework challenges to e-banking in
Tanzania”, Legal Department, Tanzanian President’s Office:
Public Service Remuneration Board, Dar es Salaam, United
Republic of Tanzania, PSU Research Review, ISSN: 2399-1747
Publication date: 29 August 2019
Co-operative Rural Development Bank (CRDB).
Dar es Salaam Commercial Bank (DCB).
Emily F. &, Tanya A., (2013) “Prepaid debit cards: a weak link in bank
security” May 11, 2013/8:37am, Accessed on 26 March, 2018
Feschetti M. and Lodi A, (2003) “Mathematical Programming” local
Branching, vol.98.
112

Huria Journal vol. 27 (1), March 2020
http://www.tech360magaz.com/2012/07/tanzania-lost-89218-billions-
on.html line, cited on July 2012.
Krisanthi G. A., Sukarsa I. M.,and Bayupati P. A.,(2014) “Governance
Audit of Application Procurement Using COBIT Framework,” J.
Theor. Appl. Inf. Technol., vol. 59, no. 2, pp. 342–351.
Lwoga T.E., & Lwoga N. B., (2017) “User Acceptance of Mobile
Payment: The Effects of User-Centric Security, System
Characteristics and Gender”, The Electronic Journal of
Information Systems in Developing Countries EJISDC, pgs 81, 3,
1-24
Mbowe J.E., Msanjila S.S., Oreku G.S, & Khamisi K. (2016) "On
Development of Platform for Organization Security Threat
Analytics and Management (POSTAM) Using Rule-Based
Approach", Journal of Software Engineering and Applications.
Mbowe J. E., I. Zlotnikova, S. S. Msanjila, and G. S. Oreku, (2014) “A
Conceptual Framework for Threat Assessment Based on
Organization’s Information Security Policy,” J. Inf. Secur., vol. 5,
no. October, pp. 166–177.
Mijatov S., Langer P., Mayerhofer T., and Kappel G, (2013) “A
Framework for Testing UML Activities Based on fUML.” in
MoDeVVa@ MoDELS, pp. 1–10.
Marginally N, (2015) “Think FICO is a credit scoring company?” Nope:
it’s about large-scale analytics”.
Mtanzania, a local newspaper, cited on July 26, 2013, page 6.
Microsoft Reminds Consumers to be Vigilant to Avoid Unintentional
Purchase of Counterfeit Software., (2015) Accessed on 28 may
2016.
Mwananchi Local Newspaper on Monday, cited on 16 July 2012.
National Microfinance Bank (NMB).
National Development Bank.
Oreku G.S, Mtenzi. F.J., (2017), "Chapter 6, Cybercrime: Concerns,
Challenges and Opportunities", Springer Nature, 2017.
Pederiva A., (2003) “The COBIT maturity model in a vendor evaluation
case,” Inf. Syst. Control J., vol. 3, pp. 26–29,
R Core Team (2015). R: “A language and environment for statistical
computing”, R Foundation for Statistical Computing, Vienna,
Austria, URL http://www.R-project.org/.
Researched by Wolf Park, (2014) “The Nigeria Cyber Threat
Barometer, report, https://www.wolfpackrisk.com/assets/docs/the-
2014-barometer-report.pdf, Accessed on 28 March 2018.
113

A Rule-based Approach for Resolving Cybercrime in Financial Institutions: The
Tanzania case
George S. Oreku
Sidel. R (2015) “Theft of debit-card data from ATMs soars, Thieves are
stealing information to make counterfeit plastic” The Wall Street
Journal, May 19, 2015 7:41 PM
Von Solms B. and. Von Solms R, (2004) “The 10 deadly sins of
information security management,” Comput. Secur. 23(5), 371–
376.
Vagias W. M., “Likert,. (2006) “Type Scale Response Anchors”
114

Huria Journal vol. 27 (1), March 2020
Fee-free Basic Education Policy Implementation in
Tanzania: A ‘Phenomenon’ Worth Rethinking
Richard Shukia
University of Dar es Salaam, School of Education
ABSTRACT
This paper is based on a study that employed qualitative research
methods to examine the implementation of the fee-free basic education
policy in Tanzania. The study reveals that, the policy is misapprehended,
and causing confusion and dissonance among key implementers
including heads of schools and parents, and it is threatening the quality
delivery of education. However, there is no doubt that the
implementation of the fee-free education policy has significantly
promoted access to basic education for children from various socio-
economic backgrounds. Thus, this paper argues that the implementation
of the fee-free basic education policy, albeit commendable, it is not a
panacea to achieving equitable access and quality education delivery for
all. Hence, the policy and its implementation is a ‘phenomenon’ worth
rethinking for Tanzania to realise equitable and quality universal basic
education.
Key words: Fee-free education policy, basic education, policy
implementation and Tanzania
INTRODUCTION
Tanzania attained independence in 1961. The Tanzanian government
recognises the value of investing in human capital in order to fight
diseases, poverty and ignorance among its citizens. Since independence,
various education-related reforms have been implemented to address the
challenges that undermine the education sector. The majority of the
reforms have been made as measures to express government’s
commitment to ensuring that all school-age children have access to basic
education (URT, 2014). The Tanzania’s government commitment and
efforts are evident in several international, regional and national
instruments to which Tanzania subscribes. These instruments include the
Universal Declaration on Human Rights (Article 26); the International
115
Fee-free Basic Education Policy Implementation in Tanzania: A ‘Phenomenon’
Worth Rethinking
Richard Shukia
Covenant on Economic, Social and Cultural Rights (Articles 13 and 14);
the Convention on the Rights of the Child (Article 28); the Convention on
the Elimination of All Forms of Discrimination against Women (Article
10); the Convention on the Rights of Persons with Disabilities (Article
24); the UNESCO Convention against Discrimination in Education
(Article 4); the ILO Convention 182 on the Worst Forms of Child Labour
(Preamble, Articles 7 and 8); the African Charter on the Rights and
Welfare of the Child (Article 11); and the African Youth Charter (Articles
13 and 16) (Right to Education Project, 2014).
Tanzania’s efforts to guarantee education for all are further informed by
the 1990 World Conference on Education for All, which set out a vision
for education and restated the goal of achieving Universal Primary
Education (UPE) by 2000 (UNESCO, 1990). However, by the year 2000,
many countries including Tanzania had failed to achieve UPE targets.
Consequently, the Dakar Framework for Action (DFA) (UNESCO, 2000)
and the Millennium Development Goals (MDG) restated formally what
was required. The DFA and MDG goals for education required
governments to ensure that, by 2015, all children, regardless of their
gender and geographical location, had access to and completed their basic
education. These goals required countries to implement strategies for
ensuring access to quality primary education for all children. These goals
were further refined in the Sustainable Development Goals (SDGs). One
of the SDG education targets is that all nations should ensure that all girls
and boys complete free, equitable and quality primary and secondary
education, leading to relevant and effective learning outcomes by 2030. In
this light Tanzania introduced a fee-free basic education policy that aimed
at narrowing the gap for the vulnerable children who shortfall in attaining
basic education down to incapacity of their families to afford paying for
education expenses.
Fee-Free Basic Education in Tanzania: The Past and Present
Contexts
Tanzania has committed itself to ensuring access to education for all
school-age children since independence. Immediately after independence,
in 1963, school fees were abolished in all secondary schools. This
initiative aimed at reducing the disparity in enrolment based on income
(Cameron and Dodd, 1970), and providing opportunity for children to
116

Huria Journal vol. 27 (1), March 2020
study from primary school up to university level without paying any fees.
In the 1970s, however, Tanzania, like many other developing countries,
experienced economic instability due to the higher oil prices, among other
factors. In response to this devastating problem, the World Bank and IMF
introduced a Structural Adjustment Programme (SAP) for which
Tanzania was among the countries to accept (Daven, 2008). Among other
things, the programme required Tanzania to cut its spending on the social
sectors in order to reduce its budget deficit. Consequently, public
expenditure on education declined by a quarter from 1975 to 1990
(UNICEF, 1990). In the 1980s, however, the demand for cost-sharing in
education increased due to educational deterioration and pressure from
the international financial institutions. This led to a gradual increase in
households’ contributions and the re-introduction of enrolment fees in
1995 (Daven, 2008). In the early 2000s, however, fees for primary
education were abolished as a result of the implementation of the Primary
Education Development Plan (PEDP) 2002-2006. One of the key PEDP
components was to expand primary school enrolment by ensuring that all
children aged 7-12 years old were enrolled into standard one by 2004. To
achieve this enrolment target, PEDP abolished tuition fees and other
mandatory cash contributions from parents from January 2002 (URT,
2004). A United States of America (USA) dollar ($10) equivalent to Tshs
10,000 annual capitation grant per pupil was provided by the government
to offset primary school-related costs, although parental contributions
were also in place to meet additional school running costs. There was no
specific amount of contribution set officially. Schools and parents,
through school committees or boards, decided how much parents should
contribute to the schools depending on the various needs that were also
determined, for example, by the location of the school—urban or rural.
In 2002, the Gross Enrolment Ratio (GER) and Net Enrolment Ratio
(NER) in primary schools stood at 98.6% and 80.7%, respectively. The
enrolment rate was higher than that in 2000 by almost 20% and 21%,
respectively. In 2007, the GER and NER increased to 114.4% and 97.2%,
respectively. This gain, however, was not maintained. Since 2010,
progress in increasing access to standard one has been marginal. In 2013,
for example, the NER slipped to 89.7%. This implied that Tanzania might
no longer be on track towards achieving universal education by 2015
(URT, 2015). According to the MoEST and UNICEF (2016) out of school
children report, only 31.7% of pre-primary school-age children were
attending school.
117

Huria Journal vol. 27 (1), March 2020
About 2 million primary school-age children and 1.5 million lower
secondary school-age children were out of school in Tanzania. Of these,
1.7 million children of primary school age and 400,000 of lower
secondary school age had never attended school. The report identified
several reasons for children being out of school, and poverty was
identified as one of the key reasons why many children do not attend
school. Further, the report suggested that the indirect costs of schooling
were high (MoEST and UNICEF, 2016), which might be an obstacle for
parents to enrol and keep their children in school. In 2014, the Tanzanian
government introduced a revised Education and Training Policy (ETP) to
replace that instituted in 1995. The 2014 policy advocated “Fee Free
Basic Education”, which means that every child would have access to fee-
and contribution-free basic education (URT, 2016).
Up until 2015, the formal education system in Tanzania reflected a 2–7–
4–2–3+ structure, encompassing two years of pre-primary (non-
compulsory) education, seven years of compulsory primary education
(Standards I to VII, for children aged 7 to 13 years), four years of fee-
paying lower secondary education (O-Level Forms 1 to 4, for children
aged 14 to 17 years), two years of fee-paying upper secondary education
(A-Level Forms 5 and 6, for youths aged 18 to 19 years) and three or
more years of higher education. The formal education system was
recently restructured to 1-6-4-2-3+ (URT, 2014). This reform has
expanded the compulsory basic education from seven to 11 years,
including one year of compulsory pre-primary education. Nevertheless,
the reform is yet to be accommodated in the Education Act, which will
enshrine it into Tanzania’s law. In the meantime, the former structure
remains, although the one year of pre-primary education has been
accommodated. In the context of this paper, therefore, the fee-free
education policy applies to the 11 years of compulsory basic education
(URT, 2014). Following the policy statement on fee-free basic education,
the Government Circular No. 5 (URT, 2015a) was established to
formalise the government’s commitment to providing fee-free basic
public education, as stipulated in the Education and Training Policy of
2014. The Circular also provided directives to corresponding public
bodies to ensure that primary and secondary education is free.
Significantly, the circular releases parents from all contributions, as it
reads: “The provision of free education means pupils or students will not
pay any fee or other contributions that were being [made] by parents or
guardians before the release of the new circular”.
118

Fee-free Basic Education Policy Implementation in Tanzania: A ‘Phenomenon’
Worth Rethinking
Richard Shukia
Following the issuance of this circular, the government released grants
amounting to Tshs 49,173,165,000 for the 2015/2016 academic year. Of
the total amount, 64 percent was set aside for primary schools while 36
percent was earmarked for secondary schools. Consistent with the
previous fee- and contribution-free primary education, the current fee-free
basic education initiative exempts parents with children in public primary
schools from paying tuition fees and making other school-related
contributions. In addition, the initiative extends to public secondary
schools at the ordinary level (Form 1 - 4). This is in recognition that fees
place a burden on parents, a condition which limits the maximization of
school enrolment. The fee-free basic education funding that the
government provides for primary schools is Tshs 10,000 per child per
year. Of this amount, 60% (Tsh 6,000) is transferred directly from the
Treasury into the school’s accounts, whereas 40% (Tshs 4,000) is retained
by the government for the purchase of textbooks. The capitation grant set
for secondary schools is Tshs 25,000 per student per year. Of this amount,
only Tshs 12,500 is expected to be transferred direct to a school.
Furthermore, the government compensation for day and boarding
secondary school tuition fees is set at Tshs 20,000 and Tshs 70,000 per
student per year, respectively. The cost of meals at boarding schools
amounts to Tshs 405,000 per student per year. Of the funds transferred to
schools, the utilisation distribution is as presented in Table 1.
Table 1: Utilisation Distribution of Capitation grants transferred to
public schools
Primary School Secondary School
Administration 10% Academic purposes 30%
Maintenance 30% Continuous assessment 15%
Materials 30% Office expenses 35%
Sport 10% Minor repairs 10%
Examinations 20% Medicine and expenses related to female
students 10%
Source:(URT, 2015b)
As Table 1 shows, the expected utilisation of the funding for primary and
secondary schools differs in terms of the associated items and amounts.
Some items receive a greater allocation than others. For clarity and to
support the effective implementation of fee-free basic education, the
119

Huria Journal vol. 27 (1), March 2020
Tanzanian government has issued a series of circulars: Education Circular
No 5 (URT, 2015a) (issued on 27 November 2015); Education Circular
No. 6 of 2015 (URT, 2015b) (issued on 10 December, 2015); and
Education Circular No. 3 of 2016 (issued on 25 May 2016) and (URT,
2016). Despite Circular No. 5’s provisions, tension and mixed feelings
about fee-free basic education existed among education stakeholders,
including parents, with some perceiving it as precluding making parental
contributions for their children’s education altogether. As a result, the
government issued circular No. 6 (URT, 2015b) to clarify the role of
parents with regard to fee-free public basic education. The circular,
among other things, states that parents should meet the costs for the
following items:
i. School uniforms and uniforms for sports activities; learning
materials such as books, pens and pencils
ii. The provision of food for children attending day schools (in co-
operation with the school leadership);
iii. Medical expenses for the child, and travel expenses for both day
and boarding school pupils; and
iv. Mattress, bed-sheets, and personal hygiene materials for boarding
schools’ pupils and for those staying in government-owned
hostels.
In addition, the parents are obliged to provide information where practices
contradict the spirit of the provision of fee-free basic education. These
clarifications notwithstanding, confusion persists within a cross-section of
the public, particularly among the low-income groups. As a result, the
government issued another directive, Circular No. 3 of 25th May 2016, to
provide further clarification and list the responsibilities of the various
stakeholders: the Ministry of Education Science and Technology
(MoEST); the President Office-Regional Authority and Local
Government (PO-RALG); the Regional and District Commissioners; the
District Executive Directors (DED); the school committees/boards; the
heads of schools; and the parents. Overall, the responsibilities range from
issuing circulars to guide the implementation of the policy, reimbursing
capitation grants, planning, budgeting for capitation grants at various
levels, monitoring the implementation of the policy, and taking legal
action in cases of poor policy implementation (URT, 2016).
Capitation Grants Releases, 2015/16 – 2017/18
The available information reveals that the budget allocation to the
120
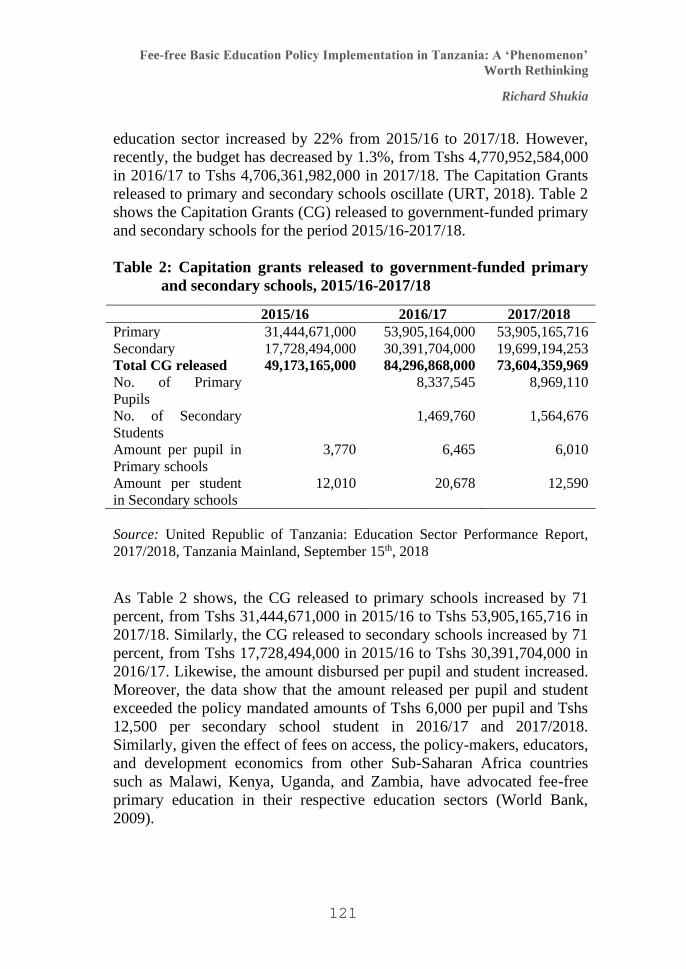
Fee-free Basic Education Policy Implementation in Tanzania: A ‘Phenomenon’
Worth Rethinking
Richard Shukia
education sector increased by 22% from 2015/16 to 2017/18. However,
recently, the budget has decreased by 1.3%, from Tshs 4,770,952,584,000
in 2016/17 to Tshs 4,706,361,982,000 in 2017/18. The Capitation Grants
released to primary and secondary schools oscillate (URT, 2018). Table 2
shows the Capitation Grants (CG) released to government-funded primary
and secondary schools for the period 2015/16-2017/18.
Table 2: Capitation grants released to government-funded primary
and secondary schools, 2015/16-2017/18
2015/16 2016/17 2017/2018
Primary 31,444,671,000 53,905,164,000 53,905,165,716
Secondary 17,728,494,000 30,391,704,000 19,699,194,253
Total CG released 49,173,165,000 84,296,868,000 73,604,359,969
No. of Primary
Pupils
8,337,545 8,969,110
No. of Secondary
Students
1,469,760 1,564,676
Amount per pupil in
Primary schools
3,770 6,465 6,010
Amount per student
in Secondary schools
12,010 20,678 12,590
Source: United Republic of Tanzania: Education Sector Performance Report,
2017/2018, Tanzania Mainland, September 15th, 2018
As Table 2 shows, the CG released to primary schools increased by 71
percent, from Tshs 31,444,671,000 in 2015/16 to Tshs 53,905,165,716 in
2017/18. Similarly, the CG released to secondary schools increased by 71
percent, from Tshs 17,728,494,000 in 2015/16 to Tshs 30,391,704,000 in
2016/17. Likewise, the amount disbursed per pupil and student increased.
Moreover, the data show that the amount released per pupil and student
exceeded the policy mandated amounts of Tshs 6,000 per pupil and Tshs
12,500 per secondary school student in 2016/17 and 2017/2018.
Similarly, given the effect of fees on access, the policy-makers, educators,
and development economics from other Sub-Saharan Africa countries
such as Malawi, Kenya, Uganda, and Zambia, have advocated fee-free
primary education in their respective education sectors (World Bank,
2009).
121
Huria Journal vol. 27 (1), March 2020
They have raised concerns that the fees are acting as a financial barrier to
education. Thus, the abolition of fees would make it easier and less costly
for school-age children to enrol in school (USAID, 2007). The available
information reveals that enrolment increased significantly in countries
where school fees were abolished. In Uganda, for example, the enrolment
nearly doubled in the year after the fees were abolished. Similar increases
in enrolment following the abolition of fees were noted in Kenya, Malawi
and Zambia, to mention but a few. We further learn that enrolment in
those countries increased most rapidly among the most disadvantaged
children, including girls, orphans and children in rural areas (USAID,
2007). Few would dispute that removing school fees might reduce a
significant burden from poor families but it may not be a panacea since
the practice may not bring the schooling cost to zero. Even if school fees
are abolished, poor and vulnerable children may still face barriers to
obtaining an education due to the indirect education-related costs that
many households face. Thus, school fees’ abolition alone may not
necessarily lead to improved accessibility. Other factors need to be
considered if the gains made due to the fees’ abolition policy and practice
are to be consolidated and sustained (USAID, 2007). The initiative of the
Tanzania government to provide fee-free basic education has received
both national and international attention and, indeed, commendation.
However, much remains unknown about how various stakeholders
perceive and translate the fee-free basic education policy into practice.
We also know little about the impact of the policy implementation within
the teaching-learning processes. This study, therefore, aimed to explore
the education stakeholders’ perceptions and understanding of the fee-free
basic education policy and how this policy is translated into practice.
This study is informed by the top-down perspective on policy
implementation, which assumes that the policy’s goal can be specified by
policy-makers and successfully implemented by setting up firm
machinery (Paudel, 2009) for implementation. This perspective stresses
the formal handling of problems and issues, which can easily be
manipulated, centralised and controlled. Of interest are things such as
funding formulae, formal organisational structures and authority
relationships between the administrative units, plus regulations and
administrative controls, such as budgets. In this context, policy
implementation begins at the top of the process as an authoritative
decision, with a clear statement of the policy-makers’ intent, then
proceeds through a sequence of increasingly more specific steps to define
what is expected of the implementers at each level (Matland, 1995;
122
Fee-free Basic Education Policy Implementation in Tanzania: A ‘Phenomenon’
Worth Rethinking
Richard Shukia
Paudel, 2009). The top-down approach, however, fails to recognise the
complex implementation structures, placing exclusive emphasis on the
framers of the policy as the key actors. Further, this approach neglects the
reality of policy modification at the hands of the implementers, and it also
assumes that all priorities are known. Moreover, the top-down approach
can lead to resistance, disregard and pro forma compliance (Paudel,
2009).
METHODOLOGY
The study was informed by the qualitative research approach. This
research approach allowed the collection of detailed, comprehensive
information on the research topic. Data for the study were collected from
seven districts on mainland Tanzania that were conveniently selected, one
from each of the seven educational zones spread across the country. The
inclusion of one district from each educational zone was necessary in
order to facilitate a comprehensive understanding of the implementation
of the fee-free education policy from zones containing diverse socio-
economic backgrounds. For each district, eight schools (four primary and
four secondary) were randomly selected. Thus, a total of 56 schools (28
primary and 28 secondary) were sampled to participate in this study. All
of the sampled primary schools were day schools while 5% of the
secondary schools were boarding schools.
The study involved 339 participants, consisting of seven District
Executive Directors, seven District Council Chairpersons, seven District
Education Officers, 56 school committee/board chairpersons, 56 heads of
schools, 112 teachers, and 84 parents. The district officials and heads of
the schools were purposively recruited to participate in the study. On the
other hand, the teachers were randomly selected from their respective
schools whereas the parents were conveniently recruited based on their
availability and consent. The heads of the schools helped to convene the
parents with children in their respective schools.
The study employed interviews and focus group discussion techniques to
generate information. Interviews were conducted with the district
officials, heads of schools, and school committee/board chairpersons. A
total of 28 focus group discussions (FGDs) were conducted. Four FGDs,
two with parents (one with parents with children in primary school and
one with parents with children in secondary schools) and two with
123

Huria Journal vol. 27 (1), March 2020
teachers (one with primary school teachers and one with secondary school
teachers) were conducted in each participating district. In addition, the
study employed content analysis of relevant documents. These documents
included the Education and Training Policy (2014), Basic Education
Statistics of Tanzania, 2012-2016 and 2017 and fee-free basic education-
related circulars. All of the interview and FGD sessions were conducted
and audio-recorded using Kiswahili, which is the language of the majority
of people in Tanzania. The data was later transcribed and translated into
the English language. The analysis of the data was informed by a thematic
analytical approach. The analysis proceeded through three main steps:
preparing and organizing the data; creating the themes; and coding. The
preparation and organization of the data for analysis started during the
fieldwork. This involved listening to each audio-recorded interview and
focus group discussion session. This enabled the researcher to become
familiar with the data. This process was followed by a verbatim
transcription of the interview and focus group discussion proceedings.
Thereafter, the themes were generated inductively. After creating the
themes, the transcripts were re-read for coding, which involved
associating the data with the themes created.
FINDINGS
Understanding of Fee-free Basic Education
The findings showed that, generally, among the study participants, there
was confusion and even some misunderstanding regarding what the fee-
free basic education policy meant. When asked what they understood
regarding fee-free basic education, 40 percent of the heads of schools, for
example, said that it entailed the government meeting the total cost of
basic education whereas 23 percent of the heads of schools reported that it
meant providing education without paying school fees only. About 32
percent of the other heads of schools understood fee-free basic education
as involving parents making a partial contribution to the basic education
sector. Furthermore, only about half of the parents expressed that fee-free
basic education policy frees parents from paying all expenses related to
their children’s public-school education. This implies that half of the
parents involved in this study understood fee-free basic education policy
as constituting freeing parents from paying fees or making any other sort
of financial contribution to their children’s education whatsoever.
124

Fee-free Basic Education Policy Implementation in Tanzania: A ‘Phenomenon’
Worth Rethinking
Richard Shukia
The Capitation Grants Received are Insufficient to Meet all Schools’
needs
The findings reveal variations in the amount of grants that the schools
received. Some schools reported receiving less than the expected amount
while others, the secondary schools in particular, received slightly more
than they had anticipated. Nearly all of the heads of schools complained
that the capitation grants they received were inadequate to meet the basic
school requirements. In particular, the heads of schools were concerned
about the amount of funding they received for academic and
administrative purposes. For administrative purposes, the secondary
schools used the funds received to produce identity cards for the students
and teachers, buy files and other stationery, and pay for electricity and
water as well as security guards. Similarly, the heads of primary schools
explained that the funds were inadequate to meet sports, administrative,
examination expenses and repair needed at their schools. In fact, some
heads of schools added that the funds they received, were on the basis of
the number of children enrolled in their schools, failed to meet the
school’s needs, which varied depending on the school’s location and
socio-economic factors in the respective school communities. In this
regard, they suggested financing each school differently. One of the heads
of schools, for example, commented:
I fully support fee-free education. However, I feel that it is unfair to
treat all schools in the same way. The allocation [of funds] should
not be based on the number of students but on the school plan.
Each school has particular needs that differ from those of other
schools, which need to be considered. For example, the amount
allocated for examinations and repairs is insufficient.
Administration requires travel, but this has stopped now as there
are no funds for that provision.
Furthermore, the heads of schools reported that, due to inadequate
funding, some crucial school aspects had suffered, such as decreased
attendance of the school committee/board members at school
committee/board meetings, as there were no funds allocated to cover
allowances or travel costs. Moreover, the schools failed to provide mid-
day meals for their students as no funds had been allocated for this
purpose. The district officials (DEOs) also raised concerns about the
inadequacy of the funds dispensed to the schools. One DEO, for example,
125

Huria Journal vol. 27 (1), March 2020
stated, “the amount for administration that schools receive is inadequate.
Many schools have reduced the number of security guards they employ”.
Strict Adherence to School Capitation Grant Guidelines
The study found that strict government guidelines exist on how the
capitation grants received by the schools should be used. These guidelines
were issued concurrently with Ministry circular No. 6 of 2015. All of the
heads of schools explained that they were using the funds strictly
according to the guidelines, and that there was no room for modification.
The heads of schools had reservations regarding the guidelines, as they
instructed the schools to spend funds on specified items only. The
guidelines on the use of the funding restricted the heads of schools from
modifying the use of the funds for the benefit of the schools and students.
For example, some schools had a farm as an income-generating activity,
but this could not be continued as there were no funds allocated for the
purpose. One of the heads of schools, for example, asked, “Under what
line item will the expenditure on buying seeds and buying tools for
farming be located?” It was explained that, among other things, farms
were used to produce food to provide mid-day meals for the children in
schools.
Parents’ Contribute to Supplement the Capitation Grants
Data analysis revealed that 70 and 61 percent of the heads of schools and
teachers, respectively, and more than half of the parents indicated that
parental contributions were necessary because of the inadequate and
inequitable education spending on the part of the government. Indeed,
despite the implementation of fee-free basic education, many of the head
teachers, teachers and parents still embraced the idea of supporting the
government in financing basic education delivery. Moreover, the study
findings reveal that nearly all of the participants across the different
categories reported that the implementation of fee-free basic education
had reduced the parents’ direct contributions to education costs.
However, some parents still contributed in order to supplement the funds
received, and 50 percent of the participants agreed that parents continued
to bear a considerable share of the expenses related to the basic education
of their children. The participants reported that the parents contributed
towards meeting the school security, meal programmes, classroom
construction, and internal examinations-related costs. Parents with
children in Standard VII contributed to their children’s ‘camping’ for
126

Fee-free Basic Education Policy Implementation in Tanzania: A ‘Phenomenon’
Worth Rethinking
Richard Shukia
study. It was reported that towards examination, standard seven classes
were put in camps to study. Camps were organized in schools by the
schools. They were residential camps, whereby pupils stayed in camps a
few months before Primary School Leaving Examination months to
prepare for their examination. In the camps students were taught and
subjected to revisions and tests/examinations locally organized. These
camps were supported through parents’ contributions both, in monetary
and non-monetary terms. Monetary contributions were reported to range
from Tshs 1,000 to 5,000 per pupil per camp. This contribution was used
to buy food and teachers’ token appreciation. In addition to money, the
parents also contributed non-monetary items, such as maize and beans.
The overall views of the head teachers and teachers regarding the parents’
contribution have been captured by the following statement by one of the
head teachers, who remarked;
The government should allow parental contributions for specific
items…There are parents who are more than willing to contribute
to ensure that their children get proper education and do well in
examinations…There is a need for flexibility in the policy. Applying
it rigidly will do more harm than good. There are areas in which
parents can contribute. For example, the toilets in some of the
schools are unusable and money to carry out major renovations is
not forthcoming from the government. Parents should contribute
and solve such problems. How do we handle a case where a student
breaks a desk? Should the parent not be required to pay for its
replacement?
In other words, the parents were willing to contribute and wanted the
government to allow such parental contributions to supplement the
funding that the schools received from the government. In addition, the
parents found the guidelines for regulating the utilisation of government
funding rigid and, hence, called for some flexibility.
Impact of the Fee-free Basic Education Policy on Teaching and
Learning
Trends in School Enrolment
The findings revealed that enrolment at the primary schools assessed in
this study increased by 41 percent, from 3,278 in 2015 to 4,989 in 2016.
For secondary schools, the enrolment increased by 0.3 percent. In 2016,
the projected maximum number of 200 pupils was achieved, and the
actual enrolment was 285, an increase of 43 percent of the expected
127

Huria Journal vol. 27 (1), March 2020
enrolment. Dissimilarly, national data revealed decrease enrolment of
Standard One pupils in government streams. In 2017, for example,
Standard One enrolment decreased by 2.6 percent whereas, in 2018, the
decrease was 10.2 percent, from 2,016,579 in 2017 to 1,810,814 in 2018.
Although national enrolment data for 2015 were missing, there was a
sharp increase in enrolment from 1,464,376 in 2014 to 2,070,880 in 2016.
Total enrolment of pupils in Standard I-VII has increased by 7.9 percent
from 8,639,202 pupils in year 2016 to 9,317,791 pupils in year 2017(URT
2017). Similarly, in 2017 to 2018 increased by 8.5% from 9,317,791
pupils in year 2017 to pupils 10,111,671 in year 2018 (URT 2018).
Furthermore, the national data show that enrolment in Government
Primary Schools increased by 13.8% from 10,111,671 pupils in year 2018
to 10,605,430 pupils in year 2019. (URT 2019), this increase might be
attributed to the implementation of compulsory and fee-free basic
education (PO-RALG, 2017). Moreover, the study found that fee-free
basic education had also increased access to education among children
from poor families and those with special needs. Nearly all of the
participants reported that the fee-free basic education policy had increased
the school enrolment of children from poor families and children with
special needs, and some of the participants stated that it had reduced
delayed entry into school. An analysis of the national data revealed that
the enrolment of children with disabilities fluctuated. In 2014, the
enrolment decreased by 24 percent, from 30,433 in 2011 to 24,541 in
2014. In 2016, however, the enrolment of children with disabilities
increased by 50 percent, from 24,541 in 2014 to 37,034 in 2016.
Furthermore, the participants were of the view that cases of dropout had
slumped in the schools and even those who had dropped out had returned
to school. In an interview, one DEO said, “The fee-free policy has led to a
decrease in student dropouts. The policy has led to an improvement in
girls’ continuing with their education”.
Declining Teaching-Learning Quality Indicators
The parents and heads of school reported that the fee-free basic education
policy had brought substantive benefits and also had an impact on the
teaching and learning process, although a good number of the participants
feared that its implementation had somewhat compromised the quality of
teaching and learning. For example, 55.3 percent of the heads of schools
and 36.3 percent of the teachers agreed that the “Introduction of fee-free
basic education compromises the quality of education”. Furthermore, 40
percent of the head teachers and 60 percent of teachers indicated that the
128
Fee-free Basic Education Policy Implementation in Tanzania: A ‘Phenomenon’
Worth Rethinking
Richard Shukia
fee-free basic education policy was likely to affect the academic
performance of learners negatively. The majority of the participants
further reported that the fee-free basic education policy had resulted in
overcrowded classrooms. For instance, the teacher-pupil ratio (TPR) in
Standard One stood at 1:164 in 2016 compared to the average of a 1:99
teacher-pupil ratio in 2015 in the primary schools visited.
Furthermore, the introduction of fee-free basic education was reported to
have increased the teachers’ workload, with only 10 percent of the
teachers agreeing that this policy had improved teacher productivity and
motivation. The teachers further stated that the implementation of the
policy had translated into a surge in the number of pupils, a shortage of
resources, and an increased workload for them, without any attendant
positive outcomes for them as teachers. Although more children were
enrolled in schools, the number of classrooms and teachers remained the
same. In 2016 and 2017, for example, the pupil classroom ratio was 1:77
and 1:73, respectively, compared with the standard of 1:45 at the national
level. Similarly, one of the teachers lamented:
The fee-free education policy is good as it allows children from
poor families to access primary education. It reduces the financial
burden on poor families. The fee-free education benefits parents,
but what does it do for us? Our workload has increased without
concomitant adequate compensation.
In one of the interviews, a head of school reported that fee-free basic
education would affect the quality of the teaching and learning process,
pointing out that:
In previous years, we had panels for different subjects. These
teachers used to meet and discuss how to improve the teaching of
these subjects. These teachers were provided with transport and
meal allowances. We cannot do that now. Similarly, the heads of
schools cannot attend meetings of all heads as there is no budget
for that…we’ve been instructed that we can’t use school funds to
pay for…travelling allowances.
The findings suggest that the introduction of fee-free basic education is
commendable. However, it has led to overcrowded classrooms and
increased teacher workload without increase of extra manpower.
129

Huria Journal vol. 27 (1), March 2020
Implicitly, the quality of the teaching and learning processes and learning
outcomes are most likely under threat.
Parental Withdrawal and Relinquishing Responsibility for their
Children’s Schooling
The findings further reveal that, previously, the parents had been
contributing to their children’s mid-day meals at school. In one primary
school, for example, the parents were contributing up to Tshs 10,000 for
meals for each pupil per year. In some schools, the parents contributed
maize and beans to be used for school meals. However, it was reported
that, due to the fee-free policy’s implementation, the parents in many
schools had withdrawn their contribution for meals, believing that the
government now funds for the supply of these items. Moreover, due to the
implementation of the fee-free basic education policy, many parents were
increasingly relinquishing responsibility for the education of their
children. Their attendance at school meetings was falling. As one of the
heads of schools, for example, succinctly stated:
Free education has meant that parents have left the entire
responsibility for the education of their children squarely on the
government’s shoulders. Recently, we convened a meeting of
parents…to discuss how to improve the children’s performance.
Out of 28 parents, only three turned up for the meeting! In the past,
most parents would have come.
Similarly, another head of school stated that there were positive aspects of
the previous policy that allowed parents easily to contribute viably to their
children’s education,
The previous policy created a relationship between parents and
schools, and the parents realised that they have a responsibility for
their children’s education by ensuring that the schools functioned
properly. I saw the greater involvement of parents; this, I believe,
was very positive.
Another head of school commented,
In the past, parents used to come to school to ask how their
children were progressing at school. With the implementation of
fee-free education, the parents seem to feel that they have no
responsibility at all for the education of their children. Hardly any
parent comes to enquire about the progress of his or her children.
130

Fee-free Basic Education Policy Implementation in Tanzania: A ‘Phenomenon’
Worth Rethinking
Richard Shukia
The overall impression is that the parents’ engagement with their
children’s schooling has declined due to a belief that the government’s
fee-free basic education was taking care of everything. This
misconception threatens the parents-teachers/school accountability
relationship, which could be detrimental to the quality delivery of
education and, hence, the country’s overall quality education provision in
the long-run.
DISCUSSION
Few, if any, would dispute the value of the government’s fee-free basic
education policy initiative. This study’s findings show that the abolition
of fees at the primary school level has resulted in a surge in enrolment in
pre-primary classes and Standard One. This positive outcome is
consistent with the results of the PEDP, when Tanzania experienced
heightened enrolment following the reduction in primary school fees.
Similar experiences have been recorded in Ethiopia, Ghana, Kenya,
Malawi, and Uganda (World Bank, 2009). Moreover, education fees’
abolition in 2005 in Burundi led to a sharp drop in the percentage of
primary school-age children who had never attended school. Similarly,
several studies have found that the elimination of school fees at the
primary school level has resulted in an upswing in the enrolment of
disadvantaged groups (World Bank, 2009). Furthermore, fee abolition has
reduced the number of cases of delayed entry into schooling, incentivised
enrolment and reduced the dropout rate, particularly for girls and children
in rural areas. Cumulatively, these feats help to foster equity within
Tanzanian access to education. Despite the positive aspects that the policy
has engendered, several concerns related to the policy’s implementation
have been noted in this study. The sudden increase in enrolment, for
example, was incongruent with the available resources, which remained
highly limited and threatening the quality of teaching and learning
processes. There has also been an increase in high teacher-pupil ratio, as
well as complaints that schools were suffering due to a shortage of
classrooms, desks, teachers and other teaching and learning resources.
Almost all of the heads of schools, parents, teachers, and school
committee/board members reported shortages of this nature. Moreover,
the teachers reported that the execution of the fee-free education policy
had also increased their workload and led to overcrowded classes, with
the policy failing to offer teachers tangible benefits in return for their
investment in terms of labour and added responsibilities.
131
Huria Journal vol. 27 (1), March 2020
Without remedial action, these negative feelings might reduce the
motivation of the teachers, which could threaten education delivery, and
consequently undermining teaching and learning outcomes. This surge in
enrolment has created quality problems in schools. Tanzania, however, is
not unique in this respect. In many countries where fee-free education has
been implemented, the quality indicators have been negatively impacted.
In Malawi, for example, the pupil to classroom ratio increased to 119:1,
the pupil to teacher ratio increased to 62:1, and the pupil to textbook ratio
increased to 24:1 (World Bank, 2009). There is a solid body of evidence
from around the world that suggests that the single most important factor
in children’s educational success is effective teachers. A likely
consequence of the surge in enrolment is a dramatic rise in the number of
pupils per teacher. Many of the teachers in the study cited the large
number of pupils that they had to teach as a major concern. Asking
teachers to work with twice as many students is likely to lead to academic
failure for many students, most notably the poor and vulnerable children
who are the supposed beneficiaries of the abolishment of school fees. The
deterioration of the quality indicators of primary education delivery is
signaled by an increase in the number of children who repeat grades, the
lower grades in particular. For example, the number of repeaters in
Standard One, increased by 20 percent, from 141,585 in 2015 to 170,234
in 2016, compared with a 15 percent increase from 2014 to 2015. The
increase in the number of repeaters is associated with pupils’
incompetency in reading, writing and arithmetic. This might subsequently
prove costly in the long-run. We might experience this in the near future,
from 2021 onwards, when the first cohort of the 2016 fee-free basic
education beneficiaries are expected to graduate from primary education.
Despite the surge in enrolment that is attributable to the implementation
of fee-free basic education, further analysis revealed that 9 percent of the
population of primary school age children (aged 7-13 years) were out of
school (URT, 2018), a decrease in enrolment and a persistent dropout
rate. In 2017, for example, standard one enrolment decreased by 3
percent, from 2,070,823 in 2016 to 2,016,579 in 2017 (MoEST,
2016/2017). Similarly, in 2016, the number of dropouts was higher for
Standards One, Three and Six, at 27,087, 20,178, and 20,468,
respectively, compared with 11,947, 16,587 and 15,758 in 2015 (PO-
RALG, 2017). There was, however, a decrease of about 3 percent in the
dropout rate, from 9 percent in 2015 to 6 percent in 2016. Among other
things, the decrease in enrolment and rise in the dropout rate could be
attributed to the considerable indirect costs that parents incur with regard
132
Fee-free Basic Education Policy Implementation in Tanzania: A ‘Phenomenon’
Worth Rethinking
Richard Shukia
to their children’s education (MoEST and UNICEF, 2016). According to
Education Circular No. 3 of 2016, the parental responsibilities include
covering the cost of items such as: school and sports uniforms; exercise
books and pens/pencils; health expenses; and contributions towards mid-
day meals for day students and for those in hostels. For those at boarding
school, these costs include: mattresses; sheets; personal hygiene
materials; and transport to and from the school. The annual cost of these
indirect items for a primary school pupil might amount to Tshs 72,000 for
girls and Tshs 50,000 for boys. Girls, for example, might need: two skirts
(Tshs 25,000); a t-shirt (Tshs 5,000); two pairs of shoes (Tshs 12,000);
and exercise books (Tshs 10,000). Boys might need: two pairs of shorts
(Tshs 20,000); two shirts (Tshs 12,000); a t-shirt (Tshs 5,000); two pairs
of shoes (Tshs 12,000); and exercise books plus pens costing Tshs 12,000
per year.
This implies that the indirect costs that parents incurred related to their
children’s primary education might be at least eight times higher than the
Tshs 6,000 per pupil capitation grant that the government provides for
running the schools. Thus, one might argue that some children fail to
enroll or drop out of school because of these indirect costs. This threatens
the attainment of the targeted education for all. In order to ensure that all
children attend school, the government may need to consider how these
indirect school costs can be reduced or totally eliminated. Despite the fact
that many of the stakeholders appear positive about the fee-free basic
education policy, confusion and misunderstandings persist, as already
reported. Against this backdrop, doubts arise regarding whether or not the
policy is being implemented effectively. The mixed understanding
reported in this study is attributable to the seemingly less inclusive and
consultative policy establishment process, as well as the inadequate
planning prior to its implementation. Despite the repeated clarifications
from the government through circulars and other directives, the
discussions with the participants indicated that the details about the policy
remain largely obscure, as these were not shared with the various
stakeholders to the optimum extent. In fact, while the heads of schools
received government circulars on policy implementation, there is little to
substantiate the idea that these circulars were effectively shared with the
relevant teachers, parents, school committee members or even school
board members. Apparently, these circulars were largely kept in files,
accessible only by the heads of schools. Other implementers only
133

Huria Journal vol. 27 (1), March 2020
received verbal information on the policy from the school heads. In this
regard, one board member, for example, stated:
“We haven’t seen the circular…but we know it amounts to what the head-
master told us. We make decisions based on what the head informs us”.
Nearly all of the heads of schools pointed out that the funds that their
schools received were inadequate to meet the school’s needs, including
the academic and administrative needs. Uwezo (2010), who examined the
extent to which the capitation grants met the basic school needs, found
that the allocation for textbooks, for example, covered only one book for
one subject (out of seven compulsory subjects). At the time, the book’s
price ranged from at least Tshs 3,500 to 5,000 per copy. Currently, a book
would cost between Tshs 4,000 and 6,000. This suggests that each pupil
requires a minimum of Tshs 28,000 to buy books for all of the
compulsory subjects. In the same vein, the current study found that the
capitation grants provided to offset the school needs were insufficient.
Moreover, the grants that the schools received were not pegged to the
inflationary trends. Consequently, the economic value diminished in the
face of high inflation. Furthermore, the study found that the funds
allocated to the schools ignored the possibility that the pupils and schools
had varying needs. This suggests that the fee-free education policy treats
all of the children and schools equally, regardless of their background
experiences, needs or whether they are based in the more remote
resource-limited or better-endowed urban areas. Children with and
without special needs, and those whose parents are better off and those
whose parents are poor are lumped together in one ‘bucket’.
In addition, although some parents were willing to pay fees and contribute
to the school’s running costs, the policy simply ignored such an
inclination, which neglected a potential fertile area for buttressing the fee-
free education. At this juncture, the question becomes, “should the fee-
free education funds be used to support the neediest children while
continuing to collect revenue from those children whose parents can
manage parental contributions to augment this well-intentioned
government initiative?” We are aware that the government is in the
process of reviewing the capitation grant formula, as evidenced by the
production of the draft formula (entitled The Proposed Revised Capitation
Grant Allocation Formula November/December 2017). The draft formula
factors in the needs of schools and equity issues. It thus includes
overhead/constant costs and adjusters. Moreover, the formula proposes
the covering of overhead cost for all schools to meet the running costs of
134

Fee-free Basic Education Policy Implementation in Tanzania: A ‘Phenomenon’
Worth Rethinking
Richard Shukia
each one, irrespective of the school size, location or endowment with
physical resources. The costs to be covered under this category include
water, security, teaching and learning materials, and facilities. The
proposed adjusters would take into account the needs and equity issues to
be brokered by enrolment, and distance from school to the council
headquarters, the number of students with special needs, and the council
poverty headcount, respectively. Despite the promising formula, issues
such as school meal programmes have been overlooked. Moreover, the
formula depends on previous years’ school expenditure data being
deployed to determine the percentage of the costs. This application,
however, might be problematic because of inflation. Although the
formula recognises students with special needs, it does not specify such
students’ special needs, whose unit cost remains largely indeterminate.
Indeed, there are various categories of students with special needs whose
unit cost might vary.
Thus, the formula might need to draw on a rigorously determined unit
cost. To avoid drawbacks in the implementation of the revised formula,
the process needs to be sufficiently inclusive and consultative. Parental
engagement with their children’s education is instrumental in children’s
learning outcomes. However, nearly all of the heads of schools reported
that the implementation of the fee-free education policy had severely
curtailed parental involvement in their children’s education. The parents
were reportedly less responsible for their children’s schooling than in the
past, pre-fee-free education period. Only a few of the parents reportedly
attended teacher-parent meetings, let alone monitored their children’s
school progress. This lack of parental involvement endangers
participatory accountability, which is crucial in building an equitable
education system and providing quality education (UNESCO, 2016) yet,
in educational contexts where the degree of participatory accountability is
low, parents also fail to hold schools accountable for their children’s poor
learning outcomes (Komba, 2017). Similar challenges have been
observed in other African countries that implement similar fee-free
education policies. The rapid surge in enrolment posed a challenge to the
quality of education (World Bank, 2009). These countries experienced a
severe shortage of classrooms, desks, instructional materials and teachers’
housing, as well as insufficient numbers of teachers to cater for the
school-age population. These hurdles threaten the delivery of quality
education. Had Tanzania effectively drawn lessons from its past and from
other African countries, it could have minimised or even avoided
135

Huria Journal vol. 27 (1), March 2020
altogether these threats to the provision of quality basic education.
Overall, the quality threats are attributable to a lack of proper planning
and a limited inclusive and consultative process. In this regard, it is vital
to consider various steps for ensuring that fee-free basic education policy
initiatives are implemented in an orderly manner without negatively
affecting the running of the schools (World Bank, 2009).
CONCLUSION
On the whole, the implementation of fee-free education was informed by
a top-down policy implementation approach. The main government
intention was to increase access to basic education for all children,
regardless of their background. The government set goals, guidelines, and
control mechanisms for the effective implementation of the policy.
Despite the fact that the policy implementers are complying, there was an
impression from the participants that they wished that they could modify
the utilisation of the funds in order to meet their school’s needs more
effectively. In the light of the findings, this paper contends that, despite
being misapprehended, causing confusion and parental withdrawal from
school engagement, and threatening equitable and the quality delivery of
education, the implementation of the fee-free basic education policy has
significantly expanded access to education for children from various
socio-economic backgrounds. The implementation of the fee-free basic
education policy, albeit commendable, is a ‘phenomenon’ worth
rethinking in order for Tanzania to consolidate and sustain the gains,
hence, realise quality universal basic education and the 2030 global
education agenda. This rethinking may focus on how best and how
quickly education stakeholders in Tanzania can intervene in the trade-offs
between expanded school access and quality, a re-contextualisation of the
amount that each student and school receives on the basis of a rigorous
context-specific cost analysis, and whether the fee-free education funds
might be used to support the neediest while continuing to collect revenues
from those children whose parents can afford to engage in cost-sharing
within education.
136

Fee-free Basic Education Policy Implementation in Tanzania: A ‘Phenomenon’
Worth Rethinking
Richard Shukia
REFERENCES
Cameron, J. and W. A. Dodd (1970). Society, Schools and Progress in
Tanzania. Oxford: Pergamon
Daven, J. (2008). Free Primary Education in Tanzania? A case study on
costs and accessibility of primary education in Babati town.
Copenhagen: Sodertorn University College.
Komba, A. (2017). Educational Accountability Relationships and
Students’ Learning Outcomes in Tanzania’s Public Schools.
SAGE Open, 1-12, DOI: 10.1177/2158244017725995.
Matland, R. E. (1995). Synthesizing the Implementation Literature: The
Ambiguity-Conflict Model of Policy Implementation. Journal of
Public Administration and Theory, pp. 145-174.
Ministry of Education Science and Technology and Vocational Training
and United Nations Children’s Fund. (2016). Global Initiative on
Out of School Children, Tanzania Country Report.
Paudel, N. R. (2009). A Critical Account of Policy Implementation
Theories: Status and Reconsiderations. Nepalese Journal of Public
Policy and Governance, Vol. XXV, No. 2
UNESCO (1990). World Declaration on Education for All and
Framework for Action to meet Basic Learning Needs. World
conference Jomtien, Thailand 5-9 March 1990. UNESCO: Paris.
UNESCO (2000). The Dakar Framework for Action Education for All:
Meeting our Commitments. Adopted by the World education
Forum, Dakar, Senegal, 26-28 April 2000. UNESCO: Paris.
UNESCO (2016). Theme of 2017 global education monitoring report:
Accountability in education (Concept Note of 2017. Retrieved
fromhttp://en.unesco.org/gem-report/sites/gem-report/files/
concept % 20Note.pfd
United Republic of Tanzania (2014). Sera ya Elimu na Mafunzo. Dar es
Salaam: Ministry of Education and Vocational Training.
United Republic of Tanzania (2015a) “Waraka wa Elimu Namba 5 wa
Mwaka2015” Kufuta Ada Kwa Elimu Ya Sekondari Kidato Cha
Kwanza Mpaka Cha Nne Kwa Shule za Umma na Michango Yote
Katika Elimu Msingi” Dar es Salaam: Wizara ya Elimu, Sayansi
na Teknologia, 21 November 2015.
United Republic of Tanzania (2015b). “Waraka wa Elimu Namba 6 wa
Mwaka 2015 Kuhusu Utekelezaji wa Elimumsingi bila Malipo”
Dar es Salaam: Wizara ya Elimu, Sayansi naTeknolojia, 10
December 2015.
137
Huria Journal vol. 27 (1), March 2020
United Republic of Tanzania (2016) “Waraka wa Elimu Namba 3 Wa
Mwaka 2016 Kuhusu Utekelezaji wa Elimumsingi bila Malipo”
Dar es Salaam: Wizara ya Elimu, Sayansi na Teknnolojia. 25 May
2016
United Republic of Tanzania (2004). Primary Education Development
Plan: Progress Report for the Financial year 2002/03. Dar es
Salaam, Ministry of Education and Culture and President’s Office
Regional Authorities and Local Government
United Republic of Tanzania (2015). Education for All 2015 National
Review Report. United Republic of Tanzania ‐ Mainland.
United Republic of Tanzania (2012 - 2016). National Basic Education
Statistics in Tanzania: National Data. Ministry of Education,
Science and Technology
United Republic of Tanzania (2017). Pre-Primary, Primary, Secondary,
Adult and Non-Formal Education Statistics: Regional Data,
Prisident’s Office Regional and Local Government.
United Republic of Tanzania (2018). Education Sector Performance
Report, 2017/2018, Tanzania Mainland, September 15th, 2018
Uwezo (2010). Are our children learning? Annual learning assessment
report Tanzania, 2010. Uwezo Tanzania.
USAID (2007). School Fees and Education for All: Is Abolition the
Answer? Washington D.C. EQUIP 2, Working Paper
World Bank (2009). Six Steps to Abolishing School Fees: Operational
Guide. Washington: The International Bank for Reconstruction
and Development/the World Bank.
138

Huria Journal vol. 27 (1), March 2020
Behavioural Predictors of Students’ Career Intentions in
the Hospitality and Tourism Industry in Tanzania
Proches Ngatuni1 Eunice Nderingo Ulomi2
The Open University of Tanzania, Dar es Salaam
[email protected]; [email protected]
ABSTRACT
This study assessed the career intentions of the hospitality and tourism students
to identify their predictors, based on the theory of planned behaviour.
Descriptive, correlation, and multiple regression analysis techniques were
applied on survey data from a conveniently determined sample of 232 students
enrolled in certificate and diploma programmes at the National College of
Tourism in Tanzania. The results indicate that students’ career intentions were,
on average, high and so were their attitudes toward a career in the industry,
subjective norms and perceived behavioural control. Career intentions and
attitudes towards the career were significantly higher for the hospitality
programme and NTA 6 students. Attitudes (perceived behavioural control) were
significantly higher (lower) for students in the travel and tourism programme
than those of students in the tour guide operations programme. Students with
personal exposure to the industry (also in NTA 6) showed higher subjective
norms than those without exposure (NTA 5). Students’ career intentions were
significantly positively predicted by their attitudes toward a career in the
industry, subjective norms and perceived behavioural control, even after
controlling for the effects of skill level and programme type. Perceived
behavioural control had the strongest predictive power. The study calls for a
dynamic review of the curricula, resourcing the training institutions, and
availability of well supported and monitored internship opportunities.
Keywords: career intentions, theory of planned behaviour, hospitality and
tourism industry.
INTRODUCTION
The contribution of the hospitality and tourism industry in the growth of
many country’s economies across the globe has been on a rapid increase
(UNCTAD, 2013; WTO, 2020). In many developing countries, the
industry is regarded as an important means of accelerating social-
economic development because of the role it plays in foreign exchange
earnings and job creation (Wamboye et al., 2020; WTO, 2019; WTTC-
Tanzania, 2020). In many African nations, the industry is among the
main contributors of gross capital formation, means of transferring
139
Behavioural Predictors of Students’ Career Intentions in the Hospitality and
Tourism Industry in Tanzania
Proches Ngatuni, Eunice Nderingo Ulomi
technology and managerial expertise, improving citizens’ quality of life,
and of escaping from economic hardships (Anderson and Sanga, 2018).
For example, Tanzania’s development agenda recognises tourism as
among the group of products in which the country is experiencing growth,
both in comparative advantage and in demand (URT, 2016). According to
Anderson and Sanga (2018), tourism’s contribution is recorded at 18
percent of GDP; export earnings at 30 percent, and total employment at
10.9 percent. In 2020, contributions to GDP, export earnings and total
employment were estimated at 18.3 percent, 21.4%, and 12 percent,
respectively.
In addition, the targets for the same in 2025 have been pegged at 19.5
percent, 21.1 percent, and 11.5 percent, respectively. Moreover, earnings
are projected at USD 4.2 billion in 2025 compared to USD 1.9 billion
earned in 2014, whereas the number of international tourist arrivals is
estimated to be 2.468 million visitors compared to the 1.14 million
tourists received in 2014. Despite the recognition of the position of the
industry in Tanzania’s development agenda together with the recorded
achievements so far, the industry is marred with many
challenges/constraints. Among the most widely cited challenges that are
relevant to the present study are the inadequate skilled (quality and
quantity) personnel at all levels (operational and managerial), poor
planning for human resource development and investment, and the
mismatch between the content of the hospitality and tourism education
curricula on one hand and the needs of the hospitality and tourism
stakeholders on the other (Anderson and Sanga, 2018). While URT
(2016) acknowledges the inadequacy of quality skilled local labour, it
further points out the insufficient public investment in tourism training
institutions, limiting the potential of such institutions to become
internationally accredited. The hospitality and tourism industry is both
labour intensive (Baum and Kokkrainkal, 2005) and service quality –
dependent. Its growth, therefore, increases the demand for skilled
personnel (Anderson and Sanga, 2018). This increased demand of skilled
personnel pressurizes the academia to prepare and supply the industry
with qualified graduates, who hold skills appropriate and relevant to it, at
both operational and managerial levels. Against the identified challenges,
several interventions have also been identified, some of which included
improving training and skills development (URT, 2016) and increasing
coordination of all stakeholders in the industry to ensure that training
140

Huria Journal vol. 27 (1), March 2020
capacity if fully utilized and the curricula are made relevant to the needs
of the industry (Anderson and Sanga, 2018).
In line with the suggested interventions, the Government of the United
Republic of Tanzania has created an environment where both private and
public institutions contribute to the preparation of the personnel required
by the industry. According to Anderson and Sanga (2018), there are more
than 116 hospitality and tourism training institutions in the country, at all
levels, yielding an average of 1,000 plus graduates into the job market.
However, 78.5 percent of these trainings institutions are accredited by the
Vocational Educational Training Authority (VETA), most of which are
privately owned. The remaining institutions are technical educational
institutions accredited by the National Council for Technical Education
(NACTE) (13.8 percent) and Universities accredited by the Tanzania
Commission for Universities (TCU) (7.7 percent). Both these public and
private training institutions at all levels train and contribute graduates to
the industry. However, despite all these efforts; (i) the output is lower
than the industry’s demand; and (ii) the quality is questionable especially
the VETA group, on account of the institutions being ill-resourced,
together with the absence of a cohesive professional organ at the national
level to coordinate their professions hands-on training (Anderson, 2015).
Anderson predicts the demand for human resource in 2020 at 720,000
employees to cater for the predicted 2 million international tourists in the
same year against the current supply of about 1,000 graduates per year
(p.72). Worse still, not all of the graduates join a career in hospitality and
tourism industry (Wen et al., 2018), exacerbating the demand gap. The
characteristics of the industry, as perceived by the students, also add to
the problem.
Walmsley’s (2004) review of previous researches revealed that students
perceived the industry’s jobs as jobs that are low paid, low skilled, and
are seasonal. Walmsley adds that the industry’s jobs are exposed to poor
management, marred by negative image and they lack career structure, in
addition to the industry being viewed as a refugee sector. Jing and Tribe
(2009) also opined that the industry’s jobs are repetitive and unstable.
Thus, besides the mismatch between the industry’s demand for adequate
and qualified personnel and the output of such personnel from the training
institutions, the aforementioned characteristics raise an additional but
important question: i.e. whether those who graduate from these
institutions do intend to (behavioural intentions), or actually, join and
develop careers in the industry (actual behaviour). In China, for example,
141

Behavioural Predictors of Students’ Career Intentions in the Hospitality and
Tourism Industry in Tanzania
Proches Ngatuni, Eunice Nderingo Ulomi
Wen et al. (2018) show, from a review of past studies, that 80 to 90% of
graduates from the hospitality and tourism programmes joined careers
other than the hospitality and tourism industry careers. This trend goes
against the understanding that recruiting and retaining well educated and
qualified employees can provide companies in this industry with a
competitive advantage in the long run (da Silva and do Valle, 2015;
Kusluvan and Kusluvan, 2000). However, the intentions of these
graduates to join the industry are practically more valuable than their
actual behaviour. It is, therefore, important to establish the extent to
which the students enrolled in the hospitality and tourism programmes in
Tanzania intend to join and develop careers in the industry (career
intentions), upon graduation. In addition, understanding the factors that
drive these intentions is important and has practical implications for the
industry, academia, and other stakeholders, including the students. This is
because the resulting knowledge will help all stakeholders to take
appropriate actions to ensure that the few graduates do join, and stay in,
careers in the industry.
Globally, studies on career intentions are many (Amani and Mkumbo,
2016; Arnold et al., 2006; Gorgievski et al., 2018; Huang, 2011; Park et
al., 2017; Wen et al., 2018; Zellweger et al., 2011), but only a few of
them are from the hospitality and tourism industry, especially those that
deal with behavioural predictors. Even so, these few studies are from the
Asian region (Park et al., 2017; Wen et al., 2018), leaving the African
region, Tanzania included, under-researched. Majority of these studies
also focused on undergraduate students leaving the other competence
levels (diplomas and vocational training) under-investigated. The few
studies and reports available on Tanzania (Anderson and Sanga, 2018;
ATE, 2011; URT, 2016) lay down the ground for this study. Taking the
stakeholders' theory view – tourism educators, students, tourism service
providers and government authorities - Anderson and Sanga (2018)
identify the challenges of the industry to include a serious shortage of
specialized managerial and operational skills and a mismatch between
hospitality and tourism curricula and the needs of the industry (ATE,
2011). Little, if any, research in Tanzania is directed toward assessing the
students’ career intentions and their predictors (behavioural or otherwise).
One study on behavioural predictors of students’ career intentions in
Tanzania is the study by Amani and Mkumbo (2016). However, it
focused on career intentions of students in disciplines other than
142
Huria Journal vol. 27 (1), March 2020
hospitality and tourism and it called for further studies, not only in
disciplines other than the four they covered (education, law, engineering
and business studies) but also in other cultural groupings. This study is a
response to the call.
Training, deploying and developing skilled personnel is one thing, but
attracting graduates to join and stay in the industry is something else. The
latter, requires managers to have knowledge about these intentions and
what determines them. The present study, therefore, extends the existing
works by examining the career intentions and their behavioural predictors
focusing on technical diploma students in hospitality and tourism
programmes, based on the framework of the Theory of Planned
Behaviour (TPB). The main objective of this study was to assess the
hospitality and tourism students’ intentions to join and develop careers in
the industry and to identify the behavioural predictors of these intentions.
Although only a few studies have investigated the effect of these
behavioural predictors (e.g., Amani and Mkumbo, 2016; Park et al., 2017;
Wen et al., 2018), the three predictor variables are considered to be
conceptually independent determinants of intentions (Hsu, 2012).
Moreover, other scholars like Al-Shammari and Waleed (2018) and Hsu
(2012) point out that the contribution of these behavioural predictors vary
across cases/behaviours and contexts/situations, implying that there is
need to learn more from the experiences in different cases and contexts as
well as in different cultural groupings (Amani and Mkumbo, 2016).
Further, the study compared the TPB variables based on selected
variables – gender, skill (programme) level, industry exposure, and
programme type. Lastly, the study determined whether the behavioural
factors uniquely explained the variance in the students’ career intentions
after controlling for the effects of programme type and skill level.
Theoretical Foundation
This study mainly applied the TPB’s framework of Ajzen (1991). The
theory postulates that an individual’s actual behaviour is best predicted by
behavioural intentions to perform that behaviour, which in turn is
predicted by three factors, namely attitudes towards the behaviour,
subjective norms, and perceived behavioural control. The basic TPB
indicates the predictive relationships among five constructs – actual
behaviour, behavioural intentions, attitudes toward the behaviours,
subjective norms and perceived behavioural control. The present study,
however, restricted itself on the behavioural intentions part of the
underlying model by determining its behavioural predictors. It is argued
143

Behavioural Predictors of Students’ Career Intentions in the Hospitality and
Tourism Industry in Tanzania
Proches Ngatuni, Eunice Nderingo Ulomi
that the hospitality and tourism programme students’ intentions to join
and develop careers in the hospitality and tourism industry are predicted
by their attitudes toward a career in the industry, subjective norms and
their perceived behaviour control. Behavioural intentions refer to the
individuals’ readiness to perform a certain behaviour. The importance of
these intentions is that they are the immediate and most important
antecedent to the actual behaviour (Ajzen, 2002). Thus, the study
considers the students’ intentions to join a career in the hospitality and
tourism industry because it is an antecedent to their actual decision to join
the industry when they graduate. Attitude towards a behaviour is the
individuals’ positive or negative assessment of other people, objects,
events, activities, ideas, or just about everything in their environment
(Zimbardo et al., 1977, cited in Wen et al., 2018, p.71). Thus, attitude
towards a career in the hospitality and tourism industry in the present
study is defined as the students’ favourable or unfavourable evaluation of
careers in the industry (Park et al., 2017). Subjective norms refer to an
individual’s perception of the social pressures of relevant/significant
others who believe that he or she should or should not perform a given
behaviour (Ajzen, 1991).
These relevant/significant others are the people, opinions and/or
expectations of whom the individual values highly. Kim et al. (2016)
identify these people to include parents and other family members,
friends, other relatives, college/university teachers/dons, etc. It is argued
that individuals tend to behave in a manner that meets what is expected of
them by these significant/relevant others, and in so doing, their
behavioural intentions improve (Kim and Cho, 2008). Subjective norms is
a two-dimensional construct (Fishbein and Ajzen, 2010 cited in Moore
and Burrus, 2019, p. 140), i.e., injunctive norms and descriptive norms.
Injunctive norms refer to the social rules about what ought to be done.
This is highly practised in African societies where parents tend to exert
pressure on their children to pursue what they (parents) believe is the
right thing to do; e.g., becoming a teacher, a doctor, or an engineer.
Descriptive norms, on the other hand, represents the results of a
comparison of the individual’s behaviour with that of the friends they
value. For example, drawing from Moore and Burrus (2019) on
intentions to engage in science, technology, engineering, and mathematics
(STEM) fields, it can be argued that students in hospitality and tourism
management programmes who have friends or people already in the
144

Huria Journal vol. 27 (1), March 2020
industry, and whose opinion they value, would tend to have higher
intentions to join a career in the same industry. Perceived behavioural
control is the individuals’ perception of the relative ease or difficulty with
which he/she can perform a given behaviour (Ajzen, 1991).
It is argued that students in hospitality and tourism programmes would
evaluate the behaviour (joining a career in the industry) in terms of
whether such behaviour is under their control (Han and Lee, 2001) by
looking at their skills, ability, knowledge, commitment (internal factors)
and time, opportunities and support from others (external factors) (Park et
al., 2017). The more they feel that they are in control of the decision to
join a career in the industry the higher will be their intentions to execute
the decision to join in. The TPB has, for many years, been used to explain
the determinants of an individual’s behavioural intentions and covered
many areas such as sociology, education, health, management and
information and communication technology (Akhtar and Das, 2018; Al-
Shammari and Waleed, 2018; Amani and Mkumbo, 2016; El-Mosalamy
and Metwale, 2018; Malebana, 2014; Suffian et al., 2018; Srirejeki et al.,
2019; Zaremohzzabieh et al., 2019). Specifically, in the hospitality and
tourism industry, Hsu (2012) used the theory to explore the relationship
between the attitudes towards internship, subjective norms, and perceived
behavioural control of hospitality vocational college students in Taiwan
and their career intentions. Goh and Ritchies (2011) also used the theory
to investigate hospitality students’ attitudes and perceived constraints
towards field trips. In addition, Park et al. (2017) and Wen et al. (2018)
applied the theory to predict hospitality and tourism students’ intentions
to pursue careers in the industry in Korea and China, respectively.
Hypotheses Development
Behavioral predictors
The TPB-based empirical studies on career intentions in the hospitality
and tourism industry as well as their predictors are few, biased toward the
Asian region, and much fewer in Africa. Besides, the evidence is varied
and covers universities’ undergraduate students in hospitality and tourism
programmes. Using a sample of 307 undergraduate hospitality and
tourism students in Korea, Park et al. (2017) found their career intentions
in the industry to be positively predicted by attitudes toward the career
and perceived behavioural control, but only attitudes were significant.
These career intentions were insignificantly negatively predicted by
subjective norms. However, the perceived behavioural control in their
145

Behavioural Predictors of Students’ Career Intentions in the Hospitality and
Tourism Industry in Tanzania
Proches Ngatuni, Eunice Nderingo Ulomi
study was measured using indicators different from those that are
normally used in the TPB framework – i.e., they were based on language
skills and experience requirements. In another study, Wen et al. (2018)
used a sample of 525 three- and four-year undergraduate degree students
in the hospitality and tourism programmes in China. They reported all
three TPB variables to predict positively and significantly the career
intentions in the industry. Past researches also show conflicting evidence
on the relative importance of the behavioural predictors in influencing
career intentions. For example, in a review of 19 empirical studies, Ajzen
(1991) established that subjective norms contributed very feebly to the
intentions to perform different behaviours. This was supported by a
subsequent study by Armitage and Conner (2001). Conversely, attitudes
toward a behaviour have been shown to be the most important factor
influencing behavioural intentions in Park et al. (2017). In another study,
however, Wen et al. (2018) reported that perceived behavioural control is
the most important predictor of career intentions. These conflicting
results, therefore, support the suggestion in Ajzen (1991, 2002) that the
relationship among the three predictors should be studied empirically for
each specific behaviour.
The only study on career intentions’ behavioural predictors in Tanzania is
Amani and Mkumbo (2016) who studied a sample of over a thousand
undergraduate students in education, law, engineering and business
studies professional disciplines from four universities. They reported
career intentions of the education students to be significantly higher than
those of their colleagues in the other three disciplines. They further
reported that all the three behavioural predictors had positive and
significant effects on career intentions, with attitudes toward the career
having the most predictive power. They recommended further studies to
consider not only other fields and cultural groups but also the final part of
the model (i.e., the actual behaviour). From this short review, students’
intentions to pursue careers in the hospitality and tourism industry are
likely to be predicted by their attitudes toward a career in the industry,
subjective norms, and perceived behaviour control. The present study,
therefore, hypothesizes that:
H1a: Students’ attitudes toward careers in the hospitality and tourism
industry will have a significant positive effect on their career
intentions in the industry.
146
Huria Journal vol. 27 (1), March 2020
H1b: Students’ subjective norms will have a significant positive effect
on their career intentions in the industry.
H1c: Students’ perceived behavioural control will have a significant
positive effect on their career intentions in the industry.
Other Potential Predictors
Personal exposure to the hospitality and tourism industry: Students earn
exposure to the industry in at least two formal ways – through an
opportunity to work in it before joining a training programme and through
an opportunity to participate in an internship programme while on the
training programme. During such exposures students are brought closer to
the working environment, professionals, and customers - an opportunity
to gain more knowledge about the industry. This exposure, in turn,
improves their perceptions about the industry. Park et al. (2017) argue
that internship programmes increase the students’ likelihood of
developing favourable perceptions about the hospitality and tourism
industry, making them likely to consider joining the industry as a suitable
career option.
On the other hand, other scholars argue that exposure to the industry will
have a negative or positive influence depending on the students’ degree of
satisfaction with the internship experience. Chao (2019) provides
evidence that satisfaction with internship positively impacts on tourism’s
students’ occupational choice, while Richardson (2009) found in
Australia that students with unsatisfactory experience in the industry are
discouraged from joining careers in it. Unsatisfactory experience may
also fuel dropouts from the study programme (Baum, 2006). In addition,
Chan’s (2017) study in New Zealand shows that students formed more
negative attitudes toward the hospitality and tourism industry as they gain
more exposure to it. Elsewhere, the effect of the internship has been
shown to vary across students’ generations (Richardson, 2010; Goh and
Lee, 2018) and gender, with females showing higher career intentions in
the industry the more they are exposed to it (Chuang and Dellmann-
Jenkins, 2010). In another study by Hsu (2012), internship attitude was
shown to affect positively both the career intentions and the actual
behaviour. The present study posits that exposure to the industry is a
function of whether the students worked in it before joining the
programme of study or had an opportunity of an internship in it, or both.
It also posits that exposure will affect either negatively or positively their
perceptions about, and attitudes toward, a career in the industry as well as
147
Behavioural Predictors of Students’ Career Intentions in the Hospitality and
Tourism Industry in Tanzania
Proches Ngatuni, Eunice Nderingo Ulomi
their level of confidence that they can decide to join the industry. Thus,
the study hypothesizes that:
H2a. There will be a significant difference in career intentions between
students with and without exposure to the hospitality and tourism
industry.
H2b. There will be a significant difference in attitudes toward a career
between students with and without exposure to the hospitality and
tourism industry.
H2c. There will be a significant difference in subjective norms between
students with and without exposure to the hospitality and tourism
industry.
H2d. There will be a significant difference in perceived behavioural
control between students with and without exposure to the
hospitality and tourism industry.
Moreover, from the evidence that internship affects students’ perception
about the industry differently with exposed females having higher career
intentions than exposed males (Chuang and Dellmann-Jenkins, 2010), the
present study hypothesizes that:
H3a. There will be a significant difference in career intentions between
male and female students.
H3b. There will be a significant difference in attitudes toward a career
between male and female students.
H3c. There will be a significant difference in subjective norms between
male and female students.
H3d. There will be a significant difference in perceived behavioural
control between male and female students.
Skill level and programme type: The diploma programme is a
combination of two competence levels – NTA 5 and NTA 6 - with no
direct entry to the latter by school leavers. Each level takes a year to
complete. NTA 6 students are viewed as students who have interacted
more with the programme content. The majority will also have had the
opportunity to attend an internship programme. NTA 6 student will be
seen as, on average, more knowledgeable about the industry than their
NTA 5 colleagues. Thus, the present study hypothesizes that:
148

Huria Journal vol. 27 (1), March 2020
H4a. There will be a significant difference in career intentions between
skill level groups.
H4b. There will be a significant difference in attitudes toward a career
between skill level groups.
H4c. There will be a significant difference in subjective norms between
skill level groups.
H4d. There will be a significant difference in perceived behavioural
control between skill level groups.
There could also be differences across the type of programme of study.
For example, the tour guide operation programme offers more travel
opportunities and contact with foreign visitors than the others, but perhaps
it demands high language skills and subject matter expertise. Some will
serve as porters, which is more muscular. Thus, this study hypothesizes
that:
H5a. There will be a significant difference in career intentions across
programmes of study.
H5b. There will be a significant difference in attitudes toward a career
across programmes of study.
H5c. There will be a significant difference in subjective norms across
programmes of study.
H5d. There will be a significant difference in perceived behavioural
control across programmes of study.
METHODOLOGY
Participants
The study adopted a quantitative, cross-sectional survey design. A
structured questionnaire was used to collect data in November 2019.
Participants were students pursuing hospitality and tourism management
programmes at the National College of Tourism (NCT), Tanzania. NCT is
a sector-specific agency run by the Government of the United Republic of
Tanzania, through the Ministry of Natural Resources and Tourism
(MNRT). The College is responsible for offering technical education in
the sector leading to the awards of certificates (NTA 4) and diploma
(NTA 5 - 6) at three campuses – Bustani and Temeke (both in Dar es
Salaam), and Arusha. All three campuses together enrolled 611 students
in different programmes in the 2018/19 academic year. The campuses and
the share of enrolment in brackets were: Arusha (149) Bustani (216) and
Temeke (246). Programmes of study cover the four skill areas of
hospitality, travel and tourism, tour guide operations, and events
149
Behavioural Predictors of Students’ Career Intentions in the Hospitality and
Tourism Industry in Tanzania
Proches Ngatuni, Eunice Nderingo Ulomi
management. Form six leavers and NTA 4 graduates are eligible to join
NTA 5 while graduates from NTA 6 are eligible to join degree
programmes. There is no direct entry at NTA 6. The college graduated
200 students (2016), 129 (2017) and 209 (2018). Although several other
colleges, universities and vocational training institutions have training
programmes in hospitality and tourism, NCT was chosen for its role in
producing technical personnel much needed in the industry at the
supervisory level, the key to any labour-intensive system.
It was also chosen because the hospitality students are better prepared for
hospitality jobs than students in the other academic backgrounds since
they receive more comprehensive knowledge and practical training
related to what the industry requires (Airey and Frontistis, 1997). As an
agency of the Government, the college was likely to have the national
interests in the hospitality and tourism industry at heart. Four hundred
(400) questionnaires were distributed proportionately to the three
campuses (Arusha 100, Temeke 170, and Bustani 130). Efforts to
promote participation were employed. Finally, a total of 232 filled
questionnaires were collected (58 percent response rate overall); 18 from
Arusha and 164 and 48 from Temeke and Bustani, respectively.
The Instrument
The instrument included a consent form, as a part of ethical requirements
to ensure that students read and consented participation based on full
knowledge of the study’s purpose and how the data so collected would be
used and the results reported. The main section contained items based on
the TPB model originated from Ajzen (1991, 1998), but as used in Wen et
al. (2018). These items were adapted to suit the study’s context. Student
attitudes toward the hospitality and tourism industry career was measured
by four items using semantic differential response format. A sample item
was: “I find the idea of having a career in the hospitality and tourism
industry…”, to which respondents response ranged from 1 = very
uninteresting to 5 = very interesting. Another item was “definitely, a
career in the hospitality and tourism industry will be (pleasurable…very
unpleasurable) for me. This was negatively worded to serve as an
“attention trap” to identify unengaged respondents as well as a means for
controlling for common method bias (CMB). Subjective norms were
measured by two items. One of the items was “Most people who are
important to me want me to work in the hospitality and tourism industry
after graduation”.
150
Huria Journal vol. 27 (1), March 2020
Perceived behavioural control was measured by two items. A sample item
was “It is completely up to me to decide whether I will work in the
hospitality and tourism industry after graduation.” Finally, career
intentions were measured by three items. A sample item was “I plan to
work in the hospitality and tourism industry after graduation”. In all the
three measurement scales, a Likert-like scale was used with five
responses ranging from 1 = strongly disagree to 5 = strongly agree. Age
was measured continuously from the year of birth, gender = 1 if male, 0
otherwise, and qualification level = 1 if NTA 4, 2 if NTA 5 and 3 if NTA
6 (later redefined as a skill level dummy with 1 if NTA 6, 0 otherwise).
Whether the respondent had worked in the hospitality and tourism
industry before joining the programme (Yes/No), and whether the
respondent had an opportunity to attend an internship programme in the
industry (Yes/No). These two were later redefined as “personal industry
exposure” dummy scoring 1 if the respondent had either worked or had an
opportunity for internships in the industry, 0 otherwise. Programme of
study (hospitality, travel and tourism, tour guide operators, and event
management) was dummy coded in three dummy variables – hospitality,
travel and tourism, and tour guide operations, with the latter used as a
reference category in the post hoc comparisons in the analysis of variance
(ANOVA). No student in the event management programme participated
in the survey. The last item was whether a closest relative was engaged in
the hospitality and tourism industry (Yes/No). The instrument was pilot
tested on 35 students conveniently sampled from Bustani (11) and
Temeke (24). From the results, the instrument was fine-tuned and
administered to the rest of the sampled students.
Data Screening, Processing and Analysis
The 232 questionnaires represented a response rate of 58 percent, higher
than the minimum of 35 to 50 percent acceptable in business research
(Mellahi and Harris, 2016). Using frequency distribution, errors in data
entry were identified and corrected. A total of 58 cases were lost due to:
(i) missing values in all the TPB variables (12); (ii) lack of engagement in
filling the questionnaire (44) identified by the use of an attention trap; and
(iii) outliers (2) for having scores larger than the Mahalanobis Distance
cut-off of χ2(3) = 16.27, ρ < .001 (Tabachnick and Fidell, 2018). Finally,
174 usable questionnaires were retained for analysis. The fourth item of
the attitudes scale was reverse-coded. A scale test for reliability analysis
was used to check for internal consistency of each of the four scales.
Mean scores were computed for each of the four scales followed by both
151

Behavioural Predictors of Students’ Career Intentions in the Hospitality and
Tourism Industry in Tanzania
Proches Ngatuni, Eunice Nderingo Ulomi
descriptive and correlation analysis. The following linear multiple
regression (1) and hierarchical regression (2) models were run:
(1)
(2)
Where, CI = career intentions in the industry, AT = attitudes toward a career in
the industry, SN = subjective norms and PBC = perceived behavioural control,
Hosp = hospitality programme dummy (=1) and Skill = skill level dummy (1=
NTA6). Other underlying regression assumptions were checked: Normality
(Normal P-P plot inspection), multi-collinearity (bivariate correlation in pairs of
independent variables and variance inflation factors), Linearity (bivariate
correlation between dependent and independent variables), and homoscedasticity
[Breusch – Pagan Lagrange Multiplier (LM) and Koenker tests using Ahmad
Daryanto plugin tool in SPSS (Daryanto, 2013)].
FINDINGS
Sample Description
Table 1 summarises the respondents’ characteristics. Majority of the respondents
were male (72.1%) and from Temeke campus (70.5%). Over half of the
respondents were registered in the Travel and Tourism programmes (51.1%)
while the tour guide operations programme contributed only 17.2% of the
respondents. All NTA 4 respondents were lost in the data cleaning process,
leaving three-quarters of the respondents in NTA 5 (75.6%). About half (49.4%)
of the respondents had an opportunity to attend internship programmes and
23.7% had an opportunity to work in the hospitality and tourism industry before
joining the study programme. The two groups put in perspective had personal
exposures to the hospitality and tourism industry either before or during the
programme. These were taken as students who had personal knowledge about
various aspects of the industry. It is expected that this exposure would bear on
their career intentions, attitudes toward the industry, social influence and the
feeling of being in control over the career decisions and their implementation.
Lastly, respondents with parents or relatives working in the hospitality and
tourism industry constituted 45.4% of the sample.
Table 1: Sample description
Variable Frequency Percentage
Gender [N = 172]
152

Huria Journal vol. 27 (1), March 2020
Male 124 72.1
Female 48 27.9
Campus [N = 173]
Bustani 37 21.4
Temeke 122 70.5
Arusha 14 8.1
Programme [N = 169]
Hospitality 50 29.6
Travel and Tourism 89 51.1
Tour Guide operations 30 17.2
Skill level [N = 172]
NTA 5 130 75.6
NTA 6 42 24.4
Internship [N = 172]
Yes 85 49.4
No 87 50.6
Worked in HTI [N = 172]
Yes 42 23.7
No 132 76.3
HTI Exposure [N = 174]
Yes 92 52.9
No 82 47.1
Relatives in HTI [N = 174]
Yes 79 45.4
No 95 54.6
Reliability, Descriptive and Correlation Statistics
From the scale test for reliability analysis, the Cronbach’s alpha
coefficients (Table 2) ranged from .74 (SN) to .77 (AT, CI) indicating
acceptable internal consistency while that PBC was .62, indicating
questionable internal consistency but usable (George and Mallery, 2019;
Hair et al., 2019). All mean scores were higher than the cut-off point of
3.5 based on a 5-point Likert scale (Albdour and Altarawneh, 2014).
These mean scores indicate that students had high intentions to join
careers in the hospitality and tourism industry. The scores also indicate
that the students had high attitudes toward the industry and felt high
social pressure from the people, opinion of whom they value highly, to
join the industry. They had a high feeling of being in control of the
153
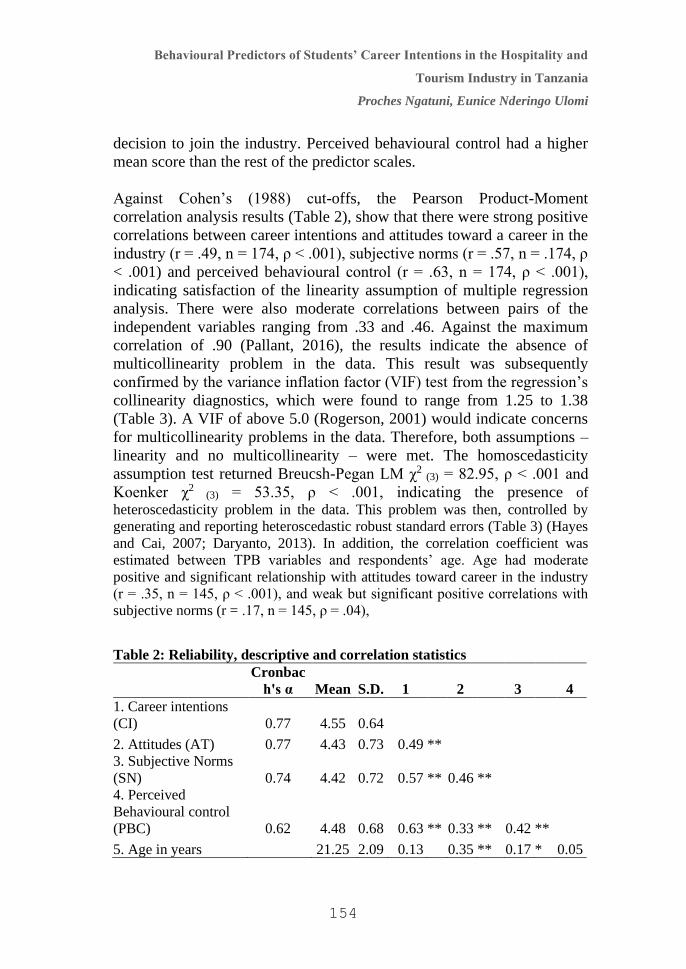
Behavioural Predictors of Students’ Career Intentions in the Hospitality and
Tourism Industry in Tanzania
Proches Ngatuni, Eunice Nderingo Ulomi
decision to join the industry. Perceived behavioural control had a higher
mean score than the rest of the predictor scales.
Against Cohen’s (1988) cut-offs, the Pearson Product-Moment
correlation analysis results (Table 2), show that there were strong positive
correlations between career intentions and attitudes toward a career in the
industry (r = .49, n = 174, ρ < .001), subjective norms (r = .57, n = .174, ρ
< .001) and perceived behavioural control (r = .63, n = 174, ρ < .001),
indicating satisfaction of the linearity assumption of multiple regression
analysis. There were also moderate correlations between pairs of the
independent variables ranging from .33 and .46. Against the maximum
correlation of .90 (Pallant, 2016), the results indicate the absence of
multicollinearity problem in the data. This result was subsequently
confirmed by the variance inflation factor (VIF) test from the regression’s
collinearity diagnostics, which were found to range from 1.25 to 1.38
(Table 3). A VIF of above 5.0 (Rogerson, 2001) would indicate concerns
for multicollinearity problems in the data. Therefore, both assumptions –
linearity and no multicollinearity – were met. The homoscedasticity
assumption test returned Breucsh-Pegan LM χ2 (3) = 82.95, ρ < .001 and
Koenker χ2 (3) = 53.35, ρ < .001, indicating the presence of
heteroscedasticity problem in the data. This problem was then, controlled by
generating and reporting heteroscedastic robust standard errors (Table 3) (Hayes
and Cai, 2007; Daryanto, 2013). In addition, the correlation coefficient was
estimated between TPB variables and respondents’ age. Age had moderate
positive and significant relationship with attitudes toward career in the industry
(r = .35, n = 145, ρ < .001), and weak but significant positive correlations with
subjective norms (r = .17, n = 145, ρ = .04),
Table 2: Reliability, descriptive and correlation statistics
Cronbac
h's α Mean S.D. 1 2 3 4
1. Career intentions
(CI) 0.77 4.55 0.64
2. Attitudes (AT) 0.77 4.43 0.73 0.49 ** 3. Subjective Norms
(SN) 0.74 4.42 0.72 0.57 ** 0.46 ** 4. Perceived
Behavioural control
(PBC) 0.62 4.48 0.68 0.63 ** 0.33 ** 0.42 **
5. Age in years 21.25 2.09 0.13 0.35 ** 0.17 * 0.05
154

Huria Journal vol. 27 (1), March 2020
*ρ < .05; **ρ < .001
Multiple Regression Results
Multiple Regression analysis was used to determine whether the TPB
variable predicted the students career intentions. The results show that the
model (Table 3) as a whole explained 54.7% of the variance in career
intentions, and fitted the data well (F(3,170) = 68.46, ρ < .001). Career
intentions were positively and significantly predicted by attitudes toward
careers in the industry (b = 0.180, t = 2.10, ρ = .037), subjective norms (b
= 0.254, t = 2.687, ρ = .008) and perceived behavioural control (b =
0.419, t = 3.954, ρ < .001). Perceived behavioural control was the
strongest predictor of the variance in career intentions (beta = .445, ρ <
.001).
Table 3: Multiple regression results
b SE(b) beta t VIF
(Constant) 0.752 0.504 1.493
Attitude 0.180 0.086 .207 2.100 * 1.38
Subjective norms 0.254 0.095 .289 2.687 ** 1.40
Perceived behavioural control 0.419 0.106 .445 3.954 *** 1.25
R2 = .547; F-Stat (3,170) = 68.46, ρ < .001
*ρ < .05; **ρ < .01; ***ρ < .001
Results based on heteroscedastic consistent standard errors (HC3) (Cai &
Hayes, 2007; Daryanto, 2013).
Hierarchical Regression Results
Hierarchical multiple regression was used to assess the ability of the TPB
variables to predict levels of the career intentions, after controlling for the
influence of skill level and programme type (Table 4). Skill level and
programme type (dichotomized as 1 = hospitality, 0 = other programmes)
were entered at Step 1, explaining 4.8% of the variance in the career
intentions. After entering the TPB variables at Step 2, the total variance
explained by the model as a whole was 55.3%, F(5,166) = 40.99, ρ < .001.
The three TPB variables explained an additional 50.5% of the variance in
career intentions, after controlling for skill level and programme type,
∆R2= .505, ∆F-Stat (3,166) = 62.43, ρ < .001. In the first model, only skill
level was statistically significant (Table 4).
155

Behavioural Predictors of Students’ Career Intentions in the Hospitality and
Tourism Industry in Tanzania
Proches Ngatuni, Eunice Nderingo Ulomi
Table 4: Hierarchical regression results
Unstandardized Coefficients
Model 1 Model 2
(Constant) 4.43 *** 0.790 **
Skill level 0.274 * 0.079
Hospitality 0.187 0.085
Attitude 0.166 **
Subjective norms 0.250 ***
Perceived behavioural control 0.419 ***
R2 .048 .553
F-stat 4.225 * 40.99 ***
∆R2 .505
∆F-Stat 62.43 ***
* ρ < .05; ** ρ < .01; *** ρ < .001
Comparison of TPB Variables across Demographics
The independent samples t-test and analysis of variance (ANOVA) (with
post-hoc) techniques were used to compare the mean scores in the TPB
variables across respondents’ groups based on exposure to the industry,
gender, skill level, and programme of study. The results (Table 5) show
that there was a significant positive difference only in subjective norms
between respondents who had, and those who had no personal exposure
to the hospitality and tourism industry (Mean diff. = 0.23, t(172) = 2.144, ρ
= .033). Those who were personally exposed to the industry had
significantly higher subjective norms. Male students had higher but
insignificant career intentions. Male students also had lower but
insignificant attitudes toward a career in the industry, subjective norms,
and perceived behavioural control, than female students. There were also
statistically significant differences between skill levels, i.e. NTA 6 vs.
NTA 5, in career intentions (Mean diff. = 0.26, t(170) = 2.29, ρ = .023),
attitudes toward the career (Mean diff. = 0.42, t(170) = 4.33, ρ < .001),
subjective norms (Mean diff. = 0.25, t(170) = 1.98, ρ = .049), but not in
perceived behavioural control (Mean diff. = 0.13, t(170) = 1.04, ρ = .30).
Thus, career intentions, attitudes and subjective norms were higher for
NTA level 6 than for NTA level 5 students. Lastly, a one-way between-
groups analysis of variance (ANOVA) shows that across the three
programme types, there were statistically significant differences at ρ < .05
level in career intentions (F (2, 166) = 3.605, ρ = .029), in attitudes toward
156

Huria Journal vol. 27 (1), March 2020
careers in the industry (F (2, 166) = 8.455, ρ < .001), in perceived
behavioural control (F(2, 166) = 3.867, ρ = .023), but not in subjective
norms (F(2, 166) = 2.642, ρ = .074).
Post-hoc comparisons based on Hochberg GT2 and Games-Howell (Field,
2018), with the tour guide operations group as a reference category,
indicated significantly higher career intention (Mean diff = 0.38, ρ = .028)
and attitudes toward the career (Mean diff. = 0.55, ρ < .001) for students
in the hospitality programme. Means scores for subjective norms
(perceived behavioural control) were higher (lower) for the hospitality
group, but the differences were insignificant. There were significantly
higher (lower) scores of attitudes toward the career, Mean diff. = 0.59, ρ =
.004 (perceived behavioural control, Mean diff = - 0.38, ρ = .023), for
students in the travel and tourism programme. No significant differences
were found in career intentions and subjective norms across programme
types.
Table 5: Group comparison analysis
Variable Mean differences
CI# ATγ SN# PBC#
HTI Exposure [Yes
= 1] 0.16 0.15 0.23 * 0.12
Gender [Male =1] 0.13 - 0.22 - 0.06 - 0.003 Skill level [ NTA 6
= 1] 0.26 * 0.42 *** 0.25 * 0.13
Programme‡
Hospitality 0.38 * 0.55 ** 0.35 -0.02 Travel and
Tourism 0.29 0.59 *** 0.32 -0.38 *
*ρ < .05; ** < .01; ***ρ < .001
CI = Career intentions; AT = Attitude towards a behaviour; SN = Subjective
norms; PBC = Perceived behavioural control. ‡ANOVA with Post hoc
comparison using the tour guide operations programme as a reference group. #
= Hochberg’s GT2, γ = Games-Howell.
157

Behavioural Predictors of Students’ Career Intentions in the Hospitality and
Tourism Industry in Tanzania
Proches Ngatuni, Eunice Nderingo Ulomi
DISCUSSION
The purpose of this study was to assess the behavioural predictors of the
career intentions of hospitality and tourism students in Tanzania. The
specific objectives were to (1) determine students’ level of career
intentions to join a career in the hospitality and tourism industry after
graduation; (2) to determine the behavioural predictors of career
intentions; and (3) identify the differences of career intentions and
predictors using personal exposure to the industry groups, gender, skill
level and programme type. Hospitality and tourism students were found to
have high intentions to join careers in the industry, attitudes toward
careers in the industry, subjective norms and perceived behavioural
control. These students, therefore, are of significant potential to the
industry. Since many of them were at the beginning of their respective
programmes of study, the results call for the institution to encourage them
and nurture their intentions, attitude as well as their level of self-
confidence so that they maintain these intentions and attitudes up to the
time of graduation. All three behavioural predictors significantly
positively predicted the students’ career intentions in the hospitality and
tourism industry, confirming hypotheses H1a - H1c. The findings are
consistent with the theory of planned behaviour, which posits that
individuals’ behavioural intentions are determined by their attitudes
toward the behaviour, subjective norms and perceived behavioural
control. The three predictors together explained over half of the variance
in the career intentions, even after controlling for the effects of other
variables (programme type and skill level). This proportion of variance
explained is higher than the average of 41 percent reported in other
sectors such as the Godin and Kok’s (1996) meta-analytic study which
covered a range of health-related behaviours.
The findings on individual predictors are consistent with some of the
previous studies (e.g., Wen et al., 2018), but inconsistent with the results
reported in Park et al. (2017) that subjective norms and perceived
behavioural control did not have a significant effect on students’ career
intentions in the hospitality and tourism industry. In the present study,
perceived behavioural control was the most influential predictor, similar
to the findings by Wen et al. (2018), while attitudes toward the career was
the weakest contributor contrary to the findings by Amani and Mkumbo
(2016) and Park et al. (2017). Moreover, the findings are inconsistent
with Ajzen’s (1991) and Armitage and Conner’s (2001) extensive studies,
158

Huria Journal vol. 27 (1), March 2020
which highlighted subjective norms as the weakest predictor. Unlike in
Park et al. (2017), attitude in this study was the weakest predictor,
contradicting the findings in Amani and Mkumbo (2016) and Wen et al.
(2018). These contradictions viewed together lend support to the
observations and suggestions that the contributions of the three variables
vary across cases and contexts (Al-Shammari and Waleed, 2018) and that
the relationship among the TPB variables should be empirically tested for
each specific behaviour (Ajzen, 1991; 2002). Only subjective norms
differed between the exposure groups, confirming hypothesis H2c, but not
H2a, b, & d. The gender differences were insignificant in all four variables
(H3a – H3d not supported). Career intentions, attitudes toward a career, and
subjective norms differed significantly between skill levels, confirming
hypotheses H4a, H4b, and H4c, but not H4d. They were all higher in NTA 6
than in NTA 5 students.
The career intentions, attitudes toward careers in the industry and
perceived behavioural control differed significantly across programmes of
study, confirming hypotheses H5a, H5b, and H5d. Career intentions were
significantly higher for students in the hospitality programme (relative to
colleagues in the tour guide operations programme). Both these results
and those of significant differences in the mean scores of all TPB
variables across skill-level, call for the need to re-examine the curricula’s
content (and the associated learner support services) across the
programmes. The review will help to ensure that both the curricula and
learner support services enable the student to make informed career
decisions irrespective of their level, or programme, of study. Consistent
with the aforementioned interpretation, the attitudes of both hospitality
and travel and tourism students toward a career in the industry were
significantly higher than those of their colleagues in the tour guide
operations group. In addition, the attitudes of the students in NTA 6 were
also significantly higher than those of their colleagues in NTA 5. On the
other hand, subjective norms were significantly higher for NTA 6 as well
as for those personally exposed to the industry. These two results suggest
that skill level and personal exposure to the industry could be working
together because the students in NTA 6 are highly likely to have engaged
in internships. The skill level variable included students who had an
opportunity to work in the industry before joining the programme.
Therefore, skill-level and personal exposure results may signal the
importance of having in place well-designed and well-supervised
internship programmes. Such importance arises from the assumption that
student’s interaction with colleagues, people who matter in the industry,
159
Behavioural Predictors of Students’ Career Intentions in the Hospitality and
Tourism Industry in Tanzania
Proches Ngatuni, Eunice Nderingo Ulomi
as well and the industry’s environment and set up, will increase the
pressure on them to see working in the industry as a good career option.
This will, in turn, elevate their intentions to join the industry after
graduation. Finally, the differences in the perceived behavioural control
across programmes of study may indicate differences in the curricula’s
ability to impart knowledge and skills so that the students feel confident
enough and able to see opportunities in the industry instead of seeing
inabilities and barriers.
CONCLUSION AND RECOMMENDATIONS
The present study extended the empirical knowledge on behavioural
predictors of career intention literature in several ways. Firstly, it tested
and added evidence from a frontier tourism market (Tanzania). Secondly,
it engaged students in technical level programmes, rarely studied before,
as opposed to the dominancy of university-level students (see for example
Amani and Mkumbo, 2016) in Tanzania. The study, therefore, concludes
that the TPB model applies in predicting career intentions of non-
university level hospitality and tourism students, and in the Tanzanian
context. Thirdly, the study extends the study by Anderson and Sanga’s
(2018) by offering support to the stakeholders’ view in bridging the gap
between academia and the hospitality and tourism industry. Both the
academia and the industry should work together to ensure that the content
of the curricula is relevant, up-to-date, and capable of fuelling student’s
positive intentions of joining the industry. These desires will be satisfied
if the curricula are capable of building the right attitudes and providing
skills, knowledge, emotions, and abilities. The satisfaction of the desires
also requires the curricula to be capable of illuminating on the
opportunities available in the industry. Personal exposure to the industry
is also important but its value will be enhanced by cooperation between
the stakeholders – instructors and on-the-field supervisors.
These two players should work together to offer sufficient value-adding
support to the students so that they see opportunities and responsibility
from the eyes of their superiors and professionals in the industry. The
resulting pressure will increase the students’ intentions to join the
industry. Learner support services ought to be right and supportive of the
acquisitions of these attributes by the students. Technical education
colleges should monitor closely their students’ internship engagements in
the industry to identify and mitigate the challenges they face. Then the
160
Huria Journal vol. 27 (1), March 2020
colleges and the industry should work together to bridge any observed
gaps by carefully considering the benefits and the challenges of the
students’ engagement experiences in the hospitality and tourism industry.
The two parties should align these experiences with the curricula to better
influence the professional lives of the current and future students so that
they become potentially valuable players in the hospitality and tourism
industry when they graduate and join it. The two ministries – Ministry of
Education Science and Technology and Ministry of Natural Resources
should work together to equip the training institutions with appropriate
teaching and learning environment (physical, human and financial
resources). They should also create a supportive environment for the
private sector institutions to increase their investments, and subsequently,
improve on their contribution to the training efforts. The regulators -
VETA, NACTE and TCU - should also ensure that the curricula are
appropriate, and the training institutions under their respective
jurisdictions meet the minimum programme accreditation criteria. They
should also play a supportive role to ensure that the curricula are
frequently updated to meet the changing dynamics in the industry. Parents
and other social groups have the responsibility of shaping their children’s
attitude towards the hospitality and tourism industry.
These contributions notwithstanding, the study’s findings are limited in
terms of their support to the theory of planned behaviour as well as
generalizability. This study used the TPB to examine the behavioural
predictors of hospitality and tourism students’ career intentions focusing
on its behavioural predictors. The consequences of behavioural intentions
on the actual behaviour as well as that of perceived behavioural control
and its interaction with behavioural intentions in predicting the actual
behaviour were beyond the scope of this study. This makes it difficult to
reflect the results on the entire or the revised TPB model. Furthermore,
the analysis included students who were studying various aspects of
hospitality and tourism programmes at diploma level from one college,
excluding those who were studying at the same level in other colleges. It
also excluded those who are studying similar programmes at university or
vocational training levels. In these regards, therefore, any generalization
of the results presented in this paper to students in hospitality and tourism
students in Tanzania should be made with caution. Future research should
consider a sample drawn from across levels and from other institutions,
and consider the excluded parts of the TPB model. This approach will
help coming up with a more generalized understanding of how these
behavioural predictors affect the career choices of Tanzania’s hospitality
161
Behavioural Predictors of Students’ Career Intentions in the Hospitality and
Tourism Industry in Tanzania
Proches Ngatuni, Eunice Nderingo Ulomi
and tourism students. A longitudinal study assessing career intentions at
the beginning and the end of the programme could help to capture the
influence of the programmes’ content, including internships and/or field
trips, on the career intentions. Among the benefits of doing this extension
will be to capture not only the impact of the curriculum but also the effect
of behavioural intentions and perceived behavioural control (and the
mediation thereof) on the actual behaviour.
REFERENCES
Airey, D. and Frontistis, A. (1997). Attitudes to careers in tourism: An
Anglo Greek comparison. Tourism Management, 18 (3), 149–158.
Ajzen, I. (1991). The theory of planned behaviour. Organizational
Behaviour and Human Decision Processes, 50(2), 179–211.
Ajzen, I. (1998). Models of human social behavior and their application
to health psychology. Psychology and Health, 13 (4), 735–739.
Ajzen, I. (2002). Perceived behavioral control, self-efficacy, locus of
control, and the theory of planned behavior. Journal of Applied
Social Psychology, 32(4), 665–683.
Akhtar, F. and Das, N. (2018). Predictors of investment intention in
Indian stock markets: Extending the theory of planned behaviour.
International Journal of Bank Marketing, 37(1), pp. 97-119.
https://doi.org/10.1108/IJBM-08-2017-0167
Albdour, A. A. and Altarawneh, I. I. (2014). Employee engagement and
organizational commitment: Evidence from Jordan. International
Journal of Business, 19(2), 192-212.
Al-Shammari, M. and Waleed, R. (2018). Entrepreneurial intentions of
private university students in the Kingdom of Bahrain.
International Journal of Innovation Science, 10(1), 43-57.
Amani, J. and Mkumbo, K. (2016). Predictors of career intentions among
undergraduate students in Tanzania. Journal of Education and
Human Development, 5(3), 106-115.
Anderson, W. (2015). Human resource needs and skill gaps in the tourism
and hospitality sector in Tanzania. Consultancy Report submitted
to The Ministry of Education and Vocational Training, Tanzania.
Anderson, W. and Sanga, J.J. (2018). Academia-industry partnerships for
hospitality and tourism education in Tanzania. Journal of
Hospitality & Tourism Education, 1-16. https://
doi.org/10.1080/10963758.2018.1480959
162
Huria Journal vol. 27 (1), March 2020
Armitage, C. J. and Conner, M. (2001). Efficacy of the theory of planned
behaviour: A meta-analytic review. British Journal of Social
Psychology, 40, 471–499.
Arnold, J., Loan-Clarke, J., Coombs, C., Wilkinson, A., Park, J. and
Preston, D. (2006). How well can the theory of planned behavior
account for occupational intentions? Journal of Vocational
Behavior, 69(3), 374-390.
Association of Tanzania Employers (ATE). (2011). Skills Development
Assessment. Arlington, VA: JE Austin Associates.
Baum, T. (2006). Human resource management for tourism, hospitality
and leisure: An international perspective. London: Cengage
Learning EM.
Baum, T. and Kokkranikal, J. (2005). Human resource management in
tourism. In L. Pender and R. Sharpley (Eds.). Management of
Tourism. pp. 85–101. London, UK: Sage.
Chan, M. C. (2017). Exploring how hospitality undergraduate students’
perceptions and attitudes towards a career in the hospitality
industry are affected by their work experience: A New Zealand
quantitative study (Doctoral dissertation). Auckland University of
Technology. Auckland, New Zealand.
Chao, C.W. (2019). A study on the relationship between the self-efficacy
and occupational choices of tourism department students-the
internship satisfaction as mediating variable. In 2019 5th
International Conference on Humanities and Social Science
Research (ICHSSR 2019). Atlantis Press.
Chuang, N. K. and Dellmann-Jenkis, M. (2010). Career decision making
and intention: A study of hospitality undergraduate students.
Journal of Hospitality & Tourism Research, 34(4), 512–530.
Cohen, J. (1988). Statistical power analysis for the behavioral sciences.
Hillsdale, NJ: Erlbaum.
Daryanto, A. (2013). Heteroskedasticity - SPSS syntax [WWW
Document]. URL https://sites.google.com /site/ahmaddaryanto/
scripts/Heterogeneity-test (Accessed 11 Oct. 2019).
El-Mosalamy, D. and Metawle, M. (2018). Predictors of investors’
participation in the Egyptian stock market: Application of theory
of planned behaviour. Journal of Business and Management
Science, 6 (3),118-125.
Eurico, S.T., Da Silva, J.A.M. and Do Valle, P.O. (2015). A model of
graduates׳ satisfaction and loyalty in tourism higher education:
The role of employability. Journal of Hospitality, Leisure, Sport &
Tourism Education, 16, 30-42.
163

Behavioural Predictors of Students’ Career Intentions in the Hospitality and
Tourism Industry in Tanzania
Proches Ngatuni, Eunice Nderingo Ulomi
Field, A. (2018). Discovering statistics using IBM SPSS Statistics. (5th
edition). London: Sage Publication Ltd.
George, D. and Mallery, P. (2019). IBM SPSS Statistics 25 Step by step: A
simple guide and reference. (15th edition). New York: Routledge.
Godin, G. and Kok, G. (1996). The theory of planned behavior: A review
of its applications to health-related behaviors. American Journal of
Health Promotion, 11, 87–98.
Goh, E. and Lee, C. (2018). A workforce to be reckoned with: The
emerging pivotal generation Z hospitality workforce. International
Journal of Hospitality Management, 73, 20–28.
Goh, E. and Ritchie, B. (2011). Using the theory of planned behavior to
understand student attitudes and constraints toward attending field
trips. Journal of Teaching in Travel & Tourism, 11(2), 179–194.
Gorgievski, M. J., Stephan, U., Laguna, M. and Moriano, J. A. (2018).
Predicting entrepreneurial career intentions: values and the theory
of planned behavior. Journal of Career Assessment, 26(3), 457-
475.
Hair, J. F. Jr., Black, W.E., Babin, B. J. and Anderson, R.A. (2019).
Multivariate data analysis. (8th edition). Hampshire: Cengage
Learning EMEA.
Han, D. and Lee, M. (2001). Explaining drinking and driving. Journal of
Personality and Social Psychology, 15(2), 141–158.
Hayes, A.F. and Cai, L. (2007). Using heteroskedasticity-consistent
standard error estimators in OLS regression: An introduction and
software implementation. Behav. Res. Methods. 39, 709–722.
doi:10.3758/BF03192961.
Hayes, A. F. and Cai, L. (2007). Using heteroskedasticity-consistent
standard error estimators in OLS regression: An introduction and
software implementation. Behavior Research Methods, 39(4), 709-
722.
Hsu, M. S. (2012). A study of internship attitude, subjective norm,
perceived behavioral control, and career planning of hospitality
vocational college students. Journal of Hospitality, Leisure, Sport
and Tourism Education, 11(1), 5–11. https://doi.org /10.
1016/j.jhlste.2012.02.003
Huang, J. T. (2011). Application of planned behavior theory to account
for college students' occupational intentions in contingent
employment. The Career Development Quarterly, 59(5), 455-466.
164

Huria Journal vol. 27 (1), March 2020
Jiang, B. and Tribe, J. (2009). Tourism jobs – short lived professions:
Student attitudes toward tourism careers in China. Journal of
Hospitality, Leisure, Sports & Tourism Education, 8(1), 4-19.
Kim, H.-S. and Cho, H.-I. (2008). The relationship gambling behaviors of
golf game player: An application of the theory of planned ehavior.
The Korea Journal of Sport and Psychology, 19(1), 129–141.
Kim, S.S., Jung, J. and Wang, K.C. (2016). Hospitality and tourism
management student’s study and career preferences: Comparison
of three Asian regional groups. Journal of Hospitality Leisure,
Sports and Tourism Education, 19, 66-84.
Kusluvan, S. and Kusluvan, Z. (2000). Perceptions and attitudes of
undergraduate tourism students towards working in the tourism
industry in Turkey. Tourism Management, 21, 251–269.
Malebana, J. (2014), Entrepreneurial intentions of South African rural
university students: A test of the theory of planned behaviour.
Journal of Economics and Behavioral Studies, 6 (2), 130-143.
Mellahi, K. and Harris, L. C. (2016). Response rates in business and
management research: An overview of current practice and
suggestions for future direction. British Journal of Management,
27(2), 426–437. https://doi.org/10.1111/1467-8551.12154
Moore, R. and Burrus, J. (2019). Predicting STEM major and career
intentions with the theory of planned behavior. Career
Development Quarterly,67(2),139–155.https://doi.org/ 10.1002
/cdq.12177.
Pallant, J. (2016). SPSS survival manual: A step by step guide to data
analysis using IBM SPSS. (6th edition.). Berkshire: Open
University press, McGraw-Hill Education.
Park, S. A., Kim, H. B. and Lee, K. W. (2017). Perceptions of
determinants of job selection in the hospitality and tourism
industry: The case of Korean university students. Journal of
Human Resources in Hospitality and Tourism, 16(4), 422–444.
https://doi.org/10.1080/15332845.2017.1266874.
Richardson, S. (2009). Undergraduates' perceptions of tourism and
hospitality as a career choice. International Journal of Hospitality
Management, 28, 382–388.
Richardson, S. (2010). Generation Y's perceptions and attitudes towards a
career in tourism and hospitality. Journal of Human Resources in
Hospitality & Tourism, 9(2), 179–199.
Rogerson, P. A. (2001). Statistical methods for geography. London: Sage.
165

Huria Journal vol. 27 (1), March 2020
Srirejeki, K., Supeno, S. and Faturahman, A. (2019). Understanding the
intentions of accounting students to pursue career as a professional
accountant. Binus Business Review, 10(1), 11-19.
Suffian, M.Z.A., Rosman, M., Norlaila, I., Norizan, A. and Hasnan,
M.T.M.T. (2018). Entrepreneurial intention: An empirical study
among undergraduate students. Journal of Fundamental and
Applied Sciences, 10(2S), 413-435.
Tabachnick, B. G. and Fidell, L. S. (2018). Using multivariate statistics.
(7th edition). Boston: Pearson.
UNCTAD (2013). Tourism’s contribution to sustainable development, p.
14–15.
United Nations Conference on Trade and Development (2008). FDI and
tourism: The development dimension. Geneva, Switzerland:
United Nations.
URT (2016). National Five-year Development Plan 2016/17-2020/21:
Nurturing industrialization for economic transformation and
human development. Dar es Salaam: Ministry of Finance and
Planning.
Walmsley, A. (2004). Assessing staff turnover: A view from the English
Riviera. International Journal of Tourism Research, 6, 275–287.
doi:10.1002/jtr.488.
Wamboye, E. F., Nyaronga, P. J. and Sergi, B. S. (2020). What are the
determinants of international tourism in Tanzania? World
Development Perspectives, 17, 100175. https://doi.org/ 10.1016/
j.wdp.2020.100175
Wen, H., Leung, X., Li, X. and Kwon, J. (2018). What influences Chinese
students’ intentions to pursue hospitality careers? A comparison of
three-year versus four-year hospitality programs. Journal of
Hospitality, Leisure, Sport and Tourism Education, 23, 70–81.
https://doi.org/10.1016/j.jhlste.2018.08.001.
World Tourism Organization (2020). World tourism barometer excerpt,
18(1). Retrieved from https://webunwto.s3.eu-west-1.amazonaws.
com/s3fs-public/2020-
01/UNWTO_Barom20_01_January_excerpt_0.pdf. Accessed on
31 May 2020.
World Travel and Tourism Council (WTTC) - Tanzania (2020). Tanzania
2020 Annual research: Key highlights. World. Travel and Tourism
Council, London, UK.
World Travel and Tourism Council (WTTC) – World (2019). Travel and
tourism economic Impact - World. Travel and Tourism Council,
London, UK.
166

Behavioural Predictors of Students’ Career Intentions in the Hospitality and
Tourism Industry in Tanzania
Proches Ngatuni, Eunice Nderingo Ulomi
Zaremohzzabieh, Z., Ahrari, S., Krauss, S. E., Samah, A. B. A., Meng, L.
K. and Ariffin, Z. (2019). Predicting social entrepreneurial
intention: A meta-analytic path analysis based on the theory of
planned behavior. Journal of Business Research, 96, 264-276.
Zellweger, T., Sieger, P. and Halter, F. (2011). Should I stay or should I
go? Career choice intentions of students with family business
background. Journal of Business Venturing, 26(5), 521-536.
Acknowledgement
We acknowledge the support we received from the management, and the
hospitality and tourism students, of the National College of Tourism,
Tanzania. We also acknowledge the comments from participants of the
International Conference on Linking Industry with Academia in Tourism
and Hospitality Sector in Developing Countries (LIATH-DC) held on the
10th-11th February 2020 in Dar es Salaam, Tanzania. Their constructive
comments and suggestions together with those of the two anonymous
reviewers on the earlier versions of the manuscript helped improve this
paper.
167

Huria Journal vol. 27 (1), March 2020
Challenges facing Wastewater Management in Fast
Growing Cities in Tanzania: A Case of Dodoma City
Council
Anna I. Wawa
The Open University of Tanzania
ABSTRACT
The main objective of this study was to examine the challenges facing the Urban
Water Supply Authorities in fast growing cities on wastewater management,
Dodoma City as a case study. The study used field observation and interview
methods to collect data. The primary data were complimented by literature
search to enrich the findings. Purposive sampling to Dodoma Urban Water
supply and Sewerage Authority (DUWASA) and City Council Health officials
was adopted to obtain the required information for this study. The findings
revealed the major challenge facing DUWASA to include rapid expansion of the
city associated with lack of funds for extension and rehabilitation of
infrastructure. However, there is a minimal use of the available wastewater
systems by the current population due to high cost of installation. The study
recommends collaborative efforts by DUWASA and Dodoma City Council on the
expansion of sewerage system to match with the current growing speed of the
City. The study recommends for The Ministry of Water and Irrigation Tanzania
to support DUWASA to execute its planned project of constructing larger waste
stabilization ponds away from the residential areas.
Key words: Wastewater, wastewater management, sewerage, waste
stabilization ponds
INTRODUCTION
The global sewage generation is increasing at an exponential rate as a
result of rapid population growth and urbanization (Bleninger and Jirk,
2008), all of which are exerting pressure on water system infrastructures.
There have been concerns that with the current world’ rapidly growing
population, the trend of shifting from rural areas to urban settlements is
likely to continue, and the overall growth of the world’s population could
add another 2.5 billion people to urban areas by 2050, with close to 90%
of this increase taking place in Asia and Africa (Bodo, 2019). In addition
to rapid population growth and urbanization, poverty has been a big
168
Challenges facing Wastewater Management in Fast Growing Cities in Tanzania:
A Case of Dodoma City Council
Anna I. Wawa
challenge facing the third world countries. World Bank and the United
Nations Millennium Development Movement define poverty using an
income threshold (at purchasing power parity) of US$ 1 a day per person
for Africa. Lusambo (2016) in his study in Tanzania found that using
selected poverty lines: overall, 29.3% - 98.2% of the households are poor.
In rural areas, 24.5% - 96.8% of the households are poor. In peri-urban
areas, it was found that 20% to 100% (depending on the poverty line
used) were poor, while in urban areas the poverty rate was found to be
between 37.1% and 99%. According to Tanzania Human Development
Report, Dodoma is among the 5 lower ranked regions in Tanzania based
on human development index (UNDP and URT, 2017).
In Tanzania, taking into account the high urbanization rate, the population
in the 20 biggest towns will increase to 13.8 million people by 2020 and
about 26 million people by 2030. It should be note that currently, 74% of
the population lives in Low-Income Areas. In most cases, the unplanned
inhabitants of these Low-Income Areas have inadequate access to basic
services such as safe water and adequate sanitation (Pauschert et al.,
2012). The increase of slums in cities for instance, has been making
thousands of people live in appalling housing structures and without
facilities like sewerage, electricity, water or paved roads (Hove et al.,
2013). Hove further argues that social services like transport, energy,
communications and water supply are among the municipal services that
are often inadequately provided. This inadequacy has caused
dissatisfaction to customers of utilities and they have become reluctant to
pay user charges. This erodes the tax base, which in turn, the governments
both at the central and local levels find themselves with insufficient funds
to maintain or upgrade the existing facilities. Dodoma is among the fast-
growing cities in Tanzania; the reason accounting for this speed is the
shifting of the capital functions from Dar es Salaam to Dodoma. The
establishment of Dodoma as a Capital City was conceived some decades
ago, but it came into reality in 2015 when the government of the United
Republic of Tanzania, under the leadership of his Excellency Dr. John
Pombe Magufuli, deliberately implement this idea. Shifting of capital
functions has been in concomitance with shifting of people,
capitals/assets and investment opportunities, which have resulted to rapid
population growth and expansion of the city that created more demand for
land, social services and increase of waste production.
169

Huria Journal vol. 27 (1), March 2020
This requires efficient wastewater treatment techniques to manage liquid
wastes emitted from residential, industrial and commercial areas. Dodoma
urban, is the jurisdiction operational area for Dodoma Urban Water
Supply and Sanitation (DUWASA). DUWASA was established on 1st
July 1998 as per Act No. 8 of 1997. It is full autonomous entity with the
legal mandate to provide clean and safe water and sewerage services to
the urban area of the Dodoma City council. The authority was subsided
by an Urban Water Department which also took over from the Capital
Water Engineer in 1996. However, the sewerage system remained under
Capital Development Authority (CDA) until in the year 2002, when it
was handed over to DUWASA. The Authority is in category “A” which
therefore is obliged to meet all operations and maintenance cost plus
some capital investment. This implies that construction and maintenance
of sewerage systems are the obligations of the Authority (DUWASA
Annual Report, 2018).
Wastewater treatment and management is the overall process that
involves the improvement of the quality of wastewater between points of
production and points of discharge. This process is aimed at improving
the physical, biological and chemical properties of wastewater to
eliminate both the known and emerging contaminants from the
wastewater eventually available for release into the environment (Bruce et
al., 2015). Donde (2017) asserts that, biological treatment has gained
much ground over other methods since it has become an important and
integral part of any wastewater treatment plant that treats wastewater from
different sources having soluble organic impurities or a mix of different
wastewater sources. Biological treatment using aerobic activated sludge
process has been in practice for well over a century and is undergoing
more and more modification and improvements.
According to Pauschert et al. (2012), only 10 out of the 20 public service
providers operate a rudimentary sewer system. The respective coverage is
presented in brackets behind the name: Mwanza (3.1 %), Moshi (5.8%),
Arusha (7.0 %), Dodoma (11.6 %), Iringa (11.9%), Mbeya (0.6 %),
Morogoro (1.6 %), Songea (3.7 %), Tabora (1.3 %), Tanga (9.3 %) and
Dar es Salaam (4.8 %). Pauschert et al. further observe that, only 30% of
households with on-site sanitation facilities empty their facility relying on
contractors or cess pit-emptier. Many households simply shift the facility
to another place as long as space is available. Often people refrain from
using emptying services, because of the high cost for those services.
170

Challenges facing Wastewater Management in Fast Growing Cities in Tanzania:
A Case of Dodoma City Council
Anna I. Wawa
However, wastewater management is crucial in protecting public health
by preventing diseases as well as environmental pollution from sewage
contaminants. A large volume of untreated wastewater has been dumped
directly into the water streams threatening human health and ecosystem
biodiversity resources (United Nations World Development Report II,
2006).
Early in the 19th century, the English scholar Reverend Thomas Malthus
published “An Essay on the Principle of Population.” According to
Malthus, while resources tended to grow arithmetically, populations
exhibited exponential growth. Thus, if left unrestricted, human
populations would continue to grow until they would become too large to
be supported by the available resources. Humans would outpace their
local carrying capacity, the capacity of ecosystems or societies to support
the local population. Malthus proposed alternative to moral restraint that,
if allowed to grow unchecked, population would outstrip available
resources, resulting in what came to be known as Malthusian catastrophes
naturally occurring checks on population growth such as famine, disease,
or war.
Malthusians would cite epidemics and starvation in overpopulated urban
slums, as natural checks on growing populations that have exceeded the
carrying capacities of their local environments. Proponents of this theory,
Neo-Malthusians, state that these natural checks such as famines were
examples of Malthusian catastrophes. On a global scale, however, food
production has grown faster than population due to transformational
advances in agricultural technology. It has often been argued that future
pressures on food production, combined with threats to other aspects of
the earth’s habitat such as global warming, make overpopulation to be
still a more serious threat in the future (https://socialsci.libretexts.org.).
This theory is relevant to this study as it relates the population growth and
utilization of resources. As stated before, the exponential growth of
Dodoma city exerts pressure on available social services including water
infrastructure. Urbanization theories also apply to this study. According to
Bodo (2019), urbanization is the steady increase in the number of people
living in cities or urban centres. The urban growth results from the
continuous mass movement of people from rural settlements to urban
areas or the movements between urban areas. It can also result from
natural increase through high fertility rates accompanied with low
mortality rates. Bodo further argues that, when people move in their
numbers to a particular location, there will be pressure on the available
171

Huria Journal vol. 27 (1), March 2020
resources. In the case of this study, the influx of people from other towns
to Dodoma is expected to exert pressure on the existing infrastructures.
Varon and Mara (2004) acknowledge the wastewater stabilization ponds
(WSPs) as the most appropriate method of domestic and municipal
wastewater treatment in developing countries, where the climate is most
favourable for their operation. According to Varon and Mara, WSPs are
least-cost, low-maintenance, highly efficient, entirely natural and highly
sustainable. The only energy they use is direct solar energy, so they do
not need any electromechanical equipment, saving expenditure on
electricity and more skilled operation. WSPs are particularly suited to
tropical and subtropical countries since sunlight and ambient temperature
are key factors in their process performance. Dodoma region being a
tropical region its climate favours the optimal operations of WSP. Varon
and Mara, describe WSP are man-made earthen basins, comprising of the
series of anaerobic, facultative and, depending on the effluent quality
required, maturation ponds (Figure 1). Basically, primary treatment is
carried out in anaerobic ponds, secondary treatment in facultative ponds,
and tertiary treatment in maturation ponds. Anaerobic and facultative
ponds are for the removal of organic matter (normally expressed as
"biochemical oxygen demand" or BOD), Vibrio cholerae and helminth
eggs; and maturation ponds for the removal of faecal viruses, faecal
bacteria like Salmonella spp, Shigella spp. and pathogenic strains of
Escherichia coli, and nutrients (nitrogen and phosphorus). Due to their
high removal of excreted pathogens, WSPs produce effluents that are very
suitable for reuse in agriculture and aquaculture (Varon and Mara, 2004).
172

Challenges facing Wastewater Management in Fast Growing Cities in Tanzania:
A Case of Dodoma City Council
Anna I. Wawa
Figure 1: Structure of Waste Stabilization Ponds
Source: https://en.wikipedia.org/, accessed March (2019)
The use of aerobic wastewater treatment as a reductive medium has been
receiving increased interest due to its low operation and maintenance
costs. WSP performs well in pathogen and nutrient removal thus leaving
the effluent being nutrient-rich for farming purposes. Mkude and Saria
(2014) comment that wastewater effluent if efficiently treated, contributes
to water resource conservation and expansion of irrigated land. It also
reduces the disposal problem hence protecting the environment and
improves public health. However, WSP system comprising only
anaerobic and facultative ponds produces an effluent suitable for
restricted irrigation only (for all crops except salads and vegetables eaten
uncooked and for discharge to a stream, river or lake). Maturation ponds
are needed if the effluent is to be used for unrestricted irrigation.
However, in all cases, the appropriate design calculations must be done to
determine whether or not suitable effluents will be produced (Varon and
Mara, 2004).
WSP technology has been adopted by Dodoma Urban Water Authority in
treating wastewater. The trunk sewer has the capacity of serving 423,000
people. However, the system had served about 40,000 people by 2018,
which is only 10% of Dodoma City population. Only few areas have been
completely covered by lateral sewers of 23 km length. Wastewater from
this system is finally treated by waste stabilization ponds [WSP] which
are located at Swaswa area (DUWASA Report, 2018). Interview with
DUWASA sewerage and environmental engineer revealed that WSP in
Dodoma were designed 30 years ago considering the number of people at
that time. WSP are located at Swaswa area about 7 km from the city
centre, in north eastern part of Dodoma town, the area which is now
surrounded by residential houses. It is a place where wastewater is
transported from different parts of the city through sewerage system and
on-site sewage facilities. Sewerage engineers furthermore revealed that
the available ponds were constructed for temporary use before the
permanent WSP was constructed at a distant area from the city.
Unfortunately, the temporary ponds are still used to-date regardless of the
increase in the population. Additionally, the constructed ponds are not
fully utilized due to incomplete construction hence not allowing the
completion of treatment process. The structure of WSP consists of two
anaerobic and two facultative ponds working in series only, no maturation
173
Huria Journal vol. 27 (1), March 2020
ponds at all.
Lack of maturation ponds makes the wastewater effluent not suitable for
unrestricted agriculture due to a risk of contamination of crops. However,
the surrounding community is tempted to use the partially treated
wastewater for irrigation purposes which threatens the health aspect of the
surrounding society. Dodoma region being semi-arid area experiences
severe shortage of water, and farming activities are competing for the
scarce water sources with industrial and municipal users. Alternatively,
farmers use wastewater directly to their farms and for construction
purposes. This study therefore intended to investigate the challenges
facing the DUWASA in managing wastewater and to identify the
associated impacts. Specifically, the study intended to: examine the extent
to which the existing sewerage system in Dodoma city is utilized.
Secondly the study examined the challenges facing DUWASA in
managing wastewater in Dodoma city, and finally, the impact of sewage
disposal in relation to health aspects of people in Dodoma city. The
findings emanating from this study provide feedback to the responsible
authority aiming at exposing the challenges hence recommendations for
improvement of wastewater management. This information is also vital
for policy makers at ministerial level to make them facilitate
establishment of a comprehensive and sustainable wastewater
infrastructure and conservation measures.
METHODOLOGY
The Study Area
The study was conducted in Dodoma City Council. Dodoma City is the
new national capital of The United Republic of Tanzania and the capital
of Dodoma Region. According to 2012 census, Dodoma had a population
of 410,956 (NBS 2012). However, the discussion with the responsible
officer at National Bureau of Statistics indicated the difficulty of
projecting Dodoma city population due to the currently high influx of
people in Dodoma following the shifting of Capital city from Dar es
Salam to Dodoma. Dodoma town was founded in 1907 by German
colonists during construction of the Tanzanian central railway. The literal
meaning of Dodoma originally ‘Idodomya’ in a native (Gogo) language is
translated as ‘it has sunk’. The natives give a history of an elephant which
sunk in a wetland. The city is seen as lowland sunk in-between hills. It is
in a semi-arid region with relative warm temperature throughout the year
174

Challenges facing Wastewater Management in Fast Growing Cities in Tanzania:
A Case of Dodoma City Council
Anna I. Wawa
(Dodoma City Council Profile, 2016). Dodoma city is located at 6.17
latitude and 35.74 longitudes and it is situated at an elevation of 1,125
metres above sea level. The city lies in the heart of Tanzania in the central
part of the country, 450 km west of Dar es Salaam. Dodoma city lies on a
strategic cross road including The great North road with access to Arusha
and Kenya in the north; Morogoro to Dar es Salaam in the east; Iringa and
Mbeya to Zambia in the south and Singida to Kigoma and Mwanza, in the West
(Figure 2) .
Figure 2: Dodoma City Council showing its location and bordering
regions https://www.google.com/search
According to Dodoma City Profile, about 75% of the people’s income in
the Municipality is from agriculture and animal husbandry. 25% of the
population is engaged in petty businesses such as retail shops, carpentry
and food vendors. Other activities include small and medium industries,
consultancy and construction work. The main industrial products are
wine, mattresses, furniture and mineral water. Others include honey, wax
and herbs from the forests. Per capita income is estimated to be Tshs
407,486. Dodoma was selected to represent the fast-growing cities in
Tanzania which have been experiencing challenges of wastewater
management. The study involved three officials from Dodoma Urban
Water Supply and Sanitation Authority including: Sewerage and
Environmental engineer, WSP attendant; and head of Municipal Health
175

Huria Journal vol. 27 (1), March 2020
Department. These officials are dealing with wastewater management and
were purposively selected to provide information related to the study
objectives.
Methods
The study adopted a case study approach to allow the in-depth
investigation of challenges facing DUWASA in managing wastewater in
a fast-growing city of Dodoma. Two sources of data were collected:
primary data were obtained from field survey and secondary data from
documentary reviews. For primary data, the study used interview and
field observation to collect data to substantiate various issues pertinent to
wastewater management in the study area. An interview schedule was
used for face-to-face discussion with DUWASA and City council officials
while observation activity was guided by a list of issues to be observed in
the field. Interviews enabled the researcher to have detailed in-depth
discussions with responsible officials to meet the main objective of the
study. Pictures were taken during the field visit to illustrate the real
situation of sewerage system management and waste water stabilization
ponds at Swaswa area. The collected data were primarily qualitative in
nature hence necessitated the use of content analysis. Qualitative data
analysis involved ideas and opinions which are categorized into themes,
this kind of data use verbal statements or explanations. Documentary
review involved secondary data derived from second hand information;
information that is already documented elsewhere. Secondary data
collection is cost effective and provides data that are permanent as well as
available in a form that can be checked by others (Kothari, 2004). In this
regard, the researcher used a number of documents including
organizational profiles, annual reports and literatures including books,
journal articles, published and unpublished materials available online
relevant to the topic. This helped the researcher to get wider
understanding of the topic, be able to analyze data and make conclusion
and give recommendations.
FINDING AND DISCUSSION
The Extent of Use of the Available Sewerage System
DUWASA reports show that only 10% of the Dodoma city population is
connected to sewerage system while the remaining 90 % use other means
of disposing waste water. Sewerage coverage network by the year 2018
176
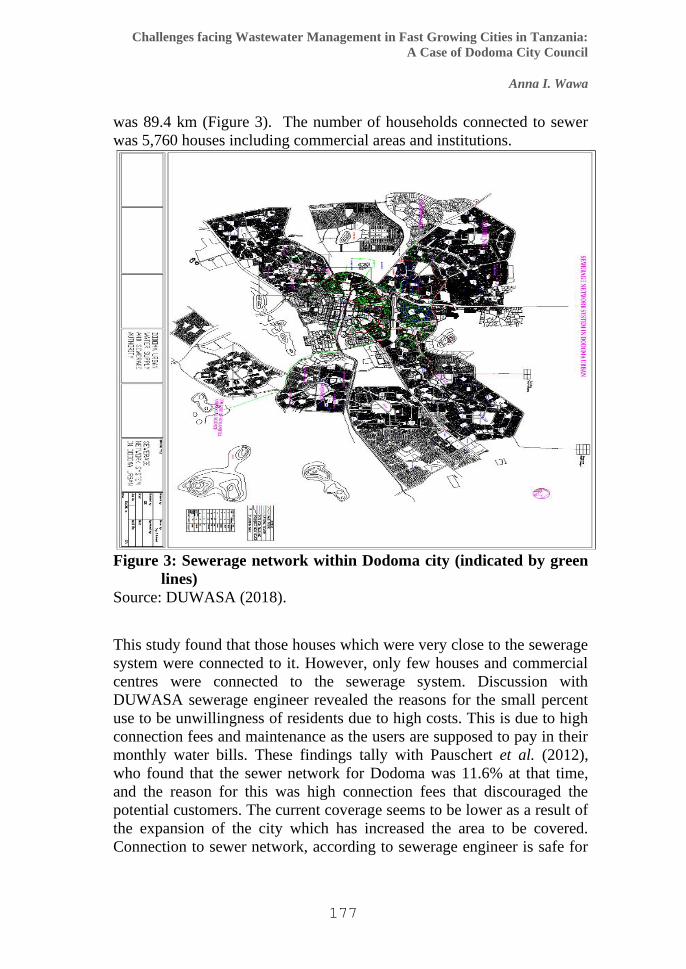
Challenges facing Wastewater Management in Fast Growing Cities in Tanzania:
A Case of Dodoma City Council
Anna I. Wawa
was 89.4 km (Figure 3). The number of households connected to sewer
was 5,760 houses including commercial areas and institutions.
Figure 3: Sewerage network within Dodoma city (indicated by green
lines)
Source: DUWASA (2018).
This study found that those houses which were very close to the sewerage
system were connected to it. However, only few houses and commercial
centres were connected to the sewerage system. Discussion with
DUWASA sewerage engineer revealed the reasons for the small percent
use to be unwillingness of residents due to high costs. This is due to high
connection fees and maintenance as the users are supposed to pay in their
monthly water bills. These findings tally with Pauschert et al. (2012),
who found that the sewer network for Dodoma was 11.6% at that time,
and the reason for this was high connection fees that discouraged the
potential customers. The current coverage seems to be lower as a result of
the expansion of the city which has increased the area to be covered.
Connection to sewer network, according to sewerage engineer is safe for
177
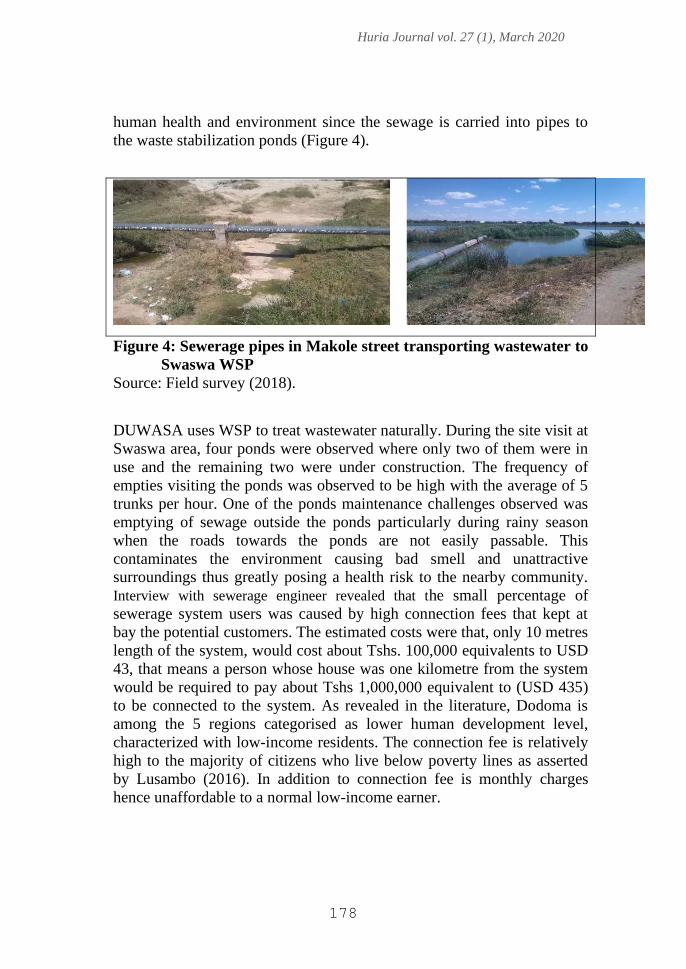
Huria Journal vol. 27 (1), March 2020
human health and environment since the sewage is carried into pipes to
the waste stabilization ponds (Figure 4).
Figure 4: Sewerage pipes in Makole street transporting wastewater to
Swaswa WSP
Source: Field survey (2018).
DUWASA uses WSP to treat wastewater naturally. During the site visit at
Swaswa area, four ponds were observed where only two of them were in
use and the remaining two were under construction. The frequency of
empties visiting the ponds was observed to be high with the average of 5
trunks per hour. One of the ponds maintenance challenges observed was
emptying of sewage outside the ponds particularly during rainy season
when the roads towards the ponds are not easily passable. This
contaminates the environment causing bad smell and unattractive
surroundings thus greatly posing a health risk to the nearby community.
Interview with sewerage engineer revealed that the small percentage of
sewerage system users was caused by high connection fees that kept at
bay the potential customers. The estimated costs were that, only 10 metres
length of the system, would cost about Tshs. 100,000 equivalents to USD
43, that means a person whose house was one kilometre from the system
would be required to pay about Tshs 1,000,000 equivalent to (USD 435)
to be connected to the system. As revealed in the literature, Dodoma is
among the 5 regions categorised as lower human development level,
characterized with low-income residents. The connection fee is relatively
high to the majority of citizens who live below poverty lines as asserted
by Lusambo (2016). In addition to connection fee is monthly charges
hence unaffordable to a normal low-income earner.
178

Challenges facing Wastewater Management in Fast Growing Cities in Tanzania:
A Case of Dodoma City Council
Anna I. Wawa
Interview with the City Council Health department officer revealed other
methods of disposing waste water in Dodoma city were septic tanks,
sewerage ponds, and storm water drainage. Use of septic tanks is the main
method of disposing waste water in Dodoma city. During site visits,
septic tanks were observed in many houses in the study area. Septic tanks
are large air-tight holes in the ground lined with bricks or concrete with
an inlet pipe for incoming sewage and outlet pipe for treated sewage. The
tank has a removable concrete cover with air vents for gases to escape. In
emphasizing this, the municipal health officer had these to say;
Septic tanks were ascertained as more hygienic because
sewage does not come out to the ground surface and does
not occupy floor area on the roadsides or impair the
beauty of the surroundings
Sewer trunks come to suck sewage in households, transport and dump it
into sewage reservoir pond at Swaswa WSP (Figure 5).
Figure 5: Trunk emptying collected wastewater to WSP at Swaswa in
Dodoma
Source: Field survey (2018)
179

Huria Journal vol. 27 (1), March 2020
However, carefulness is required in handling sewage in septic tanks. This
is substantiated by a study by Marshall (2005) in Jakarta. The author
found that in Jakarta, there were more than one million septic tanks in the
city, but they were poorly maintained and had contaminated the ground
water with faecal coli form bacteria. The contents in tanks (untreated)
were often emptied illegally into water ways. During interviews with
DUWASA officials, it was revealed that during rainy season septic tanks
do overflow hence their users opt to empty their contents in seasonal
rivers and water channels thus posing health risks to city dwellers. Storm
water drainage is another method used to dispose sewage in the study
area. In this method, people construct small outlets at the ground level
that discharge wastewater into storm water drainage constructed by the
city council. This was mainly observed along market places and the
houses located close to the storm drainage system, the sewage flows
directly to the drainage and is carried to natural rivers. Since the water in
storm drainage system mixes with wastewater, it is exposed to the
environment. Again, posing health risk as some people are tempted to use
it for irrigation of rice farms and children sometimes play with it.
The Challenges facing DUWASA in Wastewater Management
The study revealed challenges facing wastewater disposal in Dodoma city
including financial constraints, incomplete construction of WSP, and use
of partly treated water for agriculture, and the low use of the existing
sewer network by the customers.
Financial Constraints
Interview with the sewerage engineer revealed that DUWASA was facing
financial problems which were hindering the required department from
connecting all the houses to the sewage network and maintaining the
existing sewer system. With a particular focus on this, the engineer
narrated that,
Financial problems hinder the reconstruction of the lines
which are frequently affected by salinity and gases. There
have been frequent collapses of concrete pipes which require
frequent maintenance but suffer from lack of funds. Lack of
funds also hinders the expansion of the network to new
customers. Additionally, our customers fail to connect to sewer system due to high installation costs. As a result, DUWASA
provides services to only 10% of the total population of
Dodoma city.
180

Challenges facing Wastewater Management in Fast Growing Cities in Tanzania:
A Case of Dodoma City Council
Anna I. Wawa
The Use of Temporarily Constructed WSP in Dodoma City
According to sewerage and environmental engineer, WSP at Swaswa lack
maturation pond which is an important stage in the biological waste water
treatment. Again, the current WSP are confined; surrounded by residential
areas in such a way that there is no room for extension and for that they
pose potential risk of health to the surrounding community. Generally, the
current waste water treatment units do not meet the Tanzanian standards
to the effluent and how to reduce the environmental impacts to the
surrounding. Functioning of WSP is also affected by shortages of
unblocking tools and equipment to disludge the ponds as revealed by
WSP attendant. This causes a high concentration of dirtiness (Biological
Oxygen Demand (BOD) that affects the functioning microorganisms to
decompose the wastes.
Blockage of Sewerage System and Use of Partially treated
Wastewater
The interview with Sewerage engineer revealed the problem of frequent
blockage of sewerage system caused by solid waste entering into the
system,
Overflowing of sewage in the city is a common problem.
This is often caused by blockage of chambers. This has
been reported to be caused by residents who illegally use
the sewerage system to dispose solid wastes into sewers.
Furthermore, the scattered solid wastes particularly
plastic bags also enter the open chambers. Blockage of
sewerage system discourages other users to continue using
the sewerage system and therefore opt to use other
methods.
Bodo (2019) argues that high rates of urbanization affect land, water, and
air because of the large number of people, the number of buildings and
the increased demands on the available resources in the cities. The lack of
sanitation and sewerage systems has been leading to the blockage of the
drainage system thus causing flooding in cities. Topographical structure
of Dodoma city, being a low land is prone to flooding particularly during
heavy rains. This has caused a mixing up of wastewater from septic tanks
and blocked chambers to environment natural streams which are health
risky to surrounding community. The use of partly treated wastewater was
also revealed by the study. During field visit at Swaswa WSP, the
181

Huria Journal vol. 27 (1), March 2020
researcher observed people using the waste water in the first pond that is,
the one not partially treated for irrigation activities.
The study by Mkude and Saria (2014) revealed the poor performance of
WSP in Dodoma in BOD, Nitrogen and Phosphorus removal, which was
associated with poor construction and partial completion of WSP, lacking
maturation stage. This stage is essential for polishing wastewater and
nutrient as well as pathogen removal. Sewerage engineers further
explained the challenges they were experiencing as the Authority when
trying to prohibit the use the partially treated water; sometimes they were
meeting resistance from the residents surrounding the areas who were
using this water for irrigation and construction activities. The WSP
attendant claimed to have sometimes been threatened by the users of the
wastewater hence hindering him from efficiently discharging the
operations of WSP. Furthermore, he disclosed that there were some
elements of underground politicians’ influences supporting the
community to use the wastewater regardless of its danger to their health.
He had these to say,
Politicians including ward Council members and
parliamentary members, particularly during election
period, tend to side with community members pretending
to deal with their concerns while preventing professionals
to perform their duties.
DUWASA’s Future plans for Improving Wastewater Management
During interview with DUWASA officials, the following were revealed
as future plans of the Authority to cope with the fast growth of the city;
first is to extend the sewer network to about 250km for trunks, sub trunks
and lateral sewer. Secondly, is to construct trunk sewers from the existing
ponds (Swaswa area) to the new proposed site for waste stabilization
ponds (WSP) at Nzuguni area. A third plan is that the Management of
sewer disposal trucks (Exhosters) should equalize the cost based on the
size and volume relatively to the disposal cost
Impacts of Sewage Disposal to the Public health
Discussion with Dodoma City health officer, revealed the eruption of
epidemics like typhoid, malaria and dysentery which are directly
associated with poor sewage disposal. It was revealed that vectors for the
182

Challenges facing Wastewater Management in Fast Growing Cities in Tanzania:
A Case of Dodoma City Council
Anna I. Wawa
disease were being nurtured in the stagnant water that had been created in
sewage outlets, drainage, puddles, and ponds. According to Dodoma City
Council Profile; the top 6 frequently occurring diseases in Dodoma City
included; malaria, urinary tract infection, diarrhoea, skin infections,
pneumonia and intestinal infection. Most of these are bacterial diseases
associated with the contaminated environment. The stagnant water
influences the breeding of mosquitoes and other water born disease
vectors. In addition, discussions with the health officer affirmed that these
diseases were mostly affecting children because they normally used to
play in storm water streams. This scenario is in line with WHO report
that; worldwide, 2.2million of people die each year from diarrhoea and
over half of the world’s hospitals beds are filled with people suffering
from water borne disease (UNDP, 2006). The experience of the researcher
being a resident of Dodoma City for 28 year agree with WHO report, the
most frequently mentioned diseases in Dodoma include typhoid, cholera
and Malaria. All these are linked to the contaminated environment.
CONCLUSION AND RECOMMENDATIONS
Urbanization has given rise to several challenges or problems such as, the
build-up squatter settlements and spread of diseases, inadequate waste
disposal and poor sanitation. Responsible authorities should come up with
workable solutions through review and implementation of policies.
Managing of sewage is intrinsically linked to management of the entire
water chain. Sewage disposal is an everyday activity as it is intertwined
with domestic, industrial, commercial, and agricultural activities.
Meanwhile, poor sewage disposal influences the spreading of water borne
disease, air pollution, and awful environment. The study recommends the
following: there should be collaborative efforts by DUWASA and the
City Council to facilitate smooth functioning of wastewater treatment in
Dodoma to match with the current growing speed of the City. The
responsible Ministry should support DUWASA in executing the planned
project of constructing larger Waste Stabilization Ponds away from
residential areas. DUWASA should also continue to create community
awareness on guidelines of reuse of wastewater for agriculture and the
associated dangers. The assessment of wastewater quality after WSP
treatment should be done to reduce the impacts on the public health and
environment at large.
183

Huria Journal vol. 27 (1), March 2020
REFERENCES
Bleninger, T. and Jirka, G. (2008). Modelling and Environmentally Sound
Management of Brine Discharge from Desalination Plants.
Desalination 221(1-3): 585-597
Bodo, T. (2019a). Rapid Urbanization: Theories, Causes, Consequences
and Coping Strategies. Annals of Geographical Studies, 2 (3): 32-45
Bruce, P., Ruth, B. and Barbara, K. (2015). A review on emerging
contaminants in wastewaters and the environment: Current knowledge,
understudied areas and recommendations for future monitoring.
Water Research, 72, 3-7.
Dodoma Municipal Council Profile (2016). Unpublished
Donde, O. (2017). Wastewater Management Techniques: A Review of
Advancement on the Appropriate Wastewater Treatment Principles
for Sustainability. Environmental Management and Sustainable
Development 6, No. 1 https://www.researchgate.net/publication
DUWASA, (2018); Annual Report, 2018; Unpublished
Hove, M., Ngwerume, E.T. and Muchemwa, C. (2013). The Urban Crisis
in Sub-Saharan Africa: A Threat to Human Security and
Sustainable Development. Stability: International Journal of
Security and Development, 2(1), p.Art. 7. DOI
https://www.stabilityjournal.org
Kothari, C. R. (2004). Research methodology: Methods and techniques
(2nd edn). New Delhi: New Age International Publisher Ltd.
Lusambo, L.P. (2016). Households’ Income Poverty and Inequalities in
Tanzania: Analysis of Empirical Evidence of Methodological
Challenges. J Ecosys Ecograph 6:183
Mkude, L.T. and Saria, J. (2014). Assessment of Wastewater Stabilization
Ponds (WSP) Efficiecny on Wastewater Treatment for Agriculture
Reuse and other Activities. A Case of Dodoma Municipality,
Tanzania. Ethiopian Journal of Environmental Studies &
Management 7(3):298-304 Marshall, J. (2005). Megacity, mega
mess. Nature, 437.
Malthus’ Theory of Population Growth; https://socialsci.libretexts.org/
Pauschert, D. Gronemeier, K. and Bruebach, K. (2012). Urban Water and
Sanitation Poverty in Tanzania. Evidence from the field and
recommendations for successful combat strategies GIZ, www.giz.de
UNDP (2006). Human Development Report, 2006. Beyond scarcity:
power, poverty and the global water crisis.
184

Challenges facing Wastewater Management in Fast Growing Cities in Tanzania:
A Case of Dodoma City Council
Anna I. Wawa
UNDP and URT (2018). Tanzania Human Development Report 2017
Social Policy in the Context of Economic Transformation.
Economic and Social Research Foundation, DSM
United Republic of Tanzania (2013). Tanzania National Population
Census report. Govt printer. Dar-es-Salaam
Varon, M.P. and Mara, D. (2004). Waste Stabilisation Ponds.
International Water and Sanitation Centre (IRC), University of
Leeds, UK.
185
Huria Journal vol. 27 (1), March 2020
Assessment of Beekeeping as an Adaptation Strategy to
Climate Change in Iramba District
Ziwa Elia Yohana1 and Josephat Saria2
[email protected], [email protected]
The Open University of Tanzania
ABSTRACT:
The effects of climate change in Tanzania affect rain fed agriculture and reduce
the productivity in most parts of Tanzania. Indigenous knowledge and different
agricultural strategies, on how to diversify to other agricultural activity like
beekeeping has been adopted by different communities in Tanzania, especially in
semi-arid areas. This paper focuses on assessing potentials of beekeeping as an
adaptation strategy against impacts of climate change in Iramba District. The
research used different methods in collecting information such as key
informants’ interviews, focus group discussions and observation methods.
Secondary data were collected through documentary review, while the
questionnaire was administered to 150 heads of households from four villages
namely: Kyalosangi, Galangala, Mdonkolo and Songambele. The results show
that over a period of 30 years, about 77% of respondents reported decrease in
maize and 78% decrease in sunflower productivity. In interviews, the
respondents indicated that they have shifted to beekeeping which contributes
more to household’s income than land tilling which is rain-fed. This is
supported by 33.1% who were attracted in beekeeping for income purposes. The
average honey production per hive ranges from 10 – 15 Lts/hive in top bar hives
and frame hives, while traditional hives ranges between 5 – 10 Lts/hive. This
study therefore recommends provision of appropriate capacity building and
financial support to beekeepers in order to optimize production of bee products
in the study area.
Keywords: climate change, adaptation strategy, agriculture, beekeeping,
rain-fed agriculture
INTRODUCTION
Recently, Tanzania has experienced severe and recurring droughts with
devastating effects to agriculture (IDRC, 2016). For the past decade, we
have witnessed a number of climate related disasters in many parts of the
186

Assessment of Beekeeping as an Adaptation Strategy to Climate Change in Iramba
District
Ziwa Elia Yohana, Josephat Saria
country such as widespread crop failures, flooding, extensive droughts,
livestock deaths and intensification of climate sensitive diseases among
others (Shemsangaet al., 2010). Climate variability, a precursor of climate
change, is already affecting Tanzania. Climatic patterns are becoming
both less predictable and more severe. For instance, a 1997 drought was
followed by a fivefold increase in rainfall in 1998, and then one of the
worst droughts in four decades in 1999 (Shemsanga et al., 2010). Rainfall
patterns are expected to become increasingly variable across the country,
with an increase in the north of 5 to 45 per cent and decreases of 5 to 15
per cent elsewhere (Mwandosyaet al., 1998).
Changes in rainfall reliability, onset and cessation can result in crop
failure and hunger, exacerbated by other stresses such as land degradation
and insecurity of land tenure. Agriculture is one of the human activities,
mostly affected by the climatic change (Sariaet al., 2015). However, the
impacts of climate change are not just of environmental concern, but will
impede efforts to tackle poverty and promote national development.
According to Saria et al. (2017) many human development systems have
been affected by these changes, particularly agriculture, water resources,
industry and human health. Yanda (2015), indicates that there is a positive
correlation between climate change and crop yields under the rain-fed
scenario. According to Ahmed et al. (2011), rainfall has significantly
decreased in Tanzania, especially in the recent years, and is further
expected to decrease by the middle of this century. It should also be noted
that such climatic impacts will not affect the country like Tanzania
uniformly due to diverse climatic patterns, from equatorial to semiarid
and arid climates. Saweet al. (2018) on assessment of the impacts of
climate change and variability on crop farming systems in Singida region,
found a decrease in rainfall, increase in temperature and increase in
incidences of droughts. The crop yield for maize and ground nuts have
shown a decreasing trend while that of millet has shown an increasing
trend proving that the crop was indeed versatile enough for this type of
climate regime (Mongi et al., 2010). Where rainfall will be less, fewer
crops and lower yields will be produced, thus negatively affecting
household food security. Food security exists when all people, at all
times, have physical and economic access to sufficient safe and nutritious
food that meets their dietary needs and food preferences for an active and
healthy life (Dilley and Boudreau, 2001).
187
Huria Journal vol. 27 (1), March 2020
In Tanzania for example, in 2013/2014 the food requirement was
7,656,673 tons but only 5,613,221 tons were produced; which is only
about 73%, making a food deficit of 2,043,452 tons (27%), leading to
serious implications to food security and poverty (URT, 2014).
Beekeeping is an efficacious tool in rural development as bees are
omnipresent and the required equipment and tools namely: hives, smokers
and protective clothing are locally made (Reddyet al., 2012). Losses in
the agricultural sector and spikes in food prices can push vulnerable
consumers into poverty (Milderet al., 2010). Vulnerability to climate
change is seen to disproportionately affect the poor owing to a number of
social, economic and physical factors that increases their exposure to the
impact of climate change shocks but at the same time limits their capacity
to cope and adapt (Pardeyet al., 2013). Climatechange has required
farmers to change crop species/varieties and modified management of
soils and sometimes application of water (Sacco et al., 2014). In addition,
farmers have developed strategies for pest management, including using
of pesticides (Klein et al., 2007).Due to expanding and emerging pests,
farmers in most African countries have started using a number of agro
chemicals (pesticides for crop pests, mosquitoes and household pests
control, herbicides for weeds), which, if improperly used, cause honeybee
colony losses and bring the real possibility of damaging the delicate
equilibrium in the honeybee colony, as well as the contamination of hive
products(Aynalem, 2017).
In spite of the existing beekeeping potential in Tanzania as a coping
strategy to climate change, the opportunity remains unexploited by most
of the people due to insufficient documentation on its profitability,
performance and specific contribution to poor people basic needs
(Mujuniet al., 2012). Beekeeping is still marginal with only 10-15% of
the households engaged in it (Kiddet al., 2001). The sub-sector is
basically accepted but subsistence in nature and it requires improvement
or support by the Government to improve it (Msalilwa, 2016). Tutuba and
Vanhaverbeke (2018) indicate that though honeybee contributes to the
national economy by generating some US$ 19 million per annum and
employing more than two million people, still this potential is not fully
exploited, and the sector is still non-commercial. Beekeepers in rural
areas still remain local and relatively poor (Msalilwa, 2016). The quality
and quantity produced per hive is still below average (MMA, 2012).
Moreover, exports of honey and beeswax have been declining despite the
rise in global demand and increase in investment (ITC, 2015). This paper
188
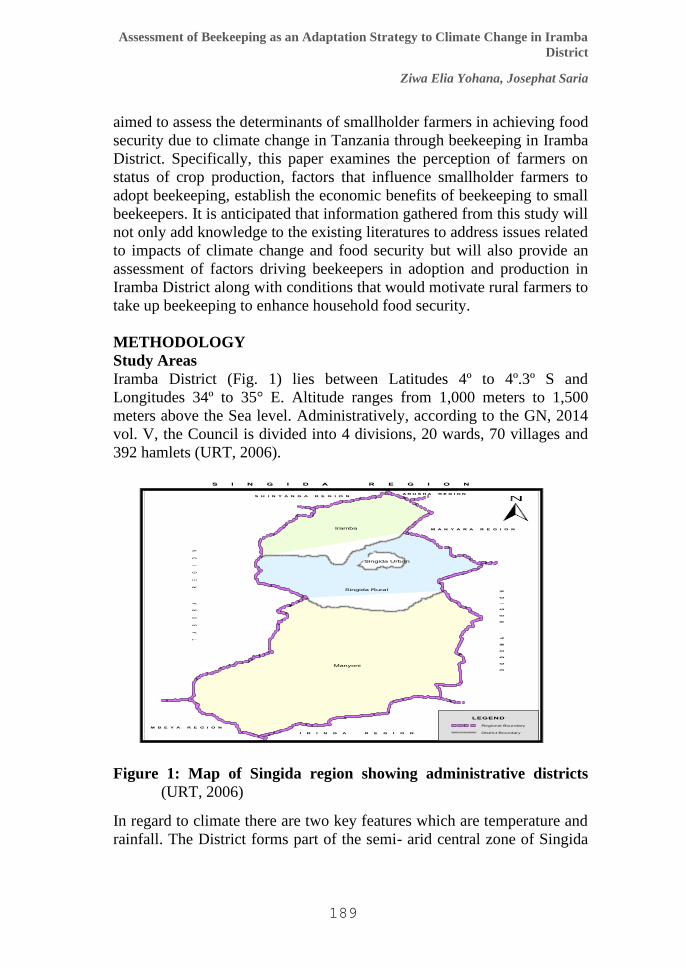
Assessment of Beekeeping as an Adaptation Strategy to Climate Change in Iramba
District
Ziwa Elia Yohana, Josephat Saria
aimed to assess the determinants of smallholder farmers in achieving food
security due to climate change in Tanzania through beekeeping in Iramba
District. Specifically, this paper examines the perception of farmers on
status of crop production, factors that influence smallholder farmers to
adopt beekeeping, establish the economic benefits of beekeeping to small
beekeepers. It is anticipated that information gathered from this study will
not only add knowledge to the existing literatures to address issues related
to impacts of climate change and food security but will also provide an
assessment of factors driving beekeepers in adoption and production in
Iramba District along with conditions that would motivate rural farmers to
take up beekeeping to enhance household food security.
METHODOLOGY
Study Areas
Iramba District (Fig. 1) lies between Latitudes 4º to 4º.3º S and
Longitudes 34º to 35° E. Altitude ranges from 1,000 meters to 1,500
meters above the Sea level. Administratively, according to the GN, 2014
vol. V, the Council is divided into 4 divisions, 20 wards, 70 villages and
392 hamlets (URT, 2006).
Manyoni
Iramba
Singida Rural
Singida Urban
LEGEND
Regional Boundary
District Boundary
S H I N Y A N G A R E G I O N
T
A
B
O
R
A
R
E
G
I
O
N
M A N Y A R A R E G I O N
A R U S H A R E G I O N
D
O
D
O
M
A
R
E
G
I
O
N
I R I N G A R E G I O N
M B E Y A R E G I O N
S I N G I D A R E G I O N
Figure 1: Map of Singida region showing administrative districts
(URT, 2006)
In regard to climate there are two key features which are temperature and
rainfall. The District forms part of the semi- arid central zone of Singida
189

Huria Journal vol. 27 (1), March 2020
which experiences monomial rainfall and the rain season interrupted by
two notable dry spells in mid-February and mid-March. The total annual
rainfall which is unimodal, it ranges from 500 mm to 850 mm per annum
with high geographical, seasonal and annual variation. There are two well
defined seasons, the short rainy season during the months of December to
March or sometimes goes to April and the long dry season from April to
November.
Methods
This study used a multistage sampling technique where three stages were
involved (Kothari, 2004). In the first stage Iramba district was selected
purposefully from the list of seven districts that constitute the beekeeping
in Singida region. In the second stage, two wards (2) Ndago and
Kinampanda out of 20 wardswere purposefully selected. The same
approach was used to select the four (4) villages two from each ward.
Ndago ward: Mdonkolo, Songambele and Kinampanda ward: Kyalosangi
and Galangala.
Field surveys, informative interviews, physical observations, group
discussions and literature reviews were the main approach of data
collection in the study area, where purposive sampling was employed to
sample beekeepers among the semi-arid districts of Tanzania mainly
based on the frequency of food shortage and other physical aspects
(FAO/UNESCO, 1988). Two types of data were collected which included
primary and secondary data. Primary data were collected from beekeepers
household heads or their respective representatives. Secondary data were
collected from Ward Executive Office (WEO), Village Executive Office
(VEOs), the District Beekeeping office (DBO), Extension Officers (EO),
District Forest Office (DFO), and IRDP library. The sampling unit was
households, and the sample size was 150 respondents (beekeepers) from
four villages, they were obtained using a formula developed by Yamane
(1967), that;
n = N/ [1+N (e)2]
Where by: n = sample size, N = sampling frame, e = prediction error 0.1
(10%). The sample size of the household survey consisted of 10% of the
total number of heads of households in each study ward. According to
URT (2007), total number of household’s beekeepers in Iramba district is
62,528. This gives; n =62,528/ [1+62,528(0.1)2], where, n = 99.86.
Therefore n = 100 respondents. Adding 15% we have 115 respondents
190
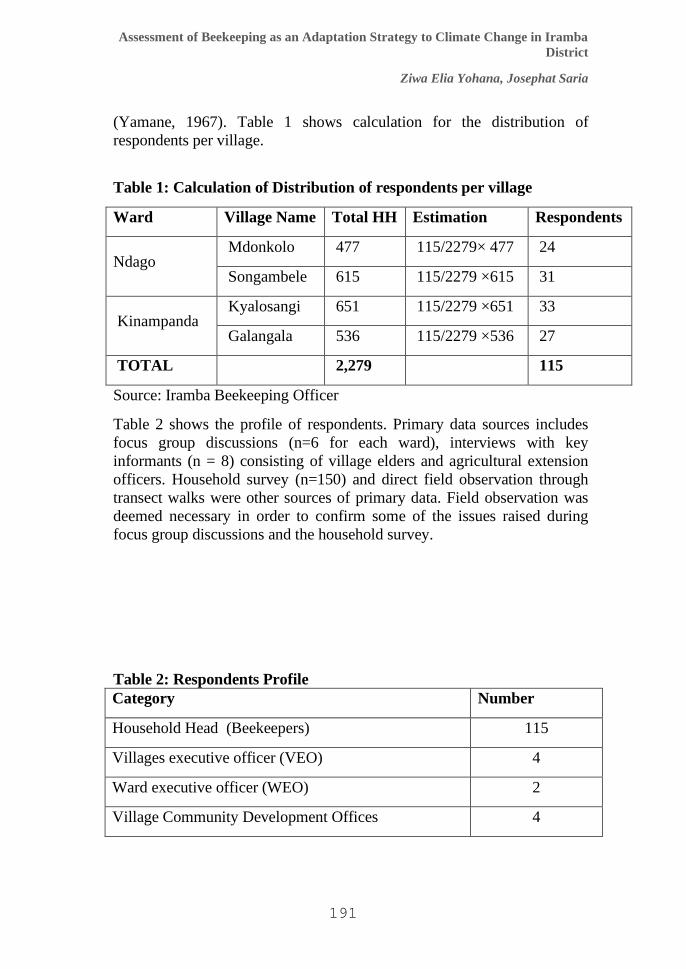
Assessment of Beekeeping as an Adaptation Strategy to Climate Change in Iramba
District
Ziwa Elia Yohana, Josephat Saria
(Yamane, 1967). Table 1 shows calculation for the distribution of
respondents per village.
Table 1: Calculation of Distribution of respondents per village
Ward Village Name Total HH Estimation Respondents
Ndago Mdonkolo 477 115/2279× 477 24
Songambele 615 115/2279 ×615 31
Kinampanda Kyalosangi 651 115/2279 ×651 33
Galangala 536 115/2279 ×536 27
TOTAL 2,279 115
Source: Iramba Beekeeping Officer
Table 2 shows the profile of respondents. Primary data sources includes
focus group discussions (n=6 for each ward), interviews with key
informants (n = 8) consisting of village elders and agricultural extension
officers. Household survey (n=150) and direct field observation through
transect walks were other sources of primary data. Field observation was
deemed necessary in order to confirm some of the issues raised during
focus group discussions and the household survey.
Table 2: Respondents Profile
Category Number
Household Head (Beekeepers) 115
Villages executive officer (VEO) 4
Ward executive officer (WEO) 2
Village Community Development Offices 4
191

Huria Journal vol. 27 (1), March 2020
District Beekeeping Officer (DBO) 1
District Forest Officers (DFO) 1
Agriculture Extension Officers 8
Beekeeping NGO working in study area 5
Village leaders 10
Total 150
Formation of FGD involved a purposive selection of ten (10) members
who represented households, where five (5) represented beekeepers
households and village elders, while three (3) represented agricultural
extension offices, two (2) represented extension officers, two (2)
beekeeping NGO representative. Secondary data such as publication
materials such as books, journal papers, original scientific work,
government reports and academic dissertation were consulted during
review to identify and bridge up the gap basing on the study’s objective.
Quantitative data were gathered using structured questionnaires as the
main tool. The structured questionnaire covered questions on main trends
of crop production in five years, the factors influencing beekeeping
practices, the quantity of honey produced, the implication of the financial
obtained to food security, and the major constraints in beekeeping.
Multiple response questions were analyzed so as to get frequencies and
percentages. After being collected from the field using questionnaire,
primary data were edited before punching them into the computer software
Statistical Package for Social Sciences (SPSS 11.5). Data were analyzed
mainly at univariate level where descriptive statistics and frequencies for
study variable were computed. Analyzed data in this paper have been
mainly presented in tables and graphs for meaningful interpretation and
discussion.
FINDINGS AND DISCUSSION
Respondents’ characteristics
Different characteristics have direct and indirect influence on the adoption
of bee keeping among rural farmers. During the study, different
parameters such as age, sex, gender of household head, education level
192
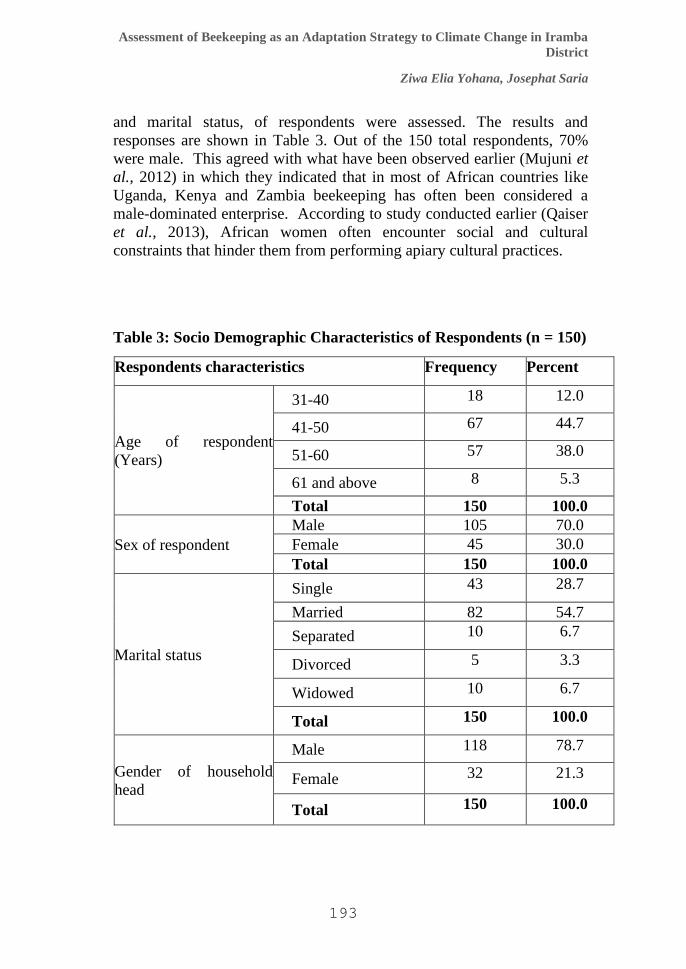
Assessment of Beekeeping as an Adaptation Strategy to Climate Change in Iramba
District
Ziwa Elia Yohana, Josephat Saria
and marital status, of respondents were assessed. The results and
responses are shown in Table 3. Out of the 150 total respondents, 70%
were male. This agreed with what have been observed earlier (Mujuni et
al., 2012) in which they indicated that in most of African countries like
Uganda, Kenya and Zambia beekeeping has often been considered a
male-dominated enterprise. According to study conducted earlier (Qaiser
et al., 2013), African women often encounter social and cultural
constraints that hinder them from performing apiary cultural practices.
Table 3: Socio Demographic Characteristics of Respondents (n = 150)
Respondents characteristics Frequency Percent
Age of respondent
(Years)
31-40 18 12.0
41-50 67 44.7
51-60 57 38.0
61 and above 8 5.3
Total 150 100.0
Sex of respondent
Male 105 70.0
Female 45 30.0
Total 150 100.0
Marital status
Single 43 28.7
Married 82 54.7
Separated 10 6.7
Divorced 5 3.3
Widowed 10 6.7
Total 150 100.0
Gender of household
head
Male 118 78.7
Female 32 21.3
Total 150 100.0
193

Huria Journal vol. 27 (1), March 2020
Education level
Non-Primary
education
22 14.7
Complete primary 113 75.3
Above primary
education
15 10.0
Total 150 100.0
These are bee-sting phobia, lack of time due to taking care of family
matters, inability to raise and harvest from the traditional bee-hive. The
small percentages of women practicing beekeeping could be those who
are either separated, divorced or widowed, and hence were the sole
breadwinners for their family. Namwataet al. (2013) indicate few women
participate in beekeeping, their apiaries are located on farms nearby their
homes, and beehives are sited on stands or short trees at reasonable height
easy for women to manipulate the bee colonies. The majority of
respondents (54.7 %) are married while the remaining are either single,
divorced or widow. The majority of beekeepers (44.7%) are at the age
ranges between 41-50 year. This is followed by 38% with the age range
between 51 – 60 years. The lowest are those old people with the age
above 60 (5.3%). The age between 40 – 60 years is known to be energetic
and they have family responsibility. Therefore, being active in beekeeping
makes more sense because traditional beekeeping in the area is a labour
intensive activity usually undertaken in the forests which need energetic
experienced people who are committed and able to bear life threatening
risks.
The majority of respondents (75.3%) completed primary education while
15% have no formal education and 10% have secondary education. These
results contrast with the results reported in Western Uganda where the
majority had attained formal education with 17.5% being tertiary
education graduates (Mujuni et al., 2014). However, this result shows the
majority of respondents have been exposed to education. Exposure to
education will increase ability of the keepers to obtain, process, and use
information relevant to the adoption of improved innovations of
beekeeping at their disposal. Namwata et al. (2013) indicate that
beekeepers with a minimum of basic education are more likely to adopt
improved beekeeping innovations and hence increase productivity of bee
194

Assessment of Beekeeping as an Adaptation Strategy to Climate Change in Iramba
District
Ziwa Elia Yohana, Josephat Saria
products. This is due to the fact that beekeeping is a self-employment
opportunity available in the study area.
Status of Crop Production in the Study Area
Agriculture has a significant contribution to economy of beekeepers’
households. Field surveys, and physical observations made show that the
most important cash and food crops commonly cultivated in Iramba
district were maize, sunflower (Helianthus annuus) beans, sunflower,
sweet potatoes (Ipomoea batatas) and groundnuts. Table 4 summarizes
the responses on the trends of crop productivity over the last 30 years
(1989 to 2019 years). It is discernible that maize (Zea mays L.) is the
main food crop, at both local and regional levels including countries like
Kenya, Uganda, Burundi and Rwanda. In Tanzania, maize accounts for
over 70% of the cereal food requirement (URT, 2013). Therefore, its
production has a strong link to food security. Majority of respondents
(77.3 %) indicated that maize production has declined for the past thirty
years. This is followed by 19.3% who shows the production of maize is
fluctuating.
Table 4: Trends of productivity of various agricultural crops over the
last 30 years (1989 to 2019years)
Trend Frequency Percent
Maize productivity
Increasing 2 1.3
Decreasing 116 77.3
Fluctuating 30 20.0
no change 2 1.3
Total 150 100.0
Beans productivity Increasing 3 52.0
Decreasing 4 2.7
Fluctuating 1 0.7
do not know 142 44.6
Total 150 100.0
Sorghum productivity
Decreasing 10 6.7
do not know 140 93.3
Total 150 100.0
195

Huria Journal vol. 27 (1), March 2020
Sunflower
productivity
Increasing 2 1.3
Decreasing 117 78.0
Fluctuating 29 19.3
no change 2 1.3
Total 150 100.0
Sweet potato
productivity
Decreasing 4 52.7
Fluctuating 1 0.7
do not know 145 46.6
Total 150 100.0
Groundnut
productivity
Decreasing 17 86.7
Fluctuating 3 2.0
do not know 130 11.3
Total 150 100.0
Meteorological data trends (Table 5), show that the study area
experienced eight dry seasons in a period of 14 years. The mean rainfall
seasonal per season in this area is 777.4 mm in the period between 1994
and 2011. This is an insufficient amount for requirements of many crops,
given inconsistency rainfall patterns demonstrated by higher standard
deviations. For example, maize rainfall requirement ranges from 500 to
2,000 mm, sorghum 250 to 1,200 mm, paddy 1,200 to 1,800 mm and
sunflower 600 to 1,000 mm per annum (TARO, 1987a).
Table 5: Measured Rainfall Variability during Growing Seasons in
Iramba District from 1994 to 2008 (Kabote et al., 2017) Period November December January February March April
1994-1998 71.0±68.9 195.6±197.6 140.2±68.1 158.8±49.5 151.8±112.8 120.8±56.1
1999 -
2003
123.6±84.8 139.1±54.0 192.4±97.2 60.1±26.4 202.2±57.1 87.6±45.3
2004-2008 67.3±50.6 112.9±59.3 149.9±65.7 65.7±134.7 135.3±100.4 66.6±69.1
Similar trend was observed to other food crops (Table 4); sunflower 78%
of respondents indicated the harvest was decreasing, groundnuts 86.7%.
Sorghum is among the dominant crops in the study area (semi-arid)
produced under smallholder farming (TARO, 1987b). It is among the
most drought resistant crops and therefore its resilience to climate change
impacts is a bit high. That’s why 93.3% of respondents do not see the
difference in production. Similar results were reported by Saweet
al.(2018) in the study conducted at Manyoni Singida district, there is a
196

Assessment of Beekeeping as an Adaptation Strategy to Climate Change in Iramba
District
Ziwa Elia Yohana, Josephat Saria
crop damaging and persistent of low harvest. These results collaborated
the results of Malley et al. (2009) who observed that productivity of crops
in semi-arid areas of central Tanzania was increasingly becoming
threatened by increasing drought frequency. According to Urassa (2016),
this is probably due to climate change, drought, depletion of plant
nutrients from the soil and infestation of crop pests and diseases.
Information from both focus group discussion and in-depth interviews
revealed that there is tremendous decline in crop production. The
response from key informant (male, 67 years old) from Songambele
village said:
My brother, since I moved to this village about 42 years
ago, I have never experienced this life of buying everything.
I have never bought maize, sorghum or beans for my family.
Previously I could harvest 10 bags of maize in my 2acre
farm, but recently I could hardly get a bag or two. The
increases in temperature have accelerated the increase in
drought in our village. Nowadays agriculture has become
unpredictable because even the rainfall amount has
decreased to the maximum.
Farmers’ perception on increasing rainfall unpredictability coincides with
higher standard deviations in monthly rainfall from the results determined
earlier (Kaboteet al., 2017). The higher standard deviations implying that
rainfall patterns are inconsistent in each month during crop growing
seasons, and some months receive much rain while others get
considerably low rains. These results coincide with farmers’ perceptions,
which show extending back of the dry spell from February to January
resulting into decreasing crop growing season. The rainfall in December
and April also shows a clear decreasing trend for the period between 1994
and 2008 in Iramba district (Table 5). Sweet potatoes are short duration
crops that are relatively drought tolerant therefore, the high in importance
in food security in semi-arid areas. About 52% of respondents indicated
that there is a decrease in production of sweet potatoes (Table 4). In focus
group discussion at Ndago ward, one respondent indicated,
When we came to this farm about five year ago, we
could harvest 10 bags or 8 bags of sweet potatoes.
Now, I only harvest 3 or 4 bags. Now, there is less
rain, they don't grow very well. I get a very poor
harvest (45 years old man).
197

Huria Journal vol. 27 (1), March 2020
Interview with respondents a 55-year-old female from Kyalosangi village
indicated,
for almost 10 years now we are experiencing different pests
who do not respond to any chemical. When I was young my
mother used to use ashes to kill pests. These days, the new
pests do not respond to any chemical. Probably, they are used
to high temperature. They are the one responsible to decline
of our harvest…
The only crop which shows increasing trend is beans. About 52% of
respondents indicated increase in yield of beans (Table 4). This is linked
with the introduction of new type of seed which are heat tolerant and
they are now commonly grown at the study area. In the survey made at
different seed companies, four different varieties were found in the
market. These were: Uyole 94, Lyamungo 90, Jesca,and Kablanketi.In
the discussion with extension officers about the variety preferred by
farmers they rank in the order of Jesca followed by Lyamungo 90 and
the lowest was Kablanket, which was in line with another study
conducted earlier (Hillockset al., 2006).
Different Reasons Motivating Small Holder Beekeepers
Figure 2 identifies difference reasons which motivate smallholder farmers
to be beekeepers. The majority of respondents (33.1%) reported they were
attracted in beekeeping for purpose of income generation, this is followed
by 31.1% of respondents who reported that they adapted out of own
motivation (personal interest) followed by 29.7% of respondents reported
that they keep bees just for food security.
198

Assessment of Beekeeping as an Adaptation Strategy to Climate Change in Iramba
District
Ziwa Elia Yohana, Josephat Saria
Figure 2: Different reasons motivate smallholder farmers to be bee
keepers (n = 150)
These results agree with the report by Paji (2016) where 50% of the
respondents were influenced by the need to increase the income, while
only 16% of the respondents got engaged in bee keeping activities due to
the fact that honey is medicinal and 6% of the respondents were
influenced by the need to obtain food. According to Dadant, (1980),
honey bees play a critical role in agriculture and beekeeping has many
relative advantages and importance that help farmers to improve their
livelihoods to ensure food security. Beekeeping conserves the natural
resource and contributes to the globe through environmental protection,
as beekeeping and agro-forestry are integrated activity. It also provides
valuable products like honey, beewax, propolis, bee venom and royal
jelly, which farmers use as source of income (Keralem, 2005; Doss,
2006).
Quantity of Honey Production
Under good management of beekeeping, harvested honey can reach up to
15 kg per hive per harvest. However, in Tanzania honey yield per hive is
generally low due to several factors. The production ranges of honey per
house hold in the study area are shown in Figure 3.
Figure 3: Honey Production per hive per Harvest per Household
Results in Figure 3 indicate that most respondents (42.7%) harvest 6 to 8
kg of honey per hive per harvest followed by 22.7% harvest 9 to12 kg per
hive, 19.3% harvest less than 5 kg per hive, 13.3% harvest 13 to 15 kg
and only 2% of respondents harvest more than 15 kg of honey per hive
per harvest. In average, more than 60% of beekeepers in Iramba District
199

Huria Journal vol. 27 (1), March 2020
harvest less than 9 kg of honey per hive per harvest. According to the
interview with Iramba District Beekeeping Officer (DBO) the total
number of house hold beekeepers is 396 with total number of 1,475 hives,
making an average of 3.7 hives per household. The hives are divided into
three categories: Top bar hives (146 hives), frame hives (682 hives) and
traditional hives (647 hives). The average honey production per hive
varies as production in top hives and frame bar ranges from 10 – 15
Lts/hive while traditional hives ranges between 5 – 10 Lts /hive.
These values concur with traditional hive determined earlier by Gidey and
Mekonen (2010), which is 8-15 kg/hive and 5-6 kg /hive. Tessega (2009)
in the modern hive produces twice as much to the traditional hives which
gave 15.6 kg per hive. The difference observed in honey yield between
traditional (the common in Iramba district) and modern hive might be due
to time of honey bees spent for building comb, while in the modern hive
the foundation sheet is prepared and provided by the beekeepers. This
might have enabled the honey bee colonies in modern beehives to spend
their time and energy on collecting nectar for honey than building new
combs.
Preference of Respondents to Beekeeping Compared to Crop
Agriculture
According to Mujuni et al. (2012), beekeeping is emerging as a very
successful agricultural practice for rural communities in less developed
countries mainly due to its economic benefits from the products of this
practice. Figure 4, indicates that the majority of respondents (63.4%)
prefer beekeeping compared to crop agriculture. Only 33.3% said thatit is
just like production of other crops and only 3.3% indicated it is less than
other crops.
200

Huria Journal vol. 27 (1), March 2020
Figure 4: Preference of respondents to beekeeping compared to
Agricultural crops
In the FGD the respondent indicated:
Beekeeping is the most profitable activity compared to
maize and other crops. Also, the price of honey is usually
very high compared to the labour it takes. Crops like
maize need rainfall, but honey does not
These findings agreed with Dalang (2001) who noted that on a
comparative basis, apiculture stands out conspicuously as a high revenue-
generating venture compared to arable cropping. The implication of the
above results is that given beekeeping, livestock production and crop
farming, beekeeping is a better enterprise to the study area community
because it generates a higher income for smallholder farmers. It is
estimated that 90% of honey produced in Tanzania is consumed as food
in Tanzania. A significant amount of honey is used to make local beer in
areas where honey is produced in huge volumes. In an interview with one
village elder from Mdonkolo village who is also beekeeper he indicated:
“I normally sell my honey to traditional beer brewers,
in an average of Tshs 8,0000 – 10,000 per liter. This
is because it is easy to get cash to meet my personal
requirements. I can get 60 Liter from my hives per
harvest; therefore, I am sure of getting about Tshs
600,000” (1 $ = 2230 Tshs).
201
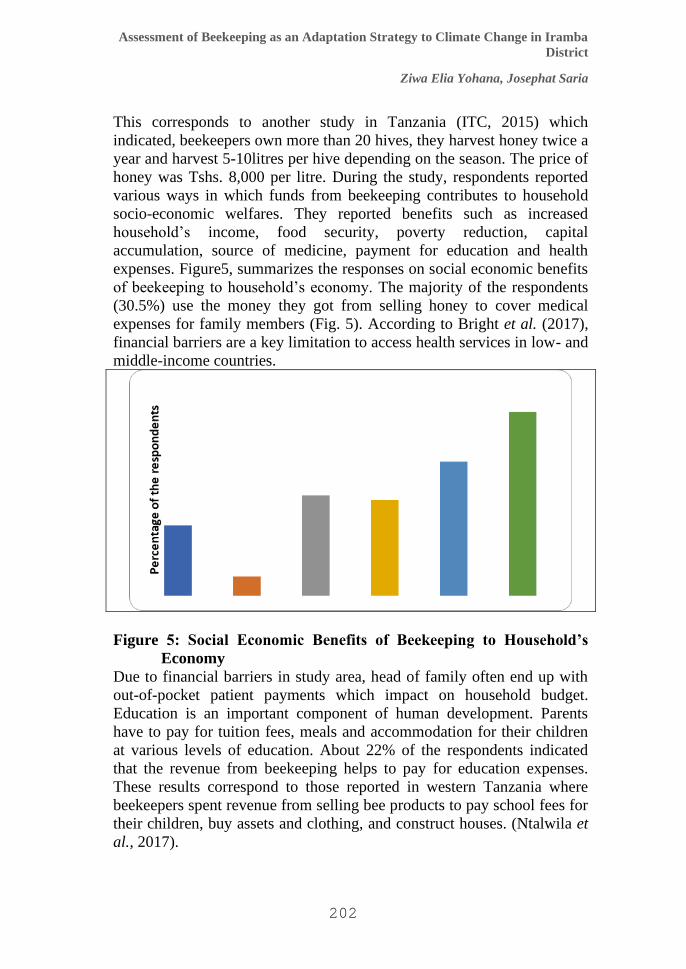
Assessment of Beekeeping as an Adaptation Strategy to Climate Change in Iramba
District
Ziwa Elia Yohana, Josephat Saria
This corresponds to another study in Tanzania (ITC, 2015) which
indicated, beekeepers own more than 20 hives, they harvest honey twice a
year and harvest 5-10litres per hive depending on the season. The price of
honey was Tshs. 8,000 per litre. During the study, respondents reported
various ways in which funds from beekeeping contributes to household
socio-economic welfares. They reported benefits such as increased
household’s income, food security, poverty reduction, capital
accumulation, source of medicine, payment for education and health
expenses. Figure5, summarizes the responses on social economic benefits
of beekeeping to household’s economy. The majority of the respondents
(30.5%) use the money they got from selling honey to cover medical
expenses for family members (Fig. 5). According to Bright et al. (2017),
financial barriers are a key limitation to access health services in low- and
middle-income countries.
Figure 5: Social Economic Benefits of Beekeeping to Household’s
Economy
Due to financial barriers in study area, head of family often end up with
out-of-pocket patient payments which impact on household budget.
Education is an important component of human development. Parents
have to pay for tuition fees, meals and accommodation for their children
at various levels of education. About 22% of the respondents indicated
that the revenue from beekeeping helps to pay for education expenses.
These results correspond to those reported in western Tanzania where
beekeepers spent revenue from selling bee products to pay school fees for
their children, buy assets and clothing, and construct houses. (Ntalwila et
al., 2017).
202

Huria Journal vol. 27 (1), March 2020
Major Beekeeping Constraints Faced by Farmers in the Study Area
Based on the result of this study, the major constraints faced by
beekeepers were: lack of reliable market, bush fire, theft of hive and
products, drought, limited knowledge, pests and diseases, lack of common
flowers and poor technologies as summarized in Table 6. When asked
about the constraints that faces beekeepers, respondents reported several
problems. Results in Table 6 show that 15.2% of the respondents reported
drought as the major problem facing bee keepers in the study area. Due to
drought few flowers bloom hence bees cannot access the honey. This is
evident from a number of respondents (12.7%) who said that due to
drought common flowers are not available these days.
Table 6: Problems facing Bbeekeeping in the Study Area (Multiple
response)
Problems facing beekeepers Frequency Percentage
Aggressiveness of bees 11 1.2
Limited space 48 5.1
Limited market for bee products 135 14.2
Bush fire 146 15.4
Theft of hive and products 10 1.1
Drought 144 15.2
Limited knowledge 136 14.3
Pests and diseases 59 6.2
Lack of common flowers 121 12.7
Poor technology 140 14.7
Urassa et al. (2016) observed that in Iramba district, agricultural
production is poorly performing, mainly due to low and erratic rainfall,
which range between 500 and 800 mm per annum. As it is in Singida
region as a whole, famine is a common phenomenon in the district due to
lack of rainfall and droughts. Drought has caused many problems
including bush fire rated by 15.4% of the respondents. Kumar et al.
(2012) indicates that the use of fires may increase the risk of accidental
wild fires especially during dry months. Markets for honey and other bee
products in Tanzania are not fully established. Beekeepers in Iramba
Districts are mainly smallholders who depend on local markets to sell the
honey produced. The market is unstructured and unreliable due to
inadequate customers, difficult transportation, lack of realization of the
honey value and inadequate ability of beekeepers to search for markets.
203
Assessment of Beekeeping as an Adaptation Strategy to Climate Change in Iramba
District
Ziwa Elia Yohana, Josephat Saria
Namwataet al. (2013) reported that bee keeping industry face a series of
drawbacks namely technology, market, equipment, climate,
transportation, credit accessibility, lack of training/skills and cultural
practices.
This corresponds to findings by Tutuba and Vanhaverbeke, (2018) who
established that commercialization of beekeeping in Tanzania is
constrained by low market prices and poor, marketing systems and
limited market information. These results also compare with Arse et al.
(2010), who reported on the shortage of honeybee forages, shortage of
honey bee colonies, poisoning by agro-chemicals, shortage of modern
hives, prevalence of honeybee enemies and market problems, shortage of
improved bee equipment, absconding and swarming problems, prevalence
of honeybee diseases, lack of knowledge of the right harvest time and
theft problems as the major beekeeping constraints. This is in line with
the work of Kerealem et al. (2005) which stipulates that drought is the
main constraint of bee keeping. These constraints have a direct and
indirect effect on the reproduction and productivity of honeybees.
CONCLUSION AND RECOMMENDATIONS
This study provided information on the current status of beekeeping in
two wards inIramba District as adaptation strategies against impacts of
climate change in the district. Climate change is evident due to rainfall
patterns inconsistent in each month during crop growing seasons, most of
Iramba district receive considerably low rains. This situation has caused
frequent food shortages and famine. In order to respond to the impact of
climate change in Iramba district, smallholder farmers opt for beekeeping
instead to crop production as the source of food and income to meet the
family basic needs. The honey production has played a critical role in
agriculture and beekeeping has many relative advantages and importance
that help farmers to improve their livelihoods, and food security.
Since food security cannot be achieved without income security,
beekeeping could be a useful tool for improving rural economy. It is
hereby recommended to have the capacity building for beekeepers so that
they can get knowledge about the various practices employed in
beekeeping through a mixture of practical and theoretical sessions.
204

Huria Journal vol. 27 (1), March 2020
Sessions should involve the practices necessary to ensure the cultivation,
management and maintenance of healthy beehives. Beekeepers must be
introduced to the biodiversity-friendly, livelihood opportunity that
beekeeping provides. As an entrepreneurial avenue, beekeeping can have
positive impacts on biodiversity and ecosystems, in addition to serving as
a source of income to provide a level of financial sustainability to
farmers.
REFERENCES
Ahmed, S., Deffenbaugh, N. Hertel, T. Lobell, D., Ramankutty, N., Rios,
A. and Rowhani, P. (2011). Climate Volatility and Poverty
Vulnerability in Tanzania. Global Environmental Change 21: 46–
55
Arse, G., Tesfaye, K, Sebsibe, Z., Tekalign, G., Gurmessa, U., Tesfaye, L.
and Feyisa, H. (2010). Participatory Rural Appraisal Investigation
on Beekeeping in Arsi Negelle and Shashemene Districts of West
Arsi zone of Oromia, Ethiopia. Livest.Res. Rural Dev. 22:120
Aynalem, T. (2017), Beekeeping, Climate Change and Food Security:
The Case of Eastern Amhara Region, Ethiopia. Livestock
Research for Rural Development 29(5):18-22
Bright, T., Felix, L., Kuper, H. and Polack, S. (2017). A Systematic
Review of Strategies to Increase Access to Health Services among
Children in Low- and Middle-Income Countries. BMC Health
Serv Res. 17:252 -264
Dadant, C. P. (1980). First Lesson in Beekeeping, Revised edition. New
York: Charles Scripler’s Sons.
Dalang, M. (2001). Apiculture and Poverty Alleviation. Plateau
Agricultural Development Programme. PADPNewsletter 4(5)6-9
Dilley, M. and Boudreau, T. E. (2001). Coming to Terms with
Vulnerability: A Critique of the Food Security Definition. Food
Policy, 26(3):229-247
Doss, C. R. (2006). Analyzing Technology Adoption Using Micro
Studies: Limitations, Challenges, and Opportunities for
Improvement. Agricultural Economics 34(3):207-219
FAO/UNESCO (1988). Soil Map of the World, Revised Legend, with
Corrections and Updates; World Soil Resources Report 60;
205

Assessment of Beekeeping as an Adaptation Strategy to Climate Change in Iramba
District
Ziwa Elia Yohana, Josephat Saria
Reprinted with Updates as Technical Paper 20; ISRIC:
Wageningen, The Netherlands
Gidey, Y., Bethelhem, K., Dawit, K. and Alem, M. (2012). Assessment of
Beekeeping Practices in AsgedeTsimbla District, Northern
Ethiopia: Absconding, Bee Forage and Bee Pests.African Journal
of Agricultural Research 7(1):1-5
Hillocks, R. J., Madata, C. S., Chirwa, R., Minja, E. M. and Msolla, S.
(2006). Phaseolus Bean Improvement in Tanzania, 1959–
2005. Euphytica, 150 (1-2):215–231
International Development Research Centre (IDRC) (2016). Review of
Current and Planned Adaptation Action in Tanzania, CARIAA
Working Paper no. 14 Alec Crawford
International Trade Center (ITC) (2015). Tanzania Honey Sector
Synthesis Report and Development Road Map. ITC, Palais des
Nations, Geneva, Switzerland.
Kabote, S. J., Mamiro, D. P., Synnevåg, G., Urassa, J. K. and Mattee, A.
Z. (2017). Perceived and Measured Climate Variability and
Change in Semi-arid Environments in Tanzania: Experiences from
Iramba and Meatu Districts.Int. J. Environment and Sustainable
Development, 16(1):1-24
Keralem, E. (2005). Honey Bee Production System, Opportunities and
Challenges in Enebse Sar Midir Wereda (Amhara Region) and
Amaro Special Wereda (Southern Nations, Nationalities and
Peoples Region), Ethiopia. M.Sc. Thesis Alemaya, University,
Ethiopia
Kerealem, E., Gebey, T. and Preston T. R. (2009). Constraints and
Prospects for Apiculture Research and Development in Amhara
region, Ethiopia.Livest. Res. Rural Dev. 21:172 - 186
Kidd, A. D., Christoplos, I., Farrington, J. and Beckman, M. (2001).
Extension, Poverty and Vulnerability in Uganda: Country Study
for The Neuchatel Initiative: Overseas Development Institute
Klein, A., Vaissiere, B. E., Cane, J. H., Steffan, D., Cunningham, S. A.,
Kremen, C. and Tscharntke, T. (2007). Importance of Pollinators
in Changing Landscapes for World Crops. Proceeding of the
Royal Society B. Biological Sciences 274: 303-313
Kothari, C. (2004). Methods and Technique. In Research Methodology,
2nd ed., New Delhi, India: New Age International Publisher.
Kumar, S. M., Ranjit, S. A. and Alagumuthu, G. (2012). Traditional
Beekeeping of Stingless Bee (trigona sp) by Kani Ttribes of
Western Ghats, Tamil Nadu, India. Indian Journal of Traditional
Knowledge, 11(2):342–345
206

Huria Journal vol. 27 (1), March 2020
Malley, Z. J., Taeb, M. and Matsumoto, T. (2009). Agricultural
Productivity and Environmental Insecurity in the Usangu Plain,
Tanzania: Policy implications for sustainability of agriculture.
Environment, Development and Sustainability 11(1):175-195
Milder, J. C., Scherr, S. J. and Bracer, C. (2010). Trends and Future
Potential of Payment for Ecosystem Services to Alleviate Rural
Poverty in Developing Countries. Ecol. Soc. 15:4-8
MMA (2012). Kigoma Honey Subsector and Value Chain Analysis
Report, Study Commissioned by Beekeeping Support Project
Kigoma Region
Mongi, H., Majule, A. E. and Lyimo, J. (2010). Vulnerability and
Adaptation of Rain-fed Agriculture to Climate Change and
Variability in Semi-Arid Tanzania. African Journal of
Environmental Science and Technology 4(6):371-381
Msalilwa, G. L. (2016). Performance and Contribution of Beekeeping
Enterprises to Livelihood in Songea District, Master of Science in
Agricultural and Applied Economics of Sokoine University of
Agriculture, Morogoro, Tanzania
Mujuni, A., Natukunda, K., Kugonza, D. (2012). Factors Affecting the
Adoption of Beekeeping and Associated Technologies in
Bushenyi District, Western Uganda. Livestock Research for Rural
Development, 24:08
Mujuni, A., Natukunda, K., Kugonza, D. R. (2014). Factors Affecting the
Adoption of Beekeeping and Associated Technologies in
Bushenyi District, Western Uganda. MSc, Makerere University,
Uganda
Mwandosya, M. J., Nyenzi, B.S. and Luhanga, M. L. (1998). The
Assessment of Vulnerability and Adaptation to Climate Change
Impacts in Tanzania. Dar es Salaam. Centre for Energy,
Environment, Science and Technology (CEEST).
Namwata, B. M. L., Mdundo, K. J. and Malila, M. N. (2013). Potentials
and Challenges of Beekeeping Industry in Balang’dalalu Ward,
Hanang’ District in Manyara, Tanzania Kivukoni Journal 1(2):75
-93
Ntalwila, J., Mwakatobe, A. Kipemba, N., Mrisha, C., Kohi, E. (2017).
Contribution of Beekeeping to Livelihood and Biodiversity
Conservation in–Inyonga Division (Mlele District) Western
Tanzania. International Journal of Entomology Research, 2(6):33
– 38
Paji, K. (2016). Contribution of Beekeeping Towards Rural Household
Livelihood in Tanzania: The Case of Two Selected Wards Mlali
207
Assessment of Beekeeping as an Adaptation Strategy to Climate Change in Iramba
District
Ziwa Elia Yohana, Josephat Saria
and Chamkoroma in Kongwa District, Master’s Thesis, Dodoma
University.
Pardey, P. G., Alston, J. M. and Chan-Kang, C. (2013). Public
Agricultural R&D over the Past Half Century: An Emerging New
World Order.” Agric. Econ. 44: 103–113.
Qaiser, T., Ali, M., Taj, S., and Akmal, N. (2013). Impact Assessment of
Beekeeping in Sustainable Rural Livelihood, Journal of Social
Sciences (COES&RJ-JSS) Vol. 2
Reddy, P. V., Verghese, A. and Rajan, V. V. (2012). Potential Impact of
Climate Change on Honeybees (Apis spp.) and their Pollination
Services. Pest Management in Horticultural Ecosystems,
18(2):121-127
Sacco, S. J., Jones, A. M., Sacco, R. L. (2014). Incorporating Global
Sustainability in the Business Language Curriculum. Global
Business Languages. 19(1):3 – 17
Saria, J. A., Gwambene, B., Jiwaji, N.T., Pauline, N.M., Msofe, N.K.,
Mussa, K. R., Tegeje, J.A., Messo, I., Mwanga, S.S. and Shija,
S.M.Y. (2015). Smallholder Farmers’ Practices and
Understanding of Climate Change and Climate Smart Agriculture
in the Southern Highlands of Tanzania. Journal of Resources
Development and Management 13:37-47
Saria, J. A., Nderumaki, V. A. and Mkanda, F. X. (2017). Effect of
Expansion of Cultivation on Pastoralism as a Food-Security
Measure in Longido District, Northern Tanzania. International
Journal of Environmental Monitoring and Analysis 5(6):159 – 166
Sawe, J., Mung’ong’o, C. G. and Kimaro, G. F. (2018). The Impacts of
Climate Change and Variability on Crop Farming Systems in
Semi-Arid Central Tanzania: The Case of Manyoni District in
Singida Region. African Journal of Environmental Science and
Technology12(9):323-334
Shemsanga, C., Omambia, A. N. and Gu, Y. (2010). The Cost of Climate
Change in Tanzania: Impacts and Adaptations. Journal of
American Science, 6(3):182-196
Tanzania Agricultural Research Organization (TARO) (1987a).
Recommendations for Maize Production in Tanzania, 24pp,
TARO, Dar-es-Salaam.
Tanzania Agricultural Research Organization (TARO) (1987b).
Recommendations for Sunflower Production in Tanzania, 21pp,
TARO, Dar-es-Salaam.
Tessega, B. (2009). Honeybee Production and Marketing Systems,
Constraints and Opportunities in Burie District of Amhara Region,
208

Huria Journal vol. 27 (1), March 2020
Ethiopia. MSc Thesis, Department of Animal Science and Technology.
Bahir Dar University, Ethiopia
Tutuba, N. and Vanhaverbeke, W. (2018). Beekeeping in Tanzania: Why
is Beekeeping not Commercially Viable in Mvomero? Africa
Focus, 31 (1): 213-239.
United Republic of Tanzania (URT) (2014). Review of Food and
Agricultural Policies in the United Republic of Tanzania; MAFAP
Country Report Series; FAO: Rome, Italy
Urassa, J.K., Nombo, C.I., Kabote, S.J., Mamiro, D.P., Mbwambo, J.S.,
Mattee, A.Z., Matata, L.M. and Synneåg, G. (2016). Climate
Change and its Variability on Crop Production in Semiarid Areas
of Iramba and Meatu Districts, Tanzania. African Development,
Vol. 32, Special Issue,
URT (2007). National Sample Census of Agriculture Volume Vm:
Regional Report: Singida Region, National Bureau of Statistics,
Ministry of agriculture and Food Security, Presidents Office,
Regional Administration and Local Government
URT (2013). National Agriculture Policy; Government Publishing Press:
Dar es Salaam, Tanzania, 2013.
URT (2006). Agricultural Sector Review 2006: Performance, Issues and
Options, Ministry of Agriculture, Food Security and Co-
operatives, October, Dar es Salaam.
Yamane, T. (1967). Statistics, an Introductory Analysis, 2nd Ed., New
York: HarRow
Yanda, P. Z. (2015). Climate Change Implications for Management and
Use of Agricultural Biodiversity Resources in Africa.
Environment and Ecology Research 3(2):35–43
Acknowledgement
Our acknowledgement is directed to Iramba District Executive Director’s
(DED) office, ward officers of Ndago and Kinampanda, ward extension
officers for allowing us to interview smallholder farmers on their areas.
We also acknowledge the community from Iramba District for providing
us with the information and all others who in one way or another
facilitated the completion of this work.
209

HURIA JOURNAL
Guide for Authors
SCOPE
Huria Journal is an international journal that publishes original research papers of academic
interest (theoretical, applied and general), targeting tertiary institutions and researchers and is
therefore hospitable to scholarly writing on a variety of academic topics ranging from education,
humanities, social sciences and all cross-cutting issues related to societal transformation in
developing countries. The types of contribution range from original research papers, review
articles and technical notes. Submitted papers are subject to a blind peer review by reputable
researchers who are experts in the relevant fields. Papers are evaluated for the quality of research
as well as the relevance and accessibility for an international audience. The journal is published
triennially in March July and December.
Other websites related to this journal: https://journals.out.ac.tz/; http://ajol.info/index.php/huria
Original research articles: Research articles that make a substantial original contribution to
research practice or policy in any research area. Research articles are contributions that have the
purpose of publication of original unpublished research which may be reproduced and generalized.
They should be between 3000 and 5000 words. Excluding tables, figures and references. The
original research article should follow the conventional structure: Introduction, materials and
methods, Results and Discussion.
Short communication: Short communications are intended to provide preliminary research results
or unpublished hypotheses of public relevance. Short communications may contain an abstract,
and can be organized either along the lines of a regular manuscript, or without subdivisions. The
accompanying abstract should not exceed 200 words. Authors may also consider combining the
results and discussion sections. They should be up to 2500 words and include a table or figure and
preferably not more than five references.
Letters to the editor: These include letters which seek to discuss recent articles published in Huria
Journal or report on original research or significant findings. They should not exceed 600 words
and five references.
Reviews: Huria Journal welcomes papers relating to any research themes. Reviews should
emphasize the implication of reviewed literature for future
Huria Journal Vol 26 (1), March 2019
practical applications and policy implications. A review paper should not exceed 8,000 words.
Submission of Manuscripts
Manuscripts must be submitted with a cover letter stating that all authors (in case of multiple
authors) agree with the content and approve of its submission to the journal. Only materials that
have never been published or being submitted for publication elsewhere will be considered. All
210

submissions will be critically peer-reviewed by at least two anonymous reviewers who will be
looking for originality, relevance, clarity, appropriateness of the methods, validity of data,
reasonability of the conclusion and support from data.
Manuscripts that are written in clear and grammatical English should be submitted in both
electronic and hard copy to:
Editor-in-Chief
Huria Journal
The Open University of Tanzania
P. O. Box 23409
Dar es Salaam, TANZANIA
Tel: 255+ (022) 2668820
(022) 2668445
Fax: 255+ (022) 2668759
e-mail: [email protected]/or [email protected]
magreth.bushesha @out.ac.tz
There are no submission fees or page charges.
The Editorial Board reserves the right to accept or reject any manuscript and also reserves the right
to edit the manuscripts as it sees fit. Authors may be contacted for clarification when necessary.
Manuscript Preparation
Page format
Page set-up of the manuscripts should be on A4magret or 8.5” x 11 “paper, typed double-spaced
(24-26 lines per page), with margins of top 25mm, bottom 25mm left 40mm and right 20mm.
Font
The font size of main text shall be 12 in Times New Roman
Huria Journal Vol 26 (1), March 2019
Depending on the areas of specialization, manuscripts should be arranged in the order of: title
page, abstract (structured summary) including up to six key words, main text, acknowledgements,
references, tables figures, and figure legends.
In case of science/experimental-based submissions, the order should be: title page, abstract,
introduction, materials and methods, results, discussion, acknowledgements, references, figure
legends, tables, and illustrations. Under this category, results and discussion sections may be
combined if appropriate.
Title Page
This page must include the following information:
• The title of the manuscript which should be concise, specific, informative and clear.
• Should be in bold, using font 14.
• The names (spelled out in full) of the author(s) of the manuscript including their corresponding
affiliation(s) should be indicated immediately below the title.
• A complete mailing address (including the e-mail) of the person to whom all correspondence
regarding the manuscript should be addressed and must also be indicated.
211
Abstract
The first page following the title page should contain an abstract. Abstract should contain up to
250 words mainly of the summary of background, objective, methodology, main findings of the
paper and conclusions and recommendations. Three to five key words representing concepts of
the paper may be written at the end of the abstract. The Abstract shall be in italics.
Main Text
In the main text:
Introduction: Should describe the objective of the reported work and provide relevant
background information.
Methodology (Where the study/research dictates): this part should identify the population,
area of study, procedure employed and any other relevant input to the realization of the study.
Results: Thissection should explain all the important findings and provide information
about the reliability of the results. Here, the use of
Huria Journal Vol 27(1), March 2020
tables and figures are allowed, but the use of text to emphasize important points is encouraged.
Discussion: it should describe the implications of the findings and any conclusions based on the
findings.
Abbreviations in the body of the paper should be used after having been initially explained. If
statistical analysis is applicable, it is important that the procedure is carried out following
appropriate methods.
Tables
Tables should be as close as possible to the text explaining the concept. Tables should be numbered
in the order in which they are mentioned in the text. A Table caption must be presented in upper
case at the top. Explain in footnotes all non-standard abbreviations used in each table.
Figures
Figures must be clearly drawn, placed as close as possible to the related text. All Figures must be
numbered according to the order in which they appear in the text. A Figure caption should be typed
in bold immediately below the Figure.
Pagination
The page numbers should appear at the centre of the bottom edge of the page.
References
All references to books, monographs, articles, and statistical sources must be identified at
appropriate point in text by author’s last name and publication year. The use of author’s name,
year of publication and pagination in text citations remains optional, but not really encouraged.
When author’s name is in text, cite (Williams, 2005). References should be cited in the text using
212

(name, Year) style, in the text. The list of references should be presented at end of the paper, in
alphabetical order.
Journal papers:
Author(s), (year). Article title, Name of journal, Volume Number, Issue Number, page range.
Huria Journal Vol 26 (1), March 2019
With dual authorship, give both names; for three or more, use et al., With more than one reference
to an author in one year, distinguish them by use of letter (a, b) attached to publication year
(2006a). For instance, (Agnes, 2000a; 2000b). Enclose a series of references within one pair of
parentheses, separated by semicolons, e.g., {Cornelia, 2001; Emmanuel, 2003; Juma et al., 2004;
Pembe and Owino, 2005}.
On the page of references, list all the cited references alphabetically by author and, within author,
by publication year. Examples of common references follow.
Print, M. (2000), Curriculum Development and design. Allen and Uwin, London;
Hellen, S., Joyce, K., and John, R. (2005), Schooling in Capitalist America. New York: Basic
Books. p. 99;
Holleran, E.A., Karki, S., Holzbaur, E.L.F. (1998),: The Role of the Dynactin Complex” in
Intracellular Motility. In Jeon, K.W. (Ed.) International Review of Cytology. Vol. 182.
Academic Press, San Diego, pp. 69-109;
Gao, S., McGarry M., Latham, K.E., Wilmut, I. (2003), Cloning of Mice by Nuclear Transfer.
Cloning stem Cells, 5: 287-294;
Tanzania Bureau of Statistics (2002), Country Census data Book. Dar es Salaam: Government
Printing Office.
Conference Proceedings:
Author(s), (year). Article title, Name of conference, Location of conference, page range.
Internet sources
Name of Author(s) or company or organisation, (year), Title of article, URL, date found.
Footnotes
They should be kept to a minimum. Two or more consecutive references to the same source
should, where possible, be grouped in the same note; the reader should be able to follow the article
without referring to the notes.
213