Thesis Summary - Digital Collections
148
Development and Validation of an Unobtrusive, Continuous Model of Loneliness among Older Adults By Johanna Petersen Austin A DISSERTATION Presented to the Department of Biomedical Engineering and the Oregon Health & Science University School of Medicine in partial fulfillment of the requirements for the degree of Doctor of Philosophy May 2015 © Johanna Petersen Austin All Rights Reserved
-
Upload
khangminh22 -
Category
Documents
-
view
1 -
download
0
Transcript of Thesis Summary - Digital Collections

Development and Validation of an Unobtrusive, Continuous
Model of Loneliness among Older Adults
By
Johanna Petersen Austin
A DISSERTATION
Presented to the Department of Biomedical Engineering and the Oregon Health & Science University
School of Medicine in partial fulfillment of
the requirements for the degree of
Doctor of Philosophy
May 2015
© Johanna Petersen Austin All Rights Reserved

School of Medicine
Oregon Health & Science University
CERTIFICATE OF APPROVAL
___________________________________
This is to certify that the PhD dissertation of
Johanna Petersen Austin
has been approved
______________________________________ Jeffrey Kaye Mentor/Advisor
______________________________________ Hiroko Dodge
______________________________________ Stephen Thielke
______________________________________ Todd Leen
______________________________________ Peter Jacobs

For Tamara,
Who challenged me to overcome my weaknesses,
encouraged me to improve my strengths,
and believed in me when I did not believe in myself.

i
TABLE OF CONTENTS
TABLE OF CONTENTS ................................................................................................................... i
List of Tables ....................................................................................................................................v
List of Figures ................................................................................................................................ vi
Acknowledgements ........................................................................................................................ ix
Abstract ........................................................................................................................................ xiii
Chapter 1: Introduction ............................................................................ 1
Summary ...................................................................................................................................... 1
Definition of Loneliness .............................................................................................................. 3
Concepts Related to Loneliness .................................................................................................. 4
Health Consequences of Loneliness and their Mechanisms ....................................................... 6
Current Measurement of Loneliness ........................................................................................... 8
Objective Assessment of Loneliness...........................................................................................10
Chapter Outline .......................................................................................................................... 12
Thesis Contribution .................................................................................................................... 14
Engineering Contributions: .................................................................................................... 14
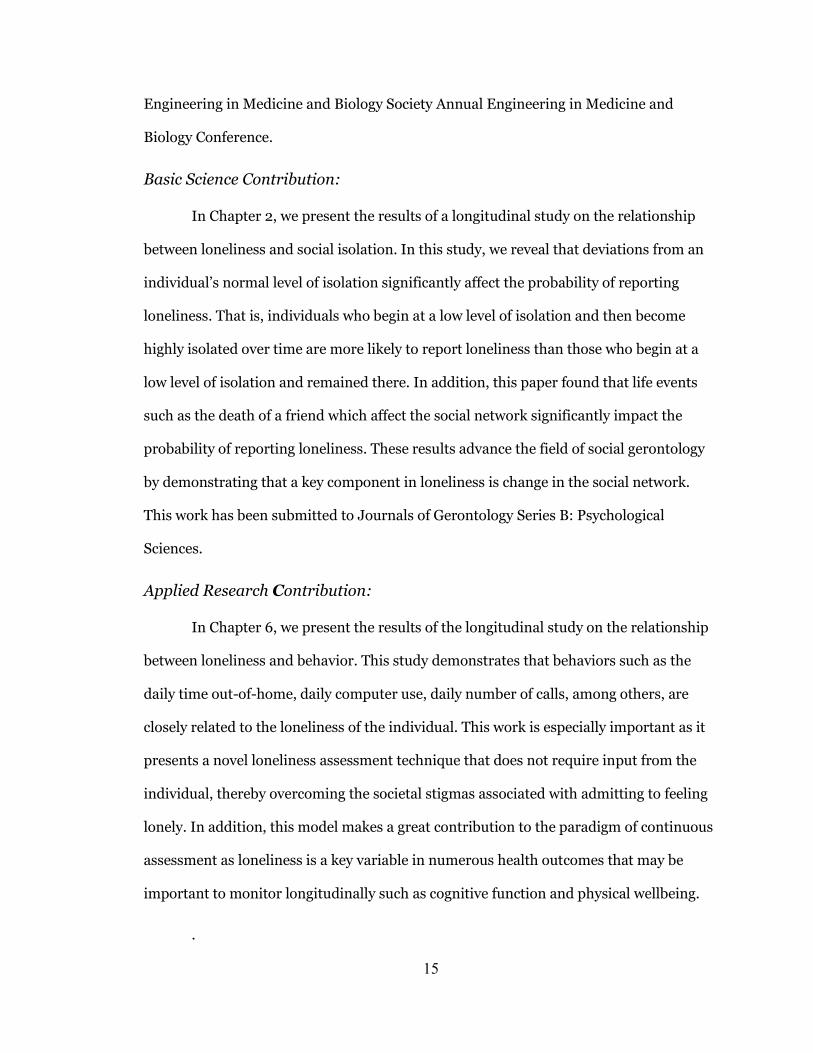
Basic Science Contribution: ................................................................................................... 15
Applied Research Contribution: ............................................................................................. 15
Chapter 2: Longitudinal Relationship between Loneliness and Social Isolation: Results from the Cardiovascular Health Study .......................... 16
Summary .................................................................................................................................... 16
Introduction ............................................................................................................................... 17
Methods ..................................................................................................................................... 20

ii
Study Design .......................................................................................................................... 20
Participants ........................................................................................................................... 20
Measures .............................................................................................................................. 21
Data Analysis ......................................................................................................................... 24
Results ....................................................................................................................................... 25
Descriptive Statistics ............................................................................................................. 25
Transition Probability ........................................................................................................... 27
Loneliness and Social Isolation ............................................................................................. 28
Discussion .................................................................................................................................. 31
Acknowledgment ....................................................................................................................... 36
Chapter 3: Unobtrusive In-Home Detection of Time Out-of-Home with Applications to Loneliness and Physical Activity ............................... 37
Summary ................................................................................................................................... 37
Introduction .............................................................................................................................. 38
Methods ..................................................................................................................................... 40
Data Collection ...................................................................................................................... 40
Feature Selection .................................................................................................................... 41
Model Development .............................................................................................................. 43
Results ....................................................................................................................................... 45
Model Applications................................................................................................................ 48
Conclusions ............................................................................................................................... 54
Addendum ................................................................................................................................. 55
Chapter 4: Phone Behavior and its Relationship to Loneliness in Older Adults ............................................................................................. 57

iii
Summary .................................................................................................................................... 57
Introduction .............................................................................................................................. 58
Methods ..................................................................................................................................... 60
Participants ........................................................................................................................... 60
Data and measures ................................................................................................................. 61
Data analysis.......................................................................................................................... 64
Results ....................................................................................................................................... 65
Descriptive statistics .............................................................................................................. 65
Mixed effects negative binomial regression on total daily calls ............................................ 66
Differential effect of loneliness on incoming and outgoing calls .......................................... 67
Discussion ................................................................................................................................. 69
Chapter 5: SVM to Detect the Presence of Visitors in a Smart Home Environment ............................................................................................ 73
Summary ................................................................................................................................... 73
Introduction .............................................................................................................................. 74
Methods ..................................................................................................................................... 76
Data Collection and Pre-processing ...................................................................................... 76
Model Development .............................................................................................................. 78
Results and Discussion.............................................................................................................. 80
Conclusions ............................................................................................................................... 83
Chapter 6: Behavior and Loneliness: How does What We Do Associate with How We Feel? .................................................................... 84
Summary ................................................................................................................................... 84
Introduction .............................................................................................................................. 85

iv
Methods ..................................................................................................................................... 87
Participants ........................................................................................................................... 87
Data and Measures ................................................................................................................ 88
Data Analysis ......................................................................................................................... 92
Results ....................................................................................................................................... 93
Descriptive Statistics ............................................................................................................. 93
In-home behavior and Loneliness ......................................................................................... 94
Discussion ................................................................................................................................. 98
Chapter 7: Future Directions ................................................................ 103
Summary ..................................................................................................................................103
Overview .................................................................................................................................. 104
Model Applications ................................................................................................................. 104
Social Isolation, Loneliness and Health .............................................................................. 104
Testing the Effectiveness of Interventions ........................................................................... 105
Identification of Lonely Individuals ..................................................................................... 105
Future Work ............................................................................................................................ 106
Visitors to the Home............................................................................................................. 107
Telephone Use ...................................................................................................................... 107
Computer Use ...................................................................................................................... 109
Conclusion ................................................................................................................................ 110
References ..................................................................................................................................... 111

v
LIST OF TABLES
Table 2.1: Descriptive statistics of the variables included in the model of loneliness and
social isolation at each assessment year. Only individuals who answered the
yearly CES-D loneliness question are included in the table each year. ..................... 26
Table 2.2: Longitudinal association of loneliness and social isolation. Based on 24,323
observations from 5,870 individuals. ........................................................................ 30
Table 3.1: Comparison of sensitivity and specificity of classifier when trained on 3
subjects and tested on the remaining subject. .......................................................... 55
Table 3.2: Beta coefficients from final out-of-home logistic classifier. ........................................ 56
Table 4.1: Demographic characteristics of the population ............................................................ 61
Table 4.2: Results of the mixed effects negative binomial regression on daily number of
phone calls ................................................................................................................. 66
Table 4.3: Comparative results on the relationship between loneliness and
incoming/outgoing phone calls ................................................................................. 68
Table 5.1: Sensitivity and specificity of the SVM model for visitor detection for subject
1for all epochs in a 24-hour period, daytime epochs only and 95% confidence
intervals (CI) for 1000 random splits of the data into model fitting and
classification sets. ....................................................................................................... 81
Table 6.1: Baseline demographic characteristics of the population ............................................. 88
Table 6.2: In-home data statistics and cross-correlations ........................................................... 94
Table 6.3: Results of the mixed effects linear regression between the UCLA Loneliness
Score and behavior. ................................................................................................... 95

vi
LIST OF FIGURES
Figure 1.1: Word cloud of 358 responses from 58 older adults commenting on their
loneliness in the last week. .......................................................................................... 3
Figure 2.1: Example data from one participant showing the social network score for each
time point, the calculated median social network score (per participant), and
the calculated deviation from the median social network score (calculated
for each year). ........................................................................................................... 23
Figure 2.2: Graph of the average annual transition probability (p) between states of
loneliness. The variable, no, represents the number of people in each category
at baseline, while 𝑛 represents the average number of people transitioning
between each category across years. ......................................................................... 28
Figure 3.1: Receiver operating characteristic (ROC) curve of the model performance. ............... 45
Figure 3.2. Estimated daily time out-of-home as a function of actual daily time out-of-
home. For the individual from this population who leaves the most, the
classifier underestimates their time out-of-home by 5.11 minutes. For the
individual who leaves the least, the classifier overestimates their time out-of-
home by 19.83 minutes. On average, the classifier will overestimate time out-
of-home by 5.47 minutes. .......................................................................................... 47
Figure 3.3: Loneliness score as a function of average time spent outside the home over
the five days up to and including survey administration. Loneliness is
negatively correlated with time out-of-home ............................................................ 49
Figure 3.4: Mean and 95% CI of the probability of being out of the home as a function of
the time of day for 51 elderly subjects over the course of 30 days. For this
cohort of elderly, roughly half the population is out of the home at lunch and
dinner times on any given day. ................................................................................... 51
Figure 3.5: Average probability of being out of the home as a function of the time of day
for five different individuals over 30 days with varying loneliness scores. 95%

vii
CI in this measure is plotted in grey. Meal time outings can be seen on plots
(a-d) whereas subject (e), the loneliest of the group, is the most variable and
the only one with no clear mealtime peaks. .............................................................. 52
Figure 3.6: (a) Physical activity score as a function of average time spent outside the
home over the four days up to and including survey administration. (b)
Pearson’s correlation coefficient (r) between average time outside home and
physical activity score. As more days further from the survey date are
included in the window and averaged, the correlation drops off. This
suggests recall bias. ................................................................................................... 53
Figure 4.1: Probability density of the daily number of incoming calls as a function of (a)
the UCLA Loneliness score and (b) the z-normalized Cognitive score, holding
all other variables at their means. Color represents density; discrete
probabilities were linearly interpolated for graphical clarity. The mean
function, μ (black trace), has been overlaid on the density to show central
tendency. Number of calls decreases with increasing loneliness and
decreasing cognitive abilities. .................................................................................... 69
Figure 5.1: An example of total dwell time in the living room versus the total number of
sensor firings in the dining room for subject 1 from 5:00-7:00pm for both
the case where a visitor was reported in the home and the case where no
visitors were reported during this time. The non-linear decision boundary
between these events is also shown. .......................................................................... 79
Figure 6.1: Diagram of in-home behaviors hypothesized to be related to loneliness. The
node corresponding to visitors to the home is shaded differently because it
was not included in the model due to the challenges in the algorithm
development discussed in Chapter 5 (pg. 65). Still, it was included in the
diagram as it is likely associated with loneliness. ..................................................... 86
Figure 6.2: Diagram showing the relative influence of the behavioral variables on
loneliness. Variables are sized by magnitude of influence and colored by the
direction of the influence (red = positive, blue = negative). In addition, the

viii
connector lines are colored by significance of the variable, with blacker lines
indicating higher significance. ................................................................................... 96
Figure 6.3: Plot of the predicted out-of-sample loneliness against the true loneliness of
the 55 data points included in the model from 16 subjects. ...................................... 97
Figure 7.1: Social network graph of 12 subjects whose phone data was collected from the
phone carrier. Nodes corresponding to participants whose data was collected
are shown in either orange (male) or green (female). All purple nodes
represent a contact called by the participant. The thickness of lines between
nodes corresponds to the number of calls between the nodes. In addition,
nodes are sized by the distance from Portland (smaller nodes mean longer
distance). The loneliness scores are displayed in black above the
corresponding participant node. ............................................................................. 108
Figure 7.2: Relationship between loneliness and (a) total computer use, (b) percent of
total computer use spent socially, and (c) percent of total computer use spent
non-socially. Loneliness is positively related to overall computer use and
non-social computer use, but negatively related to social computer use. ............... 109

ix
ACKNOWLEDGEMENTS
Five years have passed since Tamara first saw a flicker of potential in me and
offered me a position as a graduate student in her lab. At the beginning, the distant hope
of a PhD felt too far off to truly grasp; I often felt alone in a dark tunnel with no hope of a
light on the other side. And yet, somehow I have managed to push through, to reach the
light at the other end, to feel the sunlight on my skin once more. And I can honestly say I
would not have been able to do this, to make this trek or to travel this far, without the
help of the numerous people who stood by my side and encouraged me as I passed
through the darkness.
Tamara, even though you are no longer around to hear these words, I hope you
understood how much I looked up to you as a personal role model, and how much I
appreciated your support and guidance during my graduate career. It was always clear to
me that you were completely devoted to your employees and graduate students—even to
the point of reducing your own salary so you could retain your employees—and yet your
family always came first in your life. As I graduate and move from life as a student to new
jobs and opportunities, I will strive to mirror these priorities in my own life. Thank you
for continually demonstrating that what matters most—more than the allure of a high
paying job or the prestige of a fancy title—are the people around you. Thank you also for
the countless hours you spent helping me design experiments, write papers, and apply
for grants, for being devoted to my education and growth even as your life became more
and more challenging, and for always laughing and sharing with me as we met in your
office. You have contributed so much to my growth as a woman in science and even more
to my growth as an individual, and I can’t even begin to thank you enough for all of it.
Jeff, thank you for being willing to step in and mentor me after Tamara passed
away. At first, it was challenging to adjust to the expectations of a new advisor while

x
grieving the loss of the old one. And yet we made it work. You pushed me to do analyses I
would not have otherwise done, challenged me to think more globally about the problem
space, and provided excellent council when I faced the obstacles and road blocks that
naturally pop up whenever human subjects are involved in research. Thank you for
taking the time to regularly meet with me despite a busy and hectic schedule and for all
your work discussing projects, reviewing papers, and helping me develop as both a
scientist and a person.
My committee, Pete Jacobs, Hiroko Dodge, Stephen Thielke, and Todd Leen,
have all spent considerable time helping me as I planned studies, drafted manuscripts,
and finally defended my thesis. I could not have gotten this far without their guidance,
encouragement, and assistance. Pete, thank you for thoroughly reviewing my document
and providing insightful comments. I may not have always agreed with you, but I know
that the document is much higher quality now as a result of the copious hours you spent
pouring over each detail. Hiroko, you stepped in as PI on two projects when Tamara was
gone—not a small undertaking! But you took the time to think critically about each
project, consider the analysis and the outcomes, and worked with Amy and me in a
gracious and respectful manner—thank you. Stephen, it was your idea to access the
Cardiovascular Health Study dataset, which proved to be a very rewarding dataset to
work with for me. Thank you for all the time you spent helping me to devise an analysis
plan, access the dataset, run models, and write up the results. Todd, thank you for
teaching me in two enjoyable classes, for laughter and encouragement leading up to and
following the defense, and for regularly checking in to make sure I was doing okay after
Tamara was gone.
I have also been blessed by the companionship and support of the people who
work around me at the Point of Care Laboratory. Nicole, thank you for helping me install

xi
all the sensors for all the subjects in Chapter 6, for listening and providing feedback on
countless presentations, for helping me communicate with lay audiences and the IRB,
and for sharing the experience (and occasional hardships) of step-mothering with me.
Jon, thank you for all the work you did to ensure our system was running and collecting
data, for welcoming me into the group and pushing me to my limits to win a bet, and
always being available for a laugh in the middle of the workday. Thomas, thank you for
being patient with me as I slowly learned to make my own queries in MySQL and for the
countless times you diagnosed and solved the problem with problem sensors. Zach,
thank you for paving the way for me to get my own PhD—for demonstrating that it is
possible to finish in a finite period of time, and for always being willing to discuss our
research together. Stuart, thank you for showing me the value of proofs, for discussing
wavelet models with me over coffee, and for trying to improve my taste in movies.
Krystal, thank you for being available as both a friend and colleague—one who pushes
me to think about my future and what life has for me. Julia, thank you for sharing a
cubicle with me for the last 5 years, for attending classes and studying with me, and for
the occasional bottle of wine after work. Ben, Ariella, Kait, and Peter (and all the
Technical RA’s that have come before you and will come after you), thank you for the
countless hours you have spent in the field working to ensure the sensors are all
functioning properly. While all of you are co-workers, you have become friends to me.
Thank you all for making the office an enjoyable place to spend time, for the occasional
Friday beer, and for teasing me on occasion—I have enjoyed and appreciated each of you.
But the staff at the Point of Care Laboratory is not the only people who make life
at OHSU pleasant. I am also thankful for the continual support of Janet Itami—from
helping ensure I am registered for the correct classes to assisting me in reserving a room
for my defense and working with Edcomm to make sure all the necessary equipment was
available for a teleconference (no easy task!). Virginia Howard was also very helpful,

xii
especially when I first started and was just beginning to find my way around the office.
Others include Monica Hinds who provided a great deal of guidance and feedback when I
began writing my qualifier, Owen McCarty who helped me obtain the Charles Patrick
Memorial Scholarship and regularly checked in to make sure I was progressing okay, and
Valerie Scott who helped to ensure all the paperwork and documentation was in order
each time I applied for a scholarship or grant.
Finally, thank you to my family. Dad, thank you for pushing me to study
bioengineering, for suggesting I look at the programs at OHSU, for reading so many of
my papers and providing numerous comments, suggestions, and insights. Thank you for
believing in me, and helping me grow into the woman I am today. Mom, thank you for
being brave enough to study engineering at a time when few women chose careers in
math, for demonstrating to me that I could study math, too, and for the numerous trips
to Carpenter Hall for coffee, conversation and laughter. To my husband, Daniel, thank
you for being willing to listen when I needed to vent, providing counsel when I needed
help, and giving encouragement when I felt down. You walked the same road before me
and I watched as you stood strong under the challenges, difficulties and pressures of
being a graduate student. Then as I made my own way down the road, you stood by me
and encouraged me to withstand those same challenges, difficulties and pressures.
Thank you for never giving up on me.

xiii
ABSTRACT
Socialization is a very important part of healthy aging, but due to normal changes
in health and life style, elderly individuals are at increased risk of becoming lonely—a
qualitative state characterized by a subjective deficit in the social relationships. In the
elderly, loneliness predicts morbidity and mortality [1-3], is associated with decreased
cognitive functioning [4], impairs sleep quality [5, 6], decreases mobility [7, 8], and
reduces quality of life. As a result, it is increasingly important to identify and assist lonely
individuals. While surveys exist to measure loneliness [9, 10], they are given in a
sporadic, infrequent, and impersonal fashion, making early detection of loneliness
difficult. It is therefore necessary to improve current methods to identify lonely
individuals.
Recently, we and others have developed techniques to continually monitor older
adults in their home environment using unobtrusive sensing technologies [12, 13]
designed to help older adults maintain independence [14, 15] by tracking activities and
behavioral patterns in the home on a daily basis. Unobtrusive technologies allow us to
collect many types of data that relate to a person’s interaction with others, but this
information has never been related back to the current state of the art loneliness
assessment. The focus of this thesis is to develop techniques to assess loneliness based
on data from motion, contact, phone and computer sensors in the home, setting the
framework for unobtrusively measuring loneliness among older adults. In this way, the
model of loneliness will be a great contribution to the paradigm of continuous
assessment, allowing for a well-rounded view of functional ability and independence in
the aging population.
The first step in unobtrusively assessing loneliness is to understand which
behaviors are both associated with loneliness and can be monitored unobtrusively.

xiv
However, many of the variables we can monitor using this array of sensors, such as
frequency of visitor contact and phone use, relate directly to the level of social isolation,
not the loneliness level per say. Social isolation is a quantitative construct that captures
the number of personal contacts and the frequency of interactions an individual has.
However, the association between loneliness and social isolation is not clear as relatively
few longitudinal studies analyzing the relationship between loneliness and social
isolation have been performed. Thus, we first investigate the longitudinal relationship
between both the level of social isolation and deviations (relative to an individual’s
median) in the level of social isolation and loneliness using innovative longitudinal
analysis techniques, and demonstrate that loneliness is closely related to both the overall
level of isolation and deviations in that level. Next, we develop methods to monitor
behaviors associated with loneliness, including phone use, time out-of-home, and
visitors to the home. Using these developed metrics (among others), we analyze the
relationship between the behavior and loneliness of 16 older adults monitored in their
own homes for 8 months. Here, we demonstrate the close relationship between in-home
behavior and loneliness (R2 = 0.428), suggesting in-home technology can be used for
continuous assessment of loneliness in older adults.

1
Chapter 1: Introduction
SUMMARY
Because the focus of this thesis is on the development and validation of an
unobtrusive model of loneliness, this section provides a detailed background on the
concept of loneliness and its health consequences. This background includes a definition
of loneliness which differentiates it from solitude, and clarifies the difference between
loneliness and other key social concepts including social isolation, social support and
social network. Next, this section details the numerous negative health outcomes
associated with loneliness and their possible mechanisms, and discusses techniques that
have been employed to assess loneliness levels among older adults. Because of the
shortcomings with current approaches to assess loneliness, an overview of in-home
assessment is provided which describes how loneliness might be assessed unobtrusively
using an array of sensors in the home. This section concludes by outlining the specific
contributions of this thesis, and detailing their significance in the field.

2
Humans are designed for social interaction [20]. We crave attention, acceptance,
and companionship. Often, we derive meaning and purpose from our interactions with
others—both from the giving and receiving of support [21]. We attend events, join sports
teams, form reading groups, volunteer time; all to meet and interact with other people.
But sometimes, our social relationships are not fulfilling. We feel isolated, alone, lonely.
And this feeling of aloneness is acutely painful. Mother Teresa once said, “Loneliness and
the feeling of being unwanted is the most terrible poverty”, and very few people have
never experienced the poverty of loneliness.
Still, certain groups of people are particularly susceptible to loneliness. Young
adults--especially college freshmen who have just left the nest and are attempting to find
themselves in the world—may feel alone and isolated on their new college campus. Single
mothers are also prone to loneliness, feeling they are alone in the struggle to make ends
meet. But perhaps the most vulnerable population is older adults. While many adults
continue to lead energetic, fulfilling lives well into old age [22], for many, socializing
becomes more and more challenging as health declines and vision and hearing fails [23].
Older adults are also particularly vulnerable to traumatic life events such as the death of
friends, especially friends who feel irreplaceable at such a late stage of life [24]. After
retirement, the network of friends may become smaller as access to the working social
network is reduced, and the sense of purpose and self-respect may become reduced
without the fulfillment provided by regularly working. In this phase of life, forming and
maintaining new friendships becomes particularly challenging, especially when the
failing health of other older adults may make kinship with the peer group seem less
desirable [25]. The painfully isolating experience of loneliness among older adults is
captured in the word cloud in Figure 1.1, generated from 358 responses from 58 older

3
adults commenting on why they felt lonely in the last week1. The themes of loss,
isolation, and relationship are clearly evident. Because of the importance of loneliness
among older adults, this thesis is devoted to the development of new techniques to
monitor and understand loneliness in this population.
Definition of Loneliness
Of course, the first step toward developing a technique to monitor loneliness is to
understand what loneliness is. While most of the population can clearly articulate when
they feel lonely, defining the concept in precise terms is more challenging. Beginning in
the 1960s, many
researchers have
attempted to define
loneliness [26-28]
and the proposed
definitions have
several common
threads [29]. First,
loneliness is a
subjective experience, distinguishing it from social isolation which deals with a
quantifiable lack of friends or support network [27]. The distinction between social
isolation and loneliness is important, as research indicates it is the perception of
1 Figure generated using data from 58 older adults in the Intelligent Systems for Assessing Aging Changes (ISAAC) cohort. All participants enrolled in this study complete an online weekly health form, which asks (in addition to other questions) whether the participant felt lonely in the last week. Participants answer ‘yes’ or ‘no’, and if they respond ‘yes’ they have the option to fill in a text box about their loneliness. All words were shortened to the root word (e.g. feeling was changed to feel) and common words (for example and, but, or) were removed. In addition, references to family members (e.g. my son) were changed to ‘family’ to give a better picture of the relative difference in frequency of referring to family member or friends when describing loneliness. Finally, to preserve participant privacy, all references to the names of friend or family members were changed to the appropriate noun (e.g. ‘my son Larry’ is changed to ‘my family’).
Figure 1.1: Word cloud of 358 responses from 58 older adults commenting on their loneliness in the last week.

4
isolation, not the isolation itself per se, that brings about the negative consequences
associated with loneliness [11].
Second, loneliness is caused by a deficit in relationships. Weiss et al. defined two
types of loneliness: a social loneliness which arises from a perceived lack of a friend
network, and an emotional loneliness which arises from the lack of a significant other
(for example a spouse or partner) [27]. Others have simply defined loneliness as arising
when there is a discrepancy between an individual’s desired levels of support and the
support they perceive [26, 28]. In both cases, the key point is that the social relationships
are lacking in some way. Potential sources of the mismatch between perceived and
desired support may include negative life events (e.g. death of a friend or loved one),
chronic diseases which reduce the ability to socialize, and relocation [30]. Addressing
and mitigating loneliness can therefore take two paths: either the older adult can adjust
their expectations for support (becoming satisfied with lower levels of support) or
change the level of achieved support from the network.
The experience of loneliness is also painful, thereby distinguishing it from
solitude. As Paul Tillich [31] noted in The Courage to Be, “Language… has created the
word ‘loneliness’ to express the pain of being alone, and it has created the word ‘solitude’
to express the glory of being alone”. While being alone is often associated with
loneliness, spending time away from others can be a positive experience, and has been
linked to measures of wellbeing and life satisfaction. The preference or tolerance for
solitude differs on an individual level[32, 33]; thus the amount of isolation tolerated
before loneliness is experienced will differ by individual as well.
Concepts Related to Loneliness
In addition to understanding what loneliness is, it is equally important to
understand what it is not. In the literature, there are several concepts that are related,

5
but not synonymous, to loneliness. These include social network, social engagement,
social isolation, and social support. This section will define these variables and how they
relate to loneliness.
Social network refers to the group (or groups) of people with whom an
individual has contact. This network provides the means of social engagement, which
refers to the frequency and number of social activities in which one participates [34]. In
addition, the social network provides the basis for social support, which is defined as
the availability of people on whom one can rely [35]. Like loneliness, social support is
typically subjective, evaluated using participant reports on the perception of support
from the social network. In contrast, social isolation is typically defined as a
quantifiable construct pertaining to the number of social network members and the
frequency of contact [36, 37]. By this definition, an individual is socially isolated if they
have relatively small social network, or if they interact with their social network
infrequently. This will be the working definition of social isolation for this thesis.
Assessing an individual’s level of isolation through this method simply entails evaluating
their social network and the frequency of contact with the network, which can be
performed using assessments such as Hirsch’s Social Network List [38]. However, the
reader should note that in the literature, social isolation is frequently interpreted not
only as a measure of size and frequency of contact with the social network, but also the
perceived closeness of the network members [36]. For example, Hawthorne’s Friendship
scale [39], which he developed to assess social isolation, asks questions such as “I have
someone to share my feelings with”. These questions relate to the perception of isolation,
not the actual amount of isolation per se. In fact, many of the same questions appear in
measures designed to assess loneliness [9, 10, 40] as those designed to assess isolation.

6
Health Consequences of Loneliness and their Mechanisms
When attempting to monitor loneliness, it is important to understand the health
outcomes associated with loneliness and how they might be inter-related. Here, we
discuss several outcomes associated with loneliness and their hypothesized mechanisms.
Loneliness has frequently (but not uniformly [41]) been shown to predict
morbidity and mortality [1-3], with an increased risk of mortality due to loneliness
similar to that of smoking and obesity [18, 19]. There are two main models for how
loneliness and lack of social relationships influence health: the main effects and stress
buffering models [42]. In the main effects model, a positive influence on health comes as
a direct result of being part of a social network, through the indirect protective effects the
social network provides. That is, the social network may encourage members to engage
in positive health behaviors [43, 44] (although some studies have shown that negative
health behaviors may also spread through the social network [45, 46]), may provide
support or resources when issues arise thereby mitigating potential effects of disease,
and may provide purpose and meaning to the members, which directly increases life
satisfaction [47]. Because lonely individuals may be less trusting of their social network
and perceive less support, they are less likely to receive the positive benefits associated
with being part of a social network. This model is consistent with prior research
connecting loneliness to an increased risk of placement in nursing home facilities [48],
and increased risk of emergency hospitalization [49], possibly because the support
derived from the social network is lacking.
On the other hand, the stress buffering model posits that social relationships
provide support which buffers the negative responses to stressful life events. In this
model, it is actually the perception of support (which is directly tied to loneliness) that
reduces negative health outcomes. For example, the perception that others will provide

7
resources may reduce the perceived stress of a given situation, thereby reducing the
negative health outcomes. In addition, the perception of support may dampen the
physiological changes associated with stress [42], even if the support is coming from a
pet rather than another human being [50]. This model is consistent with prior research
on loneliness and health, which indicates that loneliness increases blood pressure [51]
and diminishes immunity [52], and prior studies on social relationships which indicate
that the quality of an individual’s relationships is more important for determining key
health outcomes than the sheer quantity[53]. In addition, studies on loneliness in young
adults show that while lonely and non-lonely individuals engage in the same number of
stressful activities, lonely individuals perceived more stress from the same situations
[54]. More recent models indicate that loneliness influences health through both
pathways [55, 56]. It is also interesting to note that the older adults themselves perceive
both pathways as acting to influence health [57].
In addition to increased morbidity and mortality, multiple studies have also
found that loneliness is associated with decreased cognitive function [4, 58-61], possibly
due to a decline in socialization, which has been associated with increased cognitive
reserve [59, 62]. Cognitive reserve refers to the number of available mechanisms to
process a given task. If more mechanisms are available, more damage can be sustained
before clinical expression of damage occurs [63]. Thus, individuals who have more
cognitive reserve would present with superior cognitive function for a given level of
disease pathology [64]. This is consistent with the ‘use it or lose it’ hypothesis, which
suggests that increasing social activities will protect against dementia [17, 65], possibly
due to the increase in cognitive reserve.
Loneliness is also associated with poor sleep and increased frequency of micro-
awakenings [6]. Poor sleep, independent of loneliness, is hazardous in its own as it is
8
associated with obesity [66, 67], hypertension [68], cognitive impairment [69], and poor
quality of life [70]. The poor sleep among lonely individuals may be directly related to
the feeling of perceived isolation, which results in hyper-vigilance and distrust, thereby
increasing the number of micro-awakenings to ensure a safe sleeping environment [11].
The hyper vigilance felt by lonely individuals may partially explain the increased cortisol
levels the morning after a self-report of loneliness among middle-aged [71] and older
adults [72]. This is also consistent with results from Friedman et al. showing that
interleukin-6, an inflammatory factor that is linked to increased risk of disease and
mortality, was most elevated in individuals experiencing both poor sleep quality and
poor quality social relationships. In this study, the interleukin-6 levels were reduced to
normal if the participant either perceived support from their social relationships or
exhibited good sleep quality [73], further highlighting the beneficial effects of quality
social relationships.
Perhaps in part due to the influence of loneliness on sleep quality and the
relationship between health limitations and loneliness, individuals experiencing
loneliness also report lower quality of life, life satisfaction [47], and increased levels of
depression [74].
Current Measurement of Loneliness
While this thesis is on the development of a new technique to monitor and
understand loneliness, it is important to appreciate how loneliness is measured
currently, as the current techniques will provide the gold standard in validating the new
approach. There are two main approaches currently used to assess loneliness [75]: self-
labeling using direct questions of loneliness, and the employment of scales or surveys
designed to indirectly assess loneliness.

9
The self-labeling technique typically asks a question about whether the
participant has felt lonely within a certain time frame (e. g. the past week), with answers
generally ranging from never to always. While this technique has excellent face validity
and has been employed in numerous studies, it also has several drawbacks. First,
assessing loneliness via a single question assumes that loneliness is a unidimensional
construct so the only difference between lonely individuals is the frequency or intensity
of perceived loneliness [76]. However, Weiss argued that loneliness is in fact multi-
dimensional, encompassing both an emotional loneliness (the loneliness for significant
attachment figure such as a spouse) and a social loneliness (the loneliness for close
friends) [27]. For example, women who move to a new town for their husbands’ work
frequently report loneliness for friends despite having the significant attachment of the
husband, while recent widows will report loneliness for their deceased spouse despite
having a strong friend network. Assessing loneliness via a single question cannot capture
these differences in the type of loneliness experienced.
Individuals experiencing loneliness are also perceived as weaker, less attractive,
and more passive than their non-lonely counterparts. Due to these social stigmas
associated with loneliness, it is possible that many subjects will avoid reporting
loneliness even when they are quite lonely, leading to an underestimate of loneliness in
the population, and erroneous estimation of the association between loneliness and
health outcomes. Several researchers have also argued that loneliness may be present
even without the awareness of the individual [26, 77]. which would also lead to
underestimation of the true levels of loneliness in the population (although others have
argued that the subjective nature of loneliness indicates that loneliness can only be
present by self-report of the individual [78]).

10
Because of the numerous shortcomings associated with directly assessing
loneliness, several scales have been developed to indirectly assess loneliness. The two
most commonly used scales are the UCLA Loneliness scale[9] and the De Jong Gierveld
Loneliness Scale [10], although other scales have also been employed [27, 79]. The UCLA
Loneliness Scale is a 20-item unidimensional scale [40] which has been employed in
numerous studies of loneliness among older adults [80-83]. In contrast, the De Jong
Gierveld Loneliness Scale is an 11-item scale which covers two domains [84] following
Weiss’s theoretical model of loneliness to capture both emotional and social loneliness
[27]. Both scales have short forms consisting of a minimum of 4 items [9, 10] which have
also been used extensively in the literature. While these scales may not encounter the
same level of stigma associated with directly asking participants whether they are lonely,
they still depend on self-report from the subjects, and thus are subject to desirability
bias[85, 86], memory problems[65], and under or over estimation[87]. Relying on self-
report to assess both loneliness and social isolation makes it challenging to assess the
differential effect these constructs have on health—for example an individual
experiencing loneliness may perceive infrequent contact with friends regardless of the
true amount of contact. Clearly, a more objective method to assess loneliness in older
adults is required to advance the field.
Objective Assessment of Loneliness
Recently, ambient in-home sensors have been developed to continuously and
unobtrusively monitor inhabitants [15, 88, 89]. The goal of such systems is typically to
monitor behavior more frequently than otherwise possible (e.g. hourly or minutely), and
identify behaviors that may be associated with increased risk of cognitive decline [90-
92], low mood, [93] or other negative outcomes . The nature and type of sensors used in
such platforms can vary widely. For example, several research groups have proposed

11
video cameras[94] and body worn tags[95, 96] as viable options in in-home monitoring.
Video cameras[94] installed in key areas of the home enable assessment of various gait
parameters, may be used to detect falls, and allow the identification of different
individuals moving through the home. However, most individuals consider the use of
video monitoring a violation of privacy even when discriminating features of the video
data are removed prior to processing. Body-worn tags (e.g. RFID, UWB, Wi-Fi) [95, 96]
have also been proposed for in-home assessment as they track how an individual moves
throughout the home and are sensitive to multiple individuals at the same time.
However, among older adults this technology poses challenges to long term tracking as
seniors forget to wear sensors or take them off when they become uncomfortable. In
contrast, inexpensive wireless movement detectors and contact sensors can detect a
subject’s activities in the home on a daily basis without being overly invasive (no
cameras) or requiring participants to remember to wear or charge devices. However,
they give no information about who (or what) is causing the sensor to fire, and may be
subject to high levels of noise. Thus, they are most effective in single person homes.
Because older adults living alone are the most vulnerable to feelings of loneliness or
social isolation, this technology is ideal for unobtrusive monitoring of loneliness and
isolation in older adults.
Using an array of such unobtrusive motion and contact sensors, we at the Oregon
Center for Aging and Technology (ORCATECH) have developed methods to detect
important behaviors such as walking speed [97], sleep quality [98], mobility [99], total
activity [100, 101], and medication adherence [102] in the home. While we have
previously related the behavioral metrics derived from the sensors to physical [103] and
cognitive health outcomes [12, 101], it may be that some of the behaviors which can be
assessed using in-home sensors relate directly or indirectly to loneliness. For example,
sensors on the phone would enable the unobtrusive assessment of daily time spent on

12
the phone and total calls, an important measure of socialization which may be associated
with loneliness. Because phone use also requires the dialing of distinct numbers for each
contact, this would also enable unobtrusive assessment of an individual’s social network.
While multiple studies have shown that loneliness is not strongly associated with social
network size, through unobtrusive and continuous monitoring of social network, it may
be possible to detect changes in social network characteristics (e.g. the loss of a friend,
relocation, retirement) which have been qualitatively linked with loneliness. Additional
behaviors that may relate to loneliness include computer use [104], time out-of-home
[105], visitors to the home, and sleep[11].
Chapter Outline
The focus of this thesis is therefore on the development of an unobtrusive model
to assess loneliness in older adults. To that end, Chapter 2 is devoted to furthering the
understanding the longitudinal relationship between social isolation and loneliness.
While some studies find loneliness is significantly associated with measures of social
isolation, others downplay their association. Most of the studies on the relationship
between loneliness and social isolation that have been performed to date are cross-
sectional in nature, precluding understanding of the longitudinal interaction between
social isolation and loneliness. Because many of the social variables that can be
monitored unobtrusively are measures of social isolation (e.g. phone use, computer use),
it is important to understand the longitudinal association between loneliness and social
isolation. Thus, this chapter will establish the plausibility of monitoring loneliness by
detecting changes in social isolation on a population basis using data from the
Cardiovascular Health Study, a longitudinal study of 5,888 older adults in the United
States.

13
Based on the results of the second chapter, Chapters 3-5 cover the development
of methods to monitor the mediators or covariates of loneliness. Chapter 3 will present
the development of a logistic regression classifier to assess the total daily hours spent
outside the home using the in-home sensor data. This algorithm will also be used to
assess the relationship between loneliness and time out-of-home among 33 older adults,
showing that loneliness is significantly related to time out-of-home. Next, Chapter 4
will present longitudinal data on the relationship between phone behavior (the daily
number of incoming and outgoing phone calls) and loneliness, showing that higher daily
phone use is associated with lower levels of loneliness. Finally, Chapter 5 will present
the development of an SVM classifier used to detect the presence of visitors in the home
using key features from the in-home data. This chapter will demonstrate that while the
algorithm performed reasonably well at detecting visitors for one subject, it did not
perform well for the other subject the algorithm was trained on. Future work attempted
to collect superior ground truth from additional participants to thoroughly develop a
visitor detection method, but unforeseen challenges in the data collection precluded the
finalization of a robust visitor detection algorithm. As a result, this section is auxiliary to
the rest of the thesis as visitors will not be included in the final model of loneliness.
Using the developed metrics (among others), Chapter 6 analyzes the
relationship between in-home behavior and the loneliness of 16 older adults
participating in a randomized controlled trial who were monitored in their own homes
for 7 months. This chapter will show the feasibility of using in-home data to assess
loneliness. The thesis will be concluded in Chapter 7, which will discuss future
directions for research, including additional in-home behaviors that could be employed
in a larger study to assess the relationship between behavior and loneliness.

14
Thesis Contribution
This thesis presents several contributions to the field: three engineering
contributions, one basic science contribution, and one applied research contribution.
These are each discussed in more detail below.
Engineering Contributions:
In Chapter 3, an algorithm to detect the total daily hours spent outside the home
using data from an in-home sensor platform is developed and validated. This technique
is an important contribution as the total time spent outside the home has been linked
with quality of life [106], life satisfaction [105], and cognitive function [107-111]. By
unobtrusively monitoring time out-of-home using this developed technique, it may be
possible to continually assess these important health outcomes in older adults. This work
has been published in the IEEE Journal of Biomedical and Health Informatics [81].
In Chapter 4, we present a novel method to assess the telephone use of older
adults using a landline phone sensor. While studies have previously used data collected
from mobile phones to quantify social groups and their evolution [112, 113], infer
friendship networks [114], and even assess mental health [115], these techniques only
work with mobile phone data which is not typically employed by the older adult
population. Our technique therefore advances the field in assessment of phone use
among older adults, while demonstrating the relationship between phone use and
loneliness in this population. This work has been submitted to Aging and Mental Health.
In Chapter 5, a classifier to detect the presence of visitors in the home is
presented. As noted, this algorithm was not fully validated due to challenges in the
collection of ground truth visitor data. Still, this work represents key results on behaviors
that may change when visitors are present in the home, and could be used to inform
priors in future models of visitors in the home. This work has been published at the IEEE
15
Engineering in Medicine and Biology Society Annual Engineering in Medicine and
Biology Conference.
Basic Science Contribution:
In Chapter 2, we present the results of a longitudinal study on the relationship
between loneliness and social isolation. In this study, we reveal that deviations from an
individual’s normal level of isolation significantly affect the probability of reporting
loneliness. That is, individuals who begin at a low level of isolation and then become
highly isolated over time are more likely to report loneliness than those who begin at a
low level of isolation and remained there. In addition, this paper found that life events
such as the death of a friend which affect the social network significantly impact the
probability of reporting loneliness. These results advance the field of social gerontology
by demonstrating that a key component in loneliness is change in the social network.
This work has been submitted to Journals of Gerontology Series B: Psychological
Sciences.
Applied Research Contribution:
In Chapter 6, we present the results of the longitudinal study on the relationship
between loneliness and behavior. This study demonstrates that behaviors such as the
daily time out-of-home, daily computer use, daily number of calls, among others, are
closely related to the loneliness of the individual. This work is especially important as it
presents a novel loneliness assessment technique that does not require input from the
individual, thereby overcoming the societal stigmas associated with admitting to feeling
lonely. In addition, this model makes a great contribution to the paradigm of continuous
assessment as loneliness is a key variable in numerous health outcomes that may be
important to monitor longitudinally such as cognitive function and physical wellbeing.
.

16
Chapter 2: Longitudinal Relationship between Loneliness and Social Isolation:
Results from the Cardiovascular Health Study
SUMMARY
Conflicting results on the association between loneliness and changes in the level
of social isolation have been reported in the literature. While some studies find
loneliness is significantly associated with social network, others indicate that loneliness
can present with both large and small social network, downplaying their association.
However, many of the social variables (e.g. telephone use, visitors to the home) that can
be monitored unobtrusively are measures of social isolation, and thus may not relate
directly to loneliness. The focus of this chapter is therefore to clarify the longitudinal
association between loneliness and social isolation using data from the first five years of
the Cardiovascular Health Study, a longitudinal study of 5,888 older adults in the United
States. The loneliness question from the CES-D depression scale [116] was dichotomized
and used to assess loneliness, while social isolation was measured using six items from
the Lubben social network scale [117]. Variables were created to capture both the median
level of social isolation and the deviations in the level of social isolation for each year.
Using longitudinal logistic regression models, we show that a higher median level of
isolation network score is associated with increased odds of reporting loneliness. In
addition, increases in the level of isolation relative to an individual’s median are
associated with increased odds of reporting loneliness. This result has significant
implications for monitoring loneliness using unobtrusive in-home sensing technologies,
and suggests that variables such as phone use, email use, and time out-of-home, which
are closely related to social isolation, may also be closely associated with loneliness
among older adults.

17
INTRODUCTION
Social relationships are important at all ages, and are considered a key element in
successful aging [100, 118]. Yet many older adults have diminished opportunities for
social relationships, and may become lonely. Loneliness has been defined as a subjective
state resulting from a deficiency in the social contacts [26]. A large body of literature has
focused on understanding the relationship between loneliness and health among older
adults [119]. Loneliness, has been associated with poor sleep quality [5, 6], decreased
mobility [7, 8], increased risk of placement in nursing home facilities [48], and increased
risk of emergency hospitalization [49]. Loneliness has frequently been shown to predict
morbidity and mortality [1-3], although not uniformly [41]. Loneliness is also associated
with decreased cognitive function [4, 58, 59].
Another important aspect of the social lives of older adults is their level of social
isolation. While loneliness is a subjective state, social isolation is a quantitative construct
arising from a deficit in social contact. Much like loneliness, social isolation has been
found to have significant consequences for health: individuals who are socially isolated
tend to have increased morbidity and mortality with the increase in mortality similar to
that of smoking [19], exhibit poor sleep quality [73] and have increased risk of cognitive
decline [120]. Social isolation is typically defined as one end of a continuum
encompassing the objective size of the network and the frequency of contact [36, 37].
However, by reducing the continuum to a binary state (isolated or not), it is possible to
lose relevant information regarding the level of isolation. Thus, in this paper we will not
A version of this chapter has been submitted to Journals of Gerontology Series B:
Psychological Sciences

18
dichotomize the continuum but instead use overall level of isolation, a measure of both
the size of the social network and the frequency of contact.
While it might seem self-evident that social isolation co-occurs with loneliness,
they are in fact distinct constructs [26]. Several studies have examined the relationship
between social isolation and loneliness [58, 121-123], many of which focus on the
relationship between loneliness and the size of the social network (one aspect of social
isolation). For example, Berkman et al. suggested that the social network lays the
foundation for support [34], arguing that while one may perceive a lack of support
despite a large social network, without any social network one cannot have support.
Perlman and Peplau also argue that the size of the social network is one of the key
determinants of loneliness [26] such that individuals with smaller social networks are
more prone to feelings of loneliness. Other studies have found that individuals with no
friends or children were more likely to report loneliness [124] and that having small
social network was significantly associated with loneliness [125], especially among those
suffering from ‘social’ loneliness [126].
Despite findings suggesting a relationship between loneliness and social
isolation, only a handful of objective, longitudinal studies on this relationship exist [127-
129]. In 2002, Holmen & Furukawa found that loneliness was closely tied to not having a
good friend to talk to in a longitudinal study of residents of Stockholm [127]. Social
network was also found to be associated with loneliness among Israeli populations [128].
More recently, loneliness was found to be associated with social network score among
British populations [130], although this study only had two time points spaced eight
years apart. Because the manifestation of loneliness may be influenced by culture [131-
133], the results from non-American cohorts cannot be generalized to the American
older adult population. In the United States, a single study by Cacioppo et al. found

19
social isolation was associated with both loneliness and depression [74]. However, the
main outcome of this study was to understand the relationship between loneliness and
depression, not to understand the complex relationship between loneliness and social
isolation. Remarkably, none of the longitudinal studies investigated the relationship
between change in isolation (measured either via life events that directly or indirectly
impact the social network or a change in social network score) and loneliness—a
particularly important relationship to understand, especially given that changes in social
network (which would manifest as changes in the level of isolation) are related to health
outcomes independent of baseline network size [22, 134]. Still, there is some evidence to
suggest that loneliness is closely tied to changes in the overall level of isolation: a
qualitative study on the causes of loneliness in older adults found that the greatest causes
of loneliness were ‘life events’ that cause changes in either one’s ability to interact with
the available social network or in the social network itself [23].
In this paper, we examine the relationship between both median level of isolation
(across individuals) and deviations in the level of isolation (within an individual) with
self-reported loneliness among a large group of American older adults surveyed yearly
for five years. We hypothesize that individuals who have recently experienced a life event
that would cause a change in the level of isolation (e.g. the death of a friend) will be more
likely to report feelings of loneliness. We also hypothesize that both higher average levels
of isolation (across individuals) and increases in the level of isolation from the median
(within the same individual) will be associated with a higher probability of reporting
loneliness.

20
METHODS
Study Design
Data for this study came from the first five years of the Cardiovascular Health
Study (CHS), an ongoing observational study on the risk factors for cardiovascular
disease in American adults aged 65 and older. A total of 5888 participants were enrolled
from Medicare eligibility lists in four communities: Sacramento County, California;
Allegheny County, Pennsylvania; Forsyth County, North Carolina; and Washington
County, Maryland. In 1989/90, 5201 participants were enrolled from these communities,
and an additional 687 African American participants were enrolled in 1992/1993.
Exclusion criteria at baseline included institutionalization, receiving hospice care or
radiation chemotherapy for cancer, and not expecting to stay in the area for the next
three years. Participants were also excluded if they were not ambulatory at home or if
they were not able to be interviewed. All participants received up to ten annual in-person
interviews and 6-month telephone calls until 1999 when they started receiving telephone
calls twice per year. Demographics collected at baseline include age, sex, race, and
education. The institutional review board (IRB) of each of the sites and the Coordinating
Center approved the study. In addition, the IRB at Oregon Health & Science University
approved the reanalysis of the dataset described here (IRB #10006). Details of the study
design and sampling methods have been described elsewhere [135, 136].
Participants
During the first five years of the study, participants were asked questions
regarding social network and life events which were discontinued after five years. The
current study uses these social data to examine the relationship between change in
isolation and loneliness. A complete descriptive summary of the demographic
characteristics of the cohort at baseline and during the four years of follow up is provided

21
in Table 2.1. Each year, only those participants who answered the loneliness question
(described under ‘Measures’) are included in tables or analyses.
Measures
Loneliness
Subjective loneliness was assessed using a question from the Center for
Epidemiological Studies Depression (CES-D) scale [116]. The question asks “In the last
week, I felt lonely” with answer options (i) rarely/none of the time, (ii) some or a little of
the time, (iii) a moderate amount of time, and (iv) most of the time. We dichotomized
loneliness to ‘not lonely’ (i) versus ‘lonely’ ((ii), (iii), (iv)).
Social Isolation
Social isolation was measured using 6 items from Lubben’s social network scale
[117], which was developed as a modification to the Berkman-Syme social network index
to specifically target older adults [137]. This questionnaire asks ten questions: three
questions regarding family relationships, three targeting friend relationships, three
looking at independent social support, and one identifying living situation (with others
or alone). Each question is answered categorically and converted to a score ranging from
0 to 5. Because this analysis is specifically looking at the relationship between the level of
isolation and loneliness, and because perceived support may change in tandem with
changes in isolation, the three questions targeting social support were not included in
the summary isolation score. This ensures that any relationship between loneliness and
social isolation is due to changes in the social isolation, not changes in perceived
support. In addition, living situation was included in the analysis separately as a binary
variable. The scores on the six questions regarding friend and family relationships were
summed to give a summary ‘network score’ between 0 and 30.

22
In order to understand how both overall social isolation and change in social
isolation affect loneliness, we included two variables, one to represent an individual’s
median level of isolation (across years), and a second to represent the deviation from the
median level social isolation each year. We first calculated each individual’s median
isolation score over the t as a measure of average level of social isolation. For each
individual, we then calculated each year’s offset from the median as a representation of
deviation in the level of isolation from the individual’s median (see Figure 2.1). We used
difference in level of isolation from the median level instead of the difference in isolation
level from the previous year because this captures longer term trends in isolation levels
(not simply the previous year, but the average over the time period) and allows usage of
the each year of the dataset (the first year is lost due to lagging when considering the
difference between years). By including both the median value and the offset from the
median, we capture the relationship between loneliness and both average isolation and
deviations in level of isolation over time.
Life Events
Five questions were included in the model regarding major life events in the last
six months: (i) “Did somebody close to you die”, (ii) “Did a significant relationship
become considerably worse”, (iii) “Did someone close to you have an illness”, (iv) “Was a
grandchild born”, and (v) “Have you been caring for a sick or disabled person”. Each
question was answered as ‘yes’ or ‘no’ each year, and included in the model
independently.
Additional Covariates
We included variables in the models that might confound the relationship
between loneliness and social isolation. Because cognitive function has been shown to
impact one’s ability to form and maintain relationships [120], it was important to control

23
for cognitive function in the model. Cognitive function was measured using the Modified
Mini-Mental State Examination (3MSE) [138] in years 1-4. Because the 3MSE was not
used at baseline, values from year 1 were lagged backward to the baseline year as scores
on this measure change very slowly. Scores on the 3MSE range from 0-100. The 3MSE
score in this cohort was 90.6 ± 8.6 at year 1. Health status at each year was determined
by calculating whether or not a participant had any prior report of cardiovascular
disease, cancer, chronic obstructive pulmonary disease, kidney disease or was taking any
medication for diabetes.
Figure 2.1: Example data from one participant showing the social network score for each time point, the calculated median social network score (per participant), and the calculated deviation from the median social network score (calculated for each year).

24
Data Analysis
Descriptive analysis:
We first computed descriptive statistics for all variables included in the model.
Because the scores on the social network questionnaires are highly skewed to the left
(large social network), we computed the median and inter-quartile range (IQR) for the
social network scale. These are computed yearly on the available data for all participants
who completed the corresponding year’s CES-D loneliness item. We also computed the
percent of positive and negative responses (the remaining percent of 100 corresponds to
the percent missing) for all life events variables for all years.
Transition probability analysis:
To understand how stable feelings of loneliness are in this cohort, we created a
transition probability graph describing the probability of transitioning between lonely
and non-lonely states. Transition probabilities were computed between adjoining years
(e.g. from year 2 to year 3) by calculating the total number of participants who
transitioned between states (e.g. lonely to not lonely) and dividing that number by the
total number of participants who were in the starting state (e.g. lonely) in the first of the
two adjoining years and answered the CES-D loneliness question both years. For each
possible state change (lonely to non-lonely, non-lonely to lonely), a total of four
transition probabilities were computed: one for each year pair. The overall transition
probability across years was computed as the average transition probability across the
four years of follow up data. The probability of remaining in the same state (e.g. the
probability of reporting loneliness in two consecutive years) is taken as 1-P(Transition).
We also computed the percent of subjects who are chronically lonely as the percent who
reported loneliness each year they responded to the CES-D loneliness question. We also
computed the percent of subjects who are chronically lonely as the percent who reported
loneliness each year they responded to the CES-D loneliness question.

25
Logistic regression mixed effects models
Longitudinal mixed effects logistic regression models were employed in Stata
(StataCorp, Texas, Version 13) to examine the relationship between loneliness (measured
using the dichotomized CES-D question) and the level of isolation over time. The mixed
effects regression framework allows for repeated measures of the same individual by
including individual-specific offset terms. Thus, all available data from all years (those
shown in Table 2.1) were included in the model, allowing the model to fit both group and
individual changes over time. The variables used in the first model were missing an
average of 2% of cases each year (max: 7.6%, min: 0%). In order to avoid biases
associated with list wise deletion and to maximize efficiency, chained multiple
imputation was employed on all variables used in the first model with missing data due
to nonresponse (imputation was not employed on participants who died or were lost to
follow up). The outcome variable was not imputed. Ten imputed datasets were generated
to ensure reliability and consistency of the imputed results. The average number of
observations per individual was 4, and the minimum number of observations was 1. In
order to ensure coefficient estimates were not biased by multicollinearity, the variance
inflation factor (VIF), a standard diagnostic tool for assessing the level of collinearity of
the independent variables, was computed for all independent variables. The VIF for all
variables was below 2.5, indicating any bias from multicollinearity can reasonably be
ignored [139]. A p-value of 0.01 was considered significant.
RESULTS
Descriptive Statistics
As shown in Table 2.2, the mean participant age was 72.8 ± 5.6 years at baseline;
57% of the cohort was female, and 70% was married. By the end of the analysis period,
the mean age was 75.9 ± 5.3 years, the proportion of females had increased to 59%, and

26
Table 2.1: Descriptive statistics of the variables included in the model of loneliness and social isolation at each assessment year. Only individuals who answered the yearly CES-D loneliness question are included in the table each year.
Baseline (n=5194)
Year 1 (n=4894)
Year 2 (n=4659)
Year 3 (n=5059)
Year 4 (n=4600)
Age (years)a 72.8 (5.6) 73.6 (5.4) 74.5 (5.4) 75.1 (5.4) 75.9 (5.3)
Gender (% Female)b 57.0 57.1 57.6 58.7 59.3
Marital Status (%)b
Married 69.1 69.7 69.2 66.5 66.7
Widowed 23.0 22.5 22.7 24.2 24.1
Divorced/Separated 3.8 3.6 3.7 5.2 5.2
Never Married 4.1 4.2 4.3 4.1 4.0
Education (years) a 13.9 (4.7) 14.0 (4.7) 14.0 (4.7) 13.9 (4.7) 14.0 (4.7)
Race (%)b
Black 4.7 4.3 4.4 17.3 16.0
Non-Black 95.3 95.7 95.6 82.7 84.0
3MSE Score a -- 90.6 (8.6) 90.8 (9.5) 89.7 (10.0) 90.6 (10.3)
Living Situation (%)b
Alone 9.8 22.2 25.1 27.8 28.8
With Others 76.7 75.6 74.8 72.1 69.6
Felt Lonely (%)b
Most of the time 3.0 3.9 3.8 4.2 3.9
Moderate amount of time
4.3 4.9 4.8 4.8 4.9
At least some of the time
14.5 15.2 15.1 16.4 15.7
Rarely/Never 78.2 76.0 76.4 74.6 75.5
Social Network Score c 20 (6) 20 (6) 20 (6) 21 (5) 21 (5)
Somebody close diedb
Yes 30.6 25.4 26.3 27.9 27.5
No 69.2 74.5 73.5 72.1 72.3
A significant relationship became considerably worseb
Yes 6.6 4.1 3.8 4.8 4.3
No 93.2 95.8 95.9 95.1 95.5
Somebody close had illnessb
Yes 30.9 25.4 29.3 26.6 25.4
No 69.0 74.6 70.6 73.3 74.3
A grandchild was bornb
Yes 9.2 11.2 10.8 12.6 12.0
No 90.7 81.2 89.0 87.3 87.6
Been caring for a sick/disabled personb
Yes 14.5 7.6 7.7 9.5 6.8
No 85.3 92.1 92.1 90.3 93.1 aContinuous variables are presented as the mean and standard deviation bCategorical and binary variables are presented as percent in each category. The remaining percent of 100 for these variables corresponds to the percent missing. cThe social network score is presented as the median and IQR due to the skewness in the responses

27
the proportion of married individuals had decreased to 67%. An average of 23% of the
participants (averaged across years) reported feeling lonely at least some of the time.
Only an average of 3.8% of the participants reported feeling lonely most of the time in
the previous week. The median social network score was 20 (out of 30 possible points)
with an IQR of 6 at baseline, and increased to 21 (IQR 5) by the last year of the analysis.
An average of 27.5% of the cohort reported that somebody close died within the
last six months (averaged across years), and similarly an average of 27.5% of the cohort
reported that somebody close had an illness. Having a significant relationship become
worse was relatively uncommon, with only an average of 4.7% of the cohort reporting
this each year. The birth of a grandchild was also a rare event, with only 11% of the
cohort reporting this each year. Finally, an average of 9.2% of the cohort reported they
had been caring for a sick or disabled person during the last six months. The life events
variables were missing an average of 0.5% of the observations.
Transition Probability
Figure 2.2 shows the average annual probability (p) of transitioning between
states of loneliness from one year to the next. Only an average of 13% of individuals who
were not lonely one year transitioned to feeling lonely at least sometimes in the next
year, while 87% of those who were not lonely one year remained not lonely the next year.
In contrast, an average of 40% of individuals reporting loneliness one year transitioned
to not lonely by the next year, while 60% of the individuals reporting loneliness one year
remained lonely in the next year. Although there was a greater probability of resolving
than developing loneliness, overall there was a slight increase in loneliness over time
(from 22% to 25% of the cohort) because of the larger number of individuals in the non-
lonely group.
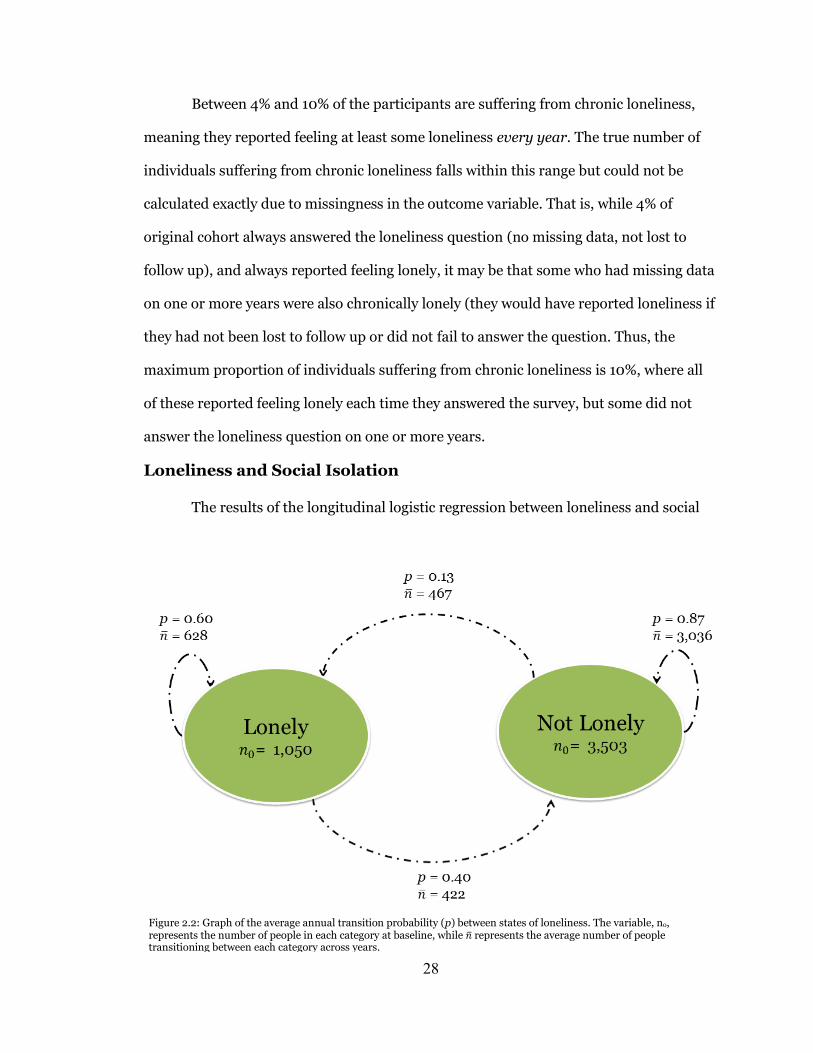
28
Between 4% and 10% of the participants are suffering from chronic loneliness,
meaning they reported feeling at least some loneliness every year. The true number of
individuals suffering from chronic loneliness falls within this range but could not be
calculated exactly due to missingness in the outcome variable. That is, while 4% of
original cohort always answered the loneliness question (no missing data, not lost to
follow up), and always reported feeling lonely, it may be that some who had missing data
on one or more years were also chronically lonely (they would have reported loneliness if
they had not been lost to follow up or did not fail to answer the question. Thus, the
maximum proportion of individuals suffering from chronic loneliness is 10%, where all
of these reported feeling lonely each time they answered the survey, but some did not
answer the loneliness question on one or more years.
Loneliness and Social Isolation
The results of the longitudinal logistic regression between loneliness and social
Figure 2.2: Graph of the average annual transition probability (p) between states of loneliness. The variable, no, represents the number of people in each category at baseline, while �̅� represents the average number of people transitioning between each category across years.

29
isolation are shown in Table 2.2. The variable most strongly associated with loneliness
was living alone, which was associated with 79% higher odds of reporting loneliness.
Loneliness was also significantly related to both between and within person effects,
calculated as each individual’s median level of social isolation across years (between
person effect) and each year’s deviation in the level of social isolation relative to the
individual’s median (within person effect). These variables are shown in Table 2.2 as
‘Median Lubben Social Network Score’ and ‘Deviation in Lubben Social Network Score’,
respectively. Across individuals, those with one additional point in their median social
network score (which corresponds to a lower level of social isolation) had 11% lower odds
of reporting loneliness. Thus, compared to those who are fully connected (score of 30 on
the social network score), those who are completely isolated (score of 0 on the social
network score) have a 97% higher odds of reporting at least some loneliness.
Within the same individual, years where the social network score was higher than
that individual’s median social network score across years (indicating lower than normal
levels of social isolation) had 3% lower odds of reporting loneliness per unit increase in
social network score relative to the median. Thus, for the individual shown in Figure 2.1,
the odds of reporting loneliness in year 1 are 6% lower than that in year 2 (social network
score is 2 points higher than the median in year 1), and 3% higher in year 3 as compared
to year 2. The most anybody deviated from their median was 17 points in either
direction, indicating the maximum effect of this variable was a 40% change in the odds
of reporting loneliness.
Among the life events variables, the variable most strongly associated with
loneliness was reporting that a significant relationship became considerably worse,
which was associated with a 125% higher odds of reporting loneliness (see Table 2.2).
Caring for a sick or disabled person was also associated with 54% higher odds of

30
reporting loneliness, although reporting that somebody close had an illness was not a
significant predictor of loneliness levels. Reporting that someone close died was
associated with 22% higher odds of reporting loneliness. Surprisingly, those who
reported a grandchild had been born in the last year also had 17% higher odds of
Table 2.2: Longitudinal association of loneliness and social isolation. Based on 24,323 observations from 5,870 individuals.
Odds Ratio
z 95% Conf.
Interval
Median Social Network Score (per unit; 30 points total)
0.89** -12.75 0.87 0.90
Deviation in Social Network Score (per unit)
0.97* -3.48 0.96 0.99
Someone close died in last year 1.22** 3.87 1.10 1.35
A significant relationship became considerably worse
2.25** 8.37 1.86 2.72
Somebody close had illness in last 6 months 1.14 2.46 1.03 1.26
A grandchild was born in the last 6 months 1.17 2.16 1.02 1.36
Been caring for a sick/disabled person 1.54** 5.58 1.33 1.80
Not Living Alone 0.21** -18.33 0.18 0.25
3MSE Score 0.98** -6.42 0.97 0.98
Health Status 1.45** 5.62 1.27 1.65
Male 0.46** -9.35 0.40 0.55
Education (years) 0.97** -3.35 0.95 0.99
Marital Status (married)
Widowed 1.61*** 4.56 1.31 1.98
Divorced/Separated 1.01 0.03 0.71 1.41
Never married 0.74 -1.61 0.51 1.07
Race (non-black)
Black 0.88 -1.06 0.70 1.11
Age 1.006 0.92 0.99 1.02
*p<0.01, **p<0.001

31
reporting loneliness, although this result was not significant (p > 0.01).
Consistent with other studies on factors associated with loneliness, widowhood
was associated with a 61% increase in the odds of reporting loneliness relative to being
married (shown in Table 2.2), being male was associated with 46% lower odds of
reporting loneliness relative to females, and each unit increase in 3MSE score
(associated with higher cognitive function) was associated with 2% lower odds of
reporting loneliness. Having significant chronic diseases was also associated with 45%
higher odds of reporting loneliness, and each unit increase in years of education was
associated with 3% lower odds of reporting loneliness. In this full model, age was not
significantly related to loneliness. This result was not consistent with prior studies on
loneliness, leading to a post-hoc analysis investigating the univariate association
between age and loneliness. In this analysis, age was significantly associated with
loneliness (results not shown).
DISCUSSION
In this paper, we have shown that loneliness is closely tied to both the median
level of isolation, and deviations from an individual’s normal level of isolation. We also
found that life events which would directly or indirectly affect the level of isolation are
closely related to the probability of reporting loneliness. In our first analysis, we
presented a transition probability graph of loneliness, showing that loneliness is a
relatively stable state: 60% of participants who report loneliness one year will also report
it the following year. We also found the percent of participants reporting loneliness was
gradually increasing each year, ending at nearly 25% reporting at least some loneliness in
the final year of the analysis.

32
Both the median social isolation and deviations from an individual’s median level
of isolation were significantly related to loneliness. We found that relative to those
experiencing the highest level of isolation, those with the largest possible social network
score had 97% lower odds of reporting loneliness. In addition, a decrease in social
network score relative to an individual’s median score (which may arise due to changes
in the number of connections or the frequency of seeing the available connections)
significantly increased the odds of reporting loneliness. Thus, individuals who began at a
low level of isolation and then became highly isolated over the time period are more
likely to report loneliness than those who began at a high level of isolation and remained
there for the entire monitoring period (holding all other variables constant). Still, the
effect of being very isolated was larger than the effect of becoming isolated over the
monitoring period. This may be because of the relatively short time period studied,
which may wash out the effect of current changes in the social network score due to
changes that occurred prior to the beginning of the monitoring period. That is,
individuals currently exhibiting a low social network score may have experienced
changes and loss prior to the monitoring period that made them feel lonely. Then, once
the monitoring period began their social network score may be constant, thereby
increasing the effect of the median social network score on loneliness and decreasing the
effect of the deviation variable. Participants exhibiting low social network scores also
have limited ability to become more isolated, but may be more impacted by changes in
the social network score. Future studies should investigate the relationship between
changes in social isolation and loneliness among those who are already experiencing
social isolation.
It may also be that the effect of the deviation variable is smaller because some
changes in the social network such as the loss of a close friend who is then replaced by a
new friend would not show up in this measure of social isolation. This is highlighted in

33
the significance of the life events variables, which dramatically affected the odds of
reporting loneliness. These results are consistent with previous longitudinal studies on
the relationship between loneliness and social isolation [74, 140], and suggest that future
studies investigating the relationship between health and loneliness or social isolation
should account for the correlation between these two variables.
In addition to finding the level of isolation was associated with loneliness, we also
discovered that participants who experienced a life event that impacted their level of
isolation were considerably more likely to report loneliness. These life events included
events that would directly affect the social network such as having a significant
relationship become worse or losing a close friend or family member. Of course, it is
natural and even healthy to mourn the loss of a close friend or family member. However,
given the close relationship between loneliness (especially chronic loneliness) and
health, it is important to help individuals suffering from loss to engage in their
community and build new relationships. Methods to identify and help such individuals
in a meaningful way may become increasingly important as the number of older adults
continues to rise. Some interventions have been designed which specifically target
individuals suffering from bereavement [141]. A better understanding of loneliness and
its causes may help in the design and implementation of meaningful interventions for
bereaved persons.
We also found that life events that indirectly affect the level of social isolation,
such as caring for a sick or disabled person which may hamper the frequency with which
one can interact with the available social network, were also significantly associated with
loneliness. Many studies have investigated the relationship between caregiving and
quality of life, and have found that care-giving, especially for a friend or family member,
reduces well-being [142, 143] and quality of life [144], and increases stress [145] and

34
depression [146, 147]. The results presented here also suggest that care-giving increases
the likelihood of feeling lonely, which is consistent with qualitative studies on loneliness
and caregiving [148]. This highlights the need to provide resources and support for those
who are caring for a family member or loved one.
Consistent with previous work, gender, cognitive status, marital status,
education, and health status were all associated with the probability of reporting
loneliness. In the full model, age was not a significant predictor of loneliness. However,
in a univariate model of age and loneliness, increased age was associated with higher
odds of reporting loneliness. This suggests that the relationship between loneliness and
age that has been found in previous studies may be due to changes in health status, social
network or life events that are more likely to accrue with increased age.
This study has some limitations. First, the data included in the analysis is from
1989-1992; over 20 years old. An entirely new generation has moved into old age, with
possibly different values, beliefs, and means of socializing (for example online
communities). It is possible that the results reported here will not generalize to the new
generation of older adults. As noted, the study also included only 5 years of data, and
therefore may not have been sensitive to the full relationship between loneliness and
changes in isolation. Future studies should investigate these relationships over longer
time periods. In addition, the social network scale used as part of the CHS only has 6
questions on social isolation, and does not include measures such as community
involvement or church attendance which are frequently included in measures of social
isolation. Future studies should investigate how changes in these aspects of isolation
affect loneliness.
Finally, self-labeling of loneliness using a direct question on whether or not each
individual currently felt lonely was used to distinguish those who felt lonely from those

35
who did not. While this loneliness assessment technique has excellent face validity and
has been employed in numerous studies, it also has several drawbacks. First, individuals
experiencing loneliness are frequently perceived as weaker, less attractive, and more
passive than their non-lonely counterparts. Due to these social stigmas associated with
loneliness, it is possible that many subjects will avoid reporting loneliness even when
they are quite lonely, leading to an underestimate of loneliness in the population, and
erroneous estimation of the association between loneliness and health outcomes. In
addition, assessing loneliness via a single question assumes that loneliness is a
unidimensional construct so the only difference between individuals is the frequency or
intensity of perceived loneliness [76]. Weiss argued that loneliness is in fact multi-
dimensional, encompassing both an emotional loneliness (the loneliness for significant
attachment figure such as a spouse) and a social loneliness (the loneliness for close
friends) [27]. Assessing loneliness via a single question cannot capture these differences
in the type of loneliness experienced, or the differences in the relationship between
loneliness and isolation in these two different types of loneliness. Previous work by
Dykstra and Fokkema noted that individuals who were experiencing social loneliness
were affected by the size of their social network, while those experiencing emotional
loneliness felt lonely independent of the social network [126]. This study only captured
one time period among married and divorced older adults, and therefore could not
assess the relationship between longitudinal changes in social isolation and emotional or
social loneliness. Future studies are required to fully understand the relationship
between changes in social isolation and the experience of emotional and social
loneliness.
In this paper, we have shown that loneliness is associated with both the level of
isolation and deviations in an individual’s level of isolation. These results have important
consequences for future studies on loneliness, especially on the identification of lonely

36
individuals. Because loneliness may change in response to many life events and is closely
related to social isolation, it may be more timely and informative to identify lonely
individuals by tracking changes in the social network or other daily behaviors using
unobtrusive monitoring techniques [12, 81]. For example, tracking call history would
enable assessment of social network size and frequency of contact—the two major
components of social isolation scales. Other behaviors that may relate to loneliness that
can be tracked unobtrusively include time spent outside the home [81], computer use
[149], and sleep quality [6]. Such approaches to loneliness identification would have
dramatic consequences for the understanding of loneliness, enabling researchers to
monitor and assess loneliness levels on smaller time scales such as daily or even hourly.
ACKNOWLEDGMENT
This research was supported by contracts HHSN268201200036C,
HHSN268200800007C, N01HC55222, N01HC85079, N01HC85080, N01HC85081,
N01HC85082, N01HC85083, N01HC85086, and grant U01HL080295 from the
National Heart, Lung, and Blood Institute (NHLBI), with additional contribution from
the National Institute of Neurological Disorders and Stroke (NINDS). Additional support
was provided by R01AG023629 from the National Institute on Aging (NIA). A full list of
principal CHS investigators and institutions can be found at CHS-NHLBI.org. The
content is solely the responsibility of the authors and does not necessarily represent the
official views of the National Institutes of Health.

37
Chapter 3: Unobtrusive In-Home Detection of Time Out-of-Home with Applications to
Loneliness and Physical Activity
SUMMARY
This section details the work performed to unobtrusively assess daily time out-of-
home using the in-home sensing platform. Using features from the in-home data stream,
we first develop and validate a logistic regression classifier to assess whether someone
was in the home or not for each 5-minute interval. This approach was both sensitive
(0.939) and specific (0.975) in detecting home occupancy across over 41,000 epochs of
data collected from 4 subjects monitored for at least 30 days each in their own homes,
although it worked best for individuals who were not living in the assisted living portion
of a retirement community where regular nurse visits caused large amounts of noise in
the data. Once the classifier was developed and validated, we used it to compare the
loneliness of the cohort with their daily average time out-of-home over the four days up
to and including administration of the 20-item UCLA Loneliness scale [9], and found
that people who are lonelier tend to leave the home for fewer hours on average each day
(r = 0.442, p=0.011). We also studied the relationship between time out-of-home and
physical activity, and discovered that self-reported level of physical activity is
significantly associated with time out-of-home, but may be subject to recency effects.
These results indicate that time out-of-home is an important covariate to loneliness, and
that by monitoring time out-of-home and its covariates longitudinally, it may be possible
to infer loneliness.

38
INTRODUCTION
Loneliness, or perceived social isolation, is a common condition that is
particularly prevalent in elderly where retirement, the death of friends, and the subtle
decline in health pose challenges to forming and maintaining friendships. Indeed, nearly
20% of seniors self-report as occasionally lonely [150], while 5-15% of elders report
frequent loneliness [123]. In this population, loneliness is particularly problematic since
it predicts morbidity and mortality [1-3], causes decreased cognitive functioning [4],
impairs sleep quality leading to daytime dysfunction [5, 6], decreases mobility which
increases risk of falls [7, 8], and reduces quality of life. For these reasons, detection and
mitigation of loneliness is critical, as the deleterious effects of loneliness can be reversed
with an appropriate intervention [11]. However, physicians currently do not assess
loneliness in the clinical setting and many of the aforementioned correlates of loneliness
can cause lonely people to go unnoticed by people and programs attempting to reach out
to them, making detection of lonely individuals difficult.
Smart homes, which have the ability to continuously and unobtrusively monitor
inhabitants [15, 88, 89], present an ideal means to monitor and detect loneliness at the
earliest phases. While multiple approaches to smart home technology exist [96, 151-153],
memory problems and privacy concerns in the elderly hamper the efficacy of devices
worn on the body and cameras in the home. For this reason, our research focuses on
unobtrusive and passive sensing of loneliness based on data from motion sensors,
contact sensors, computer sensors, and phone sensors. Using this array of sensors, we
are developing methods to monitor the covariates of loneliness—for example, sleep
This work was originally published in 2014 by the IEEE Journal of Biomedical and
Health Informatics, Volume 18, Issue 5, pp. 1590-1596
Reprinted with permission

39
quality [98], frequency of visitor contact [154], total activity [101], and time out-of-
home—with the goal of developing a robust model of loneliness that can be employed to
continuously and unobtrusively detect loneliness in the home. Such a platform would
allow lonely individuals to receive much needed help prior to experiencing a host of
negative health effects.
The focus of this paper is on using passive sensors for objectively and
unobtrusively detecting time spent out-of-home, a critical component of loneliness. This
is in large part because loneliness often presents with a decline in physical activity [155],
decreased motor function [7], and increased risk of depression [80], all of which are
associated with more time spent in the home. Loneliness is also associated with sleep
disruptions and daytime dysfunction [5]. Daytime dysfunction may not only increase
time spent inside the home, but also reduce activity while in the home. For this reason,
accurately detecting when an individual leaves the home will allow us to control for time
out-of-home when estimating daytime dysfunction.
While our primary focus is on characterization of loneliness, measuring time out-
of-home is also important for other applications. For example, fewer outings has been
linked to decreased cognitive functioning, suggesting its importance for detecting
cognitive decline [107]. More generally, measuring time spent out-of-home across a large
number of individuals allows investigation into general behavioral patterns such as how
elderly spend their time during the day, what the regularity of these patterns is over the
course of the day, and what sort of changes exist between weekday and weekend out-of-
home profiles. In fact, as we suggest below, larger variability in out-of-home profiles may
allow detection of individuals at higher risk of loneliness.
Taken together, these applications support the need for an accurate, objective
and unobtrusive method for detecting time out-of-home, especially in elderly

40
populations. In the following we describe and validate a method for detecting time spent
out-of-home using a logistic regression based classifier with inputs derived from passive
senor data. After describing the sensor data collection and video ground truth, we
discuss the rationale for incorporating different inputs into the classifier followed by a
performance assessment. We follow by showing several applications of our methodology
to loneliness and physical activity, and conclude with a summary of the contributions of
this work.
METHODS
In this section, we describe the data collection, the model development and
experimental validation.
Data Collection
The data used in this study were collected from the homes of the Intelligent
Systems for Assessing Aging Changes (ISAAC) cohort [156] and the ORCATECH Living
Lab. These two cohorts currently comprise around 150 seniors living independently in
the Portland community who have been monitored for the past 3-5 years. A core set of
technologies is continually maintained in all homes, including pyroelectric motion
sensors (MS16A, x10.com) in each room and contact sensors (DA10A, x10.com) on the
refrigerator and doors to the home.
To collect ground truth data, motion activated video cameras (Logitech C600)
were installed over the door in the homes of four different subjects. This allowed us to
capture when residents entered and exited the home while minimizing privacy issues by
only recording video for 5 seconds when motion was detected. At installation, we verified
that the field of view of the camera was appropriately positioned to detect when people
passed through the door. Each individual video file was first labeled with a home

41
identifier and time stamp and then automatically uploaded to our data server. Using
these data, outings from the home were hand-annotated. An outing was defined as any
period where the resident left the home and closed the door behind them, leaving
nobody else in the house. Thirty days of valid video data were collected from each home.
While the cameras collected data, data from motion sensors in each room of the
home as well as contact sensors on the doors of the home were simultaneously collected.
The infrared motion sensors function by firing a signal each time movement is detected,
with a refractory period after firing of about 6 seconds. The contact sensors are magnetic,
and fire a different signal when the two magnets are together (the door is closed) than
when they are apart (the door is open). These contact data also have heartbeats: if no
event occurs within about an hour, the contact sensor emits a signal corresponding to
whatever state it is in at present. To remove heartbeats, consecutive data points with the
same signal were removed from the data stream.
Feature Selection
To derive the features used in the model development, the sensor data from each
home was first divided into 5 minute epochs. Because most out-of-home events last at
least 30 minutes, this window size was small enough to capture the outing events with
high sensitivity, while remaining large enough facilitate data processing and analysis.
For each epoch, thirteen features were calculated—five initial features and the forward
and backward lags from four of them—and used in the model development.
The first feature included in the model corresponds to the number of sensor
firings during each five minute interval. Because the motion sensors in the home are
event driven, the number of sensor firings should be very low or zero when nobody is
present in the home. On the other hand, the number of sensor firings should increase
when someone is present in the home provided they are moving about. To account for

42
periods where the subject is both home and not moving (e.g. during naps or overnight),
our second feature corresponds to whether the subject was in or out of bed, as calculated
using the heuristic approach developed by Hayes et al [98].
Our next two features correspond to the firing of door sensor events and are
designed to capture entry and exit events from the home. Two key observations can be
made regarding the door sensor and outings from the home. First, when the subject
leaves the home, the last sensor firing in the home during the departure epoch should be
a door sensor. Second, when the subject arrives back home, the first sensor firing in the
home during the arrival epoch should be a door sensor. In between these two events,
few, if any, sensor firings should occur. However, simply looking for these events to
happen consecutively is not enough as door sensor firings are noisy and can be missed.
For example, if a door opening event is not recorded, the corresponding door closing
event will be treated as a heartbeat and removed from the sensor stream. To create the
most robust model, we therefore incorporated two separate door sensor features into the
model. The first, corresponding to a leaving event, operates on the intuition that periods
of inactivity following a door sensor likely correspond to out-of-home events. For this
feature, we looked for periods where the door sensor was the last sensor that fired during
the epoch. All epochs between this event and the next movement event, where movement
is defined as at least 3 consecutive sensor firings, were labeled as ‘1’, corresponding to
epochs where the person was likely out of the home. Our second door sensor feature
corresponds to an arrival event, and operates on the intuition that periods of inactivity
preceding a door sensor firing likely also correspond to out-of-home events. For this
feature, we looked for all epochs where the door sensor was the first sensor in the epoch
and labeled all epochs between this event and the previous movement event as ‘1’.

43
The final feature included in the model simply indicates whether the last
recorded sensor firing occurred in a room from which the subject could leave the house.
This feature was calculated independent of the true home layout. Rather, rooms that
were deemed unlikely to leave the home from without first tripping a different sensor
(e.g. a bedroom) were labeled ‘0’ while those a resident may be able to directly leave the
home from (e.g. the living room) were labeled ‘1’. Each epoch was then labeled according
to the value of the last sensor firing. This feature was important to distinguish events
where the resident arrived home and opened the door from those where the resident was
in the home but not moving when someone else arrived and opened the door. Although
using the home-specific layouts could provide better labeling for training purposes, this
approach would not readily generalize to new homes.
In order to capture some of the time-series nature of outings from the home,
forward and backward lags of one epoch for each feature except the bed feature were also
used in the classifier.
Model Development
We treated the problem of detecting outings as a binary classification on each
epoch. Multiple methods to classify binary data exist (support vector machines, neural
networks, logistic regression, etc.), each with its own advantages and disadvantages.
However, the focus of this paper is not to compare the different classification techniques,
but rather to demonstrate that the features described can be used to separate out-of-
home epochs from in-home epochs with high sensitivity and specificity. Because of the
ease of interpretability of the results, we chose to use logistic regression, a well-known
technique often used for binary classification [157], to classify the data. Logistic
regression is based on the assumption that the “log-odds” of the outcome is linear in the

44
parameters. From this assumption, the conditional probability follows a logistic
distribution given by
exp( )( 1| )
1 exp( )
ii i
i
P y
xx
x. (3.1)
where yi is a binary indicator variable corresponding to ‘1’ if nobody is in the home
during epoch i (the participant is out-of-home) and ‘0’ otherwise, xi is the feature vector
for epoch i , and, β represents the vector of model parameters which can be estimated
using maximum likelihood.
To optimize model performance and applicability, we trained on the same
number of out-of-home events as in-home events. This resulted in training on ¼ of the
in-home epochs (7745 of 30,980 epochs), and ¾ of the out-of-home epochs (7678 of
10,198 epochs). We tested on all the remaining data. For all model fits, we used 1000
fold repeated random sub-sampling to determine mean out-of-sample performance,
parameter estimates, and 95% confidence intervals for sensitivity and specificity with a
decision threshold of 0.5 (that is, samples with a probability greater than 0.5 were
classified as ‘out-of-home’, and those with a probability less than 0.5 were classified as
‘in-home’).
Initially, the logistic regression model was trained using all the data and all the
features discussed above. Parameter estimates and 95% confidence intervals for each
feature were calculated using these data. All features with parameter estimates whose
95% confidence intervals included zero were removed from the model, and the model
was refit using the reduced feature set. This process was continued until all included
features proved significant. Through this process, four features were removed: the
forward and backward lags of the number of sensor firings, the backward lag of the first

45
door sensor, and the forward lag of the last door sensor. All other features were
significant. The results of the model with the final feature set are presented below.
RESULTS
The logistic regression based classifier performed well with a sensitivity of 0.939
(95% CI: 0.931, 0.947) and specificity of 0.975 (95% CI: 0.973, 0.977). This high
performance can also be visualized in the ROC curve shown in Figure 3.1. The ideal
threshold for classifying this data is likely 0.51. After this point, a small increase in
sensitivity causes large drops in specificity, quickly resulting in dramatic overestimation
of time out-of-home.
While reporting sensitivity and specificity is important, the true goal of this
model is to estimate how much time an individual spends out of the home. For that
Figure 3.1: Receiver operating characteristic (ROC) curve of the model performance.

46
reason, calculating the difference between the estimated time out-of-home and the true
time out-of-home is important. This difference will vary as a function of the proportion
of time spent out-of-home. That is, for individuals who go out frequently, the low
sensitivity may cause underestimation of time out-of-home, while we may over-estimate
the time out-of-home for those who seldom leave. To compute the expected bias in
minutes we estimate the probability of false positive (1 )(1 )ps p and of false negative
(1 )( )es p and evaluate their difference multiplied by the number of minutes in a day:
1440 (1 )(1 ) (1 )( )p e
b s p s p . (3.2)
Here, sp is the specificity of the model, se is the sensitivity of the model, and p is the proportion of time spent out-of-home. Using this estimate of the bias,
Figure 3.2 shows the relationship between true daily time out-of-home and the estimate
of time out-of home for a sensitivity of 0.939 and specificity of 0.975. In our population
of four subjects, the lowest average daily time out-of-home was 3 hours per day. For this
subject, the classifier will overestimate their time out-of-home by 19.8 minutes per day
on average. On the other hand, the highest average time out-of-home was 8 hours per
day, and the classifier will underestimate this subject’s time out-of-home by 5.1 minutes
per day on average. Across subjects, the classifier will overestimate time out-of-home by
5.5 minutes per day on average. Within the range of probable average daily time out-of-
home, this classifier performs very well at estimating the true time out-of-home.
This performance gives some indication of the noisiness of the sensor data. For
example, many of the false negatives (periods classified as ‘in’ when nobody was actually
in the home) occurred when sensors would fire in the home while the resident was out,
likely due to sources of heat inside the apartment (e.g. space heaters, pets, or sun
through the window). Indeed, in two separate homes, we discovered sensors that often
fired while the resident was out of the home – one likely due to a computer turning on
and causing a change in heat patterns in the room, and the other likely due to sun

47
through the window. Because it is nearly impossible to detect and eliminate all mis-
firings, we did not remove any of these events from the sensor stream. Instead, our
performance gives an indication of how the model will perform under true conditions,
which are typically noisy.
In general, we were able to handle these noise issues as well as noise associated
with the door sensors themselves by accounting for both arrival and departure events. If
the arrival door event was excluded from the model, the sensitivity dropped only slightly
to 93.1% while the specificity dropped considerably to 82.6%. Exclusion of the departure
door event dropped the sensitivity to 90.67% while the specificity remained largely
unaffected at 96.6%. This difference between the arrival and departure door sensor
events indicates more errors occur with door sensors when subjects are leaving the home
than when
they arrive
back home.
Figure 3.2. Estimated daily time out-of-home as a function of actual daily time out-of-home. For the individual from this population who leaves the most, the classifier underestimates their time out-of-home by 5.11 minutes. For the individual who leaves the least, the classifier overestimates their time out-of-home by 19.83 minutes. On average, the classifier will overestimate time out-of-home by 5.47 minutes.

48
Model Applications
We have shown that our classifier can detect outings from the home with high
accuracy. We now examine applications of this model.
Loneliness and Outings
In June of 2012, subjects from both the ISAAC cohort and the ORCATECH living
lab were administered an online version of the UCLA loneliness scale [9], a well
validated survey for assessing loneliness. This survey asks questions such as “I do not
feel alone” and “There are people I feel close to”, where response options are: (1) Never,
(2) Rarely, (3) Sometimes and (4) Often. Because this survey was administered online
rather than in-person, we also added a response for ‘do not wish to answer’. After
reversing the value of positive questions, the value of each answer was summed across
the twenty questions to give a loneliness score ranging from 20 to 80, with 80 being the
loneliest. The least lonely individual scored 21 on this survey, while the loneliest
individual from our cohort scored 60. The mean value was 35 with a standard deviation
of 7.87, which is consistent with values obtained by Russell et al in validating the UCLA
Loneliness Scale for the elderly [40].
We chose to correlate loneliness score with the average time spent outside the
home over the five days up to and including survey administration. This interval was
chosen to provide the most robust summary of average outings while eliminating as
much recall bias as possible. The current analysis included only those subjects with valid
sensor data who answered all questions on the questionnaire (34 people) and who live
alone. Of those 34 individuals, two were traveling away from home for at least three of
the five days prior to filling out the survey and were therefore excluded from this aspect
of the study. This left a total of 32 subjects who completed the loneliness survey and had

49
valid sensor data. We used these subjects’ data to explore the correlation between
outings and loneliness.
Figure 3.3 shows the correlation between the average time spent outside the
home over the course of the four days up to and including survey administration and the
corresponding loneliness score. As can be seen, average time outside the home is
negatively correlated with the loneliness score, indicating those who spend more time at
home tend to be lonelier. This is consistent with research showing a negative correlation
between loneliness and physical exercise, social activity, and mobility. Still, the
correlation is significant (p=0.011) but modest (r = -0.44). Obviously it is possible for
some individuals to stay at home but not experience loneliness. Including other factors
that influence loneliness such as social contact with others, sleep disturbances, and
daytime dysfunction would assist in creating a more complete model of loneliness in the
Figure 3.3: Loneliness score as a function of average time spent outside the home over the five days up to and including survey administration. Loneliness is negatively correlated with time out-of-home.

50
home.
Outings by Time of Day
While the total time spent outside the home is important, various factors can
influence the time spent outside the home. For example, in retirement communities
people typically take meals in the central dining hall. Leaving simply to eat a meal may
not influence loneliness the same way that leaving to play games with close friends
would. For this reason, it is also important to view outings as a function of the time of
day.
For this aspect of the study, we used our outing model to compute outings, y for
every five minute interval over the thirty days prior to completing the loneliness survey
where y=1 if the individual was out of the home, and y=0 if the individual was in the
home. By averaging the corresponding y values for each subject and day, we were able to
generate a picture of the probability of leaving the home as a function of the time of day.
Figure 3.4 shows the probability of leaving over the entire population of 51 individuals
living alone in the community who completed the survey and had any full days of sensor
data during the 30 day period prior to survey completion. Clear peaks can be discerned
at around noon and 6 p.m., corresponding to the lunch and dinner hours, respectively.
The probability of being out of the home at these times was 0.5, indicating that at noon
and 6 p.m., an average of 50% of our elderly population is outside the home on any given
day. Further, these subjects are more likely to be out of the home in the early afternoon,
perhaps when most errands are completed. Not surprisingly, Figure 3.4 also shows that
our cohort is almost certainly at home during the night, consistent with sleep patterns.

51
While trends across the population are important for summarizing how elderly
spend their time, individual trends are also important. To illustrate the variability of
outing patterns of lonely and non-lonely individuals, we chose to plot the probability of
being out for a representative sample of five subjects with varying loneliness scores.
Their loneliness scores and corresponding probability of being out of the home are
shown in fig. 5(a-e). Clear meal times and an obvious regularity can be discerned in fig
5a-d, but this regularity is largely absent in fig 5e—the loneliest individual plotted.
It is worth noting that the individuals in Figure 3.5a, c, and d live in retirement
communities where they could take meals in the local dining hall. While the individual
plotted Figure 3.5a leaves the home regularly in the late afternoon, the main peaks in
Figure 3.5c surround the lunch and dinner mealtimes. This mealtime regularity is also
Figure 3.4: Mean and 95% CI of the probability of being out of the home as a function of the time of day for 51 elderly subjects over the course of 30 days. For this cohort of elderly, roughly half the population is out of the home at lunch and dinner times on any given day.

52
seen in Figure 3.5d, although this individual rarely leaves the home at all. This may
suggest that outings other than simple mealtime outings are important in assessing
loneliness for individuals living in a retirement community. On the other hand, mealtime
outings for individuals living alone in the community may represent an important aspect
of socialization, and contribute greatly to decreasing loneliness. This is seen in Figure
3.5b. This individual lives alone in the community and, even though his most common
outing times surround the mealtimes, he is not lonely. Likely he is getting a great deal of
socialization when he leaves his home to get a meal with a friend, which helps ward off
loneliness. Taking into account these different lifestyles may be important in
unobtrusively modeling loneliness in the home.
Outings and Physical Activity
Many physical activities are done outside the home, so we tested how outings
from the home correlate with self-report of physical exercise. Concurrent with the
administration of the UCLA loneliness scale, subjects also completed a physical activity
survey from Berkman’s Social Disengagement Index [158]. This fifteen item survey
Figure 3.5: Average probability of being out of the home as a function of the time of day for five different individuals over 30 days with varying loneliness scores. 95% CI in this measure is plotted in grey. Meal time outings can be seen on plots (a-d) whereas subject (e), the loneliest of the group, is the most variable and the only one with no clear mealtime peaks.

53
queries subjects regarding activities they do both in and outside the home. To get a
composite score of outside activities, scores on three questions were reversed: (i) How
often do you prepare your own meals, (ii) How often do you read books, magazines, or
newspapers, and (iii) How often do you watch television, as these are activities likely
done inside the home. After reversing these scores, the scores on all questions were
summed to give a total outdoor activity index.
A plot of the correlation between the physical activity score and the average time
spent outside the home over the four days up to and preceding survey administration is
shown in Figure 3.6a. As can be seen, physical activity score is positively correlated with
average time spent outside the home (r=0.415, p=0.031), indicating outings are also an
Figure 3.6: (a) Physical activity score as a function of average time spent outside the home over the four days up to and including survey administration. (b) Pearson’s correlation coefficient (r) between average time outside home and physical activity score. As more days further from the survey date are included in the window and averaged, the correlation drops off. This suggests recall bias.

54
important measure of physical activity. This correlation is also prone to recall bias.
Figure 3.6b shows a plot of the correlation as a function of the window of observation.
While looking at only the same day as the survey generates the worst correlation, the
best correlation is seen when averaging around 3-7 days of outing activity. The
correlation then drops considerably until it plateaus at around 18 days of outing data.
This result is consistent with the salience effects seen by Eagle et al. in their correlation
of self-report of proximity patterns of other individuals with Bluetooth phone logs [114],
suggesting human recall favors the recent events.
CONCLUSIONS
We have presented and validated a logistic regression based classifier to detect
outings from the home on longitudinal data from subjects currently monitored in their
own homes. Our classifier performs very well with a sensitivity of 0.939 and specificity of
0.975, but it depends heavily on door sensors firing when they ought. Simple tests for
door sensor functionality should be employed prior to using this model.
We also discussed several practical applications of our approach. Specifically, we
have shown that time outside the house is negatively correlated with loneliness,
indicating the utility of time out-of-home in any unobtrusive model of loneliness. We
have also demonstrated a general pattern of out-of-home behavior in an elderly
population consistent with prior research, and shown that outing patterns vary
substantially on an individual level which may be useful in detecting individuals at
increased risk of loneliness. We correlated time out-of-home with physical activity, and
were able to demonstrate that an individual’s self-report of physical activity may be
subject to recall bias. In conclusion, we expect that being able to accurately detect out-of-
home events will improve point-of-care in the home setting, particularly for loneliness

55
and other adverse health outcomes whose symptoms present with an increased,
decreased, or more variable pattern of out-of-home behaviors.
ADDENDUM
In this chapter, we discussed various errors that may occur in the sensor data
that would reduce the sensitivity and specificity of the time out-of-home classifier. For
example, if a sensor in the home fires repeatedly when the subject is out-of-home, those
epochs may be classified as ‘in-home’ when the participant is in fact out-of-home. This
type of error would drop the sensitivity and if it occurred in applications of the
algorithm, would lead to mis-estimation of the total daily time out-of-home. Another
source of error would be malfunctioning door sensors, which would dramatically reduce
the algorithms ability to detect the periods where the subject is not home, thereby
reducing the sensitivity of the algorithm.
In one of the homes included in this analysis, a sensor would frequently fire while
the subject was not home. To demonstrate the algorithm performance in the presence of
such noisy data, we performed a round-robin train and test of the classifier, where we
trained the classifier on data from all but one subject and tested the performance of the
classifier on the data from the remaining subject. The results of this analysis are
presented in Table 3.1. As can be seen, the classifier performed well for three of the four
subjects (Subjects 1-3), with an
average sensitivity of 94.35 and
average specificity of 98.41.
However, for the last subject
(Subject 4), the sensitivity of the
classifier dropped dramatically to
Table 3.1: Comparison of sensitivity and specificity of classifier when trained on 3 subjects and tested on the remaining subject.
Sensitivity Specificity
Subject 1 93.25 96.55
Subject 2 94.02 99.36
Subject 3 95.8 99.31
Subject 4 79.67 99.07
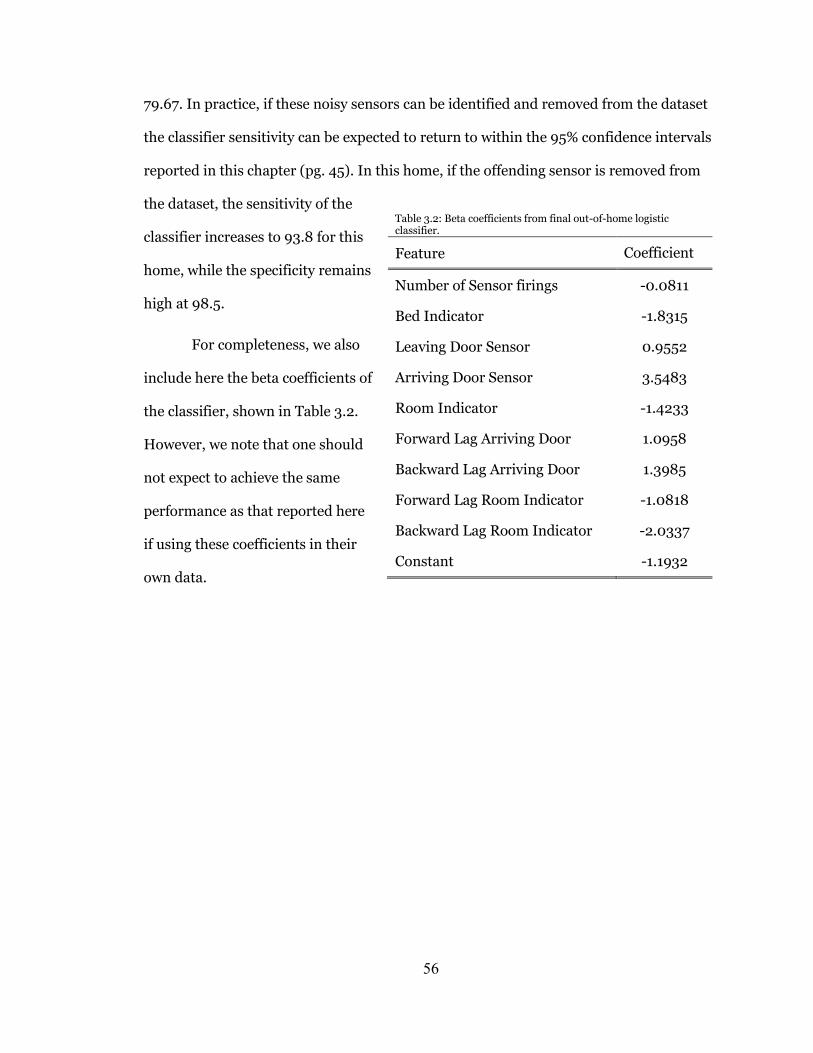
56
79.67. In practice, if these noisy sensors can be identified and removed from the dataset
the classifier sensitivity can be expected to return to within the 95% confidence intervals
reported in this chapter (pg. 45). In this home, if the offending sensor is removed from
the dataset, the sensitivity of the
classifier increases to 93.8 for this
home, while the specificity remains
high at 98.5.
For completeness, we also
include here the beta coefficients of
the classifier, shown in Table 3.2.
However, we note that one should
not expect to achieve the same
performance as that reported here
if using these coefficients in their
own data.
Table 3.2: Beta coefficients from final out-of-home logistic classifier.
Feature Coefficient
Number of Sensor firings -0.0811
Bed Indicator -1.8315
Leaving Door Sensor 0.9552
Arriving Door Sensor 3.5483
Room Indicator -1.4233
Forward Lag Arriving Door 1.0958
Backward Lag Arriving Door 1.3985
Forward Lag Room Indicator -1.0818
Backward Lag Room Indicator -2.0337
Constant -1.1932

57
Chapter 4: Phone Behavior and its Relationship to Loneliness in Older Adults
SUMMARY
In this section, we study the relationship between loneliness and objective measures of
phone behavior. Using data on the total daily number of calls as recorded by in-home
phone monitors on the landline phones of 26 older adults, we show that increased
loneliness is associated with fewer total calls (both incoming and outgoing). In
particular, individuals with the highest possible loneliness score of 60 had half (0.52) the
number of calls each day on average compared with individuals with the lowest possible
loneliness score, holding all other variables at their means. A follow up analysis shows
loneliness is significantly related to both incoming and outgoing phone calls. This work
shows that total phone use should be included in the longitudinal model of loneliness.
Future work on phone use and loneliness should assess how changes in social network
(for example changes in the numbers dialed) relate to loneliness. In addition, this work
included data from landline phones only, and the results should be verified among cell
phone users as the behavioral profile of cell phone use may differ from that of landline
phones.

58
INTRODUCTION
Loneliness and social isolation have each received considerable attention in
gerontology due to their association with numerous negative health outcomes [159]. For
example, individuals experiencing loneliness have been found to exhibit increased
morbidity and mortality [1], reduced sleep quality [5], increased daytime dysfunction [6],
and increased rates of cognitive decline [4]. The relationship between loneliness and
health may be in part because lonely individuals perceive less support from their social
network [122], and therefore experience increased stress levels compared to non-lonely
individuals [71]. Likewise people who are socially isolated tend to have increased
morbidity and mortality with the increase in mortality similar to that of smoking [19].
Socially isolated people also exhibit poor sleep quality [73] and increased risk of
cognitive decline [120]. These associations with health may be a direct result of a poor
social network, as isolated individuals have less access to resources and less
encouragement to engage in healthy behaviors [42, 55, 56]. But while both loneliness
and social isolation are associated with significant negative health outcomes, it is
difficult to isolate the contribution each state has on health in part due to problems with
the assessment of loneliness and social isolation.
While loneliness is typically understood to refer to a subjective feeling of a deficit
in social relationships [26, 28, 29], the term ‘socially isolated’ refers to a quantifiable
state where the number of network members or frequency of contact with the network is
small [36, 37]. As a result, while loneliness is typically assessed using subjective scales,
assessment of social isolation has been performed simply by counting the number of
network members and the frequency of contact with the network [38]. However, most of
This chapter has been accepted for publication pending a minor revision to Aging
and Mental Health.

59
the techniques currently used to assess social isolation rely on subjective self-report of
the number of contacts and frequency of contact with the network. Relying on self-report
to assess both loneliness and social isolation makes it challenging to isolate the impact
each of these constructs has on health. For example, an individual experiencing
loneliness may perceive (and report) infrequent contact with friends regardless of the
true amount of contact. Thus, the development of an objective means to assess social
isolation would advance the understanding of the relationship between loneliness and
social isolation, and their differential effect on health.
One aspect of behavior that directly relates to the level of isolation is telephone
use. Because people use the phone to call their network members, monitoring phone
calls would provide one measure of the frequency of contact (by monitoring total number
of calls), and network size (by monitoring numbers dialed). Of course, this would only
assess frequency of contact via the telephone, and network size of those with whom one
corresponds via telephone, which may not be a complete picture of the level of isolation.
Still, many of the scales used to assess social isolation ask participants how often they
contact friends and family by phone in addition to asking how often they are contacted in
person, highlighting the importance of telephone contact in measures of isolation. In
young adults, data collected from mobile phones has been used to quantify social groups
and their evolution [112, 113], infer friendship networks [114], and even assess mental
health [115]. These applications typically employ smart phone apps to record phone calls,
Bluetooth proximity logs (records when the phone is close to another Bluetooth user),
and GPS or cell-phone tower information. However, older adults still largely use landline
phones and flip phones (as opposed to smart phones): while 69% of those 65 and older
own a cell phone, only 18% owned a smart phone in 2012 [160]. Thus the smart phone
apps developed to assess phone use do not currently work in well this population.
Monitoring landline phone use can be performed by installing a device in the home that

60
records signals on the phone line. This technology can easily be employed with other
unobtrusive in-home monitoring systems which detect important behavioral features
such as time out-of-home [81], sleep quality [98], visitors to the home [154], or computer
use [161], and provides a longitudinal measure of a key behavioral parameter.
In this research, we used phone monitors placed in the homes of 26 older adults
to objectively assess social isolation and its relationship to loneliness. We hypothesized
that increased levels of loneliness, as measured using the UCLA Loneliness Scale, would
be associated with fewer daily calls. As a secondary analysis, we also sought to determine
whether loneliness had a differential effect on outgoing or incoming calls. Previous work
on loneliness has demonstrated that individuals experiencing loneliness may attempt to
overcome their loneliness by reaching out to others [27, 162]. Thus, while incoming calls
may decline as individuals become lonely, outgoing calls may remain constant or
increase. In the later phases of loneliness, both incoming and outgoing calls are likely to
decline as individuals may adjust their expectations for social contact or become resolved
in their loneliness [20, 26]. Thus, we hypothesize that loneliness will be significantly
related to incoming calls but not outgoing calls.
METHODS
Participants
The participants for this study were recruited from the ORCATECH Intelligent
Systems for Assessing Aging Changes (ISAAC) [12] cohort, an ongoing observational
study aimed at understanding the relationship between daily behavior and health in
older adults. The minimum age for participation in the ISAAC study is 80 years (or 70
for non-whites). Participant inclusion criteria include living independently in a house or
an apartment larger than a studio, a minimum score of 25 on the Mini-Mental State

61
Examination [163], and a maximum score of 0.5 on the Clinical Dementia Rating[164]
scale. Participants were also required to be in average health for their age with either no
or well-controlled chronic health conditions. Exclusion criteria were health conditions
that may limit physical participation or lead to death within three years. Subjects from
the ISAAC cohort who agreed to participate in this additional study received phone
monitors (Shenzen Fiho Electronic, Fi3001B) on their landline phone line for up to one
year. All subjects signed informed consent prior to participating in any study activity,
and the study was approved by the OHSU Institutional Review Board (IRB #4661). A
total of 26 individuals agreed to participate; the mean age of the participants was 86 ±
4.5 years, 88% of the cohort was female, and 46% had completed college (see Table 4.1).
Data and measures
Incoming phone calls
Installation of the phone monitors began in December of 2011 and continued on
through February of 2012. Once installed, the monitors were left in the home for at least
6 months. During this time, subjects had a mean of 174 ± 87 days of valid monitoring
data. The differences in number of days of data between subjects were influenced
Table 4.1: Demographic characteristics of the population
Characteristic Statistic Range
(Min, Max)
Age (years) 86 ± 4.5 (73, 94)
Gender (% Female) 88% -
Education (% Completed College) 46% -
Race (% Caucasian) 100%
MMSE 29.1 ± 1.04 (26, 30)
Cognitive Z-score 0.28 ± 0.55 (-0.81, 1.39)
Loneliness 35.3 ± 7.6 (23, 60)
Pain Level 1.89 ± 2.2 (0, 10)
62
primarily by device functionality. That is, the devices occasionally stopped collecting data
due to a device failure, and would not turn back on for a period of up to several months.
Thus, the missing data mechanism was not related in any way to the study participants
or their characteristics. As a result, we assumed the phone call data were missing
completely at random, and dropped days with missing data from the model. The
monitors plug directly into the phone line, and are designed to record all signals on the
line including ‘on hook’, ‘off hook’, ‘ring start’, ‘ring stop’, and ‘dtmf’ (numbers dialed
encoded as dual-tone multi-frequency). Incoming and outgoing phone calls were
counted separately. Because the phone must ring prior to being taken off the hook for an
incoming call, all calls where the phone rang and was subsequently removed from the
hook within 30 seconds of the final ring signal were counted as incoming calls. It should
be noted that missed calls (calls where the resident did not answer the phone) would not
be treated as incoming calls in this paradigm. For a call to be treated as outgoing, a
number must have been dialed. Because several of our participants live in retirement
communities, four digit codes could be used to call within the building to other residents
of the retirement community. As a result, a call was treated as outgoing if an ‘off hook’
signal was followed by at least four numbers dialed and not preceded by a ring signal. It
should be noted that there is no signal to detect whether an outgoing call was completed
(that is, whether the other end picked up the phone or not). Caller-ID information was
not reliably collected, and therefore data regarding the number dialed was not used in
this analysis.
Loneliness
Loneliness was assessed online in June of 2012 using the 20-item UCLA
Loneliness Survey [9], which asks questions such as “I feel part of a group of friends” and
“I do not feel alone”. Response options for each question are (1) Never, (2) Rarely, (3)
Sometimes, and (4) Often. The survey is scored by first reversing the value of positive

63
questions and then summing the value of each answer to give a composite ‘loneliness’
score between 20 and 80, with 80 being the loneliest.. The loneliness survey was
administered to participants in conjunction with a regular weekly health form, a
questionnaire with 11 questions that was administered online to all ISAAC participants
each week. This questionnaire is programmed to appear on participant computers every
time they log in to the computer until it is completed. The survey begins to appear each
Monday, and once completed will not appear again until the following Monday. For a
period of up to 2 months beginning in June 2012, the loneliness survey appeared
immediately after completion of the weekly health form. Participants were told the
general nature of the ensuing questions and given the option to accept, decline, or
postpone survey completion. If a participant opted to postpone survey completion, it
appeared after subsequent weekly health forms until either the subject completed the
entire survey, declined to complete the survey, or a period of two months passed. Once
the participant completed this online administration of the UCLA Loneliness survey
once, they were not asked to complete it again. Thus, we collected the UCLA Loneliness
Survey data from each participant at most one time, but the date at which they
completed it ranged from early June to late July.
Covariates
We included several variables in the model that might confound the relationship
between loneliness and incoming phone calls. Individuals with cognitive difficulties
might initiate fewer conversations, and those with more physical symptoms might reach
out to other people more or less than others would. Global cognitive status was assessed
using a composite score including z-scores tabulated from two or three representative
neuropsychological tests in each of five cognitive domains. Cognitive domains included
working memory: Letter-Number Sequencing (WMS-III) [165] and Digit Span Backward
length (WAIS-R) [166]; attention/processing speed: Digit Span Forward length (WAIS-

64
R), Digit Symbol (WAIS-R), and Trail Making Test- Part A [167]; memory: WMS-R
Logical Memory II Story A, WMS-R Visual Reproduction II, and CERAD Word-List
Recall [168]; executive function: letter fluency (CFL), Trail Making Test Part B [167], and
Stroop color-word conflict [169]; and visual perception/construction: WAIS-R Block
Design, WAIS-R Picture Completion, and WMS-R Visual Reproduction I. Individual test
z-scores were calculated using group mean and standard deviations of the raw test scores
from all cognitively intact participants at study entry into the ORCATECH cohort. All
individual participant scores were z-normalized, summed, and averaged to obtain the
composite score.
Pain level was assessed weekly using a question from the weekly health form. The
question asked participants to rate their pain by indicating the number that best
described their pain on average in the last week. Participants answered on an 11-point
Likert scale (0-10) with lower scores indicating less pain. In the model, we also included
gender, age at baseline, and a flag for weekend days (this was included because weekend
behavior is often different from weekday behavior due to work hours, community events,
and the availability of resources; this flag will allow the model to fit these behaviors
separately).
Data analysis
We first computed descriptive statistics for all variables included in the model.
Because the telephone data is left skewed, we calculated the median and interquartile
range (IQR) to describe the data. The interquartile range is a robust measure of standard
deviation that is given by the 75th percentile minus the 25th percentile of the data.
Because the daily number of calls is a count variable, we tested it for over-dispersion to
determine whether the Poisson model, a standard model for count data, is a good fit to
the data. This was tested using a 𝜒2 test, with null hypothesis that α (the dispersion

65
parameter) equals zero. This test indicated the data is over-dispersed (𝜒2 = 7782,
p<0.001), so a negative binomial regression was used to model the data. We modelled
the effect of loneliness on phone use using a mixed effects negative binomial regression,
controlling for age, sex, and cognitive function. A total of 4,519 days of data were
included in the model, representing an average of 174 days of monitoring for each
participant (days of data included in the model differed across participants due to both
data outages due to device failure and differences in the date of installation). In our
secondary analysis (models 2a and 2b), we sought to determine the differential effect of
loneliness on incoming and outgoing phone calls. For this analysis, we ran two mixed
effects negative binomial regressions, after testing for over-dispersion in the output for
these models (𝜒2 = 1337, p<0.001 for model 2a, and 𝜒2 = 936, p<0.001 for model 2b).
The dependent variable in model 2a was the total daily number of incoming calls, while
that for model 2b was the daily number of outgoing calls. All analyses were performed in
Stata (StataCorp, Texas, Version 13). A p-value of 0.05 was considered significant.
RESULTS
Descriptive statistics
Participants received a median of 2 (IQR: 3) phone calls each day, and placed a
median of 2 (IQR: 4) calls each day. The median total calls each day was 5 (IQR: 6), and
the correlation (r) between daily number of incoming and outgoing phone calls was 0.47.
The average loneliness score in this cohort was 35.3 ± 7.62, which is consistent with
previous studies on loneliness in older adults [40]. The average cognitive Z-score score
was 0.276 ±0.55, indicating little to no cognitive impairment in this cohort. The median
level of pain reported each week was 1, with an inter-quartile range (IQR) of 4.

66
Mixed effects negative binomial regression on total daily calls
The results of the mixed effects negative binomial regression are shown in Table
4.2. It should be noted that the effective sample size for all cross-sectional variables
included in this model (age, gender, loneliness and cognitive function) is 26. From the
negative binomial regression, the incidence rate ratio (IRR) represents the proportional
change in number of calls for a unit increase in the independent variable. An IRR that is
greater than 1 means the number of calls increases for each unit increase in that
independent variable, and an IRR of less than 1 indicates the number of calls will
decrease for each unit increase in that independent variable. For example, an IRR of 0.5
would mean that for each unit increase in the independent variable, the daily number of
calls would decrease by a factor of 0.5. Thus, if the independent variable could vary from
0 to 3, the change in daily calls over this range would drop by 0.53 or 0.125.
As can be seen from Table 4.2, loneliness is significantly related to the daily
number of incoming phone calls. Individuals with higher loneliness scores received
fewer calls on average (IRR=0.99, p<0.05; 95% CI 0.99, 1.00) such that the individual
Table 4.2: Results of the mixed effects negative binomial regression on daily number of phone calls
Variable Incidence Rate Ratio
Std. Err. z 95% CI
Loneliness 0.990* 0.005 -1.96 0.980 1.000
Gender (male) 2.026*** 0.225 6.37 1.630 2.518
Age 0.982 0.010 -1.81 0.963 1.001
Cognitive Z-Score 1.512*** 0.098 6.36 1.331 1.717
Weekend 0.647*** 0.017 -17.02 0.616 0.680
Pain Level 1.007 0.011 0.68 0.987 1.028
Date (Normalized) 0.999 0.011 -0.06 0.977 1.022
Constant 5.099 4.322 1.92 0.968 26.854
* p<0.05, ** p<0.01, *** p<0.001

67
with the highest loneliness score of 60 averaged nearly two thirds the number of calls
each day (0.990(60-23) = 0.69) compared to the individual with the lowest loneliness score,
holding all other variables constant. Other factors also significantly affected the total
number of calls each day. Gender was significantly associated with the daily number of
calls, with women receiving twice the number of calls that males received (IRR = 2.03,
p<0.001; 95% CI 1.63, 2.52). This result should be interpreted with caution, however, as
the number of males included in the study was very small (n = 3). Due to the small
number of men, as a post-hoc analysis we re-ran the model with men excluded to ensure
consistency in our estimated coefficients. The results were not significantly different: no
coefficient changed to a value outside the previously estimated 95% confidence intervals
suggesting the small number of males in the model will not bias the coefficients when
accounting for gender. In addition, superior cognitive function was associated with a
higher daily number of calls (IRR = 1.51, p<0.001; 95% CI 1.33, 1.72). People also had
fewer calls on the weekend than the weekday (IRR=0.65, p<0.001; 95% CI 0.612,
0.680). Age and pain level were not significant predictors of the daily number of calls.
Differential effect of loneliness on incoming and outgoing calls
To test whether loneliness was differentially related to incoming and outgoing
phone calls, we ran two additional mixed effect negative binomial regressions, with daily
number of incoming phone calls as the outcome for the first regression, and daily
number of outgoing phone calls as the outcome for the second regression. The
comparative results of this analysis are shown in Table 4.3. Consistent with our
hypothesis, loneliness was negatively related to incoming calls but not outgoing calls.
The loneliest individual received 40% of the number of calls received by the least lonely
(IRR = 0.98, p<0.01; 95% CI 0.96, 0.99). The non-linear relationship between loneliness
and daily number of incoming phone calls is shown in Figure 4.1. This figure shows the
probability density of the daily number of calls as a function of the UCLA Loneliness

68
Score, holding all continuous variables at their means (gender was taken to be female
and the flag for weekend was held at weekday). That is, at each possible value of the
UCLA Loneliness Scale, the probability of receiving a given number of calls (between 0
and 6) is computed and plotted in color, with higher probabilities plotted in red and
lower probabilities plotted in blue. The mean is also plotted in black. As can be seen, the
average daily number of incoming calls decreases from 4.6 when the loneliness score is
23 (the lowest observed score) to 1.9 when the loneliness score is 60 (the highest
observed score). It should be noted that the UCLA Loneliness scale can range from 20 to
80, but no participants scored higher than 60 or lower than 23 in this cohort, so the
values plotted do not exceed this observed range.
In this analysis, age was also found to be significantly related to outgoing calls
(IRR = 0.97, p<0.01; 95% CI 0.956, 0.99) but not incoming calls. Gender was
significantly related to both incoming and outgoing calls, such that women received 60%
more calls than men, and placed 128% more calls than men (although this should be
Table 4.3: Comparative results on the relationship between loneliness and incoming/outgoing phone calls
Number Incoming Calls Number Outgoing Calls
Incidence Rate Ratio
Std. Error
z Incidence Rate Ratio
Std. Error
z
Loneliness 0.950** 0.009 -2.74 1.001 0.005 0.25
Gender (male) 2.281*** 0.440 4.27 1.613*** 0.188 4.09
Age 1.014 0.016 0.87 0.972** 0.010 -2.74
Cognitive Z-Score
1.694*** 0.171 5.22 1.065 0.076 0.88
Weekend 0.686*** 0.018 -14.68 0.625*** 0.023 -13.01
Pain Level 1.023 0.012 1.90 0.992 0.013 -0.58
Time 0.888* 1.198 2.84 1.001 0.005 -1.91
Constant 0.950 0.009 -0.09 1.613* 0.188 2.15
*p<0.05, **p<0.01, ***p<0.001

69
interpreted with caution due to the small number of males in the cohort). In addition,
cognitive status was significantly related to the number of incoming calls (IRR = 1.69,
p<0.01; 95% CI 1.39, 2.06) but not the number of outgoing calls.
DISCUSSION
This paper presents the first results on the relationship between loneliness and
objective measures of social isolation using a landline phone monitoring system. We
found that increased loneliness is associated with decreased daily phone use, such that
the loneliest individual uses the phone nearly two thirds as much as the least lonely. This
result supports the work of prior studies suggesting loneliness is closely tied to the
quality of the social network [170, 171], and suggests that loneliness may also be closely
tied to the level of social isolation. In addition, this suggests that by objectively
Figure 4.1: Probability density of the daily number of incoming calls as a function of (a) the UCLA Loneliness score and (b) the z-normalized Cognitive score, holding all other variables at their means. Color represents density; discrete probabilities were linearly interpolated for graphical clarity. The mean function, μ (black trace), has been overlaid on the density to show central tendency. Number of incoming calls decreases with increasing loneliness and decreasing cognitive abilities.

70
monitoring isolation levels longitudinally in older adults, it may be possible to
understand the differential effect that loneliness and social isolation have on health.
Finally, because loneliness is tied to social isolation, it may be possible to unobtrusively
monitor loneliness levels in addition to isolation levels, using both measures of social
isolation and emotional well-being (for example time out-of-home [81]).
Consistent with our hypothesis, we also found that loneliness was more closely
tied to incoming than outgoing phone calls. This is consistent with previous work on
loneliness which suggests that in the early stages of loneliness, people may attempt to
overcome their loneliness by forming new social connections, even when meeting new
people causes great emotional stress [27, 162]. Attempting to form new connections may
manifest as an increase in the number of outgoing calls while the number of incoming
calls declines. After a time of being lonely, one may adjust expectations for support,
becoming content to have fewer contacts and less support [26]. Thus, while outgoing
calls may increase at the onset of loneliness and then decrease over time, incoming calls
are more likely to universally decrease with the manifestation of loneliness. Of course,
with only one loneliness time point it is difficult to understand how telephone use
changes with changes in loneliness levels within the same individual. Thus, future
studies on the time-course of loneliness and isolation should investigate the differential
relationship between loneliness and incoming and outgoing calls in the earliest phases of
loneliness onset.
Among our covariates, age was also found to be significantly related to the
number of outgoing calls, but not the number of incoming calls. This may be suggestive
of difficulties with using the phone that occur with age, especially with placing calls. For
example, while hearing impairments may make it challenging to use the telephone to
communicate at all (reducing the total number of calls), arthritis and vision impairments

71
may cause difficulties in dialing numbers to place outgoing calls, thus reducing the
number of outgoing calls to a greater degree than incoming calls.
Increased cognitive function was found to be positively associated with telephone
use, which is consistent with work tying the ability to perform instrumental activities of
daily living (iADL) including the ability to use the phone with cognitive ability [172].
Thus, as cognitive function declined, phone use also declined. Increased pain was also
associated with increased phone use, which may represent the increased support given
when people fall, go to the emergency room, or have other adverse events likely to
increase pain levels. We also found that women make more calls than men, people
receive fewer calls on the weekend than on the weekday, and superior cognitive function
was associated with more telephone use.
This study has several limitations. Notably, there were relatively few subjects,
and as a result the number of constant or control variables that could be included in the
model was small despite the large number of data points (the effective sample size for
each cross-sectional variable is 26). Future studies should incorporate data from more
subjects with additional potentially explanatory variables to fully understand the
relationship between phone use and outcomes of interest among older adults. We also
did not explicitly test whether participant characteristics were related to the number of
days of monitoring data as this was determined primarily by how well the phone monitor
worked in each home. Still, the subjects who have more observed days of data will have
the largest influence on the estimated coefficients. Thus, if any participant characteristic
were in fact related to the number of days of observed data, the coefficients may be
biased. This study did not monitor the duration of each phone call or the number dialed
due to shortcomings with the phone monitoring software. Because of the importance of
social network on multiple health outcomes [16], developing techniques to unobtrusively

72
monitor multiple aspects of social network, including number of contacts or longitudinal
changes in the social network (addition of new members or loss of old ones) may be
increasingly important [22]. Further, the average age of this cohort was 86 years, and the
youngest participant was aged 73 years. Despite their older age, everyone in the cohort
lived alone and independently (although they may live in a retirement community). In
addition, all participants used landline phones only, and did not use wireless telephone
devices. The results of this study may not generalize to younger populations, to those
whose physical health is imposing more serious limitations on their lifestyle, or to those
populations where wireless devices have become the norm.
This work shows that in-home monitoring can be used to objectively analyze the
relationship between loneliness and social isolation. Using this approach in longitudinal
models on health, it may be possible to understand the differential effect these variables
have on health. In addition, using a phone monitor in conjunction with in-home
monitoring platforms designed to assess multiple aspects of behavior known to be
associated with loneliness (for example, sleep [11], time out-of-home [81], and computer
use [149]), it may be possible to monitor loneliness levels unobtrusively and
continuously in the home environment. Such models would contribute greatly to the
understanding of loneliness and its effectors, time course, and outcomes. By monitoring
for loneliness in the home environment, it may also be possible to detect lonely
individuals earlier than currently possible, thereby enabling outreach programs to give
lonely persons appropriate help and assistance.
.

73
Chapter 5: SVM to Detect the Presence of Visitors in a Smart Home Environment
SUMMARY
This chapter describes the work performed to unobtrusively detect the presence
of visitors in the home. Because visitors represent an important aspect of socialization,
they may be an important feature for assessment of loneliness using in-home sensors. To
develop a visitor detection technique, we first develop and validate a Support Vector
Machine (SVM) classifier to detect periods where untagged visitors are present in the
home. This approach used the dwell time, number of sensor firings, and number of
transitions between major living spaces (living room, dining room, kitchen, and
bathroom) as features in the model and diary self-report from two subjects as ground
truth. The sensitivity and specificity of the SVM classifier was different between the two
subjects: subject 1 had a sensitivity of 0.90 and specificity of 0.89, whereas subject 2 had
a lower sensitivity and specificity at 0.67 and 0.78, respectively. While the results
demonstrated the feasibility of detecting visitors with the in-home sensor data, they also
highlight the need for improved ground truth and more advanced classification
techniques to detect visitors in the home for all subjects. To that end, we installed
motion-activated video cameras over the doors to the homes of six subjects. These
cameras were designed to record the coming and going of visitors by recording 5 seconds
of video data any time movement was sensed. However, due to the 30 second refractory
period of the camera, the arrival and departure of visitors were not always captured, thus
invalidating the ground truth. Despite the challenges faced in fully validating a visitor
detection algorithm, this work represents key results on behaviors that may change when
visitors are present in the home, and could be used to inform priors in future models of
visitors in the home. Still, we did not carry this project any further in this project. The
next step in developing a visitor detection algorithm would be to install superior video
cameras capable of collecting high quality ground truth. Using this data, it would be
possible to train a general visitor detection algorithm and enable monitoring the
frequency of visitors to the home to include as a feature in a model of loneliness.
However, this work was outside the scope of the thesis; thus visitors to the home will not
be included in the final model of loneliness and behavior.
74
INTRODUCTION
The emerging problem of supporting and caring for an aging population has
received a great deal of attention in recent years. The high cost of institutionalization (i.e.
nursing homes) and the reduced quality of life in such environments has led to a search
for options that allow seniors to maintain their independence. One approach to helping
seniors remain in their homes is ambient sensing environments, in which technologies
placed in the home provide continuous data about the health status of the residents [12,
15, 173]. This “smart home” approach is most effective when it is unobtrusive, i.e., the
seniors are not required to do anything outside of their normal daily activities, and thus
unobtrusive technologies that are integrated into the individual’s home play an
important role in this approach. Unfortunately, identification of activities using such
passive technologies is much more challenging if there are multiple people in the
environment [174], since the IR passive sensors cannot differentiate who is moving
through the space. Thus, being able to identify when multiple people are present is an
important part of interpreting and disambiguating in-home data.
The ability to identify when visitors are in the home is particularly important for
assessing socialization in seniors. Socially isolated individuals generally exhibit higher
blood pressure [175], higher all-cause mortality [18], and are at increased risk of
developing cognitive decline [158]. Since a decrease in visitors to the home often heralds
an increase in the isolation of an individual, detecting visitors to the home can allow for
early detection of changes in socialization levels, enabling earlier intervention and
support.
This work was originally published in 2012 at the IEEE Engineering in Medicine
and Biology Society Annual International Conference, pp. 5850-5853
Reprinted with permission

75
A number of approaches have been proposed to manage the multi-person
identification problem. More complex sensors such as video cameras have the advantage
of allowing identification of different individuals moving through the home, but most
seniors consider the use of video monitoring as a violation of their privacy. Body worn
tags (RFID, UWB, Wi-Fi etc.) can provide good information about the relative location of
multiple individuals in the home [95, 96]. In an elderly population, however, this
approach is impractical especially for long periods of time as they may forget to wear the
sensors or take them off when they become uncomfortable. Alternative approaches not
requiring body-worn tags include algorithmic techniques that attempt to disambiguate
passively acquired sensor data based on statistical properties. For example, we recently
used Gaussian Mixture Models to separate the walking speeds of individuals moving
through a sensor line in two-person homes [176]. While this approach was effective for
its specific purpose (measuring walking speed), it was not more widely applicable to
identifying when visitors were in the home. Crandall and colleagues used graph and rule-
based algorithms as well as Bayesian Updating Graphs to estimate the number of
individuals present [177]. While effective, this technique required a very high density of
sensors, which is not practical for large-scale monitoring. Thus, techniques to identify
visitors to the home in passively monitoring environments are still needed.
The main focus of this paper is to develop a method to detect the presence of
visitors in the home environment using only the data provided by wireless motion
sensors in each room. A support vector machine (SVM) was developed to distinguish
these events, using several key features from the sensor data as the input and subject
diary entries detailing when visitors were present in the home as the ground truth. The
quality of the model is estimated using thousand fold repeated random sub-sampling.

76
METHODS
Data Collection and Pre-processing
The data used in this study came from the homes of ORCATECH Living Lab
subjects. The ORCATECH Living Lab is a group of 31 seniors who have agreed to
participate in ongoing research about the role of technology in maintaining
independence. A core set of technologies is continually maintained in their homes,
including pyro-electric motion sensors (MS16A, x10.com) in each room and contact
sensors (DA10A, x10.com) on the doors to the home. Only the motion sensor data were
used in this study. For a period of 6 weeks, thirteen subjects completed diary entries
twice a day—once at around noon and once around 11:00pm—regarding the specific
times visitors were present in their homes. The diaries were incomplete for six
participants (for example, the participant would report that they had a visitor but not
record the times of the visit), and five participants lived in multi-person homes where
there was little time with only one person in the home. Two participants lived alone and
had complete diary entries; those data were used for this analysis. Incidentally, these
data suggest the difficulty in using self-report as the source of socialization data [85].
Over the course of the six week period, subject 1 recorded 31.75 hours where
visitors were present and subject 2 recorded 89.5 hours where visitors were present.
These self-report data were used as the ground truth in model development. During this
time, sensor data from the motion sensors in these subjects’ homes were also collected.
All data from any days where any sensor in the house was not functioning properly were
excluded. This resulted in the exclusion of two days of data from subject 1 and zero days
of data from subject 2. A total 4.75 hours of visitor data were therefore excluded for
subject 1.
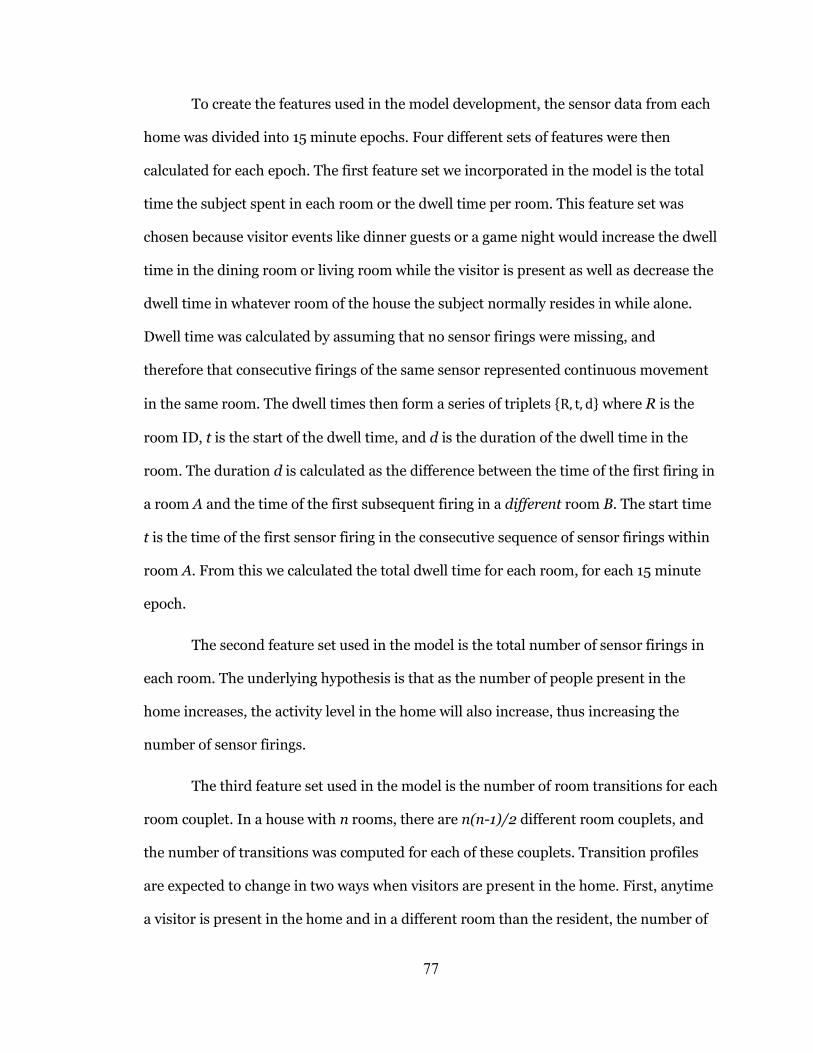
77
To create the features used in the model development, the sensor data from each
home was divided into 15 minute epochs. Four different sets of features were then
calculated for each epoch. The first feature set we incorporated in the model is the total
time the subject spent in each room or the dwell time per room. This feature set was
chosen because visitor events like dinner guests or a game night would increase the dwell
time in the dining room or living room while the visitor is present as well as decrease the
dwell time in whatever room of the house the subject normally resides in while alone.
Dwell time was calculated by assuming that no sensor firings were missing, and
therefore that consecutive firings of the same sensor represented continuous movement
in the same room. The dwell times then form a series of triplets {R, t, d} where R is the
room ID, t is the start of the dwell time, and d is the duration of the dwell time in the
room. The duration d is calculated as the difference between the time of the first firing in
a room A and the time of the first subsequent firing in a different room B. The start time
t is the time of the first sensor firing in the consecutive sequence of sensor firings within
room A. From this we calculated the total dwell time for each room, for each 15 minute
epoch.
The second feature set used in the model is the total number of sensor firings in
each room. The underlying hypothesis is that as the number of people present in the
home increases, the activity level in the home will also increase, thus increasing the
number of sensor firings.
The third feature set used in the model is the number of room transitions for each
room couplet. In a house with n rooms, there are n(n-1)/2 different room couplets, and
the number of transitions was computed for each of these couplets. Transition profiles
are expected to change in two ways when visitors are present in the home. First, anytime
a visitor is present in the home and in a different room than the resident, the number of

78
transitions between those two rooms is likely to increase. On the other hand, anytime the
visitor and resident are in the house in the same room, the number of room transitions is
expected to decrease or remain the same while the number of sensor firings and dwell
time for that room will likely increase.
The fourth feature set corresponds to the time of day. Because human activity
patterns follow a circadian rhythm, there will be differences in normal activity patterns
as a function of the time of day. It is therefore important to include the time of day as a
feature in the model design. The time of day was coded as a dummy variable with ‘1’
assigned to the four epochs starting at midnight, 12:15am, 12:30am, and 12:45am, and
linearly increasing each hour; thus ‘24’ was assigned to the four epochs starting at
11:00pm, 11:15pm, 11:30pm and 11:45pm.
Model Development
SVM was used to classify the data. SVM [178] is a well-established machine
learning technique to classify data which has been used previously in smart home
environments to detect abnormal behavioral patterns [14]. In general, SVM is used to
determine non-linear boundaries for classification. The theory underlying SVM is based
on the notion of mapping the raw data into a high-dimensional space where it can be
categorized by a hyperplane decision boundary. When projected back into the original
data space, the hyperplane is mapped into a nonlinear surface. The mapping can be
performed directly using kernel-based transformation. Because the decision boundary
for distinguishing visitor epochs from non-visitor epochs is likely to be non-linear, as
illustrated in Figure 5.1, we used SVM with a Gaussian Radial Basis Function kernel with
σ = 1 to map the data into a higher dimensional space to perform the classification.
In order to limit the complexity of the model, we reduced the feature set to
include only those features corresponding to rooms that are frequently used when

79
visitors are present. That is, only the sensor features from the kitchen, dining room,
living room, main bathroom and the transitions between these rooms were used in the
final model.
Initially, the SVM model was trained using all epochs during all 24 hours of the
day to train and test the model. However, because the features included in the model
may look considerably different during the night (because the subject is likely sleeping),
this could lead to biased results. We therefore also tested the model using only those
epochs that occur during the daytime hours—that is, 7am to 11pm—to eliminate potential
bias associated with the night hours.
Because there were so many more epochs where visitors were not present (3732
for subject 1 when night hours are excluded) as compared to epochs were visitors were
Figure 5.1: An example of total dwell time in the living room versus the total number of sensor firings in the dining room for subject 1 from 5:00-7:00pm for both the case where a visitor was reported in the home and the case where no visitors were reported during this time. The non-linear decision boundary between these events is also shown.

80
present (108 for subject 1), we trained the model on ¾ of the visitor epochs. When
nighttime epochs were excluded, we trained on 15% more non-visitor epochs than visitor
epochs and 50% more non-visitor epochs than visitor epochs when night hours were
included. We tested on all the remaining data. For all model fits, we used 1000 fold
repeated random sub-sampling to determine the mean out-of-sample performance and
95% confidence intervals. We report on those results below.
RESULTS AND DISCUSSION
Table 5.1 presents the results of the SVM model for classifying epochs where
visitors are and are not present in the home for each subject and both models. As can be
seen, excluding nighttime epochs from the model does not significantly affect the
sensitivity of the analysis. However, the specificity decreases by about 0.07 when
nighttime epochs are excluded for both subjects. This decrease in the specificity when
nighttime epochs are excluded is to be expected as the sequences of sensor firings that
are likely to occur during the night (e.g. bedroom, bathroom) are very different from
those that occur during the day (e.g. kitchen, living room). However, even when the
nighttime epochs are excluded, the model still performs reasonably well with sensitivity
and specificity of 0.89 and 0.80 for subject 1, and 0.67 and 0.69 for subject 2,
respectively.
It is also important to note that the model performs considerably worse in
detecting epochs where visitors are present for subject 2 than for subject 1. The average
sensitivity for subject 1 is 0.90 as compared to 0.67 for subject 2. There are several
possible causes for this difference in sensitivity. First, the ground truth in this model is
limited to the self-report of the subjects. It is well known that self-report, especially in
the aging population, is prone to inaccuracies [85]. Forgetting to report visitors in the

81
home would decrease the specificity of the model, while inaccurately reporting the time
that visitors arrive and leave would decrease the sensitivity. It is therefore possible that
subject 2 did not accurately record the precise times that visitors arrived and left the
home, resulting in a lower sensitivity of the model.
The home layout and placement of sensors in these two homes is also
considerably different. Subject 1 has an open kitchen that feeds into the dining room and
living room. In this layout, it is easy for an individual in the kitchen to interact with
individuals in the living and dining rooms. As a result, the number of transitions
between these three rooms can increase dramatically when visitors are present. Further,
the sensors are well placed so subjects can be detected in any room of the house. Because
there are so few dead zones in the house, changes in behavioral patterns due to the
presence of a visitor can be detected more easily, resulting in a higher sensitivity of the
SVM model in detecting visitors.
In contrast, the sensor layout appears to have problems for subject 2. While there
is a sensor in the dining room, its purpose is not to detect individuals in the dining room,
but rather to detect individuals leaving the home. The field of view of the sensor is
pointed mostly at the front door. As a result, it seems to have high error rate in
accurately detecting the presence of an individual in or passing through the dining room.
This would dramatically affect the performance of this model in detecting visitors as it is
dependent on the transition profiles, number of sensor firings, and dwell times in these
Table 5.1: Sensitivity and specificity of the SVM model for visitor detection for subject 1for all epochs in a 24-hour period, daytime epochs only and 95% confidence intervals (CI) for 1000 random splits of the data into model fitting and classification sets.
Subject 1 Subject 2
Sensitivity Specificity Sensitivity Specificity
Mean 0.902 0.861 0.672 0.782
95% CI (0.778, 1.00) (0.813, 0.893) (0.589, 0.756) (0.752, 0.810)
82
rooms.
These differences in home layouts and in the positioning of the sensors highlight
the importance of sensor placement in a smart home. In configuring a smart home, it is
critically important to place sensors appropriately to accurately detect the movement of
the subject throughout the entire home. Placing a sensor with an occluded or limited
field of view is likely to limit the ability to detect behavioral patterns or changes in
behavioral patterns in the home environment. As Crandall’s study showed [179], a large
number of sensors can greatly improve the recognition of subject movements. However,
it remains an open question how the number and placement of sensors can be optimized
to minimize the intrusion into the senior’s home while still allowing for good recognition
of visitors.
While the current approach for detecting visitors in the home performs well it
still has several limitations. First, the visitors recorded in this study were only daytime
visitors—neither subject reported overnight guests. However, the presence of an
overnight guest in the home would be incredibly important to identify from both a
socialization perspective and to effectively model multiple individuals in the home. The
model therefore needs to be generalized for the case where visitors remain in the home
overnight.
Further, the model only detects the presence or absence of any number of visitors
in the home, but cannot quantify how many visitors are present. Several of the diary
entries report varying numbers of visitors present in the home, and accurately detecting
differences between large groups of visitors and more personal encounters with small
groups is important in assessing socialization practices.
Finally, this model was only tested on two subjects and two home layouts, and
therefore needs to be validated on more subjects. Because the behavioral patterns

83
associated with the presence of visitors in the home will change for different people, the
generalizability of the model must be tested for multiple individuals and multiple home
layouts. This is especially important as the performance of the model varied considerably
between the two subjects tested.
CONCLUSIONS
Because of the multiple health impacts of socialization in the growing aging
population, continually and unobtrusively monitoring the socialization practices of
elderly individuals is increasingly important. Key to this goal is the detection of visitors
present in the home. Using the dwell time, number of firings, number of transitions, and
hour of the day as features in a support vector machine, we were able to distinguish
periods where visitors are present in the home with 90% sensitivity and 86% specificity
for subject 1, while the sensitivity and specificity were lower at 67% and 78% for subject
2, respectively.
In the future, we plan to improve this result by incorporating the door sensors
that detect the opening and closing of the front door into the model. Because visitors
must enter and exit the home through the doorway, modeling changes in the presence or
absence of a visitor in the home around door firings may increase performance of the
model and allow for visitor detection at a greater granularity.

84
Chapter 6: Behavior and Loneliness: How does What We Do Associate with How We
Feel?
SUMMARY
In this section, we incorporate all the in-home behaviors studied thus far in
addition to other behaviors hypothesized to be associated with loneliness into a
longitudinal model on the relationship between loneliness and behavior. While previous
chapters used existing data from the ORCATECH Life Laboratory to assess the
relationship between key behaviors and loneliness, this study used data from 16 new
participants specifically recruited to study the relationship between loneliness and
behavior. Each of these participants received the in-home motion and contact sensors as
well as telephone and computer sensors. In addition, the participants completed the
UCLA Loneliness scale at least 3 times over the 8 month monitoring period. Using this
longitudinal dataset, we were able to use eight behavioral variables, including five ‘social’
variables, as independent variables in a mixed effects linear regression with UCLA
Loneliness Score as the dependent variable. Our analysis shows that loneliness is
significantly associated with both time out-of-home (𝛽 = -0.77, p<0.05) and number of
computer sessions (𝛽 = 0.87, p<0.01), although other behavioral variables (in-home
walking speed, time on computer, number of calls) were also marginally non-significant.
The R2 for the model was 0.43. We also show that the in-home behavioral variables can
predict out-of-sample loneliness scores reasonably well, with a correlation between true
loneliness score and predicted out of sample loneliness score of 0.48. This chapter
presents the first steps toward an unobtrusive, objective model of loneliness among older
adults, and marks the first time multiple objective behavioral measures have been
related to loneliness. These results underscore the possibility of using in-home sensor
platforms to objectively and continuously monitor loneliness levels among older adults.

85
INTRODUCTION
Loneliness is a painful and debilitating experience typically arising due to
a perceived deficit in social relationships [26, 28, 29]. Among older adults in particular,
the experience of loneliness can be especially traumatic, giving rise to numerous negative
health outcomes including increased morbidity and mortality [1], reduced sleep quality
[5], increased daytime dysfunction [6], and increased rates of cognitive decline [4]. For
these reasons, detection and mitigation of loneliness in older adults is critical as the
deleterious effects of loneliness can be reversed with an appropriate intervention [11].
While identifying lonely individuals is critical to mitigating loneliness among
older adults, the detection of loneliness can be challenging. While it may seem easy to
simply ask older adults if they are feeling lonely (using the self-labeling approach to
assessing loneliness [75]), it is possible that people will avoid reporting loneliness even
when they are quite lonely due to the numerous social stigmas associated with being
lonely. For this reason, several scales have been developed to indirectly assess loneliness
levels [9, 84]. While these scales may overcome the negative stigmas associated with
being lonely, they still depend on self-report which is subject to desirability bias[85, 86],
memory problems[65], and under or over estimation[87]. Thus, the development of an
objective and continuous method to assess loneliness in older adults may enable
identification of loneliness as it occurs, thereby assisting in the mitigation of loneliness at
the earliest possible stages. An objective model of loneliness would allow researchers to
develop more precise inferences regarding the impact of loneliness on health while
enhancing our understanding of loneliness in older adults.
Recently, ambient in-home sensors have been used to continuously and
unobtrusively monitor individuals in their own homes [15, 88, 89]. These systems are
frequently designed to help seniors remain independent and healthy as long as possible

86
by capturing meaningful behavioral measures which relate to health outcomes of
interest. There are several aspects of behavior that can be assessed using these in-home
sensing technologies which may also relate to loneliness levels. For example, our
preliminary research shows that both time out-of home [81] and telephone use [180] are
associated with loneliness levels among older adults. Other behaviors that may be related
to loneliness include computer use [149, 181, 182], visitors to the home, sleep quality [5,
11], and measures of daytime dysfunction [6] which include in-home mobility [99] and
in-home walking speed [90, 97]. A diagram of the in-home behaviors hypothesized to be
associated with loneliness is shown in Figure 6.1.
The focus of this paper is to understand the relationship between in-home
behavior and loneliness. Using data from 16 participants monitored in their own homes
Figure 6.1: Diagram of in-home behaviors hypothesized to be related to loneliness. The node corresponding to visitors to the home is shaded differently because it was not included in the model due to the challenges in the algorithm development discussed in Chapter 5 (pg. 73). Still, it was included in the diagram as it is likely associated with loneliness.

87
for up to 7 months, we will first analyze which in-home behaviors are most closely
associated with loneliness. We hypothesize that the variables most closely associated
with social behaviors (those on the left of the graph in Figure 6.1), will be most strongly
associated with loneliness. Next we will analyze how well the measures of in-home
behavior predict out-of-sample loneliness levels, which will provide a first glimpse into
the feasibility of using unobtrusive in-home sensor data to assess loneliness levels in
older adults.
METHODS
Participants
Participants for this study were recruited from low-income apartment
communities and by word of mouth as part of a loneliness intervention study lasting 9
weeks (the intervention will not be discussed further here). The minimum age for
participation in this study was 62 years. Participant inclusion criteria include living alone
and independently and a minimum score of 26 on the Mini-Mental State Examination
[183]. Participants were also required to be ambulatory and in average health for their
age, have internet in their apartments, and know how to use a computer. Eligible
participants who knew how to use a computer but did not already own one were given a
computer to use for the duration of the study. All participants provided written informed
consent before participating in study activities. This protocol was approved by the
Oregon Health & Science University Institutional Review Board (IRB #9631). A total of
16 participants were recruited. The mean age of participants was 71.0 ± 6.3 years; 81%
were female (see Table 6.1). All participants received a core set of technologies in their
home including pyroelectric infrared motion sensors (MS16A, x10.com) in each room
and contact sensors (DA10A, x10.com) on the doors to the home. A line of motion
sensors was also placed in a straight line in a frequently used walkway. These sensors

88
were used to assess relevant behavioral metrics discussed in more detail below.
Participant enrollment began in January of 2014 and ended in May of 2014. The
intervention began on June 30, 2014 and ended August 27, 2014. Participants were
followed from enrollment until the end of the 3 month follow up period, which ended
November 26, 2014.
Data and Measures
Loneliness
Loneliness was assessed at baseline, at the start and end of the intervention, and
at a 3-month post-intervention follow up using the 20-item UCLA Loneliness scale. This
survey asks questions such as “I feel part of a group of friends” where response options
are: (1) Never, (2) Rarely, (3) Sometimes and (4) Often. At baseline, the loneliness survey
was administered in-person: participants were asked to fill out a paper copy of the survey
(not via an interview) thereby reducing desirability bias. After consenting to be in the
study, participants were added to an email list and study information was gathered
through on-line surveys. That is, the survey was emailed to each participant with a
subject-specific link to the survey at regular time intervals spaced between one week and
2 months apart. Participants completed the form online in their own homes. One
participant who did not
know how to use email
completed a paper copy
of the survey in the first
follow up, and
completed the survey
over the phone in the
subsequent two follow
Table 6.1: Baseline demographic characteristics of the population
Characteristic Statistic Range (Min, Max)
Age (years) 71.0 ± 6.3 (62, 80)
Gender (% Female) 81% -
Education (years) 15 ± 1.5 (12, 18)
MMSE 29.3 ± 0.95 (27 ,30)
Socioeconomic Status 45.1 ± 9.75 (33, 62)
Race (% Caucasian) 100% -

89
up periods. To generate a composite loneliness score, the value of positive questions was
first reversed and then scores on all questions were summed to give a loneliness score
ranging from 20 to 80, with 80 being the loneliest.
Time Out-of-Home
Total daily time out-of-home was computed probabilistically using the logistic
regression classifier developed in Chapter 3 [81]. As shown in Chapter 3 (pg. 45), this
technique has high sensitivity (94%) and specificity (98%), and is completely
unobtrusive. Because days where the subject was away from home overnight (e.g. due to
hospital stay or vacation) are not representative of daily behavior, these days were
excluded from the analysis.
Phone Use
Phone use metrics were collected in one of two ways for each participant. Where
available, call records were exported from the phone carrier (e.g. AT&T, Verizon). The
phone carriers record the number dialed, time of call, and call duration (generally
rounded up to the nearest minute). Not all carriers record whether the call was incoming
or outgoing, so this was not included in the model. Whenever the phone carrier logs were
not available (two participants use CenturyLink which does not keep track of phone use),
the phone monitoring device used in Chapter 4 was used to unobtrusively assess daily
phone use. The monitors (Shenzhen Fiho Electronic, Fi3001B) plug directly into the
phone line, and are designed to record all signals on the line including ‘on hook’, ‘off
hook’, ‘ring start’, and ‘dtmf’ (number dialed). Because the phone must ring prior to
being taken off the hook for an incoming call, all calls where the phone rang and was
subsequently removed from the hook within 30 seconds of the final ring signal were
counted as incoming calls. It should be noted that missed calls (calls where the resident
did not answer the phone) would not be treated as incoming calls in this paradigm. For a

90
call to be treated as outgoing, a number must be dialed. Because several of our residents
live in retirement communities, four digit codes can be used to call within the building to
other residents of the retirement community. As a result, a call was treated as outgoing if
an ‘off hook’ signal was followed by at least four numbers dialed and not preceded by a
ring signal. It should be noted that the phone line does not detect whether an outgoing
call was completed (that is, whether the other end picked up the phone or not).
Computer use
Participants also received computer monitoring software designed to assess the
total time spent on the computer, daily number of computer sessions, and the activities
performed while on the computer. The software installed was specific to the operating
system of the individual’s computer. Individuals with Windows-based operating systems
(n = 14) received WorkTime Corporate (Nestersoft Inc., Ontario Canada), while those
with Apple computers (n = 2) received RescueTime Professional (RescueTime, Seattle
WA). Both programs record the total time spent on the computer by analyzing mouse
and keyboard activity. Computer use was logged in sessions, where a given session was
considered continuous until the mouse and keyboard were both inactive for a period of
15 minutes or more. Total number of computer sessions each day was computed by
counting the number of continuous sessions, and total hours on the computer was
computed by adding the total hours spent on the computer in each computer session.
Five participants owned a tablet or other personal computing device.
Unfortunately the software used to track computer activity was not compatible with app-
based devices. Thus, this activity was not recorded.
Walking Speed
Daily in-home walking speed was calculated using a line of four motion sensors
positioned in series on the ceiling. The field of view of the sensors was restricted so they

91
fired only when the participant passed directly underneath them. The distance between
sensors was recorded to allow adequate calculation of velocity as the participant passed
through the line of sensors [97]. While the data from these sensors is highly correlated
with true walking speed, the variability in sensor placement and refractory period means
there is typically a constant offset between true walking speed and calculated walking
speed for each line of sensors. As a result, the raw walking speed is typically not
comparable cross-sectionally because the constant offset will differ by individual. To
account for this, we normalized the measures of walking speed for each individual by the
median and IQR of their walking speed over the entire time period [97]. Then, because
the participant can walk through the line multiple times in a day, the median normalized
walking speed was calculated for each day and used as normalized daily in-home walking
speed in the model. Thus, this variable represents the deviation in daily walking speed
from an individual’s median.
Mobility
In-home mobility was computed by first assuming that the motion sensors only
fire when they detect movement from the participant. Thus, consecutive firings from the
same sensor indicate movement within a room (indicative of activity levels), and
consecutive sensor firings from different sensors indicate the participant is moving
throughout the home. Under this assumption, total daily mobility can be estimated by
summing the total number of consecutive firings from two different sensors each day
[99]. However, this measure of mobility will be influenced by the number of hours spent
inside the home [184]. That is, the more hour spent inside the home each day, the
greater the opportunity for mobility. To get a meaningful measure of in-home mobility,
it is therefore necessary to divide the mobility estimate by the total hours spent inside
the home. This number represents the estimated level of mobility per hour spent inside
92
the home. Because home layout and sensor sensitivity (which vary by participant) may
affect the median number of transitions independent of true in-home mobility levels,
this measure was normalized by each participant’s median in-home mobility estimate
and the IQR, calculated over the entire monitoring period.
Sleep
ORCATECH has previously developed a technique to unobtrusively assess
various aspects of sleep including sleep latency, restlessness, and number of awakenings
[98]. However, this method only works if participants sleep in a bedroom, not the living
room. Unfortunately, many participants in this study regularly slept in the living room.
Thus, the previously validated technique was not employed. Instead, total sleep time was
determined by adding the hours between 10pm and 9am where sensors indicated the
participant remained in either a bedroom or the living room for a period of 2.5 or more
hours without transitioning.
Data Analysis
Using all the data from up to 7 months of monitoring for each participant, we
first computed descriptive statistics and cross-correlations for all the in-home variables
derived from the sensor platform. Next, we ran a longitudinal mixed effects linear
regression to examine the relationship between in-home behavior and loneliness using
the in-home data from the same day the participants completed the UCLA Loneliness
scale. Due to the small sample size, we did not control for any demographic
characteristics to allow inclusion of the maximum number of behavioral variables
without over fitting the model. Instead, we allowed these characteristics to be captured
in the person-specific offset from the mixed effects model. In order to ensure coefficient
estimates were not biased by multicollinearity, the variance inflation factor (VIF), a
standard diagnostic tool for multicollinearity, was calculated for each independent

93
variable included in the model, and univariate models were computed for all input
variables to ensure the direction of the beta-coefficients were consistent between the full
model and the univariate models. The VIF for all variables in the model was below 2.5,
indicating any multicollinearity can safely be ignored [139], and the direction of all the
beta coefficients did not change between the univariate and full regression models. A p-
value of 0.05 was considered significant. In order to determine the effectiveness of the
model at predicting loneliness, we computed both the correlation between in-sample and
out-of-sample predictions of loneliness and true loneliness levels. To determine the
predicted out-of-sample loneliness score, we trained our regression model on data from
all but one participant, and then used the coefficients from that model to predict the
loneliness of the remaining participant. By iteratively doing this for each participant, we
were able to obtain out-of-sample loneliness predictions for all participants, and relate
these predictions to the true loneliness scores.
RESULTS
Descriptive Statistics
The descriptive statistics for the behavioral variables, including the correlation
between the in-home behavioral variables, are presented in Table 6.2. As can be seen, the
average daily time spent outside the home was 3.24 ± 2.84 hours, slightly lower than
previous studies on time outside the home in older adults [81]. The average daily number
of phone calls was 5.3 ± 4.94, while the average daily number of minutes spent on the
phone was 29.97 ± 35.25. As expected, the daily number of phone calls was highly
correlated with the total daily time spent on the phone (r = 0.6). These participants spent
an average of 1.95 ± 2.02 hours on the computer each day, which was logged across an
average of 3.52 ± 3.7 sessions each day. The total daily hours on the computer had a
strong positive correlation with the daily number of computer sessions (r = 0.55) and a

94
negative correlation with the hours spent outside the home that day (r = -0.20). On
average, participants slept for 5.87 ± .831 hours each night. This was divided into an
average of 4.25 ± 3.65 hours asleep in the master bedroom and 1.58 ± 31.91 hours asleep
in the living room or a secondary bedroom (not shown in table). The normalized median
daily walking speed was positively correlated with the hours spent outside the home (r =
0.24).
In-home behavior and Loneliness
The results of the mixed effects regression between loneliness and in-home
behavior are presented in Table 6.3. A total of 55 data points were included in this
model, representing an average of 3.4 data points per participant. As can be seen,
Table 6.2: In-home data statistics and cross-correlations.
Mean (STD)
1 2 3 4 5 6 7 8
1. Time Out of Home (hours)
3.24 (2.84)
1
2. Number of Calls
5.31 (4.94)
0.06 1
3. Time on Phone (minutes)
29.97 (35.26)
-0.02 0.6 1
4. Computer Use (hours)
1.95 (2.02)
-0.20 -0.07 -0.11 1
5. Number of Computer Sessions
3.53 (3.74)
-0.24 -0.13 -0.12 0.50 1
6. Time Asleep (hours)
5.87 (3.81)
0.28 -0.06 -0.01 -0.01 -0.16 1
7. Norm Median Walking Speed
-0.01 (0.29)
0.04 -0.04 -0.04 0.05 -0.01 0.02 1
8. Norm Room Transitions
0.20 (1.02)
0.10 0.08 0.04 -0.04 0.08 -0.07 0.11 1

95
loneliness is negatively associated with the total hours spent outside the home, such that
a unit increase in hours spent outside the home results in a corresponding drop in
loneliness of 0.77 points. This result is consistent with that found in Chapter 3 (pg. 49),
where each increase in hours spent outside the home was found to decrease the
corresponding loneliness by 1.63 points. The slight decrease in the relationship between
time out-of-home and loneliness is likely due to the inclusion of additional variables in
the model, some of which are correlated with time out-of-home. Loneliness was also
found to be significantly related to the total number of computer sessions, such that each
additional computer session results in an increase in loneliness score of 0.87 points.
The other in-home behavioral variables were not significant in predicting
loneliness (p > 0.5), although some were only marginally non-significant as shown in
Figure 6.2. In this figure, variables are sized by the magnitude of the influence the
variable has on loneliness, and colored by the direction of the influence (green = positive
influence, purple = negative influence). In addition, the lines connecting each variable to
Table 6.3: Results of the mixed effects linear regression between the UCLA Loneliness Score and behavior.
Coefficient
Std. Error.
z 95% Confidence
Interval
Time Out of Home (hours) -0.772* 0.340 -2.27 -1.44 -0.11
Number of Calls -0.141 0.152 -0.92 -0.44 0.16
Time on Phone (minutes) 0.000 0.029 0.02 -0.06 0.06
Number of Computer sessions 0.867** 0.331 2.62 0.22 1.52
Time on Computer (hours) -0.882 0.622 -1.42 -2.10 0.34
Time asleep (hours) -0.141 0.244 -0.58 -0.62 0.34
Normalized Median Walking Speed
-2.394 2.210 -1.08 -6.73 1.94
Normalized Room Transitions 0.863 0.862 1.00 -0.83 2.55
Constant 46.199*** 2.855 16.18 40.60 51.79
* p<0.05, ** p<0.01

96
loneliness are colored by the significance level of the variable in the full model (darker =
more significant). As can be seen, time out-of-home and number of computer sessions
are the darkest two variables and also the two with the largest influence on loneliness.
Still, time on computer, walking speed, and number of calls were all marginally non-
significant and had a relatively large effect on loneliness. The variable with the smallest
effect was the total time spent on the phone, possibly due to its high correlation with the
number of phone calls. Time asleep was also found to be highly non-significant and with
Figure 6.2: Diagram showing the relative influence of the behavioral variables on loneliness. Variables are sized by magnitude of influence and colored by the direction of the influence (green = positive, purple = negative). In addition, the connector lines are colored by significance of the variable, with blacker lines indicating higher significance.
Time on Phone
Room Transitions
Time on Computer
Number of Calls
Time Out of Home
Walking Speed
Time Asleep
Loneliness
Computer Sessions

97
only a small effect on loneliness.
The overall R2 for the model was 0.428, suggesting a close relationship between
behavior and loneliness. The normalized root mean squared error of the predicted
loneliness scores (normalized using the standard deviation of the true loneliness scores)
was 0.898, and correlation between the true loneliness and predicted out-of-sample
loneliness (using leave one out cross-validation) was 0.446, as shown in Figure 6.3. In
this figure, it is clear that the model tends to over-estimate the loneliness of individuals
whose true loneliness is low, and under-estimate the loneliness of those whose true
loneliness is high. This may be due in part to the mixed effects model chosen, which
includes an offset for each individual in the model. While this functions well for
associative models where the intent is to understand the relationship between variables
Figure 6.3: Plot of the predicted out-of-sample loneliness against the true loneliness of the 55 data points included in the model from 16 subjects.
98
(the focus of this chapter), it faces challenges in an out-of-sample predictive framework
as the model does not estimate a unique offset for the unseen individual. It should be
noted that while we tested the model’s ability to predict loneliness out-of-sample, the
primary goal of this analysis was to understand the relationship between loneliness and
in-home behavior, a fundamentally different goal than optimizing predictive power
[185]. Larger sample sizes and study designs optimizing predictive power are required to
truly understand how well in-home behavior predicts loneliness.
DISCUSSION
This paper presents the first steps toward an unobtrusive, objective model of
loneliness among older adults, and marks the first time multiple objective behavioral
measures have been related to loneliness. These results underscore the possibility of
using in-home sensor platforms to objectively and continuously monitor loneliness levels
among older adults.
In our longitudinal regression model, daily time out-of-home and the number of
computer sessions were the only two variables that were significantly associated with
loneliness (p < 0.05). This result supports our hypothesis that the social variables would
be most closely associated with loneliness. However, phone use and hours on the
computer were not significantly associated with loneliness. The lack of significance in
these social variables may be in part because of the high correlation between the social
variables. That is, the number of phone calls was highly correlated with the amount of
time spent on the phone (r = 0.6), and the number of computer sessions was highly
correlated with the amount of time spent on the computer (r = 0.5). Including variables
that are highly correlated in a model can result in multicollinearity, which can inflate the
variance of coefficients, causing variables to look non-significant when they actually are

99
significant. While we tested all variables included in the model for non-ignorable
multicollinearity using the VIF, it is possible that these high correlations still resulted in
biases in the variables or their significance. Indeed, removing the total time spent on the
phone from the model altogether increases the significance of the total number of phone
calls (p = 0.181) while the coefficient remains nearly the same (𝛽 = -0.148) indicating the
presence of at least some bias from multicollinearity. One way to overcome biases
associated with multicollinearity is to increase the sample size, highlighting the need to
test these results in a larger, more diverse cohort.
It may also be that telephone use was not significant because a major aspect of
phone use, texting, was not captured in this cohort. Ad-hoc interviews with participants
revealed that many of these older adults prefer texting to calling, and do most of their
communication this way. Future studies on the relationship between loneliness and
behavior should incorporate variables that capture texting in the models. In addition,
this study was not able to accurately capture the number dialed for all participants.
Collecting numbers dialed would enable the incorporation of variables related to the
social network such as the overall size of the network (number of contacts), the loss of a
contact, or the addition of a new contact. Longitudinal analyses on the effect of network
change revealed that losing a network member is associated with depressive symptoms
and changes in network composition (both positive and negative) are associated with
health outcomes [22]. Thus, monitoring network change using telephone data may not
only improve the ability to unobtrusively assess loneliness levels, but also enable the
identification of network changes (e.g. the loss of a network member) which herald
upcoming health consequences.
As with telephone use, total time on the computer may not have been significant
due to our inability to track computer use on tablets and smart phones. Several

100
participants owned tablets, and two indicated their tablet was their primary device for
browsing the internet and playing games. It may also be that monitoring total hours on
the computer is not sufficient as the computer can be used for both social and anti-social
activities. Previous research on internet use and loneliness has indicated that increased
internet use decreases loneliness only if the internet is used to communicate with friends
and family [104]. Other studies have found conflicting results on the benefits of
computer use among older adults, possibly due to differences in activities performed
while on the computer [186-189]. Thus, future studies on computer use and loneliness
should incorporate variables describing activities performed on the computer.
We also did not find that any non-social variables were significantly associated
with loneliness. The non-social variables included total time asleep and two measures of
daytime dysfunction: in-home walking speed and in-home mobility. Previous studies on
loneliness and sleep indicated that loneliness is not associated with total duration of
sleep but instead with the sleep quality [6]. However in this study, we were not able to
include a measure of sleep quality as many of the participants regularly slept in the living
room and our previously validated algorithm does not work if people do not sleep in a
bedroom [98]. Because sleeping in the living room may be associated with poor sleep
quality, future work should validate a method to assess sleep quality even when
participants do not sleep in the bedroom. In-home walking speed and in-home mobility
were also not associated with loneliness. This is consistent with prior work on in-home
walking speed and low mood [93], although it may also be due to high levels of noise in
these two data streams which drive up the standard error of the coefficients. Future
studies using more participants and data points are necessary to thoroughly understand
the relationship between measures of daytime dysfunction and loneliness.

101
This study has several limitations. Notably, the sample size was small and
relatively homogenous: only 16 subjects, all Caucasian and living alone, mostly in a low
income retirement community. Future studies should validate the results found here in a
larger, more diverse cohort. In addition, the study spanned less than one year, with an
average of 3.4 observations per participant. Future studies should also assess the
relationship between loneliness and behavior over a longer time period to better
understand the time course of loneliness, the seasonal effects of loneliness, and the
complex relationship between behavior and loneliness. Finally, all participants included
in this model volunteered to be part of the study, and agreed to have the sensor system
installed in their homes. There may be key differences in characteristics between those
who are or are not willing to participate in research studies, especially those involving in-
home sensors. Some work has been done to identify the differences between these
groups which indicate those who participate are more likely younger and more highly
educated [190]. To overcome some of this bias, this study specifically targeted
individuals living in low-income retirement communities for recruitment. Still, it is
possible that those who refused to participate or were not interested are different in
other key characteristics, although a recent study by Claes et al suggested no key
differences between those who were willing to participate in unobtrusive monitoring
studies from those who were unwilling [191].
While future studies are required to validate these results in a larger, more
diverse cohort, these results show potential for using behavioral measures to objectively
assess loneliness levels among older adults. An objective model of loneliness has the
potential to improve outcomes for older adults as it would provide the opportunity to
enhance our understanding of the relationship between loneliness and health outcomes
through longitudinal, objective monitoring of loneliness. An objective model would also
help in the evaluation of interventions designed to improve loneliness by not only

102
reducing the number of participants necessary to demonstrate statistically significant
improvement in loneliness but also providing insight into behaviors that changed or
improved over the course of the intervention. In the long term, unobtrusive in-home
sensor platforms could be employed in major retirement communities, assisting staff in
the identification of lonely individuals and preventing them from becoming isolated and
ignored. Taken together, this objective model of loneliness has the potential to
dramatically impact social gerontology as a whole.

103
Chapter 7: Future Directions
SUMMARY
This thesis has developed new methods to unobtrusively assess behaviors
associated with loneliness, and provided insight into how loneliness is associated with
behavior. This section first details how this information might be used in future studies
of loneliness, including in-depth analysis of the relationship between loneliness, social
isolation and health and the validation of interventions designed to assess loneliness.
Such applications may dramatically improve outcomes for older adults suffering from
loneliness. This section also details ways the model of loneliness could be improved. For
example, finalizing the development of a visitor detection method and adding frequency
of visitors to the home to the model of loneliness may improve the observed relationship
between behavior and loneliness and lead to more robust, unobtrusive models of
loneliness. In addition, various aspects of both the computer data and telephone data
were not included in the pilot study on behavior and loneliness discussed in Chapter 6
(pg. 84). These additional variables are discussed in this section, along with preliminary
data demonstrating their relationship to loneliness.

104
OVERVIEW
Because of the importance of loneliness and the challenges associated with self-
report of loneliness among older adults, this thesis has been devoted to the development
of an objective method to assess loneliness in older adults. After analyzing the
longitudinal relationship between loneliness and isolation, we developed new techniques
to monitor behaviors hypothesized to be associated with loneliness using in-home
sensing technologies. We then used behavioral data extracted from the in-home sensor
platform using these developed techniques (among others) in a longitudinal model
designed to assess the relationship between daily behavior and loneliness, and
determined the feasibility of using an objective technique to assess loneliness. The
results presented herein demonstrate the feasibility of using in-home monitoring to
continuously assess loneliness among older adults. This approach to loneliness
assessment opens the door to numerous possibilities for future research.
MODEL APPLICATIONS
Social Isolation, Loneliness and Health
As discussed in Chapter 2, multiple studies have demonstrated that both
loneliness and social isolation have serious impacts on health. For example, individuals
experiencing loneliness have been found to exhibit increased morbidity and mortality
[1], reduced sleep quality [5], increased daytime dysfunction [6], and increased rates of
cognitive decline [4]. Likewise socially isolated individuals tend to have increased
morbidity and mortality with the increase in mortality similar to that of smoking [19],
poor sleep quality [73] and increased risk of cognitive decline [120]. But while both
loneliness and social isolation are associated with significant negative health outcomes, it
is difficult to isolate the contribution each state has on health in part because assessment

105
of both loneliness and social isolation has relied on subjective self-report. Thus, an
objective model of loneliness would enable longitudinal, objective studies on the inter-
relationship between loneliness and social isolation, allowing researchers to determine
which problem (loneliness or isolation) is contributing the negative health outcomes. In
addition, because the model of loneliness is completely unobtrusive, long term studies
ranging from years to decades could be employed to better understand the causal
relationship between loneliness and health. In this manner, an objective model of
loneliness has the potential to improve outcomes for older adults by providing the
opportunity to enhance our understanding of the relationship between loneliness and
health outcomes.
Testing the Effectiveness of Interventions
An unobtrusive model of loneliness would also help in the evaluation of
interventions designed to improve loneliness. Because the model of loneliness would be
able to estimate daily loneliness levels, fewer participants would be required to
demonstrate statistically significant improvement in loneliness. In addition, the model
would provide insight into behaviors that changed or improved over the course of the
intervention. Leaving the system in place after completion of the intervention would
allow analysis of the long term effects of the intervention. Understanding the long term
effects of loneliness interventions would help researchers develop interventions with
lasting effects rather than transient effects that decay upon completion of the
intervention program.
Identification of Lonely Individuals
In the long term, unobtrusive in-home sensor platforms could be employed in
major retirement communities or nursing homes, where they could assist staff in the
identification of lonely individuals. By helping the staff identify when an individual is

106
becoming lonely, it would be possible to intervene and prevent individuals from
becoming isolated and ignored. This would be especially important among larger
communities where lonely individuals may be prone to withdraw from others altogether,
causing them to go unnoticed by the people attempting to reach out to them. Indeed,
some retirement communities and companies are already taking advantage of the
benefits of unobtrusive sensing technologies. For example, Elite Care, a retirement
community in the greater Portland, OR area specifically designed for adults suffering
from Alzheimer’s disease and other dementias, employs numerous sensors designed to
maximize the wellbeing of both the older adults and their family.
FUTURE WORK
While the results presented here are promising, there are several ways the
longitudinal model of loneliness could be improved using in-home data. First, our
behavioral model of loneliness did not include any demographic data due to the small
sample size. However, previous research on loneliness has provided insight into
demographic variables that are associated with loneliness in older adults. Demographic
variables influencing loneliness include gender [123], income [23], marital status
(widows are particularly vulnerable to loneliness) [37, 128, 141], and number of children
[192]. Other studies have indicated that childhood experiences may play a large role in
the perception of loneliness in adulthood [193, 194]. Personality may also affect the
perception of loneliness: individuals who are highly neurotic are more likely to
experience loneliness [195] as are those with high levels anxiety [24]. In addition, pet
ownership is likely to influence loneliness. For example, pets have been used in multiple
interventions designed to ameliorate loneliness as they provide a level of companionship
that may be otherwise lacking [196-198]. In the cohort of 16 individuals from Chapter 6,
pet ownership was weakly associated with higher loneliness levels (𝛽 = 0.77, p=0.11)

107
when included in the model with the behavioral variables. This result may indicate that
those who are lonely are attempting to improve their loneliness through pet ownership.
While we did not account for these traits in the full model presented in Chapter 6 due to
the small sample size and homogeneity of the cohort, adding them to a larger model of
loneliness would likely improve the model’s ability to predict loneliness from behavior.
Thus, future studies on loneliness and behavior should account for these demographic
variables thought to be associated with loneliness.
Visitors to the Home
While we developed a technique to assess visitors to the home, this technique was
never thoroughly validated due to issues with the collection of ground truth data.
However, visitors to the home represent an important aspect of socialization, especially
among those who are home bound. Future work should validate the visitor detection
approach developed here using objective ground truth data that does not rely on the self-
report of the individual. In addition, more robust visitor detection methods could be
developed which employ techniques such as Hidden Semi-Markov Models (HSMM)
which model dwell times or Non-Stationary Hidden Semi-Markov Models (NSHSMM)
which capture variation in transition probabilities over time[199]. In this way, it would
be possible to validate a visitor detection algorithm that works across individual
differences in behavior and differences in home layout.
Telephone Use
The model of in-home behavior and loneliness included only basic measures of
phone use such as total time spent on the phone and total number of calls. However, if
the number dialed can be accurately captured, phone use data could easily be used to
generate social network models, such as that shown in Figure 7.1. While some
association between social network size and loneliness may be evident from this graph,
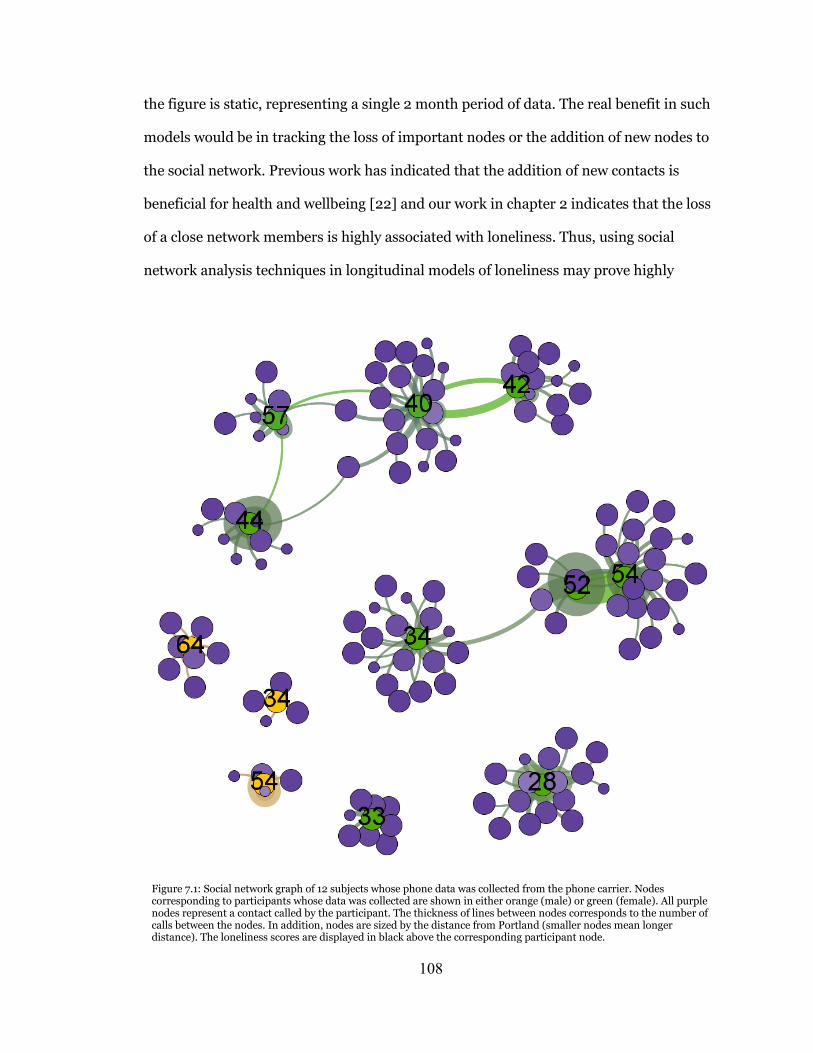
108
the figure is static, representing a single 2 month period of data. The real benefit in such
models would be in tracking the loss of important nodes or the addition of new nodes to
the social network. Previous work has indicated that the addition of new contacts is
beneficial for health and wellbeing [22] and our work in chapter 2 indicates that the loss
of a close network members is highly associated with loneliness. Thus, using social
network analysis techniques in longitudinal models of loneliness may prove highly
Figure 7.1: Social network graph of 12 subjects whose phone data was collected from the phone carrier. Nodes corresponding to participants whose data was collected are shown in either orange (male) or green (female). All purple nodes represent a contact called by the participant. The thickness of lines between nodes corresponds to the number of calls between the nodes. In addition, nodes are sized by the distance from Portland (smaller nodes mean longer distance). The loneliness scores are displayed in black above the corresponding participant node.

109
beneficial. With the recent rise in social network analysis, new techniques are being
developed to assess longitudinal characteristics of social networks, including
determining when a network member should be counted as ‘lost’ or when a new member
should be counted as added [200]. Using these techniques, future models of behavior
and loneliness may be even more sensitive to changes in loneliness levels over time.
Computer Use
Our model of loneliness also used basic measures of computer use: total time on
the computer and number of sessions. However, total time may not relate directly to
loneliness as individuals can do
both social and anti-social
computer activities. Because
RescueTime did not allow
separation of specific activities
performed on the computer, we
were unable to include more
sensitive aspects of computer
behavior in our loneliness
model. Still, we were able to
separate the type of activity
performed while on the
computer for the 13 participants
who received WorkTime on their
computers and relate these data
to loneliness as shown in Figure
7.2. We separated computer
Figure 7.2: Relationship between loneliness and (a) total computer use, (b) percent of total computer use spent socially, and (c) percent of total computer use spent non-socially. Loneliness is positively related to overall computer use and non-social computer use, but negatively related to social computer use.

110
behavior into ‘social’ and ‘non-social’ activities, where social activities included time
spent in email and social networking sites, and non-social activities included games. As
can be seen, spending an increased percent of total computer time in non-social activities
increases loneliness, while spending more time in social activities decreases loneliness.
These results are consistent with previous research on the relationship between
computer use and loneliness[104], and suggest that future studies should account for the
type of activity performed while on the computer instead of just the total computer use.
CONCLUSION
In conclusion, this thesis has presented new techniques to assess behaviors
associated with loneliness, and used these techniques to develop an objective method to
assess loneliness from these behaviors. This work has dramatic implications for the field
of social gerontology: deepening our understanding of loneliness, improving
interventions, and advancing our understanding of the relationship between loneliness
and health. We hope this work contributes to a reduction in the number of people
suffering from the “terrible poverty of loneliness”.

111
REFERENCES
[1] Y. Luo, L. C. Hawkley, L. J. Waite, and J. T. Cacioppo, "Loneliness, health, and mortality in old age: a national longitudinal study," Soc Sci Med, vol. 74, pp. 907-14, Mar 2012.
[2] C. M. Perissinotto, I. Stijacic Cenzer, and K. E. Covinsky, "Loneliness in older persons: a predictor of functional decline and death," Arch Intern Med, vol. 172, pp. 1078-83, Jul 23 2012.
[3] R. S. Tilvis, V. Laitala, P. E. Routasalo, and K. H. Pitkala, "Suffering from loneliness indicates significant mortality risk of older people," J Aging Res, vol. 2011, pp. 1-5, 2011.
[4] R. S. Wilson, K. R. Krueger, S. E. Arnold, J. A. Schneider, J. F. Kelly, L. L. Barnes, et al., "Loneliness and risk of Alzheimer disease," Arch Gen Psychiatry, vol. 64, pp. 234-40, Feb 2007.
[5] J. T. Cacioppo, L. C. Hawkley, G. G. Berntson, J. M. Ernst, A. C. Gibbs, R. Stickgold, et al., "Do lonely days invade the nights? Potential social modulation of sleep efficiency," Psychol Sci, vol. 13, pp. 384-7, Jul 2002.
[6] L. C. Hawkley, K. J. Preacher, and J. T. Cacioppo, "Loneliness impairs daytime functioning but not sleep duration," Health Psychol, vol. 29, pp. 124-9, Mar 2010.
[7] A. S. Buchman, P. A. Boyle, R. S. Wilson, B. D. James, S. E. Leurgans, S. E. Arnold, et al., "Loneliness and the rate of motor decline in old age: the Rush Memory and Aging Project, a community-based cohort study," BMC Geriatr, vol. 10, pp. 77-84, 2010.
[8] K. A. Faulkner, J. A. Cauley, J. M. Zmuda, J. M. Griffin, and M. C. Nevitt, "Is social integration associated with the risk of falling in older community-dwelling women?," J Gerontol A Biol Sci Med Sci, vol. 58, pp. M954-9, Oct 2003.
[9] D. Russell, L. A. Peplau, and C. E. Cutrona, "The revised UCLA Loneliness Scale: concurrent and discriminant validity evidence," J Pers Soc Psychol, vol. 39, pp. 472-80, Sep 1980.

112
[10] J. De Jong Gierveld and T. Van Tilburg, "The De Jong Gierveld short scales for emotional and social loneliness: tested on data from 7 countries in the UN generations and gender surveys," Eur J Ageing, vol. 7, pp. 121-130, Jun 2010.
[11] L. C. Hawkley and J. T. Cacioppo, "Loneliness matters: a theoretical and empirical review of consequences and mechanisms," Ann Behav Med, vol. 40, pp. 218-27, Oct 2010.
[12] J. A. Kaye, S. A. Maxwell, N. Mattek, T. L. Hayes, H. Dodge, M. Pavel, et al., "Intelligent Systems For Assessing Aging Changes: home-based, unobtrusive, and continuous assessment of aging," J Gerontol B Psychol Sci Soc Sci, vol. 66 Suppl 1, pp. i180-90, Jul 2010.
[13] A. Fleury, N. Noury, and M. Vacher, "Supervised classification of activities of daily living in health smart homes using SVM," in Engineering in Medicine and Biology Society, 2009. EMBC 2009. Annual International Conference of the IEEE, 2009, pp. 6099-6102.
[14] J. Shin, B. Lee, and K. Suk Park, "Detection of Abnormal Living Patterns for Elderly Living Alone Using Support Vector Data Description," Information Technology in Biomedicine, IEEE Transactions on, vol. 15, pp. 438-448, 2011.
[15] M. Skubic, G. Alexander, M. Popescu, M. Rantz, and J. Keller, "A smart home application to eldercare: current status and lessons learned," Technol Health Care, vol. 17, pp. 183-201, 2009.
[16] A. J. Gow, J. Corley, J. M. Starr, and I. J. Deary, "Which social network or support factors are associated with cognitive abilities in old age?," Gerontology, vol. 59, pp. 454-63, 2013.
[17] L. Fratiglioni, S. Paillard-Borg, and B. Winblad, "An active and socially integrated lifestyle in late life might protect against dementia," Lancet Neurol, vol. 3, pp. 343-53, Jun 2004.
[18] J. S. House, K. R. Landis, and D. Umberson, "Social relationships and health," Science, vol. 241, pp. 540-5, Jul 29 1988.

113
[19] J. Holt-Lunstad, T. B. Smith, and J. B. Layton, "Social relationships and mortality risk: a meta-analytic review," PLoS Med, vol. 7, p. e1000316, Jul 2010.
[20] J. T. Cacioppo and W. Patrick, Loneliness: Human nature and the need for social connection: WW Norton & Company, 2008.
[21] R. F. Baumeister and M. R. Leary, "The need to belong: desire for interpersonal attachments as a fundamental human motivation," Psychological bulletin, vol. 117, p. 497, 1995.
[22] B. Cornwell and E. O. Laumann, "The health benefits of network growth: New evidence from a national survey of older adults," Soc Sci Med, Oct 2 2013.
[23] N. Savikko, P. Routasalo, R. S. Tilvis, T. E. Strandberg, and K. H. Pitkala, "Predictors and subjective causes of loneliness in an aged population," Arch Gerontol Geriatr, vol. 41, pp. 223-33, Nov-Dec 2005.
[24] B. S. Fees, P. Martin, and L. W. Poon, "A model of loneliness in older adults," J Gerontol B Psychol Sci Soc Sci, vol. 54, pp. P231-9, Jul 1999.
[25] S. Pettigrew and M. Roberts, "Addressing loneliness in later life," Aging Ment Health, vol. 12, pp. 302-9, May 2008.
[26] L. A. Peplau and D. Perlman, "Perspectives on Loneliness," Loneliness : a sourcebook of current theory, research, and therapy, pp. 1-18, 1982.
[27] R. S. Weiss, "Loneliness: The experience of emotional and social isolation," 1973.
[28] V. Sermat, "Sources of loneliness," Essence: Issues in the Study of Ageing, Dying, and Death, 1978.
[29] L. A. Peplau, "Loneliness research: Basic concepts and findings," in Social support: Theory, research and applications, ed: Springer, 1985, pp. 269-286.
114
[30] V. Burholt and T. Scharf, "Poor health and loneliness in later life: the role of depressive symptoms, social resources, and rural environments," J Gerontol B Psychol Sci Soc Sci, vol. 69, pp. 311-24, Mar 2014.
[31] P. Tillich, "The Courage toBe," ed: New Haven: Yale University Press, 1952.
[32] J. M. Burger, "Individual differences in preference for solitude," Journal of Research in Personality, vol. 29, pp. 85-108, 1995.
[33] M. R. Leary, K. C. Herbst, and F. McCrary, "Finding pleasure in solitary activities: desire for aloneness or disinterest in social contact?," Personality and Individual Differences, vol. 35, pp. 59-68, 7// 2003.
[34] L. F. Berkman, T. Glass, I. Brissette, and T. E. Seeman, "From social integration to health: Durkheim in the new millennium," Soc Sci Med, vol. 51, pp. 843-57, Sep 2000.
[35] I. G. Sarason, H. M. Levine, R. B. Basham, and B. R. Sarason, "Assessing social support: the social support questionnaire," Journal of personality and social psychology, vol. 44, p. 127, 1983.
[36] E. Y. Cornwell and L. J. Waite, "Measuring social isolation among older adults using multiple indicators from the NSHAP study," J Gerontol B Psychol Sci Soc Sci, vol. 64 Suppl 1, pp. i38-46, Nov 2009.
[37] G. C. Wenger, R. Davies, S. Shahtahmasebi, and A. Scott, "Social isolation and loneliness in old age: Review and model refinement," Ageing and Society, vol. 16, pp. 333-358, 1996.
[38] B. J. Hirsch, "Psychological dimensions of social networks: A multimethod analysis," American Journal of Community Psychology, vol. 7, pp. 263-277, 1979.
[39] G. Hawthorne, "Measuring social isolation in older adults: development and initial validation of the Friendship Scale," Social Indicators Research, vol. 77, pp. 521-548, 2006.

115
[40] D. W. Russell, "UCLA Loneliness Scale (Version 3): reliability, validity, and factor structure," J Pers Assess, vol. 66, pp. 20-40, Feb 1996.
[41] J. Stessman, Y. Rottenberg, I. Shimshilashvili, E. Ein-Mor, and J. M. Jacobs, "Loneliness, health, and longevity," J Gerontol A Biol Sci Med Sci, vol. 69, pp. 744-50, Jun 2014.
[42] S. Cohen, B. H. Gottlieb, and L. G. Underwood, "Social relationships and health," Social support measurement and intervention: A guide for health and social scientists, pp. 1-25, 2000.
[43] N. A. Christakis and J. H. Fowler, "The Collective Dynamics of Smoking in a Large Social Network," New England Journal of Medicine, vol. 358, pp. 2249-2258, 2008.
[44] J. H. Fowler and N. A. Christakis, "Dynamic spread of happiness in a large social network: longitudinal analysis over 20 years in the Framingham Heart Study," Bmj, vol. 337, 2008.
[45] N. A. Christakis and J. H. Fowler, "The Spread of Obesity in a Large Social Network over 32 Years," New England Journal of Medicine, vol. 357, pp. 370-379, 2007.
[46] J. T. Cacioppo, J. H. Fowler, and N. A. Christakis, "Alone in the crowd: the structure and spread of loneliness in a large social network," Journal of personality and social psychology, vol. 97, p. 977, 2009.
[47] D. Mellor, M. Stokes, L. Firth, Y. Hayashi, and R. Cummins, "Need for belonging, relationship satisfaction, loneliness, and life satisfaction," Personality and Individual Differences, vol. 45, pp. 213-218, 2008.
[48] M. E. Tinetti and C. S. Williams, "Falls, injuries due to falls, and the risk of admission to a nursing home," New England journal of medicine, vol. 337, pp. 1279-1284, 1997.
[49] G. J. Molloy, H. M. McGee, D. O'Neill, and R. M. Conroy, "Loneliness and emergency and planned hospitalizations in a community sample of older adults," J Am Geriatr Soc, vol. 58, pp. 1538-41, Aug 2010.

116
[50] K. Allen, J. Blascovich, and W. B. Mendes, "Cardiovascular reactivity and the presence of pets, friends, and spouses: the truth about cats and dogs," Psychosom Med, vol. 64, pp. 727-39, Sep-Oct 2002.
[51] L. C. Hawkley, R. A. Thisted, C. M. Masi, and J. T. Cacioppo, "Loneliness predicts increased blood pressure: 5-year cross-lagged analyses in middle-aged and older adults," Psychol Aging, vol. 25, pp. 132-41, Mar 2010.
[52] S. D. Pressman, S. Cohen, G. E. Miller, A. Barkin, B. S. Rabin, and J. J. Treanor, "Loneliness, social network size, and immune response to influenza vaccination in college freshmen," Health Psychology, vol. 24, p. 297, 2005.
[53] H. Amieva, R. Stoykova, F. Matharan, C. Helmer, T. C. Antonucci, and J.-F. Dartigues, "What aspects of social network are protective for dementia? Not the quantity but the quality of social interactions is protective up to 15 years later," Psychosomatic medicine, vol. 72, pp. 905-911, 2010.
[54] L. C. Hawkley, M. H. Burleson, G. G. Berntson, and J. T. Cacioppo, "Loneliness in everyday life: cardiovascular activity, psychosocial context, and health behaviors," Journal of personality and social psychology, vol. 85, p. 105, 2003.
[55] S. Cohen, "Social relationships and health," American psychologist, vol. 59, p. 676, 2004.
[56] L. C. Hawkley and J. T. Cacioppo, "Aging and Loneliness Downhill Quickly?," Current Directions in Psychological Science, vol. 16, pp. 187-191, 2007.
[57] A. M. Miller and M. Iris, "Health promotion attitudes and strategies in older adults," Health Educ Behav, vol. 29, pp. 249-67, Apr 2002.
[58] C. E. Coyle and E. Dugan, "Social isolation, loneliness and health among older adults," J Aging Health, vol. 24, pp. 1346-63, Dec 2012.
[59] A. La Rue, "Healthy brain aging: role of cognitive reserve, cognitive stimulation, and cognitive exercises," Clin Geriatr Med, vol. 26, pp. 99-111, Feb 2010.
117
[60] R. S. Tilvis, M. H. Kähönen-Väre, J. Jolkkonen, J. Valvanne, K. H. Pitkala, and T. E. Strandberg, "Predictors of cognitive decline and mortality of aged people over a 10-year period," The Journals of Gerontology Series A: Biological Sciences and Medical Sciences, vol. 59, pp. M268-M274, 2004.
[61] A. J. Gow, A. Pattie, M. C. Whiteman, L. Whalley, and I. Deary, "Social Support and Successful Aging: Investigating the Relationships Between Lifetime Cognitive Change and Life Satisfaction," Journal of Individual Differences, vol. 28, pp. 203-115, 2007.
[62] N. Scarmeas and Y. Stern, "Cognitive reserve and lifestyle," J Clin Exp Neuropsychol, vol. 25, pp. 625-33, Aug 2003.
[63] Y. Stern, "What is cognitive reserve? Theory and research application of the reserve concept," Journal of the International Neuropsychological Society, vol. 8, pp. 448-460, 2002.
[64] N. Scarmeas and Y. Stern, "Cognitive reserve and lifestyle.," J Clin Exp Neuropsychol, vol. 25, pp. 625-33, Aug 2003.
[65] A. A. Bielak, "How can we not 'lose it' if we still don't understand how to 'use it'? Unanswered questions about the influence of activity participation on cognitive performance in older age--a mini-review," Gerontology, vol. 56, pp. 507-19, 2009.
[66] G. Hasler, D. J. Buysse, R. Klaghofer, A. Gamma, V. Ajdacic, D. Eich, et al., "The association between short sleep duration and obesity in young adults: a 13-year prospective study," Sleep, vol. 27, pp. 661-666, 2004.
[67] F. P. Cappuccio, F. M. Taggart, N.-B. Kandala, and A. Currie, "Meta-analysis of short sleep duration and obesity in children and adults," Sleep, vol. 31, p. 619, 2008.
[68] J. E. Gangwisch, S. B. Heymsfield, B. Boden-Albala, R. M. Buijs, F. Kreier, T. G. Pickering, et al., "Short sleep duration as a risk factor for hypertension analyses of the first national health and nutrition examination survey," Hypertension, vol. 47, pp. 833-839, 2006.

118
[69] T. L. Hayes, T. Riley, N. Mattek, M. Pavel, and J. A. Kaye, "Sleep Habits in Mild Cognitive Impairment," Alzheimer Disease & Associated Disorders, vol. 28, pp. 145-150, 2014.
[70] M. Kryger, A. Monjan, D. Bliwise, and S. Ancoli-Israel, "Sleep, health, and aging. Bridging the gap between science and clinical practice," Geriatrics, vol. 59, pp. 24-6, 29-30, Jan 2004.
[71] A. Steptoe, N. Owen, S. R. Kunz-Ebrecht, and L. Brydon, "Loneliness and neuroendocrine, cardiovascular, and inflammatory stress responses in middle-aged men and women," Psychoneuroendocrinology, vol. 29, pp. 593-611, 2004.
[72] E. K. Adam, L. C. Hawkley, B. M. Kudielka, and J. T. Cacioppo, "Day-to-day dynamics of experience–cortisol associations in a population-based sample of older adults," Proceedings of the National Academy of Sciences, vol. 103, pp. 17058-17063, 2006.
[73] E. M. Friedman, M. S. Hayney, G. D. Love, H. L. Urry, M. A. Rosenkranz, R. J. Davidson, et al., "Social relationships, sleep quality, and interleukin-6 in aging women," Proceedings of the National Academy of Sciences of the United States of America, vol. 102, pp. 18757-18762, 2005.
[74] J. T. Cacioppo, L. C. Hawkley, and R. A. Thisted, "Perceived social isolation makes me sad: 5-year cross-lagged analyses of loneliness and depressive symptomatology in the Chicago Health, Aging, and Social Relations Study," Psychol Aging, vol. 25, pp. 453-63, Jun 2010.
[75] S. Shiovitz-Ezra and L. Ayalon, "Use of direct versus indirect approaches to measure loneliness in later life," Research on Aging, p. 0164027511423258, 2011.
[76] C. Victor, L. Grenade, and D. Boldy, "Measuring loneliness in later life: A comparison of differing measures," Reviews in Clinical Gerontology, vol. 15, pp. 63-70, 2005.
[77] C. Marangoni and W. Ickes, "Loneliness: A theoretical review with implications for measurement," Journal of Social and Personal Relationships, vol. 6, pp. 93-128, 1989.

119
[78] D. Russell, "The measurement of loneliness," Loneliness: A sourcebook of current theory, research and therapy, pp. 81-104, 1982.
[79] L. Liu, Z. Gou, and J. Zuo, "Social support mediates loneliness and depression in elderly people," Journal of health psychology, p. 1359105314536941, 2014.
[80] R. Aylaz, U. Akturk, B. Erci, H. Ozturk, and H. Aslan, "Relationship between depression and loneliness in elderly and examination of influential factors," Arch Gerontol Geriatr, vol. 55, pp. 548-54, Nov-Dec 2012.
[81] J. Petersen, D. Austin, J. Kaye, M. Pavel, and T. Hayes, "Unobtrusive in-home detection of time spent out-of-home with applications to loneliness and physical activity," IEEE Journal of Biomedical and Health Informatics, vol. 18, pp. 1590-1596, 2014.
[82] G. D. Cohen, S. Perlstein, J. Chapline, J. Kelly, K. M. Firth, and S. Simmens, "The impact of professionally conducted cultural programs on the physical health, mental health, and social functioning of older adults," Gerontologist, vol. 46, pp. 726-34, Dec 2006.
[83] R. L. Evans, W. Werkhoven, and H. R. Fox, "Treatment of social isolation and loneliness in a sample of visually impaired elderly persons," Psychological reports, vol. 51, pp. 103-108, 1982.
[84] J. de Jong-Gierveld and F. Kamphuls, "The development of a Rasch-type loneliness scale," Applied Psychological Measurement, vol. 9, pp. 289-299, 1985.
[85] T. A. Salthouse, "Mental Exercise and Mental Aging," Perspectives on Psychological Science, vol. 1, pp. 68-87, March 1, 2006 2006.
[86] A. R. Herzog, M. M. Franks, H. R. Markus, and D. Holmberg, "Activities and well-being in older age: effects of self-concept and educational attainment," Psychol Aging, vol. 13, pp. 179-85, Jun 1998.
[87] J. Liang, "Self-reported physical health among aged adults," J Gerontol, vol. 41, pp. 248-60, Mar 1986.

120
[88] T. L. Hayes, M. Pavel, and J. Kaye, "An Approach for Deriving Continuous Health Assessment Indicators From In-home Sensor Data " in Technology and Aging. vol. 21, A. Mihailidis, J. Boger, H. Kautz, and L. Normie, Eds., ed: IOS Press, 2008, pp. 130-137.
[89] G. Demiris and B. K. Hensel, "Technologies for an aging society: a systematic review of "smart home" applications," Yearb Med Inform, vol. 47, pp. 33-40, 2008.
[90] H. H. Dodge, N. C. Mattek, D. Austin, T. L. Hayes, and J. A. Kaye, "In-home walking speeds and variability trajectories associated with mild cognitive impairment," Neurology, vol. 78, pp. 1946-52, Jun 12 2012.
[91] J. Kaye, N. Mattek, H. H. Dodge, I. Campbell, T. Hayes, D. Austin, et al., "Unobtrusive measurement of daily computer use to detect mild cognitive impairment," Alzheimer's & Dementia, vol. 10, pp. 10-17, 2014.
[92] S. Hagler, H. Jimison, and M. Pavel, "Assessing Executive Function Using a Computer Game: Computational Modeling of Cognitive Processes," 2014.
[93] S. M. Thielke, N. C. Mattek, T. L. Hayes, H. H. Dodge, A. R. Quinones, D. Austin, et al., "Associations between observed in-home behaviors and self-reported low mood in community-dwelling older adults," J Am Geriatr Soc, vol. 62, pp. 685-9, Apr 2014.
[94] K. Heath and L. Guibas, "Multi-person tracking from sparse 3D trajectories in a camera sensor network," in Distributed Smart Cameras, 2008. ICDSC 2008. Second ACM/IEEE International Conference on, 2008, pp. 1-9.
[95] T. L. Hayes, M. Pavel, N. Larimer, I. A. Tsay, J. Nutt, and A. G. Adami, "Distributed healthcare: Simultaneous assessment of multiple individuals," IEEE Pervasive Computing, vol. 6, pp. 36-43, 2007.
[96] R. S. Joshua, P. F. Kenneth, J. Bing, M. Alexander, P. Matthai, D. R. Adam, et al., "RFID-based techniques for human-activity detection," Commun. ACM, vol. 48, pp. 39-44, 2005.

121
[97] S. Hagler, D. Austin, T. Hayes, J. Kaye, and M. Pavel, "Unobtrusive and Ubiquitous In-Home Monitoring: A Methodology for Continuous Assessment of Gait Velocity in Elders," IEEE Trans Biomed Eng, Nov 20 2009.
[98] T. L. Hayes, T. Riley, M. Pavel, and J. A. Kaye, "Estimation of rest-activity patterns using motion sensors," in Engineering in Medicine and Biology Society (EMBC), 2010 Annual International Conference of the IEEE, 2010, pp. 2147-2150.
[99] D. Austin, R. M. Cross, T. Hayes, and J. Kaye, "Regularity and predictability of human mobility in personal space," PLoS One, vol. 9, p. e90256, 2014.
[100] M. L. Chaves, A. L. Camozzato, C. L. Eizirik, and J. Kaye, "Predictors of normal and successful aging among urban-dwelling elderly Brazilians," J Gerontol B Psychol Sci Soc Sci, vol. 64, pp. 597-602, Sep 2009.
[101] T. L. Hayes, F. Abendroth, A. Adami, M. Pavel, T. A. Zitzelberger, and J. A. Kaye, "Unobtrusive assessment of activity patterns associated with mild cognitive impairment," Alzheimers Dement, vol. 4, pp. 395-405, Nov 2008.
[102] T. L. Hayes, N. Larimer, A. Adami, and J. A. Kaye, "Medication adherence in healthy elders: small cognitive changes make a big difference," Aging and Health, vol. 21, pp. 567-580, 2009.
[103] J. Kaye, N. Mattek, H. Dodge, T. Buracchio, D. Austin, S. Hagler, et al., "One walk a year to 1000 within a year: Continuous in-home unobtrusive gait assessment of older adults," Gait & Posture, vol. 35, pp. 197-202, 2// 2012.
[104] S. Sum, R. M. Mathews, I. Hughes, and A. Campbell, "Internet use and loneliness in older adults," Cyberpsychol Behav, vol. 11, pp. 208-11, Apr 2008.
[105] H. W. Wahl, M. Wettstein, N. Shoval, F. Oswald, R. Kaspar, M. Issacson, et al., "Interplay of Cognitive and Motivational Resources for Out-of-Home Behavior in a Sample of Cognitively Heterogeneous Older Adults: Findings of the SenTra Project," J Gerontol B Psychol Sci Soc Sci, vol. 68, pp. 691-702, Sep 2012.

122
[106] C. Gagliardi, F. Marcellini, R. Papa, C. Giuli, and H. Mollenkopf, "Associations of personal and mobility resources with subjective well-being among older adults in Italy and Germany," Arch Gerontol Geriatr, vol. 50, pp. 42-7, Jan-Feb 2010.
[107] T. Suzuki and S. Murase, "Influence of outdoor activity and indoor activity on cognition decline: use of an infrared sensor to measure activity," Telemed J E Health, vol. 16, pp. 686-90, Jul-Aug 2010.
[108] B. D. James, P. A. Boyle, A. S. Buchman, L. L. Barnes, and D. A. Bennett, "Life space and risk of Alzheimer disease, mild cognitive impairment, and cognitive decline in old age," Am J Geriatr Psychiatry, vol. 19, pp. 961-9, Nov 2011.
[109] M. Wettstein, H.-W. Wahl, N. Shoval, F. Oswald, E. Voss, U. Seidl, et al., "Out-of-Home Behavior and Cognitive Impairment in Older Adults: Findings of the SenTra Project," Journal of Applied Gerontology, September 24, 2012 2012.
[110] M. Crowe, R. Andel, V. G. Wadley, O. C. Okonkwo, P. Sawyer, and R. M. Allman, "Life-space and cognitive decline in a community-based sample of African American and Caucasian older adults," J Gerontol A Biol Sci Med Sci, vol. 63, pp. 1241-5, Nov 2008.
[111] N. Shoval, H.-W. Wahl, G. Auslander, M. Isaacson, F. Oswald, T. Edry, et al., "Use of the global positioning system to measure the out-of-home mobility of older adults with differing cognitive functioning," Ageing & Society, vol. 31, pp. 849-869, 2011.
[112] G. Palla, A.-L. Barabási, and T. Vicsek, "Quantifying social group evolution," Nature, vol. 446, pp. 664-667, 2007.
[113] N. Eagle and A. Pentland, "Reality mining: sensing complex social systems," Personal and ubiquitous computing, vol. 10, pp. 255-268, 2006.
[114] N. Eagle, A. S. Pentland, and D. Lazer, "Inferring friendship network structure by using mobile phone data," Proc Natl Acad Sci U S A, vol. 106, pp. 15274-8, Sep 8 2009.

123
[115] R. Wang, F. Chen, Z. Chen, T. Li, G. Harari, S. Tignor, et al., "Studentlife: assessing mental health, academic performance and behavioral trends of college students using smartphones," in Proceedings of the 2014 ACM International Joint Conference on Pervasive and Ubiquitous Computing, 2014, pp. 3-14.
[116] L. S. Radloff, "The CES-D scale a self-report depression scale for research in the general population," Applied psychological measurement, vol. 1, pp. 385-401, 1977.
[117] J. E. Lubben, "Assessing social networks among elderly populations," Family & Community Health, vol. 11, pp. 42-52, 1988.
[118] J. W. Rowe and R. L. Kahn, "Successful aging," The gerontologist, vol. 37, pp. 433-440, 1997.
[119] T. C. Antonucci, K. J. Ajrouch, and K. S. Birditt, "The convoy model: explaining social relations from a multidisciplinary perspective," Gerontologist, vol. 54, pp. 82-92, Feb 2014.
[120] L. L. Barnes, C. F. Mendes de Leon, R. S. Wilson, J. L. Bienias, and D. A. Evans, "Social resources and cognitive decline in a population of older African Americans and whites," Neurology, vol. 63, pp. 2322-6, Dec 28 2004.
[121] E. Dugan and V. R. Kivett, "The importance of emotional and social isolation to loneliness among very old rural adults," Gerontologist, vol. 34, pp. 340-6, Jun 1994.
[122] P. E. Routasalo, N. Savikko, R. S. Tilvis, T. E. Strandberg, and K. H. Pitkala, "Social contacts and their relationship to loneliness among aged people - a population-based study," Gerontology, vol. 52, pp. 181-7, 2006.
[123] M. Pinquart and S. Sorensen, "Influences on Loneliness in Older Adults: A Meta-Analysis," Basic and Applied Social Psychology, vol. 23, pp. 245-266, 2013/01/17 2001.
[124] L. C. Mullins, C. H. Elston, and S. M. Gutkowski, "Social determinants of loneliness among older Americans," Genet Soc Gen Psychol Monogr, vol. 122, pp. 453-73, Nov 1996.

124
[125] L. C. Hawkley, M. E. Hughes, L. J. Waite, C. M. Masi, R. A. Thisted, and J. T. Cacioppo, "From social structural factors to perceptions of relationship quality and loneliness: the Chicago health, aging, and social relations study," The Journals of Gerontology Series B: Psychological Sciences and Social Sciences, vol. 63, pp. S375-S384, 2008.
[126] P. A. Dykstra and T. Fokkema, "Social and emotional loneliness among divorced and married men and women: Comparing the deficit and cognitive perspectives," Basic and Applied Social Psychology, vol. 29, pp. 1-12, 2007.
[127] K. Holmen and H. Furukawa, "Loneliness, health and social network among elderly people--a follow-up study," Arch Gerontol Geriatr, vol. 35, pp. 261-74, Nov-Dec 2002.
[128] J. Cohen-Mansfield, D. Shmotkin, and S. Goldberg, "Loneliness in old age: longitudinal changes and their determinants in an Israeli sample," Int Psychogeriatr, vol. 21, pp. 1160-70, Dec 2009.
[129] G. C. Wenger and V. Burholt, "Changes in levels of social isolation and loneliness among older people in a rural area: a twenty-year longitudinal study," Can J Aging, vol. 23, pp. 115-27, Summer 2004.
[130] C. R. Victor and A. Bowling, "A longitudinal analysis of loneliness among older people in Great Britain," J Psychol, vol. 146, pp. 313-31, May-Jun 2012.
[131] D. P. Johnson and L. C. Mullins, "Growing old and lonely in different societies: Toward a comparative perspective," Journal of Cross-Cultural Gerontology, vol. 2, pp. 257-275, 1987.
[132] T. Van Tilburg, J. de Jong Gierveld, L. Lecchini, and D. Marsiglia, "Social integration and loneliness: A comparative study among older adults in the Netherlands and Tuscany, Italy," Journal of Social and Personal Relationships, vol. 15, pp. 740-754, 1998.
[133] C. Victor, S. Scambler, and J. Bond, The Social World Of Older People: Understanding Loneliness And Social Isolation In Later Life: Understanding Loneliness and Social Isolation in Later Life: McGraw-Hill International, 2008.

125
[134] P. A. Thomas, "Trajectories of social engagement and limitations in late life," J Health Soc Behav, vol. 52, pp. 430-43, Dec 2011.
[135] G. S. Tell, L. P. Fried, B. Hermanson, T. A. Manolio, A. B. Newman, and N. O. Borhani, "Recruitment of adults 65 years and older as participants in the Cardiovascular Health Study," Annals of epidemiology, vol. 3, pp. 358-366, 1993.
[136] L. P. Fried, N. O. Borhani, P. Enright, C. D. Furberg, J. M. Gardin, R. A. Kronmal, et al., "The cardiovascular health study: design and rationale," Annals of epidemiology, vol. 1, pp. 263-276, 1991.
[137] L. F. Berkman and S. L. Syme, "Social networks, host resistance, and mortality: a nine-year follow-up study of Alameda County residents," American journal of Epidemiology, vol. 109, pp. 186-204, 1979.
[138] E. L. Teng and H. C. Chui, "The Modified Mini-Mental State (3MS) examination," J Clin Psychiatry, vol. 48, pp. 314-8, Aug 1987.
[139] P. Allison. (2012, November 1, 2014). When Can You Safely Ignore Multicollinearity? Available: http://www.statisticalhorizons.com/multicollinearity
[140] M. A. Tijhuis, J. De Jong-Gierveld, E. J. Feskens, and D. Kromhout, "Changes in and factors related to loneliness in older men. The Zutphen Elderly Study," Age Ageing, vol. 28, pp. 491-5, Sep 1999.
[141] M. Stewart, D. Craig, K. MacPherson, and S. Alexander, "Promoting positive affect and diminishing loneliness of widowed seniors through a support intervention," Public Health Nurs, vol. 18, pp. 54-63, Jan-Feb 2001.
[142] E. Verbakel, "Informal caregiving and well-being in Europe: What can ease the negative consequences for caregivers?," Journal of European Social Policy, vol. 24, pp. 424-441, 2014.
[143] L. K. George and L. P. Gwyther, "Caregiver weil-being: A multidimensional examination of family caregivers of demented adults," The Gerontologist, vol. 26, pp. 253-259, 1986.

126
[144] J. Glozman, K. Bicheva, and N. Fedorova, "Scale of quality of life of care-givers (SQLC)," Journal of neurology, vol. 245, pp. S39-S41, 1998.
[145] D. Gallagher-Thompson, G. R. Shurgot, K. Rider, H. L. Gray, C. L. McKibbin, H. C. Kraemer, et al., "Ethnicity, stress, and cortisol function in Hispanic and non-Hispanic white women: A preliminary study of family dementia caregivers and noncaregivers," The American journal of geriatric psychiatry, vol. 14, pp. 334-342, 2006.
[146] S. S. Butler, W. Turner, L. W. Kaye, L. Ruffin, and R. Downey, "Depression and caregiver burden among rural elder caregivers," Journal of Gerontological Social Work, vol. 46, pp. 47-63, 2005.
[147] L. D. Clyburn, M. J. Stones, T. Hadjistavropoulos, and H. Tuokko, "Predicting caregiver burden and depression in Alzheimer's disease," JOURNALS OF GERONTOLOGY SERIES B, vol. 55, pp. S2-S13, 2000.
[148] J. Tunstall, Old and alone: a sociological study of old people. London: Routledge & K. Paul, 1966.
[149] Y. Amichai-Hamburger and E. Ben-Artzi, "Loneliness and Internet use," Computers in Human Behavior, vol. 19, pp. 71-80, 2003.
[150] L. A. Theeke, "Predictors of loneliness in U.S. adults over age sixty-five," Arch Psychiatr Nurs, vol. 23, pp. 387-96, Oct 2009.
[151] S. Park and H. Kautz, "Hierarchical recognition of activities of daily living using multi-scale, multi-perspective vision and RFID," Seattle, WA, United states, 2008.
[152] N. Zouba, B. Boulay, F. Bremond, and M. Thonnat, "Monitoring activities of daily living (ADLs) of elderly based on 3D key human postures," Santorini, Greece, 2008, pp. 37-50.
[153] T. L. Hayes, S. Hagler, D. Austin, J. Kaye, and M. Pavel, "Unobtrusive assessment of walking speed in the home using inexpensive PIR sensors," in 31st Annual International Conference of the IEEE Engineering in Medicine and Biology Society, Minneapolis, MN, 2009.

127
[154] J. Petersen, N. Larimer, J. A. Kaye, M. Pavel, and T. L. Hayes, "SVM to detect the presence of visitors in a smart home environment," in Engineering in Medicine and Biology Society (EMBC), 2012 Annual International Conference of the IEEE, 2012, pp. 5850-5853.
[155] L. C. Hawkley, R. A. Thisted, and J. T. Cacioppo, "Loneliness predicts reduced physical activity: cross-sectional & longitudinal analyses," Health Psychol, vol. 28, pp. 354-63, May 2009.
[156] J. A. Kaye, S. A. Maxwell, N. Mattek, T. L. Hayes, H. Dodge, M. Pavel, et al., "Intelligent Systems for Assessing Aging Changes: Home-Based, Unobtrusive and Continuous Assessment of Aging," Journal of Gerontology Series B: Psychological Sciences and Social Sciences, vol. 66B, pp. i180-i190, 2011.
[157] J. S. Long, Regression Models for Categorical and Limited Dependent Variables, 1 ed.: Sage Publications, Inc, 1997.
[158] S. S. Bassuk, T. A. Glass, and L. F. Berkman, "Social disengagement and incident cognitive decline in community-dwelling elderly persons," Ann Intern Med, vol. 131, pp. 165-73, Aug 3 1999.
[159] L. M. Heinrich and E. Gullone, "The clinical significance of loneliness: a literature review," Clin Psychol Rev, vol. 26, pp. 695-718, Oct 2006.
[160] K. Zickuhr and M. Madden, "Older adults and internet use," Pew Internet & American Life Project, vol. 6, 2012.
[161] J. Kaye, H. Dodge, T. Hayes, N. Matteck, D. Howieson, D. Austin, et al., "Person-specific change in home computer use predicts the development of mild cognitive impairment (MCI)," Alzheimer's & Dementia: The Journal of the Alzheimer's Association, vol. 9, pp. P445-P445, 2013.
[162] H. S. Sullivan, The interpersonal theory of psychiatry: edited by HS Perry and ML Gawel, 1953.
[163] T. N. Tombaugh and N. J. McIntyre, "The mini-mental state examination: a comprehensive review," J Am Geriatr Soc, vol. 40, pp. 922-35, Sep 1992.

128
[164] J. Morris, "The clinical dementia rating (CDR): Current version and scoring rules," Neurology, vol. 43, pp. 2412-2414, 1993.
[165] D. Wechsler, Wechsler memory scale (WMS-III): Psychological Corporation, 1997.
[166] D. Wechsler, "Wechsler Adult Intelligence Scale—Revised. San Antonio, TX: Psychological Corp," ed: Harcourt Brace Jovanovich, 1981.
[167] S. G. Armitage, "An analysis of certain psychological tests used for the evaluation of brain injury," Psychological Monographs, vol. 60, p. i, 1946.
[168] W. G. Rosen, R. C. Mohs, and K. L. Davis, "A new rating scale for Alzheimer's disease," The American journal of psychiatry, 1984.
[169] A. R. Jensen and W. D. Rohwer, "The Stroop color-word test: A review," Acta psychologica, vol. 25, pp. 36-93, 1966.
[170] H. Litwin and S. Shiovitz-Ezra, "Social network type and subjective well-being in a national sample of older Americans," Gerontologist, vol. 51, pp. 379-88, Jun 2011.
[171] C. Stephens, F. Alpass, A. Towers, and B. Stevenson, "The effects of types of social networks, perceived social support, and loneliness on the health of older people: accounting for the social context," J Aging Health, vol. 23, pp. 887-911, Sep 2011.
[172] P. Barberger-Gateau, D. Commenges, M. Gagnon, L. Letenneur, C. Sauvel, and J. F. Dartigues, "Instrumental activities of daily living as a screening tool for cognitive impairment and dementia in elderly community dwellers," Journal of the American Geriatrics Society, vol. 40, pp. 1129-34, 1992.
[173] D. Lymberopoulos, A. Bamis, and A. Savvides, "Extracting spatiotemporal human activity patterns in assisted living using a home sensor network," Universal Access in the Information Society, vol. 10, pp. 125-138, 2011.
[174] S. Koch, M. Marschollek, K. H. Wolf, M. Plischke, and R. Haux, "On health-enabling and ambient-assistive technologies. What has been

129
achieved and where do we have to go?," Methods Inf Med, vol. 48, pp. 29-37, 2009.
[175] R. L. Piferi and K. A. Lawler, "Social support and ambulatory blood pressure: an examination of both receiving and giving," Int J Psychophysiol, vol. 62, pp. 328-36, Nov 2006.
[176] D. Austin, T. L. Hayes, J. A. Kaye, N. Mattek, and M. Pavel, "On the disambiguation of passively measured in-home gait velocities from multi-person smart homes," Journal of Ambient Intelligence and Smart Environments, vol. 3, pp. 165-174, 2011.
[177] A. S. Crandall and D. J. Cook, "Tracking systems for multiple smart home residents," in Ambient Intelligence and Smart Environments. vol. 9 ed Amsterdam, The Netherlands: IOS Press, 2011.
[178] C. M. Bishop, "Pattern Recognition and Machine Learning," ed New York: Springer Science+Business Media, LLC, 2006, pp. 291-345.
[179] A. R. Kaushik, N. H. Lovell, and B. G. Celler, "Evaluation of PIR detector characteristics for monitoring occupancy patterns of elderly people living alone at home," in 29th Annual International Conference of IEEE-EMBS, Engineering in Medicine and Biology Society, EMBC'07, Lyon, France, 2007, pp. 3802-3805.
[180] J. Petersen, D. Austin, J. Yeargers, and J. Kaye, "Unobtrusive phone monitoring as a novel measure of cognitive function," Alzheimer's & Dementia: The Journal of the Alzheimer's Association, vol. 10, pp. P366-P367, 2014.
[181] M. Matanda, V. B. Jenvey, and J. G. Phillips, "Internet use in adulthood: loneliness, computer anxiety and education," BEHAVIOUR CHANGE-BUNDOORA THEN SYDNEY THEN BOWEN HILLS-, vol. 21, pp. 103-114, 2004.
[182] J. Morahan-Martin and P. Schumacher, "Loneliness and social uses of the Internet," Computers in Human Behavior, vol. 19, pp. 659-671, 2003.

130
[183] M. Folstein, S. Folstein, and P. McHugh, ""Mini-mental state" - a practical method for grading the cognitive state of patients for the clinician," Journal of Psychiatric Research, vol. 12, pp. 189-198, 1975.
[184] I. H. Campbell, D. Austin, T. L. Hayes, M. Pavel, T. Riley, N. Mattek, et al., "Measuring changes in activity patterns during a norovirus epidemic at a retirement community," Conf Proc IEEE Eng Med Biol Soc, vol. 2011, pp. 6793-6, 2011.
[185] P. D. Allison, Multiple regression: A primer: Pine Forge Press, 1999.
[186] S. R. Cotten, G. Ford, S. Ford, and T. M. Hale, "Internet use and depression among older adults," Computers in human behavior, vol. 28, pp. 496-499, 2012.
[187] P. Lee, L. Leung, V. Lo, C. Xiong, and T. Wu, "Internet Communication Versus Face-to-face Interaction in Quality of Life," Social Indicators Research, vol. 100, pp. 375-389, 2009.
[188] N. Shapira, A. Barak, and I. Gal, "Promoting older adults' well-being through Internet training and use," Aging Ment Health, vol. 11, pp. 477-84, Sep 2007.
[189] T. Fokkema and K. Knipscheer, "Escape loneliness by going digital: a quantitative and qualitative evaluation of a Dutch experiment in using ECT to overcome loneliness among older adults," Aging Ment Health, vol. 11, pp. 496-504, Sep 2007.
[190] H. H. Dodge, Y. Katsumata, J. Zhu, N. Mattek, M. Bowman, M. Gregor, et al., "Characteristics associated with willingness to participate in a randomized controlled behavioral clinical trial using home-based personal computers and a webcam," Trials, vol. 15, p. 508, 2014.
[191] V. Claes, E. Devriendt, J. Tournoy, and K. Milisen, "Attitudes and perceptions of adults of 60 years and older towards in-home monitoring of the activities of daily living with contactless sensors: An explorative study," International journal of nursing studies, vol. 52, pp. 134-148, 2015.

131
[192] C. Segrin and S. A. Passalacqua, "Functions of loneliness, social support, health behaviors, and stress in association with poor health," Health communication, vol. 25, pp. 312-322, 2010.
[193] L. Tornstam, "Dimensions of loneliness," Aging (Milano), vol. 2, pp. 259-65, Sep 1990.
[194] J. M. Ernst and J. T. Cacioppo, "Lonely hearts: Psychological perspectives on loneliness," Applied and Preventive Psychology, vol. 8, pp. 1-22, 2000.
[195] R. I. Schnittger, J. Wherton, D. Prendergast, and B. A. Lawlor, "Risk factors and mediating pathways of loneliness and social support in community-dwelling older adults," Aging & mental health, vol. 16, pp. 335-346, 2012.
[196] M. R. Banks and W. A. Banks, "The effects of animal-assisted therapy on loneliness in an elderly population in long-term care facilities," J Gerontol A Biol Sci Med Sci, vol. 57, pp. M428-32, Jul 2002.
[197] C. M. Masi, H. Y. Chen, L. C. Hawkley, and J. T. Cacioppo, "A meta-analysis of interventions to reduce loneliness," Pers Soc Psychol Rev, vol. 15, pp. 219-66, Aug 2010.
[198] C. P. Keil, "Loneliness, stress, and human-animal attachment among older adults," Companion animals in human health, pp. 123-134, 1998.
[199] E. Marhasev, M. Hadad, and G. A. Kaminka, "Non-stationary hidden semi Markov models in activity recognition," Boston, MA, United States, 2006, pp. 53-60.
[200] L. Peel and A. Clauset, "Detecting change points in the large-scale structure of evolving networks," arXiv preprint arXiv:1403.0989, 2014.