Thesis final - CORE
260
i Effects of filler content and coupling agents on the mechanical properties and geometrical accuracy of selective laser sintered parts in glass bead-filled polyamide 12 composites Thesis submitted to Cardiff University for the degree of Doctor of Philosophy By Alkir A. Mousah Manufacturing Engineering Centre School of Engineering Cardiff University United Kingdom June 2011
-
Upload
khangminh22 -
Category
Documents
-
view
0 -
download
0
Transcript of Thesis final - CORE

i
Effects of filler content and coupling agents on the mechanical
properties and geometrical accuracy of selective laser sintered parts in
glass bead-filled polyamide 12 composites
Thesis submitted to Cardiff University
for the degree of Doctor of Philosophy
By
Alkir A. Mousah
Manufacturing Engineering Centre
School of Engineering
Cardiff University
United Kingdom
June 2011

i
Abstract
Improvements in existing materials and the development of new materials for use in
selective laser sintering are continually being pursued in the industrial and academic
domains. This research will focus on the possibilities available for improving the
mechanical properties and geometric accuracy of selective laser sintered parts produced
from non-commercial polyamide 12 (PA12) composites. The specific material of
interest is PA 12 filled with glass beads. This thesis describes a study of the relationship
between filler particles, the polymer matrix and processing parameters and their
influence on the mechanical properties and geometric accuracy of the composite. The
aim of the study is to better understand the effect of coupling agents on the above
mentioned properties as there is a lack of information in this area.
Most of the experiments described in the thesis were performed with PA 12 filled with
coated and uncoated glass beads. The production of test samples was carried out on a
selective laser sintering machine (DTM Sinterstation 2000). Knowledge about different
machine-material combinations has been extended by performing additional PA 12
composite experiments. The accessible information from PA 12 and glass-filled PA 12
(PA12/GF) manufacturer’s data was used as a reference in comparison and assessment
of the results obtained from the new machine-material combinations.
This research has shown that adding coated glass beads to PA 12 improves the tensile
strength and elastic modulus but reduces the impact strength and ductility of the

ii
resulting material. Under suitable processing conditions, the geometrical accuracy of
sintered parts also improves with the addition of glass beads. The work has also shown
that good interfacial bonding between the polyamide matrix and the glass beads,
particularly when a coupling agent is used, is a likely cause for the observed
improvements.

iii
Acknowledgement
First and foremost I would like to thank God for all of my blessings. Next, I would like
to take this opportunity to express my deepest appreciation and gratitude to my
supervisor Prof. Duc T Pham for his guidance, insight, patience, and time. His
encouragement and advice greatly contributed to the success of this thesis. I am
extremely fortunate to have been groomed under him, and in total awe of the keen
insight with which he have guided me to shape this thesis into what it needed to be.
Special gratitude and thanks to Dr. Shwe Soe for his academic and technical support,
understanding, for the time and knowledge he invested in starting my research project. I
am also eternally grateful to Dr. Georgi Lalev for his directly helping with this research,
particularly in the scanning electron microscope (SEM) to take SEM micrographs of
samples.
Sincere thanks are due to MEC staff members in the Selective Laser Sintering
Laboratory, especial to Technicians Justin and Paul for their invaluable technical
support.
Finally, I am thankful for the unbounded support and encouragement of my Country, my
Family and my Friends … words can not thank you enough.

iv
Declaration
This work has not previously been accepted in substance for any degree and is not
concurrently being submitted in candidature for any other degree.
Signed:………………. (Alkir A S Mousah) Date :………………..
Statement 1
This thesis is being submitted in partial fulfilment of the requirements for the degree of
PhD.
Signed:………………. (Alkir A S Mousah) Date :………………..
Statement 2
This thesis is the result of my own independent work/investigation, except where
otherwise stated. Other sources are acknowledged by explicit references.
Signed:………………. (Alkir A S Mousah) Date :………………..
Statement 3
I hereby give consent for my thesis, if accepted, to be available for photocopying and for
inter-library loan and for the title and summary to be made available to outside
organisations.
Signed:………………. (Alkir A S Mousah) Date :………………..
Signed:………………. (Alkir A S Mousah) Date :………………..
v
Contents
Abstract……………..................................................................................... i
Acknowledgments........................................................................................ iii
Declaration……………................................................................................ iv
Contents….................................................................................................... vi
List of tables….............................................................................................. x
List of figures…............................................................................................ xi
List of symbols ………………………………………………………….. xvi
List of abbreviations ……………………………………………………. xvii
Chapter 1- Introduction………………..……………..………………. 1
1.1 Background of common Rapid Prototyping and Manufacturing
(RP&M) technologies ………………………………………………...
2
1.1.1 Stereolithography (SLA) ……………………………………. 8
1.1.2 Fused Deposition Modelling (FDM) ……………………….. 10
1.1.3 Laminated Object Manufacturing (LOM) ………………….. 12
1.1.4 Selective Laser Sintering (SLS) ……………………..…….. 14
1.2 Motivation ……………………………………………..……………... 16
1.3 Aim and objectives……………………………………………...….… 17
1.4 Research questions and hypotheses………………………….………... 17
1.5 Research approach……………………………………………….……. 20
1.6 Thesis outline………………………………….……………………… 20

vi
Chapter 2- Literature review ……………………………………….… 23
2.1 Basic information and principles of selective laser sintering………….. 23
2.1.1 Thermal-physical issues in SLS process………………………. 24
2.1.1.1 Heat absorption of the powder bed during SLS
process…………………………………..……………
27
2.1.1.2 Thermal diffusivity, thermal conductivity and
specific heat…………………………………………..
29
2.1.2 Processing parameters and operating cycle of SLS process…… 32
2.1.3 Selective laser sintering machines………………..……………. 33
2.1.4 Materials available for SLS process……………………..……. 37
2.2 Fillers………………………………………..………………………… 40
2.3 Coupling agents…………………………………..…………………… 41
2.4 Interfacial adhesion…………………………………..………………… 41
2.4.1 Wettability………………………………………..…………….. 43
2.4.2 Mechanisms of adhesion………………………..……………… 43
2.5 Previous work on relationship between part properties, fillers and
process parameters in SLS......................................................................
45
2.5.1 Mechanical properties of selective laser sintered parts ………. 46
2.5.2 Geometric accuracy of selective laser sintered parts …………. 53
2.6 Research gap addressed……………..………………………………… 55
2.7 Summary…………..……………………………….…………………... 57
vii
Chapter 3- Selective laser sintering of glass beads- filled polyamide
12 composites……………………………………………….
58
3.1 Materials details and characterisation………………………………….. 59
3.1.1 Glass beads……………………………………………………... 60
3.1.2 Silane coupling agents………………………………………….. 62
3.1.3 Nylon 12………………………………………………………... 68
3.2 Powder mixing and blends preparation……………….…………..……. 70
3.3 Powder and processing acquisition…………………………………….. 71
3.3.1 Differential scanning calorimetry analysis…………………..…. 71
3.3.2 Particle size; shape and distribution……………………………. 77
3.3.3 Tapped bulk density of glass beads filled polyamide 12
composites…………………………………..………………….
80
3.4 Processing system…………………..…………………………………. 83
3.4.1 Laser sintering trials………………..……………….…………. 86
3.4.1.1 Preheating process and part bed temperature……... 87
3.4.1.2 Shrinkage scale factors and laser beam offset values.
………………….………….………………..
96
3.5 Characterisation of laser sintered samples………….…………..……. 101
3.5.1 Geometric definition……………………….…………………. 101
3.5.2 Visual observation and evaluation……….………………..…. 104
3.5.3 Density measurements of sintered density samples……….…. 106
3.6 Design and fabrication of test samples………………..……….……………. 111
3.7 Summary……………………………………………….……………………. 115
viii
Chapter 4-
Effects of processing conditions and coupling agents on
mechanical properties of selective laser sintered glass beads
filled- polyamide 12 composites…………..……………………..
116
4.1 Experiments………………………………………………………….. 117
4.1.1 Materials and samples preparation…………………..………. 117
4.1.2 Equipment and methodology…………..........………………. 118
4.2 Mechanical properties………………………………….……………. 122
4.2.1 Tensile strength……………………...........…………………. 122
4.2.2 Young’s modulus…………………………………………..... 128
4.2.3 Elongation at Break………………………………………..... 132
4.2.4 Flexural strength and modulus………………..……………... 134
4.2.5 Impact strength…………………..…………………………... 138
4.2.6 Fracture toughness…………………….……………………... 143
4.2.6.1 Single- edge- notched three point bending fracture
toughness tests……………………………………...
145
4.2.6.2 Correlation between fracture toughness and glass
bead content………………………………………...
150
4.2.6.3 Effect of V- notch depth on fracture toughness…… 152
4.3 Morphological observation……………………………...…………... 154
4.4 Summary……………………………………………………………... 159
Chapter 5- Experimental investigations of the influence of processing
parameters and material properties on curling phenomenon
in selective laser sintering……………………..……………………
161

ix
5.1 Background…………………………………………………………... 161
5.2 Implementation of Taguchi method in the optimisation of curling in
SLS…………………………………………………………………...
170
5.3 Experimental procedure……………………….……………………... 174
5.3.1 Description of experimental set-up………………………….. 174
5.3.2 Design of Experiments………………………………………. 179
5.4 Curling measuring procedure………………………………………... 187
5.5 Statistical analysis of experimental data……………………………... 188
5.5.1 Main effects……………………………………………..…... 192
5.5.2 Analysis using signal to noise (S/N) ratio………………….... 196
5.5.3 Data analysis by ANOVA technique………………………… 200
5.6 Summary……………………………………………………………... 207
Chapter 6- Conclusions and recommended future work………….………... 208
6.1 Conclusions……………………………………………..……………... 208
6.2 Suggestions for Future Work………………..…….…………………... 211
7. Appendix…….……………………………………………..….……………… 213
8. References…….………………………………………………………………. 223

x
List of tables
Table 1.1 Comparison of selected additive processing technologies……...…. 7
Table 1.2 Correspondence between research tasks, hypotheses, and chapters. 19
Table 3.1 Contents of glass beads blended with PA12 by weight…………… 72
Table 3.2 Measured and calculated data of tapped density of composites……. 84
Table 3.3 Modification limits of composite material and LS process
parameters………………………………..…………..………….....
89
Table 3.4 Effects of part bed temperature in SLS process…………………… 97
Table 3.5 Scale factor and beam offset for PA12/GB composites……....…… 109
Table 3.6 Measured data of sintered density specimens…………………….. 114
Table 4.1 Process parameters used in manufacturing of test specimens from
the PA12/CP00 and PA12/CP03 composites………………………
119
Table 4.2 Mechanical properties of SLS specimens (PA12; PA12/CP00 and
PA12/CP03 systems)…..…………..……………………….……...
141
Table 4.3 Mechanical properties of SLS specimens recorded by
extensometer (PA 12; PA12/CP00 and PA12/CP03 systems)……..
142
Table 4.4 Test results of fracture toughness performed on PA12/GB
composites.........................................................................................
149
Table 5.1 The dependency of shrinkage percentage in the length of tensile
bars on glass beads content……………………..………………….
168
Table 5.2 The factors that may have an effect on the SLS process………… 181
Table 5.3 List of SLS experimental parameters and their factor levels……... 182
Table 5.4 The layout of the L8 orthogonal array…………………..………… 185
Table 5.5 The filled in L8 for experimental runs and level combinations……. 186
xi
Table 5.6 Values of thickness and curling for L8 orthogonal array from three
set of experiments……………..……………………………….…..
191
Table 5.7 Experimental results for curling measurements (PA12/CP03
system)……………………………..………………………………
193
Table 5.8 Levels average for main effects………………………….……..…. 194
Table 5.9 The S/N ratio results for curling……………..…………..………... 198
Table 5.10 The range of each parameter…………………………………..... 199
Table 5.11 ANOVA table……………………………..……………………... 204
List of figures
Figure 1.1 Data transfer between CAD and the RM system………………… 3
Figure 1.2 Overview of additive processing technologies…………………... 6
Figure 1.3 A schematic drawing of the SLA………………………………... 9
Figure 1.4 Fused Modelling System………………………….……………... 11
Figure 1.5 Mechanism of a LOM machine and part building sequence of the
LOM process……………………….……..……………………...
13
Figure 1.6 SLS process………………………………………….…………... 15
Figure 1.7 Thesis organisation …………………………..………………….. 21
Figure 2.1 Comparison between SUN and WAGNER SLS process models.. 25
Figure 2.2 Interaction of the laser irradiation and polymer powder………… 28
Figure 2.3 Heat transfer mechanisms in a porous body………………..….… 31
Figure 2.4 The Sinterstation 2000 and build chamber……………..………... 35
Figure 2.5 Breakout station……………………………..…………………... 36
Figure 3.1 Scanning electron micrograph of soda-lime glass beads 3000
solid sphere…………………………………..…………………...
61

xii
Figure 3.2 Idealistic view of a silane treated surface……………………..… 65
Figure 3.3 Coupling mechanism of a silane coupling agent………………… 67
Figure 3.4 DSC curve for melting and crystallisation…………….………… 74
Figure 3.5 DSC plot of virgin PA 12 powder………..……………………... 76
Figure 3.6 SEM micrograph showing unsintered PA 12 powder………….... 78
Figure 3.7 General view of blended powder of PA 12 with glass beads….... 79
Figure 3.8 Particle size and distribution of the glass beads used by sieve
analysis…………………………………………………………...
81
Figure 3.9 The relation between filler ratio and composites tap density……. 85
Figure 3.10 Cross shaped test samples used to help in finding suitable
Bed/feed temperatures……………………………………………
90
Figure 3.11 Cracks and lines on the powder surface formed due to excessive
bed/feed temperatures………………………….………………...
92
Figure 3.12 Growth on sintered specimens…………………………………... 94
Figure 3.13 In-build curling causes the part to shift when the roller passes
over the part bed………………………..………………………...
95
Figure 3.14 Flowchart of beam offset and shrinkage calibration procedure…. 98
Figure 3.15 Calibration standard part built and measured to calculate
shrinkage scale factor and beam offset values for the composite
materials…………………………………..……………………...
100
Figure 3.16 Parts for investigating the manufacturability of small-scale
features in SL process……………………….…………………...
103
Figure 3.17 Samples for visual inspection of features definition based on bed
temperature; laser power and filler content………….…………...
105
Figure 3.18 Comparison of part surface finish and appearance between parts

xiii
with different glass beads content…………………………….…. 107
Figure 3.19 Weight of density specimens sintered using various energy
densities…………………….…………..………………………...
110
Figure 3.20 The influence of energy density values on the density of sintered
density specimens………………………………………………...
112
Figure 4.1 Orientation of samples in the build bed of the SLS machine……. 120
Figure 4.2 Testometric materials testing machine and extensometer
installed…………………………………………………………...
123
Figure 4.3 Shape and dimensions of the tensile test specimens 123
Figure 4.4 Stress- strain curves of PA12; PA12/CP00; PA12/CP03……..… 125
Figure 4.5 The variation of tensile strength of the PA12/CP00 and PA12/
CP03 systems………………………………………………..…....
127
Figure 4.6 The variation of the modulus of elasticity of PA12/GB
composites with glass beads content [wt%]………….………..…
129
Figure 4.7 The variation of the elongation at break with glass bead content.. 133
Figure 4.8 Shape, dimension and the arrangement of test specimen……..… 136
Figure 4.9 The variation of the flexural strength and flexural modulus with
glass beads content……………………………………………....
137
Figure 4.10 Impact test arrangement…………………..……………………... 139
Figure 4.11 The variation of impact strength with glass beads weight ratios… 140
Figure 4.12 Specimen configuration for fracture toughness measurements….. 146
Figure 4.13 Load-displacement curves of: PA12; PA12/CP00; PA12/CP03… 147
Figure 4.14 Dependency of fracture toughness of polyamide 12 composites
on glass bead content………………………………………....…..
151
Figure 4.15 Optical photomicrographs of the V- notch introduced using SLS

xiv
process………………………………….………………………... 153
Figure 4.16 Dependence of KIC and GIC on notch depth……………………... 155
Figure 4.17 SEM micrographs. Scan surfaces……………………..…………. 157
Figure 4.18 SEM scan surfaces and tensile fracture surfaces of selective laser
sintered PA12/CP03 composites containing 20 [wt%] of glass
bead built at different energy densities…………………………..
158
Figure 5.1 Shape distortion in SLS…………………..……………………... 165
Figure 5.2 Curling up of parts during SLS process…………………………. 166
Figure 5.3 Dependency of the shrinkage percentage on glass bead content… 169
Figure 5.4 Scheme of the major steps of implementing the Taguchi method. 172
Figure 5.5 Test bar used for curling investigation…………………………... 177
Figure 5.6 Position of test bar with respect to the part bed and neighbouring
parts………………………………….…………………………...
178
Figure 5.7 The model of the SLS process in Taguchi method………………. 183
Figure 5.8 Measurement arrangement of curling………………….………… 189
Figure 5.9 Definition for symbols: C; ta; hmax………………..……………... 190
Figure 5.10 Main effects graphs for average curling 195
Figure 5.11 The percentage contributions of process parameters on the
amount of curling on sintered parts………………………………
206
List of symbols
Symbol Unit Description
A mm2 Area , cross- sectional area
BS mm Laser beam speed
cp J/kgK Specific heat capacity
d mm Beam diameter

xv
ED J/mm2 Energy density
F N Force
GIC J.m-2 Critical strain energy release rates
k W/mK Thermal conductivity
KIC Pa.m1/2 Critical stress intensity factor
Lp ; P W Laser power
Lt , s mm Layer thickness
m g Mass
Q J/s Heat flow
SCSP mm Scan spacing
Tb ◦C Part bed temperature
Tg ◦C Glass transition temperature
Tpc ◦C Crystallisation temperatures
Tpm ◦C Melting temperature of polymer
α m2/s Thermal diffusivity
β ◦Cmin-1 Heating rate
ρ g/cm3 Powder density
ε % Strain
σ MPa Stress
List of abbreviations
3DP Three dimensional printing
ABS Acrylonitrile butadiene styrene
ACU Atmospheric conditioning unit
AF Additive fabrication
ANOVA Analysis of Variance
CAD Computer aided design
CP00 Uncoated glass beads
CP03 Coated glass beads
xvi
DIN Deutsche Institut fuer Normung
DOE Design of experiments
DSC Differential scanning calorimetry
DTM Desktop manufacturing corporation
EOS Electro optical system
FDM Fused deposition modelling
GB Glass bead
GF Glass filled
LCVD Laser jet chemical vapour deposition
LEFM Linear elastic fracture mechanics
LLM Layer Laminated Modelling
LMT Layered manufacturing technique
LOM Laminated object manufacturing
MSD Mean square deviation
OA Orthogonal array
PA 12 Polyamide 12
PC Polycarbonate
PPSU Polyphenylsulfone
PS Polyester
RBO Rough breakout station
RM Rapid manufacturing
RMTs Rapid manufacturing technologies
RP Rapid prototyping
S/N Signal-to-noise ratios
SEM Scanning electron microscope

xvii
SFF Solid Freeform Fabrication
SFP Solid foil polymerisation
SLA Stereolithography
SLS Selective laser sintering
SMS Selective mask sintering
STL Stereolithography interface format
UV Ultraviolet Light

1
Chapter 1 - Introduction
In today’s highly competitive global market, industry is looking for cost savings,
improved product performance and reliability, failure prevention, longer product life and
better environmental protection. Global competition is forcing companies to not only
look for new ways to improve their business processes but also to focus on important
factors such as product features, quality, cost and time to market to remain competitive.
In response, new production techniques and advanced materials have to be established
for the manufacturing of robust, complex and accurate parts.
Rapid Manufacturing Technologies (RMTs) offer opportunities to make products faster
and usually at lower costs. In general, they can be a solution for the issues mentioned
above, as they show advantages, such as freedom of design and tool-less fabrication,
compared to conventional production methods. However, the limited range of materials
that can be processed by RMTs represents one among many limitations, and despite
many materials being investigated for use with RMTs, there is still a need for research
into new material systems, which are likely to be composed of combinations of existing
materials [1].
This thesis studies the relationship between the properties of such composite materials
properties and processing parameters and their influence on the mechanical properties
and geometric accuracy of parts produced using selective laser sintering (SLS). The

2
study began on a DTM Sinterstation 2000 machine with a composite material of
polyamide 12 filled with glass beads (PA12/GB).
1.1. Background of common rapid prototyping and manufacturing (RP&
M) technologies
Historically, the first commercially available rapid prototyping (RP) system was
introduced in the late 1980s. RP systems, as the name suggests, were originally
employed for producing prototype models. RP was invented as a method to manufacture
concept prototypes which may be used in processes such as design, testing and
assembly. In this section, a basic overview of the different methods of (RP&M) is
presented. The section proceeds with a brief discussion and comparison between these
techniques.
In order to create a part by any rapid manufacturing process, it is first necessary to create
a 3D drawing of the part using CAD software. The computer then divides the drawing
into layers and gives the rapid manufacturing machine a description of each individual
layer. The machine then creates these layers, one on top of another, to produce a whole
part. Generally, the RM process relies on the discrete slicing of a CAD model, which is
then built up in layers from a base material (often a powder or a resin), finally producing
a full three-dimensional part without the aid of moulds, substrates or any hard tooling.
Fig (1.1) shows the process of data transfer between CAD and the RM system [2], [3].

3
Fig (1.1) Data transfer between CAD and a RM system [3]
RM system
Layered Model
Physical Model
CAD system CAD File
(3D)
Faceted model (STL file)

4
However, the success of this new technique marked a revolution in product development
and manufacturing. Nowadays, it is evolving rapidly from prototyping towards the
manufacture of functional end-user products [4], [5].
RP&M is an important technology and is also known as Layered Manufacturing
Technology (LMT), Solid Freeform Fabrication (SFF), Additive Fabrication (AF),
Direct CAD Manufacturing, Instant Manufacturing and E- Manufacturing. The term
that is commonly used now in the literature is “Rapid Prototyping and Manufacturing
(RP&M)”, which denotes the route of rapid prototyping but also explains the extension
of where these techniques are trying to go in manufacturing [6].
Virtually, all RP & M technologies provide the ability to fabricate parts with unbounded
geometric freedom, which is their most important advantage over subtractive methods
and the main reason why they exist. For the time being, there are about thirty rapid
prototyping techniques, but only few of them are widely used and dominant in the
market, and these are:
• Stereolithography (SLA)
• Selective Laser Sintering (SLS)
• Fused Deposition Modelling (FDM)
• Laminated Object Manufacturing (LOM)
• Inkjet-based systems and three-dimensional printing (3DP).
Each of these technologies has its varying strengths and weaknesses depending on the
manufacturing details, type of material and post-processing [4], [7].

5
The main advantage of RP&M processes is the ability to rapidly produce net or near-net
shape parts with varying geometries using a single machine with no part-specific
tooling. Among all of its features, the most important is that this technology is fast and
flexible in the whole forming process as inferred by its common name, Rapid
Prototyping and Manufacturing [4], [8], [9]. New manufacturing technologies offer
alternative means of producing prototypes, patterns, models and low volume parts faster
and at reduced costs compared to traditional manufacturing processes [10]. However,
none of the processes excel in all respects; each process has restrictions imposed by
costs, accuracy, materials, geometry and size.
Researchers have conducted detailed research on many important rapid prototyping
techniques, which they grouped together based on the similarities of how the materials
are added and bonded together. Furthermore, they have explained the basic principles
and compared them by considering the cost efficiency, materials used, process time and
accuracy [11], [12].
The main difference between these techniques, which are described in some detail
below, is the method they use to create the layers. Furthermore, RP&M technologies use
different types of materials to produce parts, including thermoplastics, wax, ceramics,
metals and most commonly polymers. Fig (1.2) gives an overview of selected RP&M
processes available at the moment, whereas a comparison of selected additive processing
technologies is presented in Table (1.1).

6
Fig (1.2) Overview of additive processing technologies [13]
Fused deposition modelling (FDM)
Melting and freezing
Chemical reaction
Blanking and polymerisation
Blanking and joining
3D-printing (3DP)
Foil
Consolidation trough binder
Filament Powder
Liquid Gaseous
Melting and freezing
Polymerisation
Solid
Selective laser sintering (SLS)
RP&M processes
Melting and freezing
Selective mask sintering (SMS)
Laminated object manufacturing (LOM)
Solid foil polymeri-sation (SFP)
Sterolitheo-graphy (SL)
Laserjet chemical vapour deposition (LCVD)

7
Table (1.1) Comparison of selected additive processing technologies [13]
SLA SLS LOM FDM SMS 3DP
Materials
photopolymers
(acrylic and
epoxy resins
metals, sand,
thermoplastics
(PA12, PC, PS)
foils
(paper,
polymers,
metals,
ceramics
thermoplastics
(ABS, PC,
ABS-PC-blend,
PPSU)
thermoplastics
(PA12)
thermoplastics,
cement, cast-
sand
Part size (mm) 600x600x500 700x380x550 550x800x500 600x500x600 210x297x600 508x610x406
Accuracy <0.05 mm 0.05–0.1 mm 0.15 mm 0.1 mm 0.05–0.12 mm 0.1/600x540
dpi
Cooling-off
time/
curing time
no cooling-off
or curing time
up to 30 min
depending on
geometry and
bulk
depending
on geometry
no cooling-off
or curing time
depending on
geometry and
bulk
no cooling-off
or curing time
Commercially
available since 1987 1991 1990 1991 2005 1998
Costs (T ) from 130 from 150 from 150 from 50 from 150 from 25
Relative
sample costs*) medium medium–high low–medium low–medium medium–high low
a) Costs depend on the number, size and complexity of samples.

8
1.1.1. Stereolithography (SLA)
SLA was the first RP&M technique developed and is still the most widely used process.
It was developed by 3D systems of Valencia, California, USA, founded in 1986. This
process is based on a photosensitive liquid resin which, when exposed to ultraviolet
(UV) light, solidifies and forms a polymer. An SLA machine consists of: a build
platform, resin bath, recoating blade, ultraviolet laser and a scanning device. A bath of
photosensitive resin contains a vertically moving platform. The part under construction
is supported by the platform which moves downward by the layer thickness for each
layer. A laser beam traces out the shape of each layer and solidifies the photosensitive
resin. Fig (1.3) shows the SLA process. The surrounding resin gives no mechanical
stability to the built part; hence, a support structure is indispensable for the creation of
overhanging layers. In a subsequent process, these structures are removed and the part
is completely cured in a UV cabinet [13], [14].
Since it was the first technique, SLA is regarded as a benchmark by which other
technologies are judged. In the beginning, SLA prototypes were fairly brittle and prone
to curing-induced warpage and distortion, but recent improvements have largely
corrected these problems. To broaden the application area of SLA, research and
technology development efforts are being directed towards process optimisation. In
general, SLA is inexpensive compared to other RP&M techniques; it exclusively uses a
light-sensitive liquid polymer which has considerably poor mechanical properties, and
so the fields of application are limited to the production of prototypes with reduced
functionality [14].

9
Fig (1.3) SLA system [15]

10
1.1.2. Fused deposition modelling (FDM)
Fused deposition modelling is an additive manufacturing technology commonly used
for modelling, prototyping and production applications. It was developed by Scott
Crump in 1988 and was commercialised in the 1990s by Stratasys of Eden Prairie, MN,
USA [16]. The system consists of a build platform, extrusion nozzle and control
system, which is in its entirety contained within a chamber which is held at a
temperature just below the melting point of the plastic. The overall arrangement of
FDM is illustrated in Fig (1.4).
In this technique, filaments of heated thermoplastic are extruded from a tip that moves
in the x-y plane. The extrusion head deposits very thin beads of material in a controlled
fashion onto the build platform to form a layer. The material is heated just above its
melting point so that it solidifies immediately after extrusion and cold- welds to the
previous layers. The platform is kept at a lower temperature, so that the thermoplastic
quickly becomes firm. After deposition of a layer, the platform lowers and the extrusion
head deposits the next layer onto the previous one. Supports are built alongside the
deposition where required. These are fastened to the part either with a second, weaker
material or with a perforated junction [17].
The FDM process creates functional prototypes, tooling and manufactured goods from
commercially available engineering thermoplastics, such as ABS, sulfones,
polycarbonate, elastomers, and investment casting wax as well as medical versions of
these plastics. Unlike some additive fabrication processes, FDM requires no special
facilities or ventilation and involves no harmful chemicals or byproducts. FDM
machines range from fast concept modellers to slower (high-precision) machines [14].

11
Fig (1.4) Fused Modelling System [13]

12
1.1.3. Laminated object manufacturing (LOM)
Laminated Object Manufacturing is a process based on the principle of lamination. By
definition, laminated object manufacturing (also known as laminated object modelling
(LOM) or layer laminated modelling (LLM)), is a hybrid prototyping method, where an
additive layer laminate process generates the part from paper, ceramic, polymer or
metals followed by a subtractive step which cuts the outline with a CO2 laser cutter
[13]. Fig (1.5-a) demonstrates the mechanism of a LOM machine.
In this technique, shapes are built with layers of paper or plastic. The binding together
of the laminates is brought about by means of a thermally activated adhesive. A heated
roller is used to glue the laminate to the previous layer. The outline of the part cross-
section for each layer determined by the computer-aided design (CAD) file is then cut
using a CO2 laser beam. The laser also cuts the excess material in a cross-hatch pattern.
The excess material provides support for subsequent layers. Finally, an overall
rectangular outline is cut, freeing the cross-section from the paper roll. The platform
moves down and the feed paper advances. The sequence repeats itself until the final
layer is completed. The excess material, which is already sectioned into cross-hatched
columns, is removed manually at the end of the process [18]. Fig (1.5-b) shows the part
building sequence of the LOM process.
LOM is used extensively for tooling and manufacturing by producing patterns and
masters for sand casting, investment casting, cavity moulds for injection and tools for
thermal forming and prototype stamping (Helisys, Inc, CA USA), [18]. At the present,
the commercially available machines for LOM are LOM 1015, LOM 2030 and LOM
2030E.

13
Fig (1.5) Mechanism of a LOM machine (a); and part building sequence of the
LOM process (b), (source: Helisys Inc, CA, USA) [18]
laser Optics x-y positioning device Laminating roller Layer outline and crosshatch Sheet material Part block Platform Take- up roller Material supply a) roll
New layer Bonding Cutting b)

14
1.1.4. Selective laser sintering (SLS)
Selective laser sintering (SLS) is a powder-based Rapid Prototyping & Manufacturing
method developed at the University of Texas. It was initially commercially available
from the DTM Corporation but was later bought out by 3D Systems in 2001. Needless
to say, the SLS process, with a humble start in 1987, has grown to become synonymous
with Rapid Manufacturing [19].
In SLS, a fine powder is heated with a CO2 laser which causes sintering of the powder
particles and as a result they are mutually bound. The process itself is a very simple,
repeatable one. The building of parts, as illustrated in Fig (1.6), is a repeatable two-step
process: first; a roller is positioned beside one of the feed beds. This feed bed then
raises a set amount and the roller pushes the raised powder across, covering the part bed
with a powder layer. Second; with the layer of powder present, the laser starts to etch
out the desired shape of the part in the powder, in effect melting the powder. Once this
is done, the part bed drops down a set amount and the process continues from the
opposite side with the other feed bed raising and the roller distributing another layer of
powder over the part bed, followed by the laser etching out the shape. The part is built
up in slices with each layer of powder representing a single slice of the part. As the
laser sinters the powder, each layer fuses together to give a full solid part. However, the
process is self-supporting and parts can therefore be nested together. The selective
nature of the laser process enables complex geometries to be achieved without
compromising functionality. Finished parts are surrounded by, and often contain,
unsintered powder; this loose powder is simply blasted away with an air gun and any
post-processing work is then carried out [20], [21].

15
Fig (1.6) SLS process [15]

16
1.2. Motivation
Currently, Additive Manufacturing Techniques are used more and more in many
industrial branches, such as aerospace, automotive and biomedical, to manufacture
functional parts and end-use products rather than prototypes. Therefore, the parts are
required to possess sufficient mechanical properties and quality to meet the
requirements needed of their applications. In most cases, however, material properties
and functional life of parts made by currently available layer manufacturing techniques
seldom meet those of their counterparts produced by traditional polymer processing
techniques such as injection moulding. In order to bridge this gap, research efforts have
been made to develop existing materials and to find new materials, as these will play a
major role in opening access to new fields of application [13], [22], [23].
In this context, traditional pure materials no longer satisfy all the requirements and
there is a real need for new composite materials. The development of new polymers is a
time-consuming and expensive project. By compounding, blending and reinforcing
existing polymers, it is possible to obtain material properties that are not available with
conventional single polymer materials, and such properties may be key factors in
achieving improved properties and better quality in selective laser sintered components.
The latest trend of research includes:
- the development of new materials,
- advancements in laser technologies, software and computer integrated
manufacturing support to Rapid Prototyping and Manufacturing (RP&M),
- development of new methods of layer deposition,
- improvement of the mechanical properties of components as well as their surface
quality and geometric accuracy [8], [24].
17
1.3. Aim and objectives
For Rapid Prototyping (RP) applications, the mechanical properties of the parts
produced are often of low importance, as parts are intended simply for short-term
visualisation purposes, as well as form, fit and function testing. As the move towards
Rapid Manufacturing (RM) continues, with the production of functional end-use
components, achieving improved mechanical properties and better quality in SLS
components has become increasingly important.
The aim of this research was to study the mechanical properties and geometric accuracy
of laser sintered non-commercial composites formed by the incorporation of glass
particles into polyamide 12. The primary objectives of this research were:
1. To study the effect of filler content and surface treatment on mechanical
properties.
2. To infer the effect of filler content and its surface treatment on geometric
accuracy.
1.4. Research questions and hypotheses
In order to produce suitable products (in terms of properties and quality), the main
aspects to be considered in SLS technology are the properties of the powders used in
the process and the processing parameters. The following research questions for this
work were centred on the two major research activities mentioned above:

18
Research question 1: How can the general properties of polyamide 12, as a polymeric
material for selective laser sintering, be improved?
Hypothesis 1: The properties of polyamide 12 can be improved by creating blends and
composites.
Sub-research question 1.1: What is the role of the interfacial adhesion between the
filler and the matrix in improving the mechanical properties of glass bead-filled
polyamide 12 composites?
Hypothesis 1.1: The condition of interfacial adhesion controls the local elastic fields
and the overall properties of composites.
Research question 2: How can the geometric accuracy of sintered component be
improved?
Hypothesis 2: The geometric accuracy of SLS parts could be improved by controlling
the properties of the material and optimising the processing parameters and conditions.
Sub-research question 2.1: Under what conditions is it possible to improve the
geometric accuracy of selective laser sintered components from PA12?
Hypothesis 2.1: Geometric accuracy of selective laser sintered parts can be improved
by creating blends.
Table (1.2) lists the correlation between the primary research tasks, the research
questions, the corresponding hypotheses and where the research questions were
addressed in this research. Answering these research questions is documented in
different chapters of the thesis.

19
Table (1.2) Correspondence between research tasks, hypotheses, and chapters.
Thesis
Chapter
Chapter 3 Chapter 4 Chapter 5
Task
Characterisation of
materials and
determination of
process parameters.
Study of the effects
of processing
conditions, filler
content and coupling
agents on mechanical
properties.
Investigations on the
influence of processing
parameters and material
properties on the curling
phenomenon in selective
laser sintering.
Hypothesis Hypothesis 1 Hypothesis 2
20
1.5. Research approach
After conducting a literature review, which is presented in detail in chapter 2, four tasks
were undertaken to help reach the goal of eventually improving the mechanical
properties and geometric accuracy of parts produced using SLS, namely:
1. Compounding pure PA12 with glass beads, with different ratios and surface
treatment.
2. Carrying out pre-processing studies for the characterisation of composite
materials and the determination of process parameters.
3. Production of test samples using the SLS process under varying parameters
and conditions.
4. Conducting experiments, measuring and determining the mechanical
properties and geometric accuracy of the composite.
1.6. Thesis outline
The specific goal of this research was to study the mechanical properties and geometric
accuracy of selective laser sintered parts in non-commercial glass bead-filled
polyamide 12 composites with filler particles of different ratios and surface treatments.
This thesis is divided into six chapters. A brief overview of the topics covered in each
chapter is presented in Fig (1.7). Chapter 1 serves as an introduction to the thesis. The
research aim and objectives, as well as research questions are presented in this chapter.
In Chapter 2, the literature review, the theoretical background and existing research
activities are summarised. The working principles behind the SLS process, apparatus
and materials are outlined. Chapter 3 includes details on material preparation and
characterisation, such as pre-processing studies, design and fabrication of test samples,
characterisation of laser sintered samples.

21
Relevance
• PR & RM techniques • Motivation and importance of the research • Aims and objectives • Research questions and hypotheses
• Basic information and principles • Fillers and additives • Coupling agents • Existing work and research gap
• Pre-processing studies • Powder and processing acquisition • characterisation of sintered samples >Forms the basis for the following chapters
• Processing parameters • Production of test samples • Determination of mechanical properties
• Curling phenomenon • Taguchi method • Design of experiments • Statistical analyses • ANOVA technique
• Concludes the research work • Recommends future work
Fig (1.7) Thesis organisation
Chapter 1 Introduction: The need for parts with improved mechanical properties and quality in the SLS process
Chapter 2
Literature review and previous research
Chapter 3 Foundations for the study of mechanical properties and geometric accuracy
Chapter 4 Experimental investigation of the mechanical properties of SLS parts
Chapter 5 Experimental study of geometric accuracy of SLS parts
Chapter 6 Closure of the thesis

22
Chapter 4 represents the backbone of this work, where the effects of processing
conditions, filler content and coupling agents on mechanical properties of PA12/GB
composites are detailed. Chapter 5 describes an investigation into the influence of
processing parameters and material properties on the curling phenomenon which is a
major cause of geometric inaccuracies. In this chapter the Taguchi method and
ANOVA technique were implemented. Finally, Chapter 6 provides a brief conclusion
of this thesis as well as the contributions resulting from the research work and
recommendations for future work.

23
Chapter 2 - Literature review
In this chapter, basic information for the SLS process is presented. The chapter
proceeds with outlining the nature of the SLS process as well as the machines and
materials involved, and it continues with a review leading into determining of a
research gap in the existing literature related to SLS.
2.1. Basic information and principles of selective laser sintering
Selective laser sintering is an additive manufacturing process, in which layers of
preheated powder are spread and laser radiation is used to partially liquefy and fuse the
powdered material. Sintered material forms parts, whilst unsintered material remains in
place to support the structure. During recent years, selective laser sintering has evolved
from a RP technique to a promising RM technique.
As with any machine tool, it is important to understand the capability of the selective
laser sintering (SLS) process, the equipment and materials in order to produce high
quality parts. The SLS systems are intended for sintering a wide range of materials with
greatly different properties. This is mainly due to its suitability to process almost any
material, such as polymers, metals, ceramics and many types of composites, provided it
is available as a powder and that the powder particles tend to fuse or sinter when heat is
applied [19].
Fundamentally, selective laser sintering represents such a complex physical process in
which many single mechanisms affect each other. The SLS process needs several steps,
such as energy input, energy absorption, heating of the powder bed, sintering and

24
cooling of the sintered part to be complete. The investigation often requires creating
submodels which enable a better understanding of partial aspects, then merging these
submodels into an integrated model, representing the base for process simulation.
Modelling the entire SLS process is very difficult due to the many different physical
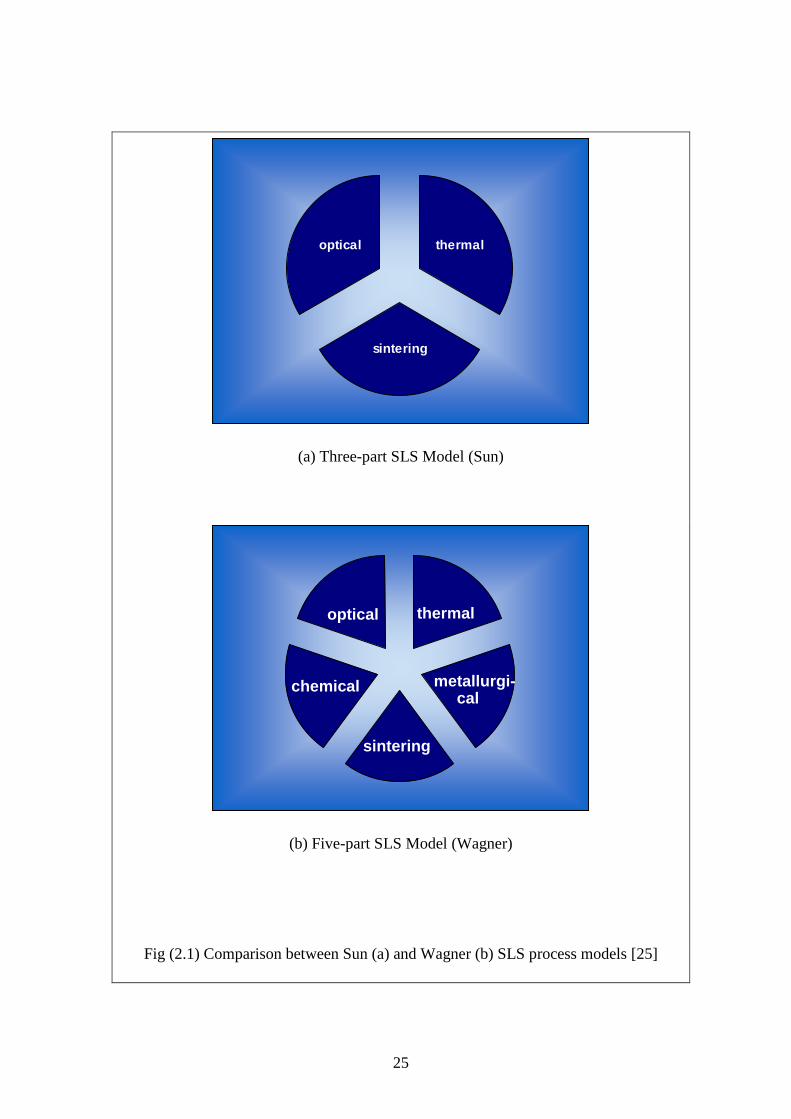
processes involved and as depicted in Fig (2.1). The integrated model of Sun is
composed of three different submodels, whereas it is composed of five in the modified
model of Wagner [25].
2.1.1. Thermal-physical issues in the SLS process
The thermal nature of SLS process influences, to great extent, the bulk powder
properties as well as the properties of the sintered parts, such as the mechanical
properties, geometric accuracy, surface roughness and other properties; hence,
investigating and studying the thermal behaviour of the process, in particular
temperature distribution within the build bed, will lead to a better understanding of the
problem [26].
Although several physical phenomena are involved in the process, and coupling exists
between them, the SLS process is mainly dominated by its thermal nature. It belongs to
a three-dimensional unsteady heat transfer problem, which requires the application of
several numerical and computational techniques to solve the unsteady state heat transfer
equations. However, SLS is a complicated process, involving several physical
phenomena, including:
- Heat generation and transfer, including the heating of the powder bed and the
cooling of the sintered sample;
- Microstructure evolution, including porosity evolution and phase changes
25
sintering
optical thermal
(a) Three-part SLS Model (Sun)
(b) Five-part SLS Model (Wagner)
Fig (2.1) Comparison between Sun (a) and Wagner (b) SLS process models [25]
thermal optical
chemical
sintering
metallurgi- cal
26
(melting and solidification of the binder);
- Fluid problems (molten binder flowing in the solid lattice);
- Mechanical problems (lack of uniformly distributed thermal strains during the
cooling stage may cause residual stresses and distortions of the produced parts).
Accordingly, knowing the temperature distribution and evolution is essential to suitably
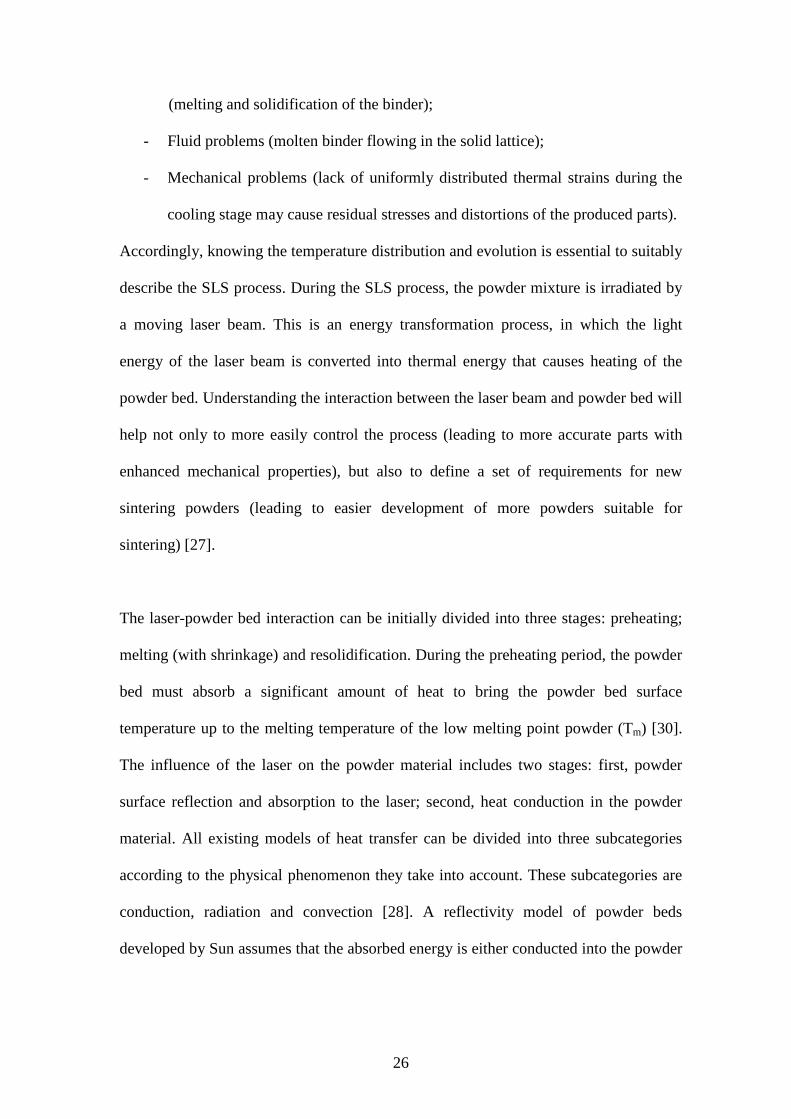
describe the SLS process. During the SLS process, the powder mixture is irradiated by
a moving laser beam. This is an energy transformation process, in which the light
energy of the laser beam is converted into thermal energy that causes heating of the
powder bed. Understanding the interaction between the laser beam and powder bed will
help not only to more easily control the process (leading to more accurate parts with
enhanced mechanical properties), but also to define a set of requirements for new
sintering powders (leading to easier development of more powders suitable for
sintering) [27].
The laser-powder bed interaction can be initially divided into three stages: preheating;
melting (with shrinkage) and resolidification. During the preheating period, the powder
bed must absorb a significant amount of heat to bring the powder bed surface
temperature up to the melting temperature of the low melting point powder (Tm) [30].
The influence of the laser on the powder material includes two stages: first, powder
surface reflection and absorption to the laser; second, heat conduction in the powder
material. All existing models of heat transfer can be divided into three subcategories
according to the physical phenomenon they take into account. These subcategories are
conduction, radiation and convection [28]. A reflectivity model of powder beds
developed by Sun assumes that the absorbed energy is either conducted into the powder

27
bed or lost through radiation and convection at the surface. Fig (2.2) schematically
depicts the interaction between laser irradiation and the powder bed.
2.1.1.1. Heat absorption of the powder bed during the SLS process
In SLS, the processing medium is composed of powder particles, not a continuum. The
thermal properties of the powder bed change as the powder is heated and as
coalescence between particles occurs. During the scanning process in SLS, material
properties change due to their dependence on temperature and degree of fusion taking
place. Powder changes from the solid phase to the liquid phase and then back to the
solid phase. These phase change processes are accompanied by both absorption and
release of thermal energy. Therefore, the thermal properties are a function of the
powder bed properties, temperature and time. The powder under the laser absorbs the
energy where the temperature rises. It conducts heat exchange with the surrounding
sintered powder as well as loose powder according to the thermo- mechanical law,
which consists of conduction, radiation and convection [28], [29].
The laser beam is a moving heat source, whose reaction time with the powder is less
than 1 ms. During the heating process, the thermal physical properties and parameters
of the powder, such as specific heat and thermal conductivity change with the
temperature, which is changing with time. The laser sintering process of polymer
composite powder is dynamic and unsteady [29].
During selective laser sintering (SLS), the optical properties of the powder material will
influence the heat transfer within the powder bed and hence its fusion behaviour. When
the laser beam strikes the powder bed, part of the laser energy is reflected and
28
Fig (2.2) Interaction of the laser irradiation and polymer powder [30]
Heat lost by convection
Heat lost by radiation
Laser moving direction
Heat conducted to the powder bed
Sintered region
Previous layer
Laser beam
Unsintered region

29
the rest is absorbed by it. The transmittance of the powder affects the energy
distribution within the powder bed. For powders with a low transmittance, most energy
will be absorbed near the surface, and the thermal gradient along the z-axis, into the
powder, is large. It has been reported that the maximum absorption takes place near, but
not exactly on, the powder bed surface [31].
2.1.1.2. Thermal diffusivity, thermal conductivity and specific heat
The aim in this section is not to evaluate the exact thermal property values of the
processing material, but to understand if those aspects can be technologically important
in the definition and control of a selective laser sintering process, where it is generally
believed that thermal properties play a central role during SLS of composite materials.
The thermal diffusivity α [m2/s], thermal conductivity k [W/mK] and specific heat cp
[J/kgK], namely the thermal properties, are the three most important physical properties
of a material that are needed for heat transfer calculations. Those properties are evident
when heat is added or removed from a material and are related by:
pc
k
ρα = (2.1)
Thermal diffusivity (α) is a measure of the rate of heat propagation through a material.
It is an important property in all problems involving non-steady state heat transfer,
which happens during heating and cooling of a material. The thermal conductivity (k) is
described as a measure of the ability of material to transfer thermal energy by
conduction. The specific heat (cp) is the amount of heat per unit mass required to
increase the temperature by one degree Celsius, and therefore is associated with the
energy consumption in the heating processes [32].

30
It is a well-known fact that the thermal conductivity of a powder bed can vary from
point to point depending on the local temperature as well as the conditions of contact
between particles and the local density [33]. Porous media are most frequently met in
many engineering fields and, in particular, in rapid prototyping and manufacturing. The
thermal conductivity of porous media is one of the important properties for numerical
simulations. The various heat transfer mechanisms in multi-porous bodies have been
identified and discussed by Yagi and Kunii and by Kunii and Smith, who have
developed a simplified equivalent physical structure and a corresponding mathematical
expression for the apparent conductivity in terms of porous-structure parameters and
the conductivities of the solid and gas phases. The following heat transfer mechanisms,
shown schematically in Fig (2.3), exist in a multi-porous body:
1. Direct solid conduction through areas of actual particle-to-particle contact
2. Direct gas conduction through areas of pore-to-pore communication
3. Series conduction through solid and gas
4. Particle-to-particle radiation across a gas layer
5. Pore-to-pore radiation by passing particles
Of these mechanisms, 1, 2, 3, and 5 may be considered to be in parallel, and 4 to be in
parallel with the gas part of 3. Once these heat transfer mechanisms have been
identified and their relationships noted, it is possible to formulate a simplified physical
model of a multi-porous body and its resulting heat transfer properties [34].

31
Fig (2.3) Heat transfer mechanisms in a porous body [34]
1,2,3 … Conduction 4,5 … Radiation

32
The prediction of the thermal conductivity of heterogeneous or composite materials
comprises a significant portion of the heat transfer literature, and a significant number
of effective thermal conductivity models have been proposed. Thermal property
evaluation is very important in the prediction of the melting process of the powder bed,
where there are three components in the powder bed: low melting point powder, high
melting point powder and gas (or gases) [35], [36].
2.1.2. Processing parameters and operating cycle of the SLS process
The most important factors of the laser sintering process can be classified into material,
machine, part, laser, environment and exposure. Therefore, these factors have to be
taken into account for the system and materials. Beyond this, process-specific factors
and the selection of the material components e.g. mean density or optical characteristics
have to be considered and possibly adopted. The most important process-controlled
variables are:
• Laser energy
• Layer thickness
• Scan velocity
• Beam offset
• Exposure strategies
The laser energy is one of the most important process variables, since by increasing the
laser energy higher temperatures in the powder can be achieved. Thus, the proportion of
the liquid phase, the density and the mechanical strength of the laser sintered part
increases. The beam offset and the scan velocity have a crucial influence on the build
speed, the strength of the part and, beyond that, it also determines together with the

33
particle size of the applied powder the surface roughness of the horizontal surfaces
[37].
The operating cycle of the SLS process is almost the same in all SLS machines. A full
build cycle of the SLS process consists mainly of three stages:
(1) Warm up stage: The chamber is inerted with nitrogen gas, the process chamber and
feed material are warmed up and a number of layers are spread without being sintered.
Depending on the material being used, this stage takes between one and two hours.
(2) Build stage: The part is built. The time to build a single layer using the SLS process
is influenced by two time elements: the time taken to spread a layer of powder and the
time taken for the laser to scan and sinter the appropriate area. The first element
remains constant through a build cycle, while the second factor is a function of the size
of the area to be scanned.
(3) Cool down stage: The chamber is returned to ambient temperature in a controlled
way. This stage takes between one and three hours [38].
2.1.3. Selective laser sintering machines
In this section, some general information about the machine that was used for the
research is presented. Along with that information, the purpose of the machine and
what it lends to the research is explained. At the heart of this research work is the SLS
machine that processed the material from which the parts were made and produced the
numerous test parts to be measured. The first prototype selective laser sintering (SLS)
machine was created at the University of Texas at Austin, Texas, USA in 1986. In
1987, the DTM Corporation was founded and produced the SLS Model 125 [38].
Nowadays, SLS machines are produced by two major manufacturers; EOS GmbH

34
based near Munich, Germany and DTM (now owned by 3D Systems Inc. of
California). Commercial SLS machines (DTM and EOS) are all equipped with CO2
lasers with maximum power ratings between 50 and 200W. Besides the HQ 2500, the
EOSINT P 700, a production version from DTM, known as the Sinterstation 2000, was
installed in the Department of Manufacturing Engineering Centre at Cardiff University
in 1997. This machine was used in the current work, both for study and research.
In general, a typical SLS machine includes a laser source, optics, a powder laying unit
(recoater), powder bins and a platform all within a build chamber (Fig. 2.4). The main
units of Sinterstation 2000 are [38]:
1- Powder engine/process chamber/laser scanner in which the SLS build process is
carried out
2. Atmospheric conditioning unit (ACU) containing the cooling, air conditioning and
gas insertion systems required by the process chamber
3. Controls cabinet containing the computer, programmable logic controllers, power
systems, modem and Ethernet connections
4. Rough breakout (RBO) station for breaking out the sintered parts from the cake of
unsintered powder at the end of the run, Fig (2.5)
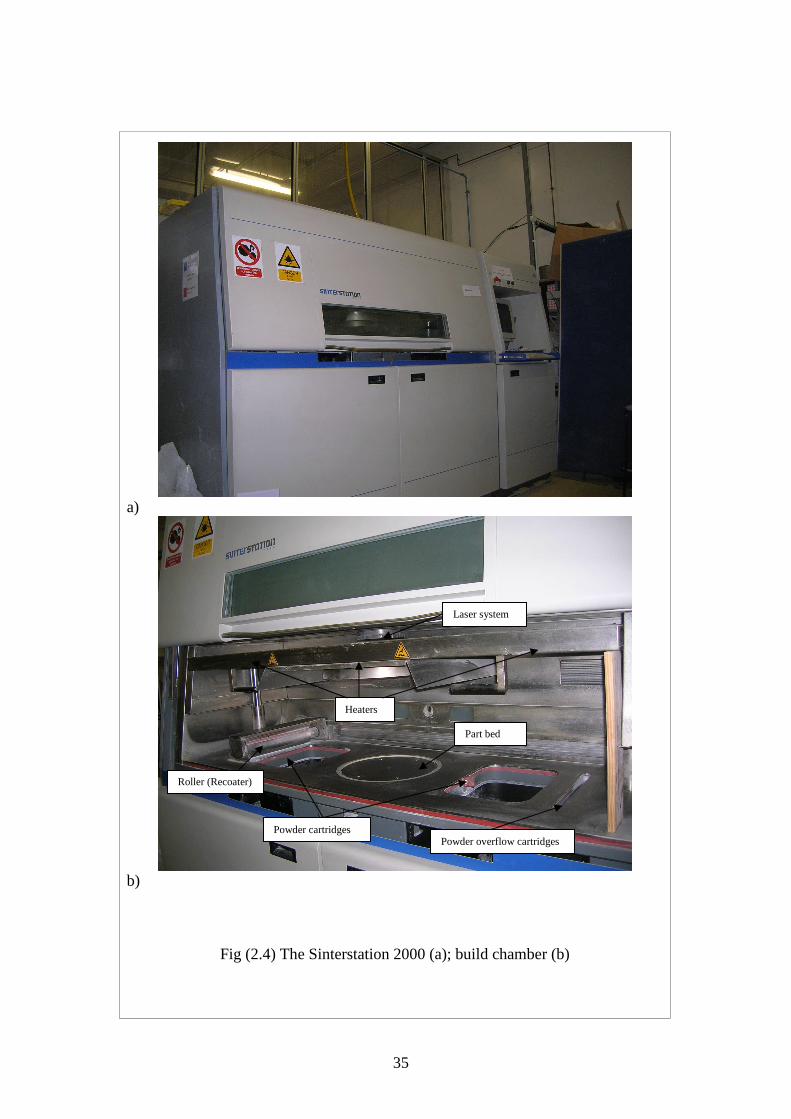
35
a)
b)
Fig (2.4) The Sinterstation 2000 (a); build chamber (b)
Powder cartridges
Part bed
Laser system
Powder overflow cartridges
Roller (Recoater)
Heaters

36
Fig (2.5) Breakout station

37
2.1.4. Materials available for the SLS process
There are various grades of materials used in SLS, each with their own characteristics,
but each is used in the same way within the SLS machine. In order to produce suitable
products the main aspects to be considered, first and foremost in SLS technology, are
the properties of the powders used in the process and processing parameters.
Polymers were the first material to be processed by SLS, and this is because there are
several properties of polymers that make them easier to process by SLS than other
materials. Polymers have a relatively high viscosity in the liquid state, relatively low
surface energy, low reactivity with most gases and low thermal conductivity. However,
the effect of the properties of the polymer materials, such as molecular weight, molten
viscosity, crystallisation rate and the particle size of the powder, on the mechanical
properties and the quality of selective laser sintered parts is one among many important
factors which should be highly considered when characterising polymers in selective
laser sintering [39], [40]. Hence, the requirements for maximum suitability of a
polymer for laser sintering should be:
1- A very high difference between melting point and solidification point.
2- A very high enthalpy of fusion.
The explanation is that, since in pure polymer powders the solidification point is
determined by basic physical data, an increase of the melting point by forming a new
crystal modification implies a great advantage. The larger the difference, the smaller the
shrinkage on solidification, leading to more precise achievement of the desired
dimensions of the shaped article. A very high enthalpy prevents powder particles
located in the neighbourhood of the particles affected by the laser beam from beginning
to melt as a result of unavoidable conduction of heat, which results in sintering outside

38
the desired area. The suitability of polymer powders is a function of their physical
characteristics as well as their chemical nature [41]. Materials currently available for
SLS include:
Polycarbonate (PC)
Powders of polycarbonate are able to produce parts with very good dimensional
accuracy, feature resolution and surface finish, but they are only partially consolidated.
As a result, the parts produced from PC are only useful for applications that do not
require part strength and durability [42].
Nylon
Nylon (polyamide PA) is an aliphatic polyamide with a low monomer content in melt-
equilibrium, low moisture absorption and low density compared with other polymers. It
is not sensitive to stress cracking and has excellent impact strength at dry or low
temperatures, which makes this material desirable for rapid prototyping purposes. It is
the most commonly used material in SLS, producing parts with good long-term
stability, strength and durability required for functional testing and end-use. It can be
sintered to fully dense parts with mechanical properties that approximate those of
injection moulded parts [43].
Glass-filled nylon
Glass-filled nylon powder is characterised by excellent stiffness in combination with
good elongation at break. Still better parts are obtained by using glass bead-filled nylon
powder for use in deep drawing dies and within the engine area of cars. Glass bead-
filled nylon provides greater rigidity and is perfect when prototyping rigid parts

39
intended for production in advanced engineered thermoplastics. Adding the filler (glass
beads and not fibre) to nylon predominantly increases the stiffness, but not the strength
of the part [44].
Alumide™:
Alumide is a metallic grey aluminium-filled polyamide 12 powder, which is
characterised by its high stiffness, excellent dimensional accuracy, metallic appearance
and good post-processing possibilities. The surfaces of Alumide parts can be refined
very easily by grinding, polishing or coating. The machining of Alumide laser-sintered
parts is simplified through the cut breaking effect of the aluminium filling. A typical
application for Alumide is the manufacture of stiff parts for applications in automotive
manufacture, for tool inserts for injecting and moulding small production runs, for
illustrative models, for education and jig manufacture, among other aspects [45], [46].
Windform™:
This is a light grey composite polyamide-based material with added aluminium and
glass, with improved heat deflection temperature and superior stiffness, excellent
surface finish, wear resistance and first-rate detail reproduction. It offers an attractive,
gleaming metallic look, appreciable in many applications, such as in wind tunnels, in
design and functional applications. Moreover, it absorbs slightly less liquid and is
particularly suitable for applications which require a superior surface finish [47].

40
2.2. Fillers
Although the use of fillers in the plastics industry has been popular for several decades,
there is still a very large interest in all fields for the development of composite materials
with enhanced properties. Especially, high tech products accelerate the research of
advanced composites, which demand extensive knowledge of all the factors that
determine the final properties of polymeric composite materials.
Modification of organic polymers through the incorporation of fillers yields, with few
exceptions, multiphase systems containing the filler embedded in a continuous
polymeric matrix. The resulting mixtures are characterised by the unique
microstructures or macrostructures that are responsible for their properties. The primary
reasons for using fillers are:
- property modification or enhancement
- overall cost reduction
- improvement and control of processing characteristics
- reduced shrinkage
- improved crack resistance
- control of viscosity
Particle-filled polymer composites have become attractive owing to their low cost and
widespread applications in the household, automobile and electrical industries. In
general, the mechanical properties of particulate-filled polymer composites depend
strongly on the size, shape and distribution of filler particles in the matrix polymer, and
good adhesion at the interface surface [48], [49].

41
2.3 Coupling agents
Improving the interfacial adhesion between the inorganic particles and the polymer
matrix by modifying the filler surface is essential to achieved toughening of polymer-
matrix composites. The adhesion between polymeric materials and particulate fillers is
usually weak due to poor compatibility of the polymer with the mineral surface. In
order to increase the adhesion between these two unlike surfaces, it is logical to use a
third material containing special functional groups which can adhere to both surfaces.
To improve compatibility, adhesion promoters are commonly required [50] [51], [52].
The main role of coupling agents is to promote adhesion which will result in
developments in mechanical properties. The coupling agent functions as a molecular
bridge at the interface of dissimilar polymer binders and fillers, resulting in the
formation of covalent bonds across the interface, which subsequently improves the
properties of the composite system [52]. The most widely used coupling agents are the
silane coupling agents.
2.4. Interfacial adhesion
Adhesion is a complex phenomenon related to physical effects and chemical reactions
at the interface. Interfacial bonding conditions are one of the most important factors
that control the local elastic fields and the overall properties of composites. Imperfect
interfacial bonding may be due to damage in a very thin interfacial layer known as the
interphase or interface. The term “imperfect interface” is used to characterise a situation
in which the displacements are discontinuous at the interface between the inclusion and
the matrix. However, adhesion can be defined as a connection between two materials
which can transfer forces. This adhesion can sometimes be achieved or improved by the
use of an adhesive or coupling agent [53], [54], [55].

42
Basically, the properties of heterogeneous polymers composites are determined by four
factors, namely: component properties, composition, structure and interfacial
interactions. Interfacial adhesion is extremely important in all composites used in load-
bearing applications. Improper adhesion leads to the de-bonding of the components and
the development of voids which may merge into large cracks and lead to the premature
failure of the part.
The importance of interfacial adhesion is shown by the fact that a large number of
surface modification techniques are used in practice for all kinds of composites.
According to some authors, interfacial adhesion is the decisive factor in determining the
properties of composites. Appropriate adjustments of interphase properties and
adhesion strength are the most important conditions for achieving acceptable properties.
The debate also continues on the most proper adhesion strength in composites. Very
strong adhesion is claimed to lead to stiff and brittle composites, while in the case of
weak adhesion, the components de-bond under the effect of external load with the
consequences mentioned above. Medium or appropriate strength is claimed to be the
most advantageous; however, a quantitative value is never assigned to this claim [56].
In this context, an enhancement of mechanical properties can only be achieved by the
addition of a rigid filler if sufficient interfacial coupling exists for stress transfer
between the matrix and the particles. The interfacial adhesion can sometimes be
improved by the use of coupling agents. Great numbers of fillers are already provided
during fabrication with a coupling agent developed for the adhesion with a particular
matrix polymer.

43
2.4.1. Wettability
When two dissimilar materials are brought into intimate contact, a new interface is
formed at the expense of the two free surfaces in air. The nature of the interaction at the
interface determines the strength of the bond, which forms between the matrix and the
filler. The extent of these interactions is greatly determined by the wettability of one
phase by the other. The first criterion for good adhesion is intimate contact, which is
good wetting of the surface. However, wetting is a necessary, but not sufficient,
condition for good adhesion [57].
2.4.2. Mechanisms of adhesion
Adhesion is a phenomenon by which two materials form a contact region that is able to
sustain or transmit stress. There are a variety of mechanisms or factors that contribute
to the adhesion between two materials. These include interfacial Van der Waals forces
that lead to adsorption; interdiffusion of molecules across the interface; interfacial
chemical bonding and/or hydrogen bonding; mechanical interlocking and electrostatic
interactions [50].
However, mechanisms of adhesion are only operational if and only if effective wetting
is present between the phases. Adhesion generally occurs when the filler and the matrix
are held together by interfacial molecular contact in such a way that a unit is formed.
Following the outline of the review articles on the science of adhesion, four main
mechanisms of adhesion can be distinguished [51], [53]:
1) Mechanical
2) Chemical
3) Diffusion

44
4) Electronic
Basically, mechanical interlocking action occurs when the matrix bonds both
mechanically and chemically, onto the surface of the filler which contains pores, holes,
crevices and voids and solidifies during the solidification stage. In this manner, it acts
as a mechanical anchor. The penetration of the polymer melt or the coupling agent into
the irregularities of the filler surface can establish mechanical interlocking, where the
surface roughness greatly affects the interfacial area between the matrix and the filler.
However, the fact that good adhesion is also observed between smooth surfaces shows
that this theory is not generally applicable [53], [54].
The adsorption theory of adhesion is the most generally accepted theory in the field of
composite materials. This theory proposes that the materials will adhere because of the
forces acting between the atoms in the two surfaces. Two types of forces may be
present. The strongest or primary interfacial bonds are of a chemical nature (ionic,
covalent or metallic bonds). The formation of covalent chemical bonds across the
interface takes place between the matrix and filler surfaces. This type of bonding is the
strongest and most durable. The secondary, weaker bonds, also referred to as physical
interactions, cover the ever-present Van der Waals forces, dipole-dipole interactions
and hydrogen bonds which are the strongest of the secondary bonds and may play an
important role in the case of a polyamide 12 matrix [58].
The diffusion theory of adhesion explains adhesion of high polymers to themselves and
to each other by mutual diffusion of polymer molecules across the interface. This
theory could only be applicable to the coupling agent/matrix interface if the coupling
agent is a macromolecule or becomes one during the coating or extrusion process by
45
auto-condensation. Moreover, this theory requires the two components to be mutually
soluble and to have sufficient mobility [58].
The electronic theory suggests that adhesion can be obtained by electrostatic forces
arising from contact or junction potentials between two components with different
electronic band structures. This theory seems to be less useful for explaining the
interfacial adhesion in particle-reinforced composites because at least one of the two
components should have metallic properties.
2.5. Previous work on the relationship between part properties, fillers and
process parameters in SLS
Processing parameters and composite material properties were the two issues which
were initially explored to study the influence of filler content and its surface treatment
on the mechanical properties and geometric accuracy of laser sintered polyamide 12
with glass beads. Previous attempts to improve the mechanical or physical properties of
polymeric laser sintered parts have involved reinforcing them with micron-sized
inorganic fillers, such as glass beads, silicon carbide, hydroxyapatite, aluminium
powder, or even nano-sized fillers such as clay, nanosilica and nano-Al2O3 [4], [24].
However, the mechanical properties of the produced part were not solely controlled by
the base material itself; they were also influenced by the production process. Likewise,
to produce a high quality selective laser sintered part (in terms of dimensional and
geometrical accuracies), the process parameters need to be tuned up and optimised
according to powder properties and the requirements of application [59], [60], [61].

46
The issue of achieving geometrically accurate and mechanically robust parts by the
SLS process has been studied by a number of researchers in an attempt to enhance their
mechanical properties and quality and to enable their use in wider RP&M applications.
In conjunction with the development of the research presented in this thesis, the
following research areas were reviewed.
Several attempts have been made to study the effects of process parameters and filler
content on the mechanical properties of selective laser sintered parts. This work is
concerned with the mechanical properties and geometrical accuracy of parts sintered
from non-commercial glass bead-filled polyamide 12 composites (PA12/GB).
2.5.1. Mechanical properties of selective laser sintered parts
The influence of fabrication parameters on the material properties of SLS parts has
been investigated by Gibson and Shi [62]. In achieving this, they have carried out
experiments measuring the tensile strength and density of sintered samples produced
from fine nylon in different orientations with different fabrication parameters. They
showed that mechanical properties vary when different powders are used if similar
process parameters are selected. The porosity decreases and mechanical properties
increase when laser power increases and the scanning speed and scan spacing decrease.
They concluded that, besides powder material properties, fabrication parameters,
orientation and building position also influence the mechanical properties, where some
of these can be improved with post-processing as a compensation for some limitations
of the SLS process.

47
Wong et al. [63] studied the SLS of blended powder from PA12 and organically
modified rectorite (OREC). The effects of OREC on the sintering parameters and
mechanical properties of the sintered samples were investigated. Compared with pure
PA12, the results showed that the laser power needed for sintering greatly decreased
and the mechanical properties of the sintered samples were considerably improved with
the addition of OREC (0-5 wt%). Moreover, they concluded from the XRD and SEM
results that rectorite was intercalated by PA12 and PA12/ORCE nanocomposites were
formed.
Experimental investigations into the production of particulate silicon carbide (SiC)
polyamide matrix composites using the selective laser sintering process have been
conducted by Gill et al. [64]. SiC grit was blended with Duraform polyamide to
produce a powder blend at a composition of 50 by weight of grit to polyamide. A full
factorial experimental approach was applied to examine the effects and interactions of
key fabrication parameters, with regard to the tensile strength and porosity of the
composite SLS produced samples. Their investigation revealed that the optimum
energy density for producing samples of maximum strength was independent of the
initial powder blend composition. In another paper by the same authors [65], dealing
with the same composite, they showed that the tensile strength of the samples was
dependent not only on individual parameter settings but also on the interaction and
combination of fabrication parameters. Furthermore, they reported that the effects of
parameter changes are related to the initial powder blend composition and energy
density, with lower polyamide content resulting in greater sensitivity to process
parameters.

48
For SLS applications, Mozzoli et al. [66] developed and characterised a new
aluminium-filled polyamide powder from a rheological point of view. They reported
that the new material allowed SLS manufacturing of models with considerably high
dimensional accuracy, strength and resistance to mechanical stresses. Moreover, the
aluminium-filled polyamide material promised a smoother surface, better finishing
properties, excellent accuracy and high stiffness in the direct manufacturing of metallic-
looking plastic parts.
A study of mechanical anisotropy due to build orientation and the end-of-vector effects
in the laser sintering process was presented by Ajoku et al. [67]. In their investigation,
they used tensile, flexural and compression testing methods to assess the changes in the
mechanical properties of laser sintered nylon 12 samples. The results from the tests
showed that the build orientation of the samples had an effect on the mechanical
properties obtained. They reported that differences in the tensile strength, modulus and
flexural strength of samples built in the x, y and z axes were observed. They concluded
that the orientation of a part in the laser sintering machine is the primary variable which
affects its mechanical properties and the end-of-vector effect is a secondary factor
which is more prominent in parts with small x dimensions.
Another paper investigating the mechanical properties of parts produced via SLS has
been published by Caulfield et al. [59]. They investigated the influence of process
parameters (such as energy density, distance between scan lines and the speed of the
laser beam) on the physical and mechanical properties of polyamide 12 parts. They
performed tensile tests with a video extensometer to determine the mechanical
properties according to the standard ASTM D638 and compared all the results for 0 and

49
90 degrees of orientation of the parts. They took some SEM pictures to visualise the
fracture surfaces. The results of the tests showed that, as they related to the energy
density level, the material properties of samples generated at lower energy densities
were porous, weak and anisotropic, but became more isotropic, solid and stronger as
the energy density level increased. They generally showed that the mechanical
properties of parts are highly dependent on process parameters and part orientations.
Salmoria et al. [68] investigated the processing of blends of polyamide 12 (PA12) and
high-density polyethylene (HDPE) by selective laser sintering using a CO2 laser. They
studied the effect of components on elastic/plastic behaviour and evaluated the mixture
composition, processing conditions and their influence on the dynamic- mechanical
properties of the fabricated samples. The study demonstrated that the average value of
the elastic modulus of PA12 samples was higher than that of the HDPE samples.
Moreover, it showed that the low values of ultimate strength were an indication of low
chemical affinity between matrix and filler. On the other hand, the creep and fatigue
behaviour also changed as a function of the component quantities and the viscous-
dissipative behaviour of HDPE phase was observed, providing significant plastic
deformation and toughness.
Majewski et al. [69] have studied the effect of the degree of particle melt on mechanical
properties in selective laser sintered nylon 12 parts. They investigated the use of a novel
method of interpreting a DSC curve to indicate the level of melting within semi-
crystalline selective laser sintered parts, or the degree of particle melt (DPM). They
confirmed that changes in build parameters in the SLS process can cause variations in
the DPM. Furthermore, the results shown that, as the DPM increases, the tensile

50
strength and elongation at break also increase, whilst there is no significant effect on
the Young’s modulus. They concluded that their findings will enhance the ability to
optimise and predict the properties of the SLS process; furthermore, they showed that
the measurement of DPM has potential for use as a tool to enable the analysis of new
materials and machines by indicting how the material has melted.
Majewski et al. [23] proposed a method of off-line casting, where the tensile strength of
parts produced (from Duraform GF, which consists of a mixture of 50% nylon 12 and
50% glass filler) using this method were compared with the properties achieved in
selective laser sintered parts produced with the same materials. For materials tested, the
results demonstrated that the casting method provided an acceptable correlation with
the properties of the selective laser sintered parts, and the use of a manual casting
method can provide a relatively good indication of some tensile properties and help
with assessing the properties of selective laser sintering material without the
requirement to produce a full build.
Experimental investigations have been made by Jain et al. [70] to understand effect of
delay time on part strength in selective laser sintering. Tensile samples of polyamide
(PA 2200) material as per the ASTM standard were fabricated on an SLS machine
while keeping the delay time range constant for all the samples. An optimum delay time
range was found experimentally. They successfully developed an algorithm and
implemented it to predict part orientation for improved part strength by considering
delay time. They concluded that comparatively higher strength can be achieved by
orienting the part so that the maximum area on all layers falls within the optimum delay
time range.

51
The relationship between strength and the various process parameters, namely layer
thickness, refresh rate, part bed temperature and hatch pattern have been investigated
by Jain et al. [21]. Experiments were conducted based on the Taguchi method using an
L16 modified orthogonal array. Tensile samples of polyamide (PA2200) material as per
the standard ASTM D638 were fabricated on an SLS machine with constant energy
density and tested on a universal testing machine for tensile strength. The experiments
revealed that there was small range in part bed temperature within which parts with
desirable quality could be produced. They concluded that the results of their work will
help to understand the consequences of varying these parameters in an SLS process on
the quality of parts, production costs and processing time.
An experimental investigation was carried out by Jain et al. [71] to study the feasibility
of processing blended powder of polyamide (PA) and organically modified nanoclay
using selective laser sintering. The effect of nanoclay on the sintering parameters and
mechanical properties of the sintered samples were studied. The relationship between
the mechanical properties and a few important process parameters, namely beam speed,
laser power and scan spacing, was studied using Taguchi’s L9 orthogonal array. The
authors found that the addition of clay did not improve the mechanical properties of the
laser sintered polyamide; rather, it resulted in decreased mechanical properties. These
results suggest that it is feasible to process PA2200/clay blended powder using an SLS
process; however, for improving mechanical properties using such materials in an SLS
process, further investigations need to be made to find suitable conditions in view of the
partial melting of polyamide particles and the very short period of time involved in
processing.

52
Yang et al. [72] have developed a dissolution-precipitation process to produce
polyamide12/potassium titanium whisker (PTW) composites for applications in SLS.
They reported a new method for preparing polyamide 12 (PA12)/PTW composite
(PPC) powders for applications in SLS that uses a dissolution-precipitation process.
The sintering characteristics and mechanical properties of the PA12 powder, the glass-
filled PA12 (GF-PA) and PPCs were compared. Based on their results, they reported
that the sintering characteristics of PPCs were as good as those of PA12 and the
mechanical properties were greatly improved by PTW. The tensile strength, bending
strength and bending modulus of the composites containing PTW were much higher
than those of PA12 and GF-PA. PTW was much better than glass as a filler material for
PA12 in SLS. They concluded that fillers significantly contribute to improving the
tensile strength, bending strength and bending modulus of PA12 composites with little
effect on the impact properties.
Goodridge et al. [24] have presented initial research into the reinforcement of laser
sintered polyamides with carbon nanofibres (CNF). They investigated the effects of
CNF addition on the processing parameters and mechanical properties of laser sintered
parts and demonstrated that CNF can increase the strength of a base polyamide 12 laser
sintering polymer prepared using a melt-mixing technique. After the characterisation of
the polymer nanocomposite parts and dynamic mechanical testing, they reached the
conclusion that the nanofibres were well-dispersed within the polymer matrix and
increased the storage modulus compared to the base material. Improvements to the
production of the nanocomposite starting powder were required to use these materials
effectively with laser sintering.

53
2.5.2. Geometric accuracy of selective laser sintered parts
Raghunath and Pandey [73] studied the effect of process parameters on the process and
material shrinkage. They investigated the relationship between shrinkage and various
process parameters, namely laser power, beam speed, hatch spacing, part bed
temperature and scan length in SLS. Cuboids from polyamide with suitable dimensions
were fabricated rather than fabricating long parts along the X, Y and z directions in
order to study shrinkage, as it was expected that the shrinkage along the X, Y and z
directions is not independent. They found that scan length influences shrinkage in the x
direction. They derived empirical relationships for percentage shrinkage in terms of
scan length using the Taguchi method. However, they used scaling factors based on the
maximum dimensions, not on the individual scan lengths while compensating using the
model developed by them. The obtained results were validated and they were found to
be in good agreement with other experiments. They also showed that the shrinkage
model led to the development of more accurate parts.
The main goal in the study carried out by Senthilkumaran et al. [74] was to understand
the nature of shrinkage occurring in the SLS process to improve the accuracy of parts
produced from polyamide 12. They focused on the shrinkage behaviour by subjecting
the shrinkage calibration samples to varying conditions. They investigated the
variations in error patterns due to different strategies in building the calibration part and
reported that certain compensations other than shrinkage were needed to get an accurate
estimate of the shrinkage. They also found that beam offset, inertia of the scanning
mirror and positioning errors in hatch generations affected the shrinkage pattern.
Moreover, the results showed that the exposure strategies and part orientation
influenced the accuracy of the part to be produced. They concluded that investigations

54
on the shrinkage behaviour of plastic parts are likely to make the process of
compensation efficient and hence aid in improving the accuracy of the process.
Finite element analysis was used by Dalgarno et al. [75] in an attempt to model the
development of the curling phenomenon in the SLS of polycarbonate. They reported on
the use of finite element techniques to model curling. The model has been validated
through a comparison of the finite element results of experimental builds, and extended
to allow the influence of bases on the development of curling to be examined. The
result from their analysis of the effect of bases on curling showed a qualitative
agreement between the analysis and the experiments. They concluded that the
characteristic shape of components exhibiting curling is thought to arise from the
interaction of strain developed in the layer of the part during the build process and the
force of gravity.
Jamal et al. [76] have presented an analysis of curling development in the SLS of
polycarbonate. They reported on the use of finite element techniques to model curling
development in polymer materials, and particularly on the influence of viscoelasticity
on how curling develops. Their aim was to develop improved finite element models in
order to provide greater understanding of curling development using a coupled thermal
analysis. The development of time-dependent material models was reported. The results
of the implementation of these models were presented together with a comparison of
the results with experimental data. The analysis gave a qualitative insight into the
development of curling and the effect of viscoelasticity on this phenomenon.

55
In their study of the curling phenomenon in selective laser sintering of polycarbonate,
Berzins et al. [77] identified that the curling extends with different radii, particularly
closer to the edge regions of the part. Furthermore, they observed that curling occurs
with the sintering of the first layer and develops as further layers are added. The results
showed that densification, shrinkage and thermal stresses were the main factors
affecting curling.
2.6. Research gap addressed
None of the abovementioned studies considered the mechanical properties of laser
sintered plastic parts by investigating the relationship between surface pre-treated filler
and, in particular, the effect of coupling agents on the mechanical properties of
selective laser sintered glass bead-filled polyamide 12 composites. Currently, to the
best of our knowledge, no such studies have been reported for PA 12/GB composites
processed using the SLS technique. In the present work, a first attempt has been made
to address this by experimentally analysing the influence of coupling agents on the
mechanical properties of sintered components in polyamide 12 composites.
The same applies to warpage and curling phenomena. In most studies which have
reported on investigating curling, the finite element, based on thermal stress and heat
transfer analyses, was used to predict the development of curling on SLS polymer
materials, in particular polycarbonate. Furthermore, a review of the literature has shown
that the majority of research has been focused on shrinkage compensation, as well as
modelling the impact of thermal stresses and heat transfer on geometrical accuracy.
These investigations have mainly been based on properties of pure materials (rather
than composites) and processing parameters. Not much research work has been done to

56
examine the effect of material composition on curling which occurs in selective laser
sintered polyamide 12 parts.
In carrying out this work, tangible tools (such as the SLS process, testing equipment
and machines) as well as intangible ones (such as the design of experiments and
ANOVA) have been used to complete the research. These tools and the decisions
behind choosing them are a matter of discussion in different parts of this work.
In chapter 1, a summary of the most important rapid prototyping and manufacturing
techniques was given; however, selecting available RP&M process for a specific
application is a challenging task, which requires knowledge not only of the currently
available RP&M processes, but also an understanding of their capabilities, advantages
and drawbacks. In this thesis, the RP&M technology field is the broad table that
contains the area of concern. Within this large area of diverse processes, which vary
mainly in their respective deposition methods and materials, selective laser sintering is
the first step in narrowing the focus.
The availability of SLS machines (Sinterstation 2000, HQ2500, and EOSINT P 700),
materials (PA12, PA12/GF) and well qualified personnel at the Manufacturing
Engineering Centre (MEC) at Cardiff University was the first and foremost reason
which drove the selection of selective laser sintering technology for the work described
here.

57
2.7. Summary
This chapter has surveyed previous work related to the improvement of mechanical
properties and geometrical accuracy of selective laser sintered parts in order to establish
the foundations necessary to carry out this research.
The literature review reported in this chapter has led to the identification of a research
gap, which has been the guiding principle and central goal of this research project. In
addition to this, the methods, tools, materials and some related factors which can affect
the mechanical properties and geometric accuracy have been described.
In subsequent chapters, the possibilities for improving the mechanical properties and
geometrical accuracy of selective laser sintered parts will be presented.

58
Chapter 3 - Selective laser sintering of glass bead-filled polyamide
12 composites
For any manufacturing process, the accuracy and mechanical properties of the
components produced by the process will increase as the process and its parameters
become understood. The SLS process is no different in this respect. In order to master
well the SLS technology for sintering glass bead-filled polyamide 12 composites and to
optimise the process through the processing and material parameters, each new material
combination requires extensive testing.
Despite many materials which have been successfully used with the SLS process, there
is still a need to investigate new materials from the point of view of improved
properties and qualities. However, this can be expensive and time-consuming. The
development of analytical and numerical tools to simulate the SLS process can be
helpful to address the time and cost issue [27].
When developing a new material system for use with selective laser sintering
technology, optimisation of the process must be undertaken. It is also important to
understand the effects and interactions that fabrication parameters have on the material
properties of the final parts. A series of experiments aimed at achieving this goal,
focusing on the mechanical properties and geometric accuracy of SLS-processed
composite samples, are described in this work.

59
This chapter provides the background needed for subsequent chapters on the
investigation of mechanical properties and geometric accuracy of glass bead/polyamide
12 composites. It introduces the topic of determination of material and process
parameters, describes the pre-processing studies required and methods used, reviews
the factors influencing the process, and comments on the latest advances in the SLS of
polymer composites. The main focus is on polyamide 12 filled with hard inorganic
glass particles. To investigate the feasibility of producing sound parts from these
composites using the SLS process, an experimental study had to be carried out.
3.1. Materials details and characterisation
When developing a new material system for use with the SLS process, certain pre-
processing studies are required in order to check the feasibility of the material to be
used on the SLS machine. Before producing test samples of glass bead/ polyamide12
(PA12/GB) blends, a systematic study was carried out. The relevant material properties
of PA12 and PA12/GB powders were determined using well-known characterisation
techniques, such as differential scanning calorimetry (DSC), scanning electron
microscopy (SEM) and powder packing analysis.
Samples of unsintered and sintered PA12/GB composites were examined by Scanning
Electron Microscopy (SEM; ZEISS XB 1540 workstation) and Differential Scanning
Calorimetry (DSC 1 STARe System/ METTLER TOLEDO AG) to assess any
morphological, physical or chemical changes that had taken place during processing.

60
3.1.1. Glass beads
Glass beads (GB) are one of many types of filler used to prepare polyamide composites.
Glass beads have been widely used as fillers in thermoplastics for various industrial
applications because they can enhance load-bearing capability in the elastic
deformation range. This has motivated many researchers to investigate the effects of
glass beads on the mechanical properties and geometric accuracy of many filled
engineering polymers. As shown in Fig (3.1), the glass beads or microspheres are
classified into solid and hollow spheres with densities varying from 2.5 [g/cm3] to 0.1
[g/cm3]. Spheres clearly have no aspect ratio to provide reinforcement properties, but
their geometry affords important advantages in processing. They have the smallest
surface area of any shapes and therefore they have the smallest influence on viscosity
and melt flow. The unique shape of glass spheres also decreases high stress
concentrations associated with regularly shaped and sharp-edged particulate fillers that
result in severely reduced mechanical properties.
Depending on the specifications of the glass beads, the treatment (surface treated or
untreated) to which the beads are subjected before being mixed with the polymer
material and the bead/polymer quantity ratio, the presence of the glass beads can
facilitate processing of the composite material and can, in various respects, enhance
some mechanical properties and accuracy of the parts formed from the composite.
Additionally, due to the isotropic character of the composite, the mechanical properties
are more reproducible and more suitable for a mathematical description [54], [78].

61
Fig (3.1) Scanning electron micrograph of soda-lime glass beads (3000 solid spheres) [79]

62
However, the effects of glass beads on the mechanical behaviour of the composites are
highly dependent on the quality and the level of adhesion between the glass beads and
the polymer matrix. Fillers are mainly added into the polymer matrix for one or more of
the following reasons:
• reduced cost
• increased modulus (stiffness)
• reduced shrinkage
• improved crack resistance
• controlled viscosity
In this work, both surface-modified glass beads (3000CP03) and surface untreated
(3000CP00) with a diameter of 35 [µm] supplied by Potters Industrial Inc/Omya UK
Ltd. were used. The treated glass beads were already provided with a coating during
their production. This coating contained a silane coupling agent.
3.1.2. Silane coupling agents
Generally, the inorganic glass bead particles exhibit low interaction with the organic
PA12 matrix, which leads to poor adhesion of the filler to the matrix. Therefore,
improving the interfacial adhesion between the inorganic particles and the polymer
matrix by modifying the filler surface is essential in polymer composites [49]. The
adhesion between polymeric materials and particulate fillers is usually weak due to
poor compatibility of the polymer with the mineral surface. In order to increase the
adhesion between these two unlike surfaces, it is logical to use a third material
containing special functional groups which can adhere to both surfaces. To improve
compatibility, adhesion promoters are commonly required [30], [31].
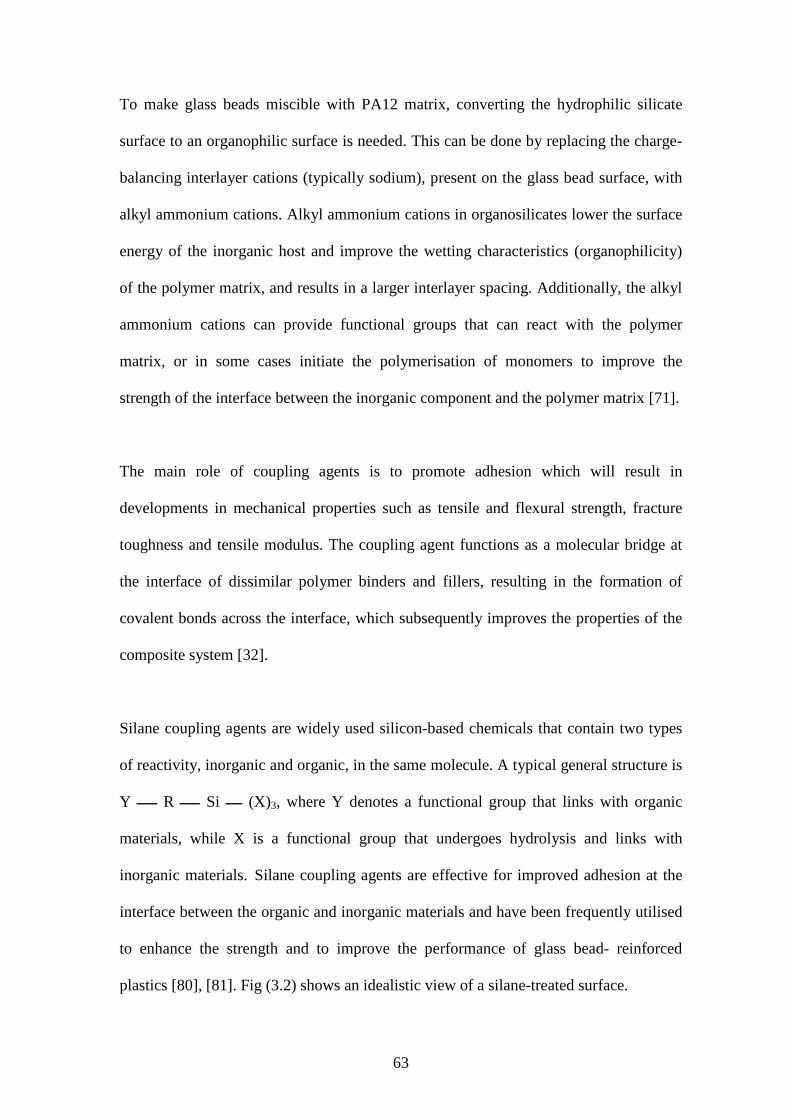
63
To make glass beads miscible with PA12 matrix, converting the hydrophilic silicate
surface to an organophilic surface is needed. This can be done by replacing the charge-
balancing interlayer cations (typically sodium), present on the glass bead surface, with
alkyl ammonium cations. Alkyl ammonium cations in organosilicates lower the surface
energy of the inorganic host and improve the wetting characteristics (organophilicity)
of the polymer matrix, and results in a larger interlayer spacing. Additionally, the alkyl
ammonium cations can provide functional groups that can react with the polymer
matrix, or in some cases initiate the polymerisation of monomers to improve the
strength of the interface between the inorganic component and the polymer matrix [71].
The main role of coupling agents is to promote adhesion which will result in
developments in mechanical properties such as tensile and flexural strength, fracture
toughness and tensile modulus. The coupling agent functions as a molecular bridge at
the interface of dissimilar polymer binders and fillers, resulting in the formation of
covalent bonds across the interface, which subsequently improves the properties of the
composite system [32].
Silane coupling agents are widely used silicon-based chemicals that contain two types
of reactivity, inorganic and organic, in the same molecule. A typical general structure is
Y ــــــ R ــــــ Si ـــــ (X)3, where Y denotes a functional group that links with organic
materials, while X is a functional group that undergoes hydrolysis and links with
inorganic materials. Silane coupling agents are effective for improved adhesion at the
interface between the organic and inorganic materials and have been frequently utilised
to enhance the strength and to improve the performance of glass bead- reinforced
plastics [80], [81]. Fig (3.2) shows an idealistic view of a silane-treated surface.

64
Among all kinds of coupling agents used to modify the surface of glass beads,
organofunctional silanes have been chosen because of their commercial availability and
the good results they offer. Silane coupling agents present three main advantages:
1. They are commercially available at a large scale.
2. At one end, they have alkoxy silane groups capable of reacting with OH-rich
surfaces.
3. At the other end, they have a large number of functional groups which can be
tailored as a function of the matrix to be used [50].
In addition, many investigations have shown that the silane coupling agent did not
significantly change the morphology of the sintered samples; however, it slightly
improved the strength of sample due to better adhesion at the filler/polymer interface
[82].
The silane coupling agents have little effect on the packing fractions of the glass
microsphere-filled composites. This is not surprising as the surface treatments did not
significantly change the size and shape of the filler. Nevertheless, the silane treatment
had little effect on the reflectance of the glass microspheres. This phenomenon can be
attributed to the fact that the silane layer is very thin and it does not significantly
change the surface morphology of the glass microspheres. Silane treatment of glass
microspheres had little effect on the reflectance of both the filler and the composite
powder as a whole [83].

65
Fig (3.2) Idealistic view of a silane-treated surface [83].

66
Mode of action
A silane coupling agent acts at the interface as a link between an inorganic substrate
(such as glass, metal or mineral) and an organic material (such as an organic polymer,
coating or adhesive) to bond, or couple, the two dissimilar materials together. In the
cross-linking process, the first step is generally the grafting of the silane to the polymer
backbone; second step is linking the polymer chains together via condensation of
silanols. Fig (3.3) reveals a simplified picture of the coupling mechanism [83].
Methods of applying silane
Since different materials are used for different applications, methods of applying
silanes to fillers should be chosen appropriately for each case. In the integral blend
method, silane is added to the mixture of filler and polymer followed by mixing. The
simplest and most effective laboratory treatment of particulate fillers is to mix the filler
with a dilute solution of silane in an organic solvent. In another method, silane is
submerged in water by stirring and after hydrolysing silane, glass beads are added to
the solution. This method is very effective for coarse fillers. However, a
monomolecular layer of silane on the filler results in optimal adhesion to the matrix
[52]. The optimum amount of silane can be calculated as follows (Eq. 3.1):
)/(
)/()()(
2
2
gmsilaneofareaspecificwetting
gmareaspecificfillerxgweightfillergsilane = …. (3.1)

67
Fig (3.3) Coupling mechanism of a silane coupling agent [83]

68
Operating temperature
Silane coupling agents can withstand temperatures of about 200 [◦C] and laser powers
of 50 [W]. These agents do not degrade, particularly in a nitrogen atmosphere, with a
short time of exposure to energy, which is the case in the processing chamber of
selective laser sintering machines. The physical and chemical data of the silane
coupling agent (according to the manufacturer) were:
- Boiling point > 68 [◦C] (DIN 51356)
- Flame point ≈ 93 [◦C] (DIN 51758)
3.1.3. Nylon 12
Nylons are an important thermoplastic silky material. They were first prepared by
Wallace Hume Carothers in the 1930s at Dupont, and first used commercially between
1938 and 1940. They are made of repeating units linked by peptide bonds (or amide
bonds) and are frequently referred to as polyamides (PA). Polyamides are crystalline
polymers with a number of advantages, such as higher modulus, strength, impact
properties, good processing properties and low cost. Parts fabricated from nylon have
excellent mechanical properties, very smooth surfaces and high accuracy. Nylon
usually used for the production of housings and thermally stressed parts. However, its
drawbacks (such as dimensional instability, shrinkage and notch sensitivity) are also
outstanding. Therefore, the modification and toughening of polyamide have received
close attention in recent years. Several methods for toughening PA have been proposed,
among which the usual methods making use of inorganic rigid particles such as glass
beads, mica, etc. [62], [57], [84].

69
Today, the production of prototypes (RP) and functional parts (RM) by SLS is basically
limited to nylon, the most researched polymer (polyamide PA), which has become
synonymous with SLS plastics. The base material used in this study was nylon 12
(polyamide 12, PA12) with an average particle size of 60 [µm], commercially known as
fine polyamide powder (PA2200), which was used in the SLS process (supplied by
EOS GmbH Germany). The chemical structure of nylon 12 is given below:
[NH (CH2)11 CO]n .
According to the properties required for selective laser sintering materials, nylon is well
suited for selective laser sintering, due to its relatively low melting temperature and low
heat conductivity, which facilitate a local limitation of the sintering process. This
material shows a large distance between its melting and crystallisation temperatures,
low melt viscosity and high surface tension. The almost spherical particle shape and
narrow particle size distribution of commercially-distributed powders maintain good
flowability and a high packing density of the powder [85].
At present, four nylon materials are commercially available for the SLS process,
namely standard nylon, fine nylon, fine nylon medical grade and nylon composite. The
production of nylon parts is generally cost effective when a small number of parts is
required. The material with best mechanical properties for producing functional parts
with the SLS process is a nylon composite. SLS glass-filled nylon can be processed to
near density and has a high modulus and good heat and chemical resistance [86].

70
3.2. Powder mixing and blend preparation
Mixing of powders is a common operation in the SLS process. In the production of
laser sintered parts, the distribution of particle sizes in the polymer powder is highly
important for producing parts of good quality. In the case of polymer blends, the
particle size distribution becomes even more important to assure that good mixing
occurs before the polymer melts. In the present work, a mechanical mixer was used for
blend preparation. The dispersion of glass beads in the powdered PA 12 was achieved
by the blending process using a portable drum mixer type BS 125 (speed of mixing
drum: 26- 30 [rpm/min]) for 30 minutes to produce the composites.
Mixtures of PA12/GB powders were produced by physically blending pure PA 12 and
glass bead powders in different weight percentages. In producing the blends, PA 12 was
the matrix material and the glass bead powders were added and dispersed into the PA
12 powder to achieve composite blends having 10, 20, 30 and 40 wt% glass bead
contents. Accordingly, eight powder blends (plus pure PA 12 powder) were prepared,
namely four blends of PA 12 with untreated glass beads (PA12/3000CP00) and another
four blends with surface-treated glass beads (PA12/3000CP03) in weight percentage.
Table (3.1) shows the mix ratios of the glass beads and PA 12.
The prepared powder blends were then processed on a commercial SLS system (DTM
Sinterstation 2000) to produce the test samples. Except for changing the process
parameters on the operating software of the SLS system, no modifications were made
to the SLS system for processing the PA12/GB composites. All of the experiments
described in this work were performed with PA 12 and PA 12 filled with glass beads.
This combination has been chosen as a model composite since it shows a number of

71
experimental advantages. Glass beads are easily dispersed in polyamide 12 by a
portable drum mixer. The spherical form of these fillers gives rise to distinct functions
and properties compared with other directional fillers. These include [74]:
1. high packing fractions, little effect on viscosity, and high attainable levels
2. better flow characteristics than high aspect ratio fillers
3. more uniform stress distribution around the spherical inclusions and better
dimension stability
4. no orientation effects and enhanced isotropy
5. reduced uniform and predictable shrinkage and less warpage
3.3. Powder and processing acquisition
3.3.1. Differential scanning calorimetry analysis
Differential scanning calorimetry (DSC) is a thermal analysis technique that is used to
investigate thermally-induced phase transitions. Semi-crystalline polymers exhibit a
first order solid/liquid phase transition; differential scanning calorimetry can be used to
determine the melting temperature range, the enthalpy or latent heat of melting, the re-
crystallisation temperature range and the enthalpy of fusion for semi-crystalline
polymers. The temperature at which the phase transition occurs and the breadth of the
transition are both heating rate-dependent; the higher the heating rate, the higher the
transition temperature and the wider the temperature range of the transition [10].
DSC measures the heat flow into or out of a material when it is heated, cooled or kept
at a constant temperature. The signal from the DSC measurement is heat-flow and it
can be calculated by multiplying the sample mass by the sample specific heat capacity
and the heating rate. The equation is written as:

72
Table (3.1) Contents of glass beads (coated and uncoated) blended with PA 12 by
weight
Glass beads [wt%] PA12 [wt%] Ratio [wt%]
0 100 0:100
10 90 10:90
20 80 20:80
30 70 30:70
40 60 40:60

73
Q = m .cp . β …. (3.2)
Where Q is heat flow
m is sample mass
cp is sample specific heat capacity
β is heating rate.
Therefore, an increase in the sample mass or the heating rate will, in turn, increase the
heat flow signal.
In this work, DSC analysis of PA12/3000CP00 and PA12/3000CP03 blends was
carried out on the DSC1 STARe System/METTLER TOLEDO AG. Samples weighing
11-18 [mg] were heated from 20 to 200 [◦C] at a heating rate of 10 [◦Cmin-1]. The
heating and cooling were carried out under the same conditions. Heating and cooling
curves are presented in Figs (3.4a; b) for the abovementioned systems.
It is well-known that a polymer powder with a slow re-crystallisation rate, with non-
overlapping or slightly overlapping endothermic and exothermic peaks during the
heating and respective cooling phases of the DSC analysis, might result in nearly fully
dense parts with minimal distortion, while highly overlapping peaks will yield bad
results. As depicted in Figs (3.4-a; 3.4-b), both systems have almost similar melting and
re-crystallisation peaks compared to normal PA12 powder Fig (3.5). A larger
temperature difference (dT) range between those peaks allows for a larger process
window in term of fluctuations of temperature in time and space within the processing
chamber and build part. The window of sinterability, that is, the difference between the
melting temperature and the crystallisation temperature of a material, is crucial in the
SLS process because sintering is completed in a very short period of time and the
difference in the two temperatures should be large enough [71], [87].

74
Fig (3.4) DSC curve for melting and crystallisation of: a) PA12/GB (PA2200/3000CP00) composite b) PA12/GB (PA2200/3000CP03) composite
a)
b)

75
It was found from the DSC analysis that the difference in the melting and crystallisation
temperatures for PA12/GB was within the prescribed limit and was almost same as that
found for PA12. From the DSC results, it was concluded that the PA12/GB blends
could be sintered using the SLS process. The melting temperature of the polymer,
around 170 [◦C], was taken from this graph and used with, glaze point (the temperature
at which the powder glistens as it starts to melts) to aid in the determination of the
required pre-heat and build temperatures for the powder bed.
DSC analysis showed that the melting temperatures of PA12 and PA12 with 40% glass
bead content, that is, PA12/CP00 and PA12/CP03 blends, respectively, were almost the
same. However, the heat of fusion (the area under the melting peak) was comparatively
higher for the PA12 blend with 40% glass beads. This might be the possible reason for
the slightly higher part bed temperature required for sintering in the case of PA12/GB
blends, despite the almost identical melting temperatures. It has also been observed in
the DSC analysis presented in Fig (3.4a; b) that the crystallisation temperature for
PA12/GB was slightly increased with a narrowed crystalline peak. This shows that the
glass beads increased the crystallisation rate of the composites. The majority of the
energy for fusing the matrix (PA12) was provided by the heaters located directly over
the powder bed. The powder temperature in the part build area should be slightly lower
than the melting point of the PA 12 (10-16 [◦C] below the PA 12 melting temperature,
Tm).

76
Fig (3.5) DSC plot of a virgin PA 12 powder [89]

77
3.3.2. Particle size; shape and distribution
Controlling the particle size distribution of powders is vital in order to deliver a final
component with the required properties. Particle size also affects the SLS process as
fine powders tend to exhibit poor flowability, partly because of their packing behaviour
(the particles interlock). The primary effect of particle size and shape on part accuracy
is on the trueness of features. Smaller particles with a high degree of sphericity produce
parts with sharper edges and corners and improved detail resolution.
Fig (3.6) shows a general view of PA 12 powder. It has particles in the size range of 20-
80 [µm] with near spherical shape and smooth surface. Figs (3.7) present the
micrographs taken for powder blend containing 30 [wt%] glass bead. GB particles in all
four powder blends were observed in increasing amounts with increased percentage of
GB content in the PA 12. It is worthwhile to note that regardless of the composition,
Optical Microscope observation of GB particles in all samples indicated that mixtures
with good dispersion and distribution of GB were obtained.
The PA 12/GB composites, PA12/CP00 and PA12/CP03, had average particle
diameters of approximately 32-63 [µm]. The shape of both the PA 12 and glass beads
particles was to a large extent spherical. A uniform mixture of the glass bead particles
with polyamide was clearly observed in all blends. The impact of filler content was
more subtle but, in general, parts built with a glass bead content of 10 [wt%] had
improved definition compared to parts build with filler contents of 40 [wt%]
composites.

78
Fig (3.6) SEM micrograph showing unsintered PA12 powder (Source FHSG-St.
Gallen)

79
Fig (3.7) General view of blended powder of PA12 with 30 [wt%] glass beads content

80
For SLS technology, it has been reported that the process resolution is proportional to
the inverse of the particle diameter cubed. This means that the resolution increases
substantially as particle size is reduced. Parts made with smaller particles have
improved definition as characterised by the sharpness of edges and corners; this is
particularly true for materials which undergo limited densification and melting in the
SLS process. For such materials, particle shape is not greatly altered in the SLS process
[90].
Further, it is generally believed that the effects of the filler particle size and distribution
on the mechanical properties of composites are very important, in addition to the filler
surface treatment. Fig (3.8) shows the distribution of the glass beads obtained by sieve
analysis (Analysette 3 Pro, Fritsch, Germany). It can be seen that the majority of glass
beads were in the 32-63 [µm] range which is the preferred range for SLS processing
[78].
3.3.3. Tapped bulk density of glass bead-filled polyamide 12 composites
For precise property control of sintered products, it is important to know the powder
characteristics, especially the packing density of the powder. In the selective laser
sintering process, one important characteristic is tapped bulk density, that is, the
maximum packing density of a powder or blend of powders achieved under the
influence of well-defined, externally applied forces. It mainly depends on a number of
factors including particle size distribution, true density, particle shape and cohesiveness
due to surface forces, including moisture. Therefore, the tap density of a material can be
used to predict both its flow properties and its compressibility.

81
Fig (3.8) Particle size and distribution of the glass beads used (Potters A glass spheres)
by sieve analysis [78]
Particle size [µm]
Dis
trib
utio
n [%
]

82
The tap densities of the composite powders were measured to quantify the packing
characteristics of the powders. In powder processing methods, the initial packing
density of the particles being consolidated is of significant importance; the higher the
initial packing density, the smaller the change in volume and the amount of energy
required to reach the desired relative density.
The density of a composite material can have dramatic effects on the global
performance of the component during use. The addition of a high-density filler will
subsequently increase the overall composite density. The composite samples used in
this work consisted of a PA 12 matrix loaded with varying amounts of solid glass bead
filler. The solid glass spheres were obtained from Potters Industries Inc., under their
registered trade name Spheriglass. The bulk density of PA12/GB composites was
measured using a simple method in which a measuring cylinder of a certain mass (157
[g]) was filled with water and weighed. After determining the mass of water using a
sensitive scale, the measuring cylinder was emptied then was filled again with a
composite powder and weighed. Raising and dropping the cylinder 20 times from a
height of about 25 [mm] onto a hard surface will normally give a consistent value of the
tapped density. This will align with the lightest condition of powder that is spread by
roller movement on the part bed in the selective laser sintering machine. After each
measurement, the sample was poured out of the cylinder and the cylinder was filled
again. The volume and weight were recorded and the tapped density was calculated.
Table (3.2) presents the measurement data of the tapped density of the composites.
One of several stages of composite analysis, however, was the determination of the
effect of the weight content of the filler to the density of the composite. Fig (3.9) shows

83
the relation between filler ratio and composite tap density and, as expected, the density
of the composites increased with increasing weight ratio of the glass beads.
3.4. Processing system
Processing of the composite powders was carried out on a DTM Sinterstation 2000
Laser Sintering machine, as described in chapter 2. In this commercial system, the
powder bed is pre-heated to a temperature just below the melting point of the composite
material. The laser is then used to tip the powder over this point and sinter the
composite material into a solid mass. The powder in the feed chambers is also heated to
a temperature below that of the powder bed so that when it is spread over the build
area, minimal provision of thermal energy is required [91].
The default operating parameters in commercial SLS systems, recommended by the
manufacturer for a specific powder, do not satisfy the demand of all applications.
Therefore, a trial-and-error method is often adopted to obtain suitable operating
parameters to satisfy the demands of a specific application. Several operating
parameters are critical for the SLS manufacturing process. Careful controls and
extensive empirical testing are usually required for a new material. In order to achieve
this, a number of parameters can be changed and varied on this machine to meet the
requirements and conditions of the processed composite material. The relevant machine
parameters to this work are defined as follows [91], [92] and [93]:
- Bed temperature [◦C]: Temperature of the powder in the build chamber (as recorded
by an infrared optical pyrometer).
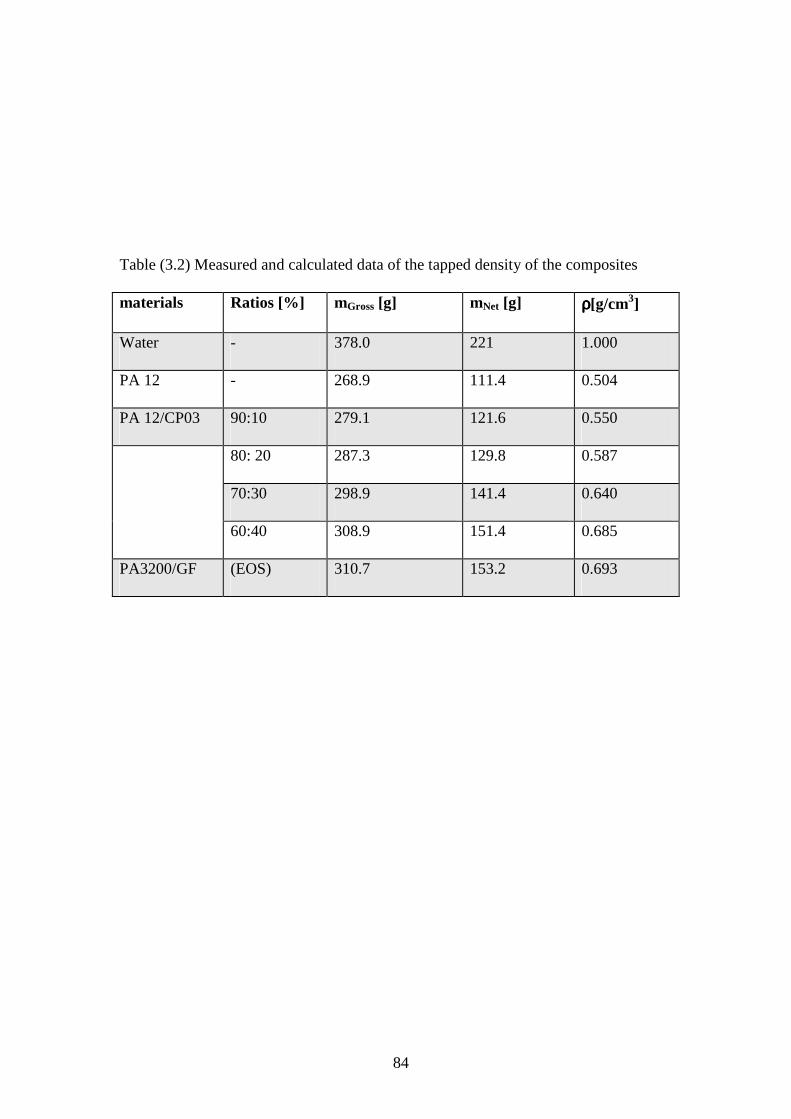
84
Table (3.2) Measured and calculated data of the tapped density of the composites
materials Ratios [%] mGross [g] mNet [g] ρρρρ[g/cm3]
Water - 378.0 221 1.000
PA 12 - 268.9 111.4 0.504
PA 12/CP03 90:10 279.1 121.6 0.550
80: 20 287.3 129.8 0.587
70:30 298.9 141.4 0.640
60:40 308.9 151.4 0.685
PA3200/GF (EOS) 310.7 153.2 0.693
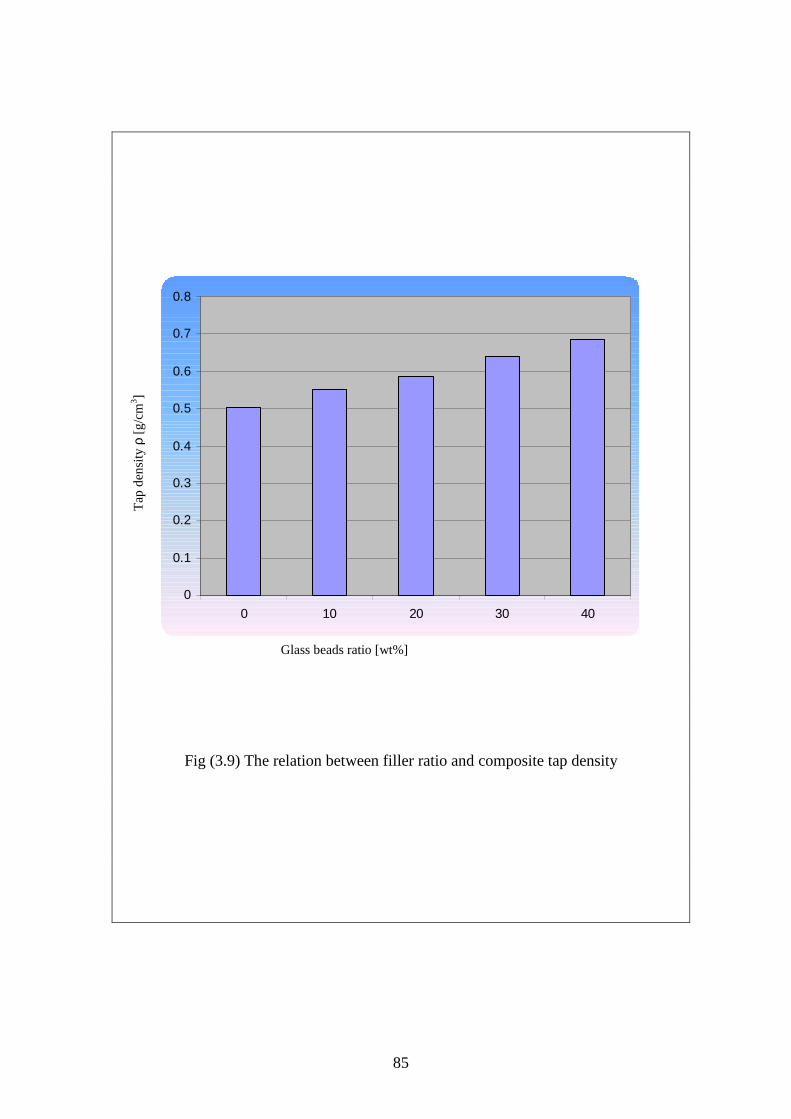
85
0
0.1
0.2
0.3
0.4
0.5
0.6
0.7
0.8
0 10 20 30 40
Fig (3.9) The relation between filler ratio and composite tap density
Glass beads ratio [wt%]
Tap
den
sity
ρ [g
/cm
3 ]

86
- Feed temperature [◦C]: Temperature at which the powder is stored in the feed
chambers before being spread across the build area (as recorded by an infrared optical
sensor).
- (Fill) Laser power [W]: Applied power of the laser as it scans the area of each layer.
- Roller speed [mm/s]: Velocity at which the roller travels as it spreads the powder over
the build area.
- Rotate scan order: when selected, it sets the laser beam to alternate between the parts
every other layer, rather than just at the first part nested in the build bed.
3.4.1. Laser sintering trials
It is a well-known fact that for every new material, all parameters of the SLS machine
need to be tuned. Therefore, the material needs to be characterised before building the
SLS parts. Certain common characters of the material powder are also needed for the
successful and good SLS processing. In order to establish suitable parameters for
processing glass bead-filled polyamide 12 composites, a range of processing conditions
were attempted as outlined in this section.
Basically, laser scan speed is one among many important parameters in laser sintering.
The operating system of Sinterstation 2000 does not allow for varying scan speed, and
thus this was kept constant at 914 [mm/s]. Other parameters, including a laser scan
spacing of 0.15 [mm], a roller speed of 127.0 [mm/s], a layer thickness of 0.1 [mm] and
laser beam diameter of 0.4 [mm] were also kept constant.

87
3.4.1.1. Preheating process and part bed temperature
In the selective laser sintering process, the powder is fused and processed into a part by
applying heat energy. Preheating of the powder on the surface of the powder bed is an
important process which guarantees that parts can be successfully fabricated and which
influences the accuracy of parts fabricated using SLS technology. The uniformity of
temperature on the powder bed influences the accuracy and performance of parts. It is
necessary to understand the influences of the parameters of preheating set on the
uniformity of the temperature on the surface of the powder bed. The initial step in the
process was to determine the best operating parameters for the composite powder: laser
power, feed temperature and part bed temperature. These critical parameters were kept
constant for all of the future builds to provide consistent heat input to the powder.
However, these parameters can vary from machine to machine [94], [95].
Before sintering the samples, approximate bed and feed temperatures should be
determined by observing the flow of powder across the build area as it is spread by the
roller. This was carried out initially at five degree intervals between 80 and 95 [◦C] for
feed temperature and at two degree intervals between 170 and 178 [◦C] for bed
temperature, and then at one degree intervals as the temperatures became closer to the
optimum. The most appropriate combinations of bed temperature, feed temperature and
laser power that could produce good parts in terms of mechanical properties and
geometrical accuracy, as determined by uniform powder flow and a smooth powder bed
coupled with an unhardened powder cake, were then used to produce test samples and
conforming parts.

88
During this investigation, several key SLS operating parameters had to be tuned to
produce parts of sufficient quality and improved mechanical properties. The glass bead-
filled polyamide 12 composites were given a 2-4 [hr] warm-up period, similar to that
recommended for commercial polyamide 12 materials. Twelve millimetre layers were
then rolled over the build area prior to sintering, adding further heat to the system.
During this first stage, the process chamber was gradually preheated and the part bed
temperature was increased.
Five cross-shaped parts (Fig 3.10), four at the four quadrants and one at the centre of
the build cylinder, were fabricated on the SLS machine. The process was started at a
temperature of 170 [°C] and a laser power of 6 [W], where the initial layers were
carefully observed for curling. If curling occurred, the part bed temperature was
increased by 1-2 [°C] and the whole process was repeated until the suitable part bed
temperature was found. In the case of glass bead-filled polyamide 12 powders, the part
bed temperature was found to be slightly higher as compared to that for the pure
polyamide powder. Table (3.3) shows the modification limits of the composite
materials and the SLS process parameters and summarises the observations and results
while finding suitable part bed and feed temperatures for various powder mixtures.
The temperature in the areas of the two powder cartridges was held at a low enough
temperature between room temperature and the temperature in the part build area so the
powder remained free-flowing and could be spread by the roller during SLS processing.

89
Table (3.3) Modification limits of composite materials, SLS process parameters and the
effects of part bed temperature
Bed temp.
[◦C]
Feed temp.
[◦C]
Laser power
[W]
Rotate scan order Material [wt%]
170–180 80–95 6–18 1 (On) 0 -40
0:100 10:90 20:80 30:70 40:60
Observations Powder bed temperature (Feed temp.) [◦C]
Parts warp seriously and shift when the powder spreading
recoater passes over
170
(80)
170
(80)
170
(80)
170
(80)
170
(80)
Parts warp and shift 172
(85)
172
(85)
172
(85)
172
(85)
172
(85)
A slight warp, no shift 174
(90)
174 174
(90)
174
(90)
174
(90)
Satisfactory parts with smooth surface 176
(90)
176
(90)
176
(90)
177
(90)
177
(90)
Powder surrounding parts agglomerates slightly during
sintering, and it is difficult to remove unsintered powder
178
(95)
178
(95)
180
(95)
180
(95)
180
(95)

90
Fig (3.10) Cross-shaped test samples used to find suitable bed and feed temperatures

91
If the powder temperature was set too high in the powder cartridge areas, the powder
clumped together and did not spread evenly during SLS processing. Moreover, the
surface of the part or powder bed cracked open on the surface and was streaked with
lines as the roller moved across it due to an excessive heating rate or temperature from
the heaters and due to partial melting of the powder which resulted in short feed or no
feed, Fig (3.11). The measures to be taken in this case were a gradual reduction to the
heater setting and waiting for the system to add a few layers. The temperature was
repeatedly reduced until the cracking disappeared. However, to produce geometrically
accurate and mechanically robust parts by SLS, a balance must be struck between
maximising the temperature to increase part density and minimising the temperature to
maintain geometric accuracy.
In order to minimise thermal distortion and facilitate fusion to the previous layer, the
entire bed is heated to a temperature just below the melting point of the material which
is done prior to the commencement of sintering. The laser is modulated in such a way
that only the grains which are directly exposed to the beam are affected, and heating is
done to a level such that the surface tension of the particles is overcome and they fuse
together [96].
Too high bed temperature (above 178 [◦C]) caused growth of the part as the
surrounding powder bonded to the desired boundaries of the part. Growth is caused by
heat transfer from the consolidated part to the surrounding support powder. Growth
(Fig. 3.12) occurs as powder sinters on the part, blurring features and altering part
dimensions. It is particularly apparent with small features or small holes.
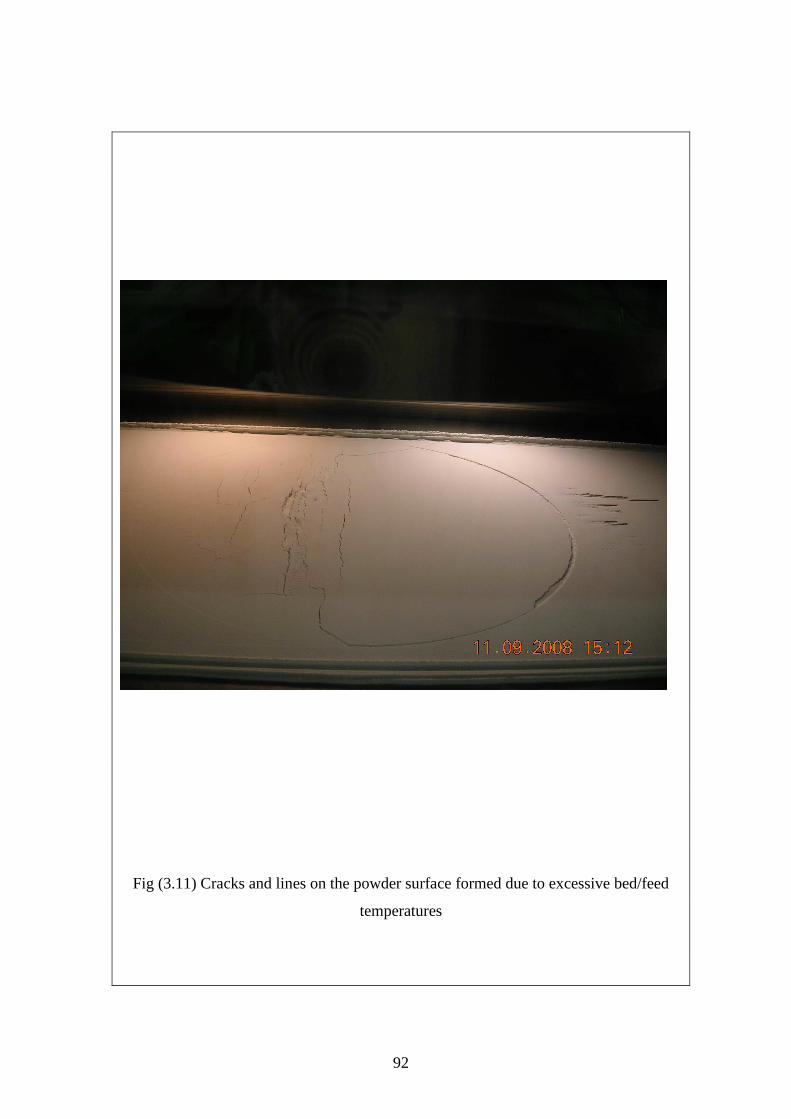
92
Fig (3.11) Cracks and lines on the powder surface formed due to excessive bed/feed
temperatures

93
The sintered parts become difficult or even impossible to break out due to a caking
phenomenon in which the powder particles stick together and a large amount of the
powder forms as a lump. Reduction of the part heater set point parameter and laser
power parameter was necessary to eliminate growth and prevent powder from caking.
On the other hand, too low a bed temperature (below 170 [◦C]) caused the lased
composite to shrink significantly from the surrounding bed, which resulted in
movement of the part on the subsequent pass of the roller. Moreover, the phenomenon
of curling was observed in this case when the part bed temperature was too low.
Curling is a phenomenon in which the sintered layers become non-planar due to a high
thermal gradient between the sintered and unsintered powder material. In-build curling
occurs when the edges or corners of the part rise above the powder bed surface, mainly
due to uneven temperature distribution in the part bed when the part temperature dips
too low after the feed powder is added (chapter 5). As shown in Fig (3.13), in-build
curling can cause the part to shift when the roller passes over the part bed.
The investigation of pre-heating and part bed temperature showed that, when the
powder bed temperature was kept close to the powder melting temperature, relatively
low heat input from the laser beam was sufficient to sinter the powder. Therefore, the
sintering process must be performed at a part bed temperature as close as possible to the
melting temperature of the composite material. This shows that the selection of a
suitable part bed temperature is very important to facilitate successful sintering as well
as to ensure the reuse of the unsintered powder material. A suitable part bed
temperature was found by conducting a typical cross test [71], [97].

94
Fig (3.12) Growth on sintered samples

95
Fig (3.13) In-build curling causes the part to shift when the roller passes over the part
bed

96
3.4.1.2. Shrinkage scale factors and laser beam offset values
Beam offset calibration and shrinkage compensation are two of the most important
parameters that affect the part building accuracy of the SLS process. Beam offset
includes the diameter of the laser spot, the heat-affected area and the deflection angle
during the laser scan. It differs from one sintering to another [98].
It is not difficult to conclude that accuracy is material- and also machine-dependent.
During the whole fabrication process, the samples shrink along the X, Y and Z
directions. In order to compensate for this shrinkage, the input part geometry is
modified applying scaling factors in the X, Y and Z directions correspondingly.
Shrinkage depends very much on part geometry and its orientation during laser
sintering. The inside and outside surfaces are offset to compensate for the size of the
sintering spot of the laser beam (beam offset) [99]. The right selection of the scaling
factors and beam offset determines the extent to which the systematic factors due to
input data can be compensated; Table (3.4) presents the experimentally obtained scale
factor and beam offset for PA12/GB composites, where Fig (3.14) illustrates the
calibration procedure of beam offset and shrinkage compensation.
Selective laser sintered part accuracy is influenced by a number of machine and
material characteristics. Crystalline or semi-crystalline materials exhibit high shrinkage
associated with both the material phase change and the high degree of consolidation
obtained during processing, but the amount of growth is usually limited by relatively
low laser powers which are required to completely melt the material [81].

97
Table (3.4) Scale factor and beam offset for PA12/GB composites
X, Y offset & Z compensation [mm] Shrinkage scale factor [mm]
fill outline
X 1.01809 0.194 0.000
Y 1.02304 0.160 0.000
Z 1.02000 0.127 -

98
Fig (3.14) Flow chart of beam offset and shrinkage calibration procedure
Laser sintering process
Sample break out & cleaning
process
Measuring process
Output dimension
Calculate shrinkage and beam
offset
Input dimension

99
Nonetheless, some of the most significant sources of error are associated with laser
beam positioning on the part bed surface and uncertainty in the calibration factors used
to compensate for material shrinkage and growth as well as the finite width of the laser
beam. Another source of error is the minimum resolution of the process, which is
dependent on the particle size and the shape of the material. However, it is well-known
that there are dimensional changes associated with material shrinkage and growth
during the fabrication of SLS parts.
Software is available to compensate for these effects, given the proper scale and offset
values. The scale and offset procedure includes the building and measurement of
purpose-built parts, (Fig 3.15) that contain nominal dimensions. However, while
software is used to compensate for the dimensional changes associated with material
shrink and growth, the best accuracy is usually obtained when these compensations are
small. From a practical standpoint, the effects of growth and finite beam diameter on
part accuracy are indistinguishable since they both cause a constant increase in part
dimensions [90].

100
Fig (3.15) Calibration standard part built and measured to calculate shrinkage scale
factor and beam offset values for the composite materials.

101
3.5. Characterisation of laser sintered samples
Process parameters are the pre-defined values that control the sintering of the powders
during the SLS process. The mechanical properties and geometrical output of the laser
sintered parts are all influenced by the quantity of energy delivered to the powders.
Selective laser sintering part accuracy has been reported in a number of studies. In
nearly all of these studies, accuracy has been reported as the deviation of measured
dimensions from the desired dimensions. However, other components of accuracy are
also important to users of these technologies. In particular, trueness of features as
characterised by the sharpness of corners and edges and detail resolution is quite
important as is the ease of part fit and assembly.
3.5.1. Geometric definition
Process parameters are the defined variables that influence and control the SLS process.
A number of parameters (some user-defined and others defined by geometry or material
consideration) affect the quality of parts fabricated. The response of the SLS process is
usually described by the geometry and mechanical properties of the object produced.
Geometric problems such as curling, shrinkage, growth and poor edge definition and
the physical properties such as density, strength and degradation are all influenced by
the quantity and timing of energy delivered to the part surface.
Processing PA12/GB composites with laser powers below 8 [W] was not sufficient to
provide enough structural integrity for the parts to be handled. They did not sinter the
particles sufficiently to a degree that would allow removal from the machine. At the
optimum bed temperature, in terms of ease of removal from the powder cake, spreading
of powder, etc., a laser power between 8 and 10 [W] was found to be suitable. Laser

102
power above 18 [W] caused the lased material to degrade significantly. However, even
for parts built in the 16-18 [W] range, poor definition was seen around the outline of the
parts due to the conduction of heat into the surrounding supporting powder, Fig. (3.16).
To investigate the geometric and dimensional accuracy, purpose-designed parts were
manufactured. Two pairs, male and female, of sintered parts were fabricated from
PA12/GB composites using various bed temperatures, laser powers and filler content.
As shown in Fig (3.16-a) one pair of the parts contains a series of small ribs, slots and
hols, while the other pair (Fig 3.16-b) possesses slots, bosses, ribs, circular and
rectangular shapes. After the parts were fabricated, each part was measured using
digital calliper. Furthermore, the suitability for the facility of assembly, the geometric
accuracy after assembly and the manufacturability of sub-milliscale features were
checked.
The assembly process of pairs fabricated using 8 [W] was carried out easily without
any post-working; the parts were fitted in with each other firmly. Milliscale features on
pairs produced applying a laser power of 10 [W] were fairly fitted in with each other,
while the sub-milliscale features were not present or difficult to assemble. The
dimensional accuracy first decreased with increasing laser power and reached the
lowest level at a laser power of 18 [W].

103
Fig (3.16) Parts for investigating the manufacturability of small-scale features in the
SLS process:
a) A pair with series of small ribs, slots and holes
(b) A pair with slots, bosses, ribs, circular and rectangular shapes
a)
b)
104
3.5.2. Visual observation and evaluation
A visual observation was made to describe the surface geometrical accuracy with
comparison to the CAD files. After the samples were broken out from the powder cake,
cleaned up and sandblasted, they were visually inspected and photographically
recorded. A subjective evaluation was used to determine the quality of parts produced
under varying conditions (bed and feed temperatures were kept constant, laser power
was varied) on a run-by-run basis. The evaluation was used to judge the effect of
processing parameters on glass bead-filled polyamide 12 composites in terms of surface
finish and features definition. The evaluation was performed as a qualitative
assessment.
As the first look, the parts fabricated applying laser powers of 8 and 10 [W] were
complete and almost identical to the CAD model. This means that these laser powers
and the corresponding processing parameters (bed temperature of 176 [◦C], feed
temperature of 95 [◦C]) were generally suitable in producing accurate parts. The other
samples fabricated using relatively higher laser powers (12-18 [W]) had many missed
details and blurred features, as shown in Fig (3.17). Further, an effect of glass bead
content and shape on part accuracy (the trueness of features) was observed. A lower
content of glass beads (0-10 [wt%]) produced parts with sharper edges and corners and
improved detail resolution compared to similar parts with a relatively higher content
(40 [wt%]). In addition, visual evaluation of parts from the builds indicated that the
surface finish was excellent for the builds from composites containing 0-20 [wt%] glass
beads, and was acceptable for the builds with 30-40 [wt%] glass beads. However, the
glass beads had a small average particle size (35 [µm]) compared to the commercial
PA12 laser sintering powders (50-60 [µm]), which had a nominal effect

105
Fig (3.17) Samples for visual inspection of features definition based on bed
temperature, laser power and filler content

106
on the surface finish of the produced parts, observed by the naked eye. Fig (3.18) shows
parts with good and acceptable surface finish.
3.5.3. Density measurements of sintered density samples
It is well-known that the density of selective laser sintered components has an
important influence on the mechanical properties. Regions in the material which are not
fully consolidated have a lower mass/volume ratio leading to lower absolute strength at
stiffness values. Also, stress concentrations are more likely to occur in these regions,
leading to crack initiation and failure [100].
A nearly full relative density is one of the most important properties required for
functional parts. The aim of SLS is to attain high density parts, which need suitable
SLS process parameters. Many parameters affect the quality of sintered parts, including
sintering material properties, powder properties, the specifications of the SLS machine
and process parameters, such as laser power, scan speed, scan spacing and layer
thickness. But once the SLS machine is certain and the sintering powder has been
selected, the main factors affecting part density are the process parameters. It must be
pointed out that the sintered part from powder is porous and its density represents its
quality. Though part quality should be evaluated by a combination of mechanical
properties, sintered part density is the most important factor. In comparison of a half-
density part to a full-density part, the former is inferior to the latter in terms of
mechanical properties and surface quality. Therefore, density prediction of SLS parts
provides suitable guidelines in the selection of appropriate process parameters. As
mentioned above, sintered part quality can be evaluated by its

107
Fig (3.18) Comparison of part surface finish and appearance between parts with
different glass bead contents. a) Part contains 40 [wt%]; b) part contains 10 [wt%]
a)
b)

108
density and SLS process parameters, include laser power, scan speed, scan spacing and
layer thickness [101].
The density of the PA12/GB composites was found by building density samples under
the same conditions as the other testing samples. The density samples were small
square prisms with the intended dimensions 20 x 20 x 5 [mm3]. Once the density
samples were built, their dimensions were determined manually by measuring with a
digital calliper and they were weighed as shown in Table (3.5). Subsequently, the
apparent density was found by dividing mass by volume. The average density of the
sintered samples was 0.92 [g/cm3] obtained from six measurements. Fig (3.19)
illustrates the dependency of the weight of the density sample on energy density.
The addition of glass beads with different fractions to the PA 12 matrix affected the
density of the PA 12, which could be varied systematically in accordance with other
processing parameters. The density (ρ) usually increases during sintering and the
density of the produced part is usually higher than the powder density, but it is
generally believed that the porosity of the powder material can not be completely
eliminated. Furthermore, it is often occurs that powder temperature within the area of
the part cylinder of the SLS machine is not uniform because of the nature of the powder
bed heating temperature system. As a result, this affects the density of the sintered parts
being produced, which in turn also affects the mechanical properties and the accuracy
of the parts.

109
Table (3.5) Measured data of sintered density samples
Energy density
[J/mm2]
l
[mm]
w
[mm]
h
[mm]
m
[g]
V
[mm3]
ρ
[g/cm3]
0.058 20.64 20.64 5.74 2.2 2445.3 0.90
0.073 20.46 20.46 5.56 2.2 2327.5 0.94
0.087 20.24 20.24 5.40 2.1 2212.1 0.95
0.100 20.04 20.04 5.17 2.0 2076.3 0.96
0.117 20.40 20.40 5.48 2.0 2280.5 0.88
0.131 20.43 20.43 5.75 2.1 2400.0 0.87

110
1.9
1.95
2
2.05
2.1
2.15
2.2
2.25
0.058 0.73 0.087 0.1 0.117 0.131
Fig (3.19) Weight of density samples sintered using various energy densities
Energy Density [J/mm2]
Wei
gh
t [g
]

111
As it illustrated in Fig (3.20), the density increased with increasing energy density. This
can be explained by the fact that higher energy densities cause a better fusion of the
powder particles, resulting in a more solid part being formed. Applying too high a laser
power not only causes heat to be conducted into the powder bed, melting the
surrounding powder particles in addition to those actually targeted by the laser, but it
also leads somewhat to degradation of the material composite. However, it was found
that the relationship between energy density and part density was not linear. This may
possibly be due to the inconsistent variation of heat conditions in the part bed and
sample position/location [91].
Part density has been found to increase with bed temperature, so the aim was to keep
the part bed temperature as high as possible. The experimentally obtained results show
that at a powder bed temperature of 176 [°C], a nearly full density, 0.92 [g/m3], can be
obtained at an energy density of 0.058 [J/mm2], while it decreased by powder bed
temperature below 172 [°C], at same energy density. This means that the powder bed
temperature, beside other factors, affects the density of the sintered samples. From the
result of these experiments, it can be concluded that powder bed temperature affects the
density of sintered parts. The lower the powder bed temperature, the lower the sintered
part density. However, even with the abovementioned measures, it is very difficult to
produce parts with exactly the same densities.
3.6. Design and fabrication of test samples
A switch to test samples production can first be conducted when preliminary
experiments are complete and the various procedures have been established. Based on
the above discussed pre-sintering studies, the test samples were produced as described

112
0.82
0.84
0.86
0.88
0.9
0.92
0.94
0.96
0.98
0.058 0.073 0.087 0.1 0.117 0.131
Fig (3.20) Influence of energy density values on the density of sintered density samples
Energy Density [J/mm2]
Den
sity
[g
/mm3 ]

113
in chapter 4. The test samples were designed according to different British standards for
the examination of mechanical properties and an investigation on geometrical accuracy.
The CAD model of the test samples was generated using standard CAD software
(Magic software, version 7.5) and exported in the STL file format for uploading into
the SLS system. Prior to experimenting with PA12/GB composites, pure PA12 was first
subjected to laser sintering at different laser powers and bed temperatures. The aim was
to establish a set of suitable processing parameters for subsequent processing of the
PA12/GB composites. Experiments were carried out to obtain the optimal parameters
of SLS and the composition of the composite for successful fabrication.
Using the parameters determined previously, test samples of polymer blends
comprising GB and PA 12 were then fabricated on the SLS machine to be used in
comparison with pure PA 12. By varying the process parameters (laser power and part
bed temperature) and filler ratio, nine groups of samples comprising different blends of
PA 12 and GB were fabricated. The nine groups were pure PA 12 and physically
blended PA12/GB composites (uncoated and surface coated) consisting of 10, 20, 30
and 40 [wt%] GB. The range of laser power and the part bed temperature settings for
fabricating the various samples are tabulated in Table (3.6). Testing of samples for
mechanical properties was carried out on a Testometric Materials Testing Machine AX
(M350– 5kN) and a Pendulum Impact Test Machine Type (W&T AVERY Ltd.).
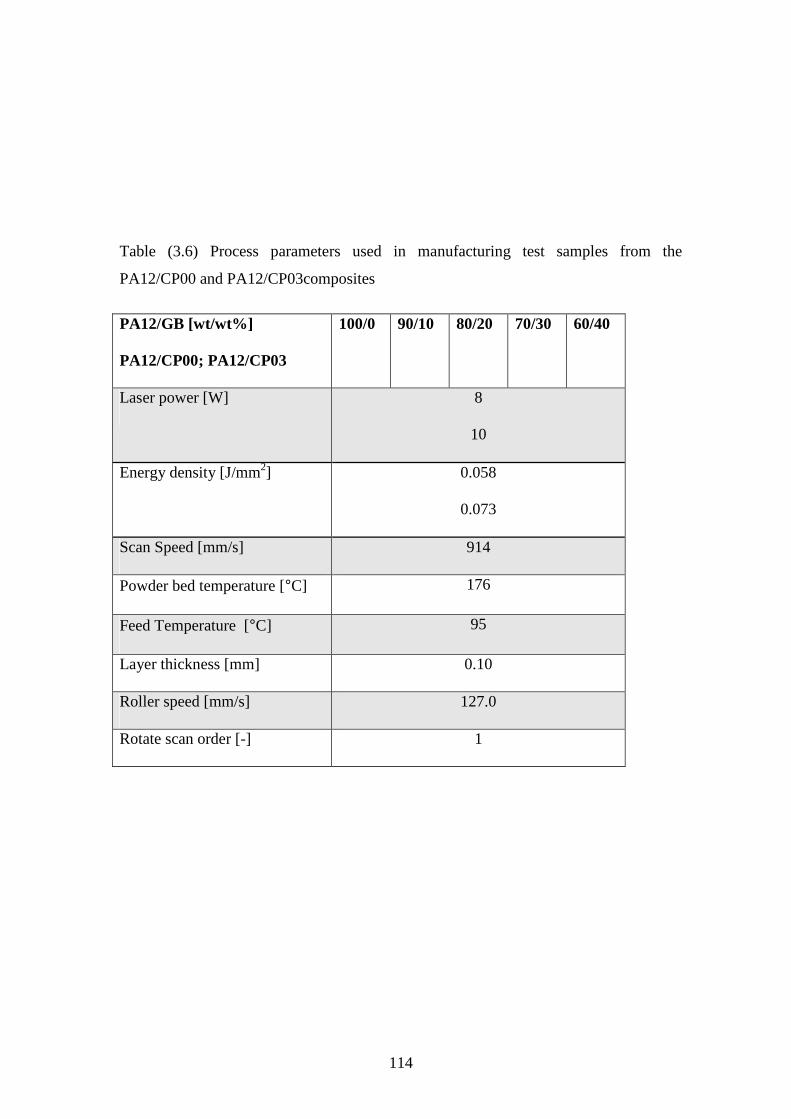
114
Table (3.6) Process parameters used in manufacturing test samples from the
PA12/CP00 and PA12/CP03composites
PA12/GB [wt/wt%]
PA12/CP00; PA12/CP03
100/0 90/10 80/20 70/30 60/40
Laser power [W] 8
10
Energy density [J/mm2] 0.058
0.073
Scan Speed [mm/s] 914
Powder bed temperature [°C] 176
Feed Temperature [°C] 95
Layer thickness [mm] 0.10
Roller speed [mm/s] 127.0
Rotate scan order [-] 1

115
3.7. Summary
This chapter has provided a description of the composite materials and process
parameter data, obtained from preliminarily experiments, needed for the subsequent
chapters on the investigation of the mechanical properties and geometric accuracy of
glass bead/polyamide 12 composites. Material properties play an important role in
determining fabrication parameters and affect the mechanical properties and geometric
accuracy of SLS components. The glass transition temperature Tg and melting
temperature Tm are two important factors for determining part bed temperature and
laser power.
In this chapter, different powder bed temperatures, laser power settings and powder
constitutions were applied to determine the most suitable processing temperature for the
PA12/GB composites. A higher bed temperature and energy density generally result in
better fusion of the polymer matrix particles. They enable the production of a more
compact structure and near fully solid, dense parts with a smooth surface. However,
when these parameters become excessively high, numerous phenomena, such as
curling, caking, growth and polymer degradation problems are accordingly observed.
A DTM system Sinterstation 2000 machine was used for conducting experiments on
PA 12 and PA12/GB composites with different weight contents of glass beads (10-
40%) with and without surface treatment. The optimal parameters for selective laser
sintering of these composites were experimentally determined. Optical Microscopy and
Scanning Electron Microscopy (SEM) were used for characterising the powder material
and the resulting sintered parts.

116
Chapter 4- Effects of processing conditions and coupling agents on
mechanical properties of selective laser sintered glass
bead-filled polyamide 12 composites
For any given application, certain mechanical properties will be of more importance
than others. It is therefore essential to identify and rank the most relevant properties and
formulate or purchase the least expensive composite material that satisfies the
requirements. The mechanical properties of interest for most applications are modulus
(tensile or flexural), yield strength, impact strength and fracture toughness [102].
Due to their unique attributes including ease of production, light weight and often
ductile nature, polymer systems are widely used in the industry. However, polymers
generally have lower mechanical properties (modulus and strength) as compared to
metals and ceramics. In order to improve the mechanical properties of polymers, the
forming of polymer matrix composites by the inclusion of fillers is one among many
ways for achieving this goal [80].
Polyamide-based composites have proven to have great potential for rapid
manufacturing in fabricating functional parts; however, the mechanical properties
(strength, in particular) of classic sintered polyamide 12 are only approximately 80% of
that of an injection moulded polyamide specimen. In selective laser sintering, the
mechanical properties of the part are largely influenced by many factors such as
powders, processing parameters, fabrication position and orientation. For these reasons,
significant research efforts have been directed toward finding SLS materials with

117
improved mechanical properties. To this end, it has been well established in the
literature that material properties are directly related to process parameters in the
Selective Laser Sintering process and hence can be varied by changing process
parameters [62], [72], [104].
4.1. Experiments
4.1.1. Materials and sample preparation
Materials and Processing
The polyamide 12 (Nylon 12; PA12; PA2200) used in this work as a matrix material
was a commercial fine polyamide PA2200 for EOSINT P supplied by EOS GmbH. The
density according to DIN 53466 was 0.435-0.445 [g.cm-3]. Two types of A-glass beads
(Spheriglass 3000: CP00 with no surface pre-treatment and CP03 surface pre-treated
with a silane coupling agent) with mean diameter of 35 [µm] were selected as the filler.
The glass beads, small solid spherical particles with a density of 2.5 [g/cm3], were
supplied by Potters Industrial Inc/Omya UK Ltd.
Sample preparation
In the sample preparation process, the polyamide 12 was compounded with glass beads
with 10, 20, 30 and 40 [wt%] ratios, using a rotating drum mixer type BS 125 for 30
minutes to produce the composites. Selective laser sintering (SLS) was performed using
a DTM Sinterstation 2000 System to manufacture specimens from glass bead-filled
polyamide 12 composites with a fill laser power (P) of 8 or 10 [W], a laser beam speed
(BS) of 914 [mm/s], a scan spacing (SCSP) of 0.15 [mm], layer thickness (Lt) of 0.1
[mm], beam diameter (d) of 0.4 [mm] and powder bed temperature (Tb) of 176 [°C].

118
The energy density (ED), regarded as the relative applied laser energy per unit area, can
be calculated as follows [59],
SCSPxBS
PED = …. (4.1)
therefore, the corresponding laser energy densities ranged from 0.058 to 0.073 [J/mm2].
In addition, some samples were prepared for the purpose of comparison from the pure
polyamide 12 powder. Table (4.1) summarises the process parameters used in
manufacturing the test samples from the PA12/CP00 and PA12/CP03 composites.
4.1.2. Equipment and methodology
Mechanical testing plays an important role in evaluating the fundamental properties of
engineering materials as well as in developing new materials and in controlling the
quality of materials for use in design and construction. If a material is to be used as a
part of an engineering structure that will be subjected to a load, it is important to know
that the material is strong enough and rigid enough to withstand the loads that it will
experience in service. As a result, engineers have developed a number of experimental
techniques for mechanical testing of engineering materials subjected to tension,
compression, bending or torsion loading.
In the testing step, the tensile, flexural, Izod impact SEN samples with BS EN ISO 527
and 178-180/1A standards, respectively, were produced using an SLS machine (DTM
Sinterstation 2000). The direction of the samples in the build chamber was on the X-
axis parallel to the front of the machine and in the X-Y plane of the build chamber, Fig
(4.1).

119
Table (4.1) Process parameters used in manufacturing test specimens from the
PA12/CP00 and PA12/CP03 composites
PA12/GB [wt/wt%] 90/10 80/20 70/30 60/40
Laser power [W] 10
Energy density [J/mm2] 0.073
Scan Speed [mm/s] 914
Powder bed temperature [°C] 176
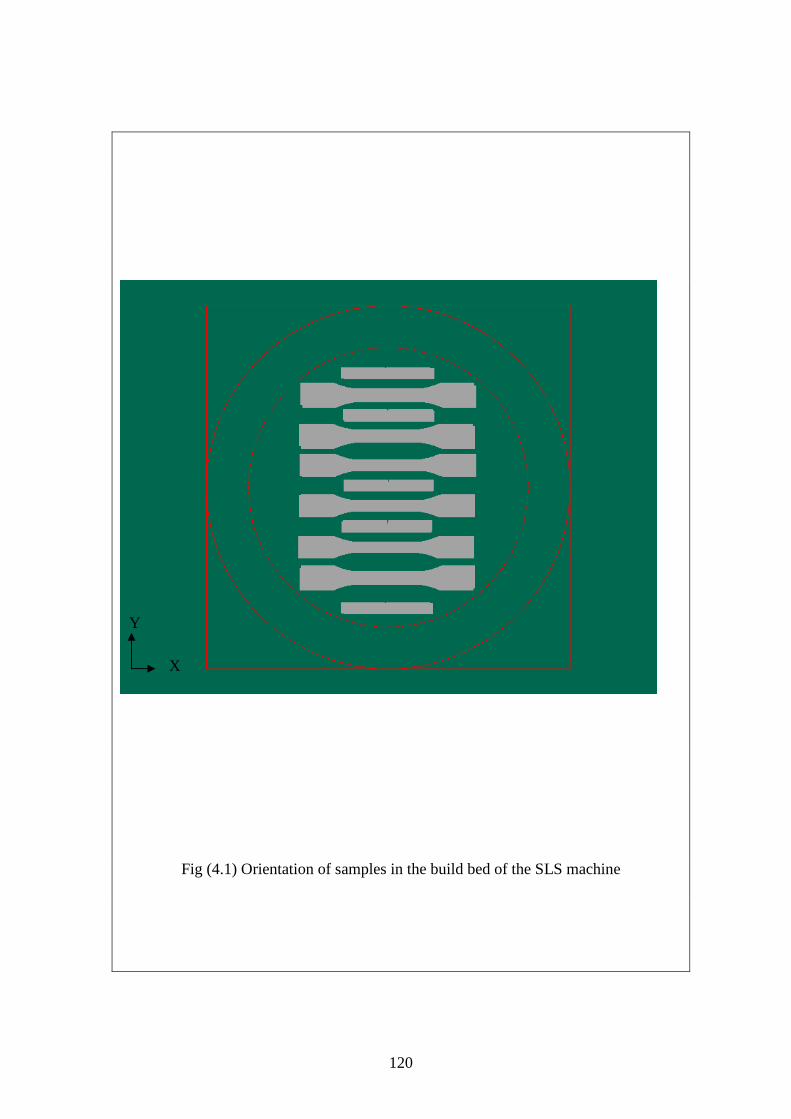
120
Fig (4.1) Orientation of samples in the build bed of the SLS machine
Y
X
121
The fabrication of specimens was carried out for both systems under the same
conditions. While the weight ratio varied, the bed temperature was kept fixed.
After production, the samples were removed from the part cake and cleaned manually.
Sandblasting and pressurised air were used to remove powder remnants. The
dimensions of the specimens were obtained using digital micrometers and callipers.
Each dimension was taken three times and an average of these values was associated
with each part.
The tensile, flexural and fracture toughness tests were carried out using a Testometric
materials testing machine AX (M350 – 5 kN). To measure the elastic tensile modulus,
an extensometer was installed with a cross-head speed of 1mm/min. The test results
(tensile and flexural properties) were the mean values of six specimens.
The impact test was carried out at room temperature using a pendulum impact test
machine type W&T AVERY Ltd. The tensile strength, elastic modulus, elongation at
break, impact strength and flexural strength were recorded and obtained.
To observe the morphological structure of scan surfaces and the fracture cross-section
of tensile bars, a Scanning Electron Microscope (ZEISS XB 1540 workstation) was
used. Samples were taken from the fracture zone of the dumb-bell bars and were coated
with gold before observation.

122
4.2. Mechanical properties
Several figures of merit are used to characterise the mechanical properties of materials.
Young’s modulus is a measure of stiffness, the amount of stress needed to create a
small recoverable (elastic) deformation. Yield strength is the stress needed to create an
irrecoverable (plastic) deformation. Flow stress is the stress needed to steadily stretch
the material beyond the yield point. Toughness expresses the amount of energy needed
to fracture a specimen of the material, which is highly dependent not only on the
material’s properties, but on strain rate, temperature, sample geometry and pre-existing
flaws [104].
4.2.1. Tensile strength
The tensile strength of a material is defined as the maximum stress that the material can
sustain under uniaxial tensile loading. For particulate composites, this relies on the
effectiveness of stress transfer between the matrix and the filler. Factors like particle
size, particle/matrix interfacial strength and particle content significantly affect the
composite strength [105]. The tensile properties of glass bead-filled polyamide 12
composites were determined according to BS EN ISO 527 standards. The testing
machine, the shape and the most important dimensions of the tensile specimen are
summarised in Figs (4.2) and (4.3).
Tensile curves
The stress-strain curve is a graphical representation of the relationship between stress
and strain. The nature of the curve varies from material to material. Stress-strain curves
can not only be used to identify some mechanical properties such as

123
Fig (4.2) Testometric materials testing machine and extensometer installed
Specimen type 1A l3 Overall length ≥150 l1 Length of narrow parallel-sided portions 80±2 r radius 20 … 25 l2 Distance between broad parallel-sided portions 104 … 113 b2 Width at ends 20±0.2 b1 Width of narrow portions 10±0.2 h Preferred thickness 4.0±0.2 L0 Gage length 50±0.5 L Initial distance between grips 115±1
(b) Fig (4.3) Shape and dimensions of the tensile test samples
(a)
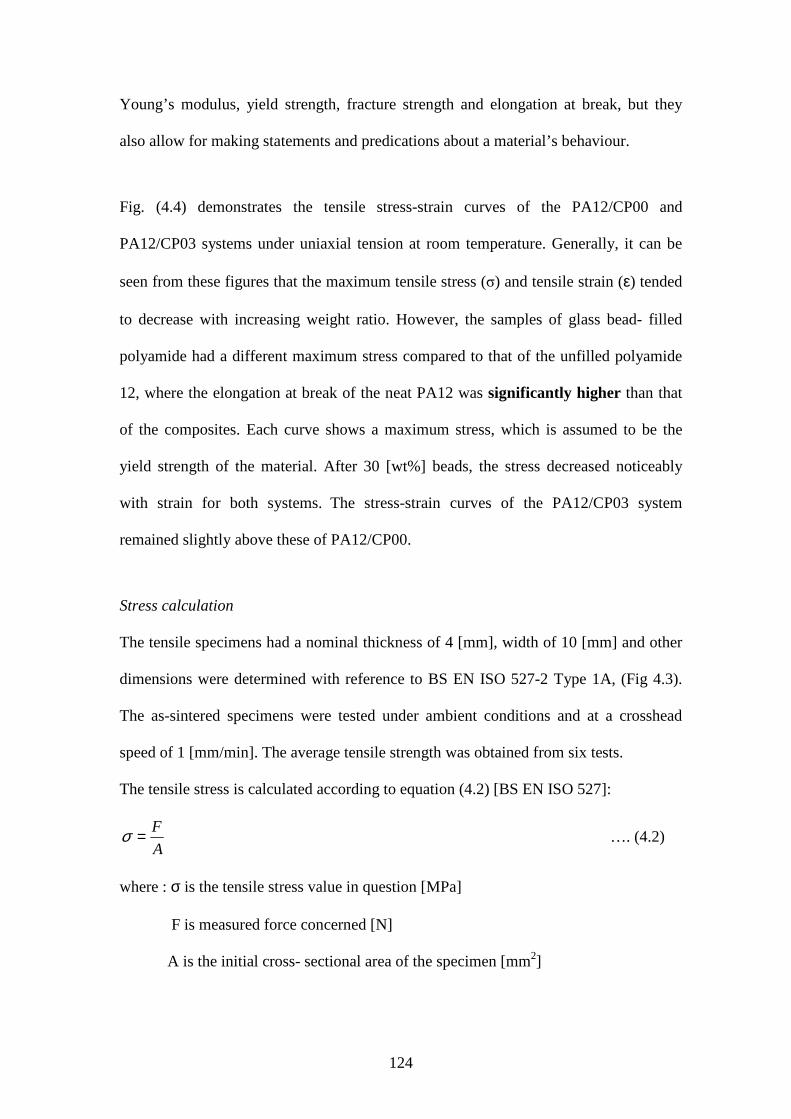
124
Young’s modulus, yield strength, fracture strength and elongation at break, but they
also allow for making statements and predications about a material’s behaviour.
Fig. (4.4) demonstrates the tensile stress-strain curves of the PA12/CP00 and
PA12/CP03 systems under uniaxial tension at room temperature. Generally, it can be
seen from these figures that the maximum tensile stress (σ) and tensile strain (ε) tended
to decrease with increasing weight ratio. However, the samples of glass bead- filled
polyamide had a different maximum stress compared to that of the unfilled polyamide
12, where the elongation at break of the neat PA12 was significantly higher than that
of the composites. Each curve shows a maximum stress, which is assumed to be the
yield strength of the material. After 30 [wt%] beads, the stress decreased noticeably
with strain for both systems. The stress-strain curves of the PA12/CP03 system
remained slightly above these of PA12/CP00.
Stress calculation
The tensile specimens had a nominal thickness of 4 [mm], width of 10 [mm] and other
dimensions were determined with reference to BS EN ISO 527-2 Type 1A, (Fig 4.3).
The as-sintered specimens were tested under ambient conditions and at a crosshead
speed of 1 [mm/min]. The average tensile strength was obtained from six tests.
The tensile stress is calculated according to equation (4.2) [BS EN ISO 527]:
A
F=σ …. (4.2)
where : σ is the tensile stress value in question [MPa]
F is measured force concerned [N]
A is the initial cross- sectional area of the specimen [mm2]
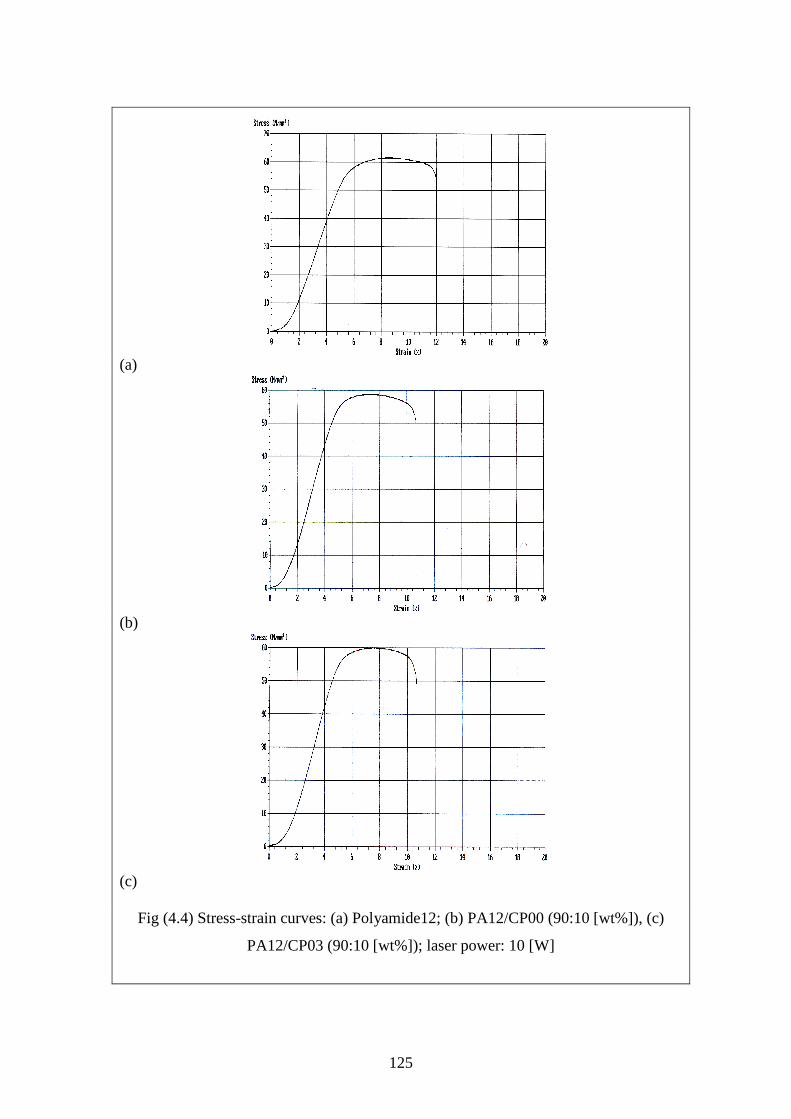
125
(a)
(b)
(c)
Fig (4.4) Stress-strain curves: (a) Polyamide12; (b) PA12/CP00 (90:10 [wt%]), (c)
PA12/CP03 (90:10 [wt%]); laser power: 10 [W]
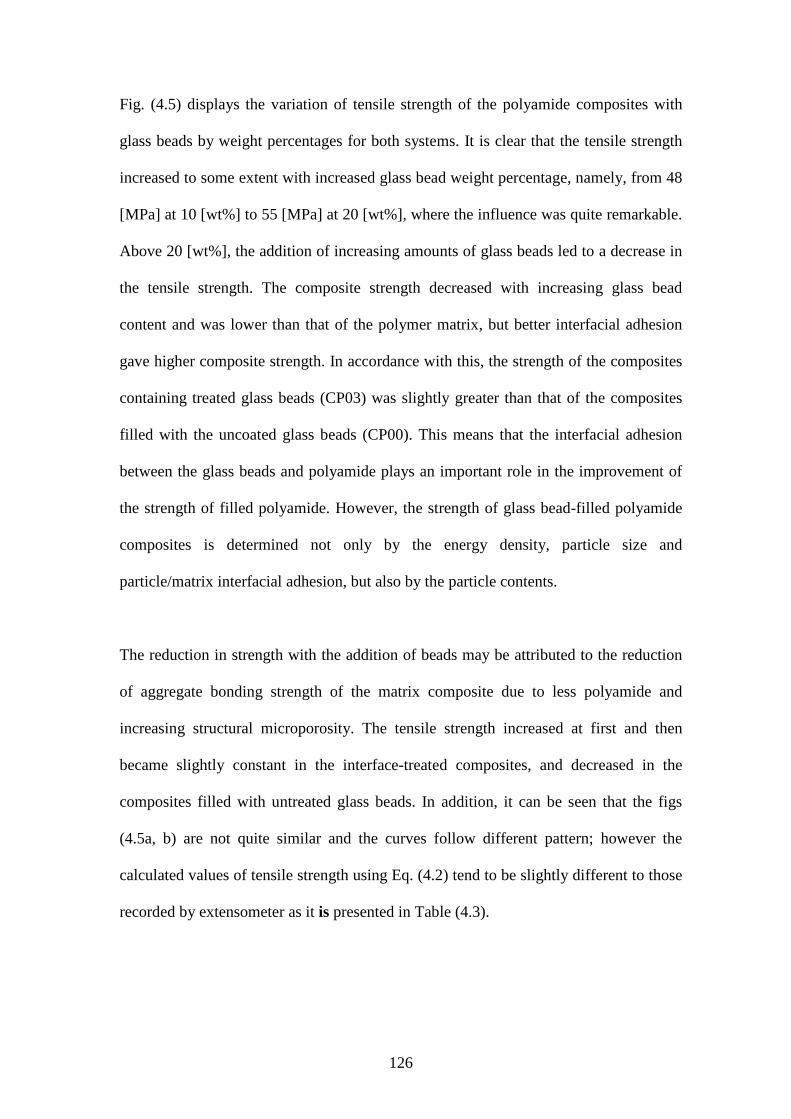
126
Fig. (4.5) displays the variation of tensile strength of the polyamide composites with
glass beads by weight percentages for both systems. It is clear that the tensile strength
increased to some extent with increased glass bead weight percentage, namely, from 48
[MPa] at 10 [wt%] to 55 [MPa] at 20 [wt%], where the influence was quite remarkable.
Above 20 [wt%], the addition of increasing amounts of glass beads led to a decrease in
the tensile strength. The composite strength decreased with increasing glass bead
content and was lower than that of the polymer matrix, but better interfacial adhesion
gave higher composite strength. In accordance with this, the strength of the composites
containing treated glass beads (CP03) was slightly greater than that of the composites
filled with the uncoated glass beads (CP00). This means that the interfacial adhesion
between the glass beads and polyamide plays an important role in the improvement of
the strength of filled polyamide. However, the strength of glass bead-filled polyamide
composites is determined not only by the energy density, particle size and
particle/matrix interfacial adhesion, but also by the particle contents.
The reduction in strength with the addition of beads may be attributed to the reduction
of aggregate bonding strength of the matrix composite due to less polyamide and
increasing structural microporosity. The tensile strength increased at first and then
became slightly constant in the interface-treated composites, and decreased in the
composites filled with untreated glass beads. In addition, it can be seen that the figs
(4.5a, b) are not quite similar and the curves follow different pattern; however the
calculated values of tensile strength using Eq. (4.2) tend to be slightly different to those
recorded by extensometer as it is presented in Table (4.3).

127
0
10
20
30
40
50
60
0 10 20 30 40
CP00/PA2200 (10W)
CP03/PA2200(10W)
0
10
20
30
40
50
60
70
0 10 20 30 40
CP00/PA2200(10W)
CP03/PA2200(10W)
Fig (4.5) The variation in tensile strength of the PA2200/CP00 and PA2200/CP03
systems. (a) by calculation; (b) by extensometer
Ten
sile
Str
eng
th [
MP
a]
(a) Ratio of glass beads [wt%]
(b) Ratio of glass beads [wt%]
Ten
sile
Str
eng
th [
MP
a]

128
4.2.2. Young’s modulus
Young’s modulus, in general, is the stiffness of a material at the elastic stage of the
tensile test. It is defined as the ratio of the uniaxial stress over the uniaxial strain in the
range of stress in which Hooke’s law holds. Young’s modulus is markedly improved by
adding rigid particles to a polymer matrix since the rigidity of inorganic fillers is
generally higher than that of the polymers. The composite modulus consistently
increases with increasing particle content.
The strain can be calculated using equation (5.2), [BS EN ISO 527]:
0
0
L
L∆=ε …. (4.3)
where: ε is strain [%] ; ∆L0 is the elongation [mm] ; L0 is measurement length of the
specimen.
The modulus of elasticity in tensile stress is calculated according to the equation (4.4):
12
12
εεσσ
−−
=E …. (4.4)
where: σ1 and σ2 are tensile stress; ε1 = 0.0025 and ε2 = 0.0005 are strains
Fig. (4.6) shows the variation of the modulus of elasticity with the glass bead weight
ratio. It can be observed that increasing the weight percentage of glass beads led to an
increase in the Young’s modulus of the test specimens produced for both systems. The
calculation results show that an increase in glass beads from 10 to 40 [wt%] led to an
increase in the modulus of elasticity from approximately 1700 to 6500 [MPa].
Generally, the increase in the modulus of elasticity is explained by the percolation
theory, which states that a matrix zone around each particle is affected by stress
concentration. Therefore, if the distance between particles is small enough, these zones
join together and form a percolation network, which increases the modulus.

129
0
1000
2000
3000
4000
5000
6000
7000
0 10 20 30 40
CP00/PA2200(10W)
CP03/PA2200(10W)
0
500
1000
1500
2000
2500
3000
3500
4000
4500
0 10 20 30 40
CP00/PA2200(10W)
CP03/PA2200(10W)
Fig (4.6) The variation of the modulus of elasticity of PA12/ glass bead composites
with glass beads content [wt%]: (a) by calculation; (b) by extensometer.
Ten
sile
Mod
ulus
[MP
a]
Ten
sile
Mod
ulus
MP
a
Glass bead content [wt%]
Glass bead content [wt%]
(b)
(a)

130
On the other hand it is well-known that for rigid particulate-filled polymer composites
(in addition to the difference in modulus between the particles and polymer), some
physical cross-linking points might be generated. Furthermore, the movement of the
molecular chains of the matrix polymer could experience a blockage, to some extent,
due to the addition of the glass beads, leading to an improvement in the stiffness of the
composite. However, the Young’s modulus of the materials increases correspondingly
with an increase in the particle content regardless of interface treatment, because it is
determined from the initial elastic deformation without damage [55], [106].
However, since one of the project goals was to either maintain or increase the modulus,
or stiffness, the particles must carry part of the load at small deformations. If the
particles are completely loose from the matrix, then they effectively act as voids within
the material, and the modulus will be diminished by an amount proportional to the
particle weight ratio. If they do bind tightly at small strains, then they will carry part of
the load, and since they are stiffer than the matrix, the overall modulus will increase.
Moreover, the better the dispersion of the particles in the matrix and interfacial bonding
between the matrix and the glass beads, the better the stiffness of the composite. For
these reasons, the adhesion between the particles and the matrix must be of
intermediate strength in order to accomplish the goal of simultaneous stiffening and
toughening [104].
The values of modulus for the PA12/CP03 system were slightly higher than those for
the PA12/CP00 system having the same filler content. When the weight ratio was >
20%, the difference in modulus between the two systems was more evident. This
indicates that the enhancement of interfacial adhesion between the matrix and the glass

131
beads is helpful in improving the stiffness of the filled PA12 composites. Furthermore,
it can be seen that the Figs (4.6a; b) are similar yet slightly different. The curves follow
the same pattern; however the calculated data of Young’s modulus using Eq. (4.4) tend
to be higher than those recorded by the extensometer as shown in Table (4.3). However,
when comparing calculated values (using the stress obtained by crosshead movement)
for tensile strength and Young’s modulus, to those recorded using the extensometer,
differences have been observed. These differences can be explained by the following
factors. Firstly, measuring imprecision and the practice of sliding a ruler along a graph
in order to determine the above mentioned properties leave plenty of room for
inaccuracies. Secondly, the calculations of the stress are based on the force the
crosshead applies and the preset dimensions for the cross-sectional area. If the actual
dimensions do not accurately represent the area of the sample, it will result in stress
values that are higher or lower to those of the extensometer. Thirdly, if the specimen
slips at all, while in the grips of the testing machine, it can alter the collected data. The
same holds true if the sample extends in the transition region rather than just in the
gauge region. The extensometer is used to prevent these two issues. Lastly, a plastic
stress curve versus strain curve most often contains a linear elastic region, as well as a
non-linear plastic region. Very little strain occurs within the linear region. Because
modulus is measured within this region, an extensometer with a high resolution is
necessary. The mechanical transverse extensometer used typically has limited travel
and must be removed from the specimen during a test. The inaccuracy of recorded data
for elastic modulus is most likely due to the fact that it is difficult to determine strictly
the exact point at which the extensometer should be removed from the specimen.
132
4.2.3. Elongation at break
Elongation at break is an important parameter of the tensile fracture toughness of a
material. Fig (4.7) presents the variation of the elongation at break value with the ratio
of glass beads. The results show that the elongation at break decreased drastically with
increased glass bead ratio. The measured elongation at break with 10 [wt%] glass beads
was 3.17% and decreased to 0.13% at glass bead content of 40 [wt%]. This is generally
explained by immobilisation of the macromolecular chains by the filler which increases
the brittleness of the polymer. On the other hand, the increase in deformability of the
PA12/CP03 system due to the presence of a coupling agent indicates that silane
coupling agents probably provide a plasticising (or lubrication) effect because of the
formation of physisorbed layers in the interphase [33], [107].
The calculation of percentage elongation at break in relation to the original gauge
length can be carried out using the following equation:
1000
0 xl
llEp
−= …. (4.5)
where
Ep
l
l0
is the percentage elongation at break
is the distance between reference marks, at break [mm]
is the original length [mm]
Evaluation of elongation at break showed that small differences at a lower filler content
are the consequence of a small impact of filler on the polyamide matrix due to the small
interfacial area. In this case, the elongation at break values were primarily influenced
by the decrease in specimen cross-section during elongation or strain hardening. At
higher filler contents, the effect of the filler on the polyamide matrix

133
0
0.5
1
1.5
2
2.5
3
3.5
4
4.5
0 10 20 30 40
CP03/PA2200 (10W)
CP00/PA2200,(10W)
Fig (4.7) The variation of the elongation at break with glass bead content.
Elo
ngat
ion
at b
reak
[%
]
Ratio of glass beads [wt%]

134
was much more extensive due to the enlargement of the interfacial area and the
formation of increased interfacial interactions between the filler and the matrix.
However, as it can be seen from Fig (4.7) that the values of elongation at break of
composites increased with silane coupling agent treatment compared to the untreated
cases at a constant glass bead content due to the plasticiser effect of silane coupling
agents.
4.2.4. Flexural strength and modulus
In many applications for particulate-filled plastics, especially particulate-filled
thermoplastics such as polyamides, the product must not only be strong, but also stiff or
rigid to perform as designed. The flexural strength of a material is defined as its ability
to resist deformation under load. The flexural modulus is the ratio of stress to strain in
flexural deformation, or the tendency for a material to bend. Adding glass beads
increases the stiffness or flexural modulus of a polyamide composite. Generally, the
more glass beads used, the greater the increase in flexural modulus.
Flexural strength and the modulus of elasticity were obtained through a three-point
bending test. Most commonly, the sample was placed on a support span and the load
was applied to the centre by the loading nose, producing three-point bending at a
specified rate. The parameters for this test are the support span, the speed of loading
and the maximum deflection for the test. These parameters are based on the test
specimen thickness and are defined by ISO 178. Fig. (4.8) summarises the shape,
dimension and arrangement of the test samples.

135
Stress calculations
For a rectangular sample under a load in a three-point bending setup:
22
3
bh
FLf =σ …. (4.5)
where: σf flexural stress [MPa]
F the load (force) at the fracture point [N]
L the length of the support span [mm] , L = 16 h = 16x4 = 64 [mm]
b width [mm]
h thickness [mm]
The flexural properties are presented in Table (4.2). Table (4.2) reveals that the glass
bead-filled polyamide exhibited a lower flexural strength and higher modulus than that
of the uncoated system.
Fig. (4.9) demonstrates the variation of the flexural strength and flexural modulus with
glass bead content. The results from the experiments show that flexural strength
increased gradually, whilst the flexural modulus values increased steadily as glass bead
loading increased from 10 to 40 [wt%]. However the flexural strength and flexural
modulus values of the PA12/CP03 system with coated glass beads were slightly higher
than those of the PA12/CP00 system, where is generally believed that the coupling
agent would soften the PA12 matrix around the glass beads, which have a smooth
spherical surface and should not initiate fine cracks in the matrix around them.
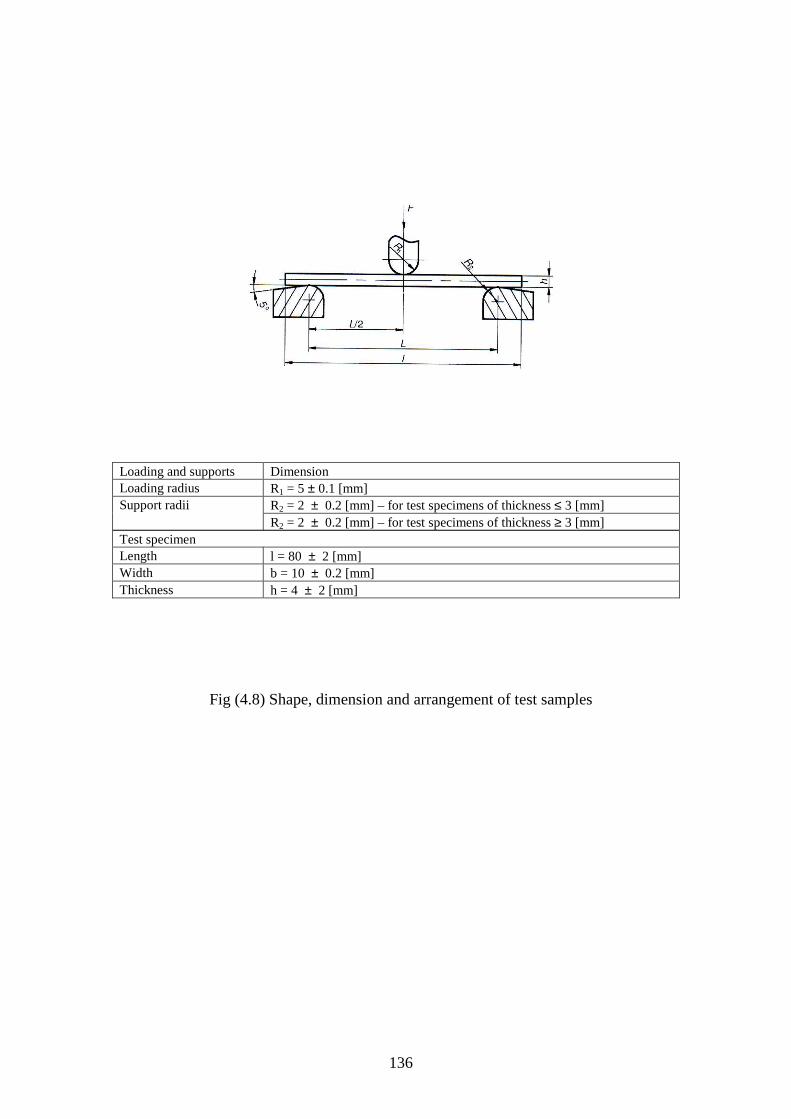
136
Loading and supports Dimension Loading radius R1 = 5 ± 0.1 [mm]
R2 = 2 ± 0.2 [mm] – for test specimens of thickness ≤ 3 [mm] Support radii R2 = 2 ± 0.2 [mm] – for test specimens of thickness ≥ 3 [mm]
Test specimen Length l = 80 ± 2 [mm] Width b = 10 ± 0.2 [mm] Thickness h = 4 ± 2 [mm]
Fig (4.8) Shape, dimension and arrangement of test samples

137
0102030405060708090
100
0 10 20 30 40
CP00/PA12,(10W)
CP03/PA12,(10W)
0
500
1000
1500
2000
2500
3000
3500
4000
4500
0 10 20 30 40
CP03/PA2200,(10W)
CP00/PA2200,(10W)
Fig (4.9) The variation of the flexural strength (a); and flexural modulus (b) with glass
bead content
Fle
xura
l Str
engt
h [M
Pa]
F
lexu
ral M
odul
us [M
Pa]
Ratio of glass beads [wt%]
Ratio of glass beads [wt%]
(a)
(b)

138
4.2.5. Impact strength
The impact strength of notched samples was measured at ambient temperature by the
notched Izod test. Izod impact tests were carried out on 80x10x4 [mm] rectangular bars
with a single-edge 45° V-shaped notch (tip radius 0.25 [mm], depth 1.5 [mm]). The test
was performed at room temperature using a pendulum impact test machine type W&T
AVERY Ltd., with a pendulum speed at impact of 2.44 [m/s], Fig (4.10).
The Izod fracture test was carried out to characterise the impact strength of glass bead-
filled polyamide 12 composites. The samples used were the notched rectangular bar
described above. The average values were calculated from six samples and the
measured results for impact strength are listed in Tables (4.2) and (4.3).
The impact strength of different PA12/GB composites with different filler content is
shown in Fig. (4.11). It is clear from this figure that the impact strength increased to
some extent with increased glass bead weight percentage. As the weight ratio of glass
beads increased, the impact strength of the polyamide was reduced. With loading up to
20 [%wt], the significant drop in impact strength was readily apparent. This
degradation in impact properties can be attributed to the immobilisation of the
macromolecular chains by the glass beads, which limits their ability to deform freely
and makes the composite less ductile.
From the impact experiment, it was found that the impact strengths of composites filled
with uncoated glass beads decreased monotonically from 13.97 to 9.84 [kJ m−2] with
increasing particle weight ratio, probably due to the poor interfacial adhesion between
polyamide and glass beads.

139
(a) Avery Izod pendulum impact machine
(b) (c)
Method designation
Specimen Notch type
Notch base radius, rN
Remaining with, bN, at notch base
ISO 180/A Length l = 80 ± 2 [mm] Width b = 10.0 ± 0.2 [mm] Thickness h = 4.0 ± 0.2 [mm]
A
0.25 ± 0.05
8,0 ± 0.2
Fig (4.10) Impact test arrangement: (a) testing machine; (b) Notch type; (c) Sample
geometry and loading arrangements.
1 striking edge; 2 notch; 3 vice jaw; 4 face of jaws in contact with the sample; 5 fixed vice jaw;
6 movable vice jaw; bN remaining width at notch base

140
0
2
4
6
8
10
12
14
16
0 10 20 30 40
CP03/PA2200,(10W)
CP00/PA2200,(10W)
Fig (4.11) The variation of impact strength with glass bead weight ratios
Impa
ct s
tren
gth [k
J/m
2 ]
Ratio of glass beads [wt%]

141
Table (4.2) Mechanical properties of SLS samples (PA12; PA12/CP00 system; PA12/CP03
system) by calculation
PA12/ CP00 ratios [%] 100/0 90/10 80/20 70/30 60/40
Laser power [W] 10 [W]
Properties; Material: PA12/CP00
Max percent
variation
average 52.89 52.39 52.40 48.40 40.85 22.76 Tensile strength [MPa]
SD* 0.81 0.70 0.53 1.40 1.13
average 1721.9 2716.55 3399.60 4675.32 6250.16 72.45 Tensile modulus [MPa]
SD 214.09 383.57 493.75 275.77 232.56
average 4.18 3.27 2.36 0.55 0.17 95.93 Ultimate elongation [%]
SD 0.53 0.64 0.42 0.11 0.08
average 69.97 75.43 80.41 84.38 87.20 19.75 Flexural strength [MPa]
SD 3.07 1.01 1.90 1.95 3.14
average 2262.91 2252.98 2675.18 3280.86 3870.03 41.78 Flexural modulus [MPa]
SD 361.15 222.16 115.58 150.47 366.19
average 9.14 13.97 13.65 13.41 9.84 34.57 Impact strength [kJ/m2]
SD 0.58 0.65 1.06 1.43 0.65
PA12/ CP03 ratios [%] 0/100 10/90 20/80 30/70 40/60
Laser power [W] 10 [W]
Properties; Material: PA12/CP03
Max percent
variation
average 52.89 53.59 54.61 52.23 51.54 5.62 Tensile strength [MPa]
SD 0.81 0.99 0.74 0.47 2.36
average 1721.9 2800.95 4190.34 4820.07 6470.73 73.39 Tensile modulus [MPa]
SD 214.09 571.72 477.71 498.21 375.54
average 4.18 2.74 1.70 0.48 0.18 95.69 Ultimate elongation [%]
SD 0.53 0.48 0.39 0.08 0.03
average 69.97 77.07 78.61 86.14 90.70 22.85 Flexural strength [MPa]
SD 3.07 1.59 3.43 1.10 0.89
average 2262.91 2460.51 2549.98 3208.68 3849.12 41.21 Flexural modulus [MPa]
SD 361.15 99.75 226.96 203.27 273.62
average 9.14 14.40 13.18 11.46 10.29 36.53 Impact strength [kJ/m2]
SD 0.58 1.18 2.16 1.09 0.74 (*) SD … Standard deviation

142
Table (4.3) Mechanical properties of SLS samples recorded by an extensometer (PA12;
PA12/CP00 system and PA12/CP03 system)
Stress at Peak
[MPa]
Stress at Upper
Yield [MPa]
Young’s Modulus
[MPa]
Stress at Break
[MPa]
No. LP
Material: PA 12
1 59.720 55.480 2050.3 42.897
2 58.812 54.875 1974.4 39.885
3
10W
60.400 57.147 2302.4 45.995
Material: PA12/CP00; 90:10
4 57.128 54.833 2666.8 42.222
5 56.655 55.430 2377.2 53.480
6
10W
57.583 56.267 2521.2 48.591
Material: PA12/CP00; 80:20
7 53.257 52.815 3081.5 48.230
8 52.515 51.97 3091.7 49.042
9
10W
53.290 53.073 3086.6 49.722
Material: PA12/CP00; 70:30
10 39.257 39.208 3187.9 35.308
11 38.655 38.120 3110.0 36.692
12
10W
34.390 32.890 3255.0 32.495
Material : PA12/CP00 ; 60:40
13 39.683 39.537 3925.7 38.99
14 38.320 38.287 4160.8 37.987
15
10W
37.270 37.245 4210.5 36.698
Material: PA12/CP03; 90:10
16 57.612 55.720 2504.5 44.755
17 56.355 53.160 2233.8 48.042
18
10W
55.628 54.000 2233.8 42.498
Material: PA12/CP03; 20:80
19 48.153 48.787 2582.8 48.140
20 49.995 49.715 2811.2 47.905
21
10W
51.260 51.105 2395.7 48.623
Material: PA12/CP03; 70:30
22 49.002 48.955 3366.5 46.820
23 48.592 48.025 4178.4 47.517
24
10W
47.933 47.873 3279.8 47.125
Material: PA12/CP03; 60:40
25 48.147 48.140 3625.0 48.110
26 41.055 41.055 3992.8 41.010
27
10W
47.740 47.545 3627.2 47.158

143
The impact strength of PA12/CP03 composites filled with treated glass bead particles
decreased from 14.40 and 10.29 [kJm−2]. However, with treated glass beads, the impact
strengths were somewhat higher than those of untreated composites. This indicates that
the impact strength of the PA12 composites can be improved by coated glass beads. As
discussed above, the silane coating agent on the glass bead surface improves the
interfacial adhesion between the glass bead and the PA12 matrix. The improved
interfacial adhesion is favourable for transmitting the impact force and absorbing the
fracture energy. On the other hand, reducing the size of glass beads is helpful for
improving the toughness of composites [108],[109].
4.2.6. Fracture toughness
Fracture toughness is a property which describes the ability of a material containing a
crack to resist fracture, and is one of the most important properties of any material for
virtually all design applications. Fracture toughness is an indication of the amount of
stress required to propagate a pre-existing flaw. It is a very important material property
since the occurrence of flaws is not completely avoidable in processing, fabrication, or
service of a material/component. Flaws may appear as cracks, voids, metallurgical
inclusions, delamination, weld defects, design discontinuities, or some combination
thereof [110].
The aim of this section was to experimentally investigate the fracture toughness of the
glass bead-filled polyamide12 composites under quasi-static load. In the case of the
simpler mechanical properties such as Young’s modulus or yield strength, the testing
techniques are simple and require little thought or interpretation. However, toughness is
a more difficult property to characterise.
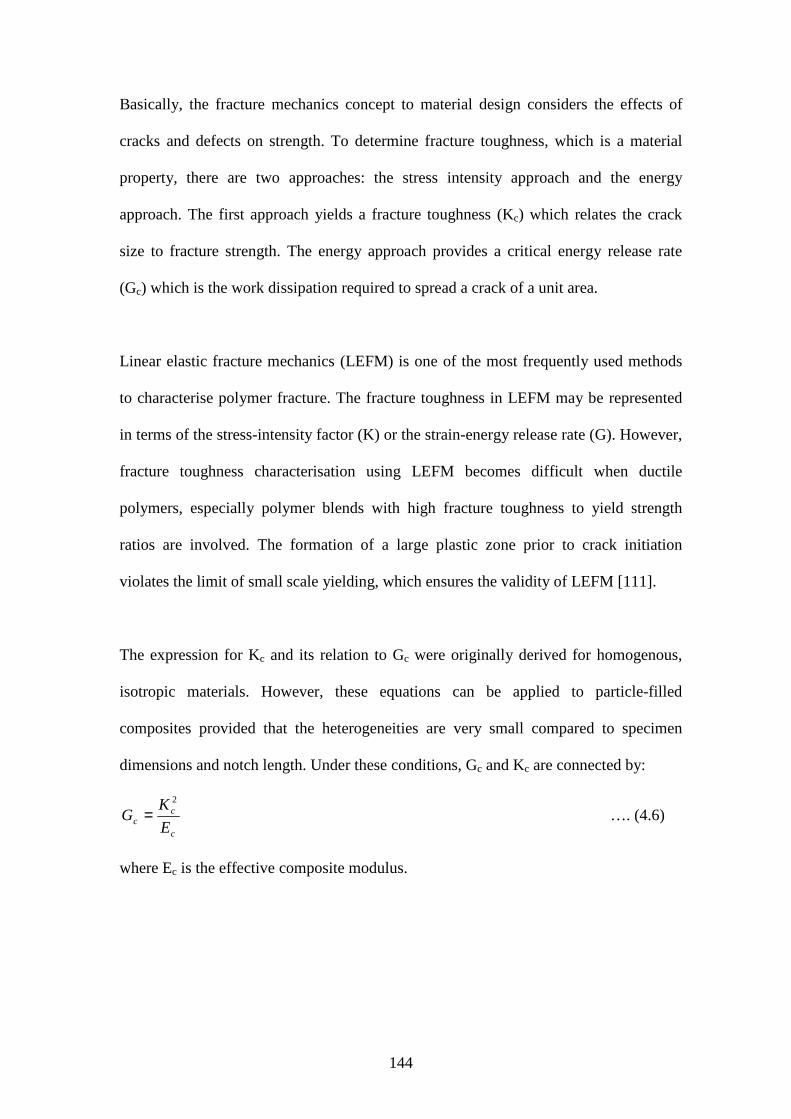
144
Basically, the fracture mechanics concept to material design considers the effects of
cracks and defects on strength. To determine fracture toughness, which is a material
property, there are two approaches: the stress intensity approach and the energy
approach. The first approach yields a fracture toughness (Kc) which relates the crack
size to fracture strength. The energy approach provides a critical energy release rate
(Gc) which is the work dissipation required to spread a crack of a unit area.
Linear elastic fracture mechanics (LEFM) is one of the most frequently used methods
to characterise polymer fracture. The fracture toughness in LEFM may be represented
in terms of the stress-intensity factor (K) or the strain-energy release rate (G). However,
fracture toughness characterisation using LEFM becomes difficult when ductile
polymers, especially polymer blends with high fracture toughness to yield strength
ratios are involved. The formation of a large plastic zone prior to crack initiation
violates the limit of small scale yielding, which ensures the validity of LEFM [111].
The expression for Kc and its relation to Gc were originally derived for homogenous,
isotropic materials. However, these equations can be applied to particle-filled
composites provided that the heterogeneities are very small compared to specimen
dimensions and notch length. Under these conditions, Gc and Kc are connected by:
c
cc E
KG
2
= …. (4.6)
where Ec is the effective composite modulus.

145
4.2.6.1. Single-edge-notched three-point bending fracture toughness tests
Toughness tests were also performed on the composites at a slower rate than impact
conditions by drawing out the notched rectangular bar samples. For this purpose, five
sets from which five replicate samples of each were produced and tested at room
temperature on a Testometric materials testing machine AX at a cross-head speed of 1
[mm/min] using a span of 64 [mm]. Single-edge-notched (SEN) type specimens were
prepared for the determination of the critical stress intensity factor (KIC) in the three-
point bending (3PB) test.
The fracture toughness specimens were produced using an SLS machine under the
same conditions applied to other testing specimens. The length (L), thickness (B) and
width (W) of the specimens were 80, 10 and 4 [mm], respectively, Fig (4.12). The
single-edge V-shaped notches of 45°, with a tip radius of 0.25 [mm] and different
depths, were introduced using the SLS machine. The resulting load-displacement
curves of glass bead-filled polyamide composites are given in Fig (4.13).
The load-displacement curves allowed for making statements about the behaviour of
the composites. Looking at the effect of glass bead content on the load-displacement
curves of the specimen, as presented in Fig. (4.13), it is clear that as the filler content
increased, the load and the displacement decreased.
Calculation of fracture toughness:
The KIC values were determined using the relationship [112]:
KIC =.
W
af
22BW
a3PS

146
Fig (4.12) Specimen configuration and dimensions for fracture toughness
measurements

147
(a) (b)
(c) (d)
(d)
Fig (4.13) Load-displacement curves of: (a) PA12; (b) CP00/PA12; 10:90 [wt%]; (c)
CP03/PA12; 20:80 [wt%]; (d) CP03/PA12; 30:70 [wt%]; (e) CP03/PA12; 40:60 [wt%]

148
432
8.2511.2553.407.393.1
+
−
+
−=
f
a
f
a
f
a
f
a
W
af …. (4.7)
where
W
af is a shape factor, P is the load at failure, S is the length of the span and a
is the notch depth.
Critical strain energy release rates (GIC) were calculated from the stress intensity values
using the following relationship:
GIC =. )1( 22
ν−E
K IC .… (4.8)
where E is the modulus of elasticity obtained from the tensile tests and ν is the
Poisson’s ratio of the polymer, taken to be 0.35 [113].
Shown below is an example for the calculation of KIC and GIC for the CP03/PA12
composite, weight ratio 40:60 and laser power of 10 [W] :
Span: S = 0.064 [m]; Thickness: B = 0.004 [m]; Width: W = 0.010 [m]; Young’s
modulus: Eavg = 3364500000 [N/m2].
Crack depth: CD = 0.001 m; load: F = 189 [N]:
1 – Shape factor:
W
af = 1.74578
2- KIC = 2504162.80 [Pa.m1/2] ≈ 2.50 [MPa m1/2]
3- GIC = 1863.82 [J.m-2] ≈ 1.86 [kJ/m2]
The results of critical stress intensity factor (KIC) and critical energy release rate (GIC)
are summarised in Table (4.3).

149
Table (4.4) Test results of fracture toughness performed on Polyamide 12/ glass bead composites.
Material: PA12 Crack Depth [m] Laser Power [W} KIC [MPa m1/2] GIC[kJ/m2]
0.001 3.17 4.46 0.002 3.97 6.97 0.003 4.63 9.51 0.004 4.32 8.26 0.005
10
4.24 7.96 Composite material: PA12/CP00; 90:10
0.001 3.14 3.62 0.002 3.93 5.70 0.003 4.54 7.59 0.004 4.42 7.19 0.005
10
4.58 7.74 Composite material: PA12/CP00; 80:20
0.001 3.11 3.14 0.002 3.84 4.78 0.003 4.68 7.12 0.004 4.51 6.60 0.005
10
4.41 6.31 Composite material: PA12/CP00; 70:30
0.001 2.82 2.73 0.002 3.71 4.72 0.003 4.15 5.91 0.004 3.98 5.42 0.005
10
4.07 5.69 Composite material: PA12/CP00; 60:40
0.001 2.49 1.61 0.002 3.23 2.69 0.003 3.72 3.58 0.004 3.63 3.42 0.005
10
3.39 2.99 Composite material: PA12/CP03; 90:10
0.001 3.08 3.80 0.002 3.80 5.78 0.003 4.78 9.14 0.004 4.19 7.04 0.005
10
4.88 9.51 Composite material: PA12/CP03; 80:20
0.001 3.11 3.73 0.002 3.82 5.63 0.003 4.37 7.36 0.004 4.23 6.89 0.005
10
4.41 7.50 Composite material: PA12/CP03; 70:30
0.001 2.74 2.11 0.002 3.49 3.42 0.003 3.74 3.93 0.004 3.59 3.59 0.005
10
3.73 3.92 Composite material: CP3/PA12; 40:60
0.001 2.50 1.86 0.002 3.21 3.06 0.003 3.86 4.43 0.004 3.57 3.78 0.005
10
3.69 4.05

150
4.2.6.2. Correlation between fracture toughness and glass bead content
The dependency of plain strain fracture toughness, i.e. the critical stress intensity factor
(KIC), of glass bead-filled polyamide 12 is given in Fig (4.14). The most distinctive
feature in this figure is that the fracture toughness of two composite systems did not
show any significant increase with increasing glass bead content. In fact, it decreased
with the increase in glass bead content. It was seen, upon increasing the glass bead
content that the KIC decreased. In other words, the addition of glass beads led to
composites with brittle behaviour.
The critical strain energy release rates (GIC) calculated from the (KIC) and modulus data
can be found in Fig (4.14-b). The general trend of this figure is the same as that of Fig
(4.14-a): fracture toughness decreased with increasing glass bead content. Nonetheless,
in all systems, as glass bead content increased, the decrease in fracture toughness per
unit increase of glass bead content became greater more rapidly in Fig (4.14-b) than in
Fig (4.14-a). This difference between KIC and GIC values can be easily understood by
considering how they are related: GIC depends on KIC and modulus under the linear
elastic fracture assumption.
From the abovementioned figures, it can also be observed that the influence of surface
treatment, i.e. coupling agents, on fracture toughness is insignificant, therefore a little
bit of energy can be damped via de-bonding. Besides, a crack can propagate through an
interface easily because of a weak interface. This is why fracture toughness decreased
with increasing glass bead content; however the interfacial-treated composites were
superior in tensile strength.

151
0
0.5
1
1.5
2
2.5
3
3.5
4
4.5
0 10 20 30 40
Kic,CP00/PA12
Kic,CP03/PA12
0
1
2
3
4
5
6
7
8
0 10 20 30 40
Gic,CP00/PA12
Gic,CP03/PA12
Fig (4.14) Dependency of fracture toughness of polyamide 12 composites on glass bead
content.
(a) critical stress intensity factor (KIC) ; (b) critical strain energy release rate (GIC) .
GC
I [K
J/m
2 ] K
CI
[MP
am1/
2 ]
Content of Glass Beads [wt%]
Content of Glass Bead [wt%]
(a)
(b)

152
4.2.6.3. Effect of V-notch depth on fracture toughness
In fracture toughness testing it is common, for reasons of simplicity and reproducibility,
to use notches to approximate sharp cracks. Hence, because of the lower stress
concentration ahead of a notch, as compared to a truly sharp crack, a greater force is
required to cause a notch tip crack to extend. This deviation increases with increasing
notch width and results in the commonly reported dependence of fracture toughness
(K IC) on notch root radius. This can be explained as a consequence of the interaction of
a distorted stress field with material flaws in front of a notch. In conventional impact
testing, the required notches are usually mechanically introduced into the test samples
in accordance with the relevant ISO Standard. However, with RP/RM processes, it is
entirely possible to include the notch into the CAD file and manufacture this design
detail as the part is being built [112], [114].
Owing to the effects of the manufacturing method, specimens with sintered-in notches
do not give results comparable to those obtained from specimens with machined
notches. It has been shown that to measure true fracture toughness, sharp notches with
the size of microstructural features are required. Fracture toughness values determined
with sharp-notched specimens are compared with the results of experiments with
conventional sawn-in notches. It has been shown that sharp notches deliver
considerably lower, more accurate and reproducible values of KIC, for materials with
fine microstructures. In this sense, in order to minimise the staircase effect of the build
process on the notch profile, all the specimens under investigation were built in the flat
orientation, as shown in Fig (4.2). Fig (4.15) shows optical photomicrographs of SLS-
introduced notches.

153
(a) (b)
(c) (d)
(e) Fig (4.15) Optical photomicrographs of the V-notch introduced using the SLS process
(a) notch depth 1 [mm]; (b) 2 [mm] ; (c) 3 [mm]; (d) 4 [mm]; (e) 5 [mm]

154
V-notches are one of the simplest and most frequent geometries that appear in testing
samples and in notched structural components. Generally, notches concentrate stress for
purely elastic responses and they generate enhanced plastic strain rates at the notch root
when local yielding occurs. Therefore, experiments were performed to explore the
effect of non-standard SEN-3PB type samples with increased notch depths. Fig (4.16)
shows the dependence of KIC and GIC on notch depth. Most of the composites,
including unfilled PA12, absorbed less energy as the notch depth increased, i.e. as the
stress or strain-rate concentration increased. The blends with a higher weight ratio of
glass beads, however, maintained essentially the same KIC and GIC independent of
notch depth in the range investigated.
In fact, the data on the fracture toughness of selective laser sintered glass bead-filled
polyamide 12 are roughly comparable with those for standard injection moulded
samples from nylon, rubber-modified polymethyl methacrylate (PMMA-RT) and
polyvinylchloride (PVC), [BS ISO 17281:2002].
4.3. Morphological observation
The morphological study in this work included the intrinsic microstructures of the
blends of the sintered and fractured surfaces after tensile tests. A scanning electron
microscope (ZEISS XB 1540 workstation) operating at an acceleration voltage of 30
[kV] was used to analyse the micrographs of scan surfaces and fracture cross-sections
of tensile bars. Prior to observation, the surfaces were coated with a thin layer of gold
to make them conductive and to avoid the concentration of electron emission on the
surface during examination. The SEM micrographs of the glass bead-filled polyamide
12 composites sintered at two different energy densities (ED) and different glass bead
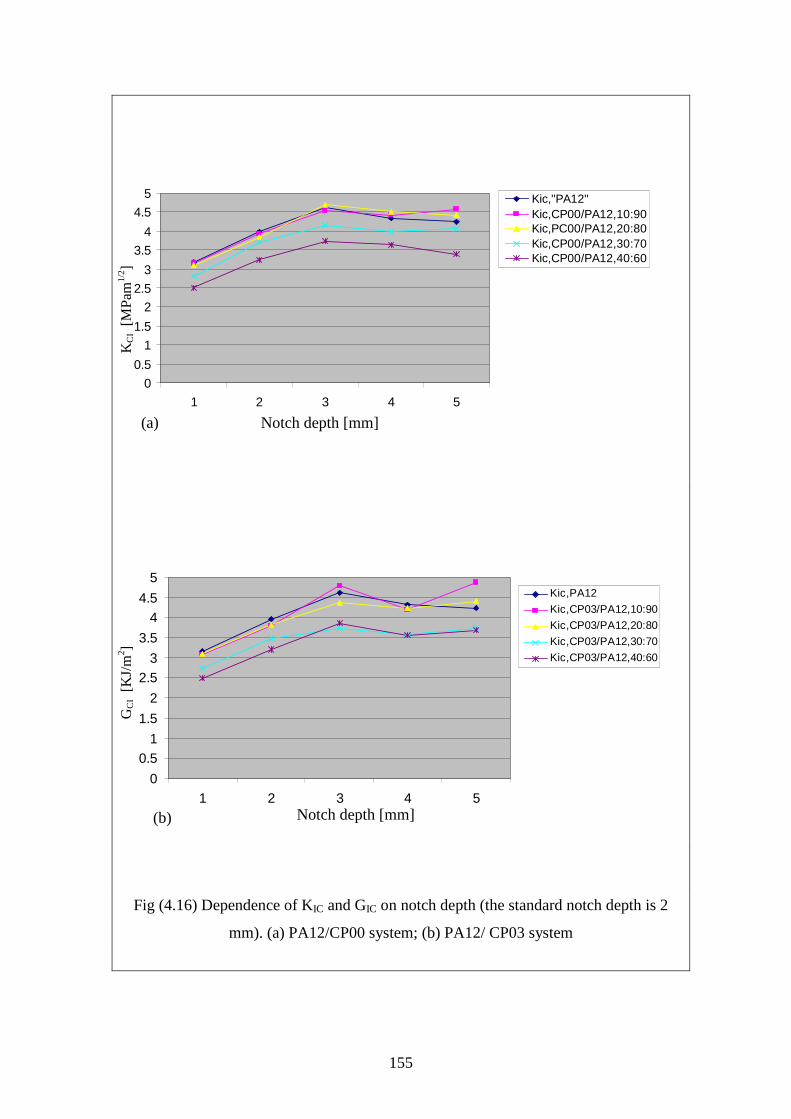
155
0
0.5
1
1.5
2
2.5
3
3.5
4
4.5
5
1 2 3 4 5
Kic,"PA12"Kic,CP00/PA12,10:90Kic,PC00/PA12,20:80Kic,CP00/PA12,30:70Kic,CP00/PA12,40:60
0
0.51
1.5
2
2.53
3.5
44.5
5
1 2 3 4 5
Kic,PA12
Kic,CP03/PA12,10:90
Kic,CP03/PA12,20:80
Kic,CP03/PA12,30:70
Kic,CP03/PA12,40:60
Fig (4.16) Dependence of KIC and GIC on notch depth (the standard notch depth is 2
mm). (a) PA12/CP00 system; (b) PA12/ CP03 system
Notch depth [mm]
KC
I [M
Pam
1/2 ]
Notch depth [mm]
GC
I [K
J/m
2 ]
(a)
(b)

156
contents with different surface treatments are shown in Figs (4.17) and (4.18). For the
PA12/CP00 system, it can be noted from Fig (4.17-a) that the particles on the scan
surface formed at an ED of 0.058 [J/mm22]] were only slightly fused together at points of
contact and a number of voids could also be seen compared to those formed at an ED of
0.073 [J/mm22]], Fig (4.17-b), where the particles were strongly fused together. This
indicates that the flow of the composite was facilitated by relatively higher energy
density. Fig (4.17-c;d) shows the morphology of a tensile fracture cross-section of the
PA12/CP00 system with a glass bead weight ratio equal to 20%. One can see that the
connection between the glass beads and PA12 was not perfect, that many glass beads
had been pulled out and that PA12 was stretched during breakage, resulting in a rough
spongy surface. However, the tensile fracture surface of the un-treated glass beads in
the composite after de-bonding was very smooth. This indicates that the interfacial
adhesion was poor and therefore its tensile strength as lower than that of the
PA12/CP03 system (see Fig 4.5).
Fig (4.18a;b) is an SEM micrograph taken of the scan surfaces and the tensile fracture
cross-sections of the PA12/CP03 system with a glass bead weight ratio of 20% at
energy densities of 0.058 [J/mm22]] and 0.073 [J/mm22]]. In general, it can be observed that
there is not a significant influence of the coupling agent on the scan surface.
The treated glass beads, Fig. (4.18-c;d), were uniformly distributed in the PA12 matrix,
and their surface became very rough. Hence, the bonding between the glass bead and
the matrix was strengthened. These results indicate that the silane agent coated on the
surface of glass bead enhanced the interaction between the glass beads and PA12, and
improved both the adhesion and morphological structure of the PA-

157
Scan surfaces pictures
(a) LB=8 [W]; ED = 0.058 [J/mm2]
(b) LB = 10 [W]; ED = 0.073 [J/mm2]
Tensile fracture surfaces (c) LB=8 [W]; ED = 0.058 [J/mm2]
(d) LB = 10 [W]; ED = 0.073 [J/mm2]
Fig (4.17) SEM micrographs of scan surfaces: (a); (b) and tensile fracture surfaces: (c);
(d) of selective laser sintered PA12/CP00 composites containing 20 [wt%] glass beads
built at two different energy densities

158
Scan surfaces pictures
(a) LB=8 [W]; ED = 0.058 [J/mm2]
b) LB = 10 [W]; ED = 0.073 [J/mm2]
Tensile fracture surfaces (c) LB=8 [W]; ED = 0.058 [J/mm2]
(d) LB = 10 [W]; ED = 0.073 [J/mm2]
Fig (4.18) SEM micrographs of scan surfaces: (a); (b) and tensile fracture surfaces: (c);
(d) of selective laser sintered PA12/CP03 composites containing 20 [wt%] glass beads
built at two different energy densities

159
matrix composites. Therefore, the tensile strength was higher than that of the former,
(see Fig 4.5).
4.4. Summary
The results presented in this chapter have shown that, over the range tested, an
increasing proportion of glass beads will cause a corresponding increase in stiffness.
The notable increase in strength and modulus, achievable with a relatively small
decrease in tensile strength, is promising when considering the requirement to tailor the
stiffness of SLS parts and components. However, the fairly large decrease in elongation
at break may prevent the use of very high ratios of glass beads. Different from
elongation at break, the flexural strength and modulus increase steadily with increasing
glass bead content.
From the impact experiment, it was found that the impact strengths of glass bead-filled
polyamide composites decreases monotonically, in general, regardless of the surface
treatment applied on the glass beads, where the glass beads are thought to make the
composite less ductile.
In terms of fracture toughness, both composite systems do not show any significant
increase with increasing glass bead content. In fact, it decreases with an increase in
glass bead content.
The results have shown that it is possible to vary the properties of selective laser
sintered parts by adding controlled proportions of glass beads to standard PA12 powder
besides surface treatment and process parameters.

160
Generally, high impact strength coupled with a large tensile modulus suggests a tough
composite material; high impact strength and small tensile modulus indicate a ductile,
flexible material; low impact and large tensile modulus typify a brittle composite
material. However, the interface-treated composites are superior in tensile strength, and
inferior in fracture toughness to the interface-untreated composites. The SEM
micrographs showed that the silane coupling agent improves both the adhesion and the
morphological structure of PA12 composites.

161
Chapter 5- Experimental investigation of the influence of
processing parameters and material properties on the
curling phenomenon in selective laser sintering
5.1. Background
It is a well-known approach that, to be able to infer the science behind the observed
phenomenon, researchers have to plan and conduct several experiments to obtain
enough relevant data. This can be done by the trial-and-error approach, design of
experiments and the Taguchi method. Experiments, however, are necessary for the
development of new materials, for the introduction of new technologies, for
optimisation of processing parameters and for improvements to known techniques.
Indeed, with more manufacturers using the SLS process for rapid manufacturing, it is
vital that designers understand the properties of the materials that are being used. In this
direction, much work has been focused on determining the most appropriate parameters
for the SLS process. Selective laser sintering (SLS) is one of the most popular rapid
manufacturing techniques. It has the capability to produce a part in hours without any
tooling, which is a powerful advantage for many industries. However, the parts
produced tend to shrink and warp from its designed form and dimensions, forcing the
user to run several trials of a part to reach its ideal dimension or settle for a slightly
inaccurate part. Improvement of geometric accuracy by optimising processing
parameters in selective laser sintering has been and remains a major concern.
Basically, part accuracy is one of the main challenges in layered manufacturing
techniques. Compared to conventional manufacturing processes, the parts produced

162
using SLS or any other additive manufacturing process are generally poor and inferior
in terms of accuracy, where shrinkage and warping represent the most common sources
of inaccuracy in SLS process. In selective laser sintering there are four major elements
that may affect part accuracy, namely the CAD model approximation, distortion caused
during building, the stair-step effect on curved surfaces and surface roughness resulting
from the process. Distortions such as curling, glazing and bonus- Z are common
problems in the SLS machines. These problems can be reduced as a result of
improvement in the properties of SLS materials [51], [105].
Distortions are changes of geometry during or after the building process. In this sense,
geometric distortion in selective laser sintering greatly affects the accuracy of the
shaped parts by SLS. One of the main sources of size and shape variations of selective
laser sintered parts is shrinkage during processing. Shrinkage is strongly influenced by
the processing parameters (such as laser parameters, build chamber temperature,
cooling rate) and the geometry of the part. The total shrinkage in the SLS process is a
result of material shrinkage, process shrinkage and thermal shrinkage.
It is well-established that materials chosen to be used for SLS have a large difference
between the melting and crystallisation temperature. If this temperature range is too
narrow, warping can occur in the SLS part after it has been sintered. If the range is
large enough, warping will not be as serious or will not occur at all. When the material
has been sintered, the melted powder will stay in the liquid phase as it cools down.
While in the liquid phase, the material does not accumulate stress, so the cooling
process should be slow and gradual. If the part cools down too quickly, then stress
points can accumulate on the part which causes it to warp once it has hardened.

163
Therefore, polymer materials which have a large difference between the melting and
crystallisation temperatures are desired [64]. During crystallisation, the molecules
arrange themselves and occupy less volume, thus leading to material shrinkage. During
processing, the powder particles fuse together to produce dense parts, leading to a
decrease in porosity and volume. During heating, the part expands due to the coefficient
of thermal expansion and then shrinks during cooling.
The result of shrinkage and warping is the curling phenomenon, which is identified
when the downward-facing surface of a part, intended to be flat, exhibits a curved
profile close to the free edges (in which the surface profile of a specimen that was
designed to be flat becomes concave in shape after sintering). In general, curling is
caused by uneven shrinkage between the top and bottom of the part. Fig (5.1) shows
shape distortion in the SLS process.
However, adequate thermal control is necessary to prevent accuracy problems
associated with curling. Curling can occur at the part bed surface or in-build, or as the
part is cooled from the build temperature to room temperature or post-build. In-build
curling is caused by thermal stresses and layerwise shrinkage stresses. These stresses
can be minimised by maintaining the part bed at a temperature near the melting
temperature of the material. At this temperature, the thermal gradients between the part
and surrounding powder are minimised [93].
In the build stage, in-build curling occurs when the edges or corners of the part rise
above the powder bed surface. This is mainly due to uneven temperature distribution in
the part bed. In-build curling develops when the part temperature dips too low after the

164
feed powder is added. However, strong curling up of the part can cause the part to shift
when the roller passes, Fig (5.2). On the other hand, an excessive cooling rate and
thermal gradients produce unbalanced stresses in the sintered part, causing the final part
to become curved. If the part is not allowed to cool in a controlled environment for a
long time, the part will tend to warp due to faster cooling in the outside environment. In
addition, during faster cooling, the part develops significant stresses causing post-build
warpage.
Additionally, curling has also been reported to vary according to the location of the part
in the part bed. Surfaces of the part bed and cylinder wall are typically cooler than the
sintered part and its surrounding powder. Therefore, parts placed close to these surfaces
were seen to experience more curling than other positions in the part bed due to the
heterogeneous cooling taking place within the part. However, in order to decrease the
differential shrinkage, minimise the thermal distortion and facilitate fusion of powder
particles, the SLS machine manufacturer (DTM) recommends, as a corrective measure,
that the entire machine bed be heated to a temperature below the melting point of the
material before the laser scans. To this end, in order to improve the accuracy of the
sintered parts, the shrinkage behaviour of parts during manufacture needs to be better
understood. Considerable research has been performed on developing methods to
investigate this issue.

165
Fig (5.1) Curling of SLS part
Curled part after solidification
Ideal part
Side view of a part

166
Fig (5.2) Curling up of parts during the SLS process

167
The present investigation is concerned with improvements to the geometrical accuracy
in producing plastic parts by the SLS process. Previous studies in this direction have
concentrated primarily on the effects of heat transfer and thermal stress analysis on part
curling. There has been no detailed study on the effect of other important process
parameters such as laser power, powder composition, powder base thickness, layer
cooling time, etc., on the curling phenomenon. In this chapter, the effect of these
parameters is investigated.
It is evident from the review of the literature in chapter 2 that the understanding which
has developed on variations in curling due to material properties and process
parameters is useful for finding an optimum set of process parameters to produce
accurate parts. This experimental study was an attempt to enrich the existing knowledge
about the influence of processing parameters and material properties on shape
distortions in SLS of polyamide 12 composites.
For a given composite material, it is possible to moderate shrinkage and growth by
adding a reinforcement or filler to the system. It is also possible to achieve near-zero
shrinkage with multiphase coated particle morphologies [93]. Table (5.1) and Fig (5.3)
show the relationship between percentage shrinkage and filler content. It can be seen
that the shrinkage amount decreases significantly with the increase of glass beads ratio.
168
Table (5.1) Dependency of percentage shrinkage in the length of tensile bars on glass
beads content
Materials PA12 PA12/CP03 composites [wt%]
0:100 90/10 80/20 70/30 60/40
Measured length L [mm]
154.09 154.40 154.94 155.36 155.49
154.40 154.69 155.11 155.51 155.72
154.36 154.74 155.11 155.54 155.85
154.12 154.65 155.03 155.40 155.58
154.14 154.65 154.97 155.46 155.52
154.10 154.52 154.95 155.43 155.44
Percentage shrinkage [%]
0.59 0.39 0.04 -0.23 -0.32
0.38 0.20 -0.07 -0.33 -0.46
0.41 0.17 -0.07 -0.35 -0.55
0.57 0.22 -0.02 -0.26 -0.37
0.55 0.22 0.02 -0.30 -0.33
0.58 0.31 0.03 -0.28 -0.28
Average 0.51 0.25 -0.01 -0.29 -0.38

169
-0.5
-0.4
-0.3
-0.2
-0.1
0
0.1
0.2
0.3
0.4
0.5
0.6
0 10 20 30 40 50
Fig (5.3) Dependency of percentage shrinkage on glass bead content
Glass bead content [wt%]
Shr
inka
ge [%
]

170
5.2. Implementation of Taguchi method in the optimisation of curling in
SLS
Optimising parameter design problems is routinely performed in the manufacturing
industry, particularly in setting final optimal process parameters. Previously, trial-and-
error processes were used, depending on experience and intuition, to determine optimal
process parameter settings. However, the trial-and-error process is costly and time
consuming, and thus it is not suitable for complex manufacturing processes [115],
[116]. Subsequently, the Taguchi parameter design method was applied in the current
study to determine the optimal process parameter settings.
Since curling has a direct impact on the accuracy and the qualities of the produced part,
the design of experiments (DOE) method was proposed in this study to identify an
optimal process parameter setting that can reduce or even eliminate curling on sintered
parts [117]. The Taguchi method involves reducing the variation in a process through
robust design of experiments. The overall objective of the method is to produce a high
quality product at a low cost to the manufacturer.
The experimental design proposed by Taguchi involves using orthogonal arrays to
organise the parameters affecting the process and the levels at which they should be
varied. Instead of having to test all possible combinations as in factorial design, the
Taguchi method tests pairs of combinations. This allows for the collection of the
necessary data to determine which factors most affect product quality with a minimum
amount of experimentation, thus saving time and resources. The Taguchi method is best
used when there is an intermediate number of variables (3 to 50), few interactions
between variables, and when only a few variables contribute significantly [118].

171
The major steps of implementing the Taguchi method are: (1) to identify the
factors/interactions, (2) to identify the levels of each factor, (3) to select an appropriate
orthogonal array (OA), (4) to assign the factors/interactions to columns of the OA, (5)
to conduct the experiments, (6) to analyse the data and determine the optimal levels and
(7) to conduct the confirmation experiment. Fig (5.4) illustrates the scheme of the major
steps of implementing the Taguchi method. Taguchi method is a technique for
designing and performing experiments to investigate processes where the output
depends on many factors (variables, inputs) without having to tediously and
uneconomically run the process using all possible combinations of values [119], [120].
In Taguchi methodology, the desired design is finalised by selecting the best
performance under given conditions. Basically, the Taguchi method uses two important
tools, namely orthogonal arrays (OA) and signal-to-noise (S/N) ratios. OA is the matrix
of numbers arranged in columns and rows. It has a balancing property in which every
factor setting occurs in the same number of times for every setting of all other factors in
the experiment. Orthogonal arrays allow for studying many design parameters
simultaneously and can be used to estimate the effects of each factor independent of the
other factors. Therefore, information about the design parameters can be obtained with
minimum time and resources. The signal-to-noise ratio is simply a quality indicator by
which the effect of changing a particular design parameter on the performance of the
process or product can be evaluated.

172
Identify the factors/interactions
Fig (5.4) Scheme of the major steps of implementing the Taguchi method [120]
Identify the levels of each factor
Select an appropriate orthogonal array (OA)
Conduct the experiments
Analyse the data, determine the optimal levels (software)
Assign the factors/interactions to columns of the OA
Prediction the performance and Conduct the confirmation
experiment
Phase 1
Phase 2
Phase 3
Phase 4

173
The Taguchi method employs a signal-to-noise (S/N) ratio to quantify the present
variation. These S/N ratios are meant to be used as measures of the effect of noise
factors on performance characteristics. S/N ratios take into account both the amount of
variability in the response data and the closeness of the average response to the target.
Generally, there are several S/N ratios available depending on the type of
characteristics, such as smaller is better, nominal is best and larger is better [120],
[121].
Advantages and disadvantages
An advantage of the Taguchi method is that it emphasises a mean performance
characteristic value close to the target value rather than a value within certain
specification limits, thus improving the product quality. Additionally, the Taguchi
method for experimental design is straightforward and easy to apply to many
engineering situations, making it a powerful yet simple tool. It can be used to quickly
narrow down the scope of a research project or to identify problems in a manufacturing
process from data already in existence. Also, the Taguchi method allows for the
analysis of many different parameters without a prohibitively high amount of
experimentation. In this way, it allows for the identification of key parameters that have
the most effect on the performance characteristic value so that further experimentation
on these parameters can be performed and the parameters that have little effect can be
ignored [118].
The main disadvantage of the Taguchi method is that the results obtained are only
relative and do not exactly indicate what parameter has the highest effect on the
performance characteristic value. Taguchi parameter design method however, can only

174
find the best specified process parameter level combination, which includes discrete
setting values of the process parameters. Also, since orthogonal arrays do not test all
variable combinations, this method should not be used when all relationships between
all variables are needed. The Taguchi method has been criticised in the literature for
difficulty in accounting for interactions between parameters. Furthermore, since
Taguchi methods deal with designing quality into products and processes rather than
correcting for poor quality, they are applied most effectively at early stages of process
development. After design variables are specified, the use of experimental design may
be less cost effective [115], [118].
5.3. Experimental procedure
5.3.1. Description of experimental set-up
The SLS process involves a large number of process parameters that are carefully
controlled by the operator. Most of the process parameters are decided by the
knowledge and experience of the machine builder and machine operator.
The experimental study presented in this chapter aims, based on the Taguchi method, to
investigate the curling behaviour of polyamide/glass bead composites sintered using a
DTM 2000 laser sintering machine with changes in material compositions, part bed
temperature, powder base thickness, laser power and layer cooling time. Experiments
based on the DOE method were utilised to determine an optimal parameter setting for
achieving a minimum or zero amount of curling on specimens fabricated using the
selective laser sintering (SLS) process.

175
Selection of process parameters and fabrication
Notably, there are many factors that should be considered in the fabrication of sintered
parts. Some of them are straightforwardly related to the fabrication process itself, while
others are more difficult to control, related to properties of the material and machine
condition. Scan speed, layer thickness, scan spacing, laser power, powder particle size,
powder size distribution, scanning strategy and part bed temperature represent
important parameters which affect the SLS process. The effect of several combinations
of these parameters on the accuracy of SLS parts have been investigated by numerous
researchers. In this present experimental study of curling five controlled parameters,
with two levels for each factor, including part bed temperature, laser energy, powder
base thickness, layer cooling time (which is taken into account by varying the number
of specimens contained in the build) and filler ratio were adopted.
Although the variation of scan speed and layer thickness could affect sintered parts in
terms of the quality and the production speed, the effect of these two parameters was
not considered in this study. They were kept constant as default settings recommended
by the manufacturer of the Sinterstation 2000 machine. Additionally, the installed SLS
software in this machine does not allow changes on the two above mentioned
parameters to be applied.
In fact, many specimens were made and measurements were conducted before using the
Taguchi method to find a parameter range in which effective processing takes place
with reasonable stability and consistency of the SLS machine.

176
Details of the material
The specimens used in this study were produced using PA12/CP03 composites.
Polyamide 12 (PA12, PA2200) is a semi-crystalline polymer which represents a
modification of nylon 12 developed for use in SLS machines. However, in the SLS
process, it is common to use composite materials. Glass beads 3000 (CP00: coated and
CP03: uncoated) were blended in different ratios with refreshed polyamide 12 (mixing
ratio of 50% fresh powder and 50% used) to produce the composites.
Geometry of the test specimens
Since curling was to be studied, a test bar was designed as shown in Fig (5.5). In this
section, the geometry of the specimen and the SLS machine parameters used in its
fabrication are introduced. The specimen was a polyamide/glass bead test bar 250 [mm]
in length and 10x4 [mm2] in cross-sectional area.
As previously mentioned, the SLS process consisted of three stages, namely warm-up,
build and cool-down. In the warm-up stage, layers of powder were deposited onto the
part piston. The overall thickness of the powder spread in that stage was approximately
25.54 [mm] (default). This was then followed by the build stage, where the temperature
of the powder in the feed cartridges was maintained at 95 [°C]. Layers of powder were
spread by the roller, with the part heater raising the temperature of the top surface of the
added layer to a set point temperature prior to sintering taking place. The test bar was
produced, in the centre of the part bed, in an arrangement illustrated in Fig (5.6). The
SLS machine parameters selected in fabrication, i.e. laser power (P), beam speed (BS)
and scan spacing (SCSP) were 8 or 10 [W], 914 [mm/s] and 0.25 [mm], respectively.

177
Fig. (5.5) Test bar used for curling investigation
250.00

178
Fig (5.6) Position of the test bar with respect to the part bed and neighbouring parts

179
5.3.2. Design of experiments
A design of experiment is a methodology of experimentation by which the total
information from a system can be obtained by doing minimum number of experiments.
Although the technique is well-known and has been widely used in manufacturing
processes, few of these studies have been reported in the case of SLS.
The main objective of the present investigation was to apply the Taguchi method to
establish the optimal set of control parameters for the minimising of curling on
selective laser sintered parts from polyamide composites. The Taguchi method was
employed in this work to determine the optimal combination of design parameters,
including part bed temperature, laser power, powder base thickness, layer cooling time
and filler ratio.
Selection of control factors and noise factors
Before designing the experiments, an exhaustive evaluation of the factors that could
influence the optimisation of the quality characteristic was carried out. Previous studies
indicated that part bed temperature, laser power, layer cooling time and part
location/position/orientation have an influence on curling in the selective laser sintering
process (SLS). In this study, as controllable factors, part bed temperature (A), laser
power (B), powder base thickness (C), layer cooling time (D) and filler ratio (E) were
selected. Based on experimental trials and experience with the SLS process, five main
parameters were chosen. These parameters are considered as control variables.
However, besides these parameters, which are controlled, there are also uncontrolled
factors that have an effect on the SLS process. The controllable and uncontrollable
factors generate signals and noise. Signals are the factors that work in favour of
180
sintering process performance and noise is the factors that work against sintering
process performance. The goal of the experiments was to increase the signal within the
chosen factors and to reduce the noise from uncontrollable factors [122]. Tables (5.2)
and (5.3) list the variable factor levels and noise factors, respectively. The model of the
SLS process is shown in Fig (5.7).
In order to achieve the abovementioned goal, the following guidelines were taken into
consideration for the DOE:
- The design and analysis of the experiment must be as simple as possible.
- The inputs of the SLS process are defined on the basis of theoretical and
practical knowledge.
- It is important to distinguish between the practical and statistical significance of
the results
- The physical and engineering knowledge about the problem, because a
statistical evaluation is not enough if the results are not evaluated properly
[123], [124].
Selection of the orthogonal array
The arrays were selected by the number of parameters (variables) and the number of
levels (states). However, the effect of many different parameters on the performance
characteristic in a condensed set of experiments can be examined using the orthogonal
array experimental design proposed by Taguchi. The selection of the orthogonal array
is based on the number of parameters and the levels of variation for each parameter.

181
Table (5.2) The factors that may have an effect on the SLS process
Controlled factors Uncontrolled factors
- Part bed Temperature , T
- Laser Power, LP
- Powder base thickness, BT
- Cooling time , CT
- Filler ratio FR
- Layer thickness Lt
- Scan speed … etc.
- Chamber temperature variation
- Composite homogeneity
- Moisture in the material
- Optical properties
- Machine condition
- Building position
- Size of building part … etc.

182
Table (5.3) List of SLS experimental parameters and their factor levels
Description Parameters Number
of levels 1 2
Part bed temperature , T [°C] 2 170 172
Laser power, LP [W] 2 8 10
Powder base thickness, BT [mm] 2 20 40
Layer cooling time , CT [s] 2 One part Group of parts
Filler ratio, FR [w%] 2 10 40

183
Fig (5.7) The model of the SLS process in the Taguchi method
Part accuracy Dimensions Distortion Surface finish
Material properties: Tm; Tg; ρ; composition; particle size; etc.
Noise factors Machine related Material related Part related Process related
SLS System DTM sinterstation 2000 machine
SLS processing parameters: Tb; LP; LT; SS …etc

184
Determining what levels of a variable to test requires an in-depth understanding of the
process, including the minimum, maximum and current value of the parameter.
Therefore, knowing the number of parameters and the number of levels, the proper
orthogonal array can be selected [118].
As mentioned above, there are many SLS parameters that have some effect on the
geometric accuracy of sintered parts. In this way, since five control factors were studied
in this investigation, two levels of each factor were considered, the lowest array that
can represent this design is a modified L8 array, as shown in Table (5.4). The number of
levels for all parameters in the experimental design was chosen to be the same to aid in
the selection of a proper orthogonal array.
An orthogonal array of the L8 (25) type was selected to be used for these experiments.
This design required eight experiments with five parameters at two levels of each. In
the notation L8 (25), L indicates that the information is based on the Latin square
arrangement of factors. A Latin square arrangement is a square matrix arrangement of
factors with separable factor effects. The number 8 of the notation states the number of
experiments required when using the orthogonal array while the number 5 of the
notation is the maximum number of factors that can be studied using the array. The
number 2 of the notation indicates the number of factor levels. The interactions were
neglected. Table (5.5) shows the filled-in L8 for experimental runs and level
combinations. This setup allows the testing of all five variables without having to run
32 [= 25 = (2 temperatures)(2 laser powers)(2 powder base thicknesses)(2 layer cooling
times)(2 filler ratios] separate trials. With the actual variables and states (levels), the L8
array should look like the one represented in Table (5.5) which shows

185
Table (5.4) Layout of the L8 orthogonal array
Exp. No A B C D E
1 1 1 1 1 1
2 1 1 1 2 2
3 1 2 2 1 1
4 1 2 2 2 2
5 2 1 2 1 2
6 2 1 2 2 1
7 2 2 1 1 2
8 2 2 1 2 1

186
Table (5.5) The filled in L8 for experimental runs and level combinations
Exp. No Part bed
temperature (A)
[°C]
Laser power
(B)
[W]
Powder base
thickness (C)
[mm]
Layer cooling
Time (D)
[s]
Filler
Ratio (E)
[wt%]
1 170 8 20 O 10
2 170 8 20 G 40
3 170 10 40 O 10
4 170 10 40 G 40
5 172 8 40 O 40
6 172 8 40 G 10
7 172 10 20 O 40
8 172 10 20 G 10

187
the five control factors and their level setting values. The values of the parameters were
chosen to comply with the manufacturer’s recommendations.
5.4. Curling measurement procedure
According to the experimental plan shown in Table (5.4) several samples were
fabricated in pure PA12, PA12/CP00 and PA12/CP03 on the Sinterstation 2000
sintering machine. Figure (5.5) shows the test bar used in curling study. In this
particular case, the problem to be solved is to determine the optimal processing
parameters that lead, as much as possible, to a minimal amount of curling on sintered
parts. Curling is generally defined as a departure from a desired flat shape of a
produced part. A method to measure curling on sintered parts has been proposed. The
method is based on measurement of the out-of-plane edges of a curled specimen.
In order to determine the amount of curling, measurements of the thickness of the
cleaned and sandblasted test bars were required. These were carried out by using a
digital micrometer. The test bar for which curling was to be measured was first placed
with its top surface facing upwards onto a flat measuring table, as shown in Fig (5.8).
The measuring table was taken as the reference for measurements. Curling was
examined by measuring the upward edges of the produced bars. The measurements
were performed using a Mitutoyo HDS digital height gauge (Fig 5.8). The procedures
of curling measurement were as follows: (a) the testing bar was placed on the flat
surface of the measuring table; (b) the height gauge was moved down until its stylus
touched the edge of the testing bar to measure the maximum vertical distance of the
point on the edge of the bar from a flat reference plane; (C) the curling amount was
then calculated by the formula: C = hmax – ta, as a difference in height between the

188
average thickness at the centre and maximum height at the outer edges of the specimen.
The measuring principle is shown in Fig (5.9). Each run would have two data values
collected. Therefore, a total of 8 x 2 = 16 data values were collected per trial. The
measured values obtained from test bars showed that curling amount on the samples
sintered in PA12/CP03 system was notably small compared to that observed on
samples produced from pure PA12 or PA12/CP00 system. So based on this fact the
measured data of PA12/CP03 system were adopted for analysis in this investigation.
The results of measurements of curling are shown in Table (5.6). These data were used
in the statistical analysis by employing main effects, signal-to-noise ratio (S/N) and
ANOVA analyses as explained in the section below.
5.5. Statistical analysis of experimental data
To this point, the experimental design has been determined and the trials have been
carried out. The measured performance characteristic from each trial can be used to
analyse the relative effect of the different parameters on curling.
Selection of the quality characteristic
Basically, there are three types of quality characteristics in the Taguchi methodology
such as the-smaller-the-better, the-larger-the-better and the-nominal-is-best. Smaller
curling values represent a better or improved quality characteristic. The formula for the
three types are given as follows [115]:
Nominal the best: S/N =
2
2
log10S
yx
Larger the better: S/N =
− ∑
=
n
i iynx
12
11log10

189
Fig (5.8) Measurement arrangement of curling
Test sample
Height gauge
Reference table

190
Fig (5.9) Definition for symbols: C; ta; hmax
hm
ax
C
t a

191
Table (5.6) Values of thickness and curling for L8 orthogonal array from three sets of
experiments
Trial 1
Sample Thickness [mm] Height [mm] Curling [mm]
Run
No.
Left Centre Right tavg,T1 hLeft hRight havg CT1
1 10.049 10.029 10.011 10.03 11.84 11.63 11.735 1.705
2 10.139 10.137 10.052 10.11 11.84 12.07 11.955 1.845
3 10.167 10.338 10.352 10.28 10.48 10.39 10.435 0.155
4 10.166 10.450 10.168 10.26 11.29 11.29 11.290 1.030
5 10.186 10.396 10.300 10.29 10.36 10.67 10.515 0.225
6 10.218 10.319 10.331 10.29 11.01 11.17 11.090 0.800
7 10.180 10.118 10.140 10.15 11.79 12.27 12.030 1.880
8 10.200 10.329 10.232 10.25 11.36 11.59 11.475 1.225
Trial 2
Part Thickness [mm] Height [mm] Curling [mm]
Run
No.
Left Centre Right tavg,T2 hLeft hRight havg CT2
1 10.054 10.059 9.900 10.00 11.71 11.34 11.525 1.525
2 9.640 10.068 9.500 9.77 11.65 11.78 11.715 1.715
3 10.069 10.170 10.141 10.13 10.85 10.92 10.885 0.755
4 10.137 10.136 10.094 10.12 10.84 10.64 10.740 0.620
5 10.193 10.285 10.221 10.23 11.36 11.68 11.520 1.290
6 9.983 10.283 10.021 10.09 10.97 11.44 11.205 0.235
7 10.268 10.569 10.009 10.28 11.56 11.89 11.725 1.445
8 10.090 10.116 10.064 10.09 11.57 11.71 11.640 1.550
Trial 3
Part Thickness [mm] Height [mm] Curling [mm]
Run
No.
Left Centre Right tavg,T3 hLeft hRight havg CT3
1 10.040 10.027 9.939 10.00 12.17 11.99 12.080 2.080
2 9.754 10.118 9.731 9.87 12.45 12.06 12.255 2.255
3 10.015 10.137 10.166 10.11 11.46 11.46 11.460 1.350
4 10.206 10.400 10.342 10.32 11.21 11.39 11.300 0.980
5 10.112 10.236 10.148 10.16 10.73 11.41 11.070 0.910
6 10.177 10.313 10.198 10.23 10.72 11.19 10.955 0.725
7 10.179 10.109 10.125 10.14 12.43 11.88 12.155 2.015
8 10.252 10.214 10.228 10.23 11.88 11.52 11.700 1.470

192
Smaller the better: S/N =
− ∑=
n
iiy
nx
1
21log10
The nominal-is-best characteristics include the loss of functions that the system output
should reach; larger-the-better characteristics mean that when the output becomes
larger, it should better; smaller-the-better characteristics are such that the smaller the
output of the system, the better the characteristics are [116].
The study of distortion of a flat part is very important because the distortion will affect
part stability, especially when the part is to be used for tooling. Therefore, in order to
have accurate parts, the amount of curling must be as small as possible. Curling is an
undesirable phenomenon in the SLS process and it has to be minimised. The most
desired value is zero. In terms of geometrical accuracy, less curling is the indication of
better performance of the process. Therefore, a smaller-the-better quality characteristic
was selected in this investigation for obtaining optimum processing parameters for
minimum curling.
5.5.1. Main effects
These are separate effects of each factor and are commonly called main effects. The
primary goal in conducting this type of experiment is to optimise the parameter level
for each factor, so that the output performance measure gives a low amount of curling.
The average value of curling for each factor (A, B, C, D and E) at each level (level 1
and level 2) was obtained and the results are summarised in Table (5.8). Fig (5.10)
presents the main effect graph for the average amount of curling. This graph is based on
the average curling presented in Table (5.7). The quality characteristics investigated in
this study was “the-smaller-the-better” owing to the fact that smaller

193
Table (5.7) Experimental results for curling measurements (PA12/CP03 system)
Exp
No
Part bed
temperature
[°C]
Laser
power
[W]
Powder
base
thickness
[mm]
Layer
cooling
Time
[s]
Filler
Ratio
[wt%]
CT1 CT2 CT3 Cavg
(Mean)
1 170 8 20 O 10 1.705 1.525 2.080 1.895
2 170 8 20 G 40 1.845 1.715 2.255 1.938
3 170 10 40 O 10 0.155 0.755 1.350 0.753
4 170 10 40 G 40 1.030 0.620 0.980 0.877
5 172 8 40 O 40 0.225 1.290 0.910 0.808
6 172 8 40 G 10 0.800 0.235 0.725 0.587
7 172 10 20 O 40 1.880 1.445 2.015 1.780
8 172 10 20 G 10 1.225 1.550 1.470 1.415

194
Table (5.8) Level averages for main effects
Average curling [mm] Symbol Parameters/Factors
Level 1 Level 2
A Part bed temperature, T [°C] 1.366 1.147
B Laser power, LP [W] 1.307 1.206
C Powder base thickness, PBT [mm] 1.757 0.756
D Layer cooling time, LCT [s] 1.309 1.204
E Filler ratio, FR [w%] 1.162 1.351

195
21
1.8
1.5
1.2
0.9
21 21
21
1.8
1.5
1.2
0.9
21
A
Mean of Means
B C
D E
Main Effects Plot for Means
Data Means
Fig.(5.10) Main effects graphs for average curling A Part bed temperature B Laser power C Powder base thickness D Layer cooling time E Filler ratio

196
curling represents higher quality of parts in terms of geometrical accuracy. Thus, for the
smallest curling, the best parameter levels were: part bed temperature at level 2 (A2),
laser power at level 2 (B2), powder base thickness at level 2 (C2), layer cooling time at
level 2 (D2) and filler ratio at level 1 (E1).
5.5.2. Analysis using signal to noise (S/N) ratio
To determine the effect each variable has on the output, the signal-to-noise ratio (or the
SN number) needs to be calculated for each experiment conducted. In the Taguchi
method, the S/N ratio is a measure of quality characteristic deviation from the desired
value. The term signal represents the desirable value (mean) and the noise represents
the undesirable value (standard deviation from the mean) for the output characteristic
[118].
The signal-to-noise ratio is used in evaluating the quality of the product and is an
objective measure of quality that takes both the mean and variance into account. The
signal-to-noise ratio measures the level of performance and the effect of noise factors
on performance and is an evaluation of the stability of the performance of output
characteristics. As mentioned above, for determining the signal-to-noise ratio for the
curling response, a smaller-the-better type S/N ratio was implemented and introduced.
In the case of minimising the quality characteristic, the SN ratio is calculated using
equation (5.1):
S/N =
− ∑=
n
iiy
nx
1
21log10 where MSDy
n
n
ii =
∑
=1
21 …. (5.1)

197
In the equations above, n is the number of trials for experiment i, yi is the value for ith
trial in that experiment, i is the experiment number and MSD is the mean square
deviation.
In this study, three trials for each experiment were conducted. The S/N ratios for eight
experiments were calculated for the target value using equation (5.1). The data obtained
are presented in Table (5.9). Shown below is an example for the calculation of the SN
ratio:
033.5080.2525.1705.13
1og101
3
1
222 −=
++−= ∑=i
lSN …. (5.1-a)
After calculating the S/N ratio for each experiment, the average S/N value was
calculated for each factor and level (equations 5.2). This was done as shown below:
ij
ii
ij N
SNSN
,
4
,
∑= where j = A; B; C; D; E and i = 1; 2 ….(5.2)
236.24
96.094.081.503.5
4
43211, −=++−−=+++= SNSNSNSN
SNA ….(5.2-a)
881.04
87652, −=+++= SNSNSNSN
SNA …. (5.2-b)
Significance of each source
From Table (5.9), it can be seen that experiment number 6 yielded the highest S/N ratio
and the smallest MSD. For this experiment, the combination of parameters and their
levels was A2, B1, C2, D2 and E1 as indicated in Table (5.5). This result was different
from that obtained from the main effect analysis and did not represent the optimum
combination of parameters and their levels. However, this shows that in the present
investigation, the combination of parameters and their levels A2, B1, C2, D2

198
Table (5.9) The S/N ratio results for curling
Exp. No A B C D E T1 T2 T3 MSD SN [db]
1 170 8 20 O 10 1.705 1.525 2.080 3.186 -5.033
2 170 8 20 G 40 1.845 1.715 2.252 3.805 -5.809
3 170 10 40 O 10 0.155 0.755 1.350 0.805 +0.939
4 170 10 40 G 40 1.030 0.620 0.980 0.802 +0.959
5 172 8 40 O 40 0.225 1.290 0.910 0.848 +0.718
6 172 8 40 G 10 0.800 0.235 0.725 0.407 +3.904
7 172 10 20 O 40 1.880 1.445 2.015 3.227 -5.089
8 172 10 20 G 10 1.225 1.550 1.470 2.021 -3.056

199
Table (5.10) The range of each parameter
Level A B C D E
1 -2.236 -1.555 -4.747 -2.116 -0.811
2 -0.881 -1.562 +1.630 -1.000 -2.305
∆ 1.355 0.007 6.376 1.116 1.494
Rank 3 5 1 4 2

200
and E1 yielded the optimum quality characteristic with minimum variance around the
target value, and it could serve as a possible initial optimal process parameter setting.
The range (delta, ∆) of the SN for each parameter was calculated from equation (5.3)
and then entered into Table (5.10). The larger the ∆ value for a parameter, the larger the
effect the variable has on the amount of curling. This is because the same change in
signal causes a larger effect on the output variable being measured. The effect of the
factor was then calculated by determining the range [118]:
valuelowestvaluehighestDifference i −=∆ )( …. (5.3)
It can be seen that powder base thickness had the largest effect on the amount of curling
and that laser power had the smallest effect on curling.
5.5.3. Data analysis by the ANOVA technique
The data coming from the experimental trials needed to be evaluated by the analysis of
variance (ANOVA). The main objective of the analysis was to determine the influence
of every parameter on the variance of the result, regarding the total variance of all the
parameters.
Analysis of variance is a method of partitioning variability into identifiable sources of
variation. In this work, ANOVA was conducted to find the significance factors that
affected the amount of curling on a selective laser sintered specimen. This analysis was
performed on the S/N ratios to obtain the percentage contribution of each of the factors.
201
The relative percentage contribution among the factors was determined by comparing
their relative variance.
Basically, ANOVA helped with computing quantities such as degrees of freedom, sums
of squares, variance, F-ratio, pure sum of square and percentage contribution. The
example calculations of these quantities, based on the ANOVA analysis of the data in
Table (5.9), are shown below and the results are summarised in Table (5.11). The
following were the ANOVA terms used for analysing the experimental results [116]:
- Sum of squares (SS): It is the sum of squares of all the trial run results.
2,
21,2
1
21,1 ... ji
N
yyySS +++=∑ i is experiment number ; j is trial number
- Total sum of squares (SST): It is the difference between the sums of squares of all the
trial run results and the Correction Factor (CF).
CFySSN
iiT −=∑
=1
2 yi is the value of each result
- Correction factor (CF): the term that reduces the variation of the process.
N
TCF
2
= T is the sum of all results; N is the total number of results
- Degrees of freedom ( f ): the number of degrees of freedom for a factor is equal to
one less than the number of levels of that factor.
- Variance (V): the variance of each factor is determined by the sum of the squares of
each trial sum of results involving the factor divided by the degrees of freedom of the
factor.
f
SSV f
i = SSf is the sum of squares of the factor; f is the degrees of freedom
- Variance ratio (F): it is the ratio of variance of each factor to the error variance.

202
e
fi V
VF =
- Percentage of contribution (P): the percentage of the contribution of each factor is
the ratio of the factor sum of squares to the total sum of squares.
T
fi SS
SSP =
- Degree of freedom ( f )
Total degrees of freedom:
fT = N- 1 = 8 – 1 = 7
where N is the total number of results.
For factor A,
fA = lA -1 = 2- 1 =1
where lA is the number of levels for factor A.
For error:
fe = fT – fA – fB – fC – fD – fE = 7 – 1 - 1 -1 - 1 - 1 = 2
- Sum of squares (SS)
Total sum of squares:
CFySSN
iiT −=∑
=1
2 8
)415.1...895.1()415.1...895.1(
222 ++−++= = 2.218
( ) ( )8
2
2
2
2
1
2
1 T
N
A
N
ASS
AAA −+= ∑∑
4
)877.0753.0938.1895.1( 2+++=4
)415.1780.1587.0808.0( 2++++
8
)415.1...895.1( 2++− = 0.095

203
For error:
SSe = SST – SSA – SSB – SSC – SSD – SSE
= 2.218 – 0.095 – 0.020 – 2.003 – 0.022 – 0.071 = 0.007
- Variance (V):
i
ii f
SSV =
For factor A:
A
AA f
SSV = 095.0
1
095.0 ==
For error:
- F-ratio (F):
For factor A:
667.31003.0
095.0 ===e
AA V
VF
- Percentage contribution (P)
For factor A:
100xSS
SSP
T
AA = %28.4100
218.2
095.0 == x
Table (5.11) shows the results of the ANOVA for the curling investigation. Based on
the main effect, the optimal combination of parameters and their levels for achieving
the minimum amount of curling was determined to be A2, B2, C2, D2 and E1, i.e. part
bed temperature at level 2 (172°C), laser power at level 2 (10 W), powder base
003.02
007.0 ===e
ee f
SSV

204
Table (5.11) ANOVA table
Source f SS V F P [%]
Part bed temperature (A) 1 0.095 0.095 31.667 4.28
Laser power (B) 1 0.020 0.020 6.667 0.90
Powder base thickness (C) 1 2.003 2.003 667.667 90.31
Layer cooling time (D) 1 0.022 0.022 7.333 0.99
Filler ratio (E) 1 0.071 0.071 23.667 3.20
Error 2 0.007 0.003 1 0.32
Total 7 2.218 100%

205
thickness at level 2 (40 mm), layer cooling time at level 2 (G) and filler ratio at level 1
(10 wt%).
The results reveal that the powder base thickness had the maximum contribution, which
was 90.31%, to the quality characteristic. The factors: part bed temperature with 4.28%
followed by filler ratio with 3.20%, layer cooling time with 0.99% contribution then
laser power which was 0.90% were not significant affecting factors for minimum
curling. Fig (5.11) reveals the percent contribution of the factors.
In the three previous subsections, several tools, techniques and equations were
discussed. Each of these tools is well-known and extensively used in the scientific and
engineering professions. Just as with any tool, the intent and the results need to be
compared and grounded with process knowledge. However, statistical methods cannot
prove that a factor (or factors) has a particular effect. They only provide guidelines as
to the reliability and validity of results. Properly applied statistical methods do not
allow anything to be proven experimentally, but they do allow the likely error in a
conclusion to be measured or to the attached level of confidence to a statement. The
primary advantage of statistical methods is that they add objectivity to the decision-
making process. Statistical techniques coupled with good engineering or process
knowledge and common sense will usually lead to sound conclusions [124].

206
1
2
3
4
5
6
Fig (5.11) Percentage contributions of process parameters on the amount of curling on
sintered parts
Part bed temperature 4.28%
Laser power 0.90%
Filler ratio 3.20%
Layer cooling time 0.99%
Powder base thickness 90.31%
Error 0.32%

207
5.6. Summary
This study applied the Taguchi method to establish the optimal set of control
parameters for minimising curling on selective laser sintered parts from polyamide
composites. On the basis of the results obtained from the present investigation, the
following can be concluded:
- The combination of parameters and their levels for the optimum amount of curling is
A2B2C2D2E1, i.e. part bed temperature (172°C), laser power (10 W), powder base
thickness (40 mm), layer cooling time (G), and filler ratio (10 wt%).
- The contributions of part bed temperature, laser power, powder base thickness, layer
cooling time and filler ratio are 4.28%, 0.90%, 90.31%, 0.99% and 3.20%, respectively,
where it was found that the powder base thickness is the most effective factor in the
occurrence of the curling phenomenon.

208
Chapter 6 - Conclusions and Suggestions for Future Work
This research has examined the effect of filler content and its surface treatment as well
as two of processing parameters with the aim of showing their influence on the
mechanical properties and geometric accuracy of selective laser sintered parts from
GB/PA12 composites. In this chapter, the results obtained are summarised and then
possible future directions are discussed.
6.1. Conclusions
This work has demonstrated the effect of different parameters, such as weight ratio and
surface treatment of filler particles, part bed temperature and energy density on the
mechanical properties and geometric accuracy of glass bead-filled PA12 composites.
The addition of coated glass beads to polyamide 12 improves the tensile strength,
elastic modulus, flexural strength and flexural modulus, but generally reduces the
impact strength and the ductility of polyamide 12 with increasing weight ratio of the
glass beads under the experimental conditions applied.
Beside laser power, part bed temperature and other operating parameters covering the
SLS process, the improvements achieved in the mechanical properties and geometric
accuracy of glass bead-filled polyamide 12 composites could be attributed to the good
interfacial bonding between the polyamide matrix and the glass beads. Furthermore,
this study clearly demonstrated, from SEM micrographs taken of the surfaces of the
tensile fracture cross-sections, that the incorporation of the coupling agent to glass
beads improves the mechanical properties of the PA12/GB composites.

209
A higher energy density of the CO2 laser beam results in better fusion of the polymer
particles, enabling a more compact structure with a smoother surface to the build. When
the energy density becomes excessively high, however, degradation of the polymer will
occur, leading to a slight drop in the density of sintered test parts and blistering of the
polymeric material at the surface.
Furthermore, the work presented in this thesis has demonstrated that rigid fillers can
generally be used to increase the mechanical properties and improve the geometric
accuracy of sintered components in PA12/GB composites. In chapters 4 and 5,
experimental evidence for these improvements is presented for PA12/GB composite
systems. Chapter 4 provides evidence for the hypothesis made in chapter 1 on the
importance of interfacial adhesion. In particular, this was investigated using silane
surface-modified glass beads.
There is very little information from previously published work on the influence of
coupling agents on curling. The results of statistical analysis and analysis of variance
presented in chapter 5 provide evidence for the effectiveness of filler content and its
surface treatment on reducing the amount of curling. On the basis of the results
obtained, a combination of parameters A2B2C2D2E1 and their levels the have been
shown to yield an optimum amount of curling (with minimum variance about the
target) on selective laser sintered parts in PA12/CP03 composites. The effect of the
processing parameters applied on curling differed from one parameter to another,
however, the contribution of powder base thickness seemed to be the highest, whereas
other considered parameters had a negligible effect on curling.
210
In general, the addition of glass particles to polyamide 12 improved the behaviour of
curling of PA12/GB composites. The comparison between samples fabricated in pure
PA12, PA12/CP00 and PA12/CP03 revealed that the samples from PA12/CP03 were
significantly flat and more accurate.
As mentioned in chapter 1, this research was driven by an effort to answer the main
research questions that surrounded the improvement of the mechanical properties and
geometric accuracy of selective laser sintered components. The research questions of
this thesis were answered by mapping the research activities to the research questions,
where the testing of the hypotheses was accomplished mainly by physical
experimentation. Those questions and hypotheses and the methods described for testing
these hypotheses are explained as follows:
Testing of hypothesis 1: The background information for this was presented in section
2.3 of chapter 3. This task was executed by mixing PA 12 and glass bead powders in
different weight percentages. This combination was chosen as a model composite since
it showed a number of experimental advantages.
Testing of hypothesis 1.1: Interfacial adhesion is a decisive factor in determining the
properties of composites. Appropriate adjustment of interphase properties and adhesion
strength is a very important condition for achieving acceptable properties. This issue
was experimentally examined in chapters 4 by mechanical testing of sintered parts in
PA12/CP00 system (uncoated) and PA12/CP03 system (coated).
Testing of hypothesis 2: In chapter 5, the experiments performed to test the geometric
accuracy of the selective laser sintered parts were established with DOE using the
process parameters and material properties that expected to have some influence on

211
curling. Curling was measured by building a number of test bars. Data were collected
and statistically analysed for factors influence using S/N ratio, main effects and
ANOVA technique.
Testing of hypothesis 2.1: chapter 5 has documented this issue. The investigation
shows that, beside the processing parameters, it is possible to reduce the shrinkage and
hence, the amount of curling by adding glass beads to polyamide 12.
6.2. Suggestions for Future Work
Some of the new directions that future research can take are as follows:
Materials
This work investigated the effect of composite material properties and processing
parameters on mechanical properties and geometric accuracy. The preliminary
investigation of the composite system has shown promising results. The present
investigation could be expanded to explore:
- other fillers such as wollastonite, talc, mica and kaolin
- different particle sizes and shapes
- interface adhesion using other modifiers such as stearic and titanate coupling agents
Experiments
There are several interesting aspects of this research that can be pursued further, among
the following:
- conducting experiments on the current material composite with other SLS machines in
order to compare the results and determine whether or not the achieved improvements
are common

212
- conducting experiments with other geometries, various sizes, different positions and
locations to widen the knowledge base of SLS geometric accuracy, particularly warping
and curling phenomena
Machines and equipment
Automation in rapid manufacturing techniques is still an open area to researchers. A
selective laser sintering machine working in production may need an automated process
for mixing, cleaning and re-feeding unused material. Integration and combination of
SLS machines with conventional machine tools (industrial robots, manipulators,
fixtures from a flexible system for handling of parts, removal of waste material,
removal of the part from the machine and parts finishing) is one of challenges facing
researchers, engineers and designers alike.
Additionally, the development of a versatile laboratory-scale SLS machine which can
be employed to produce standard testing samples before using powdered material in
main production could be beneficial for accurately and quickly predicting the
mechanical properties and accuracy of SLS processes.
Continuation of this experimental work by other researchers will be beneficial for
materials development and accuracy characterisation in rapid manufacturing
techniques. The experimental techniques are readily transferable to virtually any
material system used in rapid manufacturing.
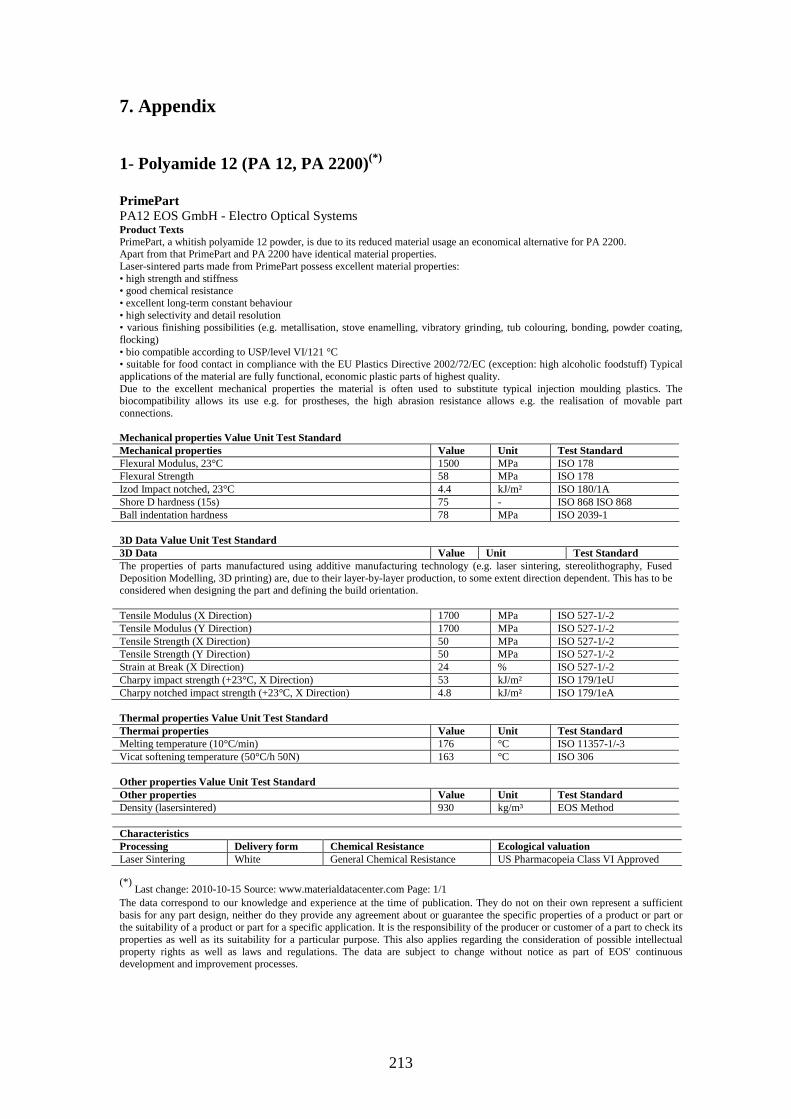
213
7. Appendix 1- Polyamide 12 (PA 12, PA 2200)(*)
PrimePart PA12 EOS GmbH - Electro Optical Systems Product Texts PrimePart, a whitish polyamide 12 powder, is due to its reduced material usage an economical alternative for PA 2200. Apart from that PrimePart and PA 2200 have identical material properties. Laser-sintered parts made from PrimePart possess excellent material properties: • high strength and stiffness • good chemical resistance • excellent long-term constant behaviour • high selectivity and detail resolution • various finishing possibilities (e.g. metallisation, stove enamelling, vibratory grinding, tub colouring, bonding, powder coating, flocking) • bio compatible according to USP/level VI/121 °C • suitable for food contact in compliance with the EU Plastics Directive 2002/72/EC (exception: high alcoholic foodstuff) Typical applications of the material are fully functional, economic plastic parts of highest quality. Due to the excellent mechanical properties the material is often used to substitute typical injection moulding plastics. The biocompatibility allows its use e.g. for prostheses, the high abrasion resistance allows e.g. the realisation of movable part connections. Mechanical properties Value Unit Test Standard Mechanical properties Value Unit Test Standard Flexural Modulus, 23°C 1500 MPa ISO 178 Flexural Strength 58 MPa ISO 178 Izod Impact notched, 23°C 4.4 kJ/m² ISO 180/1A Shore D hardness (15s) 75 - ISO 868 ISO 868 Ball indentation hardness 78 MPa ISO 2039-1 3D Data Value Unit Test Standard 3D Data Value Unit Test Standard The properties of parts manufactured using additive manufacturing technology (e.g. laser sintering, stereolithography, Fused Deposition Modelling, 3D printing) are, due to their layer-by-layer production, to some extent direction dependent. This has to be considered when designing the part and defining the build orientation. Tensile Modulus (X Direction) 1700 MPa ISO 527-1/-2 Tensile Modulus (Y Direction) 1700 MPa ISO 527-1/-2 Tensile Strength (X Direction) 50 MPa ISO 527-1/-2 Tensile Strength (Y Direction) 50 MPa ISO 527-1/-2 Strain at Break (X Direction) 24 % ISO 527-1/-2 Charpy impact strength (+23°C, X Direction) 53 kJ/m² ISO 179/1eU Charpy notched impact strength (+23°C, X Direction) 4.8 kJ/m² ISO 179/1eA Thermal properties Value Unit Test Standard Thermai properties Value Unit Test Standard Melting temperature (10°C/min) 176 °C ISO 11357-1/-3 Vicat softening temperature (50°C/h 50N) 163 °C ISO 306 Other properties Value Unit Test Standard Other properties Value Unit Test Standard Density (lasersintered) 930 kg/m³ EOS Method Characteristics Processing Delivery form Chemical Resistance Ecological valuation Laser Sintering White General Chemical Resistance US Pharmacopeia Class VI Approved (*)
Last change: 2010-10-15 Source: www.materialdatacenter.com Page: 1/1 The data correspond to our knowledge and experience at the time of publication. They do not on their own represent a sufficient basis for any part design, neither do they provide any agreement about or guarantee the specific properties of a product or part or the suitability of a product or part for a specific application. It is the responsibility of the producer or customer of a part to check its properties as well as its suitability for a particular purpose. This also applies regarding the consideration of possible intellectual property rights as well as laws and regulations. The data are subject to change without notice as part of EOS' continuous development and improvement processes.
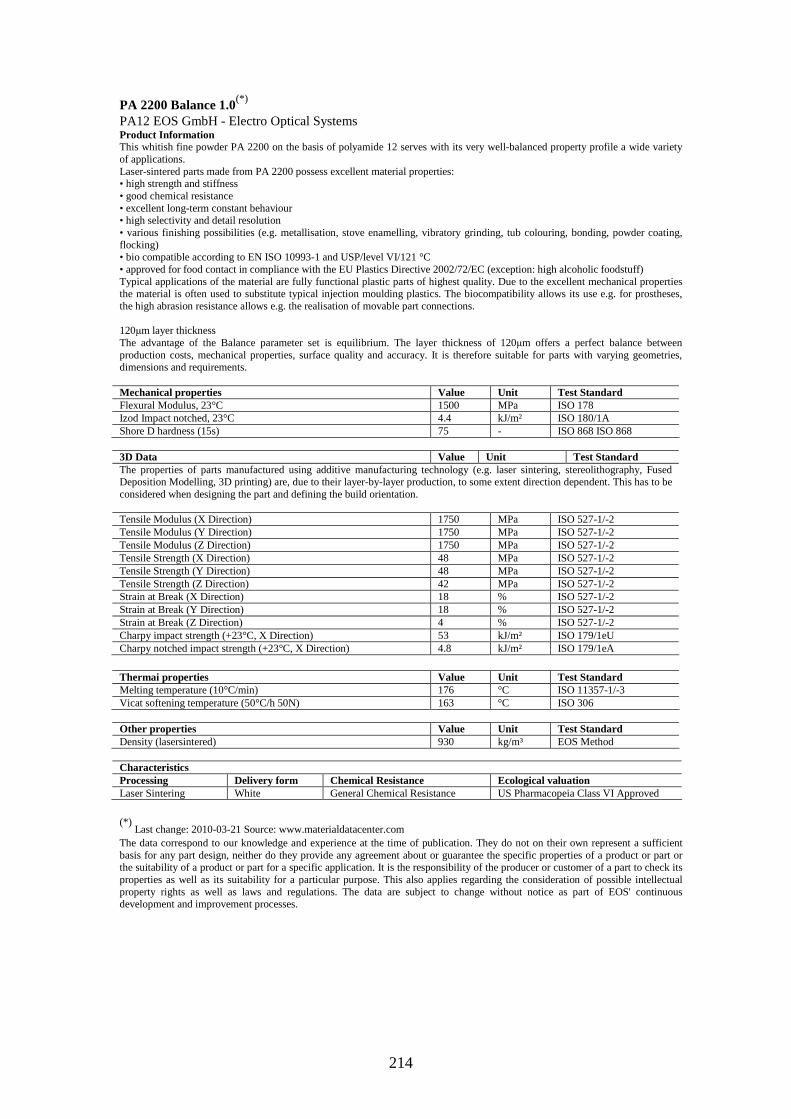
214
PA 2200 Balance 1.0(*) PA12 EOS GmbH - Electro Optical Systems Product Information This whitish fine powder PA 2200 on the basis of polyamide 12 serves with its very well-balanced property profile a wide variety of applications. Laser-sintered parts made from PA 2200 possess excellent material properties: • high strength and stiffness • good chemical resistance • excellent long-term constant behaviour • high selectivity and detail resolution • various finishing possibilities (e.g. metallisation, stove enamelling, vibratory grinding, tub colouring, bonding, powder coating, flocking) • bio compatible according to EN ISO 10993-1 and USP/level VI/121 °C • approved for food contact in compliance with the EU Plastics Directive 2002/72/EC (exception: high alcoholic foodstuff) Typical applications of the material are fully functional plastic parts of highest quality. Due to the excellent mechanical properties the material is often used to substitute typical injection moulding plastics. The biocompatibility allows its use e.g. for prostheses, the high abrasion resistance allows e.g. the realisation of movable part connections. 120µm layer thickness The advantage of the Balance parameter set is equilibrium. The layer thickness of 120µm offers a perfect balance between production costs, mechanical properties, surface quality and accuracy. It is therefore suitable for parts with varying geometries, dimensions and requirements. Mechanical properties Value Unit Test Standard Flexural Modulus, 23°C 1500 MPa ISO 178 Izod Impact notched, 23°C 4.4 kJ/m² ISO 180/1A Shore D hardness (15s) 75 - ISO 868 ISO 868 3D Data Value Unit Test Standard The properties of parts manufactured using additive manufacturing technology (e.g. laser sintering, stereolithography, Fused Deposition Modelling, 3D printing) are, due to their layer-by-layer production, to some extent direction dependent. This has to be considered when designing the part and defining the build orientation. Tensile Modulus (X Direction) 1750 MPa ISO 527-1/-2 Tensile Modulus (Y Direction) 1750 MPa ISO 527-1/-2 Tensile Modulus (Z Direction) 1750 MPa ISO 527-1/-2 Tensile Strength (X Direction) 48 MPa ISO 527-1/-2 Tensile Strength (Y Direction) 48 MPa ISO 527-1/-2 Tensile Strength (Z Direction) 42 MPa ISO 527-1/-2 Strain at Break (X Direction) 18 % ISO 527-1/-2 Strain at Break (Y Direction) 18 % ISO 527-1/-2 Strain at Break (Z Direction) 4 % ISO 527-1/-2 Charpy impact strength (+23°C, X Direction) 53 kJ/m² ISO 179/1eU Charpy notched impact strength (+23°C, X Direction) 4.8 kJ/m² ISO 179/1eA
Thermai properties Value Unit Test Standard Melting temperature (10°C/min) 176 °C ISO 11357-1/-3 Vicat softening temperature (50°C/h 50N) 163 °C ISO 306 Other properties Value Unit Test Standard Density (lasersintered) 930 kg/m³ EOS Method Characteristics Processing Delivery form Chemical Resistance Ecological valuation Laser Sintering White General Chemical Resistance US Pharmacopeia Class VI Approved
(*)
Last change: 2010-03-21 Source: www.materialdatacenter.com The data correspond to our knowledge and experience at the time of publication. They do not on their own represent a sufficient basis for any part design, neither do they provide any agreement about or guarantee the specific properties of a product or part or the suitability of a product or part for a specific application. It is the responsibility of the producer or customer of a part to check its properties as well as its suitability for a particular purpose. This also applies regarding the consideration of possible intellectual property rights as well as laws and regulations. The data are subject to change without notice as part of EOS' continuous development and improvement processes.

215
PA 2200 Performance 1.0(*) PA12 EOS GmbH - Electro Optical Systems Product Information This whitish fine powder PA 2200 on the basis of polyamide 12 serves with its very well-balanced property profile a wide variety of applications. Laser-sintered parts made from PA 2200 possess excellent material properties: • high strength and stiffness • good chemical resistance • excellent long-term constant behaviour • high selectivity and detail resolution • various finishing possibilities (e.g. metallisation, stove enamelling, vibratory grinding, tub colouring, bonding, powder coating, flocking) • bio compatible according to EN ISO 10993-1 and USP/level VI/121 °C • approved for food contact in compliance with the EU Plastics Directive 2002/72/EC (exception: high alcoholic foodstuff) Typical applications of the material are fully functional plastic parts of highest quality. Due to the excellent mechanical properties the material is often used to substitute typical injection moulding plastics. The biocompatibility allows its use e.g. for prostheses, the high abrasion resistance allows e.g. the realisation of movable part connections. 100µm layer thickness Performance is the parameter set of choice for parts with high demands on mechanical properties and fracture behaviour, especially when the part is going to be subjected to multiaxial loading in all three directions. Performance parts are characterized by the highest degree of isotropic strength and rigidity. The choice of 100µm layer thickness results in fine resolution and also very high surface quality and detail resolution. Mechanical properties Value Unit Test Standard Flexural Modulus, 23°C 1500 MPa ISO 178 Izod Impact notched, 23°C 4.4 kJ/m² ISO 180/1A Shore D hardness (15s) 75 - ISO 868 ISO 868 3D Data Value Unit Test Standard The properties of parts manufactured using additive manufacturing technology (e.g. laser sintering, stereolithography, Fused Deposition Modelling, 3D printing) are, due to their layer-by-layer production, to some extent direction dependent. This has to be considered when designing the part and defining the build orientation. Tensile Modulus (X Direction) 1800 MPa ISO 527-1/-2 Tensile Modulus (Y Direction) 1800 MPa ISO 527-1/-2 Tensile Modulus (Z Direction) 1800 MPa ISO 527-1/-2 Tensile Strength (X Direction) 50 MPa ISO 527-1/-2 Tensile Strength (Y Direction) 50 MPa ISO 527-1/-2 Tensile Strength (Z Direction) 50 MPa ISO 527-1/-2 Strain at Break (X Direction) 20 % ISO 527-1/-2 Strain at Break (Y Direction) 20 % ISO 527-1/-2 Strain at Break (Z Direction) 10 % ISO 527-1/-2 Charpy impact strength (+23°C, X Direction) 53 kJ/m² ISO 179/1eU Charpy notched impact strength (+23°C, X Direction) 4.8 kJ/m² ISO 179/1eA Thermai properties Value Unit Test Standard Melting temperature (10°C/min) 176 °C ISO 11357-1/-3 Vicat softening temperature (50°C/h 50N) 163 °C ISO 306 Other properties Value Unit Test Standard Density (lasersintered) 930 kg/m³ EOS Method Characteristics Processing Delivery form Chemical Resistance Ecological valuation Laser Sintering White General Chemical Resistance US Pharmacopeia Class VI Approved (*)
Created: 2011-02-23 Source: www.materialdatacenter.com The data correspond to our knowledge and experience at the time of publication. They do not on their own represent a sufficient basis for any part design, neither do they provide any agreement about or guarantee the specific properties of a product or part or the suitability of a product or part for a specific application. It is the responsibility of the producer or customer of a part to check its properties as well as its suitability for a particular purpose. This also applies regarding the consideration of possible intellectual property rights as well as laws and regulations. The data are subject to change without notice as part of EOS' continuous development and improvement processes.
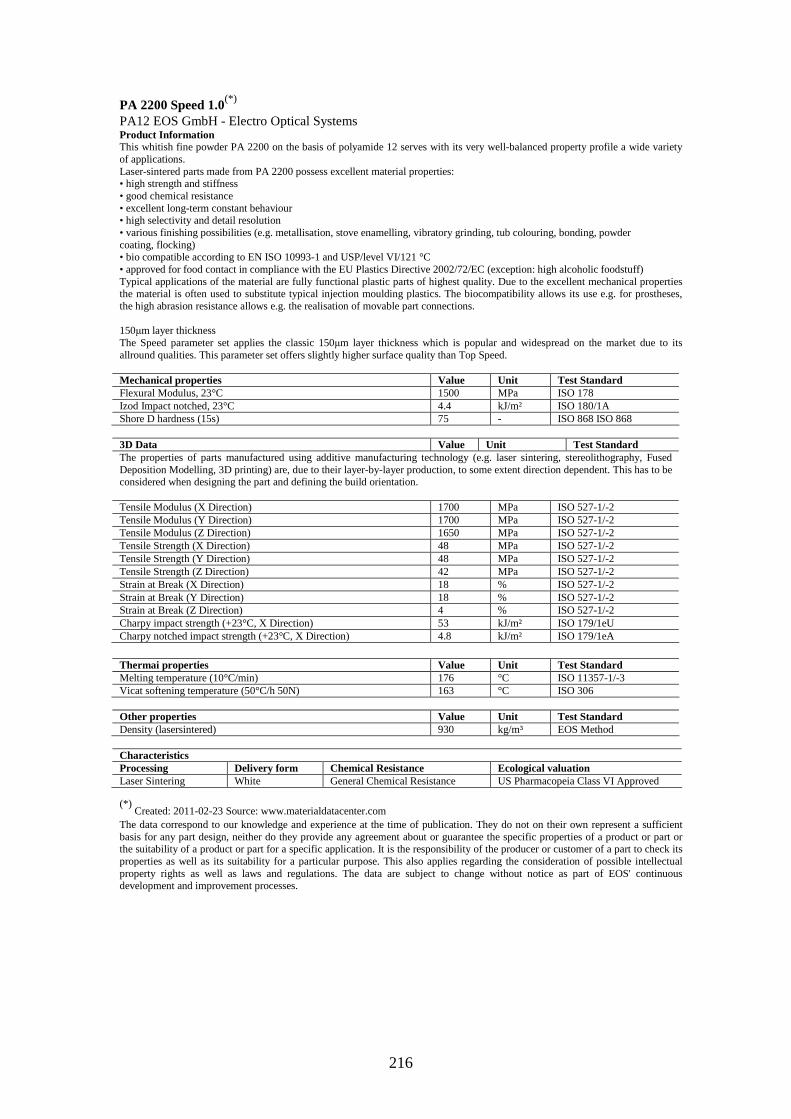
216
PA 2200 Speed 1.0(*) PA12 EOS GmbH - Electro Optical Systems Product Information This whitish fine powder PA 2200 on the basis of polyamide 12 serves with its very well-balanced property profile a wide variety of applications. Laser-sintered parts made from PA 2200 possess excellent material properties: • high strength and stiffness • good chemical resistance • excellent long-term constant behaviour • high selectivity and detail resolution • various finishing possibilities (e.g. metallisation, stove enamelling, vibratory grinding, tub colouring, bonding, powder coating, flocking) • bio compatible according to EN ISO 10993-1 and USP/level VI/121 °C • approved for food contact in compliance with the EU Plastics Directive 2002/72/EC (exception: high alcoholic foodstuff) Typical applications of the material are fully functional plastic parts of highest quality. Due to the excellent mechanical properties the material is often used to substitute typical injection moulding plastics. The biocompatibility allows its use e.g. for prostheses, the high abrasion resistance allows e.g. the realisation of movable part connections. 150µm layer thickness The Speed parameter set applies the classic 150µm layer thickness which is popular and widespread on the market due to its allround qualities. This parameter set offers slightly higher surface quality than Top Speed. Mechanical properties Value Unit Test Standard Flexural Modulus, 23°C 1500 MPa ISO 178 Izod Impact notched, 23°C 4.4 kJ/m² ISO 180/1A Shore D hardness (15s) 75 - ISO 868 ISO 868 3D Data Value Unit Test Standard The properties of parts manufactured using additive manufacturing technology (e.g. laser sintering, stereolithography, Fused Deposition Modelling, 3D printing) are, due to their layer-by-layer production, to some extent direction dependent. This has to be considered when designing the part and defining the build orientation. Tensile Modulus (X Direction) 1700 MPa ISO 527-1/-2 Tensile Modulus (Y Direction) 1700 MPa ISO 527-1/-2 Tensile Modulus (Z Direction) 1650 MPa ISO 527-1/-2 Tensile Strength (X Direction) 48 MPa ISO 527-1/-2 Tensile Strength (Y Direction) 48 MPa ISO 527-1/-2 Tensile Strength (Z Direction) 42 MPa ISO 527-1/-2 Strain at Break (X Direction) 18 % ISO 527-1/-2 Strain at Break (Y Direction) 18 % ISO 527-1/-2 Strain at Break (Z Direction) 4 % ISO 527-1/-2 Charpy impact strength (+23°C, X Direction) 53 kJ/m² ISO 179/1eU Charpy notched impact strength (+23°C, X Direction) 4.8 kJ/m² ISO 179/1eA
Thermai properties Value Unit Test Standard Melting temperature (10°C/min) 176 °C ISO 11357-1/-3 Vicat softening temperature (50°C/h 50N) 163 °C ISO 306 Other properties Value Unit Test Standard Density (lasersintered) 930 kg/m³ EOS Method Characteristics Processing Delivery form Chemical Resistance Ecological valuation Laser Sintering White General Chemical Resistance US Pharmacopeia Class VI Approved (*)
Created: 2011-02-23 Source: www.materialdatacenter.com The data correspond to our knowledge and experience at the time of publication. They do not on their own represent a sufficient basis for any part design, neither do they provide any agreement about or guarantee the specific properties of a product or part or the suitability of a product or part for a specific application. It is the responsibility of the producer or customer of a part to check its properties as well as its suitability for a particular purpose. This also applies regarding the consideration of possible intellectual property rights as well as laws and regulations. The data are subject to change without notice as part of EOS' continuous development and improvement processes.
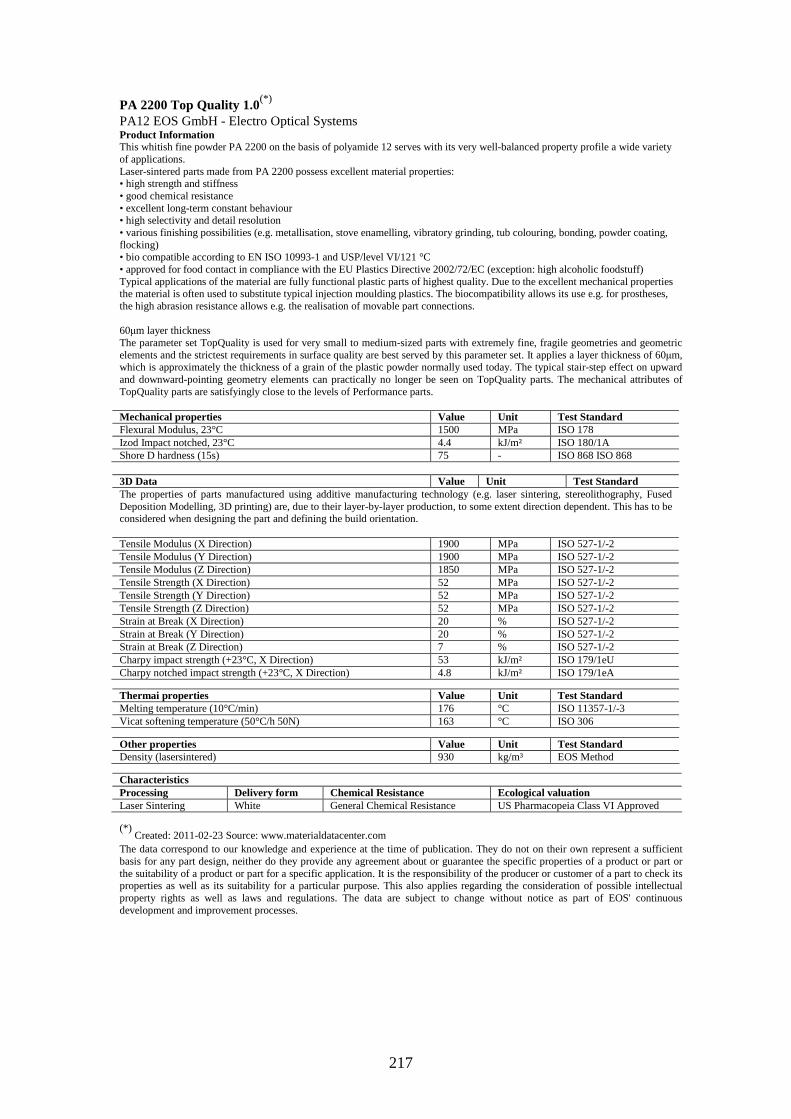
217
PA 2200 Top Quality 1.0(*) PA12 EOS GmbH - Electro Optical Systems Product Information This whitish fine powder PA 2200 on the basis of polyamide 12 serves with its very well-balanced property profile a wide variety of applications. Laser-sintered parts made from PA 2200 possess excellent material properties: • high strength and stiffness • good chemical resistance • excellent long-term constant behaviour • high selectivity and detail resolution • various finishing possibilities (e.g. metallisation, stove enamelling, vibratory grinding, tub colouring, bonding, powder coating, flocking) • bio compatible according to EN ISO 10993-1 and USP/level VI/121 °C • approved for food contact in compliance with the EU Plastics Directive 2002/72/EC (exception: high alcoholic foodstuff) Typical applications of the material are fully functional plastic parts of highest quality. Due to the excellent mechanical properties the material is often used to substitute typical injection moulding plastics. The biocompatibility allows its use e.g. for prostheses, the high abrasion resistance allows e.g. the realisation of movable part connections. 60µm layer thickness The parameter set TopQuality is used for very small to medium-sized parts with extremely fine, fragile geometries and geometric elements and the strictest requirements in surface quality are best served by this parameter set. It applies a layer thickness of 60µm, which is approximately the thickness of a grain of the plastic powder normally used today. The typical stair-step effect on upward and downward-pointing geometry elements can practically no longer be seen on TopQuality parts. The mechanical attributes of TopQuality parts are satisfyingly close to the levels of Performance parts. Mechanical properties Value Unit Test Standard Flexural Modulus, 23°C 1500 MPa ISO 178 Izod Impact notched, 23°C 4.4 kJ/m² ISO 180/1A Shore D hardness (15s) 75 - ISO 868 ISO 868 3D Data Value Unit Test Standard The properties of parts manufactured using additive manufacturing technology (e.g. laser sintering, stereolithography, Fused Deposition Modelling, 3D printing) are, due to their layer-by-layer production, to some extent direction dependent. This has to be considered when designing the part and defining the build orientation. Tensile Modulus (X Direction) 1900 MPa ISO 527-1/-2 Tensile Modulus (Y Direction) 1900 MPa ISO 527-1/-2 Tensile Modulus (Z Direction) 1850 MPa ISO 527-1/-2 Tensile Strength (X Direction) 52 MPa ISO 527-1/-2 Tensile Strength (Y Direction) 52 MPa ISO 527-1/-2 Tensile Strength (Z Direction) 52 MPa ISO 527-1/-2 Strain at Break (X Direction) 20 % ISO 527-1/-2 Strain at Break (Y Direction) 20 % ISO 527-1/-2 Strain at Break (Z Direction) 7 % ISO 527-1/-2 Charpy impact strength (+23°C, X Direction) 53 kJ/m² ISO 179/1eU Charpy notched impact strength (+23°C, X Direction) 4.8 kJ/m² ISO 179/1eA
Thermai properties Value Unit Test Standard Melting temperature (10°C/min) 176 °C ISO 11357-1/-3 Vicat softening temperature (50°C/h 50N) 163 °C ISO 306 Other properties Value Unit Test Standard Density (lasersintered) 930 kg/m³ EOS Method
Characteristics Processing Delivery form Chemical Resistance Ecological valuation Laser Sintering White General Chemical Resistance US Pharmacopeia Class VI Approved (*)
Created: 2011-02-23 Source: www.materialdatacenter.com The data correspond to our knowledge and experience at the time of publication. They do not on their own represent a sufficient basis for any part design, neither do they provide any agreement about or guarantee the specific properties of a product or part or the suitability of a product or part for a specific application. It is the responsibility of the producer or customer of a part to check its properties as well as its suitability for a particular purpose. This also applies regarding the consideration of possible intellectual property rights as well as laws and regulations. The data are subject to change without notice as part of EOS' continuous development and improvement processes.

218
PA 2200 Top Speed 1.0(*) PA12 EOS GmbH - Electro Optical Systems Product Information This whitish fine powder PA 2200 on the basis of polyamide 12 serves with its very well-balanced property profile a wide variety of applications. Laser-sintered parts made from PA 2200 possess excellent material properties: • high strength and stiffness • good chemical resistance • excellent long-term constant behaviour • high selectivity and detail resolution • various finishing possibilities (e.g. metallisation, stove enamelling, vibratory grinding, tub colouring, bonding, powder coating, flocking) • bio compatible according to EN ISO 10993-1 and USP/level VI/121 °C • approved for food contact in compliance with the EU Plastics Directive 2002/72/EC (exception: high alcoholic foodstuff) Typical applications of the material are fully functional plastic parts of highest quality. Due to the excellent mechanical properties the material is often used to substitute typical injection moulding plastics. The biocompatibility allows its use e.g. for prostheses, the high abrasion resistance allows e.g. the realisation of movable part connections. 180µm layer thickness TopSpeed is a very economical parameter set for parts with medium to high requirements of quality and mechanical load and high cost pressure. Particularly large and relatively thick-walled parts can usually profit from this layer thickness, mostly without any noticeable impairment from the fast build-up rates. Mechanical properties Value Unit Test Standard Flexural Modulus, 23°C 1500 MPa ISO 178 Izod Impact notched, 23°C 4.4 kJ/m² ISO 180/1A Shore D hardness (15s) 75 - ISO 868 ISO 868 3D Data Value Unit Test Standard The properties of parts manufactured using additive manufacturing technology (e.g. laser sintering, stereolithography, Fused Deposition Modelling, 3D printing) are, due to their layer-by-layer production, to some extent direction dependent. This has to be considered when designing the part and defining the build orientation. Tensile Modulus (X Direction) 1600 MPa ISO 527-1/-2 Tensile Modulus (Y Direction) 1600 MPa ISO 527-1/-2 Tensile Modulus (Z Direction) 1600 MPa ISO 527-1/-2 Tensile Strength (X Direction) 45 MPa ISO 527-1/-2 Tensile Strength (Y Direction) 45 MPa ISO 527-1/-2 Tensile Strength (Z Direction) 38 MPa ISO 527-1/-2 Strain at Break (X Direction) 18 % ISO 527-1/-2 Strain at Break (Y Direction) 18 % ISO 527-1/-2 Strain at Break (Z Direction) 3 % ISO 527-1/-2 Charpy impact strength (+23°C, X Direction) 53 kJ/m² ISO 179/1eU Charpy notched impact strength (+23°C, X Direction) 4.8 kJ/m² ISO 179/1eA
Thermai properties Value Unit Test Standard Melting temperature (10°C/min) 176 °C ISO 11357-1/-3 Vicat softening temperature (50°C/h 50N) 163 °C ISO 306 Other properties Value Unit Test Standard Density (lasersintered) 930 kg/m³ EOS Method
Characteristics Processing Delivery form Chemical Resistance Ecological valuation Laser Sintering White General Chemical Resistance US Pharmacopeia Class VI Approved (*)
Created: 2011-02-23 Source: www.materialdatacenter.com The data correspond to our knowledge and experience at the time of publication. They do not on their own represent a sufficient basis for any part design, neither do they provide any agreement about or guarantee the specific properties of a product or part or the suitability of a product or part for a specific application. It is the responsibility of the producer or customer of a part to check its properties as well as its suitability for a particular purpose. This also applies regarding the consideration of possible intellectual property rights as well as laws and regulations. The data are subject to change without notice as part of EOS' continuous development and improvement processes.

219
PA 3200 GF(*) PA12-GB EOS GmbH - Electro Optical Systems Product Information PA 3200 GF is a whitish, glass-filled polyamide 12 powder, which is characterised by an excellent stiffness in combination with good elongation at break. Laser-sintered parts made from PA 3200 GF possess excellent material properties: • high stiffness • high mechanical wear-resistance • good thermal loadability • excellent surface quality • high dimensional accuracy and detail resolution • good processability • excellent long-term constant behaviour A typical application for PA 3200 GF is the usage e.g. for final parts within the engine area of cars, for deep-drawing dies or any other application which requires particular stiffness, high heat distortion temperature and low abrasive wear. Mechanical properties Value Unit Test Standard Flexural Modulus, 23°C 2900 MPa ISO 178 Flexural Strength 73 MPa ISO 178 Izod Impact notched, 23°C 4.2 kJ/m² ISO 180/1A Shore D hardness (15s) 80 - ISO 868 ISO 868 Ball indentation hardness 98 MPa ISO 2039-1 3D Data Value Unit Test Standard The properties of parts manufactured using additive manufacturing technology (e.g. laser sintering, stereolithography, Fused Deposition Modelling, 3D printing) are, due to their layer-by-layer production, to some extent direction dependent. This has to be considered when designing the part and defining the build orientation. Tensile Modulus (X Direction) 3200 MPa ISO 527-1/-2 Tensile Modulus (Y Direction) 3200 MPa ISO 527-1/-2 Tensile Modulus (Z Direction) 2500 MPa ISO 527-1/-2 Tensile Strength (X Direction) 51 MPa ISO 527-1/-2 Tensile Strength (Y Direction) 51 MPa ISO 527-1/-2 Tensile Strength (Z Direction) 47 MPa ISO 527-1/-2 Strain at Break (X Direction) 9 % ISO 527-1/-2 Charpy impact strength (+23°C, X Direction) 35 kJ/m² ISO 179/1eU Charpy notched impact strength (+23°C, X Direction) 5.4 kJ/m² ISO 179/1eA
Thermai properties Value Unit Test Standard Melting temperature (10°C/min) 176 °C ISO 11357-1/-3 Vicat softening temperature (50°C/h 50N) 166 °C ISO 306 Other properties Value Unit Test Standard Density (lasersintered) 1220 kg/m³ EOS Method
Characteristics Processing Delivery form Features Laser Sintering White Low Coefficient of Friction (*)
Created: 2011-02-21 Source: www.materialdatacenter.com The data correspond to our knowledge and experience at the time of publication. They do not on their own represent a sufficient basis for any part design, neither do they provide any agreement about or guarantee the specific properties of a product or part or the suitability of a product or part for a specific application. It is the responsibility of the producer or customer of a part to check its properties as well as its suitability for a particular purpose. This also applies regarding the consideration of possible intellectual property rights as well as laws and regulations. The data are subject to change without notice as part of EOS' continuous development and improvement processes.

220
2. Glass beads SPHERIGLASS® Solid Glass Spheres: A Glass
Potters A glass spheres are manufactured from a soda lime glass composition, like window glass. The refractive index of A-glass is 1.51 - 1.52.
SPHERIGLASS® solid A glass spheres are available in mean particle sizes from 7 to 200 microns. The 3000 and 4000 grade products, with a typical mean particle size of 35-25 microns, are the product most commonly used for resin extension in polymer applications. The 5000 and 6000 grade products are most commonly used in paints and coatings.
In general, smaller spheres improve impact strength. Larger spheres tend to improve flow properties.
Typical Particle Size Product Grade Mean Value
1922 203 2024 156 2227 119 2429 85 2530 71 2900 42 3000 35 4000 25 5000 11 6000 7

221
3. Coupling Agents Coatings High performance Glass Microspheres coatings for increased adherences in Thermoplastic and Thermoset applications. Spheriglass® solid glass microspheres are extensively used in most thermoplastic and thermosetting resin systems as an inorganic functional filler and reinforcement. When the microspheres are used, processability and resin composite performances are enhanced, while overall manufacturing costs are reduced. Coatings Interfacial Bonding, between the glass beads and the polymer can be enhanced by the use of a coupling agent (coating). These agents are being applied to the microspheres during manufacture, in molecular layers to obtain maximum adhesion. This improved bonding manifests itself in improved properties of the moulded section. Accordingly, elastic modulus and strength are significantly improved. Surface treatment has also been shown to improve melt viscosity, most likely due to improved wetting. Benefits of using Spheriglass® with coupling agents
o Lowers viscosity of filled resins o Increase overall reinforcement loading capacity o Reduces processing equipment wear and energy usage o Provides excellent flow-out in intricate and thin wall designed moulds o Provides final product with improved hardness, dimensional stability, surface finish and
machinability o Improve composite properties by improving dispersion of other fillers and additives
Coated Uncoated The effect of the coupling agent on the interfacial bond can be seen by the contrasting figures above. In the figure on the right, on can shows the pulling away of a polymer from an uncoated microsphere as the test specimen is stretched. In figure on the left, resin is strongly adhered to the microsphere and no separation between the resin and the microsphere is discernible. Coupling Agents Improve properties of resins filled with Spheriglass® glass microspheres
Polyamide 6 Properties Unit Unfilled Spheriglass® 3000 (30% by wt.)
No Coupling Agent CP03 Tensile Strength Tensile Elongation Izod Notched Izod Un-Notched Flexural Modulus Flexural Strength HDT Mould Shrinkage
MPa %
KJ/m2
KJ/m2
MPa Mpa °C %
47.3 66.7 7.0 61.2 1712 69.8 51.4 1.5
32.0 23.6 3.2 36.6 2152 70.1 67.6 1.3
50.8 30.3 4.9 25.4 2686 89.2 60.0 1.2

222
Spheriglass microspheres are available with coatings of three different coupling agents – CP01, CP02 and CP03; all are formulated for optimum performance within specific resin systems. In certain resin systems, such as fluorocarbons and silicones, coupling agent are les effectives. Consult the charts below for recommended usage.
Recommended Coupling Agents For Use With Spheriglass®
FOR USE IN THERMOPLASTIC RESIN SYSTEMS Resin Type Coating Resin Type Coating Acrylics Acetal ABS Cellulostics Fluroplastics Ionomer PBT / PET Polyamide Polycarbonate
CP01 CP02 - CP03 CP01 CP02 – CP03 None Recommended CP02 – CP03 CP02 – CP03 CP03 CP02 - CP03
Polyethylene Polyimide Polymethyl Methacrylate Polyphenylene Oxide Polypropylene Polystyrene Polysulfone Polyvinyl Chloride (PVC) Styrene Acrylonitrile (SAN)
CP01 CP03 CP01 CP03 CP03 CP01 CP03 CP03 CP01
FOR USE IN THERMOSETTING RESIN SYSTEMS
Resin Type Coating Resin Type Coating Alkyd Epoxy Melamine Phenol-Formadehyde Phenolic
CP01 CP02 - CP03 CP02 - CP03 CP03 CP03
Polyester Silicones Urea-Formaldehyde Urethanes Vinyl Ester
CP01 CP01 CP03 CP03 CP01
Spheriglass® microspheres benefits Spheriglass® solid glass microspheres are available in sizes ranging from 5 to 250 microns in diameter. In addition to the benefits outlines earlier, Spheriglass® offers:
• Solid smooth transparent shape Non flammability • Lowest surface-to-volume ratio Uniform dispersion • High Abrasion resistance Low uniform shrinkage • High compressive strength High Flexurus modulus
Other products
• Luxsil® Cosmetic Microspheres • SpheriWhite® Colour-Enhancing Solid Glass Microspheres • Q-Cel® Ultra-Light Hollow Glass Microspheres • Spericel®Ultra-Fine Weight Reducing Hollow Glass Microspheres • GlassFill® Ultra-Fine Powdered Glass
Safety Information
Glass composition and coatings used with Potters Europe microspheres are non-toxic and present no hazard with regard to ingestion, inhalation or contact. Material Safety Data Sheets are available upon request.
Information contained in this publication (and otherwise supplied to users) is based on our general experience and is given in good faith, but we are unable to accept the responsibility in respect of factors which are outside our knowledge or control. Spheriglass, SpheriWhite, Luxsil, Q-Cel, Sphericel, GlassFill are registered trademark of Potters Industries Inc. and affiliated companies. Ref: 3-03-007-1-09.doc

223
8. References
[1] E. C. Santos, M. Shiomi, K. Osakada and T. Laoui (2006): Rapid manufacturing of
metal components by laser forming. Int. J. of Machine Tools and Manufacture 46.
1459–1468
[2] C. E. Majewski; B. S. Hobbs; N. Hopkinson (2007): Effect of bed temperature and
infra-red lamp power on the mechanical properties of parts produced using high-speed
sintering. Virtual and Physical Prototyping, Vol. 2, Iss. 2, pp 103 – 110. Loughborough
University, UK
[3] A. Rosochowski, A. Matuszak (2000): Rapid tooling: The state of the art. Journal of
materials processing technology 106, 191- 198
[4] I. Abd Aziz (2010): Microstructure and mechanical properties of TI-6AL-4V
produced by selective laser sintering of pre- alloyed powder. M.Eng. Thesis University
of Waikato Hamilton, New Zealand
[5] D. C. Thomson (1995): The optimization of part orientation for solid freeform
manufacture. M.Sc. thesis in engineering, faculty of the graduate school of the
University of Texas at Austin
[6] B. E Davis (2001): Characterization and calibration of stereolithography products
and processes. M.Sc. Thesis, Georgia Institute of Technology

224
[7] Ö. İlkgün (2005): Effects of production parameters on porosity and hole properties
in laser sintering rapid prototyping process. M.Sc. thesis in mechanical engineering.
Middle East Technical University. Turkey
[8] S. K. Singhal, P. K. Jain, P. M. Pandey (2008): Adaptive Slicing for SLS
Prototyping. Computer-Aided Design & Applications, 5(1-4), 412-423. India
[9] Y. Yan , S. Li, R. Zhang, F. Lin, R. Wu, Q. Lu, Z. Xiong, X. Wang (2009): Rapid
Prototyping and Manufacturing Technology: Principle, Representative Technics,
Applications, and Development Trends. Tsinghua Science & Technology, Volume 14,
Pages 1-12, China
[10] J. P. Schultz (2003) : Modeling heat transfer and densification during laser
sintering of viscoelastic polymers. PhD dissertation in Materials Science and
Engineering. The faculty of the Virginia Polytechnic. Institute and State University.
USA
[11] C. M. Tekin (2009): Mechanical characterization and modeling of porous
polymeric materials manufactured by selective laser sintering. M.Sc. Thesis in
mechanical engineering. Middle East Technical University. Turkey
[12] D.T Pham, R.S Gault (1998): A comparison of rapid prototyping technologies.
International Journal of Machine Tools and Manufacture, Vol. 38, Issues 10-11, pp
1257-1287. UK

225
[13] B. Wendel, D. Rietzel, F. Kühnlein, R. Feulner, G. Hülder, and E. Schmachtenberg
(2008): Additive Processing of Polymers. Macromolecular Materials and Engineering.
Macromolecular Materials and Engineering, 293:799–809. Germany.
[14] http://www.efunda.com/processing/rapid_prototyping/. [Accessed 3 Feb.2011].
[15] A. Dolenc (1994): An overview of rapid prototyping technologies in
manufacturing. Institute of Industrial Automation, Helsinki University of technology
[16] US 5121329 (1992), inv.: S. Crump.: Apparatus and method for creating three-
dimensional objects.
[17] http://www.mne.psu.edu/lamancusa/rapidpro/primer/chapter2.htm. [Accessed 3
Feb.2011].
[18] J. Park, M. J. Tari, H. T. Hahn, (2000): Characterization of the laminated object
manufacturing (LOM) process. Rapid Prototyping Journal, Vol. 6 Iss: 1, pp.36 – 50.
Mechanical and Aerospace Engineering Department, University of California, Los
Angeles, USA
[19] S. Kumar (2010): Selective laser sintering: Recent advances. CSIR National Laser
Centre, South Africa
[20] http://www.lasersintering.com/sls-information.php#sls. [Accessed 3.Feb .2011]

226
[21] P. K. Jain, P. M. Pandeyand, P.V.M. Rao (2008): Experimental investigations for
improving part strength in selective laser sintering. Virtual and Physical Prototyping.
Taylor & Francis. Delhi, India.
[22] N. Hopkinson, P. Dickens, (2001): Rapid prototyping for direct manufacture.
Rapid Prototyping Journal, Vol. 7 Iss: 4, pp.197 – 202
[23] C.E. Majewski, H. Zarringhalam, D. Toon, U. Ajoku, N. Hopkinson, M.P. Caine
(2009): The use of off-line part production to predict the tensile properties of parts
produced by Selective Laser Sintering. Journal of Materials Processing Technology.
Vol. 209, Issue 6, Pages 2855-2863. UK
[24] R.D. Goodridge, M.L. Shofner, R.J.M. Hague, M. McClelland, M.R. Schlea, R.B.
Johnson, C.J. Tuck (2010): Processing of a Polyamide-12/carbon nanofibre composite
by laser sintering. Polymer Testing. Vol. 30, Issue 1, Pages 94-100
[25] F. Klocke, C. Wagner, C. Ader (2005): Development of an Integrated Model for
Selective Metal Laser Sintering. Fraunhofer-Institute of Production Technology IPT,
Aachen, Germany
[26] J. D. Williams, C. R. Deckard, (1998): Advances in modeling the effects of selected
parameters on the SLS process. Rapid Prototyping Journal, Vol. 4 Iss: 2, pp.90 – 100.
Clemson University, Clemson, South Carolina , USA
227
[27] X.C. Wang & J.P. Kruth (2000): Energy absorption and penetration in selective
laser sintering: A ray tracing model. Proceedings of the International Conference on
Mathematical Modelling and Simulation of Metal Technologies pages:673-682. K. U.
Leuven - Department of Mechanical Engineering - Division PMA
[28] S. Kolossov, E. Boillat, R. Glardon, P. Fischer, M. Locher (2004): 3D FE
simulation for temperature evolution in the selective laser sintering process. Int. J. of
Machine and Manufacture. Vol. 44, Issues 2-3, Pages 117-123. University of Bern,
Switzerland
[29] B. Pei-kang, C. Jun, L. Bin and W. Wen-feng (2006): Numerical simulation of
temperature field during selective laser sintering of polymer-coated molybdenum
powder. Transactions of Nonferrous Metals Society of China. Vol. 16, Supplement 2,
Pages s603-s607. China
[30] R. B. Patil, V. Yadava (2007): Finite element analysis of temperature distribution
in single metallic powder layer during metal laser sintering. Int. J. of Machine Tools
and Manufacture. Vol. 47, Issues 7-8, Pages 1069-1080. India
[31] K.M. Fan, K.W. Wong, W.L. Cheung (2007): Reflectance and transmittance of
TrueFormTM powder and its composites to CO2 laser. Rapid Prototyping Journal, Vol.
13, Iss: 3, pp.175 – 181

228
[32] W. N. dos Santos, J. A. M. Agnelli, P. Mummery, A. Wallwork (2007): Effect of
recycling on the thermal properties of polymers. Polymer Testing.Vol. 26, Issue 2,
Pages 216-221
[33] G. B. M.l Cervera, G. Lombera, (1999): Numerical prediction of temperature and
density distributions in selective laser sintering processes. Rapid Prototyping Journal,
Vol. 5 Iss: 1, pp.21 – 26. National University of Mar del Plata, Argentina
[34] S. L. Israel, T. D. Hawkins, and S. C. Hyman (1966): Thermal properties of solid
and porous tungsten at temperature to 5000 F. National Aeronautics and space
administration. Washington, D. C. USA
[35] J. K. Carson, S. J. Lovatt, D. J. Tanner, A. C. Cleland (2005): Thermal
conductivity bounds for isotropic, porous materials. International Journal of Heat and
Mass Transfer. Volume 48, Issue 11, Pages 2150-2158
[36] Y. Zhang, A. Faghri (1999): Melting of a subcooled mixed powder bed with
constant heat flux heating. International Journal of Heat and Mass Transfer, Volume
42, Number 5, pp. 775-788. USA
[37] D. Tolksdorf, E. Westkämper (2006): Developments in precision product
manufacturing for laser-sintering. 3ed international Conference Multiscale Materials
Modeling, Freiburg , Germany

229
[38] N. P. Juster, (1994): Rapid prototyping using the selective sintering process.
Assembly Automation, Vol. 14 Iss: 2, pp.14 – 17. Department of Mechanical
Engineering, University of Leeds
[39] D T Pham, S Dimov, F Lacan (1999): Selective laser sintering: applications and
technological capabilities. Proc IMechE, Part B: Journal of Engineering Manufacture.
Volume 213, Number 5, Pages 435-449 / 1999, University of Wales, Cardiff UK
[40] A. Franco (2007): An apparatus for the routine measurement of thermal
conductivity of materials for building application based on a transient hot-wire method.
Applied Thermal Engineering.Vol. 27, Issues 14-15, Pages 2495-2504. Italy
[41] H. Czichos, D. Klaffke, E. Santner, M. Woydt (1995): Advances in tribology: the
materials point of view. Wear. Vol. 190, Issue 2, Pages 155-161. Berlin, Germany
[42] J.-P. Kruth, M.C. Leu and T. Nakagawa (1998): Progress in Additive
Manufacturing and Rapid Prototyping. CIRP Annals - Manufacturing Technology.
Vol. 47, Issue 2, Pages 525-540
[43] A. V. Gusarov, T. Laoui, L. Froyen, V. I. Titov (2003): Contact thermal
conductivity of a powder bed in selective laser sintering. International Journal of Heat
and Mass Transfer. Vol. 46, Issue 6, Pages 1103-1109
[44] http://www.3trpd.co.uk/sls.htm. [Accessed 3. Feb. 2011].

230
[45] http://www.eos.info/en/products/materials-for-plastic-system. [Accessed in 3. Feb.
2011]
[46] http://www.nwuav.com/materialPDFs/alumide.pdf. [Accessed in 3.Feb.2011]
[47] http://www.windform.it/sito/. [Accessed in 3.Feb.2011]
[48] T. S. Gates (2003): On the Use of Accelerated Test Methods for Characterization
of Advanced Composite Materials. National Aeronautics and Space Administration.
Langley Research Centre, Hampton, Virginia. USA
[49] M. Xanthos (1st edition) (2005): Front Matter, in Functional Fillers for Plastics,
Wiley-VCH Verlag GmbH & Co. KGaA, Weinheim, FRG. USA
[50] W. Shen, C. Y. Tang, C. P. Tsui and L. H. Peng (2002): Effects of two damage
mechanisms on effective elastic properties of particulate composites. Composites
Science and Technology. Volume 62, Issues 10-11, Pages 1397-1406
[51] Alberola, N. D. and Mele, P. (1996): Viscoelasticity of polymers filled by rigid or
soft particles: Theory and experiment. Polymer Composites, Polymer Composites. Vol.
17, Issue 5, Pages 751–759
[52] Shirin Shokoohi, Ahmad Arefazar (2009): Silane Coupling Agents in Polymer-
based Reinforced Composites: Journal of Reinforced Plastics and Composites. vol. 28
no. 17 2131-2142. Tehran, Iran

231
[53] D. Metǐn, F. Tihminlioğlu, D. Balköse, S. Ülkü (2004): The effect of interfacial
interactions on the mechanical properties of polypropylene/natural zeolite composites.
Composites Part A: Applied Science and Manufacturing. Volume 35, Issue 1, Pages 23-
32. Turkey
[54] R. K. Y. Li, J. Z. Liang, S. C. Tjong (1998): Morphology and dynamic mechanical
properties of glass beads filled low density polyethylene composites. Journal of
Materials Processing Technology. Volume 79, Issues 1-3, Pages 59-65
[55] Liang, J.-Z. (2007): Tensile properties of hollow glass bead- filled polypropylene
composites. Journal of Applied Polymer Science. Vol. 104, Issue 3, Pages 1697-1701,
China
[56] A. Meddad, B. Fisa (1997): Filler– matrix debonding in glass bead-filled
polystyrene. Journal of Materials Science. Volume 32, Number 5, 1177-1185. Canada
[57] Shao-Yun Fu, Xi-Qiao Feng, Bernd Lauke, Yiu-Wing Mai (2008): Effects of
particle size, particle/matrix interface adhesion and particle loading on mechanical
properties of particulate– polymer composites. Composites Part B: Engineering.
Volume 39, Issue 6, Pages 933-961
[58] N. D. Alberola, P. Mele (1997): Interface and mechanical coupling effects in
model particulate composites. Polymer Engineering & Science. Vol. 37, Issue 10,
Pages 1712- 1721, France

232
[59] B. Caulfield, P.E. McHugh, S. Lohfeld (2007): Dependence of mechanical
properties of polyamide components on build parameters in the SLS process. Journal of
Materials Processing Technology. Vol. 182, Issues 1-3, Pages 477-48, Ireland
[60] W.A.Y Yusoff, A.J Thomas (2008): The effect of employing an effective laser
sintering scanning strategy and energy density value on eliminating “Orange peel” on
a selective laser sintered part. International Association for Management of
Technology IAMOT
[61] P. K. Jain, P. M. Pandey, P. V. M. Rao (2008): Effect of delay time on part
strength in selective laser sintering. The International Journal of Advanced
Manufacturing Technology. Vol. 43, Issu.1-2, 117-126
[62] I. Gibson, D. Shi, (1997): Material properties and fabrication parameters in
selective laser sintering process. Rapid Prototyping Journal, Vol. 3 Iss: 4, pp.129 – 136.
The University of Hong Kong
[63] Y Wang, Y Shi, S Huang (2005): Selective laser sintering of polyamide-rectorite
composite. Proc. IMechE Vol. 219 Part L: J. Materials: Design and Applications.
People's Republic of China
[64] T J Gill, K K B Hon (2004): Experimental investigation into the selective laser
sintering of silicon carbide polyamide composites. Proc IMechE, Part B: Journal of
Engineering Manufacture, Vol. 218, Issue 10, Pages 1249-1256

233
[65] K.K.B. Hon, T.J. Gill (2007): Selective Laser Sintering of SiC/Polyamide
Composites. CIRP Annals - Manufacturing Technology, Vol. 52, Issue 1, P 173-176.
The University of Liverpool
[66] A. Mazzoli, G. Moriconi, M. G. Pauri (2007): Characterization of an aluminum-
filled polyamide powder for applications in selective laser sintering. Materials &
Design.Vol. 28, Issue 3, Pages 993-1000. Italy
[67] U Ajoku, N Saleh, N Hopkinson, R Hague, P Erasenthiran (2006): Investigating
mechanical anisotropy and end-of-vector effect in laser-sintered nylon parts. Proc.
IMechE Vol. 220 Part B: J. Engineering Manufacture. JEM537 © IMechE, UK
[68] G.V. Salmoria, J.L. Leite, R.A. Paggi, A. Lago, A.T.N. Pires (2008): Selective
laser sintering of PA12/HDPE blends: Effect of components on elastic/plastic
behaviour. Polymer Testing.Vol 27, Issue 6, Pages 654-659. Brazil
[69] C Majewski, H Zarringhalam, N Hopkinson (2008): Effect of the degree of particle
melt on mechanical properties in selective laser-sintered Nylon-12 parts. Proc. IMechE
Vol. 222, Issue 9, Part B: J. Engineering Manufacture, Pages 1055-1064
[70] P. K. Jain, P. M. Pandey, P. V. M. Rao (2008): Effect of delay time on part
strength in selective laser sintering. The International Journal of Advanced
Manufacturing Technology. Volume 43, Numbers 1-2, 117-126. India
234
[71] P. K. Jain, P. M. Pandey, P. Rao (2010): Selective laser sintering of clay-
reinforced polyamide. Polymer Composites,Vol. 31, Issue 4, pp 732–743. India
[72] J. Yang, Y. Shi, C. Yan (2010): Selective Laser Sintering of Polyamide
12/Potassium Titanium Whisker Composites. Journal of Applied Polymer Science, Vol.
117, Issue 4, pp. 2196–2204. China.
[73] N. Raghunath, Pulak M. Pandey (2007): Improving accuracy through shrinkage
modelling by using Taguchi method in selective laser sintering. International journal of
machine tools & manufacture. ISSN 0890-6955, vol. 47, n6, pp. 985-995. India
[74] K. Senthilkumaran, Pulak M. Pandey, P.V.M. Rao (2009): Influence of building
strategies on the accuracy of parts in selective laser sintering. Materials & Design.
Volume 30, Issue 8, Pages 2946-2954. India
[75] K.W. Dalgarno, T.R.C. Childs, I. Rowntree, L. Rothwell (1996): Finite Element
Analysis of Curl Development in the Selective Laser Sintering Process. Department of
Mechanical Engineering, University of Leeds, Leeds, LS2 9JT, UK
[76] N. M. Jamal, KW Dalgarno: Analysis of the influence of the viscoelasticity in curl
development in SLS. School of Mechanical Engineering, University of Leeds, Leeds,
LS2 9JT, UK

235
[77] M. Berzins, T.H.C. Childs, K.W. Dalgarno, G. Ryder and G. Stein (1995):
Densification and distortion in selective laser sintering of polycarbonate parts. In Solid
Freeform Fabrication Symposium 1995, proceedings of the conference held in Austin,
Texas, ISSN 1053-2153, pp. 196-203. USA
[78] H. Chung, S. Das (2006): Processing and properties of glass bead particulate-
filled functionally graded Nylon-11 composites produced by selective laser sintering.
Materials Science and Engineering: A, Volume 437, Issue 2, Pages 226-234
[79] I. M. Ward, P R Pinnock (1966): The mechanical properties of solid polymers. Br.
J. Appl. Phys. 17 3
[80] www.tciamerica.com/ [Accessed 5. Feb .2011]
[81] www.specialchem4polymers.com/ [Accessed 5. Feb .2011]
[82] S. Shokoohi, A. Arefazar (2009): Effect of Processing Conditions and Coupling
Agents on ABS/SGF Composites Properties. Journal of Reinforced Plastics and
Composites, vol. 28 no. 9 1059-1073. Iran
[83] A. C. Miller and J. C. Berg (2003): Effect of silane coupling agent adsorbate
structure on adhesion performance with a polymeric matrix. Composites Part A:
Applied Science and Manufacturing. Volume 34, Issue 4, Pages 327-332

236
[84] L. W. Vick, R. G.Kander (1997): Ambient temperature compaction of
polycarbonate powder. Polymer Engineering & Science, Vol. 37, Issue 1, Pages120–
127, USA
[85] B. Weidenfeller, M. Höfer, F. R. Schilling (2004): Thermal conductivity, thermal
diffusivity, and specific heat capacity of particle filled polypropylene. Composites Part
A: Applied Science and Manufacturing. Vol. 35, Issue 4, Pages 423-429
[86] A. E. Tontowi, T.H.C. Childs, (2001): Density prediction of crystalline polymer
sintered parts at various powder bed temperatures. Rapid Prototyping Journal, Vol. 7
Iss: 3, pp.180 - 184
[87] J.-P. Kruth, G. Levy, R. Schindel, T. Craeghs, E. Yasa: Consolidation of Polymer
Powders by Selective Laser Sintering. Proceedings of the 3rd International Conference
on Polymers and Moulds Innovations pages:15-30
[89] W. A. Yusoff, (2007): An investigation of the orange peel phenomenon. PhD.
thesis, Cardiff University, Manufacturing Engineering Centre, Cardiff, UK
[90] C. Nelson, K. McAlea, D. Gray (1996): Improvements in SLS part accuracy. DTM
Corporation. Austin, Texas 78754
[91] R. D. Goodridge, R. J.M. Hague, C. J. Tuck (2010): An empirical study into laser
sintering of ultra-high molecular weight polyethylene (UHMWPE). Journal of Materials
Processing Technology. Volume 210, Issue 1, Pages 72-80

237
[92] L. Hao, M.M. Savalani, Y. Zhang, K.E. Tanner and R.A. Harris (2006): Effects of
material morphology and processing conditions on the characteristics of
hydroxyapatite and high-density polyethylene biocomposites by selective laser
sintering. Proceedings of the Institution of Mechanical Engineers, Part L: Journal of
Materials: Design and Applications, 220 (3), pp. 125-137 E. UK
[93] J. Cheng, S. Lao, K. Nguyen, W. Ho, A. Cummings, and J. Koo (2005): SLS
Processing Studies of Nylon 11 Nanocomposites. The University of Texas at Austin,
Mechanical Engineering Department, University Station 2200, Austin, TX 78712
[94]. Li, X., Shi, Y., Huang, S. Jixie Gongcheng Xuebao (2002): Investigation on
preheating of powder in SLS machine. Chinese Journal of Mechanical Engineering,
China. Vol. 38, no. 3, pp. 94-98
[95] T.J. Gornet, K.R. Davis, Dr. T.L. Starr, K.M. Mulloy (2002): Characterization of
selective laser sintering. Materials to determine process stability. Rapid Prototyping
Center, J.B. Speed Engineering School, University of Louisville. USA
[96] I. Švab, V. Musil, M. Leskovac: The Adhesion Phenomena in Polypropylene/
Wollastonite Composites. Acta Chim. Slov. 2005, 52, 264–271
[97] K. M.S Gautham (April 2000): A Design Tool to Control Roughness in Rapid
Prototyping. AutoDes, INC., Novi, MI, Henderson, Mark, Ph.D., Industrial
Engineering, Arizona State University, Tempe, AZ
238
[98] X. Wang, (1999): Calibration of shrinkage and beam offset in SLS process. Rapid
Prototyping Journal, Vol. 5, Iss. 3, pp.129 – 133. Artificial Intelligence Laboratory,
University of Wales, Cardiff, UK
[99] S.S. Dimov, D.T. Pham, K.D. Dotchev, A.I. Ivanov (1999): Dimensional accuracy
of CastForm Polystyrene patterns produced by Selective Laser Sintering.
Manufacturing Engineering Centre, Cardiff University, Cardiff, United Kingdom
[100] B. Van Hooreweder, F. De Coninck, D. Moens, R. Boonen, P. Sas (2010):
Microstructural characterization of SLS-PA12 specimens under dynamic
tension/compression excitation. Polymer Testing. Volume 29, Issue 3, Pages 319-326
[101] X. Shen, J. Yao, Y. Wang, J. Yang (2004): Density Prediction of Selective Laser
Sintering Parts Based on Artificial Neural Network. Advances in Neural Networks-
ISNN 2004. Lecture Notes in Computer Science, Volume 3174/2004, Pages153-165
[102] A. R. Lockwood (2006): Toughening mechanisms in composites of miscible
polymer blends with rigid filler particles. PhD. Thesis, Massachusetts Institute of
Technology, Dept. of Chemical Engineering, USA
[103] J. G. Lyons, J. E. Kennedy, S. Lordan, L. M. Geever, C. L. Higginbotham:
Characterisation of the effects of a titanium micro particle filler on a polyether-block-
amide host matrix. Journal of Materials Science. Volume 45, Number 12, 18 March
2010, Pages 3204-3214

239
[104] J. Liang, R. Li, (2000): Effect of filler content and surface treatment on the tensile
properties of glass-bead-filled polypropylene composites. Polymer International. Vol.
49, Issue 2, Pages 170–174. People's Republic of China
[105] Y. Zhou, V. Rangari, H. Mahfuz, S. Jeelani, P.K. Mallick (2005): Experimental
study on thermal and mechanical behavior of polypropylene, talc/polypropylene and
polypropylene/clay nanocomposites. Materials Science and Engineering: A. Volume
402, Issues 1-2, Pages 109-117
[106] B. S. Yoon, J. Y. Joang, M. H. Suh, Y. M. Lee, S. H. Lee (1997): Mechanical
properties of polypropylene/polyamide 6 blends: Effect of manufacturing processes and
compatibilization. Polymer Composites.Vol. 18, Issue 6, Pages 757–764
[107] I. L. Dubnikova, S. M. Berezina, A. V. Antonov (2004): Effect of rigid particle
size on the toughness of filled polypropylene. Journal of Applied Polymer Science, Vol.
94, Issue 5, Pages 1917–1926
[108] http://www.thetestlab.com/pdf/ASTM-D5045_Fracture_Toughness_Testing.pdf
[Accessed 8. Feb. 2011].
[109] B.B. Johnsen, A.J. Kinloch, R.D. Mohammed, A.C. Taylorand, S. Sprenger
(2007): Toughening mechanisms of nanoparticle- modified epoxy polymers. Polymer:
Volume 48, Issue 2, Pages 530-541
240
[110] J. Wu, Y. -W Mai (1996): The essential fracture work concept for toughness
measurement of ductile polymers. Polymer Engineering & Science, Vol. 36, Issue 18,
Pages 2275–2288
[111] S. M. Zebarjad, S. A. Sajjadi, M. Tahani (2004): Influence of filler particles on
deformation and fracture mechanism of isotactic polypropylene. Journal of Materials
Processing Technology, Volume 155, Issue 127, Pages 1459-1464
[112] R. J. Damani, Ch. Schuster, R. Danzer (1997): Polished notch modification of
SENB-S fracture toughness testing. Journal of the European Ceramic Society. Volume
17, Issue 14, Pages 1685-1689
[113] J. Lee and A. F. Yee (2000): Fracture of glass bead/ epoxy composites: on micro-
mechanical deformations. Polymer. Volume 41, Issue 23, Pages 8363-8373
[114] R. Hague; S. Mansour; N. Saleh (2004): Material and design considerations for
rapid manufacturing. International Journal of Production Research, 1366-588X,
Volume 42, Issue 22, Pages 4691 – 4708
[115] W. J. Deng, C. T. Chen, C. H. Sun, W. C. Chen, C. P. Chen (2008): An Effective
Approach for Process Parameter Optimization in Injection Molding of Plastic Housing
Components. Polymer-Plastics Technology and Engineering, Volume 47, Number 9,
pp. 910-919(10). Taiwan

241
[116] J.-P. Kruth, S. Kumar (2005): Statistical Analysis of Experimental Parameters in
Selective Laser Sintering. Advanced Engineering Materials. Vol. 7, Issue 8, Pages 750–
755
[117] H.-Te Liao, J.-Ren Shie, (2007): Optimization on selective laser sintering of
metallic powder via design of experiments method. Rapid Prototyping Journal, Vol. 13
Iss: 3, pp.156 – 162.
[118] http://controls.engin.umich.edu/wiki/index.php/Design_of_experiments_via_
taguchi_methods:_orthogonal_arrays. [Accessed 11 Feb.2011].
[119] Y. H. Chen1, S. C. Tam, W. L. Chen, H. Y. Zheng (1996): Application of
Taguchi Method in Optimization of Laser Micro- Engraving of Photomasks.
International Journal of Materials and Product Technology. Vol. 11, No.3/4, pp. 333 -
344
[120] L.A. Dobrzañski, J. Domaga, J.F. Silva (2007): Application of Taguchi method in
the optimisation of filament winding of thermoplastic composites. Archives of Materials
Science and Engineering. Vol. 28, Issue 3, March 2007, Pages 133-140
[121] B. Ozcelik, T. Erzurumlu (2006): Comparison of the warpage optimization in the
plastic injection molding using ANOVA, neural network model and genetic algorithm.
Journal of Materials Processing Technology. Volume 171, Issue 3, Pages 437-445

242
[122] R. Konda, K.P. Rajurkar, R.R. Bishu, A. Guha, M. Parson (1999): Design of
experiments to study and optimize process performance. International Journal of
Quality & Reliability Management, Vol. 16 Iss: 1, pp.56 – 71. USA
[123] B. Berginc, Z. Kampuš, B. Šuštaršič (2006): The use of the Taguchi approach to
determine the influence of injection-moulding parameters on the properties of green
parts. Journal of Achievements in Materials and Manufacturing Engineering. Volume
15, Issue 1-2. Ljubljana, Slovenia
[124] D. C. Montgomery, 5th Edition, 2001: Design and Analysis of Experiments. John
Wiley & Sons, INC; USA