
Danielle Elizabeth Butler - University of Salford Institutional ...
Upload
khangminh22Category
view
0download
0
Small Business Strategy and Performance in a Developing Economy: An Exploratory Analysis of Zimbabwe’s Small Business Sector
Emmanuel Rufasha
A thesis submitted to meet the requirements for the degree of Doctor of Philosophy in Business and Management in the School of Business and Law
Supervisor: Professor K. Allman
Co-supervisor: Professor J. Davies
January, 2018


i
Table of Contents ................................................................................... i
Table of contents ................................................................................................................ i
Appendices ....................................................................................................................... vii
List of figures ................................................................................................................... viii
List of tables ....................................................................................................................... x
Acknowledgements ......................................................................................................... xiii
Abstract ........................................................................................................................... xiv
1.0 Chapter 1: INTRODUCTION ......................................................................................... 1
1.1 Introduction and Background ..................................................................................... 1
1.2 Importance of the study and its contribution to existing understanding and knowledge ...... 3
1.3 Research aim, objectives and questions ..................................................................... 6
1.4 Structure of the study ................................................................................................. 9
1.5 Summary ................................................................................................................... 11
Chapter 2: LITERATURE REVIEW ..................................................................................... 12
2.0 Introduction .............................................................................................................. 12
2.1 Defining Micro, small and medium enterprises (SME) ............................................. 12
2.1.1 Scope for reviewing the SME definition ................................................................. 16
2.2 Significance of the small and medium enterprises ................................................... 18
2.3 Strategic planning...................................................................................................... 22
2.3.1 Definition of strategic planning .............................................................................. 22
2.3.2 Strategic planning and the contingency approach ................................................ 23
2.3.3 The prescriptive approach ..................................................................................... 26
2.3.4 The descriptive / emergent approach.................................................................... 27
2.3.5 The prescriptive-emergent paradigm .................................................................... 27

ii
2.3.6 Strategy definition that fits small firms ................................................................. 28
2.4 Formal strategic planning and the small firm ........................................................... 29
2.5 Tools of strategic planning…………………………… .......................................................... 33
2.5.1 Overview………………………………………………………………………………………………………. .... 33
2.5.2 SWOT analysis……………………………………………………………………………… ..................... 34
2.5.3 PESTLE analysis…………………………………………………………………………………… .............. 35
2.5.4 Ansoff matrix………………………………………………………………………… ............................ 35
2.5.5 Value for money analysis………………………………………………………………… .................. 36
2.5.6 Cost benefit analysis…………………………………………………………………………… .............. 36
2.5.7 Continuity planning………………………………………………………………………………… .......... 37
2.5.8 Key issues analysis……………………………………………………………………………………… ...... 37
2.5.9 Scenario planning……………………………………………………………………………………….. ...... 38
2.5.10 Competitive analysis……………………………………………………………………………… ......... 38
2.5.11 Goals grid matrix………………………………………………………………………………………. ...... 39
2.5.12 Supply chain analysis………………………………………………………………………… .............. 40
2.5.13 Critical success factors ……………………………………………………… .............................. 40
2.5.14 Stakeholder analysis………………………………………………………………………… ............... 41
2.5.15 Balanced scorecard…………………………………………………………………………………......... 42
2.5.16 BCG matrix……………………………………………………………………………………………… ........ 43
2.5.17 Feasibility studies or analysis…………………………………………… ................................ 44
2.5.18 VRIO analysis………………………………………………………………… ................................... 45
2.5.18.1 Question of value………………………………………………… .......................................... 45
2.5.18.2 Question of rarity……………………………………………………… .................................... 46
2.5.18.3 Question of imitability………………………………………………… .................................. 46
2.5.18.4 Question of organisation…………………………………………….................................... 46
2.5.19 GAP analysis………………………………………………………………… .................................... 47

iii
2.5.20 PEST analysis……………………………………………………………… ...................................... 48
2.5.21 Porter’s five forces………………………………………………………… .................................. 49
2.6 Performance……………………………………………………………………… ................................... 51
2.7 Strategic planning and its relationship to performance………… ................................ 53
2.8 Newness of small firms……………………………………………………………………… ................... 54
2.9 Theoretical perspective………………………………………………………………… ........................ 55
2.9.1 Contingency theory…………………………………………………………… ................................ 55
2.9.2 The traditional contingency theory………………………………… .................................... 56
2.9.3 Theoretical contingent factors………………………………………… ................................... 57
2.9.4 This study and its contingency factors…………………………… .................................... 58
2.9.5 Newness of firm ……………………………………………………………………… .......................... 58
2.9.6 Environmental volatility…………………………………………………… .................................. 59
2.9.7 The effect of contingencies on organisational performance…… ........................... 59
2.9.8. Weaknesses of contingency theory………………………………………… .......................... 61
2.10 Conceptual framework…………………………………………………………… ............................ 64
2.11 Conclusion……………………………………………………………………………………… .................... 67
Chapter 3: ZIMBABWE – RESEARCH CONTEXT…………………………………… ......................... 68
3.0 Introduction………………………………………………………………………… ................................. 68
3.1 Economic overview…………………………………………………………………………… ................... 69
3.2 Unemployment……………………………………………………………………………………… .............. 70
3.3 Hyperinflation 2004 to 2009……………………………………………………………...................... 71
3.4 Government of nationality unity…………………………………………… ................................ 72
3.5 Post Government of national unity………………………………………………… ...................... 72
3.6 Agriculture………………………………………………………………………… ................................... 73
3.7 Mining sector…………………………………………………………………… ..................................... 74
3.8 SMEs sector…………………………………………………………………………… ............................... 74

iv
3.9 Instability of Zimbabwe’s economy……………………………… ......................................... 76
3.10 Conclusion……………………………………………………………………… .................................... 78
Chapter 4: METHODOLOGY………………………………………………………… ................................ 79
4.1 Introduction………………………………………………………………………… ................................. 79
4.2 Research design……………………………………………………………………… .............................. 79
4.2.1 Stages of the research………………………………………………………… ............................... 80
4.3 Research methodology…………………………………………………… ...................................... 81
4.3.1 Philosophical worldview……………………………………………………… .............................. 83
4.4 Survey approach…………………………………………………………… ........................................ 84
4.4.1 Questionnaire for this study……………………………………………… ................................. 85
4.4.2 Questionnaire design………………………………………………………… ................................ 85
4.4.3 Limitations of questionnaire surveys…………………………………… .............................. 87
4.4.4 Interviews……………………………………………………………………………………………………. .... 87
4.4.4.1 Interview design………………………………………………………………………………………. ..... .88
4.5 Sample composition………………………………………………………………………………………. ..... .89
4.6 Literature review…………………………………………………………………………………………… .... . 91
4.7 Data analysis………………………………………………………………………………………………….. .... 91
4.8 Reliability and validity……………………………………………………………………………………. ..... 92
4.9 Ethical aspects……………………………………………………………………………………………….. .... 92
4.10 Conclusion…………………………………………………………………………………………………… ..... 93
Chapter 5: PRESENTATION AND ANALYSIS OF QUANTITATIVE RESULTS……………… ..... . 94
5.1 Introduction……………………………………………………………………………………………………..... 94
5.2 Descriptive statistics………………………………………………………………………………………. .... 94
5.3 Performance difference between planners and non-planners……………………….. .... 99
5.3.1 Gross turnover or sales as a performance indicator……………………………… ... ……. 100

v
5.3.2 Employment growth as a performance indicator……………………………………… ...… 102
5.4 Correlation analysis……………………………………………………………………………………….. ... 105
5.4.1 Relationship between formal strategic planning and performance in new firms
firms…………………………………………………………………………………………………………………… .. .. 106
5.4.2 Relationship between formal strategic planning and performance in the established firm sector…………………………………………………………………………………… .... …. 109
5.4.3 Relationship between formal strategic planning and performance for the
entire sample ……………………………………………………………………………………………………… ... 118
5.4.3.1 Employment growth for entire sample…………………………………… ... ……………….. 118
5.4.3.2 Sales growth for entire sample…………………………………………………… .. ……………. 120
5.5 Testing the hypothesis………………………………………………………………………… .. …………. 122
5.6 Summary………………………………………………………………………………………………… .. ……… 123
Chapter 6: PRESENTATION AND ANALYSIS OF QUALITATIVE RESULTS……………… .. ….. 124
6.1 Introduction……………………………………………………………………………………………………... 124
6.2 Importance of interviews in research………………………………………………… ... ………….. 124
6.3 Challenges related to the quality of data……………………………………………… ... ……….. 126
6.3.1 Handling qualitative research challenges……………………………………………… .. …….. 127
6.3.2 Addressing reliability………………………………………………………………………………… ...… 127
6.3.3 Addressing validity………………………………………………………………………………………. .. 128
6.4 Design of the interview………………………………………………………… .. ……………………….. 128
6.4.1 The interview schedule………………………………………………………… .. …………………….. 129
6.4.2 Administration of the interviews……………………………………………… .. …………………. 131
6.5 Results of the interviews………………………………………………………………… ... ……………… 131
6.5.1 SMEs 001, 002 and 003 …………….. …………………………………………………… .. …………. 133
6.5.2 SMEs 004, 005 and 006………………………………………………………………………… ... …….. 136
6.5.3 SMEs 007, 008 and 009…………………………………………………………………………… .. … ..139

vi
6.5.4 SMEs 010, 011 and 012…………………………………………………………………………….. ..... 142
6.5.5 SMEs 013, 014 and 015……………………………………………………………………………… .... 145
6.5.6 SMEs 016, 017 and 018……………………………………………………………………………… .... 148
6.5.7 SMEs 019, 020 and 021………………………………………………………………………………. ... 151
6.5.8 SMEs 022, 023 and 024………………………………………………………………………………. ... 154
6.6 Cross case analysis…………………………………………………………………………………………. .. 157
6.6.1 Interviewed firms by industrial sector…………………………………………………………. .. 157
6.6.2 Arrangement of interviewed firms by planning type…………………………………… .... 159
6.6.3 Usage of the tools of planning………………………………… .. ………………………………….. 160
6.6.4 The other types of planning used by firms…………………………………………………… .. 161
6.6.5 Environmental volatility as a contingency factor…………………………………………. .. 163
6.6.5.1 Correlations for the interviewed firms……………………………………………………… .. 164
6.6.6 Economic instability……………………………………………………………………………………. ... 170
6.6.7 Corruption…………………………………………………………………………………………………… .. 170
6.6.8 Knowledge of planning………………………………………………………………………………… .. 172
6.6.9 Gross turnover as a performance measure…………………………………………………. ... .173
6.7 Summary……………………………………………………………………………………………………….. ... 173
Chapter 7: DISCUSSION………………………………………………………………………………………… .. 175
7.1 Introduction……………………………………………………………………………………………………... 175
7.2 Planning practices of SMEs in Zimbabwe………………………………………………………..... 176
7.3 Rationale for the other types of planning used by firms in Zimbabwe……………. .. 183
7.4 Performance comparison between planners and non-planners…………………….. ... 185
7.4.1 Use of turnover as a performance indicator……………………………………………….. ... 189
7.5 Relationship between formal strategic planning and performance in small firms 190
7.6 Contingency approach application for optimal small firm performance…………. .. 193

vii
7.6.1 Contingency based model for unstable environments from findings… .. ………… 200
7.7 Future research considerations……………………………………………………………………… ... .203
7.8 Implications for practitioners…………………………………………………………………………. .. 205
7.9 Implications for policy makers………………………………………………………………………..... 206
7.10 Conclusion……………………………………………………………………………………………………. .. 207
REFERENCES………………………………………………………………………………………………………… ... 208
APPENDICES…………………………………………………………………………………………………….. ... 233
1. SME studies showing a relationship between strategy and performance…. .. 233 2. Definitions of strategy………………………………………………………………………… .. ……. 236 3. Conceptual framework…………………………………………………………………………….. .. 239 4. Questionnaire………………………………………………………………………………………… . . . 240 5. Interview guide………………………………………………………………………………………… .. 243

viii
List of figures ..........................................................................................................viii
2.0 The world’s biggest economies………………………………………………… ...... ………………….. 16
2.1 Contribution of SMEs to GDP of EU, Japan, USA and China……………………………. ..... 19
2.2 Contribution of SMEs to employment rate…………………………………………………….. .... 20
2.3 Features of SMEs……………………………………………………………………………………………. .... 21
2.4 Mintzberg’s model of strategy formation………………………………………………………. ..... 25
2.5 A stakeholders’ matrix showing which strategies to use………… ... ……………………….. 42
2.6 Conceptual framework…………………………………………………………………………………… .... 66
5.1 Form of organisation……………………………………………………………………………………… ..... 95
5.2 Industrial sector distribution………………………………………………………………………….. .... 96
5.3 Firm age / years of experience……………………………………………………………………….. .... 97
5.4 Density of planners and non-planners……………………………………………………………. .... 97
5.5 Distribution of formal strategic planners, outright non-planners and other
Planners………………………………………………………………………………………………………………. .... 98
6.1 Usage of planning tools by firms 001 to 003…………………………………………………. .... .134
6.2 Usage of planning tools by firms 004 to 006………………………………………………….. .... 137
6.3 Usage of planning tools by firms 007 to 009………………………………………………….. .... 140
6.4 Usage of planning tools by firms 010 to 012………………………………………………….. .... 143
6.5 Usage of planning tools by firms 013 to 015………………………………………………….. .... 146
6.6 Usage of planning tools by firms 016 to 018………………………………………………….. .... 149
6.7 Usage of planning tools by firms 019 to 021………………………………………………….. .... 152
6.8 Usage of planning tools by firms 022 to 024………………………………………………….. .... 155
6.9 Interviewed established firms by industrial sector………………………………………… .... 157
6.10 Established firms interviewed……………………………………………………………………… ... 157
6.11 Interviewed new firms by industrial sector…………………………………………………. .... 158

ix
6.12 Interviewed new firms………………………………………………………………………………… .... 158
6.13 Interviewed firms by planning type…………………………………………………………….. .... 159
6.14 Planning tools’ extent of usage……………………………………………………………………. ... 161
7.1 Interviewee firms by planning type……………………………………………………………… ..... 179
7.2 Planning tools extent of usage……………………………………………………………………….. .. 182
7.3 Hierarchical chart – Rationale for chosen planning approach…………………………. .. 185
7.4 Conceptual framework in graphical form……………………………………………………….. .. 198
7.5 Post fieldwork depiction of conceptual framework………………………………………… .. 199
7.6 Conceptual framework post analysis depiction……………………………………………… ... .200
7.7 PACOFIM model for unstable environments in line with findings…………………… .. 201
7.8 PACOFIM Model first column breakdown in line with findings………………………. ... .202

x
List of tables ............................................................................................................. x
1.1 SME studies showing no relationship between strategy and performance…… ......... 3
1.2 Aim, research objectives and research questions…………………………………… ................ 8
2.1 Different approaches to the SME definition……………………………… ............................ 15
2.2 Significance of formal strategic planning………………………………………………… ……… ... 31
3.1 Macroeconomic indicators………………………………………………………………… .................. 70
4.1 General description of the positivist and phenomenological paradigms ……………… 82
4.2 The four worldviews……………………………………………………………………………………… ...... 83
4.3 Strengths of the survey approach……………………………………………………………… ........... 84
4.4 Population size (N)………………………………………………………………………… ....................... 90
4.5 Table for determining sample size from a given population…………………… .............. 90
5.1 Formal strategic planning………………………………………………………………… .................... 98
5.2 Descriptive statistics of planners and non-planners…………………………… .................. 99
5.3 Sample sales growth statistics in preparation for independent t-tests .................. 100
5.4 Independent samples test for sales growth………………………………………………… ....... 101
5.5 Sample employment growth statistics in preparation for independent t-tests ..... 103
5.6 Independent samples test for employment growth……………………………… .............. 104
5.7 New firms’ sales growth statistics for use in correlation analysis……… .................. 106
5.8 New firm correlation analysis without a contingency factor………………… .............. 107
5.9 New firm correlation analysis with firm age as a contingency factor………… ......... 108
5.10 Established firms’ sales growth statistics for use in correlation analysis………… .. 109
5.11 Established firms’ correlation analysis with no contingency factor……………… .... .110
5.12 Established firms’ correlation analysis with firm age as contingency factor… .... 111
5.13 New firms’ employment growth statistics for correlation analysis…………… ... .....112
5.14 New firms’ correlation analysis without a contingency factor…………………… ...... .113
5.15 New firm correlation analysis with firm age as contingency factor……………… ..... 115

xi
5.16 Established firm statistics for correlation analysis……………………………… ............ ..115
5.17 Established firm correlation analysis without a contingency factor………… ......... 116
5.18 Established firm correlation analysis with firm age as a contingency factor…. ... 117
5.19 Entire sample descriptive statistics for correlation analysis…………………………. .... 118
5.20 Entire sample correlation analysis without a contingency factor and with
firm age as a contingency factor……………………………………………………………………… ........ 119
5.21 Entire sample descriptive statistics for correlation analysis……………………… ........ 120
5.22 Entire sample correlation analysis without a contingency factor and with
firm age as a contingency factor……………………………………………………………………… ........ 121
6.1 Arrangement of interviews……………………………………………………………………… ........... 131
6.2 Organisation specific aspects………………………………………………………… ..................... 133
6.3 Planning approach utilised………………………………………………………… .................... …..133
6.4 Effect of environment on business………………………………………… .................... ……….135
6.5 Association of planning and firm age……………………………… ...................... …………….135
6.6 Organisation specific aspects……………………………………… ...................... ………..........136
6.7 Planning approach utilised…………………………………………… ................. ……………………136
6.8 Effect of environment on business……………………… ...................... ……………………….138
6.9 Association of planning and firm age…………………… .................. …………………………...138
6.10 Organisation specific aspects………………………… ................. ……………………………..…139
6.11 Planning approach utilised……………………… .................... …………………………………...139
6.12 Effect of environment on business…………… ............... ……………………………………….141
6.13 Association of planning and firm age………… ............. …………………………………………141
6.14 Organisation specific aspects……………… ............... …………………………………………….142
6.15 Planning approach utilised……………… ............... ………………………………………………..142
6.16 Effect of environment on business……… ........ …………………………………………………...144
6.17 Association of planning and firm age… ........ ……………………………………………………..144

xii
6.18 Organisation specific aspects ......................... …………………………………………………..,145
6.19 Planning approach utilised……………… .............. ………………………………………………….145
6.20 Effect of environment on business……………………………………………………………………147
6.21 Association of planning and firm age………………………………………………………………..147
6.22 Organisation specific aspects……………………………………………………………………………148
6.23 Planning approach utilised……………………………………………………………………………….148
6.24 Effect of environment on business……………………………………………………………………150
6.25 Association of planning and firm age………………………………………………………………..150
6.26 Organisation specific aspects…………………………………………………………………………….151
6.27 Planning approach utilised………………………………………………………………………………..152
6.28 Effect of environment on business…………………………………………………………………….153
6.29 Association of planning and firm age…………………………………………………………………153
6.30 Organisation specific aspects…………………………………………………………………………….154
6.31 Planning approach utilised………………………………………………………………………………..154
6.32 Effect of environment on business…………………………………………………………………….156
6.33 Association of planning and firm age…………………………………………………………………156
6.34 Interviewed firms by planning type…………………………………………………………….......159
6.35 Interviewee firms’ planning timeframes……………………………………………………….….,162
6.36 Environmental hostility as a contingency factor………………………………………………..163
6.37 Simple correlations between formal strategic planning and performance………..165
6.38 Correlations between formal strategic planning and performance contingent
on environmental hostility…………………....................…………………………………………….. …,168
6.39 Longitudinal correlations without controlling for contingent factors…………… …,169
6.40 Longitudinal correlations with environmental hostility as contingency factor …,169
7.1 Survey participant firms by planning type………………………………………………………. …177
7.2 Interview participant firms by planning type………………………………………………………179

xiii
Acknowledgements
The Lord God almighty deserves reverence, praise and worship for it is Him who accorded me
the opportunity to do studies at PhD level. He was with me right from the beginning until the
end. Glory to God.
First and foremost, my profound and sincere gratitude to my supervisor and mentor, Prof. Kurt
Allman for his patience, going an extra mile in encouraging me, and for his insightful counsel,
without which this thesis would not have been a success. My supervisor moved to a different
university to take up a more senior and challenging job as Director of the Business school, but
that professional elevation did not diminish his zeal to supervise and inspire me. Irrespective
of his very busy schedule, he would still spare sufficient time for me. I am immensely thankful
to him.
I am thankful to Dr. S. Udagedara, Dr. J. Lord, Prof. K. Chang and Prof. N. Lockett for
energising me through their constructive, insightful and forward-looking comments. The
various presenters in the Doctoral training sessions deserve special mention as their
presentations contributed in the framing of this thesis. The PGR Support team deserves to be
thanked for their cordial yet professional conduct at all times. My colleagues, Dr. Udeni
Salmon and Moshood Bello were a constant source of inspiration. I extend my thanks to them.
I am thankful to my father (the retired Rev. Thomas Rufasha) for his prayers and unrelenting
encouragement. I am equally grateful to my siblings for their motivating words each time I
communicated with them. To my wife, Mercy, my three stars Isheanopa Emmanuel, Rena
Angel and Mufudzi Chido, I say thank you for being my companions and for your astounding
levels of understanding. There are a lot more whom I could have mentioned but while I am
greatly indebted to them, I cannot finish them all. A special thank you to them.
To all those I have mentioned and those I have not managed to mention, may the almighty God
continually bless them and particularly meet each one of them at their points of need.

xiv
Abstract
Considerably much has been written about the relationship between planning and performance
in small firms and yet there is disjointedness and little agreement on the findings. Such a
scenario calls for more research in the domain. This study explores the relationship between
formal strategic planning and performance in the small business sector of a developing
economy. Drawing on the contingency theory of management, the study, inter alia, identifies
knowledge gaps within the traditional contingency theory as well as in prior literature, and in
addressing such gaps, insightfully contributes to the body of knowledge in this field of study.
A mixed methods approach was adopted for rigour in responding to the research questions and
hypotheses. The study embraced questionnaire and interview routes with samples of 392 and
24 owner-managers of SMEs in Harare, Zimbabwe respectively. For a more comprehensive
analysis of the planning performance relationship, a longitudinal approach was adopted
covering three periods. Correlation analysis is employed in establishing the nature of the
relationships. Findings established reveal that there is no statistically significant relationship
between formal strategic planning and performance in the small business sector within the
context of an unstable and hostile environment. Further, an interesting revelation is unearthed
where the performance of formal strategic planners is not significantly different from that of
non-planners. The study sheds new light on the interplay between the contingency approach
and the relationship between formal strategic planning and performance in a developing, yet
unstable economy.

i

1
Chapter One: INTRODUCTION
1.1 Introduction and background
As far back as the 1960’s during its foundations, strategic planning has been hailed as a
fundamental basis for organisational success (Brinckmann, Grichnik and Kapsa, 2010).
Various authors have landed their support of this view and they include Steiner (1979) and
Herter (1995) who have asserted that formal strategic planning works in stable and predictable
environments (Boyd, Haynes, Hitt, Bergh, and Ketchen, 2012). Since then however, as a result
of economic and political dynamics, operating environments have become dynamic and
unpredictable and have seen changes in political, economic, social, technological and legal
perspectives, almost questioning the efficacy of long range planning. Drucker (1999) buttresses
this view through his statement, “we live in a period of profound transition”. Rooted in the
contingency theory of management (Mintzberg, 1994: Donaldson, 2001), this study mainly
seeks to establish the extent to which formal strategic planning is relevant in a turbulent
environment (Boyd, 2012). The contingency approach flavour adopted in this study is one
where organisations can decide on the extent of planning convenient dependant on the founding
environment (Brinckmann et al., 2010: Verreynne and Meyer, 2010). In other words,
organisations can flip between formal strategic planning and flexible, informal, emergent
strategic approaches (Verreynne and Meyer, 2010). In addressing this objective the study, inter
alia, explores the relationship between formal strategic planning and performance of small
firms in an unstable, volatile environment.
According to Brinckmann et al, (2010), and Verreynne and Meyer (2010), planning has been
found to have a positive correlation with organisational success but studies by Robinson and
Pearce (1983) and Robinson et al. (1986) found no positive relationship. Still other studies in
this domain have established that there is no difference in the performance of firms that are
involved in formal strategic planning and those that are not (Robinson and Pearce, 1984;

2
Robinson et al, 1986). Consistent with the above, Inkpen and Choudhury (1995) state that the
absence of a strategy ought not be associated with poor performance. Infact a few researchers
have questioned the efficacy of planning, some of them stating that planning is a time-wasting
exercise which surreptitiously takes away important productive time from small firm owner-
managers (Bhide, 2007; Beaver, 2007). Irrefutably therefore the debate on the relationship
between planning and organisational success is still hanging, and particularly so in the small
firm sector. The significance of the unending debate inter alia, is the support indirectly rendered
to the contingency approach whereby organisations can decide on which planning route to
adopt based upon the founding environment (Yu et al., 2012).
Most of the prior studies in any case relate to large organisations and were conducted in
developed countries. Appendix 1 and table 1.1 below have summaries of small firm studies
which the author had a chance to peruse. Very few studies if any have been conducted in
developing countries and specifically focusing on small and medium enterprises (SME’s) to
establish the relationship between small firm formal strategic planning and their performance.
In a developing country such as Zimbabwe there is an apparent dearth of published studies that
are specific to the area described. Furthermore, Zimbabwe is a ‘turbulent’ environment
(Makanyeza and Dzvuke, 2015) and provides an opportunity to examine planning and its
relationship to performance within that peculiar environmental set up.

3
Table 1.1 SME studies showing no relationship between strategy and performance
Study Sample type &
size
Measures of
strategic
planning
Performance
measures
Findings
Robinson and Pearce
(1983)
85 small banks Use of formal planning;
written documentation;
use of environmental
scanning; setting of
goals and objectives;
Distinct competency;
authority relationships;
resource deployment;
monitor control
Financial (loan) growth No relationship between
formal strategy and
financial performance
McKiernan & Morris
(1994)
1380 small firms Use of formal planning Financial; sales growth;
profit margin; return on
current assets; employee
productivity
Formality of the
strategic planning
process does not impact
on performance
1.2 Importance of the study and its contribution to existing knowledge and understanding
In the previous section and in line with the literature review which falls under the next chapter,
identified gaps in the existing literature in relation to SMEs, include the following:
• the relationship between formal strategic planning and performance of small firms
is unclear as there are gross inconsistencies in findings, reflecting contradictions
and disjointedness. Most of the studies however relate to large firms as opposed
to small firms, and present mixed findings.
• the existing literature mainly discusses planning in its generic terms without
singling out formal strategic planning, and particularly in the small firm sector.

4
• as far as the author is aware, this is the first time a single study looks at both new
and established small firms to establish the relationship between formal strategic
planning and performance.
• existing literature bemoans the thin literature base in this field of study. Carrying
out this study partly fills this gap.
• Meta analyses in this research area have less studies coming from the developing
world.
• Sub Saharan Africa has a dearth of in depth published research in the area
described
This study is based on the contingency theory or approach, also known as the situational
approach, which basically is a concept in management stating that there is no one universally
applicable set of management principles by which to manage organisations (Yu et al., 2012).
De Geus (1997) observes that each organisation differs from the next and they face different
contingency variables or situations which ultimately imply that they have to manage their
peculiar situations differently. Prior to this, Steiner (1971) had long observed that there is no
universal strategy formulation structure applicable to all organisations. In the contingency
theory of management, and using the assumption of fit, the relationship is between some
characteristic of management (in this case, formal strategic planning) and effectiveness or
performance.
The study seeks to explore the validity of the contingency theory within the context of small
firm formal strategic planning in Sub-Saharan Africa. The contingency approach as adopted in
this study is one where organisations have the freedom to decide on the extent of planning to
adopt in view of the founding environment. Impliedly, organisations can flip between formal
strategic planning and flexible, informal and emergent strategic approaches particularly in
unstable and unpredictable environments (Donaldson, 2001). Two planning schools have
emerged from literature, the planning and learning schools (Brinckmann et. al, 2010).
According to planning scholars, business planning is even more important in dynamic and

5
unstable external environments because it reduces uncertainty, maintains the critical control
function to avoid subjectivity and biases, and enhances quick decision making (Delmar and
Shane, 2003; Brinckmann et. al, 2010).
The other school, the learning school, which is supportive of the contingency approach, argues
for adaptation in strategy development (Pansiri and Temtime, 2010; Verreynne and Meyer,
2010; Brews and Hunt, 1999). Emergent strategic approaches are divorced from formal
planning as they avoid predefined formal plans. Literature recommends such emergent
approaches as being quite effective especially in hostile and unpredictable environments (Boyd
et al., 2012; Mintzberg, 1994). Emergent strategies are action based to enhance capturing of
opportunities as and when they come up (Pansiri and Temtime, 2010; Mintzberg and Waters,
1985). The learning school differs from the planning school in that it calls for organisations to
concentrate on learning and engage flexible approaches to adapt strategy in the face of
environmental unpredictability (Hough and White, 2003). Proponents of the learning school
further note that in highly uncertain environments, formalised and predictive planning may
result in intra-organisational rigidities which negatively impact on performance (Boyd et al.,
2012; Mosakowski, 1997; Bresser and Bishop, 1983). Since information gaps are inherent in
fast-paced and uncertain environments, coming up with workable formal plans in such
environments is highly unlikely (Boyd et al., 2012).
Some of the identified contingency theory gaps applicable to this study are as given below: -
• Contingency theory fails to clarify the nature of the contingency variables that may
affect organisational behaviour in strategic management. This study circumvents this
challenge by using contingency variables that have been used in prior literature.
• Contingency theory is criticised for being paradoxically deterministic as it tends to lead
to a single optimum structural ‘decision choice’ in a given situation. This study will
attempt to give recommendations that are not classicist or deterministic.
The theory implicitly assumes that managers can deliberately move their organisations from
misfit into full or perfect fit, a move which literature criticises as utopian or impractical. Rather,
a movement of organisations into quasi fit is more practical. In this study, organisations are

6
taken as moving from misfit into quasi fit, which can be further improved to the next quasi fit
level.
1.3 Aim, Research objectives and questions
Findings from erstwhile studies in the domain of small business planning and performance are
in disagreement and fragmented (Chwolka and Raith, 2012). Whereas some studies have
established a positive correlation between planning and performance, others found no
relationship at all and yet others revealed a negative relationship. Further, evidence from prior
studies is again in an unsettled debate where most extant traditional literature revealed that
planning firms outperform non-planning firms, while the other group of studies expose findings
that are the exact opposite of the former (Brinckmann et al., 2010).
The Zimbabwean economic scene has been gripped by a high degree of uncertainty among
business operators (RBZ, 2015). This stems back to, inter alia, the retrogressive Zimbabwe's
Economic Structural Adjustment Programme (ESAP) of 1990 (World Bank, 1994) which
triggered budget overruns, to the Fast-Track Land Reform Program of 2000 (GoZ, 2000) which
seized farm land, effectively displacing an experienced and established farming community
and replacing same with new farmers, most of whom were not well-resourced and
knowledgeable enough to run the farms, the populist Indigenisation and Economic
Empowerment Act of 2008, which ceded the majority shareholding of companies to locals, and
the eventual hyperinflation of 2008. Between 2007 and 2008 alone, inflation sky rocketed from
8000% to 230 million percent (Ndedzu et al., 2013). This marked the demise of the local
currency (the Zimbabwe dollar), and the emergence of the multi-currency regime. The
country’s citizens lost all of their savings in Zimbabwe dollars overnight, only to start from
zero multi-currency bank account balances. As that was not enough, in less than a decade, the
Government in 2016 introduced a surrogate currency, following questionable and seemingly
artificial foreign currency shortages. The move was met with adverse criticism resulting in a
parallel market, with many businesses (ironically, including banks) either shunning it or
deflating its supposed value (RBZ, 2017). Over and above that in 2016 there was a contentious
imports embargo in the industrially deteriorated economy. A combination of these and other

7
events apparently degraded the ease of doing business in the country. Questions on the efficacy
of planning are bound to come up in the midst of such confusing events.
It is an irrefutable fact that small and medium enterprises owner managers still hold vivid
memories of how formal strategic planning was demoted to insignificance in light of the afore-
discussed events which were unpredictable. A case in point, amply supporting this point, is the
2015 indiscriminate withdrawal of operations by a giant multi-national company, Rio Tinto. It
was the world’s second-largest mining company, which had been in the country for more than
60 years (ZCTU, 2016). A question that immediately comes to the fore is, “Did they fail
because of inadequate planning?” This is only but a modicum of the dynamics in the
Zimbabwean business environment – a very unstable, highly volatile and unpredictable
environment (Makanyeza and Dzvuke, 2015). According to the Government of Zimbabwe
(2016) statistics, over ten thousand (10,000) big companies ceased operations between 2009
and 2016. It is clear from the foregoing that if the hostile business environment in Zimbabwe
could lead to closure of operations by some of the giant multi-national corporations, then the
under-resourced small firms are even more vulnerable. In fact Gombarume (2014) observes
that the small firm sector is performing poorly and closures are rampant.
The foregoing were some of the guiding issues in the formulation of the research aim,
objectives and questions, which are outlined below: -

8
Table 1.2: Research aim, objectives and questions
Aim Research Objectives Research Questions
To analyse the relationship
between formal strategic
planning and performance in
the small business sector of a
developing economy such as
Zimbabwe.
1. To investigate the extent
to which small businesses
in Zimbabwe engage in
formal strategic planning.
2. To find out the rationale
for the other types of
planning carried out by
small firms.
3. To compare the
performance of small
businesses engaged in
formal strategic planning
with that of those that are
not.
4. To analyse the
relationship between
formal strategic planning
and organisational
performance of new and
established small
businesses.
5. To assess how the
contingency approach can be
utilised to optimise
performance in the small firm
sector.
1. How do small firms in
Zimbabwe engage in formal
strategic planning?
2. What is the rationale for the
other types of planning used
by small firms in Zimbabwe
3. Is there a sustained
performance difference
between planners and non-
planners?
4. To what degree is there a
relationship between formal
strategic planning and
performance in new (less
than eight years in
operation) and established
(eight years or more in
operation) small businesses?
5. How can the contingency
approach be best applied for
optimal small firm
performance?

9
1.4 Structure of the study
This thesis is comprised of seven chapters, followed by a list of references and appendices.
This chapter, Chapter One, provides a synopsis of the thesis and the general background and
foundation of the study. It further outlines the research aims, objectives and questions, as well
as an outline of the significance of the study.
Chapter Two presents a review of prior literature in this domain. It discusses the definition of
and significance of SMEs, an outline of strategy and its various facets, strategy as it relates to
contingency theory is discussed, contingency theory is discussed at length by looking at its
origins, its tenets, gaps and weaknesses, and tools of strategy making are also presented. The
chapter proceeds to look at performance, its meaning in this study and in prior literature and
the general construct of performance. The relationship between strategy and performance as
well as performance comparisons between planning and non-planning firms is discussed as
well. The theoretical framework is also presented in this chapter. The framework is based on
the Contingency theory of management which posits that there is no one way of managing
organisations, and in this context, managing strategy in small firms.
Chapter Three Puts the research into context by giving a brief historical perspective of the
Zimbabwean economy and the small enterprises sector. It looks at selected macro-economic
indicators like unemployment, inflation, GDP growth rates and related variables. Important
institutions in the country’s political history like the government of national unity (GNU) and
the government post dissolution of the GNU are deliberated on. Economic sectors discussed
include agriculture, mining, and SMEs sectors. At the end, the chapter highlights the historical
events that earn the country’s economic environment the labels ‘unstable’ and ‘hostile’.
In Chapter Four the research methodology, research approach and research methods adopted
are discussed. The first section of this chapter deliberates on the research design followed by

10
an outline of the stages of the research and research methodology. A discussion of the survey
approach ensues, the study’s questionnaire, its design and general limitations of questionnaire
surveys are highlighted. The sections after this tackle interviews and the interview design of
the study. The sample composition, data analysis, reliability and validity as well as ethical
aspects of the study are looked at.
Chapter Five presents and analyses quantitative results. It commences by giving the
descriptive results after which it outlines the performance difference between planners and non-
planners, first with growth in gross turnover as a performance indicator and second, with
employment growth as a performance indicator. Through correlation analysis, the chapter
analyses the relationship between formal strategic planning and performance in new firms. The
same analysis is done for established firms and then for the entire sample. The chapter finishes
by testing the hypotheses.
Chapter Six is the presentation and analysis of qualitative results from the interviews carried
out. It opens by a deliberation on the importance of interviews in research. Challenges related
to the quality of data, handling qualitative research challenges, addressing reliability and
validity occupy the next sections respectively. From here the chapter discusses addressing
validity, interview design, the interview schedule and administration of the interviews. Results
of the interviews are tackled next and these were deliberated on an interview by interview basis,
after which cross case analysis is done. Presentation of descriptive results for both established
and new firms comes next, then the sections on usage of planning tools, the other types of
planning used by small firms, environmental volatility as a contingency factor, correlations for
the interviewed firms. Economic instability, corruption and gross turnover as a measure of
performance are outlined at the tail end of the chapter.
In Chapter Seven, findings from the prior two chapters are discoursed. The chapter discusses
through handling each of the research questions at a time. In this regard, it commences by
looking at the planning practices of SMEs in Zimbabwe, followed by a discussion on the
rationale for the other types of planning used by small firms in Zimbabwe. Next, the chapter

11
focuses on the performance comparison between planners and non-planners. The relationship
between formal strategic planning and performance in small firms, with and without
contingency factors is deliberated on, followed by the contingency approach application for
optimal small firm performance. A model based on findings is discoursed, and it is code-named
PACOFIM model for volatile environments. The chapter proceeds to deliberate on future
research considerations, implications for practitioners and implications for policy makers.
1.5 Summary
This chapter has given the general introductory background of the study. Areas that have been
discussed include justification and rationale for the research, aims and objectives of the
research, research questions and structure of the study. The next chapter deals with a
comprehensive review of literature.

12
Chapter two: LITERATURE REVIEW
2.0 Introduction
The main objective of this section is to lay a theoretical background of the study. Key research
concepts are discussed in line with prior literature. The chapter begins by evaluating SME
definitions, culminating in section 2.1.1 which establishes a working definition for a small
enterprise for the purposes of this study. Section 2.2 deliberates on the significance of SMEs.
Next, in section 2.3, the strategic planning construct is discussed, focussing on its definition,
its association with the contingency theory of management, the three main planning paradigms
being prescriptive, descriptive and the hybrid prescriptive-emergent approach, a strategy
definition that fits small firms, formal strategic planning and the small firm in section 2.4 and
the tools of strategic planning in section 2.5. Section 2.6 deliberates on the construct of
performance, and section 2.7 looks at strategic planning and its relationship to performance
while newness of small firms is discoursed in section 2.8. Section 2.9 handles the theoretical
perspective including contingency theory, the contingency factors for this study, the effect of
contingent factors on organisational performance and the identified weaknesses of contingency
theory. The chapter finishes with a discussion on the conceptual framework for this study.
2.1 Defining Micro, Small and Medium Enterprise (SME)
The SME taxonomy is a broad definition mainly comprising micro, small and medium sized
enterprises. The definition further touches on employee numbers, financial aspects like
turnover and balance sheet values (Robu, 2013; European Commission, 2003) whilst also
taking cognisance of managerial independence and market share (Bolton report, 1971). An
analysis of previous studies in this domain reveals that there is no single universally canonical
definition of a small firm. Various accepted definitions and classifications of SMEs are given
by different industries, countries, organisations and studies.
As far back as the 1970s, the lack of a uniform SME definition was raised as an issue in the
Bolton report (1971). Now, more than forty years later, the same concern remains unresolved.
As it appears, there is no likelihood of a solution at least in the foreseeable future as each

13
country, industry or organization is determined to hold firmly to their unique definitions.
Coming up with a single definition appears to be a futile exercise as evidenced by the length
of time it has so far taken since the absence of a universal definition was voiced as an issue
of concern. Coupled to this, scholars in the entrepreneurship field have continued to
undertake studies with different definitions reflective of the different countries,
organisations, industries, et cetera they will be representing. What perhaps may be of
assistance is a general guideline from which the different stakeholders draw and come up
with their own definitions.
In the same manner that definitions differ, small firm terminologies also differ from one
country, organisation and study to the next. The abbreviation “SME” is used in the European
Union and by international organisations such as the World Bank, the United Nations and the
World Trade Organization (WTO). Zimbabwe uses the term MSME (Micro Small and Medium
Enterprises – www.msmed.gov.zw) while South Africa uses the term SMME for small,
medium and micro enterprises. The term “small and medium businesses” (or SMBs) is
predominantly used in the United States of America.
Salient points in one of the pioneer and somewhat rudimentary definitions of SMEs (Bolton
report, 1971, p. 1) include:
• Occupies a small share of the market
• Managed by owner(s) in a personalised way without a formal management structure
• Is independent and managers make decisions without any outside control
As if partially borrowing from the above, the SME Act of Zimbabwe defines micro, small and
medium sized enterprises in terms of three major categorisations being number of employees,
turnover of the enterprise and value of assets. The Act however remains silent on the specifics
like the quantum of employees, numerical level of turnover and the quantified assets value. To
this end, academics and practitioners appear to be groping in the dark in this regard, and have
coined their own tailor-made definitions. Munanga (2013) defines the Zimbabwean SME as
one with at most 75 employees but goes ahead to state that the definition is not a substantive
one. Makanyeza and Dzvuke (2015) quote Manyani et.al. (2014) who states that an SME in
Zimbabwe is a registered concern with at most one hundred employees and an annual turnover
of not more than $830,000. Makanyeza and Dzvuke (2015) define an SME as a registered
14
concern that employs not more than one hundred employees and is not dominant in the field it
operates. Because of these inconsistencies, this study will adopt a definition drawn from extant
literature as given at the end of this section.
The European Commission (2003) states that defining SMEs through the criterion of staff
numbers (staff headcount) should be observed as the main criterion. The commission further
stresses that introducing a financial criterion is nonetheless a necessary adjunct in order to grasp
the real scale and performance of an enterprise and its position compared to its competitors
(European Commission, 2003.p. 1). Consistent with the foregoing, the main factors
determining whether a business concern is an SME are: (1) number of employees and (2) either
turnover or balance sheet total. According to the European Commission (2003) an SME is one
with a maximum employee complement of 250, maximum turnover and balance sheet total of
50 million Euro and 43 million Euro respectively. The United States of America uses the same
definition where groupings are:
Micro enterprises - up to 9 employees,
Small enterprises - 10 – 99 employees, and
Medium enterprises - 100 – 499 employees
Indicative of how widely the European Commission’s definition has been embraced, out of a
World Bank study of 132 economies (Kushnir; Mirmulstein and Ramalho, 2010), a third
defined SMEs as having up to 250 employees while the other economies had various ceilings
that ranged from less than 19 to 499. The US Small Business Administration defines a small
firm as a business that is independently operated, exerts little influence in its industry and
employs fewer than five hundred people. Further epitomizing the heterogeneous nature of the
SME definition, South Africa’s definition is up to 200 employees, 300 for Japan, while China
has up to 3000 employees (Kushnir et al, 2010). The definitions per se are not reflective of the
economic performance of a country as evidenced by the wide differences in the employee
headcounts set by different countries. For instance, China’s 3000 employee ceiling is difficult
to reconcile with figures like 250 for almost a third of European Commission member states,
300 for Japan and also with the 499 ceiling set in America. The differences are difficult to
explain in economic performance terms and are therefore simply reflective of a country’s
choice (Fig 2.0 refers).

15
The table below gives a generalised position on the small and medium enterprise definitions
used in line with discussions above.
Table 2.1: Different Approaches to the SME Definition
No. Criteria Name Dominant Characteristic
1. Economic sphere
Generalised
A single generalised small and medium
enterprises definition encompassing all
economic sectors
Differentiated Different definitions of SMEs in
different economic sectors e.g. transport,
telecommunication etc.
2. Number of indicators used Unidimensional
Using a single indicator in the SME
definition. The most commonly used
indicator is the number of employees.
Multi-dimensional
Using two or more indicators in the SME
definition. The most commonly used are
the number of employees, turnover and
size of balance sheet
Source: Robu (2013)
Given the differences in definitions from country to country, and further noting that the
definitions have little to do with a country’s economic performance but rather are a reflection
of the unique choice of a country based on its peculiar interests (see Fig 2.0). For the purposes
of this study, and in view of the fact that there is no clear definition of an SME in Zimbabwe,
the working definition will be firms with up to two hundred and fifty employees and sales up
to one million Great British Pounds (GBP). The definition is in synchrony with the EU
definition. If China has 3000 as its maximum employee headcount for an SME, Japan, 300
maximum employee headcount, and England has 250 while America has 499, it is the
researcher’s view that notwithstanding South Africa’s 200 maximum employee headcount,
Zimbabwe can have 250, which is 50 more. As discussed earlier, the figures appear to reflect

16
the unique interests of the country or organization coining same. In the current instance, the
interests are mainly for comparability of studies in this domain while also addressing the lack
of a definite definition of an SME in the country as explained earlier (Munanga, 2013;
Makanyeza and Dzvuke, 2015).
Source: International Monetary Fund, World Economic Outlook, April 2017
Fig 2.0: The world’s biggest economies’ GDPs vs SME definition by employee headcount
2.1.1 Scope for Reviewing the SME Definition
The current definitions that involve employment size and financial measures like turnover and
balance sheet size remain questionable as they are not sufficiently focused to circumvent
misinterpretation. Boswell (1973) contends that financial measures are ‘subject to the obvious
erosion of inflation’ and that employment figures can be ‘dubious’.
The employee numbers criterion seemingly loses relevance due to technological advancements
where high-tech machinery can be employed to run with operations that would otherwise call
for several persons to perform. On the other hand, some operations are more knowledge-based
and therefore might not as such call for large numbers of employees. While such small firms
have thin employee bases, their revenues will be high irrespective. Consulting firms are a

17
typical example of knowledge based operations. Information technology concerns are an
example of high-tech firms which may not have many employees and yet register high turnover
figures.
Going through the definitions, the researcher noted that it is not very clear how the following
firms are treated in terms of categorisation between small firms and large firms:
• With few employees within the level set for small and medium enterprises but with
turnover exceeding the maximum set for small and medium enterprises
The reverse situation however appears clear where an organisation has employee numbers
above the maximum set for a small and medium enterprise but recording turnover below the
maximum set for small and medium enterprises. Such can be termed a big firm on the basis of
the employee numbers. Instances of seemingly loose ends like the one explained above need
to be tightened in the interest of a more compact and precise definition.
In one of the World Bank papers, Gibson and Vaartinded (2008) suggest an interesting
definition which is, “An SME is a formal enterprise with annual turnover, in currency terms,
of between 10 and 1000 times the mean per capita gross national income, at purchasing power
parity, of the country in which it operates”. The definition is unidimensional in that it ignores
the employee numbers criterion, consciously choosing to focus primarily on the financial
aspect of turnover with respect to national income. In that respect, the definition addresses
concerns raised earlier on knowledge-based and high-tech operations. It remains unclear as
well if the turnover is treated in gross or net terms. For the avoidance of variances brought
about by different approaches to accounting, the researcher finds it reasonable to use gross
turnover.
To the extent that the suggested definition views SMEs as formal enterprises, it is difficult to
operationalise. The reason for this is that there is a substantial number of informal SMEs
particularly in developing economies. To this end, the definition may be more applicable in the
developed world.

18
The SME taxonomy is a broad definition and definitions that dwell on employee head count
and financial aspects like turnover and balance sheet size, though detailed, appear a little
simplistic to sufficiently capture the richness and complexity of the construct within the context
of the dynamic business world in which enterprises operate. A review of the definitions is
needed in the interest of keeping such focused, current and applicable.
2.2 Significance of the Small and Medium Enterprises
Researchers are in general agreement that small and medium enterprises play a pivotal role
both at national and global economic levels (Ciubotariu, 2013; Robu, 2013; Brinkmann et. al.,
2010). Robu (2013) argues that the ability of a nation to create a conducive environment for
SMEs directly determines economic performance and level of economic development of the
nation concerned. This comes on the back of the fact that in any economy, whether advanced
or developing, the SME sector is the major contributor to that economy’s gross domestic
product (Robu, 2013). Reflective of the importance of small and medium enterprises, a number
of countries have got government ministries specifically meant for the SMEs. More so, several
business schools in the world’s universities now offer Small Enterprise Management or
Entrepreneurship as some of their core courses. The diagram below portrays the contribution
by SMEs to gross domestic products (GDP) of selected nations.

19
Figure 2.1: Contribution of SMEs to GDP of EU, Japan, USA and China
Source: Robu (2013)
SMEs generate current and future wealth and employment. Frese et. al., (2007) argue that
poverty reduction and economic development can be achieved through creating the right
environment for the small and medium enterprises sector. According to the European
Commission (2012) more than 98% of enterprises within the EU are SMEs and they employ
more than 60% of the active labour force. In this context SMEs make a contribution towards
social stability. SMEs have the advantage of inherent resilience, and they can continue to
operate even when large corporations are scaling down or outright closing down (Oregan,
2007). In unstable economies like Zimbabwe where large companies are scaling down while
others are closing shop, SMEs can buttress the economy as they can absorb a substantial portion
of the labour force leaving the large companies (Makanyeza and Dzvuke, 2015).
In a snapshot, the diagram below gives a holistic picture of SMEs’ contribution to the rate of
employment.
0% 10% 20% 30% 40% 50% 60% 70%
EU
Japan
USA
China
Contribution to GDP

20
Figure 2.2: Contribution of SMEs to employment rate
Source: Ciubotariu (2013)
In countries with lower per capita income, SMEs contribute more to employment (78%) than
in countries with higher income per capita (59%). In support of this view, Makanyeza and
Dzvuke (2015) quote Manyani et. al., (2014) who states that the SMEs’ contribution to
employment in Zimbabwe is around 90%. Zimbabwe is a low per capita income economy. In
sharp contrast to this and further proving the validity of the above assertion, Robu (2013) writes
that in 2010 the level of employment contributed by EU SMEs was 67%. The EU generally
houses high per capita income economies. Consistent with this, the European Commission
(2012) states that SMEs represent more than 95% of enterprises and also provide 60-70% of
the jobs. Accordingly poverty, social unrest and lack of economic development can be
addressed through empowering or enabling the SME sector (Frese et. al., 2007). This is an
issue that will further be looked at in discussions as it has policy making connotations.
SMEs are important in various ways and the following diagram gives their characteristics.
From the characteristics, one can discern the significance of the sector.
78%67%
59%66%
0%
10%
20%
30%
40%
50%
60%
70%
80%
90%
Low per capitaincome economies
Slightly low percapita income
economies
Slightly high percapita income
economies
High per capitaincome economies

21
Table 2.2: Features of SMEs
Source: Adapted from Ciubotariu (2013)
The SME sector is important and dictates the pace of economic growth and development of
any nation. It is critical to investigate the link between formal strategic planning and
performance in this critical sector of a developing economy. Findings and discussions should
have economy-wide ramifications.
Characteristics of SMEs
A rapid system of internal communication with personal contact between management and employees
External communication system highly responsive to the market, based on direct contact between management and customers
Personalised and centralised management, ususally the owner is the manager A hierarchical structure with fewer levels
Less formal strategy, usually intuitiveReduced specialisation of staff, employees often do multi-tasking
Small numbers in terms of employment Lack of a strong position to negotiate
Difficulties in obtaining capitalA close relationship with the local community
Usually reluctant to adopt regulationsLess sensitive to institutional pressure as large companies are
Feed the large enterprises sector as they gradually graduate into large firms Usually at the forefront of innovation

22
2.3 Strategic Planning
Strategic plans are a vital feature of modern organisational management. Governments,
educational institutions, financiers, consultants, government agencies and non-governmental
organisations normally encourage the establishment and usage of strategic plans. In academic
institutions, strategic management has become an important subject of the Business
Management curriculum thereby further epitomising the importance attributed to the
discipline. Even though there are researchers who question the efficacy of planning (Beaver,
2007; Bhide, 2007; Honig, 2008), one widely held belief is that there is a positive association
between planning and performance (Burke, Fraser and Greene, 2010).
2.3.1 Definition of Strategic Planning
Strategy as a term was originally used in the military context but since the 1960’s it has been
adopted in business management circles where it is now under extensive use (Mintzberg et.al.,
1998). At first glance, strategic planning appears to be a clear concept but after a substantial
review of literature, it becomes apparent that researchers are not agreed on a uniform definition
of the construct. As a result, the area of strategy and its definition has received wide literary
attention. Some of the various definitions picked randomly over a period of time are as depicted
in Appendix 2.
The various definitions tend to confuse both the academic and the practitioner as to which one
to adopt. It is important to establish a single all-encompassing definition that befits the micro,
small and medium enterprises sector. A good starting point is presented by Mintzberg (1978)
who argues that while strategy has been defined differently, there is a theme commonality that
runs through all the various definitions. It involves defining strategy as a deliberate and
conscious set of guidelines that determines decisions into the future. Another common feature
is that strategy is treated as (i) explicit, (ii) developed consciously and purposefully, and (iii)
made in advance of the decisions to which it applies.

23
Given that this study’s conceptual model is founded on the contingency approach to strategic
management (Yu et al., 2012), it is important to discuss the approach in coming up with a
definition that suits the small firm sector.
2.3.2 Strategic Planning and the Contingency Approach
The contingency approach to management, which evolved during the 1960s, is founded on the
idea that there is no one best way to manage organisations (Mintzberg, 1994; Yu et al., 2012).
Furthermore, to be effective, the major pillars of management science which are planning,
organising, leading, and controlling must be tailored to the particular circumstances affecting
the organisation. Put differently, the approach stems from the theory that management
effectiveness is dependent or contingent upon the interplay between particular situations and
management behaviours. The theory rather propounds that management techniques ought to
be dependent on the circumstances obtaining, implying that circumstances should dictate the
management approach (Yu et al., 2012; Donaldson, 2001).
The approach’s opinion is that management is not static or rigid, but should be flexible and
alter in line with the applicable circumstances or situation (Donaldson, 2001). Insinuated, a
one-size-fits-all stance to management cannot be accommodated by this approach (Boyd et al.,
2012). Organisations are different, face different situations and require different ways of
managing. The approach comes against the classical process and models postulated by
management theorists such as Frederick Taylor (1856 – 1915) and Henri Fayol (1841 – 1925).
The classicists came under attack in the 1950s and 1960s from a group of management thinkers
who held the belief that the classical approach was inflexible and did not consider
environmental contingencies. Irrespective of the fact that both Fayol and Taylor had a
contingency aspect in their works, the criticisms were successfully used in creating the
contingency school of management.

24
The contingency approach to management is founded on the contingency theory of leadership
effectiveness which was postulated by psychologist Fred Fiedler around the 1960s and 1974.
This came as a result of dissatisfaction with trait based theories of leadership effectiveness,
coined by the classicists. Various situational aspects were identified to impact on the
effectiveness of different leadership styles (Donaldson, 2001). For instance Fiedler suggests
that the degree to which subordinates like or trust the leader, the degree to which the task is
structured, and the formal authority possessed by the leader are key determinants of the
leadership situation.
Task oriented or relationship oriented leadership should each work if they fit the characteristics
of the situation. The contingency approach has impacted a number of areas in management
science and one such area is strategic management (Boyd et al., 2012). Over and above the
traditional formalistic or classical strategic management framework, there are emergent
approaches to strategic management (Donaldson, 2001; Mintzberg and Waters, 1985).
Mintzberg (1994) states, “The process of strategy making must be loosened up and not get set
in concrete through arbitrary formalisation”.
The classical approach to strategy making, also coined the prescriptive approach, (Mintzberg
and Waters, 1995) is one which presupposes a predictable, benign environment therefore plans
are pre-set (Boyd et al., 2012). The more modern approach amenable to the contingency model
is labelled the descriptive, learning or emergent approach (Mintzberg and Waters, 1985). The
view holds that the environment is unpredictable and therefore as changes occur, strategy is
revisited and reviewed in line with the ever changing exogenous and firm specific factors
(Verreynne and Meyer, 2010).
Infact, due to the constant changes and sometimes turbulent, unpredictable nature of the
environment, it becomes near impractical to program and specify strategy ahead of time
(Mintzberg, 1995; Boyd et al., 2012). Rather, strategy should change over time in sympathy
with shifts in the environment (Pansiri and Temtime, 2010; Mintzberg and Waters, 1985). This
approach is also called ‘logical incrementalism’ by Harrington (2001) or the learning
perspective (Mintzberg et.al., 1998). Lyngso (2014) labels it agile strategy management. A

25
commonality runs through the different definitions and names, and it is the characteristic of
flexibility in strategy management as opposed to the blinkers and rigidity of prescriptive
planning. Honig (2004) expresses the difference of the two concepts by stating that planning is
more of a prescriptive approach while learning mainly has to do with emergent situations or
contingencies.
In consistency with the emergent perspective, Ansoff (1994) states, “….in today’s environment
there are “horses for courses”, different environmental challenges require different strategic
responses and, as a consequence, different planning approaches’. Ansoff further states that the
original version of strategic planning is ‘no longer with us’ as it has been metamorphosed into
various planning regimes that respond to environmental challenges – generally termed
emergent approaches. This is further corroborated in the works of Pansiri and Temtime (2010)
and Verreynne and Meyer (2010) who all emphasise not only the criticality of environmental
awareness in strategic management but also the overarching need to resonate with
environmental changes. Stonehouse and Pemberton (2002) hold a slightly different perspective
of planning from Ansoff in that they argue against a complete side-lining of the prescriptive
approach. They caution that instead of rigidly focusing on a single approach, which is
unhealthy, a combination of the prescriptive and emergent paradigms is a good anecdote
against poor performance (Stonehouse and Pemberton, 2002).
Unrealised strategy Emergent strategy
Fig 2.4: Mintzberg’s model of strategy formation (source, Mintzberg and Waters, 1985)
Intended strategy

26
Mintzberg’s typology represented in the above diagram depicts both the classical and emergent
approaches to strategic management. An example of deliberate or planned strategy is the
Mission Statement. Strategy which is not guided by intentions can emerge in an organisation,
and this exemplifies emergent strategy.
The founding pillars of the descriptive or emergent approach were erected through the work of
Mintzberg and others (Mintzberg and Waters, 1985; Mintzberg et.al., 1998; Burns and Stalker,
1961; Payne and Pugh, 1976). Strategy establishment is portrayed as an ongoing exercise of
revising and acclimatizing in line with changing environmental conditions (Pansiri and
Temtime, 2010; Kraus and Kaurane, 2009). The contingency theory accommodates the co-
existence of both emergent and prescriptive approaches to strategy management. Echoing the
same line of reasoning, Stonehouse and Pemberton (2002) as earlier discussed, reveal the
importance of the descriptive approach but go further to state that the prescriptive approach
needs not be totally ruled out.
2.3.3 The Prescriptive Approach
The basis of this view is long term strategy focus based on the availability of relevant
information to the decision maker. Similar terms for the prescriptive approach include the
methodical or systematic approach (Ansoff, 1987), formality of strategy (Brinckmann et al.,
2010), the normative, deliberate and rational views of strategy (Hart, 1992). Siding with the
former view, Armstrong (1982) defined normative strategy formulation as the process of
establishment of identifiable objectives and the required actions to achieve them. Stonehouse
and Pemberton (2002) observed that the prescriptive approach of strategic management is
strongly systematised and deterministic in nature, concentrating mainly on the long term
strategy formulation aspect (Boyd et al., 2012). The long term orientation of the prescriptive
approach thrives in fairly stable and predictable founding environments (Boyd et al., 2012).

27
2.3.4 The Descriptive/ Emergent Approach
The instability, complexity and unpredictability of the environment gave rise to a school of
thought which argues that strategy cannot be programmed and cast in stone ahead of time
(Ansoff, 1994; Boyd, 2012). The view rather stresses that strategy should naturally change and
appear over time in sympathy with the changing internal and environmental factors (Verreynne
and Meyer, 2010; Mintzberg and Waters, 1985). Giving further weight to this view, Kraus and
Kauraman (2009) argued that formality and rationality do not form the sole basis of strategy
but also experimentation, perception and learning (Stonehouse and Pemberton, 2002).
Mintzberg and his colleagues are the founders of the descriptive approach (Mintzberg and
Waters, 1985), which is also termed the emergent, learning, agile, flexible or logical
incrementalism approach to strategic management.
Under this approach, strategy making is seen as a process of unending amendments and fine-
tuning in line with changes in the external environment (Pansiri and Temtime, 2010; Kraus and
Kauraman, 2009). Stonehouse and Pemberton (2002) note that the descriptive or emergent
approach fits well in hostile, unpredictable and ever-changing founding environments (Boyd
et al., 2012). Under the approach, managers make adjustments to strategy at any point in time
in line with the information they have, hence the name experimentation or learning approach.
Because SMEs naturally have faster response rates and quicker competitive reactions, some
researchers have concluded that the descriptive approach is more compatible with small firms.
2.3.5 The Prescriptive-Emergent Paradigm
Mintzberg (1984) submits cautionary statements regarding the formulation of strategy. He
notes that traditional strategic planning failed (1970 -80s) mainly on account of the fact that it
was based on some flaws which include fallacies of prediction, detachment and formalisation.
From the aforestated statement, one would tend to think that Mintzberg was defending the
emergent approach alone, but that was not the case. Mintzberg went further to caution against

28
using the emergent approach alone. He observed that whilst a purely deliberate strategy
hampers learning rapidly from experience, a purely emergent strategy hampers control
(Mintzberg, 1984; Stonehouse and Pemberton, 2002).
In consistence with the above view, Kleinman and Sefarty (1998) argue that a purely
prescriptive approach has a shortfall of not encompassing the human involvement in the
process while, on the other hand, a solely emergent approach suffers from lack of analytical
capability since, inter alia, there will be no forecasted data.
Brews and Hunt (1999) attempt to draw a line between the prescriptive and
descriptive/emergent approaches through what they termed specificity of strategic ends and
means. They define strategic ends as the array of organisational goals and objectives that give
the firm a sense of direction (Brews and Hunt, 1999). Strategic means are defined as the actions
that, when exercised, lead to achievement of strategic ends. The prescriptive approach is
characterised by a high specificity of ends and means, while the emergent approach has low
ends and means (Brews and Hunt, 1999). Mintzberg et.al., (1998) concur with the description
posited by Brews and Hunt (1999), but take a step further to state that the extent of alterations
to the prescriptive strategic plan determine which approach was used on the deliberate-
emergent continuum. Ultimately, extant literature portrays some consensus by a number of
researchers that the deliberate and emergent approaches to strategic management should rather
be taken as complementary and not as mutually exclusive (Stonehouse and Pemberton, 2002).
2.3.6 Strategy Definition that Fits Small Firms
Kerin et al (1990) posited a more comprehensive definition which reads, “pattern of planned
(prescriptive) and present (emergent) objectives, resource deployments, interactions of an
organization with markets, competitors, and other environmental aspects”. The appropriateness
of the definition to this study is mainly due to its accommodation of the prescriptive and
emergent approaches to strategic management, as well as mentioning the key actors involved
29
in the strategy making exercise. Burke and Jarratt, (2004) echo almost similar sentiments.
Further, the definition embraces the majority of the common themes identified by Mintzberg
(1978) and is applicable to both large and small firms. Accordingly, the definition advanced by
Kerin et al (1990) is adopted for this study.
2.4 Formal Strategic Planning and the Small Firm
The area of formal strategic planning in small firms has received some attention in literature.
Within extant literature on SME strategy making, there is a substantial stream of research on
the formality or sophistication of planning and also on the informality of planning (Gibson and
Cassar, 2005; Brinckmann et al., 2010). It is still not clear which route is more optimal, the
formal or informal planning one as researchers are still engaged in this debate. Strategy scholars
seem to recommend an approach based on the founding environment. For instance Boyd et al.,
(2012) hints that formalistic planning is more akin to stable, predictable and high risk avoidance
environments while informal planning is workable in unstable, hostile, unpredictable and low
risk avoidance environments. Verreynne and Meyer (2010) and Pansiri and Temtime (2010)
appear to be supportive of this stance as reflected by their contribution urging firms to be
attentive to and resonate with the environment, implying remaining aware of environmental
changes. Some of the advantages stated in literature for formal planning include the ability to
analyse the environment in a more objective way (Herter, 1995), leading to quality decision
making. Under the formal approach, strategic planning is included on the corporate agenda and
the process of strategic planning is approached in a systematic manner (Armstrong, 1982).
Consistent with the above argument, Lyles et.al (1993) state that, “the elements of goal
formulation, developing distinctive competencies, determining authority relationships,
deploying resources and monitoring implementation receive more effective attention when
small businesses engage in formal planning”. Supporting the formalistic approach, Clayton
(1996) reveals that lack of a formal strategy leads to old-fashioned management practices
which include an autocratic management style practised by the proprietor. McKiernan and
Morris (1994) note that formal strategic planning facilitates survival, particularly in turbulent

30
environments. They however advance a contrasting view when they state that formal strategic
planning processes in small firms usually fail to provide a holistic picture of the firm.
In a twenty-five year literature search, Kraus (2006) revealed that small firms engage in
planning and most of them formally using long time spans. The same view is supported by
researchers like Brinckmann (2010) who acknowledges that small firms do engage in formal
strategic planning. Verreynne and Meyer (2010) reveal an opposing stance when they state,
“…small firms make strategy but instead of formal processes, they use approaches most
suitable to their peculiar situations”. This view receives support from other researchers like
Beaver and Jennings (2000) who describe the small firm strategy making process as out of the
ordinary and often-times peculiar. In fact Beaver (2007) casts doubt on the success of formal
processes in small firms.
Bresser and Bishop (1983) observe that formal strategic planning may be dysfunctional if it
introduces rigidity and encourages excessive bureaucracy. By implication the researchers’
findings implicitly support the use of formal strategic planning but only have reservations
where rigidity and bureaucracy are encouraged. After all, the occurrence of rigidity and
bureaucracy is normally visible in large organisations as opposed to small firms, and in this
context it can be argued that this view mainly applies to large organisations.
The most common indicators of a formal planning process as given by prior researchers were
the presence of a written long-range plan covering at least three years, the formulation of goals
and strategies, and some method for evaluating progress toward the plan. In line with extant
literature, the means of identifying whether a firm engages in formal strategic planning or not
was the presence of documented plans of a strategic nature (Gibson and Casser, 2005).
Further to the discussion above, the table below gives a brief rundown of the significance of
formal strategic planning, and therefore why this study concentrates on the construct.

31
Table 2.2: Significance of Formal Strategic Planning
The Characteristics of Formal Strategic Planning
1. Formal strategic planning procedures can challenge complacent acceptance of the
status quo (Chwolka and Raith, 2012)
2. Formal strategic planning procedures can ensure top managers act as one (Locke and
Lathan, 1980)
3. Formalising strategic planning is more likely to result in top managers paying
attention to the same important matters at the same time (Locke and Lathan, 1980)
4. Formal strategic plans enable communication with both insiders and outsiders to the
firm (Bird, 1992)
5. Planning minimizes the incidence of delay-causing bottlenecks (Chwolka and Raith,
2012)
6. The flow of resources is optimized (Delmar and Shane, 2003)
7. Information gaps can be anticipated and closed (Brinckmann et al., 2010)
8. Enables firm to control goal achievement (Chwolka and Raith, 2012)
Extracted from Chwolka and Raith (2012)
Steiner, (1979), defines formal strategic planning as the process of determining the mission,
major objectives, strategies, and policies that govern the acquisition and allocation of re-
sources to achieve organizational aims. The process has become inextricably interwoven into
the entire fabric of management: it is not something separate and distinct from the process of
management. Herter (1995) stated that a formal strategic plan should always answer the age
old questions such as where are you now, where do you want to be, and how are you to get
there. Andrews (1971) also postulated these same fundamental questions. The most common
indicators of a formal planning process as given by prior researchers were the presence of a
written long-range plan covering at least three years, the formulation of goals and strategies,
and some method for evaluating progress toward the plan. Stonehouse and Pemberton (2002;
854) define strategic planning as “the devising and formulation of organisational level plans
which set the broad and flexible objectives, strategies and policies of a business, driving the
organisation towards its vision of the future”.

32
Strategic planning has received considerable academic and practitioner interest and yet findings
from the studies are more often than not in general conflict. In this regard, Stonehouse and
Pemberton (2000) note that the maturity of an academic discipline is often judged by the extent
to which its theories and techniques are employed in everyday practice. They further categorize
the field of strategic management as being in its adolescence relative to other more established
areas of business and management theory as evidenced by inconsistent and conflicting
viewpoints.
In implicit confirmation of the foregoing, prior studies in this field unearth contradictory
findings. Robinson and Pearce (1984) note, “results suggest that managers responsible for
strategic planning activity in smaller organizations do not appear to benefit from a highly
formalised planning process, extensive written documentation, or the use of mission and goal
identification as the beginning of a strategic planning process.” This runs in diametric
contradiction to one of management science’s founding pillars, which is planning (Porter,
2008).
Research findings on whether small businesses engage in formal strategic planning or not are
mixed where some reveal that they do engage in formal strategic planning (Lowe and Clemens,
1990, Brinckmann et al., 2010), some expose non-engagement (Glen and Weerawardena, 1996;
Verreynne and Meyer, 2010), some state rather operational planning (Robinson et al., 1986),
and yet other studies found out informal planning as more popular among small businesses
(Stonehouse and Pemberton, 2002). The discussion has thus centred on formal versus informal
planning and strategic versus operational planning.

33
2.5 Tools of strategic planning
2.5.1 Overview
A number of techniques, tools, methods, models, frameworks, approaches and methodologies
are available to buttress decision making within strategic management. In keeping with the
understanding that strategic management is still a growing field, the set of tools is continually
enlarging as strategic management creates its own approaches and uses the tools borrowed
from other disciplines (Chwolka and Raith, 2012). Important to note is the fact that tools do
not make strategy and the same tools do not implement strategy. The critical role they play is
to present information in different ways that pave way for new insights to be uncovered
(Hussey, 1997). Tools are also handy in presenting complex issues and assist as both important
communication and analytical devices. The diagrammatic presentation of most of the tools
makes comprehension better as opposed to wordy narratives explaining a strategic management
concept.
A strong focus on tools within the strategic management field is lacking, most probably because
of the secondary role that they serve. Such lack of focus on strategic management tools is even
more pronounced within the small to medium sized enterprises sector whose general approach
to strategic planning is informal and at times casual (Brinckmann et al., 2010). Literature notes
the low success rate of new small firms with some estimates quoting failure rates of greater
than 60% in the formative period, culminating in Beaver’s (1995) conclusion that sub-optimal
performance, collapse and potential business failure are closely related with a lack of attention
to strategic management. Hussey (1999) adds that, “failure to understand, apply effectively,
and persevere with the tools and techniques that are chosen is a management disease of
epidemic proportions and increasingly it will lead to fatalities”. The same logic can be traced
in Benjamin Franklin's adage, “when you fail to plan, you will be planning to fail”
(Osabuohien, 2012(.

34
2.5.2. SWOT analysis
SWOT is an acronym for strengths, weaknesses, opportunities, and threats. SWOT analysis
therefore is a tool of strategic planning that evaluates the strengths, weaknesses, opportunities
and threats of an organisation (Martin and Shehan, 2015). Noteworthy about the potential of
SWOT is the fact that without too much thinking, the tool can unravel vast opportunities which
a business can take advantage of. Through a good comprehension of an organisation’s
weaknesses, threats that could otherwise adversely impact the business can be managed
accordingly (Christian, Idoko and Nzekwe, 2014). A mere look at the organisation and its
competitors using the SWOT framework can guide one into crafting a powerful strategy that
can set the organisation apart from its competitors, making it a market leader (Christian et al.,
2014).
Martin and Shehan (2015) attribute the origin of SWOT to Albert Humphrey, leader of a
convention at the Stanford Research Institute in the 1960s to 1970s. They however proceed to
caution that Humphrey did not claim origination of SWOT, and to this end the origins of the
concept remain unclear. SWOT is basically a two pronged approach which looks at the
endogenous (inward or internal) and exogenous (outward or external) factors of an organisation
(Martin and Shehan, 2015). Strengths and weaknesses are the internal factors while
opportunities and threats are the external factors. SWOT items that generate strategies are the
important ones and those items that do not generate strategies are not important. Adoption of
an aggressive strategy culminates from strong relations between strengths and opportunities
while a defensive strategy on the other hand results from strong relations between threats and
weaknesses (Christian et al., 2014).
One of the ways through which SWOT analysis can be utilised is by matching strengths to
opportunities and converting weaknesses and threats into strengths or opportunities. Martin
and Shehan (2015) observe that where threats or weaknesses cannot be converted, they should
rather be avoided or minimised. With sufficient objectivity and focus, SWOT analysis can lead
to the generation of powerful and effective strategies that can catapult organisations into market

35
leadership positions (Christian et al., 2014) because SWOT falls under industry and market
competition analysis (Demont, 2017; Khan et al., 2015).
2.5.3 PESTLE analysis
In its expanded form, PESTLE represents Political, Economic, Social, Technological, Legal
and Environmental factors for consideration in strategy formulation. A PESTLE analysis
therefore is an assessment of the six environmental or exogenous factors in strategy making
(Schmieder-Ramirez and Mallette, 2015). It is important to note that the organization has no
direct influence or control on the six factors, hence it attempts to strike a strategic fit within its
environment in a way that optimises operational efficiency and performance (Carr and Nanni
Jr, 2009). PESTLE is an extension of PEST analysis, which is discussed in a different section.
This section will discuss the L and the E as the first four factors are discussed under PEST
analysis.
• L stands for Legal factors which cover the various pieces of legislation in the country
with a direct impact on business operations and performance. These include inter alia
employment law, antitrust law, discrimination law, health and safety law and consumer
law (Schmieder-Ramirez and Mallette, 2015).
• E represents Environmental factors that affect business operations and performance.
Such factors include environmental and ecological facets like climate, climate change,
and weather (Schmieder-Ramirez and Mallette, 2015). Industries generally affected are
agriculture, insurance and tourism.
2.5.4. Ansoff matrix
Developed by strategy guru, Igor Ansoff, the Ansoff matrix is a business growth strategy tool
intended to shift the organisation to higher performance levels (Harvard Business Review,

36
1998). In stable or unstable environments, the tool can be applied for the same purpose, to think
deeper on the risks of growth using a simple and understandable framework.
The matrix is sometimes labelled the Product-Market Expansion Grid because it primarily
looks at the product and market growth strategies (Oertwig, 2017) which are market
penetration, market development, product development and product diversification (Harvard
Business Review, 1998).
2.5.5. Value for money analysis
Good value for money is the appropriate utilisation of resources to attain the envisioned
outcome. In the same vein. A value for money analysis is an independent investigation that
sheds light on the use of an organisation’s funds, and in particular whether economy,
effectiveness or efficiency were taken into account (Sarmento and Renneboog, 2014). In many
ways it is highly comparable to a cost benefit analysis, which is discussed in a separate section.
2.5.6. Cost benefit analysis
Cost–benefit analysis is a tool of strategic management which organisations normally use to
ascertain the appropriateness of a particular strategic decision as well as comparing different
options (Misuraca, 2014). It computes all costs and benefits to the current time period through
discounting, a concept termed the time value of money. Underlying the analysis is an
accounting concept called the cost benefit principle, which states that benefits from an
accounting system should always outweigh the costs associated with it (David, Ngulube and
Dube, 2013).
In broad terms, a cost benefit analysis has two main purposes, which are to verify if a given
strategic decision is justifiable or feasible and also to provide a basis for comparing projects
(David et al., 2013). Jules Dupuit of French origin, an engineer and economist is credited with
founding the cost benefit analysis concept in 1848. Implemented appropriately, a cost benefit

37
analysis gives confidence to an organisation to embark on a particular strategic course
(Misuraca, 2014).
2.5.7. Continuity planning
Business continuity planning promotes the “firm as a going concern” concept. It telescopically
looks at potential futuristic threats to the business entity and puts in place systems or
comprehensive ways of dealing with such forecasted potential threats (British Standards
institution, 2012). Continuity planning, in other words, strengthens the resilience of a firm in
the face of potential exogenous or endogenous threats or shocks. The tool is in the group of
industry and market competition analysis (Khan et al., 2015; Demont, 2017).
Continuity planning, in broader terms, falls under a firm’s risk management function. The
business continuity plan categorically states each potential threat and outlines how the firm can
deal with each named threat in reverting to operational normalcy (British standards institution,
2012). Threats come in various forms and could include downing of tools by the labour force,
disturbances in the supply chain, non-operation of key machinery or non-supply of power
(Elliot, Swartz and Herbane, 1999). It is important for systems to be continually checked in
verifying their preparedness for such potential threats (British standards institution, 2012).
2.5.8. Key issues analysis
Key issues analysis (sometimes abbreviated KIA) implies gathering information on what
factors customers consider key inorder for them to do business with you. Once such factors
have been established, the firm analytically looks at same versus competition, thereby rating
how customers perceive its market position. Armed with such knowledge, the firm can craft a
strategy to enhance its position. A key issues analysis is therefore not an outcome predictor,
but rather it indicates areas that need to be focused on as strategy is developed. This tool coerces

38
the firm to assess its competitive position and further to develop a competition-outwitting
strategy.
2.5.9. Scenario planning
Scenario planning as a concept was borrowed from the military intelligence (Schwartz, 1998).
It is sometimes called “scenario and contingency planning” (Wack, 1985). The tool is premised
on brainstorming about future trends and avoiding possible sudden company discontinuities
out of the same perceived trends by developing counter strategies (Schwartz, 1998). Scenario
planning is normally carried out by a few executives who start-off by having lengthy
discussions on what their thoughts are like concerning possible big shifts in society,
technology, politics, economics and how such shifts might impact on selected issues (Schwartz,
1998). Priority lists are drawn up including things that are likely to have the most impact on
the issue under consideration. Strategy options are then developed from these priority lists.
Scenario planning is multi-disciplinary as it covers a wide spectrum of areas including inter
alia psychology, technology, religion, economics, demographics and politics. As Sulej (2001)
suggests, this tool was found to be popular among large corporates, with only a few small firms
embracing it.
2.5.10. Competitive analysis
This tool of strategic planning entails recognising a firm’s competitors and assessing their
strategies in order to establish their weaknesses and strengths vis-à-vis the firm’s own service
and product offerings (O’Connor, 2010). Put in other words a competitive analysis is an
evaluation of the weaknesses and strengths of potential and current competitors. From such an
exercise, an organisation can come up with strategies either in the offensive or defensive
context or both, thereby unravelling opportunities and threats facing the organisation.
According to Demont (2017), competitive analysis as a tool of strategic management falls
under industry and market competition analysis.

39
Literature has it that competitive analysis is common among large corporate organisations and
also that it is not carried out properly in most cases where firms operate on "informal
impressions, conjectures, and intuition gained through the titbits of information about
competitors every manager continually receives" (O’Connor, 2010). Such lack of robustness
in carrying out this exercise has more often than not left a number of competitive blind corners
which are a threat to business (O’Connor, 2010).
2.5.11. Goals grid matrix
A goals grid matrix is represented diagrammatically as a four quadrant box answering four
basic questions which are (Saxena, 2009): -
1. What do you want that you don't have? (Achieve)
2. What do you want that you already have? (Preserve)
3. What don't you have that you don't want? (Avoid)
4. What do you have now that you don't want? (Eliminate)
The tool is normally used at strategy formulation point and fosters clarity with organisational
goals. Each goal falls into one of the four boxes in line with the above questions.
Whilst the tool is said to be particularly helpful in large and complex organisations, small firms
can also benefit from same. In line with Khan et al., (2015), the tool belongs to the industry
and competition analysis category. The tool recognises that in complex systems there is a high
likelihood of ripple effects from a single action. In fact the Goals grid matrix mostly rests on
Chester Barnard's cautions against the unintended and unforeseen effects of what we do, it is
beneficial to consciously think through our objectives not just in terms of what we wish to
achieve but also in terms of what we wish to preserve, what we wish to avoid and what we
wish to eliminate (Saxena, 2009).

40
2.5.12. Supply chain analysis
Supply chain analysis is a tool of strategic planning that is premised on a system termed the
supply chain. A supply chain is a system of organisations, activities, resources, information,
and people involved in the movement of a service or product from the supplier to the customer
(Food and Agricultural Organisation [FAO], 2005a). Supply Chain analysis therefore refers to
the entire set of economic agents (the owner manager of a firm like a carpenter, a dealer or a
product user, including entities such as an enterprise, and other organisations) that directly play
a part towards the determination of a final product. The chain covers the full chronology of
processes from the raw material to the finished product within the purchasing reach of the
consumer (FAO, 2005a).
As a tool of strategic planning, supply chain analysis uses an Excel table with data on complete
financial accounts of the various economic agents, and assessment of the impact of policy
changes on the financials of the various agents is made possible (FAO, 2005c). A change in
the financials of one agent in the chain affects the other agents’ financials as well as their ability
to supply the product in question. The analysis thus works on assumptions or simulations.
Khan et al., (2015) slotted this tool under industry and market competition analysis. Critiques
of this method argue that financial information on the various agencies is not always readily
available and to that end the tool consumes time as planners have to visit third party offices
like the national statistics offices, company house and so on to acquire missing information,
which after all, might not be very dependable in view of the concept of information asymmetry
(FAO, 2005b).
2.5.13. Critical success factors
Critical success factors (sometimes shortened to CSF or alternatively termed key result areas
or key success factors) are elements that are necessary for an organization to achieve its
intended mission (Rockart, 1986). A critical success factor for the success of an Information

41
Technology project, for instance, is the involvement of users. According to Hein, Tziolas, and
Osborne (2011), "Critical success factors are those few things that must go well to ensure
success for a manager or an organization and, therefore, they represent those managerial or
enterprise areas that must be given special and continual attention to bring about high
performance. Infact Oertwig (2017) states that it is a growth strategy tool. CSFs include issues
vital to an organization's current operating activities and to its future success" (James and
Friesen, 1995). A typical critical success factor is the response to the question, “Why would
customers choose us?”
2.5.14. Stakeholder analysis
Stakeholder analysis intends to assess and comprehend stakeholders from an organisational
perspective or within the context of a project or policy. The analysis entails collecting and
scrutinising qualitative stakeholder information to establish what to consider when developing
or implementing a strategy, policy or program (Cameron, Seher, and Crawley, 2010). As Hein,
Jankovic, and Feng, (2017) put it stakeholder analysis in strategy formulation, business
administration, conflict resolution, and project management, is the process of analysing the
impact of a particular decision stance on relevant stakeholder parties.
Armed with such information, ways of addressing the needs of affected stakeholders can then
be devised. Hein et al., (2017) portray this as a proactive and cautious approach to stakeholder
management. A key step to take initially is to identify an organisation’s stakeholders and
classify same into primary or key and secondary stakeholders. Stakeholders can then be
mapped using various approaches and the decisions to be adopted are normally taken from a
stakeholders’ matrix which shows the strategies to embrace for each stakeholder group. A
diagrammatic example of a stakeholder matrix is given below: -
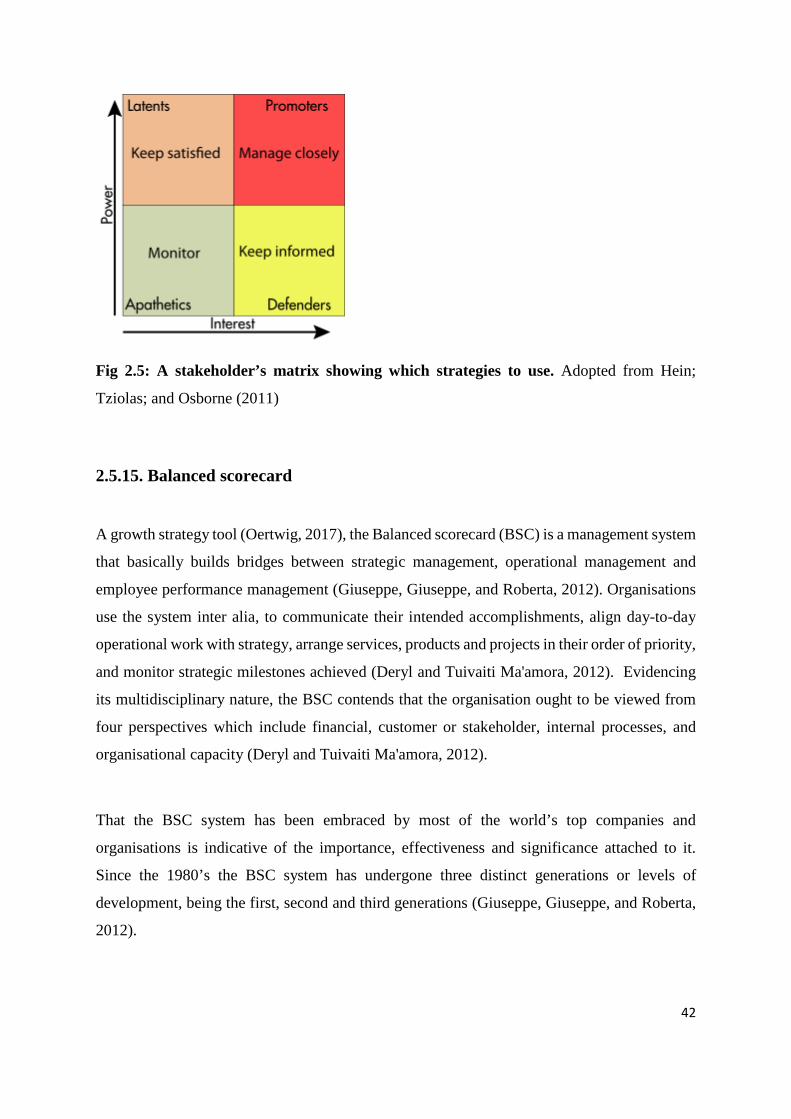
42
Fig 2.5: A stakeholder’s matrix showing which strategies to use. Adopted from Hein;
Tziolas; and Osborne (2011)
2.5.15. Balanced scorecard
A growth strategy tool (Oertwig, 2017), the Balanced scorecard (BSC) is a management system
that basically builds bridges between strategic management, operational management and
employee performance management (Giuseppe, Giuseppe, and Roberta, 2012). Organisations
use the system inter alia, to communicate their intended accomplishments, align day-to-day
operational work with strategy, arrange services, products and projects in their order of priority,
and monitor strategic milestones achieved (Deryl and Tuivaiti Ma'amora, 2012). Evidencing
its multidisciplinary nature, the BSC contends that the organisation ought to be viewed from
four perspectives which include financial, customer or stakeholder, internal processes, and
organisational capacity (Deryl and Tuivaiti Ma'amora, 2012).
That the BSC system has been embraced by most of the world’s top companies and
organisations is indicative of the importance, effectiveness and significance attached to it.
Since the 1980’s the BSC system has undergone three distinct generations or levels of
development, being the first, second and third generations (Giuseppe, Giuseppe, and Roberta,
2012).

43
While it serves to measure and manage individual employer performance, the BSC tool also
serves as a strategic management system.
Despite its robustness, effectiveness and wide adaptation, the balanced scorecard system has
met a number of criticisms. These include strategies that are not comprehended by the
implementers; the fact that management systems are designed for operational and not for
strategic control; key operational processes have no direct link with the drivers of strategy; and
that it is difficult to link employee personal goals and competencies to strategy implementation
(Giuseppe; Giuseppe; and Roberta, 2012).
Literature lambasts the haphazard and loose use of the balanced scorecard system. Rather
practitioners are urged to use the system properly and effectively lest they risk failure to achieve
strategic objectives (Deryl and Tuivaiti Ma'amora, 2012). Other studies contend that the
balanced scorecard is not suitable for small firms because most SMEs do not have a long term
strategic focus. Still other studies suggest that due to the many changes in the SME strategies,
the balanced scorecard is therefore not compatible with the operational modalities of a typical
SME (Giuseppe, Giuseppe, and Roberta, 2012). Another portion of literature anchors its
argument on the fact that SMEs in general do not have a fair appreciation of performance
management systems and the benefits derived therefrom, hence usage of the BSC will be asking
for too much from them (Giuseppe, Giuseppe and Roberta, 2012).
2.5.16. BCG matrix
A 1970 creation for the Boston Consulting Group by Bruce Henderson, the BCG matrix is
sometimes known as the growth-share matrix (Oertwig, 2017), the Boston Box, the Boston
matrix, the product portfolio matrix, or the Boston Consulting Group analysis. The major thrust
of the BCG matrix is to enable organisations to analyse their product offerings for purposes of
appropriate resource allocation (Andrea, 2014). Scatter plots are normally used to rank the
products or business units on the basis of their growth rates or market shares. Andrea, (2014)
states that the categorisations that constitute the BCG matrix include cash cows (high market

44
share in a slow-growing industry), dogs (low market share in a slow-growing industry),
question marks (low market share in a high-growth market), and stars (high market share in a
fast-growing industry).
The normal cycle for most business units is starting off as question marks, turning into stars,
and as the market stops growing they turn into cash cows and then dogs (Armstrong and Brodie,
1994).
Notwithstanding its wide theoretical appeal and high rate of usage, some academics have
questioned whether use of the matrix helps in causing businesses to succeed. In one of the
studies, out of 129 firms, those who followed portfolio planning methods like the BCG matrix
were found to have lower shareholder returns (Andrea, 2014). What more, the categorical
definitions of product lines and their respective growth rates does not always tally real life
scenarios as sometimes the opposite of what is theoretically expected manifests.
2.5.17. Feasibility studies or analysis
A feasibility study is an estimation of the soundness of a project or system proposed. The
study’s principal objective is to expose weaknesses and strengths of a given business, its
opportunities and threats, and in the process evaluates the business’ potential for success
(O’Brien and Marakas, 2011). A dichotomous decision pattern is thereafter to be adopted
where, if the business has potential for success the decision will be in the affirmative to proceed
with the business or project but if there is no potential then a negative decision to stop
undertaking the business or project will be adopted, or precautionary measures could still be
adopted to avoid loss-making (Georgakellos and Marcis, 2009). The main twin criteria used
to judge feasibility are cost to be incurred and value to be achieved. The rule of thumb is that
cost should always be lower than the value to be attained. Khan et al., (2015) group this tool
under industry and market competition analysis.

45
By way of structure, O’Brien and Marakas, (2011) hint that a feasibility study should provide
a historical background of the project, venture or business; it should give a clear description of
the product or service, accounting statements, details of the operations and management,
marketing research and policies, financial data, legal requirements and tax obligations. It is
important to carry out the feasibility study objectively without biases so that it may be credible
to its users (Bentley and Whitten, 2007).
The five major areas of feasibility are represented by the acronym TELOS, being technical,
economic, legal, operational and scheduling (O’Brien and Marakas, 2011). Feasibility studies
normally precede project or business commencement.
2.5.18. VRIO analysis
VRIO analysis falls under the internal analysis step of the strategic management procedures,
and is mainly used as a framework in the evaluation of resources and capabilities of a firm
(Barney and Hesterly, 2010). The framework is an acronym representing value, rarity,
Imitability (ease or difficulty to imitate) and organisation (ability to exploit the resource or
capability).
2.5.18.1 Question of Value
The V in the VRIO framework questions whether the resource or capability is important to the
firm (whether or not the resource or capability can be used to take advantage of an opportunity
or alleviate a threat in the marketplace. If it addresses at least one of the two things, it can be
regarded as a strength of the firm (Barney and Hesterly, 2010). The opposite scenario is
considered as a weakness. Some examples of opportunities exploitable by firms include
cultural change, particular international events, demographic change and technological change.
On the other hand, threats mitigatable by a resource or capability could be the threat of buyers,
threat of suppliers, threat of entry, threat of rivalry, and threat of substitutes(Barney and
Hesterly, 2010). The exploitation of opportunities or the mitigation of threats would normally

46
culminate in one of two or more outcomes: being costs reduction or increase in revenues (or
both).
2.5.18.2 Question of Rarity
A firm can earn competitive advantage through rarity, which is when a firm has an important
resource or capability that is completely unique among obtaining and potential competitors.
For a resource or capability to be labelled rare, it has to be simultaneously short in supply and
also persist over time to be a source of sustained competitive advantage (Barney and Hesterly,
2010). Failure to meet both elements simultaneously implies that the resource or capability is
not rare.
2.5.18.3 Question of Imitability
Imitability in the VRIO framework asks whether firms without a resource or capability face a
cost disadvantage in obtaining or developing it compared to firms that already possess it
(Barney and Hesterly, 2010). Valuable and rare resources (which are not easily imitated by
competitor firms) can earn the firm first-mover advantages as well as competitive advantage.
A firm can either take advantage of an external opportunity or offset an external threat through
using its rare and valuable resources. Imitation is normally through either substitution or direct
duplication, and in most cases it is an expensive endeavour which calls for a sound resource
base (Barney and Hesterly, 2010).
2.5.18.4 Question of Organisation
Further to an analysis of the other components of VRIO, the last stage is to organise the
company in a way that allows exploitation of the firm’s resources culminating in a sustained
competitive edge (Barney and Hesterly, 2010). The question of organisation has various

47
components, some of which include the firm’s formal reporting structure (who reports to whom
in the firm), management control systems (formal like budgeting and management reports; and
informal like company culture and employee to employee monitoring) and compensation
policies. Firms incentivize their employees to behave in a desired way through compensation
policies (influencing behaviour through incentivising employees either in monetary form like
salary increases and bonuses, or in non-monetary form like additional leave days or birthday
off-day). As Barney and Hesterly, (2010) note, where the correct organization is lacking, a firm
with all the other elements of VRIO can still suffer competitive disadvantage.
2.5.19. GAP analysis
Gap analysis is a tool of strategic management that fosters a comparison between expected or
potential performance and actual performance. The underlying concept is one of comparison
between the actual and expected or ideal. In this context, gap analysis can be applied in various
perspectives which include: -
1. Organization (e.g., Human Resources). The firm may, for instance intend to turn
employee records from paper-based to paperless, online records. Gap analysis comes
in handy as comparisons are made between the current records system and the
envisaged paperless system.
2. Business direction – Product gaps can be established when customers for instance want
an existing product upgraded. Comparison between the existing product and the
expected product gives a product gap, which helps in the product development process.
3. Business processes - Comparing current profits to expected profits gives a planning
gap which is useful in strategizing for the expected higher profits.
4. Information technology. When an organisation has old computer systems and needs to
have more recent versions of computer systems, an information technology gap is
established and it guides procurement in the acquisition of a new system, or if the
system is to be developed, the information technology gap forms the basis of the
specification to be used during system development.

48
GAP analysis is part of industry and market competition analysis (Khan et al., 2015). The
guiding principle in gap analysis is closing the gap. To undertake a gap analysis, a
comprehensive procedure has to be followed which basically identifies the status quo, identifies
the expected situation and works out the most optimal gap-filling strategy.
2.5.20. PEST analysis
PEST is an acronym for the four macro-environmental factors namely Political, Economic,
Social and Technological, which are assessed in relation to the business situation. The analysis
seeks to establish how such factors can futuristically impact on the performance of the business
in the long haul (Schmieder-Ramirez and Mallette, 2015). As part of the environmental
scanning operation of strategic management, PEST analysis focuses its attention on uncovering
the current and future potential of a market in terms of growth, decline, business position and
direction of operations. The PEST analysis comes in several flavours which include, inter alia,
STEP, STEEP, TEPS and an extended form labelled PESTLE (Schmieder-Ramirez and
Mallette, 2015). The PEST factors are expounded upon as follows: -
• Political analysis looks at government intervention in the economy including several
political factors such as labour and environmental law, government policies on tax,
trade restrictions and tariffs as well as the involvement of government in health,
infrastructure and education system (Schmieder-Ramirez and Mallette, 2015).
• Economic analysis focuses on economic factors that impact on the operations and
performance of a business. These include interest rates, inflation rate, exchange rates
and economic growth.
• Social analysis concentrates on factors such as population growth trends, age
distribution, work attitudes, culture, and health consciousness. The analysis looks at
how such factors affect business performance.
• Technological analysis looks at technology incentives, automation, and rate of
technological change.

49
2.5.21. Porter’s five forces
Porter's five forces analysis is a tool of strategic planning that generally gauges the level of
competition in a given industry and how strategy can be developed therefrom. By lining up
five forces determining competitive intensity, an analysis of same gives the attractiveness
(industry profitability) or unattractiveness of an industry (Porter, 2008). Unattractiveness of an
industry, in this context implies a highly competitive environment where the combination of
the five forces has the effect of adversely impacting on companies’ ability to serve their
customers thereby depressing profitability to unsustainably low levels.
On the other hand, attractiveness of industry means that firms are able to effectively employ
their business models and core competencies culminating in above average levels of
profitability. Porter's five forces comprise two forces from 'vertical' competition namely the
bargaining power of customers and that of suppliers as well as three forces from 'horizontal'
competition namely the threat of rivals, the threat of substitute products or services, and the
threat of new entrants. Literature hints that in developing the five forces analysis, Porter sought
to address the shortcomings of the then popular SWOT analysis which he found lacking in
rigour and orderliness or formality (Ireland et al., 2008).
a) Threat of new entrants
High-returns yielding markets are generally attractive to new firms, and as more new entrants
establish their operations, general profitability is reduced due to a high supply of firms in the
same business. The most attractive industries are those with high returns and high entry barriers
as well as low exit barriers (Ireland, Hoskisson, and Hitt, 2008).
Some of the factors that can have an effect on the extent of threat new entrants may pose include
the existence of barriers to entry (patents, rights, etc.), government policy, economies of scale,
cost disadvantages independent of size, capital requirements and absolute cost, inter alia
(Porter, 2008).

50
b) Threat of substitutes
In addressing this force, the environment is scanned for almost similar products or services
with which customers may find it easy to substitute a firm’s offerings (Porter, 2008). The
increase of adverts against asbestos, for instance, have led to substitution of asbestos roofing
material with clay roofing tiles and other roofing materials. The likelihood of customers to
substitute a product or service with another gives a measure of the threat of substitutes. Some
of the factors that lead to substitution include buyer propensity to substitute, perceived level of
product or service differentiation, quantum of substitute products or services in the market,
ease of substitution, buyer switching costs and relative price performance of the substitute
(Ireland et al., 2008).
c) Bargaining power of customers
Customers are sensitive to product or service price changes, and can as a result, put pressure
on a firm. In a snapshot, this describes the bargaining power of buyers. Where there are several
alternatives, buyer power is high and vice versa (Porter, 2008). Firms try to manage buyer
power by introducing loyalty programmes. According to Porter, (2008) some of the major
potential factors include buyer information availability, buyer price sensitivity, uniqueness of
product or service, availability of substitute products or services, buyer switching costs in
relation to firm switching costs, and degree of dependency upon existing channels of
distribution.
d) Bargaining power of suppliers
Suppliers of raw materials, labour, components, and services can exercise power over the firm
especially where there are no substitutes. Irrespective of price hikes, the firm is still compelled
to do business with the supplier when no substitutes exist (Ireland et al., 2008). This explains
the bargaining power of suppliers. Factors that affect the bargaining power of suppliers include
degree of differentiation of inputs, supplier switching costs, presence of substitute inputs,
employee solidarity (labour unions), and supplier competition (Porter, 2008).

51
e) Industry rivalry
Industry rivalry is the fifth force coined by Porter and it implies the intensity of competitiveness
within a given industry (Porter, 2008). The higher the competitive intensity, the higher the
industry rivalry, and vice versa. Some of the factors with a bearing on industry rivalry include
competition between online and offline companies, degree of transparency, firm concentration
ratio, level of advertising expense, and sustainable competitive advantage through innovation
(Ireland, et al., 2008).
2.6 Performance
While the contingency theory looks at managing organisations in ways that fit the peculiar
situation or contingencies facing the firm, it is important at the end of it all to review what came
out of the management efforts exerted. Reference here is being made to performance. The
dictionary meaning of performance is carrying out or accomplishment of a task or something.
In this regard, Siegler (1992) notes that, “a performance measure is one of the quantitative
indicators used by management to judge how well one part or all, of a company is doing”.
According to Venkatraman and Ramanujam (1986), one major weakness in strategy research
is the operationalisation and measurement of performance. The construct has been measured
differently by different researchers, thereby complicating comparisons across studies.
Rosa et al., (1996) define performance of small businesses as the ability of small firms to
contribute to job and wealth creation through business start-up, survival and growth. They are
not too far from the performance indicators given by Brush and Vandewerf (1992) who state
them as annual sales, number of employees, return on sales, growth in sales, and growth in
employees. Ramanujam et al., (1986a; 1986b) suggest that the effectiveness of planning must
be measured according to how well the planning system helps the organisation fulfil the
objectives of planning. Other studies (Greeley, 1986) contend that non-financial indicators such
as stakeholder or employee satisfaction and new products / service developments need to be
considered in the definition of performance.

52
Many of these relativist performance evaluation measures neglect the fundamental requirement
that performance evaluation cannot be divorced from the market nexus (Reid and Smith, 2000;
168). In accordance with this reasoning, the performance concern in this study concentrates on
indicators of economic success, being sales and employee growth (Gibson and Casser, 2005).
This stance has been adopted mainly for relative simplicity and in conformity with prior studies
for ease of comparisons. Supportive of this approach, Wiklund (1999) suggests that
performance ought to consider both employee growth and financial performance.
Laukkanen et al. (2013) conceptualise performance as (1) change in turnover and (2) change
in employee headcount, as adopted in several earlier studies (Hoy et al., 1992; Venkataraman
and Ramanujam, 1986). Whether the change is positive or negative, turnover is believed to
offer a straightforward yet reliable indicator of how well a business is doing in general
(Laukkanen et al., 2013: 7). Some studies (Weinzimmer et al., 1998) argue that using turnover
growth over increase in employee numbers or firm assets as an indicator of growth is
recommendable. The basis of the argument is that turnover growth is multi-faceted in that it
may be attributed to various causes which include higher prices charged to customers, increase
in market share or greater share of wallet or all these together (Laukkanen et al., 2013).
Furthermore, the argument stresses that firms’ sales may grow even though there might be no
change in employee numbers or amount of assets. A firm, for instance, may increase its prices
while employees and assets remain the same. While the argument holds in its context, it is
important to highlight that a number of prior studies in this area have recommended the use of
multiple performance measures (Venkataraman and Ramanujam, 1986). What more, in both
empirical and academic circles (Global Economic Monitor, 2013) changes in employee
numbers is indicative of enterprise performance and, in aggregate, economic performance as
total employment is directly affected. The mere fact that embedded within the definition of an
SME, both turnover and employee numbers feature (EU, 2003), ignoring either of the twin
constructs in performance analysis is an omission that implicitly questions the definition of an
SME and its validity. Ultimately, for ease of comparison of studies as recommended by Gibson
and Casser (2005), it is critical to use both turnover and employee numbers in SME
performance analysis (Laukkanen et al., 2013).

53
In terms of performance differences between small businesses that engage in formal strategic
planning and those that do not, it is difficult to draw solid conclusions from studies done so far
in this particular area as findings by different researchers do vary. The two major schools of
thought coming out of prior studies are (1) that planning businesses perform better than non-
planning businesses (Clayton, 1996; Gibson and Casser, 2005), and (2) that formal planners
and non-planners perform equally (Robinson and Pearce, 1984; Robinson et al., 1986). It is
interesting to note that no findings so far have come up with the position that non-planning
businesses perform better than planning businesses. Gibson and Casser, 2005 however
introduce yet another dimension when they state that the use of formal planning does not
necessarily culminate in superior performance. Rather businesses that are better performers are
more likely to use business planning.
2.7 Strategic Planning and its Relationship to Performance
The relationship between formal strategic planning and organizational performance is the area
that forms the crux of this study, and a perusal of past researches clarifies that there is still more
research to be done as findings are contradictory and disjointed (Chwolka and Raith, 2012).
The different findings obtained from different studies are partly a result of the different research
designs and methods used (Brinckmann et al., 2010; Gibson and Casser, 2005). Accordingly,
several authors agree with the researcher that a generalised position from past studies is
difficult to come up with at this juncture (Verreynne and Meyer, 2010; Brinckmann et al.,
2010).
Research carried out on the relative effects of planning on the sales and profit performance of
small businesses can be divided into three major groups where the first group established a
positive relationship (Burke et al., 2010; Brinckmann et al, 2010), the second group found a
positive relationship but with added conditionalities (Verreynne and Meyer, 2010), and the last
group established a no-relationship scenario (Robinson and Pearce, 1983; Shrader et al., 1984;
Sexton and van Auken, 1985; Robinson et al., 1986; Gable and Topol, 1987; Steven et al.,
2004). Yet other researchers find the relationship so “tenuous” that it is not amenable to direct

54
measurement (Lorange, 1980; Hogarth and Makridakis, 1981; King, 1983; Shrader et al.,
1984). Studies have been within the established and new small business sectors.
The researcher concurs with Gibson and Casser, (2005), in suggesting that the differences in
findings are by and large due to methodological and theoretical problems facing research in
this domain. It is important to note that some authors have gone further to hint against formal
strategic planning particularly Bresser and Bishop, 1983 who state that formal strategic
planning may be dysfunctional if it introduces rigidity and encourages excessive bureaucracy.
Mintzberg (1994), siding with the above, states that ‘the process of strategy making must be
loosened up and not get set in concrete through arbitrary formalisation’. Honig and Karlsson
(2004) also unravel a negative relationship scenario. More recent studies tend rather to point to
a positive relationship between informal planning or intuitive approaches and performance
(Allinson et al., 2000; Steven et al., 2004; Verreynne and Meyer, 2010). Appendix 1 and table
1.1 in the first chapter bear testimony to the two schools of thought in extant literature, which
are positive and negative planning-performance relationships.
2.8 Newness of small firms
Prior studies have generally demarcated small firms into new and established concerns
(Lorange, 1980; Hogarth and Makridakis, 1981; King, 1983; Shrader et al., 1984; Bracker and
Pearson, 1986; Schwenk and Shrader, 1993; Zahra, 1996; Delmar and Shane, 2003; 2004;
Guber, 2007; Brinckmann et al, 2010 and Verreynne and Meyer, 2010), where in general firms
that are less than eight years have been classified under new firms while those that are eight
years and above have been labelled established firms (Zahra, 1996). This position is in variance
with the GEM Global report (2009: 15) which states that new businesses are those with an
operational age of up to 3.5 years and established businesses are those that are more than 3.5
years old. For the purposes of this study and particularly to enhance comparability of studies,
the eight year demarcation criterion was adopted.

55
Entrepreneurship research is stuck in an ongoing debate concerning the value of planning for
both established and new small firms. While Delmar and Shane (2003) note that planning is
beneficial to new ventures, Reynolds (1996) contends that planning does not benefit new
ventures much. Forbes (2007) explains that new and established small firms experience
different contexts of planning. Established firms have a history of operational performance
against which they can compare with current performance. New firms do not have such.
Additionally, established firms have long standing links with other market players while
oftentimes the opposite is true for new firms. Because of the resultant plans that are produced
by the two groups (new and established small firms) and how usable they are to the specific
firms, judgements come up on whether or not the plans are valuable. A helpful solution to the
new small firm in particular, is the use of business consultants in drafting their first strategic
plan. Consultants will be having industry historical perspectives and have means of obtaining
competitor information. The lack of resources, which characterises small firm operations, may
hinder progress in this connection.
According to Brinckmann et al., (2010), planning in new and established small firms is usually
informal, iterative, unstructured and irregular leading to no written outcome. The same study
concluded that planning is positively related to performance in both new and established small
firms.
2.9 Theoretical perspective
2.9.1 Contingency theory
In this study the contingency theory is like a vehicle through which organisations can be
analysed. The foundation of contingency theory can be traced to the academic submissions of
Burns and Stalker (1961), Payne and Pugh (1976) and Mintzberg (1978). The main postulation
of contingency theory is that there is no one best way to manage an organisation or to make

56
decisions (Yu et al., 2012). Rather, management actions should be shaped by peculiar factors
endogenous and exogenous to the firm.
For purposes of this study, the context within which contingency theory is understood is that,
there is no one optimal way of strategy formulation which applies equally across all firms in
their diversity of circumstances (Boyd et al., 2012). Organisations are bound to strategise
differently in line with situations peculiar to them (Yu et al., 2012). As Pennings (1992) notes,
the hallmark of contingency theory is that the firm derives its success from fitting its
characteristics like structure and processes to contingencies that reflect its situation. For this
research, the contingencies are newness of firm and the environment (Burns and Stalker, 1961).
Increased organisational success is only witnessed when the firm manages to fit its
characteristics to contingencies (Donaldson, 2001).
This study analyses the effect of the contingencies on the firm’s decision to adopt a particular
strategy formulation stance. Over and above looking generically at planners and non-planners,
this study further looks at the effects of contingency factors on the three paradigms of strategy
formulation (the prescriptive, emergent and prescriptive-emergent dimensions) vis-à-vis
performance.
2.9.2 The traditional contingency theory
Contingency theory is a theory of possibilities as it prescribes a ‘multi-avenues approach’ in
managing organisations (Yu et al., 2012). In consistence with this assertion, Otley (1980) notes
that contingency theory, as a principle, can be descriptive (where it sheds light on why
organisations choose particular strategic paths) and also prescriptive (whereby it prescribes the
strategy formulation approach which should be adopted in a given set of circumstances).
Donaldson (2001) portrays the contingency approach as a theory of equilibrium, citing the
reason that it views changes in organisations as ways of maintaining balance or equilibrium.
Underlying the theory is the axiom that whenever an organisation is in misfit, it naturally goes

57
through transformation in order to be in fit (Mousettis, 2011; Woodward, 1965). The argument
is that optimum organisational performance is achieved when it is in fit, and whenever an
organisation is in misfit, its performance will be low hence the need to undergo transformation
to achieve fit. In concurrence with the foregoing, Hage (1974) observed that the major objective
of contingency theory lies in lessening the deficit or reducing the misfit (Mousettis, 2011).
Management effort is always exerted towards the situation of fit. To ensure that the
organisation is in fit, the strategic management approach chosen needs to be matched to the
contingent circumstances affecting its operations (Yu et al., 2012).
2.9.3 Theoretical contingent factors
Contingency theory extant literature looks analytically at the variables which could be
applicable in foretelling and explaining an organisation’s decision to fashion its processes in a
particular way. The contingency variables generally fall into two main classes, which are 1)
environmental influences, which are exogenous to the firm and are not influenced by internal
organisational decisions or actions, and 2) internal variables upon which the firm has more
influence. Some of the contingency factors identified in literature include technological change
(Mintzberg, 1979), environmental change (Jones, 1985), technology (Woodward, 1965),
innovation (Hage and Aiken, 1967a), and organisational size (Blau, 1970)
The contingency of organisational size for instance has been discussed widely in literature
(Donaldson, 2001) using the contingency theory of organisational structure. The number of
employees a firm has impacts on the extent of that organisation’s bureaucracy and
decentralisation of structure and processes respectively (Mousettis, 2011; Donaldson, 2001).
Smaller organisations, as portrayed by Donaldson (2001), tend to be un-bureaucratic and have
centralised decision making structures while the opposite tends to be true for large
organisations. In like manner, large organisations tend to plan formally while smaller
organisations tend to use other forms of informal planning (Brinckmann et al, 2010).

58
2.9.4 This study and its contingency factors
Any variable that moderates the impact of an organisational characteristic, like strategic
planning, on organisational performance is a contingency. Consistent with contingency theory,
all contingency factors are causes of organisational strategic planning typologies because
organisations change their strategic planning regimes to achieve fit and better performance
(Mousettis, 2011; Donaldson, 2001). To confirm if a given factor is indeed a contingency of
an organisation depends on whether aligning the strategic planning typology and the
contingency produces better performance.
Within the context of contingency theory, this study singled out two factors as probable
predictors of a contingency link with strategy formulation approach adoption. These are (1)
newness of firm, and (2) environmental volatility.
2.9.5 Newness of firm
Whether an organisation is new or established constitutes an important contingency factor.
According to this study, a firm that has operated for eight years and below is new and a firm
that has operated for more than eight years is an established one. Brinckmann et al, (2010) use
the same criterion. New firms are argued in literature as having no sufficient market
information, like own performance history and competitors’ performance, to warrant proper
formal strategic planning (Gibson and Cassar, 2005). Resultantly, there exists a portion of
literature in this domain that portrays new firms as having a no relationship scenario between
planning and performance (Bhide, 2007).
Conversely, the more established a firm is the more it is inclined to carryout formal strategic
planning as it has a clearer understanding of its environment, competitors and its own
performance history. A positive relationship between strategic planning and performance is
therefore expected to be reflected in this group of firms (Brinckmann et al, 2010).

59
2.9.6 Environmental volatility
Burns and Stalker (1961) theorised that ‘the manner in which an organisation achieves fit with
its environment depends on the nature of the environment’. An organisation’s external
environment is therefore a vital contingency factor. Mintzberg (1979) frames the prescriptive
and emergent strategic management typologies against the background of the organisation’s
founding environment. Echoing a similar line of reasoning, Porter (1980) notes that the central
theme in strategy formulation is relating the organisation with its environmental conditions. In
this regard, strategic management studies that have deliberately ignored general environmental
conditions within their models face criticism in extant literature (Kudla, 1980; Gibson and
Casser, 2005).
A stable environment is one whose pace of change is fairly slow to the effect that firms can set
up prescriptive plans which can be dependably usable up to the end of the period. Production
and use of formal strategic plans is more akin to stable environments (Boyd et al., 2012;
Brinckmann et al, 2010). An unstable environment, on the other hand, has got rapid changes
which call for constant reviews of strategic plans to maintain their relevance. Unstable
environments therefore normally yield the production of flexible, emergent plans for optimum
performance (Mintzberg, 1979, Boyd et al., 2012). It is important for organisations to resonate
with environmental changes to avoid under performance and failure. As noted by Burns and
Stalker (1966), highly formalised organisations fail as a result of their inability to change their
prescriptive strategic management processes and flow with environmental changes. Pansiri and
Temtime (2010) noted the criticality of owner-managers’ awareness of environmental
conditions for more fruitful strategy formulation processes in organisations. Verreynne and
Meyer (2010) are agreeable and emphasise the need for organisations to resonate with their
founding environments for more meaningful strategic management.
2.9.7 The effect of contingencies on organisational performance
Donaldson (2001) portrays the contingent variable as the decider on which feature generates
optimum organisational effectiveness. The tendency to emphasise on effectiveness in
contingency theory comes on the back of organisational theory which places remarkable

60
interest in the analysis and explanation of success or failure of organisations. The issue of how
to treat or measure organisational performance has received considerable interest in literature,
with a number of variables being put forward as fitting measures of the construct. These
performance measures include efficiency, profitability and employee satisfaction or innovation
rate (Donaldson 2001). This study adopts a two-pronged approach wherein it looks at the
financial (turnover growth) and non-financial (growth in employee headcount) performance of
SMEs, firstly in consistence with other studies in this domain thereby enhancing comparability
of studies (Brinckmann et al., 2010). Secondly and in line with Gibson and Casser (2005),
turnover and employee headcount are such basic concepts that they are measured almost
uniformly across the board and therefore they do not pose differences in measurement
challenges.
According to contingency theories, organisational processes and contingencies have a fit that
has a positive effect on performance, implying a trivariate relationship among the three
concepts. Resultantly, high performance is experienced when the process variable (for instance
in this study, planning or non-planning) is at fit with the level of the contingency (for instance,
newness of firm) (Donaldson, 2001). Conversely, low performance is witnessed when the
process variable is not at fit with the contingency level. This study will try to empirically
analyse the trivariate relationship between a given strategic management approach, the
contingent factors, and organisational performance.
The selection of an appropriate performance measure involves looking at a number of issues.
The initial issue to be looked at is the importance of using multiple measures of performance
as opposed to depending on a single measure of performance. Extant literature is supportive of
the multiple measures approach (Brinckmann et al., 2010; Gibson and Cassar, 2005). Measures
of performance that are generally used like return on investment (ROI) and related ratios have
been criticised in literature as giving deceptive and sometimes irrelevant information
particularly in volatile environments, and therefore unreliable (Gibson and Casser, 2005;
Carlin, 1999). This study uses financial and non-financial measures of performance being
turnover growth and employment growth. This is in consistence with former studies in this
domain (Brinckmann et al., 2010), and therefore enhances comparability of studies in the
process.

61
The other critical issue to consider, as captured by Brews and Hunt (1999) is that since strategic
plans cover periods longer than a year, it is only fair to use performance measures that have a
time lag aspect. This is in view of the fact that the fruits of strategy may take more than one or
two accounting periods to be realised (Palmer and Wiseman, 1999). Literature thus advances
an opinion that performance measures ought to include a time lag to effectively establish the
strategy-performance relationship (Palmer and Wiseman, 1999). This study utilises the time
lag aspect in measuring SME performance. In concurrence with Dess and Robinson, (1984),
this study measures SME performance based on self-assessment scales, using a three period
turnover and employment growth trend (Brews and Hunt, 1999).
2.9.8 Weaknesses of contingency theory
Whereas the traditional contingency theory is usable in contributing to strategy research, a
number of criticisms have been levelled against it. This section will discuss weaknesses that
relate to this study. The traditional contingency theory fails to clarify the nature of the
contingency variables that may affect organisational behaviour in strategic management. This
study uses contingency variables that have been used in prior literature.
The contingency theory is criticised for being deterministic because it tends to lead to a single
optimum structural ‘decision choice’ in a given situation (Schreyogg, 1980). This contradicts
its very definition which points to the fact that there should be no one best way of managing
organisations (Yu et al., 2012). Therefore drawing a line between contingency and classical
theories in this regard becomes difficult as they both appear deterministic. Contingency theory
ought to be different by isolating itself from determinism, as this study aims to achieve.
Greenwood et al. (2002) observe that the assumed effect of independent environmental
variables on organisational strategy (dependent variable) is questionable. A case in point is that
of a firm which may have the ability to control particular features of its environment. What
more, the same firm may enjoy monopolistic privileges in the market within which it operates
and be superficially influenced by the environmental factors.

62
A number of researchers have argued that organisational processes are not determined by either
the internal or external situation. They contend rather that organisational management has free
choice, and is accountable for its decisions (Whittington, 1989). While taking due note of the
argument, the viewpoint adopted in this study is that small firms, being small, cannot control
their environment neither can they occupy monopoly status in their industries. In this regard,
their structures and processes should be dependent on internal and external factors.
According to Donaldson (2001), there are two glaring problems within contingency theory.
Further, Donaldson (2001) notes that addressing the challenges is likely to yield a transformed
and advanced version of the contingency theory, coined Neo-contingency theory. This
proposed version is portrayed as being more realistic, practical and functional. While it adopts
the foundations of the original theory, it shuns away from some of its assumptions (Donaldson,
2001).
One of the downsides of traditional contingency theory is methodological whereby there lacks
a clear explanation on the manner in which more than one contingency factors interact to
determine the holistic effects on organisations. Within this study for instance, there are more
than one contingent variables, being age of firm and environmental volatility, which could
shape the adoption of a specific strategic management approach. Resultantly, the challenge that
remains is which method to use in combining the effects of more than one variable in
ascertaining their holistic effects on the researched issues.
One literature contribution is to use portfolio theory, whereby the risk of a portfolio is
influenced by the risk of each factor and by the correlation amongst the factors (Donaldson,
2001). However according to Brealey and Myers (1996), the approach tends to give deceptive
results in that if two variables reveal strong causes but are negatively correlated, the outcome
is a lower effect (lower coefficient value) in the equation than in each of the factors. Contrary
to this view, another section of scholars contend rather that a summation of the effects should
yield a correct overall result. Despite the strong appeal in this approach, Van de Ven and Drazin

63
(1985) submitted that the global effect of multiple effects is not the sum of their individual
effects. In their model, they presented the combination of multiple fits as a system fit,
contending that this ought to be taken as a whole and not separated by individual analysis of
each variable after which they are summed up. In this study, concurrence with the above
contention that neo-contingency theory advances is noted. Partial (multivariate) correlation
analysis is used as opposed to summing up the individual effects of the variables.
The second downside of the traditional contingency theory can be traced to its lack of clarity
regarding managers’ ability to identify precisely how organisational structures and processes
establish a fit with their contingency variables. The theory’s implicit assumption is that
managers have a complete understanding of the position of their organisations. Donaldson
(2001) refutes this assumption which he characterises as idealistic at best. It is near impossible
for managers to deliberately move their organisations into full or perfect fit, but rather into
quasi fit. Neo contingency theory therefore contends that what is within managers’ knowledge
base is an idea of the direction in which fit exists, which knowledge they can use to move their
organisations towards that direction. That managers have complete control and perspective of
the situation is impossible and therefore utopian (Donaldson, 2001).
Put differently, once the direction of fit is established, the more likely culmination is movement
of the organisation into quasi-fit as opposed to full-fit. It is important to note that the mere
movement from misfit to quasi-fit improves organisational performance. Such development
and increase in performance is sufficient for feedback and commencement of another growth
phase again. Donaldson (2001) explains the concept of the organisation moving into quasi-fit
as more realistic and practical than that of the organisation moving into full or perfect fit.
Putting the argument within the context of this study, if fit is established to exist when a new
firm plans formally, changing organisational approaches to planning to achieve fit will not
necessarily result in full or perfect fit but quasi fit, which can always be improved upon. The
proposed improvements to traditional contingency theory aim to make it more practical and
relevant in the real world. In a nutshell, this study tries to improve the traditional contingency
theory by introducing pragmatic solutions to its handicaps, as well as filling in some of its

64
glaringly evident gaps. In a similar vein, Edwards (2010) notes that there is need for more
research work that refines theory by, inter alia, unravelling limitations of existing theories.
2.10 Conceptual framework
The conceptual model is in the form of a matrix-cum-graph (see diagram below) where the
vertical axis looks at new and established planners and non-planners while the horizontal axis
looks at the construct of performance. Planners are formal strategic planners only and the
evidence of planning is the presence of strategic planning documentation of a strategic nature.
This is in consistence with prior studies in this domain (Brinckmann et al., 2010). A small firm
that does not do formal strategic planning is labelled a non-planner in this study and impliedly,
this group includes inter alia informal planners, operational planners, and outright non-
planners. New planners and new non-planners are entities that have been in business for less
than eight years and established planners and non-planners are entities that have been in
business for eight years or more (Gibson and Casser, 2005). Previous studies have tended to
go with one group of planners but this study is looking at both new and established planners.
Performance in this study is defined in terms of the annual change in gross turnover and also
annual change in employee head count. This is in line with prior studies and more importantly
it allows for comparability of studies (Gibson and Casser, 2005). The horizontal axis is
representative of performance. Under the traditional contingency theory, there is perfect or full
fit and yet, according to Donaldson (2001), perfect fit is not always achievable. Quasi fit is
rather achieved and a firm can further improve upon the quasi fit to a higher level of quasi fit
as it tends towards full fit. Low to high performance is therefore universally accommodated by
this reasoning (Donaldson, 2001).
The scenario represented by green boxes is one where non-planners have low performance
while planners have high performance. Joining the green boxes yields a positive relationship
between planning and performance. Studies portraying a positive relationship between
planning and performance and which are supportive of the above scenario include Burke et al.,

65
(2010), Delmar and Shane, (2003) and Brinckmann et al., (2010). The reverse scenario
represented by blue boxes has got non-planners registering good performance while planners
register poor performance. An attempt to join the blue boxes yields a negative relationship
between planning and performance. This scenario is reflected in studies whose findings are a
negative relationship between planning and performance (Reynolds, 1996; Bhide, 2007;
Bresser and Bishop, 1983).
Shifts within the framework are possible such as a planning firm becoming a non-planning firm
or a non-planning firm becoming a planner. New firms can also be established ones with the
passage of time. Firms may also move from poor to good performance and vice versa.
Important to note is the fact that in each planning or non-planning group, good and poor
performers feature.
Firms may also move from one performance level either to a higher one or to a lower one.
Some small firms in the sample may graduate to large companies. It has to be stated that this
study is not analysing causality but the relationship or link between formal strategic planning
and performance. Small firms ranging from poor to good performers are posed against their
planning practices. In each group, planners and non-planners feature. The study intends inter
alia, to ascertain the existence of such a model in a developing economy as well as establish
the relationship between formal strategic planning and performance.
The arrangement of the conceptual model gives an insight into the contingency approach.
Whereas in a single model, planners, non-planners, poor performers, and good performers co-
exist, that is precisely what the contingency theory propounds. By refuting a ‘one size fits all’
approach to managing organisations, the contingency approach rather finds fulfilment in the
co-existence of planning, non-planning, good performance and poor performance firms within
the same economy or environment.

66
Fig 2.6: Conceptual framework
Established planners
New planners
Established non-planners s
New non-planners
Poor Good
Performance
Hostile environment adversely impacting on performance
Flexible plans. Strong controls, proactive management & entrepreneurial spirit
Growing intelligence database. Resources still scant
Strong controls. Entrepreneurial spirit
More reactive than proactive. Intuitive processes in use. No formal plans
Emergent approaches to planning utilised plus strong entrepreneurial drive
Limited systems. Lack of planning hampers direction
Growth driven by entrepreneurial spirit. Central command & control – tacit controls

67
2.11 Conclusion
The main theoretical aspects relating to the study have been discussed, laying a foundation to
the study. The country in which the study is carried out is discussed next for an appreciation of
the environmental factors.

68
Chapter three: ZIMBABWE – RESEARCH CONTEXT
3.0 Introduction
This chapter looks at the country Zimbabwe within the context of this study, and further seeks
to justify why the environment is labelled unstable. An economy is stable when it is not
characterised by excessive fluctuations or swings in the macro economy. Such an economy
would have a steady output growth and stable as well as low inflation. The featuring of frequent
financial crises, frequent large recessions or high and variable inflation would imply economic
instability. Material policy shifts that directly affect the performance of the economy,
especially adversely, reveal elements of instability too. Extant literature strikes a convergence
of opinion in labelling the economy of Zimbabwe as unstable, volatile and hostile (Chagonda,
2012; Chiboiwa, Samuel, and Chipunza, 2010; African Development Bank, 2015; Makanyeza
and Dzvuke, 2015). Zimbabwe is a land-locked southern African country located in what is
commonly known as sub-Saharan Africa. It attained political independence in 1980, its
erstwhile colonial master having been Great Britain. A reconciliatory stance towards former
rulers was adopted and pursuit of communism/ socialism as an economic policy was upheld in
the initial years. With the passage of time, communism lost impact and around 1991/92 the
country adopted capitalism when it introduced the Economic Structural Adjustment
programme (ESAP).
In 1980, Zimbabwe’s Gross Domestic Product (GDP) per capita (current), compared to
neighbouring countries was at a world average. Inflation in 1980 was 5.4percent. The new
currency that was launched compared favourably to world leading currencies where ZW$1 was
similar to BP£0,657. Then, the country was second in Africa in terms of industrialisation. This
chapter discusses some of the aspects of the Zimbabwean economy and unravels the
developments and circumstances that contribute in making the country’s economic
environment unstable and hostile.

69
3.1 Economic overview
According to the African Development Bank (2015), Zimbabwe’s economy remains in a fragile
state, with an unsustainably high external debt and massive deindustrialisation and
informalisation. The average GDP growth rate of 7.5% during the economic rebound of 2009-
12, when the government of national unity was in power, has since gone down. Among some
of the causes of this economic slowdown are liquidity challenges (e.g. the lack of and high cost
of capital and revenue underperformance), outdated technologies, structural bottlenecks that
include power shortages and infrastructure deficits, corruption and a volatile and fragile global
financial environment.
The period 2009-12 started off with the introduction of the multi-currency regime and the
inauguration of a government of national unity. The economy grew at an average of 11% per
annum. Post 2012 GDP growth slid down from 10.6% per annum in 2012 to 4.5% in 2013 and
an estimated 3.1% in 2014. Because of forecasted investments in mining, agriculture,
communications and related infrastructure projects, there was a marginal improvement in GDP
growth to 3.2% expected in 2015.
The logical way forward for government was adoption of a contractionary fiscal policy because
of the constrained fiscal space. On the other hand, monetary authorities could not use the full
set of monetary policy instruments as this was limited by adoption of the multi-currency
regime.
Inflation has been generally low and at one point in 2014 it went into negative territory. Some
of the major causes of this low inflation regime include tight liquidity conditions, weak
domestic demand and appreciation of the US dollar against the South African rand. Important
to note is the fact that South Africa is Zimbabwe’s major trading partner. Industrial capacity
utilisation continues a declining trend, and is estimated at 36.3% owing to underproduction and
lack of competitiveness. The appreciation of the United States dollar against the South African
rand has meant that imports have become cheaper than domestically produced goods while

70
exports have become more expensive (RBZ, 2014). The natural tendency under such
circumstances is for the demand for imports to go up while exports reduce, leading to negative
balance of payments. Thus, for 2014 there was an estimated current account deficit of around
23.1%. As if this was not enough, the country is reeling under a ballooning external debt which
was estimated to be around USD 8.4 billion at the end of 2014 (GoZ, 2015). The African
Development Bank has been spearheading debt resolution discussions between Zimbabwe and
its creditors.
The period between 2011 and 2014 saw the closure of at least 4 610 companies, culminating
in the loss of about 55 443 jobs (GoZ, 2015). The informal sector employs more than 80% of
workers in Zimbabwe(Makanyeza and Dzvuke, 2015). Most of the workers who leave formal
employment for various reasons find their way to the informal sector (Chagonda, 2012). The
table below shows some of the macroeconomic indicators in Zimbabwe for the years 2012 to
2016.
Table 3.1: Macroeconomic indicators
Indicators 2012 2013 2014(e) 2015(p) 2016(p)
Real GDP Growth Rate (%) 4.4 4.5 3.1 3.2 3.3
Real Percapita GDP Growth Rate(%) 2.4 1.4 0 0.2 0.5
Inflation (CPI) (%) 5.1 1.6 -0.1 0.6 1.5
Current account balance (%GDP) -35.3 -25.4 -23.1 -17.8 -17.2
Source: African Development Bank Zimbabwe Country Brief 2013 - 2015
3.2 Unemployment
The two ugly forces facing Zimbabwe are poverty and unemployment. The rate of poverty is
around 80%, while unemployment hovers in the region of 95% , a figure which occupies
leadership status within the context of global unemployment statistics (Chagonda, 2012;
Makanyeza and Dzvuke, 2015).

71
Added to the above, Zimbabwe’s current account balance is negative – it is around US -$517
million. A large number of indigenous entrepreneurs have gone bankrupt between the years
2000 to 2014 mainly due to the negative economic environment since the year 2000. Large
multi-national concerns have also closed shop, the likes of Rio Tinto and the Zvishavane
Asbestos mine, dissipating hordes of unemployed former workers onto the streets in the
process.
3.3 Hyperinflation 2004 to 2009
The period from 2000 to 2009 was eventful. This is the period when the land reform programme
was carried out. There was remarkable flight of capital on the back of unrealistic price controls,
triggering a drop in investor confidence. It was during the same period that inflation rose to a
record 66,000 percent and shortages of fuel, tap water, food and medicine were the order of the
day (Chagonda, 2012). In this same period, western powers imposed sanctions on the country.
GDP per capita plummeted by 40 percent, agricultural production dropped by around 51
percent and industrial production fell by 47 percent. All these factors indicate a slide down in
economic fortunes and ultimately instability.
In 2004 the country stopped servicing its foreign debt on the back of economic challenges. The
stoppage of repayments culminated in the compulsory suspension of the country from the IMF
(African Development Bank, 2014). Over and above insufficient donations from the World
Bank, the United Nations World Food programme also ceased its food aid. Government had to
borrow from local sources thereby crowding out the private sector and further stifling economic
growth. During this same period, there were severe foreign currency shortages leading to
devaluations of the Zimbabwe dollar. A thriving parallel market that came up meant competing
exchange rates each time new official rates were announced (Chagonda, 2012). Bearer cheques
came into use and values were as high as $1trillion. Truncation of zeroes from the currency
had to be done to normalise daily transactions but each time this was done, the zeroes speedily
accumulated again mainly due to the activities of the parallel foreign exchange market.
Inflation was almost uncontrollable to the extent that the Reserve Bank termed it ‘the number

72
one enemy’ (Chagonda, 2012). It was only when dollarization and the multi-currency regime
was embraced that hyper-inflation came to an end (Makanyeza and Dzvuke, 2015).
3.4 Government of National Unity
By the commencement of the year 2009, the economy had been in bad shape for a considerably
long time. A government of national unity was hatched out of the three parliamentary parties.
Though the parties had their own irreconcilable differences, they had a meeting of minds on
important national decisions which improved the economy. The government’s first major
decision was the suspension of the Zimbabwean Dollar in April 2009 (RBZ, 2010). A multi-
currency regime was adopted and the main currencies used included the United States Dollar,
the South African Rand, the EU Euro, and the Botswana Pula. Immediately hyper-inflation
came to a halt. Business confidence started to build up once again and a number of economic
milestones were achieved. GDP growth levels shot up sharply to around 7.3% per annum,
making Zimbabwe one of the fastest growing economies in the world. The ensuing
parliamentary elections culminated in a Zanu PF victory, leaving the other two parties with
minority seats. The government of national unity was dissolved leaving a Zanu PF government
in power.
3.5 Post Government of National Unity
The government of national unity came to an end following elections in which the MDC party
lost. The indigenisation policy was among the top policies pursued by the new government and
this created uncertainty. The economy has been on a downward spiral since and the country’s
foreign debt has continued to balloon. In 2014 the government admitted that Zimbabwe was
heavily in debt. Policies to attract foreign direct investment needed to be introduced to improve
economic performance and resume debt repayments. The controversial indigenisation policy
militates against efforts to attract foreign direct investment as would-be investors are not sure
of the future of their companies. Zimbabwe's official foreign debt stands at around $7 billion.
The figure is however questionable as other figures as high as $11 billion are quoted once debts
to other African and Asian countries are included.

73
As of May 2014, reports had it that Zimbabwe's economy was in decline following the period
of relative economic stability during the Government of National Unity. The Africa Progress
Panel in 2014 reported that at Zimbabwe’s current rate of development, it would take 190 years
for the country to double its per capita GDP. The main contributing factors included uncertainty
around the indigenisation programme, the perceived lack of a free press, the possibility of
abandoning the US dollar as official currency, and political uncertainty following the end of
the government of national unity with the MDC as well as power struggles within ZANU-PF.
The report expressed fears that the country’s economic situation was likely to deteriorate
further. At about ninety five percent, Zimbabwe’s unemployment statistic is reflective of global
leadership.
3.6 Agriculture
Zimbabwe remains an agro-based economy. The sector is constantly affected by periodic
droughts which affect the sub Saharan country, and the impact of such droughts is reflected
through GDP figures which normally plummet. Poverty levels normally shoot up as evidenced
by the need for drought relief food during such periods (Mugumbate and Nyanguru, 2013).
Discussions to resuscitate the ancient practice of “Zunderamambo” (King’s granary or food
store for grain sufficiency during drought periods) have not materialised partly due to the fact
that the agricultural sector is now under a new breed of new farmers who are still on a learning
curve (Mugumbate and Nyanguru, 2013). The phenomenon renders the Zimbabwean economy
unstable as it has to adjust to the devastating effects of droughts from time to time.
The agricultural sector in Zimbabwe can be divided into two parts, which are industrialised
farming of crops such as cotton, tobacco, coffee, peanuts and various fruits and subsistence
farming with staple crops such as maize or wheat. Industrialised farming used to be almost
exclusively in the hands of the white minority until the land redistribution program of 2000
(Pazvakavambwa and Hungwe, 2009).

74
At one point before the land redistribution program, industrialised farming used to be the
backbone of the domestic Zimbabwean economy and contributed close to 40% of the exported
produce. With the new crop of farmers who appear to be still on a learning curve, this is no
longer the case (Mugumbate and Nyanguru, 2013). According to 2008 estimates by the
University of Zimbabwe, Agricultural production decreased by 51% between the years 2000
and 2007.
3.7 Mining sector
The discovery of diamonds in 2006, in the south eastern part of the country has made the mining
sector a major player in the export market. The Marange diamond fields are thought to be one
of the richest in the world (Maguwu, 2013). Though there have been concerns about lack of
clarity on diamond export revenues, this is one mineral with huge earning potential and could
play a pivotal role in changing the economic fortunes of the country if well managed (Maguwu,
2013; Nichols, 2012). The country also has reserves of metallurgical-grade chromite, coal,
asbestos, copper, nickel, gold, platinum, iron ore, and diamonds.
The indigenisation legislation affected the mining sector when in March 2011, the government
of Zimbabwe implemented laws which required local ownership of mining companies (GoZ,
2012). The response to this news were share price falls of companies with mines in Zimbabwe.
3.8 SMEs sector
With the high levels of retrenchments, company closures and general deindustrialisation, the
SMEs sector has become a major player in the Zimbabwe job market (Makanyeza and Dzvuke,
2015; Chagonda, 2012). Like in most other sub Saharan countries, Zimbabwe also suffers from
the problem of rapid urban population growth especially due to rural urban migration. The
SME sector has potential to embrace rural-urban migrants, thereby partly addressing the
unemployment challenge. Unemployment in Zimbabwe, currently estimated to be in the region
of 95% can be partly resolved through the development and growth of SMEs (Munanga, 2013).

75
SMEs leverage on relatively low start-up costs, low risk and their ability to exploit untapped
knowledge bases of creativity for the development of new products. It was estimated in 2004
that 80% of jobs in Zimbabwe were in the informal sector. The figure increased to 84% in the
2011 Labour Force survey.
According to the World Bank (2015), Zimbabwe’s ease of doing business ranking is 171 out
of 189. Its starting a business ranking is 180 out of 189, and the World Bank goes further to
state that it takes over two months to start a business. Economic freedom ranking is 175 out of
178. The implication is that SMEs in Zimbabwe could be more in quantum or could be
operating more smoothly had it not been for the unfavourable conditions as depicted by the
statistics.
Manufacturing sector surveys by the Confederation of Zimbabwe Industries (CZI) reveal that
industrial capacity utilisation plummeted from 35.8% in 2005 to 18.9% by 2007 and to less
than 10.0% by 2008. The point driven home by these figures is the apparent fact that the country
is in a predicament of deindustrialisation. It increased to 33.0% in 2009, 43.7% in 2010 and
57.2% in 2011, before declining again to 44.2% in 2012 and 39.6% in 2013.
In realising the importance of SMEs, the government of Zimbabwe created a ministry that
specifically looks at this sector. Funding and other support bodies have also been instituted, all
in the interest of SMEs (Reserve Bank of Zimbabwe, 2009). Most of the commercial banks in
Zimbabwe have a division that looks after SMEs. Through the ministry, government has
provided cheaper industrial parks, sometimes termed ‘factory shells’ to SMEs to foster their
growth and operational ease. This study notes that whilst these structures are noble and
forward-looking, their effectiveness is diminished by the economic retardation and
retrogression that haunts the country (Chagonda, 2012).

76
3.9 Instability of Zimbabwe’s economy
This section simply runs down some of the events that shook the Zimbabwean economy,
ultimately evidencing the instability of the economy. This is in consistence with the fact that
an economy with frequent large recessions, very high or variable inflation, or frequent financial
crises would be considered as economically unstable.
Period Event
1982 – 1984 There was a drought that negatively impacted growth in the agro-
based economy
1986 Another drought that held back economic progress
1991 – 1992 A crippling drought that teamed up with the implementation of the
Economic Structural Adjustment programme (ESAP) in adversely
affecting the generality of the population. ESAP signalled the policy
shift from socialism-communism to capitalism.
1997 Black Friday crash of the Zimbabwe dollar by 75% on 14 November
1997. This came on the back of government’s unbudgeted payment of
Z$50,000 gratuity as well as Z$2,000 monthly pensions to the country’s
war veterans. The total disbursed figure equated to 3% of GDP, hence
the impact (Chagonda, 2012).
1997, November Designation of 1471 white-owned farms for compulsory acquisition and
the announcement by government that compensation would be paid
towards land improvements and not for the land (Pazvakavambwa and
Hungwe, 2009)
1998 Zimbabwe’s involvement in the DRC war, an unbudgeted expense.
Grapevine has it that the DRC war costed the Zimbabwean fiscus over
US$1 million a day (Moore, 2002; Chagonda, 2012)
1999 A drought that weakened the economy

77
2000 A violent land reform programme that led to a fall in commercial
agricultural production by 51% (Mugumbate and Nyanguru, 2013)
1997 – 2000 Inflation rose from 19% to 56%
2000 – 2006 Inflation further rose from 56% to 1000%
2002 Hotly contested presidential election where, for the first time in history,
the winning ZANU PF candidate won by a thin margin (56.2%)
followed by the opposition MDC candidate with 42%. Political violence
during and after the campaigning period destabilised the economy
(Chagonda, 2012).
2004 Banking crisis – a number of banks were closed and placed under
curatorship (RBZ, 2004)
2004 Stoppage by Zimbabwe to service its foreign debt triggering the
compulsory suspension of the country from the IMF
2006 – 2008 Inflation sky rocketed to an astronomical 231 million percent by July
2008
2006 – 2009 Zeroes were truncated thrice in this period to normalise financial
transactions. In an exercise dubbed “Sunrise I” in August 2006, the
Central Bank removed three zeroes from Zimbabwe’s currency. In
August 2008, Sunrise II cut a further ten zeroes from the currency and
in February 2009, Sunrise III truncated another twelve zeroes from the
currency (Chagonda, 2012)
2008 Fiercely contested presidential elections where the opposition MDC
candidate won by 48% and the losing ZANU PF candidate followed
with 43%. Almost a month passed before these results were announced
(Chagonda, 2012). Because there was no majority, a rerun was held and
tables were turned in favour of the ZANU PF candidate who got 85%
while the MDC candidate got 9%. Politically motivated violence was
rampant during and after the campaigning period.
2008 A fall in the country’s GDP by 14%

78
2009 Because of the initial result of the 2008 presidential elections, a
Government of National Unity took office in February 2009 (Munanga,
2013)
2009, April Shelving of the Zimbabwe dollar, a freezing or loss of all Zimbabwe
dollar savings and the introduction of a multi-currency regime
2013 End of Government of National Unity following a general election
where ZANU PF won. The ZANU PF government immediately adopted
the indigenisation policy which created uncertainty in the business
fraternity (Chagonda, 2012)
2016 Nationwide, questionable and devastating cash shortages, and
introduction of Bond notes for use within the country’s borders
On average, over the period reviewed, economically significant events occurred almost at the
rate of one in every two years, and these are events that had adverse impacts on the economy
of Zimbabwe. Given the foregoing, it is not therefore a far-fetched idea to label the
Zimbabwean economy as unstable, and the operating environment for Zimbabwean SMEs as
hostile (Makanyeza and Dzvuke, 2015; Chagonda, 2012; Mugumbate and Nyanguru, 2013).
3.10 Conclusion
This chapter has discussed Zimbabwe within the context of this study. It has looked specifically
at the economic overview, hyperinflation (2004 to 2009), the government of national unity,
post government of national unity, unemployment, the agricultural, mining and SME sectors
particularly in terms of their linkage to the economy of Zimbabwe. It is important to shed some
light on the country in which the research was undertaken. The next chapter looks at the
research methodology.

79
Chapter Four: METHODOLOGY
4.1 Introduction
The objective of this chapter is to outline the key methodological issues with respect to this
study. It unravels the research strategy and design employed to address research objectives.
There is a discussion on the positivist and phenomenological paradigms, the questionnaire used
for the study and its design. The chapter further discourses on the general limitations of
questionnaire surveys. The interview design employed is looked at as well as the sample
composition and the longitudinal approach embraced. In other words, the investigation
blueprint used to obtain data is discussed. Further the chapter focuses on data analysis,
reliability, validity and ethical aspects within the context of this study.
4.2 Research design
Literature amply documents research design, which is described as, ‘the framework or plan
for a study used as a guide in data collection and analysis (Saunders et al., 2009). Churchill
(1991) goes further to state that research design is the grand plan used in completing a study.
Almost a similar description is given by Yin (2011) who defines research design as the
rationale that connects collected data, conclusions to be drawn from the data and the research
questions. Put differently, research design is the investigation blueprint aimed at empowering
the researcher to validly and reliably address the research questions.
Four research issues are addressed by the research design, which are the type of questions to
be studied, choosing the relevant data for the research, the kind of data to be collected and how
to go about the analysis of results (Saunders et al., 2009). Operationalising the above, research
design is concerned with choice of the applicable data collection methods, questionnaires,
samples, measurement and scaling procedures as well as data analysis routes (Yin, 2014).

80
Central to the choice of a research design and methodology is the research question as well as
the research objectives (Creswell and Clark, 2011; Tourna-Germanou, 2007). The main
research aim that this study attempts to address is ‘to analyse the relationship between formal
strategic planning and performance in the small business sector of Zimbabwe, a developing
economy’. Contingency theory forms the theoretical basis of this research and small firms are
divided into two major groups, being new firms (small enterprises that have been in business
for less than eight years) and established firms (small enterprises that have been in business for
eight years or more), where firm age is a contingent variable (Gibson and Casser, 2005).
This research concentrates on the relationship between formal strategic planning and
performance with moderating contingent variables. It is not concerned with causality neither
does it intend to look at the direction of causality. According to Neuman (1994), the language
of quantitative research is one of variables and relationships among such (Pallant, 2013).
Quantitative methods will be employed in addressing certain research questions while the
qualitative approach will be used to address the other questions.
4.2.1 Stages of the research
The research consists of two main stages, the first being a survey through questionnaires to 392
small enterprises. Analysis of this section will be both quantitative and qualitative as the
questionnaire addresses both research approaches. The second stage is an interview based
survey through semi structured interviews to at least 24 small enterprises. Analysis of this
section will be predominantly qualitative in view of the sample size and the type of questions
to be addressed. The strength of a multiple methods approach is to overcome the shortcomings
of different methods. Such an approach is recommended in management research (Yin, 2009).
The questionnaire underwent a pilot study with five small enterprises’ owner managers.
Corrections from the pilot were useful in reshaping the research tool (Yin, 2014).
Questionnaires were served on owner managers while interviews were conducted on owner
managers as well after the initial questionnaire based survey.

81
4.3 Research methodology
Cooper and Schindler (2003) define research methodology as the procedural framework and
method within which the research is carried out. Almost a similar definition is submitted by
Creswell and Clark (2011) who define the same construct as the procedures and methods of
the research process in general. Put differently, it can be referred to as a study’s operational
framework within which data are placed for clear revelation of their meaning.
As Saunders et al., (2009) put it, the proper way of choosing an appropriate research
methodology for a study is to initially analyse research context aspects like aim of the study,
research questions and availability of resources for the project. Ultimately, choice of a
methodology should not be guided by what method the researcher finds convenient or
appealing but by how much the chosen methodology can achieve in resolving the research
problem (Saunders et al., 2009). Because of the nature of the research questions, which
combine inter alia, what and how, a mixed methods approach is embraced (Creswell and Clark
(2011). A hybrid positivist-phenomenological approach is adopted with a longitudinal aspect
over three periods. The longitudinal aspect is meant to do justice to strategic management and
performance relationship measurement. The constructs are long term by nature, and
accordingly require a long term assessment approach (Palmer and Wiseman, 1999).
According to Yin (2009), mixed methods research forces the methods to share the same
research questions, to collect complementary data and to conduct counterpart analyses.
Cunningham, Young and Lee (2000) note that in a mixed methods approach, the methods are
complementary. To the extent that the mixed methods cover up for each other’s shortcomings,
mixed methods research tends to tackle complicated research questions and collects a richer
and stronger array of evidence than can be done by any mono-method single handed (Creswell
and Clark, 2011). The following table shows some of the characteristics of the two research
paradigms.

82
Table 4.1; General description of the positivist and phenomenological research
paradigms
Positivist (Quantitative) Phenomenological (Qualitative)
Tends to produce quantitative data Tends to produce qualitative data
Makes use of large samples Makes use of small samples
Data is specific and precise Data is rich and subjective
High levels of reliability Low levels of reliability
Low validity High validity
There is scope to generalise findings Findings cannot be readily generalised
Source: Creswell and Clarke, (2011)
The interview based approach basically sought to establish how SMEs in Zimbabwe do their
planning. It also sought to extract information on how environmental uncertainty and firm age
affect small firm strategic planning. Over and above, it probed further on questions that
featured in the initial questionnaire based survey, which needed clarity. The interview explored
deeper into the how part of the research (Yin, 2014), while establishing finer details on the
strategic management practices of small and medium enterprises in Zimbabwe. Twenty four
firms were interviewed.
The multi-methods approach adopted in this study, also called triangulation, is defined by
Denzin (1978) as “the combination of methodologies in the study of the same phenomenon”
(Teddlie and Tashakkori, 2012). The variety of methods imply variety in data collection and
data analysis approaches, culminating in balanced discussions, conclusions and
recommendations. Infact Babbie (1998) recommends combining a survey with other research
approaches to make the survey more effective. Using a multiple methods approach in this study
should enhance a more detailed understanding of strategic planning in the small enterprises
sector than would be the case with a methodologically singular approach (Saunders et al.,
2009).

83
4.3.1 Philosophical worldview
According to Creswell (2014), there are four main worldviews, which are postpositivism,
constructivism, transformative and pragmatism. While the study adopted quantitative and
qualitative paradigms, which may appear to be in synchrony with postpositivism and
constructivism worldviews, the appropriate worldview for this study is pragmatism. Several
methodology scholars strike a consensus in labelling pragmatism as a philosophical
underpinning for mixed methods studies (Creswell, 2014; Tashakkori and Teddlie, 2010). An
important characteristic of pragmatism is its concentration on the research problem and then
utilising multiple methods to expand frontiers of knowledge on the problem.
Table 4.2 The four worldviews
Postpositivism Constructivism
Determination
Reductionism
Empirical observation and
measurement
Theory verification
Understanding
Multiple participant meanings
Social and historical construction
Theory generation
Transformative Pragmatism
Political
Power and justice oriented
Collaborative
Change-oriented
Consequences of actions
Problem-centred
Pluralistic
Real-world practice oriented
Source: Creswell (2014)
Creswell (2014) further describes pragmatism as uncommitted to any one system of philosophy
and reality, which applies to mixed methods research. The researcher is at liberty to choose the
methods, techniques and procedures that best meet the needs at hand. Ultimately (Creswell,
2014), for the mixed methods researcher, pragmatism opens avenues to multiple methods (in
this study, quantitative and qualitative paradigms), different worldviews, and different
assumptions, as well as different forms of data collection (questionnaire based survey and

84
interview route in this study) and analysis (quantitative and qualitative analyses adopted in this
study)
4.4 Survey approach
A survey forms an integral part of the research methodology of this study. In deciding to take
the survey route, some of the rationales considered include the following.
Table 4.3 Strengths of the survey approach
Strengths of the survey approach
1. can be used profitably in the examination of many social topics and can be especially
effective when combined with other methods
2. survey data facilitate the careful implementation of logical understanding
3. the fact that the survey format permits a clear and rigorous elaboration of a logical
model clarifies the deterministic system of reasons for, and sources of, observed
events, characteristics, correlations and cause and effect
4. a survey is conducted for purposes of describing not only the particular sample under
study, but also for purposes of understanding the larger population from which the
sample was originally selected
5. because of the various variables at their disposal, survey researchers can carefully
examine the relative importance of each and obtain the greatest amount of
understanding from the fewest number of variables
Source: Saunders et al., (2009)

85
4.4.1 Questionnaire for this study
A questionnaire was used to collect data. One of the reasons for settling for this method is its
ability to be used on a large number of small enterprises’ owner managers, who are
representative of a wider population for the purpose of addressing the quantitative and
qualitative research questions of the study.
The specific method of data collection were questionnaires that were be sent by personal
contact with the SME owner-managers or via e-mail for a few respondents. The postal system
in Zimbabwe was not efficient enough to use the postal route, hence the personal contact
option. One advantage of the questionnaire is that it is generally cheaper to administer than a
large sample of standardised interviews for instance (Saunders et al., 2009).
4.4.2 Questionnaire design
It is of paramount importance that a questionnaire is designed appropriately. A poor
questionnaire design results in the collection of data that is irrelevant for the intended analysis
(Yin, 2009). As is common in business management studies, the questionnaire design was
mainly based on a review of literature (Creswell and Clark, 2011). Before finalising on the
questionnaire, some input was obtained from presentations to academics and also from
interviews with small enterprises owner managers as well as postgraduate students.
Questionnaire questions were framed around research objectives, questions and the
contingency approach. Literature emphasises the importance of a pilot survey as part of the
development of a survey instrument (Saunders et al.,2009). A pilot study was then conducted
with five SME owner managers. De Vaus (1996) notes that for a pilot survey to be effective, it
should be tested on people who are similar to the intended sample respondents or participants.

86
Accordingly, SME owner managers were picked to form the pilot group of respondents. The
pilot owner managers were requested to indicate: -
• whether they faced difficulties in grasping the contents of the questionnaire
• whether the contents were relevant to their organisation and to this research
• whether it was easy to read the questions
• whether they had any suggestions for further improving the questionnaire
The Researcher also had the mandate to:
• ensure that the format of the questionnaire was user-friendly
• check practical issues such as data coding
• ensure that the final instrument contained relevant questions only
Comments from the pilot were important in reshaping and reorganising the questionnaire, and
giving it a more logical flow of questions. Following the said amendments, a second round of
questionnaire testing was carried out with three owner managers and two academics whose
feedback suggested that the questionnaire was ready for the field. The questionnaire consisted
of two sections. The first section looked at basic and screening questions on the industry type
in which the respondent firm is, newness of firm, total employment and income figures. The
second section looked primarily at the formality of planning of respondent organisations.
The choice to make use of e-mail and a hand-to-hand approach was reached on account of the
following factors:
The postal infrastructure in Zimbabwe was not at its best therefore sending questionnaires by
post was not an attractive option. The option to email was only used with a few, otherwise the
majority of the small business community face challenges accessing email due to persistent
network problems as well as not having the computers onsite that are connected to the internet.
In many cases, business owners have to visit an internet café to access email and printing as
well as for scanning services which are paid for. This could load respondents with extra
expenses, potentially reducing the response rate. In the circumstances, the hand to hand
approach, in the main, had to be employed.

87
4.4.3 Limitations of questionnaire surveys
Surveys have a number of weaknesses, which this study attempted to circumvent. Low
response rates is one of the limitations which this study has tried to avoid by mainly employing
a hand to hand questionnaire administration approach. According to Saunders et al., (2009),
one major limitation with questionnaires is that of non-response, particularly when respondents
have no special interest in the subject being researched on. The approach to have owner
managers only as the respondents ensured that respondents were interested as planning and
performance are normally interesting subjects to firm owners. The questionnaire pilot tests
(Creswell and Clarke, 2011) removed ambiguities that could confuse respondents thereby
increasing the rate of response errors. The questionnaire length was kept at a minimal to avoid
boredom on the part of respondents. In this regard, only research specific questions were
included in the questionnaire. This is in consistence with Saunders et al., (2009) who
recommend objectively exhaustive but precise questionnaires.
4.4.4 Interviews
The interview approach was mainly chosen to address the qualitative aspect and get deeper
insights on strategic management practices of SMEs in Zimbabwe. The ‘why’ and ‘how’
questions constitute a greater part of the interviews (Saunders et al., 2009) while also exploring
the extent to which the contingency approach is applicable in the Zimbabwean scenario. One
advantage of interviews is that they provide flexibility for the researcher especially where
complex issues are being addressed as various forms of questions can be utilised to enhance
understanding (Tashakkori and Teddlie, 1998). Supporting the foregoing, Creswell and Clark
(2011) note that using interviews simplify seemingly difficult or confusing questions through
repeating or rephrasing same. Literature identifies three types of interview, being structured,
semi-structured and unstructured (Yin, 2009). This study used semi-structured interviews.
Semi-structured interviews allow the researcher to ask various types of questions to get the
same information from interviewees. Despite its benefit of being direct and giving the

88
researcher a chance to focus on particular objects, the structured interview was avoided due to
its unsuitability for the aim and objectives of this research.
Semi-structured interviews were conducted with twenty four SME owner managers to unravel
deeper insights on strategy formulation. In choosing interviews as one of the research
approaches, some of the advantages of the approach which the researcher was mindful of
include the possibility of immediate follow up and clarification, interviewees can expand upon
and justify their responses and the researcher can probe and pursue interesting issues that may
arise during the course of the interview (Saunders et al., 2009).
4.4.4.1 Interview design
Since the interviews came at the second stage of data collection, they were developed from the
questionnaire. Participants would have responded to the questionnaire before, hence this stage
would be seeking finer details to extract deeper insights therefrom. The questions generally
took an open ended format to allow participants sufficient space for free expression of their
ideas and opinions without restraint (Saunders et al., 2009). Questions were also prepared
according to the research objectives and literature review findings.
Major areas addressed by the interviews included: -
• establishing whether firms indulged in outright non-planning, prescriptive, emergent or
prescriptive-emergent planning paradigms
• obtaining reasons for adopting non-planning or a particular strategic management
approach
• For planners, the tools of strategy formulation used
• How the contingent variables like newness of firm and environmental volatility affect
strategy formulation
• Probing further on responses given in the questionnaire like on performance indicators
The interview schedule was taken through pilot testing (Saunders et al., 2009) with three SME
owner managers before finalisation on same. Feedback from the pilot was useful in reviewing
the schedule before fieldwork commencement.

89
4.5 Sample composition
The research was carried out in Harare, Zimbabwe and across all sectors of the economy which
include manufacturing, retail, wholesale, transport, financial, engineering, and others. The
research targeted operational small businesses that were in the main housed in factory shells in
Caledon under Waterfalls, Southerton industrial site, Glenview, Mbare, Highfields, and Msasa
industrial site. Small business concerns in the Harare central business district (CBD) were also
picked. While other centres have small businesses, Harare was preferred for cost-management
reasons as well as its strategic location as the hub of economic activity in Zimbabwe. Given
that the operational and regulatory environment is the same within Zimbabwe, a Harare sample
can be depended upon and is safe to generalise findings there from. The small business sites
picked constitute more than 75% of the Harare-based small business factory shells, quite a fair
representation of the entire population, thereby rendering the results of this study reliable and
generalisable.
Guidance in arriving at the minimum sample size of 322 was obtained from Krejcie and
Morgan (1970), who provided a statistically determined model or formula of arriving at
research samples from given total populations. In this study the total population was 2038
SMEs in the factory shell sites stated afore. Tables 4.3 and 4.4 below reveal the details more
precisely. Sample members were picked randomly across all sectors of the economy. The
random approach has an advantage of flexibility that allows great scope for inference and
judgment in the interpretation of results (Saunders et al., 2009). It is also less expensive and
less time consuming as compared to other approaches. It is important to note that one major
criticism of Krejcie and Morgan’s (1970) sampling approach is that a sample derived from it
should be considered as the minimum size (Bartlett, Kotrlik, and Higgins, 2001). In this regard
the sample was increased to 392 as a protective measure against the downsides of adopting the
minimum sample size. Because this study looks categorically at new and established firm
sectors for testing the relationship between planning and performance, two sub-samples
emerged from the whole.

90
Table 4.4 Population Size (N)
Location Population
Caledon Shopping Centre,
Waterfalls
60
Glenview and Mbare Home
Industries
1500
Highfields and CBD 450
Msasa 28
Total Population 2,038
Table 4.5: Table for Determining Sample Size from a Given Population (Extracted from
Krejcie & Morgan, 1970, p. 2)
N S N S
1200 291 2000 322
1300 297 2200 327
1400 302 2400 331
1500 306 2600 335
1600 310 2800 338
1700 313 3000 341
1800 317 3500 346
1900 320 4000 351
Key: N is population size and S is sample size

91
4.6 Literature review
In this study, literature review was used as one of the research techniques (Creswell and Clark,
2011). A detailed literature search and review was undertaken mainly in the second chapter,
giving the general theoretical and conceptual framework of the study. Survey instruments like
the questionnaire and interview schedule were a direct offshoot from the literature search and
review. Without a logical review of literature it would be near impossible to come up with the
research instruments and research gaps outlined in the earlier chapters.
4.7 Data analysis
This study embraced a mixed methods (triangulation) approach where the qualitative and
quantitative research paradigms were adopted. Data was fully extracted from the questionnaires
and interview sheets onto the summary sheets that incorporate frequency distribution tables
and related presentation methods (Pallant, 2013). Descriptive and inferential statistics were
implemented to illustrate the research findings. The Statistical Package for Social Sciences
(SPSS) was utilised to statistically analyse the data gathered. The descriptive design was also
used to do justice to the qualitative aspect of the research.
Qualitative data collected through interviews was used to interpret the information conveyed
by these basic statistical tools. Literature emphasises the fact that there is no best method of
analysing qualitative data but it all rests with the researcher’s interpretation of findings
(Saunders et al., 2009). For the qualitative part under the interview based survey, Nvivo 11
software was utilised. Conclusions and recommendations were then drawn from the findings
in the field. The blending of both positivist (quantitative) and phenomenological (qualitative)
data analysis is recommended in the literature (Creswell and Clark, 2011; Saunders et al.,
2009). It is expected that the two pronged analyses should result in an academically and
empirically sound discussion, conclusion and recommendations (Tashakkori and Teddlie,
2012).

92
4.8 Reliability and validity
Validity means an instrument’s ability to measure what it originally intended to measure
(Saunders et al., 2009; Tourna-Germanou, 2007). Before distribution of the questionnaire to
the sample, a pilot study was conducted which sought to pick any mistakes, ambiguous or
confusing questions. The pilot study is a vital method of detecting any flaws in questionnaire
design in terms of validity, reliability and practicality. A major strength of pilot studies is the
method’s proactivity as opposed to reactivity (Creswell and Clark, 2011; Black, 1999). The
questionnaire was pilot tested with five owner managers of SMEs (pilot respondents). They
were requested to provide feedback on key aspects of questionnaire construction and contents,
which feedback was used in reviewing the research instrument.
According to Yin (2009), internal validity refers to the applicability of data analysis techniques
to the researched issues. The researcher endeavoured to demonstrate how data analysis
techniques sufficiently addressed the research objectives. As recommended in literature, the
use of methodological and data triangulation in this study is a dependable method of enhancing
validity and reliability of research (Yin, 2009)
4.9 Ethical aspects
Ethical aspects worth consideration were duly observed in this research. Participants gave
informed consent through the participant information sheet which accompanied questionnaires.
In this regard, participants were advised their nature of involvement, that their involvement
was voluntary, that they were not whatsoever coerced into participation (Saunders et al., 2009)
in the study, and that they had the right to discontinue in the research study as and when they
felt as such. By approaching senior managers or owners of the small enterprises, the researcher
ensured that participants had the psychological maturity necessary to understand their
involvement in the study.
Confidentiality was ensured through the use of coded questionnaires. Participants were assured
that no harm would befall them as a result of their involvement in this research (Yin, 2009).

93
Before carrying out the research fieldwork, due ethical procedures within the Salford
University Business School were observed.
4.10 Conclusion
This chapter explained the methodology adopted in this study. Explanations were given on the
rationale for choosing the research design and methodology used. It brought to light how the
sample was arrived at and also the logic behind the determination of interview participants. An
explanation on the intended methods of data presentation and analysis is given. Further, issues
to do with ethical aspects were discussed.

94
Chapter 5: PRESENTATION AND ANALYSIS OF QUANTITATIVE RESULTS
5.1 Introduction
This chapter aims to provide answers to some of the main research questions particularly to do
with the extent of planning of the SMEs, performance comparisons between planners and non-
planners, and the relationship between formal strategic planning and performance. The
exploration of relationships was conducted using the Pearson product-moment correlation
coefficient. T tests were used in performance comparisons between formal strategic planners
and non-planners. Hypotheses were tested in this chapter as well.
5.2 Descriptive statistics
Out of the 650 questionnaires distributed, 451 were responded to, of which 392 were usable.
This represents a 60.3% effective response rate. Of the 392 SMEs, 242 (61.7%) were
partnerships, 92 (23.5%) were private limited companies, and 58 (14.8%) were sole
proprietorships. The figure 5.1 below captures the statistics.

95
Fig 5.1: Form of organization
Concerning the sectors within which these SMEs operated, 235 (59.9%) were in the
manufacturing sector, 65 (16.6%) were in the services sector, 46 (11.7%) were in the
construction sector, 31 (7.9%) were in the retail sector, 12 (3.1%) were in the wholesale sector,
and 3 (8%) were in the other sectors category. Notwithstanding that manufacturing occupies
the highest portion, the variety of industries is a fairly good representation of the different
industries in which SMEs operate.
0 50 100 150 200 250 300
Sole Proprietorship
Pvt Ltd Company
Partnership
Form of Organisation

96
Fig 5.2: Industrial sector distribution
In relation to the age of the companies, new firms (those that were less than 8 years old) were
194 (49.5%), established firms (those that were 8 years old and above) were 198 (50.5%). New
firms in accordance with the Global Economic Monitor (2009) definition (small firms that were
up to 3.5 years old) were 83 (21.2%), and established firms (small firms above the age of 3.5
years) per Global Economic Monitor (2009) definition were 309 (78.8%).
Frequency
Services Manufacturing Construction Retail Wholesale Other

97
Fig 5.3: Firm age / Years of experience
Formal strategic planners (those that ticked number 6.2(a) to (e)) were 86 (21.9%). Non-
planners within the definition of this study were 306 (78.1%).
Fig 5.4: Density of planners and non-planners
83
194 198
309
SINCE 2011 SINCE 2007 BEFORE 2007 BEFORE 2011
86
306
DENSITY OF PLANNERS AND NON-PLANNERS
Planners Non-planners

98
The non-planners’ group comprised outright non-planners and SMEs who planned using other
methods outside of formal strategic planning. Outright non-planners were 87 (22.2%) while
SMEs which planned but not formally (SMEs which used emergent or learning approaches)
were 219 (55.9%). This is diagrammatically represented below.
Fig 5.5: Distribution of formal strategic planners, outright non-planners and other
planners
Table 5.1 provides information on the meaning of formal strategic planning in this study. This
is captured in questionnaire question number 6.2(a) to (e).
Table 5.1: Formal strategic planning
The organisation has a written strategic plan which: a) Has a vision and mission statement b) Covers at least three years into the future c) Includes the specification of objectives and goals d) Includes the selection of long-range strategies e) Includes the determination of the future resources required
Responses to question number six are summarized in table 5.2 below. Figures 5.4 and 5.5 partly
show a further summary of table 5.2 as they identify formal strategic planners, outright non-
planners and emergent planners.
Formal strategic planners
22%
Outright non-planners
22%
Other planning approaches
56%
DISTRIBUTION OF PLANNERS AND NON-PLANNERS

99
Table 5.2: Descriptive statistics of planners and non-planners
The organisation has no written strategic plan covering at least three years into the future Frequency Percent
False 138 35,2 True 254 64,8 Total 392 100,0
The organisation has a written strategic plan which: Has a vision and mission statement
False 95 24,2 True 297 75,8 Total 392 100,0
Covers at least three years into the future False 301 76,8 True 91 23,2 Total 392 100,0
Includes the specification of objectives and goals False 95 24,2 True 297 75,8 Total 392 100,0
Includes the selection of long-range strategies False 134 34,2 True 258 65,8 Total 392 100,0
Includes the determination of the future resources required Frequency Percent
False 114 29,1 True 278 70,9 Total 392 100,0
5.3 Performance difference between planners and non-planners
According to Pallant (2016), performance differences can be measured by the independent
samples t-test for equality of means. In analysing the performance difference between planners
and non-planners, two major steps are adopted in view of the definition of performance used
in this study. Performance is defined as (i) growth in gross turnover or sales per annum and,
(ii) growth in employment or employee headcount per annum. First the independent samples t
test is applied on gross turnover or sales statistics, and second it is applied on employment or
employee head count statistics.

100
The Independent samples t tests are then employed to compare means at the 95% confidence
interval. To determine whether the difference is significant or not, Pallant (2016, 247) uses the
following criterion, which is adopted in this study:
If the value in the Sig. (2-tailed) column is equal to or less than 0.05, there is a significant
difference in the mean scores.
If the value is above 0.05, there is no significant difference between the two groups
While addressing research question three, this section also tests the hypothesis H1b, which
reads ‘Small businesses that engage in formal strategic planning do not have superior
performance to non-planners’.
5.3.1 Gross turnover or sales as a performance indicator Table 5.3: Sample sales growth statistics in preparation for independent t tests
Entire Sample Statistics Non-
planners and planners
N Mean Std. Deviation
Std. Error Mean
SALES GROWTH 2013 -2014
No 306 29.25 55.563 3.176 Yes 86 11.65 21.325 2.300
SALES GROWTH 2014 – 2015
No 306 -1.35 36.577 2.091 Yes 86 6.57 24.382 2.629
SALES GROWTH 2015 – 2016
No 306 20.27 33.478 1.914 Yes 86 19.01 39.563 4.266
SALES GROWTH OVERALL 2013 – 2016
No 306 4.81 7.934 .454 Yes 86 3.73 5.674 .612
From the table 5.3 above, sales growth as a performance indicator is mainly represented by the
mean column. Cross sectional analysis in terms of sales growth for the period 2013 – 2014
reveal a higher mean (29.25) for non-planners than for formal strategic planners (11.65). In the

101
ensuing period 2014 – 2015, formal strategic planners registered a higher performance in terms
of turnover growth (6.57) as compared to non-planners who had -1.35. The period 2015 – 2016
has a higher mean for non-planners (20.27) as compared to formal strategic planners who had
19.01. In overall or longitudinal terms, non-planners have a higher mean (4.81) as compared
to formal strategic planners who have 3.73. Based on the above table, the next table represents
the independent samples test which reveals how statistically significant the performance
differences are.
Table 5.4: Independent samples test for sales growth
Independent samples test
t-test for equality of means
T Df Sig. (2-tailed)
Mean Difference (No-yes)
Std. Error Difference
95% Confidence Interval of the Difference Lower Upper
SALES GROWTH 2013 -2014
4,488 356,804 ,000 17,600 3,921 9,889 25,312
SALES GROWTH 2014 – 2015
-2,357 203,812 ,019 -7,916 3,359 -14,540 -1,293
SALES GROWTH 2015 – 2016
,295 390 ,768 1,256 4,259 -7,117 9,630
SALES GROWTH OVERALL
1,174 390 ,241 1,075 ,915 -,725 2,874
There is a statistically significant difference in sales performance for the period 2013 – 2014,
as well as the period 2014 -2015 for SMEs that engage in formal strategic planning and non-
planners. According to the cross sectional analysis, the period 2013 – 2014 witnessed higher
sales growth in non-planning SMEs than in small firms that engaged in formal strategic
planning (Mean for non-planners minus mean for formal strategic planners is 17 600)
For the period 2014 – 2015, formal strategic planners registered higher sales growth than non-
planning SMEs (Mean for non-planners minus mean for formal strategic planners is -7.916 )

102
There is a statistically insignificant difference in sales performance for the period 2015-2016
as well as for the overall, longitudinal analysis between formal strategic planners and non-
planners. For the period 2015 – 2016, non-planners registered higher sales growth, albeit the
fact that the difference in sales performance is insignificant Mean for non-planners minus mean
for formal strategic planners is 1 256. The overall, longitudinal analysis reveals higher sales
growth for non-planning firms compared to formal strategic planners (mean for non-planners
minus mean for formal strategic planners is 1 075). The difference is however statistically
insignificant. This is explained by the fact that over the three periods, sales growth statistics
for formal strategic planners and non-planners were mixed as evidenced by the mean
differences which would be positive in one period and negative in another. A statistically
insignificant difference in sales performance hence becomes the culmination of that undulating
trajectory over the years under review.
It can therefore be concluded that longitudinally over the three periods, there is not a
statistically significant difference in the mean sales growth (performance) scores for formal
strategic planners and non-planners [Sig. (2-tailed) > 0.05].
5.3.2 Employment growth as a performance indicator
The following tables show performance differences in terms of employment growth between
formal strategic planners and non-planners. Independent samples t tests are also carried out to
verify the significance of the differences.

103
Table 5.5: Sample employment growth statistics in preparation for independent t tests
Entire Sample Statistics Non-
planners and planners N Mean
Std. Deviation
Std. Error Mean
EMPLOYMENT GROWTH 2013 -2014
No 306 38.95 61.552 3.519 Yes
86 13.72 27.025 2.914
EMPLOYMENT GROWTH 2014 – 2015
No 306 -11.27 33.682 1.925 Yes 86 3.70 22.768 2.455
EMPLOYMENT GROWTH 2015 – 2016
No 306 -.49 22.468 1.284 Yes 86 11.93 18.191 1.962
EMPLOYMENT GROWTH OVERALL
No 306 27.21 60.472 3.457 Yes 86 29.41 43.908 4.735
The mean column displays performance differences between formal strategic planners and non-
planners in each of the three periods, and also longitudinally or overall over the four years. In
the period 2013 – 2014, performance in terms of employment growth was higher for non-
planners (38.95) than for formal strategic planners (13.72). for the period 2014- 2015,
performance in terms of employment growth was higher for formal strategic planners (3.70)
than for non-planners (-11.27), and for the period 2015 – 2016, performance in terms of
employment growth was higher for formal strategic planners (11.93) than for non-planners (-
0.49). The longitudinal analysis yields a position where formal strategic planners have higher
performance in terms of employment growth (29.41) than non-planners (27.21). Conclusions
can however not be made until after the independent samples test is carried out, and the next
table presents results of the same.

104
Table 5.6: Independent samples test for employment growth
Independent samples test
t-test for equality of means
T Df Sig. (2-tailed)
Mean Difference
Std. Error Difference
95% Confidence Interval of the Difference Lower Upper
EMPLOYMENT GROWTH 2013 -2014
5,522 322,489 ,000 25,230 4,569 16,242 34,218
EMPLOYMENT GROWTH 2014 – 2015
-4,799 200,570 ,000 -14,972 3,120 -21,125 -8,820
EMPLOYMENT GROWTH 2015 – 2016
-4,708 390 ,000 -12,417 2,637 -17,602 -7,232
EMPLOYMENT GROWTH OVERALL
-,374 185,119 ,709 -2,195 5,862 -13,760 9,371
There are statistically significant differences in the mean employment (performance) growth
scores for formal strategic planners and non-planners for the periods 2013- 2014; 2014 -2015;
and 2015 – 2016 [sig. (2-tailed) < 0.05]. There is however not a statistically significant
difference in the mean employment (performance) growth scores for formal strategic planners
and non-planners over the four years. This is mainly attributable to the fact that the mean
differences are not consistent over the three periods. The mean difference starts off in positive
territory (25 230), swinging to negative figures in the ensuing two periods (-14 972 in the period
2014 to 2015, and -12 417 in the period 2015 to 2016).
For the period 2013 – 2014, non-planning SMEs perform better than formal strategic planners
in terms of employment growth (mean difference is 25 230). In the following two periods (2014
– 2015 and 2015 – 2016), formal strategic planners perform better in terms of employment
growth than their non-planning counterparts (-14 972 and -12 417 respectively).
Overall, longitudinal analysis yields a mean difference of -2 195 and after applying the
independent samples t test, the difference is found to be statistically insignificant. It can thus
be concluded that longitudinally over the three periods (2013 to 2016), there is not a statistically

105
significant difference in the mean employment growth scores for formal strategic planners and
non-planners [Sig. (2-tailed) >0.05].
Further, it is therefore plausible to conclude that longitudinally over the three periods (2013 to
2016), there is not a statistically significant difference in performance (as measured by sales
growth and employment growth means) between formal strategic planners and non-planners.
5.4 Correlation Analysis
The strength of a linear relationship between two quantitative variables is explained by
correlation analyses (Shayib, 2013). The Pearson product-moment correlation coefficient is the
most common statistical test that is available in SPSS. The Greek letter p (rho) is used to
represent the population correlation coefficient and r to represent the sample correlation
coefficient (Shayib, 2013). Pearson correlation coefficients (r) acquire values from -1 to +1,
where the negative sign indicates a negative correlation (this implies that as one variable
increases, the other variable decreases), and the positive sign indicates a positive correlation
(this implies that as one variable increases, the other variable also increases). A perfect
correlation of -1 or 1, means that the value of a variable can completely be determined once we
know the value of the other variable (Pallant, 2016). Conversely, a correlation of 0 (zero)
signifies a lack of association between the two variables in question.
Two major steps ought to be taken when interpreting the results of the correlation analysis. The
first step involves determining the direction of the relationship between the two
variables in question and the second step involves considering the value of the Pearson
correlation (r). Whereas different interpretations are recommended by different researchers, in
this study we adopt the framework provided by Shayib (2013, p. 237) and Cohen (1988), which
is as given below: -
r= 0.00 to 0.09 or r= 0.00 to - 0.09 no correlation

106
r= 0.10 to 0.29 or r= - 0.10 to - 0.29 very weak or small correlation
r= 0.30 to 0.49 or r-= -0.30 to - 0.49 medium correlation
r = 0.50 to 1.0 or r = - 0.50 to - 1.0 large or strong correlation
5.4.1 Relationship between formal strategic planning and performance in new firms
This section looks at the cross sectional correlation analyses in each of the three periods (2013-
2014; 2014-2015; and 2015-2016) as well as the longitudinal correlation analysis over the three
periods for new firms. At first the analysis does not have a contingent variable but the second
analysis has got firm age as a contingent or controlling variable.
Table 5.7: New firms’ sales growth statistics for use in correlation analysis
Descriptive Statistics
New firms Mean Std. Deviation N
New firms Formal strategic planning 3.2344 1.79944 192
Sales growth (2013-2014) 15.9531 32.02621 192
Sales growth (2014-2015) 9.5469 39.72442 192
Sales growth (2015-2016) 15.8281 34.91540 192
Overall sales growth 4.1250 6.93689 192
Firm age 5.2115 1.25196 192

107
Table 5.8: New firm correlation analysis (formal strategic planning and performance in
terms of sales growth) without a contingent factor
Correlations
Strategic SALES1 SALE2 SALE3 OVER_SALES Year of experience
No contingency factor
Strategic Correlation 1,000
Significance (2-tailed)
Df 0 Sales growth (2013-2014)
Correlation -,016 1,000
Significance (2-tailed) ,828
Df 190 0 Sales growth (2014-2015)
Correlation -,043 ,167 1,000
Significance (2-tailed) ,555 ,021
Df 190 190 0 Sales growth (2015-2016)
Correlation -,022 ,215 ,030 1,000
Significance (2-tailed) ,762 ,003 ,678
Df 190 190 190 0 Overall sales growth (2013-2016)
Correlation -,035 ,670 ,661 ,617 1,000
Significance (2-tailed) ,629 ,000 ,000 ,000
Df 190 190 190 190 0 Firm age Correlation
-,043 -,050 -,005 ,091 ,019 1,000
Significance (2-tailed) ,549 ,492 ,944 ,211 ,792
Df 190 190 190 190 190 0
From the above, it can be concluded that in new firms, there is no significant relationship
between formal strategic planning and performance in terms of turnover growth, without a
controlling variable.

108
Table 5.9: New firm correlation analysis (formal strategic planning and performance in
terms of sales growth) with firm age as a contingent factor
Correlations
Formal strategic planning
Sales growth (2013-2014)
Sales growth (2014-2015)
Sales growth (2015-2016)
Overall sales growth (2013-2016) Firm age
When controlling for firm age
Formal strategic planning
Correlation 1,000
Significance (2-tailed)
Df 0 Sales growth (2013-2014)
Correlation -,018 1,000
Significance (2-tailed) ,805
Df 189 0 Sales growth (2014-2015)
Correlation -,043 ,166 1,000
Significance (2-tailed) ,554 ,021
Df 189 189 0 Sales growth (2015-2016)
Correlation -,018 ,220 ,031 1,000
Significance (2-tailed) ,803 ,002 ,673
Df 189 189 189 0 Overall sales growth (2013-2016)
Correlation -,034 ,672 ,662 ,618 1,000
Significance (2-tailed) ,638 ,000 ,000 ,000
Df 189 189 189 189 0
Since all correlations are under 0.10, there is no significant correlation in new firms between
formal strategic planning and performance in terms of turnover growth where firm age is the
controlling variable (contingency factor)

109
5.4.2 Relationship between formal strategic planning and performance
in the established firm sector
Table 5.10: Established firms’ sales growth statistics for use in correlation analysis
Descriptive Statistics
More than 8 years Established firms over 8 years old Mean Standard deviation N
Formal strategic planning 4.2700 1.44135 200
Sales growth (2013-2014) 34.4500 62.27075 200
Sales growth (2014-2015) -8.4000 25.54354 200
Sales growth (2015-2016) 23.9900 34.40959 200
Overall sales growth (2013-2016) 5.0000 8.00314 200
Firm age 12.2400 2.56423 200

110
Table 5.11: Established firms’ correlation analysis (formal strategic planning and
performance in terms of sales growth) with no contingency factor
Formal strategic planning
Sales growth (2013-2014)
Sales growth (2014-2015)
Sales growth (2015-2016)
Overall sales growth (2013-2016)
Firm age
No contingency factor
Formal strategic planning
Correlation 1,000
Significance (2-tailed)
Df 0 Sales growth (2013-2014)
Correlation ,103 1,000
Significance (2-tailed) ,148
Df 198 0 Sales growth (2014-2015)
Correlation -,197 -,112 1,000
Significance (2-tailed) ,005 ,114
Df 198 198 0 Sales growth (2014-2015)
Correlation ,038 ,318 -,208 1,000
Significance (2-tailed) ,595 ,000 ,003
Df 198 198 198 0 Overall sales growth (2013-2016)
Correlation ,030 ,881 ,145 ,614 1,000
Significance (2-tailed) ,677 ,000 ,040 ,000
Df 198 198 198 198 0 Firm age Correlation ,071 -,015 -,106 ,056 -,027 1,000
According to the table above, there is no statistically significant correlation between formal
strategic planning and performance in terms of turnover growth, without a contingency factor.

111
Table 5.12: Established firms’ correlation analysis (formal strategic planning and
performance in terms of sales growth) with firm age as contingency factor
Formal strategic planning
Sales growth (2013-2014)
Sales growth (2014-2015)
Sales growth (2015-2016)
Overall sales growth (2013-2016)
Firm age
When controlling for Firm age
Formal strategic planning
Correlation 1,000
Significance (2-tailed)
Df 0 Sales growth (2013-2014)
Correlation ,104 1,000
Significance (2-tailed) ,143
Df 197 0 Sales growth (2014-2015)
Correlation -,191 -,114 1,000
Significance (2-tailed) ,007 ,108
Df 197 197 0 Sales growth (2015-2016)
Correlation ,034 ,320 -,203 1,000
Significance (2-tailed) ,633 ,000 ,004
Df 197 197 197 0 Overall sales growth
Correlation ,032 ,881 ,143 ,617 1,000
Significance (2-tailed) ,657 ,000 ,044 ,000
Df 197 197 197 197 0
There is no statistically significant correlation between formal strategic planning and
performance in terms of sales growth with firm age as the contingency factor.

112
Table 5.13: New firms’ employment growth statistics for correlation analysis
Descriptive Statistics
New firms Mean Std. Deviation N
Less than or equal
to 8 years
Formal strategic planning 3.2344 1.79944 192
Employment growth
(2013-2014) 14.1719 32.50947 192
Employment growth
(2014-2015) 4.6094 26.43571 192
Employment growth
(2015-2016) 4.4063 18.97950 192
Overall employment
growth (2013-2016) 23.2188 48.92492 192
Firm age 5.2115 1.25196 192

113
Table 5.14: New firms’ correlation analysis (formal strategic planning and performance
in terms of employment growth) without a contingency factor
Correlations
New firms
Formal strategic planning
Employment growth (2013-2014)
Employment growth (2014-2015)
Employment growth (2015-2016)
Overall employment growth (2013-2016) Firm age
No contingency factor
Formal strategic planning
Correlation 1,000
Significance (2-tailed)
Df 0 Employment growth (2013-2014)
Correlation -,054 1,000
Significance (2-tailed) ,460
Df 190 0 Employment growth (2014-2015)
Correlation -,048 ,070 1,000
Significance (2-tailed) ,508 ,336
Df 190 190 0 Employment growth (2015-2016)
Correlation ,103 ,071 ,069 1,000
Significance (2-tailed) ,154 ,325 ,342
Df 190 190 190 0 Overall employment growth (2013-2016)
Correlation -,022 ,729 ,614 ,473 1,000
Significance (2-tailed) ,766 ,000 ,000 ,000
Df 190 190 190 190 0 Firm age Correlation
-,043 -,096 -,035 ,203 -,004 1,000
Significance (2-tailed) ,549 ,184 ,633 ,005 ,952
Df 190 190 190 190 190 0

114
It can be concluded that in new firms, there is no statistically significant correlation between
formal strategic planning and performance in terms of employment growth without a
contingency factor.
Table 5.15: New firm correlation analysis (formal strategic planning and performance in
terms of employment growth) with firm age as contingency factor
Correlations
New firms
Formal strategic planning
Employment growth (2013-2014)
Employment growth (2014-2015)
Employment growth (2015-2016)
Overall employment growth (2013-2016) Firm age
When controlling for Firm age
Formal strategic planning
Correlation 1,000
Significance (2-tailed)
Df 0 Employment growth (2013-2014)
Correlation -,058 1,000
Significance (2-tailed) ,425
Df 189 0 Employment growth (2014-2015)
Correlation -,050 ,067 1,000
Significance (2-tailed) ,495 ,358
Df 189 189 0 Employment growth (2015-2016)
Correlation ,115 ,093 ,078 1,000
Significance (2-tailed) ,115 ,200 ,286
Df 189 189 189 0 Overall employment growth (2013-2016)
Correlation -,022 ,732 ,614 ,484 1,000
Significance (2-tailed) ,764 ,000 ,000 ,000
Df 189 189 189 189 0
The deduction from the above is that in new firms there is no statistically significant correlation
between formal strategic planning and performance in terms of employment growth with firm
age as a contingency factor.

115
Table 5.16: Established firm statistics for correlation analysis
Descriptive Statistics
Established firms Mean Std. Deviation N
Established firms
Formal strategic planning 4.2700 1.44135 200
Employment growth
(2013-2014) 51.8900 67.96177 200
Employment growth
(2014-2015) -20.0850 32.63315 200
Employment growth
(2015-2016) .1550 24.74739 200
Overall employment
growth (2013-2016) 31.9900 63.98846 200
Firm age 12.2400 2.56423 200

116
Table 5.17: Established firm correlation analysis (formal strategic planning and
performance in terms of employment growth) without a contingency factor
Correlations
Established firms
Formal strategic planning
Employment growth (2013-2014)
Employment growth (2014-2015)
Employment growth (2015-2016)
Overall employment growth (2013-2016) Firm age
No contingency factor
Formal strategic planning
Correlation 1,000
Significance (2-tailed)
Df 0 Employment growth (2013-2014)
Correlation ,255 1,000
Significance (2-tailed) ,000
Df 198 0 Employment growth (2014-2015)
Correlation -,258 -,251 1,000
Significance (2-tailed) ,000 ,000
Df 198 198 0 Employment growth (2015-2016)
Correlation -,058 -,395 ,150 1,000
Significance (2-tailed) ,417 ,000 ,034
Df 198 198 198 0 Overall employment growth (2013-2016)
Correlation ,117 ,781 ,301 ,044 1,000
Significance (2-tailed) ,099 ,000 ,000 ,536
Df 198 198 198 198 0 Firm age Correlation
,071 -,001 -,061 ,026 -,022 1,000
Significance (2-tailed) ,319 ,987 ,388 ,712 ,760
Df 198 198 198 198 198 0
Cross sectional analysis for the years 2013-2014 and 2014-2015 revealed very weak
correlations between formal strategic planning and performance in terms of employment
growth. In the longitudinal analysis above, it is clear that there is no statistically significant

117
relationship between formal strategic planning and performance in terms of employment
growth without a contingency factor in the established firm sector.
Table 5.18: Established firm correlation analysis (formal strategic planning and
performance in terms of employment growth) with firm age as a contingency factor
Correlations
Established firms
Formal strategic planning
Employment growth (2013-2014)
Employment growth (2014-2015)
Employment growth (2015-2016)
Overall employment growth (2013-2016) Firm age
When controlling for firm age
Formal strategic planning
Correlation 1,000
Significance (2-tailed)
Df 0 Employment growth (2013-2014)
Correlation ,256 1,000
Significance (2-tailed) ,000
Df 197 0 Employment growth (2014-2015)
Correlation -,255 -,252 1,000
Significance (2-tailed) ,000 ,000
Df 197 197 0 Employment growth (2015-2016)
Correlation -,060 -,395 ,152 1,000
Significance (2-tailed) ,402 ,000 ,032
Df 197 197 197 0 Overall employment growth (2013-2016)
Correlation ,119 ,781 ,300 ,045 1,000
Significance (2-tailed) ,095 ,000 ,000 ,531
Df 197 197 197 197 0
Given the foregoing exposition, it can be concluded that there is a very weak correlation
between formal strategic planning and performance in terms of employment growth with firm
age as the contingency factor.

118
5.4.3 Relationship between formal strategic planning and performance
for the entire sample (all the 392 SMEs)
5.4.3.1 Employment growth for entire sample
Table 5.19: Entire sample descriptive statistics for correlation analysis
Descriptive Statistics
Mean Std. Deviation N
Formal strategic
planning 3.7628 1.70522 392
Employment growth
(2013-2014) 33.4158 56.77535 392
Employment growth
(2014-2015) -7.9898 32.18934 392
Employment growth
(2015-2016) 2.2372 22.18539 392
Overall employment
growth 27.6939 57.20545 392
Years of experience 8.7974 4.06063 392

119
Table 5.20: Entire sample correlation analysis (in terms of employment growth) without a contingency factor and with firm age as a contingency factor
Correlations
Control Variables
Formal
strategic
planning EMP1 EMP2 EMP3 OVER_EMP Firm age
No
contingency
factor
Formal
strategic
planning
Correlation 1.000 .217 -.250 -.011 .070 .276
Significance (2-tailed) . .000 .000 .824 .166 .000
Df 0 390 390 390 390 390
EMP1 Correlation .217 1.000 -.267 -.283 .732 .279
Significance (2-tailed) .000 . .000 .000 .000 .000
Df 390 0 390 390 390 390
EMP2 Correlation -.250 -.267 1.000 .147 .355 -.357
Significance (2-tailed) .000 .000 . .004 .000 .000
Df 390 390 0 390 390 390
EMP3 Correlation -.011 -.283 .147 1.000 .190 -.048
Significance (2-tailed) .824 .000 .004 . .000 .347
Df 390 390 390 0 390 390
OVER_EM
P
Correlation .070 .732 .355 .190 1.000 .058
Significance (2-tailed) .166 .000 .000 .000 . .251
Df 390 390 390 390 0 390
Years of
experience
Correlation .276 .279 -.357 -.048 .058 1.000
Significance (2-tailed) .000 .000 .000 .347 .251 .
Df 390 390 390 390 390 0
When
controlling for
firm age
Formal
strategic
planning
Correlation 1.000 .151 -.168 .002 .056 Significance (2-tailed) . .003 .001 .970 .267 Df 0 389 389 389 389
EMP1 Correlation .151 1.000 -.186 -.281 .747 Significance (2-tailed) .003 . .000 .000 .000 Df 389 0 389 389 389
EMP2 Correlation -.168 -.186 1.000 .139 .403 Significance (2-tailed) .001 .000 . .006 .000 Df 389 389 0 389 389
EMP3 Correlation .002 -.281 .139 1.000 .193 Significance (2-tailed) .970 .000 .006 . .000 Df 389 389 389 0 389
OVER_EM
P
Correlation .056 .747 .403 .193 1.000 Significance (2-tailed) .267 .000 .000 .000 . Df 389 389 389 389 0
a. Cells contain zero-order (Pearson) correlations.

120
During the periods 2013 – 2014 and 2014 – 2015, there are very weak or small correlations
between formal strategic planning and performance both in the first scenario without a
contingency factor and also in the second scenario where firm age is the contingency factor.
The weak correlations are however overshadowed by the longitudinal aspect which displays
no statistically significant correlation between formal strategic planning and performance in
terms of employment growth.
5.4.3.2 Sales growth for entire sample
Table 5.21 : Entire sample descriptive statistics for correlation analysis
Descriptive Statistics
Mean Std. Deviation N
Formal strategic
planning 3.7628 1.70522 392
SALES1 25.3903 50.59926 392
SALE2 .3903 34.40385 392
SALE3 19.9923 34.85413 392
OVER_SALES 4.5714 7.50311 392
Years of experience 8.7974 4.06063 392

121
Table 5.22: Entire sample correlation analysis (formal strategic planning and performance in terms of sales growth) without a contingency factor and with firm age as a contingency factor
Correlations
Control Variables Strategic SALES1 SALE2 SALE3
OVER_
SALES Firm age
No contingency
factor
Formal
strategic
planning
Correlation 1.000 .105 -.168 .040 .015 .276
Significance (2-
tailed) . .038 .001 .426 .773 .000
Df 0 390 390 390 390 390
SALES1 Correlation .105 1.000 -.040 .285 .791 .148
Significance (2-
tailed) .038 . .425 .000 .000 .003
Df 390 0 390 390 390 390
SALE2 Correlation -.168 -.040 1.000 -.091 .388 -.252
Significance (2-
tailed) .001 .425 . .072 .000 .000
Df 390 390 0 390 390 390
SALE3 Correlation .040 .285 -.091 1.000 .615 .133
Significance (2-
tailed) .426 .000 .072 . .000 .008
Df 390 390 390 0 390 390
OVER_SALE
S
Correlation .015 .791 .388 .615 1.000 .044
Significance (2-
tailed) .773 .000 .000 .000 . .386
Df 390 390 390 390 0 390
Years of
experience
Correlation .276 .148 -.252 .133 .044 1.000
Significance (2-
tailed) .000 .003 .000 .008 .386 .
Df 390 390 390 390 390 0
When
controlling for
firm age
Formal
strategic
planning
Correlation 1.000 .067 -.106 .004 .003 Significance (2-
tailed) . .183 .037 .940 .959
Df 0 389 389 389 389 SALES1 Correlation .067 1.000 -.003 .270 .794
Significance (2-
tailed) .183 . .949 .000 .000
Df 389 0 389 389 389 SALE2 Correlation -.106 -.003 1.000 -.060 .413
Significance (2-
tailed) .037 .949 . .237 .000

122
Df 389 389 0 389 389 SALE3 Correlation .004 .270 -.060 1.000 .615
Significance (2-
tailed) .940 .000 .237 . .000
Df 389 389 389 0 389 OVER_SALE
S
Correlation .003 .794 .413 .615 1.000 Significance (2-
tailed) .959 .000 .000 .000 .
Df 389 389 389 389 0 a. Cells contain zero-order (Pearson) correlations.
There are very weak correlations during the periods 2013 – 2014 and 2014 – 2015 under a no-
contingency factor scenario. When controlling for firm age, the period 2014 – 2015 exhibits a
very weak correlation. Longitudinal positions in both cases have no statistically significant
correlations both, (i) in the absence of a controlling variable and (ii) with firm age as the
contingency factor.
5.5 Testing the hypotheses
For statistical hypothesis testing, four distinct steps are taken which are outlined below (Shayib,
2013):
• Null or alternative hypothesis formulation
• Test statistic identification
• Test statistic value calculation for the sample of interest
• Based on the distribution of the test statistic, accept or reject null hypothesis, where the
null hypothesis is true
The above steps were followed for the following hypotheses:
H1a – There is no relationship between formal strategic planning and performance in the small
business sector, and
H1b – Small businesses that engage in formal strategic planning do not have superior
performance to non-planners
123
For hypothesis H1a, there is no statistically significant relationship between formal strategic
planning and performance (p<0.05) both in the new and established firm sectors as well as for
the entire survey sample (correlations computed in prior sections). This suggests that we reject
the null hypothesis at the 95% confidence interval.
For the second hypothesis H1b, there is no statistically significant difference in performance
between formal strategic planners and non-planners (see tables 5.4 and 5.6), implying that we
reject the null hypothesis at the 95% confidence interval.
5.6 Summary
This chapter has presented the quantitative findings and analysed same. The results are to be
further reviewed in the discussion chapter. Performance has been compared between formal
strategic planners and non-planners within the context of this study. Correlation analyses has
been addressed for both new and established firms. Hypotheses have accordingly been tested
as well. The next chapter presents and analyses qualitative findings.

124
Chapter 6: PRESENTATION AND ANALYSIS OF QUALITATIVE RESULTS
6.1 Introduction
This chapter presents the results of the qualitative interviews held after the questionnaire
survey. These semi-structured interviews were conducted with twelve new SME owner-
managers and twelve established SME owner-managers to gain a deeper understanding of the
formal strategic planning and performance relationship. This chapter is comprised of six
sections inclusive of the introduction (Section 6.1). Section 6.2 deliberates on the significance
of interviews in research, and Section 6.3 looks at the challenges that come with the interview
method. An explanation of the interview design is contained in Section 6.4, and Section 6.5
discusses the interview results while relating same to the topic of this thesis. At the tail end is
Section 6.6 which is a summary of this chapter.
6.2 Importance of interviews in research
The interview route is one of the most effective methods in qualitative research, more so where
the study is exploratory in nature (Yin, 2009). Three distinct characteristics set interviews apart
from the other research methods: interviews have flexibility in that they can be employed in
almost any research context, and they have an edge of unravelling in-depth information which
no other research method can effectively achieve (Yin, 2009).
Literature converges in presenting interviews as one of the strongest ammunition for the
researcher, some of the pros of interviews as a research method are given as (Creswell and
Clark (2011); Yin, 2009):
(1) they generally have a higher response rate than the other research methods,
(2) they have a flexibility that allows researchers to make use of them in a diversity of
conditions,

125
(3) they leave no room for respondents’ confusion as the researcher can clarify seemingly
unclear questions,
(4) they give the researcher full control of the conditions under which questions are posed and
responded to,
(5) they put the researcher and interviewee in a personal dialogue wherein deeper insights are
brought to light,
(6) they give room for the capturing of non-verbal communication,
(7) the respondent’s identity is clear and unquestionable to the researcher,
(8) in producing large amounts of data, interviews are a critical method,
(9) they enable instant or on-the-spot follow-up and elucidation, and
(10) the interviewer is at liberty to track and dig deeper into noteworthy matters that come up
in the interview.
Notwithstanding the strengths of interviews discussed, a number of disadvantages have been
levelled against the same as a research method. Saunders et al., (2009) observed the facts that
interviews are expensive and call for time commitment on the part of both the researcher and
respondents. Additionally it is noted that the interviewer’s personal bias can affect the outcome
of the interviews. It is however important to note that interviews come in various types and
forms, for particular uses. Belk, Fischer and Kozinets, (2013) highlight the range of qualitative
interview types as structured, semi-structured and unstructured. Structured interviews for
instance are engaged where the researcher has a set of predetermined questions which will be
adhered to (Belk et al., 2013; Yin, 2009).
For this study, the semi-structured interview type was employed as it allows the interviewer
scope for follow-up questions which might not be on the interview schedule. The semi-
structured interview type is also in line with the main thrust for adopting the interview approach
in this study, which was to form the second phase of the research (where the initial phase was
a questionnaire based survey) and therefore dig deeper into the planning practices of SMEs in
Zimbabwe and address the typically qualitative research objectives of the study. Silverman

126
(2011) and Saunders et al. (2009) observe that semi-structured interviews allow the researcher
to ask various types of questions which generate comparable information from one interviewee
to the next. Generality and flexibility in the questioning approach are the hallmarks of semi-
structured interviews, and one strength of the approach is that interviewees are more
forthcoming as they feel unrestrained (Creswell and Clark, 2011).
6.3 Challenges related to the quality of data
Obtaining primary research data through the semi-structured interview route appears to be the
most appropriate method to produce useful data needed for analysing SME planning practices.
In settling for this method, it is crucial to be cognisant of the challenges, particularly biases that
may surface in the data collection phase. Data quality issues such as these have a direct and
adverse impact on reliability and validity of the collected data. Interviewee and interviewer
bias come out as the major issues related to reliability of data collected via semi-structured
interviews. The use of misleading questions aimed at guiding the responses in a particular
direction in line with what the researcher wants, yields interviewer bias (Belk et al., 2013; Yin,
2009). When researchers turn a blind eye on interviewees’ responses while only concentrating
on data specifically applicable to their study, also results in interviewer bias, according to Yin
(2009) as well as Schutz, (1967). In like manner, researchers may interpret interview results in
a fashion skewed to their predetermined interests in the area of study. This is another form of
interviewer bias (Saunders et al., 2009).
Conversely, respondent bias comes about when interviewees pick certain attitudes towards
questions posed. Negative attitudes lead to less reliable responses while positive attitudes lead
to more reliable responses. Yin (2009) reveals that using the semi-structured interview method
means interviews are not homogenous and ultimately data reliability is compromised as a
repeat of the same research may yield different results on account of that non-standardisation.
The gist of the concept of validity is the questioning of whether research results are indeed
what they appear to be. Validity seeks to confirm if research variables have some correlation
(Saunders et al., 2009).

127
6.3.1 Handling qualitative research challenges
Data quality challenges come in different forms depending on the methods used for data
collection and analysis. A number of solutions picked from literature are employed in this
study to address reliability and validity.
6.3.2 Addressing reliability
A mixture of methods was implemented to address the interviewer bias, thereby ensuring
reliability of collected data. The interview comprised of different themes in line with the
research objectives. In doing this, the researcher circumvented using misleading questions, and
the interviewee was given the liberty to respond within the context of the applicable theme or
research objective. Further questions were aimed at following up on respondents’ answers but
still within the boundaries of the theme under discussion.
The researcher conducted interviews with an assistant researcher and both parties took down
notes as the interview progressed. Unclear responses were immediately followed upon within
the interview. At the end, both sets of notes were reconciled in coming up with one interview
record. This way, misinterpretation of interviewees’ responses was dodged. While the
electronic recording of interview proceedings was initially considered, it was ruled out because
respondents were sceptical about being recorded as they thought that confidentiality would be
compromised. Such feelings are not surprising in Zimbabwe as the country was heavily
polarised, particularly politically therefore respondents were understandably afraid of potential
victimisation.
Reliability of data concerns may also emerge out of the absence of a consistent instrument in
the use of semi-structured interviews. The interview schedule is a uniform document but follow
up questions to establish deeper insights on SME planning practices are not consistent, and
attempting to strike uniformity of such is tantamount to removing objectivity from the whole

128
interviewing process. The research would therefore be weakened. Be that as it may, the
researcher’s view is that the inclusion of further questions to establish key underlying facts was
within the broad context of the study hence it did not amount to compromise of data reliability.
Additionally, a pilot study of the interview was conducted to ensure that questions and themes
went under scrutiny thereby ruling out any misleading questions.
6.3.3 Addressing validity
Great importance was placed on ensuring that there was a common understanding between the
researcher and the respondents to make the data extracted from interviews pass the validity
test. To enhance validity of this study, after recording the interview results, the records were
taken back to the interviewees to check and confirm if their responses had been captured
correctly, and if they were representative of their personal opinions. A few minor corrections
were made to the records rendering them fully accepted by participants and therefore enhancing
validity.
6.4 Design of the interview
The interview was designed based on findings in the literature review, the contingency theory
and questions mainly revolved around the research objectives. To lend the requisite weight to
this study, and in view of the objectives of the research, only owner-managers were interviewed
in each SME. Such a group of respondents were found to be the ones best placed within SME
firms to answer questions on strategy and performance of their business entities as well as
factually comment on the determinants of strategy or contingent factors. The bulk of the
questions were mainly designed in such a fashion that they were open ended. This was a
deliberate ploy to allow respondents the freedom to express their thoughts unfettered. Before
going into the field, the draft interview schedule was initially reviewed and discussed with my
supervisor and with other academics in the university. Pilot interviews were also undertaken

129
following the former. The reviews revealed areas which needed to be revisited and this was
important in making the interview more robust.
6.4.1 The interview schedule
The interview schedule had a set of predetermined questions which the researcher had the
liberty to develop upon through pursuing any issues of interest in accordance with the situation
of the firm, thereby insightfully shedding light on seemingly grey areas. The schedule was used
by the researcher as a general guide for systematic management of the interviews. It is
important to note that the interviews came as a second phase of the research fieldwork after a
questionnaire based survey. The questionnaire based survey demarcated formal strategic
planners from non-planners through question number six thereon which reads as follows;
1. Place an X against statements from the following which are true about your organisation:
1. The organisation has no written strategic plan covering at least three years into the future
1
2. The organisation has a written strategic plan which: a) Has a vision and mission statement 2 b) Covers at least three years into the future 3 c) Includes the specification of objectives and goals 4 d) Includes the selection of long-range strategies 5 e) Includes the determination of the future resources required 6
Participants that placed an X on 1 were considered to be non-planners, while those that placed
the letter X on 2a to e were considered to be formal strategic planners. Planners and non-
planners were therefore picked randomly from the survey results, and this question was not
repeated as it is in the interviews as it had already been addressed in the questionnaire based
survey.
Noteworthy as well is the fact that the interview schedule, being a qualitative tool was meant
to address research questions that could not be quantitatively analysed thus highlighting one
strength of the mixed methods approach (Creswell and Clark, 2011), being that what one

130
method cannot accomplish can be executed through the other method (Tashakkori and Teddlie,
2009).
The interview schedule was divided into three parts as follows:
Part I comprised of organisation specific questions like sector, firm age, turnover and
employment figures. The questions are however mixed and not found in a single place because
there was need to maintain a comprehensive flow of questions.
Part II sought to address research questions numbers one and two, “How do small businesses
in Zimbabwe engage in formal strategic planning?”, and “What is the rationale for the other
types of planning used by small firms in Zimbabwe?” Five questions in the interview schedule
were asked about planning approaches used by Zimbabwean small businesses. Questionnaire
question number six afore-discussed also addressed this particular area. One question sought
to understand the planning process and its sophistication. The other question enquired about
any changes that were made to the plan before the end of the period. The third question
presented twenty generic tools of planning and enquired if respondents used same as well as
reasons for non-usage in such scenarios. The fourth question examined the rationale or
advantages of the other types of planning and the relevant procedures involved. For the outright
non-planners, the sixth question tried to get to the bottom of non-planning logic. A grasp of
such was supposed to enhance understanding of SME planning practices.
Part III looked at the factors that influence the strategy formulation process, and in this regard,
four questions were fielded. The first question dwelt on the economic environment. The second
question looked at the political environment. The third question was about competition
intensity and hostility. The fourth question discussed firm age.

131
6.4.2 Administration of the interviews
The interviews were administered in the following manner. Respondent owner-managers in
each of the twenty-four SMEs were briefed about the interview questions before hand. The
time, venue and approximate duration of the interview was agreed upon before the event. In
the interview, it was the researcher who posed the questions, at which point the respondent was
given the freedom to fully express their opinions. The average length of each interview was 58
minutes, with a minimum of 52 minutes and a maximum of 1 hour 40 minutes. Five interviews,
for instance lasted longer than 1 hour 36 minutes.
As explained in the prior section, the gist of the interview questions was to elicit responses that
revealed respondents’ grasp of the formal strategic planning and performance relationship in
their firms as well as the contingency factors involved. Where appropriate, further questions
were posed which sought to extract from respondents deeper insights on the subject. One of
the glaring advantages of flexibility in the interviewing process is the fact that some of the
respondents unearthed important issues which were insightful in understanding the strategy
performance relationship within the confines of the contingency theory of management.
6.5 Results of the interviews
Table 6.1: Arrangement of interviews
Type of firm
Longitudinal Performance level Planners Non-planners
Established (8 years or more)
Positive growth Interview nos. 001 - 003 Interview nos. 007 - 009
Negative growth Interview nos. 004 -006 Interview nos. 010 - 012
New (less than 8 years)
Positive growth Interview nos. 013 - 015 Interview nos. 019 - 021
Negative growth Interview nos. 016 - 018 Interview nos. 022 -024

132
A total of twenty four (24) interviews were held, and as reflected in the table above, twelve
were established firms (eight years or more in business) and the other twelve were new firms
(less than eight years in business). It is important to highlight that this study contains two
studies in one research project that is established firms and new firms. Initially the decision
had been to make the interviews thirty-two (four from each of the eight groups in Table 6.1
above) but after careful consideration, based especially on ‘saturation’ and the law of
‘diminishing returns’ (Ritchie et al., 2003; Creswell and Clark, 2011), they were scaled down
to twenty-four (three from each of the eight groups in the table above). Since interviews came
as the second phase of the research after the questionnaire based survey, interview respondents
were randomly picked from the survey but within positive growth/ negative growth in
performance groupings and falling either under new firms or established firms.
The question of how many interviews are sufficient has been discussed extensively in literature.
Creswell and Clark (2011, 209) hint that it is normal in qualitative research to study a few
individuals or few cases. There are other contributors who state approximate numbers like
Guest et al., (2006) who state twelve as a rough figure appropriate for qualitative interviews.
Several authors strike a consensus on the fact that there is no ‘definitive’ number as numbers
are dictated by the nature of the study (Mason, 2010; Miles and Huberman, 1994; Oppenheim,
1992). In this study, twelve respondents under established firms and twelve respondents under
new firms were deemed to be sufficient as that level ruled out saturation whilst being fully
representative of all the important constituents of the sample (that is planning and non-planning
established firms with positive growth in performance and those with negative growth in
performance, as well as new firms with the same characteristics).
The following sections provide summaries of the interview results for each SME, starting with
established firms (SMEs 001 to 012) and then new firms (SMEs 013 to 024). The use of
numbers for the SMEs is consistent with the requirement for confidentiality during and after
the research. As such interviewee names were not revealed.

133
6.5.1 SMEs 001, 002 and 003
Part 1
Table 6.2: Organisation specific aspects
Firm 001 Firm 002 Firm 003 Sector Construction Beverages
manufacturing Hair salon & beauty business
Firm age Established firm Established firm Established firm Turnover (2013-2016)
$149,000; $155,000; $151,000; $180,000
$66,741; $68,000; $72,970; $90,000
$22,000; $26,500; $31,000; $35,000
Employment(2013-2016)
20; 25; 25; 30 12; 15; 20; 20 10; 10; 12; 14
Turnover and employment figures for the three firms portray an upward trajectory, and the
main reason cited was a surge in business volumes. SMEs 001 and 003 stated thus:
I had to increase manpower to be abreast with the increasing demand for construction services.
Even if people are having economic hardships, they still want to appear presentable, therefore
our business will always have demand.
Part 2
Table 6.3: Planning approach utilised
Firm 001 planning approach: Prescriptive-emergent I plan 3 years ahead but I revise the plans yearly and also at any time depending on what has happened which can make me change my plans….sometimes policies just change and I have to adjust my plans to suit that. Every year we also revise our plans based on what will be happening that time. Firm 002 planning approach: Prescriptive-emergent We revise plans yearly and at any time when new laws or policies are announced. By doing so, we keep our business afloat, otherwise it can fall if we do not constantly revise our plans Firm 003 planning approach: Prescriptive-emergent We revise plans yearly but whenever there are new developments. We adjust our plans to fit the situation prevailing in the country at that time.

134
All the three firms are hybrid prescriptive-emergent planners, and their main reason for
adopting that type of planning is the flexibility to change plans in line with environmental
dictates.
Fig 6.1: Usage of planning tools
Firm 002 uses more tools of planning than the other two firms. There are however certain tools
of planning like Ansoff matrix, BCG matrix and VRIO analysis which are not used at all by all
the three firms.
0
0.2
0.4
0.6
0.8
1
1.2
Usage of planning tools by firms 001 to 003
Firm 001 Firm 002 Firm 003

135
Part 3
Table 6.4: Effect of the environment on business on a scale of 1 to 4, 4 being the highest
Firm 001: 4 Firm 001 responses: (1) The change of the economy affects our business. When inflation was very high and during the Zimbabwe dollar days, no one wanted to build because everyone wanted food first. (2) Politics affects my business because if the government changes, new laws and probably new currencies will be introduced and this will certainly affect my business. (3) There are a lot of construction companies but if we do a good job we survive on referral business. Firm 002: 4 Firm 002 responses: (1) Economic changes can put money in people’s pockets and sometimes they can take away money. If people don’t have money, our business suffers. (2) During the days of the Government of National Unity our business was flying but now it is successful but at a lower level than GNU days/ period. Yes, politics affects our business. (3) Competition affects every business but we strategise in such a way that we beat competition. Firm 003: 4 Firm 003 responses: (1) The economy affects our business because when the economy is good, business flourishes but when it is bad as it is now, business does not perform very well. (2) Changes in politics affect our business. From the GNU era, for instance as compared to now, our business has gone down. (3) Competition affects us but we try by all means to find solutions around competition.
All the three firms view the environment as a contingency factor in the strategy formulation
exercise.
Table 6.5: Association of planning and firm age
Firm 001: Yes: “….I now approach planning with maturity and for me to continue in business, it is maturity. Firm 002: Yes: “When I started business I didn’t know many competitors or the business. Now I am mature in the business and I plan as an experienced person. Firm 003: Yes: “With more years of operating my business I have acquired skills and technics in planning, which I did not have at the beginning.
Firms 001 to 003 all acknowledge that planning has an association with firm age.

136
6.5.2 SMEs 004, 005 and 006
Part 1
Table 6.6 Organisation specific aspects
Firm 004 Firm 005 Firm 006 Sector Retail of tailoring,
sewing & cutting & designing materials
Auto-mobile cleaning chemicals manufacturing
Construction
Firm age Established firm Established firm Established firm Turnover (2013-2016)
$71,900; $70,400; $72,500; $71,850
$9,000; $11,000; $7,000; $6,000
$75,000; $66,000; $60,000; $50,000
Employment(2013-2016)
10; 10; 10; 10 8; 11; 5; 3 30; 20; 20; 15
Turnover and employment figures for the three firms generally expose negative growth. The
firms were going through tough times as depicted by firms 004 and 005 who stated the
following:
Business has been going down almost every day. We are in fact running losses but hope that
tomorrow might be better.
My profits are nose-diving and I am almost reaching break-even point. Cash shortages in the
country had an effect to this negative growth according to Firm 005 respondent.
Part 2
Table 6.7: Planning approach utilised
Firm 004 planning approach: Prescriptive-emergent We revise our plans annually but we also do operational plans on almost a daily basis. Our plans are flexible because we can adjust any time depending on the situation. Firm 005 planning approach: Prescriptive-emergent We have a three year plan but we normally rely on the daily operational plans we do because they are more practical and close to reality. Firm 006 planning approach: Prescriptive-emergent As events unfold in the country, we just pick things that are affecting our plans and we accordingly adjust them. So there are no timeframes for such changes.

137
All the three firms are hybrid prescriptive-emergent planners. They adopt hybrid prescriptive-
emergent planning because they find it compatible with the reality on the ground and also for
the fact that it is agile.
Fig 6.2: Usage of planning tools
The three firms do not widely use the tools of planning. Firm 006 only uses three tools, firm
005, seven and firm 004 uses ten tools out of twenty tools.
00.20.40.60.8
11.2
Usage of planning tools by firms 004 to 006
Firm 004 Firm 005 Firm 006

138
Part 3
Table 6.8: Effect of the environment on business on a scale of 1 to 4, 4 being the highest
Firm 004: 4 Firm 004 responses: (1) Yes, economic policies affect us. We order materials from expensive suppliers and we are charged tariffs at the border which make our products expensive. (2) Different political regimes and periods bring different business environments. (3) Second hand clothes from outside the country are driving us out of business because material purchases have gone down over the years. Firm 005: 4 Firm 005 responses: (1) There is no cash in the country and I was not prepared for plastic money because we transacted in cash most of our sales. (2) The political gurus are the ones who are mismanaging funds, hence the economy has collapsed. Companies are closing down and even the policies they impose are too harsh for business. (3) There is high competition in this business. One has to be technical minded to win. . Firm 006: 4 Firm 006 responses: (1) People have no money and for the isolated projects we get, we have to brace ourselves for bad debts because payments are not forthcoming. (2) Political heavyweights are the ones dictating the direction of the economy through their policies, most of which cripple business. (3) Some competitors who are well connected tend to get more contracts with large organisations which pay well. The fittest only survive in this jungle.
All the three firms agree in viewing the environment as influencing business decisions and
therefore, planning.
Table 6.9: Association of planning and firm age
Firm 004: Yes: “….It’s easier now to plan than it was when I started the business. Experience is the best teacher, so they say. Firm 005: Yes: Firm 006: No
Whilst firms 004 and 005 acknowledge that planning and firm age have an association, firm
006 doesn’t.

139
6.5.3 SMEs 007, 008 and 009
Part 1
Table 6.10: Organisation specific aspects
Firm 007 Firm 008 Firm 009 Sector Retailing beauty
products Teaching services – pre-school
Manufacturing wax products
Firm age Established firm Established firm Established firm Turnover (2013-2016)
$15,500; $18,000; $25,000; $30,000
$79,800; $81,000; $85,000; $94,000
$59,000; $60,100; $60,900; $61,000
Employment(2013-2016)
6; 6; 6; 6 5; 5; 5; 5 8; 8; 8; 8
Turnover figures for the three firms depict positive growth over the years but employment
figures are constant for the three firms over the four year period. The three firms are selling
essential services and products which are on high demand, hence the positive growth trend in
turnover. Employment numbers remained constant because it was working well for the firms.
Part 2
Table 6.11: Planning approach utilised
Firm 007 planning approach: Prescriptive-emergent I do much of my planning monthly though I am a flexible planner. I constantly check for any critical areas that need adjustments any time. The environment in which we operate is very hostile and needs the type of planning I execute. No time intervals for any change – it’s very flexible. Firm 008 planning approach: Emergent In teaching, we cannot plan for three years. We do termly planning and break the plan into weekly objectives which are achievable. My type of planning is Ministry approved, even if you decide to go private, the planning doesn’t change. We cannot plan for three years because by then the pupils would be gone. Some changes just happen and need me to adjust my plans to suit the state of affairs. No time intervals but changes are done when the situation directs me to do so. Firm 009 planning approach: Emergent I know nothing about strategic planning. I do plan the way I can say is very traditional. I do not follow any laid down procedures. No specific time intervals. I just make some changes as and when necessary.

140
Whilst firm 007 is a prescriptive-emergent planner, the other two are emergent planners. Firm
009 lacks knowledge about strategic planning and therefore resorted to emergent planning
which was more practical for the firm.
Fig 6.3: Usage of planning tools
The firms use an average of fifteen planning tools each. Tools that remain unused across the
board include Ansoff matrix, BCG matrix, Scenario planning and VRIO analysis.
00.20.40.60.8
11.2
Usage of planning tools by firms 007 to 009
Firm 007 Firm 008 Firm 009

141
Part 3
Table 6.12: Effect of the environment on business on a scale of 1 to 4, 4 being the highest
Firm 007: 2 Firm 007 responses: (1) Whether the economy is bad or good, one has to be presentable always and has to part with his/her cash. We are not affected much by the economy. (2) During these days where there are a lot of political protests countrywide, every business closes and we will be home. This is the worst part of political unrest. It affects business. (3) I am lucky to have skilled workers who cannot be shaken by competitors. They are geared to face any challenges. Firm 008: 4 Firm 008 responses: (1) Despite the economy going down, most parents are preferring private teaching where they are assured of the best services – no strikes or non-performing employees. (2) As mentioned earlier there is an issue of tax imposed by the government. Its not yet being applied but when implemented will affect my business hence political environment affects my business. (3) There is high competition in this sector but the best way is to have foresight and always to give the best service quality. Firm 009: 4 Firm 009 responses: (1) Our business is sometimes affected positively and sometimes negatively. In my case, power cuts are boosting my business. (2) At some point there were politically motivated demonstrations country-wide and in the process people looted our products and it was difficult to recover from the loss. (3) Because this kind of business is easy and cheap to run, there is stiff competition.
All the three firms view the environment as a contingency factor in the strategy formulation
exercise. Firms 008 and 009 scored high while firm 007 scored 2. On a 1 to 4 scale, 2 is the
midpoint and therefore falls on the side of the other two firms.
Table 6.13: Association of planning and firm age
Firm 007: Yes: “….The more years I have been in business make it much easier for me to plan. Experience is the best teacher. Firm 008: Yes: “Age contributes a lot to my business. With experience and maturity, I tend to perfect my work extra-ordinarily. Firm 009: Yes: “Experience has given me the opportunity to look around for more customers and also market my products. Planning is easier now.
The three firms acknowledge that firm age has some association with planning.

142
6.5.4 SMEs 010, 011 and 012
Part 1
Table 6.14: Organisation specific aspects
Firm 010 Firm 011 Firm 012 Sector Manufacturing
cleaning detergents Manufacturing peanut butter and vaseline
Manufacturing uniforms, casualwear and babywear
Firm age Established firm Established firm Established firm Turnover (2013-2016)
$24,000; $21,000; $23,000; $16,000
$41,320; $40,700; $40,900; $39,000
$95,000; $70,000; $40,000; $20,000
Employment(2013-2016)
4; 8; 10; 7 11; 10; 10; 7 10; 6; 4; 3
The depicted scenario under turnover and employment figures for the three firms is one of
negative growth, albeit to various extents. Firm 010 cites the bad shape of the economy and
bad debts as playing a major part in its falling performance.
Part 2
Table 6.15: Planning approach utilised
Firm 010 planning approach: Emergent To me, it’s a thing of the past to plan for a long period. I plan monthly and keep revisiting my plans often to address any changes that may come up. Changes can be of very short notice before end of period. Rules and laws are constantly being changed and we should follow suit. This is so because the business environment is not conducive. Firm 011 planning approach: Emergent I used to plan monthly long back when the environment was conducive but now I do weekly or even daily planning though it’s strenuous. The economy caused this. If I do not do flexible planning it will be very difficult if anything changes overnight. I don’t advise on time intervals because I am governed in my planning by policy shifts done by those in power. Firm 012 planning approach: Emergent Daily planning is the order of my business. I do what needs to be done there and my planning system is very flexible. It’s easy to carry out and flexible in times of policy changes. No specific method is being followed but I am getting good results.
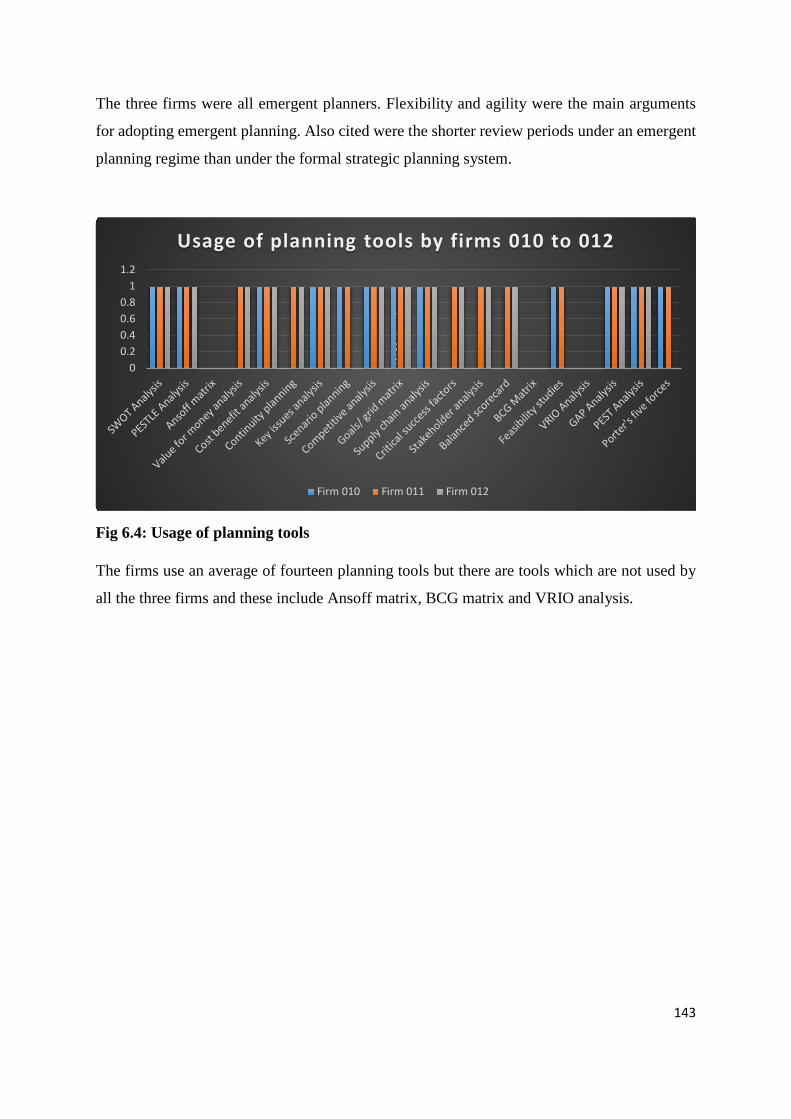
143
The three firms were all emergent planners. Flexibility and agility were the main arguments
for adopting emergent planning. Also cited were the shorter review periods under an emergent
planning regime than under the formal strategic planning system.
Fig 6.4: Usage of planning tools
The firms use an average of fourteen planning tools but there are tools which are not used by
all the three firms and these include Ansoff matrix, BCG matrix and VRIO analysis.
00.20.40.60.8
11.2
Usage of planning tools by firms 010 to 012
Firm 010 Firm 011 Firm 012

144
Part 3
Table 6.16: Effect of the environment on business on a scale of 1 to 4, 4 being the highest
Firm 010: 3.33 Firm 010 responses: (1) In 2015 and 2016, the government put tough measures for imports. I used to import my inputs from South Africa. High import costs affected my business. (2) Those in power can change policies and affect the flow of business. Rebate was reduced from $300 to $200 overnight and prohibition to import some items which adversely affected my business. (3) Competition is the order of the day but customers believe in quality. I try to provide quality products. Firm 011: 4 Firm 011 responses: (1) The Zimbabwean economy seems to be tottering on the brink of collapse. This has affected my business whose fortunes have gone down. Other businesses have also closed down. (2) There is a very bad habit of indulging in corruption by politicians. If they are found guilty, nothing is done to them. They are looting the resources available and this negatively affects business. (3) Most of my inputs are sourced locally but for those that I have to import, the duty is too high to sustain business. This affects product pricing and in trying to rationalise prices, we end up in losses. Firm 012: 3 Firm 012 responses: (1) Since the land reform programme, land was given to the people without inputs. No training on how to farm, hence the industry collapsed. There is no more commercial cotton growing as before. (2) Political giants imposed their methods of taking away land from the whites without agricultural knowledge. Fertiliser companies closed down and we now rely on imports. Suddenly they imposed import bans. (3) No more competition to talk about as we are all stuck on where to get materials. Those who are into illegal activities are the ones in business.
The three firms all view the environment as a contingency factor in the strategy formulation
exercise. The least score is three for firm 012 whilst the highest is four for firm 011.
Table 6.17: Association of planning and firm age
Firm 010: Yes: “….When I started I was afraid of players who had been there before me but now I am confident and am also feared by new and old players. Firm 011: Yes: “Yes, quite well, age does count in my planning……..experience is the best teacher. Firm 012: Yes: “….most of my approaches when planning are experience oriented.
The firms are in agreement that there is an association between planning and firm age.

145
6.5.5 SMEs 013, 014 and 015
Part 1
Table 6.18: Organisation specific aspects
Firm 013 Firm 014 Firm 015 Sector Hair and beauty
salon services Retailing timber Stationery, typing
and photocopying services
Firm age New firm Established firm Established firm Turnover (2013-2016)
$111,700; $113,400; $115,900; $116,000
$200,000; $215,000; $195,000; $220,000
$85,000; $87,000; $86,000; $90,000
Employment(2013-2016)
9; 10; 11; 11 34; 36; 30; 35 14; 14; 14; 14
Positive growth in performance is reflected by the three firms. In this regard firms 013 and 014
state:
We are doing pretty well in an economy that’s not looking that good.
We have been performing well hence the increase in employees over the years.
Part 2
Table 6.19: Planning approach utilised
Firm 013 planning approach: Prescriptive-emergent We normally do the three year plan for bankers to see but monthly planning is what we use and find very flexible. I constantly check for critical areas needing adjustments. I am operating in a very harsh and hostile environment and it needs the type of plans I am executing. No time intervals for any changes. Firm 014 planning approach: Prescriptive-emergent We just do three year plans as a rule but they don’t help us very much because things change. We usually use our day to day plans – they are more helpful. Firm 015 planning approach: Prescriptive-emergent We use monthly and daily plans which are not time consuming because it’s normally a budget and goals/ objectives for the period. Cheap also.

146
All the three firms are hybrid prescriptive-emergent planners, and they state that they only do
formal strategic planning for various reasons but what is useful for their operations are the
emergent plans.
Fig 6.5: Usage of planning tools
Tools like Ansoff matrix, Value for money analysis, Key issues analysis, Critical success
factors, Stakeholder analysis, Balanced scorecard, BCG matrix, and Porter’s five forces were
not used at all by the three firms. Each of the firms uses an average of nine planning tools. Lack
of knowledge of the planning tools is the main reason why there is underutilisation of the tools.
00.20.40.60.8
11.2
Usage of planning tools by firms 013 to 015
Firm 013 Firm 014 Firm 015

147
Part 3
Table 6.20: Effect of the environment on business on a scale of 1 to 4, 4 being the highest
Firm 013: 2.33 Firm 013 responses: (1) The economy does not affect us much because people want to look good whether in a bad or good economy. (2) Political and other protests are the order of the day, and business comes to a halt whether you like it or not. We are experiencing the worst political unrest. (3) Competition is there but it affects us positively because customers are coming to us in search of good services and quality products. Firm 014: 3.33 Firm 014 responses: (1) It seems this is some people’s right time to build. They are doing very challenging projects and we wonder where they get the money. (2) Politics does affect some businesses but in our case not much. Only when there is political unrest but most of the times we will be doing business well. (3) Competition is very healthy in any sector. Our prices and our approach to business is shaped by what others do. Firm 015: 4 Firm 015 responses: (1) Economic environment affects our business quite a lot. Like in Zimbabwe, most businesses lost their fortunes when the country changed from local currency to US dollars. (2) Politicians are the masterminds of everything. We dance according to their tunes for continuity of our business, and they can enforce laws at any time. (3) Yes, competition affects our business. Some competitors charge very little and we wonder if they put costs into consideration.
The firms have mixed positions regarding environmental factors that influence planning.
Because of the nature of their businesses, some firms do not find the economic environment
for instance as an influencer of planning. In general however the firms all view the environment
as a contingency factor in the strategy formulation exercise.
Table 6.21: Association of planning and firm age
Firm 013: Yes: “Yes, I am no longer an amateur in planning. Firm 014: Yes: “The way one plans matures with age. Firm 015: No: “I don’t see a relationship because planning is planning. If you know how to plan, you know it even from the start.
Save for firm 015 which doesn’t see an association, the other two firms acknowledge that there
is an association between planning and firm age.

148
6.5.6 SMEs 016, 017 and 018
Part 1
Table 6.22: Organisation specific aspects
Firm 016 Firm 017 Firm 018 Sector Retail – food
takeaway business Door & window frames manufacturing
Timber manufacturing
Firm age New firm New firm New firm Turnover (2013-2016)
$61,000; $54,000; $49,000; $42,000
$11,000; $12,300; $9,000; $7,000
$11,000; $13,000; $10,000; $7,000
Employment(2013-2016)
10; 10; 9; 7 6; 6; 4; 2 4; 2; 3; 2
A negative growth trend is shown by the turnover and employment figures for the three new
firms. The bad state of the economy is cited as causing the drop in performance. The firms are
facing losses and they cannot increase their workforces since they are not managing to meet
the salary bill. Firm 016 states:
…the number of employees is decreasing yearly because of losses experienced in my business.
Part 2
Table 6.23: Planning approach utilised
Firm 016 planning approach: Prescriptive-emergent We keep adjusting the three-year plan and also our monthly plans because a lot of changes happen and they need to be reflected in our plans. As policy announcements are done and as new competitors come on board etc., we find ourselves having to adjust our plans. Firm 017 planning approach: Prescriptive-emergent On top of the main three-year strategic plans, we also have monthly plans which have helped us since the collapse of our economy. As events happen on a daily basis they just tell you to change your plans. Firm 018 planning approach: Prescriptive-emergent We also have shorter term plans like monthly. All plans can be changed anytime when things happen that force us to change. The kind of economy in which I am surviving needs a very flexible way of planning to suit the environment. There are no specific time intervals but normally as and when there is such need.

149
All the three firms are hybrid prescriptive-emergent planners. The hybrid prescriptive-
emergent planning regime is resorted to as it suits the harsh economic environment in which
the firms find themselves.
Fig 6.6: Usage of planning tools
The above diagram shows a gross underutilisation of the planning tools. About nine tools of
planning are not used at all by the three firms. Lack usage is attributed to lack of knowledge of
the tools.
00.20.40.60.8
11.2
Usage of planning tools by firms 016 to 018
Firm 016 Firm 017 Firm 018

150
Part 3
Table 6.24: Effect of the environment on business on a scale of 1 to 4, 4 being the highest
Firm 016: 4 Firm 016 responses: (1) Economic policies like the ban of imports have created a parallel market with high prices. (2) Politics affects us but there is little we can do to change the political situation. We believe it’s a phase which will come to pass. Firm 017: 4 Firm 017 responses: (1) Economic challenges are making business very difficult – we have to strive to keep afloat, otherwise it’s easy to drown in this economy. (2) Those in power make good and bad decisions and we have to find a way of surviving even in the face of horrible decisions. (3) There is stiff competition in this sector. Some are sourcing cheaper raw materials from unknown sources while some import finished products. Firm 018: 4 Firm 018 responses: (1) When we switched to dollarization, we lost fortunes and we never got that money back. Now the economy is in bad shape. Recovery looks remote. (2) The ruling top brass impose very harsh and stringent policies, making it difficult for our businesses to survive. People in general also don’t have money in their pockets. (3) It’s now survival of the fittest. There is very stiff competition and it’s whom you know that determines the fortunes of your business.
All the three firms have high scores and collectively view the environment as a contingency
factor in the strategy formulation exercise.
Table 6.25: Association of planning and firm age
Firm 016: No: “I don’t see the relationship. Firm 017: Yes: “Admittedly, in the first year it’s difficult to plan but if you employ a good business consultant, he can do it for you and from there you can do it alone. Firm 018: No: “I am still to discover that relationship. So far, I don’t seem to see it.
Firms 016 and 018 do not see any association between planning and firm age. Firm 017
however does see an association.

151
6.5.7 SMEs 019, 020 and 021
Part 1
Table 6.26: Organisation specific aspects
Firm 019 Firm 020 Firm 021 Sector Wholesale for food
items Catering Manufacturing
agricultural chemicals
Firm age New firm New firm New firm Turnover (2013-2016)
$7,800; $9,200; $10,000; $12,000
$41,900; $43,900; $44,000; $44,500
$19,000; $25,000; $27,000; $30,000
Employment(2013-2016)
1; 1; 1; 1 9; 10; 10; 10 10; 11; 12; 12
Turnover and employment figures for the three firms reflect an upward trajectory. SMEs 019
and 020 say:
Even if the economy is bad, my business is stable and successful. When prices go up, I simply
pass it on to customers and they have no option but to take that.
When the economy is bad as it is, people work mainly for their stomachs first. Because of that,
our business is stable.
I shall keep ten employees for some time because we are managing to satisfy demand with the
ten workers.

152
Part 2
Table 6.27: Planning approach utilised
Firm 019 planning approach: Emergent I just jot down the tasks to be done the next day, and to diarise on the calendar what will happen in future. I understand my daily plans than the sophisticated plan for three years – that’s too far. Firm 020 planning approach: Emergent We plan almost every day for the following day – what needs to be purchased and the kind of dishes to be served. I am happy to plan that way because I am familiar with the method. Firm 021 planning approach: Outright non-planner We, the owners are not very educated to do planning and after all, we are not really performing poorly without the planning
SMEs 019 and 020 are emergent planners while SME 021 is an outright non-planner.
Familiarity with emergent planning is the rationale for using it and lack of education is cited
as the reason for pursuing outright non-planning.
Fig 6.7: Usage of planning tools
Only one tool, Competitive analysis, is used by SME 019. The firms state that they do not know
about the tools of planning, hence non-usage.
00.20.40.60.8
11.2
Usage of planning tools by firms 019 to 021
Firm 019 Firm 020 Firm 021

153
Part 3
Table 6.28: Effect of the environment on business on a scale of 1 to 4, 4 being the highest
Firm 019: 2 Firm 019 responses: (1) People always want to eat, no matter the economy is good or bad. (2) In this country, political protests are on the rise and every time there are protests, we have to close shop, otherwise our stocks will be looted. We have no control over this. (3) The effect of competition is insignificant because importation of groceries was banned therefore demand is too high to think about competition. Firm 020: 4 Firm 020 responses: (1) The economy affects my business but I try to adjust fast so that business does not suffer. (2) Politicians make decisions or actions that affect businesses. (3) Competition is high in this business but as long as you maintain high standards, you get repeat business from delighted customers. Firm 021: 4 Firm 021 responses: (1) The economic environment has affected me a lot. You can hardly plan for tomorrow because it’s very unpredictable. (2) Much of the suffering is coming from politics. From the land repossessions, my business has never been the same again. Also some leaders stay in power for too long causing innocent people to suffer. (3) It’s like the jungle where the fittest only flourish. The fittest are those that are well connected to the top guys up there.
All the three firms view the environment as having influence on business decisions.
Table 6.29: Association of planning and firm age
Firm 019: No: “….I cannot see the relationship. Firm 020: No: “I don’t see a relationship. Firm 021: No
The MSEs are agreed that they do not acknowledge an association between planning and firm
age.

154
6.5.8 SMEs 022, 023 and 024
Part 1
Table 6.30: Organisation specific aspects
Firm 022 Firm 023 Firm 024 Sector Wholesale of
grocery items Manufacturing soap & detergents
Construction
Firm age New firm New firm New firm Turnover (2013-2016)
$3,000; $3,010; $2,000; $890
$70,500; $51,000; $32,000; $32,000
$171,240; $184,000; $160,700; $155,000
Employment(2013-2016)
1; 1; 1; 1 40; 30; 10; 10 20; 20; 20; 20
There is an overall drop in performance right across the three SMEs. The SMEs are not making
profits at all as exposed by SME 023 which states:
….no profits are there to talk about. Things are bad.
I have come down from a force of forty workers to ten workers. We can only afford to pay ten
workers to remain afloat as a company.
Part 2
Table 6.31: Planning approach utilised
Firm 022 planning approach: Outright non-planner Things just used to work without much analysis of the business through plans. I did not see the value of planning. Firm 023 planning approach: Outright non-planner I do not plan simply because I don’t have knowledge about planning. Also I didn’t see it as something worthy to do. Because I have colleagues who plan and are doing well, I want to try it. I am to attend some planning workshops soon. Firm 024 planning approach: Emergent We can make changes to plans depending on what has happened. Changes are written as and when they become necessary – we have no set time frames to make changes. Our motto is to keep it simple, so we plan in point form, stating goals for the month, week or next day. Our type of planning is simple and manageable – I don’t have to go to college to learn how to do it.

155
SMEs 022 and 023 are outright non-planners who do not plan because they lack knowledge
about planning and also they used to operate smoothly and profitably without the planning.
SME 024 is an emergent planner and uses that planning regime because it is simple.
Fig 6.8: Usage of planning tools
Only one tool, Goals/ grid matrix, is used by SME 024. Lack of knowledge about the tools is
the main reason for non-usage. The other firms are outright non-planners hence they would not
use tools of planning because they do not engage in any form of planning.
00.20.40.60.8
11.2
Usage of planning tools by firms 022 to 024
Firm 022 Firm 023 Firm 024

156
Part 3
Table 6.32: Effect of the environment on business on a scale of 1 to 4, 4 being the highest
Firm 022: 4 Firm 022 responses: (1) The economy is down and business is also down. If the economy is to be revived, business is likely to improve also. (2) During the days of the Government of National Unity, we had good business but as soon as the politics changed, business has never been the same again. (3) Some large wholesalers sell stuff from South Africa and yet there is an import ban. Their prices are lower and this kills our businesses. Firm 023: 4 Firm 023 responses: (1) Right now I am unable to import raw materials which I used to import way back because of the import ban imposed by government. Adverse climatic conditions have affected the agricultural sector so cooking oil production is low. (2) Politicians know better why they impose harsh policies. We are now surviving under years of bad policies and also bad politics. (3) Most business people in this industry are resorting to informal ways of bringing in raw materials. Some of us are scared of smuggling so they are making progress whilst we are not. Firm 024: 4 Firm 024 responses: (1) Because of the economic hardships, most of our clients do not have money in their pockets. Bad debts are disturbing our operations. (2) Political figures come with their own policies, which can adversely affect our businesses in the process. Import of building materials was banned, pushing up local prices. (3) There is high competition – there are too many construction companies and most of them charge too low prices and they drive us out of business.
The firms all agree that the environment affects business decisions. They all score fours, which
is the highest on the scale.
Table 6.33: Association of planning and firm age
Firm 022: Does not know. Firm 023: No response, no comment. Firm 024: No: “We have always kept our plans simple
Firms 022 and 023 understandably did not comment relating to planning and firm age as they
do not plan at all. SME 024 does not see any association between planning and firm age. Firms
001 to 003 all view firm age as a contingency factor in planning.

157
6.6 Cross case analysis
The qualitative research aimed especially to focus on areas which the quantitative analysis
could not address, thereby leveraging on the mixed methods approach. The how and what
questions of the study were especially tackled. The following data bars and pie charts provide
statistics of the interviewed firms by industrial sector.
Fig 6.9: Interviewed established firms by industrial sector
Fig 6.10: Established firms interviewed
Industry Established firmsConstruction 2Manufacturing 6Services 2Retail 2
2
6
2
2
Established firms interviewed
Construction Manufacturing Services Retail

158
Fig 6.11: Interviewed new firms by industrial sector
Fig 6.12: Interviewed new firms
There is no big difference between new and established firms as regards composition of the
firms interviewed. While four industrial sectors were represented under established firms (i.e.
construction, manufacturing, services, and retail), five industrial sectors were represented
under new firms (i.e. construction, manufacturing, services, retail, and wholesale). An
approach that would equate the industrial sectors covered between new firms and established
firms would have been ideal but the hindrance was the fact that some would-be interviewee
firms declined to be involved in the interviews. It became important, in the circumstances, to
pick willing firms for the interviews. It is the researcher’s view that the slight difference in
industrial sectors does not materially affect the findings.
Industry New firmsConstruction 1Manufacturing 4Services 3Retail 2Wholesale 2

159
6.6.2 Arrangement of interviewed firms by planning type
Table 6.34: Interviewed firms by planning type
Firm type New firms (12) Established firms (12)
Entire 24 firms
Formal strategic planners
6 (50%) 6 (50%) 12 (50%)
Informal planners 3 (25%) 6 (50%) 9 (37.5%)
Outright non-planners 3 (25%) - (0%) 3 (12.5%)
Emergent planners 9 (75%) 12 (100%) 21 (87.5%)
Fig 6.13: Interviewed firms by planning type
In terms of firms that engaged in formal strategic planning, there was an equal quantum of
firms from the new and established sectors, being six firms each. Formal strategic planners
were those firms that had a written strategic plan which:
a) Had a vision and mission statement,
b) Covered at least three years into the future,
c) Included the specification of objectives and goals,

160
d) Included the selection of long-range strategies, and
e) Included the determination of the future resources required
It is important to state that formal strategic planners were identified at questionnaire survey
level, before the interviews. In line with the literature reviewed, these firms can also be termed
prescriptive planners.
While established firms had six informal planners, new firms had three informal planners.
These firms were involved in planning other than formal strategic planning. There was a third
group of firms under new firms, which is styled ‘outright non-planners’. As the name suggests,
these are firms that carried out no planning at all. Bhide, (2007) is among a group of researchers
who question the efficacy of planning in small firms, citing that planning takes managers’ time
which could be useful in supporting their fledgling enterprises. Such firms that use intuitive
approaches find backing in literature. Three firms from this group fell under new firms. This
class of firms did not feature under established firms. A further group of firms that altered their
plans before the end of the period is represented in the diagrams above. Noteworthy is the fact
that all formal strategic planners and informal planners fell under this group of planners using
the emergent approach to planning. From the foregoing analysis, it becomes clear that all
formal strategic planners interviewed employed the hybrid prescriptive-emergent planning
approach as posited in literature (Donaldson, 2001).
6.6.3 Usage of the tools of planning
The interviews also sought to get an understanding on the utilisation of the generic tools of
planning. A total of twenty tools of planning were enquired upon, and these included SWOT
analysis; PESTLE/PESTEL analysis; Ansoff matrix; Value for money analysis; Cost benefit
analysis; Continuity planning; Key issues analysis; Scenario planning; Competitive analysis;
Goals/grid matrix; Supply chain analysis; Critical success factors; Stakeholder analysis;
Balanced scorecard; BCG matrix; Feasibility studies; VRIO analysis; GAP analysis; PEST
analysis; and Porter’s five forces

161
Fig 6.14: Planning tools’ extent of usage
The diagram above shows that the tools mostly used by firms are Goals grid matrix,
Competitive analysis, SWOT analysis, PEST analysis, and GAP analysis. Conversely, the tools
that had zero utilisation included VRIO analysis, BCG matrix, and the Ansoff matrix. Amongst
the least utilised tools featured the Balanced scorecard, Scenario planning, Porter’s five forces,
Stakeholder analysis and Critical success factors.
6.6.4 The other types of planning used by firms
Plans falling under this category were by and large informal and had various implementation
periods below three years. Typically, the firms planned annually, monthly, weekly and daily.
No clear demarcation line could be drawn between new firms and established firms on this area
as the trend was almost the same for all informal planners. Four major categories in terms of
planning timeframes were identified and these are represented in the table 6.2 below. Daily
planners have the highest frequency, followed by monthly planners, anytime planners and
weekly planners respectively. The planning timeframes are mainly dictated by the

162
unpredictable nature of the operating environment and the bad state of the economy. Other
reasons however included user-friendliness, flexibility and practicality of methods, easy to
adjust, and less time consuming among others. Out of the 24 interviewee owner-managers, 19
said something to do with economic hardships or instability. Such participant responses bear
testimony to the fact that the economy is unstable and unpredictable in line with some prior
literature advancing the same fact (Chagonda, 2012).
Table 6.35: Interviewee firms’ planning timeframes
Planning Timeframe Frequency
Anytime 5
Daily 9
Weekly 1
Monthly 6
Zero (Outright non-planners) 3
TOTAL 24
Interview question number seven (b) sought clarity on the rationale for using the informal
planning route. Reasons given by respondent owner managers for adopting informal planning
approaches were mixed but revolved around six main categories which are:
a) Unpredictable / unstable nature of the economy
b) Simplicity and therefore less costly,
c) Shorter implementation and review periods,
d) Familiarity,
e) Flexibility,
f) No expertise to carry out formal strategic planning

163
6.6.5 Environmental volatility as a contingency factor
Three Likert-type questions were posed in the interviews regarding environmental hostility.
The questions, developed from participants’ responses in the questionnaire survey, covered the
economic, political and competitive environments, and they sought respondents’ views on the
extent to which their businesses and planning were affected by the factors. A scale of 1 to 4
was applied, where 1 was no, 2 was low, 3 was medium and 4 was high. After summing up the
scores and averaging them, the following scores were obtained:
Table : 6.36: Environmental hostility as a contingency factor
Factors New firm scores Established firm
scores
Overall scores
Economic
environment
3.42 3.5 3.46
Political
environment
3.92 4 3.96
Competitive
environment
3.6 3.25 3.42
Environmental
hostility
3.65 3.58 3.6
The fourth row code named “environmental hostility” bears averages for the three top rows.
The average figures, if rounded up to the nearest whole number, will give 4. From the scale, 4
means high, implying that environmental hostility as a contingency factor affects the
interviewed firms in a strong way.

164
6.6.5.1 Correlations for the interviewed firms
Despite the small sample size of interviewed firms (twenty four), correlations were carried out
particularly with the intention to control for environmental hostility as a contingency factor.
Environmental hostility could not be considered as a contingency factor under the
questionnaire survey as the survey, inter alia, sought to establish the environmental factors
leading to environmental hostility. It was therefore only logical for the correlation analysis
involving environmental hostility to be undertaken under the interview phase. While
methodology literature advises that quantitative research calls for big samples of at least eighty
members (Creswell and Clark, 2011), some portions of literature state that thirty can be
considered as the minimum quantitative sample size (Osborne, 2012), and yet still some
sections of literature state that there are no absolute minimums (Kim, 2005). Kim (2005)
hastens to hint that what is most important with small samples is for the sample size to represent
the characteristics or behaviour of the larger population. In consistency with literature
guidelines, it is important to explain the sampling strategy and provide reasons for the small
sample.
In that respect it is imperative to state that the sample of 24 commenced at 32 (being sixteen
from the new and sixteen from the established firm sectors), of which it would meet the
minimum sample size requirement as posited in literature (Osborne, 2012). It had to be scaled
down from thirty two to twenty four following the setting in of saturation. The twenty four
sample size is representative of new planners and new non-planners as well as established
planners and established non-planners. The sample also is representative of good and poor
performers in each of the named categories. Eight categories, as shown on the conceptual
framework, with three members from each category give a total of twenty four sample
members.
While the correlation computations done earlier were specifically for either new or established
firms and also for the entire sample, the current correlations have been done on the entire
interviews sample of twenty four mainly because of the small sample which could not be split

165
further into new and established firms. Results give an idea on the relationship between formal
strategic planning and performance contingent on environmental hostility.
Since the questionnaire touched on one of the contingency factors, which is newness of firm,
the interviews had to handle the other contingency factor, being environmental hostility partly
to meet the triangulation approach of this study while also ensuring that both contingency
factors are included in correlation computations. Question number six on the interview
schedule covered this aspect and read as follows:
On a scale of 1 to 4, 1 being no; 2- low; 3- medium, and 4 - high, please respond to the
following:
6a) Changes in the economic environment affect our business......., and give reasons for saying
so........................................
6b) Changes in the political environment affect our business..........., and provide reasons for
your answer ...........................
6c) Competition intensity and hostility affect our business .............., and give reasons for your
answer ...........................

166
Table 6.37: Simple Correlations between Formal Strategic Planning and Performance:
The above correlation output table is based on the computation of the Pearson correlation
coefficient to examine the relationship between formal strategic planning, and performance in
Interviewed firms
Interviewed firms
Pearson Correlation 1
Sig. (2-tailed)
N 24
EmplGrowth2014
Pearson Correlation -.039
Sig. (2-tailed) .858
N 24
EmplGrowth2015
Pearson Correlation .109
Sig. (2-tailed) .612
N 24
EmplGrowth2016
Pearson Correlation -.074
Sig. (2-tailed) .733
N 24
SalesGrowth2014
Pearson Correlation .146
Sig. (2-tailed) .498
N 24
SalesGrowth2015
Pearson Correlation -.072
Sig. (2-tailed) .740
N 24
SalesGrowth2016
Pearson Correlation .111
Sig. (2-tailed) .604
N 24

167
terms of both sales and employment growth. In this study we adopt the framework provided
by Shayib (2013, p. 237) and Cohen (1988), which is as given below: -
r= 0.00 to 0.09 or r= 0.00 to - 0.09 no correlation
r= 0.10 to 0.29 or r= - 0.10 to - 0.29 very weak or small correlation
r= 0.30 to 0.49 or r-= -0.30 to - 0.49 medium correlation
r = 0.50 to 1.0 or r = - 0.50 to - 1.0 large or strong correlation
The output table shows that none among the six correlations were statistically significant. The
results show that there is no statistically significant correlation between formal strategic
planning and the two measures of performance, being turnover and employment growth.

168
Table 6.38: Correlations between formal strategic planning and performance contingent
on environmental hostility
The above correlation output table is based on the computation of the Pearson correlation
coefficient to examine the relationship between formal strategic planning and performance in
terms of turnover and employment growth contingent on environmental hostility. The results
show that there is no statistically significant correlation between formal strategic planning and
performance in terms of turnover and employment growth, contingent on environmental
hostility.
Control Variables Interviewed firms
Environmental hostility
Interviewed firms Correlation 1.000
Significance (2-tailed) .
Df 0
EmplGrowth2014 Correlation -.009
Significance (2-tailed) .969
Df 24
EmplGrowth2015 Correlation .131
Significance (2-tailed) .571
Df 24
EmplGrowth2016 Correlation -.269
Significance (2-tailed) .239
Df 24
SalesGrowth2014 Correlation .049
Significance (2-tailed) .832
Df 24
SalesGrowth2015 Correlation -.038
Significance (2-tailed) .869
Df 24
SalesGrowth2016 Correlation -.008
Significance (2-tailed) .972
Df 24

169
Table 6.39: Longitudinal Correlations without controlling for contingency factors
The above table shows longitudinal correlations between formal strategic planning and
performance in terms of turnover and employment growth without a contingency factor. There
is no statistically significant correlation between formal strategic planning and performance
over the three periods from 2013 to 2016.
Table 6.40: Longitudinal correlations with environmental hostility as contingency factor
Table 6.8 above shows longitudinal correlations between formal strategic planning and
performance in terms of turnover and employment growth contingent on environmental
Interviewed
firms
Interviewed firms Pearson Correlation 1
Sig. (2-tailed)
N 24
EmplGrowthLongt Pearson Correlation -.002
Sig. (2-tailed) .992
N 24
SalesGrowthLongt Pearson Correlation -.016
Sig. (2-tailed) .939
N 24
Control Variables Interviewed firms
Environmental hostility
Interviewed firms
Correlation 1.000 Significance (2-tailed) . df 0
EmplGrowthLongt
Correlation -.023 Significance (2-tailed) .920 df 24
SalesGrowthLongt
Correlation -.049 Significance (2-tailed) .832 df 24

170
hostility. The results show that there was no statistically significant correlation between formal
strategic planning and performance in longitudinal terms.
6.6.6 Economic instability
Throughout the interviews, the theme of economic instability in Zimbabwe was echoed. Out
of the twenty four interviewee owner managers, nineteen mentioned something to do with the
poor state of the economy, or its instability. Findings in literature on the economy of Zimbabwe
find backing from the views of the SME fraternity in the country. Almost every respondent
bemoaned the economic malaise in which Zimbabwean SMEs find themselves. Question
numbers 2, 4 and 15 in the interviews held gave respondents ample opportunity to comment
on the state of the economy in Zimbabwe. Whether respondents were going through good times
or rough patches, both groups of respondents still mentioned the poor and unstable state of the
economy. Such views from respondent owner managers coupled with findings from the
literature review provide this study a solid basis upon which to label the economy of Zimbabwe
unstable.
6.6.7 Corruption
Of late, there has been a proliferation of literature on the subject of corruption centring on
Zimbabwe (Jone, 2010; Chagonda, 2012). A number of interview respondents spoke about this
theme as they responded to various questions. The theme came up as under hand deals or
favours exercised on particular persons by those in positions of authority thereby rendering the
playground unlevelled or tilted in favour of the corrupt. For instance where import bans had
been announced, imported items continued to find their way through the borders and in a way
enriching particular sections of the small business community at the expense of the rest. Some
of the responses by interviewee owner managers, which have corruption connotations include
the following: -
“…we are all stuck on where to get materials. Those who are into illegal activities are the ones
in business”.

171
The implication of the above statement is that those businesses being run strictly on ethical
principles are most likely to register sub-optimal performance but those involved in some law-
breaching activities have a higher propensity to perform above par. Another participant stated
the following:
“It is like a jungle where only the fittest flourish. The fittest are those that are well connected
to the top guys up there”.
It would appear from the above that linking one’s business to an influential figure in some high
offices tends to open avenues of organisational success. Probed further, the respondent revealed
that establishing the connection was pricey as one had to avail a pecuniary or other form of
favour to the top officers. Chagonda (2012) is supportive of this stance when he states, “…as
the culture of surviving through means that were not straight appeared to have taken root in the
country”. The other participant had the following to say:
“Some large wholesalers sell stuff from South Africa and yet there is an import ban. Their
prices are lower and this kills our businesses”.
The afore-given statement points to an uneven playing ground where policies or laws appear
to be applied selectively to some while others remained ‘immune’ to the same. Underhand
deals appeared to ‘sanctify’ others as ‘immune’ to the law while those without the capacity or
appetite for the deals find themselves under the full wrath of the import bans, resulting in sub-
optimal performance of their business entities.

172
6.6.8 Knowledge of planning
A number of interviewees mentioned the point that they were not well schooled or learned to
be able to meet the requisite planning knowledge. Some of the reasons advanced for non-usage
of formal strategic planning include the following:
“It is easy to carry out and less time-consuming for someone like me who is not much schooled,
it's very workable”.
“We, the owners, are not very educated to do planning and after all, we are not really
performing poorly without the planning”.
The above statement is indicative of the fact that there is a group of non-planners who are
comfortable with non-planning as long as they perform well. They only start to doubt non-
planning when they register poor performance. The guiding logic for their non-planning stance
is lack of education. On the other hand the former statement portrays informal planners who
avoid formal strategic planning as they find it time-consuming and too laborious to be carried
out by unschooled people. They rather find informal planning simple and therefore convenient
for them.
Under the tools of planning, there are a number of respondents that stated that they did not
know certain tools of planning. Typical responses were framed as follows: -
“I don't know about this one” or “We do not use this type of planning”
Responses given above appear, in the main, to reveal lack of knowledge about the tools of
planning, and the latter response exudes an attitude of reluctance to use the tools.

173
Respondent 002 was found to know the tools of planning but his body language communicated
the fact that he ignored using the tools as he found his firm’s operations too simplistic to
warrant the use of strategic planning tools and techniques.
6.6.9 Gross turnover as a performance measure
An analysis of the turnover figures given against total manpower gives an average maximum
annual salary of $5,864.73, yielding an average monthly salary of $488.00. In 2014, firm 005
has an annual salary of $1,000.00, culminating in a monthly salary of $83.00. The same firm
in 2015 had an average annual salary of $1400, giving a monthly salary of $116.00. The figures
are too low to be believable, and it would appear that there was an element of information
asymmetry at play where respondent owner managers concealed their actual turnover figures
for reasons best known to them. Infact SMEs have been known to prepare different sets of
accounts for different stakeholders (Gibson and Casser, 2005; Brinckmann et al, 2010). For
instance the taxman, the banker, the potential investor, the researcher and so on, are given
different sets of accounts. Whilst the point is true, the researcher recognised that even though
figures may be deceptive, ultimately they give us rough guidance on the general trend of
income.
6.7 Summary
The interviews with the twenty four SMEs from different sectors and of different sizes
succeeded in extracting information on the planning practices of SMEs in Zimbabwe. The
interviews also succeeded in providing a rich background for the establishment of the rationale
for the other types of planning used by SMEs, as well as obtaining information for use in
reflecting on the contingency theory of management within the domain of planning. Reflection
and deeper analysis of interview findings in light of some of the findings of the literature review
was also enabled by the interviews. Environmental volatility and firm age were found to be
important determinants of strategy. Interviews also proved helpful in raising new themes that

174
the study has incorporated in the analysis. The presentation and analysis of data done in this
chapter now lead to a broader and holistic discussion on findings in the next chapter.

175
Chapter 7: DISCUSSION
7.1 Introduction
Chapter six has presented and analysed the interview and qualitative results of the study. This
chapter delivers a broad discussion of the study findings with regard to prior literature and in
accordance with research questions, hypotheses and expected results. The chapter is divided
into ten sections. The next section, Section 7.2, outlines the planning practices of SMEs in
Zimbabwe. Section 7.3 explains the rationale behind the other types of planning used by small
firms in Zimbabwe. Section 7.4 discusses the performance comparison between planners and
non-planners, while section 7.5 looks at the relationship between formal strategic planning and
performance in small firms. The next section, section 7.6 discusses the contingency approach
and how it can be applied for optimal small firm performance. Sections 7.7, 7.8 and 7.9 discuss
future research considerations, implications for practitioners and implications for policy-
makers respectively. At the end is section 7.10, which is the conclusion.
This study examined five research questions and two hypotheses, which are outlined below:
1. How do small firms in Zimbabwe engage in formal strategic planning?
2. What is the rationale for the other types of planning used by small firms in Zimbabwe
3. Is there a sustained performance difference between planners and non-planners?
4. To what degree is there a relationship between formal strategic planning and performance in
new (less than eight years in operation) and established (eight years or more in operation) small
firms?
5. How can the contingency approach be best applied for optimal small firm performance?
Alternative hypotheses tested for this study were as follows:
H1a – There is no relationship between formal strategic planning and performance in the small
business sector, and

176
H1b – Small businesses that engage in formal strategic planning do not have superior
performance to non-planners
7.2. Planning practices of SMEs in Zimbabwe
This study reveals four firm types in Zimbabwe, which are formal strategic planners (grouped
under prescriptive planners), informal planners, firms that alter their plans before end of period
(analogous to emergent planners), outright non-planners (firms that do not engage in any form
of planning) and hybrid prescriptive-emergent planners. Formal strategic planners in this study
were distinguished through question number 6 in the survey questionnaire, which outlined their
combined characteristics as: Having a strategic plan which, a) has a vision and mission
statement, b) covers at least three years into the future, c) includes the specification of
objectives and goals, d) includes the selection of long-range strategies, and e) includes the
determination of the future resources required.
Out of the survey sample of 392 firms, eighty-six (86) were formal strategic planners. This
constitutes 21.9% of the entire sample. Further analysis revealed that 219 firms (55.9%) were
informal planners, while 87 firms (22.2%) were outright non-planners. Results from a holistic
analysis of the sample suggested that 271 firms (69.1%) were emergent planners. All informal
planners (100%) were emergent planners while 52 formal strategic planners (60.5%) were
emergent planners as well. The following table captures these figures more precisely.

177
Table 7.1: Survey participant firms by planning type
Firm type Entire survey
sample
New firms Established firms
Formal strategic planners 34 (8.6%) 20 (10.4%) 14 (7%)
Outright non-planners 87 (22.2%) 60 (31.3%) 27 (13.5%)
Emergent planners 219 (55.9%) 82 (42.7%) 137 (68.5%)
Hybrid Prescriptive-
Emergent planners
52 (13.3%) 30 (15.6%) 22 (11%)
Totals 392 192 200
The small number of formal strategic planners in the survey sample (21.9%) and the substantial
quantum of emergent planners (69.1%) confirm literature findings. According to Boyd et al.,
(2012), it is quite difficult to program and specify strategy ahead of time in volatile,
unpredictable environments. As such, utilisation of formal strategic planning is more akin to
stable, benign or predictable environments. Zimbabwe is representative of a volatile
environment and the foregoing statements justify the small quantum of formal strategic or
prescriptive planners. Stonehouse and Pemberton (2002) observe that informal or emergent
planning is more popular in unstable and unpredictable environments. According to
Brinckmann et al., (2010), ‘planning in new and established small firms is oftentimes informal,
unstructured, and irregular leading to no written outcome.’
An interesting revelation from this study is the existence of firms that do not plan at all. In this
day and age, one would expect firms to carry out some form of basic planning but evidence
from this study refutes that line of reasoning. The finding is consistent with the reasoning of
some critics in the entrepreneurship field that genuinely have reservations whether planning is
really a useful pursuit (Bhide, 2007; Beaver, 2007; Honig, 2008). Arguably, these firms might
fall under those that use intuitive processes as discussed by Brinckmann et al., (2010). The

178
picture depicted above from survey results is not too distant from that yielded in the interviews
conducted. Interview results in terms of the spread of the different types of planners are as
given below:-
Table 7.2: Interview participant firms by planning type
Firm type New firms (12) Established firms
(12)
Entire 24 firms
Formal strategic
planners
6 (50%) 6 (50%) 12 (50%)
Emergent planners 3 (25%) 6 (50%) 9 (37.5%)
Outright non-planners 3 (25%) - (0%) 3 (12.5%)
Hybrid Prescriptive-
Emergent planners
9 (75%) 12 (100%) 21 (87.5%)

179
Key: FSP - Formal strategic planners
INFP - Informal planners
ONP - Outright non-planners
PSCBEP – Emergent planners
Fig 7.1: Interviewee firms by planning type
There is a significantly large number of firms that alter their plans before the end of the period
(termed emergent planners). Out of the interviewed 24 firms, 21 firms (87.5%) are emergent
planners. Further analysis provided evidence that all formal strategic planners were emergent
planners. There is a synchrony with Stonehouse and Pemberton (2002) who reveal the
significance of the descriptive or emergent approach whilst simultaneously cautioning against
a complete side-lining of the prescriptive approach. In this context therefore, prescriptive and
emergent planning approaches are taken as complementary and not as mutually exclusive. The
hostile environment in which the firms operate appeared to push them to adopt the emergent
approach mainly for firm survival. Production and use of formal strategic plans is more akin to
0
5
10
15
20
FSPINFP
ONPPSCBEP
FSP, 12
INFP, 9
ONP, 3
EMERGENT, 19
Interviewee firms by planning type

180
stable environments (Boyd et al., 2012; Brinckmann et al, 2010). Stonehouse and Pemberton
also observed that the prescriptive approach with its long term, systematised and deterministic
thrust thrives in fairly stable and predictable founding environments.
An unstable environment, such as the Zimbabwean scenario, has got rapid changes which call
for constant reviews of strategic plans to maintain their relevance. Unstable environments
therefore normally yield the production of flexible, emergent plans for optimum performance
(Mintzberg, 1979, Mintzberg and Waters, 1985; Boyd et al., 2012). Verreynne and Meyer
(2010) are agreeable and state that small firms make strategy using approaches most suitable
to their peculiar situations. It is important for organisations to resonate with environmental
changes to avoid under performance and failure. This generally explains why the study has a
high incidence of emergent planners as opposed to prescriptive planners. Confirming the
foregoing discussion, responses given by interviewed owner managers typically revolved
around the following comment made by respondent firm number 16, which reads as follows:
“We keep adjusting the 3 year plan and also our monthly plans because a lot of changes happen
and they need to be reflected in our plans.”
Adoption of the emergent planning approach by a higher percentage of survey and interview
participants in the unstable Zimbabwean economy echoes Ansoff’s (1994) statement, “….in
today’s environment there are “horses for courses”, different environmental challenges require
different strategic responses and, as a consequence, different planning approaches’. This
confirms Mintzberg’s (1994) statement that, ‘The process of strategy making must be loosened
up and not get set in concrete through arbitrary formalisation. The widespread utilisation of
emergent planning approaches by Zimbabwean SMEs is significantly reflective of the
environmental complexity the firms find themselves in. According to Ansoff, however, the
featuring of formal strategic planning is a departure from his postulation that ‘the original
version of strategic planning is ‘no longer with us’ as it has been metamorphosed into various
planning regimes that respond to environmental challenges – generally termed emergent
approaches’. Results of this study challenge Ansoff’s ‘extremist’ (emergent planning only)
approach in that different planning regimes are unveiled. Such an outcome is more in line with

181
the softer approach adopted by some authors including Stonehouse and Pemberton (2002) who
argue against a complete side-lining of the prescriptive approach.
Findings reveal that among the formal strategic planners and informal planners interviewed,
most of them use tools of planning, albeit to varying extents. In light of the themes extracted
from NVivo, then quantified, it emerged that not all the studied tools of planning were being
used by the interviewees. The major ones that had the highest recurrence rate of usage were
Goals Grid Matrix, PEST analysis, GAP analysis, feasibility analysis, competitive analysis,
SWOT analysis, supply chain analysis, continuity planning as well as cost-benefit analysis. It
is evident that there is a commonality running through the aforestated planning tools, being
that virtually all relate to industry and market competition analysis (Demont, 2017; Khan et al.,
2015).
On the other hand, feasibility studies, supply chain analysis, continuity planning as well as
cost-benefit analysis all tended to reflect aspects of contingency planning, mainly to keep
businesses afloat or simply for survival. The mention of a difficult and unconducive business
environment ran across almost the entire spectrum of interviewees, lending support to the use
of contingency planning. In this context, the gross utilisation of survival strategies by
respondent firms was not a misplaced phenomenon. It would, nonetheless, appear that the
dearth of the use of strategic planning tools like the BCG matrix, Balanced scorecard, critical
success factors, and, inter alia, Ansoff growth matrix, is indicative of the fact that little attention
was being accorded to growth strategies, strategy performance management or rather business
performance (Oertwig, 2017).

182
Fig 7.2 : Planning tools’ extent of usage
In summary, despite the limited planning that was being done, for those that planned, most of
it related to contingency planning (industry analysis) for survival through the turbulent times,
more than for business performance/growth.
Overall, formal strategic planning was being conducted by a handful of participants. The bulk
of participants engaged in informal and emergent planning approaches as a safeguard against
the hostile operating environment. Whilst it would be expected that such an unstable
environment needs meticulous planning, there was quite a significant number of outright non-
planners most probably thriving on intuitive approaches. The low number of formal strategic
planners, very high number of informal and emergent planners and the significantly high
number of outright non-planning firms in a uniquely unstable environment goes to demonstrate
how different firms manage their peculiar situations differently, thereby lending support to the
contingency theory of management.

183
7.3. Rationale for the other types of planning used by small firms in Zimbabwe
The other types of planning used by SMEs by and large fall under informal planning with time
frames ranging from daily, weekly, monthly and annually. In all the scenarios, however,
alterations to the plans were effected at any time as dictated by the obtaining environment and
firm specific factors. Rationales for the various forms of planning were mixed with some of
the most frequent ones being simplicity, time saving, flexibility, shorter implementation
periods for quick feedback and familiarity with the planning approaches.
On plan simplicity and time saving aspects, Bhide (2007) concurs according to his statement
that owner managers need more time to grow their fledgling enterprises than spend time doing
planning. Bhide (2007) however is not contextually in agreement with the above as his notion
was to totally disregard planning because he questioned its efficacy. With regard to resource
restrictions, interviewee number 009 had this to say,
“It is easy to carry out and less time-consuming for someone like me who is not much schooled,
it's very workable.”
Impliedly, business planning requires top management's time, which could be used for other
value creating activities (Carter et al., 1996; Brinckmann et al., 2010). Infact many scholars
have condemned planning as a disruption, contending that it interferes with the endeavours of
time-limited firm owner managers to perform more important activities to strengthen the
foundations of their tender, amateurish firms (Bhide, 2007; Chwolka and Raith, 2012). It might
prove sensible to analytically review the foregoing statement in a manner that seeks to find out
what sort of activities the firm managers would be doing that are distracted by planning. It
could be that since there will be no planning done, managers could just be running around and
doing things amiss as they will basically be using intuitive means. This is consistent with Porter
(1981) who states that the absence of planning is tantamount to businesses groping in the dark.
Benjamin Franklin’s famous adage fits in well here as well, and that is, “when you fail to plan,
you will be planning to fail” (Osabuohien, 2012.( ). Nonetheless, the literature contribution

184
lends support to the adoption of simple planning methods by SMEs, methods that do not
consume much of their productive time.
Concerning shorter implementation periods and quick feedback, some sections of literature are
in concurrence. According to Chwolka and Raith, (2012), planning is more effective when the
time span between planning and feedback is short. Respondent 10, echoing the latter, stated,
“To me, it's a thing of the past to plan for a long period. I plan monthly and keep revisiting my
plans often to address any changes that may come up.”
Further analysis revealed that while formal and informal planning was used by some SMEs, its
use was biased towards business survival through industry scanning and market analysis. From
the hierarchical diagram extracted from NVivo, it emerged that the majority of the
interviewees, planners and non-planners, had a meeting of minds on the instability and
uncertainty of the economy. This uncertainty was mainly triggered by the poor economic
environment, illiquidity, poor policy frameworks, the surrogate currency crisis, the tense
political outlook, and among other things, the scarcity of sufficient local resources. As a result,
prospects for business growth were minimal, leaving the major goal being to ensure business
sustainability.

185
Figure 7.3: Hierarchical Chart – Rationale for Chosen Planning Approach
7.4. Performance comparison between planners and non-planners?
Literature identifies that performance is the time test of any strategy (Gibson and Casser, 2005).
This is consistent with the methodological approach in this study as a longitudinal approach
was adopted. In convergence with this approach, Brews and Hunt (1999) observe that since
strategic plans cover periods longer than a year, it is only fair to use performance measures that
have a time lag aspect. This is in view of the fact that the fruits of strategy may take more than
one or two accounting periods to be realised. Literature thus advances an opinion that
performance measures ought to include a time lag to effectively establish the link between
strategy and performance (Palmer and Wiseman, 1999). Notwithstanding the longitudinal
thrust though, cross-sectional analysis was also done to get an appreciation of annual positions.
When performance was measured in terms of sales or turnover growth, the periods 2013 to
2014 and 2014 to 2015 revealed non-planners as having performed better than formal strategic
planners, and formal strategic planners as having performed better than non-planners
accordingly. Following independent t-tests in this regard, the differences in performance were
found to be statistically significant. Non-planners performed better than formal strategic

186
planners again in the period 2015 to 2016 but after independent t-tests were carried out, there
was not a statistically significant difference in the mean turnover growth scores for formal
strategic planners and non-planners.
In longitudinal terms, there was not a statistically significant difference in the mean sales or
turnover growth scores for formal strategic planners and non-planners over the four year period
from 2013 to 2016. When performance was measured in terms of employment growth, the
periods 2013 to 2014 revealed non-planners as having a higher mean performance figure, 2014
to 2015 and 2015 to 2016 portrayed formal strategic planners as having higher mean
performance figures, implying that they performed better than non-planners. Mean
performance differences established in the three periods were found to be statistically
significant at cross sectional level. The overall longitudinal independent t-tests concluded that
there was not a statistically significant difference in the mean employment growth scores for
formal strategic planners and non-planners over the entire four year period. Cross sectional
analyses indicating better performance registered by non-planners are noteworthy.
The overall longitudinal position in terms of both employment and turnover growth is that
‘there is not a statistically significant difference in the mean turnover and employment growth
scores for formal strategic planners and non-planners over the four year period from 2013 to
2016. This finding simultaneously addresses the second hypothesis, 1b, which reads, ‘Small
businesses that engage in formal strategic planning do not have superior performance to non-
planners’. In view of the aforestated findings, the hypothesis is accepted.
Such a result tends to turn tables in management science because management theory advises
against non-planning to avoid sub-optimal performance (Mintzberg, 1987; Porter, 2008;
Steiner, 1979). Herter (1995) contends that planning yields organisational success in stable and
predictable environments. The result somewhat vindicates the portion of literature which
advances the fact that small firms would rather depend on intuition than engaging in business
planning (Allinson, Chell, and Hayes, 2000; Chwolka and Raith, 2012). The foregoing
discussion appears to question the relevance of formal strategic planning in unstable,
unpredictable environments. In one prior study, Robinson and Pearce (1984) observe that

187
managers responsible for strategic planning activity in smaller organisations appear not to
benefit much from a highly formalised planning process or extensive written documentation.
In the same vein, Pansiri and Temtime (2010) posited that it is critical for small firm owner
managers to be aware of environmental conditions for more fruitful strategy formulation
processes in organisations. This comes as confirmation of findings by Burns and Stalker (1966)
who stated that highly formalised organisations fail as a result of their inability to change their
prescriptive strategic management processes and flow with environmental changes.
Important to observe is the fact that an insignificant difference in the performance of formal
strategic planners and non-planners somewhat diminishes the worth of formal strategic
planning. In a way, therefore, the outcome popularises non-planning in unstable and
unpredictable environments as not taboo or anathema in the fashion that management theorists
portray it (Porter, 2008; Mintzberg, 1987). Echoed here is Benjamin Franklin's adage, “when
you fail to plan, you will be planning to fail” (Osabuohien, 2012). According to this study, that
adage applies partially. The fact that even outright non-planners also have good performance
sends a clear message to policy makers, funding agencies and other stakeholders that
stigmatising non-planning within the context of unstable and unpredictable environments ought
to be accorded a rethink.
Almost similar findings were obtained by Robinson and Pearce, (1984) and Robinson et al.,
(1986) where no difference was found in the performance of planning and non-planning firms.
Also echoed here are the findings by Inkpen and Chouldhury (1995) who state that the absence
of a strategy ought not to be associated with poor performance. Verreynne and Meyer (2010)
confirm this as they found non-engagement in planning. What more, Gibson and Casser (2005)
contend that the use of planning does not necessarily culminate in superior performance. If
outright non-planners therefore can make a positive contribution to the fiscus, then the way
they operate needs to be studied and appreciated more in an endeavour to find out how best
they can be supported to perform even much better.

188
An alternative explanation of the foregoing result is the definition of non-planners in this study.
Informal planners and outright non-planners are all grouped under non-planners in this study,
and yet there are more informal planners than formal strategic planners. What more, these
informal planners by and large employ emergent planning approaches, which have been seen
to be linked to high performance in volatile environments as planning is more in tune with the
pace of environmental changes. In support of this stance, Mintzberg (1994) posits that effective
strategies can be emergent patterns that do not necessarily follow a predefined, explicit or
formal plan, particularly in uncertain and unpredictable environments where such planning
approaches allow for swift action to adopt opportunities as and when they come up
(Mosakowski, 1997; Mintzberg and Waters, 1985; Brinckmann et al., 2010).
Following the same argument, in a study of small banks, Robinson and Pierce (1983) noted
that a formalistic approach to strategy did not lead to superior financial performance. The
results from Lindsay and Rue’s (1980) study are supportive, bearing almost the same
conclusions concerning the formal approach to strategy and performance. Infact the ability to
develop reliable formal strategic plans under a dynamic, unpredictable environment with
information gaps and uncertainty of information is questionable (Boyd et al., 2012) as the
approach is prone to lack of flexibility which, on the contrary, forms a key characteristic in
emergent planning approaches (Brinckmann et al., 2010). Several researchers (Steiner, 1967;
Still, 1974; Robinson and Pierce, 1983) have noted that emergent or informal approaches lead
to a successful SME strategy formulation. Kelmar and Noy (1990) also found out that informal
planning was more popular among small businesses.
Further analysis of this outcome highlights the significance of factors moderating the link
between formal strategic planning and performance, also termed contingency factors
(Donaldson, 2001). Burke et al., (2010) highlight that reasons for planning, while being
heterogenous, are key in determining the level of performance. In the Zimbabwean unstable
and unpredictable environment, most small firms planned to remain afloat implying that
insufficient justice was accorded to growth strategies etc. The finding under discussion tends
to unveil the uniqueness of the Zimbabwean environment compared to more stable and
developed economies. Brinckmann et al., (2010) for instance show with respect to different

189
cultural settings that business planning is less beneficial for performance in cultures
characterized by higher uncertainty avoidance than firms in cultures with lower uncertainty
avoidance. A plausible interpretation of this statement appears to be that small business owner
managers can more comfortably rely on their predetermined plans in environments where
uncertainty avoidance is high because not many adverse changes are expected (Brinckmann et
al., 2010; Delmar and Shane, 2003).
7.4.1 Use of turnover as a performance indicator
In the face of the foregoing revelations, it becomes necessary to analytically discuss the subject
of turnover as a measure of performance. Laukkanen (2013) and Gibson and Casser (2005)
also used turnover as a measure of performance. The world over, of which Zimbabwe is not an
exception, small enterprises are known for exploiting information asymmetry for their gain.
End of year accounts for instance can be produced in various forms for different stakeholder
communities like the taxman, financial institutions and other funding agencies, city councils,
companies house, etc. This is glaringly apparent in the turnover figures supplied by certain
participant small firms where annual turnover divided by the number of employees would give
unrealistically low annual salaries for the employees. In certain cases, some of these small firms
only operated on seasonal basis, but where they operated year round, the figures were shrouded
with a lack of clarity which rendered them questionable.
Having discussed the above, it remains important to note that the figures gave us a starting
point and showed the general turnover trend over the years reviewed. This is mainly in view of
the fact that information asymmetry cannot be ruled out as suggested by Gibson and Casser
(2005). Also, the assurance of anonymity given to respondents meant they would be free to
give almost realistic figures. Critical to note is the point that such questionable figures were a
negligibly small proportion of total respondents hence over-dwelling on this would be
improper.

190
7.5. Relationship between formal strategic planning and performance in small firms
One of the major purposes of this study was to examine the relationship between formal
strategic planning and performance in SMEs. As findings stated below confirm, there was no
statistically significant correlation between formal strategic planning and performance in the
new and established firm sectors. Results did not change materially by controlling for a
contingency variable like firm age or environmental instability.
(i) New firm correlations with turnover growth as the measure of performance
- There was no statistically significant correlation between formal strategic planning and
performance where turnover growth was the performance measure, without a contingency
factor.
- There was no statistically significant correlation between formal strategic planning and
performance with turnover growth as the performance measure, where firm age was the
contingency factor
(ii) New firm correlations with employment growth as the measure of performance
- There was no statistically significant correlation between formal strategic planning and
performance in terms of employment growth, without a contingency factor.
- There was no statistically significant correlation between formal strategic planning and
performance in terms of employment growth with firm age as a contingency factor.

191
(iii) Established firm correlations with turnover growth as the measure of performance
- There was no statistically significant correlation between formal strategic planning and
performance in terms of turnover growth without a contingency factor.
- There was no statistically significant correlation between formal strategic planning and
performance in terms of turnover growth with firm age as a contingency factor.
(iv) Established firm correlations with employment growth as the measure of performance
- There was no statistically significant correlation between formal strategic planning and
performance in terms of employment growth without a contingency factor.
- There was no statistically significant correlation between formal strategic planning and
performance in terms of employment growth with firm age as a contingency factor.
(v) Entire sample
- There was no statistically significant correlation between formal strategic planning and
performance in terms of turnover growth, both without a contingency factor and when
firm age was a contingency factor.
- There was no statistically significant correlation between formal strategic planning and
performance in terms of employment growth, without a contingency factor, where firm
age was a contingency factor, and where environmental instability was a contingency
factor.

192
These findings are consistent with Mc Kiernan and Morris, (1994) and Robinson and Pierce
(1983) where no relationship scenarios were found between formal strategic planning and
performance. In the former study, it was concluded that ‘formality of the strategic planning
process does not impact on performance’.
Results from this study strike a sharp contradiction with Verreynne and Meyer, (2010),
Brinckmann et al., (2010) and Gibson and Casser, (2005) where associations between planning
activity and performance were revealed. A possibly plausible explication of the no relationship
scenario portrayed in this study is the definition of planning adopted. Formal strategic planners
alone are the planners in this study, while the rest, including informal planners and outright
non-planners, are blanketed under non-planners. This is against a background where we have
a significantly high number of performing informal planners.
Hypothesis 1a, which reads, ‘There is no relationship between formal strategic planning and
performance in the small business sector’, is accepted in line with the findings of the study.
Hypothesis 1b, which reads, ‘Small businesses that engage in formal strategic planning do not
have superior performance to non-planners’ is accepted in view of the findings established in
this study.
The above latter results imply that SMEs that engage in formal strategic planning tend to
perform almost at par with those small firms that do not plan formally. Given that amongst the
non-planners are informal (emergent) planners, it is relevant to note Barney’s (1991)
suggestion that an emergent planning approach is a peculiar and difficult to mimic process that
leads to increased performance. Hart (1991) agrees with this suggestion in his study, by
revealing a finding that the emergent planning approach is more strongly linked to financial
performance than the formal strategic planning approach. Frederickson and Mitchell (1984)
established no link between formal planning and financial performance. McKiernan and Morris
(1994) observed that the formal approach to strategy fails to accord managers a holistic firm
view.

193
Contrary to these results are several studies that investigated the relationship between formal
strategic planning and performance. For instance, Van Gelderen et al. (2000) indicated that
formal strategic planning leads to increased performance and also that the emergent approach
to planning leads to poor performance. In a study of 97 Canadian small firms, Miller and
Toulouse (1986) concluded that financially thriving concerns have clear strategies, long
planning periods and more detailed strategy formulation analysis. Bracker et al. (1988) found
out that firms employing formalistic strategy formulation outperformed firms utilising
emergent planning approaches, a position that is not supported by findings in this study.
Findings from this study find support from selected prior researches, and at the same time run
contradictory to other sections of literature. What remains important are the revelations coming
out of the study and the explications given in view of the founding environment.
7.6. Contingency approach application for optimal small firm performance
Contingency theory has been employed in this study, and formed the main part of the
theoretical framework to elucidate the variability of planning approaches used by small firms
and how the same relate to performance. The hallmark of contingency theory is the contention
that there is no one way of planning as different organisations are bound to plan in line with
their peculiar firm specific or environmental situations (Yu et al., 2012; Mintzberg, 1994).
Confirming this assertion, Steiner (1971) states that, a universal strategy formulation structure
that can be applied to all organisations is non-existent. Organisations are, impliedly, different,
face different situations and require different ways of managing.
From the sample of 392 firms under the questionnaire survey, both planners and non-planners
are represented under good and low performance categories. The immediate interpretation of
the foregoing is that not all planners are good performers and also that not all non-planners are
poor performers. In other words, planners have got their fair share of good performers and poor
performers while non-planners also have their fair share of good performers and poor
performers. The study proves the validity or applicability of the contingency theory within the
context of small firms under a volatile, unpredictable environment in sub Saharan Africa.
Particular sections of literature in this domain are supportive of this position and these include

194
Bhide (2007) who questions the efficacy of planning as he found it to be a time-wasting
exercise which could be replaced by managers affording their fledgling enterprises more
pragmatic support. Infact entrepreneurship research is stuck in an ongoing debate concerning
the value of planning for both established and new small firms. Whereas Delmar and Shane
(2003) note that planning is beneficial to small firms, Reynolds (1996) contends that planning
does not benefit much.
Donaldson (2001) portrays the contingency approach as a theory of equilibrium, citing the
reason that it views changes in organisations as ways of maintaining balance or equilibrium.
Underlying the theory is the axiom that whenever an organisation is in misfit, it naturally goes
through transformation in order to be in fit (Woodward, 1965). The argument is that optimum
organisational performance is achieved when it is in fit, and whenever an organisation is in
misfit, its performance will be low hence the need to undergo transformation to achieve fit.
Under the contingency theory there is perfect or full fit and yet according to Donaldson (2001),
perfect fit is not always achievable. Quasi-fit is rather achievable, and a firm can further
improve upon the quasi-fit to a higher quasi-fit level as it tends towards full fit (Donaldson
(2001).
There is an apparent consistence here with Porter (2008) who states that we live in a world of
profound changes, implying that each time an organisation nears full fit, another or some other
changes occur necessitating the organisation to adjust its operations to achieve fit. The cycle
goes on and on. It therefore becomes fair to say fit is not achievable but pseudo-fit. Literature
castigates the contingency theory view of full fit achievability as impractical and therefore
utopian. Achievability of pseudo-fit is more plausible (Donaldson, 2001). Donaldson (2001)
suggests that it is near impossible for organisations to deliberately move their organisations
into full or perfect fit, but rather into quasi-fit.
The contention therefore is that what is within managers’ knowledge base is an idea of the
direction in which fit exists, which knowledge they can use to move their organisations towards
that direction. That managers have complete control and perspective of the situation is
impossible (Donaldson, 2001). The increase in performance stated is sufficient for feedback

195
and commencement of another growth phase again. To this end, recommendations in this study
seek not to be deterministic in the fashion exhibited by the traditional contingency theory or
even the classicists. The recommendations do not lead to a single optimum ‘decision choice’
and hence the study distances itself from the determinism that characterises the classicists and
traditional contingency theory (Donaldson, 2001).
To the extent that planners and non-planners alike had both good and low performers, it would
appear that optimum performance is not a preserve of planning small firms alone as the
management pundits portray (Porter, 2008). In similar manner, it also would appear that
situations of pseudo misfit are not only skewed in favour of non-planning small firms because
misfit scenarios do feature among the planning firms as well. Whereas the finding might
seemingly diminish the value of planning while conversely promoting non-planning, the
message that should be communicated, inter alia, is one of the support rendered to the
contingency theory of management in the process, that no universality (or one-size-fits-all
approach) can be applied in managing the planning function of organisations.
In concurrence with the foregoing, Hage (1974) observed that the major objective of
contingency theory lies in lessening the deficit or reducing the misfit. Management effort is
always exerted towards the situation of fit. To ensure that the organisation is in fit, the strategic
management approach chosen needs to be matched to the contingent circumstances affecting
its operations. Findings from this study appear to get support from both poles of literature,
being that section of literature which supports non-planning and the other section supportive
of planning. In this context, Chwolka and Raith, (2012) discuss critics in the entrepreneurship
field that seriously question whether business planning is, really, a meaningful activity (Bhide,
2007; Beaver, 2007; Lange et al., 2007).
The foregoing discussion basically undermines four lines of theory, the first of which is
organization theory, which posits that planning before execution of actions enhances the quality
of most human actions (Ansoff, 1991; Locke and Latham, 1980; Brinckmann et al., 2010).
According to Ansoff, (1991), planning is a vital antecedent to action for it offers a basis upon
which ensuing action takes place (Chwolka and Raith, 2012)

196
Goal setting theory contends that planning is especially of paramount importance in
multifaceted task settings (Frese et al., 2007; Locke & Latham, 1990; Wood, Mento, & Locke,
1987), and also that thorough planning is essential (Frese et al., 2007). Cognitive theory holds
that planning is important to metamorphose or transform opinions and objectives into actions
(Frese et al., 2007). It acknowledges the fact that plans are not static but are more effective if
adopted under the learning or emergent approach (Donaldson, 2001). The fourth one is action
theory, which postulates that planning is significant for transforming goals into actions (Frese
et al., 2007). Action theory recognises the significance of contingent or back-up plans
especially in unpredictable environments (Frese et al., 2007). Notwithstanding such theoretical
confluence, planning as a construct still appears to be understood differently as suggested by
the various commentaries on planning in prior literature. Findings in this study seemingly fan
this divergence of opinion on the construct of planning.
The conceptual framework graphical presentation below gives a snapshot of the various types
of firms (new and established planners and non-planners) against the quantities of firms found
in each group. It is evident that in each group there are firms that have low performance and
firms that also have high performance. In a typical economy, non-planners would not feature
among good performers. In like manner, planners would not typically be found under low
performers. In the uniqueness of its economy and operating environment, Zimbabwe has such
seemingly obscene scenarios.
The Zimbabwean scenario appears to find partial explanation in literature. Porter (1991, p. 111)
remarked that “the starting point for the [dynamic] theory is that environmental change is
relentless.” The remark somewhat explains the challenges facing the Zimbabwean SMEs, as
they attempt to cope with seemingly perennial adverse environmental changes. Reinforcing the
foregoing, Drucker (1999, ix) testifies that “we live in a period of profound transition.”
Figures 7.4, 7.5 and 7.6 below depict the general spread or distribution of small firms among
the identified four firm categories vis-à-vis performance levels. It is evident that in all groups
of small firms, there features planners and non-planners while good and poor performance is
again reflected in all groups. Among both new and established firm groups, the highest number

197
of firms are non-planners. One plausible explication for this is the fact that informal planners
are among the non-planners and yet the informal planners out-number formal strategic
planners. The revelation is in sync with Boyd et al, (2012) who state that emergent planning is
more akin to unstable and unpredictable environments. Brinckmann et al, (2010) also hint that
small firm planning is often times informal and intuition-led culminating in no written
outcome.
An interesting revelation from the figures 7.4, 7.5 and 7.6 is that in the non-planners’ group,
there is almost an equal number of good performers and poor performers. In contrast, among
planning firms, there are more good performers than poor performers. This might point to the
fact that there is less pronounced failure under a planning regime than under non-planning.
Insinuated, this perhaps suggests that firms are less likely to fail when they plan and on the
contrary small firms have a high propensity to fail under a non-planning regime. Caution
however needs to be exercised with the latter submission as there are two groups of firms under
non-planners, which are informal planners and outright non-planners. It’s worth noting that
figures 7.4, 7.5 and 7.6 portray performance contributions by planning firms and non-planning
firms under new and established firm categories. The figures strike a link with the contingency
theory of management in that they are reflective of how different firms with different and
unique circumstances manage their firms differently, yielding pseudo fit (good performance)
and pseudo misfit (sub optimal performance).

198
Fig 7.4: Conceptual framework in graphical form
0
10
20
30
40
50
60
70
80
90
Established planners New planners Established non-planners New non-planners
Conceptual framework graphical presentation
Negative performance growth Positive performance growth

199
Fig 7.5: Post fieldwork depiction of conceptual framework
Established planners
New planners
Established non-planners s
New non-planners
Poor Good
Performance
8 firms 28 firms
11 firms 39 firms
83 firms 81 firms
63 firms 79 firms

200
Fig 7.6 Conceptual framework post analysis depiction
7.6.1 Contingency based model for unstable environments from findings
The PACOFIM model (PA is derived from planning approach, CO is derived from contingent
variable and FIM is derived from fit and misfit) partially summarises the conclusions of this
study and, in a way, offers recommendations as well especially to small enterprises operating
in unstable economies, thereby responding to research question number five. The model states
the three planning typologies (prescriptive, emergent and hybrid prescriptive-emergent) as
discussed in the literature review. It also states outright non-planners as that group has a part
to play in the conceptual framework as well. In line with the contingency theory, room is given
for some of the moderating contingency factors, and in the model only two factors have been
identified being environmental volatility and newness of firm. The outcome (either a scenario
of fit or misfit) is a pseudo outcome as the organisation can start the process again at a new
level of planning or with a new planning approach altogether yielding another pseudo outcome.

201
Fig 7.7: PACOFIM model for unstable environments in line with findings
Adopted from Mintzberg’s model of strategy formulation (Mintzberg and Waters, 1985)

202
Fig 7.8 PACOFIM Model first column breakdown in line with findings
According to the model, a pseudo-misfit represents poor performance while pseudo-fit
represents good performance. The traditional contingency theory is criticised for postulating
that perfect fit is achievable (Woodward, 1965), which literature contends that it is utopian.
This is in consistence with the submission by Donaldson (2001) that achievement of full or
perfect fit is not possible but rather pseudo-fit, which can always be improved upon as the cycle
goes on and on towards full fit. Organisations can register various performance levels along
the performance continuum. The determining factors for each pseudo outcome is the planning
approach embraced and the moderating contingency variables in place at each point in time.
There is scope in the model to add any other contingency factors that may be in force at any
point in time. The two factors included are for illustration purposes as they are not exhaustive
of all the possible contingencies. Forward looking organisations are on a continual quest for
higher pseudo fit levels each time by adopting appropriate strategies. Infact, contingency theory
posits that management is not static or rigid but should be flexibly alterable in line with the

203
circumstances or situation at hand (Boyd et al., 2012). Perfect fit, according to the model, is
not achievable but simply aimed for. The model introduces non-planning based on the findings
from this study wherein non-planning firms have a dichotomous performance structure of
pseudo-fit (good performance) and pseudo-misfit (poor performance). Classical management
theory is vehemently antagonistic to non-planning and gives no provision or room for good
performance from non-planners. The model therefore portrays contingency theory as a theory
of multiple possibilities (Yu et al, 2012), one that accommodates non-planners who are vilified
by management classicists as having no space on the good performance continuum (Porter,
2008).
The overall construction of the model, whereby all planning approaches (prescriptive, emergent
and prescriptive-emergent) as well as non-planning (figures 7.7 and 7.8) are included in the
planning-performance cycle depicts the heterogeneity that marks the hallmark of contingency
theory. By coming up with findings that led to the framing of the model as such, this study
distances itself from the paradoxically deterministic tendencies of traditional contingency
theory (Shreyogg, 1980; Donaldson, 2001).
7.7 Future research considerations
This study has several important implications for future research in this domain. This same
research carried out in various developing economy environments, introducing more context
variables that moderate the planning–performance relationship will add value to future
research. Such variables could be newness of the sampled firms, the nature of business
planning, cultural variables, and so on. In so doing, the intention will be to foster a dynamic
and contextual comprehension of the planning–performance relationship. Put differently, such
a research will be rich in that it will not dwell on a generalised approach of the importance of
planning for small firms. Rather, it will target to unravel research-based evidence concerning
contexts when planning exhibits differing levels of effectiveness.

204
This research has looked at small firms in various industries at one goal, and analysis of data
could possibly not uncover some concealed industry specific associations. The opportunity
therefore exists for future research to analyse the relationship between planning and
performance on an industry by industry basis (Gibson and Casser, 2005).
While it is acknowledged that the process of planning is rather a waning study as discussed by
various researchers in this field (Brinckmann et al., 2010), for a holistic understanding of the
planning construct, it will be important for future research to concentrate on the process of
planning. In volatile environments such as Zimbabwe, it will be critical to get a better
comprehension of what really entails non-planning. Getting deeper to understand the
operational modalities, intuitive or other processes of non-planning small firms will assist
future research.
It is of paramount importance that future research looks at the link between planning and
performance within the context of causality. The opinion finds support in the work of Frese et
al., (2007). While this study dwelt mainly on the relationship between the same constructs,
taking a step further to look at causality particularly in volatile, low risk avoidance
environments, will be important.
Based on findings from this study, future research could for instance analyse further and
attempt to establish finer details on how environmental volatility, uncertainty, information
asymmetry and contradictions, or strategic flexibility affect planning.
Given the findings from this study, it is evident that research on planning remains a promising
field of entrepreneurship research, and future studies in some of the highlighted areas should
assist in addressing knowledge gaps in this domain.

205
7.8 Implications for practitioners
An obvious connotation for small firm practitioners is that small firm management in volatile
environments ought not to be made to believe that it is awkward not to plan. The findings of
this study indicate that using formal strategic planning does not necessarily culminate in
outstanding performance. Findings suggest however, that small firms that have superior
performance are more likely to use emergent planning approaches. They further suggest that
the most popular planning approach is the emergent approach, while the least popular is the
prescriptive approach. It should however be made clear that planning alone divorced from
quality content and professional implementation does not readily amount to a positive link with
performance. In the same vein, it is critical to point out that concentrating on planning alone
without putting commensurate efforts on the implementation and review aspects only negates
the whole intention of planning.
To the extent that a number of participant firms highlighted the fact that they plan to maintain
good relationships with banks and get funding, it is ideal to mention that planning small firms
are more likely to have good support networks. Insinuating the foregoing, plans are the main
means by which a firm’s operations can be communicated to outsiders, hence the presence of
plans makes networking easier and more fruitful. Underlying this suggestion is the fact that
small firms are not islands; they have various stakeholders around them like bankers, funding
agencies, government departments and others who want to see the firm through the lens of its
written plans. It would appear, by implication, that cash-rich enterprises may not find it worthy
to have plans for funding purposes, but hastening to mention that support comes in various
forms other than pecuniary appears to be not misplaced.
The picture shown by the figures 7.4 and 7.5 which, when interpreted, implies a higher
propensity to succeed among planners than among non-planners, and also a lower propensity
to fail among planners than among non-planners, sends an important message to the
practitioners’ community. Planners are more likely to succeed and less likely to fail.

206
Many a time, plans may call for alterations or adjustments in line with environmental and firm
specific changes. From the study findings, this becomes even more pronounced within volatile
environments. The small firm practitioner needs to be prepared for this exercise, and to be
attentive to environmental as well as firm specific changes always for achievement of pseudo-
fit. Verreynne and Meyer’s (2010) exhortation for organisations to resonate with environmental
changes is echoed.
7.9 Implications for policy makers
This study suggests some noteworthy implications for policy makers. An important policy
implication is that wholesale enforcement of small firms to adopt formal strategic planning
within the context of volatile, unpredictable economies appears unwarranted as a government
objective. This is mainly because encouraging formal strategic planning may not directly
translate to good performance by compliant firms. This study established that there is no
statistically significant difference in performance between formal strategic planners and non-
planners. In the same vein, ‘punishing’ non-planning through non-provision of financial and
other forms of support appears counter-productive. The research revealed that good
performance is found among non-planners, which feeds into national income figures thereby
partially defining the economic well-being of the country in question. There is rather a clarion
call for non-planning to be comprehended in a deeper context without unduly clinging on to
the non-planning stereotypes of classical management theory. Such typically classical
tendencies, as the study reveals, appear not to work in a hostile environment like Zimbabwe.
A clear understanding of non-planning will yield better solutions on how such non-planning
firms can obtain support from various stakeholders.
It is important for the policy makers to appreciate the fact that education on planning is needed
among the small enterprises sector. Typical responses given by non-planners include that they
are not schooled enough to engage in planning, that they do not know how to use some of the
planning tools and that even though they do not plan, they are happy with that status quo as it
is working for them. Analysis revealed that tools of business growth were being underutilised
as firms concentrated on survival tactics to remain afloat. Education is needed on how to frame

207
digestible but fairly detailed plans. In the same vein it appears important to educate small firm
owner managers on how to use the tools of planning as well as generally showing them the
advantages of planning over non-planning. Such educative programs will be targeted at
empowering small firm owner managers to make decisions from a position of knowledge.
Another subject that constantly surfaced in both survey and interviews done is corruption, and
a key implication to policy makers is that the practice needs to be systematically weeded out.
The finding is corroborated by the contributions of Chagonda (2012) and Jone (2010), among
others. Respondents raised this concern in interviews especially, noting that some of their
failures were partly a result of corruption.
The economic slide down in the country was proven in the literature review and in the
fieldwork, a large portion of respondents bemoaned the poor state of the economy. A multi-
faceted approach is needed to ensure sustained economic resuscitation. Further, it would appear
that the small firm sector is not getting the requisite ‘protection’ thereby rendering the
environment a low risk avoidance one. For the small firm sector to effectively reduce poverty,
catalyse economic development and meaningfully contribute to social stability, the SME sector
needs to be accorded priority status.
7.10 Conclusion
This chapter has discussed findings from the study by addressing each research objective and
hypothesis. Links with the literature have been highlighted in the discussion. Further, the
discussion spilled over into implications for the research community, practitioners and policy-
makers.

208
REFERENCES
Abell, D. F; Hammond, J. S, (1979), Strategic market planning: Problems and analytical
approaches, Prentice-Hall (Englewood Cliffs, NJ)
Abernathy, W. J; Wayne, K, (1974), Limits of the learning curve, Harvard Business Review
52: 109 - 119
Ackelsburg; Arlow, (1985), Small businesses do plan and it pays off, Long Range Planning
Journal 18 (5): 61 - 67
Agca, V; Topal, Y; Kaya, H, (2012), Linking intrapreneurship activities to multidimensional
firm performance in Turkish manufacturing firms: an empirical study, International
Entrepreneurship and Management Journal 8 (1): 15 – 33
Allinson, C. W; Chell, E; Hayes, J, (2000), Intuition and entrepreneurial behavior, European
Journal of Work and Organisational Psychology 9: 31 - 43
Allman, K., (2001), Understanding the motivations of the technology orientated entrepreneur,
R & D Management conference, Dublin
Allman, K.; Edler, J.; Georghiou, L.; Jones, B.; Miles, I.; Omidvar, O.; Ramlogan, R.; Rigby,
J, (2011), Measuring wider framework conditions for successful innovation: A system’s review
of UK and international innovation data, NESTA
Andrews, K. R, (1971), The concept of corporate strategy, Dow Jones-Irwin Inc, Homewood
IL
Andrea D., (2014`), The rise and fall of B.C.G. Matrix: Proceedings of the 8th International
Management Conference, 1: 3, Check date values in: |date= (help)
Ansoff, H.I., (1979), Strategic Management, London: MacMillan
209
Armstrong, J. S, (1982), The value of formal planning for strategic decisions: review of
empirical research. Strategic Management Journal 3 (3): 197 – 211
Armstrong J. S. and Brodie R. J., (1994), Effects of portfolio planning methods on decision
making: experimental results: International Journal of Research in Marketing Science Direct,
11 (1): 73–84
Baird, L. S; Lyles, M. A; Orris, J.B, (1994), Formalised Planning in Small Business: Increasing
Strategic Choices Journal unknown
Baker, W.H; Addams, H.L; Davis, B, (1993), Business planning in successful small firms,
Long Range Planning 26 (6): 82-88
Bamiatzi, V. C; Kirchmaier, T, (2012), Strategies for Superior Performance under Adverse
Conditions: A Focus on Small and Medium-sized High Growth Firms, International Small
Business Journal 32 (3): 259 – 284
Barney, J. B., and Hesterly, W. S. (2010), VRIO Framework In Strategic Management and Competitive Advantage, 68–86, New Jersey: Pearson.
Begley, T. M; Boyd, D. P, (1987), A Comparison of Entrepreneurs and Managers of Small
Business Firms, Journal of Management 13 (1): 99 – 108
Belk R. W., Fischer E., and Kozinets R. V., (2013), Qualitative consumer and marketing
research, London, Sage
Bentley, L and Whitten, J (2007), System Analysis & Design for the Global Enterprise, 7th ed,
417.
Berman, J; Gordon, D; Sussman, G, (1997), A study to determine the benefits small business
firms derive from sophisticated planning versus less sophisticated types of planning, Journal
of Business and Economic Studies 3 (3): 1 – 11

210
Blau, P.M. (1970) A formal theory of differentiation in organizations, American Sociological
Review, 35(2): 201-218
Boardman, N. E., (2006), Cost-benefit Analysis: Concepts and Practice (3rd ed.); Upper
Saddle River, NJ: Prentice Hall, ISBN 0-13-143583-3.
Bolton, J. E, (1971), Small Firms: Report of the Commission of Enquiry on Small Firms,
London; HSMO, Cmnd 4811
Boswell, J., (1973), The Rise and Decline of Small Firms, Alien and Unwin: London
Boyd, B. K., (1991), Strategic performance and financial planning: a meta-analysis review,
Journal of Management Studies 28 (4): 353 - 374
Boyd B. K; Haynes K. T; Hitt M. A; Bergh D. D; Ketchen D. J (Jr), (2012), Contingency
hypothesis in strategic management research: use, disuse or misuse? Journal of management
38 (1): 278 - 313
Boynton, A.C. and Zmud, R.W., (1984), An Assessment of Critical Success Factors: Sloan
Management Review, 25(4), 17–27
Brandenburger, A. M., and Nalebuff, B. J. (1995). The right game: Use game theory to shape strategy, Harvard Business Review, 73(4), 57-71
Bracker, J. S; Keats, B. W; and Pearson, J. W, (1988), Planning and Financial Performance
among Small Firms in a Growth Industry, Strategic Management Journal 9: 591 – 603
Bracker, J. S; Pearson, J. N, (1985), The Impact of Consultants on Small Firm Strategic
Planning, Journal of Small Business Management 23 (3): 23 - 30
Bradford, R. W; Duncan, P. J; Tarcy, B, (1992) Simplified Strategic Planning: A No-Nonsense
Guide for Busy People Who Want Results Fast! Publisher unknown

211
Brealey, R.A; Myers, S.C, (1996), Corporate Finance, 5th Edition, New York: The McGraw-
Hill Companies, Inc.
Bresser, B. K; Bishop, R. C, (1983), Dysfunctional effects of formal planning: two theoretical
explanations, Academy of Management Review 8 (4): 588 - 599
Brews, P.J. and Hunt, M.R. (1999), Learning to plan and planning to learn - Resolving the
planning school-learning school debate, Strategic Management Journal, 20: 889-913
Brinckmann, J; Grichnik, D; Kapsa, D, (2010), Should entrepreneurs plan or just storm the
castle? A meta-analysis on contextual factors impacting the business planning-performance
relationship in small firms, Journal of Business Venturing 25 (1): 25 – 40.
British Standards Institution, (2012), Societal security; Business continuity management
Systems Requirements: London
Brush, C. G; Vanderwerf, P. A, (1992), A comparison of methods and sources for obtaining
estimates of new venture performance, Journal of Business Venturing 7: 157 - 170
Brush, C. G; Vandewerf, P. A, (2002), A comparison of methods and sources for obtaining
estimates of new venture performance, Journal of Business Venturing 7 (2): 157 - 170
Burns, T. and Stalker. G.M., (1961), The Management of Innovation. London: Tavistock.
Carlin, T, (1999) Simplifying Corporate Performance Measurement, Australian CPA,
69 (11): 48-50
Cameron, B.G., T. Seher, E.F. and Crawley, (2010), Goals for space exploration based on
stakeholder network value considerations: Acta Astronautica
Camillus, J. C, (1975), Evaluating the Benefits of Formal Planning, Long Range Planning 8
(3): 33 – 40

212
Carr L. P; Nanni A. Jr. (2009), Delivering Results: Managing What Matters: Springer Science & Business Media, 44. ISBN 978-1-4419-0621-2.
Carroll, P.J. (1982), 'The link between performance and strategy', Journal of Business
Strategy, Vol.2, No.4, pp.3-20.
Chaganti, R; Chaganti, R and Mahajan, V., (1989), Profitable Small Business Strategies under
Different Types of Competition, Entrepreneurship Theory and Practice 13 (3), 21 - 35
Chagonda, T., (2012), Teachers’ and bank workers’ responses to Zimbabwe’s crisis: uneven
effects, different strategies, Journal of Contemporary African studies 30 (1) : 83-97
Chandler A.D., (1962), Strategy and Structure: Chapters in the history of the American
industrial Enterprise, Cambridge, MA:MIT Press.
Chell, E; Allman, K., (2002), The development of High Technology Enterprises from HEIs:
Some Methodological Considerations in R Oakey, W During, Saleema Kauser (Eds.), New
Technology-Based Firms in the New Millennium, Amsterdam: Pergamon II, Ch 6, 71 - 93
Chet, M. C., Cardinal, L. B, (1994), Strategic Planning and Firm Performance. A Synthesis of
More than Two Decades of Research, The Academy of Management Journal, 37 (6): 1649 -
1665.
Chiboiwa, M.W, Samuel, M.O., Chipunza, C, (2010), An examination of employee retention
strategy in a private organization in Zimbabwe, African Journal of Business Management 4
(10): 2103 – 2109
Clayton, T, (1996), Long term planning: a must, New Zealand Manufacturer 15: 5 - 10
Cooper, A. C., (1981), Strategic Management: New Ventures and Small Businesses, Long
Range Planning, 14 (5): 39 – 45.

213
Chakravarthy, B. S, (1986), Measuring Strategic Performance, Strategic Management
Journal 7 (5): 437 - 458
Chandler, N; Hanks, H. S, (2002), Measuring the Performance of Emerging Businesses: A
Validation Study, Journal of Business Venturing 8 (5): 391 – 408.
Ciubotariu M. S, (2013), the role of small and medium enterprises in the modern economy
and the importance of IFRS application for SMEs, the annals of economics and public
administration 13 (1): 17
Creswell, J.W., Clark Plano, V.L., (2011), Designing and conducting mixed methods research,
second edition, Sage Publications Inc.
Creswell J. W., (2014), Research design; Quantitative, qualitative and mixed methods
approaches, fourth edition, Sage Publications Inc.
David, R; Ngulube, P; Dube, (2013), A cost-benefit analysis of document management
strategies used at a financial institution in Zimbabwe: A case study; SA Journal of Information
Management, 15 (2)
De Geus, A, (1997), The Living Company, Boston Harvard Business School Press, Mass,
(ISBN 978-1-57851-820-3)
Delmar, F; Shane, S (2003), Does business planning facilitate the development of new
ventures? Strategic Management Journal 24 (12): 1165 - 1185
Dess, G. G; Lumpkin, G. T; Covin, J. G, (1997), Entrepreneurial Strategy-making and firm
performance: tests of contingency and configurational models, Strategic Management Journal
18 (9): 677 – 695
Dess G.G; Robinson R.B. Jr, (1984), Measuring organizational performance in the absence of
objective measures: The case of the privately-held firm and conglomerate business unit,
Strategic Management Journal 5: 265-273

214
Dibrell C; Craig J. C; Neubaum D.O, (2014), Linking the Formal Strategic Planning Process,
Planning Flexibility and Innovativeness to Firm Performance, Journal of Business Research
67: 2000-2007
Dilts, J. C; Prough, G. E, (1989), Strategic Options for Environmental Management: A
Comparative Study of Small versus Large Enterprises, Journal of Small Business Management
27 (3): 31 – 38
Dollinger, M. J, (1985), Environmental contacts and financial performance of the small firm,
Journal of Small Business Management 23
Donaldson, L. (1996) The normal science of structural contingency theory. In Clegg, S.R,
Hardy, C., Nord, W.R. (eds), Handbook of Organization Studies, 57-76. Thousand Oaks,
CA: Sage
Donaldson, L. (2001) The contingency theory of organizations. Sage Publications
Drazin, R; Van de Ven, A. H, (1984) Alternative Forms of Fit in Contingency Theory,
Administrative Science Quarterly 30:4 (514 – 539)
D’Souza, D. E; McDougall, P.P, (1989), Third World Joint Venturing: A Strategic Option for
the Smaller Firm, Entrepreneurship Theory and Practice 13 (4): 19 - 33
Edwards, J.R; (2001a) Multidimensional constructs in organizational behaviour research: an
integrative analytical framework, Organizational Research Methods 4(2): 144–192
Elliot, D.; Swartz, E.; Herbane, B, (1999), Just waiting for the next big bang: business
continuity planning in the UK finance sector; Journal of Applied Management Studies, (8), 43–
60
FAO (Food and Agriculture Organization of the United Nations), (2005a), Commodity Chain
Analysis, Constructing the Commodity Chain Functional Analysis and Flow Charts, EASYPol:
215
On-line resource materials for policy making, Module 043, Available on Internet:
http://www.fao.org/docs/up/easypol/330/cca_043EN.pdf
Frederickson, J. W, (1984), The Comprehensiveness of Strategic Decision Processes:
Extension, Observations, Future Directions, Academy of Management Journal 27 (3): 445 -
466
French, S. J; Kelly, S. J; Harrison, J. L, (2004), The role of strategic planning in the
performance of small, professional service firms: A research note, Journal of Management
Development 23 (8): 765 – 776
Frese, M; Van Gelderen, M. W; Ombach, M, (2000), How to plan as a small scale business
owner: psychological process characteristics of action strategies and success, Journal of Small
Business Management 38: 1 - 18
Fulmer, R. M; Rue, L, (1974), The Practice and Profitability of Long Range Planning,
Managerial Planning Journal 22 (6), 1 – 7
Gable, M; Topol, M. T, (1987), Planning practices of small-scale retailers, American Journal
of Small Business 12 (2): 19 - 32
Gelderen, M; Frese, M; Thurik, R, (2000), Strategies, Uncertainty and Performance of Small
Business Startups, Journal of Small Business Economics 15 (3): 165 – 181
Georgakellos, D. A. and Marcis, A. M. (2009), Application of the semantic learning approach
in the feasibility studies preparation training process: Information Systems Management 26 (3)
231-240
Gibson, B; Casser, G, (2005), Longitudinal Analysis of Relationships Between Planning and
Performance in Small Firms, Journal of Business and Economics 25 (3): 207 – 222.

216
Ginsberg, A; Venkatraman, N, (1985), Contingency Perspectives of Organisational Strategy
: A Critical Review of the Empirical Research, Academy of Management Review 10:3 (421 –
434)
Giuseppe; Giuseppe S.; Roberta S., (2012), Developing a Territory Balanced Scorecard
approach to manage projects for local development: Two case studies, Land Use Policy, 29
(3): 629–640, doi:10.1016/j.landusepol.2011.10.005, Retrieved 30 June 2014.
Glen, W; Weerawardena, J, (1996), Strategic planning practices in small enterprises in
Queensland, Small Enterprise Research 4 (3): 5 – 16
Global economic monitor [GEM] (2013)
Greeley, G. E, (1986), Does strategic planning improve company performance? Long-range
planning (April): 101 - 109
Greenwood, R; Suddaby, R; Hinings, C.R, (2002), Theorizing change: The role of professional
associations in the transformation of institutionalized fields, Academy of Management Journal
45(1): 58-80
Guber, M, (2007), Uncovering the value of planning in new venture creation: A process and
contingency perspective, Journal of Business Venturing 22 (6): 782 – 807.
Hage, J. and Aiken, M, (1967a), The relationship of centralization to other structural
properties, Administrative Science Quarterly, 12(1): 72-92
Hage, J. (1974) Communication and organizational control. New York: Wiley
Harrigan, K. R, (1983), Research methodologies for contingency approaches to business
strategy, The Academy of Management Review 8 (3): 398 - 405

217
Harrington, R.J. (2001) Dimensions in the strategic making process, Published PhD Thesis,
Washington State University
Hart, S. (1992), An integrative framework for strategic making process, Academy of
Management Review, 17: 327-351
Harvard Business Review, (1998), Strategies for Growth: Harvard Business Review
Paperback Series by Harvard Business Review Paperback
Hein A. M.; Tziolas A. C.; Osborne R., (2011), Project Icarus: Stakeholder Scenarios for an
Interstellar Exploration Program, JBIS, 64, 224-233
Hein, A. M., Jankovic, M., and Feng, W., (2017), Stakeholder Power in Industrial Symbioses:
A Stakeholder Value Network Approach: Journal of Cleaner Production 148C: 923-933
Herold, D. M, (1972), Long-range planning and organisational performance: a cross-valuation
study, The Academy of Management Journal 15 (1): 91 - 102
Herter, G, (1995), Business planning boosts your chances, Journal of Accounting Technology
11 (4): 20 - 30
Hodgkinson, G. P; Whittington, R; Johnson, G; Schwarz, M, (2006), The Role of Strategy
Workshops in Strategy Development Processes: Formality, Communication, Co-ordination
and Inclusion, LRP – International Journal of Strategic Management 39 (5): 479 – 496
Hofer, C. W, (1976), Research on strategic planning: a survey of past studies and suggestions
for future efforts, Journal of Economics and Business 28: 261 - 286
Hofer, C; Schendel, D, (1978), Strategy formulation: Analytical concepts, West St Paul

218
Hogarth; Makridakis, (1981), Forecasting and planning: An evaluation, Journal of
Management Science 27 (2): 115 - 138
Ireland, R. D., Hoskisson, R., and Hitt, M. (2008), Understanding business strategy: Concepts
and cases, Cengage Learning
Itzkowitz, G, (1996) Contingency theory. Rowman & Littlefield
James J. A. and Friesen M., (1995), The Success Paradigm: Creating Organizational
Effectiveness Through Quality and Strategy, New York: Quorum Books, ISBN 978-0-89930-
836-4
James M., (2000), Cooperative Feasibility Study Guide, United States Department of Agriculture, Rural Business-Cooperative Service
Jaouen, A, Best PhD Dissertation Award in Entrepreneurship, Montpellier Business School
CEROM Best PhD dissertation award in entrepreneurship
Jarvis, R.; Curran, J; Kitching, J; Lightfoot, G, (1995) Financial management strategies of
small business owners: the case of cash flow management, paper presented to the 18th ISBA
National Small Firms Policy and Research Conference, Paisley
Johansson, W, (2004), Narrating the Entrepreneur, International Small Business Journal: 22
(3): 273 - 293.
Johnson, G. and Scholes, K., (1997), Exploring Corporate Strategy: Text and Cases,
Cambridge: Prentice Hall.
Johnson, G., Scholes, K. and Whittington, R. (2008) Exploring Corporate Strategy. 8th Ed.
London: FT Prentice Hall
Jone, J.L., (2010), Nothing is straight in Zimbabwe: The rise of kukiya-kiya economy 2000-
2008, Journal of Southern African Studies 2 (36)

219
Jones, D, (1982), Characteristics of planning in small firms, Journal of Small Business
Management 20 (3): 15 -19
Jones, C.S. (1985) ‘An empirical study of the evidence for contingency theories of
management accounting systems in conditions of rapid change’, Accounting, Organizations
and Society 10(3): 303-328
Jones, O; Macpherson, A, (2006), Inter-Organisational Learning and Strategic Renewal in
SMEs: Extending the 41 Framework, LRP – International Journal of Strategic Management
39 (2): 133 – 154
Joyce, P; Seaman, C; Woods, A, (1996), in Blackbum, R, and Jennings P.. (eds), Small Firms:
Contributions to Economic Regeneration, London: The Institute for Small Business Affairs
Justis, R. T. and Kreigsmann, B. (1979), The feasibility study as a tool for venture analysis:
Business Journal of Small Business Management 17 (1) 35-42
Kalkan A; Bozkurt O. C, (2013), The Choice and Use of Strategic Planning Tools and
Techniques in Turkish SMEs According to Attitudes of Executives, Procedia-Social and
Behavioural Sciences 99: 1016 - 1025
Kargar, J; Parnell, J.A, (1996), Strategic planning emphasis and planning satisfaction in small
firms: an empirical investigation, Journal of Business Strategies 13 (l): 42-64
Kelmar, J. H; Noy, S, (1990), Perceptual differences in small business strategic planning, The
Growing Small Business, Proceedings of the 5th National Small Business Conference,
Toowoomba: 367 – 380
King, W. R, (1983), Evaluating strategic planning systems, Strategic Management Journal 4:
263 - 277
Kleinman, D.L. and Serfaty, D. (1998) ‘Normative-Descriptive modelling of human teams: A
15 year perspective’, Proceedings of the human factors and ergonomics society, Santa

220
Monica, California
Krejcie, R. V; Morgan, D. W. (1970), Determining Sample Size for Research Activities,
Educational and Psychological Measurement 30, 607 - 610.
Koontz H and O’Donnell C, (1976), Management: A Systems and Contingency Analysis of
Managerial Functions, McGraw-Hill, New York
Kraus, S. and Kauranen, I. (2009) ‘Strategic Management and Entrepreneurship: Friends or
Foes?’ International Journal of Business Science and Applied Management, 4(1): 37-50
Kudla, R. J, (1980), The Effects of Strategic Planning on Common Stock Returns, Academy
of Management Journal 23: 5 - 20
Kushnir, K; Mirmulstein M. L; Ramalho R, (2010), Micro, Small, and Medium Enterprises
around the World: How Many Are There, and What Affects the Count? 3
http://www.ifc.org/ifcext/globalfm.nsf/AttachmentsByTitle/MSME-Country-Indicators-
Analysis-Note/$FILE/MSME-CI-AnalysisNote.pdf
Kwesu, I et al., (2002), Dissertation Research Guidelines, Zimbabwe Open University (ZOU),
Harare
Laukkanen, T; Nagy G; Reijonen, S; Pasanen M, (2013), The Effect of Strategic Orientations
on Business Performance in SMEs, International Marketing Review 30(6): 510-535
Lawrence, P.R. and Lorsch, J. (1967) Organizational and Environment. Boston, MA: Harvard
Business School, Division of Research
Leitner, K. H; Guldenberg, S, (2010), Generic Strategies and Firm Performance in SMEs: A
Longitudinal Study of Austrian SMEs, Journal of Small Business Economics 35 (2): 169 –
189, DOI: 10.1007/s11187-009-9239-x

221
Locke, E. A; Latham, G. P, (1984), Goal setting: a motivational technique that works,
Englewood Cliffs, NJ: Prentice-Hall
Lorange, P, (1980), Corporate planning: An executive viewpoint, Englewood Cliffs, NJ
Prentice-Hall
Lowe, J; Clemens, T, (1990), Strategic planning and the smaller firm in Australia, The Growing
Small Business, Proceedings of the 5th National Small Business Conference, Toowoomba: 13 -
22
Lumpkin, G.T; Dess G.G, (1995) Simplicity as a strategy-making process: the effects of stage
of organizational development and environment on performance, Academy of Management
Journal, 38(5), pp. 1386-1407
Lyles, M.A., Baird, I.S., Orris, J.B. and Kuratko, D.F. (1993), Formalized planning in small
business: increasing strategic choices’, Journal of Small Business Management, 31(2): 38-
50
Maguwu, F., (2013), Marange diamonds and Zimbabwe’s political transition, Journal of
peacebuilding and development 8 (1)
Makanyeza, C and Dzvuke, G (2015), The influence of innovation on
the performance of small and medium enterprises in Zimbabwe, Journal of African Business,
16(1): 2, 198-214
Mason, R. O; Mittroff, I, (1981), Challenging Strategic Planning Assumptions: Theory, Cases
and Techniques Publisher unknown
Masurel, E; Smit, H. P, (2000), Planning Behaviour of Small Business Management, Journal
of Small Business Management 38 (2)

222
Mazzarol, T; Reboud, S, (2006), The strategic decision-making of entrepreneurs within small
high innovator firms, International Entrepreneurship and Management Journal 2 (2): 261 –
280, DOI: 10.1007/s11365-006-8688-9
Miles, R. E; Snow, C. C, (1978), Organisation strategy, structure and process, New York
McGraw- Hill
Miller; Cardinal, (1994), Strategic planning and firm performance: a synthesis of more than
two decades of research, Academy of Management Journal 37: 1649 - 1665
Miller, D; Friesen, P. H, (1978), Archetypes of Strategy Formulation, Journal of Management
Science 24 (9): 921 – 933
324
Mintzberg, H., (1973), The Nature of Managerial Work, NY: Harper and Row.
Mintzberg, H., (1979), The Structuring of Organizations, Englewood Cliffs, NJ: Prentice
Hall.
Mintzberg, H., (1983), Power in and around Organizations , Englewood Cliffs,
NJ: Prentice Hall.
Mintzberg, H., (1987), Crafting strategy, Harvard Business Review 4 (65): 66 - 75.
Mintzberg, H, (1990), The design school: reconsidering the basic premises of
strategic management, Strategic Management Journal 3 (ll): l71-195.
Mintzberg, H. (1989), Mintzberg on Manage men t : Inside Our S t r a n g e W o r l d o f _
Organizations, New York Free Press.
Mintzberg, H., (1992), Five p's for strategy, in ,Mintzberg H., and Quinn,
J.B., The Strategy Process: Concepts and Contexts, NJ: Prentice Hall : l2-19.

223
Mintzberg, H. (1993), The pitfalls of strategic planning, California
Management Review 36 (I): 32-47.
Mintzberg, H., (1994), The rise and fall of strategic planning, Harvard
Business Review 72(I) : 107-114.
Mintzberg,H., Raisinghani, 0., and Theoret A., (1976), The structure of
unstructured' decision processes, Administrative Science Quarterly 21 (2): 246-
275.
Misuraca P, (2014), The Effectiveness of a Costs and Benefits Analysis in Making Federal
Government Decisions: A Literature Review; Center for National Security, The MITRE
Corporation
Mohr, A. T; Puck, J. F, (2005), Managing Functional Diversity to Improve Performance of
International Joint Ventures, LRP – International Journal of Strategic Management 38 (2): 145
- 162
Morris, C; McKiernan, P, (1994), Strategic Planning and Financial Performance in UK SMEs:
Does Formality Matter? British Journal of Management 5 (1): 31 - 41
Moussetis, R., Abu-Rahma, A., Nakos, G. and Kriemadis, A, (1999), Corporate political
management readiness: the relationship of environment-organization and performance, paper
presented at the Academy of Management Annual Meeting, Chicago, IL.
Moussetis, R, (2011), Ansoff revisited, Journal of Management History 17 (1): 102 - 125
Mugumbate, J., Nyanguru, A., (2013), Exploring African philosophy: The value of ubuntu in
social work, African Journal of Social Work 3 (1)
Murphy, G. B; Trailer, J. W; Hill, R. C, (1999), Measuring Performance in entrepreneurship
research, Journal of Business Research 36 (1): 15 - 23

224
Naffzig~r, D. W; Kuratko, D, (1991), An Investigation into the Prevalence of Planning in
Small Business, Journal of Business and Entrepreneurship 3 (2): 99 - 109
Naffziger, D.W; Mueller, C.B, (1999), Strategic planning in small businesses: process and
content realities, in the Proceedings of the 14th Annual USASBE Conference, San Diego, CA
Narayanan, V.K; Fahey, L. (2005), The relevance of the institutional underpinnings of
Porter’s five forces framework to emerging economies: An epistemological analysis. Journal
of Management Studies, 42(1): 207–223.
Nichols, J.E., (2012), A conflict of diamonds : The Kimberley process and Zimbabwe’s
Marange diamond fields, HeinOnline
Northcott, D. and Taulapapa, T. (2012), Sing the balanced scorecard to manage performance
in public sector organizations: The International Journal of Public Sector Management, 25 (3):
166–191
O'Brien, J. A., and Marakas, G. M. (2011), Developing Business/IT Solutions In Management
Information Systems, 488-489, New York, NY: McGraw-Hill/Irwin
O'Connor T., (2010), Strategic Planning for Distributors: Execution Isn't Everything-It's the
Only Thing!: National Association Wholesale-Distr, 49, ISBN 1934014222
O’Regan N, (2000), The Relationship Between Culture, Leadership, Strategic Planning and
Performance in Small and Medium Sized Enterprises, Thesis
O’Regan, N; Ghobadian, A, (2002), Effective Strategic Planning in Small and Medium Sized
Firms, Management Decision, 40 (7): 663 - 671.
O’Regan, N; Ghobadian, A, (2006), Perceptions of generic strategies of small and medium
sized engineering and electronics manufacturers in the UK: The applicability of Miles and
Snow typology, Journal of Manufacturing Technology Management 17 (5): 603 - 620

225
Otley, D.T. (1980), The contingency theory of management accounting: Achievement and
prognosis, Accounting, Organizations and Society, 5(4): 413-428
Pansiri, J; Temtime, Z.T, (2010) Linking firm and managers' characteristics to perceived
critical success factors for innovative entrepreneurial support, Journal of Small Business and
Enterprise Development 17(1): 45-59
Palmer, T.B; Wiseman, R.M, (1999) Decoupling risk taking from income stream uncertainty:
A holistic model of risk’, Strategic Management Journal 20: 1037–1062
Payne, R.L. and Pugh, D.S. (1976) Organization structure and climate. In Dunnette M.D, (ed.)
Handbook of industrial and organizational psychology. Chicago: Rand McNally
Pazvakavambwa, S., Hungwe, V., (2009), Land redistribution in Zimbabwe, World Bank
Pearce, A. J; Freeman, B. E; Robinson, B. R, (1987), The Tenuous Link between Formal
Strategic Planning and Financial Performance, Academy of Management Review, 12 (4): 658 -
675.
Pelham, A. M, (1995), A Longitudinal Study of the Impact of Market Structure, Firm
Structure, Strategy and Market Orientation Culture on Dimensions of Small-Firm Performance,
Journal of the Academy of Marketing Science 24 (1): 27 – 43
Pennings, J.M. (1992) Structural contingency theory: a reappraisal, In Staw, B.M; Cummings,
I.I. (Eds), Research in Organizational Behaviour 14: 267-309. Greenwich,
CT: JAI Press
Porter, M. E, (1980), Competitive strategy techniques for analyzing industries and
competitors, New York: MacMillan
Porter M. E, (2008), "The Five Competitive Forces that Shape Strategy", Harvard Business
Review, January 2008, 86-104

226
Porter, M, (1991), Towards a dynamic theory of strategy, Strategic Management Journal 12:
95 – 117
Porter, M.E., (1996), What is strategy, Harvard Business Review74 (6): 61-78.
Quinn, J.B., (1980), Strategies for Change: Logical Incrementalism, Homewood, IL:
Irwin.
Ramanujam, V; Venkatraman, N; Camillus, J. C, (1986), Multiobjective Assessment of
Effectiveness of Strategic Planning: A Discriminant Analysis Approach, Academy of
Management Journal 29: 347 - 372
Rhyne, L. C, (1986), The Relationship of Strategic Planning to Financial Performance,
Strategic Management Journal 7: 423 - 436
Robinson, R. B; Logan, J; and Salem, M, (1986), Strategic Versus Operational Planning in
Small Retail Firms, American Journal of Small Business 10 (4): 7 – 16
Robinson, R. B; Pearce, J. A, (1983), The impact of formalized strategic planning on financial
performance in small organizations, Strategic Management Journal 4: 197 - 207
Robinson, R. B; Pearce, A. J, (1984), Research Thrusts in Small Firm Strategic Planning, The
Academy of Management Review, 9 (1): 128 - 137.
Robinson, R. B; Pearce, J. A; Vozikis, G. S and Mescon, T. S, (1984), The relationship
between stage of development and small firm planning and performance, Journal of Small
Business Management 22 (2): 45 – 52.
Robu, M (2013), The dynamic importance of SMEs in the economy, the USV annals of
Economics and Public administration 13 (1): 17
Roos, J; Victor, B; Statler, M, (2004), Playing Seriously with Strategy, LRP – International
Journal of Strategic Management 37 (6): 549 – 568

227
Roper, S, (1997), Strategic initiatives and small business performance: an exploratory analysis
of Irish companies, Entrepreneurship and Regional Development, 9: 353-364
Rosa, P; Carter, S; Hamilton, D, (1996), Gender as a determinant of small business
performance: insights from a British study, Journal of Small Business Economics 8 (6): 463 -
478
Rue, L. W; Ibrahim, N. A, (1998), The relationship between planning sophistication and
performance in small firms. Journal of Small Business Management 36 (4): 24 - 32
Sarmento, Joaquim Miranda and Renneboog Luc, (2014), Public-Private Partnerships: Risk Allocation and Value for Money: Center Discussion Paper Series No. 2014-022; TILEC Discussion Paper No. 2014-017, Available at SSRN: https://ssrn.com/abstract=2411450
Saris, W; Gallhofer, I. N, (2014), Design, Evaluation and Analysis of Questionnaire for Survey
Research Interscience, John Wiley
Schmieder-Ramirez, J. and Mallette, L., (2015) Using the SPELIT Analysis Technique for Organizational Transitions, Chapter 28 of Education Applications and Developments: Science Press
Schwartz, P., (1998), The Art of the Long View, Doubleday/Currency,; John Wiley & Sons
Schwenk, R. C; Shrader, B. C, (1993), Effects of Formal Strategic Planning on Financial
Performance in Small Firms: A Meta-Analysis, Entrepreneurship Theory and Practice, 17.
Sexton, D. L; Auken, P. V, (1985), A longitudinal analysis of small business strategic planning,
Journal of Small Business Management 23 (1): 7 - 15
Silverman D., (2011), Qualitative research: issues of theory, method and practice, Los Angeles, Calif.; London, Sage 3rd ed.
Shane, S; Delmar, F, (2004), Planning for the market: business planning before marketing and
the continuation of organizing efforts, Journal of Business Venturing 19: 767 - 785

228
Shortell, S. M; Veliyath, R, (1993), Strategic Orientation, Strategic Planning System
Characteristics and Performance, Journal of Management Studies 30 (3): 359 - 381
Shrader, C. B; Mulford, L. C; Blackburn, L. V, (1989), Strategic and Operational Planning,
Uncertainty and Performance in Small Firms, Journal of Small Business Management, 27
Shrader, C. B; Taylor, C. A; Dalton, D. R, (1984), Strategic planning and organizational
performance: A critical appraisal, Journal of Management 10 (2): 149 - 171
Shuman, J. C; Shaw, G; Sussman, J, (1985), Strategic Planning in Smaller Rapid Growth
Companies, Long Range Planning Journal 18 (12): 48 - 53
Simply-strategic-planning.com. Accessed on 04.09.2014
Siegler, J. (1992), 'Manage your numbers to match your strategy*. Management Review. 81
(1): 46-48
Small Sample Techniques. The NEA Research Bulletin, 38 (Dec, 1960): 99
Smeltzer, L. R; Fann, G. L; Nikolaisen, V. N, (1988), Environmental Scanning Practices In
Small Business, Journal of Small Business Management 26 (3): 55 – 62
Steiner, G. A, (1979), Strategic management: what every manager must know, Simon and
Schuster (www.books.google.co.zw accessed on 21.06.12)
Stonehouse G. and Pemberton J., (2002), Strategic planning in SMEs – some empirical
findings, Management Decision, 40 (9); 853 - 861
Tashakkori A. and Teddlie C., (2010), Handbook of mixed methods in social and behavioral
research, second edition, Sage Publications Inc.

229
Taylor; Online, F, (1997), Strategic Initiatives and Small Business Performance: An
Exploratory Analysis of Irish Companies, Entrepreneurship and Regional Development: An
International Journal 9 (4)
The Importance of Small Businesses Web Business Monthly Register_com, Inc_files
(accessed on 18 June 2012)
The Strategic Planning Process.mht (accessed on 18 June 2012)
Thune, S. S; House, R. J, (1970), Where long-range planning pays off: Findings of a survey
of formal, informal planners, Business Horizons Journal 13 (4): 81 - 87
Trochim, W. M, (2003), Research Methods Knowledge Base,
www.socialresearchmethods.net (accessed on 18 June 2012)
Tuominen P, Reda F, Dawoud W, Elboshy B, Elshafei G, and Negm A, (2015), Economic
Appraisal of Energy Efficiency in Buildings Using Cost-effectiveness Assessment: Procedia
Economics and Finance, 21, 422–430
USAID – United States Agency for International Development, (2007), Booklet of
Standardized Small and Medium Enterprises Definition
Van de Ven, A. H; Drazin, R, (1984), The Concept of fit in Contingency Theory, Minnesota
University Minneapolis Strategic Management Research Center
Van de Ven, A; Drazin, R, (1985), The concept of fit in contingency theory, Research in
Organizational Behaviour 7: 333-365
Van Gelderen, M; Frese, M; Thurik, R, (2000), Strategies, uncertainty and performance of
small business start-ups, Journal of Small Business Economics 15 (3): 165 - 181
Vargo J; Seville E, (2011), Crisis Strategic Planning for SMEs: Finding the Silver Lining,
International Journal of Production Research 49 (18): 5619-5635

230
Veliyath, R. and Shortell, S. (1993) ‘Strategic orientation, strategic planning system
characteristics, and performance’, Journal of Management studies, 30(3): 359-381
Venkatraman, N; Ramanujam, V, (1986), Measurement of Business Performance in Strategy
Research: A Comparison of Approaches, Academy of Management Review 1 (4): 801 - 814
Venkatraman, N; Ramanujam, V, (1987), Measurement of Business Economic Performance:
An Examination of Method Convergence, Journal of Management 13 (1): 109 - 122
Verreynne, M. L; Meyer, D, (2010), Small Business Strategy and the Industry Life Cycle,
Journal of Small Business Economics 35 (4): 399 – 416, (DOI: 10.1007/s11187-008-9165-3)
Veysel, A; Yusuf, T; Kaya, H, (2012), Linking intrapreneurship activities to multidimensional
firm performance in Turkish manufacturing firms: an empirical study, International
Entrepreneurship Management Journal 8: 15 - 33
Wack, P., (1985), The Gentle Art of Re-perceiving, Harvard Business Review
Way, S. A, (2002), High Performance Work Systems and Intermediate Indicators of Firm
Performance: tests of contingency and configurational models, Strategic Management Journal
18 (9): 677 – 695
Weinzimmer, L.G; Nystrom, P.C; Freeman, S.J, (1998) Measuring organizational growth:
issues, consequences and guidelines, Journal of Management, 24(2): 235-262
Welsh, J. A; White, J. F, (1981), A small business is not a little big business, Harvard Business
Review: 18 – 32
Wheelan, T. L; Hunger, J. D, (1989), Instructor’s manual to accompany strategic management
and business policy, (www.books.google.co.zw, accessed on 21.06.12)
Whipp, R, (2002), Strategy, Organizational, International Encyclopedia of the Social &
Behavioral Sciences: 15151 – 15154.

231
White; Hamermesh, R. G, (1981), Toward a model of business unit performance: An
integrative approach, The Academy of Management Review 6 (2): 213 - 223
White, S; Leung, K, (2004), Handbook of Asian Management
Wijewardena, H; Zoysa, A. D; Fonseka, T; Perera, B, (2004), The Impact of Planning and
Control Sophistication on Performance of Small and Medium-Sized Enterprises: Evidence
from Sri Lanka, Journal of Small Business Management – Advancing Entrepreneurship
Research Worldwide 42 (2): 209 – 217
Wiklund, J, (1999), The Sustainability of the Entrepreneurial Orientation – Performance
Relationship, Journal of Entrepreneurship: Theory and Practice 24
World Bank Group, (2015): Doing Business
Wood, D. R; Laforge, R. L, (1979), The Impact of Comprehensive Planning on Financial
Performance, Academy of Management Journal 22: 516 – 526
Woodward, J. (1965), Industrial organization - Theory and practice, London, U.K.: Oxford
University Press
www.msmed.gov.zw (Ministry of SMEs, Zimbabwe – accessed on 18.06.2014)
www.seda.org.za, (2010), The Small Business Monitor retrieved on 24 April 2014
Yin R. K., (2014), Case study research : design and methods; Los Angeles : SAGE 5th ed.
Yin R. K., (2014), Qualitative research from start to finish; New York, Guilford Press
Young, G. I. M. (1970), Feasibility studies: Appraisal Journal 38 (3) 376-383

232
Zahra, S, (1996), Technology strategy and new venture performance: a study of corporate-
sponsored and independent, Journal of Business Venturing 11 (4), 289

233
Appendix 1 : SME studies showing a relationship between strategy and performance
Study Sample Type
& Size
Measures of
Strategic
Planning
Performance
Measures
Findings
Schwenk &
Shrader (1993)
14 small firms -use of external
assistance; use of
sophisticated
strategic
planning; use of
planning
formality
-Sales growth
-Return on assets
A link between
planning and
performance was
revealed
Barker et al
(1993)
194 small
firms
-emphasis on
regular strategic
planning, written
plans & top
management
involvement
-profitability;
marketing mix;
industry leadership;
decision making;
communication/unity ;
motivation
Completion of
strategic
planning is
positively
associated with
profitability
Joyce, Seaman
& Woods
(1995)
301 small
firms
Emphasis on
strategic
planning,
informal strategy
& evolutionary
strategy
Short term growth,
increase in staff
numbers, investment in
new technology
Strategic firms
are more likely
to grow and have
increased
employment,
increased
investment in
new technology
& greater
innovation
success
Karger &
Parnell (1996)
47 small banks Use of planning
characteristics;
external &
internal
Satisfaction with
financial outcome;
organisational
creativity in planning
A link between
strategy &
performance was
found.

234
orientation,
functional
integration,
resources for
strategy, planning
techniques & a
focus on control
Roper (1997) 703 small
firms
Emphasis on
introducing new
products;
expanding into
new export
markets; quality;
MIS; consensual
management;
centralising
control or
ownership
Growth; profitability Significant link
between
strategic
initiatives &
asset utilisation /
profitability but
no evidence of a
link between
strategic
initiatives &
their turnover to
assets ratio
Naffziger &
Mueller (1999)
71 small firms Degree of officer
involvement,
communication
methods, degree
of formal
planning and the
collection of
information &
time spent on
planning
Service quality
improvement, changes
in productivity &
market share
High degree of
satisfaction on
the use of
strategic
planning based
on the
performance
measures
Gibson &
Cassar (2005)
2956 small
firms
Existence of
documented
plans
Sales & employment
growth
Association
between
planning activity
and performance

235
Verreynne &
Meyer (2010)
320 small
firms
Participative,
adaptive &
simplistic
strategy making
Sales growth; cash
reserves; return on
equity; gross profit; net
profit; return on
investment; growth in
funding sources; ratio
of profit to sales
Simplistic,
participative &
adaptive; the 3
approaches to
planning are
related to firm
performance

236
Appendix 2: Definitions of Strategy Chandler (1962) The determination of the basic long-term goals of an enterprise and the
adoption of courses of action and the allocation of resources necessary
for carrying out these goals.
Andrews (1971) The pattern of major objectives, purposes or goals and essential
policies or plans for achieving those goals, stated in such a way as to
define what business the company is in, or is to be in, and the kind of
company it is or is to be
Hofer & Schendel
(1978
Strategy is concerned with the development of a viable match between
the opportunities and risks present in the external environment and the
organisation capabilities and resources for exploiting these opportunities
Steiner (1979) The process of determining the mission, major objectives, strategies, and
policies that govern the acquisition and allocation of re-sources to
achieve organizational aims.
Ansoff (1979) The positioning and relating of the organisation to its environment in a
way which will assure its continued success and make it secure from
surprises
Porter (1980) taking offensive or defensive actions to create a dependable position in
an industry, to cope successfully with the five competitive forces and
thereby yield a superior return on investment for the firm
Quinn (1981) Strategy is a pattern or plan that integrates an organisation's major
goals, policies, and action sequences into a cohesive whole
Carroll (1982) Strategy is a statement of important action to be taken to improve
relative performance by allocating limited resources, which reflects an
understanding of the principle economic forces affecting the business,
of the external changes to the business requiring a response, and of the
role to be played by competitors
Van
Cauwenbergh
& Cool (1982)
Strategy is calculated behaviour in non-programmed situations

237
Mintzberg (1987) Plan: Strategy as plan is some sort of consciously intended course of
action or a set of guidelines to deal with a situation and shows the firm
how to reach its intended position from its current state.
Ploy: Strategy as ploy could be a specific manoeuvre intended to outwit
an Opponent or competitor so that competitive scenario turns in its
favour.
Pattern: Strategy as pattern refers to pattems in a stream of actions and
by this definition strategy is consistency in behaviour, whether or not
intended.
Position: It is a means of locating an organisation in an environment and
by this definition strategy becomes a mediating force between
organisation and environment.
Perspective: Strategy as perspective refers to the way a firm perceives
the world and suggests that strategy is a concept
Kerin et.al (1990) Pattern of planned (logical) and present (developing) objectives,
resource deployments, interactions of an organization with markets,
competitors, and other environmental aspects
Herter (1995) A strategic plan answers the age old questions such as where are you
now, where do you want to be, and how are you to get there
Johnson and
Scholes (1997)
Strategy is the direction and scope of an organisation over the long term:
which achieves advantage for the organisation through its configuration
of resources within a changing environment, to meet the needs of
markets and to fulfil stakeholder expectations
Drucker (1999) Supports organisations in realising their desired goals and objectives in
an unstable and dynamic environment
Whipp (2002) Strategy involves identifying the long-term goals of an organization, the
allocation of appropriate resources and matching both to the
environment
Woods and Joyce
(2003)
A set of beliefs on how a firm can achieve success
Barney &
Hesterly
A firm's strategy is defined as its theory about how to gain competitive
advantages.

238
(2006)
Hitt, Ireland &
Hoskisson (2007)
A strategy is an integrated and coordinated set of commitments and
actions designed to exploit core competencies and gain competitive
advantage.
Johnson, Scholes
& Whittington
(2008)
Strategy is the direction and scope of an organisation over the long term,
which achieves advantage in a changing environment through its
configuration of resources and competences with the aim of fulfilling
stakeholder expectations.
Burke, Fraser and
Greene (2010)
A statement of the organisation’s vision, general operations and
direction

239
Appendix 3: Conceptual framework
Established planners
New planners
Established non-planners s
New non-planners
Poor Good
Performance
Hostile environment adversely impacting on performance
Flexible plans. Strong controls, proactive management & entrepreneurial spirit
Growing intelligence database. Resources still scant
Strong controls. Entrepreneurial spirit
More reactive than proactive. Intuitive processes in use. No formal plans
Emergent approaches to planning utilised plus strong entrepreneurial drive
Limited systems. Lack of planning hampers direction
Growth driven by entrepreneurial spirit. Central command & control – tacit controls

240
Appendix 4: QUESTIONNAIRE Please note that the information provided in this questionnaire will remain confidential. The questionnaire seeks to analyse the relationship between formal strategic planning and performance in the small and medium enterprises sector. Please respond to the questionnaire by inserting X in the appropriate box and make comments where requested.
SECTION A
2. Indicate the form of your organisation
Sole proprietorship
(1)
Pvt Ltd company (2)
Partnership (3) Public Ltd company (4)
3. Indicate your industry type
Services Manufacturing Construction Retail Wholesale Other 1 2 3 4 5 6
4. Your business has been in operation since
Since June 2011 1 Since 2007 2 Before 2007 3
5. Please state total numbers of employees in the years 2013, 2014, 2015 and estimated for 2016
2013 2014 2015 2016
6. Please state gross sales income in the years 2013, 2014, 2015 and estimated for 2016
2013 2014 2015 2016
SECTION B - Formality of the organization's planning and planning process
7. Place an X against statements from the following which are true about your organization:
3. The organisation has no written strategic plan covering at least three years into the future
1
4. The organisation has a written strategic plan which: f) Has a vision and mission statement 2 g) Covers at least three years into the future 3 h) Includes the specification of objectives and goals 4 i) Includes the selection of long-range strategies 5

241
j) Includes the determination of the future resources required 6
8. The organization has a written strategic plan which incorporates all five elements of answer (a) to (e) above:
Yes 1 No 2
9. The organisation also has procedures for anticipating or detecting error in or failures of the plan and for preventing or correcting them on a continuing basis
Yes 1 No 2
10. The procedures above make some attempt to account for factors outside the immediate environment of the organization
Yes 1 No 2
11. Under number 5 above, if you have ticked 2b, for how long have you been carrying out formal strategic planning? ……………………………….
12. Briefly explain what made you start to plan formally …………………………………………….. ……………………………………………………………………………………………………………………………………
13. What other reasons do you think prompt small businesses to start formal strategic planning? …………………………………………………………………………………………………………………. …………………………………………………………………………………………………………………………………..
14. Do you see your business continuing to do formal strategic planning in future?
Yes 1 No 2
15. Why do you say so? ………………………………………………………………………………………………………….. …………………………………………………………………………………………………………………………………………….

242
16. If you have not ticked 2(b) under number 5 above, do you do any planning at all? Yes 1 No 2
17. If yes, then briefly explain how you do your planning and what period of time the plans cover ……………………………………………………………………………………………………………… ………………………………………………………………………………………………………………………………… ………………………………………………………………………………………………………………………………….
18. Do you see your organisation continuing to plan in this way? (Yes…) (No …) 19. Explain why you do not plan in the way suggested in 2a to 2e (under number 5 above)
…………………………………………………………………………………………………………………………………………………………………………………………………………………………………………………………………………
20. If you are not planning formally, have you done formal strategic planning before?
Yes 1 No 2
21. If your answer to the above is yes, what prompted you to stop formal strategic planning? …………………………………………………………………………………………………………………
22. In your own opinion, what other reasons do you think force companies to stop formal strategic planning? …………………………………………………………………………………………………………………………………
23. If your response to 14 above is no, state your reasons for not planning ………………… ………………………………………………………………………………………………………………………………..
24. Do you see your organisation continuing not to plan? (Yes …) (No …) 25. Explain your answer
……………………………………………………………………………………………….. …………………………………………………………………………………………………………………………………
Thank you very much for your valuable time and cooperation

243
Appendix 5: INTERVIEW GUIDE Researcher: Emmanuel Rufasha Aim of the study: The objective of the study is to analyse the relationship between formal strategic planning and performance in the small and medium enterprises sector, and the implications, inter-alia, for practitioners, policy makers, funding agencies. Confidentiality & anonymity: Confidentiality is assured and names of respondents will not be disclosed. Please respond to the schedule by answering all applicable questions.
Interview code number: ............
1. Please state your sector and what business your enterprise is in ……………………………………………………………………………………………………………………………………………………………………………………………………………………………………………………………………………………………….
2. How do you envisage the future economy of your sector (i.e. turbulent, stable, uncertain or certain) and give reasons why you say so ……………………………………………………………………………………………………………………………………………………………………………………………………………………………………………………………………………………………………………………………………………………………………………………………………………………………………………..
3. What were your gross sales and forecast for the following years? 2013 2014 2015 2016
, and in your opinion, what factors have caused your enterprise to be at its current level of performance ………………………………………………………………………………………………………………………………………………………………………………………………………………………………………………………………………………………………………………………..
b) In what way do your profits relate to the gross sales figures? …………………………………………………………………………………………………………………………………………………………………………………………………………………………………………………………………………………………………………………………
c) Please state total number of employees in the years 2013, 2014, 2015 and estimated for 2016

244
2013 2014 2015 2016
State the reason(s) for the variability in employee numbers over the years. ……………………………………………………………………………………………………………………………………………………………………………………………………………………………………………………………………………………………………………………………………………………………………………………………………………………………………………..
4. Considering the economy, do you envisage your business growing, contracting, or staying the same over the next five (5) years and why ……………………………………………………………………………………………………………………………………………………………………………………………………………………………………………………………………………………………………………………………………………………………………………………………………………………………………………………………………………………………………………………………………………………
5. How will you plan for the above? ……………………………………………………………………………………………………………………………………………………………………………………………………………………………………………………………………………………………………………………………………………………………………………………………………………………………………………………………………………………………………………………………………………………
6. On a scale of 1 to 4, 1 being no, 2 – low, 3 – medium, and 4 – high, please respond to the following: a) Changes in the economic environment affect our business …………., and give
reasons for saying so ………………………………………………………………………………………………………………………………………………………………………………………………………………………………………………………………………………………………………………………………………………………………………………………
b) Changes in the political environment affect our business …………., and provide reasons for your answer ………………………………………………………………………………………………………………………………………………………………………………………………………………………………………………………………………………………………………………………………………………………………

245
……………………………………………………………………………………………………………………………………………………
c) Competition intensity and hostility affects our business ………., and give reasons for your answer ………………………………………………………………………………………………………………………………………………………………………………………………………………………………………………………………………………………………………………………………………………………………………………………
7. Do you have a written strategic plan covering at least three (3) years into the future? …….. If not, then are you involved in any form of planning? ………………. If yes, please explain how regularly you plan, the time period that your plans cover, and how you do your planning. ……………………………………………………………………………………………………………………………………………………………………………………………………………………………………………………………………………………………………………………………………………………………………………………………………………… b) If you answered yes to the second question in 7 above, can you state the advantages of the type of planning you carry out compared to the other type of planning mentioned in the first question in 7 above. ………………………………………………………………………………………………………………………………………………………………………………………………………………………………………………………………………………………………………………………………………………………………………………………………………………
8. If you have answered no to both questions in 7 above, please state why you do not plan ………………………………………………………………………………………………………………………………………………………………………………………………………………………………………………………………………………………………………………………………………………………………………………………………………………
9. Do you have a vision and mission statement? …………………. 10. If you plan, is your plan subject to any changes before the end of the period?
…………, and if so state reasons why and also advise on the time intervals for such changes ……………………………………………………………………………………………………………………………………………………………………………………………………………………………………………………………………………………………………………………………………………………………………………………………………………………………………………………………………………………………………………………………………………………

246
11. Has your business been in operation before 2007 or since 2007? ……………… Do you see any relationship between the age of your firm and how you plan? ………………………………………………………………………………………………………………………………………………………………………………………………………………………………………………………………………………………………………………………………………………………………………………………………………………
12. If you are involved in planning, can you show which tools and techniques of planning you use, how you use them and why you don’t use them in the case of non-usage
Planning tool/ technique
Used (Yes/no)
If yes, how do you use it and is it helpful?
If no, state why you do not use it
SWOT analysis
PESTLE/PESTEL analysis
Ansoff matrix
Value for money analysis
Cost benefit analysis
Continuity planning
Key issues analysis
Scenario planning
Competitive analysis
Goals grid/matrix

247
Supply chain analysis
Critical success factors
Stakeholder analysis
Balanced score card
BCG matrix
Feasibility studies
VRIO analysis
GAP analysis
PEST analysis
Porter’s 5 forces
13. Is your expenditure always, sometimes or never more than the budgeted expenditure? …………….. Give reasons for your answer ………………………………………………………………………………………………………………………………………………………………………………………………………………………………………………………………………………………………………………………………………………………………………………………………………………

248
14. Can you say you always, sometimes or never have fairly sufficient information on competitors for use in your planning? …………………. Can you explain your response? ………………………………………………………………………………………………………………………………………………………………………………………………………………………………………………………………………………………………………………………………………………………………………………………………………………
15. Can you confirm that your business always, sometimes or never manages to have some financial savings……………………… Explain why you say so ………………………………………………………………………………………………………………………………………………………………………………………………………………………………………………………………………………………………………………………………………………………………………………………………………………
Thank you very much for your assistance
Copyright © 2022 FDOKUMEN