
Thesis-2014-Mariani_2.pdf - CERN Document Server
232
CERN-THESIS-2014-363
-
Upload
khangminh22 -
Category
Documents
-
view
2 -
download
0
Transcript of Thesis-2014-Mariani_2.pdf - CERN Document Server

CER
N-T
HES
IS-2
014-
363

Politecnico di Milano
Energy Department
Doctoral Programme in Materials Engineering
Development of Novel, Advanced
Molybdenum-based Composites
for High Energy Physics
Applications
Doctoral Dissertation of:
Nicola Mariani
Supervisor:
Ing. Alessandro Bertarelli (CERN)
Tutor:
Prof. Marco Beghi (Politecnico di Milano)
The Chair of the Doctoral Program:
Prof. Chiara Castiglioni (Politecnico di Milano)
Cycle XXVI - 2014

Supervisor:
Ing. Alessandro Bertarelli (CERN)
Tutor:
Prof. Marco Beghi (Politecnico di Milano)
The Chair of the Doctoral Program:
Prof. Chiara Castiglioni (Politecnico di Milano)
ii

To Valentina, my family and my friends...

Acknowledgements
I would like to acknowledge all the people who contributed to this extraor-
dinary project, but of course they are so many that I here there will be only
a very short selection.
First of all a special thank must be given to Alessandro Bertarelli (CERN
EN/MME), who supervised this work with incredible energy and tons of
ideas giving the right fuel for exploring new, unknown territories. The sec-
ond most important person who contributed to this work is Stefano Bizzaro
from BrevettiBizz: he not only provided an invaluable experience on mate-
rials and production techniques, but also helped me to grow and understand
the world surrounding us from all the possible perspectives, thus allowing
the realization of my projects. Afterwards, I want to give another special
thank to Prof. Marco Beghi, who assisted me in my personal and univer-
sity path since many many years, always believing in me and giving his
extraordinary support.
Then the other members of the Project Engineering section: Alessandro
Dallocchio, Federico Carra, Luca Gentini, Benoit Riffaud, Didier Steyaert
and Marc Timmins, Marco Garlasch, Edyta Krzyzak, Guillaume Maitre-
jean, Elena Quaranta and many other students who did a part of the road
with us: we shared this years at CERN and during all this time I knew
I could count on their help and their friendship, so I want to thank them
once more for everything and I wish them all the best!
Following I would like to thank all the colleagues from the MME group,
too many to be cited here, and the people working with us on the EuCard
activities, with a special mention for Lorenzo Peroni and Martina Scapin
of Politecnico di Torino, Michael Kitzmantel and Erich Neubauer of RHP
Technology, and Alexander Ryazanov of NRC-Kurchatov Institute.

Finally, my last big thank goes to my girlfriend Valentina, my family and
my friends who bear me during this long and difficult years: I know it has
been hard for you too but I love you all!

Abstract
Newly introduced particle accelerators such as the Large Hadron Collider
(LHC) of CERN (Geneva, CH) exhibit a huge increase in the energy stored
inside the accelerated beam with respect to previous machines, bringing
to the need of more efficient, reliable and robust Collimation Systems to
properly clean the beam from outgoing particles and protect the rest of the
accelerator in case of accidental beam impacts on sensitive and expensive
components such as superconducting magnets or particle detectors.
The research on new materials for Beam Intercepting Devices (BID) is there-
fore receiving strong interest at CERN and in the rest of the particle accel-
erators community with the aim to improve the cleaning efficiency and the
robustness of BID. In that framework the aim of the present PhD work is
to develop, characterize and produce new composite materials to be used
in LHC Collimators active part (socalled Jaw) that must satisfy multiple
requirements in terms of: density and average atomic number (Cleaning Ef-
ficiency), electrical conductivity (RadioFrequency Impedance), mechanical
strength at high strain rates (Impact Resistance), thermal conductivity and
thermal expansion (Thermal Stability). In addition, since the material will
be heavily irradiated during its life cycle, it must not contain elements that
create dangerous isotopes and must be able to withstand high cumulated
doses before to lose its properties by radiation induced degradation.
The thesis work has been divided into two main multidisciplinary axes that
are strongly interconnected between each other: the novel composites R&D
and their characterization in standard conditions and second the experi-
mental testing of proposed materials against a real proton beam impact,
supported by realtime measurements and postimpact analysis.

The first part included a preliminary study of present solutions and available
composites, the characterization of already developed materials like Copper
Diamond (CuCD, developed by RHP Technology, Seibersdorf, AT), and
finally the research, development and characterization of new Molybdenum
based composites.
CuCD is a metal matrix composite produced by Rapid Hot Pressing (RHP)
of Copper, Boron and diamond powders especially developed for thermal
management applications. The combination of the good physical proper-
ties of diamonds (high thermal conductivity, low thermal expansion and
density) with the electrical conductivity of Copper give rise to a material
having a thermal conductivity ≈ 25% higher than Copper OFE with a
thermal expansion coefficient at RT of only 7 ppm/K. Unfortunately, the
intrinsic brittleness of such material combined with its thermal instability
at higher temperatures are limiting the material appealing, so that a sec-
ond R&D program has been established to overcome such limitations by
exploring alternative composite families with higher thermal stability at
high Temperature.
The R&D of Molybdenum-based composites has been carried out in collab-
oration with the private company BrevettiBizz (Verona, IT) between 2011
and 2013, and has been managed by the student who provided propos-
als for compositions and production cycles, microstructural, thermal and
mechanical characterization and interpretation of results. The supporting
thermo-mechanical characterization has been made under standard condi-
tions using ad-hoc experimental apparatus that in certain cases has been
designed and produced inside CERN EN/MME with the contribution of the
student, like the thermal conductivity and thermal conductance measuring
apparatus described in the thesis work. Molybdenum has been chosen as the
main element because of its extraordinary mechanical properties combined
with very high Thermal Stability and a good chemical affinity with carbon
materials like diamond and graphite. The most important milestones in
the materials R&D presented in the thesis work are Molybdenum - Cop-
per - Diamond (MoCuCD), Molybdenum Carbide - Graphite (MoGR) and

Molybdenum Carbide - Graphite - Carbon Fibers (MoGRCF).
• MoCuCD has been a great improvement of CuCD from the mechanical
point of view (thanks to the formation of Molybdenum carbides at
the interface between diamonds and Molybdenum) but the presence
of Copper used to fill the interstitials is still limiting its resistance to
high Temperatures;
• MoGR relies on the high temperature reaction between Molybdenum
and graphite to promote the complete transformation of Molybdenum
in refractory carbide Mo2C. One peculiarity of Mo2C is its metal like
electrical conductivity that results in a conductive MoGR composite.
In addition MoGR is completely refractory (TM >2500oC) and has
a very high Thermal Stability, but does not shine for physical and
mechanical properties;
• MoGRCF, finally, includes the refractory behaviour of MoGR while
enhancing its thermal and physical properties by the addition of Car-
bon Fibers. The material is then sintered in liquid phase to melt and
squeeze the Mo2C phase and let it fill the interstitials between Fibers.
The result is an outstanding material with a thermal conductivity in
excess of 700 W/mK and a density of only 2.8g/cm3.
The second part of the thesis is the final testing of proposed materials
against a direct beam impact to compare the different collimator materials
in a reallife accidental situation. Preliminary hydrodynamic FEM analysis
of the beam impact have been performed to predict the damage entity on
standard collimator related materials. The simulations have been carried
out using the commercial code Autodyn involving nonlinear materials mod-
els like Equations Of State and complex strength and failure models. The
simulations allowed to predict (for known materials) the physical effective
damage on the materials impacted by the proton beams and to properly
tune the design of the samples and the sample holder in order to obtain
measurable parameters with the proposed experimental apparatus. The ex-
periment, id. HRMT −14, took place into the HiRadMat facility at CERN

(High Radiation to Materials) during SeptemberOctober 2012, entailing the
controlled impact on 6 different Collimator materials with increasing proton
beam intensities of the Super Proton Synchrotron particles accelerator of
CERN (operating at 440 GeV). The energy of the impacts was enough to
observe the samples explosion by high speed video camera (during the high
intensity shots) and the observation of macroscopic damage on impacted
samples.
Finally, the proposed comparison of the different materials will be the back-
ground for the final choice of the LHC Collimator materials to be taken in
next years at CERN.
Keywords: Beam Intercepting Devices (BID); LHC Collimators; Carbon
Fiber Carbon (CFC); Inermet180; Molybdenum; Glidcop; metal-diamond
composites; Copper-Diamond (CuCD); metal carbide graphite composites;
metal carbide carbon fibers reinforced composites; Molybdenum-Copper-
Diamond (MoCuCD); Molybdenum Carbide-Graphite composite (MoGR);
Molybdenum Carbide-Graphite-Carbon Fibers composite (MoGRCF); Rapid
Hot Pressing (RHP); Liquid Phase Sintering (LPS); HiRadMat; proton
beam impacts; hydrodynamic simulations; Autodyn.

Contents
List of Figures xiv
List of Tables xxv
1 Thesis Structure 1
2 Thesis Motivations 3
2.1 Aim of the Thesis . . . . . . . . . . . . . . . . . . . . . . . . . . . . . . . 3
2.2 Context . . . . . . . . . . . . . . . . . . . . . . . . . . . . . . . . . . . . 3
2.3 Overview of PhD activities . . . . . . . . . . . . . . . . . . . . . . . . . 4
3 Introduction to LHC Collimators 6
3.1 The Large Hadron Collider (LHC) . . . . . . . . . . . . . . . . . . . . . 6
3.2 LHC Layout & Experiments . . . . . . . . . . . . . . . . . . . . . . . . . 8
3.3 LHC Collimation System . . . . . . . . . . . . . . . . . . . . . . . . . . 11
3.3.1 Beam Cleaning . . . . . . . . . . . . . . . . . . . . . . . . . . . . 12
3.3.2 Machine Protection . . . . . . . . . . . . . . . . . . . . . . . . . 13
3.3.3 Beam Matter Interaction Principles . . . . . . . . . . . . . . . . 14
3.3.4 LHC Collimators Requirements . . . . . . . . . . . . . . . . . . . 16
3.4 Overview of LHC Collimators Design . . . . . . . . . . . . . . . . . . . . 18
3.4.1 Present LHC Collimators design . . . . . . . . . . . . . . . . . . 18
3.4.2 Future HL-LHC Collimators . . . . . . . . . . . . . . . . . . . . . 19
4 State of the Art of LHC Collimator Materials 22
4.1 Survey of LHC Collimators Materials . . . . . . . . . . . . . . . . . . . . 22
4.1.1 Carbon Fibres Carbon composites . . . . . . . . . . . . . . . . . 23
4.1.2 Graphite . . . . . . . . . . . . . . . . . . . . . . . . . . . . . . . 25
viii

CONTENTS
4.1.3 Tungsten Heavy Alloys . . . . . . . . . . . . . . . . . . . . . . . 25
4.1.4 Dispersion Strengthened Copper . . . . . . . . . . . . . . . . . . 26
4.1.5 Molybdenum . . . . . . . . . . . . . . . . . . . . . . . . . . . . . 28
4.2 BID Materials Figures of Merit . . . . . . . . . . . . . . . . . . . . . . . 29
4.3 Benchmarking of present Collimator materials . . . . . . . . . . . . . . . 32
5 Analytical Modelling of Composite Materials Properties 34
5.1 Introduction to Composite Materials . . . . . . . . . . . . . . . . . . . . 34
5.2 Physical Properties . . . . . . . . . . . . . . . . . . . . . . . . . . . . . . 37
5.2.1 Electrical Properties . . . . . . . . . . . . . . . . . . . . . . . . . 37
5.3 Mechanical Properties . . . . . . . . . . . . . . . . . . . . . . . . . . . . 38
5.3.1 Elastic Constants of Orthotropic Materials . . . . . . . . . . . . 40
5.3.2 Strength and Failure of Composite Materials . . . . . . . . . . . 42
5.4 Thermal Properties . . . . . . . . . . . . . . . . . . . . . . . . . . . . . . 43
5.4.1 Thermal Conductivity . . . . . . . . . . . . . . . . . . . . . . . . 43
5.4.2 Coefficient of Thermal Expansion . . . . . . . . . . . . . . . . . . 46
5.4.3 Specific Heat . . . . . . . . . . . . . . . . . . . . . . . . . . . . . 46
6 Composite Materials Characterization Techniques 47
6.1 Preliminary Non-destructive Analysis . . . . . . . . . . . . . . . . . . . 47
6.1.1 Density . . . . . . . . . . . . . . . . . . . . . . . . . . . . . . . . 47
6.1.2 Electrical Conductivity . . . . . . . . . . . . . . . . . . . . . . . 48
6.2 Samples Preparation . . . . . . . . . . . . . . . . . . . . . . . . . . . . . 49
6.3 Microstructural Analysis . . . . . . . . . . . . . . . . . . . . . . . . . . . 51
6.3.1 Imaging through Optical and SE Microscopy . . . . . . . . . . . 52
6.3.2 X-Rays Diffraction . . . . . . . . . . . . . . . . . . . . . . . . . . 54
6.4 Mechanical Characterization . . . . . . . . . . . . . . . . . . . . . . . . . 54
6.4.1 Ultimate Strength . . . . . . . . . . . . . . . . . . . . . . . . . . 56
6.4.2 Elastic properties . . . . . . . . . . . . . . . . . . . . . . . . . . . 57
6.5 Thermal Characterization . . . . . . . . . . . . . . . . . . . . . . . . . . 57
6.5.1 Thermal Conductivity . . . . . . . . . . . . . . . . . . . . . . . . 57
6.5.2 Coefficient of Thermal Expansion . . . . . . . . . . . . . . . . . . 62
6.5.3 Specific Heat . . . . . . . . . . . . . . . . . . . . . . . . . . . . . 63
ix

CONTENTS
7 Copper - Diamond (CuCD) Composites 64
7.1 Introduction to diamond-reinforced MMC . . . . . . . . . . . . . . . . . 64
7.1.1 Diamond Properties . . . . . . . . . . . . . . . . . . . . . . . . . 66
7.1.2 Diamond Degradation . . . . . . . . . . . . . . . . . . . . . . . . 68
7.1.2.1 Superficial Graphitization . . . . . . . . . . . . . . . . . 69
7.1.2.2 Bulk Graphitization . . . . . . . . . . . . . . . . . . . . 70
7.2 CuCD for BID . . . . . . . . . . . . . . . . . . . . . . . . . . . . . . . . 71
7.2.1 CuCD Production . . . . . . . . . . . . . . . . . . . . . . . . . . 73
7.2.2 CuCD Characterization . . . . . . . . . . . . . . . . . . . . . . . 73
7.2.2.1 Microstructural Analysis . . . . . . . . . . . . . . . . . 73
7.2.2.2 CuCD Radiation Hardness . . . . . . . . . . . . . . . . 78
7.3 Conclusions on CuCD . . . . . . . . . . . . . . . . . . . . . . . . . . . . 81
8 Molybdenum - Copper - Diamond (MoCuCD) Composites 83
8.1 MoCuCD for BID . . . . . . . . . . . . . . . . . . . . . . . . . . . . . . 83
8.2 MoCuCD Production . . . . . . . . . . . . . . . . . . . . . . . . . . . . . 85
8.2.1 Production Cycle Improvements . . . . . . . . . . . . . . . . . . 85
8.2.2 Oxygen content reduction . . . . . . . . . . . . . . . . . . . . . . 86
8.2.3 Choice of Diamond Type . . . . . . . . . . . . . . . . . . . . . . 87
8.2.4 Particles Coatings . . . . . . . . . . . . . . . . . . . . . . . . . . 88
8.2.5 Copper Coated Diamonds . . . . . . . . . . . . . . . . . . . . . . 89
8.2.5.1 Sample Preparation and SEM Imaging . . . . . . . . . 89
8.2.5.2 EDS Analysis . . . . . . . . . . . . . . . . . . . . . . . 91
8.3 MoCuCD Characterization . . . . . . . . . . . . . . . . . . . . . . . . . 92
8.3.1 MoCuCD with Copper Coated Diamonds (MoCucCD) . . . . . . 94
8.3.1.1 Composition . . . . . . . . . . . . . . . . . . . . . . . . 94
8.3.1.2 Microstructural Analysis . . . . . . . . . . . . . . . . . 94
8.3.1.3 MoCucCD results . . . . . . . . . . . . . . . . . . . . . 94
8.3.1.4 Conclusions on MoCucCD . . . . . . . . . . . . . . . . 99
8.3.2 MoCuCD . . . . . . . . . . . . . . . . . . . . . . . . . . . . . . . 99
8.3.2.1 Composition . . . . . . . . . . . . . . . . . . . . . . . . 99
8.3.2.2 Microstructural Analysis . . . . . . . . . . . . . . . . . 100
8.3.2.3 Mechanical Characterization . . . . . . . . . . . . . . . 100
x
CONTENTS
8.3.2.4 Thermal Characterization . . . . . . . . . . . . . . . . . 107
8.3.2.5 Electrical Characterization . . . . . . . . . . . . . . . . 108
8.3.2.6 MoCuCD Results . . . . . . . . . . . . . . . . . . . . . 109
8.4 Conclusions on MoCuCD . . . . . . . . . . . . . . . . . . . . . . . . . . 110
9 Molybdenum Carbide - Graphite (MoGR) Composites 113
9.1 Introduction to carbide-reinforced CMC . . . . . . . . . . . . . . . . . . 113
9.1.1 Previous R&D on Metal Carbide - Graphite Composites . . . . . 114
9.1.2 Graphite Properties . . . . . . . . . . . . . . . . . . . . . . . . . 115
9.1.3 Molybdenum Carbide Properties . . . . . . . . . . . . . . . . . . 119
9.2 MoGR for LHC Collimators . . . . . . . . . . . . . . . . . . . . . . . . . 120
9.3 MoGR Production . . . . . . . . . . . . . . . . . . . . . . . . . . . . . . 120
9.3.1 Molybdenum Carbide formation reaction . . . . . . . . . . . . . 120
9.3.2 Sintering Aids in High Temperature sintering . . . . . . . . . . . 121
9.3.3 Production cycle improvements . . . . . . . . . . . . . . . . . . . 122
9.3.4 MoGR R&D . . . . . . . . . . . . . . . . . . . . . . . . . . . . . 123
9.4 MoGR Characterization . . . . . . . . . . . . . . . . . . . . . . . . . . . 125
9.4.1 Microstructural Analysis . . . . . . . . . . . . . . . . . . . . . . . 126
9.4.2 Graphite Orientation . . . . . . . . . . . . . . . . . . . . . . . . . 129
9.5 Conclusions on MoGR . . . . . . . . . . . . . . . . . . . . . . . . . . . . 130
9.5.1 MoGR Properties estimation . . . . . . . . . . . . . . . . . . . . 131
9.5.2 Final Results of MoGR R&D . . . . . . . . . . . . . . . . . . . . 132
10 Molybdenum Carbide Graphite Carbon Fiber (MoGRCF) Compos-
ites 134
10.1 Introduction to Carbon Fiber-reinforced CMC . . . . . . . . . . . . . . . 134
10.2 Carbon Fibers Properties . . . . . . . . . . . . . . . . . . . . . . . . . . 135
10.2.1 Comparison of Carbon Fibers . . . . . . . . . . . . . . . . . . . . 136
10.2.2 Production techniques . . . . . . . . . . . . . . . . . . . . . . . . 138
10.2.3 Structure of Carbon Fibers . . . . . . . . . . . . . . . . . . . . . 141
10.3 MoGRCF Production and Characterization . . . . . . . . . . . . . . . . 145
10.3.1 Solid Phase Sintering of MoGRCF . . . . . . . . . . . . . . . . . 145
10.3.1.1 Solid State MoGRCF Characterization . . . . . . . . . 146
10.3.1.2 Conclusions on Solid State MoGRCF . . . . . . . . . . 147
xi

CONTENTS
10.3.2 Liquid Phase MoGRCF . . . . . . . . . . . . . . . . . . . . . . . 151
10.3.2.1 Liquid Phase MoGRCF Characterization . . . . . . . . 152
10.3.2.2 Conclusions on Liquid Phase MoGRCF . . . . . . . . . 159
10.4 Conclusions on MoGRCF . . . . . . . . . . . . . . . . . . . . . . . . . . 164
11 High Energy Beam Impacts on Materials 166
11.1 Introduction to Thermally Induced Dynamic Phenomena . . . . . . . . 166
11.1.1 Shock waves . . . . . . . . . . . . . . . . . . . . . . . . . . . . . . 167
11.2 Numerical Modelling . . . . . . . . . . . . . . . . . . . . . . . . . . . . . 167
11.2.1 Importation of Energy Deposition maps . . . . . . . . . . . . . . 168
11.2.2 Constitutive Models . . . . . . . . . . . . . . . . . . . . . . . . . 169
11.2.3 Equations of state . . . . . . . . . . . . . . . . . . . . . . . . . . 169
11.2.3.1 Strength Model . . . . . . . . . . . . . . . . . . . . . . 169
11.2.3.2 Failure model . . . . . . . . . . . . . . . . . . . . . . . . 171
11.2.4 Numerical Methods . . . . . . . . . . . . . . . . . . . . . . . . . 171
11.2.4.1 Lagrangian method . . . . . . . . . . . . . . . . . . . . 171
11.2.4.2 Smoothed-particle hydrodynamics . . . . . . . . . . . . 172
11.3 Experimental Activity . . . . . . . . . . . . . . . . . . . . . . . . . . . . 172
11.3.1 Medium intensity impacts . . . . . . . . . . . . . . . . . . . . . . 175
11.3.2 High intensity impacts . . . . . . . . . . . . . . . . . . . . . . . . 176
11.3.3 Post Irradiation Damage . . . . . . . . . . . . . . . . . . . . . . . 176
11.4 Post Impact Residual Damage . . . . . . . . . . . . . . . . . . . . . . . . 178
11.4.1 Energy Deposition on Materials . . . . . . . . . . . . . . . . . . . 178
11.4.2 Inermet180 . . . . . . . . . . . . . . . . . . . . . . . . . . . . . . 179
11.4.3 Molybdenum . . . . . . . . . . . . . . . . . . . . . . . . . . . . . 181
11.4.4 Glidcop . . . . . . . . . . . . . . . . . . . . . . . . . . . . . . . . 183
11.4.5 MoCuCD . . . . . . . . . . . . . . . . . . . . . . . . . . . . . . . 184
11.4.6 CuCD . . . . . . . . . . . . . . . . . . . . . . . . . . . . . . . . . 184
11.4.7 MoGRCF and MoGR . . . . . . . . . . . . . . . . . . . . . . . . 186
11.5 Conclusions on Beam Impact Resistance of Collimator Materials . . . . 188
xii

CONTENTS
12 Conclusions 189
12.1 Research Context . . . . . . . . . . . . . . . . . . . . . . . . . . . . . . . 189
12.2 Scientific Contributions and Results . . . . . . . . . . . . . . . . . . . . 190
12.3 Future Outlook . . . . . . . . . . . . . . . . . . . . . . . . . . . . . . . . 192
References 194
Glossary 199
xiii

List of Figures
3.1 Stored beam energy versus beam momentum for past, present and future
Particles Accelerators . . . . . . . . . . . . . . . . . . . . . . . . . . . . 7
3.2 High Luminosity LHC Upgrade Plan (1) . . . . . . . . . . . . . . . . . 7
3.3 CERN accelerator complex in Meyrin, CH. . . . . . . . . . . . . . . . . 8
3.4 LHC Rings Design: Experiments, Cleaning, Accelerating and Dump Sys-
tems locations. . . . . . . . . . . . . . . . . . . . . . . . . . . . . . . . . 10
3.5 Summary and position of existing Collimators over the LHC ring. . . . . 12
3.6 Schematics of LHC Multi-stage Collimation system . . . . . . . . . . . . 13
3.7 Structure of a Primary LHC Collimator. . . . . . . . . . . . . . . . . . . 18
3.8 Schematics of the internal structure of the Collimator. . . . . . . . . . . 19
3.9 Details of the single jaw inside the tank with specific improvements with
respect to present Collimators. . . . . . . . . . . . . . . . . . . . . . . . 20
4.1 Orientation of Carbon Fibre Carbon Composite with respect to Jaw
Assembly. . . . . . . . . . . . . . . . . . . . . . . . . . . . . . . . . . . . 24
4.2 QBSD image at low magnification of Inermet180 microstructure. The
Tungsten grains are clear while the Ni-Cu phase appears black. . . . . . 26
4.3 Thermal properties of Inermet 180 as a function of the temperature.
The magnified zone indicates the melting of the Ni-Cu phase in the
Differential Scanning Calorimetry (DSC) plot. . . . . . . . . . . . . . . . 27
4.4 Transmission Electron Microscopy of Glidcop AL − 15: the very small
and uniformly dispersed alumina particles are clearly visible. . . . . . . 28
4.5 Optical Microscopy of Molybdenum microstructure: the grains are elon-
gated and there are no visible pores and inclusions. . . . . . . . . . . . . 30
xiv

LIST OF FIGURES
5.1 Schematics of Voigt (Equal Strain) and Reuss (Equal Stress) assumptions
for particulate reinforced composite. . . . . . . . . . . . . . . . . . . . . 39
5.2 Comparison of Voigt, Reuss and Hill models for Al-SiC composite as a
function of the SiC fraction (θ). . . . . . . . . . . . . . . . . . . . . . . . 40
5.3 Axis Definition for an orthotropic materials, here simplified as a layered
structure. . . . . . . . . . . . . . . . . . . . . . . . . . . . . . . . . . . . 41
5.4 Schematic representation of the Voigt and Reuss Models applied to Or-
thotropic materials. . . . . . . . . . . . . . . . . . . . . . . . . . . . . . . 42
6.1 Achimedes balance used in BrevettiBizz to measure the composites density. 48
6.2 Foerster Sigmatest 2.069 used for mapping the superficial electrical con-
ductivity. The used sensor is 6 mm diameter and the effective analysed
area per measure point is about 8 mm in diameter. . . . . . . . . . . . . 49
6.3 Samples of MoCuCD (8) cut by water jet: the cutting cone, the cut
surface roughness and the cutting end residuals are clearly visible. . . . 50
6.4 Thermal conductivity (diameter 10 mm H4 mm), thermal expansion
(16x4x4 mm) and specific heat (diameter 3 mm H1 mm) samples of
MoCuCD. . . . . . . . . . . . . . . . . . . . . . . . . . . . . . . . . . . . 51
6.5 3D representation of samples positions (and orientations) for MoGRCF
plate cut by precision cutting machine. . . . . . . . . . . . . . . . . . . . 52
6.6 Flexural Fixture developed and produced at CERN EN/MME to test
advanced composites. . . . . . . . . . . . . . . . . . . . . . . . . . . . . . 55
6.7 Left: internal view of the developed thermal test bench, showing the
INOX shield (that accommodates also the cables and the screws to fix
the sample inside) and the instrumented sample. Right: closed set-up
showing the cooling circuits on top and on the bottom, the top screw to
adjust the pressure on the sample and the external connections for the
thermal probes. . . . . . . . . . . . . . . . . . . . . . . . . . . . . . . . . 59
6.8 Molybdenum Graphite instrumented sample to be used in the thermal
test bench. The sample is attached by screws to the two Cu-OFE sample
holders, the screw tips being sharpened to reduce heat flow through the
screws. . . . . . . . . . . . . . . . . . . . . . . . . . . . . . . . . . . . . . 61
xv

LIST OF FIGURES
6.9 FEM simulation performed to validate the Thermal Test Bench. The
effects of radiation between all surfaces, convection with the ambient
and with the cooling water together with the thermal resistance at the
interfaces have all been taken into account. The analysis has been carried
out using Ansys Transient Thermal module. . . . . . . . . . . . . . . . . 61
7.1 Figures of Merit SSNI and TSNI for different materials of interest. . . . 65
7.2 SE Image at medium magnification of fracture surface of AgCD sample
produced at EPFL. . . . . . . . . . . . . . . . . . . . . . . . . . . . . . . 66
7.3 SE Image at medium magnification of natural diamond powder used in
BrevettiBizz for the production of MoCuCD composites. The cleavage
fracture formed during the milling are clearly visible. . . . . . . . . . . . 67
7.4 SE Image at medium magnification of synthetic diamond powder used
in BrevettiBizz for the production of MoCuCD composites. . . . . . . . 68
7.5 Phase diagram of carbon. . . . . . . . . . . . . . . . . . . . . . . . . . . 69
7.6 Aspect of graphitized diamond surface . . . . . . . . . . . . . . . . . . . 70
7.7 CuCD plate produced in RHP Technology in 2010 after water jet cutting. 72
7.8 SE Image: Fracture surface of CuCD sample embedded inside the sample
holder observed at SEM. . . . . . . . . . . . . . . . . . . . . . . . . . . . 74
7.9 QBSD Image: Low magnification SEM Observation at CERN of the
fracture surface of CuCD. The distribution of diamonds (dark grey) in
the bulk material and the two dimensions of the diamonds are clearly
visible. . . . . . . . . . . . . . . . . . . . . . . . . . . . . . . . . . . . . . 75
7.10 SE Image: Medium magnification SEM Observation at CERN of the
fracture surface of CuCD. The Cu matrix detached on one diamond
while remained attached to the adjacent one, confirming the low adhesion
between the phases. The surface of the diamond on the left appears
smooth and with signs of visible graphitization as expected by the low
temperature cycle. . . . . . . . . . . . . . . . . . . . . . . . . . . . . . . 76
7.11 SE Image: High magnification SEM Observation at CERN of the fracture
surface of CuCD. The small particles attached to the diamonds are Boron
carbides formed during the process, as the larger particle attached at the
bottom of the diamond. . . . . . . . . . . . . . . . . . . . . . . . . . . . 77
xvi

LIST OF FIGURES
7.12 SE Image: High magnification SEM Observation at CERN of the fracture
surface of CuCD. High magnification of the Boron carbide particle. . . . 78
7.13 Thermal Diffusivity reduction after exposure to 1017 protons at 30 MeV.
Source (2). . . . . . . . . . . . . . . . . . . . . . . . . . . . . . . . . . . 79
7.14 Dpa distribution along the two phases in the case of alternate layers of
Cu and diamond (respectively 65 and 130 µm thick). The higher density
of Cu leads to a much higher dpa level with respect to the diamond phase. 80
8.1 SE Image at low magnification of the first MoCuCD. The matrix ap-
pears porous and the natural diamonds are graphitized. The plate’s
composition is: 60%V 45 µm Mo, 30%V 174 µm synthetic diamonds,
10%V 45 µm Cu and has been sintered under primary vacuum for 180
min at 1020oC. . . . . . . . . . . . . . . . . . . . . . . . . . . . . . . . . 84
8.2 Effect of temperature and time on the relative density of sintered 4µm
W and Mo powders. . . . . . . . . . . . . . . . . . . . . . . . . . . . . . 86
8.3 Ad hoc powder cleaning system developed at BrevettiBizz. . . . . . . . 87
8.4 Scheme of observed section. . . . . . . . . . . . . . . . . . . . . . . . . . 90
8.5 QBSD Image at intermediate magnification of the observed diamond
particle embedded into the polymeric resin sample.The regular shape
of the diamond can be clearly seen, together with the regularity of the
observed section. . . . . . . . . . . . . . . . . . . . . . . . . . . . . . . . 90
8.6 QBSD Image at high magnification of the analysed surface: the arrow
indicates the location of the EDS spectrums, starting from the diamond
edge up to the end of the coating section (6µm). . . . . . . . . . . . . . 91
8.7 EDS Spectrum in position x = 0 µm: Presence of C, O, Ti, P, Cu and Ni. 92
8.8 EDS Spectrum in position x = 1.5 µm: Cu, Ni and P peaks are becoming
higher, C peak is reducing while Ti and O peak remain constant. . . . . 92
8.9 EDS Spectrum in position x = 3 µm: O, C and Ti peaks are not visible,
also the P and Ni peaks are reduced. . . . . . . . . . . . . . . . . . . . . 93
8.10 EDS Spectrum in position x = 4.5 µm: presence of Cu and Ni only. P
peak is indicated only to show that its signal is negligible on the coating
surfaces and therefore cannot be detected on powder during the standard
analysis. . . . . . . . . . . . . . . . . . . . . . . . . . . . . . . . . . . . . 93
xvii

LIST OF FIGURES
8.11 SE Image at low magnification of MoCucCD. The metallic phase is
formed by small Mo particles embedded in Cu, while the diamonds
showed some graphitization. The fracture passed preferentially along
the diamond-matrix interfaces (absence of broken diamonds). . . . . . . 95
8.12 SE Image at intermediate magnification of MoCucCD. Aspect of a par-
tially graphitized diamond (on the left) and of the surrounding Mo-Cu
matrix. The diamonds have plenty of small titanium carbide particles
attached due to the reaction between titanium oxide and diamond surfaces. 96
8.13 SE Image at intermediate magnification of MoCucCD: aspect of Mo-Cu
matrix. In the spaces between the diamonds the Mo particles are not well
compacted and the structure appears porous. Near the diamond surfaces
there is a continuous Mo layer formed by small particles all oriented
perpendicularly with respect to the diamond surfaces: the formation
of this layer could be related to the presence of the Cu coating which
encapsulate the Mo particles during heating (when Cu starts to become
very soft). The matrix is still porous because there is not enough Cu to
infiltrate completely the voids between Mo particles. . . . . . . . . . . 97
8.14 SE Image at high magnification of MoCucCD: particular of the diamond
surface. The diamond graphitization leaded to the formation of holes
on the diamond surface where graphite detached. In some area of the
diamond there are also the small titanium carbides, while in the matrix
near the diamonds we have the presence of Ni (which was present in the
Cu coating). . . . . . . . . . . . . . . . . . . . . . . . . . . . . . . . . . . 98
8.15 SE Image at low magnification of MoCuCD-P-L1 fracture surface. The
fracture passes as in previous composites preferentially along the dia-
mond matrix interface. The majority of Diamonds are well spaced but
there is the presence of empty interstitials between Diamonds. . . . . . . 101
8.16 SE Image at high magnification of MoCuCD-P-L1 fracture surface. The
diamond surface is still covered by Mo2C and appears only slightly
graphitized. The Mo distribution along the diamond surface is still
present thanks to the new powder mixing method. The matrix looks
dense with Cu infiltrating deeply the porous Mo matrix. . . . . . . . . . 102
xviii

LIST OF FIGURES
8.17 SE Image at high magnification of MoCuCD-P-L1 fracture surface. De-
tail of diamond superficial aspect, thanks to charging effect if the dia-
mond surface is rough (due to graphitization or bonded particles) it will
appear brighter as the upper right edge of the diamond. . . . . . . . . . 103
8.18 QBSD Image at high magnification of MoCuCD-P-L1 fracture surface
in the exact same position of Figure 8.17. The QBSD technique allows
to distinguish between Mo2C carbides attached to diamond surface and
graphite thanks to their density contrast (lighter materials are darker),
as the case of the upper right diamond edge that in fact is covered by
formed Mo2C, while the other regions without grey in QBSD Image are
effectively graphitized areas. . . . . . . . . . . . . . . . . . . . . . . . . . 104
8.19 Flexural test results for MoCuCD. . . . . . . . . . . . . . . . . . . . . . 104
8.20 Compressive Tests performed at Politecnico di Torino. c1 and c2 are the
curves obtained by quasi-static tests, while h2 and h3 are obtained by
Hopkinson Bar Tests (strain rate ≈ 1000s−1). . . . . . . . . . . . . . . 106
8.21 Tensile Tests performed at Room Temperature (t2) and at 600oC (t4)
on MoCuCD. . . . . . . . . . . . . . . . . . . . . . . . . . . . . . . . . . 106
8.22 Plot of specific heat of MoCuCD as a function of the temperature. The
cp confirms the good thermal stability of MoCuCD at least in vacuum
environment. . . . . . . . . . . . . . . . . . . . . . . . . . . . . . . . . . 107
8.23 Plot of CTE of MoCuCD as a function of the temperature. The CTE
shows a large instability at 700oC that is related to Cu expansion. . . . 108
8.24 Plot of thermal conductivity of MoCuCD as a function of the tempera-
ture. The large instability at 700oC is always present on different samples
and is observed at every thermal cycle. . . . . . . . . . . . . . . . . . . . 109
8.25 Aspect of large 200x80x4 mm MoCuCD-1P2-L01 plate plus Electrical
Conductivity measurements. Values in MS/m. . . . . . . . . . . . . . . 110
9.1 Schematics of the electron delocalization in graphite single molecule. For
extended foils of graphene the delocalized region can be considered as
continuous all over the plane. . . . . . . . . . . . . . . . . . . . . . . . . 116
9.2 Scheme of the graphite cell. . . . . . . . . . . . . . . . . . . . . . . . . . 116
9.3 Idealized Graphite Crystal structure. Source Asbury Graphite website (3)117
xix

LIST OF FIGURES
9.4 SE Image at high magnification of Asbury 3260 Graphite flake. . . . . . 119
9.5 Calculated phase diagram of the Molybdenum - Carbon system. . . . . 120
9.6 a) Model of Brophy, Hayden and Wulff; b) Model of Toth and Lockington
for Ni assisted W sintering. The mechanism is the same for Mo. . . . . . 122
9.7 Hot Pressing Machine used for MoGR production at BrevettiBizz. . . . 123
9.8 SE Image: High magnification SEM Observation at CERN of the 5µm
Molybdenum powder used for MoGR production. . . . . . . . . . . . . . 124
9.9 SE Image: High magnification SEM Observation at CERN of the 45µm
Molybdenum powder used for MoGR production. . . . . . . . . . . . . . 125
9.10 SE Image: High magnification SEM Observation at CERN of the 0.25−0.55µm Palladium powder used for MoGR production. . . . . . . . . . . 126
9.11 QBSD Image at low magnification of MoGR (transversal direction) made
using fine selected Asbury3260 graphite. The clear (heavier) phase is
Mo2C formed during the solid state reaction. The grains are mostly
regular with the presence of some macro-grains formed by the coalescence
of adjacent grains. . . . . . . . . . . . . . . . . . . . . . . . . . . . . . . 127
9.12 QBSD Image at intermediate magnification of MoGR (transversal direc-
tion) made using fine selected Asbury3260 graphite. Aspect of recrys-
tallized Mo2C grains and of the internal acicular inclusions. There are
also many small Mo2C grains embedded inside the graphite phase, due
to the presence of the small 5µm Mo particles. . . . . . . . . . . . . . . 128
9.13 SE Image at high magnification of MoGR (transversal direction) made
using fine selected Asbury3260 graphite. . . . . . . . . . . . . . . . . . . 129
9.14 MoGR 24-C X-Ray analysis in Longitudinal (Black) and Transversal
(Red) direction. . . . . . . . . . . . . . . . . . . . . . . . . . . . . . . . . 130
10.1 Mechnical Properties comparison between PAN- and mesophase pitch-
based fibers (produced respectively by Toray Ind., Torayca and by Union
Carbide, Thornel) . . . . . . . . . . . . . . . . . . . . . . . . . . . . . . 138
10.2 Graphitization stages in graphitizable carbon as a function of the heat
treatment temperature (THT ), source Goma et Oberlin (4) . . . . . . . . 139
10.3 Comparison of the different production cycles for PAN- and pitch-based
CF. . . . . . . . . . . . . . . . . . . . . . . . . . . . . . . . . . . . . . . 140
xx

LIST OF FIGURES
10.4 Schematics of a common extruder used for the melt spinning of mesophase
pitch (5). . . . . . . . . . . . . . . . . . . . . . . . . . . . . . . . . . . . 140
10.5 Schematics of an hairpin element furnace used to carbonize mesophase
pitch fibers. . . . . . . . . . . . . . . . . . . . . . . . . . . . . . . . . . . 141
10.6 Fiber structure as a function of the the melt spinning parameters. . . . 142
10.7 Possible inernal sttructures of mesophase pitch precursors. . . . . . . . . 142
10.8 Internal Structure of pitch based CF used for MoGRCF production. The
internal structure is made by radially oriented graphene planes. . . . . . 143
10.9 Granoc XN-100-03Z 3 mm long CF. Presence of macroaggregates of
packed fibers with dimensions up to few mm in diameter. . . . . . . . . 144
10.10Aspect of Granoc XN-100-03Z CF. The macroaggregates are clearly visible.144
10.11SE image at low magnification of MoGRCF-1 plate (longitudinal cross
section) sintered at 2200oC with the 20%V of short fibers. Mo2C diffused
more than in previous MoGR plates sintered at 1700oC forming large,
porous grains up to few hundreds of µms. the planar orientation of
the fibers is also visible where the graphite matrix detached during the
polishing and ultra sound cleaning. . . . . . . . . . . . . . . . . . . . . . 147
10.12SE image at high magnification of MoGRCF-1 plate (transversal cross
section) sintered at 2200oC with the 20%V of short fibers. Particular of
a macro cavity formed by the intersection of 3 (visible) fibers that was
not filled by graphite or Mo2C. . . . . . . . . . . . . . . . . . . . . . . . 148
10.13SE image at low magnification of MoGRCF-3 plate (longitudinal cross
section) sintered at 2200oC with the 20%V of short fibers and the 20%V
of long fibers. Aspect of one macro aggregate of long CF remained
trapped inside the structure. . . . . . . . . . . . . . . . . . . . . . . . . 149
10.14SE image at intermediate magnification of MoGRCF-3 plate (longitudi-
nal cross section) sintered at 2200oC with the 20%V of short fibers and
the 20%V of long fibers. The interface between the fiber macro aggre-
gate and the matrix is poorly filled, while the MoGR matrix looks denser
than in previous MoGRCF-1 plate thanks to the local higher Mo content.150
xxi

LIST OF FIGURES
10.15SE image at high magnification of MoGRCF-3 plate (longitudinal cross
section) sintered at 2200oC with the 20%V of short fibers and the 20%V
of long fibers. The CF and the graphite matrix tend to sinter together
encapsulating the finely dispersed small Mo2C particles. . . . . . . . . . 151
10.16SE image at intermediate magnification of MoGRCF-4 plate (longitudi-
nal cross section) sintered at 2200oC with the 30%V of short fibers and
the 30%V of long fibers. The fibres formed an opened net that hampered
the space filling by the MoGR matrix, leaving a very porous material. . 152
10.17SE image at intermediate magnification of MoGRCF-4Bis plate (transver-
sal cross section) sintered at 2200oC with the 30%V of short fibers and
the 30%V of blended long fibers. The Mo2C phase is more regularly
dispersed and have smaller dimensions than in the other 4 plates. . . . . 153
10.18Normalized chemical composition (by EDS) and electrical conductivity
(by Sigmatest) on Plate N.10 along radial direction. . . . . . . . . . . . 154
10.19SE image at low magnification of MoGRCF-10 plate (transversal cross
section) in the central area. The Mo2C phase forms a fine dispersion
of homogeneously distributed small grains embedded into the graphitic
matrix. The local amount of Mo can be estimated around the 55% of
the peripheral concentration. . . . . . . . . . . . . . . . . . . . . . . . . 155
10.20SE image at low magnification of MoGRCF-10 plate (transversal cross
section) in the peripheral area. The Mo2C phase remains solid giving a
microstructure very similar to previous plates with large coalesced Mo2C
grains. There are also many macro cavities that reduce the final density
of the Plate. . . . . . . . . . . . . . . . . . . . . . . . . . . . . . . . . . . 156
10.21SE image at intermediate magnification of MoGRCF-10 plate (transver-
sal cross section) in the central area. The small Mo2C grains have melted
and squeezed in between the CF and the graphite phase, filling well the
interstitials. However they also tend to contract during solidification
leaving a small gap at the interface with graphite. . . . . . . . . . . . . 157
10.22SE image at intermediate magnification of MoGRCF-10 plate (transver-
sal cross section) in the peripheral area. The situation is analogous to
previous non melted plates (large Mo2C grains and macro cavities) with
the difference of the local increase in Mo content. . . . . . . . . . . . . 158
xxii

LIST OF FIGURES
10.23SE image at low magnification of MoGRCF-10/10 plate (transversal
cross section). General aspect of the material, similar to the microstruc-
ture in Figure 10.19. The main difference is the presence of few macro
cavities that were absent in the molten area of plate N.10. . . . . . . . . 160
10.24SE image at low magnification of MoGRCF-10/10 plate (transversal
cross section). Presence of few (and small) long fibers aggregates, macro-
cavities and molten Mo2C grains. . . . . . . . . . . . . . . . . . . . . . . 161
10.25QBSD image at intermediate magnification of MoGRCF-10/10 plate
(transversal cross section). The QBSD technique has been used to mark
the slight differences in graphite phase compaction: it allows to see the
partial sintering of long fibers inside the aggregate and to distinguish
between graphite and CF inside the matrix (upper area). . . . . . . . . 162
10.26SE image at high magnification of MoGRCF-10/10 plate (transversal
cross section). Particular on the macro cavity: the cavity has not been
filled by liquid Mo2C during the LPS and was too large to disappear
by diffusion. The surrounding volume appears instead fully dense with
recrystallized graphite grains. . . . . . . . . . . . . . . . . . . . . . . . . 163
11.1 Equation of State SESAME 3550 for pure tungsten: plot of Pressure as
a function of density and temperature. . . . . . . . . . . . . . . . . . . . 169
11.2 Equation of State SESAME 3550 for pure tungsten: plot of internal
energy as a function of density and temperature. . . . . . . . . . . . . . 170
11.3 Material specimen shapes for tests at medium and high intensity. . . . . 173
11.4 General assembly of the HRMT14 test-bench. Red arrow represents the
beam. . . . . . . . . . . . . . . . . . . . . . . . . . . . . . . . . . . . . . 174
11.5 Left: Axial strain measured with strain gauge at r = 20 mm, L = 15
mm and numerically simulated. Right: Radial velocity measured with
LDV at r = 20 mm, L = 15 mm and numerically simulated. . . . . . . . 175
11.6 High-speed video camera images of the ejected particle cloud: the beam
is coming from the left while the cloud is moving downwards; three
Inermet180 samples are partially visible (numbered 1 to 3). . . . . . . . 176
11.7 Comparison between simulation (SPH) and acquired image. . . . . . . . 177
xxiii

LIST OF FIGURES
11.8 Autodyn simulation of the High Intensity beam impact on Inermet180:
residual damage estimation by imposing the erosion criterion. . . . . . . 178
11.9 High Intensity shots samples location for all the different materials. . . . 179
11.10Energy Deposition profile for all the HRMT-14 materials arrays. Val-
ues have been normalized to the entire pulse (of 72 or 144 bunches).
Note that the MoGRCF Array is composed by three different grades as
reported in Figure 11.9. . . . . . . . . . . . . . . . . . . . . . . . . . . . 180
11.11Inermet180 H6 c impact damage observation from lateral view port. . . 181
11.12Molybdenum H5 c (top) and H5 o (bottom) impacts damage observation
from lateral view port. . . . . . . . . . . . . . . . . . . . . . . . . . . . . 182
11.13Glidcop H4 c (top) and H4 o (bottom) impact damage observation from
lateral view port. . . . . . . . . . . . . . . . . . . . . . . . . . . . . . . . 183
11.14MoCuCD H3 c impact damage observation from lateral view port. . . . 185
11.15CuCD H2 c impact damage observation from lateral view port. . . . . . 185
11.16MoGR H1 c impact damage observation from lateral view port. . . . . . 187
11.17MoGRCF H1 c Impact Damage Observation from lateral view port. . . 187
xxiv

List of Tables
3.1 LHC beam parameters for proton operations. . . . . . . . . . . . . . . . 9
4.1 Carbon Fibre Carbon Composite AC − 150K properties along the three
principal directions in Figure 4.1 (6) (7). . . . . . . . . . . . . . . . . . . 24
4.2 Physical and mechanical properties and Figures of Merit of Carbon Fibre
Carbon Composite (CFC), Graphite R4550, Inermet 180, Glidcop and
Molybdenum. Values of k, CTE, Tensile Strength and Poisson’s Ratio
are a ROM calculation for CFC are obtained by a ROM calculation over
all the three principal directions. . . . . . . . . . . . . . . . . . . . . . . 32
7.1 Comparison between predicted and measured properties for CuCD at
RT. Density and Specific Heat evaluated by ROM model 5.1, CTE by
Kerner model 5.11, k by Hasselmann and Johnson model 5.9 and E is
conservatively assuming the Reuss assumption 5.4. . . . . . . . . . . . . 72
7.2 CuCD properties variation after irradiation of 1017 protons at 30 MeV
in NRC-KI. . . . . . . . . . . . . . . . . . . . . . . . . . . . . . . . . . . 79
7.3 CuCD material properties compared to Glidcop AL-15. The properties
have been measured on the material produced by RHP Technology at
CERN and Kurchatov Institute (2). . . . . . . . . . . . . . . . . . . . . 82
8.1 Predicted and measured properties for MoCucCD at RT. Density and
specific heat evaluated by ROM model 5.1, CTE by Kerner model 5.11, k
by Hasselmann and Johnson model 5.9 and E is conservatively assuming
the Reuss assumption 5.4. . . . . . . . . . . . . . . . . . . . . . . . . . . 95
xxv

LIST OF TABLES
8.2 Predicted and measured properties of MoCuCD at RT. Density and spe-
cific heat evaluated by ROM model 5.1, CTE by Kerner model 5.11, k
by Hasselmann and Johnson model 5.9 and E is conservatively using the
Reuss assumption 5.4. . . . . . . . . . . . . . . . . . . . . . . . . . . . . 109
8.3 Final properties and Figures of Merit for MoCuCD compared to CuCD
and MoCucCD. Values with * for MoCucCD have been assumed, in
absence of apposite tests, to be equal to MoCuCD ones. . . . . . . . . . 111
9.1 Properties of ideal graphite crystal compared to pyrolitic GraphiteR4550
used for LHC Collimators. . . . . . . . . . . . . . . . . . . . . . . . . . . 118
9.2 Physical and mechanical properties of hexagonal Mo2C. . . . . . . . . . 119
9.3 Final properties and Figures of Merit for MoGR compared to CuCD
and MoCuCD. Values with * are estimations based on the considerations
reported in 9.5.1 . . . . . . . . . . . . . . . . . . . . . . . . . . . . . . . 133
10.1 Comparison of properties of different PAN- and mesophase pitch- based
CF . . . . . . . . . . . . . . . . . . . . . . . . . . . . . . . . . . . . . . . 137
10.2 Summary of the first batch of MoGRCF plates produced in solid state
during 2012 at BrevettiBizz. *The value is measured in the centre of the
plate. . . . . . . . . . . . . . . . . . . . . . . . . . . . . . . . . . . . . . 146
10.3 Comparison of Plate N.10 with plates N.3 and N.4Bis. * indicates the
values in the plate centre and in the plate periphery (always lower). . . 154
10.4 CERN Characterization of LPS MoGRCF. L indicates a measurement
along the longitudinal direction while T along the transversal one. Note:
since Mo2C flown out of the mould the final density cannot be compared
to the predicted one and no compaction rate has been calculated. How-
ever the plate microstructures confirm visually a very good compaction
of the material.* indicates the values along the two principal directions,
longitudinal and transversal. . . . . . . . . . . . . . . . . . . . . . . . . . 159
10.5 Final properties and FoM for MoGRCF compared to MoCuCD, CuCD
and MoGR. Values with * are estimations based on the considerations
reported in 9.5.1. . . . . . . . . . . . . . . . . . . . . . . . . . . . . . . . 164
11.1 Johnson Cook Model parameters used for Inermet180 simulations. . . . 171
xxvi

LIST OF TABLES
11.2 Beam parameters for tests performed on Inermet180 during HRMT-14
experiment. . . . . . . . . . . . . . . . . . . . . . . . . . . . . . . . . . . 175
11.3 Summary of the High Intensity shots parameters. Each shot is identi-
fied by H + material number + impact location (c, center or o, offset
10mm), for each shot its reported the total number of impacting bunches
(impacting in the same location and spaced in time by 25 ns), the total
number of impacting protons (Total intensity), the maximum Energy
Density Peak and the Total Energy deposited along the entire raw. . . . 180
xxvii

LIST OF TABLES
xxviii

1
Thesis Structure
This Chapter describes the structure of the thesis which is organized as follows: context
and motivations of the work, analysis of present solutions, development of novel mate-
rials and testing under extreme conditions entailed by highly energetic beam impacts.
Motivations, context and main scientific contributions of the work are summarized
in Chapter 2.
Chapter 3 includes a brief introduction to the Large Hadron Collider (LHC) and to
its unique Collimation System: this part will allow to understand the special require-
ments of materials for Beam Intercepting Devices (BID), object of the present R&D
program.
Chapter 4 presents the state of the art of LHC Collimators materials in order to
define a proper basis for the novel materials R&D.
Chapters 5 and 6 describes the analytical methods used for predicting materials
properties as well as the experimental tools applied to materials characterization.
Chapter 7 describes the characterization performed on CuCD, the first composite
material proposed as solution for future Hi-Lumi LHC Collimators.
Chapter 8 presents the R&D of Molybdenum - Copper - Diamond (MoCuCD) that
is the first material developed during the present thesis work. This Chapter includes a
first part on the innovations introduced in production procedures (powder selection and
cleaning, coatings, production cycle improvements) followed by the characterization of
the two best performing MoCuCD materials obtained.
Similarly Chapters 9 and 10 illustrate the main steps of the R&D on Molybdenum
Carbide - Graphite (MoGR) and Molybdenum Carbide - Graphite - Carbon Fibers
1

1. THESIS STRUCTURE
(MoGRCF) respectively.
Finally, Chapter 11 describes the robustness tests performed on developed mate-
rials, including advanced numerical simulations of high energy beam impacts. The
experimental activity included the active participation to a first-of-its-kind experiment
carried out in 2012 entailing the direct impact of energetic particle beams on the ma-
terials presented in this work.
Chapter 12 summarizes the results obtained with the newly introduced materials
and proposes a future outlook.
2

2
Thesis Motivations
In this Chapter the motivations and the context of the thesis work are presented and
discussed.
2.1 Aim of the Thesis
This thesis aims at identifying and characterize new composite materials for Beam
Intercepting Devices (BID) that could be used to produce the jaws of future High
Luminosity LHC Collimators. As will be explained in details in Chapter 3 the jaws of
LHC Collimators are closely interacting with the incredibly energetic LHC beam. That
makes LHC Collimators one of the most challenging equipment from thermo-mechanics
and material science point of view. Innovative results obtained in this thesis can be of
high interest for a large palette different applications, such as aero-spatial components,
nuclear plants, high temperature furnaces, electronics,
2.2 Context
The thesis context is the upcoming upgrade of the LHC (the High Luminosity LHC)
that will bring the machine beyond the limits of the presently used Collimator materials
(see Chapter 4), pushing for new efforts in the research on novel advanced composites
for BID.
The research has been funded by the European Coordination for Accelerator Re-
search & Development Project (EuCARD) Working Package 8.3, titled “Materials and
thermal shock waves” (8)) with the aim at developing and characterize materials for
3

2. THESIS MOTIVATIONS
particle accelerators Collimators: the R&D activity involved several institutes including
CERN, AIT (Austrian Institute of Technology), Politecnico di Torino, GSI (Helmholtz
Centre for Heavy Ion Research), NRC- Kurchatov Institute, EPFL (Ecole Polytech-
nique Federale de Lausanne).
2.3 Overview of PhD activities
The thesis started with the study of currently used Collimators materials and the char-
acterization of the composites developed by partner institutes during the past EuCard
WP8 activities (Copper - Diamond, CuCD, see Chapter 7).
The performed analysis of the material behaviour with respect to the BID appli-
cation enlighten how the used materials would intrinsically limit the machine in its
ultimate configuration, increasing the appealing of new composite materials as CuCD.
However, since the characterization of CuCD proved that the material is not completely
fulfilling all the requirements imposed for Hi-Lumi LHC Collimators (see Chapter 7),
the research moved to the identification of other possible composite materials having
improved behaviour with respect to the BID application. So the following part of the
thesis entailed the development of a large number of novel Mo-based composites, the
most important being listed below:
• Molybdenum - Copper - Diamond (MoCuCD, see Chapter 8);
• Molybdenum Carbide - Graphite (MoGR, see Chapter 9);
• Molybdenum Carbide - Graphite - Carbon Fiber (MoGRCF, see Chapter 10).
All produced materials have been characterized at CERN (and in other cited part-
ner institutes) in terms of thermal and mechanical properties in order to determine the
following steps of the R&D campaign. The conclusion of this work, lasted three years,
is MoGRCF: the produced composite exhibits in fact outstanding thermal and phys-
ical properties thanks to the innovative composition and to the improved production
process, thus being a very good candidate for future Hi-Lumi LHC Collimators.
However the BID requirements include the resistance, in the worst accidental sce-
nario, against high energy beam impacts: this potentially catastrophic phenomena
cannot been handled with standard tools and requires on one side complex numer-
ical simulations to predict the damage and on the other challenging experiments to
4

2.3 Overview of PhD activities
validate the proposed models under the extreme conditions encountered during the im-
pacts. The numerical tool used for the impact simulation is the hydrodynamic code
Autodyn coupled with the Smooth Particle Hydrodynamics algorithm, which allows
to follow the evolution of the fragments ejected by the target during the beam im-
pact. The simulations however require scarcely available materials models, excluding
the prediction of damage on new materials.
For that reason, and to validate the models on known materials, a first-of-its-kind
experiment has then been setup at CERN HiRadMat (High Radiation to Materials)
facility, allowing the controlled impact of highly energetic proton beams on materials
samples. The experiment was a complete success allowing for the first time in the best
of our knowledge the direct observation of the material samples explosion during a beam
impact, thus allowing for a comparison of the behaviour of different materials that is
of valuable interest for future researches on BID materials. The main contributions
given to the experiment were the design of samples via hydrodynamic simulations, the
development of a high speed, radiation hard video camera acquisition system and the
novel composites samples production.
The results of the beam impact residual damage coupled with the benchmark of the
proposed materials in the steady state conditions will then allow for the identification
of the future LHC Collimator materials.
5

3
Introduction to LHC Collimators
3.1 The Large Hadron Collider (LHC)
The exploration and understanding of the world surrounding us is a natural and ancient
instinct of human kind, and many progresses have been done since the first men looked
at the stars wondering how they could shine...
The particle physics born in the early XX century aims to understand the intimate
structure of matter: how the elementary particles behave and combine together, how
is made their internal structure and, last but not least, how they have been created.
These studies involve the investigation of particles that are infinitely small and cannot
be detected by human senses, leading to the need of more and more accurate and
sophisticated instruments for the observation.
In that framework we can consider the particle accelerators as the main tool for
modern particle physicists: these machines are to accelerate charged particles (usually
protons, but also electrons and heavier ions) up to relativistic energies that are well
beyond the standard energies experienced on earth, permitting the observation of oth-
erwise inaccessible physical phenomena, such as the formation of non-stable systems
like subatomic particles and anti-matter.
The last step in the world’s particle accelerators evolution is CERNs Large Hadron
Collider (LHC, Geneva, Switzerland) (9), that has become on November 2009 the worlds
highest energy particle accelerator, reaching the energy of 1.18 TeV in each beam and
overcoming the maximum energy of previous biggest particle accelerator, the Tevatron
(Batavia, US). The beam energy value alone is not sufficient to describe the huge
6

3.1 The Large Hadron Collider (LHC)
Figure 3.1: Stored beam energy versus beam momentum for past, present and future
Particles Accelerators
destructive power of the travelling proton beams because it’s dependent of the number
of particles in transit along the ring: for the LHC the nominal total stored energy per
beam is 362 MJ, that is enough to melt 500 Kg of Copper and is orders of magnitude
higher than any other older particle accelerator, as shown in Figure 3.1. (10)
The LHC machine upgrade program schematically presented in Figure 3.2 shows
how the machine operated safely at the energy of 4TeV per beam in 2012 reaching up
to the 75% of the nominal luminosity: the various improvements foreseen during the
Long Shutdown 1 (LS1) will permit to reach the nominal energy of 7 TeV per beam at
the nominal luminosity in 2017, while the final LHC configuration (the so-called High
Luminosity LHC, Hi-Lumi LHC) will be reached only in 2020 after major upgrades to
the superconducting magnets and to the protection system. (1).
Figure 3.2: High Luminosity LHC Upgrade Plan (1)
7

3. INTRODUCTION TO LHC COLLIMATORS
It is therefore clear how great are the technological challenges that CERN engineers
and scientists have to tackle during the LHC design, construction and operation: LHC
components are going close to the XX century technology limit so that CERN is con-
tinuously investing on the development of new materials, methods and physical models
in order to fulfil the LHC design requirements.
3.2 LHC Layout & Experiments
Figure 3.3: CERN accelerator complex in Meyrin, CH.
The LHC is the last accelerating ring of the CERN particle accelerator complex
shown in Figure 3.3; the underground tunnel circumference is 26.659km and its average
depth is 100m below the ground, the ring being placed in the France region just beside
the Swiss-France border close to Meyrin (CH). The LHC beam lines accommodate
two counter rotating proton or Lead ion beams (beam 1 clockwise, beam 2 counter-
clockwise) that are injected in the two insertion areas, located in the points IR2 (beam
1) and IR8(beam 2) shown in Figure 3.4. The particles enter in the LHC from the Super
Proton Synchrotron (SPS) with a nominal energy of 450GeV and are then accelerated
8

3.2 LHC Layout & Experiments
up to the nominal top energy (see Table 3.1) by the Radio-Frequency (RF) cavities
located in IR4. The two beams will then be brought into collision at the four interaction
points (IPs in Figure 3.4) where the main experiments are placed: ATLAS (IP1) (11),
ALICE (IP2) (12), CMS (IP5) (13) and LHCb (IP8) (14). In normal conditions the
beams will collide for several hours of beam lifetime and at the end of this period, or
in case of a failure detection, the beams will be aborted by the dump system located
in IR6.
Table 3.1: LHC beam parameters for proton operations.
Parameter Unit Injection Collision
Energy [GeV ] 450 7000
Relativistic γ [−] 479.6 7461
N. of particles per bunch [−] 1.15 ∗ 1011 1.15 ∗ 1011
N. of bunches per beam [−] 2808 2808
Stored Energy per beam [MJ] 23.3 362
Bunch spacing [ns] 25 25
Revolution Frequency [kHz] 11.245 11.245
Peak Luminosity in IP1 and IP5 [cm−2s−1] [−] 1034
Table 3.1 lists few beam parameters of interest for this work in the case of nominal
machine operation with protons. The LHC is designed to reach a peak luminosity of
1034cm2s1 in ATLAS and CMS; these are multi-purpose detectors dedicated to inves-
tigation of the broadest range of physics possible and to the Higg’s Boson discovery.
LHCb is a low luminosity (L = 1032cm2s1) specialized detector with the main objec-
tive of explaining the asymmetry between matter and antimatter in the universe by
studying the beauty quark physics. Two further experiments, TOTEM (15) and LHCf
(16) are also installed upstream and downstream of the high luminosity IPs (IP5 and
IP1 respectively), they have been devised to detect particles coming out from the ex-
periments with small deviation angles in order to measure the elastic scattering cross
section. Finally, ALICE is dedicated to the studies of the quark-gluon plasma gener-
ated by Lead ion collisions. The various experiments requirements have been taken
into account in the LHC Collimation system layout, that is presented in next chapter.
The LHC hardware (not taking into account the experiments facilities) can be
divided in 5 categories:
9

3. INTRODUCTION TO LHC COLLIMATORS
Figure 3.4: LHC Rings Design: Experiments, Cleaning, Accelerating and Dump Systems
locations.
• Superconducting magnets
• Radio Frequency Accelerating Cavities
• Collimation system
• Beam Lines
• Control equipment (Beam Loss Monitors, Wire Scanners, Vacuum gauges)
• Support equipment for Ultra High Vacuum and Cryogenics (pumps, cryostats)
The most sensitive equipment from the beam losses point of view are the super-
conducting magnets, that are responsible for bending and focusing the beams. In the
LHC tunnel 1232 main dipoles, 386 main quadrupole plus more than 4000 correctors
are operated at cryogenic temperatures of 1.8 K and 4.5 K. The actual superconducting
magnets, based on Nb superconducting wires, are capable to generate a magnetic field
of 8.33T along their length of 14.3 m (in the case of the main dipoles). Note that in
10

3.3 LHC Collimation System
each magnet unit there are two opposite magnets for the two opposite beams. The new
version of superconducting magnets will use a more performing Nb3Sn superconducting
materials that will allow to reach ≈ 11T requiring smaller magnet spires length.
The superconducting magnets are sensitive against any heating generated by the
beam or other sources because they will lose their super-conductivity provoking an
cascade temperature increase that will not allow the passage of the nominal current
coming from the power source, leading to catastrophic failure of the entire magnet
unit and of the supporting equipment (power lines, cryostats, ecc). The effects of local
heat increase in magnets have unfortunately already been observed during the accident
occurred in 2008, where a welded connection was not properly transferring the current
from one unit to the other provoking the failure of the magnet and a prolonged machine
stop. After that experience many improvements have been implemented to avoid any
other accident on magnets and high energetic power sources.
The studies on the heat deposition on magnets and equipment due to beam losses
have shown how the unique solution to increase safely the machine performance was
to establish a powerful and reliable protection system, composed by remotely con-
trolled Collimators, that has to withstand directly the most energetic particle beam
created by the human kind while protecting the rest of the machine even during severe
accidents.(17)
It is therefore clear the importance of the development and design of the LHC
Collimation system in order to handle the enormous amount of energy concentrated in
the LHC beams.
3.3 LHC Collimation System
The active collimation system of the LHC (18) is a unique of its kind complex protection
and cleaning system especially developed to handle the enormous amount of energy
stored in LHC beams: it consists of more than 100 collimation units (or Collimators)
placed at specific positions all over the LHC ring, as shown in Figure 3.5.
The Collimation system is not a static infrastructure of the LHC machine but
instead is continuously tuned and modified to better accomplish its tasks by the addition
of features to existing designs or by major design and materials modification.
11

3. INTRODUCTION TO LHC COLLIMATORS
Figure 3.5: Summary and position of existing Collimators over the LHC ring.
Actually there are three main families installed, labelled TCP, TCS and TCT,
where the T is “target”, C is “Collimator” and P, S and T are Primary, Secondary
and Tertiary respectively, as will be explained in the following paragraphs. Actually
installed Collimators were also commonly identified as Phase I in many presentations
and papers, however this notation is no more valid and we will refer to each collimator
type with its specific nomenclature. Examples of collimators actually under preparation
are the new TCTP (Tertiary) featuring the Beam Position Monitors (BPMs) and the
TCSM prototype (Secondary) still under development.
3.3.1 Beam Cleaning
During normal operations the collimators are to intercept the unavoidable halo of par-
ticles that tend to escape from the beam correct trajectory (Beam Cleaning): those
particles are highly energetic and is of paramount importance to avoid them hitting
delicate equipment such like superconducting magnets and particles detectors because
they could provoke magnets quenches as stated in various previous works (19) (20)
The collimation mechanism itself relies on two parallel jaws that define a slit for the
12

3.3 LHC Collimation System
Figure 3.6: Schematics of LHC Multi-stage Collimation system
beam, with different collimators having different orientations to cover the whole beam
halo circumference. The beam halo is therefore intercepted by the Collimators jaw
and only the central part of the beam prosecutes without being perturbed. Secondary
particles showers are also produced during the interaction between the highly energetic
beam and the collimator jaws, in order to clean the residual showers a multi-stage sys-
tem has been implemented as shown in Figure 3.6. The multi-stage cleaning system
relies on dynamic movement of the collimators jaws to assure always a cascade be-
tween Primaries (the only ones really touching the beam), Secondaries and Tertiaries,
avoiding concentrated energy absorption that might overcome the Collimators cooling
capabilities. Furthermore, different materials are used in a strategic positions to take
advantage of their different stopping powers.
3.3.2 Machine Protection
The second and most critical assignment of the Collimation System is the machine pro-
tection in case of accidental beam orbit errors: if an entire LHC bunch directly impacts
onto a target, the whole energy of the bunch is deposited into a relatively small region
13

3. INTRODUCTION TO LHC COLLIMATORS
of the target itself. As we already touched on, the energy stored is really enormous and
is potentially destructive for the large majority of materials and structures. In the case
of LHC Collimators, the risks are to damage the cooling water pipes (with water leak
inside the cryogenic vacuum of LHC Beam Line) and to eject melted and vaporized
materials inside the LHC Beam line. A further catastrophic scenario is the melting
and bonding of the collimator’s jaws that would not allow the passage of the beam
until the collimator’s removal. In all those cases the consequences on the entire LHC
machine operations will be catastrophic, forcing to a complete stop of the machine, the
collimator substitution and the reconditioning of the entire interested LHC Beam Line
sector. The expected maximum beam impact scenario has been initially calculated to
be about 20 bunches (21). The beam impact scenario has then been modified in last
years following the evolution of the LHC beam optics and Collimators operations: first,
the value was reduced to about 8 bunches impinging in the same position and perfectly
parallel to the jaw, this modification is due to a substantial improvement in the dump
re-trigger time that reduces the number of bunches that impact on the collimator be-
fore the activation of counter measures. This configuration has been extensively used
to evaluate the beam impact resistance of Tertiary Collimators (22). More recent stud-
ies carried out at CERN explored the effect of the impinging angle of the beam with
respect to the collimator jaw in the case of Tertiary Collimators (23), showing that
the previous scenario was largely conservative. A more detailed discussion about the
effects of direct beam impacts parameters will be presented in Chapter 11. The LHC
Collimation system has been therefore developed to protect the machine in case of ac-
cidental beam orbit errors, the collimator being the first, expendable device that the
beam sees in accidental scenario. In the next Paragraphs the basic physical principles
of the beam-target interaction will be discussed to produce a more accurate view of the
entire phenomena and introduce the requirements of the LHC Collimation system.
3.3.3 Beam Matter Interaction Principles
As we stated the two main functions of the collimation system are the beam cleaning
and the machine protection: both are based on the physical interaction between the
energetic proton beams and a solid target, the first being a continuous interaction
between the beam external tail and the second being an instantaneous, highly energetic
impact of the whole proton beam on the target itself. From the physical point of view,
14

3.3 LHC Collimation System
the interaction between the proton beam and the solid target gives rise to a myriad of
different phenomena, that we can briefly summarize in few elementary categories:
• Proton-Electrons interaction: electrons and photons emission;
• Proton-Nucleus interaction: isotopes formation, elementary particles emission,
kinetic energy transfer, atomic spallation (24);
• Electron-Electron and Nucleus-Nucleus: thermal energy transfer (thermalization)
from energetic atoms inside the target to adjacent atoms.
Those interactions can be predicted relying on a CERN developed Monte-Carlo
software (FLUKA, (25)): the software implements the statistical models of all the
possible particles interactions to produce the history of the single particle in terms of
internal energy, velocity, trajectory and nuclear modifications. The solution of the single
particle path represents of course only one of the possible solutions of the problem, so
the simulation is repeated for another particle, that will have a different history, and
so on until a statistically acceptable distribution has been obtained (i.e. repeating the
process does not vary the energy distribution profile normalized to particle number).
Another important effect of continuous interaction with the beam external halo
(Beam Cleaning) is the formation of defects, isotopes, fundamental particles trapped
in the lattice, ecc, that will modify the thermal, mechanical and electrical properties of
the target material, until it might no more be able to fulfil its fundamental assignments,
fortunately usually after some years of continuous irradiation.
The long time needed to intimately modify the material’s structure is due to the
fact that the beam contains a relatively small number of protons: only 1.5 1011 pro-
tonsbunch, for a maximum amount of 2800 bunches. So one bunch corresponds to a
mass of ≈ 10−12g, therefore the number of electrons emitted, the number of isotopes
created and defects formed by spallation are very low compared to the number of atoms
inside the impacted target volume in the case of a single beam-target impact, which
volume extension is various cm3. However, during the direct impact the target inter-
acts with the beam core that is by far more energetic than the beam external halo:
in that case the amount of the kinetic energy transferred to the target leads to a very
sharp and concentrated internal energy profile inside the target. The deposited energy
15

3. INTRODUCTION TO LHC COLLIMATORS
might be enough to locally melt the target material and generate a compressive shock-
wave inside the target itself. This situation is very dangerous and has been extensively
studied during the present thesis work, see Chapter 11.
The collimation system main constraints have been extensively discussed in past
works (26) and have been constantly updated in the following years when new studies
and information become available. The historical design constraints presented in cited
works have been defined for protons operation, however similar constraints can be
applied to ions operations too.
3.3.4 LHC Collimators Requirements
Apart from the two main functions of the Collimation system there are other require-
ments that must be fulfilled:
• Radio Frequency Impedance: collimators can produce significant transverse re-
sistive impedance due to the small gaps between the collimators jaw, leading
to high beam perturbations that don’t allow to fulfil the LHC nominal beam
parameters. The perturbations are due to electron clouds formed by the beam
electro magnetic field along the Collimators surfaces that interact with the fol-
lowing incoming particles. The charge evacuation is difficult in non conductive
materials like CFC, (see next paragraph 4.1.1) and is actually limiting the LHC
from reaching its nominal energy.
This effects are being carefully studied by CERN RF Group through advanced
analytical and numerical methods, methods that are beyond the scope of the
present thesis and will not be extensively discussed: it is sufficient to mention that
RF experts pointed the importance of replacing Secondary Collimators in CFC
with Secondary Collimators having conductive jaw materials. Further studies
also suggested that the introduction of a thin layer of conductive material on
top of the Collimator’s jaw might be sufficient to accommodate the dispersed RF
currents providing the requested RF Impedance reduction, at least when dealing
with high frequencies (stable beam operations).
• Vacuum: the collimators are to operate inside the Ultra High Vacuum (UHV)
of the LHC beam lines and therefore they must be bakeable (i.e. capable to
16

3.3 LHC Collimation System
sustain a thermal cycle at 300oC for several days) and their outgassing rates
must remain acceptable to sustain the LHC beam line UHV. For example, for a
graphite collimator this imposes special heat treatments (up to 1000oC for several
hours), and careful out baking. In addition, during operations the maximum jaw
temperature must be kept below 50oC by collimator cooling to avoid increases
in the degassing rate. Specific tests are carried out by the CERN Vacuum Group
on every new Collimator material and tank assembly to validate the device with
respect to LHC beam line vacuum requirements.
• Dimensional Stability: The gap between the collimators jaws is a crucial pa-
rameter for the beam cleaning and the beam stability, therefore is of paramount
importance to have perfectly flat and parallel jaw surfaces having the correct gap
and inclination. The tolerance defined for the collimators jaws are: jaw surface
flatness (40µm), reproducibility of jaw settings (20µm), step size in jaw move-
ments (10µm, 15µrad) and knowledge in collimator gap < 50µm. Summarizing,
the collimator’s jaws must have a surface flatness below 40µm over 1 m length
of the collimator jaw during operations, requiring, in addition to fine machining
and metrological control of pieces, the careful containment of the jaw thermal
expansion due to the beam losses.
• Reliability and maintenance: the lost protons will activate the installations in the
cleaning insertions leading to maximal dose rates of up to several mSv/h at di-
rect accessible hot-spots to the tunnel line. The collimator jaws may reach higher
values. The expected dose rates depend strongly on the collimation layout, the
materials chosen, the cooling time as well as the exact location in the insertion.
However, human interventions such as maintenance nearby highly activated in-
stallations must be restricted to the absolute minimum, hence collimators and
belonging equipment must be designed for maximum reliability and fastest main-
tenance or removal operations. This includes the choice of materials that must
not lose quickly their properties by radiation induced degradation.
17

3. INTRODUCTION TO LHC COLLIMATORS
Figure 3.7: Structure of a Primary LHC Collimator.
3.4 Overview of LHC Collimators Design
3.4.1 Present LHC Collimators design
The already installed LHC Collimators, as shown in Figure 3.7 (6), are made up of a
support on which the vacuum tank (containing the beam slit) and the actuation mech-
anism are positioned thanks to a plug-in system; particle beam enters longitudinally
into the vacuum tank through the connections at the extremities (see Figure 3.7 ). It’s
worth noting that the collimator operates on one beam line only, therefore to collimate
the opposite beam a second collimator has to be placed.
Inside the vacuum tank there are the two collimation jaw assemblies, core of the
system, these are the components having direct interaction with particle beams (see
Figure 3.8. In nominal working condition particle beam grazes jaw assemblies with its
external halo; actuation system assure the alignment of the jaws with an high precision.
Figure 3.8 shows more in detail how the jaw assemblies are supported at the extremities
by two shafts that transmit the movement given by the actuation system.
18

3.4 Overview of LHC Collimators Design
Figure 3.8: Schematics of the internal structure of the Collimator.
3.4.2 Future HL-LHC Collimators
The design of the next generation of collimators needed for the High Luminosity LHC
Upgrade started in 2008 with the aim to overcome the major limitations of actual
Secondary Collimators: RF impedance and limited Cleaning Efficiency. The main
design baselines of the next generation of collimators as defined in preliminary design
phase (27) are listed below:
• Supporting structure compatible with installed Collimators allowing rapid instal-
lation in the pre-existing tunnel infrastructures with minimal personnel interven-
tion. The design of the support remains very similar to Figure 3.7.
• Modular design of the jaw assembly to allow the use of alternative materials for
the jaw. The material must however be brazable to the Copper cooling circuit
and respect all the requirements stated in Paragraph 3.3.
• Back-stiffener concept to allow maximum geometrical stability (improves collima-
tor efficiency): this is obtained by geometrical optimization and by the usage of
very stiff Molybdenum bars, as shown in Figure 3.9.
19

3. INTRODUCTION TO LHC COLLIMATORS
• Optimized internal cooling circuit to absorb higher heat-loads. The brazed cooling
circuit is more efficient than the previous TCS and TCP design (cooling pipes in
Cu-Ni alloy pushed on the jaw by springs), see Figure 3.9.
• Integrated Beam position Monitors (BPMs) to minimize set-up time, as already
done in new TCTP collimators, see Figure 3.9.
The first prototype actually under assembly features a Glidcop (Alumina Strength-
ened Copper) jaw designed to have dense jaw material with optimal electrical con-
ductivity. However, Copper’s high density leads to a more localized energy deposition
accompanied by large deformations (due to its high CTE), so to help keep geometrical
stability the jaw has been divided in three blocks, each one having its apposite cooling
circuit and embedded in a INOX and Molybdenum structure (called Stiffener).
Figure 3.9: Details of the single jaw inside the tank with specific improvements with
respect to present Collimators.
To not being limited by the heat transfer through the beam pipe-jaw interface the
cooling circuit has been obtained machining a Copper piece and brazing it directly
to the Glidcop jaw on one side and to the INOX support on the other. The brazing
20

3.4 Overview of LHC Collimators Design
assures the best thermal continuity but doing so the brazed joint separates the water
of cooling circuit from the UHV of the LHC beam line: all brazing must be carefully
controlled to assure the absence of leakages through ad-hoc Helium leakage tests and
Ultra sounds controls of pieces.
21

4
State of the Art of LHC
Collimator Materials
In this paragraph, thermo-physical and mechanical properties of materials presently
used for the BID of interest for this thesis (LHC Collimators) are discussed, giving a
motivation for the choice of each material (28) and introducing the Figure of Merit
(FoM) used to benchmark existing and new solutions.
4.1 Survey of LHC Collimators Materials
As explained in previous Chapter the most critical component of the whole collimator
is the jaw (see Figure 3.9), that is the only part having direct interaction with the high
energy beams, thus being submitted to intense thermal loads both in nominal working
conditions as well as in case of accident scenario. Of course all other components
are subjected to showers and nuclear activation but their requirements are less strict
than the jaw and are therefore not treated in present work: the only exception being
Molybdenum, which is presently used as Jaw Stiffener material in the TCSM prototype
but not as Jaw material. The reasons for including Mo in this treatment are first its
usage as basis for the new MoCuCD, MoGR and MoGRCF composites (presented
in Chapters 8, 9 and 10), and second because its higher robustness with respect to
Tungsten Heavy Alloys, observed in the HiRadMat experiment results in Chapter 11,
increased its appealing as Jaw material for Tertiary Collimators.
Summarizing, the materials are:
22

4.1 Survey of LHC Collimators Materials
• Carbon Fiber Carbon (CFC) composite;
• Graphite
• Tungsten Heavy Alloy (Inermet180)
• Dispersion Strengthened Copper (Glidcop AL-15)
• Molybdenum
4.1.1 Carbon Fibres Carbon composites
Carbon Fibre Carbon composite (CFC) is made by Carbon Fibres embedded into a
graphitic matrix, giving a very light carbon materials that has outstanding mechanical
and thermal properties with respect to pure graphite. It has been developed initially for
Formula 1 cars brake discs, and is actually widely used in sports cars and other special
equipment such as high-performance tennis rackets. Regarding the collimators appli-
cation, it has been chosen for the Primary and Secondary LHC Collimators because of
its good resistance to high thermal shocks and for its low coefficient of thermal expan-
sion that ensure a high geometrical stability, as required by the design specifications
discussed in the Paragraph 3.3.
The CFC used for collimators is a commercial material labelled AC-150K: it is a
2D composite with short Carbon Fibres in a graphite matrix, the Carbon Fibres being
randomly disposed to create a layer in the yz plane; several layers are bundled over
the thickness in the x directions. In this way it is possible to obtain an orthotropic
material with equal properties in the layer plane yz and a different behaviour in the
x direction transversal to the layers (see Figure 4.1). However, the bars used for the
LHC Collimators have been also extruded to increase the final density, giving a different
Flexural Strength between the two planar directions, as confirmed by the measurements
of Flexural Strength made at CERN Mechanical Laboratory (29) presented, together
with the other thermo-physical and mechanical properties of CFC (7), in Table 4.1 1.
1Values measured using the equipment described in Paragraph 6.4.1 along the three directions of
the CFC bar: RFl,x has not been reported because it was below the measuring range of the equipment.
23

4. STATE OF THE ART OF LHC COLLIMATOR MATERIALS
Figure 4.1: Orientation of Carbon Fibre Carbon Composite with respect to Jaw Assem-
bly.
Table 4.1: Carbon Fibre Carbon Composite AC − 150K properties along the three prin-
cipal directions in Figure 4.1 (6) (7).
Property Unit Values
Density [g/cm3] 1.656 1.656 1.656
Specific Heat [J/KgK] 780 780 780
Young Modulus [GPa] Exx = 5 Eyy = 77 Ezz = 77
Shear Modulus [GPa] Gxy = 2.98 Gxz = 2.98 Gyz = 33
Poisson’s Ratio [−] νxy = 0.158 νxz = 0.165 νyz = 0.165
Flexural Strength [MPa] RFl,x = [−] RFl,y = 106.0 RFl,z = 155.9
Coefficient of Thermal Expansion [10−6K−1] αx = 8.75 αy = −1.55 αz = −1.55
Thermal Conductivity [W/mK] kx = 68 ky = 218 kz = 218
24

4.1 Survey of LHC Collimators Materials
4.1.2 Graphite
Polycrystalline extruded Graphite is the second carbon material actually used for Pri-
mary Collimators Jaws: the commercial name of the material, proposed as die for con-
tinuous casting of metals, is Graphite R4550 produced by SGL CARBON GmbH, (30),
whose properties are reported in Tables 4.2 and 9.1. The values have been measured at
CERN during 2006 (7). The material is obtained by extrusion of graphite powders and
sequential thermal treatment to promote graphitization and enhance thermal and me-
chanical properties (31): a more detailed description of graphite production, structure
and properties will be presented in Paragraph 9.1.2 along with the R&D of graphite
reinforced Molybdenum Carbide composite.
Analysing the values of Table 9.1 it is clear as polycrystalline graphite has overall
lower properties with respect to CFC, however its low density combined with the low
CTE give anyway to the material a very good robustness, as confirmed by the value
of TSNI in Table 4.2 presented in next Chapter. For those reasons CFC has been
preferred to Graphite R4550 as Primary Collimator jaw material.
4.1.3 Tungsten Heavy Alloys
Inermet180 is the commercial name of the Tungsten Heavy Alloy (Plansee, (32)) used
for Tertiary Collimators Jaws. The material exhibits good thermal and mechanical
properties combined with a high density and average Z number: for those reasons it is
actually used as particles absorbers to stop the last shower of particles before sensitive
equipment.
The thermal, mechanical and physical properties of Inermet 180 measured at CERN
EN/MME and at AIT (Austrian Institute of Technology) are listed in Table 4.2, the
values beiing at Room Temperature (RT). The evolution of the thermal properties as
a function of the Temperature are shown in Figure 4.3.
The material is obtained by liquid phase sintering of W, Cu and Ni powders in
the nominal composition of 95%w W , 3.5%w Ni and 1.5%w Cu: the big W grains,
approximately 100 µm, are surrounded by the Ni-Cu phase that melts at 1400◦C and
infiltrates the voids between adjacent W particles, providing the necessary thermal and
electrical continuity to the material.
25

4. STATE OF THE ART OF LHC COLLIMATOR MATERIALS
Figure 4.2: QBSD image at low magnification of Inermet180 microstructure. The Tung-
sten grains are clear while the Ni-Cu phase appears black.
In addition, the presence of Ni increases locally the diffusion of W atoms through the
grain borders providing a partial adhesion of the W particles itself giving mechanical
strength to the composite (33),(34).
Those effects have been confirmed by the SEM analysis carried out at CERN (Figure
4.2) and by the thermal characterization carried out at AIT presented in Figure 4.3.
4.1.4 Dispersion Strengthened Copper
Glidcop AL − 15 is the commercial name of the Alumina Strengthened Copper Alloy
produced by SCM Metals that is one of the candidates for the Secondary Collimators
jaws. The peculiarity of the material is that, unlike the large majority of Copper alloys,
it is obtained by powder metallurgy (35) instead of casting or electrolytic methods:
the process starts from a pre-alloyed powder of Cu having small concentration of Al
(%w Al = 0.15%, corresponding to ≈ 0.23%w of Al2O3), mixed with fine Copper Oxide
powder that solid state react with Al to form a fine dispersion of nano-metric alumina
particles inside Cu grains, as shown in Figure 4.4.
26

4.1 Survey of LHC Collimators Materials
Figure 4.3: Thermal properties of Inermet 180 as a function of the temperature. The mag-
nified zone indicates the melting of the Ni-Cu phase in the Differential Scanning Calorime-
try (DSC) plot.
27

4. STATE OF THE ART OF LHC COLLIMATOR MATERIALS
The material is then compacted and cold worked by extrusion to reduce Cu grain
size in order to enhance the elastic limit: the alumina particles block the movement
of dislocations and avoid the grain growth at high temperatures, permitting to main-
tain high mechanical properties at high temperatures while keeping thermo-physical
properties very close to the ones of pure Copper (36).
Figure 4.4: Transmission Electron Microscopy of Glidcop AL − 15: the very small and
uniformly dispersed alumina particles are clearly visible.
Glidcop has been initially chosen as jaw material for Hi-Lumi LHC Collimators,
however its density has been determined to be too high for secondary Collimators and
new composite materials have been indicated as more promising jaw material (37).
Glidcop remains a top choice for supporting the jaw active material because of its
capability to maintain high Yielding Strength even after the brazing process at 780oC,
assuring a good thermal dissipation of the heat generated on the jaw.
4.1.5 Molybdenum
Molybdenum deserves a description even if it is not used for the Collimators jaws
because of two main reasons: it is already used for the Jaw stiffeners of the newly in-
28

4.2 BID Materials Figures of Merit
troduced Collimators design and is one of the main components of the newly introduced
composites that will be described in the present thesis work.
The Mo used for LHC Collimators stiffeners is commercially pure, cold worked Mo
produced by Plansee: the material is obtained by sintering of pure Mo powder at high
temperature (over 2000oC), and sub-sequential cold working up to 50% reduction in
thickness.
The microstructure is made by elongated Mo grains with few small inclusions
(mostly Mo2C) that are finely dispersed inside the Mo matrix, see Figure 4.5. This
situation permits to obtain a very high elongation to fracture in the cold working di-
rection with a completely ductile behaviour, while maintaining adequate properties in
the transversal direction.
As made for Inermet180, Molybdenum has been characterized at CERN in terms of
thermal, physical and mechanical properties in order to confirm the suppliers material’s
datasheet (32).
Molybdenum is used as Stiffener in Hi-Lumi LHC Collimators because of its high
mechanical properties and high thermal stability, but recent results enlighten the pos-
sibility to use it as alternative to Inermet180 in Tertiary Collimators. The summary of
Mo properties at RT are reported in Table 4.2 in next Chapter.
4.2 BID Materials Figures of Merit
The present Paragraph explain the different parameters (or Figures of Merit, FoM)
used to benchmark BID materials. The FoM have been developed for the specific case
of LHC Collimators but are of course valid for any BID.
In fact BID materials are to combine peculiar properties in order to interact with
the incoming particle beam (in the following, beam) without being damaged, because
as mentioned in Paragraph 3.3.3 during the beam matter interaction there are a large
number of different physical phenomena that must be understood and quantified in
order to benchmark the materials.
In order to classify and rank relevant materials against the key requirements summa-
rized in previous paragraphs, five main FoM were identified and used for new materials
benchmarking (38): those FoM cannot cover all the aspects discussed in the aforemen-
29

4. STATE OF THE ART OF LHC COLLIMATOR MATERIALS
Figure 4.5: Optical Microscopy of Molybdenum microstructure: the grains are elongated
and there are no visible pores and inclusions.
tioned LHC Collimators design constraints, but are to give a valuable indication of the
materials behaviour for the more general BID application.
The definition of the FoM have been modified during the years adding the density
in the Steady-state Stability Normalized Index, while some values already reported in
previously cited works (38) have been substituted with new, more reliable measure-
ments, like the ultimate strength of CFC that has been recently measured at CERN
with the flexural test fixture, see Paragraph 4.1.1 and 6.4.1).
In the case of anisotropic materials, like the orthotropic CFC shown in Table 4.1,
there is a significant reduction of thermal and mechanical properties along the transver-
sal direction. In order to give a more realistic representation of the material behaviour
the value of CTE used for calculating the Steady-state Stability Normalized Index
(SSNI) and the Transient Thermal Shock Normalized Index (TSNI) is a ROM between
the three principal directions.
• Density ρ (and Atomic Number Z). It provides a rough indication of the material
cleaning efficiency as discussed in Paragraph 3.3. The higher the density (and
30

4.2 BID Materials Figures of Merit
atomic number) the better the cleaning efficiency but also the more concentrated
energy deposition with the consequences described in Chapter 11. This value
depends strongly on the Collimator’s family, being as low as possible for Pri-
maries (< 2 g/cm3), intermediate for Secondaries ( 2.5 < ρ < 5.5 g/cm3), and
sufficiently high for Tertiaries (> 10 g/cm3).
• Electrical conductivity. This parameter is not mandatory for BID in general but
is of paramount importance for LHC Collimators and therefore has been included
in the FoM. For LHC Collimators the electrical conductivity has to be maximized
in order to limit RF impedance, as discussed in paragraph 3.3.4 . However, recent
calculations performed at CERN RF Group showed that is not necessary to have
a very good conductor as jaw material, if it is coated with a sufficiently thick
conductive support that accommodates the RF electromagnetic field.
• Steady-state Stability Normalized Index (SSNI). This parameter, defined as k/αρ
(where k: Thermal Conductivity, α: Coefficient of Thermal Expansion, ρ: Den-
sity), expresses an indication of the ability of the material to maintain the geo-
metrical stability of the jaw when submitted to steady-state losses. Density has
been added to the formulation to express the effect of the more localized and
concentrated energy deposition in dense matter.
• Transient Thermal Shock Normalized Index (TSNI). Parameter defined as R(1−ν)cp/Eα (where R: ultimate tensile strength, ν Poissons ratio, cp specific heat, E
Youngs Modulus). TSNI is correlated to the highest absorption rate of impacting
particles before the onset of mechanical damage. It’s worth to mention that
dynamic failures require specific materials models to be correctly analysed: those
tools, together with their experimental validation, will be presented in Chapter
11.
• Melting Temperature Tm. It provides an indication of the maximum temperature
the material can achieve before being permanently damaged by melting. Note
that for composite materials (or pseudo alloys like Inermet180) this number is
always referred to the lower melting phase: for Inermet180 Tm ≈ 1400◦C, even
if the 95%w of the material is composed by Tungsten which melts at 3400◦C.
31

4. STATE OF THE ART OF LHC COLLIMATOR MATERIALS
This assumption might seem drastic but has been confirmed experimentally by
the post impact damage on Inermet180 samples, as shown in Chapter 11.
4.3 Benchmarking of present Collimator materials
The presently used Collimator materials have been studied and their FoM have been
evaluated to give an overview of their effectiveness as BID materials. In the case of
orthotropic materials, like CFC, the values reported of k, CTE, Tensile Strength and
Poisson’s Ratio are a ROM calculation over the three principal directions reported in
Table 4.1 in order to give a simplified indication of the behaviour all over the three
dimensions.
Table 4.2: Physical and mechanical properties and Figures of Merit of Carbon Fibre
Carbon Composite (CFC), Graphite R4550, Inermet 180, Glidcop and Molybdenum. Val-
ues of k, CTE, Tensile Strength and Poisson’s Ratio are a ROM calculation for CFC are
obtained by a ROM calculation over all the three principal directions.
Property Unit CFC R4550 Inermet180 Glidcop Mo
Density [g/cm3] 1.65 1.83 18 8.93 10.22
Atomic Number (Z) [−] 6 6 70.83 29 42
Radiation Length χ0 [cm] 12.25 12.25 0.35 1.47 0.98
Melting Temperature [◦C] 3650 3650 1400 1083 2623
Thermal Conductivity [W/mK] 168 100 90.5 365 138
CTE [10−6K−1] 1.88 4.29 5.25 16.6 5
Specific Heat [J/KgK] 780 780 150 391 251
Young’s Modulus [GPa] 53 11.5 360 130 330
Tensile Strength [MPa] 87 40 660 413 660
Poisson’s Ratio [−] 0.16 0.15 0.29 0.33 0.36
SSNI [Wm2/g] 54.1 12.7 0.96 2.5 2.7
TSNI [J/g] 570.8 537.5 37.4 50.1 64.7
Electrical Conductivity [MS/m] 0.14 0.077 8.6 53.8 19.2
Table 4.2 indicates the values of all the Figures of Merit for the aforementioned
materials (CFC, Graphite R4550, Inermet180, Molybdenum and Glidcop): comparing
the TSNI of CFC and Graphite R4550 with those of metallic materials it is clear
how it is not possible for a metallic material to reach the robustness (TSNI) of CFC,
32

4.3 Benchmarking of present Collimator materials
at least along the Longitudinal direction. The reasons are the very low density and
CTE of Graphite that give to the material a superb thermal shock resistance, but the
low density also limits the cleaning efficiency in steady state conditions and the low
electrical conductivity leads to high RF Impedance. This material remains the best
choice for Primary Collimators but is limiting the machine when used in Secondary
Collimators. The material initially proposed for the Secondary Collimator Prototype
TCSM, Glidcop, has optimal electrical properties but is now considered too dense to
act as a Secondary Collimator: the energy deposition is way more concentrated with
respect to CFC (see the radiation length values in table 4.2) and the material expansion
becomes more important, as discussed in previous Chapter. This effect reflects itself in
TSNI parameter, that is one order of magnitude lower than for CFC.
A single material that maximizes all the FoM at the same time does not exist: in fact
there is the need for ceramics typical properties (low density, low CTE, high melting
point and Thermal Stability) and for metals common properties (electrical conductivity,
mechanical strength). The only way to overcome such limitations is to develop ad-hoc
composites that are to combine the good qualities of metals and ceramics in a single
form.
33

5
Analytical Modelling of
Composite Materials Properties
In this chapter the main mathematical and experimental tools used for the thesis work
are presented and discussed.
The study of new materials is always delicate because there are not well established
standards to guide the characterization work and the results interpretation, therefore
many different techniques were used to have the maximum amount of information.
Many assumptions made in the preliminary phase of the material design have then been
validated or rejected by the following experimental results, leading to a dynamically
evolving and not always linear material’s R&D roadmap.
5.1 Introduction to Composite Materials
There are infinite numbers of composite materials that use different matrix constituents,
different reinforcement materials having different shapes (39); a general and not exhaus-
tive list of the different composite materials categories is:
• Polymer matrix composites (PMC)
• Metal matrix composites (MMC)
• Ceramic matrix composites (CMC)
34

5.1 Introduction to Composite Materials
The more used composites are PMC due to their light weight and the low cost of
both raw materials and production cycle, they can be filled with any kind of reinforce-
ment. As stated in Chapter 3.3 it is not possible to use highly degassing materials (such
as polymers) in the LHC Beam Vacuum environment, therefore this class of material
has not been studied in the present work.
MMC (40) are more difficult to produce and the raw materials are usually more
expensive than for PMC: while in PMC the matrix phase is usually initially in the
liquid form so that it infiltrates the voids between reinforcement particles or fibres and
only after it solidifies or react becoming solid, for metallic matrix composites it is often
more difficult to melt the metallic matrix (apart from very low melting metals such as
Aluminium) due to technological limits of used furnaces and equipment. In that case the
material compaction has to rely entirely on solid state diffusion (Solid State Sintering,
SSS) that is a slower and more delicate process than Liquid Phase Sintering (LPS).
However, such composites keep many important features of metallic materials, such
like high thermal conductivity, low thermal expansion, high melting point (depending
on the matrix phase), high stiffness, electrical conductivity and, to a certain extent,
ductility. This family of composite materials has been extensively studied for thermal
management applications where specific thermal expansions are needed, for example to
match the Silicon thermal expansion in computer microelectronics (41).
A third process to produce MMC is composed by prior compaction of dry rein-
forcement followed by infiltration by the liquid matrix: this process is called Liquid
Infiltration, and can be done only when dealing with highly fluid liquid metals having
a relatively low melting point. The drawbacks of this process are the difficulties in ob-
taining a pore free and homogeneous material and the limited dimensions of produced
pieces.
Finally, CMC are more expensive (and technological challenging) materials that use
a ceramic phase as matrix and, usually, a second ceramic phase as reinforcement. With
commercially available technologies this kind of composites can only be produced by
Solid State Sintering because the temperatures needed to melt ceramics (usually be-
yond 2000oC) exceed the application range of the large majority of furnace materials.
Ceramic matrices give to the composite the highest hardness and chemical stability,
combined with a high melting temperature and thermal stability. Cons are their high
35

5. ANALYTICAL MODELLING OF COMPOSITE MATERIALSPROPERTIES
brittleness and their very low electrical conductivity: for those reasons the main appli-
cation of CMC are cutting tools, where the CMC are used as small inserts screwed or
bonded to a metallic support. CMC might be the best option for the LHC Collimators
application if the ceramic matrix is capable to conduct current, that is the case of
Molybdenum Carbide used in the newly developed materials (see Chapter 9).
The reinforcements might in principle be of any kind of material, the most commonly
used reinforcements being ceramics in forms of particles or fibres due to their high
stiffness, strength and lightness. The fibres might be short, long or continuous, the two
more widely used being glass fibres and carbon fibres (as used in present work).
The parameters needed to correctly define a composite material are:
• Quantity of reinforcement (usually expressed in Volume percentage %v or Volume
fraction fV );
• Shape and dimensions of reinforcement;
• Relative orientation of reinforcement (for non-spherical particles only) usually
defined with respect to production geometry (for example in pressed materials
the orientation is referred to the direction normal to pressing direction);
• Quality of the matrix-reinforcement interface: a chemical bonded interface gives
usually higher adhesion (and higher final properties of the composite) with respect
to non chemical interfaces. Bonding elements might be added to the composite
especially to provide a chemical bond (Si addition to Al-Graphite composite to
form SiC at the interface (42)).
• Internal Structure of reinforcements: in certain cases the reinforcements might
have a fair complex internal structure, or they might have been coated to create
an intermediate reaction layer to assure a chemical bond or a better space filling.
• Porosity: all composite materials made by powder blending have a certain amount
of residual voids. The amount of pores has obviously to be minimized in order
to achieve the best final properties, apart from the case of foam materials where
the porosity is a key feature of the material.
36

5.2 Physical Properties
With the knowledge of all the reinforcement’s parameters and of the constituent’s
properties it is possible to estimate the final properties of composite materials by ade-
quate analytical methods under precise assumptions (43). The approximations usually
proceed from ideal conditions, i.e. optimal boundary, ideal reinforcement distribution
(very small number of contacts of the reinforcements among themselves) and no influ-
ence of the reinforcement on the matrix (independent behaviour).
However, in reality a strong interaction arises between the components involved,
so that these models can only indicate the potential of a material and provide design
guidelines during materials development. In the following various models having in-
creased complexity are presented to allow the estimation of the properties of interest
for LHC Collimators Materials.
5.2 Physical Properties
The first and most important physical property of a composite material is its density
(ρ, [g/cm3]), followed by the atomic number (Z, a-dimensional) and by the radiation
length (χ0, [cm]), that defines the ability of the material of stopping incoming particles
(inversely proportional to ρ and Z). A fourth physical property of interest is the specific
heat (cp, [J/KgK]) that due to its strong connection with the thermal properties of
the materials have been described in Paragraph 5.4.
All this properties are mass only dependant, so we can assume that each constituent
will give a contribution proportional to its volume fraction: this simple model is the
well-known Rule Of Mixture Model (ROM) that weighted means the properties (Pi) of
the single components (m: matrix and r: reinforcement, in the case of a two components
material) to obtain the property of the composite (PROM ):
PROM = fv,m ∗ Pm + fv,r ∗ Pr (5.1)
where P is ρ, Z, χ0 or cp.
5.2.1 Electrical Properties
The electrical properties (i.e. the electrical conductivity σ in [MS/m]) of composite
materials depend on the nature of the constituents: usually in MMC the matrix is
conductive while the reinforcement is a ceramic insulator (diamonds, SiC, Al2O3, ecc)
37

5. ANALYTICAL MODELLING OF COMPOSITE MATERIALSPROPERTIES
or a low conductor like graphite or carbon fibres; the situation in CMC is different
because the matrix is usually not conductive and the final conductivity relies on the
conductivity of the reinforcement (if any).
In the situation of insulating particles embedded into a conductive matrix, the ROM
model would tend to overestimate the effective conductivity because of the hypothesis
of independent behaviour of matrix and reinforcement that is not true because the
current flow is limited by the effective geometry of the conductive phase. An empirical
model that expresses the electrical conductivity as a power function of the reinforcement
volume fraction has been obtained at EPFL for diamond reinforced MMC based on very
good metallic conductors (Cu, Ag, Al) (44):
σc = σm ∗ f1.57v,m (5.2)
On the other hand in CMC the absence of an isotropic conductive phase (like in
MMC) hampers the usage of already presented simple models such as 5.1 and 5.2.
For that reason we considered in first approximation the ROM model and the MMC
empirical model as upper and lower limit of the CMC conductivity. A more detailed
description of the electrical conductivity of Carbon Fibres reinforced composites will
be given in Chapter 10.
5.3 Mechanical Properties
In order to conveniently define the mechanical properties of a composite material, it
is better to separate the elastic behaviour (that can be predicted with relatively good
accuracy) and the non-elastic behaviour comprehending plasticity and fracture, which
are governed by the defects statistics and have a more complex mathematical treatment
that not always leads to acceptable results.
The entire elastic tensor (45) of a homogeneous, continuous and isotropic solid body
can be expressed by the linear combinations of two independent constants, that usually
are the Young’s Modulus (E, in [GPa]) and the Poisson’s ratio (ν, a-dimensional and
valid between 0 and 0.5) or the Young’s Modulus E and the Shear Modulus (G, in
[GPa]).
38

5.3 Mechanical Properties
The isotropy hypothesis is valid for all composite materials that do not exhibit a
preferential orientation of the reinforcement: in our case it applies only to CuCD and
MoCuCD.
In all other studied materials the relative orientation of the matrix and the re-
inforcement brings to an orthotropic material having different properties between the
Hot-Pressing direction and the plane normal to the pressing direction, like for CFC (see
Paragraph 4.1.1), or for MoGR and MoGRCF, where the recrystallization of graphite
plays an important role in the material anisotropy (see Chapter 9). For those materials
5 independent elastic constants are needed to precisely define the entire elastic tensor.
Figure 5.1: Schematics of Voigt (Equal Strain) and Reuss (Equal Stress) assumptions for
particulate reinforced composite.
Looking at the reinforcement distribution of Figure 5.1 we can immediately define
two limit cases: if we consider the a) case, in which the body has been ideally cut
perpendicularly to the load application, to conserve the continuity of matter the defor-
mations of the two phases must coincide in every point (assumption of Voigt), while if
we consider the b) case to assure the force balance the stresses on the two phases must
coincide. The mathematical treatment is very simple and is not worth reporting here,
summarizing we can express the Young’s Modulus in two ways:
EV = fv,m ∗ Em + fv,r ∗ Er (5.3)
ER = (fv,m/Em + fv,r/Er)−1 (5.4)
39

5. ANALYTICAL MODELLING OF COMPOSITE MATERIALSPROPERTIES
that can be considered respectively as the upper and lower limit of the isotropic
composite, as shown in Figure 5.2. The third line is the Hill model that simply makes
an average between the Voigt and the Reuss models.
Figure 5.2: Comparison of Voigt, Reuss and Hill models for Al-SiC composite as a
function of the SiC fraction (θ).
Analogous calculations can be done with the Shear Modulus Gi to obtain the second
independent variable needed to define the entire stress tensor.
5.3.1 Elastic Constants of Orthotropic Materials
The precise definition of the entire elastic tensor of an orthotropic material requires the
identification of 5 independent variables (C11, C12, C13, C33, C44) as extensively
discussed in past master thesis work (46); the material is assumed having a layered
geometry oriented as presented in Figure 5.3.
The model proposed reconstructs the composite materials elastic constants starting
from the isotropic constants of the single components by imposing opportune boundary
conditions. Once obtained the elastic constants it is possible to calculate the Young’s
Modulus and the Shear Modulus along any direction.
40

5.3 Mechanical Properties
Figure 5.3: Axis Definition for an orthotropic materials, here simplified as a layered
structure.
Model Hypothesis:
• Homogeneous, isotropic layers having same known Ei and Gi, that allow calcu-
lation of C11 and C44i constants by the following equations:
C11i =Ei ∗ (1− ν)
(1 + ν) ∗ (1− 2ν)(5.5)
C44i ≡ Gi (5.6)
• Perfect, planar interfaces without phase mixing;
Boundary Conditions:
• C11c: Reuss combination of C11i (to assure stress continuity);
• C44c: Reuss combination of C44i (to assure stress continuity);
• C13c: Voigt combination of C44i (to assure strain continuity);
• C33c: Voigt combination of C11i (to assure strain continuity).
• C12c: Arbitrarily assumed ≡ to C44c (46),
41

5. ANALYTICAL MODELLING OF COMPOSITE MATERIALSPROPERTIES
Figure 5.4: Schematic representation of the Voigt and Reuss Models applied to Or-
thotropic materials.
Using the composite elastic constants calculated by we can define the Elastic Mod-
ulus along fibres direction (in our case is the plane normal to the pressure application)
and in the normal direction as longitudinal (EL) and transversal (ET ) Modulus as
expressed in equations 5.7 and 5.8 below.
EL =C33 ∗ (C112 − C442) + 2 ∗ C132 ∗ (C44− C11)
C11 ∗ C33− C132(5.7)
ET =C33 ∗ (C11− C44)− 2 ∗ C132
C11 + C44(5.8)
In the present work, which is a preliminary R&D investigation, we can rely on
the Elastic Modulus evaluation along the two principal direction to compare (in first
approximation) the behaviour of the newly introduced orthotropic composites.
5.3.2 Strength and Failure of Composite Materials
As anticipated the prediction of the composite material strength and failure is not
trivial and relies strongly on the relative properties between the constituents.
The materials of interest for LHC Collimators are mainly MMC reinforced with
diamonds (CuCD and MoCuCD) and CMC reinforced with fibres and graphite (MoGR
and MoGRCF), so we can expect to have always a brittle behaviour with limited
plasticity, in the first case because the content of diamonds is so high that it does not
42

5.4 Thermal Properties
allow Cu to plastically deform, in the second case because the ceramic constituents
don’t allow plastic deformation by dislocation movement.
It is well known that for brittle materials the fracture appears always on a “critical
defect”, where the critical defect is a defect that provokes a tri-axial stress intensification
high enough to overcome locally the material’s resistance (47). In MMC the tri-axial
stress intensification is also enhanced by the presence of particle clusters formed by a
non homogeneous particle distribution in the material (48) that must therefore been
kept under control to avoid drastic reductions in mechanical properties. In addition, as
stated in the introduction of this Chapter, our composites obtained by SSS have always
a certain amount of closed porosity that acts mechanically as a defect distribution.
The only way to correctly treat the effect of porosity is by using statistical means
such as the Johnson-Holmquist Model (49) for brittle materials adding the effect of
the limited inter-facial strength. The model can be implemented in hydrodynamic
codes such as Autodyn or LS-Dyna (50) as shown in Chapter 11 in the case of the
Johnson-Cook model implementation for Inermet180.
Since these models are all based on a llarge amount of experimental tests it has
not been possible to apply them to the composites of interest, therefore in the present
work the strength of the composites is only qualitatively estimated by evaluating the
porosity content of the composite: the more porous the composite material the lower
the strength.
5.4 Thermal Properties
The thermal properties we are interested in are: thermal conductivity (k, [W/mK]),
coefficient of thermal expansion (CTE, also expressed as α, [K10−1]), and (volumetric)
specific heat (cp, [J/KgK]).
5.4.1 Thermal Conductivity
The thermal conductivity k expresses the ratio between the amount of heat that passes
through a solid body and the temperature difference at the body’s extremities: this
is a transport property that depends strongly on the heat transfer mechanism, that
is only phononic for ceramics (absence of free electrons) and phononic and electronic
43

5. ANALYTICAL MODELLING OF COMPOSITE MATERIALSPROPERTIES
for metals. The composite final properties are a combination of the two mechanisms
balanced by the reinforcement-matrix bond.
Furthermore, since it is a transport property the relative reinforcement orientation
with respect to the thermal flux direction plays an important role, as is the case for
MoGRCF.
For isotropic composite materials the parameters that play a role in establishing
the thermal transport inside the microstructure are:
• Shape of the particles,
• Dimensions of the particles,
• Volume fraction of particles,
• Thermal conductance of the interface (or thermal resistance).
In the case of orthotropic materials having non spherical particles with a preferential
orientation (like MoGRCF) we have also to consider the:
• Distribution of fibres orientation
When using the ROM model we assume to have a perfect interface between the
two phases (which transmits without resistance the heat) and we disregard the effect
of diamond particle size, shape and orientation.
Those effects are important in the real particle reinforced composites because the
interface is not perfect and acts as a thermal resistance: since reducing the particles
dimensions increases the surface/volume ratio, and therefore the total thermal resis-
tance along the material, using smaller particles results in lower values of thermal
conductivity.
Let’s take as example the simple system Cu-diamond of CuCD, well studied in
past works (51): the low wetting and the low chemical affinity of the diamond surfaces
with Cu results in a weak inter-facial bonding, that reflects itself in a lower value of
measured thermal conductivity with respect to the ROM estimation, that is mathe-
matically expressed as a thermal resistance at the interface. If we assume a simple
model made of sphere particles homogeneously distributed in a continuous matrix with
ideal heat transfer at the interface, we can calculate an effective thermal conductivity
44

5.4 Thermal Properties
of the composite by using the original theory of Maxwell (52): this method tends to
overestimate the effective thermal conductivity because disregards the effect of the re-
inforcement size and of the interfacial thermal resistance. To overcome this limitations
an improvement of Maxwell’s model has been proposed by Hasselmann and Johnson
(53) and is reported in equation 5.9:
kc = km ∗
2(
krkm− kr
a∗hc− 1)∗ fv,r + kr
km+ 2 ∗ kr
a∗hc+ 2(
1− krkm
+ kra∗hc
)∗ fv,r + kr
km+ 2 ∗ kr
a∗hc+ 2
(5.9)
where:
kc,r,m = Thermal conductivity of composite, reinforcement and matrix respectively
[W/mK], %v,r = Volume percentage of reinforcement, a = Reinforcement spherical
particles Diameter [m], hc = Thermal conductance at the interface [W/m2K].
The main issue with the Hasselmann and Johnson model is that the value of ther-
mal conductance hc depends strongly on the reinforcement - matrix interface (that
also depends on the production process) and is not known for the large majority of
applications: the model however permits to evaluate the thermal conductance by mea-
suring the thermal conductivity of the composite. Using this method Yoshima and
Morigami found a conductance value between Boron-doped Copper and Diamonds of
2.97∗107W/m2K (51). It is worth noting that the thermal conductance at the diamond
metal interface is the bottleneck of diamond metal matrix composites and that huge
efforts are made to improve the interfacial heat exchange by adding carbide forming
elements that provide a local chemical bond between the phases (54) (44).
The relatively simple mathematical treatment of the spheres reinforced composites
thermal conductivity presented in last Paragraph is unfortunately not valid in the more
general case of ellipsoidal particles having a preferential orientation, like in the case of
MoGR composites or MoGRCF Composites. In order to handle such materials a more
general approach, the so-called Kapitza Model, has been used instead of Maxwell model:
the interfacial thermal resistance is now thought as the limiting case of heat transport
across bulk phase separated by a thin, poorly conducting interphase region, the thermal
conductance effect being represented by the thickness of the poorly conducting phase
(defined as αk, the Kapitza radius) (55). Using this assumption is it possible to express
the effective thermal conductivity of a known particulate reinforced material along
every direction taking into account the ellipsoids relative direction distribution: while
45

5. ANALYTICAL MODELLING OF COMPOSITE MATERIALSPROPERTIES
the detailed mathematical treatment is omitted for simplicity and can be found in the
literature (55), the results for the various composites calculated following the formulas
given by Nana and Birringer will be presented in the chapters dedicated to the new
materials R&D.
5.4.2 Coefficient of Thermal Expansion
Analytical expressions for describing the CTE of composites materials have been pro-
posed by many authors: Turner (56) first established the fundamental bonding between
the thermal expansion and the elastic properties of the different phases by taking into
account the Bulk Modules Ki of both matrix and reinforcement, as shown in Equation
5.10.
αc =αm ∗Km ∗ fv,m + αr ∗Kr ∗ fv,r
Km ∗ fv,m +Kr ∗ fv,r(5.10)
The proposed Turner model is based on the hypothesis of ideal, perfectly bonded
interfaces that transmit the strains and the stresses through the constituents; follow-
ing works from Kerner (57) improved Turner’s model by taking into account also the
Shear Modulus when calculating the thermally induced stress distribution around the
inclusions.
In addition to the Kerner model, that is the most suitable for metal-diamond ma-
terials and has been used in the present work, many different formulations have been
proposed in last years to better describe specific composite materials families: here we
present the formulation given in the most recent bibliography by Hsieh and Tuan (58).
αc = αm∗fv,m+αr∗fv,r+fv,m∗fv,r∗(αr−αm)∗ Kr −Km
αm ∗ fv,m + αr ∗ fv,r + 3 ∗Km ∗Kr/(4 ∗Gm)(5.11)
5.4.3 Specific Heat
Since it is a mass only dependant property, the specific heat cp is correctly predicted
by the ROM Model of equation 5.1.
46

6
Composite Materials
Characterization Techniques
In this Chapter the tools used to measure the materials properties are explained with
the aim to provide a systematic approach to new materials characterization. The mea-
surements are divided in non-destructive and destructive tests, the first being performed
with as received plates while the second being performed after the plate cutting and
the sample preparation. Unfortunately diamond based material samples cannot be
machined by standard cutting tools but have to be prepared relying on the water jet
cutting technique only, giving some limitations in samples shape and dimensions, as
will be presented in Chapter 8.
6.1 Preliminary Non-destructive Analysis
6.1.1 Density
The first (and probably the most important) property to be verified on a newly pro-
duced composite sample is its density (ρ, [g/cm3]), the measurement being made using
an Archimedes principle balance: the sample is weighted both dry and while being
submerged in water, by the difference between the dry and the submerged weight it is
possible to calculate the specific weight, or density, of the sample.
We can define the samples compaction rate (ρ/ρth) from the ratio between the
measured density ρ and the theoretical density ρth (calculated using 5.1): this value
expresses the effectiveness of the sintering process and is a good indicator of the final
47

6. COMPOSITE MATERIALS CHARACTERIZATION TECHNIQUES
properties of the composites, especially when dealing with transport properties (elec-
trical and thermal conductivity). Note that this method will not take into account the
effect of the open superficial porosity due to water penetration from the surface. The
Archimedes balance used in BrevettiBizz to measure the effective density of produced
composites is shown in Figure 6.1 (59).
Figure 6.1: Achimedes balance used in BrevettiBizz to measure the composites density.
6.1.2 Electrical Conductivity
The second non-destructive analysis made on newly produced composite plates is the
mapping of the superficial electrical conductivity (σ, [MS/m]): in addition to the av-
erage σ (and its standard deviation) the mapping will give valuable information about
the homogeneity of the produced composite plate. As explained in previous Chapter
these materials are produced by powder blending and sintering, so there is always an
intrinsic risk of powder segregation during the powder handling (for example when
placing the blended powder in the graphite moulds) due to the significant difference in
density, shape and dimension of the constituents.
Various techniques have been developed in BrevettiBizz to minimize the powder
segregation and assure the best homogeneity of the produced composites, two examples
are the powder blending made in various steps (adding small amounts of powders
each step) and the powder insertion in the mould made relying on vibrating plates.
However, changing the materials composition and/or the shape of the mould might
have detrimental effects on the final material homogeneity, that have to be verified on
48

6.2 Samples Preparation
each newly produced composite plate. On top of that, variations of the temperature
distribution during sintering might lead to density or composition non homogeneities
in the plate even if starting with perfectly distributed powders, as will be explained for
MoGRCF composites in Chapter 10
Figure 6.2: Foerster Sigmatest 2.069 used for mapping the superficial electrical conduc-
tivity. The used sensor is 6 mm diameter and the effective analysed area per measure point
is about 8 mm in diameter.
The analysis have been performed using a Foerster Sigmatest 2.069 apparatus (60)
(shown in Figure 6.2): it measures the superficial electrical conductivity by evaluating
the variations induced by the body on the emitted RF electromagnetic field. The higher
the frequency, the lower the effective penetration depth of the signal, thus changing the
frequency allows to evaluate the electrical conductivity at different depths inside the
sample. In addition, the electrical conductivity of the sample influences the penetration
depth too, so it is possible to verify the investigated thickness by an empiric formula
provided by the machine manufacturer. Finally, the instrument sensor is approximately
6 mm in diameter, while the effective investigated area is approximately 25% larger so
each measured point has to be spaced by at least 10 mm to have meaningful measure-
ments.
6.2 Samples Preparation
After the preliminary non destructive analysis the composite plate has to be cut to ob-
tain the samples needed for the following analysis: while in diamond based composites
49

6. COMPOSITE MATERIALS CHARACTERIZATION TECHNIQUES
it is practically mandatory to use the water-jet technique (due to the diamond hard-
ness) on soft, graphite based composites it is possible to use precision cutting machines
to obtain the samples.
Figure 6.3: Samples of MoCuCD (8) cut by water jet: the cutting cone, the cut surface
roughness and the cutting end residuals are clearly visible.
The water jet technique has also some drawbacks, the first being the cutting cone
effect that leaves trapezoidal section samples, and the second being a pronounced rough-
ness of the cut surfaces, that can be only partially removed by sand paper, and the
third being a residual left by the cut endings (that is kept on non functional surfaces).
If parallel surfaces have to be obtained, for example for CTE measurements, the sam-
ples can be milled by diamond tools taking care of avoiding samples overheating, like
shown in Figure 6.4 for CTE samples.
It is also convenient to identify the spatial origin of each sample to verify materials
non homogeneities (as already discussed) and reconstruct a map of materials properties
and sample’s orientations, like shown in Figure 6.5. Unfortunately, during water jet
cutting it is normal that the samples detach and fall inside the water bath, so it is not
possible to assign to each sample its correct position in the original plate.
50

6.3 Microstructural Analysis
Figure 6.4: Thermal conductivity (diameter 10 mm H4 mm), thermal expansion (16x4x4
mm) and specific heat (diameter 3 mm H1 mm) samples of MoCuCD.
After cutting and polishing, the samples have to be cleaned by ultrasound in al-
cohol, carefully dried and stocked. For SEM samples (see section 6.3.1 below) it is
also mandatory to perform a degassing cycle inside desiccators to reduce the sample
degassing inside the SEM vacuum chamber. Finally, the samples should always satisfy
the dimensional tolerances foreseen in international standards for the specific tests.
6.3 Microstructural Analysis
The analysis and interpretation of the materials internal structure is of paramount
importance for understanding the composite materials behaviour and improving its
production process, therefore all composite materials of interest have been observed
using optical microscopy, Scanning Electron Microscopy (SEM) and X-Rays Diffraction
to characterize in the most exhaustive ways their internal structure.
51

6. COMPOSITE MATERIALS CHARACTERIZATION TECHNIQUES
Figure 6.5: 3D representation of samples positions (and orientations) for MoGRCF plate
cut by precision cutting machine.
6.3.1 Imaging through Optical and SE Microscopy
The real composite materials behaviour, as explained in previous Chapter, is strongly
influenced by the presence of interfaces between phases and by the presence of defects
such as macro-cavities and porosity. In addition the shape, dimensions and crystallo-
graphic orientation of the phases contribute to the final properties of the material so
that it is of paramount importance to properly characterize the materials microstruc-
ture.
The two imaging techniques used in the present work are the Optical Microscopy
(OM) and the Scansion Electron Microscopy (SEM).
In OM a focused light beam is reflected by the sample surface (that has to be
planar, disposed perpendicularly to the beam and polished) and is then transmitted
to an ocular or a video camera for the computer acquisition. The technique requires
planar and polished surfaces in order to properly reflect the incoming light, and the
sample’s surfaces has to be etched (slightly corroded with acids) to reveal the grain
boundaries (and the presence of constituents) that will appear black because the light
52

6.3 Microstructural Analysis
will not be transmitted by the eroded grain boundary area.
On the other hand in SEM the probe is an electron beam focused on the sample
and the image is reconstructed point by point by acquiring the electrons emitted by the
scanned surface. The two techniques are very similar in concept (both analyse a sample
surface giving an image at the chosen magnification) but SEM has many advantages
with respect to OM, not only in terms of image quality (higher effective resolution and
depth of field) but also because it can give additional information about the chemistry
(by Back Scattered Electrons Imaging and Energy Dispersion Spectroscopy, EDS) and
the crystallographic orientation (by Electron Back Scatter Diffraction, EBSD) of the
present phases.
The SEM technique has then been extensively used on all composites materials to
verify:
• Fracture Surface Analysis:
– fracture surface aspect,
– fracture position and type (inter-phase or intra-phase),
• Material microstructure at different magnifications:
– dimensions, shape and orientation of phases,
– aspect and chemical nature of interfaces,
– spatial distribution and relative orientation of reinforcement,
– verification of materials homogeneity in different positions,
• Material Compaction:
– position, dimensions and orientation of cavities (> 1µm) and pores (< 1µm),
– position, dimensions and orientation of micro-cracks,
• Chemical Composition:
– EDS analysis on large areas (to verify nominal composition),
– punctual EDS analysis on impurities or secondary phases,
The results obtained by the different techniques will be presented in next Chapters
8, 9 and 10 together with a discussion of the SEM parameters used to investigate the
different aspects of the composites listed above.
53

6. COMPOSITE MATERIALS CHARACTERIZATION TECHNIQUES
6.3.2 X-Rays Diffraction
X-Rays Diffraction is a technique based on the Bragg’s interaction between collimated
X-rays (having a precise wavelength when impacting the sample) and the sample crys-
tallographic planes: the interaction, expressed by Bragg’s law 6.1, gives rise to different
peaks in the spectrum at precise angles. By the peak’s position we can then calculate
the inter planar distance of the sample crystal by inverting 6.1 .
nλ = 2dsin(θ) (6.1)
where: n = integer; λ = X-ray wavelength; d = distance between two adjacent
crystallographic planes; θ = angle of incoming X-Rays beam.
The technique is traditionally used on powders to have a statistical distribution
of each crystallographic plane orientation and observe all crystallographic directions
in the same spectrum, however it is also possible to investigate a bulk sample with
known composition to verify the relative orientations of the phases with respect to
the X-rays incoming beam. This particular technique has been extensively used to
verify the relative orientation of the recrystallized graphite grains inside the MoGR and
MoGRCF composites instead of the EBSD technique: in fact the X-Rays Diffraction
gives less information about the crystal orientation with respect to EBSD, however the
back scattered pattern image coming from graphite was too weak to be treated by the
software and was not giving reasonable results. Therefore the EBSD technique cannot
be applied to graphite based materials, as will be presented in Chapter 10.
6.4 Mechanical Characterization
The material’s mechanical properties of interest for Beam Intercepting Devices are the
Young’s Modulus, the Ultimate Strength (or the Yield Strength for ductile materials)
and the Poisson’s ratio, of course for anisotropic materials these properties have to
be evaluated along all the principal directions of the material in order to obtain the
parameters stated in previous Paragraph 5.3.1.
The common test capable to obtain all the mechanical parameters is the Tensile test,
however all studied composites were brittle with practical absence of plastic deformation
so the trials to make a Tensile test resulted in samples braking on the holders or in too
54

6.4 Mechanical Characterization
small values of stresses and deformations to have a meaningful measurement. Only few
measurements made at high temperature, with the sample heated by induction spires,
were successful. For all those reasons the composites have been tested by Flexural Tests
according to the ASTM Standard C 1161 - 02c (61) using appositely developed fully
articulated fixtures like the one presented in Figure 6.6.
The fixtures, made in Stainless Steel with bearings in hardened steel, respect all
the requirements for a Fully Articulated 4 point Fixture stated in ASTM C 1161 - 02c
standard. The fixtures have been produced in three dimensions to test different samples
dimensions and materials and have been also provided to other institutes involved in
the Collimation Materials characterization inside EuCARD and US-LARP activities.
Figure 6.6: Flexural Fixture developed and produced at CERN EN/MME to test ad-
vanced composites.
The dimensions of the Fixture, identified by the Support Span (L, [mm]) are listed
below together with the dimensions of the samples: the samples have not the standard
dimensions foreseen in ASTM c1161 standard because of the difficulties in machining
metal-diamond composites that fixed the thickness at 4 mm, the other dimensions
being proportional to the proposed ones. Afterwards it was reasonable to keep the
same dimensions on machinable metal carbide graphite composites in order to have the
best possible comparison.
• Large samples 60x5.5x4 mm (Fixture with L=50 mm)
• Medium Samples 40.9x4x4 mm (Fixture with L=35 mm)
55

6. COMPOSITE MATERIALS CHARACTERIZATION TECHNIQUES
• Small samples 25x2x1.5 mm (Fixture with L=20 mm)
6.4.1 Ultimate Strength
The formula used for the evaluation of the maximum stress generated in the sample
during a flexural test given by ASTM C1161 Standard is:
σFl =3 ∗ L ∗ F4 ∗ w ∗ h2
(6.2)
where: σFl([MPa])= Maximum Tensile (and Compressive) Flexural Stress; L([mm])=
Loading Span; F ([N ])= Applied Force; w([mm])= Sample width; h([mm])= Sample
height.
For brittle materials we can assume that the ultimate flexural strength (RFl) cor-
responds to the maximum value of force applied to the sample and we can disregard
the effects of plasticity and necking. The corresponding ultimate tensile strength (R),
measured by the tensile test, is lower and we have found empirically that for brittle
composites we can assume R ≈ 2/3RFl.
To measure RFl it is suggested to use large samples to investigate the largest possible
portion of material in order to avoid the dimensional effects of the internal structure:
both the large grain size of the phases and the presence of cavities and pores lead
to the need of testing a representative portion of material. The ASTM Standard in
fact requires a large number of tests to have a statistically representative result (≥ 10),
however the relatively small dimension of the composite plates leads to a limited number
of Flexural samples per produced plate, typically from 4 to 6 samples per plate: it is
therefore very important to obtain a narrow distribution of results from the limited
number of tests available. Since in brittle materials the ultimate strength is given
by the stresses intensification around the most critical defect, and that the defects
are statistically distributed in the material volume, the best way to have a narrow
distribution of results (with a limited number of tests) is to have in each sample the
same defects distribution. In the case of 4-point Flexural Tests the volume subjected to
the maximum Stress is approximately 1/3 of the total, so the volume explored during
the analysis in a 60x5.5x4 mm sample is 440mm3, large enough to be statistically
representative of the material and to assure a good reproducibility of the results. Recent
tests with the smaller Fixture (L=20 mm, explored volume 30mm3) confirmed that
56

6.5 Thermal Characterization
using small samples of composite leads to a very broad distribution of the results, even
if the average value is close to the big samples measurements.
6.4.2 Elastic properties
The flexural tests itself don’t allow a direct evaluation of the elastic deformation of
the samples, while it will give only the vertical displacement (δz) of the central part of
the sample: the initial slope of the plot σFl = σFl(δz) represents the flexural modulus
of the material and is generally different than the Young’s Modulus measured by a
tensile test; in addition the flexural modulus cannot be directly used in engineering
calculations.
However we can obtain correct measurements of the Young’s Modulus by flexural
tests applying a strain gauge to the lower face of the samples (the face subject to
tension) in order to measure the real deformation (ε) of the most loaded face and
obtain the real Young’s Modulus simply by:
E = δσ/δε (6.3)
while in the first elastic part of plot. The technique has been validated by tests
on reference materials (Mo and Cu-OFE) and gives values with a reasonable (≤ 10%)
error, at least for the preliminary characterization that is required during the R&D
phase.
6.5 Thermal Characterization
6.5.1 Thermal Conductivity
The thermal conductivity (k) is defined as:
k = ρ ∗ cp ∗ α (6.4)
where ρ is density [Kg/m3], cp is the specific heat [J/KgK] and α is the thermal
diffusivity [m2/s].
The thermal conductivity can be therefore evaluated both relying on a direct mea-
surement of k (in the case of steady state thermal flux) or by a measurement of the
57

6. COMPOSITE MATERIALS CHARACTERIZATION TECHNIQUES
diffusivity in a transient thermal test (complemented by specific heat and density mea-
surements).
The first method has been implemented at CERN by the development and pro-
duction of an ad-hoc thermal test bench that relies on the generation of a stationary
heat flux passing in series through reference pieces and the sample itself, the tempera-
ture distribution along the reference pieces and the sample being measured by thermal
probes. The heat flux is then evaluated by measuring the δTref along a known section
(Aref ) of the reference piece (having a known kref ) by:
Q = kref ∗Aref ∗δTrefδxref
(6.5)
and finally the Thermal Conductivity of the sample k is easily determined knowing
the heat flux and the geometry of the sample by inverting the equation 6.5.
This method is based on the ASTM E1225 - 09 Standard (Test Method for Thermal
Conductivity of Solids by Means of the Guarded-Comparative-Longitudinal Heat Flow
Technique) and gives a direct, density and specific heat independent, measurement of
the final thermal conductivity of the material along the heat flux direction. There
are many examples of applications of this method to the evaluation of the thermal
resistance at the interface between two solids ((62), (63)) or applied to the evaluation
of the thermal conductivity of graphite materials ((64), (65).
As stated in cited articles there are many technological issues to be kept under
control in order to obtain an accurate and reproducible measurements, a brief list of
issues accompanied by the implemented solutions is the following:
• Thermal resistance at the interface sample-references: high thermal resistance
reduces the heat transfer along the sample reducing the measured δT and, in the
assumption of equal thermal probe error, the measurement’s accuracy.
– Usage of thermal paste to assure a good thermal conductance (≥ 10W/mK)
across interfaces.
• Heat Losses by convection and radiation: heat lost by convection and radiation
will reduce the validity of equation 6.5 leading to increasing measurement errors.
58

6.5 Thermal Characterization
Figure 6.7: Left: internal view of the developed thermal test bench, showing the INOX
shield (that accommodates also the cables and the screws to fix the sample inside) and the
instrumented sample. Right: closed set-up showing the cooling circuits on top and on the
bottom, the top screw to adjust the pressure on the sample and the external connections
for the thermal probes.
59

6. COMPOSITE MATERIALS CHARACTERIZATION TECHNIQUES
– Convection losses are reduced placing the setup inside a tight tank (shown
in the right picture of Figure 6.7) kept under vacuum with a primary rotary
vane pump.
– Radiation losses are reduced by placing an internal shield of INOX between
the sample (shown in the left picture of Figure 6.7) and reference pieces and
the external vacuum tank, in order to reflect back to the centre the outgoing
radiation.
• Errors in measurement of temperature distribution along the sample and the
reference blocks.
– Usage of redundant measuring points on the reference pieces to statistically
reduce the error.
• Non homogeneous heat flux distribution across the sample and reference section
that lead to incorrect measurement of the heat flux itself.
– Usage of samples having exactly same cylindrical section as the reference
pieces, possible for metals but not for composites.
– Usage of sample holders in Cu-OFE to pass from the cylindrical section of
the reference pieces to the rectangular section of the sample, see Figure 6.8.
– Appropriate design of the joint between the heating and cooling elements and
the reference pieces to have a regular transition across the joint and obtain a
constant Heat Flow across the instrumented section of the reference pieces.
The preliminary analysis on known materials confirmed the validity of the setup,
that measures from few W/mK (AISI 304L Stainless Steel) to hundreds of W/mK (Al
and Copper OFE) with a constant overestimation of around 10% of the real value.
Note that the sample temperature vary from ≈ 10◦C up to ≈ 50◦C so the mea-
surement reflects the properties of the material in that range, and due to the design
of the instrument, it is not possible to measure the Thermal Conductivity at different
temperatures.
The thermal test bench alone cannot measure over the temperature range of interest
due to its intrinsic limitations, however by providing a fast and reliable measurement
60

6.5 Thermal Characterization
Figure 6.8: Molybdenum Graphite instrumented sample to be used in the thermal test
bench. The sample is attached by screws to the two Cu-OFE sample holders, the screw
tips being sharpened to reduce heat flow through the screws.
Figure 6.9: FEM simulation performed to validate the Thermal Test Bench. The effects
of radiation between all surfaces, convection with the ambient and with the cooling water
together with the thermal resistance at the interfaces have all been taken into account.
The analysis has been carried out using Ansys Transient Thermal module.
61

6. COMPOSITE MATERIALS CHARACTERIZATION TECHNIQUES
of the material properties close to RT it allowed a quick comparison of produced com-
posites that was crucial to tune the production cycle and the composition of the new
materials in the phases of the materials R&D.
When a promising material was identified then its temperature dependant thermal
properties have been measured by the laser flash technique, that measures the thermal
diffusivity of the sample at different temperatures by depositing energy on the sam-
ple with a laser and measuring the time evolution of the temperature. The thermal
diffusivity is then estimated by solving the heat’s equation.
Since the technique has not been used directly during the work it will not be exten-
sively cover here, further details can be found in the experimental apparatus producer
website (Netszsch, (66)). The machine used for the Collimator materials tests is a Net-
zsch LFA 427 analyser capable to measure the thermal diffusivity up to 1600oC ((67),
typically with an error lower than 2%. The measurement is qualified by the ASTM E
1461-01 Standard (standard test method for thermal diffusivity by laser flash).
To obtain the thermal conductivity the diffusivity measure has then been integrated
with the CTE measurement made with the dilatometer (see next paragraph 6.5.2), the
density measurement with Archimedes balance (see paragraph 6.1.1, and the specific
heat measurement made with the Differential Scansion Calorimeter (DSC, see para-
graph 6.5.3 to obtain all the temperature dependant parameters involved in equation
6.4.
6.5.2 Coefficient of Thermal Expansion
The CTE (expressed in [K−1]) is defined as the relative variation of the body dimensions
divided by the temperature variation:
α =dL(T )
L0∗ 1
dT(6.6)
The most widely used dilatometer type is based on the push rod system in which
an alumina bar is kept in contact with the sample, whose expansion during controlled
heating is measured with high precision to obtain the relative expansion for the given
temperature variation. Since the values of δL are very small the measurement must
take into account the apparatus deformations and the whole instrument has to be
precisely calibrated to give reliable results. As for the laser flash measurements of
62

6.5 Thermal Characterization
thermal diffusivity the CTE measurements have been carried out in the AIT Energy
Department in Wien, the instrument used being a Netzsch DIL 402C dilatometer (68).
6.5.3 Specific Heat
The Specific Heat (expressed in [J/KgK]) is defined as the energy needed to increase
the temperature of a finite mass of material. It is usually measured by placing the
sample in a heating chamber together with a known reference sample, both being
heated up while measuring the temperature on the samples surfaces. The heat passing
to the sample is assumed to be equal to the heat passing through the reference, that
can be calculated by using equation 6.7.
∆Q = cp ∗m ∗∆T (6.7)
Once known the heat it is straight forward to calculate the cp of the sample by
reverting equation 6.7
The instrument used in AIT is a Netzsch DSC 404C equipped with a furnace capable
to reach 1600 ◦ C (69) with a typical error of 1%.
63

7
Copper - Diamond (CuCD)
Composites
In present Chapter the characterization of CuCD, carried out at CERN inside the
EuCard WP8 activities, will be presented as already mentioned in Chapter 2.
The Chapter is so summarized:
• Introduction to diamond-reinforced MMC;
• Diamond properties;
• Diamond degradation during processing;
• CuCD characterization.
7.1 Introduction to diamond-reinforced MMC
Copper Diamond is part of the Diamond reinforced MMC (see Paragraph 5.1) devel-
oped for special thermal management applications that were extensively studied in
recent years, in spite of the high cost of raw material and production cycle, because of
the unique combination of thermal and physical properties such as low Density, high
Thermal Conductivity and low CTE. As shown in Figure 7.1 they are particularly ap-
pealing for the LHC Collimator application because they maximize both the SSNI and
TSNI indexes while having high Electrical Conductivity and matching Density.
Many works can be found in literature about the production and the characteri-
zation of CuCD different composites, few examples are CuCD materials with tailored
64

7.1 Introduction to diamond-reinforced MMC
Figure 7.1: Figures of Merit SSNI and TSNI for different materials of interest.
CTE for electronics applications (70) are more sophisticated CuCD substrates produced
by shock wave consolidation (71). Future promising applications are microprocessors
cooling elements or heat exchangers in solar cells.
Other similar materials characterized during the thesis work are Silver - Diamond
(AgCD), that can be seen in Figure 7.2, and Aluminium - Diamond (AlCD), both
produced by Prof. L. Weber at EPFL (44) using the liquid infiltration technique.
They aim to combine the properties of diamonds (hardness, low density, high thermal
conductivity, high Young’s Modulus) with the good properties of the respective metal,
usually mechanical strength and electrical conductivity.
AgCD is obtained by infiltration of pressed natural diamonds by molten Ag-Si
eutectic alloy. The SiC particles formed during the process, clearly visible in Figure 7.2
provide a very high bonding between the two phases leading to exceptional mechanical
properties, with measured flexural strength above 500MPa. However, the low melting
temperature of the eutectic limits the range of use of such material for BID application
and the material was not further studied.
In that case the use of liquid infiltration helps in filling the empty spaces between
diamonds assuring a good compaction rate, however the usage of liquid infiltration is
limited to metallic matrices with low melting temperatures because of the diamond
degradation that starts already at temperatures below 1000oC (72), (73); the details of
the phenomena are explained in Paragraph 7.1.2. For all those reasons CuCD is usually
produced with Solid State Sintering (SSS) at the lowest Temperature as possible.
65
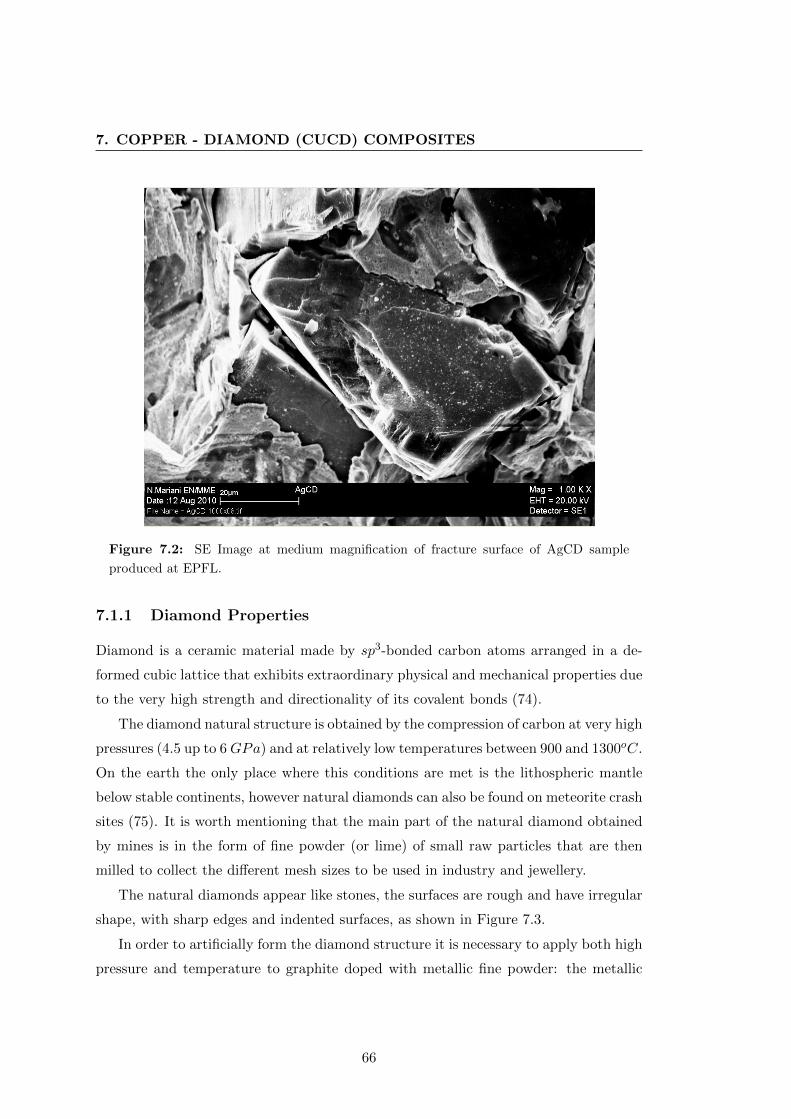
7. COPPER - DIAMOND (CUCD) COMPOSITES
Figure 7.2: SE Image at medium magnification of fracture surface of AgCD sample
produced at EPFL.
7.1.1 Diamond Properties
Diamond is a ceramic material made by sp3-bonded carbon atoms arranged in a de-
formed cubic lattice that exhibits extraordinary physical and mechanical properties due
to the very high strength and directionality of its covalent bonds (74).
The diamond natural structure is obtained by the compression of carbon at very high
pressures (4.5 up to 6GPa) and at relatively low temperatures between 900 and 1300oC.
On the earth the only place where this conditions are met is the lithospheric mantle
below stable continents, however natural diamonds can also be found on meteorite crash
sites (75). It is worth mentioning that the main part of the natural diamond obtained
by mines is in the form of fine powder (or lime) of small raw particles that are then
milled to collect the different mesh sizes to be used in industry and jewellery.
The natural diamonds appear like stones, the surfaces are rough and have irregular
shape, with sharp edges and indented surfaces, as shown in Figure 7.3.
In order to artificially form the diamond structure it is necessary to apply both high
pressure and temperature to graphite doped with metallic fine powder: the metallic
66

7.1 Introduction to diamond-reinforced MMC
Figure 7.3: SE Image at medium magnification of natural diamond powder used in
BrevettiBizz for the production of MoCuCD composites. The cleavage fracture formed
during the milling are clearly visible.
67
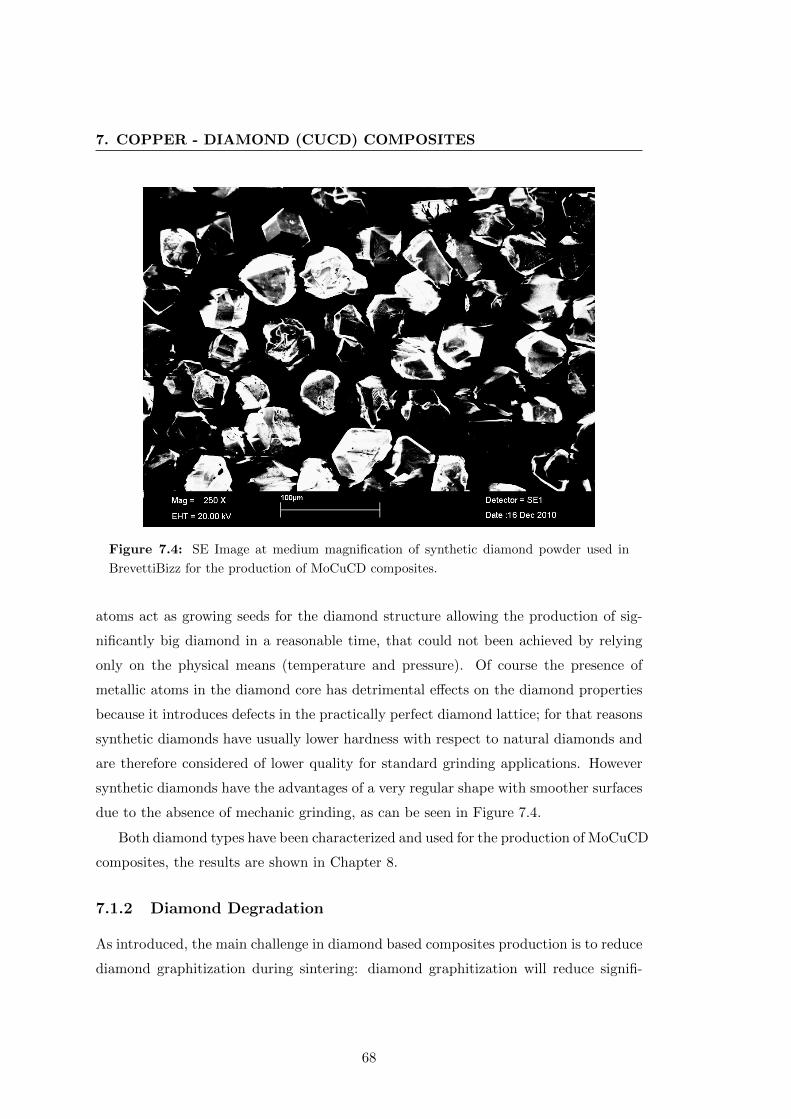
7. COPPER - DIAMOND (CUCD) COMPOSITES
Figure 7.4: SE Image at medium magnification of synthetic diamond powder used in
BrevettiBizz for the production of MoCuCD composites.
atoms act as growing seeds for the diamond structure allowing the production of sig-
nificantly big diamond in a reasonable time, that could not been achieved by relying
only on the physical means (temperature and pressure). Of course the presence of
metallic atoms in the diamond core has detrimental effects on the diamond properties
because it introduces defects in the practically perfect diamond lattice; for that reasons
synthetic diamonds have usually lower hardness with respect to natural diamonds and
are therefore considered of lower quality for standard grinding applications. However
synthetic diamonds have the advantages of a very regular shape with smoother surfaces
due to the absence of mechanic grinding, as can be seen in Figure 7.4.
Both diamond types have been characterized and used for the production of MoCuCD
composites, the results are shown in Chapter 8.
7.1.2 Diamond Degradation
As introduced, the main challenge in diamond based composites production is to reduce
diamond graphitization during sintering: diamond graphitization will reduce signifi-
68

7.1 Introduction to diamond-reinforced MMC
cantly both mechanical and thermal properties of the composite, because the graphite
formed at the interface between the diamonds and the metallic matrix is brittle and
has a very low thermal conductivity, therefore it will act as a barrier for thermal diffu-
sion across the interfaces. A very important point to have in mind is that sp3 carbon
(diamond) is meta-stable in standard conditions (RT, 1 Atm) and tends to return to
sp2 carbon (graphite) if energy is given to the system according to the carbon phase
diagram reported in Figure 7.5 (76) (77); however, the kinetic of the process at RT
is so low that we will not observe diamond graphitization even for very long times.
Pressure can be given to the system to counteract this phenomena but unfortunately
the pressure needed to avoid graphitization is too high to be practically achieved (78).
Figure 7.5: Phase diagram of carbon.
From a physical point of view diamond graphitization can be divided into two
different physical phenomena, both activated by temperature: superficial graphitization
and bulk graphitization (74)
7.1.2.1 Superficial Graphitization
If a diamond is heated under normal atmosphere (≈ 21% Oxygen), its surface will
start to react with Oxygen even at low temperatures (500−6000C) forming sp2 carbon
atoms with C = O bonding on the diamond surface. The process is exothermic and will
lead to total diamond graphitization starting from the surface. If there is some water
in the atmosphere, there will be also the formation of COOH and COH groups (79).
The main way to reduce superficial graphitization is to reduce the oxygen content on
69

7. COPPER - DIAMOND (CUCD) COMPOSITES
diamond surface: the use of high vacuum and hydrogen rich atmosphere during sintering
process helps to contain graphitization taking away some of the oxygen present both on
diamonds and on metallic powders (as in Mo and Cu powder always remain some oxygen
due to unavoidable exposure to atmosphere), but oxygen cannot be completely removed.
Increasing the temperature will increase the kinetic of superficial graphitization process
with the results reported in Figure 7.6.
Figure 7.6: Aspect of graphitized diamond surface
7.1.2.2 Bulk Graphitization
In addition to superficial graphitization, when the temperature reaches 1700− 1800oC,
sp3 carbon will start to degrade to sp2 carbon even inside diamond bulk: this mecha-
nism is not yet completely understood, but it seems to be related to impurities inside
diamond lattice which act as catalysts for diamond transformation. This suggestion is
confirmed by the fact that synthetic diamonds are more susceptible to bulk graphitiza-
tion than natural diamonds: synthetic diamonds are produced using metallic seeds as
starting points for diamond lattice growth, therefore they have a preferential starting
point for diamond bulk graphitization that is absent in natural diamonds. We must re-
70

7.2 CuCD for BID
mark that, in addition to growing seed, every kind of diamond (even the most pure and
expensive one) has some impurities inside the lattice, so its not possible to completely
avoid bulk graphitization by using high purity natural diamonds.
7.2 CuCD for BID
Concerning the use of CuCD as BID material, the interest in joining Cu and diamond
is mainly to optimize their behaviour as thermal management materials as discussed in
Chapter 2. Always in mentioned chapter is reported the description of the tools used
to benchmark BID materials (the Figures of Merit).
The values obtained for CuCD are presented in Table 4.2 and Figure 7.1 with respect
to Glidcop (introduced in section 4.1.4): the density reduction allows for a smoother
energy deposition profile that results in high beam impact strength, as confirmed by the
HiRadMat HRMT-14 experiment (see Chapter 11), while the smaller CTE increases the
thermal stability during steady state operations as required by the LHC Collimators
dimensional tolerances (see Paragraph 3.3); even more important the high electrical
conductivity assures a very low RF Impedance at high frequencies as requested by the
LHC operations. The drawbacks are the lower mechanical strength, the completely
brittle behaviour and the higher Young’s Modulus, that are reducing the TSNI (lower
robustness). Another concern regards the effective radiation hardness of such material
that is actually practically completely unexplored by the scientific community and
requires special studies, as described in Paragraph 7.2.2.2.
The comparison between the properties predicted by the analytical means presented
in Chapter 5 is presented in table 7.1, using the ROM model 5.1 for the density and the
specific heat, the Hasselmann and Jonson model for the thermal conductivity (using
5.9 with hc = 2.97x10⁷ W/m2K and a = 200µm), the Turner model for CTE and the
empirical formula 5.2 for the electrical conductivity. The reference values for Cu and
diamond are listed as well.
RHP Technology produced many sample plates with dimensions up to 200x80x4 mm
to be used for characterization in EuCard partner institutes such as NRC - Kurchatov
Institute, GSI and of course CERN. Another characterization program is ongoing in
collaboration with Brookhaven National Laboratories inside the U.S. LHC Accelerator
Research Program (LARP) collaboration activities. The characterization campaign has
71

7. COPPER - DIAMOND (CUCD) COMPOSITES
Table 7.1: Comparison between predicted and measured properties for CuCD at RT.
Density and Specific Heat evaluated by ROM model 5.1, CTE by Kerner model 5.11, k by
Hasselmann and Johnson model 5.9 and E is conservatively assuming the Reuss assumption
5.4.
Property Unit Estimation Measured Variation %
ρ [g/cm3] 5.61 5.33 95.0%
CTE [10−6K−1] 6.25 7.8 124.8%
k [W/m/K] 615 490 79.7%
σ [MS/m] 13.7 12.6 92.0%
E [GPa] 230 240 104.3%
RFl [Mpa] [−] 120 [−]
been performed to obtain a comprehensive picture of the effective material behaviour
inside the LHC in view of the choice for new Hi-Lumi LHC collimators; the work
includes a mechanical, physical, thermal and electrical characterization followed by an
extensive study on the effects of radiations on such properties (80).
Figure 7.7: CuCD plate produced in RHP Technology in 2010 after water jet cutting.
Finally it is worth mentioning that diamond based materials cannot be machined
with standard means so the final shape must be obtained directly from the mould and
that to obtain a specific roughness it is necessary to leave a Cu layer on the materials
plates that can be machined afterwards. However it must be said that this technique
did not well adapt to cylindrical samples used in the HiRadMat HRMT-14 experiment,
72

7.2 CuCD for BID
leaving samples with large diamond contamination on the lateral surfaces that had to be
machined by special diamond tools afterwards to match the dimensional specifications:
the machining had to be done dry to avoid contamination and slowly to avoid samples
overheating, so the Copper layer technique will be only used on parallelepiped shaped
samples in the future.
7.2.1 CuCD Production
The material tested at CERN has been produced in RHP Technology headquarters in
Seibersdorf (Austria) in 2010 (81): the plate final dimensions were 150x150x4 mm, the
details about the production cycle are listed below.
• Composition of starting powder: 60%V diamond powder (of them the 90% is
a 70/80 mesh (corresponding to ≈ 100µm), the remaining 10% is finer 325-400
mesh) 1%V of Boron powder and 39%V of Cu Powder.
• RHP main parameters: heating and cooling rate about 50K/min, maximum
temperature 1020oC for 30 minutes, constant applied pressure 30MPa, vacuum
atmosphere 10−4 mbar with reducing atmosphere.
• Heat treatment: to relieve the stresses inside the copper matrix the plates have
been heated to 250oC for 30 minutes after Hot Pressing.
7.2.2 CuCD Characterization
7.2.2.1 Microstructural Analysis
The composition chosen by RHP technology reflects many empirical principles that can
be found in the experience of the experts of composites: the content of diamond is kept
at 60%V because higher content would not allow the compaction of the material due
to the interference between hard diamonds; the diamond content itself is divided in a
large and small particles with ratio 9/1 to let the small diamonds fill the interstitials
between the large ones (see Figure 7.9, and the thermal cycle is kept as low as possible
to avoid superficial diamond degradation (as shown in Figure 7.10, see following section
7.1.2 allowing anyway to reach the 95% of compaction with respect to nominal density.
One of the main obstacles in obtaining tough CuCD composites is the low affinity
between the two components that does not lead to good intimate bonding across the
73

7. COPPER - DIAMOND (CUCD) COMPOSITES
Figure 7.8: SE Image: Fracture surface of CuCD sample embedded inside the sample
holder observed at SEM.
interfaces. The absence of a strong bonding is confirmed also by the aspect of the
fracture surface shown in Figure 7.10: the fracture passed preferentially across the
brittle interfaces and there are no visible signs of plastic deformation of the Copper
matrix.
This non ideal condition is limiting not only the strength (as discussed in section
5.3.2) but also the thermal conductivity that might drastically reduce when the two
phases start to detach, for example after several thermal expansions and contractions,
thus limiting the usage as heat exchanger.
RHP overcome at least partially the issue by adding a strong carbide former (Boron)
that is also soluble inside the Copper matrix: it can be observed in the SEM Figures
7.11 and 7.12 that many Boron particles close to the diamonds surfaces form a stable
carbide layer on the diamond surface and dissolve on the other side inside the Cu
matrix, giving an intrinsic mechanical bonding to the material, ≈ 120MPa of flexural
strength and 70MPa of tensile strength.
74

7.2 CuCD for BID
Figure 7.9: QBSD Image: Low magnification SEM Observation at CERN of the fracture
surface of CuCD. The distribution of diamonds (dark grey) in the bulk material and the
two dimensions of the diamonds are clearly visible.
75

7. COPPER - DIAMOND (CUCD) COMPOSITES
Figure 7.10: SE Image: Medium magnification SEM Observation at CERN of the fracture
surface of CuCD. The Cu matrix detached on one diamond while remained attached to the
adjacent one, confirming the low adhesion between the phases. The surface of the diamond
on the left appears smooth and with signs of visible graphitization as expected by the low
temperature cycle.
76

7.2 CuCD for BID
Figure 7.11: SE Image: High magnification SEM Observation at CERN of the fracture
surface of CuCD. The small particles attached to the diamonds are Boron carbides formed
during the process, as the larger particle attached at the bottom of the diamond.
77

7. COPPER - DIAMOND (CUCD) COMPOSITES
Figure 7.12: SE Image: High magnification SEM Observation at CERN of the fracture
surface of CuCD. High magnification of the Boron carbide particle.
7.2.2.2 CuCD Radiation Hardness
Two main studies are ongoing to assess the degradation of CuCD after prolonged ex-
posure to highly energetic protons fluencies: the first program started in 2010 at NRC-
Kurchatov Institute (Moscow, Ru) (2) using 30 MeV protons while the second program
started in 2013 at BNL (New York, US) (82): both focus on the measurement of key
mechanical and thermal properties before and after different radiation doses to assess
the properties reduction as a function of the dose received.
The experimental work at NRC Kurchatov Institute on CuCD is now concluded and
the results will be published soon, here we will just introduce few results of interest; on
the other hand the studies at BNL suffered from technical problems with the failure of
a vacuum capsule inside the irradiation facility that provoked the delay of the activities
until 2014 (83) and will therefore not been mentioned here.
The studies at NRC Kurchatov Institute were composed by a first theoretical part
to assess the different doses received by the two components of the composite, followed
by the characterization of pristine materials samples, the irradiation of another set of
78

7.2 CuCD for BID
Figure 7.13: Thermal Diffusivity reduction after exposure to 1017 protons at 30 MeV.
Source (2).
samples and its characterization.
The theoretical investigation of the dpa level shows different irradiation profiles
for the Cu and the diamond phases, with higher dpa in Cu, see Figure 7.14; however
the defects can recombine more easily in Cu at the irradiation temperature of 100oC
while are blocked inside the covalent diamond structure, leading to a more pronounced
degradation of the diamond properties in the long period. A brief summary of the
obtained results presented by Prof. Ryazanov of NRC-Kurchatov Institute is reported
in Table 7.2 below.
Table 7.2: CuCD properties variation after irradiation of 1017 protons at 30 MeV in
NRC-KI.
Property Unit Reference After Irradiation Variation %
CTE [10−6K−1] 7.80 8.30 6.4%
k [W/mK] 490 330 -43.1%
σ [MS/m] 12.6 9.80 -22.2%
E [GPa] 240 330 37.5%
The most significant result obtained by the characterization at NRC Kurchatov
Institute is the large reduction in thermal conductivity after even low doses of 30 MeV
protons, as shown in Figure 7.13 courtesy of A. Ryazanov. The other modifications
observed in the material are an increase in the Young’s Modulus (as expected by the
79

7. COPPER - DIAMOND (CUCD) COMPOSITES
increase of defects in the Cu matrix), together with a pronounced embrittlement. The
electrical conductivity and the CTE however did not change with respect to pristine
situation: the first because the defects in the Cu phase were not enough to reduce sig-
nificantly its excellent electrical conductivity (there is anyway a very slight reduction),
the second because the effects of the volume increase (swelling) of the Cu phase were in
a certain way compensated by the increase in Young’s Modulus that helped in keeping
low CTE values even after 1017 protons. A summary of the variations is reported in
Table 7.2.
Figure 7.14: Dpa distribution along the two phases in the case of alternate layers of Cu
and diamond (respectively 65 and 130 µm thick). The higher density of Cu leads to a
much higher dpa level with respect to the diamond phase.
The studies to correlate the dpa level at different energies are still ongoing and
should provide an indication of the life expectancy of CuCD while irradiated by the
H-Lumi LHC beam.
80

7.3 Conclusions on CuCD
7.3 Conclusions on CuCD
CuCD is without any doubt a very interesting material for the next generation of LHC
Collimators and more in general for any BID where very high thermal dissipation is
needed. Its low density (which is crucial for BID to smooth the energy absorption) gives
them high appealing also for new heat exchangers in high-end electronics, a field where
mobility is becoming more and more researched. The extensive characterization work
performed in the present thesis confirms the validity of the choice and the effectiveness
of the R&D work carried out in RHP technology. The few disadvantages found in
CuCD are the difficulties in the production, the high brittleness and the detrimental
effect of radiations on the thermal transport. On the other hand its tailored density
allows for an optimal (and smooth) beam cleaning. Table 7.3 compares the values
obtained for both CuCD and Glidcop giving a more general view of the improvements
with respect to the BID application: the relatively low value of TSNI is due to the
limited mechanical properties of CuCD at RT, however the material showed a good
robustness in the beam impact tests (see Chapter 11 thanks to its very low density
which smoothed the energy deposition over a large volume of material.
81

7. COPPER - DIAMOND (CUCD) COMPOSITES
Table 7.3: CuCD material properties compared to Glidcop AL-15. The properties have
been measured on the material produced by RHP Technology at CERN and Kurchatov
Institute (2).
Material Unit Glidcop CuCD
Density [g/cm3] 8.93 5.4
Atomic Number (Z) [−] 29 11.4
Melting Temperature [oC] 1083 1083
Thermal Conductivity [W/mK] 365 490
CTE [10−6K−1] 16.6 7.8
Cp [J/kGK] 391 420
E [GPa] 130 220
Tensile Strength [MPa] 413 70
Poisson’s Ratio [−] 0.33 0.22
σ [MS/m] 53.8 12.6
Radiation Length χ0 [cm] 1.47 4.78
SSNI [kWm2/kg] 2.5 11.6
TSNI [kJ/kg] 50.1 13.4
82

8
Molybdenum - Copper -
Diamond (MoCuCD) Composites
Present Chapter reports the R&D work and the results obtained in the first development
of advanced Molybdenum-based composites, MoCuCD.
As anticipated in Chapter 2 CuCD did not completely satisfy the key requirements
for LHC Collimators materials (identified in Paragraph 4.2) therefore the research on
novel materials moved on establishing a new R&D program on Metal-Diamond compos-
ites, taking advantage of the large experience previously acquired with CuCD adding
Molybdenum as third element.
8.1 MoCuCD for BID
Aim of the R&D was to obtain a material having lower CTE and higher strength (to
increase both the SSNI and the TSNI indexes) with respect to Glidcop and CuCD:
with this objective in mind the choice for the third component fall naturally on Mo
(Paragraph 4.1.5), a material that has been already used for LHC Collimators due
to its excellent mechanical and electrical properties combined to adequate thermal
conductivity and high thermal stability at high temperature, as shown in Table 4.2.
More important, Mo is a strong carbide former that easily reacts with carbon above
400oC (84): as for Boron in CuCD the carbides formed on the diamond surface are
responsible for the final mechanical strength of the composite. Finally, the Mo addition
should also help to compensate the high Cu CTE especially at high temperature.
83

8. MOLYBDENUM - COPPER - DIAMOND (MOCUCD)COMPOSITES
After evaluating possible partners for the new R&D program CERN established
a collaboration with BrevettiBizz, a small dynamic Italian company having valuable
experience in metal diamond composites (59). Following a preliminary introduction
meeting BrevettiBizz provided a first example of MoCuCD material (85) produced by
Rapid Hot Pressing technique (RHP) like for CuCD: the first attempt proposed by
BrevettiBizz in August 2010 can be seen in Figure 8.1, showing high porosity and dia-
monds graphitization. Furthermore, the diamonds are not homogeneously distributed
inside the matrix, resulting in poor compaction and low properties. This considerations
however leave space for large improvements in such kind of composites, as shown in
following Paragraphs.
Figure 8.1: SE Image at low magnification of the first MoCuCD. The matrix appears
porous and the natural diamonds are graphitized. The plate’s composition is: 60%V 45 µm
Mo, 30%V 174 µm synthetic diamonds, 10%V 45 µm Cu and has been sintered under
primary vacuum for 180 min at 1020oC.
The works prosecuted for more than one year exploring many possible additions and
thermal cycles to maximize the material’s properties while avoiding diamond degrada-
tion at high temperature, as explained in Paragraph 7.1.2, until the optimal production
cycle and composition have been identified and deeply characterized. The summary
84

8.2 MoCuCD Production
of the most important innovations is presented in the following Section, followed by
the development and characterization of Cu coated diamonds and finally by the results
obtained with the most important milestones in the materials R&D:
• MoCuCD Production R&D Key points
• MoCuCD with Cu coated diamonds
• MoCuCD final material with tailored composition and improved production cycle
8.2 MoCuCD Production
The observation of the first material proposed by BrevettiBizz reported in Figure 8.1
allowed to establish few key points for the MoCuCD composite production.
The diamond degradation is clearly visible in Figure 8.1 by the grey colour and
the roughness of the diamonds surfaces. Graphite is forming on diamonds surfaces
even at the relatively low Temperature of production of the plate MoCuCDA and is
hampering the formation of the proper Mo2C interface between diamonds and Mo
particles. Starting from the assumptions stated in Paragraph 7.1.2 several adjustments
have been made to the production cycle, to the raw material and to the material
composition as reported in the following.
8.2.1 Production Cycle Improvements
The first parameter to operate with when trying to reduce reinforcement degradation
is the sintering time.
The sintering of pure Mo requires very high temperatures (>2/3 Tm, ≈ 1750oC)
and sintering times: from the example in Figure 8.2 (86), using 4µm Mo powder, to
obtain a compaction rate around 90% is sufficient 1 hour at 1750oC, while at 1400oC
more than 10 hours would be necessary(87), (86).
It is also clear that it will not possible to sinter properly Mo particles without
damaging the diamonds surfaces, so the compaction process has to rely on the solid
state diffusion of the Cu phase inside the interstitials between the diamond and Mo
particles, as happens in CuCD, or by melting of the Cu phase and internal liquid
infiltration as finally done with MoCuCD.
85

8. MOLYBDENUM - COPPER - DIAMOND (MOCUCD)COMPOSITES
Figure 8.2: Effect of temperature and time on the relative density of sintered 4µm W
and Mo powders.
Many other important factors contribute to the compaction time, such as powder
dimension (smaller powder leaves smaller voids and sub sequential higher density, and
also a smaller grain in final Mo structure), powder superficial reactivity (fresh, non
oxidized surfaces diffuse atoms faster), powder shape (spheres pack differently from
lamellas and from fibers), and powder chemical purity (carbon and oxygen will have a
detrimental effect on Mo sintering), (88).
Obviously, also the the heating and cooling ramps will give their contribution to
the final diamond degradation, therefore it is mandatory to limit to the ramps to the
minimum duration technologically achievable.
Another point to keep in mind is that reducing the sintering time the importance
of the heating and cooling ramps increases and so will their contribution to the final
degree of diamond graphitization. BrevettiBizz continuously improved the power capa-
bilities of the RHP machine during the entire R&D program so the improvements have
been added stepped in time, the heating rate passed from few K/min up to ≈ 1K/s,
drastically reducing the ramp duration and the final diamond degradation.
8.2.2 Oxygen content reduction
Even with the usage of the purest available Cu powder (Electrolytic Cu powder, (36),
there will always be a residual oxygen content on the powder surface due to the powder
production and to the unavoidable exposure to atmosphere. Removing the natural
86

8.2 MoCuCD Production
Figure 8.3: Ad hoc powder cleaning system developed at BrevettiBizz.
oxygen layer on powders helps the diffusion across grains of Cu and Mo and the adhesion
of Mo to diamonds, resulting in a more compact material.
The powder cleaning can be performed or during the raw powder preparation or
during the RHP process when the powders are inserted in the mould, as already made
in RHP Technology for CuCD, see Paragraph 7.2.1; both methods use as reducing
element a gas made of hydrogen and nitrogen (3 − 5%H2, higher values would lead
to explosion risks at the process temperature) that has to flow through the powder
reacting with oxygen and allowing the evacuation of the formed water molecules.
In order to maximize the effectiveness of the process an ad hoc powder cleaning
system (Figure fig:powdercleaning) have been developed where the powders are kept
in suspension by the flowing H2 − N2 gas at 600oC inside a quartz pipe. The higher
particle surface exposure together with the constant and tailored Temperature allow
a more proper and homogeneous powder cleaning than with the cleaning inside the
mould. The combination of both methods gave optimal results concerning the reduction
of diamond degradation.
8.2.3 Choice of Diamond Type
As stated in Paragraph 7.1.2 there are many different types of diamond powder, mainly
divided in natural diamonds and synthetic diamonds. The first have higher chemical
purity that should avoid the internal bulk graphitization and therefore are often con-
sidered as more resistant to diamond degradation. However this phenomena appears at
87

8. MOLYBDENUM - COPPER - DIAMOND (MOCUCD)COMPOSITES
very high temperature (> 700oC) and it will not observed in MoCuCD plates sintered
below 1200oC so higher purity of natural diamonds is not helping in reducing graphi-
tization. On the other hand the superficial graphitization depends on the content of
defects and of the reactivity of the diamond surface, and in that case synthetic dia-
monds are significantly better due to the very smooth and regular surfaces compared
to the indented cleavage fracture surfaces of natural diamonds (see Figures 7.4 and
7.3 for the surface comparison) that offer a large number of nucleation points for the
graphitization process. For that reason, and after few experimental tests with natural
diamonds, synthetic diamonds have been chosen for the final MoCuCD material.
8.2.4 Particles Coatings
To reduce the diamond degradation the protective coatings (made to avoid the presence
of oxygen at the surface that catalyses the graphitization process) have been studied
and applied to MoCuCD during the present thesis work.
Generally, powders are coated for two main reasons: to promote a favourable re-
action between non affine elements (active coatings) or to protect the reinforcement
from contamination or other degradations that can occur during the cycle (protective
coatings). In both cases the coating should be as thin as possible (down to few atomic
layers), have homogeneous thickness, be chemically pure and dense. In addition for pro-
tective coatings it is important to cover homogeneously all the particle surface avoiding
the Oxygen penetration during the production cycle.
Apart from this two kind of coatings, that can be considered as chemically acting
coatings, there is a third way coatings might help the sintering process of the material:
thick coatings. As we have already pointed out in many occasions the reinforcement
must be homogeneously dispersed in the matrix to obtain the maximum of properties
because adjacent particles leave voids and large matrix volumes without reinforcement
(that will not sinter as supposed to), leading to low thermal and mechanical properties.
Of course since the powder mixing cannot be perfect there will always be such kind of
non homogeneities in sintered composites leaving adjacent diamonds, so here it comes
the idea of transferring the Cu content of the material from the raw Cu powder directly
to the diamonds surfaces before the mixing: during the cold mixing the thick coatings
assure always a Cu layer of few µms between adjacent diamonds resulting in much more
compacted materials with respect to analogous non coated composites.
88

8.2 MoCuCD Production
In the case of diamonds this coatings have to be obtained relying on electro-Less
methods (89) due to the dielectric nature of the particles; furthermore the low chemical
affinity between diamonds and Cu forces to insert an intermediate element that assures
the chemical bonding, such as titanium. The result is that such coatings tends to detach
from the powder and to give rise to chemical contamination of the final material, as
will be shown in details in Paragraph 8.2.5.
8.2.5 Copper Coated Diamonds
The Cu coated diamonds (in the following CucCD, see Picture 8.4) used to produce
MoCuCD in BrevettiBizz have been extensively studied with SEM and EDS during
the thesis to investigate the nature of the coating and to explain the non linear results
obtained with the composites produced.
The coating process that has been declared by the supplier is the following: first a
very thin deposition of palladium (≈ 1nm), followed by Cu deposition for 23µm, de-
pending on the position on the diamond surface. The Pd function is to create a chemical
affinity between the diamond surface and Cu as anticipated in previous Paragraph.
However during the SEM analysis made on the composite fracture surface at CERN
it was not possible to identify the Pd signal by EDS, while we found high concentrations
of Ti, P and Ni located near the diamond surface. Ni is usually added in order to
increase the deposition rate of Cu, while Ti provides good mechanical bonding between
Cu and diamond surfaces (Ti is one of the strongest carbide former). P is present due
to its presence in the Ni bath.
All those elements (apart from Pd) have detrimental effects on Cu thermal and
electrical conductivity and are usually strictly controlled in Cu metallurgy (36).
8.2.5.1 Sample Preparation and SEM Imaging
In order to check the presence and the position of Ti, Ni and P, a metallographic section
of the coating has been analysed at SEM and EDS: the CucCD have been embedded
in a conductive metallographic sample (polymer resin with Copper particle addiction,
especially used for SEM analysis), that has been polished in order to take away only
the coating on one diamond edge, leaving a polished, skewed section of the coating on
the side of the diamond, see the scheme in Figure 8.4.
89

8. MOLYBDENUM - COPPER - DIAMOND (MOCUCD)COMPOSITES
Figure 8.4: Scheme of observed section.
Figure 8.5: QBSD Image at intermediate magnification of the observed diamond particle
embedded into the polymeric resin sample.The regular shape of the diamond can be clearly
seen, together with the regularity of the observed section.
90

8.2 MoCuCD Production
The experimental apparatus used in the present investigation is the SEM Leo 430i
coupled with EDS ISIS Software for spectrum analysis; the used filament voltage was
15 kV, a good compromise between analysed area (≈ 2µm) and received signal: the
skewed section was necessary to obtain a good spatial resolution between the spectrums,
which have been taken along the x direction with intervals of 0.5 µm.
Figure 8.6: QBSD Image at high magnification of the analysed surface: the arrow indi-
cates the location of the EDS spectrums, starting from the diamond edge up to the end of
the coating section (6µm).
8.2.5.2 EDS Analysis
To show the evolution of the impurity content the most representative spectrums (taken
at 0, 1.5, 3 and 4.5 µm along the x direction in Figure 8.6) are reported below: note
that the spectrum at 4.5 µm (Figure 8.10) is equivalent to the following ones and to
the ones taken on the coating surface.
The spectrum taken in position x = 0 in Figure 8.7 shows a strong C signal (trans-
mitted through the thin Ti and Cu-Ni layer that remained attached to the diamond
surface) together with strong O and Ti peaks. The Cu, Ni and P peaks are also present,
91

8. MOLYBDENUM - COPPER - DIAMOND (MOCUCD)COMPOSITES
while the Pd peak has not been detected, probably due to the very limited Pd content
not detectable by EDS method.
Prosecuting along the thickness at 1.5 µm (Figure 8.8 the C, Ti and O peak decrease
(as expected) while the P and Ni signals increase significantly; prosecuting along the
thickness at 3 µm (Figure 8.9 the Ti and O signal totally disappear and also the P
signal is strongly decreased.
Finally the spectrum at 4.5 µm (Figure 8.10) reports the composition on the coating
surfaces.
Figure 8.7: EDS Spectrum in position x = 0 µm: Presence of C, O, Ti, P, Cu and Ni.
8.3 MoCuCD Characterization
As anticipated the following Paragraphs contain the characterization results of the two
most important diamond based composites developed during the thesis work: Molyb-
denum - Copper Diamond with and without Copper coated Diamonds (respectively
MoCucCD and MoCuCD).
Figure 8.8: EDS Spectrum in position x = 1.5 µm: Cu, Ni and P peaks are becoming
higher, C peak is reducing while Ti and O peak remain constant.
92

8.3 MoCuCD Characterization
Figure 8.9: EDS Spectrum in position x = 3 µm: O, C and Ti peaks are not visible, also
the P and Ni peaks are reduced.
Figure 8.10: EDS Spectrum in position x = 4.5 µm: presence of Cu and Ni only. P peak
is indicated only to show that its signal is negligible on the coating surfaces and therefore
cannot be detected on powder during the standard analysis.
93

8. MOLYBDENUM - COPPER - DIAMOND (MOCUCD)COMPOSITES
8.3.1 MoCuCD with Copper Coated Diamonds (MoCucCD)
8.3.1.1 Composition
MoCucCD has been produced with the following parameters:
• Composition of starting powder: 42.72%V Cu coated 45 µm diamond powder,
50%V of 5 µm Mo powder and 8.28%V of 45 µm Cu Powder. The raw powder
composition has been calculated taking into account the Cu content on the dia-
mond surfaces to obtain a final composition of ≈ 33%V diamond, 17%V Cu and
50%V Mo.
• RHP main parameters: graphite moulds and electrodes, sintering temperature
1200oC for 30 minutes, constant applied pressure 30MPa, vacuum at 10−4mbar
with reducing atmosphere 97%N2 − 3%H2.
• Produced plates dimensions: diameter 90 mm thickness 4 mm.
• Samples production: water jet cutting followed by manual grinding on diamond
tools. Microstructures are all made from fresh fracture surfaces.
The plate production cycle includes all the innovations listed in previous Para-
graphs: powder cleaning before mixing, reducing atmosphere and the liquid phase
infiltration from molten Cu phase. From the point of view of the composition it is im-
portant to remark the passage to smaller 5 µm Mo particles instead of previous 45 µm
powder: the small Mo particles tend to infiltrate the small interstitials increasing the
compaction.
8.3.1.2 Microstructural Analysis
A fresh fracture surface of the MoCucCD plate has been observed by SEM and EDS:
the pictures are shown below.
8.3.1.3 MoCucCD results
The results of performed analysis in Table 8.1 are reported in a similar way to CuCD
comparing the predicted properties to the measured one using the analytical means
and the experimental techniques described in Chapter 5.
94

8.3 MoCuCD Characterization
Figure 8.11: SE Image at low magnification of MoCucCD. The metallic phase is formed
by small Mo particles embedded in Cu, while the diamonds showed some graphitization.
The fracture passed preferentially along the diamond-matrix interfaces (absence of broken
diamonds).
Table 8.1: Predicted and measured properties for MoCucCD at RT. Density and specific
heat evaluated by ROM model 5.1, CTE by Kerner model 5.11, k by Hasselmann and
Johnson model 5.9 and E is conservatively assuming the Reuss assumption 5.4.
Property Unit Estimation Measured Var. %
ρ [g/cm3] 7.79 7.15 91.8%
α [10−6K−1] 5.00 7.00 140.0%
k [W/m/K] 397.46 100.00 25.1%
σ [MS/m] 12.67 7.10 56.0%
E [GPa] 487.00 260.00 53.4%
RFl [Mpa] [−] 408 [−]
95

8. MOLYBDENUM - COPPER - DIAMOND (MOCUCD)COMPOSITES
Figure 8.12: SE Image at intermediate magnification of MoCucCD. Aspect of a partially
graphitized diamond (on the left) and of the surrounding Mo-Cu matrix. The diamonds
have plenty of small titanium carbide particles attached due to the reaction between tita-
nium oxide and diamond surfaces.
96

8.3 MoCuCD Characterization
Figure 8.13: SE Image at intermediate magnification of MoCucCD: aspect of Mo-Cu
matrix. In the spaces between the diamonds the Mo particles are not well compacted
and the structure appears porous. Near the diamond surfaces there is a continuous Mo
layer formed by small particles all oriented perpendicularly with respect to the diamond
surfaces: the formation of this layer could be related to the presence of the Cu coating
which encapsulate the Mo particles during heating (when Cu starts to become very soft).
The matrix is still porous because there is not enough Cu to infiltrate completely the voids
between Mo particles.
97

8. MOLYBDENUM - COPPER - DIAMOND (MOCUCD)COMPOSITES
Figure 8.14: SE Image at high magnification of MoCucCD: particular of the diamond
surface. The diamond graphitization leaded to the formation of holes on the diamond
surface where graphite detached. In some area of the diamond there are also the small
titanium carbides, while in the matrix near the diamonds we have the presence of Ni (which
was present in the Cu coating).
98

8.3 MoCuCD Characterization
8.3.1.4 Conclusions on MoCucCD
The Cu coating made on the synthetic diamonds has been deeply analysed together with
the results obtained with a MoCuCD composite produced. In particular the presence
of Nickel and Phosphorous, added to increase the deposition rate, had detrimental
effect on Cu thermal and electrical properties as shown by the very low obtained values
compared to the expected one (respectively 25.16% and 56.04% of theoretical values).
On the other hand the effect of the first titanium oxide layer is to provide a better
mechanical adhesion between the metallic matrix and the diamonds, by the formation
of titanium carbides at the diamond surface: the result is an extraordinary flexural
strength for such kind of composites.
The drawback is the presence of O close to diamond surfaces (and not removable by
powder cleaning methods) that catalysts the superficial graphitization which further
reduces the final thermal and electrical properties.
For all those reasons the use of Cu coated diamonds have been avoided in following
composites, that instead rely on a deep powder cleaning and to a liquid phase infiltration
to obtain a compacted and not graphitized MoCuCD composite.
8.3.2 MoCuCD
8.3.2.1 Composition
The final composition of MoCuCD has been modified with respect to MoCucCD in-
creasing the content of synthetic diamonds and Cu to help the space filling:
• Composition of starting powder: 40%V 45 µm synthetic diamond powder, 35%V
of 5 µm Mo powder and 25%V of 45 µm Cu Powder.
• RHP main parameters: graphite moulds and electrodes, sintering temperature
1200oC for 30 minutes, constant applied pressure 30MPa, vacuum at 10−4mbar
with reducing atmosphere 97%N2 − 3%H2.
• Produced plates dimensions: the first test plate (MoCuCD − 1) has been made
with standard moulds (Diameter 90 mm Thickness 4 mm), then 5 plates 200x80x4
mm (id. MoCuCD − P − Li with i = 1, 5) have been produced to perform the
final material characterization presented in this Chapter.
99

8. MOLYBDENUM - COPPER - DIAMOND (MOCUCD)COMPOSITES
• Samples production: water jet cutting followed by manual grinding on diamond
tools. Microstructures are all made from fresh fracture surfaces.
The production cycle is virtually identical to previous MoCucCD apart from the
raw material’s and the powder mixing procedure: in order to reproduce the benefit
effects of the thick Cu coating (absence of interstitials between Diamonds) the powder
mixing has made in sequential steps mixing first hydrogen cleaned diamonds and Mo
particles adding Cu only during the last step. The high chemical affinity (enhanced
by the powder cleaning at 600oC that leaves very reactive surfaces) between Mo and
diamond helps in keeping the metallic particles close to the diamonds surfaces even
after the powder insertion in the mould. The result is an optimal starting powder
spatial distribution that allows:
• Optimal formation of Mo2C carbide at the interface
• Filling of the interstitials between diamonds
• Surrounding of diamonds by Mo particles like in plate MoCucCD (see Figure
8.13)
• Matrix filling by molten Cu due to sponge effect
As in previous Chapter we will first see the materials micro structures, followed by
the characterization results and by the conclusions on MoCuCD R&D program.
8.3.2.2 Microstructural Analysis
The microstructure of plates MoCuCD−P −Li have been deeply analysed discovering
a situation very similar to previous MoCucCD plate, as explained in following pictures
8.15, 8.16, 8.17 and 8.18.
8.3.2.3 Mechanical Characterization
The mechanical characterization has been started at CERN by flexural tests and then
prosecuted at the Dynamic Laboratory of Politecnico di Torino with quasi-static and
dynamic compressive tests and temperature dependent tensile tests.
100

8.3 MoCuCD Characterization
Figure 8.15: SE Image at low magnification of MoCuCD-P-L1 fracture surface. The
fracture passes as in previous composites preferentially along the diamond matrix interface.
The majority of Diamonds are well spaced but there is the presence of empty interstitials
between Diamonds.
101

8. MOLYBDENUM - COPPER - DIAMOND (MOCUCD)COMPOSITES
Figure 8.16: SE Image at high magnification of MoCuCD-P-L1 fracture surface. The
diamond surface is still covered by Mo2C and appears only slightly graphitized. The Mo
distribution along the diamond surface is still present thanks to the new powder mixing
method. The matrix looks dense with Cu infiltrating deeply the porous Mo matrix.
102

8.3 MoCuCD Characterization
Figure 8.17: SE Image at high magnification of MoCuCD-P-L1 fracture surface. Detail
of diamond superficial aspect, thanks to charging effect if the diamond surface is rough
(due to graphitization or bonded particles) it will appear brighter as the upper right edge
of the diamond.
103

8. MOLYBDENUM - COPPER - DIAMOND (MOCUCD)COMPOSITES
Figure 8.18: QBSD Image at high magnification of MoCuCD-P-L1 fracture surface in
the exact same position of Figure 8.17. The QBSD technique allows to distinguish between
Mo2C carbides attached to diamond surface and graphite thanks to their density contrast
(lighter materials are darker), as the case of the upper right diamond edge that in fact
is covered by formed Mo2C, while the other regions without grey in QBSD Image are
effectively graphitized areas.
Figure 8.19: Flexural test results for MoCuCD.
104

8.3 MoCuCD Characterization
The flexural Tests have been performed using Strain Gauges glued to the samples
to measure also the real elongation of the stretched side of the samples, allowing the
evaluation of the Young’s Modulus E.
The results are reported in Figure 8.19, the measured average Youngs Modulus
and Elongation to fracture being respectively 260GPa and 0.21% while the Ultimate
Flexural Strength RFl is ≈ 240MPa. The fracture is completely brittle without visible
plasticity of the metallic matrix as shown in the Fracture Surface Microscopy.
The Quasi-Static Tests (c1 and c2 in Figure 8.20) show yielding around 700MPa
followed by stress reduction until 0.15% of Strain, and then the increases again until
fracture. The explanation for the behaviour is related to the intrinsic microstructure
of the material: after the first elastic part, there is a very small plastic deformation
of the metallic matrix, which continues until the Diamonds starts to touch each other;
in this moment the material retrieves some strength until fractures (orientated along
radial direction) are forming on the external surface, causing the failure of the samples
with a Stress around 750− 780MPa.
Looking at the dynamic tests (h2 and h3 in Figure 8.20) we can see an analogue
plot, that has a much higher Yielding Stress (≈ 1100MPa) together with the same sub
sequential reduction due to matrix deformation; in dynamic conditions the matrix has
less time to deform and form the superficial cracks so that the Failure appears over
1500MPa. The failure appears more like a total disaggregation of the samples instead
of crack formation like in quasi-static case, but the mechanism has not been yet fully
eviscerated.
Finally, the two tests reported in Figure 8.21 have been made in quasi-static con-
ditions at RT and at 600oC; the heating has been made by an induction spire located
in the loaded zone of the sample, the measurement of deformation has been made by
extensometers and the temperature has been measured by a PT − 100 sensor glued on
the sample surface. The curve at RT shows a Youngs Modulus around 270− 275 GPa
(in good agreement with the flexural tests) and an ultimate strength around 140MPa.
The plasticity is negligible (< 0.002%). The curve at 600oC shows a much lower ul-
timate strength (≈ 65MPa) and Youngs Modulus (≈ 40 − 50GPa) together with a
slightly higher elongation to fracture (≈ 0.005%).
It is worth noting that during the heating on air of the samples above 600oC Mo
react with the water present in the atmosphere forming complex hydrated Mo oxides
105
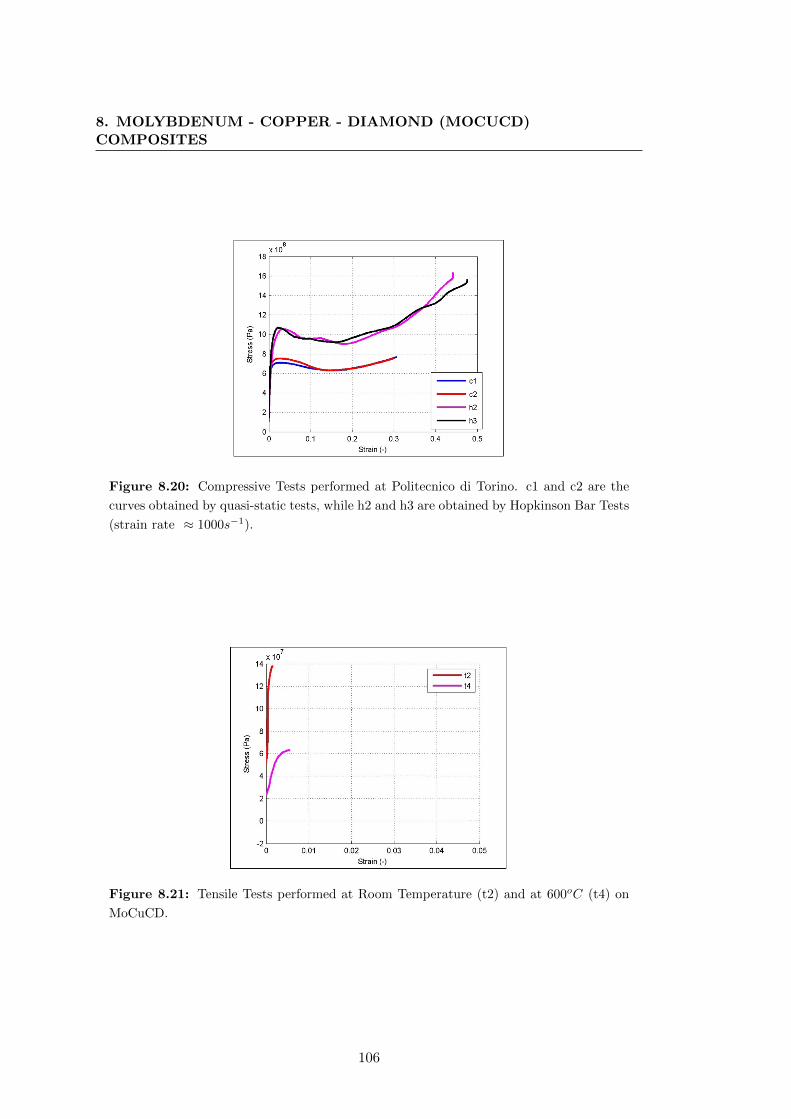
8. MOLYBDENUM - COPPER - DIAMOND (MOCUCD)COMPOSITES
Figure 8.20: Compressive Tests performed at Politecnico di Torino. c1 and c2 are the
curves obtained by quasi-static tests, while h2 and h3 are obtained by Hopkinson Bar Tests
(strain rate ≈ 1000s−1).
Figure 8.21: Tensile Tests performed at Room Temperature (t2) and at 600oC (t4) on
MoCuCD.
106

8.3 MoCuCD Characterization
(formerly known as Molybdenum Blue).
8.3.2.4 Thermal Characterization
After the preliminary estimation of the thermal conductivity using CERN’s thermal test
bench on the sample obtained from the diameter 90 mm test plate, the final thermal
characterization of MoCuCD has been carried out at AIT by Dr. W. Hohenauer using
samples obtained from the MoCuCD − P − Li plates. The values reported are the
combination of three different samples obtained from the same plate.
The characterization techniques and instruments are the same used by Dr. Ho-
henauer for Inermet180 thermal characterization:
• Specific heat by Dynamic Scansion Calorimeter (DSC Netzsch 404 coupled to a
precision balance Sartorius ME235P) from RT to 900oC
• Thermal expansion coefficient by push rod dilatometer (Netzsch Dil− 402) from
RT to 900oC
• Thermal diffusivity by Laser Flash (LFA Netzsch 427) from RT to 900oC
• Thermal conductivity is then evaluated by using equation 6.4
Figure 8.22: Plot of specific heat of MoCuCD as a function of the temperature. The cp
confirms the good thermal stability of MoCuCD at least in vacuum environment.
The specific heat plot in Figure 8.22 shows that the specific heat increases linearly
from 360 J/KgK at RT to 590 − 640 J/KgK at 500oC, after it remains constant
107

8. MOLYBDENUM - COPPER - DIAMOND (MOCUCD)COMPOSITES
up to 900oC. Note that there is no phase change or chemical reaction taking place
during the heating: since the measurements have been performed under controlled Ar
atmosphere, we can exclude the presence of unwanted reactions inside the material in
the LHC Collimator operational conditions (UHV).
Figure 8.23: Plot of CTE of MoCuCD as a function of the temperature. The CTE shows
a large instability at 700oC that is related to Cu expansion.
As can be seen in Figure 8.24, the thermal conductivity starts from ≈ 160W/mK at
RT and then decreases slowly to ≈ 115W/mK at 900oC. The discontinuity observed at
700oC is not an experimental error since it is confirmed also by the CTE measurement
in Figure 8.23: the CTE in fact starts from 7 10−6K−1 at RT and increases regularly
up to 8 10−6K−1 at 400oC remaining then constant up to 650oC; at that moment the
stress generated by the blocked thermal expansion of Cu overcomes the bonding force
of the net made by Mo and diamonds and the material starts to expand significantly
reaching ≈ 12 10−6K−1 at 800oC. After it remains constant.
8.3.2.5 Electrical Characterization
The electrical conductivity has been measured at CERN using the SigmaTest 2.067
measuring device presented in Paragraph 6.1.2. The working frequency as been fixed
to 60kHz, that corresponds to a penetration depth of the measure around 0.5mm. The
first cylindrical plate MoCuCD− 1 has been measured in nine positions on both sides
in order to check eventual non homogeneities of the superficial conductivity, while the
other 5 plates MoCuCD − P − Li have been measured in 40 positions for each side,
108

8.3 MoCuCD Characterization
Figure 8.24: Plot of thermal conductivity of MoCuCD as a function of the temperature.
The large instability at 700oC is always present on different samples and is observed at
every thermal cycle.
each position representing an area of 4cm2: the measurements permits to identify local
variations in Copper superficial content, as shown in Figure 8.25 below.
8.3.2.6 MoCuCD Results
As for the other materials the final properties of MoCuCD are compared in Table 8.2
to the predicted ones in order to evaluate the effectiveness of the material’s R&D.
Table 8.2: Predicted and measured properties of MoCuCD at RT. Density and specific
heat evaluated by ROM model 5.1, CTE by Kerner model 5.11, k by Hasselmann and
Johnson model 5.9 and E is conservatively using the Reuss assumption 5.4.
Property Unit Estimation Measured Var. %
ρ [g/cm3] 7.22 6.9 95.6%
α [10−6K−1] 5.38 7.00 130.0%
k [W/mK] 422 155 36.7%
σ [MS/m] 15.62 10.00 64.0%
E [GPa] 487 260 53.4%
RFl [Mpa] [−] 240 [−]
• Increase in thermal conductivity allows to overcome pure Mo value, however
the thermal barrier due to unavoidable graphitization of diamonds hampers an
109
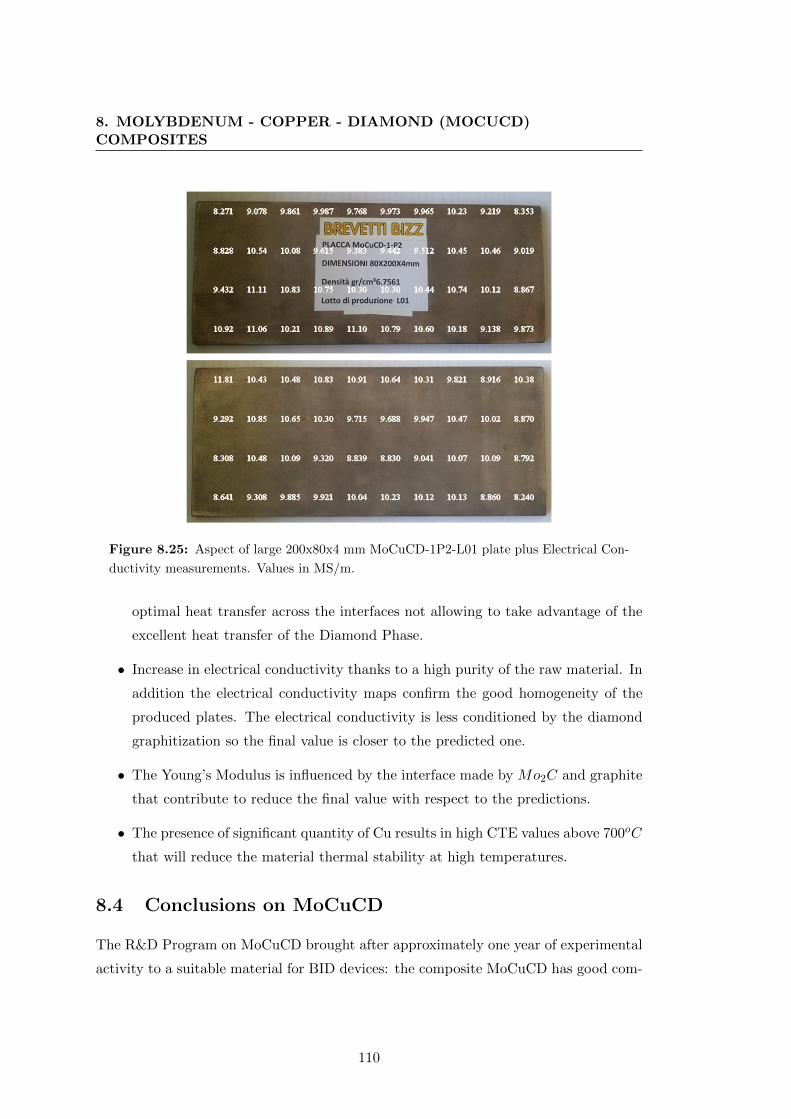
8. MOLYBDENUM - COPPER - DIAMOND (MOCUCD)COMPOSITES
Figure 8.25: Aspect of large 200x80x4 mm MoCuCD-1P2-L01 plate plus Electrical Con-
ductivity measurements. Values in MS/m.
optimal heat transfer across the interfaces not allowing to take advantage of the
excellent heat transfer of the Diamond Phase.
• Increase in electrical conductivity thanks to a high purity of the raw material. In
addition the electrical conductivity maps confirm the good homogeneity of the
produced plates. The electrical conductivity is less conditioned by the diamond
graphitization so the final value is closer to the predicted one.
• The Young’s Modulus is influenced by the interface made by Mo2C and graphite
that contribute to reduce the final value with respect to the predictions.
• The presence of significant quantity of Cu results in high CTE values above 700oC
that will reduce the material thermal stability at high temperatures.
8.4 Conclusions on MoCuCD
The R&D Program on MoCuCD brought after approximately one year of experimental
activity to a suitable material for BID devices: the composite MoCuCD has good com-
110

8.4 Conclusions on MoCuCD
paction, good thermal conductivity and adequate mechanical properties. In addition
the electrical conductivity is good for a Mo composite having the 40% in volume of di-
amonds. The values of the properties together with the FoM estimations are reported
in Table 8.3 below.
Table 8.3: Final properties and Figures of Merit for MoCuCD compared to CuCD and
MoCucCD. Values with * for MoCucCD have been assumed, in absence of apposite tests,
to be equal to MoCuCD ones.
Material Unit CuCD MoCuCD MoCucCD
Density [g/cm3] 5.4 6.9 7.15
Atomic Number (Z) [−] 11.4 17.4 20.2
Melting Temperature [oC] 1083 1083 1083
Thermal Conductivity [W/mK] 490 155 100
CTE [10−6K−1] 7.8 7 7*
Specific Heat [J/kGK] 420 360 360*
Young’s Modulus [GPa] 220 260 260*
Tensile Strength [MPa] 70 140 250
Poisson’s Ratio [−] 0.22 0.3 0.3*
Electrical Conductivity [MS/m] 12.6 10 7.1
Radiation Length χ0 [cm] 4.78 2.82 2.82*
SSNI [kWm2/kg] 11.6 3.2 2.0
TSNI [kJ/kg] 13.4 19.4 34.6
The proposed material has however some intrinsic limits that will play an important
role in the final material choice:
• Brittle behaviour with limited tensile strength;
• Moderately high CTE, with a drastic increase around 700oC.
• Sufficient but not enthusiastic thermal conductivity (only few % higher than pure
Mo), due to residual diamond graphitization.
• The density of ≈ 7 g/cm3 is probably too high for the use in secondary Collima-
tors, as discussed in Chapter 11.
111

8. MOLYBDENUM - COPPER - DIAMOND (MOCUCD)COMPOSITES
For all those reasons the research moved to the next family of composites, Molyb-
denum carbide - Graphite (MoGR), in order to overcome the two limitations of Cu
content and diamond degradation.
112

9
Molybdenum Carbide - Graphite
(MoGR) Composites
Present Chapter introduces the molybdenum carbide-based composite developed during
the thesis work. The Chapter starts as usual with an introduction about the properties
of the constituents (graphite and Mo2C), passing then to the innovations implemented
and to the results obtained.
9.1 Introduction to carbide-reinforced CMC
Starting from the idea that to better match the requirements for Hi-Lumi LHC Collima-
tors it is necessary to reduce the CTE and the density of the composite with respect to
MoCuCD while increasing its resistance to high temperatures, we did two assumptions:
• no more presence of high CTE and low melting phases (Cu);
• use of graphite flakes instead of diamonds.
The first assumption permits us to have a material that is made only by high
melting points components, giving the maximum as possible of thermal stability and
high melting temperature.
The second assumption is more drastic and relies on the following considerations:
• Graphite is lighter than diamonds;
113

9. MOLYBDENUM CARBIDE - GRAPHITE (MOGR) COMPOSITES
• Graphite is already the most stable form of carbon, while Diamond is metastable
and degrades when heated;
• Graphite is strongly anisotropic and shows exceptional properties along the <
1000 > direction of the crystallographic lattice, while has poor properties on
the other direction. If properly oriented the graphite grains will give exceptional
properties in the planar direction, which is the most important for the collimators
strength;
• Graphite is much cheaper than diamonds and permits to increase the number of
tests with the same budget.
Concerning the carbide phase, the choice fall on molybdenum carbide because is
one of the most promising refractory carbide in terms of thermal stability at high tem-
peratures: Mo is added in the form of pure metallic powder that, at the temperatures
needed for the process, completely react with graphite forming hexagonal molybdenum
carbide Mo2C, as described in Paragraph 9.3.1. The material has been however com-
monly called Molybdenum Graphite (in the following MoGR) instead of Molybdenum
Carbide - Graphite for simplicity.
9.1.1 Previous R&D on Metal Carbide - Graphite Composites
The first investigations on the feasibility of composite materials made by refractory
metal carbides and graphite were made in the early 60s at IITRI by Y. Harada and
G.A. Rubin (90). The work of Harada focused on the graphitization and sub sequential
reaction of calcined petroleum coke with metallic powder of various carbide forming
metals: the Hot Pressing process have been made at very high temperatures (2800oC
and 3000oC for MoGR composites) resulting in the complete melting of metal carbide
phase which is then squeezed out of the composite by the applied pressure, leaving
a composite material having a volume fraction of carbide somewhere between 5 and
10%. The process permitted to obtain good mechanical and electrical properties but is
intrinsically limited by the petroleum coke reaction mechanism: during the hot pressing
a non quantifiable amount of Mo2C flows out from the mould giving rise to non-
homogeneities in the material microstructure and to difficulties in the production of a
material with a precise and reproducible composition. A second problem of petroleum
114
9.1 Introduction to carbide-reinforced CMC
coke is the formation of volatile organic compounds during heating. In fact, many trials
have been made in the past to increase the resistance of the metal carbide graphite
composites, focusing mainly on the reduction of porosity due to the volatile element
formation: John and Jenkins (91) proposed in the 80s a technique for the hot-working of
many metal carbide - graphite composites, obtaining a significant reduction in porosity.
However, even if they started from a mixture of pure metallic (or metal carbide) powder
and graphite, there was the melting and the squeezing of the liquid metal carbide
during the process. To overcome these limitations and to have the complete freedom
in the choice of the material composition, we explored a different way to produce
the composite that does not involve organic precursors or liquid phase formation: the
solid state reaction between pure graphite flakes and Mo powder at temperatures lower
than the melting point of Mo2C. The possibility to change the composition without
limitations due to the process is crucial for the tailoring of the composite density that
will allow us to match the optimal beam cleaning of the collimation system during LHC
operations.
9.1.2 Graphite Properties
Graphite is a ceramic material composed by an allotropic form of carbon consisting
in loosely packed layers of hexagonally arranged sp2 carbon atoms (graphene layers),
that can be found naturally on earth or produced artificially by carbonization and
graphitization of an organic precursors. In this electronic configuration there is one
remaining π-orbital electron for each carbon atom. In the case of the hexagonal graphite
cell these electrons form a large delocalized high electron probability region commonly
called benzene ring (see Figure 9.1).
The delocalized electrons assure an excellent heat and electrical transport along the
planar direction, while the covalent sp2 bonds oriented at 120o give very high stiffness.
Graphite is then composed by a multiple packing of graphene layers bonded by weak
Van der Waals forces, with the packing structure represented in Figure 9.2 (31): the
graphene layers are free to slide on top of each other giving to graphite a very low friction
coefficient that is of valuable interest for many applications where dry lubrication is
needed (an example are the rings of the shaft in LHC Primary Collimators). The
graphene planes are usually identified by the crystallographic plane {0001} while the
directions along the plane are all the < 1000 >.
115

9. MOLYBDENUM CARBIDE - GRAPHITE (MOGR) COMPOSITES
Figure 9.1: Schematics of the electron delocalization in graphite single molecule. For
extended foils of graphene the delocalized region can be considered as continuous all over
the plane.
Figure 9.2: Scheme of the graphite cell.
116

9.1 Introduction to carbide-reinforced CMC
Since the sp2 carbon form is stable at standard Temperature and Pressure Graphite
is the most common form of carbon on earth (see the Carbon phase diagram shown in
Figure 7.5 in Chapter 7).
Graphite is present in a wide variety of forms giving rise to a certain incertitude
on its properties definition: ideally perfectly crystalline graphite (like the one used
in the present work) has a brilliant silver like aspect and exhibits excellent thermal
and mechanical properties along its planar direction, whereas polycrystalline graphite
appears dark grey and has very low thermal and mechanical properties. Probably the
most commonly used form of graphite in industry is extruded polycrystalline graphite,
which shows anisotropic properties with elongated grains along the axis that increase
the degree of crystal orientation in the material.
Figure 9.3: Idealized Graphite Crystal structure. Source Asbury Graphite website (3)
It is difficult to give precise values for the ideal single graphite crystal properties
(see Figure 9.3 (3)) since such material does not exist in real world and the properties
given in this work are either calculated or based on measurements of graphite crystals
that approach the ideal crystal structure (92). A brief list of relevant properties for the
single graphite crystal at RT is given in table 9.1 for the ideal graphite crystal compared
to the polycrystalline pyrolytic graphite R4550. Note that all the properties measured
on MoGR materials produced are evaluated along the planar direction, that as we will
see in the X-Rays Diffraction results (9.4.2 ) corresponds roughly to the {0001} plane
of graphite crystals.
117

9. MOLYBDENUM CARBIDE - GRAPHITE (MOGR) COMPOSITES
Table 9.1: Properties of ideal graphite crystal compared to pyrolitic Graphite R4550 used
for LHC Collimators.
Material Unit Graphite R4550 Ideal Graphite Crystal
0001 Plane 1010 plane
Density [g/cm3] 1830 2.2625 2.2625
Atomic Number (Z) [−] 6 6 6
Melting Temperature [oC] 3650 3650 3650
Thermal Conductivity [W/mK] 100 4180 2
CTE [10−6K−1] 4 25 -0.5
Specific Heat [J/kGK] 710 710 710
Elastic Constants [GPa] E = 11.5 C11 = 1060 C44 = 4
Tensile Strength [MPa] 40 [-] [-]
Electrical Conductivity [MS/m] 0.077 0.2 3.30 ∗ 10−4
The exceptional properties of the single crystal are of course impossible to be re-
produced into a massive material but are a very good starting point for the novel
materials R&D. It is worth mentioning that graphite burns in oxygen-rich atmosphere
already at 400oC therefore its usage as refractory element is limited to vacuum or inert
environments.
The graphite powder that used for MoGR production is the Asbury 3260 spheroidal
graphite flakes: this graphite powder exhibits the highest chemical purity and degree of
graphitization of lamellar graphite flakes with small dimensions (45µm) and a regular
round shape that helps the compaction of the powder and reduces the final anisotropy
of the composite. See Figure 9.4 for the SEM image.The two main advantages of
spheroidal graphite particles are:
• good mixing of raw powders, resulting in higher compaction of final composite.
• lower dimensions and possibility to select a chosen powder size by riddling the
powders.
It is important to point out that the spheroidal graphite particles will recrystallize
during the process giving rise to an anisotropic structure even if they were not oriented
during the powder deposition inside the mould: on the other hand the use of spheroidal
graphite helps in having a fine 3−D distribution of graphite in the final composite.
118

9.1 Introduction to carbide-reinforced CMC
Figure 9.4: SE Image at high magnification of Asbury 3260 Graphite flake.
9.1.3 Molybdenum Carbide Properties
Refractory metal carbides such as hexagonal Mo2C have been studied in the last
years because of their exceptionally high maximum operating temperature, for example
Mo2C melts slightly above 2500oC and maintains adequate properties up to 2000oC.
The phase diagram of the system Molybdenum - Carbon is reported in Figure 9.5 (93)
while a brief list of properties taken from literature (94) is reported in table 9.2.
Table 9.2: Physical and mechanical properties of hexagonal Mo2C.
Material Unit Mo2C
Density [g/cm3] 9.06
Atomic Number (Z) [−] 18
Melting Temperature [oC] 2505
Thermal Conductivity [W/mK] 21.5
CTE [10−6K−1] 7.9
Specific Heat [J/kGK] 148
Young’s Modulus [GPa] 347
Poisson’s Ratio [−] 0.234
Electrical Conductivity [MS/m] 1.4
119

9. MOLYBDENUM CARBIDE - GRAPHITE (MOGR) COMPOSITES
Figure 9.5: Calculated phase diagram of the Molybdenum - Carbon system.
9.2 MoGR for LHC Collimators
9.3 MoGR Production
9.3.1 Molybdenum Carbide formation reaction
Mo and graphite are chemically affine to each other; when fine powders of metallic
Mo and Graphite are heated up over 1000oC they immediately form hexagonal Mo2C:
the reaction is controlled by the atomic diffusion of Carbon atoms inside the Mo bcc
lattice interstitials. When the amount of carbon reaches the 33%at a new structure
of hexagonal Mo2C starts to growth from the interface between Mo and graphite and
prosecutes the transformation of the entire Mo grain (84).
2Mo + C ↔Mo2C (9.1)
The reaction prosecutes by the diffusion of C insideMo2C and the formation of MoC
carbide: MoC can have a good effect on the mechanical properties if we manage to finely
disperse it inside the Mo2C matrix, otherwise the presence of MoC at grain boundaries
120

9.3 MoGR Production
or in acicular form inside the grains can reduce significantly the final strength of the
composite. For that reason we need to find the good combination of temperature and
sintering time to obtain a fine dispersion of MoC inside the Mo2C grains. Finally, since
the entire process is diffusion controlled, we can play with the powder dimensions to
increase or reduce the reaction kinetic maintaining constant the sintering parameters.
9.3.2 Sintering Aids in High Temperature sintering
The diffusion activated reaction occurring during the sintering of MoGR is a slow
process that requires time and energy to be accomplished. Fortunately, the diffusive
physical process can be enhanced by adding some activator element in the starting
powder: many studies have been done on Mo (and W) activation sintering (95) showing
that the addition of small amounts of other metals on Mo particles surfaces will enhance
the diffusion between adjacent Mo grains, resulting in faster compaction of the particles.
For Mo the main activator element is Pd, followed by Ni, Rh, Co, Pt, Au and Fe.
In literature works, the effect of having atomic mono layers of activator on W and Mo
particles has been investigated, and two different mechanism have been presented: the
model of Brophy, Hayden and Wulff (95) foresees that the diffusion of Mo is enhanced
in the activator phase, so that Mo diffuses preferentially inside the activator layer
instead than diffusing trough the interface between adjacent Mo particles, therefore
the bonding will be assured by connecting the surfaces of Mo adjacent particles; the
second model from Toth and Lockington, always presented in the paper of Corti, on
the other hand foresees that Mo dissolves at the interface Mo-Activator, forming an
intermediate layer with mixed composition that interacts with the intermediate layer
of the adjacent particle forming a Mo-Activator bonding zone. The two models are
represented in the Figure 9.6 for the system W-Ni.
The most suitable elements for Mo activation are Pd and Ni (96): the effect of
Pd is higher than the one of Ni, but the first choice in terms of availability and costs
would be Ni, because Pd has a much higher price. Unfortunately, Ni addition has a
detrimental effect on Mo mechanical properties and has therefore been rejected (97).
In fact Ni is not soluble in Mo lattice at low temperatures, and during cooling there
will be the segregation of δ Ni-Mo inter metallic phase at grain boundaries, which is
brittle and has a low melting point (1360oC) (98). Pd, on the other hand, is soluble in
121

9. MOLYBDENUM CARBIDE - GRAPHITE (MOGR) COMPOSITES
Figure 9.6: a) Model of Brophy, Hayden and Wulff; b) Model of Toth and Lockington
for Ni assisted W sintering. The mechanism is the same for Mo.
Mo up to 3%w at RT (98), therefore will not form the brittle inter granular compound.
For this reason Pd has been chosen as sintering activator in the present study.
Pd powder (0.25− 0.55µm) has been added to the Mo powder in amount of 0.8%w.
The powders will be mixed together before to start the sintering process in multiple
steps to assure the best homogenization as possible. This situation will be different
from the one described in the already mentioned works (95) because he coated W and
Mo powder with a very thin and regular layer of activator elements instead of adding
pure powders of activator to the mixture.
9.3.3 Production cycle improvements
All tests plates of MoGR have been produced at BrevettiBizz using the modified RHP
machine shown in Figure 9.7: the machine is able to reach very high heating rates (in
the order of 1K/s) while maintaining hydrogen rich atmosphere inside the sintering
chamber to reduce the oxygen content, that can reduce significantly the diffusion at
grain boundaries as previously discussed.
A complex cooling circuit has been implemented by S. Bizzaro to keep the tempera-
tures of the external part of the machine at RT when having 1700oC inside the sintering
chamber: the combination of very high temperatures, hydrogen rich atmosphere and
very high heating rates permits to control with high precision the sintering process
122

9.3 MoGR Production
Figure 9.7: Hot Pressing Machine used for MoGR production at BrevettiBizz.
limiting the detrimental effects of heating and cooling ramps. In addition the pow-
ders are always cleaned under hydrogen atmosphere to reduce the natural superficial
oxygen absorption like for MoCuCD (see paragraph 8.2) inside the machine especially
developed by BrevettiBizz shown in Figure 8.3.
The main innovation of the proposed production technique is the use of high purity
graphite flakes as carbon source. The other additions are pure Mo powder (a combina-
tion of 5µm and 45µm Mo particles shown in Figure 9.8 and Figure 9.9 respectively)
and very fine Pd powder (as explained in paragraph 9.3.2).
The absence of the pyrolysis reaction of the calcined petroleum coke avoids the for-
mation of volatile molecules and reduces the amount of impurities in the final composite,
resulting in dense, pure structures. In addition graphite flakes have a very high degree
of densification, which permits to obtain a fully dense graphite phase even sintering
at temperatures below 2000oC. A complete characterization of the starting powders
has been performed at CERN (see Paragraph 9.1.2 in order to check the effective pow-
der size, shape, chemical purity and the presence of inclusions for all used powder.
Graphite flakes are obtained by high temperature processing of natural graphite and
are supposed to be made by close packed layers of sp2 carbon along the planar direction.
9.3.4 MoGR R&D
The R&D program on MoGR had a first preliminary part where we focused on testing
many different graphite types and different temperatures (from 1400oC up to 1800oC)
123

9. MOLYBDENUM CARBIDE - GRAPHITE (MOGR) COMPOSITES
Figure 9.8: SE Image: High magnification SEM Observation at CERN of the 5µm
Molybdenum powder used for MoGR production.
with a large scan. This preliminary part allowed to choose the most promising graphite
type (spheroidal flakes of Asbury 3260 graphite) and to reduce significantly the tem-
perature interval of interest (from 1600oC up to 1750oC). For all plates we kept a
constant 60%V of graphite in order to have a final density of ≈ 5.6g/cm3, which repre-
sents a good compromise in terms of energy absorption between CFC and pure metallic
solution and is very close to the density of CuCD.
After having fixed the region of interest we started to deeply analyse the effect of 4
main parameters independently (sintering pressure, temperature and time and graphite
particles dimensions) in order to find the best combination of production parameters.
The final MoGR material composition and production cycle parameters are reported
below.
• Composition of starting powder: 40%V Mo (divided in 90% 45 µm powder and
10% 5 µm powder) having the 0.8%w of Pd (see Figure 9.10), the rest being
Asbury 3260 Graphite Selected <45µm (see Figure 9.4).
124

9.4 MoGR Characterization
Figure 9.9: SE Image: High magnification SEM Observation at CERN of the 45µm
Molybdenum powder used for MoGR production.
• Rapid Hot Pressing main parameters: Graphite moulds and electrodes, sintering
temperature 1700oC for 10 minutes, constant applied pressure 45MPa, vacuum
atmosphere 10−4mbar with reducing atmosphere 97%N2 − 3%H2.
• Produced plates dimensions: 70x55 mm having rounded edges with R=5 mm.
The obtained plate has been cut by water jet to obtain the samples for the mechan-
ical and thermal characterization at CERN (always carried out along the longitudinal
direction of the plates) and for the microstructural analysis by SEM, EDS and X-ray
diffraction. The results being reported in the following section.
9.4 MoGR Characterization
All the produced plates have been then tested at BrevettiBizz and CERN in order to
classify them in terms of density, flexural mechanical strength, electrical conductivity
(by RF impedance measurements ), and thermal conductivity using the apparatus
presented in Paragraph 6. Further analysis by X-Rays, optical and SE microscopy
125

9. MOLYBDENUM CARBIDE - GRAPHITE (MOGR) COMPOSITES
Figure 9.10: SE Image: High magnification SEM Observation at CERN of the 0.25 −0.55µm Palladium powder used for MoGR production.
permitted an interpretation of the obtained results. Finally we want to point out that
during the sintering process there is a significant recrystallization of graphite grains
that orient themselves parallel to the plate: the final material is therefore anisotropic
and has different properties between the longitudinal and the transversal direction with
respect to parallel surfaces of the composite plate, as confirmed by X-Ray analysis.
The characterization results of the most promising MoGR material is reported in
next paragraphs.
9.4.1 Microstructural Analysis
The SEM images of MoGR were always taken on the transversal cross section of the
analysed sample, which has been polished by 1200 mesh sand paper followed by dia-
mond paste down to 1/4 µm, then cleaned in alcohol with ultra sounds and degassed.
The microstructure appearance along the longitudinal direction is very similar to the
transversal one, thanks to the use of spheroidal graphite that does not lead to high
preferential orientation of the particles. However, the lattices of recrystallized graphite
126

9.4 MoGR Characterization
grains and of the newly formed Mo2C grains are heavily oriented due to the application
of unidirectional pressure during the sintering process.
Figure 9.11: QBSD Image at low magnification of MoGR (transversal direction) made
using fine selected Asbury3260 graphite. The clear (heavier) phase is Mo2C formed during
the solid state reaction. The grains are mostly regular with the presence of some macro-
grains formed by the coalescence of adjacent grains.
As shown in Figure 9.11 the material appears homogeneous, with a regular distri-
bution of graphite grains surrounded by partially interconnected Mo2C grains having
irregular shapes. The dimensions of the Mo2C grains are significantly greater than
the initial Mo particles, suggesting a massive coalescence of the grains that brings to
the interconnected structure. The interconnection between Mo2C grains are the re-
sponsible for the final mechanical strength of the material and for the good electrical
conductivity, that could not be achieved if the conductive Mo2C grains were separated.
The BSE image of Figure 9.12 gives a closer view to the Mo2C grains shape and
internal structure: the grains are made by several initial carbide grains that grow
consuming the embedded graphite particles, leaving small acicular graphite inclusions
inside the newly formed grains.
127

9. MOLYBDENUM CARBIDE - GRAPHITE (MOGR) COMPOSITES
Figure 9.12: QBSD Image at intermediate magnification of MoGR (transversal direction)
made using fine selected Asbury3260 graphite. Aspect of recrystallized Mo2C grains and
of the internal acicular inclusions. There are also many small Mo2C grains embedded
inside the graphite phase, due to the presence of the small 5µm Mo particles.
128

9.4 MoGR Characterization
The QBSD Images allowed to clearly see the carbide grains enhancing the contrast
and removing the charge effect on the Mo2C grains (since surrounding graphite is not
conductive): however, Figure 9.13 has been obtained using the “InLens” Secondary
Electron Detector of the Sigma Zeiss SEM in order to verify also the internal structure
and porosity of the graphite phase. Graphite appears generally compacted, with the
presence of porosity mainly at the interface between two graphite grains, as shown in
Figure 9.13 on the left. There are also many small Mo2C particles remained embedded
between graphite grains. The interface between the two parts of the big carbide grain
in the middle of the image confirms the origin of the acicular inclusions.
Figure 9.13: SE Image at high magnification of MoGR (transversal direction) made using
fine selected Asbury3260 graphite.
9.4.2 Graphite Orientation
The orientation of the graphite lattice has been verified by X-Rays analysis (see Para-
graph 6.3.2) carried out placing the sample on both longitudinal and transversal ori-
entation. The comparison for MoGR is reported in Figure 9.14, where the red curve
represents the spectrum acquired in transversal direction while the black curve the
129

9. MOLYBDENUM CARBIDE - GRAPHITE (MOGR) COMPOSITES
Figure 9.14: MoGR 24-C X-Ray analysis in Longitudinal (Black) and Transversal (Red)
direction.
longitudinal one.
The first graphite peak at 25o is the < 1000 > peak of graphite lattice: we can
clearly see that the peak is predominant in the case of longitudinal orientation while
disappears in the transversal orientation, meaning a nearly perfect recrystallization of
graphite grains. Also Mo2C orients itself during the process along the Longitudinal
Direction, but in a less pronounced way with respect to Graphite.
9.5 Conclusions on MoGR
In this section the final results of the MoGR R&D program are discussed and compared
with the analytical estimations and with the other proposed materials. As already in-
troduced at the beginning of the present Chapter the results obtained with MoGR
were not satisfactory and the R&D program moved to the development of Carbon
Fiber reinforced MoGR (MoGRCF), so the final MoGR material has not been exten-
sively characterized as for CuCD and MoCuCD and only the results of BrevettiBizz
130

9.5 Conclusions on MoGR
and CERN measurements (density, electrical conductivity, thermal conductivity and
flexural strength all at RT) are available.
The remaining properties have been only analytically evaluated under the assump-
tions discussed below.
9.5.1 MoGR Properties estimation
Given the anisotropy of MoGR and MoGRCF the treatment is more complex than with
previously discussed isotropic materials so an entire Paragraph has been devoted to the
discussion about MoGR properties estimation.
The major differences between the previous estimations of the expected properties
composites and the ones for anisotropic materials, such as for MoGR and MoGRCF,
are listed below.
• Density and specific heat: the stoichiometry of the solid state reaction 9.1 and
the density differences between Mo and Mo2C have to be taken into account to
obtain the final volumetric fractions of the two components Mo2C and graphite
in order to use equation 5.1 to evaluate ρ and cp. The hypotheses are that all Mo
reacts with graphite forming Mo2C leaving the graphite in excess in the form of
completely compacted graphite (ρ = 2.25g/cm3);
• Thermal conductivity: the thermal conductivity of orthotropic materials has been
evaluated by the Kapitza model as already discussed in Paragraph 5.4.1. However
the uncertainty in the effective thermal conductivity of the partially graphitized
graphite grains (stage N.3 in Figure 10.2 in next Chapter) hampers a reliable
evaluation of MoGR thermal conductivity. On the other hand in the case of
MoGRCF the calculation has been performed assigning arbitrary to the entire
graphitic phase (graphite grains + Carbon Fibers) the properties of the Carbon
Fibers: this choice is based on the fact that at MoGRCF sintering temperature
the graphite grains should recrystallize completely and directionally reaching the
stage N.4 structure which is close to the one of CF recrystallized at similar tem-
peratures.
• Young’s Modulus: the Young’s Modulus along the two principal directions EL
and ET has been evaluated using the equations reported in Paragraph 5.3.1 using
131

9. MOLYBDENUM CARBIDE - GRAPHITE (MOGR) COMPOSITES
the elastic constants of pyrolytic Graphite R4550; however as already introduced
since graphite elastic constants have a large dispersion depending on the internal
structure of the grains this assumption is arbitrary.
• CTE: the correct evaluation of the CTE along the two principal directions should
take into account the anisotropy of the graphite phase for both the thermal and
the mechanical point of view, since the thermally induced stresses around one par-
ticle depend on the relative orientation of all surrounding grains that contribute
non linearly to the final thermal expansion. An analytical method has still not
been implemented and in present work we will simply use the conservative Turner
model in the assumption of isotropic material. A possible solution still not im-
plemented could be to reproduce the thermal expansion of a significant volume
of the bi-phase material with coupled thermo-mechanical Finite Element Method
(FEM) simulations and then transpose the results to the equivalent homogeneous
material.
• Ultimate Strength: the ultimate strength has been conservatively assumed ≈ 2/3
of measured RFl.
9.5.2 Final Results of MoGR R&D
During the R&D program carried out at CERN in collaboration with BrevettiBizz
many efforts have been done to obtain a Molybdenum Carbide Graphite material with
the production of a huge amount of experimental data that allowed to choose the
best production cycle and composition for Molybdenum Carbide - Graphite composites
realized by RHP of powders in solid state.
The obtained material has a good combination of thermal and mechanical properties
like can be seen in table 9.3, however the comparison with the other candidates, namely
CuCD and MoCuCD, shows that the only advantage of MoGR is it’s higher thermal
stability at high temperature.
The R&D on MoGR has been therefore suspended without completing the detailed
characterization made for CuCD and MoCuCD.
The work prosecuted with the introduction in MoGR of a second reinforcement
(Carbon Fibers) and with a higher sintering temperature in order to achieve higher
thermal properties while reducing density and CTE.
132

9.5 Conclusions on MoGR
Table 9.3: Final properties and Figures of Merit for MoGR compared to CuCD and
MoCuCD. Values with * are estimations based on the considerations reported in 9.5.1 .
Material Unit CuCD MoCuCD MoGR
Density [g/cm3] 5.4 6.9 5.3
Atomic Number (Z) [−] 11.4 17.4 15.9
Melting Temperature [oC] 1083 1083 2505
Thermal Conductivity [W/mK] 490 155 135
CTE [10−6K−1] 7.8 7 7.59*
Specific Heat [J/kgK] 420 360 261
Young’s Modulus [GPa] 220 260 179.25*
Tensile Strength [MPa] 70 140 95.7
Poisson’s Ratio [−] 0.22 0.3 0.19*
Electrical Conductivity [MS/m] 12.6 10 1
Radiation Length χ0 [cm] 4.78 2.82 4.99
SSNI [kWm2/kg] 11.6 3.2 3.4
TSNI [kJ/kg] 13.4 19.4 14.9
133

10
Molybdenum Carbide Graphite
Carbon Fiber (MoGRCF)
Composites
Present Chapter presents the R&D and the results obtained with the the addition of
Carbon Fibers (CF) to the already developed MoGR material.
Instead of previous Chapters, where there was a first introduction to the new con-
stituent, followed by the developed innovations and by the obtained results, in this case
the innovations and the results have been split into two distinct sections, each one hav-
ing the same internal logical order as in previous Chapters. This is due to the fact that
the R&D spaced between two very different parts that are conceptually separated, the
Solid State Sintering (SSS) and the Liquid Phase Sintering (LPS), that require specific
treatments.
10.1 Introduction to Carbon Fiber-reinforced CMC
As already anticipated the relatively low results obtained with MoGR leaded to the
research of possible additions to improve its thermal properties without sacrificing the
optimal thermal stability at high temperatures of Mo2C and graphite by adding other
low melting elements. In the Chapter the structures and properties of CF will be
presented, followed by the description of the R&D work carried out at CERN and
BrevettiBizz and by the characterization of the obtained material.
134

10.2 Carbon Fibers Properties
The graphitization stages reported in Figure 10.2 suggest that in MoGR we were
not perfectly aligning the graphene layers obtaining an internal structure of graphite
grains similar to stage number 3 in the picture, where the graphene layers are woven
like. In this case the graphene macro-molecular delocalized π-orbital is deformed with
respect to the molecular planar direction. The graphitization process prosecutes with
the formation of completely planar graphene layers, that instead give properties close
to the ideal graphene layer already discussed in previous Chapter. The temperature
needed to form perfectly planar graphene layers is indicatively higher than 2100oC so
the MoGRCF R&D program starts with the production of MoGRCF plates at 2200oC,
where all the components are still in solid phase. Further improvement has been the
increase in Temperature up to the melting of Mo2C at 2505oC to take advantage of
LPS and obtain a fully dense material.
The production of MoGRCF involved not only a huge research and characterization
work but also an important upgrade of the RHP machine made in BrevettiBizz to
reach safely the temperatures needed to sinter MoGRCF. This improvements have been
implemented stepped with time, giving rise to two parts of the R&D program, the SSS
of MoGRCF and the LPS of MoGRCF, which are presented in next Paragraphs.
The R&D started in the middle of 2012 and is still ongoing with the aim to re-
produce the optimal results obtained on test plates (70x55x4 mm or Diameter 90 mm
Thickness 4 mm) on big massive pieces having suitable dimensions for the LHC Colli-
mators (140x40x22 mm). The main issues that have been encountered switching from
thin to thick plates are differences in the spatial distribution of the fibers inside the
mould and in pressure and temperature spatial distribution during the process that lead
to less homogeneous, less oriented and less compacted material (lower final properties).
10.2 Carbon Fibers Properties
After diamond and graphite, already introduced in Paragraphs 7.1.1 and 9.1.2, the
remaining carbon materials are Carbon Fibers (CF), carbon nanotubes, graphene foils
and fullerenes (92); between all of them only CF can practically be used for producing
massive composite pieces at a reasonable cost (31). CF have exceptional physical and
mechanical properties and have been widely used for producing composites; however
some intrinsic limits of graphite based materials (low oxidation resistance, low hardness,
135

10. MOLYBDENUM CARBIDE GRAPHITE CARBON FIBER(MOGRCF) COMPOSITES
difficulty to machine pieces together with need to use dry powder aspirators) limited
their expansion and are actually mostly used for particular applications such as aero
spatial and sport industry, in addition of course to the very specific BID application
object of the present work.
Carbonization of fiber was first applied by Edison in his process of obtaining in-
candescent filaments about a century ago and is now an essential process in the CF
production. CF are unique materials and have a wide variety of applications, espe-
cially high performance CF gained in the last 30 years considerable attention and are
now widely used as a reinforcing component of the advanced composite materials for
specific applications where very low density has to be combined with high elastic prop-
erties or high thermal dissipation. These applications of CFCs are based on the high
strength, high modulus and high heat transport of the fibers, which are attributable to
the structure of highly oriented hexagonal carbon-carbon networks, similar to that of
single crystal graphite.
Since the thermal conductivity takes advantage too from the high orientation of
the graphene layers (see Paragraph 9.1.2) CF can be of invaluable interest for thermal
management composites such as the CFC already used in Primary LHC Collimators
jaws (see Paragraph 4.1.1).
However the intrinsic porosity of CFC (due to the absence of filling elements) does
not allow to take fully advantage of the CF high transport properties: in CFC the
matrix is obtained by vapour infiltration and deposition of carbon, while in MoGRCF
the use of LPS process allows the full compaction of the interstitials between CF by
the molten phase, giving exceptional thermal properties at the cost of higher density if
compared to CFC.
A comparison of some different types of CF precursor is described in the next
Paragraph together with the obtained properties. The main emphasis of this section will
be on mesophase pitch-based CF that have been used for the production of MoGRCF.
10.2.1 Comparison of Carbon Fibers
In order to obtain CF with desirable properties, a wide variety of organic materials have
been investigated for their use as precursors during the past decades. Mainly rayon,
polyacrylonitrile (PAN), and carbonaceous pitch have been used in the industry as the
precursors for CF giving different final properties and unique advantages.
136

10.2 Carbon Fibers Properties
Some indicative properties of CF provided in literature (99) are shown in Table
10.1 for PAN based fibers produced by Toray (T800 and M50) and for mesophase
pitch based fibers produced by Union Carbide (P25 and P120); as can be clearly seen
different production process parameters can give very different properties depending
on the achieved graphitization ratio, therefore it is necessary to always identify the
commercial name of the fiber and verify its properties and structure.
The literature value are then compared, always in Table 10.1, to Granoc XN −100− 03Z and to Cytek DKD ThermoGraph CF used in the production of MoGRCF
(data provided by Nippon Graphite Fiber Corporation (100) and Cytec (101)). These
newly introduced advanced mesophase pitch fibers have been especially developed to
optimize the thermal conductivity along the fiber axis by allowing a even more complete
graphitization of their structure.
There are other older methods to produce CF such as rayon (Union Carbide) and
mesophase pitch but they are significantly more expensive than the other two methods
so actually PAN and mesophase pitch are the preferentially employed precursors for
carbon fibres. Especially, mesophase pitch is expected to have better characteristics as
the precursor of CF than PAN because of its higher ”graphitizing” characteristics.
Table 10.1: Comparison of properties of different PAN- and mesophase pitch- based CF
Fiber Type Unit PAN Mesophase Pitch
Commercial name T800 M50 P25 P120 XN-100-03Z Cytek DKD
Density [g/cm3] 1.8 1.91 1.9 2.18 2.22 2.15-2.20
Thermal Conductivity [W/mK] [−] [−] [−] [−] 900 400-650
Young’s Modulus [GPa] 290 490 160 830 1000 1380
Tensile Strength [MPa] 5600 2400 1400 2200 [−] 690-830
Elongation [%] 1.9 0.4 0.9 0.3 [−] [−]
Electrical Conductivity [MS/m] 0.077 0.14 0.077 0.45 0.67 0.33
In case of mesophase pitch-based CF, tensile modulus in excess of 1000 GPa can be
attained, which is practically equivalent to the theoretical value for the ideal graphite
crystal along {0001} planes reported in Table 9.1. The electrical conductivity is another
parameter that increases together with the regularity of the graphene planes, giving to
pitch based fibers a quasi-metallic electrical conductivity.
137

10. MOLYBDENUM CARBIDE GRAPHITE CARBON FIBER(MOGRCF) COMPOSITES
This result is achieved by the very high chemical purity of the obtained fiber and
by the high precision of the graphene structure.
As both the elastic and transport properties of the graphene layers (Young’s Mod-
ulus, thermal and electrical conductivity) depend strongly on the defects density along
the graphene planes the thermal conductivity at RT of such fibers can reach up to 900
W/mK while the estimated thermal Conductivity along the fiber radial direction is few
W/mK.
In contrast, the maximum value of the modulus attained for PAN-based fibers is
considered to be about 500 GPa. Figure 10.1 shows the tensile properties of manufac-
tured PAN- and mesophase pitch-based CF.
Figure 10.1: Mechnical Properties comparison between PAN- and mesophase pitch-based
fibers (produced respectively by Toray Ind., Torayca and by Union Carbide, Thornel)
10.2.2 Production techniques
Most organic materials can be carbonized on heat treatment at a high temperature
above 700 − 800oC under inert atmosphere. Graphitizable carbons exhibit the char-
acteristic of structural conversion on heat treatment passing through several stages as
shown in the plot of Figure 10.2, by which the hexagonal carbon-carbon networks are
highly oriented in the three-dimensional order. Mesophase pitch is known as one of the
most typical graphitizable carbonaceous materials.
The processes of mesophase pitch- and PAN-based CF are shown in Fig. 10.3.
Both processes after the initial molten pitch spinning (made inside an extruder, see
138

10.2 Carbon Fibers Properties
Figure 10.2: Graphitization stages in graphitizable carbon as a function of the heat
treatment temperature (THT ), source Goma et Oberlin (4)
Figure 10.4) are essentially the same: the material is first oxidized (under active oxygen
rich atmosphere), then carbonized (under reducing atmosphere) and finally graphitized
(under vacuum). However, the oxidation in each process has a different purpose: for
mesophase pitch is to cross-link molecules to the extent of making it stronger by in-
troducing oxygen, while the oxidation of PAN brings about a ring formation of PAN
chain molecules.
From the chemical point of view pitch (a distillation residue of petroleum) is a com-
plex mixture of thousands of aromatic hydrocarbons having 3 − 8 fused ring systems
and an average molecular weight of 300− 400 g/mol. Isotropic pitch is first subjected
to polymerization and condensation to obtain mesophase anisotropic pitch: the pitch
passes through many different stages of the mesophase formation (102) until the for-
mation of a structure in which fused aromatic rings networks are stacked together by
aromatic like π - electrons.
Thanks to the particular disposition of the aromatic rings it is possible to grow
fibers having precise and regular graphene planes along the fiber axis during the fol-
lowing carbonization and graphitization, with precise layers disposition depending on
the mesophase production parameters as shown in next Paragraph.
After oxidation the pitch is carbonized under vacuum to remove the superficial OH
and COOH groups and obtain a pure CF: en example of used equipment is reported
in Figure 10.5. A similar furnace is then used for the last heat treatment in vacuum at
139

10. MOLYBDENUM CARBIDE GRAPHITE CARBON FIBER(MOGRCF) COMPOSITES
Figure 10.3: Comparison of the different production cycles for PAN- and pitch-based
CF.
Figure 10.4: Schematics of a common extruder used for the melt spinning of mesophase
pitch (5).
140

10.2 Carbon Fibers Properties
very high temperature to promote the fibers graphitization.
Figure 10.5: Schematics of an hairpin element furnace used to carbonize mesophase pitch
fibers.
10.2.3 Structure of Carbon Fibers
The internal structure of CF has been already deeply analysed in the past, in partic-
ular it has been found that mesophase pitch based CF can have one of the following
different transverse structures: radial, onion-skin, random arrangements and of course
intermediate structures of these three categories (103).
Figure 10.6 shows the obtained structure of the fiber as a function of the pitch
viscosity and of the melt spinning temperature during the mesophase development,
while Figure 10.8 shows the internal structure of a mesophase pitch CF characterized
at CERN.
Pitch based CF will contain internal packing defects that remain from the mesophase
pitch structure and will affect their final properties: a description of the most common
mesophase pitch configurations have been made by Zimmer et al. and is reported in
Figure 10.7 (104).
It is also worth noting that CF are usually chopped or milled to achieve the desired
average fibers length. These operations break the fibers leaving small fiber fragments
that remain attached to the fibers surface by electrostatic forces. Of course the amount
of fragments is higher in milled fibers than in chopped fibers. The presence of small
fragments is however not negative into a material having also a graphite phase because
141

10. MOLYBDENUM CARBIDE GRAPHITE CARBON FIBER(MOGRCF) COMPOSITES
Figure 10.6: Fiber structure as a function of the the melt spinning parameters.
Figure 10.7: Possible inernal sttructures of mesophase pitch precursors.
142

10.2 Carbon Fibers Properties
Figure 10.8: Internal Structure of pitch based CF used for MoGRCF production. The
internal structure is made by radially oriented graphene planes.
the fiber fragments have a much higher compaction with respect to the graphite flakes
helping in achieving denser composites with the same cycle.
The milled or chopped fibers will always have a broad distribution of lengths because
of the intrinsic difficulties in selecting the fibers lengths, so every fiber supply have
been observed at SEM and optical microscope to verify (visually) the fibers length
distribution.
Another issue when dealing with long fibers is their tendency to form macroaggre-
gates bonded along the fibers length by Van der Waals forces: these aggregates can be
macroscopic like shown in Figures 10.10 and 10.9 and unfortunately are not removed
by the standard powder mixing made before the sintering process. For that reason the
long CF Granoc XN − 100− 03Z have been softly separated by mixing them inside a
mechanical blender. The beneficial effect of avoiding macro-aggregates (together with
the presence of fragments, already fully dense graphite particles) overcomes the fibers
length reduction giving higher properties and homogeneity to the obtained composites.
143

10. MOLYBDENUM CARBIDE GRAPHITE CARBON FIBER(MOGRCF) COMPOSITES
Figure 10.9: Granoc XN-100-03Z 3 mm long CF. Presence of macroaggregates of packed
fibers with dimensions up to few mm in diameter.
Figure 10.10: Aspect of Granoc XN-100-03Z CF. The macroaggregates are clearly visible.
144

10.3 MoGRCF Production and Characterization
10.3 MoGRCF Production and Characterization
10.3.1 Solid Phase Sintering of MoGRCF
The brief summary of the first batch of 5 plates produced in solid state at 2200oC
is reported in table 10.2: all plates have been produced with the same raw material
(based on the results obtained from MoGR) and production cycle:
• Composition
– Molybdenum: content fixed to 20%V for all plates of 5 µm Mo powder (see
Figure 9.8;
– Graphite: Not Selected Asbury 3260 (see Figure 9.4);
– Short CF: Cytec ThermalGraph DKD - nominal length 250 µm (see Figure
10.8);
– Long CF: NGF Granoc XN −100−03Z - nominal length 3 mm (see Figure
10.9).
– All powders have been cleaned with hydrogen before mixing using the equip-
ment described in Paragraph 8.2.
– Theoretical density after solid state reaction (see Paragraphs 5.2 and 9.5.1):
ρth = 3.91 g7cm3.
• Process Parameters
– Temperature: 2200oC measured by a high temperature pyrometer pointed
on the graphite mould;
– Atmosphere: vacuum 10−4mbar with reducing atmosphere 97%N2 − 3%H2
as for MoCuCD and MoGR;
– Pressure: three steps application of pressure during the process as a function
of the temperature, last step being 30 MPa.
– Moulds and Electrodes: rectangular mould in pyrolytic graphite (plates di-
mensions 70x55x4 mm with rounded edges R = 5mm), cylindrical electrodes
in pyrolytic graphite;
– Cooling system: increased refrigerator cooling power to 60 KW.
145

10. MOLYBDENUM CARBIDE GRAPHITE CARBON FIBER(MOGRCF) COMPOSITES
Three different total amount of CF contents have been chosen, 20%, 40% and 60%,
which are extremely high for a standard fiber reinforced CMC and will usually lead to
undesirable high content of porosity. Many authors report maximum values of fiber
content around the 25% (31) in the case of metallic matrix solid state sintering, that
can increase up to 30% if switching to liquid state infiltrating processes.
However in the case of MoGRCF the composition of the MoGR matrix have been
tailored to maximize the space filling: first the use of Not Selected Asbury graphite,
which has proven to have a high content of very fine, dense and pure graphite particles,
allows to obtain a relatively high compaction rate of 94% with the 20%V of fibers, that
decreases down to ≈ 90% in the case of the 60%V of Fibers. It must also be said that at
2200oC the diffusion controlled reaction between Mo and C is extremely fast allowing
to form relatively large Mo2C grains that incorporate the small graphite grains, as
shown in Figure 10.11. In this case the usage of Pd as a sintering activator, discussed
in Paragraph 9.3.2, is no more necessary and has been abandoned reducing the cost of
the material.
Table 10.2: Summary of the first batch of MoGRCF plates produced in solid state during
2012 at BrevettiBizz. *The value is measured in the centre of the plate.
Plate Id. GR Short CF Long CF ρ ρ/ρ0 σ k RFl
Unit %V %V %V [g/cm3] % [MS/m] [W/mK] [MPa]
N.1 60 20 0 3.68 94.1% 0.61 240 59
N.2 40 40 0 3.65 93.3% 0.41 200 45
N.3 40 20 20 3.65 93.3% 0.98* 315 53
N.4 20 30 30 3.53 90.2% 0.3 200 37
N.4Bis 20 30 30 Blended 3.73 95.3% 0.42 205 77.5
The most representative microstructures of the first 5 plates are reported in the next
Paragraph together with a brief discussion of the different aspects already mentioned.
10.3.1.1 Solid State MoGRCF Characterization
As already mentioned MoGR itself shows a large anisotropy between the longitudinal
(perpendicular to applied pressure) and transversal (parallel to applied pressure) di-
rection of the produced plates, so in the case of MoGRCF the anisotropy is enhanced
146

10.3 MoGRCF Production and Characterization
by the presence of the CF that tend to dispose themselves along the longitudinal di-
rection. The fiber disposition is however not regular due to the fiber-fiber interference
during the powder deposition that leaves large macrocavities, as expected by the high
fiber content. The SEM images are always taken on the longitudinal or transversal
cross section of the analysed sample, which has been polished by 1200 mesh sand paper
followed by diamond paste down to 1/4 µm, then cleaned in alcohol with ultra sounds
and degassed.
Figure 10.11: SE image at low magnification of MoGRCF-1 plate (longitudinal cross
section) sintered at 2200oC with the 20%V of short fibers. Mo2C diffused more than in
previous MoGR plates sintered at 1700oC forming large, porous grains up to few hundreds
of µms. the planar orientation of the fibers is also visible where the graphite matrix
detached during the polishing and ultra sound cleaning.
10.3.1.2 Conclusions on Solid State MoGRCF
From the test plates reported in Table 10.2 and the microstructural observations in
previous Paragraph it is possible to start to compare few parameters:
• Effect of higher sintering temperature;
147

10. MOLYBDENUM CARBIDE GRAPHITE CARBON FIBER(MOGRCF) COMPOSITES
Figure 10.12: SE image at high magnification of MoGRCF-1 plate (transversal cross
section) sintered at 2200oC with the 20%V of short fibers. Particular of a macro cavity
formed by the intersection of 3 (visible) fibers that was not filled by graphite or Mo2C.
• Effect of short fiber quantity from 20 to 40%V (between plates N.1 and N.2) and
of total fiber content from 40%V to 60%V (between plates N.3 and N.4);
• Effect of using only short fibers or a combination of 50% Long and 50% short
fibers (plates N.2 and N.3);
• Effect of fiber blending to separate the macroaggregates (plates N.4 and N.4bis).
First of all, as expected by previous considerations about the new temperature of
2200oC in MoGRCF the graphite phase recrystallizes encapsulating the CF and the
Mo2C particles and giving a dense and continuous graphitic matrix, as can be seen in
Figures 10.14, 10.15 taken in the periphery of plate N.3.
The effect of the fiber content is related to the difficult fiber packing inside the
Fiber reinforced material instead of the Asbury 3260 Spherical Flakes of graphite, that
lead to lower compaction (and lower properties) in plate N.2 with respect to plate N.1
(see Table 10.2) and plate N.4 with respect to N.3, as clearly shown in Figures 10.16
148

10.3 MoGRCF Production and Characterization
Figure 10.13: SE image at low magnification of MoGRCF-3 plate (longitudinal cross
section) sintered at 2200oC with the 20%V of short fibers and the 20%V of long fibers.
Aspect of one macro aggregate of long CF remained trapped inside the structure.
and 10.14 respectively. However also in plate N.1 there are large macrocavities in the
regions of fiber-fiber interference, like the one showed in Figure 10.12. The only way to
completely remove such cavities is to fill them with liquid since pores larger than 2µm
will not fill themselves by the solid state sintering diffusion process.
The third effect is more difficult to define because the introduction of the macroag-
gregates of Granoc Fibers leaded to a non homogeneous plate with higher compaction
(confirmed also by the electrical conductivity measurements) in the centre of the plate.
This effect has been deeply analysed finding that there have been a partial melting in
the middle of the plate of the matrix phase due to very high thermal gradients during
the production. However this effect has been observed only in plate N.3 inside the
first batch of material, probably because of the very anisotropic behaviour of the CF
macroaggregates (see Figure 10.9 and 10.13) that reduced the powder electrical con-
ductivity along the transverse direction, increasing the ohmic heat generation inside
the mould.
149

10. MOLYBDENUM CARBIDE GRAPHITE CARBON FIBER(MOGRCF) COMPOSITES
Figure 10.14: SE image at intermediate magnification of MoGRCF-3 plate (longitudinal
cross section) sintered at 2200oC with the 20%V of short fibers and the 20%V of long fibers.
The interface between the fiber macro aggregate and the matrix is poorly filled, while the
MoGR matrix looks denser than in previous MoGRCF-1 plate thanks to the local higher
Mo content.
It must be said that at this temperature the only suitable measuring device is a
pyrometer operating through a window and pointed to the outside of the graphite
mould: the measured temperature is therefore always related to the incertitude of
the effective temperature distribution inside the plate with respect to the temperature
of the external face of the mould. However for sake of simplicity the plates will be
identified only by the nominal temperature measured by the pyrometer.
Finally, the powder blending explained in Paragraph 10.2.3 allowed to achieve much
better mechanical properties and to increase the fibers content up to the 60% : V while
obtaining anyway a very good compaction and a good phase distribution homogeneity
in plate MoGRCF-4Bis as shown in Figure 10.17, thanks to the fibers separation and to
the presence of the sub micro-metric fibers fragments that help in filling the interstitials.
150

10.3 MoGRCF Production and Characterization
Figure 10.15: SE image at high magnification of MoGRCF-3 plate (longitudinal cross
section) sintered at 2200oC with the 20%V of short fibers and the 20%V of long fibers.
The CF and the graphite matrix tend to sinter together encapsulating the finely dispersed
small Mo2C particles.
10.3.2 Liquid Phase MoGRCF
The next milestone in MoGRCF R&D is made by a combination of the two best results
of the first batch of plates, Plates N.3 and N.4: the idea is to take advantage of the fiber
blending used in Plate N.4-Bis and to replicate the fruitful local increase in temperature
observed in plate N.3. The obtained plate (id. Plate N.10) has a even more pronounced
difference between its central melted part and the not-melted periphery, as verified
with SEM analysis, electrical conductivity mapping and Local thermal conductivity
measurements presented in following Paragraphs. As already introduced in paragraph
5.1 the use of LPS will allow for a better space filling inside the material paying the
cost in a more pronounced non homogeneity of the produced plates. In addition, the
presence of molten carbides will allow for a higher mobility of graphite thus increasing
the graphite recrystallization (105).
• Composition of MoGRCF-10: 20%V 5 µmMo, 40%V 45 µmAsbury3260 graphite,,
151
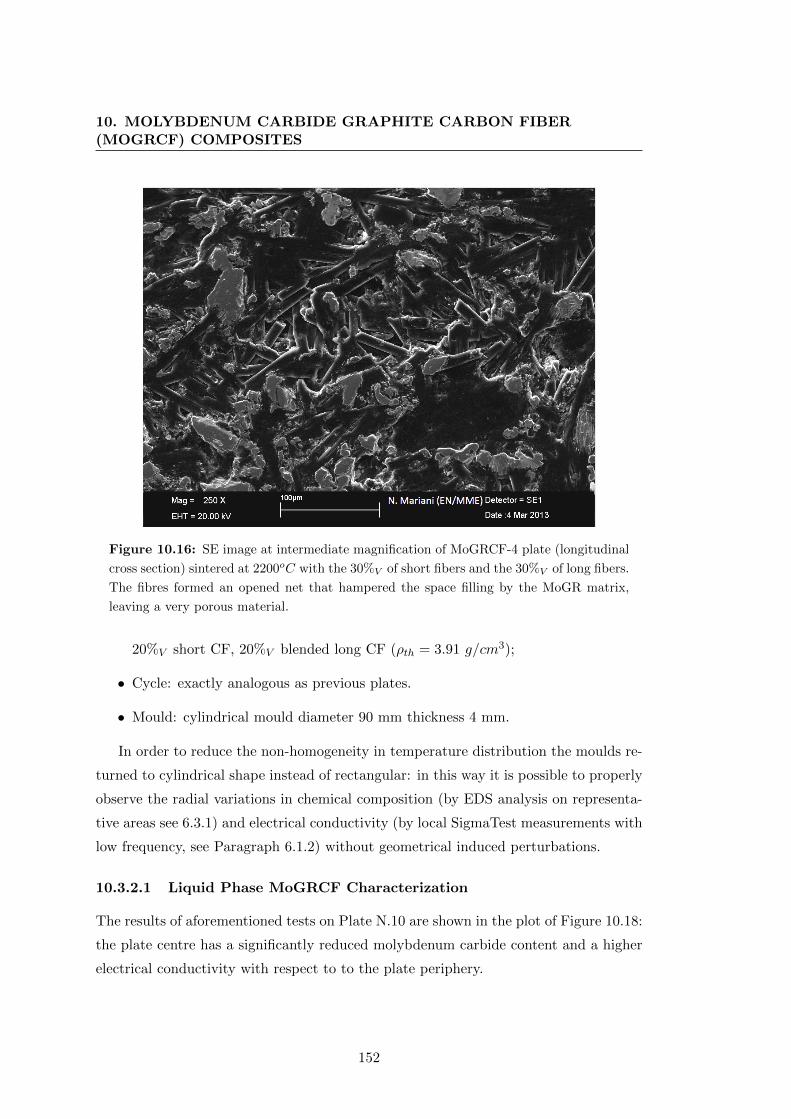
10. MOLYBDENUM CARBIDE GRAPHITE CARBON FIBER(MOGRCF) COMPOSITES
Figure 10.16: SE image at intermediate magnification of MoGRCF-4 plate (longitudinal
cross section) sintered at 2200oC with the 30%V of short fibers and the 30%V of long fibers.
The fibres formed an opened net that hampered the space filling by the MoGR matrix,
leaving a very porous material.
20%V short CF, 20%V blended long CF (ρth = 3.91 g/cm3);
• Cycle: exactly analogous as previous plates.
• Mould: cylindrical mould diameter 90 mm thickness 4 mm.
In order to reduce the non-homogeneity in temperature distribution the moulds re-
turned to cylindrical shape instead of rectangular: in this way it is possible to properly
observe the radial variations in chemical composition (by EDS analysis on representa-
tive areas see 6.3.1) and electrical conductivity (by local SigmaTest measurements with
low frequency, see Paragraph 6.1.2) without geometrical induced perturbations.
10.3.2.1 Liquid Phase MoGRCF Characterization
The results of aforementioned tests on Plate N.10 are shown in the plot of Figure 10.18:
the plate centre has a significantly reduced molybdenum carbide content and a higher
electrical conductivity with respect to to the plate periphery.
152

10.3 MoGRCF Production and Characterization
Figure 10.17: SE image at intermediate magnification of MoGRCF-4Bis plate (transver-
sal cross section) sintered at 2200oC with the 30%V of short fibers and the 30%V of blended
long fibers. The Mo2C phase is more regularly dispersed and have smaller dimensions than
in the other 4 plates.
In order to verify if the thermal properties follow the same behaviour (as expected
in graphitic materials because of the electron transfer only mechanisms already dis-
cussed) also the thermal conductivity has been evaluated both in the central part and
in the periphery. In order to do that the thermal test bench sample (80 mm long,
see Paragraph 6.5.1) has been instrumented at four different positions to divide the
thermal path in three zones along the sample, two peripheral and one central, and by
evaluating the thermal conductivity in each zone by 6.5.
The results are summarized in Table 10.3.
The plots in Figure 10.18 suggest that Mo squeezed in some way out from the plate
centre and accumulates at approximately 30 mm from the plate centre, this effect is
due to the local melting of the Mo2C phase during the process as shown in following
SEM analysis made in both locations (Figures 10.19, 10.20, 10.21 and 10.22).
153

10. MOLYBDENUM CARBIDE GRAPHITE CARBON FIBER(MOGRCF) COMPOSITES
Table 10.3: Comparison of Plate N.10 with plates N.3 and N.4Bis. * indicates the values
in the plate centre and in the plate periphery (always lower).
Plate Id. Short CF Long CF ρ σ k RFl
Unit %V %V [g/cm3] [MS/m] [W/mK] [MPa]
N.3 20 20 3.65 0.98-0.5* 315 53
N.4−Bis 30 30 Blended 3.73 0.42 205 77.5
N.10 30 30 Blended 3.69 1.03-0.5* 420-330* 74.5
Figure 10.18: Normalized chemical composition (by EDS) and electrical conductivity (by
Sigmatest) on Plate N.10 along radial direction.
154

10.3 MoGRCF Production and Characterization
Figure 10.19: SE image at low magnification of MoGRCF-10 plate (transversal cross
section) in the central area. The Mo2C phase forms a fine dispersion of homogeneously
distributed small grains embedded into the graphitic matrix. The local amount of Mo can
be estimated around the 55% of the peripheral concentration.
155

10. MOLYBDENUM CARBIDE GRAPHITE CARBON FIBER(MOGRCF) COMPOSITES
Figure 10.20: SE image at low magnification of MoGRCF-10 plate (transversal cross
section) in the peripheral area. The Mo2C phase remains solid giving a microstructure
very similar to previous plates with large coalesced Mo2C grains. There are also many
macro cavities that reduce the final density of the Plate.
156
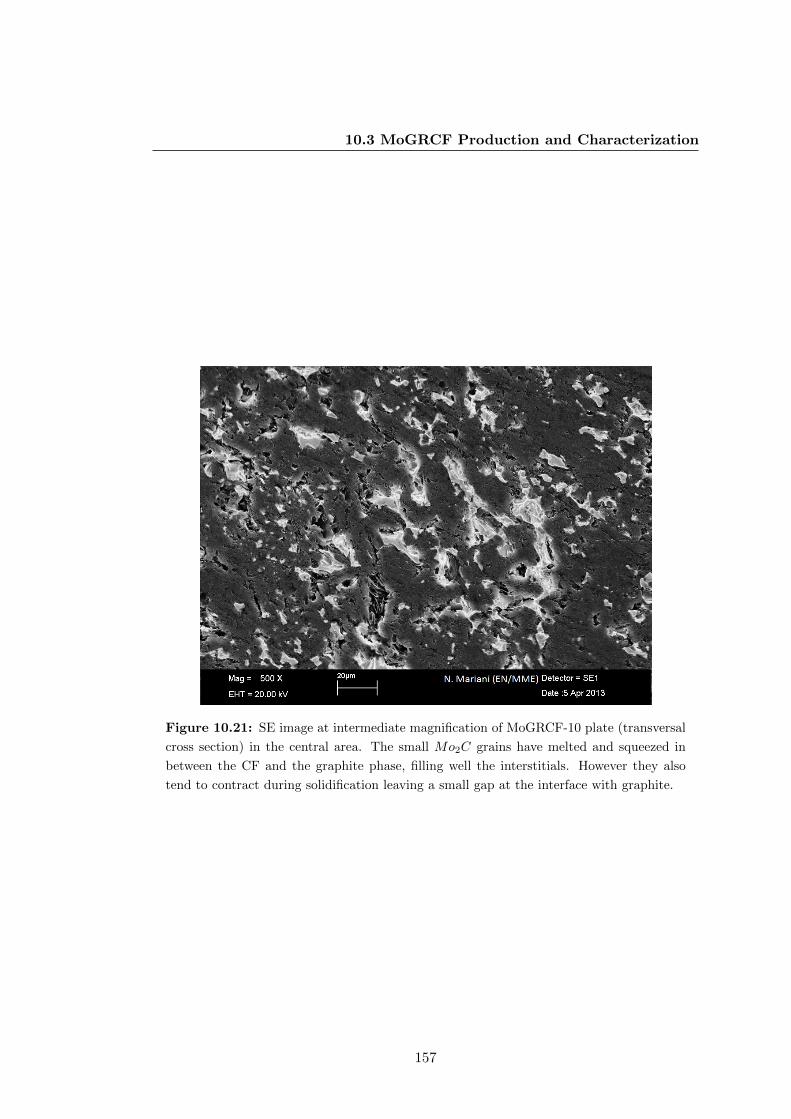
10.3 MoGRCF Production and Characterization
Figure 10.21: SE image at intermediate magnification of MoGRCF-10 plate (transversal
cross section) in the central area. The small Mo2C grains have melted and squeezed in
between the CF and the graphite phase, filling well the interstitials. However they also
tend to contract during solidification leaving a small gap at the interface with graphite.
157

10. MOLYBDENUM CARBIDE GRAPHITE CARBON FIBER(MOGRCF) COMPOSITES
Figure 10.22: SE image at intermediate magnification of MoGRCF-10 plate (transversal
cross section) in the peripheral area. The situation is analogous to previous non melted
plates (large Mo2C grains and macro cavities) with the difference of the local increase in
Mo content.
158

10.3 MoGRCF Production and Characterization
10.3.2.2 Conclusions on Liquid Phase MoGRCF
The results so far proved without doubt that the internal temperature distribution
was largely non homogeneous with a difference between the pyrometer measurement
(2200oC) and the effective temperature in the plate centre (>2505oC) that overcome
300oC. The origin of such very high gradient have been identified in the radial heat
transfer from the graphite mould external surface, that increases non-linearly with the
temperature becoming non negligible above 2000oC, as all other previous plates were
practically homogeneous. Another secondary effect is due to the powder electrical
conductivity during the sintering process that gives different heat generations profiles
for different compositions, as seen in the comparison between the first 5 plates (10.2).
Table 10.4: CERN Characterization of LPS MoGRCF. L indicates a measurement along
the longitudinal direction while T along the transversal one. Note: since Mo2C flown
out of the mould the final density cannot be compared to the predicted one and no com-
paction rate has been calculated. However the plate microstructures confirm visually a very
good compaction of the material.* indicates the values along the two principal directions,
longitudinal and transversal.
Plate Id. Short CF Long CF ρ σ k RFl
Unit %V %V [g/cm3] [MS/m] [W/mK] [MPa]
10/10 20 20 Blended 2,78 0.95-0.45* 720-380* 73
Once blocked the composition to the values identified for plate N.10, the furnace
have been equipped with an additional insulating sarcophagus in order to control the
radial heat losses without composition effects: the lower radial flux allowed to increase
the nominal temperature in the pyrometer measuring point up to 2560oC while mini-
mizing the radial temperature gradient and allowing the complete melting of Mo2C all
over the plate.
The resulting plate (id. Plate N.10/10) characterization results are reported in
Table 10.4: the final density is lower than the nominal value because there have been
an overflow of liquid Mo2C during the process due to the hydrostatic pressure of the
molten phase. The EDS estimation of the effective composition also confirms that
practically half of the total Mo content flow out of the material and remained attached
to the graphite moulds. The Mo2C content remains in forms of elongated small grains
that follow the shape of the CF and of the graphite grains (see Figure 10.24).
159

10. MOLYBDENUM CARBIDE GRAPHITE CARBON FIBER(MOGRCF) COMPOSITES
Figure 10.23: SE image at low magnification of MoGRCF-10/10 plate (transversal cross
section). General aspect of the material, similar to the microstructure in Figure 10.19.
The main difference is the presence of few macro cavities that were absent in the molten
area of plate N.10.
160

10.3 MoGRCF Production and Characterization
Figure 10.24: SE image at low magnification of MoGRCF-10/10 plate (transversal cross
section). Presence of few (and small) long fibers aggregates, macrocavities and molten
Mo2C grains.
161

10. MOLYBDENUM CARBIDE GRAPHITE CARBON FIBER(MOGRCF) COMPOSITES
Figure 10.25: QBSD image at intermediate magnification of MoGRCF-10/10 plate
(transversal cross section). The QBSD technique has been used to mark the slight dif-
ferences in graphite phase compaction: it allows to see the partial sintering of long fibers
inside the aggregate and to distinguish between graphite and CF inside the matrix (upper
area).
However, the plate is perfectly homogeneous in terms of microstructures, local EDS
composition and electrical conductivity so we can assume that the temperature gradient
has been minimized and has no longer visible effects on the material final homogeneity.
The most spectacular result is the obtained thermal conductivity of above 700
W/mK, value that has to be compared with the expected thermal conductivity eval-
uated by the Kapitza model as for MoGR (see 9.5.1) along the plate longitudinal
direction, which is ≈ 720W/mK (and ≈ 280W/mK in the transversal direction). It
means that MoGRCF − 10/10 plate shows an effective thermal conductivity which is
≈ 97% of the theoretical one, proving the effectiveness of the production process and
of the chosen composition.
There is still an uncertainty in the measurement made with CERN’s thermal test
bench due to the lack of suitable references for such very good conductors, but the
measurement has been repeated more times with different thermal probes giving re-
162
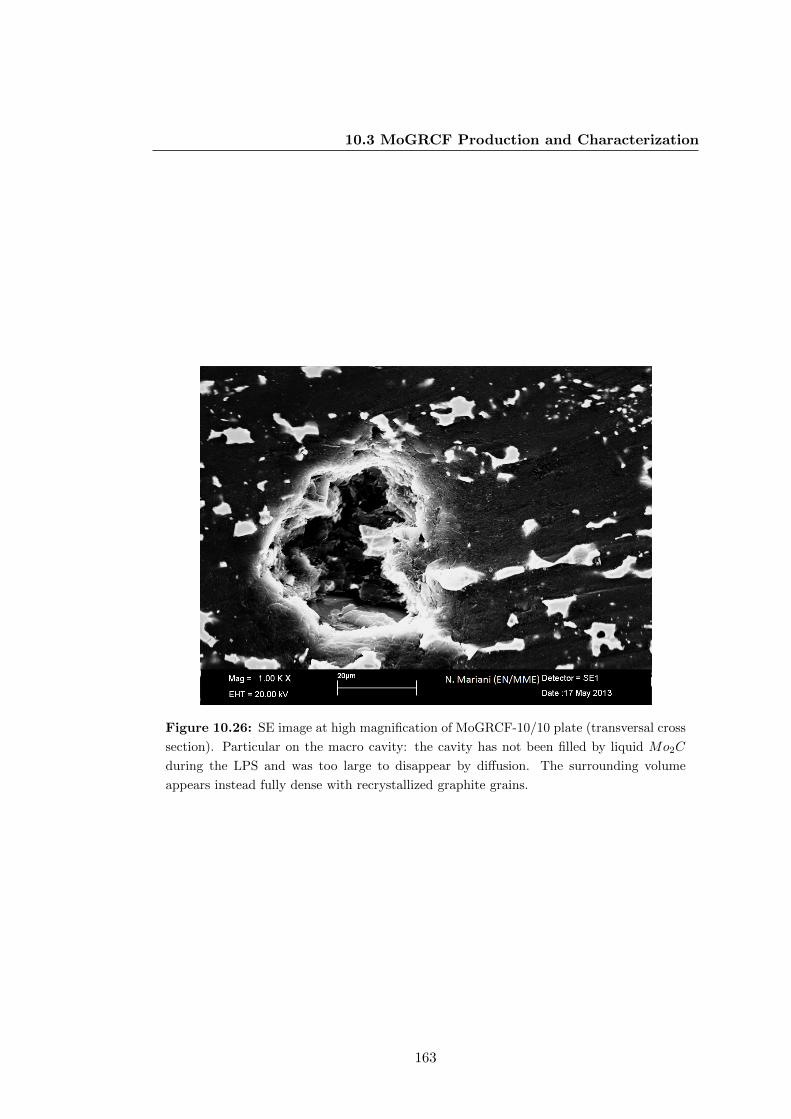
10.3 MoGRCF Production and Characterization
Figure 10.26: SE image at high magnification of MoGRCF-10/10 plate (transversal cross
section). Particular on the macro cavity: the cavity has not been filled by liquid Mo2C
during the LPS and was too large to disappear by diffusion. The surrounding volume
appears instead fully dense with recrystallized graphite grains.
163

10. MOLYBDENUM CARBIDE GRAPHITE CARBON FIBER(MOGRCF) COMPOSITES
producible results. A second source of error is the reduced temperature interval inside
the sample that reflects in higher dispersion of the final values. For all these reasons a
more precise laser flash measurement will be performed on the massive final plates to
validate the material thermal conductivity with standardized measurements.
10.4 Conclusions on MoGRCF
The R&D program on MoGRCF concluded with the identification of a suitable com-
position and production cycle to obtain a material having outstanding thermal and
physical properties. The material final properties are as usual compared with the other
materials of interest in Table 10.5 in order to appreciate the evolution of the FoM of the
materials developed during the present study. As made for CFC (see Paragraph 4.1.1
and 4.3) the value of k is a ROM average between the three directions, while the values
of CTE, Poisson’s ratio and ultimate strength have been obtained using the approach
described in Paragraph 9.5.1.
Table 10.5: Final properties and FoM for MoGRCF compared to MoCuCD, CuCD and
MoGR. Values with * are estimations based on the considerations reported in 9.5.1.
Material Unit CFC MoCuCD CuCD MoGR MoGRCF
Density [g/cm3] 1.65 6.9 5.4 5.3 2.78
Atomic Number (Z) [−] 6 17.4 11.4 15.9 13.7
Melting Temperature [oC] 3650 1083 1083 2505 2505
Thermal Conductivity [W/mK] 168 155 490 135 487
CTE [10−6K−1] 1.88 7 7.8 7.59* 2.61*
Specific Heat [J/kGK] 780 360 420 261.1* 568.5*
Young’s Modulus [GPa] 53 260 220 179.25* 51.76*
Tensile Strength [MPa] 87 140 70 95.7 50
Poisson’s Ratio [−] 0.16 0.3 0.22 0.19* 0.17*
Electrical Conductivity [MS/m] 0.14 10 12.6 1 1
Radiation Length χ0 [cm] 12.25 2.82 4.78 4.99 8.13
SSNI [kWm2/kg] 54.1 3.2 11.6 3.4 67.2
TSNI [kJ/kg] 570.8 19.4 13.4 14.9 174.3
The main advantages of the newly introduced MoGRCF materials are:
164

10.4 Conclusions on MoGRCF
• Exceptional thermal properties along the planar direction, resulting in an opti-
mal balance of stationary and transient thermal stability. Properties along the
transversal directions are anyway in the order of the 50% of the respective values
in longitudinal direction.
• Tailored density of 2.78 g/cm3 that lead to an intermediate radiation length
between CFC and CuCD, allowing for a smooth but effective beam cleaning.
• High stability at high temperature: MoGRCF is made only by very stable refrac-
tory phases (recrystallized graphite and Mo2C) that will not melt until 2500oC.
• Shock wave dumping: the low Young’s Modulus and the high graphite content
assure a good wave dumping effect that will allow for a smooth shock wave dis-
sipation.
• Electrically conductive in both directions, allowing a good charge evacuation and
reducing the overall Collimators Impedance.
The newly introduced composite is now being produced in thicker plates at Brevet-
tiBizz to verify the reproducibility of the results obtained on the thin test plates.
165

11
High Energy Beam Impacts on
Materials
The present Chapter includes the numerical simulations of direct high energy proton
beam impacts on materials and the experimental activities carried out to validate the
proposed models. The activities entailed the understanding of very fast dynamic phe-
nomena, the development of experimental apparatus for the data acquisition and the
results analysis.
The chapter is therefore so structured:
• Numerical modelling of thermally induced dynamic phenomena
• Description of experimental activities inside the HiRadMat facility at CERN
• Experimental results
• Discussion on the post irradiation damage on all tested materials
11.1 Introduction to Thermally Induced Dynamic Phe-
nomena
As stated in Paragraph 3.3 it is paramount to assess the responses to potentially de-
structive events such as highly energetic proton beam impacts on the materials presently
used, or being developed for future use, in LHC Collimators (and of course in other
BID devices like targets, dumps, absorbers, spoilers, windows etc.).
166

11.2 Numerical Modelling
The approach followed to study the problem is to first derive numerical methods
capable to predict the entire dynamic phenomena generated in matter when it is im-
pacted by beams made of highly energetic particles (phase transitions, density changes,
generation and propagation of shock waves, explosions and fragment projections) and
then verify the proposed numerical methods with an ad hoc experiment (id. HRMT-14)
carried out inside the HiRadMat facility at CERN during 2012 (106), (107).
11.1.1 Shock waves
The rapid interaction of highly energetic particle beams with matter induces a dynamic
responses in the impacted structure which nature, intensity and time scale depend on
several parameters, mainly deposited energy and energy density, interaction duration,
physical and mechanical properties of the impacted material. The phenomena is gov-
erned by the blocked thermal expansion of the impacted material’s core by the cold
surrounding material that provokes a pressure spike with the formation of travelling
stress waves inside the material (108), (22). When the deposited energy density is high
enough to provoke strains and stresses overcoming the critical threshold for the specific
material, a shock wave is formed propagating at a velocity higher than C0 (sound speed
in standard condition), potentially leading to severe damages in the affected compo-
nent. A shock wave can also be reflected at the free surfaces or at the interfaces with
other components, leading to the shock wave propagation or reflection. In the second
case the wave will pass from compressive to tensile and can lead to failures due to
hydrostatic spallation.
11.2 Numerical Modelling
When dealing with changes of phase and significant changes of density, one has to resort
to a new class of wave propagation codes, known as hydrocodes. These are highly non-
linear finite element tools, using explicit time integration schemes, developed to study
very fast and intense loadings on materials and structures (109). Hydrocodes take their
name from the original assumption of pure fluid-like behaviour of the impacted solids,
which is typically acceptable when achieved stresses greatly exceed the flow strength of
the material and the stress tensor can be reduced to its hydrostatic component only;
167

11. HIGH ENERGY BEAM IMPACTS ON MATERIALS
nowadays the deviatoric behaviour (responsible for material strength) is also taken into
account; however the original name is still widely used.
Hydrocodes usually rely on complex material constitutive models encompassing a
very large range of densities and temperatures, which, unlike implicit FEM codes, may
include large changes of density and phase transitions. Strength and failure models are
also more complicated as they have to account for the effects of strain rate, temperature,
changes of density etc as shown in following Paragraphs.
11.2.1 Importation of Energy Deposition maps
The input for numerical simulations is the map of the thermal load generated by the
beam impact on the component. The deposited energy can be calculated through a
Monte-Carlo particle transport code and depends proportionally to the density and the
atomic number of the impacted material as already discussed in Paragraph 3.3.3: the
higher the density, the higher the stopping power of the target and the energy deposited
by the beam. Simulations described in this paper are performed with Autodyn (110),
while energy deposition 3D maps are calculated with FLUKA (111) (112).
FLUKA raw output is a tabular 3D map of the internal energy density as a function
of the number of incoming particles p (unit [GeV/p ∗ cm3]): since Autodyn requires
values in [J/Kg] it is necessary to scale the FLUKA results by the chosen number of
incoming protons and by the density of each element. In addition the FLUKA elements
are usually not coincident with the Autodyn elements so the FLUKA map has to be
applied to the mesh of Autodyn by apposite algorithms of mesh interpolation.
The conversion is made by a Fortran subroutine integrated in Autodyn, which
has been developed at CERN in past years to conveniently import FLUKA maps in
hydrocodes (113) for studying beam impacts on Uranium targets; the subroutine can
deposit the energy both continuously during all the impact or divided into bunches with
imposed bunch spacing. It is worth noting that in this case the time step has to be
kept smaller than the bunch duration to appreciate the effect of the stepped deposition
leading to very long calculation times. The assigned internal energy is then treated by
Autodyn as explained in following Paragraphs.
168

11.2 Numerical Modelling
11.2.2 Constitutive Models
11.2.3 Equations of state
The Equation Of State (EOS) is a constitutive relation between the state variables of a
material; usually it expresses the pressure (or the internal energy) as a function of two
independent variables such as density and temperature. Most widely adopted EOS for
wave propagation in solids are Shock, Tillotson (114) and MieGrneisen: these formula-
tions involve complex theoretical models based on the band theory and combine them
with shock compression experimental data. However, analytical modelling can describe
only a single region of the EOS (115), excluding the description of phase transitions.
Tabular EOS overcome this problem, integrating different analytical formulations to
describe the behaviour of different phases and the related phase transitions (116).
The EOS used in this work is the tabular SESAME N.3550 (117) shown in Figures
11.1 and 11.2 (in two distinct Matlab plots for pressure and internal energy); it has
been devised for pure tungsten, for which experimental Hugoniot data are close to those
of W-Ni-Cu heavy alloys (118).
Figure 11.1: Equation of State SESAME 3550 for pure tungsten: plot of Pressure as a
function of density and temperature.
11.2.3.1 Strength Model
The strength model simulates the deviatoric behaviour of the material and has to take
into account the phenomena occurring in the matter during the beam impact, such as
169

11. HIGH ENERGY BEAM IMPACTS ON MATERIALS
Figure 11.2: Equation of State SESAME 3550 for pure tungsten: plot of internal energy
as a function of density and temperature.
the melting of the impacted volume (loss of material strength), the variations in elastic
and plastic behaviour in the thermally altered zone and the hardening due to high
strain rates in order to evaluate the propagation speed, the intensity and the damping
during the travel inside the sample and obtain the wave intensity on the free surface. A
widely adopted model that considers the above mentioned effects is the Johnson-Cook
(JC) model (119), whose parameters can be obtained through a set of experimental
tests, which include Hopkinson Bars, Taylor cylinders, tensile and compression tests at
different temperatures. The JC model expresses the flow stress as:
σy = (A+Bεnpl) +
(1 + C ∗ ln
˙εplε̇0
)∗(
1−(T − TmTm − Tr
))(11.1)
where A is the J-C elastic limit [MPa], B [MPa] and n [−] are the work hardening
parameters, C [MPa] express the strain-rate sensitivity and m [−] describes the thermal
softening with respect to the reference temperature Tr [K].
The Inermet180 parameters used for hydrodynamic simulations are reported in
Table 11.1; such values are based on the experimental results on W-Fe-Ni alloys and
were slightly modified to fit Inermet180 mechanical properties.
The JC Model is not suitable for the composite materials of interest because of their
intrinsic fragility discussed in Paragraph 5.3.2: the statistical distribution of defects
can be taken into account only relying on statistical empirical models like the Johnson-
Holmquist model (120). The main disadvantage with respect to semi analytical models
170

11.2 Numerical Modelling
Table 11.1: Johnson Cook Model parameters used for Inermet180 simulations.
Equation of State Strength Model Failure Model
Tabular Johnson Cook Hydrostatic Minimum Pressure
SESAME 3550 Shear Modulus 140GPa Pmin 2.7GPa
A 715MPa Fracture Energy 515J/m2
B 177MPa
n 0.12
C 0.016
m 1.00
Tm 1616 K
Ref. Strain rate 1s−1
like JC is that a large number of experimental tests is required to obtain reliable
parameters, and it has not been possible to prepare suitable models for the 3 studied
composites.
11.2.3.2 Failure model
This model contains the set of conditions which lead to the bulk failure of the material;
its choice heavily depends on the physical fracture mechanism. In case of particle beams
impacting close to a free surface, the compressive shockwave immediately reflects back
and turns into a tensile wave in the adjacent volume, causing the bulk failure of external
crust and the projection of melted material (121). This mechanism could be reproduced
in Autodyn through the Minimum Hydrostatic Pressure model (Pmin); the model also
implements the energy necessary for crack formation, calculated on the basis of the
material fracture toughness. Reference values have been obtained experimentally with
laser-induced spallation tests on polycrystalline tungsten (122).
11.2.4 Numerical Methods
11.2.4.1 Lagrangian method
Impacted components can often be modeled with a lagrangian mesh: even when high
deformations or material spallation occur, it is possible to overcome the limitations
of the lagrangian method by, for example, implementing the erosion of elements at
171

11. HIGH ENERGY BEAM IMPACTS ON MATERIALS
given thresholds of stress, temperature or deformation. This approach was therefore
adopted to simulate the response of type 1 samples impacted at medium energy during
the test in the HiRadMat facility. When importing the thermal load in Autodyn, a
subroutine interpolates the energy deposition map calculated by FLUKA and assigns
the corresponding energy density to the Autodyn elements: ideally, no interpolation
artifacts are generated throughout the process if the two meshes are identical. On the
other hand, in order to decrease the simulation time, the mesh in Autodyn is often
coarser and is refined only around the impact point, i.e. in the volume containing
the most loaded elements. The impinging proton pulse is constituted by trains of
bunches spaced by 25 ns, while the impact duration of each bunch is 1 ns. The energy
distribution deposited by one bunch, calculated with FLUKA, is therefore uploaded in
Autodyn every 25 ns: this means that the time step of the simulation should be lower
than 1 ns in order to correctly reproduce the impact phenomenon. The time step can
be increased after the end of the beam impact up to 10 ns for numerical stability.
11.2.4.2 Smoothed-particle hydrodynamics
The above mentioned lagrangian method is no longer adequate when the main goal
of the study is to model the material fragments ejected after high-energy impacts and
the residual damage on structures and components. In such case, one has to adopt a
different approach, such as the smoothed-particle hydrodynamics (SPH) technique. In
this computational method, the material is modelled by discrete elements (particles)
with a spatial distance of interaction (smoothing length) over which their properties
are weighted by a kernel function. This method was used for the simulation of high
energy deposition on HiRadMat type 2 samples which will be object of the present
thesis work; since the SPH algorithm requires high computational time, only the inner
volume of the specimen was modelled with SPH particles, while all the other regions
were meshed with lagrangian elements to save computational time.
11.3 Experimental Activity
The performed tests entailed the controlled impact of intense proton pulses on speci-
mens made of seven materials of interest for LHC Collimators already discussed in the
present thesis work and reported below:
172

11.3 Experimental Activity
• Metallic materials
– Inermet180 Tungsten Heavy Alloy (see Paragraph 4.1.3)
– Molybdenum (see Paragraph 4.1.5)
– Glidcop (see Paragraph 4.1.4
• Composites
– CuCD (see Paragraph 7)
– MoCuCD (see Paragraph 8)
– MoGR and MoGRCF (see Paragraphs 9 and 10)
Two different specimen shapes were chosen for each material (Figure 11.3):
• Cylindrical disks (type 1) for medium intensity tests, to measure axially symmet-
ric shockwaves;
• Cylinders with a half-moon cross section (type 2) for high intensity tests, allowing
extreme surface phenomena (melting, material explosion, debris projections etc.)
to be visualized and optically acquired.
The specimens were arranged into the sample holder tank maintained under vacuum
shown in Figure 11.4, (106).
Figure 11.3: Material specimen shapes for tests at medium and high intensity.
The effects of thermally induced shock waves on the materials were acquired via high
speed acquisition system including strain gauges, laser Doppler vibrometer and high
speed camera. Information of beam induced damages on materials were also collected
by the observation through a lateral view port.
173

11. HIGH ENERGY BEAM IMPACTS ON MATERIALS
Figure 11.4: General assembly of the HRMT14 test-bench. Red arrow represents the
beam.
The results have then been compared to the numerical analysis, when available:
in fact, the material models which are required to perform the numerical simulations,
at the extreme conditions, as to temperature, pressure and density, induced by such
impacts, are hardly available in scientific literature; besides, most of the existing infor-
mation is often classified as it is drawn from military research mainly related to nuclear
weaponry. Finally, very little data can be found for advanced ceramics and compounds,
in particular the lack of materials constitutive models for Mo, Mo2C, graphite and di-
amond hamper the realization of numerical simulations on such materials.
However, the post irradiation analysis presented in Paragraph 11.4 of impacted
samples offers the opportunity to compare the strength of the different materials in
view of the materials choice for future LHC Collimators.
Table 11.2 reports the characteristic values of the impacting beam during tests
on Inermet180 in the HiRadMat facility. Numerical simulations adopted the same
parameters, except for the beam transverse dimension which was set to 2.5 x 2.5 mm2.
174

11.3 Experimental Activity
Table 11.2: Beam parameters for tests performed on Inermet180 during HRMT-14 ex-
periment.
Parameter Medium intensity test High intensity test
Proton energy 440GeV 440GeV
Number of bunches 24 72
Pulse intensity 2.7 ∗ 1012 protons 9.05x10¹² protons
Energy on the most loaded specimen 8.35kJ 25.1kJ
Theoretical impact point Centre 2 mm from flat surface
Beam transverse dimension 1.4 x 2mm2 1.9 x 1.9mm2
11.3.1 Medium intensity impacts
Strain gauges measured axial and hoop strains on the external surface of type 1 sam-
ples, while the laser Doppler vibrometer acquired the radial velocity. Acquired raw
data were then compared to the results of numerical simulations (Figure 11.5). A
strong electromagnetic noise induced by the particle beam perturbed the strain gauge
measurements during the first few microseconds after the impact, concealing the first
deformation peak. However, this effect was limited to the beam impact duration, allow-
ing to capture the remainder of the phenomenon. Measured and simulated signals are
in good accordance during the first three reflections of the shock wave; afterwards, the
modifications in the material bulk induced by the shock wave lead to an overestimation
of the wave speed. Random spikes in the signal of gauges and LDV will be treated
during more accurate signal processing.
Figure 11.5: Left: Axial strain measured with strain gauge at r = 20 mm, L = 15 mm
and numerically simulated. Right: Radial velocity measured with LDV at r = 20 mm, L
= 15 mm and numerically simulated.
175

11. HIGH ENERGY BEAM IMPACTS ON MATERIALS
11.3.2 High intensity impacts
The developed high-speed camera system allowed for the first time, to the best of
authors knowledge, to record images of the impact of a proton beam on solid targets
and of the effects induced.
Figure 11.6: High-speed video camera images of the ejected particle cloud: the beam is
coming from the left while the cloud is moving downwards; three Inermet180 samples are
partially visible (numbered 1 to 3).
As shown in Figure 11.6, a large quantity of hot material was ejected at high
velocity from the two most loaded Inermet180 type 2 samples, generating the large
cavities shown in the post irradiation analysis. Concerning the SPH simulation results,
ejected material front shape and calculated absolute velocity (ABS VEL in Figure
11.7) are both consistent with the high-speed camera measurements,even considering
the differences in beam size between real and simulated scenarios. The velocity of
the fragment front has been estimated by measuring the displacement between two
successive frames and is about 275m/s, well matching the calculated velocity of 316m/s
(difference is about 15%).
11.3.3 Post Irradiation Damage
The prediction of the post irradiation damage based on hydrodynamic simulations
cannot rely only on the simple erosion of failed elements, since the entire phenomena
of material ejection and hole formation lasts several milliseconds that are (with actual
algorithms and computers) impossible to simulate in a reasonable amount of time. In
addition the hydrodynamic code cannot take into account the solidification of molten
elements (once the SPH correlation is broken the code cannot re create the bonding).
176
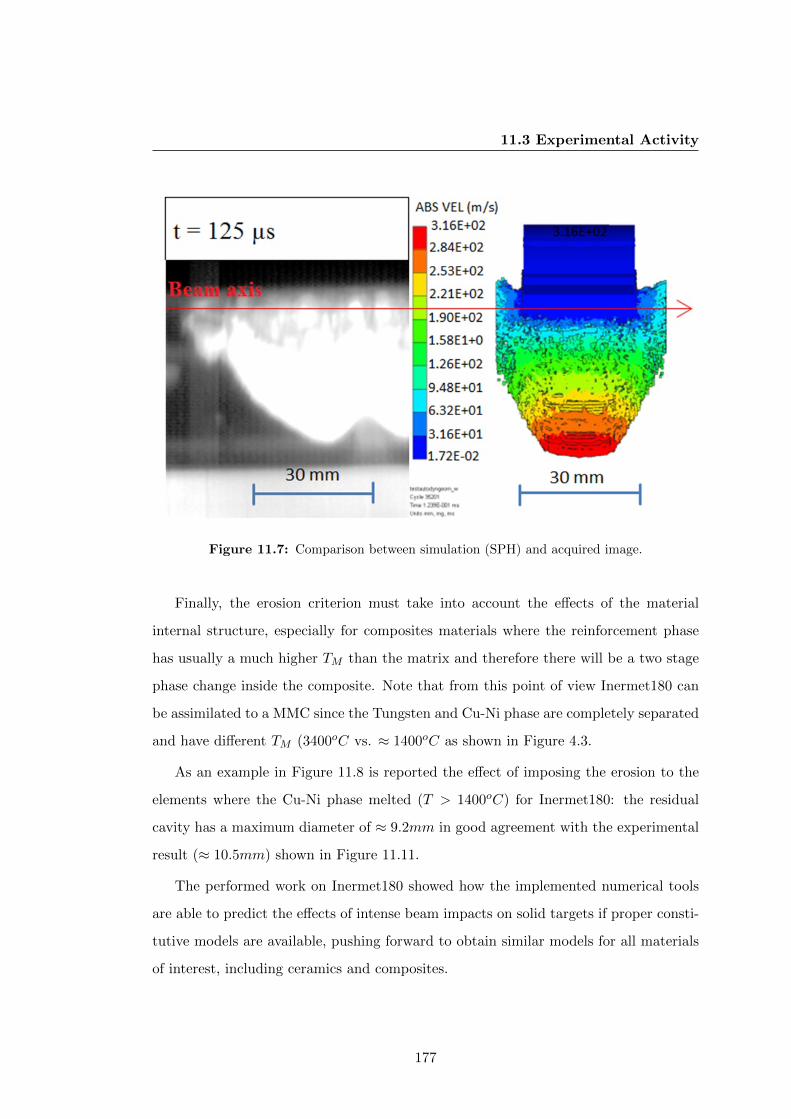
11.3 Experimental Activity
Figure 11.7: Comparison between simulation (SPH) and acquired image.
Finally, the erosion criterion must take into account the effects of the material
internal structure, especially for composites materials where the reinforcement phase
has usually a much higher TM than the matrix and therefore there will be a two stage
phase change inside the composite. Note that from this point of view Inermet180 can
be assimilated to a MMC since the Tungsten and Cu-Ni phase are completely separated
and have different TM (3400oC vs. ≈ 1400oC as shown in Figure 4.3.
As an example in Figure 11.8 is reported the effect of imposing the erosion to the
elements where the Cu-Ni phase melted (T > 1400oC) for Inermet180: the residual
cavity has a maximum diameter of ≈ 9.2mm in good agreement with the experimental
result (≈ 10.5mm) shown in Figure 11.11.
The performed work on Inermet180 showed how the implemented numerical tools
are able to predict the effects of intense beam impacts on solid targets if proper consti-
tutive models are available, pushing forward to obtain similar models for all materials
of interest, including ceramics and composites.
177

11. HIGH ENERGY BEAM IMPACTS ON MATERIALS
Figure 11.8: Autodyn simulation of the High Intensity beam impact on Inermet180:
residual damage estimation by imposing the erosion criterion.
11.4 Post Impact Residual Damage
11.4.1 Energy Deposition on Materials
The energy deposition maps of all the HRMT-14 impacts have been recently updated
by A. Manousos and V. Vlachoudis (123): the calculations are based on the method
described in 11.2.1 and have been performed taking into account the effective beam
sizes and final intensities had during the experiment.
The final sample disposition for the High intensity shot is reported in Figure 11.9:
the total number of samples have been priorly evaluated to completely stop the incoming
beam, at least for denser metals.
The last array for MoGR and MoGRCF consists in a mix of three different grades
available in 2012: all materials have sintered in solid state, the references are listed
below.
• MoGR − 24C, Sintered at 1700oC, Density 5.4 g/cm3, see Paragraph 9.5 for
properties;
178

11.4 Post Impact Residual Damage
Figure 11.9: High Intensity shots samples location for all the different materials.
• MoGRCF − 3 and MoGRCF − 4Bis, Sintered at 2200oC, Density ≈ 3.8 g/cm3,
see Paragraph 10.3.1 for properties.
The summary of the High Intensity shots for all materials is reported in Table 11.3:
the centred shots consists in 72 bunches of ≈ 1.15 ∗ 1011 protons for metals and of
144 bunches at the same Intensity for composites. At the end of all foreseen tests due
to absence of visible damage on Mo a second High Intensity shot (H5 o) have been
performed with a vertical offset of 10 mm and double the intensity, allowing to produce
extended damage on Mo samples too.
In the following sections the Post Impact Damage for each shot will be presented
and discussed in separate Paragraphs.
11.4.2 Inermet180
The final aspect of the Inemert180 sample array after the H6 shot is reported in Figure
11.11: the exposed fracture surface appears nubby and there are no signs of plastic
deformation, indicating a brittle failure with projection of independent small particles;
the particles can also be seen on the white plate on the bottom of Figure 11.11. There
is also a slightly visible sign of external colour variation in the Zone Thermally Altered
(ZTA) due to the superficial oxidation at high temperature. This confirms the presence
of some oxygen in the tank due to the low vacuum level.
179

11. HIGH ENERGY BEAM IMPACTS ON MATERIALS
Table 11.3: Summary of the High Intensity shots parameters. Each shot is identified
by H + material number + impact location (c, center or o, offset 10mm), for each shot
its reported the total number of impacting bunches (impacting in the same location and
spaced in time by 25 ns), the total number of impacting protons (Total intensity), the
maximum Energy Density Peak and the Total Energy deposited along the entire raw.
Shot Id. Material Bunch N. Tot. Int. Max En. Dens. Tot. En.
N. of Bunch N. of p+ [KJ/cm3/pulse] [KJ/pulse]
H1 c MoGRCF 144 1.95 ∗ 1013 5.1 10
H2 c CuCD 144 1.95 ∗ 1013 4.9 9.9
H3 c MoCuCD 144 1.96 ∗ 1013 8 15.5
H4 c Glidcop 72 8.71 ∗ 1012 7 9.5
H4 o Glidcop 72 8.71 ∗ 1012 7 9.5
H5 c Mo 72 9.05 ∗ 1012 8 11.8
H6 c In.180 72 9.05 ∗ 1012 17.5 25.2
H5 o Mo 144 1.95 ∗ 1013 26 24.2
Figure 11.10: Energy Deposition profile for all the HRMT-14 materials arrays. Values
have been normalized to the entire pulse (of 72 or 144 bunches). Note that the MoGRCF
Array is composed by three different grades as reported in Figure 11.9.
180

11.4 Post Impact Residual Damage
This interpretation is consistent with the discussion reported in previous Paragraph
11.3.3 about the failure model imposed to Inermet180: the fracture appears when the
Cu-Ni matrix (that embeds the W particles as shown in Figure 4.2) melts leaving the
W grains practically free to move under the pressure gradient generated during the
Beam Impact.
Figure 11.11: Inermet180 H6 c impact damage observation from lateral view port.
Comparing the energy density profile of Figure 11.10 with the damage extent in
Figure 11.11 it is also possible to roughly estimate the energy density threshold that
starts the material ejection as the energy density corresponding to the position of the
failure start (en. density threshold ≈ 10KJ/cm3/pulse).
11.4.3 Molybdenum
As already anticipated the first shot at High Intensity (H5 c, 72 bunches in the centre
of the samples) on Mo did not provoke the material failure: a deeper analysis however
indicates the formation of a longitudinal crack in sample Pos. 6, that is not completely
understood due to the lower values of deposited energy density in the cracked sample
181

11. HIGH ENERGY BEAM IMPACTS ON MATERIALS
with respect to the following ones (energy density in sample pos.6 ≈ 5KJ/cm3/pulse,
in sample pos. 7 ≈ 8KJ/cm3/pulse).
Figure 11.12: Molybdenum H5 c (top) and H5 o (bottom) impacts damage observation
from lateral view port.
The second shot (H5 o, 144 bunches impacting 10 mm below the centre of the
samples) on the other hand was able to provoke extended damage on the material
with projection of big, hot fragments of Mo: the aspect of the failure is also completely
different from the previous one on inermet180 due to the presence of conspicuous plastic
deformation of Mo samples external solid crust. in addition there is the formation of a
crack following the upper part of the ZTA.
The energy density threshold in this case can be identified in ≈ 13KJ/cm3/pulse,
≈ 30% higher than in Inermet180.
This difference can be explained by comparing few features of Mo and Inermet180:
• the absence of low melting phases in Mo increases the energy density threshold
the material can withstand before failure (more energy is needed to provoke phase
variation in the material);
182

11.4 Post Impact Residual Damage
• the superior plasticity of Mo allows for a higher energy consumption during the
failure propagation (the energy absorbed during the deformation is the integral
all over the plastic deformation) that results in lower final internal pressure.
11.4.4 Glidcop
Glidcop exhibits a completely different behaviour with respect to Mo and Inmermet180:
looking at the post impact damage in Figure 11.13 we can see the longitudinal plastic
deformation leaved by the samples expansion during the impact and a slight colour
variation in the ZTA, but there is no cavity formed as in previous cases.
Figure 11.13: Glidcop H4 c (top) and H4 o (bottom) impact damage observation from
lateral view port.
This situation is due to the the melting of only an internal cylindrical portion of the
Glidcop samples taking place all over the sample length: the internal pressure provokes
the flow out of melted material from the lateral surfaces of the samples instead of the
front surface like in Inermet180 or Mo.
This effect has been verified by the video camera observations made during the two
impacts: due to the the low quality of the pictures they will not be reported here,
183

11. HIGH ENERGY BEAM IMPACTS ON MATERIALS
however the moving fragments were visible and followed a 45o trajectory with respect
to the samples axis.
In this way the internal pressure is evacuated by the ejection of the liquid Cu from
the sides and is no more able to provoke a radial crater, but is leaving instead a slightly
deformed surface.
For Glidcop the energy density threshold has been evaluated considering the po-
sition of the first visible plastic deformation, giving ≈ 4KJ/cm3/pulse; the value is
considerably lower than in Inermet180 but it corresponds to a less catastrophic dam-
age extension.
For that reason it might be possible (in the case of impacts depositing a similar
Energy Density) to take advantage of the LHC Collimators jaw vertical movement
capability (thanks to the so-called 5th axis) to expose to the beam a fresh portion of
the jaw surface after the first impact without replacing the collimator.
11.4.5 MoCuCD
MoCuCD exhibits a failure very similar to the Inermet180, like shown in Figure 11.14,
with an estimated energy density threshold of ≈ 7 KJ/cm3/pulse.
As in Inermet180 the fracture appears nubby and without plastic deformation or
colour variations and is made by the detachment of solid, hard particles from the
material bulk. In the case of MoCuCD the diamond and Mo phases remain solid
while Cu melts (see microstructures in Figure 8.15 and 8.18), breaking the bounds
between adjacent Mo particles and diamonds (made by brittle Mo2C interlayer) that
are afterwards free to move and being ejected by the action of the internal pressure.
On top of that, MoCuCD’s density and especially the atomic number are signifi-
cantly higher than the other composites leading to higher stopping power and sharp
energy deposition profiles (lower radiation length), but without a proportional increase
in the melting temperature and in the TSNI parameter, as shown in table 10.5.
11.4.6 CuCD
CuCD survived to the High Intensity beam impact without any visible plastic defor-
mation or damage, as shown in Figure 11.15.
The only external sign of the beam passage is the oxidation around the ZTA that
follows very well the energy deposition profile calculated by FLUKA. However, the
184

11.4 Post Impact Residual Damage
Figure 11.14: MoCuCD H3 c impact damage observation from lateral view port.
Figure 11.15: CuCD H2 c impact damage observation from lateral view port.
185

11. HIGH ENERGY BEAM IMPACTS ON MATERIALS
material internal structure must have been damaged by the shock wave passage reducing
the optimal heat transfer of the material, further microstructural analysis of impacted
samples will help to verify the presence of internal micro-cracks and/or detachments of
the Copper matrix.
In that case the maximum Energy Density deposited on the most loaded sample
was ≈ 5KJ/cm3/pulse and was not able to provoke damage, therefore the threshold
energy density can be defined as > 5KJ/cm3/pulse.
11.4.7 MoGRCF and MoGR
In the array of MoGR and MoGRCF the energy density profile is non regular due to the
disposition of heavy MoGR and light MoGRCF samples along the array, as reported in
Figure 11.10 and Figure 11.9. In particular there is a first slight increase for the first
4 MoGRCF samples (approximately half of the energy density deposited in CuCD),
followed by the rapid increase during the passage across the first two heavy MoGR
samples. Afterwards the energy density reduces significantly in the following two light
MoGRCF samples (here the energy is mainly due to secondaries shower) and increases
back for the last two heavy MoGR samples.
This situation lead to an energy density peak in MoGR and MoGRCF of≈ 5.1KJ/cm3/pulse(Pos.
10) and ≈ 2 KJ/cm3/pulse (Pos. 7) respectively.
Concerning the damage on MoGR (see Figure 11.16) the sample in Pos. 6 does
not show any damage or colour variation, while in Pos. 9 there is a longitudinal crack
like in Molybdenum sample (Figure 11.12 and finally the sample in Pos. 10 exploded
leaving the usual nubby crater. For MoGR the threshold can be considered around
≈ 4− 4.5 KJ/cm3/pulse.
Finally, MoGRCF did not show any visible sign of deformation or colour variation
after the energy deposition, but it must be kept in mind that the maximum energy
density deposited on MoGRCF is significantly lower than any other tested material
thanks to the very low density of such material.
For that reason MoGRCF can be considered more similar to CFC than to CuCD or
MoGR: it has a very good TSNI but at the same time more beam-jaw interaction (i.e.
increase jaw length or total collimator number) is required to obtain the same cleaning
efficiency.
186

11.4 Post Impact Residual Damage
Figure 11.16: MoGR H1 c impact damage observation from lateral view port.
Figure 11.17: MoGRCF H1 c Impact Damage Observation from lateral view port.
187

11. HIGH ENERGY BEAM IMPACTS ON MATERIALS
11.5 Conclusions on Beam Impact Resistance of Collima-
tor Materials
The robustness of LHC Collimators materials has been studied, by analytical and nu-
merical means, and experimentally verified participating to a complex and comprehen-
sive experiment that has been carried out at CERN during 2012.
The experiment aimed at the characterization, mostly in real time, of six different
materials of interest, including three new composites developed during the present
thesis work, impacted by 440 GeV intense proton pulses.
The design of the test set-up required innovative solutions in terms of lighting, sup-
port stabilization, radiation resistance and noise control. The test was a success under
any point of view: all experiment systems (DAQ, electronics, and mechanics) worked
properly in spite of the very harsh environment and of the technological challenges
allowing the collection of valuable data.
The high-speed camera and flash systems then allowed for the first time to the best
of authors knowledge to record images of the impact of a hadron beam on solid targets
and of the effects this induced on materials. Preliminary measurements on Glidcop
and Inermet180 specimens very well match results of advanced numerical simulations
proposed in this Chapter, confirming the reliability of the simulation methods and
supplying promising indications on the validity of constitutive models used for these
materials.
A very large amount of data is still to be treated to help deriving constitutive models
for the less known materials, namely for the novel composite material which were tested
for the first time during the experiment. The provided preliminary post impact damage
evaluations will be completed by the final campaign, implying the dismantling of the
Materials Sample Holder and the destructive testing of irradiated samples. For obvious
safety reasons the tank opening must be performed inside a special Class C laboratory
that has still to be identified.
Finally, the experimental results allowed to compare in an ordered way the different
materials of interest giving a more detailed view of the final behaviour inside the LHC
accelerator.
188

12
Conclusions
This Chapter collects the most important scientific contributions and results obtained
during the PhD and summarizes the conclusions of this work.
12.1 Research Context
Recent advances in high-energy particle physics require particle accelerators to reach
unprecedented energies. In particular, the Large Hadron Collider (LHC) at the Euro-
pean Organization for Nuclear Research (CERN, Meyrin, CH) stands out for its incred-
ible quantity of energy stored inside the beams, which allows to explore a completely
new field of High Energy Physics (HEP): however, a tiny fraction of this potentially
destructive energy is sufficient to cause catastrophic damages to sensitive components
and materials leading to machine stop, with high costs in terms of time and resources
(see Chapter 3). Therefore, the study of new advanced materials for Beam Intercept-
ing Devices (BID) is having strong interest in the particle accelerator community. The
study of available solutions, reported in Chapter 4, pointed out that conventional mate-
rials do not fulfil the two main requirements of LHC Collimators: reliable and efficient
beam cleaning as well as high robustness in accidental scenarios.
This thesis aimed to fill the technological gap developing novel advanced composites
for BID.
The most important result is a novel composite (MoGRCF) having exceptional
thermal and physical properties combined with suitable mechanical strength. This
189

12. CONCLUSIONS
novel material is very appealing in view of Hi-Lumi LHC Collimators as well as future
challenging BID.
12.2 Scientific Contributions and Results
This section collects a brief summary of the most important results achieved during the
PhD. The first part includes the materials developed as well as the principal innovations
proposed in the composites production, while the second part regards the evaluation
of the beam impact resistance of BID materials.
• Molybdenum - Copper - Diamond (MoCuCD): diamond-reinforced MMC for ther-
mal management applications. MoCuCD is the final result of more than one
year of research made to identify the correct RHP production cycle parameters,
raw materials and compositions for the material production. The work included
a large study on Cu coated diamonds and on the possible solutions to reduce
diamond graphitization during production. The obtained material exhibits an
optimal combination of thermal and mechanical properties as confirmed by the
characterization reported in Chapter 8. However, its relatively high density for a
BID material is limiting its resistance in the case of high energy beam impacts.
• Molybdenum Carbide - Graphite (MoGR): graphite-reinforced CMC for high tem-
perature thermal management applications. Always produced by RHP of selected
powders its production relies on a solid state reaction without the use of low melt-
ing phases to infiltrate the interstitials (as Cu in MoCuCD). This allows for a
superior thermal stability at high temperature and a melting temperature above
2500oC, although the other thermal and mechanical properties are not as good
as previous MoCuCD. The most significant contributions given during the work
are the innovations in production technology of advanced refractory carbides -
graphite composites, such as the developed solid state reaction-based production
process and the introduction of Palladium sub micrometric powder as sintering
activator for refractory materials.
• Molybdenum Carbide - Graphite - Carbon Fibers (MoGRCF): Carbon Fibers
(CF)-reinforced CMC for BID. MoGRCF, produced by Liquid Phase Sintering of
selected and treated powders, can be considered as the final result of the PhD
190

12.2 Scientific Contributions and Results
and represents an important milestone in the research of advanced CMC for
BID applications. The material shows in fact exceptional thermal and physical
properties combined with very low density and adequate mechanical properties.
This result has been possible thanks to its very high CF content (up to 40%V ),
which is the highest value obtained for CF-reinforced CMC in the best of our
knowledge. The main contributions given during the thesis are the identification
of suitable compositions and powder treatments that, combined with the Liquid
Phase Sintering (LPS) process at very high temperatures, allowed to achieve a
thermal conductivity in excess of 700 W/mK. MoGRCF has been identified as
the most suitable material for Hi-Lumi LHC Collimators and more in general for
application where low density, high thermal and electrical conductivity and high
thermal stability are required.
• Verification of BID materials robustness against beam impacts. This part of the
work includes the FEM modelling of the beam impacts, the development, inside
a team, of an ad-hoc experiment to test the different materials and the eval-
uation of their damage threshold. More in details, the FEM simulations have
been performed relying on the hydrodynamic code Autodyn using Smooth Parti-
cle Hydrodynamics (SPH) elements, multi-phase equations of state and complex
strength and failure materials models. The proposed simulations allow for the
prediction of the shock wave (and the following explosion) provoked during the
beam impact and of the residual damage on conventional materials. However,
for the composites of interest this models are unavailable leading to the need
of apposite experiments. The experiment, called HRMT-14, has been carried
out inside the HiRadMat facility at CERN: it consisted in the controlled impact
of the highly energetic SPS beam onto instrumented materials samples with the
real time acquisition of key parameters such as samples face strain, radial velocity
and temperature. On top of that the samples explosion has been recorded using a
high speed video camera, placed 40 m away from the impact to avoid radiation in-
duced damage. The main contributions during this part were the samples design
through FEM simulations and the preparation of the video camera acquisition
setup, including the development of a synchronized and radiation resistant light-
ing system for the video acquisition. The experiment has been a success from all
191

12. CONCLUSIONS
points of view, allowing for the first time in the best of our knowledge to observe
in real time the materials explosion due to beam impacts. In addition, the data
collected during the impacts were in very good agreement with the numerical
simulations results, confirming the validity of the proposed methods. Finally, the
post irradiation damage observation allowed to benchmark the conventional and
newly introduced materials: the two most promising materials are CuCD and
MoGRCF, which survived the high intensity beam impacts without visible signs
of damage.
As a final remark, the very good results achieved with the R&D on novel Mo-based
composites allowed for the creation of a spin-off R&D program on Alumium - Graphite
composites, which is currently ongoing with the aim to produce a thermal management
material for low temperatures applications.
12.3 Future Outlook
The work performed lays the foundations for a a large number of valuable research
topics, providing also a useful set of tools for the development and the testing of BID
materials.
A brief list of future activities is reported below.
• Production and characterization of large MoGRCF plates with dimensions suit-
able for LHC Collimators jaws. The dimensional increase brings additional chal-
lenges to the plates production, that must be carefully controlled. The material
industrialization will then allow to introduce MoGRCF to other applications.
• Development of metallic coatings for MoGRCF to improve its superficial electrical
conductivity and reduce the high frequency RF Impedance to values similar to
CuCD. The coatings must be as thin as possible to avoid local energy deposition
while providing good bonding and electrical continuity with the MoGRCF matrix.
• Continuation of the study of the radiation induced degradation of aforementioned
materials in partner institutes (NRC-Kurchatov Institute, BNL) together with the
corresponding LHC life time.
192

12.3 Future Outlook
• Preparation of a new HiRadMat experiment taking advantage from the large
experience maturated with HRMT − 14: in particular there is the need to in-
crease the energy density deposited on composites in order to observe the damage
threshold, to upgrade the video camera acquisition system to obtain better pic-
tures, to create a protective system for the window, and finally to reduce the
beam perturbation on the in situ acquisition system (strain gauges).
193

References
[1] Various. HL-LHC: High Luminosity Large Hadron Collider Project. xiv, 7
[2] A. Ryazanov. ”Measurement of the thermophysical properties of material candidates for LHC collimator jaws.”
Presentation at the Collimation Working Group Meeting N. 155 of 18/02/2013 at CERN. xvii, xxv, 78, 79, 82
[3] Asbury Graphite Webpage. xix, 117
[4] J. Goma and M. Oberlin. Graphitization of thin carbon films. Thin Solid Films, 65(2):221 – 232, 1980. xx, 139
[5] J D Buckley and D D Edie. Carbon-Carbon Materials and Composites, 1st Edition. 1993. xxi, 140
[6] Alessandro Dallocchio, G Belingardi, T Kurtyka, and A Bertarelli. Study of Thermo-Mechanical Effects Induced in Solids by
High Energy Particle Beams: Analytical and Numerical Methods. PhD thesis, Turin Polytechnic, Turin, 2008. Presented on
26 May 2008. xxv, 18, 24
[7] G. A. Izquierdo. Measurement of the thermophysical properties of material candidates for LHC collimator
jaws. xxv, 23, 24, 25
[8] Various. EuCARD WP8 Home page. 3
[9] Oliver Sim Brning, Paul Collier, P Lebrun, Stephen Myers, Ranko Ostojic, John Poole, and Paul Proudlock. LHC Design
Report. CERN, Geneva, 2004. 6
[10] R W Assmann, O Aberle, G Bellodi, A Bertarelli, C Bracco, H Braun, M Brugger, S Calatroni, R Chamizo, Alessandro
Dallocchio, B Dehning, A Ferrari, P Gander, A Grudiev, E B Holzer, J B Jeanneret, J M Jimnez, M Jonker, Y Kadi, K Kershaw0,
J Lendaro, Jacques Lettry, R Losito, M Magistris, A Masi, M Mayer, E Mtral, R Perret, C Rathjen, S Redaelli, G Robert-
Dmolaize, S Roesler, F Ruggiero, M Santana, P Sievers, M Sobczak, A Tsoulou, V Vlachoudis, T Weiler, I S Baishev, and
I Kurochkin. The final collimation system for the LHC. In LHC-PROJECT-Report-919., page 4 p, Jul 2006. revised
version submitted on 2006-09-15 14:36:59. 7
[11] Various. ATLAS Collaboration website. 9
[12] Various. ALICE Collaboration website. 9
[13] Various. CMS Project website. 9
[14] Various. LHCb Collaboration website. 9
[15] Various. TOTEM Collaboration website. 9
[16] Various. LHCf Collaboration website. 9
[17] J B Jeanneret, D Leroy, L R Oberli, and T Trenkler. Quench levels and transient beam losses in LHC magnets.
Technical Report LHC-Project-Report-44. CERN-LHC-Project-Report-44, CERN, Geneva, May 1996. 11
[18] Various. LHC Collimation Project Website. 11
[19] Assmann. Collimation for the LHC High Intensity Beams. In HB2010 Proceedings, Morschach, Switzerland, page 13
p, Jan 2011. 12
[20] Assmann. Beam Halo on the LHC TCDQ Diluter System and Thermal Load on the Downstream Supercon-
ducting Magnets. In EPAC 2006 Proceedings, Edinburgh, Scotland, pages 547–549, 2006. 12
194

REFERENCES
[21] R W Assmann, B Goddard, Eugne B Vossenberg, and E Weisse. The consequences of abnormal beam dump actions on
the LHC collimation system. Technical Report LHC-PROJECT-NOTE-293, CERN, Geneva, May 2002. 14
[22] A Bertarelli, V Boccone, F Carra, F Cerutti, A Dallocchio, N Mariani, L Peroni, and M Scapin. Limits for Beam Induced
Damage: Reckless or too Cautious? (EuCARD-CON-2011-068), 2011. 14, 167
[23] M Cauchi, R Assmann, A Bertarelli, R Bruce, F Carra, A Dallocchio, D Deboy, N Mariani, A Rossi, L Lari, P Mollicone, and
N Sammut. Preliminary assessment of beam impact consequences on LHC Collimators. (CERN-ATS-2011-132):3
p, Sep 2011. 14
[24] F. Goldenbaum D. Filges. Handbook of Spallation research. Theory, Experiments and Applications. WILEY-VCH, 2009. 15
[25] Various. FLUKA website. 15
[26] Assmann et Al. Designing and building a collimation system for the high-intensity LHC beam. In PAC2003
Proceedings, Portland, Oregon, US, pages 45–47, May 2003. 16
[27] Bertarelli. Presentation: Phase II Collimators at CERN: design status and proposals. 19
[28] P Sievers. Appropriate Materials for LHC Collimators. 2003. 22
[29] EDMS reports of Flexural tests performed at CERN Mechanical Laboratory on CFC. 23
[30] SGL Carbon GmbH Webpage. 25
[31] P Morgan. Carbon Fibers and Their Composites. 2005. 25, 115, 135, 146
[32] Various. Plansee Tungsten heavy Alloys webpage. 25, 29
[33] C.W. Corti. Sintering Aids in Powder Metallurgy: The role of the platinum metals in the activated sintering
of refractory metals. 1986. 26
[34] J. T. Smith. Diffusion Mechanism for the Nickel-Activated Sintering of Molybdenum. 1965. 26
[35] SCM Metals Products Inc. Glidcop Material Datasheet. 26
[36] Various. ASM Specialty Handbook, Copper and Copper Alloys. 28, 86, 89
[37] A Bertarelli, A Dallocchio, L Gentini, N Mariani, R Perret, and M A Timmins. Mechanical Engineering and Design of
the LHC Phase II Collimators. (EuCARD-CON-2010-020. CERN-ATS-2010-148):3 p, Apr 2010. 28
[38] A Bertarelli, G Arnau Izquierdo, F Carra, A Dallocchio, M Gil Costa, and N Mariani. Research and development of
novel advanced materials for next-generation collimators. (CERN-ATS-2011-224):4 p, Nov 2011. 29, 30
[39] William D Callister Jr. Scienza e Ingegneria dei Materiali una Introduzione. EdiSES, Napoli, IT, 2002. 34
[40] P. J. Whiters T.W. Clyne. An Introduction to Metal Matrix Composites. Cambridge Solid State Science Series, Cambridge,
UK, 1993. 35
[41] Shu-bin REN Xuan-hui QU; Lin ZHANG; Mao WU. Review of metal matrix composites with high thermal conductivity
for thermal management applications. 2011. 35
[42] M. Ganor J. Pelleg. The influence of third element on the interface reactions in metal-matrix composites
(MMC): Al-grphite system. 2000. 36
[43] Karl Ulrich Kainer. Basics of Metal Matrix Composites, pages 1–54. Wiley-VCH Verlag GmbH & Co. KGaA, 2006. 37
[44] L. Weber and R. Tavangar. On the influence of active element content on the thermal conductivity and thermal
expansion of CuX (X = Cr, B) diamond composites. Scripta Materialia, (57):988–991, 2007. 38, 45, 65
[45] Leone Corradi Dell’Acqua. Meccanica delle Strutture. Le teorie strutturali e il metodo degli elementi finiti. MacGraw-Hill
Libri Italia srl, 1992. 38
[46] N. Mariani. Caratterizzazione Elastica di Film Nanometrici Multistrato Mediante Scattering Brillouin di Superficie. PhD
thesis, Milan’s Polytechnic, Department of Nuclear engineering Enrico Fermi, Milan, 2007. Presented on 21 December
2007. 40, 41
[47] L. Vergani. Meccanica dei materiali. Collana di istruzione scientifica: Serie di ingegneria meccanica. McGraw-Hill Compa-
nies, 2006. 43
195

REFERENCES
[48] M.L. Scott. Proceedings: Metal matrix composites and physical properties. Number v. 3 in Eleventh International Conference
on Composite Materials. Australian Composite Structures Society, 1997. 43
[49] T.J. Holmquist G.R. Johnson. An improved computational constitutive model for brittle materials. High Pressure
Science and Technology, (309):981–984, 1993. 43
[50] G. McIntosh. The Johnson-Holmquist Ceramic Model as used in LS-Dyna2D. Technical Report DREV-TM-9822,
Research and Development Branch Department of National Defence Canada., Defence Research Etablishment Valcartier,
Canada, Dec 1998. 43
[51] H. Morigami K. Yoshida. Thermal properties of diamond/copper composite material. 2004. 44, 45
[52] JC Maxwell. A treatise on electricity and magnetism. Oxford University Press, Vol. 1 3rd ed., 1904. 45
[53] Johnson LF Hasselmann DPH. Effective thermal conductivity of composites with interfacial thermal barrier
resistance. 1987. 45
[54] T Schubert L Ciupinsky W Zielinsky A Michalsky T Weissgaerber and B Kieback. Interfacial characterization of
Cu/diamond composites prepared by powder metallurgy for heat sink applications. 2007. 45
[55] Ce-Wen Nan, R. Birringer, David R. Clarke, and H. Gleiter. Effective thermal conductivity of particulate composites
with interfacial thermal resistance. Journal of Applied Physics, 81(10):6692–6699, 1997. 45, 46
[56] P S Turner. Thermal-Expansion Stresses in Reinforced plastics. Part of the Journal of the National Bureau of
Standards, 37:239–250, 1946. 46
[57] E H Kerner. The Elastic and thermo-elastic Properties of Composite Media. Proceedings of Physical Society LXIX,
(8):808–813, 1956. 46
[58] C.L. Hsieh and W.H. Tuan. Thermal Expansion Behaviour of a model ceramic-metal composite. Materials Science
and Engineering A 460-461, pages 453–458, 2007. 46
[59] Various. Brevetti Bizz srl Home page. 48, 84
[60] Foerster. Sigmatest 2.069 by Foerster webpage. 49
[61] ASTM International. ASTM C 1161 02c ”Standard Test Method for Flexural Strength of Advanced Ceramics
at Ambient Temperature”. 55
[62] B. Snaith, S.D. Probert, and P.W. O’Callaghan. Thermal resistances of pressed contacts. Applied Energy, 22(1):31 –
84, 1986. 58
[63] V V Rao, K Bapurao, J Nagaraju, and M V Krishna Murthy. Instrumentation to measure thermal contact resistance.
Measurement Science and Technology, 15(1):275, 2004. 58
[64] A. Noranzik. Thermal Conductivity Measurements of Graphite Samples. 2009. 58
[65] H.G. Moser C.A. Heusch and A. Kholodenko. Direct measurements of the thermal conductivity of various pyrolytic
graphite samples (PG,TPG) used as thermal dissipation agents in detector applications. Nuclear instruments
and Methods in Physics Research A, 480:463–469, 2002. 58
[66] Netzsch. Netzsch Laser Flash Technique informative website. 62
[67] Netzsch. Netzsch Laser Flash LFA 427 website. 62
[68] Netzsch. Netzsch Dilatometer website. 63
[69] Netzsch. Netzsch DSC website. 63
[70] Katsuhito Yoshida and Hideaki Morigami. Thermal properties of diamond/copper composite material. Microelec-
tronics Reliability, 44(2):303 – 308, 2004. 65
[71] Q. Sun and O.T. Inal. Fabrication and characterization of diamond/copper composites for thermal management
substrate applications. Materials Science and Engineering: B, 41(2):261 – 266, 1996. 65
[72] W.Z. Shao, V.V. Ivanov, L. Zhen, Y.S. Cui, and Y. Wang. A study on graphitization of diamond in copperdiamond
composite materials. Materials Letters, 58(12):146 – 149, 2004. 65
196

REFERENCES
[73] O. Beffort, S. Vaucher, and F.A. Khalid. On the thermal and chemical stability of diamond during processing of
Al/diamond composites by liquid metal infiltration (squeeze casting). Diamond and Related Materials, 13(10):1834
– 1843, 2004. 65
[74] J. Field. The properties of natural and synthetic diamonds. J Field, 1992. 66, 69
[75] W. Erlich, E.I.; Dan Hausel. Diamond Deposits. Society for Mining, Metallurgy, and Exploration, pages 74–78, 2005. 66
[76] F.P. Bundy. Pressure-Temperature Phase Diagram of Elemental Carbons. Physica A, pages 156 – 169, 1898. 69
[77] J M Zazula. On Graphite Transformations at High Temperature and Pressure Induced By Absorption of the
LHC Beam. Technical Report LHC-Project-Note-78, CERN, Geneva, Jan 1997. 69
[78] J. Qian, C. Pantea, J. Huang, T.W. Zerda, and Y. Zhao. Graphitization of diamond powders of different sizes at high
pressurehigh temperature. Carbon, 42(1213):2691 – 2697, 2004. 69
[79] D.V. Fedoseev S.P. Vnukuv V.L. Bukhovets B.A. Anikin. Surface Graphitization of Diamond at elevated Temperatures.
Surface and Coatings Technology, (28), 1986. 69
[80] S. Redaelli on behalf of the Collimation Project and HL-LHC-WP5. LHC Collimation Status and Upgrade Strategy.
Presented at LARP CM18/HiLumi LHC Meeting, May 7-9 2012 at Fermilab, Batavia, 2012. 72
[81] N. Mariani. LHC Phase II Collimator Material Design: Copper Diamond Composite. Visit to AIT: Austrian
Institute of Technology. 73
[82] S. Redaelli (CERN) A. Bertarelli (CERN), N. Simos (BNL). Materials for HL-LHC Collimators: R&D, Tests and
Irradiation Studies. 78
[83] N. Mariani. Collection of available documents on the Irradiation Tests to be performed at BNL (Brookhaven
National Laboratory, US) on Collimator Materials. Materials under testing: Molybdenum, Glidcop, CuCD,
MoGR. 78
[84] R.B. Matthews and G.M. Jenkins. The high temperature interaction between molybdenum and graphite. Journal
of Materials Science, 10(11):1976–1990, 1975. 83, 120
[85] N. Mariani. Molybdenum Diamond Composite (MoCD) Development Summary. 84
[86] Various. ASM Specialty Handbook, Powder Metal Technologies and Applications. 85
[87] Various. ASM Specialty Handbook, Heat-Resistant Materials. 85
[88] J.H. Adair P. Chillar, D.Agrawal. Sintering of molybdenum metal powder using microwave energy. Powder
Metallurgy, 51(2), 2008. 86
[89] Guorong Hu, Yexiang Liu, Jianhong Yang, Kaihua Yang, Fenglin Tang, and Jihong Jin. Electroless plating composite
coatings of Ni-Ti-Re on the surface of diamond. Journal of Central South University of Technology, 6(1):13–15, 1999.
89
[90] G.A. Rubin Y. Harada. Fabrication and Characterization of Metal Carbide-Graphite Composites. IITRI, 68th
Annual Meeting of the American Ceramic Society, 1966. 114
[91] D. John and G.M. Jenkins. Hot-working and strengthening in metal carbide-graphite composites. Journal of
Materials Science, 21(8):2941–2958, 1986. 115
[92] H O Pierson. HANDBOOK OF CARBON, GRAPHITE, DIAMOND AND FULLERENES: Properties, Processing and Appli-
cations. 1993. 117, 135
[93] Phase Diagram of Molybdenum - Carbon system calculated with MTDATA Phase Diagram Software from
the National Physical Laboratory, Teddington, Middlesex, UK. 119
[94] H.O. Pierson. Handbook of Refractory Carbides & Nitrides: Properties, Characteristics, Processing and Apps. Elsevier Science,
1996. 119
[95] C.W. Corti. Sintering Aids in Powder Metallurgy the role of platinum metals in the activated sintering of
refractory metals. Platinum Metals rev., 30(4):184–195, 1986. 121, 122
[96] V.V. Panichkina, V.V. Skorokhod, and A.F. Khrienko. Activated sintering of tungsten and molybdenum powders.
Soviet Powder Metallurgy and Metal Ceramics, 6(7):558–560, 1967. 121
197

REFERENCES
[97] K.S Hwang and H.S Huang. Identification of the segregation layer and its effects on the activated sintering and
ductility of Ni-doped molybdenum. Acta Materialia, 51(13):3915 – 3926, 2003. 121
[98] Various. ASM Specialty Handbook, Alloy Phase Diagrams. 121, 122
[99] T Matsumoto. Mesophase pitch and its carbon fibers. Pure & Applied Chemistry, 57(11):1553–1562, 1985. 137
[100] Nippon Fiber Corporation webpage. 137
[101] Cytec ThermalGraph DKD Carbon Fiber Producer Datasheet. 137
[102] J.D. Brooks and G.H. Taylor. The formation of graphitizing carbons from the liquid phase. Carbon, 3(2):185 – 193,
1965. 139
[103] L.S. Singer. The mesophase and high modulus carbon fibers from pitch. Carbon, 16(6):409 – 415, 1978. 141
[104] J L White M W Roberts, J M Thomas and J. E. Zimmer. Disclination structures in carbonaceous mesophase and graphite. 1976.
141
[105] R. M. German. Liquid Phase Sintering. Plenum press, New York and London, 1985. 151
[106] A Bertarelli, E Berthome, V Boccone, F Carra, F Cerutti, N Charitonidis, C Charrondiere, A Dallocchio, P Fernandez Car-
mona, P Francon, L Gentini, M Guinchard, A Masi, S D Marques dos Santos, P Moyret, L Peroni, S Redaelli, and M Scapin. An
Experiment to Test Advanced Materials Impacted by Intense Proton Pulses at CERN HiRadMat Facility.
Jan 2013. Preprint. 167, 173
[107] A. Bertarelli, F. Carra, F. Ceruttiand A. Dallocchioand M. Garlaschand M. Guinchardand N. Marianiand S. D. Marques
dos Santosand L. Peroniand M. Scapin, and V. Boccone. Behaviour of advanced materials impacted by high energy
particle beams. Journal of Physics: Conference series, 451, 2013. 167
[108] Alessandro Bertarelli, Oliver Aberle, Ralph Wolfgang Assmann, Alessandro Dallocchio, Tadeusz Kurtyka, Matteo Magistris,
Mario Santana-Leitner, and Manfred Mayer. Permanent Deformation of the LHC Collimator Jaws Induced by
Shock Beam Impact: an Analytical and Numerical Interpretation. page 3 p, 2006. 167
[109] J.A. Zukas. Introduction to hydrocodes. Elsevier, 2004. 167
[110] Ansys Inc. ANSYS Autodyn User Manual, Release 13.0. 2010. 168
[111] Giuseppe Battistoni, F Cerutti, A Fass, A Ferrari, S Muraroi, J Ranft, S Roesler, and P R Sala. The FLUKA code:
Description and benchmarking. AIP Conf. Proc., 896(SLAC-REPRINT-2007-184):31–49. 19 p, 2007. 168
[112] A Ferrari, Paola R Sala, A Fass, and Johannes Ranft. FLUKA: A multi-particle transport code (program version 2005). CERN,
Geneva, 2005. 168
[113] H. Richter, E. Noah, H. Aiginger, and K. Poljanc. Simulation of target response due to uranium ion beam impact.
The European Physical Journal A, 42(3):301–306, 2009. 168
[114] J. H. Tillotson. Metallic Equations of State for Hypervelocity Impact. Report No. GA-3216, July 18 (General
Atomic, San Diego, California, 1962). 169
[115] I V Lomonosov V E. Equations of State of Matter at High Energy Densities. The Open Plasma Physiscs Journal,
pages 122–130, 2010. 169
[116] Various. SESAME: the Los Alamos National laboratory Equations Of State database. 169
[117] G I Kerley. Equations of state for Be, Ni, W and Au, 2003. 169
[118] Various. Compendium of Shock Wave Data, 1977. 169
[119] W. H. Cook G. R. Johnson. A Constitutive Model and Data for Metals Subjected to Large Strains, High Strain
Rates and High Temperatures. In Proc. 7th Int. Symp. on Ballistics, 1983. 170
[120] G. R. Johnson and T. J. Holmquist. An Improved Computational Constitutive Model for Brittle Materials. High
Pressure Science and Technology, 2:981–985, 1993. 170
[121] D E Grady. The spall strength of condensed matter. Journal of Mech. Phys. Solids, 36(3):535–584, 1988. 171
[122] J Wang L Hu, P Miller. High strain-rate spallation and fracture of tungsten by laser-induced stress waves.
Material Science and Engineering A, 504:73–80, 2009. 171
[123] A. Manousos and V. Vlachoudis. Energy Deposition Results in: HRMT14 Samples & TCSx. Presented at the
Working Group on Advanced Materials for Collimators AdColMat - 3rd Meeting 25.11.2013, 2013. 178
198

Glossary
AIT Austrian Institute of Technology
ASTM American Society for Testing and
Materials
AgCD Silver - Diamond
AlCD Aluminium - Diamond
BNL Brookhaven National Laboratories
BPMs Beam Position Monitors
CERN European Organization for Nuclear
Research
CF Carbon Fibers
CFC Carbon Fiber Carbon composite
CMC Ceramic Matrix Composites
CTE Coefficient of Thermal Expansion
CuCD Copper - Diamond
CucCD Copper coated Diamonds
DAQ Data Acquisition System
DSC Differential Scanning Calorimetry
EBSD Electron Back Scatter Diffraction
EDS Energy Dispersion Spectroscopy
EOS Equation of State
EPFL cole Polytechnique Fdrale de Lau-
sanne
EuCARD European Coordination for Acceler-
ator Research & Development
FE Finite Elements
GSI Helmholtz Centre for Heavy Ion Re-
search
Hi-Lumi High Luminosity LHC Upgrade
HiRadMat High Radiation to Materials
INOX Stainless Steel
JC Johnson-Cook Strength Model
LDV Laser Doppler vibrometer
LHC Large Hadron Collider
LS1 LHC Long Shutdown 1
MMC Metal Matrix Composites
MoCuCD Molybdenum - Copper - Diamond
MoCucCD MoCuCD with CucCD
MoGR Molybdenum Carbide - Graphite
MoGRCF Molybdenum Carbide - Graphite -
Carbon Fibers
NRC National Research Center
OF Oxygen Free
OM Optical Microscopy
PAN Polyacrylonitrile
PMC Polymer Matrix Composites
QBSD Quadrants Back Scattered (Elec-
trons) Detector
RF Radio Frequency
RHP Rapid Hot Pressing
ROM Rule Of Mixture
RT Room Temperature, 25 oC
R&D Research and Development
SE Secondary Electron (Detector)
SEM Scanning Electrons Microscope
SPH Smooth Particle Hydrodynamics
SPS Super Proton Synchrotron
SSNI Steady State Stability Normalized
Index
TCP Primary LHC Collimator
199

GLOSSARY
TCS Secondary LHC Collimator
TCSM Hi-Lumi Secondary LHC Collimator
TCT Tertiary LHC Collimator
TCTP Tertiary LHC Collimator with Beam
Position Monitors (BPMs)
TSNI Transient Shock Normalized Index
UHV Ultra High Vacuum
US-LARP United States LHC Accelerator Re-
search Program
ZTA Zone Thermally Altered
A Area, [m2]
A Elastic Limit in JC model, [MPa]
B Work hardening constant in JC
model, [MPa]
C Strain rate sensitivity constant in JC
model, [MPa]
Cii Elastic Constants, [GPa]
E Young’s Modulus, [GPa]
F Force, [N]
G Shear Modulus, [GPa]
K Bulk Modulus, [GPa]
L Support Span, [mm]
Pmin Minimum Hydrostatic Pressure,
[GPa]
Q Heat Flux, [W]
R Ultimate Tensile Strength, [MPa]
RFl Ultimate Flexural Strength, [MPa]
Tm Melting Temperature, [oC]
THT Thermal Treatment Temperature,
[oC]
Z Atomic Number, [−]
%V Volume Percentage, [%]
%w Weight Percentage, [%]
α Coefficient of Thermal Expansion,
[10−6K −−1]
αk Kapitza radius, [µm]
χ0 radiation Length, [cm]
δz Vertical displacement, [mm]
ε̇ Strain rate, [s−1]
ε Real deformation, [−]
λ Wavelenght, [m]
ν Poisson’s Ratio, [−]
ρ Density, [g/cm3]
σ Electrical Conductivity, [MS/m]
σFl Maximum Tensile and Compressive
Flexural Stress ,[MPa]
θ Angle of incoming X-Rays, [rad]
cp Specific Heat, [J/KgK]
d Distance between adjacent crystallo-
graphic planes, [m]
dpa Displacements per atom, [−]
fV Volume Fraction, [−]
fw Weight Fraction, [−]
h Height, [mm]
hc Thermal Conductance, [W/m2K]
k Thermal Conductivity, [W/mK]
m Mass, [g]
n Work hardening exponent in JC
model, [−]
w Width, [mm]
Atm Atmosphere, pressure
Hz Hertz, frequency
J Joule, energy
K Kelvin, temperature
N Newton, force
Pa Pascal, pressure
200

GLOSSARY
Sv Sievert
T Tesla, magnetic field
W Watt, power
oC Centrigrads, temperature
bar Bar, pressure
eV Electron Volt, energy
g Gram, mass
h Hour, time
m Meter, lenght
mol Number of moles
rad Radians, angle
s Second, time
Ag Silver
Al Aluminium
Al2O3 Aluminium Oxide
Ar Argon
Au Gold
C Carbon
Co Cobalt
Cu Copper
Fe Iron
H2 Hydrogen
Mo Molybdenum
Mo2C Molybdenum Carbide
N2 Nitrogen
Nb Niobium
Ni Nickel
Pd Palladium
Pt Platinum
Rh Ruthenium
SiC Silicon Carbide
T i Titanium
W Tungsten
201