Theses Digitisation: This is a digitised ...
308
https://theses.gla.ac.uk/ Theses Digitisation: https://www.gla.ac.uk/myglasgow/research/enlighten/theses/digitisation/ This is a digitised version of the original print thesis. Copyright and moral rights for this work are retained by the author A copy can be downloaded for personal non-commercial research or study, without prior permission or charge This work cannot be reproduced or quoted extensively from without first obtaining permission in writing from the author The content must not be changed in any way or sold commercially in any format or medium without the formal permission of the author When referring to this work, full bibliographic details including the author, title, awarding institution and date of the thesis must be given Enlighten: Theses https://theses.gla.ac.uk/ [email protected]
-
Upload
khangminh22 -
Category
Documents
-
view
0 -
download
0
Transcript of Theses Digitisation: This is a digitised ...

https://theses.gla.ac.uk/
Theses Digitisation:
https://www.gla.ac.uk/myglasgow/research/enlighten/theses/digitisation/
This is a digitised version of the original print thesis.
Copyright and moral rights for this work are retained by the author
A copy can be downloaded for personal non-commercial research or study,
without prior permission or charge
This work cannot be reproduced or quoted extensively from without first
obtaining permission in writing from the author
The content must not be changed in any way or sold commercially in any
format or medium without the formal permission of the author
When referring to this work, full bibliographic details including the author,
title, awarding institution and date of the thesis must be given
Enlighten: Theses
https://theses.gla.ac.uk/

tHE ROLE OF PERIPHERAL QUANtItAtIVE COMPUtED tOMOGRAPHY At tHE ULtRA-DIStAL RADIUS IN tHE ASSESSMENt AND MANAGEMENt OF OStEOPOROSIS
by
James Clason Martin
Submitted for the degree of
Doctor of Medicine (MD)
to
Glasgow Universityin
March 1997
Work for this thesis was performed at
the Osteoporosis Research Unit Aberdeen Royal NHS trust

ProQuest Number: 10391422
All rights reserved
INFORMATION TO ALL USERS The quality of this reproduction is dependent upon the quality of the copy submitted.
In the unlikely event that the author did not send a com p le te manuscript and there are missing pages, these will be noted. Also, if material had to be removed,
a note will indicate the deletion.
uestProQuest 10391422
Published by ProQuest LLO (2017). Copyright of the Dissertation is held by the Author.
All rights reserved.This work is protected against unauthorized copying under Title 17, United States C ode
Microform Edition © ProQuest LLO.
ProQuest LLO.789 East Eisenhower Parkway
P.Q. Box 1346 Ann Arbor, Ml 48106- 1346

BOUND BY UWCC LIBRARY BINDERY
PO BOX 430 CARDIFF CF1 3XT
TEL (01222) 874949

GLftSGOWUtilVERSin
i l
■T'FS-îjf
Declaration of the Work of Others in this thesis
All studies were designed and subjects recruited personally, except those described in chapter 10, and the hip fracture study described in chapter 8.
Most of the pQCT scans were performed, and all were analysed personally. I performed all pQCT scans on those individuals described in chapter 10, and most of those described in the hip fracture study in chapter 8. Scans not done personally, were done by radiographers trained by myself in the use of pQCT.
Many of the DXA and ultrasound scans were performed, and all analysed personally. The precision measurements for calcaneal ultrasound were performed by Dr A Stewart, of the Osteoporosis Research Unit, Aberdeen Royal NHS Trust. She also designed the study, and recruited the patients participating in the hip fracture study discussed in chapter 8. However, she was not involved in any aspect of the pQCT measurements.
Dr R Munro assisted in the assessment of patients with rheumatoid arthritis studied in chapter 11.
All data presented in this thesis were collected, recorded andanalysed personally. Statistical guidance was sought from M Campbell, Senior Statistician, Health Services Research Unit, Department of Public Health, Polwarth Building, Aberdeen.
I wrote this thesis in its entirety.
Î
11

For my wife
and daughter
m
II
Many people have helped me in many ways
Finally, to my wife and daughter I owe the greatest debt. Enormous understanding and encouragement were always forthcoming, when so often required.
'%
I■:3:
ACKNOWLEDGEMENtS ;î
Special thanks to my supervisor. Dr David Reid. But for his counsel, this thesis would not have been possible. A special |friend always. i
■
I would like to thank all of the administrative, research andradiography staff of the Osteoporosis Research Unit. They welcomed me warmly into their research team, and were always available for support, supervision and guidance.
I would like to thank Marion Campbell for her statistical assistance.
I am indebted to the people of Grampian Region, Scotland. For research into osteoporosis, they gave willingly of their time. %Without such commitment, it would be difficult to promote |ï knowledge and awareness of an increasing common condition.
I give great thanks to my parents for their support throughout these recent years, and many before. a
I
I.
iv
SUMMARY
Osteo-densitometry has some well defined roles in the management of osteoporosis. This thesis examined the role of a new technique, peripheral quantitative computed tomography (pQCT) at the ultra-distal radius, which quantifies trabecular and cortical bone mineral density (BMD) separately through a volumetric measurement. Comparison was made with dual energy X- ray absorptiometry (DXA), and calcaneal ultrasound attenuation (BUA) and velocity (VOS) in some studies.
The precision [expressed as the co-efficient of variation (CV)] of pQCT in young females was 1.24%, 1.33%, 1.58% and 1.88% for total (Qtot), trabecular (Qtrab), subcortical (Qscort) and cortical (Qcort) BMD respectively. The precision was improved to these figures by minimising the difference in voxel numbers between repeat scans, a strategy which was thereafter utilised to aid repositioning in follow-up scans. The corresponding CV s were higher in women with vertebral fractures, or rheumatoid arthritis. There were small, and insignificant differences in BMD between dominant and non-dominant forearms. To minimise the variance in measurements, the non-dominant forearm was always scanned unless contra-indicated.
Normative pQCT data were derived from 332 normal females aged 18-90 years. Differences compared to the manufacturers reference data were noted, stressing the importance of creating a normal range from the local population. Age (all measurements), postmenopausal status (Qtot, Qscort) and height (Qtot, Qtrab) were negatively, and weight (Qtot, Qtrab, Qcort) was positively related to radial BMD. A cubic regression model best fitted all pQCT BMD’s as a function of age for the whole population. pQCT BMD was effectively stable in premenopausal women. In postmenopausal women, estimated rates of change in
Y

BMD (derived from best fit, non-linear regression models as a function of years postmenopause) were greatest for Qtot, Qscort and Qcort at 20 years postmenopause (-1.36%/yr - -1.39%/yr),which were greater than those for Qtrab throughout the postmenopausal years (-0.53%/yr - -0.76%/yr). Significantannualized rates of change in Qscort (-1.35%/yr,p=0.024) and Qtot (-1.04%/yr,p=0.027), but not Qtrab (-0.19%/yr) or Qcort (- 0.95%/yr) were observed in 23 late premenopausal women studied longitudinally. Bearing in mind precision values, these results suggest a 3 year interval between scans would be necessary to detect clinically significant individual changes in BMD. Perimenopausal differences (between 79 late premenopausal and 40 early postmenopausal women) were smaller for pQCT [BMD (T- score difference, p-value): Qscort(-0.58,0.018), Qtot(-0.54,0.013), Qtrab(-0.35,0.098), Qcort(-0.29,0.174)] than for DXA lumbar spine (LS:-0.61,0.003), and femoral neck (FN:- 0.76,<0.001), trochanter (FT:-0.81,0.001) and Ward's (FW : - 0 . 77,<0.001) . These observed and estimated rates of change in pQCT BMD, and the differences between late premenopausal and early postmenopausal women, are contrary to the accepted theory of accelerated trabecular bone loss immediately following the menopause, at least at the radius. Rather they suggest remodelling, with trabecularisation of endosteal cortical bone.
In 216 perimenopausal women, correlations of Qtot, Qtrab and Qscort with DXA LS and hip measurements were moderate (r : 0 .35- 0.53), and poorer with BUA (r: 0.24-0.31) and VOS (r: 0.1-0.17) . Corresponding figures for Qcort were even poorer. Consequently, pQCT would be of no value in pre-selecting perimenopausal women for axial DXA assessment. To detect all potential LS or FN osteopenia based upon a pQCT measurement, 98.6%-100% of the perimenopausal population would require a pQCT scan.
BMD in female vertebral and hip fracture populations, and the
vi
.-'W
power of pQCT compared to DXA and ultrasound in fracture discrimination was studied. There were significant differences in Qtrab [ (Z-score difference, p-value); -1.35,<0.001], Qtot (- 0.94,0.001), LS (-1.37,<0.001), FN (-1.08,0.003), FT (-1.03,0.006) and FW (-0.64,0.023), but not Qscort (-0.71,0.063) or Qcort (-0.24,0.2) between vertebral fracture (n=39) and nonfracture (n=30) groups. Qtrab was superior (numerically, but not statistically) to other pQCT and axial DXA measurements in discriminating vertebral fractures [Area under the Receiver Operator Curve (AUC): 0.853]. There were statisticallysignificant differences in all pQCT (Z-score differences : -0.48 to -0.73), DXA hip (-0.64 to -1.04) and ultrasound (-0.64 to - 0.91) measurements between hip fracture (n=165) and nonfracture (n=45) groups. FN (AUC:0.796) was superior (numerically and statistically) to all pQCT measurements and BUA, but not VOS (AUC:0.783) in discriminating hip fractures. Corresponding AUC's for pQCT measurements (except Qcort) were greater in the vertebral than hip fracture study, suggesting that pQCT may have a greater role in the prediction of vertebral fractures.
Osteo-densitometry has a recognised role in monitoring response to drug therapy. Changes in pQCT BMD were compared to DXA hip and spine BMD during treatment for 1 year with HRT (n=ll) and cyclical etidronate (ETD:n=10) in postmenopausal women. In both groups, the greatest increase after 1 year was found at LS (HRT:+6.6%,p<0.001; ETD:+5.2%,p=0.013), with significant change detected after only 4 months (HRT :+3.3%,p=0.02 ; ETD:+3.8%, p=0.01). In both groups, pQCT BMD remained virtually unchanged, suggesting that routinely, response to HRT and ETD in best detected by monitoring LS BMD. An adverse effect of warfarin on BMD was observed in a cross-sectional study. 40 men requiring longterm warfarin for cardiovascular disease, were matched for underlying disease with 40 controls. All pQCT and axial DXA BMD
vii
' - .....r:-,..-. _ _ _ _ _ _ _____

vm
measurements were lower in the warfarin group, reaching statistical significance for LS (-10.4% difference,p=0.003) and Qtrab (-9% difference,p=0.024).
BMD is reduced in patients with rheumatoid arthritis (RA) . The pathogenesis is complex, and the contribution of low dose corticosteroid therapy controversial. pQCT was compared to axial DXA and ultrasound in 75 postmenopausal women, of which 29 were controls, 21 non-steroid treated and 25 steroid treated RA patients. There was no significant steroid effect on any BMD measurement. Qtrab (p=0.001), Qscort (p=0.009) and Qtot(p=0.016), were significantly lower in the RA groups, as were both ultrasound measurements (p=0.001) and all DXA hip measurements (p=0.012-0.002). Differences in LS and Qcort were insignificant. The principle determinant of Qtot, Qtrab and ultrasound measurements was the degree of radiological damage (Larsen score). pQCT and ultrasound measurement sites are periarticular, and may be of value in assessing RA disease I
. .activity and response to therapy.
Page
INDEX IX
LISt OF tABLESLISt OF FIGURES
XIV
XVI1
1-
CHAPtER 1 INtRODUCtION
1.1 Bone1.1.1 Normal Cellular Function1.1.2 Bone Types, Skeletal Distributions
and Biomechanical Properties1.1.3 Normal Age Related Bone Mass Changes1.1.4 Describing Bone Mineral Density
(BMD) Measurements: T and Z Scores
224
810
1.21 .2.1
1 .2.2 1 .2.2 .1 1 .2.2 .21.2 .2 .31.2 .3 .1
1.2 .3 .2
1.31.3.11.3.21.3.31.3.4
1.3.51.3.6
1.3.7
1.4
OsteoporosisHistory and Definition ofOsteoporosisOsteoporotic FracturesHip FractureVertebral FractureDistal Fore-arm FractureRisk Factors and Causes of SecondaryOsteoporosisCorticosteroid Induced Osteoporosis
Techniques Used to Assess Bone Mass RadiographsSingle Photon Absorptiometry (SPA) Dual Photon Absorptiometry (DPA) Dual Energy X-ray Absorptiometry (DXA)UltrasoundQuantitative Computed Tomography (QCT)Peripheral Quantitative Computed Tomography (pQCT)
Clinical Indications Measurement
for BMD
1313
15161718 19
19
2323252526
2829
31
33
1.51.6
Screening for Osteoporosis
Rational behind Thesis Work
35
40
IX

CHAPtER 2 MEtHODOLOGYPage48
2.1 Introduction 482.2 Peripheral Quantitative Computed 48
2.2.1Tomography (pQCT)The Osteo-densitometer 48
2.2.2 Scanning Method 492.2.3 Bone Mineral Density (BMD) 50
2.3measurements acquired by pQCT Dual Energy X-ray Absorptiometry 51
2.4(DXA)Ultrasound (CUBA) 52
2.5 Statistical Analyses 522.6 Ethics and Consent 53
CHAPtER 3 tHE PRECISION OF pQCt AND HOW It IS IMPROVED USING SCAN VOXEL NUMBERS
3.1. Introduction3.1.1 Precision3.1.2 Voxel Numbers and "Trending".3.2 Methods3.3 Statistical Analyses3.4 Study Populations3.5 Results3.6 Discussion
61
6161616262626363
IÎ
CHAPtER 4 tHE EFFECt OF DOMINANCE ON RADIAL pQCt BMD MEASUREMENtS
69 I4.14.24.34.44.5
IntroductionPatient Recruitment and MethodsStatistical AnalysesResultsDiscussion
696970 70 70
CHAPtER 5 CREAtION OF A NORMAL RANGE AND DEtERMINAtION OF IMPORtANt ANtHROPOMEtRIC FACtORS ON RADIAL pQCt BMD MEASUREMENtS IN FEMALES AGED 18-90.
5.15.25.3
Introduction Study Population Statistical Analyses
74
747475
X
5.45.5
ResultsDiscussion
Page7677 I
:r
CHAPtER 6 COMPARISON OF RADIAL pQCt BMD MEASUREMENtS WItH MEASUREMENtS At OtHER SKELEtAL SItES: IMPLICAtIONSFOR tHE USE OF pQCt IN SCREENING FOR LOW AXIAL BMD.
88
6.16.2
6.36.46.4.16.4.26.4.3
6.4.4
6.4.5
6.5
IntroductionStudy Populations and Bone MassMeasurementsStatistical AnalysesResultsDemographic and Bone Mass Data Intra-Technique BMD Correlations for pQCTCorrelations of PQCT BMDMeasurements with Bone MassMeasurements at Other Skeletal Sites Comparison of the Proportion of Females in the Lowest Quartiles of the Different Measurements for the Perimenopausal Population (Group 1) Proportional Cut-Off Figures forpQCT Measurements in Detecting Low Axial BMD in the Perimenopausal Population : Comparison withUltrasound Measurements (Group 1). Discussion
88899091 919192
92
93
94
CHAPtER 7 AGE RELAtED CHANGES IN RADIAL pQCt BMD MEASUREMENtS: COMPARISON WItHOtHER SKELEtAL SItES.
123
7.1 Introduction7.2 Study Populations and Bone Mass
Measurements7.3 Statistical Analyses7.3.1 Cross-sectional Designs7.3.2 Longitudinal Designs7.4 Results7.4.1 Cross-sectional studies7.4.2 Longitudinal Studies7.5 Discussion
123124
125 12 6 12 6 12 6 127129130
XI
PageCHAPtER 8 tHE ABILItY OF pQCt tO DISCRIMINAtE 157
FRACtURE AND NON-FRACtUREPOPULAtIONS : COMPARISON WItH OtHERBONE MASS MEASUREMENtS
8.1 Introduction 1578.2 Study Populations and Bone Mass 159
Measurement s8.2.1 Vertebral fracture study 1598.2.2 Hip fracture study 1608.3 Statistical Analyses 1618.4 Results 1618.4.1 Vertebral fracture study 1618.4.2 Hip fracture study 1638.5 Discussion 164
CHAPtER 9 CHANGES IN pQCt BMD MEASUREMENtS IN 181RESPONSE tO DRUG tHERAPY: COMPARISONWItH MEASUREMENtS At OtHER SKELEtAL SItES.
9.1 Introduction 1819.2 Study Populations and Bone Mass 182
Measurements9.3 Statistical Analyses 1849.4 Results 1849.5 Discussion 185
CHAPtER 10 tHE EFFECt OF LONGtERM WARFARIN 196tHERAPY ON RADIAL AND AXIAL BMD.
10.1 Introduction 19610.2 Study Population and Bone Mass 197
Measurement s10.3 Statistical Analyses 19810.4 Results 19810.5 Discussion 199
XU
Page
CHAPtER 11 tHE EFFECt OF DISEASE AND 207CORtICOStEROIDS ON APPENDICULAR BONE MASS IN POStMENOPAUSAL WOMEN WItH RHEUMAtOID ARtHRItIS : COMPARISON WItHAXIAL MEASUREMENtS.
11.1 Introduction 20711.2 Study Population, Clinical 208
Assessments and Bone Mass Measurements
11.2.1 Study Population 20811.2.2 Clinical Data 20811.2.3 Bone Density Measurements 2 0911.3 Statistical Analyses 21011.4 Results 21011.5 Discussion 213
CHAPtER 12 OVERALL CONCLUSIONS AND 22 9DISCUSSION
REFERENCES 23 8
APPENDIX 1 Glossary of Abbreviations 27 6
X111
iiAPPENDIX 2 Papers Published From the 279
thesis Work%APPENDIX 3 Abstracts Published From the 2 80
thesis Work'APPENDIX 4 Presentations to Learned 282
Societies From the thesis Work ft

LISt OF tABLES Page
table 1.1 Risk factors for low bone mass.table 1.2 Clinical indications for assessment
of bone mineral density.table 3.1 Subject demographic and pQCT BMD
data examining the effects of voxel numbers upon the precision of pQCT in three different study populations
table 3.2 Co-efficients of variation (CV) for pQCT BMD measurements in threedifferent study populations.
table 4.1 pQCT BMD measurements of the dominant and non-dominant forearms in a study population, and the male and female subgroups.
table 5,1 Total and trabecular pQCT BMD values for our normal population compared with the manufacturers referencedata.
table 5.2 Subcortical and cortical BMD values for our normal population.
table 6.1 Details of subjects in groups 1 and 2 studied in chapter 6.
table 6.2 pQCT, DXA hip and spine BMD, andcalcaneal ultrasound measurements of the perimenopausal population (Group 1) .
table 6.3 pQCT BMD and DXA whole body (WB-BMD) and arm (WB-ARM) BMD of Group 2.
table 6.4 Cut-off value and proportion ofpopulation below this value for each of the DXA, pQCT and ultrasound measurements to detect all perimenopausal women with lumbar spine and femoral neck osteopenia.
table 7.1 Rates of change of pQCT BMD measurements in women aged 18-90 years.
table 7.2 Demographic, pQCT and DXA BMD data of premenopausal and postmenopausal subgroups of perimenopausal women (group 2).
table 7.3 Demographic and baseline pQCT and DXA BMD data of premenopausal and postmenopausal women studied longitudinally.
434467
68
73
82
83
9899
100
101
13 8
139
140
XIV

table 7.4
table 7.5
table 7.6
table 8.1
table 8.2
table 8.3
table 9.1
table 9.2
table 9.3
table 9.4
table 10.1
table 11.1
table 11.2
Annualized rates changes in pQCT and DXA BMD measurements of premenopausal and postmenopausalwomen studied longitudinally. Relationships between annualizedrates of change in pQCT and DXA BMD in premenopausal women studied longitudinally.Relationships between annualizedrates of change in pQCT and DXA BMD in postmenopausal women studied longitudinally.Demographic data of the hip and vertebral fracture groups with the corresponding control groups.Area under the receiver operator curves indicating the power of pQCT and DXA to discriminate vertebral fracture from non-fracture populations.Area under the receiver operator curves indicating the power of pQCT, DXA and calcaneal ultrasound to discriminate hip fracture from nonfracture populations.Baseline clinical, pQCT and DXA data for the groups treated with hormone replacement therapy and etidronate. Height and weight at months 0, 4, 8 and 12 in hormone replacement therapy (HRT), and etidronate (ETD) groups.Percentage changes in pQCT BMD for groups treated with hormonereplacement therapy and etidronate. Percentage changes in DXA BMD for groups treated with hormonereplacement therapy and etidronate. Anthropometric, lifestyle and warfarin related data for theWARFARIN and CONTROL groups. Characteristics of the control, nosteroid and steroid treatedrheumatoid arthritis groups. Important determinants of pQCT and DXA BMD, and calcaneal ultrasound measurements in all subjects.
XV
Page141
142
143
171
172
173
190
191
192
193
202
219-20
221
I
F
table 11.3 Relationships between rheumatoid arthritis disease parameters and pQCT BMD and calcaneal ultrasound measurements in the combined steroid and non-steroid treated rheumatoid arthritis groups.
Page222
XVI
I%I
;t

LISt OF FIGURES Figure 1.1 Figure 1.2 Figure 1.3
Figure 2.1 Figure 2.2
Figure 2.3
Figure 2.4
Figure 2.5
Figure 2.6
Figure 2.7
Figure 5.1
Figure 5.2
Figure 5.3
Figure 5.4
Figure 6.1
Schematic representation of the bone multicellular unit (BMU). Gender and age related changes in BMD, with T and Z-scores. Age and gender relatedincidence of osteoporotic fractures.The Stratec XCT-960 pQCT osteo- densitometer.A graphic representation of the pQCT scan images and BMDvalues.A woman undergoing DXA scanning of the lumbar spine and proximal femur using the Norland XR26-Mark II.A Norland XR2 6-Mark II DXAlumbar spine scan showing the spinal image and BMD values.A Norland XR26-Mark II DXAproximal femur scan showing the image and BMD values.A Norland XR26-Mark II DXAwhole body scan showing theimage and BMD values. The left upper limb has also been selected as an additional region of interest (ROI).A volunteer undergoing a c a l c a n e a l u l t r a s o u n dmeasurement using the McCueCUBA Clinical scanner.Age related distributionradial pQCT total BMDwomen.Age related distributionradial pQCT trabecular BMD for women.Age related distributionradial pQCT subcortical BMD women.Age related distributionradial pQCT cortical BMDwomen.Relationship of pQCT total with subcortical and cortical BMD.
offor
of
offor
offor
Page454647
5455
56
57
58
59
60
84
85
86
87
102
xvu

Figure 6.2
Figure 6.3
Figure 6.4
Figure 6,5
Figure 6.6
Figure 6.7
Figure 6.8
Figure 6.9
Figure 6.10
Figure 6.11
Figure 6.12
Figure 6.13
Figure 6.14
Figure 6.15
Figure 6.16
Relationship of pQCT total and trabecular BMD, and cortical with subcortical BMD. Relationship of pQCT trabecular with subcortical and cortical BMD.Relationship of pQCT total BMD with DXA lumbar spine and femoral neck BMD.Relationship of pQCT total BMD with DXA femoral trochanter and Ward's area BMD.Relationship of pQCT total BMD with calcaneal ultrasound attenuation and velocity. Relationship of pQCT total BMD with DXA whole body BMD and ipsilateral whole arm BMD. Relationship of pQCT trabecular BMD with DXA lumbar spine and femoral neck BMD.Relationship of pQCT trabecular BMD with DXA femoral trochanter and Ward’s area BMD. Relationship of pQCT trabecular BMD with calcaneal ultrasound attenuation and velocity. Relationship of pQCT trabecular BMD with DXA whole body BMD and ipsilateral whole arm BMD. Relationship of pQCTsubcortical BMD with DXA lumbar spine and femoral neck BMD. Relationship of pQCTsubcortical BMD with DXAfemoral trochanter and Ward's area BMD.Relationship of pQCTsubcortical BMD with calcaneal ultrasound attenuation andvelocity.Relationship of pQCTsubcortical BMD with DXA whole body BMD and ipsilateral whole arm BMD.Relationship of pQCT cortical BMD with DXA lumbar spine and femoral neck BMD.
xvm
Page103
104
105
106
107
108
109
110
111
112
113
114
115
116
117
I

Figure 6.17
Figure 6.18
Figure 6.19
Figure 6.20
Figure 6.21
Figure 7.1 Figure 7.2
Figure 7.3 Figure 7.4
Figure 7.5
Figure 7.6
Figure 7.7
Figure 7.8
Relationship of pQCT cortical BMD with DXA femoral trochanter and Ward's area BMD. Relationship of pQCT cortical BMD with calcaneal ultrasound attenuation and velocity. Relationship of pQCT cortical BMD with DXA whole body BMD and ipsilateral whole arm BMD. Proportions of women in the lowest quartiles of DXA BMD measurements also in the lowest quartiles of other mutually exclusive DXA measurements and pQCT BMD measurements. Proportions of women in the lowest quart il e of pQCT BMD measurements, also in the lowest quartile of calcaneal ultrasound attenuation and velocity measurements.Age related changes in pQCTtotal BMD.Age related changes in pQCTtrabecular BMD.Age related changes in pQCTsubcortical BMD.Age related changes in pQCTcortical BMD,Changes in pQCT total andt r a b e c u l a r BMD inpostmenopausal women as a function of duration since the menopause.Changes in pQCT subcortical and cortical BMD in postmenopausal women as a function of duration since the menopause. Differences in pQCT BMD values between premenopausal and postmenopausal subgroups of perimenopausal women. Differences in axial DXA BMD values between premenopausal and postmenopausal subgroups of perimenopausal women.
Page118
119
120
121
122
144145146147
148
149
150
151
1
XIX a.
/"'/ii:'.

Figure 7.9
Figure 7.10
Figure 7.11
Figure 7.12
Figure 7.13
Figure 8.1
Figure 8.2
Figure 8.3
Figure 8.4
Figure 8.5
Annualized rates of change in pQCT BMD values for p r e m e n o p a u s a l a n dpostmenopausal women studiedlongitudinally.Annualized rates of change in axial DXA BMD values forp r e m e n o p a u s a l a n dpostmenopausal women studiedlongitudinally.Relationships between theannualized rates of changes for radial pQCT total and DXAlumbar spine BMD inp r e m e n o p a u s a l a n dpostmenopausal women studied longitudinally.Relationships between the annualized rates of changes for radial pQCT total and DXAfemoral neck BMD inp r e m e n o p a u s a l a n dpostmenopausal women studied longitudinally.Relationships between the annualized rates of changes for DXA lumbar spine and femoral neck BMD in premenopausal and postmenopausal women studied longitudinally.Differences in pQCT BMD values between vertebral fracture and non-fracture groups. Differences in axial DXA BMD values between vertebral fracture and non-fracture groups.Receiver operator curves for axial DXA and pQCT BMD measurements discriminating vertebral fracture from nonfracture groups.Differences in pQCT BMD values between hip fracture and nonfracture groups.Differences in DXA hip BMD values between hip fracture and non-fracture groups.
XX
Page152
153
154
155
156
174
175
17 6
177
17 8
iaI

Figure 8.6
Figure 8.7
Figure 9.1
Figure 9.2
Figure 10.1
Figure 10.2
Figure 10.3
Figure 10.4
Figure 11.1
Figure 11.2
Figure 11.3
Figure 11.4
Differences in calcaneal ultrasound values between hip fracture and non-fracture groups.Receiver operator curves for hip DXA, pQCT BMD and calcaneal ultrasound measurements discriminating hip fracture from non-fracture groups. Longitudinal percentage changes in pQCT and axial DXA BMD measurements in response to hormone replacement therapy. Longitudinal percentage changes in pQCT and axial DXA BMD measurements in response to cyclical etidronate. Differences in pQCT BMD values between warfarin and control groups.Differences in axial DXA BMD values between warfarin and control groups.Relationship between pQCT trabecular BMD and warfarin duration, dose and INR. Relationship between DXA lumbar spine BMD and warfarin duration, dose and INR.Axial DXA BMD measurements of controls, non-steroid treated and steroid treated women with rheumatoid arthritis. pQCT BMD measurements of controls, non-steroid treated and steroid treated women with rheumatoid arthritis. C a l c a n e a l u l t r a s o u n dmeasurements of controls, nonsteroid treated and steroid treated women with rheumatoid arthritis.Relationship between pQCT trabecular BMD and selected disease variables of rheumatoid arthritis.
Page 17 9
180
194
195
203
204
205
206
223
224
225
226
XXI
-..'

Figure 11.5
Figure 11.6
Relationship between calcaneal BUA and. selected diseasevariables of rheumatoidarthritis.Relationship between calcaneal VOS and selected diseasevariables of rheumatoidarthritis.
Page227
228
xxu
5'■.r
CHAPtER 1 îINtRODUCtIONThis thesis examines the clinical role of peripheral quantitative computed tomography (pQCT) in the expanding field of osteoporosis. pQCT is a relatively new method of measuring bone mineral density (BMD) at appendicular sites, and when the work for this these was undertaken, there was very little
■ipublished work on its use. It is a technique which offers
was to evaluate pQCT in relevant areas of clinical care for those suffering from osteoporosis, in an attempt to define a niche for its use.
Understanding the fundamentals of bone pathophysiology and biomechanics ; osteoporosis - its definition and aetiologies; and osteo-densitometry - particularly present day techniques and defined roles, was essential in planning the work
1
potential advantages over existing methods by assessing trabecular and cortical bone compartments independently at an easily accessible peripheral site. This facility is important as trabecular and cortical bone behave differently dependingupon the prevailing circumstances. In addition, pQCT measurements are truly volumetric, and therefore reflect true BMD, unlike many other techniques which "correct" bone mineral content for the projected area. While several peripheral sites are accessible to pQCT, work for this thesis was limited purely to the ultra-distal radial site. Osteoporosis is recognised as a huge clinical problem and a considerable drain upon NHS resources. Delivery of effective health care for those suffering from osteoporosis includes provision of facilities to measure BMD (1.1). The purpose of this thesis
"Si
presented hereafter. The remainder of the introduction sets out present day knowledge of these matters.
1.1. Bone1.1.1 Normal Cellular FunctionBone is the living tissue that forms the skeleton, providing a mechanical framework of support. Skeletal growth occurs during childhood and adolescence, and involves bone modelling by either endochondral or intramembranous ossification. During adult life, bone undergoes the continuous process ofremodelling in response to the changing needs of anindividual. Remodelling comprises or a series of complex interactions between cells and the extracellular matrix. Two processes are responsible for remodelling - bone resorption where osteoclasts remove bone, and bone formation where osteoblasts lay down bone. The opposing functions ofosteoclasts and osteoblasts are closely linked by a phenomenon known as "coupling", with resorption then formation occurring in discrete areas known as "basic multicellular units" (BMU) . The process of coupling within a BMU is depicted in figure 1.1. Arrival of osteoclasts on the bone surface signals the initiation of bone remodelling. Osteoclasts are derived from haematopoietic granulocyte-macrophage fibroblast colony- forming units (1.2,1.3) which also produce monocytes and macrophages. The point at which they become committed to the osteoclast lineage is not clear, but osteoclast progenitors migrate from bone marrow to bone through the circulation or by direct migration (1.3). Having arrived on the bone surface, osteoclasts remove a quantum of bone leaving a "resorption pit". This is achieved through the expression of many features of the macrophage (1.3). Bone resorpting agents are secreted
into the extracellular space and bone is broken down. Internalization of the products occurs through phagocytosis before being further processed (1.2). The process of coupling attracts osteoblasts into the resorption cavity. Osteoblasts are derived from the pluripotent mesenchymal stem cells of the bone marrow (1.2,1.3), which can differentiate into fibroblasts, chondrocytes, adipocytes, and muscle cells. The progenitors which produce these cell lineages are known as fibroblast colony-forming units (1.3). The main function of osteoblasts is secretory. Deposition of the extracellular matrix occurs within the resorption cavity that is subsequently mineralised. The synthesis, deposition and mineralization of the extracellular matrix require the orderly expression of several genes, their correct expression being prerequisite for the next (1.4) . Type I collagen is the major matrix component secreted by the osteoblast and the main structural protein of bone. Its expression occurs early, during the proliferative phase of osteoblast function. Synthesis of many other non-collagenous proteins occurs. To name but a better known few, alkaline phosphatase and osteopontin are expressed later during the osteoblast matrix maturation phase. Osteocalcin is expressed even later during its mineralization phase (1.4). Filling of the resorption cavity is achieved with completion of osteoblast function. The surface is then covered with flattened cells that line the surface of all bone that is quiescent (1.2), Remodelling occurs continuously throughout the skeleton during adult life. Inspection of the surface of a section of bone reveals several resorption hollows at different stages surrounded by areas of quiescent bone. The control of osteoclast and osteoblast function and its coupling is extremely complex, involving

cellular interplay, the interaction of many cytokines and hormones, and local mechanical factors (1.2,1.3).
PropertiesDivision of bone is possible into two distinct types cortical and trabecular.
Î
1.1.2. Bone types, Skeletal Distributions and Biomechanical
ICortical bone makes up approximately 80% of the skeleton. It consists of a series of irregularly spaced, overlapping cylindrical structures known as Haversian systems, each comprising a central canal surrounded by concentric layers of bony tissue. Remodelling of cortical bone occurs at periosteal and endosteal surfaces, and within the Haversian canals. Increased Haversian system resorption will cause increased porosity of cortical bone, while increased periosteal and endosteal resorption results in increased numbers of surface
'BMU'8 (1.5). The proportion of cortical and trabecular bone varies within individual bones and according to skeletal site. Cortical bone is found primarily in the diaphyseal region of long bones in the appendicular skeleton, with metaphyseal areas containing a smaller proportion. With increasing age, endosteal exceeds periosteal resorption resulting inprogressive cortical thinning, an increased intramedullary ;Space and a small increase in the diameter of the bone(1.5,1.6). There is considerably less cortical bone in the i
■3iaxial skeleton, where trabecular bone predominates. However, ÿwithin the clinically important vertebrae, the vertebral body has a thin envelope of cortical bone, and the posterior elements are predominantly cortical bone (1.5,1.7), contributing significantly to antero-posterior lumbar spine I
4
-I

bone mass assessments - 53% in women and 44% in men (1.7).
Trabecular bone comprises approximately 20% of the skeleton, and consists of a meshwork of interconnecting trabeculae. It is found predominantly in the axial skeleton within the vertebral bodies and flat bones, and within the metaphyseal region of lone bones in the appendicular skeleton (1.2,1.5). Due to the greater surface area to volume ratio of trabecular bone, it is metabolically more active and responds more quickly to stimuli than cortical bone (1.2,1.3,1.5,1.8). Consequently, about 25% of trabecular, compared to 3% of cortical bone is remodelled each year during adulthood (1.3,1.9). Of great importance is the effect of the menopause upon bone quantity and quality. Ovarian failure and reduced levels of circulating oestrogen in women results in increased activation of BMU's, with increased bone resorption and a deficit in bone formation within each BMU (1.10,1.11) , The net effect is bone loss, which preferentially effects trabecular bone. Not only is the BMU activation frequency increased, but the depth of resorption cavity is also increased (1.11,1.12). This results in increased perforation of trabecular plates, decreased connectivity and disruption of the trabecular lattice structure, and subsequent reduction in load carrying capacity (1.11,1.13).
Also of importance is the presence of bone marrow, which is in close proximity to trabecular bone within the medullary cavities of bone. During childhood and adolescence, red or haemopoietic marrow is present in all bones. By the age of 20, marrow in the long bones has become inactive, being replaced by fat, which is then known as yellow marrow (1.14) . This
.■■ ■. , ■■ , ■ ' " /I. I" ■

occurs in all long bone with the exception of the upper femur and humerus. In addition to the upper humerus and femur, haemopoietic marrow persists in the axial skeleton. However, marrow fat increases by about 7% per decade in the vertebral body (1.15). Consequently, the proportion of active marrow in elderly females with vertebral fractures is as low as 25% (1,5) . This age related change in the distribution and type of bone marrow may have important implications for themeasurement of BMD, and the response of bone to differentstimuli.
In this thesis, the radius, lumbar spine, proximal femur andos calcis are the main skeletal sites studied, and theproportion of cortical and trabecular bone varies withskeletal site. At the radius there is variation in theproportion of cortical and trabecular bone along the radial length. Four common measurement sites are encountered in the literature, these being denoted by the percentage of the total radial length, proximal to the most proximal point of theradio-carpal joint that the measurement occurs. The mostdistal measurement site is the 4% "ultra-distal" site where typically 50-55% of bone is trabecular (1.16,1.17). pQCT measurements occur at this site. At the 8-10% "distal" site, characteristically 25% of the bone mass is trabecular, and less than 10% at the 33% "1/3", and 50% measurement sites(1.16) . The radius has been the subject of extensive study previously, mainly using single photon absorptiometry (SPA). This technique and others are discussed in greater detail later in this chapter (see section 1.3). It is worth stating at this point however, that SPA measurements occur at the distal, 1/3 and 50% measurement sites where the proportion of

trabecular bone is much lower than that found at the ultra- distal "4%" site. It is also worth noting that there are dramatic changes in the proportion of cortical and trabecular bone within the distal radius, which occur within small distances (1.16,1.17,1.18,1,19). The proportion of trabecular bone in the lumbar vertebral body is about 65% (1.2,1.5,1.20). In the proximal femur, the proportion is about 25-3 0% at the femoral neck (1.2,1.5,1.20), increasing to approximately 50% within the trochanteric region (1.20). The proportion at the os calcis is 90-95% (1.21).
Bone mineral density contributes about 75-85% of bone strength(1.22), with both cortical and trabecular components being important (1.22), A decline in bone mass results in a disproportionately greater decrease in bone strength(1.9.1.22). Bone mass of the spine (1.9,1,13,1,23,1.24,1.25), proximal femur (1.26,1.27,1.28) and distal radius (1.29,1.30) is strongly related to bone strength. For trabecular bone, both bone density (1.13,1.31,1.32,1.33) and structure(1.9,1,22) are important in determining its strength. Halving the cross-sectional area of a vertical trabecular column, or doubling the effective vertical length of the column through loss of horizontal support reduces its carrying capacity by 75% (1.22). Although trabecular bone is of great importance,cortical bone at the spine (1.31,1.34), femoral neck (1.26,1.35) and radius (1.36) are also important in determining the overall strength of bone. More pertinent inthe context of this thesis, both cortical shell geometry andtrabecular BMD at the ultra-distal radial site (1.36), and cortical BMD and thickness at the distal 1/3 site (1,37) as assessed by pQCT, is related to fracture force.

1.1.3 Normal Age Related Bone Mass ChangesA simple graphic representation of gender and age related changes in BMD is shown in figure 1.2. Skeletal growth and bone mass increases during childhood (1.38,1.39,1.40,1.41). During puberty, there is rapid skeletal growth matched by an increase in bone density (1.41,1.42,1.43,1.44,1.45). Marked accumulation occurs at the lumbar spine during puberty(1.43,1.44), while a more linear increase has been found at the radius (1.40), albeit assessed by SPA. It is possible that accretion of cortical and trabecular BMD during childhood and adolescence may differ. This issue cannot be adequatelyaddressed using measurement techniques which measure areal BMD, such as SPA and DXA. Maximum accretion of bone mass occurs during early adulthood, and the maximum potential in an individual is known as peak bone mass (PBM).
PBM is an important concept in the pathogenesis ofosteoporosis, as fracture risk in later life is considered (although not yet proven) to be dependent upon PBM, and the rate of subsequent bone loss in later life (1.46,1.47,1.48). PBM in men is generally accepted as being greater than that in women. While this is accepted at the radius (1.40,1.49,1.50,1.51,1.52), it is more controversial at the spine, some having found greater bone mass in males(1.53,1.54), others having found no gender difference (1.52,1.55,1.56). It is thought that areal BMD measurements acquired using dual energy x-ray absorptiometry (DXA) and dual photon absorptiometry (DPA), rather than volumetric BMD measurements using QCT may account for in part these discrepancies, as the greater bone size in males results in an overestimation of areal BMD gender differences (1.57).
8
However, even data acquired using volumetric measurements have been conflicting (1.53,1.54,1.55,1.56). PBM is predominantly influenced by genetic factors, which account for about 80% of the population variance (1.58,1.59). Other factors such as parity and lactation, oral contraceptive use, diet, physical activity and smoking have been shown to have an inconsistent and variable effect upon PBM (1.49,1.60). There is controversy regarding the timing of PBM (1.46). Based upon older, cross- sectional data, the consensus was that PBM was attained by the end of the third decade (1.46,1.51). Recent cross-sectional (1.44,1.60,1.61,1.62,1.63,1.64) and longitudinal (1.45,1.65) studies with greater numbers of subjects suggest that PBM is achieved by the end of the second decade.
After acquisition of PBM, bone mass is generally considered to be maintained until the latter part of the fifth decade, after which continuous trabecular and cortical bone loss occur at all skeletal sites, in all individuals of both sexes(1.47,1.49,1.51,1.64,1.66,1.67,1.68,1.69,1.70,1.71,1.72,1.73) . Following the menopause, women experience a phase of accelerated bone loss which preferentially effects trabecular bone (1.49,1.64,1.66,1.67,1.74,1.75,1.76,1.77). This lasts approximately ten years and is caused by ovarian failure and oestrogen deficiency. There is controversy regarding the timing of bone loss at different skeletal sites. Most would agree that radial BMD is stable until the end of the fifth decade, or until the onset of the menopause(1.50,1.51,1.63,1.68,1.69,1.70,1.78,1.79), although others have shown bone loss in premenopausal women in a longitudinal study (1.80). The issue is less clear at axial sites, wheresome cross-sectional studies have documented reductions in BMD

at the hip (1.68,1.72,1.81) and spine (1.51,1.74) earlier than the fifth decade, as have longitudinal studies at the spine (1.70,1.82,1.83). If premenopausal bone loss does occur, it is considerably less than postmenopausal loss, and much less important (1.84).
Controversy also exists about bone loss in the elderly. Some work has suggested that bone loss may cease or actually increase at the spine, hip and radius (1.73,1.85). This assumption however, has been called into question. Several factors such as selection of a fracture free population, secular trends in BMD, mortality of fracture patients, and accuracy errors of BMD measurements due to concomitant osteoarthritis and marrow fatty changes, confound the study of the elderly. All these confounding factors (except marrow changes) will lead to an over-estimatation of BMD, and an under-estimatation of the rates of bone loss in the elderly (1 .86).
1.1.4 Describing BMD Measurements: t-Score and Z-Score
IIt is important to describe BMD values in such a way that is easy to understand, and that gives as much information as possible without being misleading (1.87,1.88). There areseveral approaches to this.
1. The absolute BMD value. This alone has limitations as there are age and sex related differences in absolute BMD.
2. The percentage of the expected age and sex matched value. Although easy to understand, it has limitations and can be misleading. With ageing the mean value decreases, and
10

hence a decreasing denominator results in a wider range of percentage values representing the normal range. This is especially important if serial measurements are expressed as a percentage relative to the age related normal mean (not to be confused with expressing the percentage change relative to the baseline measurement). The percentile of the expected age and sex matched value. This is also easily understood, does not depend upon a normal distribution of data, and is not misleading in comparison to age matched controls or serial measurements. Unfortunately, expression of BMD as a percentile make age related comparisons difficult, and at present, they are not widely used by the manufacturers of osteo-densitometer.A unit of standard deviation (SD) from the normal mean. Data has to be normally distributed to allow BMD expression in this manner. Data not distributed normally require appropriate transformation. Population studies have demonstrated a Gaussian distribution of BMD values at all ages, in both sexes, at all skeletal sites when large enough numbers of subjects are studied. Comparison with other age groups is convenient and not misleading, but many clinicians are not familiar with data expression in SD units. Two different scores are commonly used. These are described below and graphically represented in figure 1.2.
11
Î

Z-score this value is the number of SD's above or below the sex and. age related normal mean.
t-score this value is the number of SD's above or below the mean value of young normals.
These values are now frequently used, and as discussed later in this chapter (chapter 1.2.1), the T-score is central to the definition of osteoporosis.
lÿ,
3IIh:?:i
Îi
• : s
Î
I
13
I
1.2 Os teoporos i s1.2.1 History and Definition of OsteoporosisOnly in recent years has osteoporosis received attention from the medical profession, and achieved public awareness that it warrants. The term "osteoporosis" was introduced to the medical literature in the 18th century (1.89). Its use implied a histological diagnosis of "porous bone" which was later refined to signify a reduced quantity of bone which was normally mineralised. This formed the basis for the first modern attempt to redefine osteoporosis using population based bone mass measurements performed by newer osteo-densitometers . Osteoporosis was thus defined as a BMD less than two standard deviations (SD) below the mean of young normal women i.e. a T- score less than -2 (1.90). This definition is solely dependent upon reduced bone mass, yet is it clear the structural deterioration in bone tissue is also of great important in determining bone strength. Moreover, few would argue that the most important end point of reduced bone mass, is fracture. This also is neglected in the above definition. Subsequently, the definition of osteoporosis was changed in 1991 to the following:
Osteoporosis is a disease that is characterized by abnormalities in the amount and architectural arrangement of bone tissue, which lead to impaired skeletal strength and an increased susceptibility to fracture (1.91).
Although this definition encompasses all the important concepts of osteoporosis, its clinical and research application is limited by being purely qualitative. To overcome this problem, the World Health Organisation recently
I

devised an operational definition which is based upon BMD and fracture occurrence (1.92).
OStEOPENIABMD more than 1 SD below the young normal mean, but less than 2.5 SD below.
i.e. -1.0 > t-score > -2.5
OStEOPOROSISBMD more than 2.5 SD below the young normal mean, without fracture.
i.e. t-score < -2.5 (no fracture)
SEVERE OStEOPOROSISBMD more than 2.5 SD below the young normal mean, with fracture.
i.e. t-score < -2.5 (plus fracture)
However, limitations persist even for these definitions. Structural considerations have been omitted, and the diagnoses of osteopenia and osteoporosis (without fracture) are dependent upon BMD measurement. Osteo-densitometry is therefore essential for the diagnosis of osteoporosis without fracture, a service not readily available to all at the present time in the UK. A further problem in definition is posed by intra-individual variation in BMD. Due to this, an individual can be classified as osteoporotic according to BMD at one skeletal site, yet not based upon another.
14

Consequently, the prevalence of osteoporosis in Caucasian women varies from 16% to 3 0% depending upon the number of skeletal sites assessed (1.92). Inspite of these limitations,this is the definition of osteoporosis which prevails at thepresent time.
Some idea of the magnitude now posed by osteoporosis has been shown by the applications of these definitions to a local American population in Rochester, with subsequent extrapolation nationwide. It has been estimated that 16.8 million (54%) postmenopausal white American women have osteopenia, and a further 9.4 million (30%) have osteoporosis from this calculation (1.93). Comparable figures from other populations (notably the UK) are not yet available, but these figures serve to illustrate the magnitude of the problem posed by osteoporosis.
1.2.2 Osteoporotic FracturesOsteoporotic fractures are characterised by incidence ratesgreater in females than males, rates which increase steeply with age, and a tendency to occur in skeletal sites richer in trabecular bone (1.94). The sites which are typically affected are the hip, thoracolumbar spine and distal radius, although fractures of the proximal humerus and distal femur also have the above characteristics (1.95). There are considered to be two distinct types of osteoporosis, leading to different fracture types (1.67). Type I osteoporosis (and fracture) is caused by ovarian failure, reduced levels of circulating oestrogen and increased bone loss. Trabecular bone is preferentially effected and greater bone loss occurs at skeletal sites richer in this bone type - namely the spine and
15

Idistal radius. Ultimately, this predisposes to vertebral and Colles' fractures (1.67). Type II osteoporosis (and fractures) results from age related reduction in both cortical and trabecular bone. This affects all individuals of both sexes, and predisposes to hip fractures (1.67). Graphic representation of the age and gender related incidence of hip, vertebral and distal forearm fracture is shown in figure 1.3.
16
Caucasian women and men have a lifetime fracture risk of 17.5% and 6% respectively for hip fracture, 15.6% and 5.6% forclinically diagnosed vertebral fracture, and 16% and 2.5% for distal forearm fractures (1.96), Determining the exact prevalence and incidence of vertebral fracture is complicated by asymptomatic events, and the application of differing fracture criteria (1.97). This is discussed in greater detail in section 1.2.2.2. However, from the age of 50 years onwards, the life-time risk for any of the three fractures is 39.7% for women and 3.1% for men (1.96). Consequently, in the UK around 50,000 hip fractures, 40,000 clinically diagnosed vertebral fractures and 50,000 distal forearm fractures will occur annually in women (1.12), costing the National Health Service an estimated £740 million (1.1). With an increasingly aged population, these figures are set to rise (1.98). Specific osteoporotic fractures are discussed briefly below.
1.2.2.1 Hip FractureHip fracture is the most serious of the osteoporotic fractures. Its incidence rises exponentially with age, and above the age of 50 there is a females to male ratio of 2:1 (see figure 1.3) . The lifetime age and sex related hip fracture rates are higher in Caucasian compared to Black or Asian populations (1.99), the female predilection also being
rt.i --Ji" i L is-:. ■■■
absent in the latter populations (1.95). There are also regional differences in hip fracture incidence between (1.95,1.100,1.101), and within countries (1.95). There is significant morbidity and mortality associated with hip fracture, with the relative survival rate at 5 years being 0.8 3 (1.94). The majority of deaths occur within 6 months of fracture, and are related to concomitant illnesses (1.102), although some are due to complications of the fracture or its surgical management (1.103) . Aetiological factors in the pathogenesis of hip fracture are discussed further in chapter 8 .
1.2.2.2 Vertebral FractureInspite of being synonymous with the diagnosis of osteoporosis, information on the epidemiology of vertebral fracture remains scanty. This is in part due to clinically silent fractures, which necessitates clarification of the distinction between "fracture" and "deformity". "Fracture" applies to morphometric abnormalities detected as a consequence of symptoms, usually back pain or loss of height. "Deformity" refers to abnormalities detected from morphometric studies which have been performed regardless of clinical symptoms (1.95). Gathering of epidemiological information has also been hindered by the lack of universal agreement on the definition of a vertebral fracture. There are many differing definitions based upon vertebral body morphology (1.104,1.105,1.106,1.107,1.108,1.109). There are two main methods of determining deformities/fractures at the present time. Quantitative method relies solely upon vertebral height measurements. Semi-quantitative methods require inspection of the x-ray by a radiologist as well as measurement of vertebral
17

heights. Semi-quantitative methods have the advantage of allowing differentiation of change due to conditions other than osteoporosis (such as Schuermanns disease) from true vertebral fracture. However, it is also highly dependent upon the experience of the radiologist, and reproducibility can be a problem, especially if criteria are not laid down. As each vertebral body has characteristic dimensions (1.104), probably the most widely accepted definitions incorporate a distribution of vertebral body dimensions for each spinal level, with cut-off values defining a fracture (1.95,1.106,1.107). However, to date there is no agreement as to which of these numerous methods of defining a vertebral fracture is best.
The incidence of clinically diagnosed vertebral fractures is shown in figure 1.3. In men the incidence rate increases exponentially, whilst in women there is a more linear increase. The most common spinal level for fracture is the lower thoracic and upper lumbar spine (1.95), most occurring as a result of minimal trauma. It has long been appreciated that morbidity is associated with vertebral fracture. Now there is recognised to be significant associated mortality, with a relative survival rate of 0.82 (1.110).
1.2.2.3 Distal Fore-arm FractureThe incidence pattern of this type of fracture differs from that of hip and vertebral fractures (see figure 1.3) . In women, the incidence rate increases linearly between the ages of 40 and 65 years before stabilising. In men, there is a linear increase from the age of 20 to 80 years. The majority of fractures occur in females (females:male ratio of 4:1).
18

Although morbidity arises from this fracture, there is no associated mortality (1.95) .
1.2.3.1 Risk Factors and Causes of Secondary OsteoporosisThe importance of ageing in type 2 osteoporosis, and the menopause, ovarian failure and hypoestrogenaemia in type 1
19
'3
i
::osteoporosis has already been eluded to in the preceding sections of the introduction. Table 1.1 lists the large numbers of lifestyle factors, concomitant diseases and drugs which adversely affect bone and predispose to osteoporosis (1.11,1.49,1.111). They are too numerous to discuss in detail in the introduction of this thesis, although some are discussed in greater detail in the relevant chapters of this thesis. Worthy of further discussion at this point however, is corticosteroid induced osteoporosis which is probably the commonest cause of secondary osteoporosis. Unfortunately, it was not possible to study its effect on bone per se, although its was studied in patients with rheumatoid arthritis, work which is presented in chapter 11. Corticosteroid induced osteoporosis is therefore discussed below.
1.2.3.2 Corticosteroid Induced Osteoporosis.Direct Bone Effects.Corticosteroids uncouple bone metabolism in favour of resorption, at least early in the course of therapy. Osteoblast function and precursor differentiation are directly inhibited, whilst the rate of mineral apposition is reduced resulting in inhibition of bone formation (1.112). Conversely, bone resorption is probably increased, although the evidence supporting this is less convincing and there is no convincing evidence that corticosteroids directly stimulate osteoclasts.
However, increased numbers of osteoclasts have been demonstrated histomorphometrically (1,113), It is thought that the increased osteoclast activity is a consequence of mild secondary hyperparathyroidism induced by depressed intestinal calcium absorption (1.114) and increased urinary calcium excretion (1.115). Thus the overall effect of corticosteroid is to reduce bone formation and probably increase bone resorption resulting in net bone loss (1.116).
Indirect Hormonal EffectsAdequate levels of oestrogen and testosterone are necessary for healthy bone. Corticosteroids have been shown to reduce circulating oestrogen levels by blunting the LHRH dependant pituitary release of LH (1.117), and the FSH dependant gonadal release of oestrogen (1.118,1.119) and testosterone (1.120,1.121). Likewise, there is evidence that adrenal androgens are important in maintaining bone density, with low dehydroepiandrosterone (DHEA) levels predicting reduced femoral BMD in post menopausal females (1.122,1.123). Corticosteroids cause ACTH suppression and adrenal atrophy, reducing androstenedione and oestrogen levels (1.124).
Vitamin D plays an important role in calcium homeostasis and bone metabolism, but as yet its role in corticosteroid induced osteoporosis in unclear. The inhibition of intestinal absorption would appear to be independent of Vitamin D status (1.125,1.126). The importance of mild secondary hyperparathyroidism has already been eluded to, net calcium loss through decreased intestinal absorption and increased renal excretion being the stimulus (1.114,1.115). Normocalcaemia is usual, and although conflicting levels of
20
PTH (normal or high) have been demonstrated, bone biopsies showing increased osteoclast activity(1.113) and increased nephrogenic cAMP measurements(1,127) support the contention that corticosteroids induce a state of mild secondary hyperparathyroidism. Thus corticosteroids have a profound effect on a variety of hormones involved in bone metabolism with changes favouring bone loss.
Effects upon Bone Mineral Density and Fracture.High dose corticosteroid therapy can cause annual bone loss of 5-15% (1.128,1.129,1.130). However, not all patients lose bone (1.129,1.130), and recovery after cessation is possible (1.131) . Although both trabecular and cortical bone are adversely effected, greater loss occurs from the former (1.128,1.132,1.133,1.134). The long term consequences of this is an increased fracture rate of femoral neck, rib and particularly thoracolumbar spine (1.116,1.135). The true incidence of fracture at this latter site has not been accurately defined, because painless fractures often escape detection.
Bone loss occurs most rapidly during the first few months of corticosteroid therapy, with subsequent slower, but continued bone loss(1.128,1.136,1.137). Low dose therapy (less than 7. 5mg/ day prednisolone) may have less effect on premenopausal than postmenopausal women or men(1.138) . Larger doses however, affect all population groups irrespective of age, menopausal status, sex or racial origin, with evidence suggesting that children and postmenopausal women lose bone especially quickly(1.139). The latter group are most at risk of fracture presumably due to the additive effect of oestrogen deficiency.
21 ■?

22
' l i
The cumulative dose has been found by most investigators to relate to the amount of bone loss, although a threshold value over which this becomes critical has not been established. Alternate day dosing offers no protection against bone loss(1.139), and all corticosteroids affect bone adversely although, equipotent doses of Deflazacort have been shown to have a less detrimental effect than other synthetic steroids (1.140). Corticosteroid induced bone loss occurs irrespective of the underlying condition being treated. Recent interest has focused on the effect of inhaled steroids used in the § management of asthma on bone. Evidence is mounting that even this small dose may adversely affect bone(1.141,1.142). The longterm importance of this is yet to be established.
Through quantification of trabecular bone, pQCT would be ideally suited to monitor the effects of corticosteroid. #Ruegsegger et al (1.139, 1.143) have studied a small numbers of asthmatics treated with corticosteroid for 1 year and found dose related reductions in trabecular BMD at the radius up to 17.5%, while cortical BMD was unaffected. Beyond these small, 'Iinitial studies there is a paucity of data examining the use #of pQCT in monitoring the effect of corticosteroid on bone.At the present time, axial DXA BMD assessments are indicated for the management of patients likely to be treated with corticosteroid for more than one year (1.144,1.145,1.146). Further work is necessary to establish whether pQCT has a role in the management of corticosteroid induced osteoporosis.
aa
a
1.3 techniques Used to Assess Bone MassDevelopment of methods to assess bone mass has contributed immensely to the recent increased awareness of osteoporosis as a serious health issue. Clinicians and the public alike, are now informed that there are methods available to assess bone mass, albeit some more than others. These methods must satisfy several criteria before they can be utilised clinically. They must be accurate (reflect true bone mass), precise (reproducible) in the short and longterm, acceptable to the patient and safe in terms of radiation exposure. A number of methods exists to assessing bone mass, some more readily available than others. These have been reviewed extensively before (1.88,1.147-1.154). Techniques such as neutron activation analysis (1.147, 1.155),compton scattering (1.147) and proton activation (1.147) are not routinely used. A new area of interest, which is still very much a research tool is quantitative magnetic resonance imaging. This may reveal information about trabecular bone microstructure as well as density (1.147,1.152,1.153,1.154). The following section is a summary of the commonly used, present day methods of assessing bone mass.
1.3.1 RadiographsA plain x-ray can detect fracture, but is not sensitive enough to accurately assess BMD (1.5,1.156). Structural analyses of radiographs have been developed in an attempt to improve the diagnostic ability of x-rays.
The pattern of trabeculae in the proximal femur can be graded, and is known as the Singh index (1.157). With age related trabecular thinning, the grade changes from VI to I. Although
23
the index is lower in women with hip, vertebral of Colles |i;]fractures, it has been criticised by some {1.155,1.156), but
not others (1.159) for its subjectivity and high interobserver variability. It has a low sensitivity but high specificity for diagnosing low bone mass, with a large overlap in BMD between grades (1.158,1.159). It may have a adjuvant role in conjunction with BMD, geometric or morphometric assessments in fracture prediction, but this requires furtherstudy.
conditions. Less frequently the radius, humerus, clavicle.
24
Radiogrammetry is a technique where a high quality antero- posterior x-ray of the hand is performed under standard
tibia and femur have been studied. In the hand, numerous measurements from the metacarpal (usually the second) are used ||to calculate various indices. As a technique of assessing bone
3mass, it is limited to peripheral site, is time consuming, requires skilled personnel, assesses only cortical bone, detects only advanced osteoporosis and is therefore not
lï:routinely used today (1.5,1.155).I,g:
Radiographic absorptiometry, which was previously known as 1photodensitometry, is a technique where an x-ray of a peripheral bone (usually phalanges, less commonly radius or tibia) is obtained under standard conditions together with an $aluminium reference wedge. The density of bone on x-ray is Ithen derived by comparison with the wedge using an opticaldensitometer. There has been some resurgence of interest in gS'photodensitometry (1.160), with computer enhanced analysis and improved performance. Precision has improved to 1.5-2% #(1.161,1.162) which is comparable with other scanning
modalities such as DXA. It is a readily available technique of low cost and low radiation dose. It correlates well with in vivo radial BMD as measured by SPA (1.161) and DXA(1.162,1.163), and moderately with axial hip and spine BMD as
25
.i
measured by DP A (1.161) and DXA (1.162,1.163,1.164). An age related decrease in the metacarpal index (one of the calculated parameters) has been documented (1.163), and evidence exists that it provides an estimate of vertebral and hip fracture risk (1.160,1.165). It may prove to be of value as a population screening tool, bearing in mind that DXA in not universally available.
1.3.2 Single Photon Absorptiometry (SPA)SPA was developed in the I960's. A highly collimated photon
'beam from a single energy radiation source (usually ^ I) is used
■to measure photon attenuation at the measurement site. Its use is limited to scanning peripheral sites as the scan site requires to be immersed in water to ensure uniform absorption of the single energy radiation from the surrounding tissues.The cortical rich radius is most commonly scanned, although the exact site can be varied to increase the proportion of trabecular bone. The distal femur and calcaneus can also bescanned. Precision is 1-3%, accuracy 5%, scan duration 15 minswith a radiation dose of 0.5-1.0 ptSv. A recent development has been the replacement of the ^ I source with a mini X-ray tube, giving the advantage of a stable photon source with improved longterm precision. This variation is known as single energy x-ray absorptiometry. ;
1.3.3 Dual Photon Absorptiometry (DPA)DPA overcomes the problems of soft tissue composition and
Î
water immersion encountered by SPA, by using a double energy source which emits two different photons energies. These photon energies have different bone and soft tissueattenuation properties which can be subtracted from each other allowing the BMD of axial sites such as the proximal femur and lumbar spine to be quantified. Total body scans can also be performed. Initially two isotopes (iodine: ^ I, andamericanium: ^ Am) were used, before the single isotopegadolinium ( ^ Gd) , with dual emission energies of 44 and lOOkeV, became the standard. Typically, precision values are 2-4%, accuracy 4-10%, scan duration 20 mins (45 mins for total body scans) and the radiation dose is around 1 ^Sv. Decay of the radiation source requires its replacement afterapproximately 18 months which can become expensive and further adversely affect precision. This lead to the replacement of isotopes by an X-ray source giving dual energy X-rayabsorptiometry.
1.3.4 Dual Energy X-ray Absorptiometry (DXA)DXA is now probably the most widely used scanning technique, and was introduced commercially in 1987. The radionucleotide source used in SPA and DPA was replaced with an x-ray tube. Two distinct energy level beams are generated by one of two methods. One method (used in Hologic scanners) uses rapid switching of the x-ray generator between high and low voltage settings. The other (used by Norland and Lunar scanners) produces a beam from a constant voltage, which is thenfiltered into two different energy beams. Measurements using DXA are possible at almost any skeletal site. Sites most commonly scanned are the antero-posterior and lateral lumbar spine, proximal femur, whole body, radius and calcaneus. At
26
27
Sthe hip a number of different measurements are recorded. The femoral neck and trochanter areas have differing trabecular contributions as detailed in chapter 1.1.2. Ward's area is a derived region of maximum trabecular bone content in the proximal femur. For AP scanning of the lumbar spine, precision
.is less than 1%, and 2-3% at the hip. Accuracy is 5-10%, scan duration is less than 10 mins (20 mins for total body scans) and the radiation dose 0.1-0.4 ^Sv. Recently fan beam (rather than pencil beam) DXA scanner have been developed and are now commercially available. These scanners quantify BMD in the thoracolumbar spine, and the images produced also allow vertebral body morphometric analysis. This development is known as morphometric x-ray absorptiometry (MXA).
DXA is now considered to be the benchmark method of measuring BMD. There are however limitations worthy of discussion. DXA, like DPA and SPA provide planar, two dimensional BMD measurements, which are expressed as g/cm^. Such BMD measurements are influenced by skeletal size, and can be underestimated in small individuals (1.88). Although the lumbar spine is considered to be a trabecular rich site, antero-posterior scanning incorporates the posterior elements of the spinal column which is predominantly cortical bone (1.5, 1.7), and contribute 53% of BMD in women, and 44% in men (1.7) . This can be minimised by using a lateral projection, but at the expense of poorer precision and accuracy, a smaller region of interest and a radiation dose 5 times greater. Both spinal and hip DXA measurements are influenced by marrow fat content (1.86,1.166,1.167). Increasing amounts of fatty marrow with age underestimates the actual BMD, and overestimates the rate of age related bone loss (1.86). Spinal measurements can
■I:iÎ
also be falsely elevated by aortic calcification (1.168,1.169,1.170) or degenerative changes secondary to lumbar spondylosis (1.171-1.177), both of which are common with increasing age. There is also evidence that spinal osteoarthritis is related to an increased BMD secondary to changes in bone metabolism, not merely a consequence of osteophytosis (1.174,1.178,1.179), which can have a generalised effect upon BMD (1.177). AP spine Scanning of the hip is less plagued by confounding factors, although smaller regions of interest and rotation during positioning does affect data acquisition (1.180), resulting in poorer precision compared to that of the lumbar spine.
1.3.5 UltrasoundUltrasound was first used to measure properties of bone in the 1960's, but was not widely employed until much more recently. Ultrasound use in the context of bone analysis is based upon the interaction of sound waves with bone tissue. Two ultrasonic properties are altered with transmission through bone: 1) wave velocity, and 2) wave amplitude. Alterations in amplitude are known as attenuation, which is highly dependent upon the frequency of ultrasound used. With low frequency ultrasound, the attenuation is almost linear, whereas with higher frequencies, it is non-linear. For this reason, low frequency ultrasound (0.2 - 0.6MHz) is used . Ultrasoundmeasurements occur at peripheral sites, most commonly the calcaneus, less commonly at the tibia, patella or phalanges. In this thesis, only calcaneal measurements were done. This is a weight bearing, trabecular rich site with flat, parallel surfaces, at which overlying soft tissue is limited even in obese subjects, which has been extensively studied before.
28
Ultrasound measurements in this thesis were done using the McCue CUBA Clinical machine, the methodology of which is described in chapter 3. Two measurements are produced. Broadband ultrasonic attenuation (BUA) which is measured in dB/MHz, and velocity (VOS) which is measured in m/s. There are several slightly different variants of the velocity measurement. "True velocity" is the velocity of sound through bone tissue only. "Heel velocity" is the velocity of sound through bone and soft tissue. It is this measurement which is used throughout this thesis. Lastly, "time of flight" is the velocity of sound through coupling media, soft tissue and bone. The precision of BUA is 1-3.8%, and that for velocity 0.1-1.2%. Both BUA and velocity measurements are considered to reflect not only bone density, but bone structure (1.181- 1.184), although the importance of this property has been questioned (1.185). The major advantages of ultrasound are that it is a low cost, easily portable, radiation free technique, with a rapid scan time of less than 5 minutes. There are however several troublesome features of calcaneal ultrasound worthy of further comment. Precision of BUA remains poorer than other scanning techniques such as DXA. This may be related to the inhomogeneous nature of calcaneal trabecular bone, which in turn can influence the measurement depending upon the region of interest studied (1.186). Recent concern has also been expressed that the present generation scanners are inherently inaccurate (1.187). BUA does not scale linearly with bone size (1.188) (although this would not be a problem unless very large or very small bones were being scanned), or with high BMD values (1.184).
1.3.6 Quantitative Computed tomography (QCt)
29

Quantitative computed tomography was introduced in the mid 1970's, and measures true volumetric BMD, which is therefore expressed as g/cm^. It is also the only method which allows separate quantification of cortical and trabecular BMD. Spinal QCT has been used extensively. Accuracy of single energy spinal QCT is rather poor at 5-15% due to the effects of marrow fat (which increases with age) which falsely reduces BMD, especially in elderly osteoporotic women. Dual energy QCT is now available which improves accuracy to 5% but at the expense of a higher radiation dose and poorer precision (3-5% compared to 1-3% for single energy QCT), Scan time is about 10 mins, but radiation dose is high at 20-200 ^Sv, which limits its use in repeat scanning.
There are several area of recent development with QCT (1.149,1.150). The use of stacked-slice and spiral CT scans allow a greater volume to be measured with improved precision. A more detailed analysis of spinal trabecular and cortical compartments is possible with respect to the regional effects of ageing and therapy, the relative contributions to bone strength, and fracture discrimination. Such a method of scanning also permits separate analysis of proximal femur trabecular and cortical bone, as well as providing detailed information on geometry. This is not possible with planar methods, such as DXA and DPA, or conventional QCT scanning due to its complex architecture, and rapid three dimensional variation in density and composition. Also being developed is high resolution QCT which allows assessment of trabecular micro-architecture at both axial and appendicular sites. This can be considered as being equivalent to a non-invasive bone biopsy. These are all areas of future study.
30
1.3.7 Peripheral Quantitative Computed tomography (pQCt)QCT applied to peripheral measurement sites was introduced in the mid 1970's (1.189). Radionucleotide sources (usually ^ I) were used initially, but found to be restrictive. Long scan times introduced movement artifact, and only small diameter sites could be scanned (1.190). To overcome these problems, modern pQCT scanners use an x-ray source (1.50,1.75,1.78,1.190). There are approximately 700 pQCT scanners worldwide, mostly in Europe (1.150). Most of these commercially available systems, which are manufactured by Stratec (including the one used for this thesis), perform a single axial slice of 2.5mm thickness at 4% of the ulnar length from the distal radial cortical endplate. The scanning procedure is discussed further in chapter 3. A smaller number of scanners, produced by Densiscan, perform multi-slice, high resolution scans, with improved precision (1.75,1.149). Although the ultra-distal radius is the site most commonly scanned, measurements at the tibia are also possible (1.149). pQCT performs a true volumetric measurement of BMD, results being expressed in g/cm^.
In-vitro accuracy of pQCT has recently been determined from the study of 7 cadaveric forearms (1.19). The correlation between pQCT total bone mineral content and ashed weight at the standard measurement site was 0.87, with an accuracy error of 15.5%. The precision of pQCT is discussed further in chapter 3. It varies according to the scanner used, with in- vivo precision values for trabecular BMD using the multislice, high resolution scanner being about 0.35% (1.75),compared to 1-2% for its single slice counterpart (1.19,1.50,chapter 3).
31
,

Rapid, scan time of 10-15 minutes, forearm radiation dose of only 3 jLtSv and negligible whole body exposure, easy of use at readily accessible sites, and separate assessment of cortical and trabecular bone make pQCT a potentially attractive technique worthy of further study.
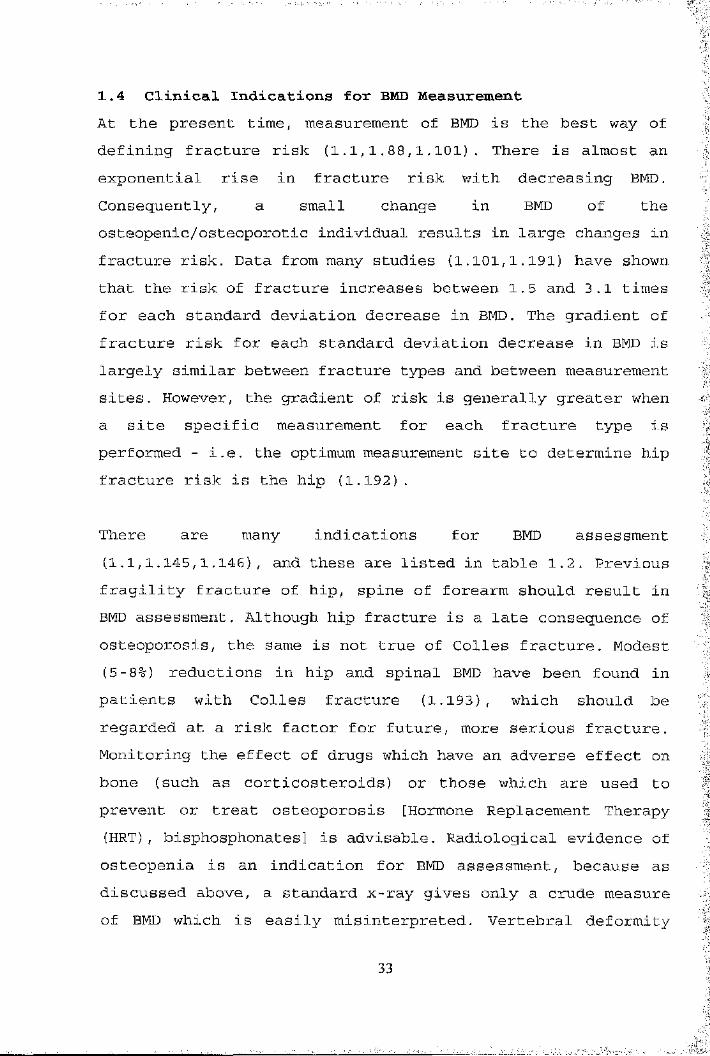
1.4 Clinical Indications for BMD MeasurementAt the present time, measurement of BMD is the best way of defining fracture risk (1.1,1.88,1.101). There is almost an exponential rise in fracture risk with decreasing BMD. Consequently, a small change in BMD of the osteopenic/osteoporotic individual results in large changes in fracture risk. Data from many studies (1.101,1.191) have shown that the risk of fracture increases between 1.5 and 3.1 times for each standard deviation decrease in BMD. The gradient of fracture risk for each standard deviation decrease in BMD is largely similar between fracture types and between measurement sites. However, the gradient of risk is generally greater when a site specific measurement for each fracture type is performed - i.e. the optimum measurement site to determine hip fracture risk is the hip (1.192).
There are many indications for BMD assessment (1.1,1.145,1.146), and these are listed in table 1.2. Previous fragility fracture of hip, spine of forearm should result in BMD assessment. Although hip fracture is a late consequence of osteoporosis, the same is not true of Colles fracture. Modest (5-8%) reductions in hip and spinal BMD have been found in patients with Colies fracture (1.193), which should be regarded at a risk factor for future, more serious fracture. Monitoring the effect of drugs which have an adverse effect on bone (such as corticosteroids) or those which are used to prevent or treat osteoporosis [Hormone Replacement Therapy (HRT), bisphosphonates] is advisable. Radiological evidence of osteopenia is an indication for BMD assessment, because as discussed above, a standard x-ray gives only a crude measure of BMD which is easily misinterpreted. Vertebral deformity
33
a aaI
warrants BMD assessment, as old traumatic vertebral fractures may not be associated with low BMD. Other findings, risk factors and conditions which are deserving of BMD assessment are shown in table 1.2.
.'is:
" :.T , •
:I
IÏ
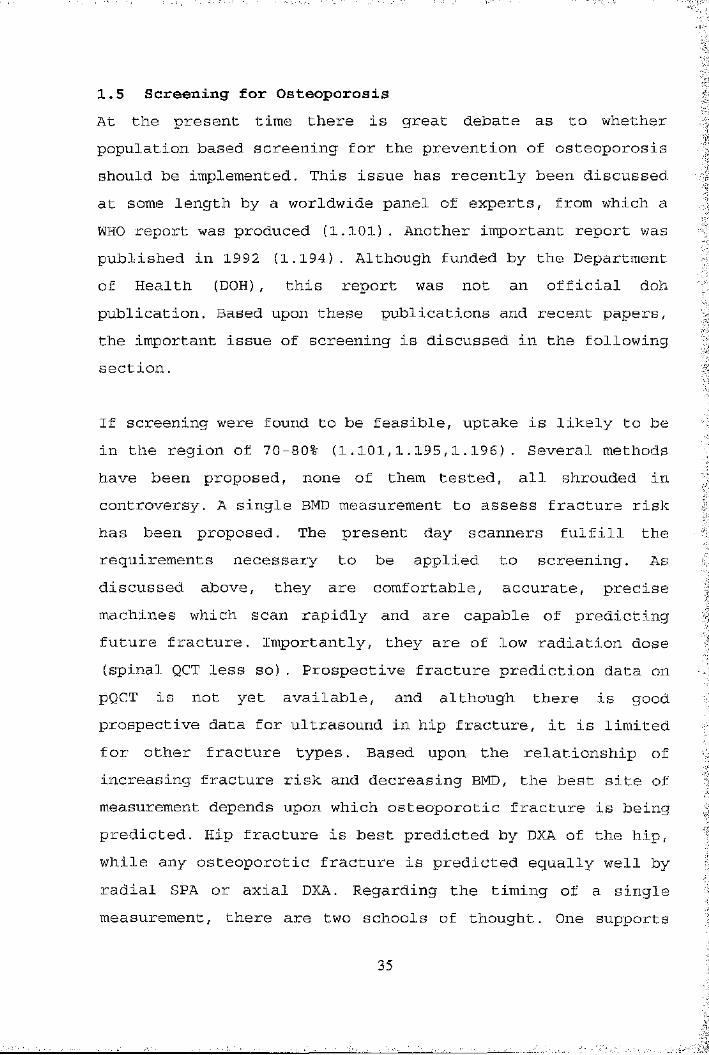
■!ÿj
1.5 Screening for OsteoporosisAt the present time there is great debate as to whether population based screening for the prevention of osteoporosis should be implemented. This issue has recently been discussed at some length by a worldwide panel of experts, from which a WHO report was produced (1.101). Another important report was published in 1992 (1.194). Although funded by the Departmentof Health (DOH), this report was not an official doh publication. Based upon these publications and recent papers, the important issue of screening is discussed in the following section.
If screening were found to be feasible, uptake is likely to be in the region of 70-80% (1.101,1.195,1.196). Several methods have been proposed, none of them tested, all shrouded in controversy. A single BMD measurement to assess fracture risk has been proposed. The present day scanners fulfill the requirements necessary to be applied to screening. As discussed above, they are comfortable, accurate, precise machines which scan rapidly and are capable of predicting future fracture. Importantly, they are of low radiation dose (spinal QCT less so). Prospective fracture prediction data on pQCT is not yet available, and although there is good prospective data for ultrasound in hip fracture, it is limited for other fracture types. Based upon the relationship of increasing fracture risk and decreasing BMD, the best site of measurement depends upon which osteoporotic fracture is being predicted. Hip fracture is best predicted by DXA of the hip, while any osteoporotic fracture is predicted equally well by radial SPA or axial DXA. Regarding the timing of a single measurement, there are two schools of thought. One supports
;
a
35
I

measurement during the perimenopausal years as there is profound bone loss following the menopause, and peak bone mass is considered important in determining future fracture risk. The other supports a measurement around the age of 65 years. This option seem more favoured at the present time {1.101,1.197) as bone loss (another important determinant of fracture risk) has had a substantial effect on bone mass, the incidence of hip fracture is still low, and it appears more cost effective to target intervention at this age compared to the age of 50 years.
Another propose method of screening is the use of repeat BMD measurements. Fast bone losers will more quickly reach a critical bone mass at which fracture is likely to occur. A second BMD measurement 5 years following the initial perimenopausal would be considered adequate to assess the rate of bone loss for screening purposes (although an earlier measurement is advisable to assess treatment response), but only improves the estimate of ultimate bone mass by about 50%. Peak bone mass (PBM) is considered to be of greater importance in determining fracture risk up to the age of 70, but thereafter the relative importance of rate of loss and PBM equates. It should be borne in mind however that the precision of repeat measurements worsens in older age, so that a smaller proportion of BMD variance will be related to bone loss. Allied to the concept of assessing rates of bone loss is the use of markers of bone metabolism. There is now a plethora of such tests, some indicating bone formation (bone iso-enzyme alkaline phosphatase, osteocalcin, collagen propeptides markers - PINP, PICP), other resorption (hydroxy-proline, pyridinoline, de-oxypyridoline, collagen degradation markers -
36

1-CTP, 1-NTP). Analysis of a panel of such markers is useful in characterising the rate of bone loss over many years. This in conjunction with a baseline BMD assessment is the third method of screening proposed. The development of more accurate and precise measures of BMD, and more specific markers of bone turnover may increase the predictive power of these proposed methods in the future.
Several criteria should be met before population based screening is accepted (1.101,1.194). Ideally a randomised controlled study should be performed which shows that screening reduces fracture rates - no such study yet exists. Failing this, several other criteria have to be considered. Firstly, the social burden of the disease should be great enough to warrant screening. As described above, osteoporotic fractures undoubtedly fulfil this criteria, being a major social and financial burden. Secondly, effective therapy must be available. HRT has been shown to reduce fracture incidence, but there was lack of data showing its longterm benefit in the elderly population. More recent studies shows longterm protection against vertebral and forearm fracture by HRT in the elderly (1.198,1.199). Also, conventional prescription of HRT is for a maximum of 10 years, after which bone loss resumes and fracture protection diminishes. The major benefits of HRT are to reduce cardiovascular morbidity and mortality, which weakens the case for targeting HRT treatment based upon BMD. However, BMD assessment may have a role if the result showed an individual to be at high risk, and they were willing to take HRT. BMD results have been shown to influence the prescription (1.200) and uptake (1.201,1.202) of HRT.
37

38
Conversely there is no indication to screen for low BMD if the individual is either intending to take HRT irrespective of the result, or would not consider HRT if low BMD was found. Non- HRT treatments are increasing available, and the increasing acceptance of their use should increase the justification for screening. Thirdly, the screening BMD measurement should adequately define future fracture risk. Although this has been shown to be the case, with hip fracture, the overlap in BMD between fracture and non-fracture patients is considered to be too great for screening purposes. Additionally, fracture prediction has been most extensively studied in older postmenopausal females. There is only early, preliminary data to suggest that a measurement during the perimenopausal years can predict future fracture (1.203,1.204). However, the follow up period reported is only 2 years, and the number of hip and vertebral fractures reported were small (1.203) or absent (1.2 04) . Lastly, the result of the screening test would have to encourage longterm HRT use. Although uptake of HRT has been ; shown to be influenced by a BMD result (1.201,1.202), its longterm use has not.
II
ftBearing in mind the above points, the consensus of opinion is that population based screening cannot yet be justified (1,101,1.194). However, gathering of hitherto lacking information, and advances in densitometry and available therapies will require this to be reviewed. Present day policyencourages case finding rather than population screening, whereby patient with suitable risk factors should be offered BMD measurements. There are many conditions which predispose to low bone mass, as detailed in table 1.1. However, it isonly those individuals with "strong" risk factors, as detailed
f

in table 1.2, who should routinely undergo BMD assessment, although clinical judgement must also influence this decision. It is noteworthy however, that clinical risk factors do not adequately predict BMD (1.205,1.206,1.207) and perform even worse in predicting fractures (1.207,1.208,1.209). As such they cannot be considered as a replacement for BMD measurement and fracture risk prediction, only a rough guide for further assessment.
39
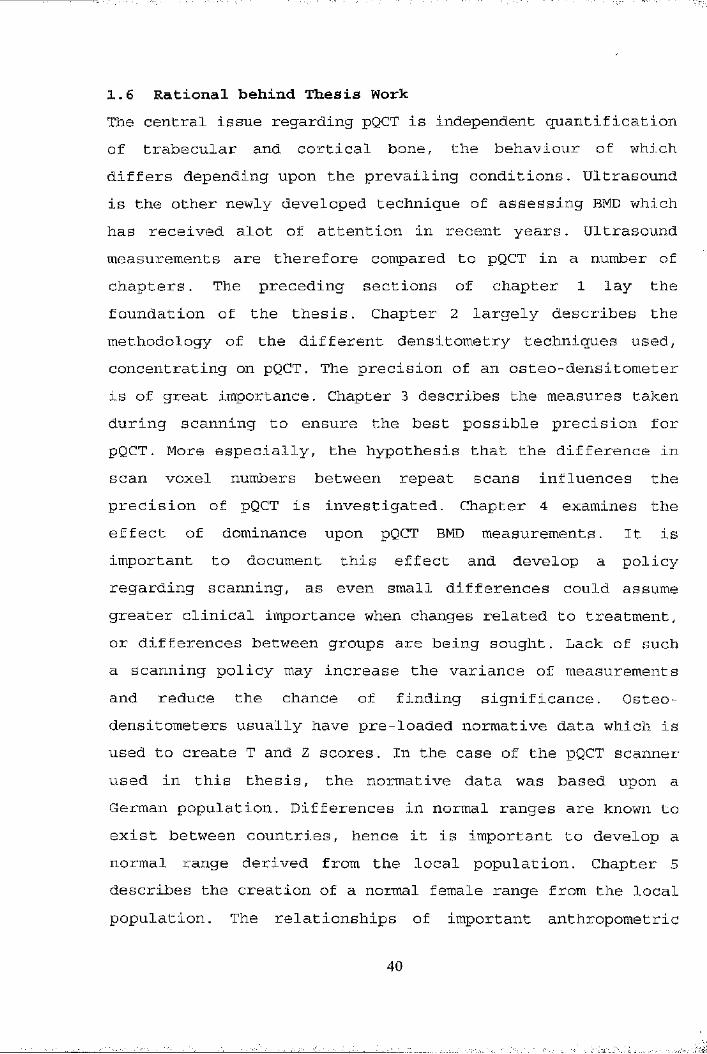
1.6 Rational behind thesis WorkThe central issue regarding pQCT is independent quantification of trabecular and cortical bone, the behaviour of which differs depending upon the prevailing conditions. Ultrasound is the other newly developed technique of assessing BMD which has received alot of attention in recent years. Ultrasound measurements are therefore compared to pQCT in a number of chapters. The preceding sections of chapter 1 lay the foundation of the thesis. Chapter 2 largely describes the methodology of the different densitometry techniques used, concentrating on pQCT. The precision of an osteo-densitometer is of great importance. Chapter 3 describes the measures taken during scanning to ensure the best possible precision for pQCT. More especially, the hypothesis that the difference in scan voxel numbers between repeat scans influences the precision of pQCT is investigated. Chapter 4 examines the effect of dominance upon pQCT BMD measurements. It is important to document this effect and develop a policy regarding scanning, as even small differences could assume greater clinical importance when changes related to treatment, or differences between groups are being sought. Lack of such a scanning policy may increase the variance of measurements and reduce the chance of finding significance. Osteo- densitometers usually have pre-loaded normative data which is used to create T and Z scores. In the case of the pQCT scanner used in this thesis, the normative data was based upon a German population. Differences in normal ranges are known to exist between countries, hence it is important to develop a normal range derived from the local population. Chapter 5 describes the creation of a normal female range from the local population. The relationships of important anthropometric
40

variables to different pQCT BMD measurements within thispopulation are also investigated in this chapter. It isrecognised that BMD at one site may not reflect that ofanother. Chapter 6 examines the relationship between pQCT BMD measurements, and measurements at other sites using different scanning modalities. It also touches on the potential use of pQCT should a screening program ever be implemented. Inchapter 7, cross-sectional age related changes in pQCT BMD's are determined from the population described in chapter 5. Perimenopausal change in BMD is considered to be profound, and preferentially affect trabecular bone. Differences in pQCT BMD between late premenopausal and early postmenopausal women are therefore examined, and compared to axial DXA differences in a cross-sectional study. Also in chapter 7, observed annual rates of change in pQCT BMD are compared to axial DXA changes in longitudinal studies of late premenopausal, and postmenopausal women. Of immense importance in the field of osteo-densitometry is the role of fracture prediction, and no work would be complete without addressing this issue. Prospective, fracture prediction studies require many years, which is outwith the timescale of this thesis. Discriminatory studies have demonstrated almost the same relationship between specific sites of BMD assessment and fracture risk as subsequent prospective studies, and are within a feasible timescale. The discriminatory power of pQCT in hip and vertebral fracture, was therefore compared to modalities known to discriminate and predict both these types of fracture respectively, the results of which are presented in chapter 8. There are now effective treatments for osteoporosis, although not all individuals respond adequately. Another very important role for osteo-densitometry is monitoring the response to
41

therapies such as HRT and bisphosphonates. Both these therapies preferentially increase trabecular BMD, and one could hypothesise that the pQCT trabecular BMD measurement may be particularly valuable in monitoring therapeutic response. The potential role of pQCT in monitoring response to HRT and etidronate is therefore examined in chapter 9, and compared to axial DXA measurements. The effect of warfarin on adult bone has received little attention. Chapter 10 describes the effect of longterm warf arinisation upon axial DXA BMD and appendicular pQCT BMD. The relative contribution of the inflammatory aspects of rheumatoid arthritis (RA), its inevitable effect on mobility and the use of low dose corticosteroid on appendicular and axial BMD remains controversial. Also, peripheral BMD measurements are being cited as potentially useful tools in monitoring disease progression and treatment response in RA. In chapter 11, these issues are addressed using pQCT, with comparison with axial DXA, and ultrasound measurements. The concluding chapter draws together the important findings from the previous investigative chapters, highlights potential areas of clinical use, and proposes potential explanations for the apparent difference in behaviour of axial and appendicular bone.
42
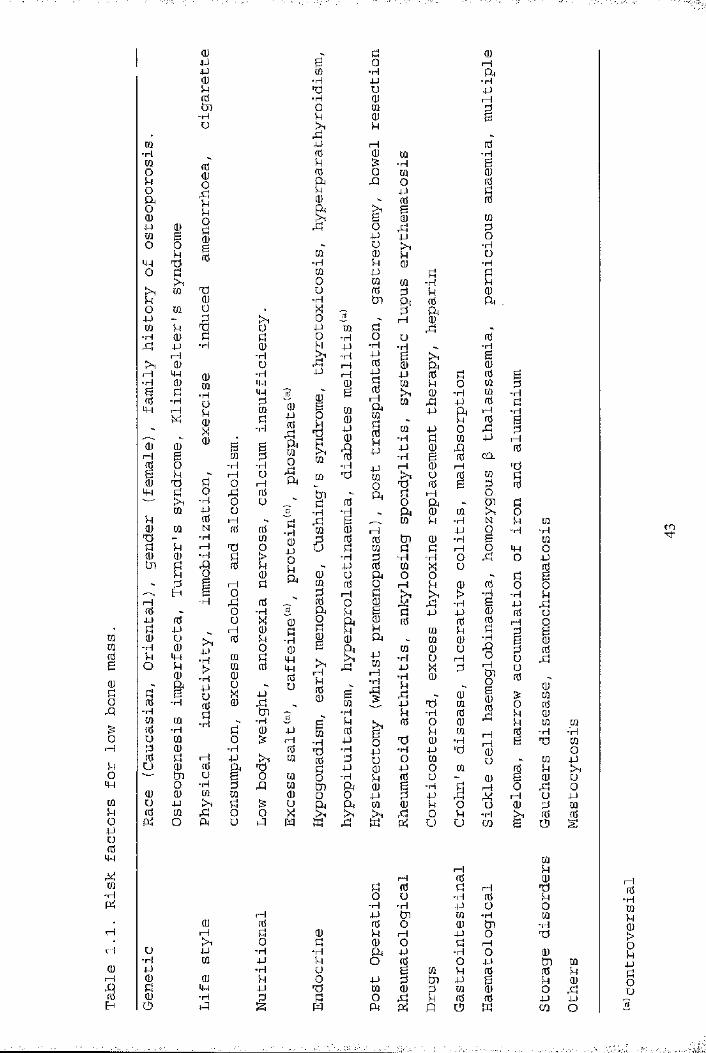
rataB
(U
oA
gO
mhOj-JurcitwM
-H
HH0)r-jI
(UJJ■UQ)54a■Ho
m•HmokOa
00Oo k0 0 044 km e 0o44
ok03 §0 kX 03N Mk 00 m U .44 - k rHm k V, U-H 0 k k44rH •H 0■H0 UrH 44 0 •H-H 0 44B k •H 440 -H Ü k44 rH MX 0 k
X ■Ha)" 0 0 2 BH B M k0 o -H -HB k rH U0 03 k 0 t—144 k 0 rk 0■H 0 uM P Ük 0 rH r.0 M N 0 003 - ■H mÜ k I-1 03 00 0 -H k >tn k A 0 kk o 0k H ky-— g orH ■H f: 00 0 ■H44 0 Ü %k 44 1—1 00 U 0 k■H 0 44 0k 44 m kO k > m 00 -H 0a 44 Ük B O X 440 -H 0 0 rk■H flj tkm w -H -H0 -H k 0o m o0 0 ■H0 k rH 44u 0 0 a rtn U B O0 •H k rQ0 0 m mo 44 >1 k0 w rk o oO a Ü kl
u-H4JOJI
(UrH4Jm
OJ44-H
OJ4-)fÜatooxia
■H(U-POua
(U
"H04444nSU
4J I—IrtSmmm0Ü
M
kB 0m■H p03 u-H 0O rak 0!h kf l44 1—10 0 wk & ■H0 o Wa rQ 0k P0a Brk
B 0op
kp
'• u kHm 0 k■H k 0M P0 to toÜ 0 k-H tk a% k0 rH44 to kp ■H o uk 44 -H •H-H P Brk iH 0 044 iH p0 to0 B 0 1—1 > ,toB Ul ao 0440
0
tok
1 p
to-HP-H-H 44 I—1[Q 03 to r0Ü1 a kk 0 o
■H -H ak B mra 0 1—1k 0 0 tku k to k
-H k -H44 0 to0 U a 0ra 0 g t—Îk 1—1 k >10 0 0 ra k e ko a 0 0k k k0a a toÎHrHk00
1Bto
p to ;—1 •Hi
•Hp■Hkkp•H k
B k 0m 0 B 03■H 44 003 -H p 'H0 k u ok 44 0 p0 •H k 0tn a 0 B0 0 p ka a to 0S rH >1 kK k K a
FI-H
&fl
S404J4JIÜ0rH&h
0-Sgh
â’4Jmm0U
Stj■Hok04J0Ou
-H4JUOU
g-H4-)&om
tHB
m-H4J■HrHoU
>-H4-)0540Üt—I 0
0M030m
■H
[Q
ÎOkU
0 I—Ia
-H44rHird1fdk0
M
o■HU
■H
s0a0
I0mm0tH044CO.m
BsN
Ifl01■H
€
IrSI- - 1I- - 10u
0iH
"Hœ
iHr4 0k 0 k rHo o ■H 0■H ■H P Ot—1 P tk W ■H0 0 O 0 tnk 0 k 1—1 P o0 k 0 0 k H■H ■H a p •H Op k o 0 0 p■H Ü B to k 0k O p k tk P BP "k to 0 k to 0k k 0 k k 0 0is; M a a O V) Ik
;-H
-H
;rH01ks
■H
44O
0 ■H440rH
1U0okk0
irHI
w■Hmop0B0k
kÜog00k
0to00U1 0
-H -H03 0
00 pk tH0 U
k 0u Pk 00 00
0k0
05ko0
■H05
0tk 00 kk 0o kP 44CO o
rn
-H

Table 1.2 Indications for assessment of bone mineral density
Radiological evidence of osteopenia, or vertebral deformity Previous fragility fracture of forearm, spine or hip Significant loss of height or thoracic kyphosis Monitoring therapy for osteoporosis Strong risk factors
Early menopause (<45 years)Prolonged secondary amenorrhoea Primary hypogonadism Corticosteroid therapy Conditions associated with osteoporosis
Anorexia nervosa MalabsorptionPrimary hyperparathyroidism Hyperthyroidism Cushings syndrome
. : iTransplantation Chronic renal failure Multiple myelomaProlonged immobility
44
;;i-
Osteogenesis imperfecta
I
iÏ
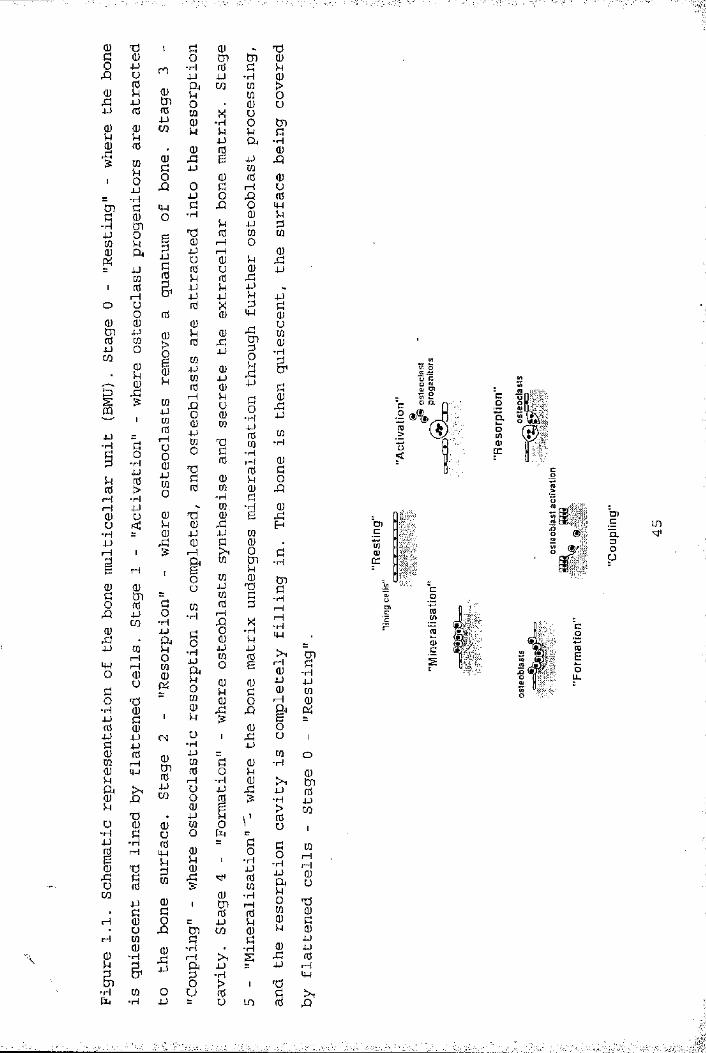
•H •H
-H
■H
•HtH
O
U
I—IXJ
■H -Hi—IXJ
•HtHiH -H CHenQ.
fH
•H i—IXJ
XJ•HXJI—IH rH
•H
XJO-HH
-H
I—! IM rHHXJ
rH iH
______
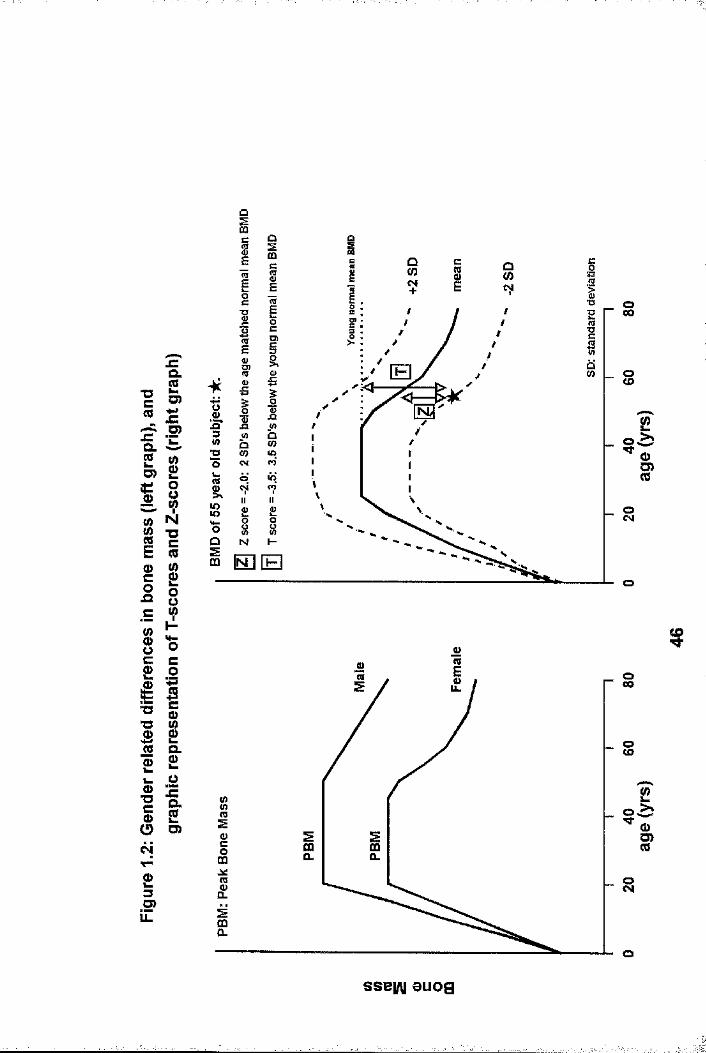
CQ
t3C(0
D)aQ>
IOJQ
l«M0)"Oc0>
JZQ .SC7)4-»fO)
Q. g WQ)
"OcCOg g
8
iëTO■O 0) Q)%0
OcOsc8Q .m
oZQ .C8
O O)c4T“
£3O)
E
■op sXJ
XJ
O)~ s
XIo
■O
8U)
o
I&
oiD
r §11.
O(£>
O
8
O
i<%)G )
sse|/\| auog
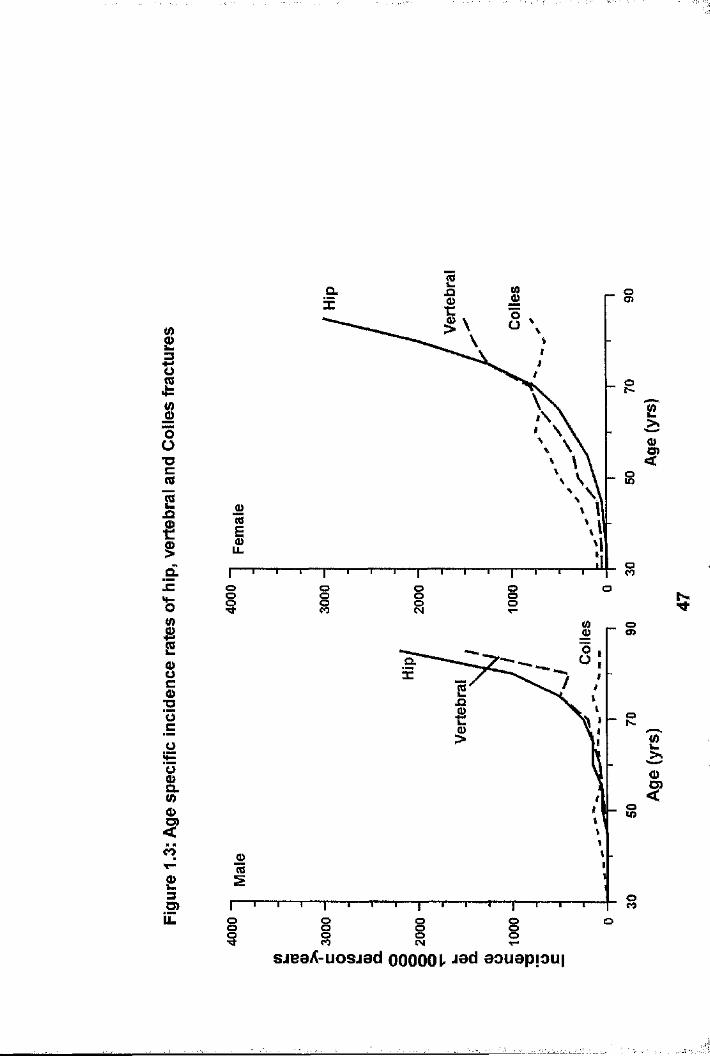
gICO1Ü"Ucvs2 jQ
gd!c
I8C0>■OÜc
o&U)0)<o
£3O)LL
a.
8
oo§ §os o
o<o
a
a
o
8 3 8oo o
£
I
2
I
8sjeeA-uosiad OOOOOL aouapfoui
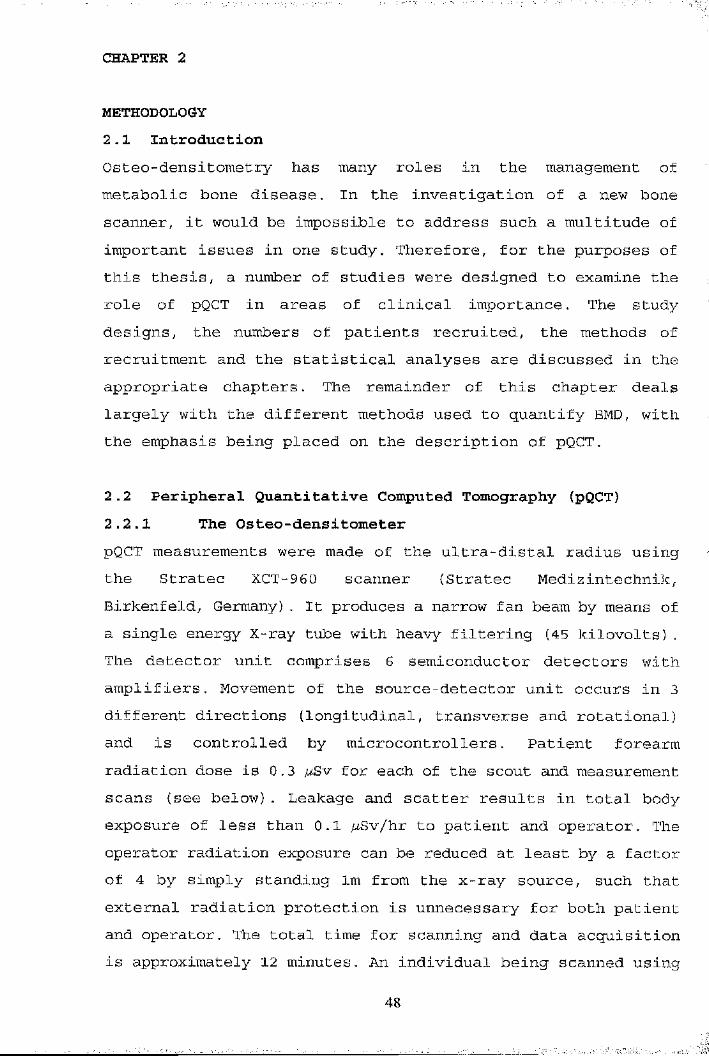
CHAPtER 2
MEtHODOLOGY2.1 IntroductionOsteo-densitometry has many roles in the management of metabolic bone disease. In the investigation of a new bone scanner, it would be impossible to address such a multitude of important issues in one study. Therefore, for the purposes of this thesis, a number of studies were designed to examine the role of pQCT in areas of clinical importance. The study designs, the numbers of patients recruited, the methods of recruitment and the statistical analyses are discussed in the appropriate chapters. The remainder of this chapter deals largely with the different methods used to quantify BMD, with the emphasis being placed on the description of pQCT.
2.2 Peripheral Quantitative Computed tomography (pQCt)2.2.1 the Osteo-densitometerpQCT measurements were made of the ultra-distal radius using the Stratec XCT-960 scanner (Stratec Medizintechnik, Birkenfeld, Germany). It produces a narrow fan beam by means of a single energy X-ray tube with heavy filtering (45 kilovolts). The detector unit comprises 6 semiconductor detectors with amplifiers. Movement of the source-detector unit occurs in 3 different directions (longitudinal, transverse and rotational) and is controlled by microcontrollers. Patient forearm radiation dose is 0.3 / Sv for each of the scout and measurement scans (see below). Leakage and scatter results in total body exposure of less than 0.1 /^Sv/hr to patient and operator. The operator radiation exposure can be reduced at least by a factor of 4 by simply standing Im from the x-ray source, such that external radiation protection is unnecessary for both patient and operator. The total time for scanning and data acquisition is approximately 12 minutes. An individual being scanned using
48
the Stratec XCT-960 is shown in figure 2.1.
2.2.2 Scanning MethodThe patient's forearm length is measured with a millimetre ruler from the ulnar styloid process to the point of the olecranon before the arm is positioned for scanning. This measurement is used to set an elbow support in front of the scanning aperture to ensure the distal forearm and carpus is in the scanning field. The upper limb is then positioned with the elbow in its support, the fingers resting on a finger rest at the back of the scanner with the thumb dangling comfortably below.
Scanning then takes place in two stages. Firstly a coronal scan provides an image of the distal forearm and carpus, and is known as the "scout scan". This allows accurate repositioning of the scanner for the "measurement scan", by positioning a cross-sectional cursor at the distal end of the radius. The measurement scan then occurs at 4% of the previously documented length of forearm, proximal to the cross-sectional cursor (see Fig 2.2). From the measurement scan, 15 tomograms are merged to create an axial slice of 2.5mm thickness, which is depicted on a monitor screen (see figure 2.2). The reconstructed image is comprised of thousands of cubes of uniform dimension but differing density, which are known as "voxels". The density is colour coded on the screen, with high density areas depicted as white/yellow, medium density areas as red, and low density areas as blue/black. This allows visual identification of the radius and ulna within the image. A thresholding algorithm between 0 and 100 is then applied to the image. Bone with a linear attenuation co-efficient (and density) lower than the threshold is defined as trabecular bone, and that above as cortical bone. The default threshold setting is 50, which was not changed in standard scanning. Subsequently the radius is
49

isolated as the region of interest (ROI), from which several BMD measurements are obtained as described below (chapter 2.2.3). The number of voxels within the ROI is also automatically calculated (typically 900-1000 for a female). As the voxel dimensions and measurement slice width remain constant, the number of voxels in any given ROI is directly proportional to its size.
2.2.3 Bone Mineral Density (BMD) measurements acquired bypQCt
4 different BMD measurements are recorded and shown in Fig 2.2. These are truly volumetric measurements so the resultant BMD values are expressed in g/cm^.
1) tOtAL BMD (Qtot) is the overall measurement of radial BMD at the measurement site.
2) tRABECULAR BMD (Qtrab). From the cross-sectional image, the outer 55% of the radial area is concentrically removed by the computer software. This leaves a central core of purely trabecular bone which is then quantified giving trabecular BMD. The default setting for the peeling process is 55%, but this can be altered if, in the rare occurrence, cortical bone (white colour) persists after peeling of the outer area.
3) SUBCORtICAL BMD (Qscort) is the density of bone in the outer 55% of voxels which are removed. It is mainly cortical bone with a small rim of trabecular bone.
4) CORtICAL BMD (Qcort) is calculated from the outer 55% area which has been removed. The computer software defines bone with a high density, eliminating less dense bone through the further use of thresholding algorithms. This process occurs automatically for any chosen threshold used
50

(50 by default) in the overall analysis.
The precision of pQCT measurements is discussed in Chapter 3. The non-dominant forearm was scanned in all individuals to excluded any potential effect of mechanical loading on BMD measurements. The effects of dominance is discussed further in Chapter 4. In the rare occurrence of a previous Colles fracture of the non-dominant arm, the dominant arm was scanned, as previous fracture distorts the anatomy at the scan site, and post-fracture radial BMD is known to be reduced (2.1).
2.3 Dual Energy X-ray Absorptiometry (DXA)The technique of scanning using DXA has been described in chapter 1.3,4, and in detail elsewhere (1.153,1.154). DXA scanning was mainly performed using a single Norland XR26-Mark II bone densitometer (Norland Corporation, Port Atkinson, USA). Figure 2.3 shows a woman undergoing DXA scanning of the lumbar spine and proximal femur. The following measurements were made using an antero-posterior projection, with representative scans being shown in figures 2.4-2.6.
1. Lumbar spine [L2-4: (LS) ]2. Left hip [femoral neck (FN), trochanter (Ft) and Ward's
area (FW)]3. Whole body [bone mineral density (WB-BMD)].
The in-vivo short-term precision expressed as the coefficient of variation is 0.9%, 2.8%, 1.3%, 4.9% and 1.5% for lumbarspine, femoral neck, trochanter and Ward’s area, and whole body BMD measurements respectively (2.2,2.3). To prevent unnecessary repetition throughout the thesis, use of the term "DXA hip" measurements will encompass femoral neck, trochanter and Ward’s BMD measurements.
A small proportion of patients with vertebral fractures
51
described in chapter 8, were scanned using a Lunar DPX-a densitometer. The scanning procedure is the same as that for the Norland XR26-Mark II, with the subject lying comfortably on the scanner base which is padded. Data acquisition differs between Norland and Lunar scanners with slight disparity of BMD results. This is dealt with further in chapter 8.
2.4 Ultrasound (CUBA)The technique of scanning using ultrasound has been described previously (1.154). Ultrasound was performed using the McCue CUBA Clinical (McCue Ultrasound, Winchester, UK) , which is shown in figure 2.7. The non-dominant foot is placed in the foot recess of the ultrasound machine, and two silicone rubber faced transducers applied to either side of the heel. K-Y jelly is applied to eliminate air from between the contact surfaces. Two measurements are recorded: broadband ultrasound attenuation (BUA), and velocity of sound (VOS), results being expressed in dB/MHz and m/s respectively. The in-vivo shorterm precision for these measurements is 3.8% and 1.4% respectively (based upon paired measurements in 16 healthy premenopausal individuals with the foot removed from the machine between measurements). To prevent unnecessary repetition of information throughout the thesis, "calcaneal ultrasound" measurements will refer to both BUA and VOS.
Although pQCT was performed in all studies, DXA and ultrasound measurement were not. The measurements performed in specific studies are detailed in each of the appropriate chapters.
2.5 Statistical AnalysesThe statistical analyses used in the various studies differ and are discussed in each of the chapters. The normality of data distribution was verified using normality plots and Shapiro- Wilks statistics. Data which violated normality criteria were compared using non-parametrie tests.
52

2.6 Ethics and ConsentAll patients participated in studies approved by the local Ethical Committee, and gave informed, written consent.
. ’ ■' 1 .

«4-)u0iw1uCO4-)-HtoUQJ04J§rH
-H4-4U■HX i4JC
-H
gWCO
•H
U04JI4J■HCOIIo04_)
CQ0
%0U)<T>1BXu04J04JC/D1
g•H§0UCO
S’-HU
0ud4Ju0A0
0c
-HXug0
.d4Jc
•H
00Uo4-44J4-40
1 » m
cx
-H
U0X
X4J-H
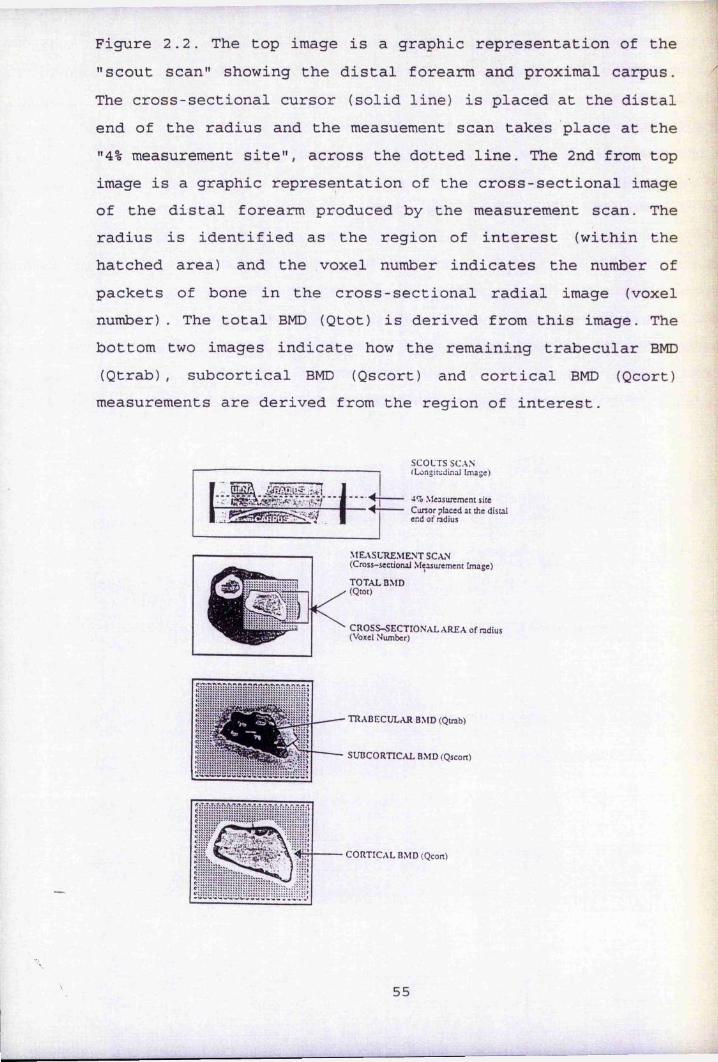
Figure 2.2. the top image is a graphic representation of the "scout scan" showing the distal forearm and proximal carpus. the cross-sectional cursor (solid line) is placed at the distal end of the radius and the measuement scan takes place at the "4% measurement site", across the dotted line. the 2nd from top image is a graphic representation of the cross-sectional image of the distal forearm produced by the measurement scan. the radius is identified as the region of interest (within the hatched area) and the voxel number indicates the number of packets of bone in the cross-sectional radial image (voxel number). the total BMD (Qtot) is derived from this image. the bottom two images indicate how the remaining trabecular BMD (Qtrab), subcortical BMD (Qscort) and cortical BMD (Qcort) measurements are derived from the region of interest.
ÎE2E.
SCOUTS SCAN (LongirjJLnaJ Image)
4% Measurement site Cursor placed at the distal end of ndius
M EASUREM ENT SCAN (Cross-sectional Measurement Image)
t o t a l BMD (Qtot)
c r o s s - s e c t io n a l a r e a of radius(Voxel Number)
t r a b e c u l a r BMD (Qtrab)
SUBCORTICAL BMD (Qscort)
C O R TIC A L BMD (Qcort)
55

Figure 2.3. A woman undergoing DXA scanning of the lumbar spine (above) and proximal femur (below) using the Norland XR26-Mark II.
56
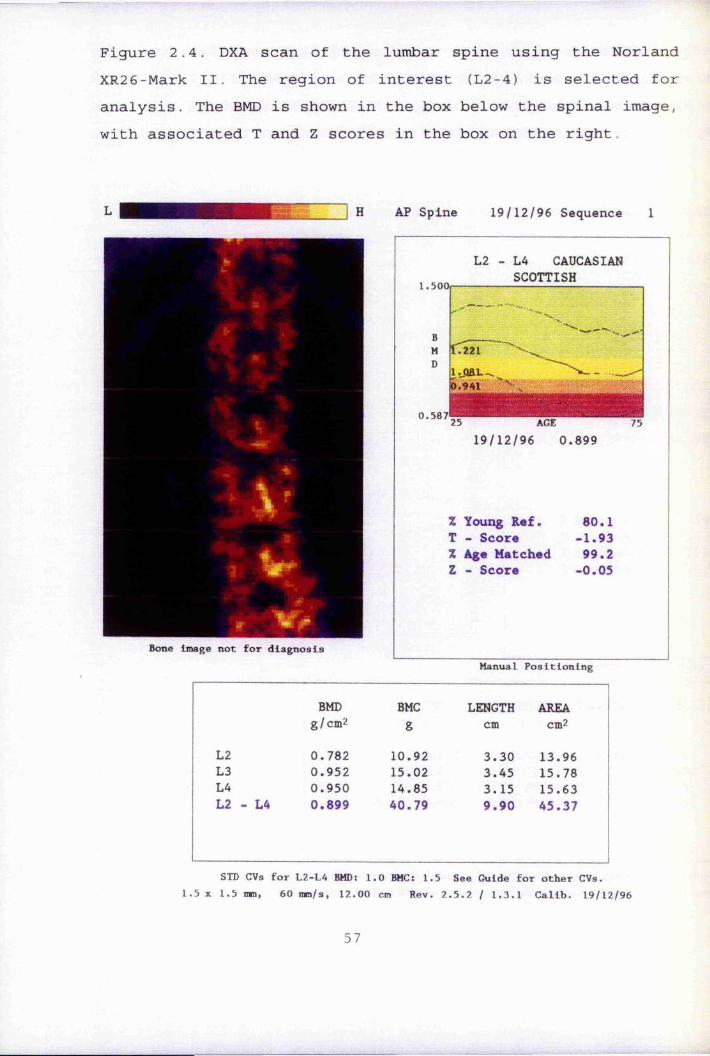
Figure 2.4. DXA scan of the lumbar spine using the Norland XR26-Mark II. the region of interest (L2-4) is selected for analysis. the BMD is shown in the box below the spinal image, with associated t and Z scores in the box on the right.
H AP Spine 19/12/96 Sequence 1
Bone Image not for diagnosis
1.500
0.587
L2 - L4 CAUCASIAN SCOttISH
l.QEL
25 AGE19/12/96 0.899
% Young Ref. 60.1t - Score -1.93% Age Matched 99.2Z - Score -0.05
Manual Positioning
BMD BMC LENGtH AREAg/cm2 g cm cm2
L2 0.782 10.92 3.30 13.96L3 0.952 15.02 3.45 15.78L4 0.950 14.85 3.15 15.63L2 - L4 0.899 40.79 9.90 45.37
StD CVs for L2-L4 BMD 1.0 BMC; 1.5 See Guide for other CVs.5 X 1.5 mm, 60 mm/s, 12. 00 cm Rev. 2.5.2 / 1.3. 1 Calib. 19/1
57
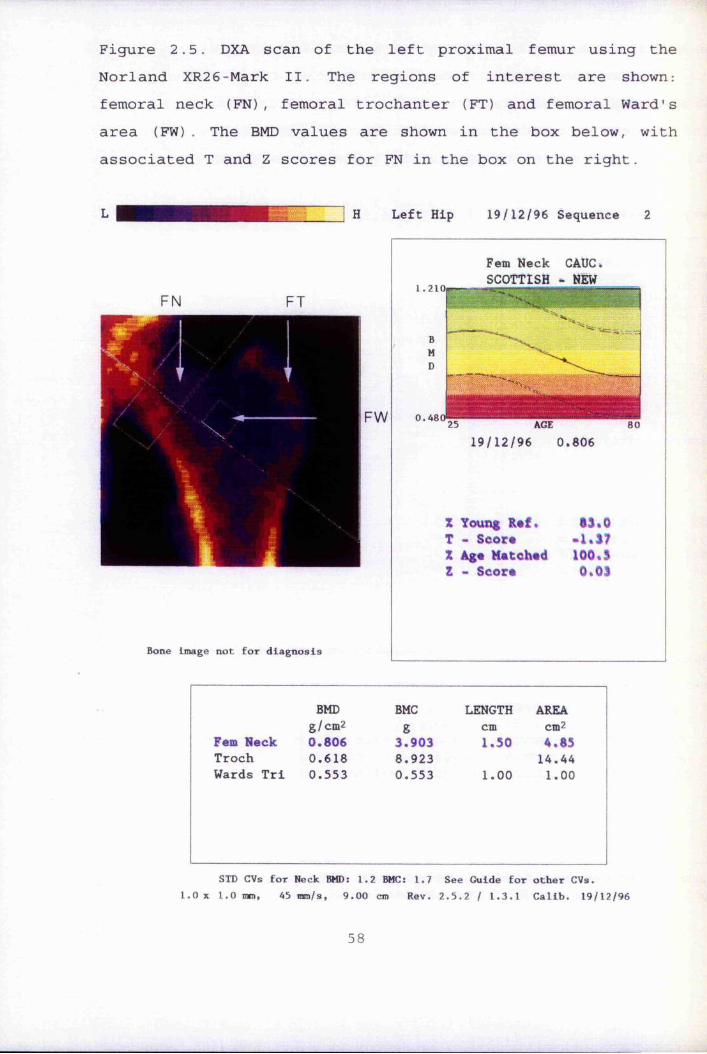
Figure 2.5. DXA scan of the left proximal femur using the Norland XR26-Mark II. the regions of interest are shown: femoral neck (FN), femoral trochanter (Ft) and femoral Ward's area (FW) . the BMD values are shown in the box below, with associated t and Z scores for FN in the box on the right.
H Left Hip 19/12/96 Sequence 2
FW
Bone image not for diagnosis
1.210Fern Neck CAUC* SCOttISH - NEW
0.461
"T- —WWW'#"*'
% Young R#f. *3%0t - Seor* -1,37% Age Matched 100,3Z - Score 0,03
25 AGE 8019/12/96 0.806
BMD BMC LENGtH AREAg/cm2 g cm cm2
Fern Neck 0.806 3.903 1.50 4.85troch 0.618 8.923 14.44Wards tri 0.553 0.553 1.00 1.00
StD CVs for Neck BMD: 1.2 BMC: 1.7 See Guide for other CVs.1.0 X 1.0 mm, 45 mm/s, 9.00 cm Rev. 2.5.2 / 1.3.1 Calib. 19/12/96
58

Figure 2.6. A whole body DXA scan using the Norland XR26-MarkII. In this instance, the left upper limb has also been selected as an additional region of interest (ROI) . the medial border of the selected ROI passes through the glenohumeral joint and excludes all other bony area. the associated BMD values are shown in the boxes below, and to the right of the whole body image.
LEFTARMR.0.1.
total BMD (g/cm ) : total BMC (g)total Lean Mass(g) total Fat Mass (g) total Fat %Siri UWE Fat % Brozek UWE Fat % Soft tissue Fat %% tBMC/FFM
0.8271498
2952013092
29.7 25.424.730.7 4.8
Bone image not for diagnosis
DEtAILED RESULtS
BMD BMC AREA LENGtH WIDtH LEAN MASS FAt MASSg/cm2 g cm2 cm cm g gHead 1.370 346.7 253.1 2889 628.4
trunk 0.818 462.2 564.9 14365 5082Abdomen 0.924 183.7 198.7 7459 2213Arms 0.477 131.7 276.1 3125 1548Legs 0.777 557.2 717.4 9141 5834total 0.827 1498 1811 29520 13092
Left Arm 0.670 99.97 149.2 63.70 13.00 1162 1622
59

fCu-H-H1—1U
gu(UÔusJJg■Hco4-)113caro
Ê1CQ24->
fdIuI—I(dufdg•H
IIdu(D<D4JCdrHg
o
r-CN2&-H

CHAPtER 3
tHE PRECISION OF pQCt AND HOW It IS IMPROVED USING SCAN VOXEL NUMBERS
3,1. Introduction3.1.1 PrecisionPrecision, which is the reproducibility of measurement results, is an important concept in osteo-densitometry. The standard value quoted in the literature is the coefficient of variation (CV). The better the precision of a scanner (ie the lower the CV) , then the greater its potential for detecting small but significant age, drug or disease related BMD changes. It is also important to evaluate precision in different age groups, as factors in the elderly, such as low BMD and movement artifact, may influence precision.
3.1.2 Voxel Numbers and "trending".With repeat measurements of the ultra-distal radius, it is vitally important to scan at the same anatomical site, as the cross-sectional area and proportion of trabecular and cortical bone changes dramatically over short distances (1.17,1.19). Ensuring standardised scanning technique will minimise inter and intra-operator variability, and improve precision.
sectional area of the radius.
The Stratec 960 has a "trending" function which allows an
61
a.
If the cross-sectional area of a repeat scan in an individual is similar to the original, this should ensure a comparable measurement site, and improved precision. The cross-sectional area of the radius in the ROI is quantified by a "voxel number : (VN) " (Fig 2.2). This could be a useful surrogate measure of area, and therefore a marker of anatomical site in any given individual, assuming there is no real change in the cross-
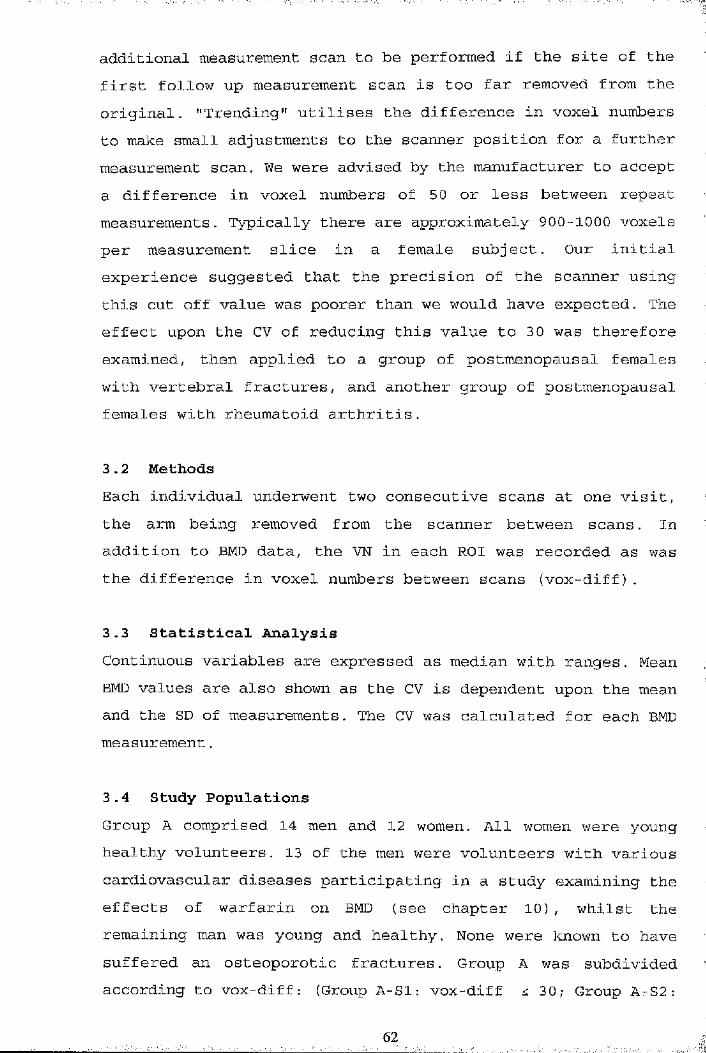
• ■; ;
additional measurement scan to be performed if the site of the first follow up measurement scan is too far removed from the original. "Trending" utilises the difference in voxel numbers to make small adjustments to the scanner position for a further measurement scan. We were advised by the manufacturer to accept a difference in voxel numbers of 50 or less between repeat measurements. Typically there are approximately 900-1000 voxels per measurement slice in a female subject. Our initial experience suggested that the precision of the scanner using this cut off value was poorer than we would have expected. The effect upon the CV of reducing this value to 3 0 was therefore examined, then applied to a group of postmenopausal females with vertebral fractures, and another group of postmenopausal females with rheumatoid arthritis.
3.2 MethodsEach individual underwent two consecutive scans at one visit, the arm being removed from the scanner between scans. In addition to BMD data, the VN in each ROI was recorded as was the difference in voxel numbers between scans (vox-diff).
3.3 Statistical AnalysisContinuous variables are expressed as median with ranges. Mean BMD values are also shown as the CV is dependent upon the mean and the SD of measurements. The CV was calculated for each BMD measurement.
3.4 Study PopulationsGroup A comprised 14 men and 12 women. All women were young healthy volunteers. 13 of the men were volunteers with various cardiovascular diseases participating in a study examining the effects of warfarin on BMD (see chapter 10) , whilst the remaining man was young and healthy. None were known to have suffered an osteoporotic fractures. Group A was subdivided according to vox-diff: (Group A-Sl: vox-diff 30; Group A-S2 :
62
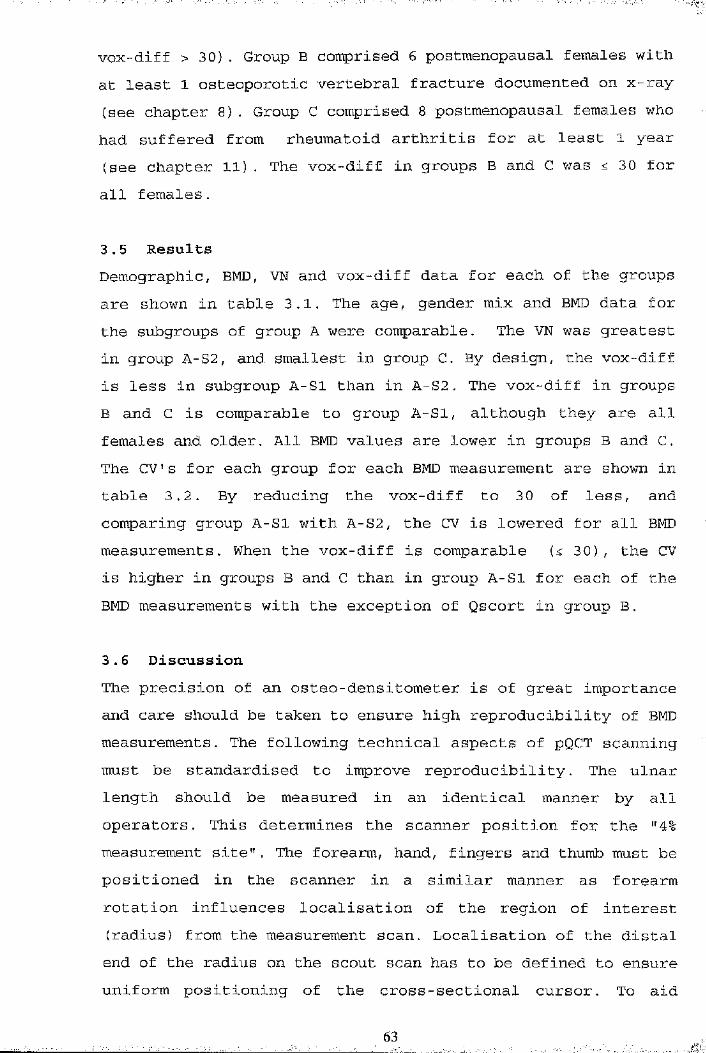
vox-diff > 30). Group B comprised 6 postmenopausal females with■
at least 1 osteoporotic vertebral fracture documented on x-ray (see chapter 8). Group C comprised 8 postmenopausal females who had suffered from rheumatoid arthritis for at least 1 year
t(see chapter 11). The vox-diff in groups B and C was 30 for all females,
3.5 ResultsDemographic, BMD, VN and vox-diff data for each of the groups |are shown in table 3.1. The age, gender mix and BMD data for |,the subgroups of group A were comparable. The VN was greatest §in group A-S2, and smallest in group C. By design, the vox-diffis less in subgroup A-Sl than in A-S2. The vox-diff in groups
mlB and C is comparable to group A-Sl, although they are all ||| females and older. All BMD values are lower in groups B and C.The C V s for each group for each BMD measurement are shown in table 3.2. By reducing the vox-diff to 3 0 of less, and comparing group A-Sl with A-S2, the CV is lowered for all BMD measurements. When the vox-diff is comparable ( 30), the CV is higher in groups B and C than in group A-Sl for each of the BMD measurements with the exception of Qscort in group B.
3.6 DiscussionThe precision of an osteo-densitometer is of great importance and care should be taken to ensure high reproducibility of BMD measurements. The following technical aspects of pQCT scanning must be standardised to improve reproducibility. The ulnar #length should be measured in an identical manner by all operators. This determines the scanner position for the "4% i measurement site". The forearm, hand, fingers and thumb must be positioned in the scanner in a similar manner as forearm rotation influences localisation of the region of interest (radius) from the measurement scan. Localisation of the distal end of the radius on the scout scan has to be defined to ensure uniform positioning of the cross-sectional cursor. To aid
63

relocation of the same measurement site in repeat measurements, the scout scan from previous measurements (eg the baseline scan in a longitudinal study) can be recalled. This permits the baseline cross-sectional cursor and measurement site to be referred to during subsequent scanning. Standardising the above procedural elements will minimise operator variation in scanning technique.
Voxel numbers can be used to further improve precision. If the number of voxels between consecutive measurement scans is greater than a predetermined threshold, fine-tuning of the scan site is possible though the "trending" function on the Stratec 960-XCT pQCT. Repositioning then occurs, the scanner moving a tiny distance towards the original scan site. An additional measurement scan (without scoutscan) then takes place at the new site within close proximity of the original scan. This is of vital importance in repeat radial measurements as there are marked changes in the proportion of cortical and trabecular bone over short distances (1.17, 1.18,1.19).
By reducing the difference in voxel number between repeat scans to 30 rather than 50, an improvement in precision was achieved as seen by comparing the C V s of subgroups 1 and 2 of group with C V S of 1.24%, 1.33%, 1.58% and 1.88% for Qtot, Qtrab,Qscort and Qcort respectively in subgroup 1 of group A. This compares well with the precision of other osteo-densitometers in our centre (see chapter 2), and other centres (1.153,1.154) . They are also comparable to in-vivo precision values published for the same pQCT scanner at other centres (1.50,3.1).
The precision of pQCT is poorer in the groups with vertebral osteoporotic fractures (group B) and RA (group C), even when the vox-diff was 30 or less. These results can be explained by the fact that the median (and mean) BMD values are lower in these two groups compared to Group A. As the CV is determined
.64

by dividing the standard deviation of the difference between measurements by the mean of the measurements, even if the errors between groups are similar, the lower mean value will ensure a higher CV (3,2) . Another contributory factor could be movement artifact in the scan images of the older individuals in groups B and C, which falsely elevates the scan voxel number. Older individuals find it more difficult to prevent forearm movement during scanning, particularly when the "trending" function is needed and the scan time increases. Consequently, the repeat measurement site may not be so close to the original as the voxel number suggests, resulting in greater between scan BMD differences. There were however no gross movement artifacts in any of the scans analysed. Also, the median voxel numbers in groups B and C were lower than in subgroup 1 of group A. A difference of 3 0 is therefore relatively greater in these groups (B & C), resulting in poorer proximity of the follow-up scans. Although the precision in the RA group is poorer, the use of voxel numbers is probably more useful for repeat measurements in this population. The destructive change which occurs at the radio-carpal joint in RA can make it indistinct during the pQCT scout scan. This anatomical landmark is essential for the correct positioning of the scanner for any measurement scan. When this is less well defined, scan voxel numbers are invaluable in repositioning the follow up scan ensuring proximity to the original measurement site.
Whilst the improvements in the precision values between the subgroups of group A are obvious, there are some confounding factors. The mean BMD values of subgroup 1 were slightly greater than the corresponding values in subgroup 2, with the exception of Qscort. This could result in a bias towards better results in subgroup 1. Also the median voxel number of the scans in subgroup 1 was slightly lower than that in subgroup 2. This work could be repeated using a cadaveric radius and ulna
65
mounted in resin, obtained from a normal individual, an osteoporotic individual, and an individual who suffered from rheumatoid arthritis. This would eliminate in-vivo movement artifact and fatigue factors. The effect of reducing the difference in voxel numbers upon the CV could be studied, and a threshold determined below which there is no further improvement in the CV. #
IÎIt became our policy to do a further measurement scan using the
"trending" function when the difference in voxel numbers ®exceeded 3 0 in repeat measurements. This ensured close |anatomical proximity of follow up and baseline measurement sites which is reflected in the improved CV figures. However, there is a large difference in the cross-sectional area, and |therefore voxel numbers, of the radius between individuals. It would therefore be better to specify the threshold for a further scan using the trending function, as a percentage of ,i|the original scan voxel number rather than an absolute value.A percentage difference of 3% would appear to be appropriate.This figure could be validated or adjusted using the cadaveric i
iradius studies as suggested above.i
IIî:*
I66

uo4-14-1IW
cd '—-S-i o rQ m CD4J VIU
min00m
CMro■H LD00G \ en^ 00 0000 ro i>
OO
en00oi>CO kO 00
•H en[>
en00 r4LD
OCM0000 'X» LD en CM eoKD 00CMI> 00
eno eotH ‘ • 00eo 00 VD en00 ko 0010- CM kOCM '— ' H
00 LO Oko 00 0000■H
00l> o[>00kûrH 000000 eno o o 00 00 ■
00en i>rH
000000ko LT) 00•H 00in
•H4H
00 en00kOI—I uo00 o H 00 o
I CM
o H
00CM00 00 Oi> 00 00
00 ' H
kOCM "sM LO 00
iH O CM •• enLO en enoCM
o00•H
■H -H-H
00
ex
00kD
LDCM
OLOLD
HLDLO
PQ
:i
kO

p, up0 pu pCn ou- gjo 43ro PPVI
44 o44 ro■H
VIXo 44
44■H43H 1co X1 0< >
tu•H
tn oJ o(d k M-)4-J I—î
pqBOiOuuo4-J
B
g•H4Jfd-HU>44Om-pg“H0■H4444(U1Ou(Nro
fdU4-JPQJ
p■Hmeu
rHI44fdmm&ICQOApq
t
oro
4444■H
É(UiH 04 rQ œ5
OPP rO pi 04O CD O co 00p • • 4 4Ü r4 H fP
oroVI pq
P44 P ro CO i> CO44 O [> m LO tH■H p0 H 04 H LOXO>CQ■H4J'HPrP-PPfd43 rO 00 LO tH-H O roO (M 4 4 44J CO ro r4 pi roBP(U <Pip PPrP O4J p-H 0
ro 00 00CQ 04 ro LO 000) rHrH CO rH H H Hfdgeu441—1fdCQpfdP0P(Ug P4J P 4JCQ 4J (d O P0 O P Ü OP 4J 4-J CQ ÜO ex O ex
00\o

CHAPtER 4
tHE EFFECt OF DOMINANCE ON RADIAL pQCt BMD MEASUREMENtS
4.1 IntroductionThe effect of mechanical stimulation and exercise upon BMD at appendicular and axial sites is controversial (4.1). This is due to differing exercise and loading regimes being studied in varying population groups, at different skeletal sites where bone composition varies. With regard to the radius, upper limb exercise and mechanical loading has been shown to have a beneficial effect upon radial bone mass in both cross-sectional ( 4 . 2 , 4.3,4.4,4 . 5 ) and longitudinal studies(4.6,4.7,4.8,4.9,4.10). When the issue of dominance was addressed in some of these studies, bone mass in the dominant forearm was uniformly found to be greater than its non-dominant counterpart (4.2,4.3,4.4,4.9). However these studies examined the effects of regularly playing tennis or specific upper limb exercises, neither of which typically prevail in the normal population. They do however suggest that at the radius, mechanical loading and dominance is of some importance, although the magnitude of this in the general population is poorly defined. The influence of dominance upon radial BMD in the general population was therefore investigated.
4.2 Patient Recruitment and MethodsDominant and non-dominant forearms were scanned using pQCT on the same day in 31 individuals. 10 individuals (5 males: 5females) were volunteers participating in a study comparing the precision of DXA scanners in 3 different Scottish centres (2.3). In addition there were 12 men participating in the study discussed in chapter 10, and 9 females participating in the study discussed in chapter 8. 2 of the 31 individuals were left handed.
69
4.3 Statistical AnalysesContinuous variables are expressed as the mean and standard deviation. Comparison between the dominant and non-dominant BMD
,values was performed by the paired t-test, and differences expressed as percentages.
%4.4 ResultsThe BMD measurements of dominant and non-dominant forearms with percentage differences are shown in table 4.1. Considering all individuals as a single group, there was a trend for all BMD measurements to be greater in the dominant radius, although this failed to reach significance: percentage differences of 1.6%, 1.1%, 1.2%and 0.6% for Qtot, Qtrab, Qscort and Qcortrespectively. BMD values of the dominant forearm were slightly
...higher than the non-dominant forearm with the exception of Qtrab in the male subgroup, and Qscort and Qcort in the female subgroup. None of the differences were statistically significant. BMD values in the male subgroup were higher than the corresponding values in the female subgroup, although they were not age matched. Ï
4.5 Discussion'These data suggest that there is no statistically significant
effect of dominance upon any radial BMD measurement in either males of females, although there was a trend for BMD to be slightly higher in the dominant arm. Although not statistically significant, the differences may be clinically important. The differences were largely in the region of 1-2%, which is similar to the precision error for the different BMD measurements. Introducing a further 1-2% variation in BMD measurements would limit the ability of pQCT to differentiate osteopenic/osteoporotic populations from normals, to detect rates of change and to monitor response to drugs.
370
I

A previous study examining the effect of dominance upon radial BMD using pQCT in normal sedentary individuals found cortical and total, but not trabecular BMD to be significantly greater in the dominant forearm, the differences being 11%, 10% and 6% respectively (4.11) . The disparity with our findings is difficult to explain as the study populations seemed comparable in their level of physical activity (no elite athletes), and the same pQCT scanner was used.
Small, and statistically insignificant differences between DXA BMD of opposing proximal femora have also been documented(4.12,4.13). Infrequently however, considerable individual variations have also been noted (4.12,4.13), and thought to be due largely to local factors such as previous fracture or hip osteoarthritis (4.12). 7-8% variation in ultrasound attenuation (BUA) measurements between opposing os calces have previously been found which was unrelated to stated handedness. The conclusion of the authors was that the same site should always be measured, particularly in longitudinal studies (4.14).
In summary, dominance and local mechanical stimulation do appear to have a mild influence on radial BMD, which may be of clinical importance without achieving statistical significance. Although only small and insignificant differences were found between radii in this work, the numbers studiW^were relatively small. Greater differences have been recorded previously in the general population (4.11), and in those undertaking specific upper limb exercises (4.2,4.3,4.4,4.9). Bearing in mind that even small percentage differences would be clinically important, it is important to remove the influence of dominance as a confounding factor in pQCT BMD measurements. Consequently it was our policy to always scan the non-dominant forearm, unless an individual had suffered a previous Colies fracture, when the contralateral forearm was scanned. In longitudinal
71

studies the same forearm was always scanned
72
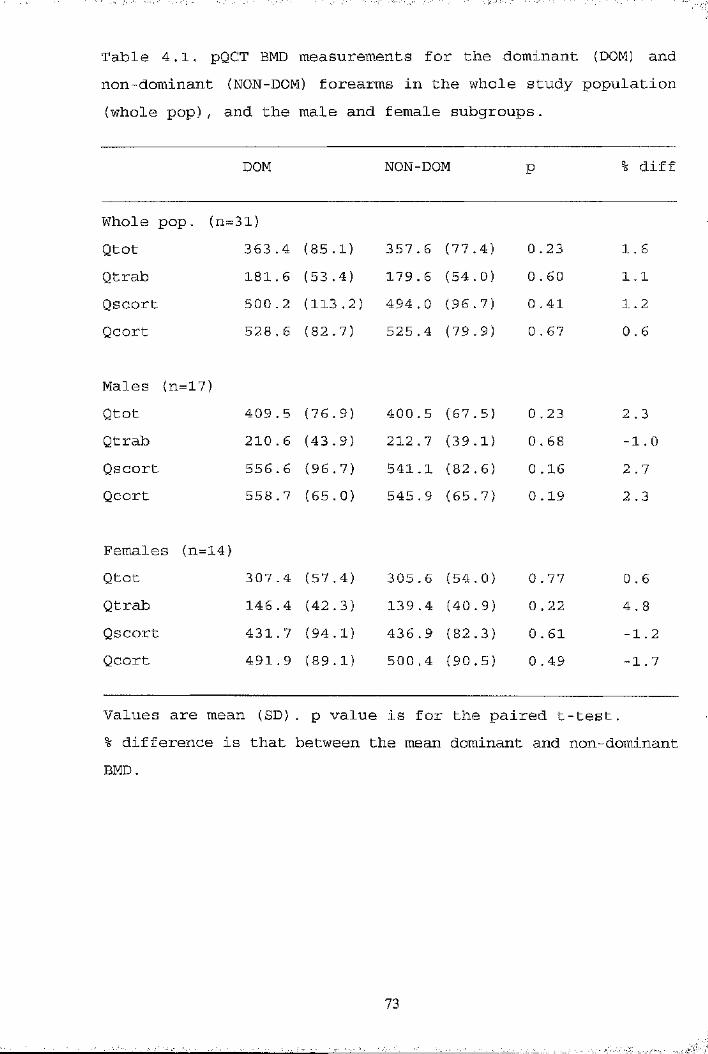
Table 4.1, pQCT BMD measurements for the dominant (DOM) and |non-dominant (NON-DOM) forearms in the whole study population |(whole pop), and the male and female subgroups. ^
DOM NON--DOM P % diff
Whole pop. (n=31)Qtot 363 ..4 (85. 1) 357 . 6 (77 ..4) 0 ,23 1.6Qtrab 181., 6 (53 .4) 179 . 6 (54..0) 0 ., 60 1.1Qscort 500 ,.2 (113 .2) 494 . 0 (96..7) 0 ..41 1.2Qcort 528 ,. 6 (82 .7) 525 .4 (79 ,.9) 0 ., 67 0 . 6
Males (n=17)Qtot 409 ,. 5 (76, 9) 400 , 5 (67,.5) 0 ..23 2 . 3Qtrab 210 ,. 6 (43 .9) 212 . 7 (39,.1) 0 ..68 -1. 0Qscort 556 . 6 (96. 7) 541 .1 (82 .6) 0 ,.16 2 . 7Qcort 558 . 7 (65. 0) 545 .9 (65 .7) 0 ,.19 2.3
Females (n=14)Qtot 307 . 4 (57 .4) 305 . 6 (54 .0) 0 . 77 0.6Qtrab 146 .4 (42 .3) 139 .4 (40 .9) 0 .22 4.8Qscort 431 . 7 (94 .1) 436 .9 (82 .3) 0 ,. 61 -1.2Qcort 491 . 9 (89. 1) 500 .4 (90 .5) 0 .49 -1.7
Values are mean (SD). p value is for the paired t-test.% difference is that between the mean dominant and non-dominant BMD.
73

CHAPtER 5
CREAtION OF A NORMAL RANGE AND DEtERMINAtION OF IMPORtANt ANtHROPOMEtRIC FACtORS ON RADIAL pQCt HMD MEASUREMENtS IN FEMALES AGED 18-90.
5.1 IntroductionThe Stratec XCT-960 pQCT bone scanner was developed in Germany. The manufacturers did provide a normal range for trabecular and total BMD values, although this was based on a German population aged 20-79 scanned using a precursor to the Stratec XCT-960 - the Stratec SCT-900 - which used a rather than X- ray source. There had been concern that the normal range provided was inaccurate, a worry which has recently been confirmed in a German population (1.50). Therefore, it was felt prudent to investigate whether the manufacturers reference range was representative of the population of Grampian region, Scotland. The best method of determining a normal range from a reference population would be to randomly select females from a population or GP register. Financial and time restraints meant that this was not possible, but all normal females who had been scanned with pQCT were analysed. Since age, height, weight and menopausal status are known to be important factors in determining Bto (1.50,5.1,5.2,5.3), their influence on pQCT radial BMD measurements was examined in this population,
5.2 Study Population332 normal females who had been scanned with pQCT were studied. All females completed a health questionnaire. None were known to suffer from any condition or were taking medication known to influence bone mass or metabolism and none had previously undergone hysterectomy. They were recruited in the following way:1. 61 volunteers who worked in the Osteoporosis Research Unit
74
_________________________
I

and the hospital at which the Unit was based.2. 197 females who attended an osteoporosis screening
programme which has been described previously (1.196). These females were aged 45-55 years old, lived in the Grampian region of Scotland and were randomly selected from a community register. Primary screening involved DXA scanning of the lumbar spine and hip. pQCT was performed within 2 months at an additional visit .
3. 31 volunteers selected from a previously studied random population who took part in an epidemiological study (European Vertebral Osteoporosis Study - EVOS) (5.4). They were known to fulfill criteria for normality 2 years previously, and agreed to return for further assessment. 30 again fulfilled normality criteria and were included in this study population, but one had suffered a vertebral fracture, and was excluded. They formed part of the control group for the studies discussed in chapters 8 and 11.
4. 45 volunteers who were recruited through advertising as normal controls for a study examining the power of different scanning modalities (DXA, CUBA and pQCT) to discriminate patients with previous hip fracture from a control population. This study is discussed further in chapter 8. One female self reported a history of rheumatoid arthritis and was therefore excluded, leaving 44 females to be included in this normal population
5.3 Statistical AnalysesBMD was stratified by age into consecutive decades, and by menopausal status (premenopausal: regular menses stilloccurring; postmenopausal: no menses for at least 12 months). Age specified mean and SD BMD values were compared to those provided by the manufacturer, and also a recently published German normal range. The effect of the independent variables
75

age, weight, height and menopausal status was examined by stepwise multiple regression analyses in the whole population. Analyses of premenopausal and postmenopausal subgroups were undertaken, with years since the menopause being substituted for menopausal status in the postmenopausal group.
5.4 Results119 of the population were postmenopausal. Total and trabecular BMD data for our normal population and that provided by the manufacturer are shown in table 5.1. Cortical and subcortical BMD data for our population are shown in table 5.2 (there were no corresponding manufacturers values). Our normal range differed from that of the manufacturer and also that recently published for a German population (1.50). There are data on only 6 females in the 30-39 age band, which unfortunately cannot be considered a truly representative sample of the normal population. This could explain why Qtot, Qtrab and Qscort BMD values are lower than expected in this age band. Mean Qtot and Qtrab BMD values were generally higher in our population, compared to the manufacturers and recently reported German population (1.50). Compared to the manufacturer's figures, the difference tended to be greater for Qtot (+9.5% - +31.1%) than for Qtrab (-1.2% - +10.6%: excluding those aged 30-39) .
The age related changes in Qtot, Qtrab, Qscort and Qcort are shown in figures 5.1-5.4 respectively. Multiple regression equations examining the influence of the independent factors age, height, weight and menopausal status (years postmenopause in postmenopausal females) upon BMD measurements in the whole population, and premenopausal and postmenopausal subgroups are also shown in the corresponding figures.
There was an age related decrease in all BMD values. Examining
76
the whole population by decades, this was not apparent until the 6th decade for Qtot, Qscort and Qcort and the 7th decade for Qtrab. Age related changes in BMD are discussed further in chapter 7. Important anthropometric determinants in the whole population were as follows: weight which was positivelycorrelated with Qtot, Qtrab and Qcort; age which was negatively correlated to all measurements; height which was negatively correlated to Qtot and Qtrab; menopausal status which was negatively correlated to Qtot and Qscort.
For premenopausal females, weight was positively correlated to Qtrab, and height negatively correlated to Qtot and Qtrab. The amount of variance explained in the premenopausal group was small with only 5% of the variance in Qtot, and 8% of Qtrab being explained. The amount of variance in Qscort and Qcort explained by these independent variables (age, height and weight) was so low that no equation was formed.
For postmenopausal females, weight was positively correlated to Qtot, Qscort and Qcort, whilst age was negatively correlated to all BMD measurements. Years since the menopause was not an important determinant for any pQCT BMD measurement. The degree of variance in BMD explained in the postmenopausal group was much greater than in the premenopausal group: 35% for Qcort, 34% for Qscort, 33% for Qtot, but only 8% for Qtrab,
5.5 DiscussionThese results highlight the importance of obtaining a locally derived normal reference range. Values supplied by the manufacturer were consistently lower across the decades than those of the local Grampian population. There were also differences in BMD values between the female population of Grampian, and the German population reported recently by Butz et al (1.50). These differences are probably real, but the
77
following factors could also be important. Firstly, the recruitment methods for the study populations were different. The entire German population reported by Butz et al (1.50) was randomly selected, whilst about 100 of the 332 females in our population were volunteers, the remainder being randomly selected from the population. Secondly, our pQCT scanner (Stratec XCT-960) was the upgraded model from that used to scan the German population (Stratec XCT-900). Differences in performance of the scanners are not known, but are unlikely to result in the large BMD differences reported here. The finding of population differences does however support the findings of a recent study, which reported that normative female pQCT BMD data vary between a number of different European centres (5.5) . Mean trabecular BMD of females aged 60 years at the different centres varied between 101-117 mg/cm^, although this was statistically insignificant. Similar findings have also been shown for normative DXA spinal (5.6, 5.7) and hip (5.7, 5. 8) data. Differences between a locally derived normal range and that provided by the manufacturer have also been found for axial DXA (5.7,5.9,5.10) and pQCT measurements (1.50). Such difference are important as they can lead to the misclassification of patients as osteoporotic or not(5.7,5.10). If must be concluded that, if possible, normativedata should be derived from the local population.
For the purposes of this thesis, the population studied in this chapter is referred to as a "normal" population. However there are several limitations of this population. Firstly,approximately 3 0% of females were not randomly selected.Secondly, there is a paucity of females aged 30-39 years, with BMD values in this age group generally being lower than their counterparts aged 18-29 years and 40-49 years. This suggest that the females in this age band are not representative of the population. Unfortunately, it is this age group which is used
78

most often to create T-scores. Hence, during the remainder of the thesis, T and Z scores are quoted for DXA femoral neck and lumbar spine measurements, but not for pQCT measurements.
Examining the BMD values across the decades, pQCT values do not appear to alter greatly until the 6th decade for Qtot, Qscort and Qcort, and the 7th decade for Qtrab. This is a similar pattern to that observed previously for pQCT measurements (1.50,1.78) . Bearing in mind the limitations of trying to determine peak bone mass with a small number of females aged 30“39 years, maximum mean BMD is achieved in the age group 40- 49 years for Qtot, 18-29 years for Qtrab and Qscort, and 30-39 years for Qcort (40-49 years if the 30-39 age group is excluded) . It is surprising that there does not appear to be a dramatic reduction in Qtrab during the 6th decade, bearing in mind that the accelerated phase of bone loss during the 5-10 years following the menopause preferentially affects trabecular bone. Rates of radial bone loss are examined further in chapter 7 .
Weight and height are generally positively related to axial hip and spine BMD, whilst age and postmenopausal status are negatively related (1.51,4.2,5.1,5.2,5.11,5.12). The results presented here suggest that in premenopausal females, the above independent variables explain only a small amount of the variance in the various pQCT BMD values, although other local and environmental factors were been examined. This is in keeping with the previous finding that peak bone mass at the radius (1.58), and hip and spine (1.59) is largely genetically determined, with up to 80% of variance being explained by genetic and familial factors.
The variance in pQCT BMD explained by age, weight, height and menopausal status for the normative data presented here, was
79
much greater in the postmenopausal, compared to the premenopausal subgroup. Age was an important determinant of all BMD measurements, being negatively related in the whole population and the postmenopausal subgroup. It was surprising that years since the menopause was not related to any measurement in postmenopausal females, particularly as trabecular bone is preferentially affected during the earlier postmenopausal years, and is independently quantified by pQCT. However, postmenopausal status was negatively related to total and subcortical BMD measurements. Weight was also positively related to BMD measurements in the whole population, but seemed to have a greater influence upon BMD of postmenopausal females. Conversely, height was negatively related to total and trabecular BMD in the whole population, and more important in premenopausal females. This relationship of height with radial BMD is an unexpected and unusual finding which is difficult to explain, but has been noted before for trabecular BMD (1.64). It is possible that taller women have thinner radii.
Considering the two menopausal groups together, these results are similar to previously published studies. Age, has been s h o w n to be n e g a t i v e l y r e l a t e d(1.50.1.51.1.63.1.68.1.69.1.70.1.78.1.79.5.3.5.13), and weight unrelated (1.50,1.64,5.13) or weakly positively related (1.51) to radial BMD. Height has been variably shown to be unrelated(5.13), weakly positively (1.50,1.51,5.14) or weakly negatively (1.64) related. Postmenopausal status (1.51) and years postmenopause (5.13) have been found to be negatively related to radial BMD. The effect of the menopause upon radial pQCT BMD measurements is discussed further in chapter 7. Disparity with the some of the results of others could be explained by differing method of analysing the relationship between anthropometric and BMD variables, as some have used linear regression, others multiple regression and others a combination
80

of both. Additionally, although pQCT was used in some of the work quoted above (1.50,1.64), SPA was used by others(1.51,5.13). Accordingly, the scan site and therefore proportion of trabecular bone differs, as do the reported BMD measurements.
81
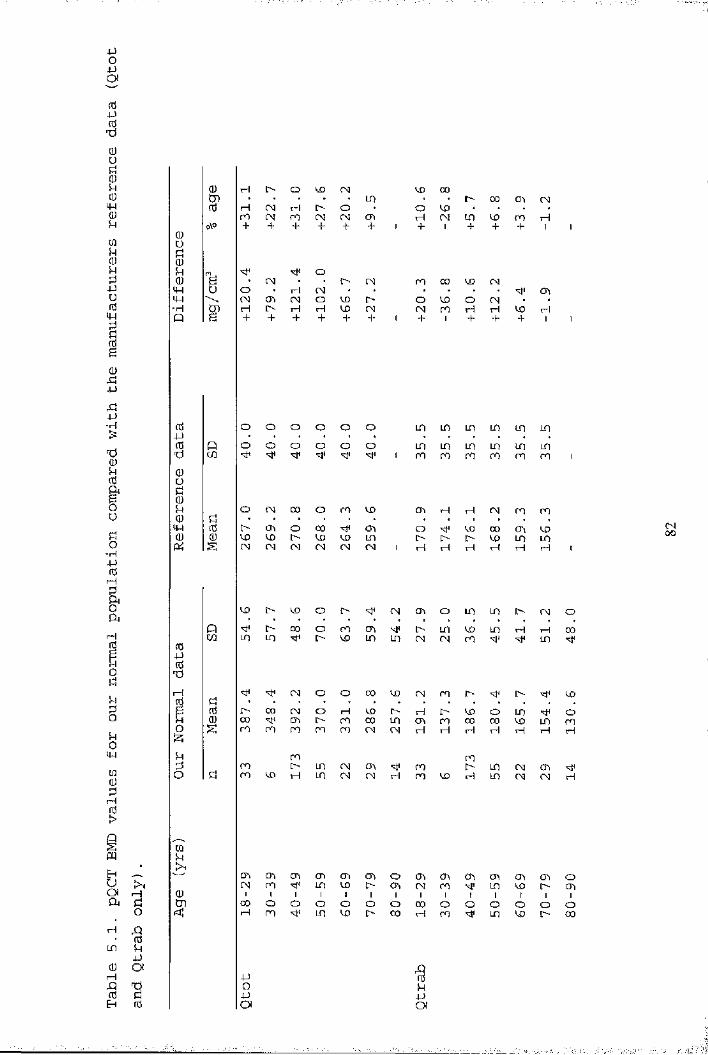
JJo■JJOf
(d4-J(dTÎ0u
O o CM4-J tH O •m M (N m O U) H CMro
o. I> CMH CM * *CM O CD [>H H CD CMm 00 CDCHO CD OCM ro H-H
-H o o o o o oo o o o o o ro ro
O CM CD O ro CDO CTi OCD CD l>CM CM CM
00CDCMsM cn CD inCM CM
CD l> CD O CM Cn O00 o CD cnO CO LD [>
CMID CO CM CD
CM O O CD CD CM CDO H CDCD CD
H l> CDcn CD CO
iw CDI> ID CM ChvH LD CM CM
CDCDCD CO HfH
CTt CTi CTh CTiCM CD ID CD Ch O CD Ch CDCD O CD CM CD
00 O OH CD ^ O00 00 o oH CD
LD
o
CO CD CMCD+
CMCM rH + +
IDCD
00COr-t
IDID
O00rH
IDID
CDIDIOID
CD+
CD
IDCD
CDLDH
H
IDCDr4
CMCM
CDCOI
OCD
iHI
CD
LD ID LD
LDCD
CM CD CD
CDIDT—I
CMiHID
LDrH
CDCM
CDl>I
O!>
CO
OCDH
H
OCDI
O00
00
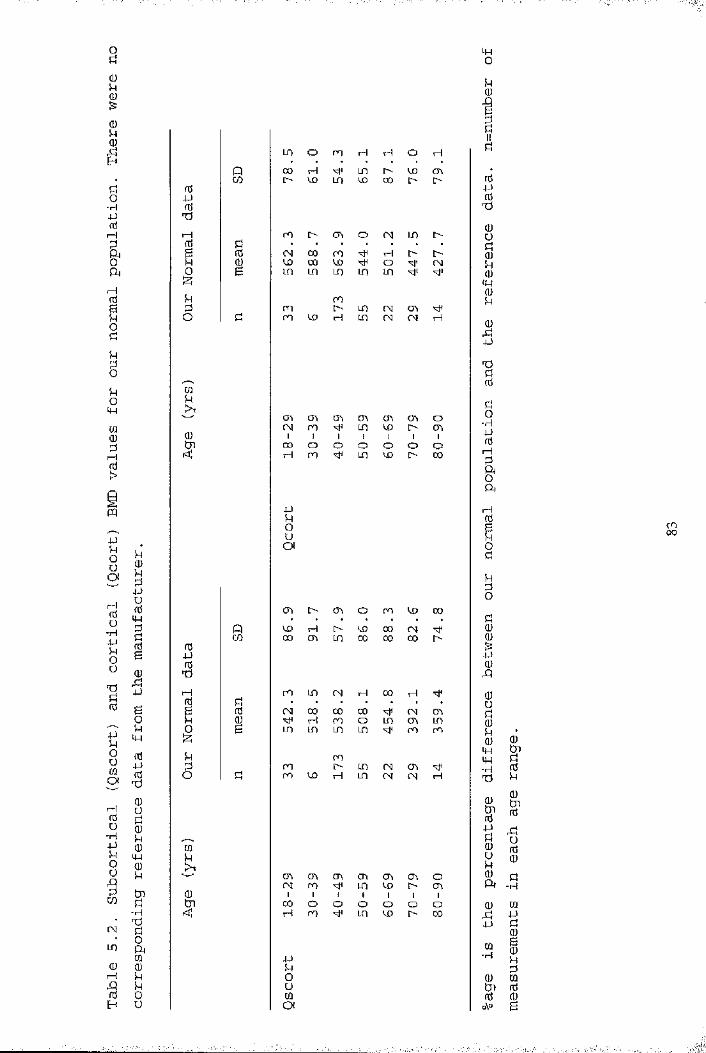
o
o oCO H LD l>\o Ln U) 00
rHrH ro o cr\ ooj 00 roW 00 U)LD m LO
o(W
roi> LD CH mLD (H CH
Ch Ch Ch Ch mLD ix» [> oCh -H
00 o H ro O O O O OLD ^ !> 00
Ch i> Ch O ro 'X) 00CD 00 CH00 CO 00'H
ro 00CH 00 00 00^ H ro oLO LD LD LO
roi> LD H LD CH Ch (H CH
■H
Ch Ch CH ro Ch Ch Ch Ch OLD CD r- Ch00 o H ro o o o o oLD CD C- CO
CHLD ■H
a
-L'-J
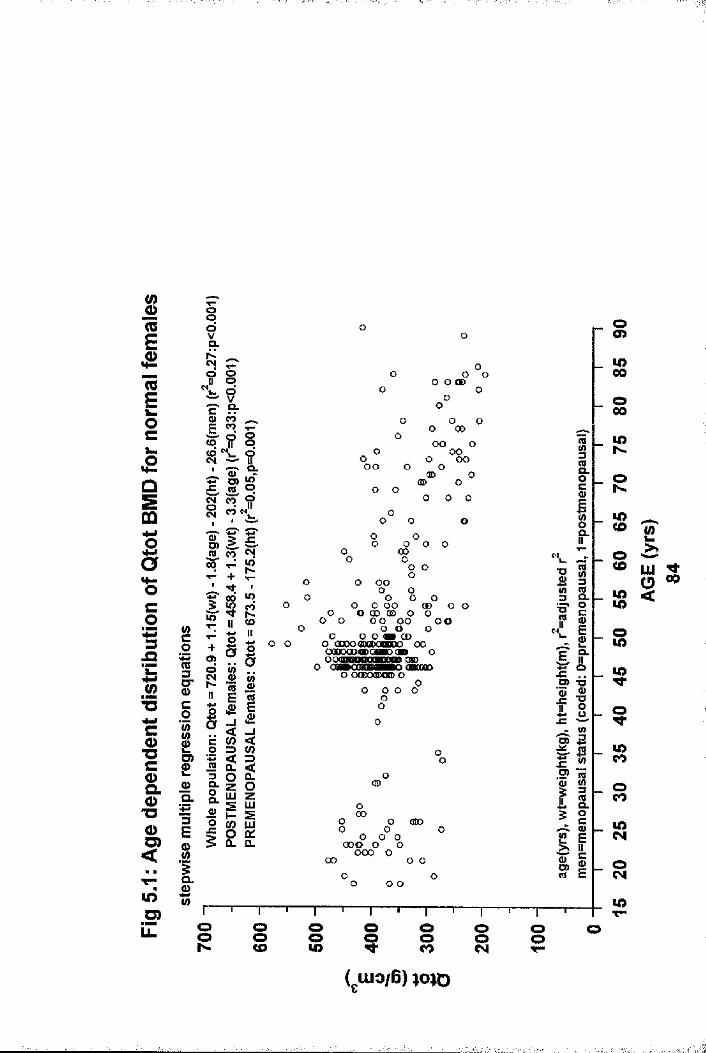
InE£IQËocÛSm
So
3.O
.<2T3wwC0>"Cc&0>"Oo<
lOO)iZ
S01 S'§Ir0)Q.3Es1«
oqdVQ.NCM? oqVCLcg
to ? Eoto dCM IIOl
a %JC (QqcT« da d M(Da> CM« h-+■M-0Ô lOw CO*?TH &IIo+ a Bq ao wCM o Mh-1) raE 0)2I & 1a _i< _jic (0 <o 3< 3iS Û. <3 o Q_Q. z OCLLUjg zlU0) h- SO co LUo q:Û. a.
o o oO O 00 oooo
rs
o 0 00GO Oo OOG O GOOG O OCD O
o o ® O
oO O O
o o o o
oo o 0 CO O G
O 0oGO GOO O0
G O OO O OG OD O o
o o
O O CD 00 O Oo o oo oo oo o o oO O O OB CDo aaxxmoDOBKK) oo ooDoaooooflKxa» o 080O OaBOOaOMHWO OBOOOO o (XDoaooo) o oO G O Ooo
oo00
o00 doo oG O Oooo o oGOO Ooo o o
o o
oo>u>00
oLOCO
slOCO
s$
COCOoCOCOCN
CO
S2Z !g s
O o o o o oO o o o o oCO CO CO CM T“

IRIEÆRIgOc.aI"6CO* 33
ïT3CO■DCOQ.Q)*oO<
lO.gLL
g01 S'§
12a.3Eg1aw
.__Oo 9o qV pçx VcT CLS' ÔÔo O
ifp d°Q. IId.
£ s C'p 5d Tfod idfO Md.MoT0) D)O) (Q £5 cTq pd' M +
d q?R CM
11 5o XI II+ ë «a hM aw (/)M-II fl)
2 ïja E 2« (D Eis <ua «c<c (0 <o ZD (0% < =>w CL <zs O a.Q. z OOCL LU2 zLUJ£ 1— 2o 0) LU> o 01Q. Q.
oo
oooo o oo
00
oo
o o o CD o o00 o ooo oo o
o o o o o
oo
oo
oo
o o
o oo o o 00 o oo o QD o o (0)00 o o o o oo W 00 CD o o 00(00 d» (3D ooo o oo OmODO o > (OO o oca> mm omo ccmcm o owoooamooDmmDOMmm# o o OaO o CMB o
o(CDooo
o oo
oooo oo o oo oQD o o QDOO OOO o<x> o
■DI?
J=O)'5if
Ij=O)II
oo>lO00o00u>
U>CO
OCO
sisa9
lOCOoCOu>CM
W)
iO00
s sCO sCM O S
I
I4If
îî

(0
I( 0ioc£01ooaco3ja£M" O
coT3CQ )Q .OT30O )
<oIÔ
§?
s iKR ? I
s01 S'c0
10)Q.+33EsI
ICO
&oi10§11r0 u
sc1
<Do>
§COiIIt :o 3
« ® Gf o
!iW
<0 .ll
I « § I S £
o o o o
oo
o
o
oo o
OG)o
oO O O Oo
OO
00 o(Q> OO O
Œ)
OO OO
oO o
o
O o
o o oO o
o o oO O O O O O QDoo O 0(® 00
OO O 00 ODO OO o
OQCBQD OOoocaaoDcooo oO O QD CQBCnQDOOOO O O OOQO OMBOPOaPO
O 0 ( D O OBDO
O O O O O
00
00
O OoO O O O
o o o o o 000 00 o o o o
oo
o o
sa0
51 1 °
n
f lB 75I ^r I
!Q)E
i
IO) O o o o O o o o OLL. o o o o O o o o O<J> 00 N CD to CO CM
( UIO/B) )J03S0
§lO00oCOu>N.
olOCDoCOlo 2 «>>.
S o<
$
lOCOoCOiOCM
u>
CDCO
;a
Î-i
.a
„|1t
%
' '
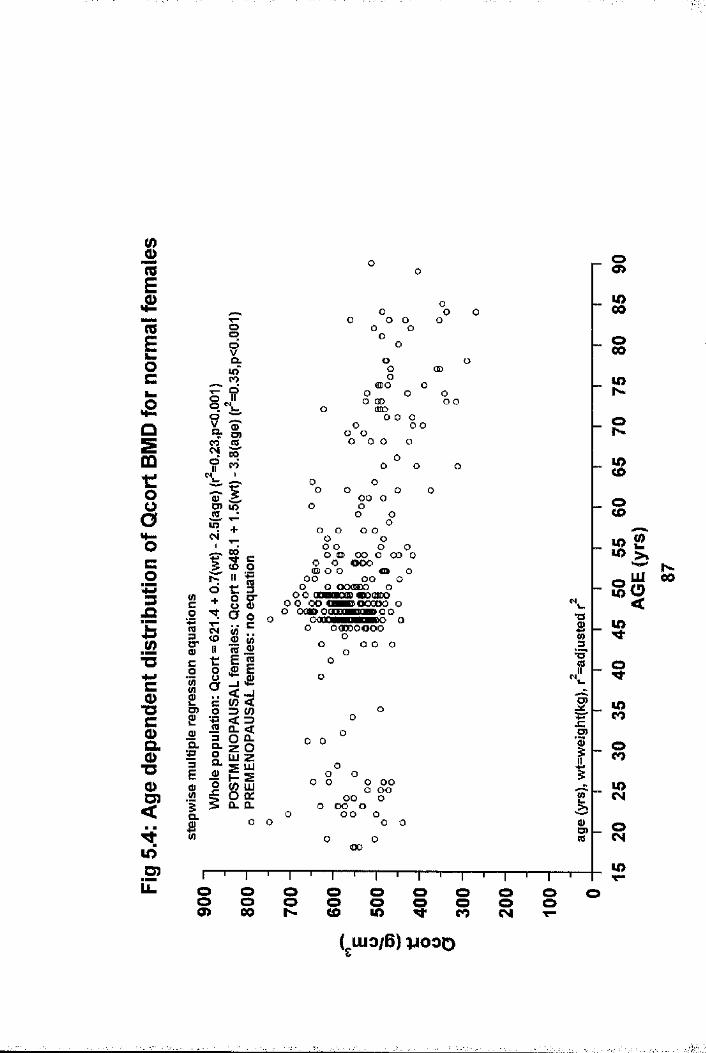
reEÆreÊock .
£Q
sOQt:oo
co'433
.52" UHMCCD13CÈo"OCD
<
5D)
§?Q.in'|i
4 âq §
IIS :liIfl)Q."■jS3Efl)I
HrIcIa.oCLfl)o
§ c <o oIta ol aIIS5= )
Îzm
ièz 111 P s(0 UJo Ù:Q_ CL
O O
ooo
<n>o o o oO OD (HDooo
o o
oo
o
OD
oo o
o o oo o o
o o o o o
o o o
o o o o o oo o o oo o o o o oo o
o o ooo(ID O O fl» Oo o o o O
o o OOflSDO o oo aooanoD<DO(Bsoo o O O O M D O O O O O O
O OOP OOQCM P g» o Q O OCaoOHDHPBDO O
O OOODOOOOo
o o o oo
O
o O
O
o o
Oo o
o o o o o o o o
o o o o o o o
o o oo o
<oo
1f
ICDO)re
oO )
LO00
LON
oh -
LOCD
sS Ï
g S “
LO
LO
oCOLO( N
LOLL sh- oo
(O
oo o I oooo> 00
!■
CHAPTER 6
COMPARISON OF RADIAL pQCT BMD MEASUREMENTS WITH MEASUREMENTS AT OTHER SKELETAL SITES: IMPLICATIONS FOR THE USE OF pQCT INSCREENING FOR LOW AXIAL BMD.
6.1 IntroductionBone density measurements are now possible at a variety of skeletal sites using different techniques. At the present time DXA is considered the "benchmark" method of assessment. Therefore, in the development of pQCT, it would be important to document the relationship between DXA and pQCT BMD measurements. Similarly, it would be useful to know the relationship between pQCT and other emerging scanning techniques such as ultrasound. This is particularly important as regional variation in bone mass status exists within individuals (6.1,6.2,6.3) .
Osteo-densitometry has some well defined roles in the management of bone disease (1.145,1.146). However, the issue of screening and prevention for the general population remains contentious (1.101,1.194). Screening for osteoporosis has been discussed in more detail in the introduction (chapter 1.5) . It has been suggested that DXA may be of value in screening perimenopausal women, targeting those considered to be "at risk" for life style and therapeutic intervention. Selection of individuals in the lowest quartile (1 .88) or quintile (1 .101) of aged-matched DXA hip and lumbar spine measurements is one method proposed for identifying individuals for intervention, while another is to target prevention in those with osteoporosis (T-score of -2.5), or osteopenia (T-score of -1.0 but > -2.5) (6.4). An ideal bone density screening toolwill accurately predict subjects at risk of future osteoporotic fracture. As discussed in the introduction (chapter 1.4 & 1.5),
88

BMD assessment is the best method of defining fracture risk (1.101,1,194). The best predictive power is achieved by- measuring BMD at the site of future fracture, ie at hip and spine (1.88). pQCT is probably cheaper and more portable than DXA, so could be used either to predict fractures or to select subjects for measurement with the more expensive DXA technique. The predictive capacity of pQCT can only be determined by longterm prospective studies, as already done for radial SPA measurements in spine (6.5) and hip (1.192) fractures. Pending publication of such studies with pQCT, it could be used in an attempt to select individuals with a high risk of low hip and spine BMD.
The relationships between BMD measurements using different techniques at various sites were therefore examined by comparing pQCT BMD measurements with DXA (hip and spine) and calcaneal ultrasound measurements in a perimenopausal female population, and whole body DXA measurements in a postmenopausal female population. The potential for pQCT to be used as a community based screening tool preliminary to axial DXA measurement was examined in the perimenopausal population - that is, could it pre-select a group from the community who could be offered an axial DXA BMD measurement,
6.2 Study Populations and Bone Mass MeasurementsThe relationship of pQCT BMD measurements and those at other skeletal sites was examined in two groups:
Group 1. The relationships between the four pQCT BMD measurements were examined in 216 perimenopausal females who attended an osteoporosis screening programme. The method of recruitment has been described previously (Chapter 5.5.2-point 2). The relationships between pQCT and DXA hip and lumbar
89

spine BMD measurements, and calcaneal ultrasound measurements were also studied in this population. DXA measurements were performed on the initial screening visit, whilst pQCT and ultrasound measurements were performed on the same day at an additional visit within 2 months.
Group 2. Comparison of pQCT measurements with DXA whole body BMD (WB-BMD)was made in 45 postmenopausal females who were acting as controls in a study examining the power of different scanning modalities (DXA, CUBA and pQCT) in discriminating patients with hip fracture from a control population. This study is discussed further in chapter 8 . Women within this group who had undergone hysterectomy had done so more than 2 years after cessation of their menses, and were considered to be postmenopausal. Further analysis of the whole body scan identified the non-dominant arm (ipsilateral to that scanned using pQCT) as an additional region of interest (ROD . The medial border of this ROI passed through the gleno-humeral joint and excluded all other bony areas. This is depicted in figure 2.5. The BMD of the whole arm was then derived (WB-ARM). All measurements were all done on the same day.
6.3 Statistical AnalysesResults for continuous variables are expressed as mean with standard deviation when normally distributed, median with range otherwise. Maximum and minimum values are shown for all bone density variables. The relationships between the various BMD measurements were examined by linear regression and Pearson correlation co-efficients. In the perimenopausal population (group 1) , quartiles of the DXA, CUBA and pQCT measurements
90
1-
were calculated with comparison of the proportion of individuals in the lowest quartiles of the different measurements. In view of the recently agreed WHO criteria for the diagnosis of osteoporosis and osteopenia based on bone density measurements (6.4), the proportional cut off value for each pQCT measurement which would be required to detect all women with osteopenia (T-score of -1.0) at either the hip (femoral neck) or spine site was determined, and compared to ultrasound measurements.
6.4 Results6.4.1 Demographic and Bone Mass DataDetails of age, height and weight for all individuals (groups 1 & 2) are shown in Table 6,1. In group 1, 101 (46.8%) of the study population were premenopausal, 46 (21.3%) had previously undergone hysterectomy and 69 (31.9%) were postmenopausal. All females in groups 2 were postmenopausal. Bone mass data for groups 1 and 2 are shown in tables 6.2 and 6.3 respectively. Due to scanner malfunction, it was not possible to record BUA and VOS results in 5 and 7 subjects respectively in group 1, and it proved impossible to isolate the arm as a ROI from the whole body scan in 1 female in group 2. Only the DXA hip and spine measurements have a locally acquired normal range based on 300 women known not to have osteoporosis. Locally derived T- scores are given for the group 1 study population compared to this normal range.
6.4.2 Intra-Technique BMD Correlations for pQCTThe relationships between the different pQCT measurements are shown in figures 6 .1-6.3. Qtot and Qscort correlated best (r=0.917). Qtot correlated less strongly with Qtrab and Qcort (r=0.687, r=0.551 respectively). Qscort was highly correlated with Qcort (r=0.739) but only moderately with Qtrab (r=0.457). Qtrab and Qcort were very poorly and negatively correlated (r=-
91

0.152) .
6.4.3 Correlations of PQCT BMD Measurements with Bone MassMeasurements at Other Skeletal Sites
The relationships of Qtot with hip, spine, arm and whole body BMD measured by DXA, and calcaneal ultrasound BUA and VOS measurements are shown in figures 6 .4-6.7. The correlation with hip measurements were all of a similar magnitude (FN: r=0.459, FT: r=0.443, FW; r=0.441), and slightly lower with LS(r=0.389). Correlation were comparable with WB-ARM {r-0.456), and slightly higher with WB-BMD (r=0.545). The relationship with calcaneal ultrasound measurements were generally poor (BUA: r=0.272/ VOS: r=0.159).
The relationships of Qtrab with the above measurements are shown in figures 6.8-6.11. The relationships were similar to those found for Qtot, with slightly higher correlation with LS (r=0.41), FT (r=0.462), FT (r=0.525), WB-BMD (r=0.573) and BUA (r=0.306), and slightly lower correlation with FW (r=0.438), WBA-ARM (r=0.435) and VOS (r=0.097).
The relationships of Qscort with the above measurements are shown in figures 6.12-6.15. The correlations with LS (r=0.345), hip (r-0.406, 0.363, 0.403 for FN, FT and FW respectively), WB- BMD (r=0.416), WB-ARM (r=0.371)and BUA (r=0.242) were slightly poorer, and VOS (r=0.165) slightly greater than those found for Qtot.
The correlations of Qcort with other measurements (figures 6.16-6.19) were found to be extremely poor: (r: 0.047-0.207),and was best with WB-ARM.
6.4.4 Comparison of the Proportion of Females in the LowestQuartiles of the Different Measurements for the
92

Perimenopausal Population (Group 1)All women were placed in a quartile for each of the DXA (hip and spine), pQCT and ultrasound measurements. The percentage of females falling into the lowest quartiles (QU ) of pQCT and DXA measurements also in the lowest quartile of other mutually exclusive hip and spine measurements are shown in Figure 6.20. Around 50% of women in QU4 of LS, FT and FW and around 25% in QU4 of FN were also in QU4 of Qtot, Qtrab and Qscort. The corresponding figures for Qcort were around 30%. However, only about 60% of women in QU4 of the hip measurements were also in QU4 of LS, and about 70% when comparing intra-hip measurements. Figure 6.21 shows a similar analysis comparing women in QU4 of the pQCT and ultrasound measurements. Generally, less than 50% of women in QU4 of all pQCT measurements were also in QU4 of BUA, with the corresponding figures for VOS being lower.
6.4.5 Proportional Cut-Off Figures for pQCT Measurements inDetecting Low Axial BMD in the Perimenopausal Population : Comparison with Ultrasound Measurements (Group 1).
In group 1, 97 (44.9%) women had a T-score -1,0 at LS, and 108 (50%) at FN. The proportional cut off values to detect all women with T scores -1.0 at LS and FN and the percentage of women below this value for each of the other bone density measurements are shown in Table 6.4. The proportional cut-off values for all pQCT measurements were such that almost the whole population would have to be scanned to detect all women with hip and spine osteopenia. However, the findings were similar for ultrasound measurements. Also, to detect all women with spinal osteopenia based upon a FN measurement, 96.3% of the population would have to be scanned, and 88.4% to detect hip osteopenia based upon a lumbar spine measurement.
93
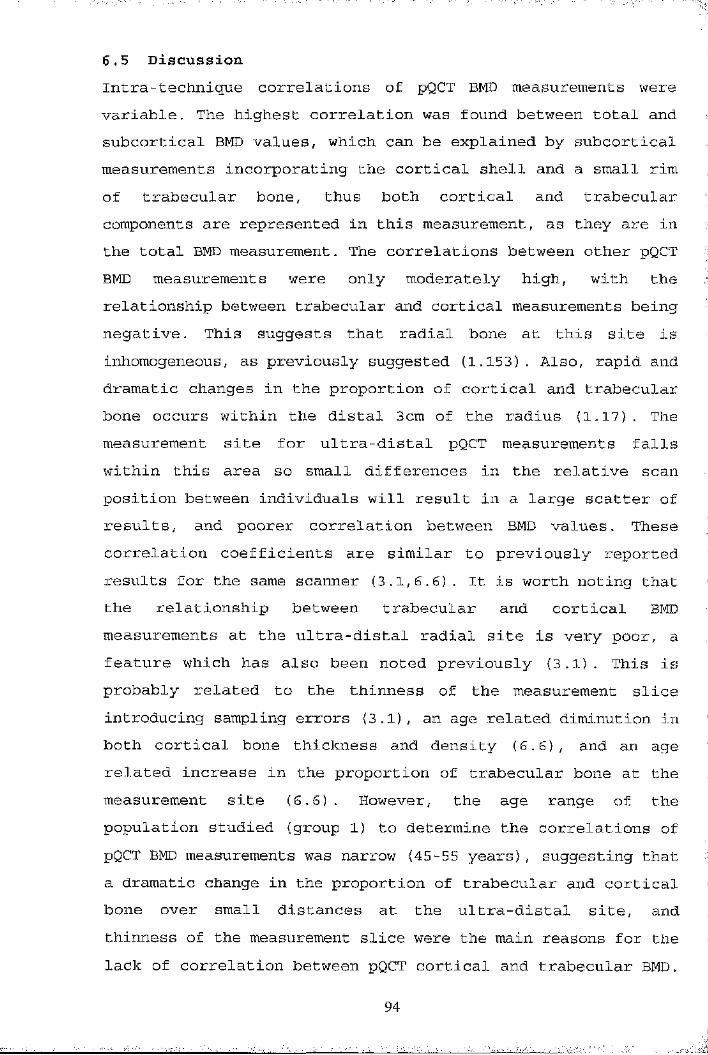
6.5 DiscussionIntra-technique correlations of pQCT BMD measurements were variable. The highest correlation was found between total and subcortical BMD values, which can be explained by subcortical measurements incorporating the cortical shell and a small rim of trabecular bone, thus both cortical and trabecular components are represented in this measurement, as they are in the total BMD measurement. The correlations between other pQCT BMD measurements were only moderately high, with the relationship between trabecular and cortical measurements being negative. This suggests that radial bone at this site is inhomogeneous, as previously suggested (1.153). Also, rapid and dramatic changes in the proportion of cortical and trabecular bone occurs within the distal 3cm of the radius (1.17) . The measurement site for ultra-distal pQCT measurements falls within this area so small differences in the relative scan position between individuals will result in a large scatter of results, and poorer correlation between BMD values. These correlation coefficients are similar to previously reported results for the same scanner (3.1,6.6). It is worth noting that the relationship between trabecular and cortical BMDmeasurements at the ultra-distal radial site is very poor, a feature which has also been noted previously (3.1). This is probably related to the thinness of the measurement slice introducing sampling errors (3.1), an age related diminution in both cortical bone thickness and density (6 .6), and an age related increase in the proportion of trabecular bone at the measurement site (6 .6) . However, the age range of thepopulation studied (group 1) to determine the correlations ofpQCT BMD measurements was narrow (45-55 years), suggesting thata dramatic change in the proportion of trabecular and cortical bone over small distances at the ultra-distal site, and thinness of the measurement slice were the main reasons for the lack of correlation between pQCT cortical and trabecular BMD.
94

There was also only moderate correlation between pQCT BMD measurements and the total BMD of the ipsilateral arm, as identified from the DXA whole body scan. As the radius, ulna and humerus are long bones consisting predominantly of cortical bone, it is surprising that the correlation between the pQCT cortical BMD and DXA arm BMD was not higher, whilst the best correlation was found with the pQCT total BMD measurement. Once again though, this is likely to be related in part to the size of the measurement sample, relative to the size of the upper limb.
The correlations between total, trabecular and subcortical pQCT radial BMD measurements and DXA BMD measurements of the lumbar spine, proximal femur and whole body are all of a similar magnitude and at best only moderate, whilst those for cortical BMD are even poorer. Similar relationships between pQCT and DXA hip and spine BMD measurements have been reported previously using similar pQCT scanners with an single energy x-ray source (1.50,3.1), and a predecessor using a energy source (6.7) .To my knowledge there no reports comparing pQCT measurements to whole body BMD.
Similarly, correlations were poor between all pQCTmeasurements and both calcaneal ultrasound measurements, confirming previous findings (1.50). The best correlation was between BUA and radial trabecular BMD, which is perhaps not surprising as the os calcis consists of 90-95% trabecular bone (1.21). This differs from the results of a previous study where BUA correlated better with radial mid-shaft BMD (predominantly cortical bone) , rather than with trabecular BMD measured at a distal site. The pQCT scanner which was specially built, was
95
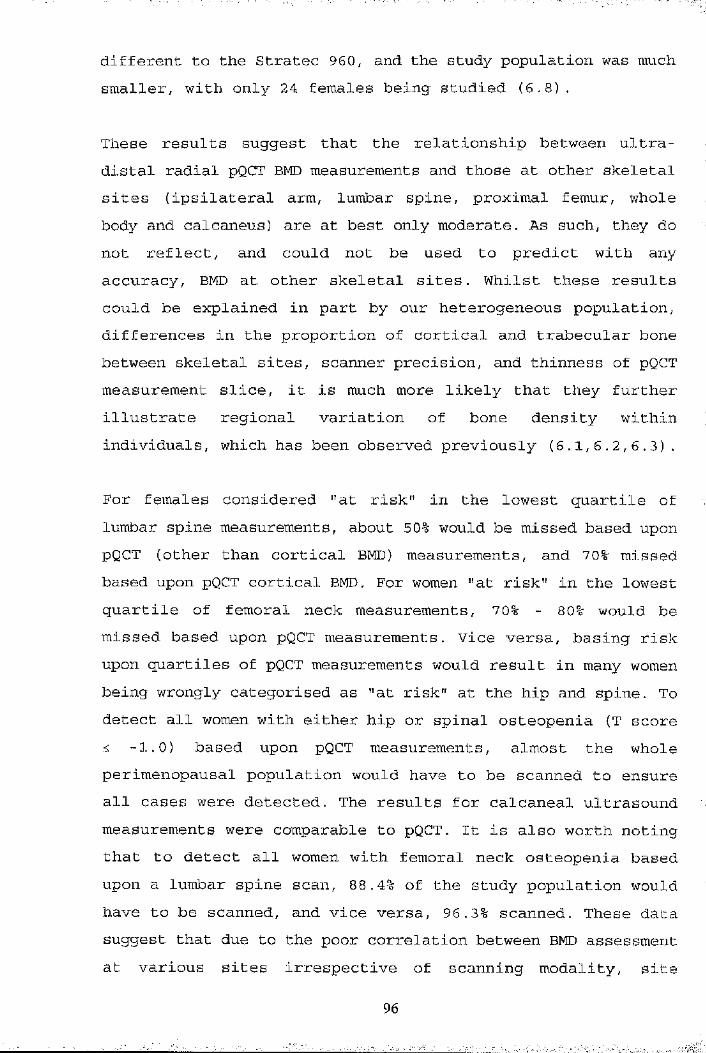
different to the Stratec 960, and the study population was much smaller, with only 24 females being studied (6 .8) .
These results suggest that the relationship between ultra- distal radial pQCT BMD measurements and those at other skeletal sites (ipsilateral arm, lumbar spine, proximal femur, whole body and calcaneus) are at best only moderate. As such, they do not reflect, and could not be used to predict with any accuracy, BMD at other skeletal sites. Whilst these results could be explained in part by our heterogeneous population, differences in the proportion of cortical and trabecular bone between skeletal sites, scanner precision, and thinness of pQCT measurement slice, it is much more likely that they further illustrate regional variation of bone density within individuals, which has been observed previously (6 .1 ,6 .2 ,6 .3) .
For females considered "at risk" in the lowest quartile of lumbar spine measurements, about 50% would be missed based upon pQCT (other than cortical BMD) measurements, and 70% missed based upon pQCT cortical BMD. For women "at risk" in the lowest quartile of femoral neck measurements, 7 0% - 80% would bemissed based upon pQCT measurements. Vice versa, basing risk upon quartiles of pQCT measurements would result in many women being wrongly categorised as "at risk" at the hip and spine. To detect all women with either hip or spinal osteopenia (T score -1.0) based upon pQCT measurements, almost the wholeperimenopausal population would have to be scanned to ensure all cases were detected. The results for calcaneal ultrasound measurements were comparable to pQCT. It is also worth noting that to detect all women with femoral neck osteopenia based upon a lumbar spine scan, 88.4% of the study population would have to be scanned, and vice versa, 96.3% scanned. These data suggest that due to the poor correlation between BMD assessment at various sites irrespective of scanning modality, site
96
. _ _ . :
specific or at least two-site assessment of risk is preferable in those requiring fracture risk assessment. Two-site assessment has previously been shown to improve the predictive value for subsequent vertebral fracture {1.191,6.9,6.10).
These results show that pQCT would be of no value in preselecting individuals for further axial DXA measurements should a screening program for osteopenia become reality. However, calcaneal ultrasound measurements have been shown to predict future hip fracture (see chapter 8) and there is convincing evidence that peripheral bone density measurements are useful in determining fracture risk. Although hip fracture risk is best determined by a site specific measurement (1.192), prospective studies have shown that radial BMD measurements, using osteo-densitometers other than pQCT, can predict fracture risk at the hip (1.192) and spine (6.5). Prospective studies are required before similar claims can be made for pQCT.
97
!■■Vi.4'
■I:
»
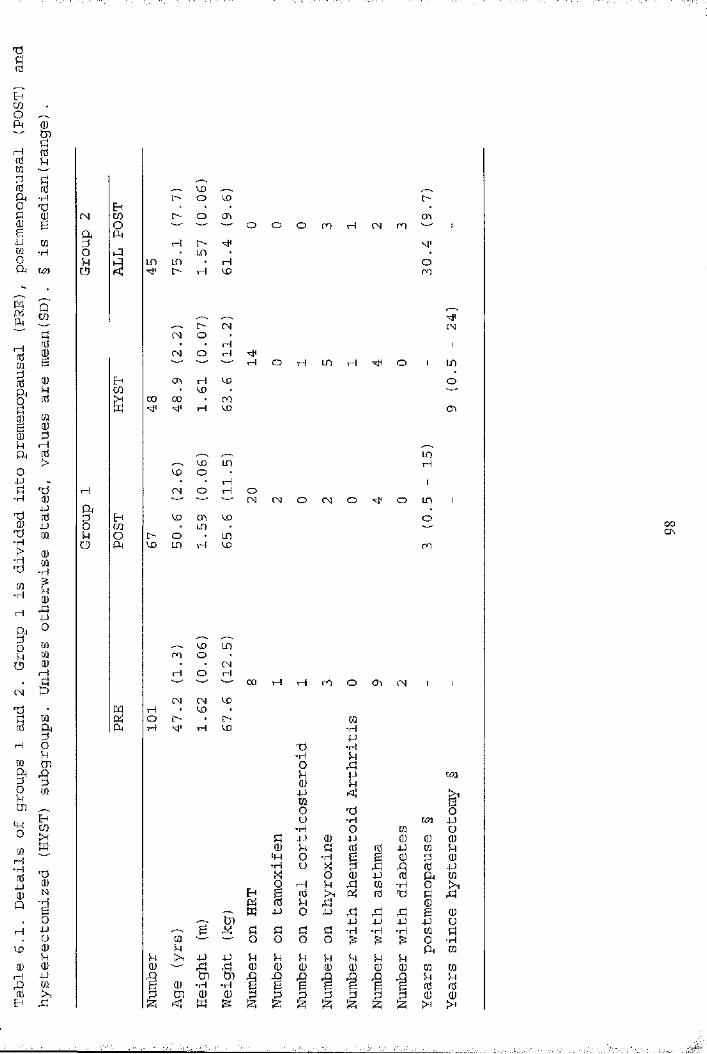
P0fd
PwOPM 0)tnqfdrd MCOdfd fdA ■Ho TJü (Um gg4J COCO "HOA U?1
E-ffN COOA Oidokl 1-qo
LOo o LO i>!> o m cho O O m rH CM ro '—' iH i>• LO • •LO un • r4 Oo H LO m
[> (M CMCM o• • H 1CN o H rH O H en rH o 1 LOON H LO OLO00 00 • mH LO CTi
LOLO m Hw O• • rH 1CM O rH OCN CM O CM O o LO 1
V£) m LO Oeno O envo en H LO ro
--s LO mro O CMrH O rH 00 rH rH ro o ON CM 1 1CM CM LOLOO • [> COH LO ■H
Td "H-H kl0 PM 4J uneu kl4JCO g0 -d Oo ■H un 4-)■H O CO Ud eu 4J (U eu (Ueu kl ti fd fd 4J CO klLW 0 -H g g eu d eu■H U X d P P fd 4JX o eu 4-) fd a COO 1—1 kl rd CO ■H oE-; g fd fd d d dpfî fd kl p euK jj o p rd rd rd g eut:n 4J 4J 4J p u,—. g rk: Ü fU d d -H -H -H CO dCO "—' O 0 o o 0 •Hu a CO>y e 4-> k k kl u kl kl klrd eu (U eu eu eu eu eu CO COtn Cn ,n kl kl(U -H -H g fd fdm eu (U d P d d d d d eu eu< K S !z; S S !2i !2| >4
00On
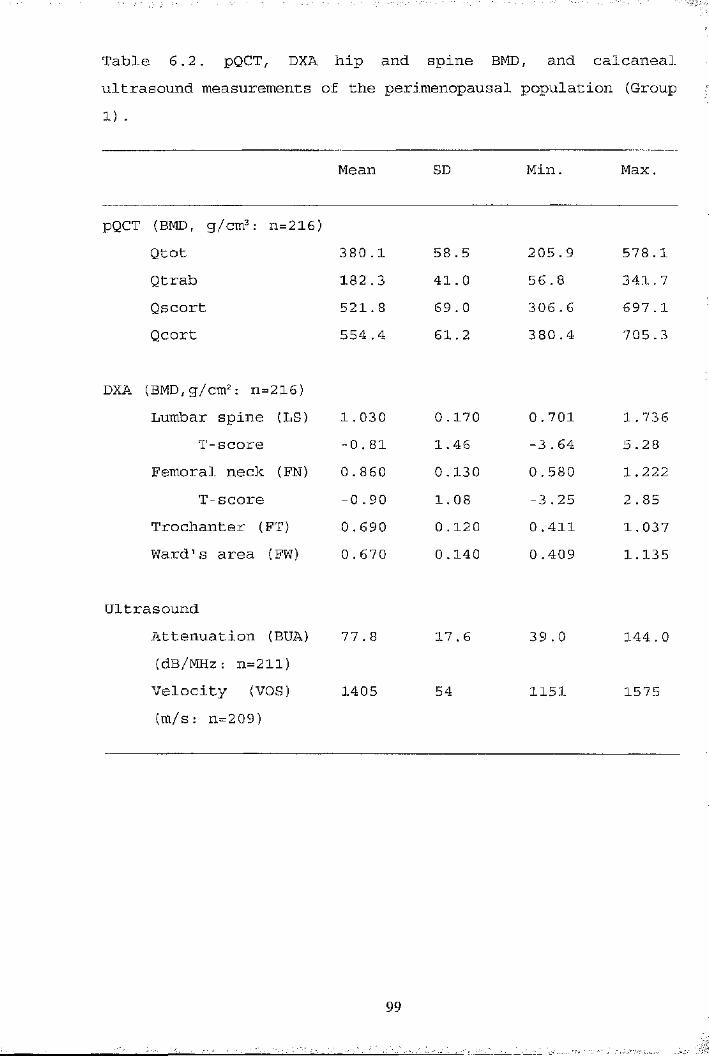
Table 6.2. pQCT, DXA hip and spine BMD, and calcaneal ultrasound measurements of the perimenopausal population (Group 1) .
Mean SD Min. Max.
pQCT (BMD, g/cm^ : n=216)Qtot 380 .1 58.5 205.9 578 .1Qtrab 182 .3 41. 0 56 . 8 341. 7Qscort 521.8 69 . 0 306 . 6 697.1Qcort 554 .4 61.2 380.4 705 . 3
DXA (BMD,g/cm2: n=216)Lumbar spine (LS) 1. 030 0 .170 0 . 701 1. 736
T-score -0 . 81 1.46 -3 . 64 5.28Femoral neck (FN) 0.860 0 ,130 0.580 1.222
T-score -0.90 1 . 08 -3 .25 2 . 85Trochanter (FT) 0 . 690 0 .120 0.411 1.037Ward’s area (FW) 0.670 0.140 0.409 1.135
UltrasoundAttenuation (BUA) 77 .8 17.6 39.0 144.0(dB/MHz: n=211)Velocity (VOS) 1405 54 1151 1575(m/s: n=209)
991
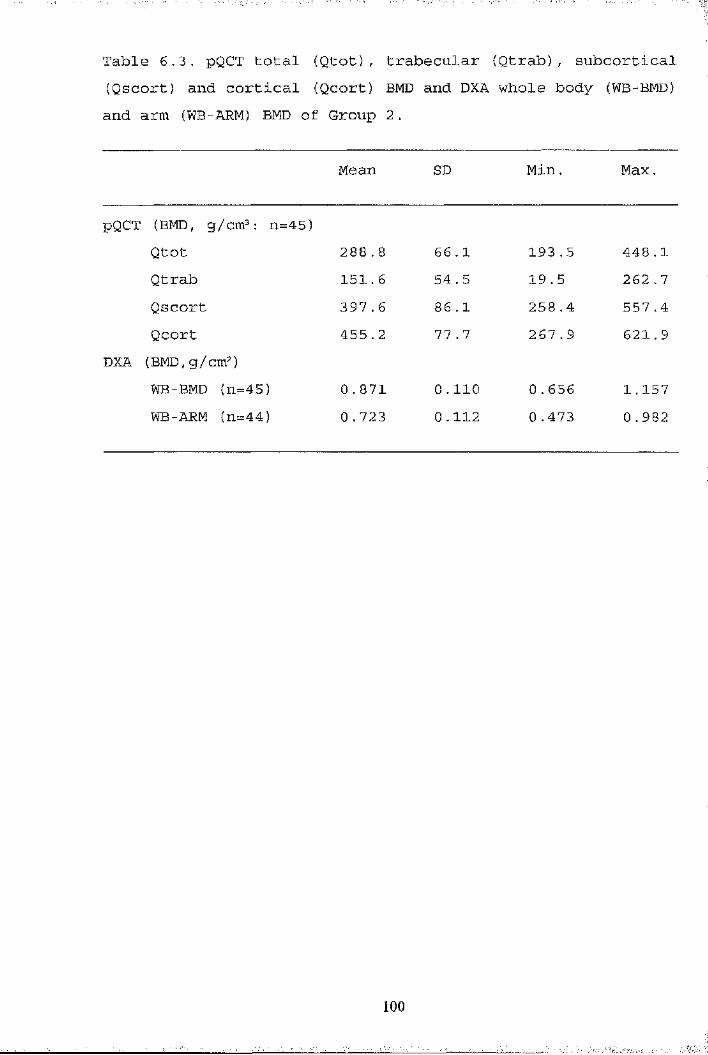
Table 6.3, pQCT total (Qtot), trabecular (Qtrab), subcortical (Qscort) and cortical (Qcort) BMD and DXA whole body (WB-BMD) and arm (WB-ARM) BMD of Group 2.
Mean SD Min. Max.
pQCT (BMD, g/cm^: n=45)Qtot 288 .8 66 .1 193 . 5 448 .1Qtrab 151.6 54 .5 19 .5 262.7Qscort 397.6 86.1 258.4 557.4Qcort 455.2 77 .7 267 . 9 621.9
DXA (BMD, g/cm2)WB-BMD (n=45) G .871 0.110 0.656 1.157WB-ARM (n=44) 0 .723 0.112 0.473 0.982
100

Table 6.4. Cut-off value and proportion of population below this value for each of the DXA, pQCT and ultrasound measurements to detect all women with T scores -1 at lumbar spine (n=97) and femoral neck (n=108). Values are: bone density cut-off value (percentage of population)
Lumbar Spine Femoral neck
DXA (BMD, g/cm2)LS - 1.236 (88.4)FN 1.104 (96 .3) -FT 0 . 835 (89.4) 0 . 751 (71.3)FW 1. 023 (98.6) 0 . 812 (85.6)
pQCT (BMD, g/cm2)Qtot 578.1 (100) 578 .1 (100)Qtrab 278.1 (98.6) 278 .1 (98.6)Qscort 688.6 (99.1) 688 . 6 (100)Qcort 693.8 (99.5) 705.3 (100)
UltrasoundBUA (dB/MHz) 144 (100) 122 {98.6)VOS (m/s) 1496 (97.1) 1514 (99.0)
101 :|
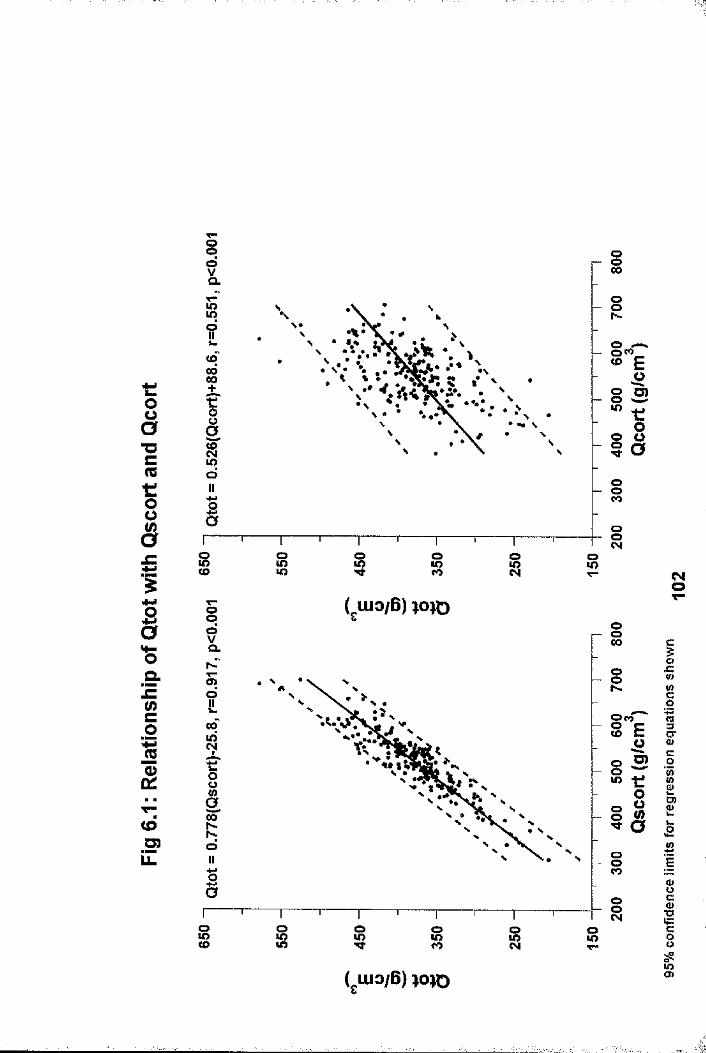
t:oa“Oc(Qt:o0(S§
10 alEU)c1 1
<o_0 )iZ
IooN
• #
OlOoo
o8
Oo<NCMOT-
OO00oQ.
JCogo>oOco to !00
8 cr
O)siosi o
8 I 8 8
o>

oo
t0 uâ1 $ t
I"OCmxTIiI0
.s-!c(n§1c4(OU)iZ
oo00CL
§r-o00
iO
OCO
CNOo00og sto i os I
sooa.sd §00(Oto8 § s
” Xi
S
oo i os g i o8
€0O
1x :(0V)cg«3ïïC0
1sc
•§w=c
8*oO)
(ulOiB) w o
■il'iI
■1îII
1“i'î
î'Aî«■
Iî■1 ..

tfoa"Ocmt:ou8JZ
JQ
Iw-0.s-JZC11CO<DD)11.
<oq0
s9IL(Ooô81oIISI
ê
IIo S "i
iIooCO
B>tI
S ooCO sCM goo ( luo/B) qeJiDO gO.u> Io
Oco(Od - §
i?IooCO
Io ooCOoo o
(gUio/G) qeiMD
O
0 : g1I§IS'
sI1Cc8s?S
■
î
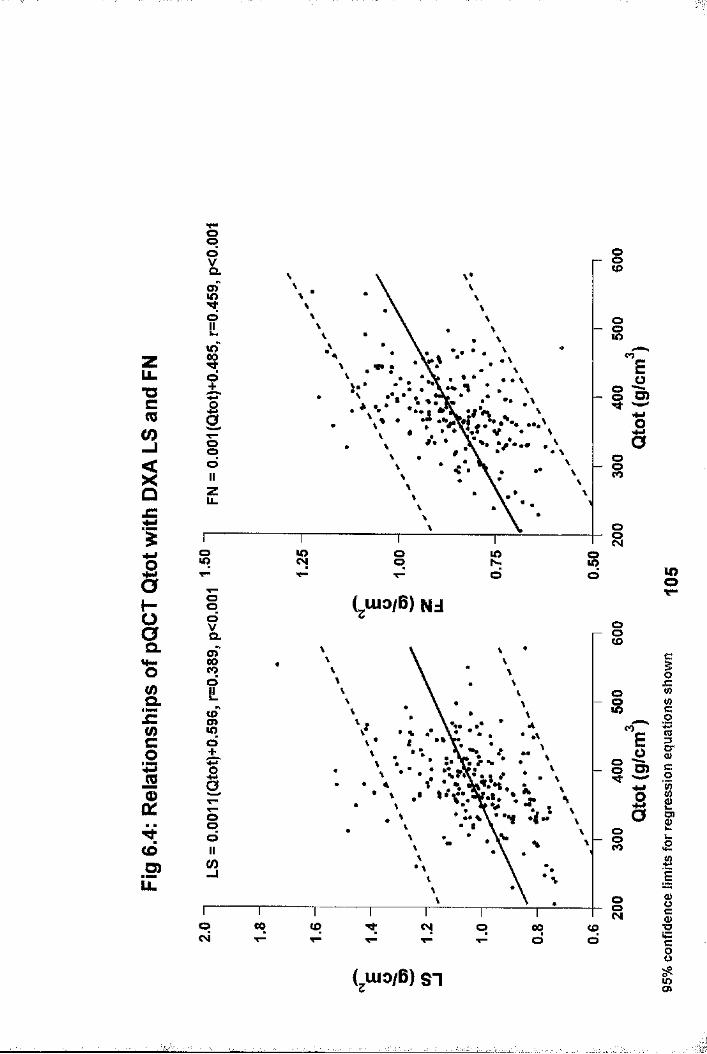
s
UL"OcCOCO
QJC
§h-oQ.
£</>c01
toD)li.
ioCL8O O
8k.in S
’* •••o ooCO
Io»o oo R 8
Eu
ë
OO Luio/B) NJOSa.
8COd8
•ftO
ood o
CO
o800 <x> o 00
dcqd
COEu
ê
(jiuo/B) SI
mo
iJCw0 ca1c01£ÊISc■§C8
$
iî
j■5;
î
asK
I
i1:
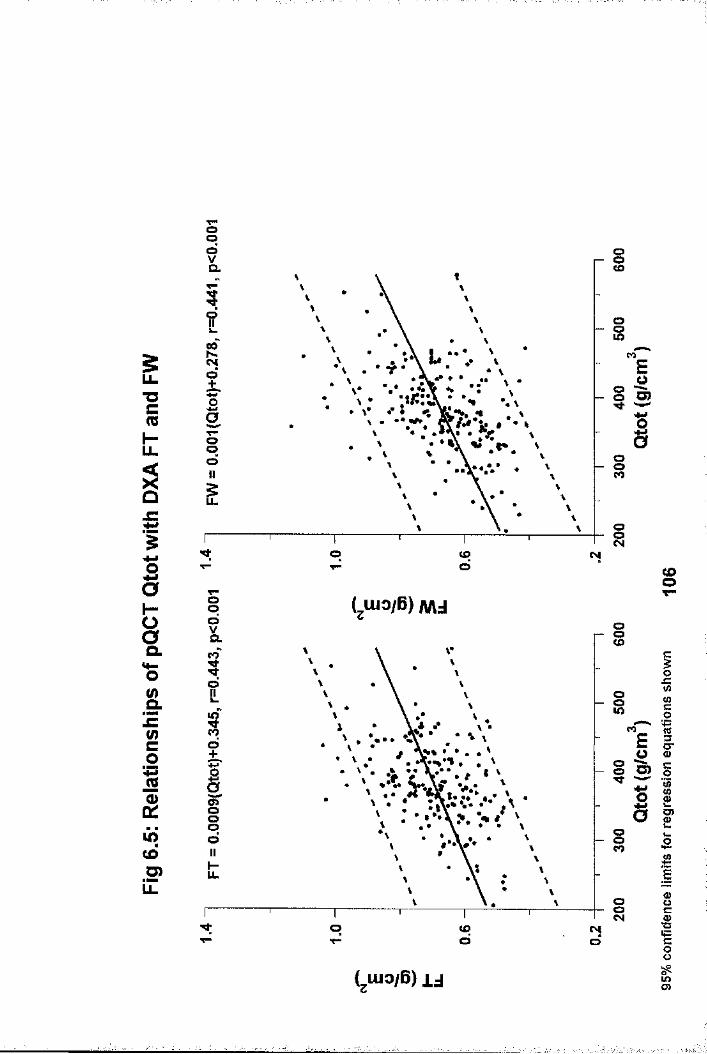
opo osQ.
Os00
5OCO
u.o O)"O
oo
£ ospd CNI
CDOT"OOO iCLCL
o olOCL lO
pd • • • cr
I 3
o>CDOp
dlO(OS?iZ
Io pd
lOO)
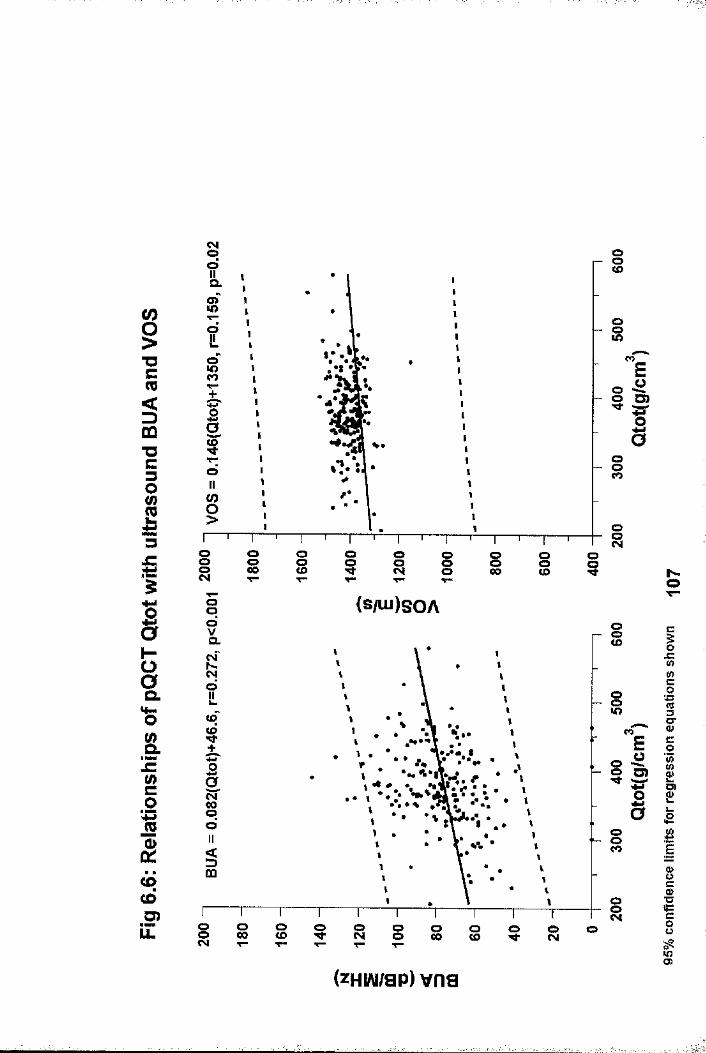
oo ooCOOLS oo s
CO"O
o O)
COT3io
8O8
O8
OS o9
O ooo s00 i oo£ CM
OO iCLCM
OCL ik.CO(O or
Sd oCOCOCDO)LL.
o8o
so00 oCO o 8 g s 8 O 8 o
lO
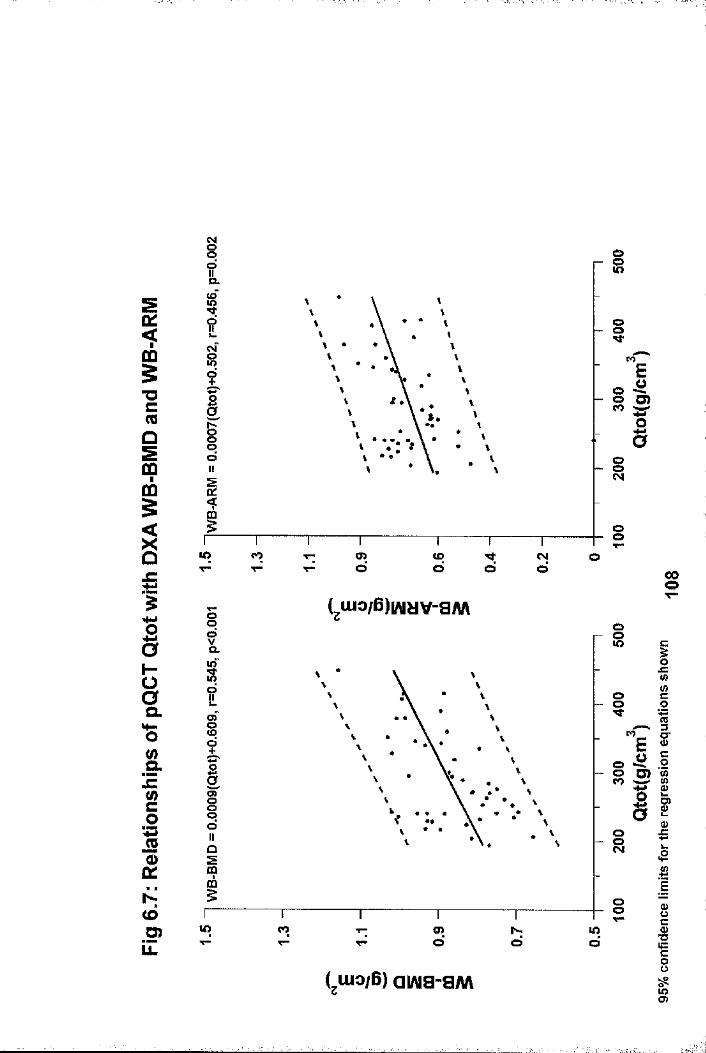
oso
a.
o ooid ”ei ™■o
sig
CO o>d
(Od
oo SB
Luio/B)|/viîJV-aWV
o gQ. id4->”ei
O"
Q.
io>oo CD
O szos
glO CO o>
d d ■o
L luo/B) awa-aiwLOO)

zLi.■ocm3
IJC
nIHOoQ.
&Ic(/)c01
00CO.5?Z
§dVCLCsf
?
iiIIdIIz
olO
• •>
oI- o
"e g s
a(0
S
oo R g
Luio/B) NdOIa.
oo
io
•V os
• Vs
o001 00 CD «M O 00
dtod
EOjQ
I
CDO
( uio/B) ST
0 JZ V)ë
1c.2ig£
ISI8
%
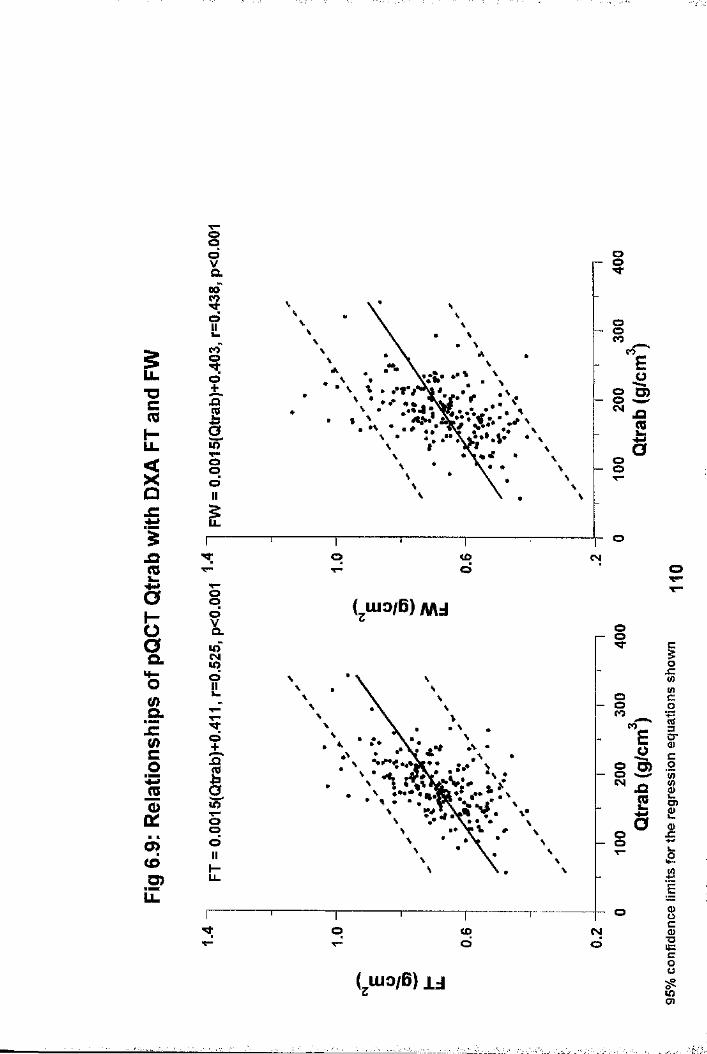
sT5CmHu.
îJC
jQ
§0
CO
9 !1d+
i10Y"0 pd111r
V
I
il2
oa
o CDd
CM
O
sa.
&ic(0c01
o>(dO)u.
( luo/B) MdooCL
O id
oS
\\ ••v>X—Opd g
oo CD CM
roEQJ3CO
( luo/B) i j
iJZV)io(Q3C0
1ssis$

CO
■DC
<Z)m■oc3013£
_o
Sa.
oofOCO
8COO O)
§o
oos
os o I o I I o00 COCM
s (s /u i)s O A
soQ.COoCOo i
COu>
§ sCM .COO s
oo8 s s o3) s s s o 8 o
LL
1IIc0 '5)1aaË
I8gCi
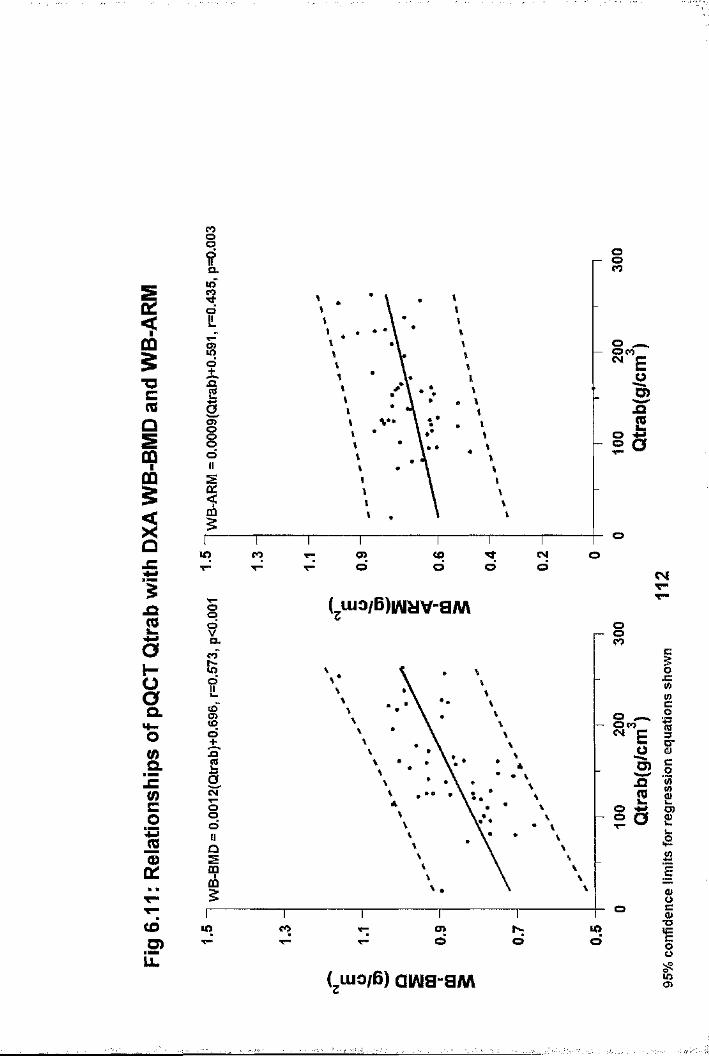
qo ooCOQ.
inCOo
o 8 ",
■a SI
Vs8I1It
oto NOCO en (Od oo CSiT-
Luio/B)wyv-aw\X2?a.
IxzwËoto
soa.4- E Io m
S ojaCL
od o O
E
Sc1oo
oCOU)
lO CO d todG)T-
LLo>Luio/B) aiflia-aM

LLT3CmCO
o£
t:o0a11JCc01Cs|T—CDS)LL
0 A OL1I
O+Eooa§OOII
oUÎ
s
• i
oo lOO S
gCO
S OlOEo5)
a8CO
s
o omNCOo
s• %
ogo>
oo o
CO
8CM00 CO CM o 00O (Oo
CO
CO
ESi
(gUio/6 ) SI
I01c0
1è42IgI1oo$

o 8
8§O
LL. oG)
LU 00oo sCOo
UL OCM
CM O 00O <Ûà rr
T"opc> R8pG JZs<o
g.lE
n»COpo
CO
O)
8CO O)8
CO o8CO(O
O)LU
u.o
T3CM O p(3 pC3
CM
L uio/B) u CD

CO
§■ocm<=)m"Uc3O%
gt:o0s1B'jzc01 IS
CDO)
?CLM)(Dt"?:T"îIfOV"dII
î
ga
II1IIII1IIIIII
IIIIiIII1III1
os i I oa og i(SAU)SOA
i
§
I
;
a
EI»toü8
o«oOOL
Stocyd
Iy ••
3Od
ag o<o o o g g o a o(D
LOT"
EII(zHiAi/ap) vna
oJZtnË0rt1Il££V)
I■Ocous
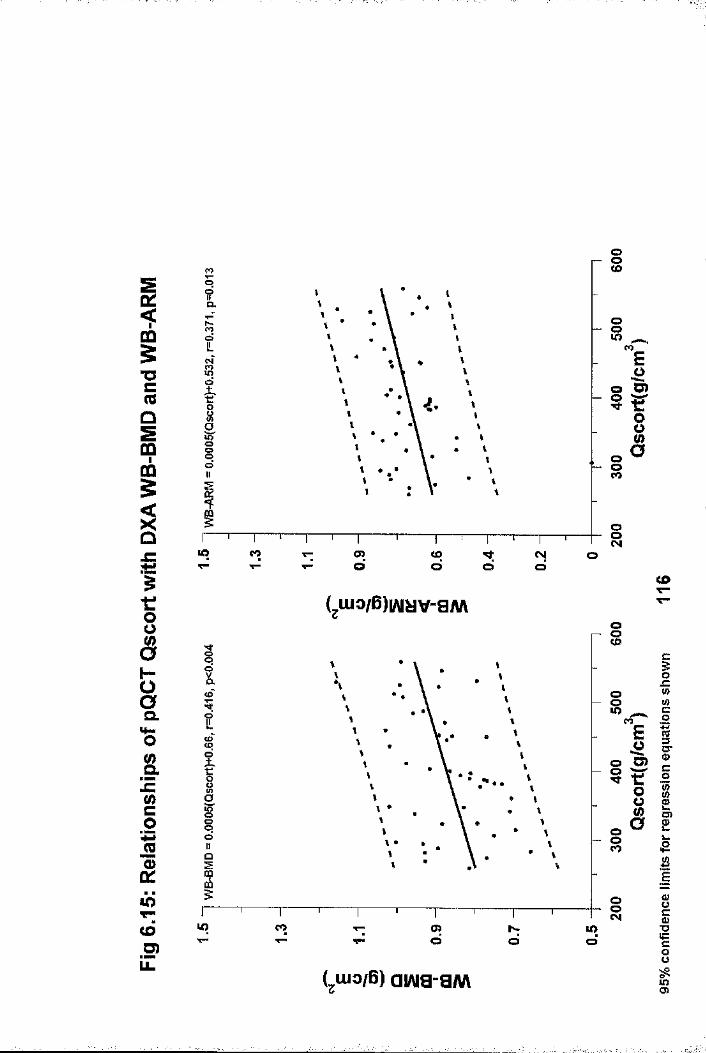
Im§■ocreQS9fflgIit:ousH-Oaa.SrJZ<nc01 £ lOT"toD)Li.
01
Î
IIq0II1
t%I
lO COT "or>o
os
os CO
o§
Ios
E
Ia
tod d
Nd
(^ui3/6)iAi^v-ayuv
8
O8COo COCDO
§oo
OO<NlO CO a> lOT“
(jUJo/B) aiAia-a«\
CO
oj=totoc0
1§■c0
1S’a
ss■o18u>cn
i
Ji

"OcmCO
Qüic
Ih“aOL
(/)O. Etn
JS(S
<oT"<6U)iZ
oinoOl
Oo
CO
Io## •
IooLL
;o lO s
o■\îrJZQ.
COOCO
criS 3
a>i* •i So
SCOCM 00 CD CM O 00 ■oto
g
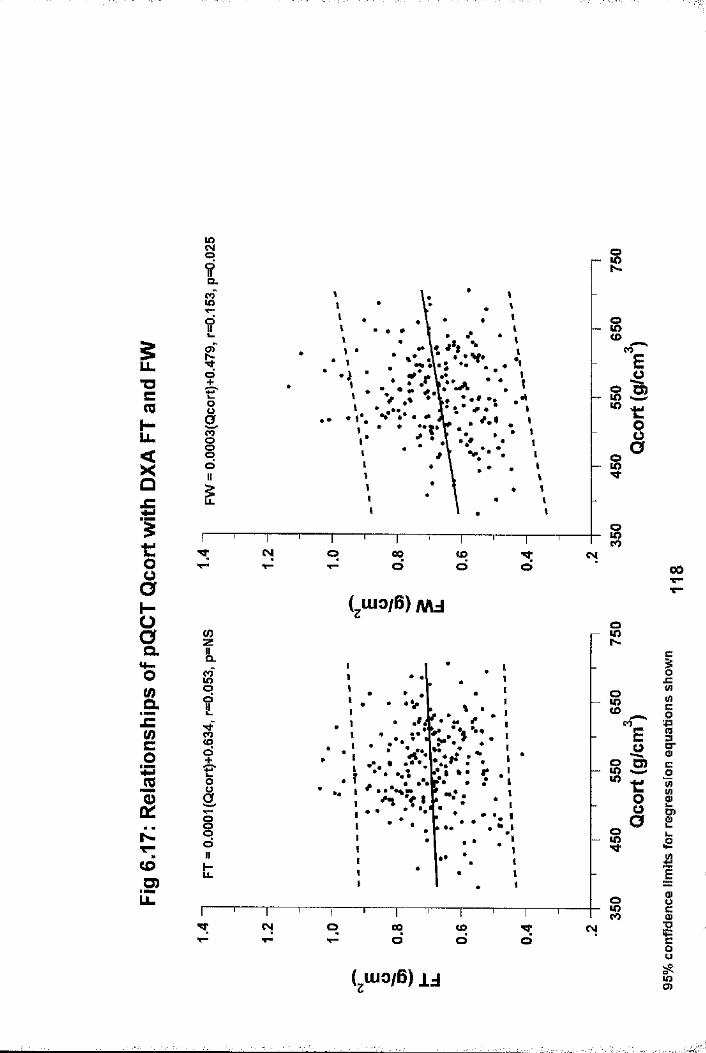
iîCLS
SN
OO<o
s CO
o g slO ^
8oooIL
g£
OCOCM O 00O (O o 00
a. CL
§OJZio.
CO8 cr
g Seno go
CDD) u.
SCM O 00O <£)
QTfO
(,uio/B) ij
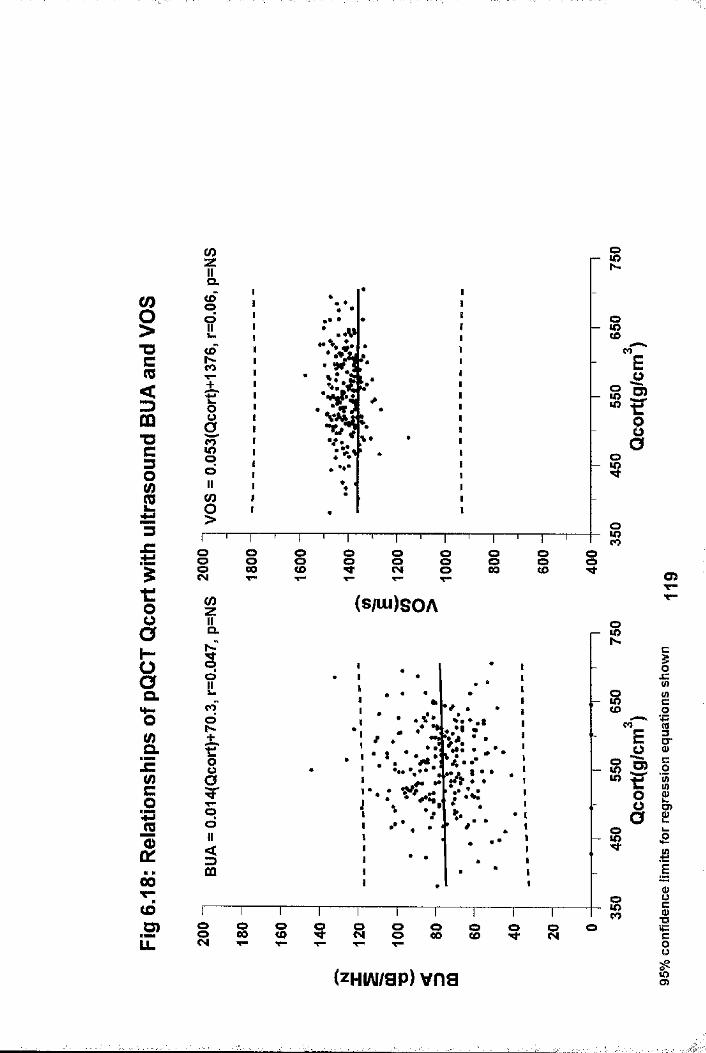
iT3C(0<tÙ73C30
13ItOOHaCLSrJC(/)co%(S
00T—(d3)LL
(0zIIQ.100!fSCO
1So11 (0§
StoCO
oE?I
O§CM
g00 i iOoo i os g
(0z (SAU)SOAOQ.
OOiCOoh-
8
OOs
8COo8 8 o<o o g oo s s o g o
COEifo
(zHvu/sp) vna
m
cI(0o«3S’c0
11
I«=§u%
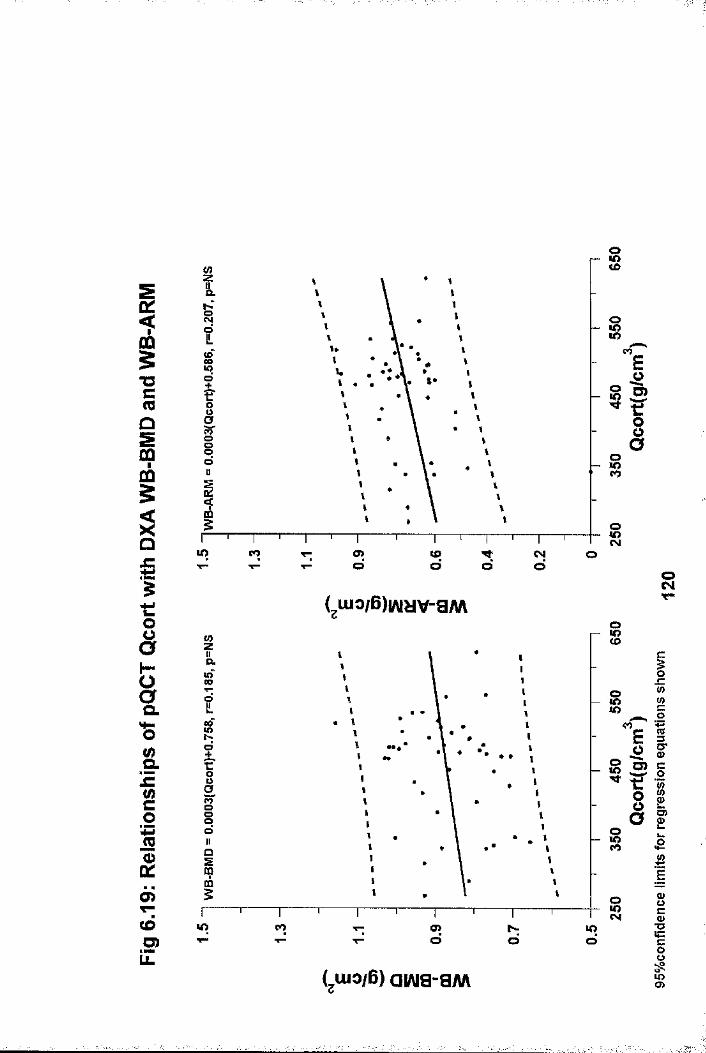
oc<F00§T3Cm
00005
§£tooH
î.1Le(0c01 £ mcôO)iZ
(D
O
8
So s1tI
s
ME6»?I
UO CO o>d
u>o o(SIo
8( jU io /B ) w y v - a M
S8
iRd •••
Si
ooCO
oU) CO a> IOT"
CQ
O JC « ü) c0
1 ® oIS’EO
I
(uio/B) awa-SM
s
sgSgÜgO)

a>toO
i l
(042
n(0
E 2w S
S |
s iIIZ "O u. cg.üc
§
s§O"
(0
II3I
_ Ûl.lI =I ic >»ili;(A O O OÏ 2a =;
I IO) o E "
i o "i 8 o£ t E 5 5 S o■ □ i []
H-LL
CM
IL,
CO
1111 i 111 I j 1111| i 111 j 1111 j 111111111 i 11111 o o o o o o o o oO O I ^ < O I O M * C O C M t-
96eiU80J8d
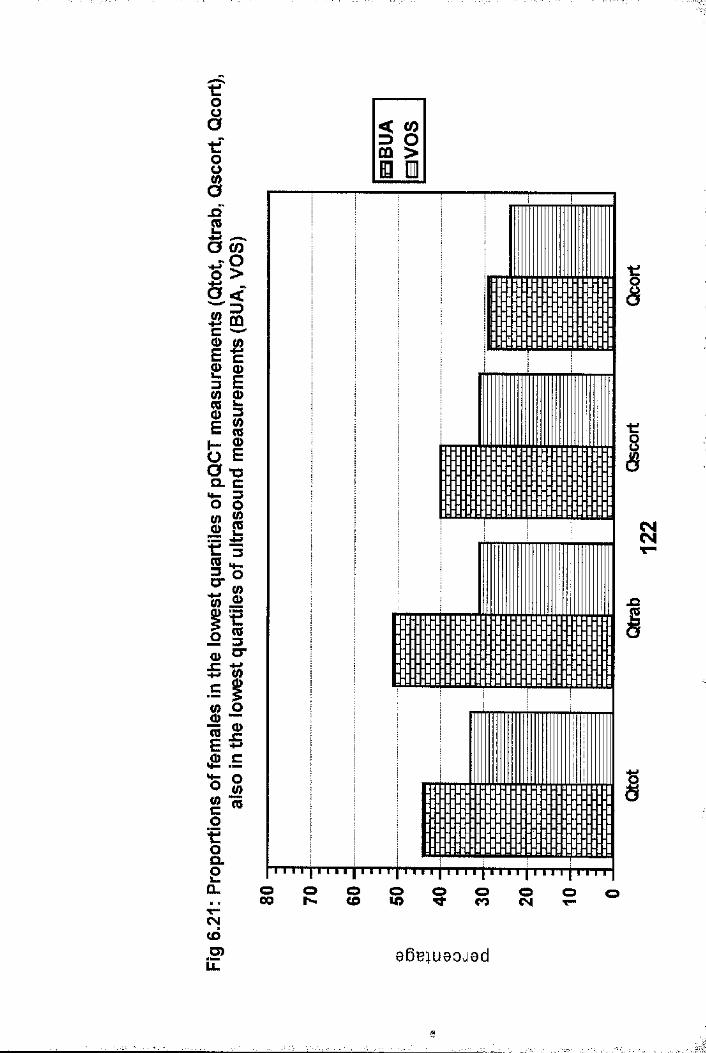
< CO 3 O CO >
Ô_Q
û> <D3 E
ilII■s om W
t :(03CT
oa>c
Q.
CN(dO)ÎZ
I
I
o o o o o o o o oO O I ^ C O I O ^ C O C N t-
96eiuaoj8d
1
CHAPTER 7
AGE RELATED CHANGES IN RADIAL pQCT BMD MEASUREMENTS: COMPARISON WITH OTHER SKELETAL SITES.
7.1 IntroductionChanges in bone mass throughout the lifetime of an individual I have been discussed in detail in chapter 1.1.3, and are depicted in figure 1.2. Peak bone mass (PBM) is now generally considered to be achieved by the end of the second decade
,(1.44,1.60-1.65), and possibly a few years later (age 25) at the radius (1.40). PBM is generally maintained throughout the following 2-3 decades before bone loss commences. Controversies regarding the age at which PBM is achieved, and timing of bone loss from PBM are also discussed in chapter 1.1.3. Generally, age related bone loss occurs in all individuals from all skeletal sites, and affects both trabecular and cortical bone.This type of bone loss leads to what has been termed Type 2 osteoporosis, leading eventually to hip fractures (1.67). Due to ovarian failure and subsequent oestrogen deficiency, women experience an accelerated phase of bone loss following the menopause. Although all skeletal sites are affected, there is controversy, especially at axial sites, as to the exact timing and degree of bone loss (1.51,1.68-1.72,1.74,1.79- 1.82,5.1,5.2). Trabecular bone is metabolically more active than cortical bone, and is therefore thought to be preferentially affected during this phase of accelerated bone loss. Consequently, bone loss is greater from skeletal sites rich in trabecular bone. This type of bone loss leads to whathas been termed Type 1 osteoporosis, and fractures especially of the wrist and vertebrae (1.67).
Most of the work done to date examining patterns of radial bone loss have employed either SPA or DXA, which give a composite
123
7.2 study Populations and Bone Mass MeasurementsThe following different female populations were studied
assessment of trabecular and cortical BMD at the measurement site. pQCT, with its ability to quantify trabecular and cortical BMD independently may give additional information as to the timing, pattern and extent of bone loss at the radius.It should be more sensitive than radial SPA or DXA to subtle BMD change, particularly within the trabecular component. It should be borne in mind however, that for any given individual, a change in BMD of ±2.8 x the co-efficient of variation is Inecessary before a BMD change can be accepted as being outwith i|precision error (1.88,7.1) . The pattern of bone loss asdetermined by pQCT was therefore examined in 4 different female |populations, which are detailed below. Changes in pQCT radial
.:Ï*
BMD were compared to axial measurements in three of the groups iÎ
ICross-Sectional DesignGroup 1. Changes in pQCT measurements alone were obtained from
:Sanalysis of the study population used to create our normal range. This population was defined in chapter5.2, and has an age range of 18-90 years. 213 females were premenopausal (defined as ongoing menses) and 119 were postmenopausal (defined as no menses for at f■ft;least 12 months)
Group 2 . Changes in pQCT BMD measurements were compared to DXA lumbar spine and hip BMD measurements in a perimenopausal group aged 45-55 years. The study population described in chapter 6.2 (group 1) was
ianalysed further. From the original 216 females, those with a known history of thyroid disease, 3|
ftdiabetes, asthma and inflammatory arthritis were texcluded as were those taking drugs known to affect bone metabolism and those who had undergone hysterectomy, leaving 119 normal women. 79 women were
124
premenopausal, and 40 postmenopausal.
Longitudinal DesignGroup 3 . 23 normal premenopausal females who were attending an
osteoporosis screening programme (described in chapter 5 : 5 .2-point 2) were invited to returnapproximately one year later for re-scanning. None were known to have any condition or were taking medication which could influence bone mass. pQCT was performed within 8 weeks of DXA lumbar spine and hip measurements at the baseline visit, but both were performed on the same day at the follow-up visit. All women were menstruating regularly at both baseline and follow-up visits.
Group 4. 26 normal postmenopausal females underwent pQCT andDXA hip and spine measurements on the same day at baseline and approximately 18 months later. None were known to have any condition or were taking medication which could influence bone mass. This study population is derived from that described in chapter 5: 5.2-point 3. Of the original 31 females, 26 females agreed to return for re-scanning, to form the basis of this study population.
For the follow-up pQCT measurements, the "trending" function, which is discussed in chapter 3, was utilised. The cut-off value used for the difference in voxel numbers between baseline and follow-up scans was set at 30. This should have ensured accurate positioning of the scanner in follow-up scans, thus minimising the influence of change in scan site on follow-up pQCT BMD measurements.
7.3 Statistical AnalysesResults for continuous variables were expressed as the mean with standard deviation if the data were normally distributed,
125

otherwise as the median with ranges.
7.3.1 Cross-sectional DesignsThe relationships of pQCT BMD values with age in the whole population aged 18-90 years (group 1) , were examined using linear and non-linear regression, exponential and logarithmic analyses. The model which best fitted the data was determined by minimising the residual sum of squares and improving the correlation co-efficient. Similar analyses were performed on premenopausal women as a function of age, and postmenopausal women as a function of years since the menopause. From the resultant equations, annual rates of change were determined, as a function of age for premenopausal women, and years postmenopause for postmenopausal females at 5, 10, 20, 3 0 and 40 years postmenopause.
In group 2, between group comparisons were performed using the unpaired t-test. Differences between premenopausal and postmenopausal subgroups were expressed as percentages. Taking into account the differing ranges for BMD measurements, T- scores were also generated and compared for the postmenopausal group, using the premenopausal group as the young normal population. The differences are expressed as T-scores rather than Z-scores, as obviously the populations were not aged matched, and pQCT BMD in premenopausal women studied cross- sectionally showed little change (see results section of this chapter).
7.3.2 Longitudinal DesignsIn the longitudinal designs, between group comparison of baseline BMD measurements were performed using the unpaired t- test. Annualized rates of change in BMD were calculated, and within group annualized percentage BMD changes from baseline were compared using the paired t-test.
7.4 Results
126

7.4.1 Cross-sectional studiesThe changes in pQCT BMD values in a female population aged 18- 9 0 (group 1) are shown in figures 7.1 - 7.4. For the whole population, cubic regression was superior to other models in describing age related changes for all pQCT BMD measurements as a function of age (see figures 7.1-7.4 for regression equations) . There was a decrease in BMD from peak bone mass to that of old age of 34.3%, 31.7%, 33.7% and 24.4% for Qtot,Qtrab, Qscort and Qcort respectively [excluding the age range 30-39 years, which is probably not representative of the general population, due to the small number of subjects studied (n=6)j . Linear regression equations of the premenopausal females showed that there was little change in any of the pQCT BMD measurements as a function of age between the end of the second and fifth decades. The relationship with age was positive for Qtot (Qtot = 376.4 + 0.3(age), r=0.053, p=NS), and negative for Qtrab (Qtrab = 186.4 - 0.01(age), r=-0.003, p=NS), Qscort (Qscort = 545 - 0.17(age), r=-0.024, p=N8) and Qcort (Qcort = 567.7 - 0.11(age), r=-0.016, p=NS). The resultantannual rates of changes in premenopausal women were small : Qtot (+0 . 3mg/cm^/yr / 0.08%/yr), Qtrab (-0 . Olmg/cm^/yr / -0.005%/yr), Qscort (-0 .17mg/cm^/yr ; -0.03%/yr) and Qcort (-0 . llmg/cm^/yr ;-0 .02%/yr).
For postmenopausal females, all BMD measurements werenegatively related to the duration since menopause, and are shown in figures 7.5 and 7.6. A cubic regression model best fitted Qtot, Qscort and Qcort BMD data, whereas a parabolic model best fitted Qtrab BMD (see figures 7.5 and 7.6 forregression equations). The annual rates of changes forpostmenopausal women at 5, 10, 20, 3 0 and 40 yearspostmenopause (YPM) derived from the regression equations for each of the BMD measurements are shown in table 7.1. For Qtrab, the rate of loss gradually increased from -0.53%/yr at 5 YPM to -0.76%/yr at 40 YPM. The greatest rate of loss in the early postmenopause years (5 and 10 YPM) was found for Qscort ( -
127'I ' : ‘‘‘I'/' ; I '"''r ''ft- . . . . .
0.72%/yr and -1.12%/yr respectively) and Qtot (-0.79%/yr and - 1.12%/yr respectively), with that for Qcort being less (- 0.5%/yr and -0.95%/yr respectively). The greatest overall rates of loss for Qtot, Qscort, and Qcort were found at 2 0 YPM: -1.36%/yr, -1.39%/yr and -1.39% respectively. Qtot, Qscort and Qcort all increased at 40 YPM: +0.85%/yr, +1.43%/yr and+0.75%/yr respectively.
Changes in radial BMD around the menopause were further examined in a perimenopausal population (group 2) and compared to DXA spine and hip BMD. 79 premenopausal females (PRE subgroup) were compared to 40 postmenopausal females (POST subgroup). Details of the study population are shown in table7.2. The PRE group was 4.1 years younger and 3 cm taller than the POST group, but were well matched for weight. The median duration since the menopause in the POST subgroup was 35 months (range 12-180). All bone mass measurements were lower in the POST subgroup and are shown in table 7.2, and figures 7.7 and 7.8. There were statistically significant differences in all BMD measurements except Qcort and Qtrab. Percentage BMD differences for axial DXA measurements [-13.48%, -11%, -9.81% and -9.78% for FW, FT, FN and LS respectively] were greater than those for pQCT [-7.63%, -6.43%, -5.49% and -1.75% forQtrab, Qtot, Qscort and Qcort respectively]. T-score differences between the premenopausal and postmenopausalsubgroups (using the premenopausal subgroup as the reference population) followed a similar pattern to the percentage differences and are shown in figures 7.7 and 7.8. Differences [T-score(SD),p value] for axial DXA measurements: FT [-0.81(1.29) ,p<0.001] , FW [-0.77 (1.01 ) ,p<0.001] , FN [-0.76 (1.09),p<0.001] and LS [-0 . 61(1.26),p=0.005] were greater than those found for pQCT measurements: Qscort[-0.58(1.34),p=0.018] , Qtot [-0 . 54(1.3),p=0.013 ] , Qtrab [-0.35(1.2),p=0.1] and Qcort [-0.29 (1.24),p=0.17] .
128

7.4.2 Longitudinal StudiesDemographic and BMD data for groups 3 and 4 are shown in table7.3. At baseline, the premenopausal group (group 3) were younger (16.3 yrs), taller (4.7cm) and heavier (2.7kg) than their postmenopausal counterparts (group 4). Accordingly, BMD for all radial, hip and spine measurements were greater in group 3, although this failed to reach significance for Qtrab and FN. Correcting for the influence of height and weight, significant differences remained for all except for Qtrab (p=0.198), FN (p=0.065) and FT (p=0.057). The variance of all BMD measurements was greater in group 4 than in group 3 . There were no significant changes in height or weight in either group between baseline and the follow-up visits (group3: height 1.613 ± 0.062m vs 1.614 ± 0.06m; weight 65.9 ± 12.5kg vs 66.2 ± 12kg)(group 4: height 1.566 ± 0.063m vs 1.568 + 0.063m; weight63.2 ± 10.7kg vs 62.9 ± 11kg). Annualized rates of change in pQCT radial BMD and DXA hip and spine BMD for both groups are shown in table 7.4, and figures 7.9 and 7.10. There were statistically significant annualized decreases in Qtot in both groups, and in Qscort in group 3. Mean changes in other pQCT measurements were negative in both groups with the exception of Qtrab in group 4, but none reached significance. There were no significant changes in DXA hip or spine BMD measurements in groups 3 or 4 with the exception of FN in group 4. The variance in percentage change was large for all measurements and tended to be greater in group 4. As can be seen for figures 7.9 and 7.10, very few individual changes fell outwith the 2.8 x CV band indicating that a real change could only be confirmed in very few patients. The postmenopausal group (group 4) was further analysed according to the duration since menopause. There was no difference in the annualized rates of change between those within 10 years of their menopause (n-9), and those more than 10 years from their menopause (n=15) , although the numbers in each subgroup were small.
The relationship between the annualized percentage rates of
129
change in pQCT measurements and those of LS and FN for premenopausal females (group 3) are shown in table 7.5, and for postmenopausal females (group 4) are shown in table 7.6. Similar relationships were found with FT and FW BMD measurements, but are not shown. There were no significant relationships between annualized rate of change between pQCT and DXA LS and FN measurements in either premenopausal or postmenopausal groups. The relationships between changes in Qtot and LS in premenopausal and postmenopausal females are shown in figure 7.11, as are those for Qtot and FN in figure7.12. The relationships of other pQCT measurements were similar but are not shown. However, the relationships between annualised percentage rates of change at LS and FN in both group 3 and 4 were also insignificant, and are shown in figure7.13.
7,5 DiscussionAll radial pQCT BMD measurements decreased with age, the, reduction between peak bone mass and old age being 24.4%-34.3% depending upon the measurement. Studying a population with a wide age range, as there was in group 1 (18-90 years) , a cubic regression model was found to best fit all pQCT BMD measurements. This has been found previously for trabecular BMD determined by QCT at the radius (7.2) and lumbar spine (1.74,7.2) . When the cross-sectional data derived from group 1 were examined by decades (see tables 5.1 & 5.2), the various BMD values seem stable until the end of the sixth decade. This method of analysing data can mask the effects of the menopause upon BMD, as its age of onset varies between women. Dividing the population by menopausal status should help clarify the effect of the menopause upon radial BMD. In the premenopausal subgroup of group 1, there must be doubt whether those females in the age group 3 0-40 years (n=6) are representative of the general population. This negates any meaningful attempt to determine the timing of peak bone mass in this population. Nevertheless, fitting a linear regression model should allow
130

the trend of BMD in premenopausal women to be determined, as the 10 year age bands on either side of the 4th decade are sufficiently large to be representative of the premenopausal population. Such a model showed that all radial pQCT BMD measurements were effectively stable in the premenopausal subgroup. This is in keeping with almost all of the published work done using both SPA (1.63,1.51,1.68,1.69,1.70,1.79) and pQCT (1.50,1.78). However, reduced radial trabecular BMD has been found in regularly menstruating women with evidence of declining ovarian function (7.3).
In contrast to the premenopausal subgroup, there was clear evidence of significant reductions in pQCT BMD measurements in the postmenopausal subgroup of group 1. A cubic regression model best fitted Qtot, Qscort and Qcort BMD data as a function of years since the menopause, whereas a parabolic model best fitted Qtrab. Surprisingly, the derived rate of loss for Qtrab gradually increased from 5 to 40 years postmenopause, which is contrary to the theory that an accelerated phase of trabecular bone loss occurs immediately following the menopause, at least at the radius. Additionally, derived rates of loss for Qtrab were much lower than those for Qtot, Qscort and Qcort in the early postmenopausal years (5 to 20 years postmenopause). The greatest rates of loss were found for Qtot, Qscort and Qcort at 20 years postmenopause(-1.36%/yr - -1.39%/yr). These findings for Qtot, Qscort and Qcort can be explained by the recent observation that postmenopausal remodelling occurs at the inner aspect of the cortical shell with trabecularisation of endosteal cortical bone. Consequently, progressive expansion of the cross-sectional area of trabecular bone occurs at the expense of cortical area in postmenopausal women (1.75,6.6) . A more pronounced decrease in pQCT total BMD compared to trabecular BMD has been noted previously from cross-sectional data (1.50,6.6). The estimated rates of bone loss (from cross- sectional data) for the postmenopausal subgroup of group 1 in this thesis, are comparable to other estimated rates of loss
131
(cross-sectional data) determined using pQCT (1.50,6.6), SPA (1.68,1.69), and DXA (7.4), and observed rates of loss (longitudinal data) determined using pQCT (1.75,1.78) and SPA (1.73). There was also evidence of ongoing loss for all pQCT BMD measurements in the elderly. Estimated rates of loss in women 30 years postmenopause were between -0.59%/yr and - 0.93%/yr depending upon the measurement, supporting the claims of others that significant bone loss continues into old age (1.86). In contrast, the estimated rates of change at 40 years postmenopause, suggested that radial Qtot, Qscort and Qcort BMD increased in the very elderly. However, many of the women more than 40 years postmenopause were recruited through an advertising campaign requesting elderly, fracture free women to act as normal controls for hip fracture patients. They were not randomly selected from the elderly population, and were therefore liable to several biases, which could have falsely increased BMD, thus reducing or reversing estimated rates of bone loss (1.86) . These biases have been discussed in more detail in chapter 1.1.3.
Profound changes in bone metabolism occurs immediately following the menopause due to falling oestrogen levels. This results in increased bone resorption and subsequent bone loss. The effect of the menopause upon radial pQCT BMD was compared to DXA hip and spine BMD measurements, in a cross-sectional study. The study population was a randomly selected group of perimenopausal females aged 45-55 years of age, which was then divided into premenopausal and postmenopausal subgroups based upon menstrual history (group 2) . 90% of the postmenopausal females studied in this group were within 8 years of the menopause and thus represent early postmenopausal females. In view of the differences in mean BMD values and ranges between pQCT and DXA measurements, comparison of differences is best achieved if the differences are expressed as T-scores (using the premenopausal subgroup as the young normal reference population) rather than percentages. BMD was found to be
132
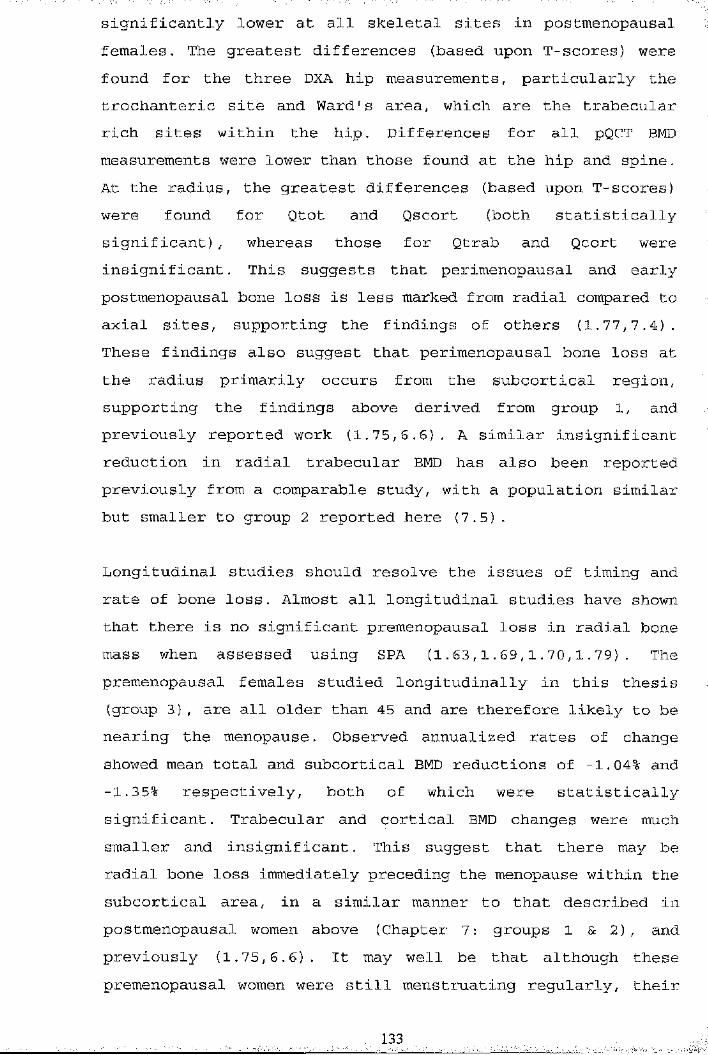
significantly lower at all skeletal sites in postmenopausal females. The greatest differences (based upon T-scores) were found for the three DXA hip measurements, particularly the trochanteric site and Ward's area, which are the trabecular rich sites within the hip. Differences for all pQCT BMD measurements were lower than those found at the hip and spine. At the radius, the greatest differences (based upon T-scores) were found for Qtot and Qscort (both statistically significant), whereas those for Qtrab and Qcort were insignificant. This suggests that perimenopausal and early postmenopausal bone loss is less marked from radial compared to axial sites, supporting the findings of others (1.77,7.4). These findings also suggest that perimenopausal bone loss at the radius primarily occurs from the subcortical region, supporting the findings above derived from group 1, and previously reported work (1.75,6.6). A similar insignificant reduction in radial trabecular BMD has also been reported previously from a comparable study, with a population similar but smaller to group 2 reported here (7.5) .
Longitudinal studies should resolve the issues of timing and rate of bone loss. Almost all longitudinal studies have shown that there is no significant premenopausal loss in radial bone mass when assessed using SPA (1.63,1.69,1.70,1.79), The premenopausal females studied longitudinally in this thesis (group 3), are all older than 45 and are therefore likely to be nearing the menopause. Observed annualized rates of change showed mean total and subcortical BMD reductions of -1.04% and -1.35% respectively, both of which were statistically significant. Trabecular and cortical BMD changes were much smaller and insignificant. This suggest that there may be radial bone loss immediately preceding the menopause within the subcortical area, in a similar manner to that described in postmenopausal women above (Chapter 7: groups 1 & 2), andpreviously (1.75,6.6). It may well be that although these premenopausal women were still menstruating regularly, their
133
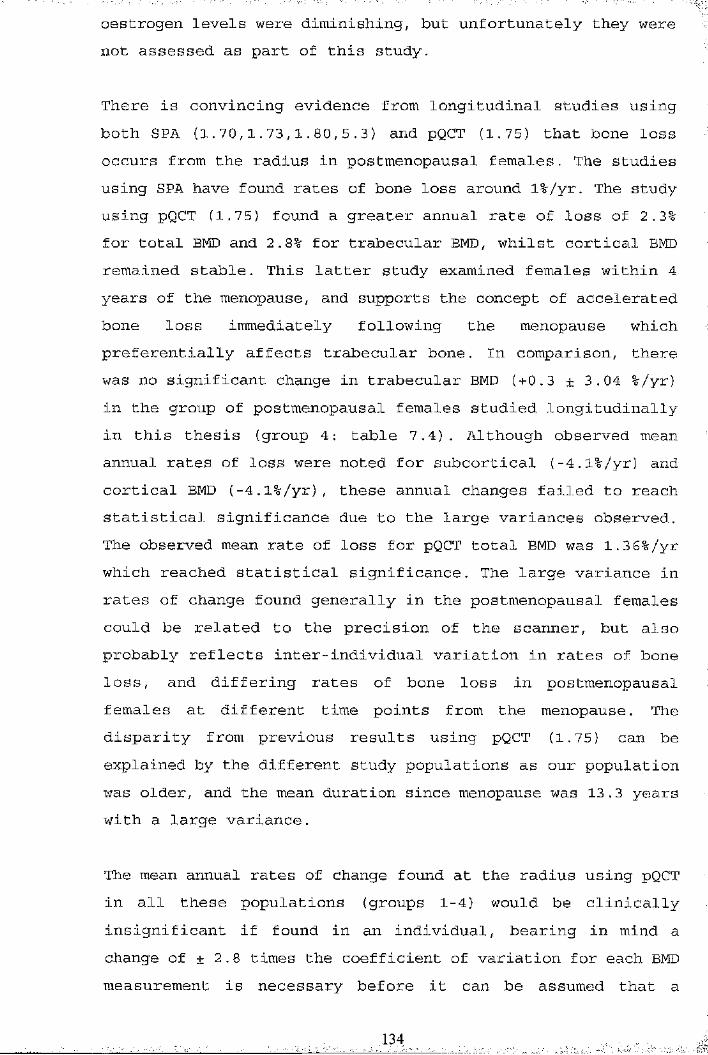
oestrogen levels were diminishing, but unfortunately they were not assessed as part of this study.
There is convincing evidence from longitudinal studies using both SPA (1.70,1.73,1.80,5.3) and pQCT (1.75) that bone loss occurs from the radius in postmenopausal females. The studies using SPA have found rates of bone loss around 1%/yr. The study using pQCT (1.75) found a greater annual rate of loss of 2.3% for total BMD and 2.8% for trabecular BMD, whilst cortical BMD remained stable. This latter study examined females within 4 years of the menopause, and supports the concept of accelerated bone loss immediately following the menopause which preferentially affects trabecular bone. In comparison, there was no significant change in trabecular BMD ( + 0.3 ± 3.04 %/yr) in the group of postmenopausal females studied longitudinally in this thesis (group 4: table 7.4) . Although observed meanannual rates of loss were noted for subcortical (-4.1%/yr) and cortical BMD (-4.1%/yr), these annual changes failed to reach statistical significance due to the large variances observed. The observed mean rate of loss for pQCT total BMD was 1.36%/yr which reached statistical significance. The large variance in rates of change found generally in the postmenopausal females could be related to the precision of the scanner, but also probably reflects inter-individual variation in rates of bone loss, and differing rates of bone loss in postmenopausal females at different time points from the menopause. The disparity from previous results using pQCT (1.75) can be explained by the different study populations as our population was older, and the mean duration since menopause was 13.3 years with a large variance.
The mean annual rates of change found at the radius using pQCT in all these populations (groups 1-4) would be clinically insignificant if found in an individual, bearing in mind a change of ± 2.8 times the coefficient of variation for each BMD measurement is necessary before it can be assumed that a
134
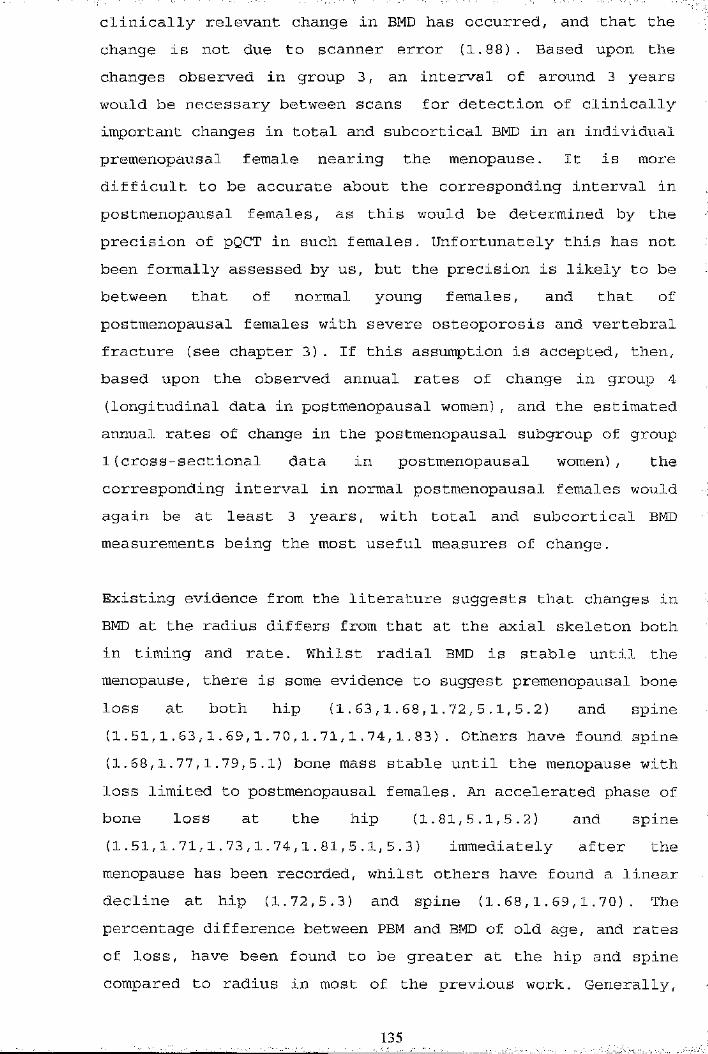
clinically relevant change in BMD has occurred, and that the change is not due to scanner error (1.88) . Based upon the changes observed in group 3, an interval of around 3 years would be necessary between scans for detection of clinically important changes in total and subcortical BMD in an individual premenopausal female nearing the menopause. It is more difficult to be accurate about the corresponding interval in postmenopausal females, as this would be determined by the precision of pQCT in such females. Unfortunately this has not been formally assessed by us, but the precision is likely to be between that of normal young females, and that of postmenopausal females with severe osteoporosis and vertebral fracture (see chapter 3). If this assumption is accepted, then, based upon the observed annual rates of change in group 4 (longitudinal data in postmenopausal women) , and the estimated annual rates of change in the postmenopausal subgroup of group 1 (cross-sectional data in postmenopausal women), the corresponding interval in normal postmenopausal females would again be at least 3 years, with total and subcortical BMD measurements being the most useful measures of change.
Existing evidence from the literature suggests that changes in BMD at the radius differs from that at the axial skeleton both in timing and rate. Whilst radial BMD is stable until the menopause, there is some evidence to suggest premenopausal bone loss at both hip (1.63,1,68,1.72,5.1,5.2) and spine (1.51,1.63,1.69,1.70,1.71,1.74,1.83). Others have found spine (1.68,1.77,1.79,5.1) bone mass stable until the menopause with loss limited to postmenopausal females. An accelerated phase of bone loss at the hip (1.81,5.1,5.2) and spine (1.51,1.71,1.73,1.74,1.81,5.1,5.3) immediately after the menopause has been recorded, whilst others have found a linear decline at hip (1.72,5.3) and spine (1.68,1.69,1.70). The percentage difference between PBM and BMD of old age, and rates of loss, have been found to be greater at the hip and spine compared to radius in most of the previous work. Generally,
135
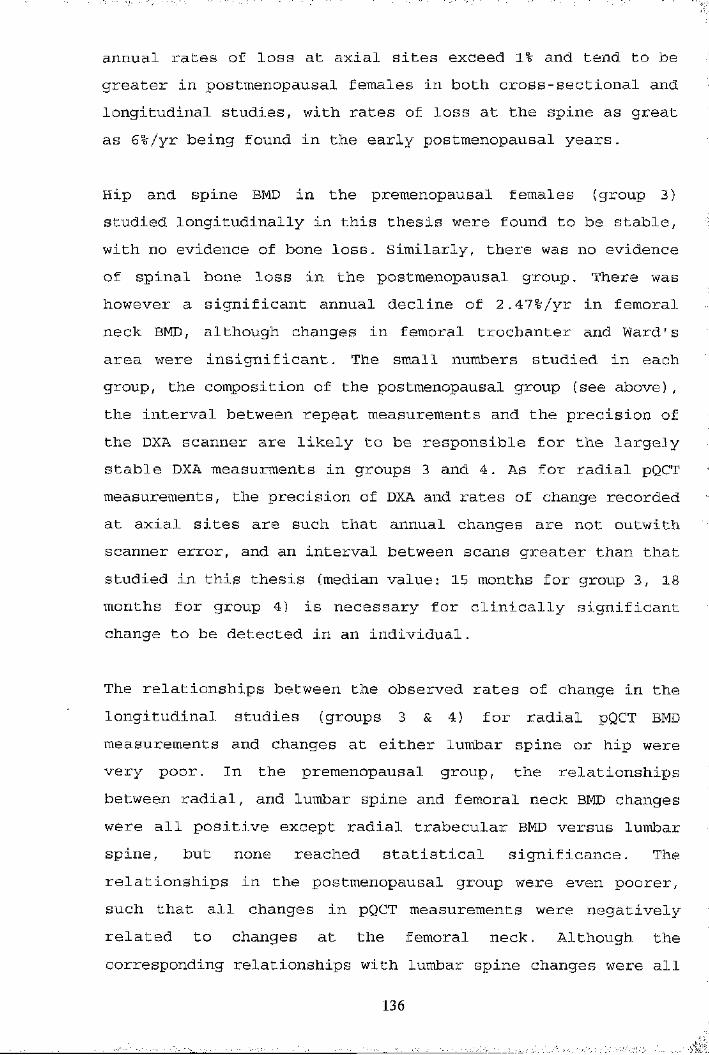
annual rates of loss at axial sites exceed 1% and tend to be greater in postmenopausal females in both cross-sectional and longitudinal studies, with rates of loss at the spine as great as 6%/yr being found in the early postmenopausal years.
Hip and spine BMD in the premenopausal females (group 3) studied longitudinally in this thesis were found to be stable, with no evidence of bone loss. Similarly, there was no evidence of spinal bone loss in the postmenopausal group. There was however a significant annual decline of 2.47%/yr in femoral neck BMD, although changes in femoral trochanter and Ward's area were insignificant. The small numbers studied in each group, the composition of the postmenopausal group (see above), the interval between repeat measurements and the precision of the DXA scanner are likely to be responsible for the largely stable DXA measurments in groups 3 and 4. As for radial pQCT measurements, the precision of DXA and rates of change recorded at axial sites are such that annual changes are not outwith scanner error, and an interval between scans greater than that studied in this thesis (median value: 15 months for group 3, 18 months for group 4) is necessary for clinically significant change to be detected in an individual.
The relationships between the observed rates of change in the longitudinal studies (groups 3 & 4) for radial pQCT BMDmeasurements and changes at either lumbar spine or hip were very poor. In the premenopausal group, the relationships between radial, and lumbar spine and femoral neck BMD changes were all positive except radial trabecular BMD versus lumbar spine, but none reached statistical significance. The relationships in the postmenopausal group were even poorer, such that all changes in pQCT measurements were negatively related to changes at the femoral neck. Although the corresponding relationships with lumbar spine changes were all
136
positive, none reached significance. A similar relationship has been found before between lumbar spine and radial BMD changes measured by DPA and SPA respectively (1.70). It is worth noting however, that the relationship between changes at the femoral neck and lumbar spine was equally poor in both premenopausal and postmenopausal populations studied in this thesis. The relationship was stronger in the postmenopausal compared to the premenopausal group, but failed to reach significance in either. This suggests that BMD changes occurring at one skeletal site are not necessarily representative of changes at another over the short-term. Change must therefore be determined from site specific measurements, and cannot be extrapolated from measurements at other sites.
137
I.1
T
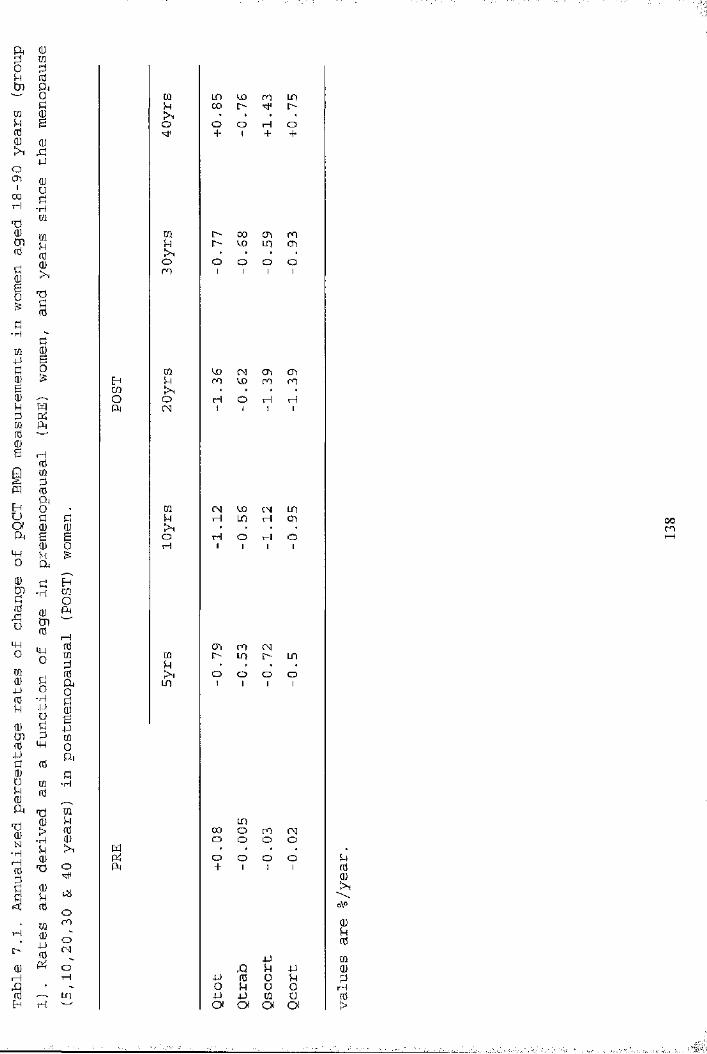
CÛ LD kû en IP!4 00 I>>, • • • ♦o O o H O+ 1 + +
m l> 00 en mu O kO LD en• • • •o o o O oen 1 1 1 1
m ko CM en enEft U m kO m fnm • • •o o TH O H rHA CN 1 1 1 1
CQ (N kO CM LDü U H LO rH enm • • •B O rH O H o0 H 1 1 1 1
E-iO]OPirHnd m m (MUi m i> m LOP U • , ,rd o o O OA LD 1 1 1 10Ü0B4JmOb•H
LOfd 00 O en CMm o O o O>, W • . . .pt; o o o Oo Pi + 1 1 1iüomoCM 4JO q Sh 4-1T—f 4-> fd oO U u OLD 4-> 4-J CQ Uw Oi ot o( O
00en
Mfd
o\oQJkrdmd)P>

1sPi
0m■HSU0g-Uo P
Pb ■H0 TïOJ o\o 1 104J0000Ha 0 rH0 p 0 O
0 rH O n0 0 • rH
o p > O OCQ 1p Pi V o
d00e0u00 kO00 •i-H CN -— '0 ' ko> o — 'E-t (NCP II • enCN O 0 rH IPPi — P HPi0OPÎJlMHO0Pi en0 CNOp rH ,— .tn ' kob en '— -0 i> H0 M II • CNP: 0 l> kopL, ' "sM rHHcpOPiH0000 BPi ^ ü0 0 ^0 P0 >1 PË ^ PP tn0 0 -HO tn 0Pi < W
00enko
enLPH
koko
roCN
enkoko
m ü
0 O
m m en p 00 H o 00kO i> o 00 • .H mkO i> p H en en H H
m 00 00 m rHO rHOOH en rH î> o O Oo o O rH o • O OOo o O O o V O V
kO kO 00 O O m ro pCN H rH H00 ko en ko\o t> p O o O o— '—'P CN p CN en en en o• • • • p o p rHP fp Ni rH en 00 p kOP l> O Pm rH P P o o o O
en 00 Ni Ni kO CN o pH H rH HCN 00 en m • • . •p m p p O O O O00 p kO o m l> 00 Pp en H OrH [> p rH o 00 t> i>en 00 p kon H p P rH o O o
A pp pp 0 o po P o oP P 0 üd Oi Oi OI cpS
enm
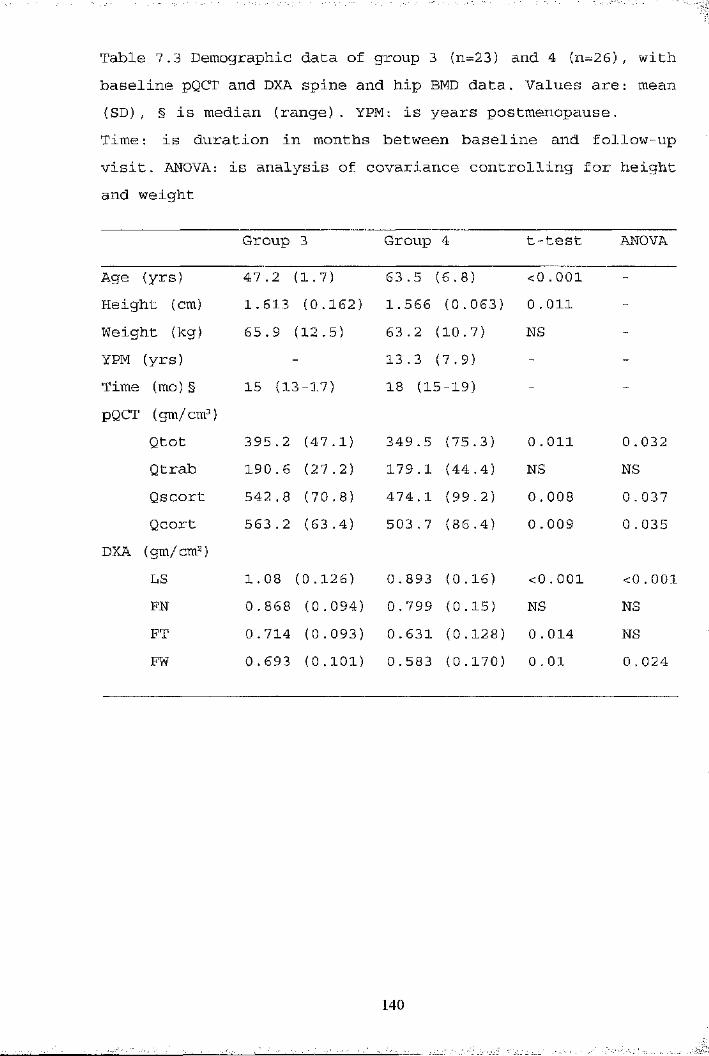
Table 7,3 Demographic data of group 3 {n=23) and 4 (n=26), with baseline pQCT and DXA spine and hip BMD data. Values are: mean (SD), § is median (range). YPM: is years postmenopause.Time: is duration in months between baseline and follow-upvisit. ANOVA: is analysis of covariance controlling for height and weight
Group 3 Group 4 t-test ANOVA
Age (yrs) 47.2 (1.7) 63.5 (6 .8) <0 .001 -Height (cm) 1. 613 (0.162) 1.566 (0.063) 0.011 -Weight (kg) 65 . 9 (12.5) 63.2 (10.7) NS -YPM (yrs) 13.3 (7.9) - -Time (mo) § 15 (13-17) 18 (15-19) - -pQCT (gm/cm^)
Qtot 395.2 (47.1) 349.5 (75.3) 0 . oil 0,032Qtrab 190 . 6 (27.2) 179.1 (44.4) NS NSQscort 542.8 (70.8) 474.1 (99.2) 0 . 008 0 . 037Qcort 563.2 (63.4) 503.7 (86.4) 0 . 009 0 .035
DXA (gm/cm^)LS 1 . 08 (0.126) 0.893 (0.16) <0 . 001 < 0.001FN 0 . 868 (0.094) 0.799 (0.15) NS NSFT 0 . 714 (0.093) 0.631 (0.128) 0 . 014 NSFW 0.693 (0 .101) 0.583 (0.170) 0 . 01 0 . 024
140

p
P0pmu1P000iI00-HA0IA-Hb
0■Hb0PtOia0-H00tJ)g
0P0Pb0N-rHtH0
Ni
0rH0E_
p-rH0a0r0PP0 p0■H0 0 I—I>1a
Qw
00B
0P0000a>
kOpII0rH 0 03a p o p
0o-rHP0■HP>POpg-HO-H
IP0Oa
>Ni U
1 ^PP
00-HH000A
0 if 0 PHB rHS O a p
BX00p
00rH>a
Ni
tp0
p&op0
o\o o\o o\o o\o o\o o\o o\oo\ol>
LD l> N i p LD œ koP
P P Ni 0 P E> P r-|+1 +1 +1 +1 +1 +1 +1 +1
Nigî
ppo 0 0 iz; izi
1 q PP pp 0 O ps o p u o&) p p 0 uOi Oi Oi Oi
0%
i>oo
s [> Nip p Pa o Og 0 0 0 0o iz O ÎZ j2j
BOia Q
0p
0 0izi
Iz; ^
kû m en ,r— p s.o Ni [> p 0 ooO p p Ni mp • rH H • Ni * p
P '— ' — P —' Ni H0 0 en !>p P O o P Ni Ni pP P 0 0H • Ni Ni • P • •i O 1 1 O 1 O 0
rH l> l> r7rH H 0 CD H !>■ P p
0 O l>P P p P P'—' —- '— P p 0Ni 0 m LO Nio H p 0 p P p inO ko rHrH O rH O o1 1 1 1 1 O o P
N"
I
■
_P
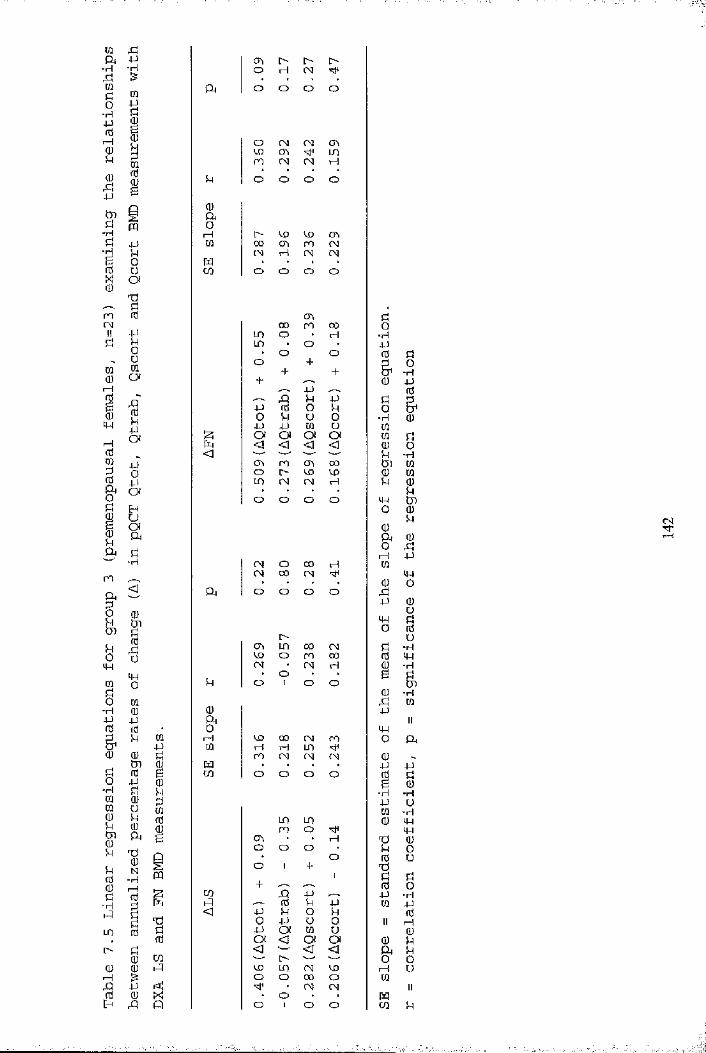
m rc;Oi 4J-H
g■H4JnJrHsü4-)
tnü-HÜ■HISmCNIIa
îdü■H
LO[>(UI—Ig
-H
CQ
iSfd(U
PQ4JU0Va
1uouCQO
iWM O'IIi t§ShÇh jzj
< yQa
roIOiwCQg•H4-1fd&m
g■HCQCQ(U
-iH
I4HOCQ(U4JfdU CQ
s ifdjjgüShCü
S’ ^U (ü
N “H(0Igs
4J0A
PQ
êICQ
g
en !> oo rH CN
Q a o O O o
o CN CN enVX) en LOro CN CN H
S-l o o O O
0aorH o CD CD CJ\M co en ro CN
CN rH CN CNm • • • •CQ O O O O
<T» ü00 ro 00 O
LO o rH ■rHLO O 4P• o O 0 aO + P o+ + & ■rH+ 0 P
4P 0A U 4P P P-P 0 O P 00 u ü O ■p 0j j 4-) CQ Ü mÎ3 Oi Oi OI Oi m ÜpL, < <1 < < 0 O< P •rH
en ro en 00 tn CQo l> CD CD 0 CQLO CN CN rH P 0• • • • Po O o O cp tno 0
P0P h 0O Æ1—t p
CN o 00 H MCN 00 CN ip• • • • 0 o
Q a O o o O fSp 0oip Uo 01> üen LO 00 CN p ■rHco O ro 00 0 PCN CN H 0 •rH
• O ♦ • G PSh o 1 o O tJS0 -HrP m
0 PA II0 IP1— 1 co 00 CN ro O Q ara tH H LO
ro CN CN CN 0m p pCQ o O o O 0 ae 0
■iH •HP Um •iHLO LO 0 P
ro O Pen • • rH Ti 0o o O P O• O 0 Uo 1 + 'd1 a P+ 0 0
CQ A 4P p -HhQ 0 P 4P m P<1 4J p O P 0
O 4J U 0 II 1— 1-p Oi M u 0Oi <3 OI Oi 0 P<3 < <3 Qa Po O OCD LO CN co 1— 1 UO O 00 o CQ
• CN CN II• O • • PQ
O 1 O O CQ p
. . . .' - .1

mA p H H CD-H •p CN HmP 0 a O o O Oo ■P-H dp g0
1p0
I> o\ IDiH CO CO in 000P H o CN CN0P I
p O1 o1 o1 O1
PiQ 0g aPQ o-H H <s}< o CO COP P 0 oo cn CD cn■d P CN CN o o§ O m • • • •g Ü CQ o o o oad0
CO d0 CN o pcn 00 in 0P i> ro -rHP CN CN PO CN 1 CN 0 dm0i“H
u0Oi 1 1
d P 1 &0o■Hdfd P 0
1ipOi
PO 0P Ou pp § &p P P 0 0 ■H 0Oi Oi Oi u 01—1 < < < Oi 0 d0 tP 0 0m <1 l> oo ro P ■Hd p ro <y\ 00 Ui 00 0 CN o o rH 0 0R* p • • • • p 02 Oi o o o O Pd 1 1 1 1 d tng O 0B o Pp OI 0m a a 0oA d o 1—1 d
d■H 00 ro 0cn CO 1> 000
dO
1
P
<
1ri
a o
LD
O
o
o
00
o
H
dpMHOd
0od0u-rH0 Ü o o CD 0 dP o rH o o 0 ■PP p • • * • G dm O o o o o tod 0 •rHo 0 d 0■H 0 0 pp p a II0 0 • o
à P 0 H m cn CTi o a&0 P 0 CD CO ro 100 d rH rH o O 0d Pi 0 M p d0 B CQ O O o o 0 do P 0 g 0■H d p -H -HW 0 d P u0 Ü 0 0 -H0PS’p
p 0 00 0 d0 0 cn ro H da G ro CN • ro d 0%N■P
roO
oO : 0u
0iCQ
oH-
H" + ■g drH0g
CQ+
d0d
0■rH
-H k P d P P 0 d
d<1 P 0 O P 0
p O P o 0 II 1—1CO 0 P P P 0 U 00 Oi Oi Oi OI 0 Pi> d < <J <3 <3 a P0 CQ — — 0 00 0 i-Q rH 00 CN 1—1 u
<o 00 rH rH 0
A p o o O O II0 0 X • • • • m
d P o o O o CQ p
fO

IsT3&(0c0>
(0
oc
oc
O)c(Q
1«2 0><
23D)E
OD
<30OOoo/DO
OOO lO O OOjjD O p 0 od 00
,'o°oœoâ^®o' cxDOCDOxdib ta»I oo<naooaiP0pp osa
ooo
00 CDœo oooo \o' 00 o o
&
od
iIcslT—+«ÎsCMII
Iro oo oh- (O
\
§u> I
sLD00
lON
S gO<o uus SsLO
O
LOCO
LOCM
LOooCO
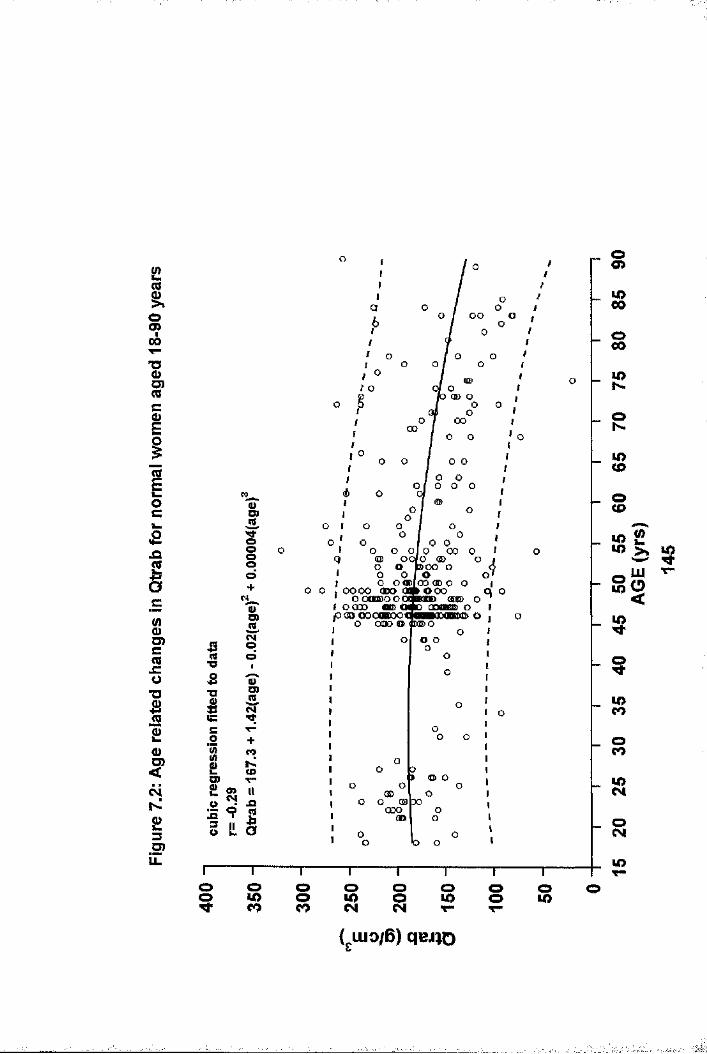
%S’cI%
1oc
Ic8O)c(Qx:0
1£o
c4
£3D)LL
■oa%xg
\Ipd+?D)IaD>t
.2 + I zO) V-
i!i
oo
oo00
00 ooo o
O OODlCOaDO o— ooocm> <SKE> o nnflMBi Oo , OOOO (DO G
' OO0BDOOC i OOOO « 0 o pOOOOOOBOOf o ooo o
o o
<o> oODoood>
lO00oCOu>NoN.u>CDoCDK S2M) >% CO_ LU T"So
<
$§COCO
oCO
COo o o o o O o oo CO o CO o CO o COCO CO N CM T“ T"
(giuo/B) qeJïO

900
%O)(0cEiIv_0CI»£■c
1
gD )CroJC0
1£(D<ÔÔNUiE
oboo
oo
(00
fo o o
oo o
oo o oo (Sût Qo œ oooooo
o omfô osoo o o
oo
ooo 00
VO)td+i
an ■oST3
IC O
!
P io II. o
&t00
T— '— r T '---- 1---- '---- 1----r
Oo>
m00
o00lON
iO<D
OCO
■"-b ^S o<$
u>CM
lOo o o O o o o o oo o o O o o o o oa> 00 N co LO co (N T—
( uio/B) ooso
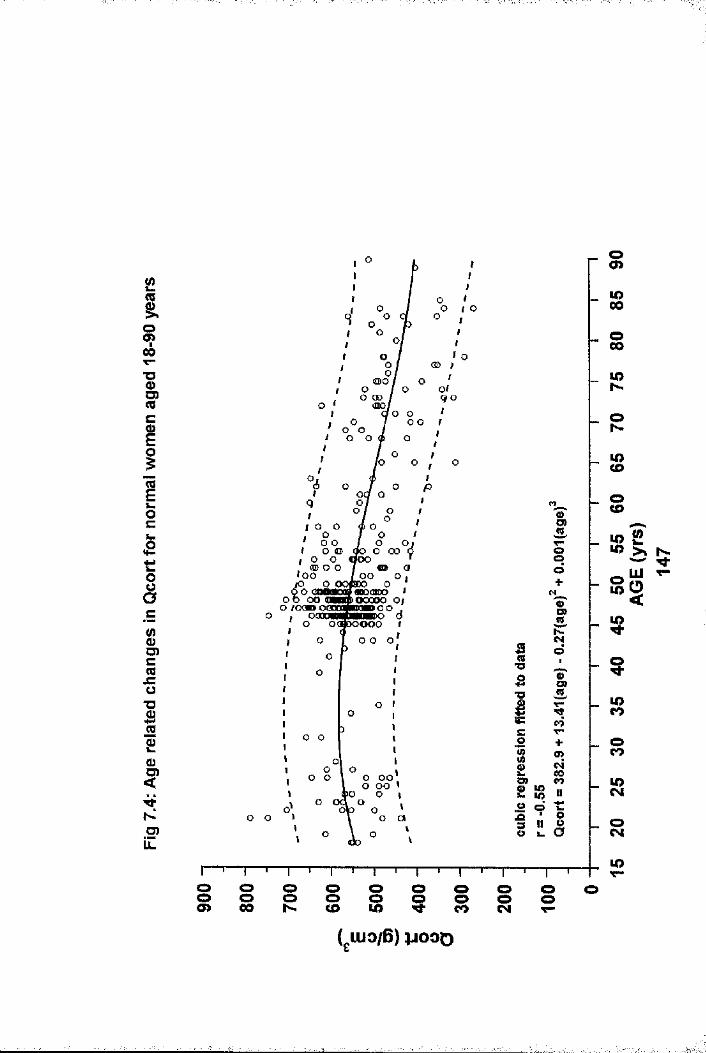
oo>Ü>00
!Oco
■oO) qo
O o
LOCD
OCDCD
O Oo e §.oiQO OOS O
O)o LOlOOO
D) o oT3O)TJ LOCO
OcoO);O) o oo o oo O)
2 Î8 LOCMo
8O)
SCJ)o
io ooco I oo o
co CD

1i.d
Q)SS.gI8.E'0Î2Ioc0ücafB8S
1
1S.ocQ)Sa..£QSCÛXI
1TOcn4->aaû>2 3CD
r §
g"O
8o
Q. q (/)o .0 o
D)00
_ O(3CO
O
ioo o oo o
CN( wo/B) qejjD 00
8d o\o[0 o
CL
9)0CNCL
asOï
_ oE ? .of
oo o8 8 o 8co 8 o
(gUio/B) ïo»D
i
ïIII
-.if
\:5'
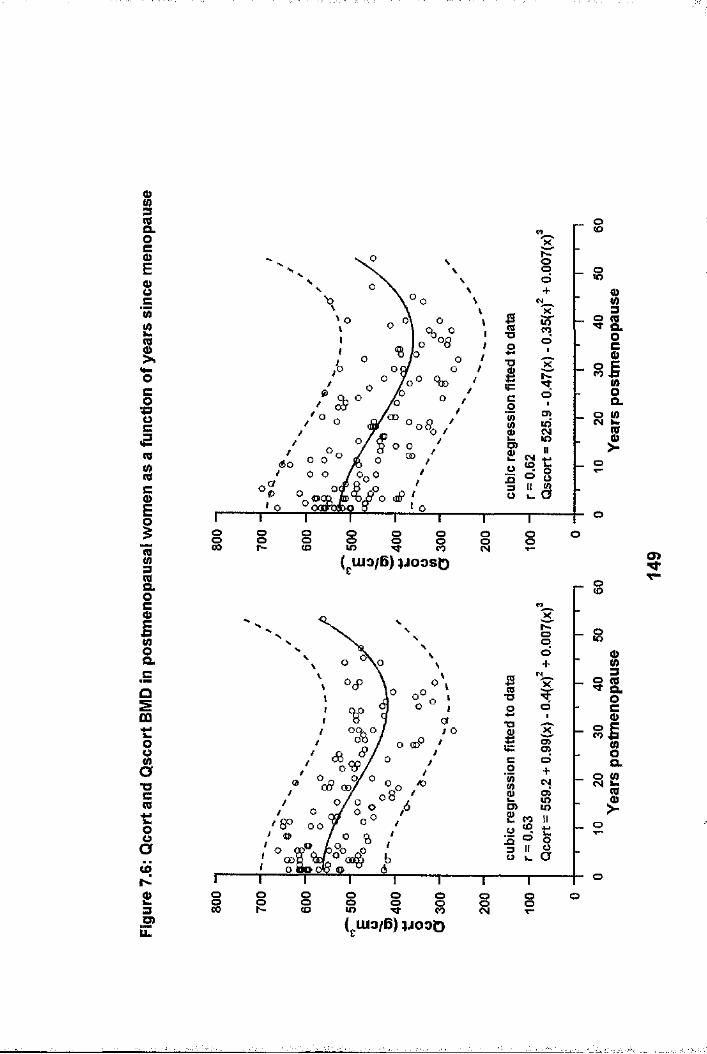
ig.ocE0)0 c'wÎ214-oc01(08II83&OCo8CLQIt:0s1t:8o
2 3.5 PLL
§ood
oTJ
oCOo
800
I 8liio oGD o
oooCO
oo 8 i 8 8 I oo( uio/B) ijooso
i(QCLocQ)8Q.2I
CD
£
o
oOoo
■o o
SooV:>n <yoor 0 0 /
o 8 O)oto
00,o
o8 § I I § gCM §
Is.og8CL
I
(giuo/6) ÏJOOD

00 T—s nl - O H
I ta. 3Q.
Ood
CL
Q.
CO MT— T-
Î ?ct)
|— — o
a>CL
CL
O)Q.
2I3
4 &o s.
■ooS
o o s § I o8
o COI>Q.
CO
( w o /B ) a iA ia
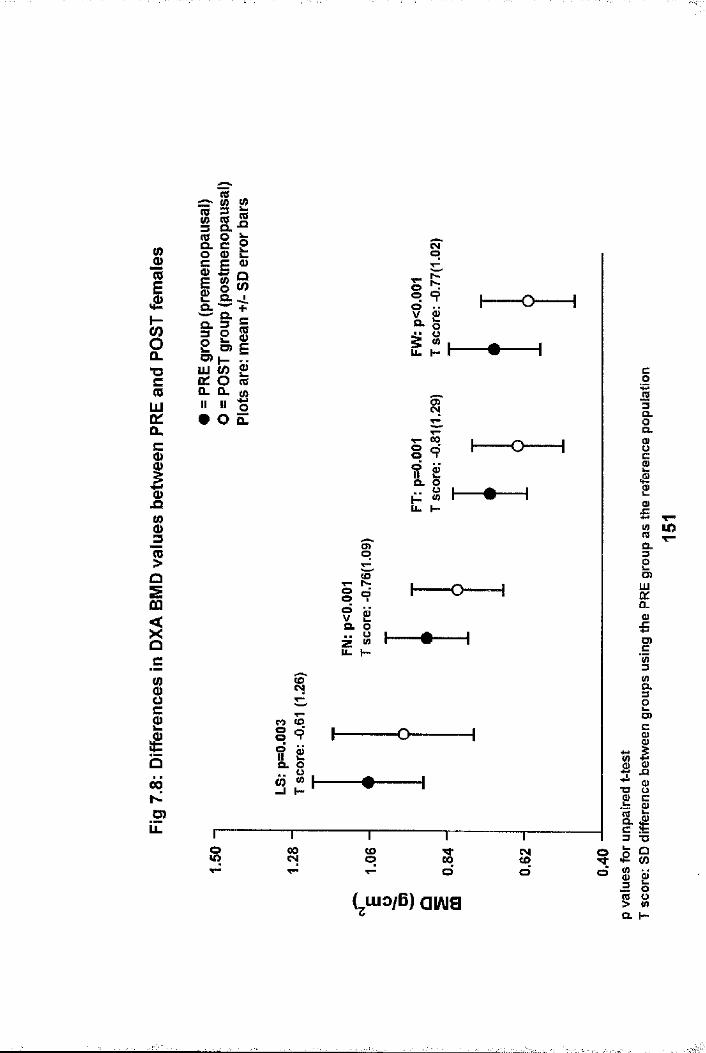
II
I"DC(QLUq:CLc
I1?oCO
Q
Sc:
IQ00No>
ills.io 0>= S 0)
S m
p iO) k- ..S O «« « I# o z
oo
a>o
fe
Vë »u . I -
o
a
o0
1
00o
o
«o'(y
CO <ooo 9O Ô)il cCL ooW (0
H
o
o CO COlO CM oT—
00d sdoo
(^u io /B ) a iA ia
c013CLg.S10)£:CL3
§.
0_0>Eg1
32 O)
i!0)TJ O
|i£ 8II> wQ. h“
Ï
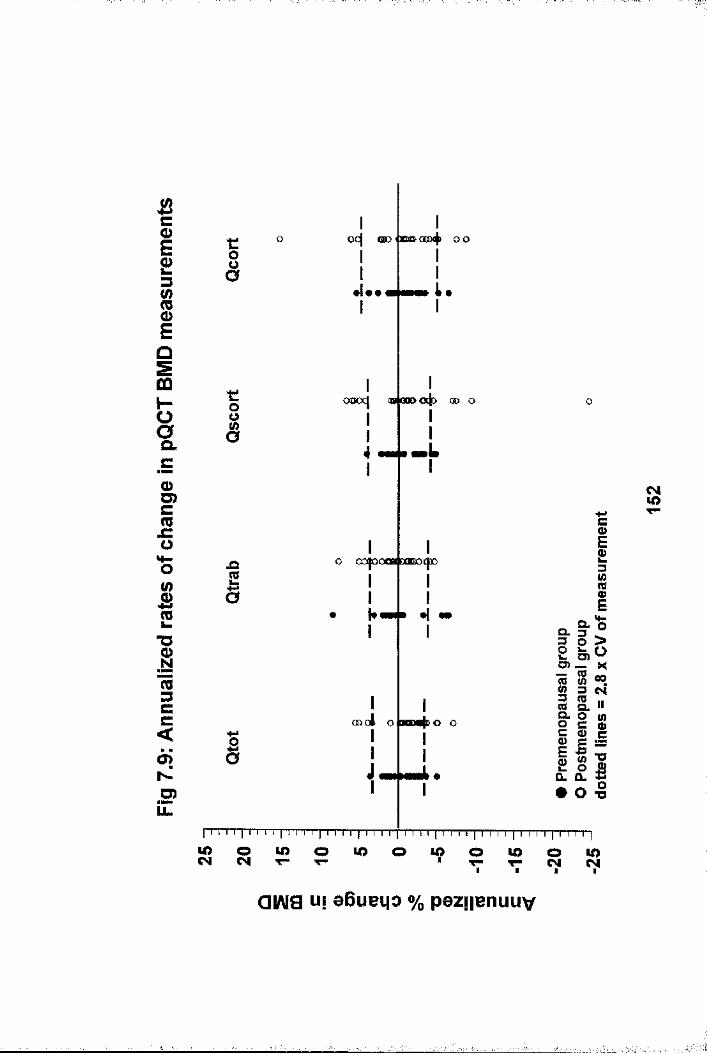
Bc013
îECÛHOCL
Q>O)C(0x;o
i"OIro3CC<o>ND)LL.
t:os
■coOO
.aI
ë
Iocj CDD < xm coc4 o o
I
ooocj (O 000
OOJOC
I I i I I I I I I i I l'i I I I t l'ï I I 111: i "i i I I I I I I I I I I I I I I I I I I I I I I
I
IIU
Iojo
II
«mLI
00 o
0438 0000I
|««H8 4 «e
Io o o l o hodoId c o
I I
<NlOC01I
II?l l ï
^ 1 1 I
• o -SI 8Q.
lOCM in o lO u> oT «ï
LOCM
QIAI8 uf eBuei|0 % pezifenuuv
I

■■■ï-
Bc0)E£3sECD0)'q .13cmo.
Oc0)U)cmx:o
I13
Ico3CC<
NO)
UL
o o OO @0D ( OOO OQD
00
LLoos|nofxni>
I Ia
LL
CO
I I I i I I I I I I I I I I !"| I I I 1 |"T"I T T] M M
O I
00 a 30000|)oo
ooJi b Ico
§•o O)O) _
i ICL0)
II0§X«îCMil
1
O T3
I I I I ! î"l I "'f 'IT'TT"]
S olO o oco CM o*?QIAia u| aBueqo % paz||enuuv
S
s
■I
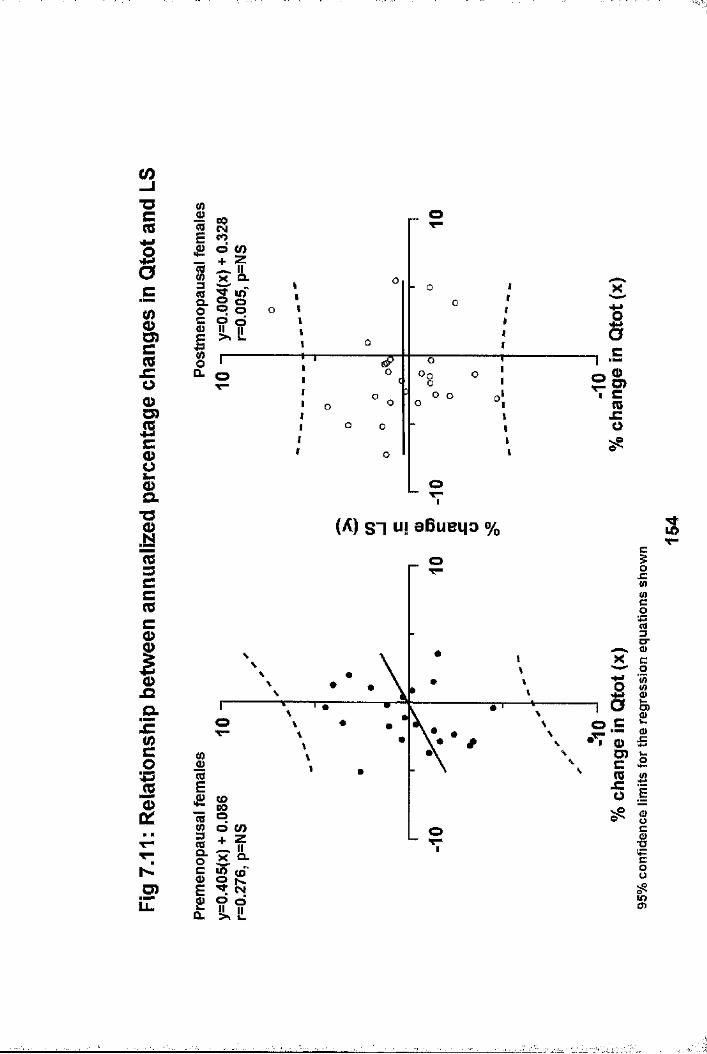
CO"Oc
I ^C
$O)c(00&scQ)2
■o1(ts3CC(CcI0).oQ.xzciO)
| sPoe/)}îi£ IL o I---CL O
t11t1I-t-rIIIIII
wo
- o
o o
sC
? lCOszo
oI
(A) S I ui eBueqo % SO
D“
O)O
o BO) ^
CD00O co o ■o
o ^P Sp o o lO
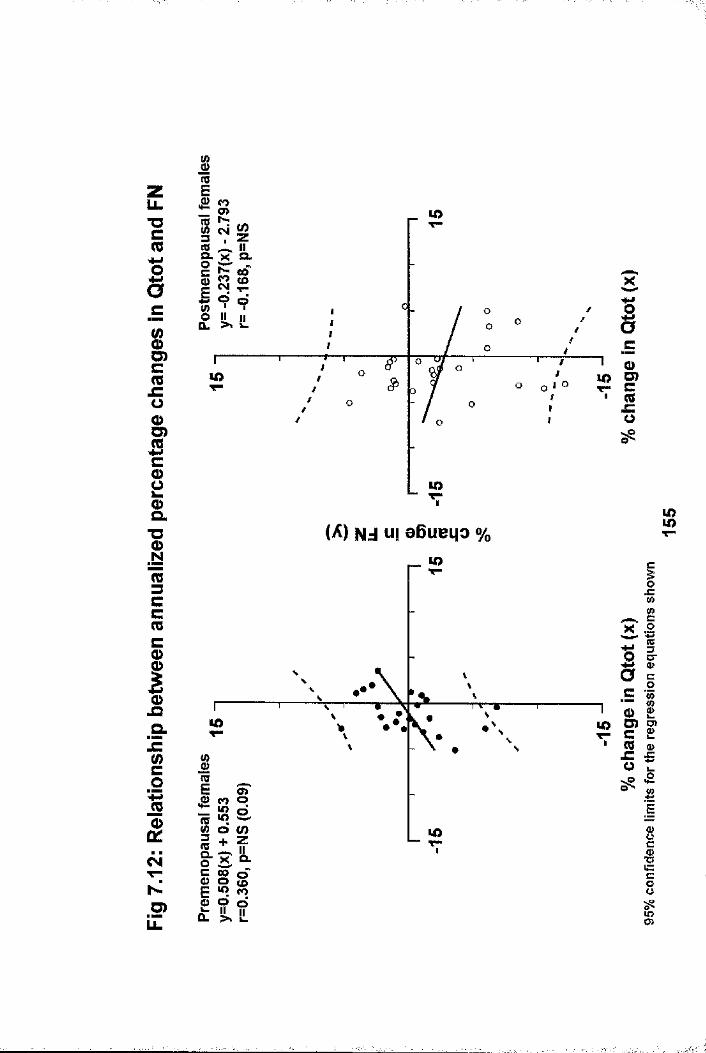
zu.T3C
IciU)c_c0â>G)jSc1&T3Im3CC(QCQ)
IQ.jE(/)C01
cJiV"ND)
i(Üu>
I I I1 9 QCL >» &-
lOT—I
(A) Nd ui eBueqo %
lO lO
o LOIII
ëc(!)D)C(C
%wcX .2
^ i rc01
c' 2CB (U £ £
ëCO
tn
Sssii
Is
I
.
î
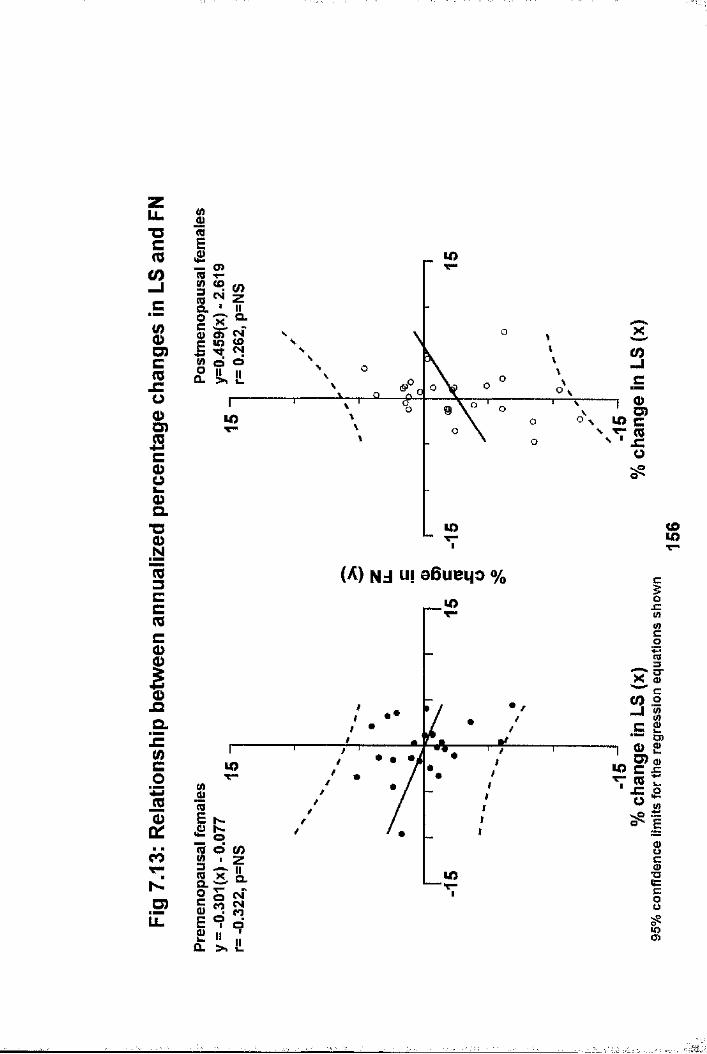
o>-I
a.
O)
D)m
Q.1 3
(A) Nj HI aBueqo %JC
<0 .2 —I %O)
COu> •aCLa.
3 §D)LL. lOO)

CHAPTER 8
THE ABILITY OF pQCT TO DISCRIMINATE FRACTURE AND NON-FRACTURE POPULATIONS: COMPARISON WITH OTHER BONE MASS MEASUREMENTS
8.1 IntroductionOsteoporotic fracture is the ultimate event affecting individuals with low BMD. Accordingly, such individuals are categorised as suffering from severe osteoporosis (6.4). Osteoporotic fractures characteristically affects the distal radius, thoracolumbar spine and proximal femur. Such fractures cause significant morbidity and cost the NHS an estimated £740 million per year (8.1). Additionally, the latter two types of fracture are associated with a reduced 5 year survival of 0.82 (8.2) and 0.83 (1.94) respectively, when compared to agematched non-fracture controls. With our increasingly aged population, the problems and financial burden imposed by osteoporotic fractures will undoubtedly rise (1.98).
One of the most important roles of osteo-densitometry is prediction of future fracture, as individuals considered at risk based upon a bone mass measurement can be targeted for life style and therapeutic intervention. There is convincing evidence that radial bone density measurements are useful in determining fracture risk. Although hip fracture risk is best determined by a site specific measurement (1.192), prospective studies have shown that radial BMD measurements, using techniques other than pQCT, can predict fracture risk at the hip (1.192,8.3) and spine (6 .5,8 .3). It is recognised that there is an overlap in BMD assessed at axial sites between age matched non-fracture populations and both hip (1.155,8.4,8.5) and vertebral (1.54,8.6) fracture populations, with the overlap being greater for the former type of fracture. Also, lumbar spine measurements can be falsely elevated by overlying aortic
157
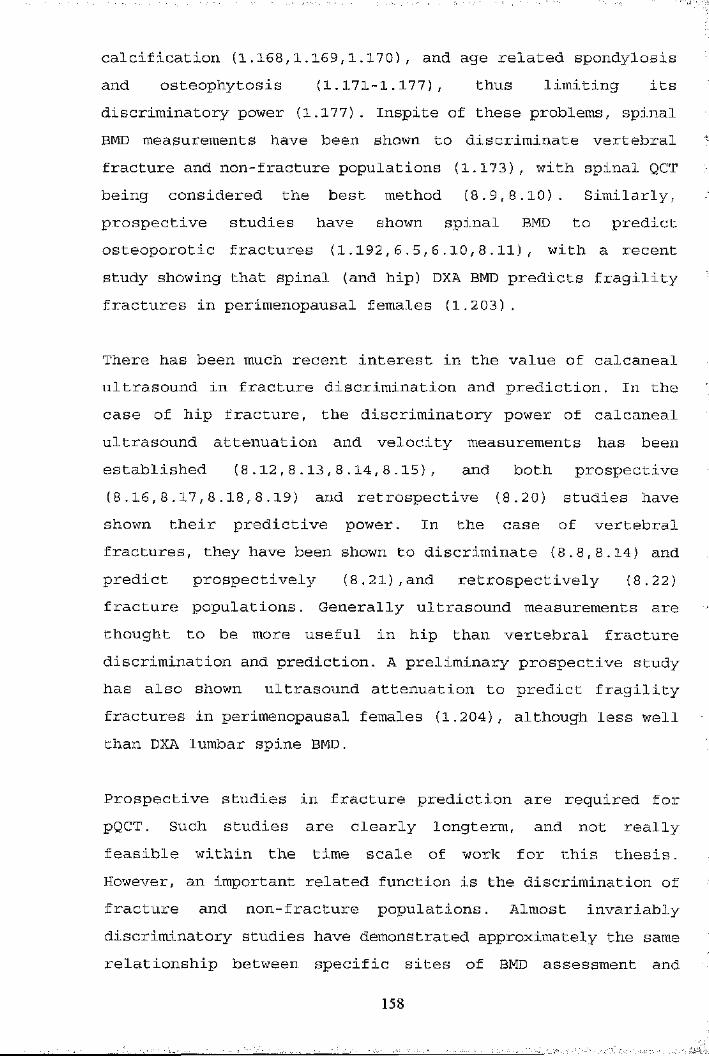
calcification (1.168,1.169,1.170), and age related spondylosis and osteophytosis (1.171-1.177), thus limiting its discriminatory power (1.177). Inspite of these problems, spinal BMD measurements have been shown to discriminate vertebral fracture and non-fracture populations (1.173), with spinal QCT being considered the best method (8.9,8.10). Similarly, prospective studies have shown spinal BMD to predict osteoporotic fractures (1.192,6.5,6.10,8.11), with a recent study showing that spinal (and hip) DXA BMD predicts fragility fractures in perimenopausal females (1.203).
There has been much recent interest in the value of calcaneal ultrasound in fracture discrimination and prediction. In the case of hip fracture, the discriminatory power of calcaneal ultrasound attenuation and velocity measurements has been established (8.12,8.13,8.14,8.15), and both prospective (8.16,8.17,8.18,8.19) and retrospective (8.20) studies have shown their predictive power. In the case of vertebral fractures, they have been shown to discriminate (8,8,8.14) and predict prospectively (8 .21),and retrospectively (8 .22) fracture populations. Generally ultrasound measurements are thought to be more useful in hip than vertebral fracture discrimination and prediction. A preliminary prospective study has also shown ultrasound attenuation to predict fragility fractures in perimenopausal females (1.204), although less well than DXA lumbar spine BMD.
Prospective studies in fracture prediction are required for pQCT. Such studies are clearly longterm, and not really feasible within the time scale of work for this thesis. However, an important related function is the discrimination of fracture and non-fracture populations. Almost invariably discriminatory studies have demonstrated approximately the same relationship between specific sites of BMD assessment and
158

fracture risk as subsequent longitudinal studies. As the vertebral body is predominantly trabecular bone, as is up to 50% of the proximal femur, independent assessment of trabecular and cortical bone at the radius by pQCT may allow differentiation of fracture and non-fracture populations by one or other of the pQCT BMD measurements. The ability of pQCT to discriminate groups of individuals who had suffered a previous vertebral or hip fracture from non-fracture controls was therefore studied, comparing the results with DXA and ultrasound measurements done at other skeletal sites.
8.2 Study Populations and Bone Mass Measurements
8.2.1 Vertebral fracture study4 5 postmenopausal females with vertebral fractures proven on lateral thoracolumbar spine x-ray were recruited from a bone clinic. None had any underlying condition or were taking medication known to influence bone mass. 30 normal postmenopausal females formed the control group. The recruitment of these females has been discussed previously (Chapter 5: 5.2 point 3). Lateral thoracolumbar spine x-rays were performed to exclude vertebral fracture in this control group (1 of the original 31 females had a vertebral fracture and was excluded from this study). All of these females had radial pQCT and DXA of hip and spine performed on a single visit. 30 of the fracture population were scanned using a Norland DXA scanner, whilst the remaining 15 females were scanned using a Lunar DPX-a scanner. The whole control population was scanned using the Norland DXA scanner. Fractured vertebral bodies within the DXA lumbar spine region of interest (L2-L4) were excluded from the analysis. As two different DXA scanners were used in the assessment of the vertebral^ fracture group, and there are known to be differences in data acquisition between these scanners (8.23), DXA hip and spine
159
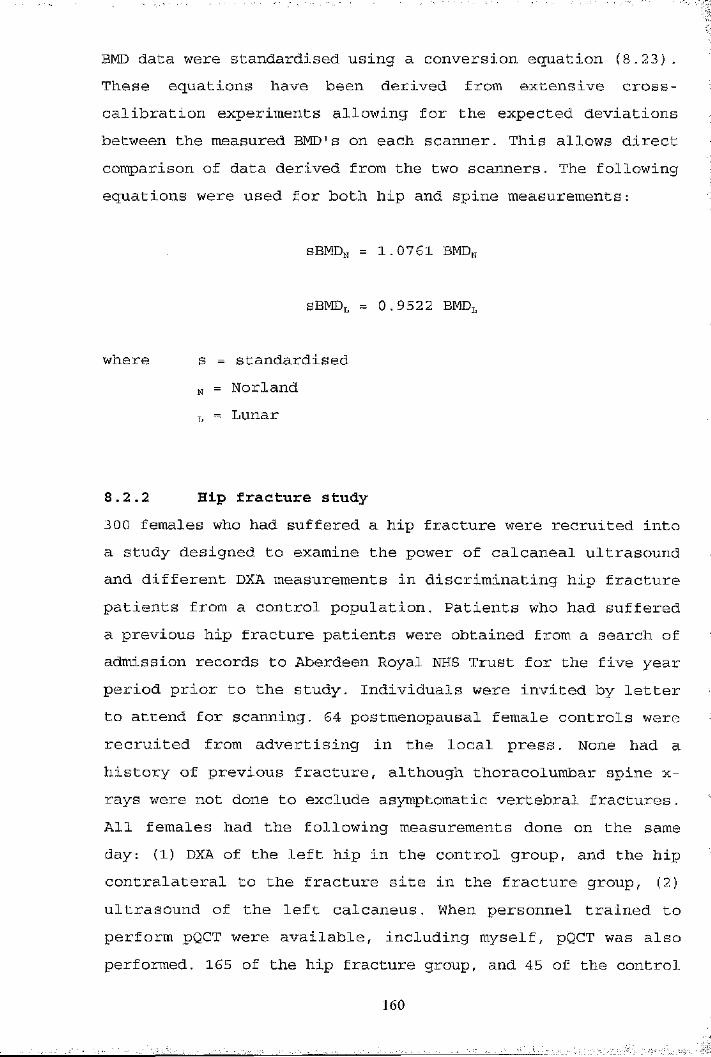
BMD data were standardised using a conversion equation (8.23). These equations have been derived from extensive crosscalibration experiments allowing for the expected deviations between the measured BMD’s on each scanner. This allows direct comparison of data derived from the two scanners. The following equations were used for both hip and spine measurements:
sBMDn = 1.0761 BMD„
SBMDl = 0.9522 BMDl
where s = standardisedN = Norland X, = Lunar
8.2.2 Hip fracture study300 females who had suffered a hip fracture were recruited into a study designed to examine the power of calcaneal ultrasound and different DXA measurements in discriminating hip fracture patients from a control population. Patients who had suffered a previous hip fracture patients were obtained from a search of admission records to Aberdeen Royal NHS Trust for the five year period prior to the study. Individuals were invited by letter to attend for scanning. 64 postmenopausal female controls were recruited from advertising in the local press. None had a history of previous fracture, although thoracolumbar spine x- rays were not done to exclude asymptomatic vertebral fractures. All females had the following measurements done on the same day: (1) DXA of the left hip in the control group, and the hipcontralateral to the fracture site in the fracture group, (2) ultrasound of the left calcaneus. When personnel trained to perform pQCT were available, including myself, pQCT was also performed. 165 of the hip fracture group, and 45 of the control
160

group had pQCT performed. These females formed the study populations which are reported in this thesis.
8.3 Statistical AnalysesSimilar analytical methods were used for both vertebral and hip fracture groups. Continuous variables are expressed as mean and standard deviation when normally distributed, median with range otherwise. Comparison between groups was performed by the unpaired t-test. Bone mass measurements were examined having corrected for the influence of age, height and weight by analysis of co-variance. Percentage differences between measurements were calculated, and taking into account differing ranges for these measurements, Z-scores (number of standard deviations above or below the normal mean) were calculated. These z scores were generated using the control group as the reference population in each corresponding studies. Receiver operator curves (ROC) for the different bone mass measurements were created. These reflect sensitivity versus specificity for multiple cut off values. The area under the resultant curve (AUC) indicates the ability of that measurement to discriminate fracture from non-fracture populations. The greater the area under the curve, the more discriminatory the measurement. ROC's were generated, AUC's calculated, and subsequent comparisons made using the "ROCKER" statistical package.
8.4 Results8.4.1 Vertebral fracture studyDetails of the study populations are shown in table 8.1. The fracture group was 4.1 years older (p<0.05), 3.8 cm shorter(p<0.05), 3.2 kg lighter (p=NS) and 6.5 years morepostmenopause (p<0.01) than the non-fracture group. The median number of vertebral fractures was 2 (range 1-8). All pQCT BMD values were significantly lower in the fracture group and are shown in figure 8.1: (Qtot: 341.8 ± 76.3 vs 269.8 ± 56.3 g/cm^;
161
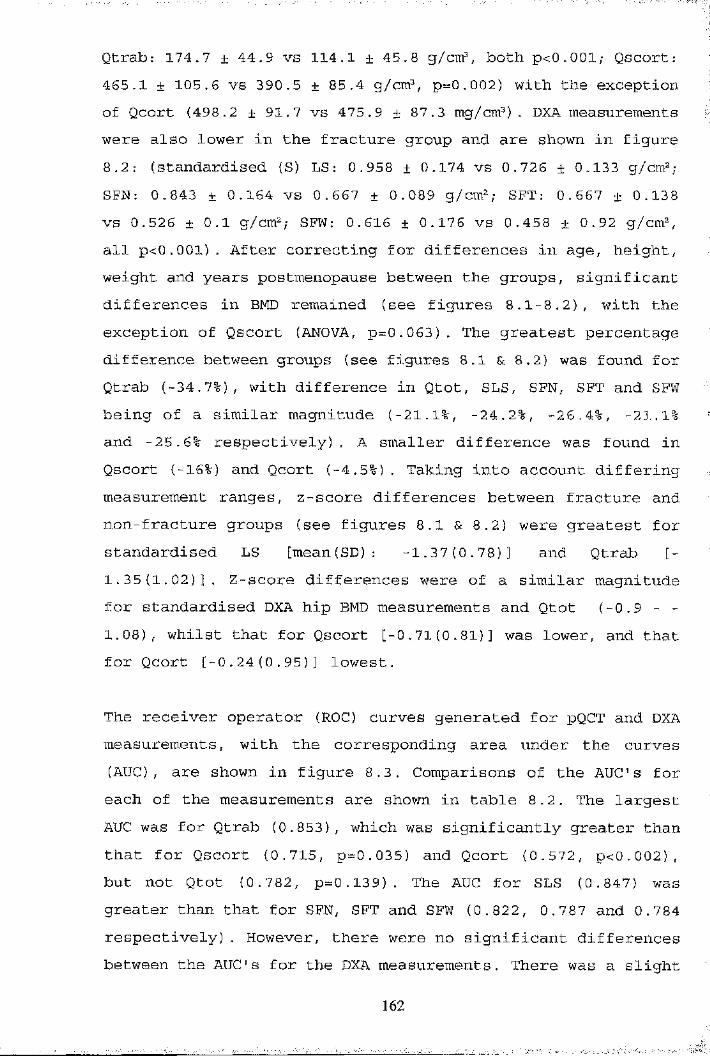
Qtrab: 174.7 ± 44.9 vs 114.1 ±45.8 g/cm , both p<0.001; Qscort:465.1 ± 105.6 vs 390.5 ± 85.4 g/cm , p-0.002) with the exception of Qcort (498.2 ± 91.7 vs 475.9 ± 87.3 mg/cm^) . DXA measurements were also lower in the fracture group and are shown in figure 8.2: (standardised (S) LS: 0.958 ± 0.174 vs 0.726 ± 0.133 g/cm^; SFN: 0.843 ± 0.164 vs 0.667 ± 0,089 g/cm^; SFT: 0.667 ± 0.138 vs 0.526 ± 0.1 g/cm^; SFW: 0.616 ± 0.176 vs 0.458 ± 0.92 g/cm\ all p<0.001). After correcting for differences in age, height, weight and years postmenopause between the groups, significant differences in BMD remained (see figures 8 .1-8.2), with the exception of Qscort (AJSTOVA, p=0.063). The greatest percentage difference between groups (see figures 8.1 & 8 .2) was found for Qtrab (-34.7%), with difference in Qtot, SLS, SFN, SFT and SFW being of a similar magnitude (-21.1%, -24.2%, -26.4%, -21.1%and -25.6% respectively). A smaller difference was found in Qscort (-16%) and Qcort (-4.5%). Taking into account differing measurement ranges, z-score differences between fracture and non-fracture groups (see figures 8.1 & 8 .2) were greatest for standardised LS (mean(SD): -1.37(0.78)] and Qtrab [-1.35(1.02)]. Z-score differences were of a similar magnitude for standardised DXA hip BMD measurements and Qtot (-0.9 - - 1.08), whilst that for Qscort [-0.71(0.81)] was lower, and that for Qcort [-0.24(0.95)] lowest.
The receiver operator (ROC) curves generated for pQCT and DXA measurements, with the corresponding area under the curves (AUC), are shown in figure 8.3. Comparisons of the AUC's for each of the measurements are shown in table 8.2. The largest AUC was for Qtrab (0.853), which was significantly greater than that for Qscort (0.715, p=0.035) and Qcort (0.572, p<0.002), but not Qtot (0.782, p=0.139). The AUC for SLS (0.847) wasgreater than that for SFN, SFT and SFW (0.822, 0.787 and 0.784 respectively). However, there were no significant differences between the AUC's for the DXA measurements. There was a slight
162
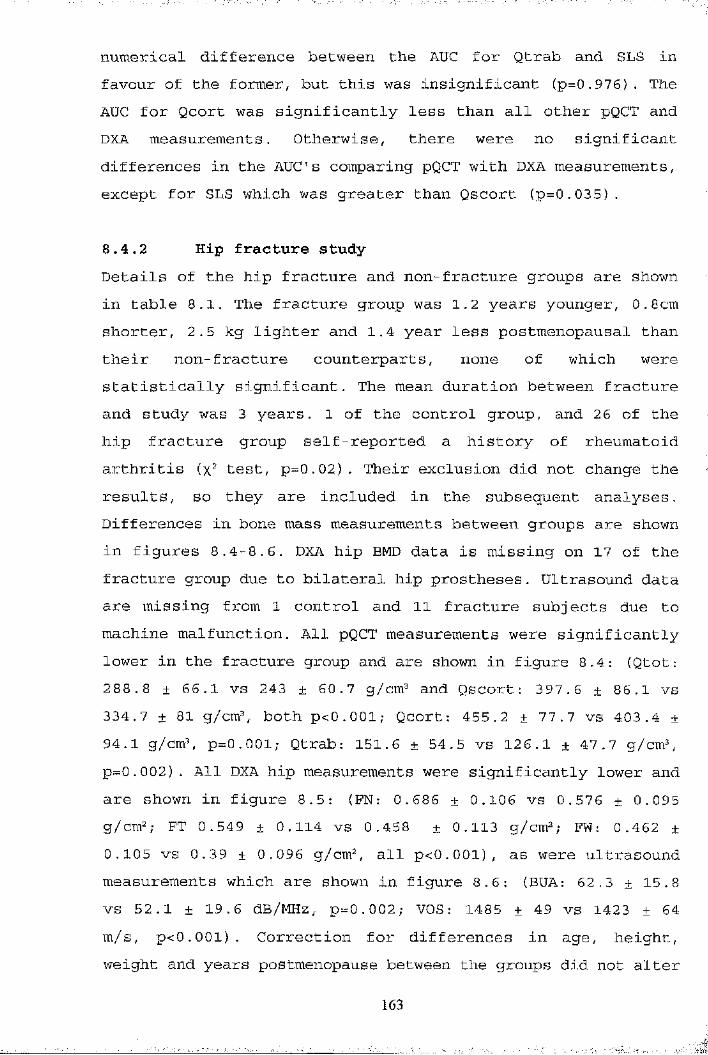
numerical difference between the AUC for Qtrab and SLS in favour of the former, but this was insignificant (p=0.976). The AUC for Qcort was significantly less than all other pQCT and DXA measurements. Otherwise, there were no significant differences in the AUC's comparing pQCT with DXA measurements, except for SLS which was greater than Qscort (p=0.035).
8.4.2 Hip fracture studyDetails of the hip fracture and non-fracture groups are shown in table 8.1, The fracture group was 1.2 years younger, 0.8cm shorter, 2.5 kg lighter and 1.4 year less postmenopausal than their non-fracture counterparts, none of which were statistically significant. The mean duration between fracture and study was 3 years. 1 of the control group, and 26 of the hip fracture group self-reported a history of rheumatoid arthritis (x test, p=0.02). Their exclusion did not change the results, so they are included in the subsequent analyses. Differences in bone mass measurements between groups are shown in figures 8 .4-8.6 . DXA hip BMD data is missing on 17 of the fracture group due to bilateral hip prostheses. Ultrasound data are missing from 1 control and 11 fracture subjects due to machine malfunction. All pQCT measurements were significantly lower in the fracture group and are shown in figure 8.4: (Qtot:288.8 ± 66.1 vs 243 ± 60.7 g/cm^ and Qscort: 397.6 ± 86.1 vs 334.7 ± 81 g/cm^, both p<0.001; Qcort: 455.2 ± 77.7 vs 403.4 ±94.1 g/cm , p=0.001; Qtrab: 151.6 ± 54.5 vs 12 6.1 ± 47.7 g/cm^, p=0.002). All DXA hip measurements were significantly lower and are shown in figure 8.5: (FN: 0.686 ± 0.106 vs 0.576 ± 0.095g/cm"; FT 0.549 ± 0.114 vs 0.458 ± 0.113 g/cm^; FW: 0.462 ±0.105 vs 0.39 ± 0.096 g/cm^, all p<0.001), as were ultrasound measurements which are shown in figure 8 .6 : (BUA: 62.3 ± 15.8vs 52.1 ± 19.6 dB/MHz, p=0.002; VOS: 1485 ± 49 vs 1423 ± 64 m/s, p<0.001). Correction for differences in age, height, weight and years postmenopause between the groups did not alter
163
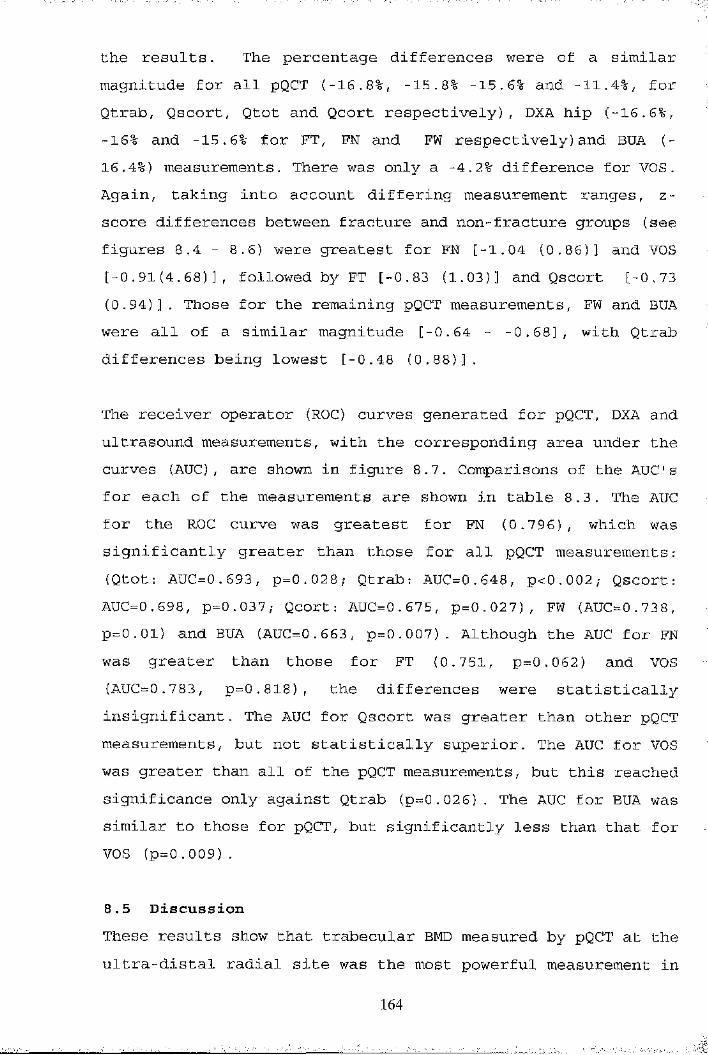
the results. The percentage differences were of a similar magnitude for all pQCT (-16.8%, -15.8% -15.6% and -11.4%, for Qtrab, Qscort, Qtot and Qcort respectively), DXA hip (-16.6%, -16% and -15.6% for FT, FN and FW respectively) and BUA (- 16.4%) measurements. There was only a -4.2% difference for VOS. Again, taking into account differing measurement ranges, z- score differences between fracture and non-fracture groups (see figures 8.4 - 8 .6) were greatest for FN [-1.04 (0.86)] and VOS [-0.91(4.68)], followed by FT [-0.83 (1.03)] and Qscort [-0.73 (0.94)] . Those for the remaining pQCT measurements, FW and BUA were all of a similar magnitude [-0.64 - -0.68], with Qtrab differences being lowest [-0.48 (0.88)].
The receiver operator (ROC) curves generated for pQCT, DXA and ultrasound measurements, with the corresponding area under the curves (AUC), are shown in figure 8.7. Comparisons of the AUC's for each of the measurements are shown in table 8.3. The AUC for the ROC curve was greatest for FN (0.796), which was significantly greater than those for all pQCT measurements: (Qtot: AUC=0.693, p=0.028; Qtrab: AUC=0.648, p<0.002; Qscort: AUC=0.698, p=0.037; Qcort: AUC=0.675, p=0.027), FW (AUC=0.738, p=0.01) and BUA (AUC=0.663, p=0.007). Although the AUC for FN was greater than those for FT (0.751, p=0.062) and VOS(AUC=0.783, p=0.818), the differences were statisticallyinsignificant. The AUC for Qscort was greater than other pQCT measurements, but not statistically superior. The AUC for VOS was greater than all of the pQCT measurements, but this reached significance only against Qtrab (p=0.026) . The AUC for BUA was similar to those for pQCT, but significantly less than that for VOS (p=0.009).
8.5 DiscussionThese results show that trabecular BMD measured by pQCT at the ultra-distal radial site was the most powerful measurement in
164
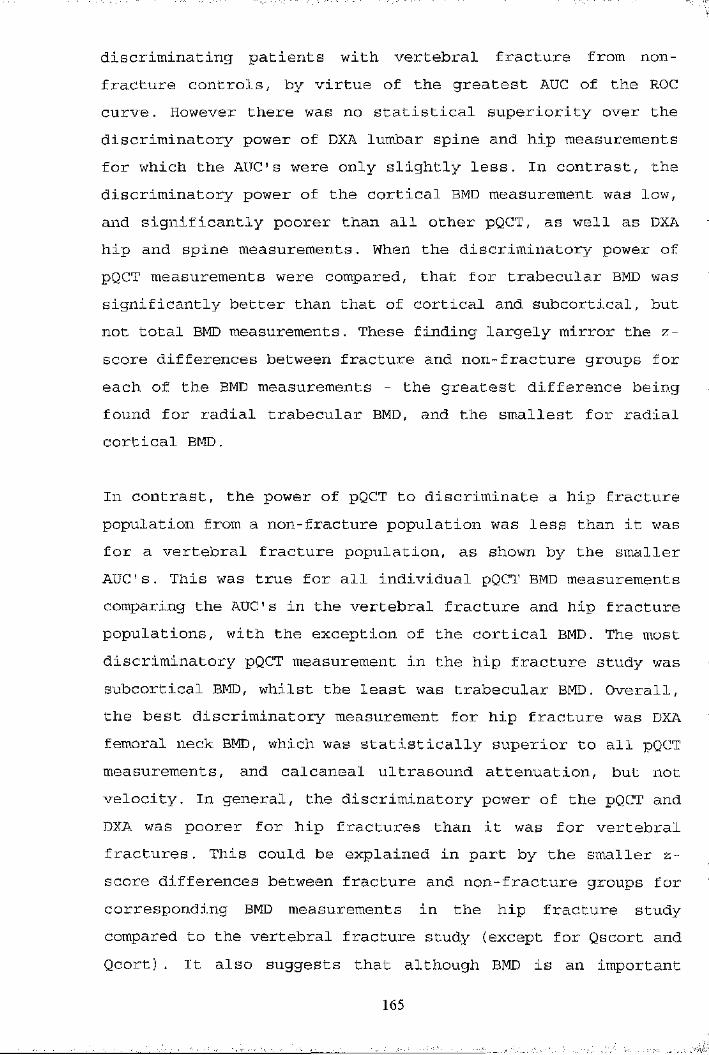
discriminating patients with vertebral fracture from nonfracture controls, by virtue of the greatest AUC of the ROC curve. However there was no statistical superiority over the discriminatory power of DXA lumbar spine and hip measurements for which the AUC's were only slightly less. In contrast, the discriminatory power of the cortical BMD measurement was low, and significantly poorer than all other pQCT, as well as DXA hip and spine measurements. When the discriminatory power of pQCT measurements were compared, that for trabecular BMD was significantly better than that of cortical and subcortical, but not total BMD measurements. These finding largely mirror the z- score differences between fracture and non-fracture groups for each of the BMD measurements - the greatest difference being found for radial trabecular BMD, and the smallest for radial cortical BMD.
In contrast, the power of pQCT to discriminate a hip fracture population from a non-fracture population was less than it was for a vertebral fracture population, as shown by the smaller AUC's. This was true for all individual pQCT BMD measurements comparing the AUC's in the vertebral fracture and hip fracture populations, with the exception of the cortical BMD. The most discriminatory pQCT measurement in the hip fracture study was subcortical BMD, whilst the least was trabecular BMD. Overall, the best discriminatory measurement for hip fracture was DXA femoral neck BMD, which was statistically superior to all pQCT measurements, and calcaneal ultrasound attenuation, but not velocity. In general, the discriminatory power of the pQCT and DXA was poorer for hip fractures than it was for vertebral fractures. This could be explained in part by the smaller z- score differences between fracture and non-fracture groups for corresponding BMD measurements in the hip fracture study compared to the vertebral fracture study (except for Qscort and Qcort) . It also suggests that although BMD is an important
165
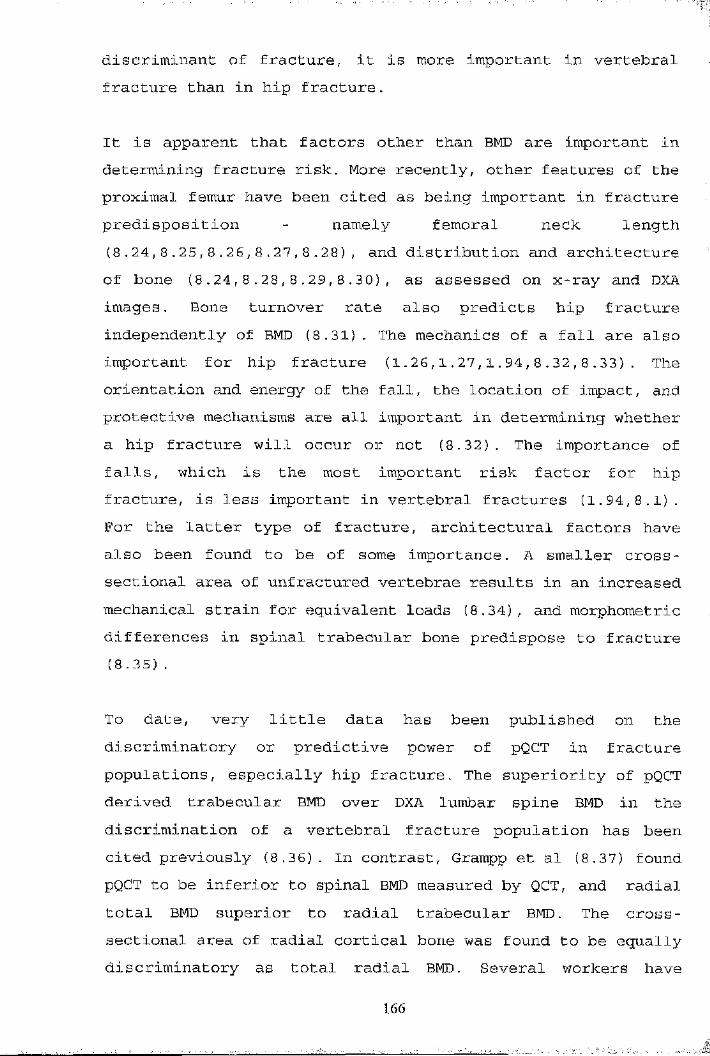
discriminant of fracture, it is more important in vertebral fracture than in hip fracture.
It is apparent that factors other than BMD are important in determining fracture risk. More recently, other features of the proximal femur have been cited as being important in fracture predisposition - namely femoral neck length (8.24,8.25,8.26,8.27,8.28), and distribution and architecture of bone (8.24,8.28,8.29,8.30), as assessed on x-ray and DXA images. Bone turnover rate also predicts hip fracture independently of BMD (8.31). The mechanics of a fall are also important for hip fracture (1.26,1.27,1.94,8.32,8.33). The orientation and energy of the fall, the location of impact, and protective mechanisms are all important in determining whether a hip fracture will occur or not (8.32). The importance of falls, which is the most important risk factor for hip fracture, is less important in vertebral fractures (1.94,8.1). For the latter type of fracture, architectural factors have also been found to be of some importance. A smaller cross- sectional area of unfractured vertebrae results in an increased mechanical strain for equivalent loads (8.34), and morphometric differences in spinal trabecular bone predispose to fracture (8.35).
To date, very little data has been published on the discriminatory or predictive power of pQCT in fracture populations, especially hip fracture. The superiority of pQCT derived trabecular BMD over DXA lumbar spine BMD in the discrimination of a vertebral fracture population has been cited previously (8.36) . In contrast, Grampp et al (8.37) found pQCT to be inferior to spinal BMD measured by QCT, and radial total BMD superior to radial trabecular BMD. The cross- sectional area of radial cortical bone was found to be equally discriminatory as total radial BMD. Several workers have
166

reported pQCT BMD in vertebral fracture populations (1.78,3.1,6.7,8.38). Grampp et al (3.1) found differences of 10% for trabecular, 8% for total and 1.5% for cortical BMD, which are lower than those reported in this thesis. There was also a greater age difference between their groups than ours. Schneider et al (6.7) found a difference of 21% between groups, but they compared a postmenopausal fracture group (mean age 5 9 years) with a premenopausal control group (aged 20-40) which are clearly not comparable. However, Ruegsegger et al have found differences of 15-33% in age matched controls (1.78, 8.38) which are comparable to those reported in this thesis.
To date, no prospective cohort study exist in which fracturerisk has been determined by pQCT. Numerous studies have shownthat radial BMD, as measured by SPA, has predictive value forhip (1.192,8.3,8.39,8.40) and vertebral (6.5,6.10,8.3)fractures. One standard deviation decrease in radial BMDresults in a 1 .6-2.6 increased risk of hip fracture(1.192,8.3,8.11), and a 1.3-2.4 increased risk of vertebralfracture (6.5,6.10,8.3,8.11). It is however generally acceptedthat fracture risk is best determined by a site specificmeasurement (1.192,8.11,8.41). If this applies to the radius, .then radial pQCT measurements should be useful in predictingdistal forearm fracture, although this was not formallyassessed as part of the work for this thesis. Thediscriminatory power of pQCT trabecular and total BMD
.measurements in vertebral fracture suggests that pQCT may alsobe of value in the prediction of vertebral fracture. pQCT maybe of particular value when lumbar spondylosis is evident, whenthe discriminatory power of spinal DXA is diminished (8.52).The power of pQCT to discriminate hip fracture was less than that of hip DXA and calcaneal ultrasound, suggesting that pQCT would be of less value in the prediction of hip fracture.
167
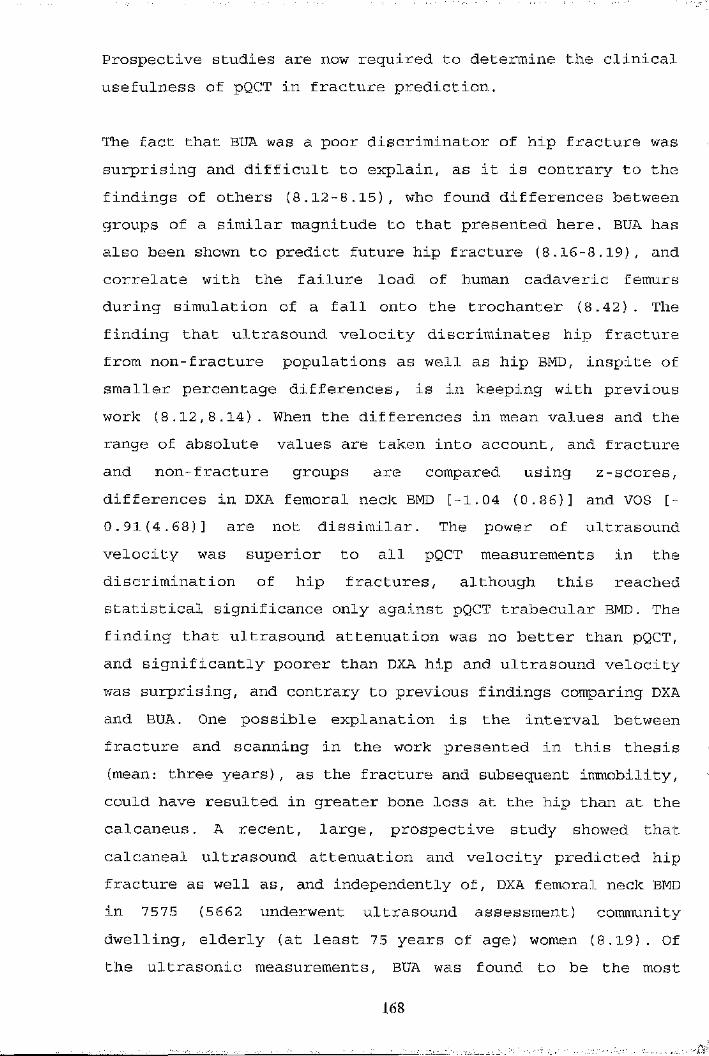
Prospective studies are now required to determine the clinical usefulness of pQCT in fracture prediction.
The fact that BUA was a poor discriminator of hip fracture was surprising and difficult to explain, as it is contrary to the findings of others (8.12-8.15), who found differences between groups of a similar magnitude to that presented here. BUA has also been shown to predict future hip fracture (8.16-8.19), and correlate with the failure load of human cadaveric femurs during simulation of a fall onto the trochanter (8.42). The finding that ultrasound velocity discriminates hip fracture from non-fracture populations as well as hip BMD, inspite of smaller percentage differences, is in keeping with previous work (8.12,8.14). When the differences in mean values and the range of absolute values are taken into account, and fracture and non-fracture groups are compared using z-scores, differences in DXA femoral neck BMD [-1.04 (0.86)] and VOS [- 0.91(4.68)] are not dissimilar. The power of ultrasound velocity was superior to all pQCT measurements in the discrimination of hip fractures, although this reached statistical significance only against pQCT trabecular BMD. The finding that ultrasound attenuation was no better than pQCT, and significantly poorer than DXA hip and ultrasound velocity was surprising, and contrary to previous findings comparing DXA and BUA. One possible explanation is the interval between fracture and scanning in the work presented in this thesis (mean: three years), as the fracture and subsequent immobility, could have resulted in greater bone loss at the hip than at the calcaneus. A recent, large, prospective study showed that calcaneal ultrasound attenuation and velocity predicted hip fracture as well as, and independently of, DXA femoral neck BMD in 7575 (5662 underwent ultrasound assessment) communitydwelling, elderly (at least 75 years of age) women (8.19). Of the ultrasonic measurements, BUA was found to be the most
168

independent of femoral neck BMD, yet the most predictive of hip fracture. Additionally, for women in whom both BUA and femoral neck BMD was low (less than the median) , the fracture risk was much greater than in those with only one low measurement. This suggests that fracture risk is best determined by measuring both femoral neck BMD and calcaneal BUA.
There are several confounding factors in the studies presented in this thesis. In the vertebral fracture study, the groups were not entirely comparable, with the fracture group being older, shorter and further beyond the menopause than the nonfracture group. However, correcting for these differences did not greatly change the highly significant differences for most BMD measurements between groups. Also, as discussed in chapter 7, age related rates of bone loss are greater at the spine and hip compared to the radius. Therefore any age difference between groups would affect DXA more than pQCT measurements, and as such should not detract from the finding that pQCT trabecular BMD discriminates best between vertebral fracture and non-fracture groups. An additional problem was performing axial measurements on two DXA scanners manufactured by different companies, which is less than ideal. However, correction equations have been extensively validated to allow comparison of data acquired from these different scanners (8.23) . Additionally, there was no quantification of lumbar spondylosis on the spinal x-rays. If significant osteoarthritic changes were present, this would have diminished the discriminatory power of the DXA lumbar spine measurement.
In the hip fracture study, the control group is much smaller than the fracture group, whilst the reverse is the ideal. Unfortunately it proved impossible to recruit more non-fracture controls. Also, only a subgroup of the population originally recruited underwent pQCT as discussed in chapter 8.2.2. There
169
was no preselection of this subgroup, as pQCT was performed whenever personnel trained in pQCT were available, and this is unlikely to have biased the subgroup which formed the populations presented here. The differences in bone mass measurements between hip fracture and non fracture groups for hip DXA and ultrasound measurements are comparable to those previously published (8.12,8.13,8.15), which supports the concept that both groups were representative.
Finally, the ability of pQCT to predict hip, vertebral and distal forearm fractures must now be determined by prospective studies.
170

■
g-HIP4mQ)Uu0 U
(Urc;4J4-)-rim1to(U3U24-)gmI4JïIffi
0) I—Ig
raIUtJ)
S4JaA o
"H
4JIM0
n34-)
L)-H
tto1QH
U
U
irHftiSh■34J>
OSUIPu
00 HW
a-HrCl
nS LO JUO 04 ,—VCT) 00O OLO H LOPu CO1 CT) rH 1H ro 04 ro i> 00 rHII • LO • • —'M 00 CT) rH> LO rH lO 04 04
LOO HrH • • mO O[> ■— H CT)U O1 o CT)H ro rH LO CT) rodl II • LO • .M n '=ÿ • 04 LO> LO H LO H
PuIPuH
m
IX) kO 1—i
u LnI
d) Il
S 5
rH
rH<y\
m
mi>
[>ooI>Lf)LO
lf)r-"
VDo
LOLOLO
rH
04HH
CT)00LO
LOCT)
HLO
%^UlU 4J 4Jf!tn m(U -H -iHtn Q) (D<< m &
OH
CT)CM
O'
CT)
Oro
LOH
O
PO
0 ta 4Ja4J 0 0U 0 Ü0 U XSh 04H 4JUa s, 00 •rH 0 Sh pW Sh 4H coÜ !>1rd 1—1a 0 0 ü0 0 Sh 0
c T3 rQ 00 4J 0 0 Bg 0 XJ 4J4J 0 Sh 00 0 Sho rH 0) > 0Pu 0 5:1> 0 4H 00 U O 0u 0 00 4-1 a
0 Sh 0 0M H >
(Ug'rdÎH3
•H
g
H
XIu-H
4JÜmO
■H4H■H
g,■Hm
4JOa
Q)m
-HeQ)Æ4JO
W I—IOU4Jg0
mp5Ulk
>
4_)m(U4J14JtJQ)U
-Hfd
0
Sho4HrHOO
OAaA
rHO
O
S'
HO
OAaALOO
O

oXJ
p
0ucxa
4-1ouQ)g
§00
<
CN00
0 I—I
>■HmrHu
004-)i4Jma■H
a 0tn0S=!
w, O tj) m!=1■H4J0U•H
-H
Os0Epiu
ShO4J0Sh0&Sh
>•H0U0Sh
0XU4J
Sh0
•HSh0
IU
0Ü0■H4J0rH
1a
0Sh04JU0Sh4HI
§1Sh4H
2pi4JU0Sh
TJ 4H p;^ rH 0
g 4-4 Sh
>
04J0-HB"HShU0-H•d
I0
0 0 I—I 00Sh004J
1Shpi00e
00[>
IS •Ph o
o CM00 LO1> O)•pH o O
04 LO 00CM CT\ LO00 ro ro|2S •PH o O O
l> 04 LDCO ro00 LD 04 CMCOP o O O O
CM CM CM4J CM O O O roSh o O o O o0 LO • • • oU o o oO O V V V o
u04J CM d lSh LO O in l> O)o H O ro LO LO LO 4Hu l> o O H CM 00 Od O V o o O 0 u
n<
4HCM 0ro in O LO rH 000 LO ro O i> ro 0) 0 PISh 00 o O) LD CM ro 04J O 0d o o V o O O 0 -H
Sh0aeCM 0CM m O H LT) 04 LO u4J 00 ro ro O rH O) 0o rH rH • CM ro 00 0) Sh4J • • o • * • . 0d o O O V O o o 0 4H00pja0>u !
p a< 0Sh0
4J 0X Sh 4J 00 O Sh pjSh U O 1—14J 0 u CO J2J IS 0d d d p pH pH pH >
' "f-
S
I
*

î>iI— I I—1 0 0 4J 0
4J0
-S
S)0d0 0
•H Sh
1a oXH 0 4-» Üotn -H d -d
■H 0
I!-H Ss i4HS gi i
ShSh ^
s i< . 4 H
m
a0
§_ o4J x:] 0 0
1ShO0
■Htj04-J1024-4H0
iÜt-H0Ü
0 0 H 00Sh004J
1Sh000i>
-HCfl0rHÜg
CO
>
gffl
g
g4-1gÜa
4JShOu0d
0Sh4-4d
4-4O4-4d
ro00
roLOLOO
00roi>
rHLDl>
LOO)l>
inl>LO
§
moo
HO o
CM CMCM 00 00LO O LOO O O
CM l> 00LO rH O HO O o 00O O o O
LO [> roCM 00 LO CT)O H CM 00 OO O O o o
00 CM CM ShCT) CT) ro 00 CM d* LO OLO ro o CM LO rH 4HO O o O O O O u5
4HCM 000 H CT) o CM i> LO1> 00 o M* l> 00 CM dLO CM LO O O o O oo 0O O O V O o o O •rHSh0aBoro rH rH ro 00 00 CT) CM üCT) O LO CM LO lO 00 "vfLO CM 00 LO O CM ro LO rH Sh* • • • « • • • • Oo O O O O O o O O 4H
Sh4J
4-4ÎHOÜ0
4JShOU
d d d g HPh Ph W
CO>
US
00dr—I
>Ia0Sh000drH>
m
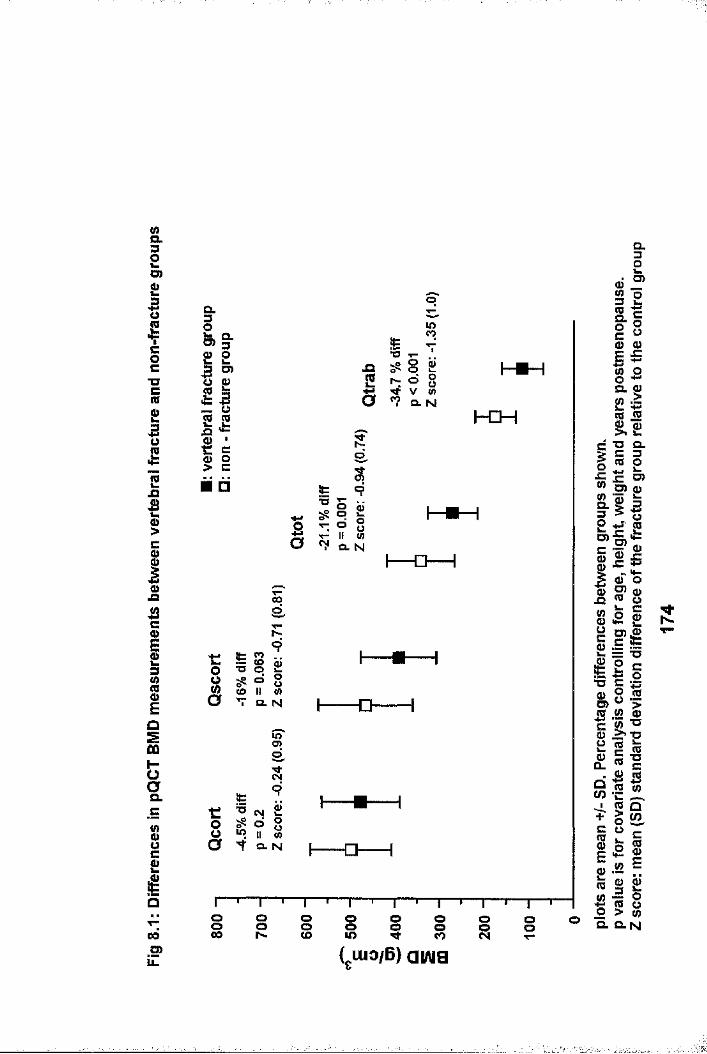
&32o>01coc"Oc(00O(0
Ia§cIaC
IiEasÛQ
ia.8Ië00.2*LL
Q.m §•2 23 O)III S'ë C § g
.afc
s??lOCO
8 2 o 8V <n o. N h€H
□s
ëT3
CNI8 go 8 II (/) CL N I □--1
r
Ô
s
1 1 1(O
Q. N
ino
-Q
0 ^ 6 8 U «> II «"Ÿ a. N5 -a-
I § §CO ooU)o ooCO
oo
ISL3D)I0jaI0
a.
,1Ig> (1)
E5g sQ. g 2#II
XS Q. C 3 0 p JC o)ÎIîlws **—0 O
S’ S
0IIdeo
20i2oQ.
I*IIi|I fl ll|0) E
l lg 8Q.N
( luo/B) aiAig
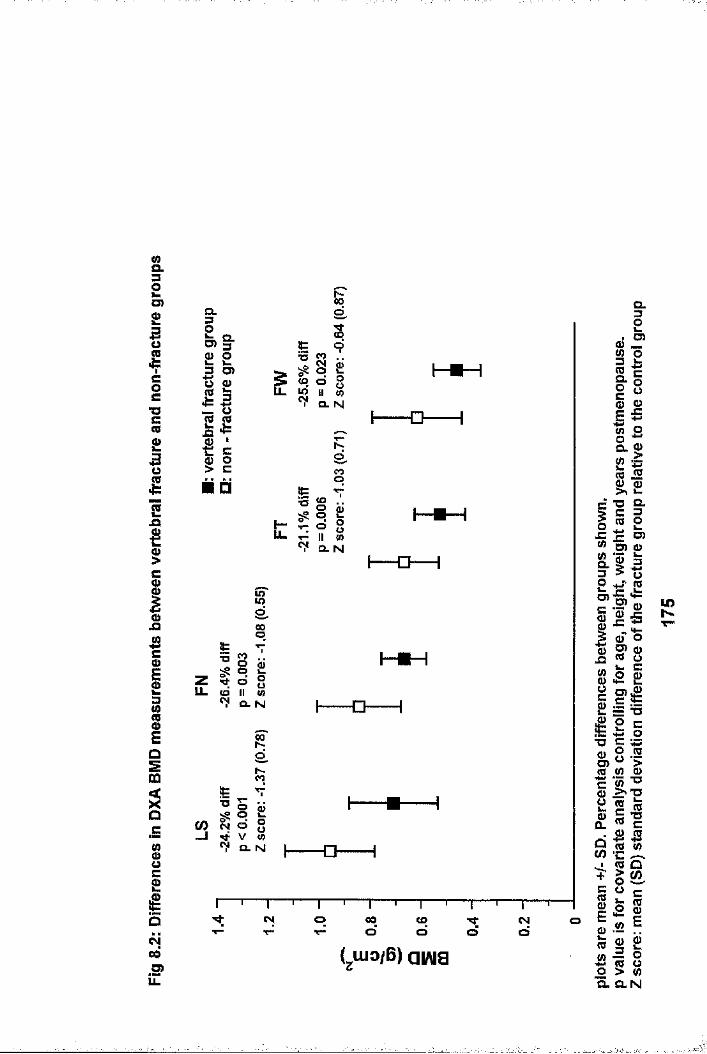
wa.32D)001Coc■oc00uffi
2Ii0JD42cIiEos0Û
o
81£(y003)
CL
D> §■IIÜ 0III i> c□
<o oR "CL N
6COo
IIIT- II Ü) ^ Cl. N
O
zu. d 8II w CL N o
CO
0
Î3
o° o
, V « ^ CL N
CM O
-o-
CM O 00d
COo o CMd
830a.081CL
2I
Q.I£c80
s z
l iD)
O)
0
i|I III1 18.8liP 0
C 0
g1Cl323)0
uCO
0 3Os0J=
8CIc0 %3 01T3
28C1Qeic2 E2o%
lO
a. O.N
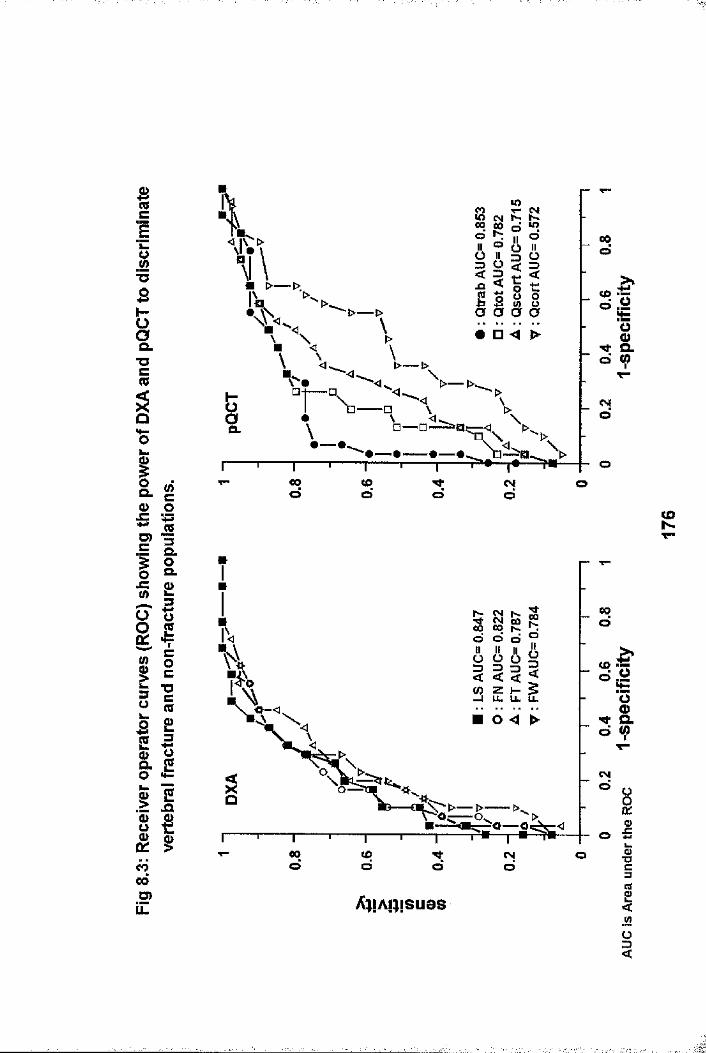
Ic
*T3S§a.■oc(Q
O0
1a. (/) c (D OD)C
«3I I0)
g #
ilililg ^g gëîoôO)ÎZ
Èo
r \ _ oD. n \
00 otooT“ o
§ 8d d
LL IL LL
00 to CM OT~
AwAiMSuos
00o
(A umm
Nd
CDN
00d
s |s |
CV|
OO •B0?31«ü<

&32O)£IIcg■ocCB0>
Cg(UJQ42ciiEDSm
I
00.5>LL
| lOï O
IIÏ É ■ □
a
t:
ê
!ÈT3
00KO8 £ o 8V ü> Q. N
t
I
CM
Ë9
8 2V 8 Q. N
•a
coKO
Xi
ISis.S9S
8Q. N
Ë■o
8
CD00 O (d ti 8 (A
Q. N I □ 1
I— O— I
I— □— I
I-- O — —I
oo00 I i i i ocoOO
(gU io/B ) a w a
I(0
ID)I8îië&45
Idc/)
iI42oCL
Q .
2D>
C8(D
i lIII O)IIE g.5 <D
CD O8*8 k c £ 2IIII8|1 1ü 45 « (0
i li|w Eï l(ü o > «O.N
NN
ï
,r..

8.32O)2
Icoc■oc(0Q>OCO
Cg
IIO) û)
IIk. IoJZ c ll<o o
tfi Va. N
1•>£i
I □ ----1
ë42ci3iIQ.5
g£iQ«>00D)
LL
t
§(d
S
ss
a. N(O00ds
# 8 2 g : 8T Q. N
CMro
[ [] 1
I □---1
00d1— '— rCD Tfd d
_TCMd
( luo/B) aiAia
o
(0a 45(0 (A
(A
00N
■ ...
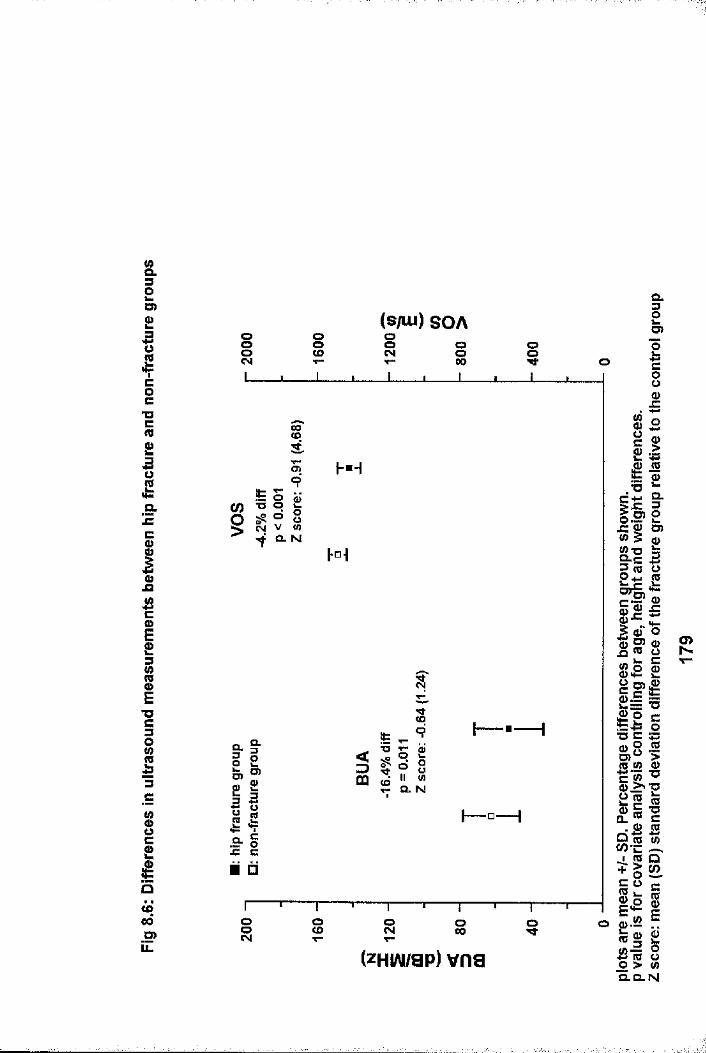
(AOL32D)
ICO
•ocCO23oCO
gë3c
IIET3cgI8Ë££«Î00■SPLL
(s/Lu) SOAI OoCM s00 Is
9
CO§ &« h"Ÿ Q. N|-°i
Ui0
D)0
3
“ illIIx: ci □
oCD 8 8 O
(zHiAimp) vns
Q.IÎc80
li■° a3If.Ill111f iwp 2
illi|iIfi" (0(As l - -
illSI IO > (A O.Q.N
m
•f

Hd p 00d(Od
oCNjdQ.oa. 00
d(Dd o (N
doT"
00O)00o
CL o3 < < (£>
dO ) (Q
5 a a CLo0 4 > CN
dQ. o
cod
co o CMd
o
00d
tS "U cod
LL LL.d x:CMd ■o
oOOd
oO)
■ -i _____

CHAPTER 9
CHANGES IN RADIAL pQCT HMD MEASUREMENTS IN RESPONSE TO DRUG THERAPY: COMPARISON WITH MEASUREMENTS AT OTHER SKELETAL SITES.
9.1 IntroductionOne of the most important functions identified for bone densitometry is monitoring of drug therapy {1.145,1.146,1.153,1.154,9.1). This is as equally applicable to drugs which have a beneficial effect upon bone mass and are used in the treatment of osteoporosis, as it is to those which have an adverse effect upon bone mass, such as corticosteroids. Both hormone replacement therapy (HRT) and cyclical etidronate with calcium are used in the treatment of osteoporosis. HRT has been shown to reduce fracture rates at the hip, spine and radius in postmenopausal women (1.198,1.199,9.2-9.5), increase axial (9.6-9.13) and maintain radial (9.8,9.11,9.14) HMD. Cyclical etidronate and calcium increase spinal BMD and is of proven value in the treatment of established postmenopausal osteoporotic vertebral fracture by reducing vertebral fracture rates (9.15,9.16,9.17) and increasing spinal BMD (9.7,9.13,9.15,9.16,9.17). The desired interval between repeat measurements for monitoring response is largely determined by the precision of the scanner and the expected rate and magnitude of change. As the precision of pQCT is comparable to DXA lumbar spine and femoral trochanter measurements, and better than femoral neck and Ward's area measurements (see chapters 2 and 3) , the response to these treatments may be better monitored at the radius by following changes in trabecular BMD. This is especially attractive as both HRT and etidronate preferentially affect trabecular bone which has an increased metabolic rate. As DXA measures a composite of trabecular and cortical bone unlike pQCT which allows direct quantification of trabecular BMD, DXA may be less sensitive to
181

smaller changes in trabecular bone than pQCT. Whilst spinal QCT is also a technique which allows measurement of trabecular bone independently, its use, especially when repeat measures are necessary, is limited by radiation considerations (see chapter 1) . The use of pQCT for monitoring purposes would however be dependent upon drug induced change at the radius being of a similar timing and magnitude to that at other skeletal sites. At present, BMD assessment every 2 years is recommended(1.145) . A hypothesis can be raised pQCT will allow earlier detection of responders, and equally importantly, nonresponders to HRT and etidronate. The work in this chapter addresses this hypothesis, the issue of timing of bone mass changes at different skeletal sites in response to HRT and etidronate during the first year of treatment, and whether changes in radial trabecular BMD measured by pQCT can predict axial changes measured by DXA.
9.2 Study Populations and Bone Mass Measurements11 postmenopausal women (defined as no menses for at least 2 years) were treated by their general practitioners with HRT preparations (Prempak-C, n=4 ; Livial and Estracombi n=2 ; Trisequens, Estraderm and Cycloprognova each n-1) for the prevention of osteoporosis (HRT Gp) . 6 of these women wereidentified from the ongoing osteoporosis screening programme which has been described previously (Chapter 5: 5.2-point 2). They either had lumbar spine or femoral neck BMD in the lowest quartile of age matched controls and were targeted for intervention with HRT assuming no contra-indications, a cut-off point which has been proposed previously (1.88). The remaining women were referred directly by their general practitioner's for a DXA scan and were also found to have low bone mass for which HRT was recommended. All women were either osteopenic (T- score -1; n= 1) or osteoporotic (T-score -2.5; n= 10) as defined by the WHO (6.4), at either the femoral neck or lumbar
182

spine. None of these women had suffered an osteoporotic fracture and none had vertebral fractures on lateral thoracolumbar spine x-ray.
10 older postmenopausal women were referred by their GP ' s to a specialised bone clinic because of symptomatic osteoporotic vertebral fractures for which cyclical etidronate and calcium supplements was prescribed (ETD gp) . All women were osteoporotic (T-scores -2.5 at either lumbar spine or femoral neck) with atraumatic vertebral osteoporotic fractures.
None of the women in either group had other conditions or were taking other medications which could affect bone mass or metabolism. Baseline pQCT and DXA of hip and spine measurements were made before treatment was started, and then 4, 8 and 12 months thereafter. All measurements were done on the same day except the baseline visit, where DXA preceded pQCT by no more than 8 weeks in some women - DXA was repeated if a longer delay was encountered. For the follow-up pQCT measurements, the "trending" function, which is discussed in chapter 3, was utilised. The cut-off value used for the difference in voxel numbers between baseline and follow-up scans was set at 30, thus ensuring accurate re-positioning of the scanner in follow- up scans and minimising the influence of change in scan site on repeat pQCT BMD measurements.
The co-efficients of variation (CV) for pQCT (see chapter 3) are generally poorer in postmenopausal women with vertebral osteoporotic fractures compared to young normal women (Qtot: 1.73% vs 1.24%, Qtrab: 2.96% vs 1.33%, Qscort: 1.57% vs 1.58%, Qcort: 5.18% vs 1.88%). The precision of axial DXA measurements was determined in 6 postmenopausal women [median (range) age: 68 (60 -71) years, and years postmenopause; 21 (13 - 25) years] with vertebral fractures on lateral thoracolumbar x-ray [median
183
(range) number of fractures; 2.5 (1-3)], by performing repeat hip and spine measurements on the same day with repositioning of the subject between scans. These women were different to those studied to determine the precision of pQCT in the a vertebral fracture group, and those studied in the etidronate treatment group. The CV's in the vertebral fracture group compared to young normals were; LS ; 2.32% vs 0.9%, FN ; 1.3% vs 2.8%, FT; 1.42% vs 1.3%, FW; 2.16% vs 4.8%. Fractured vertebral bodies within the DXA lumbar spine region of interest (L2-L4) were excluded from all relevant analyses.
9.3 Statistical AnalysesResults for continuous variables are expressed as median with ranges. Baseline lumbar spine and femoral neck BMD results are also expressed as T-scores and Z-scores (number of standard deviations above or below the mean relative to young, and age matched normal controls respectively). Between group comparison at baseline are performed using the Mann-Whitney U test. Within group percentage changes in bone mass measurements from baseline are compared using the Wilcoxon matched pairs test and one factor repeat measurement analysis. The relationships between annual rates of changes in BMD at different sites were examined using linear regression and correlation co-efficients.
9.4 ResultsBaseline clinical and bone mass details of both groups are shown in Table 9.1. Although 4 women had undergone hysterectomy (hyst) previously [HRT gp; n=l(age 63,hyst 20 yrs previously)], [ETD gp : n=l(age 71,hyst 16 yrs previously), n=2 (aged 60 & 73, hyst 30 yrs previously)], none had FSH, LH or oestradiol levels done to confirm their assumed postmenopausal status. The HRT group were younger and fewer years postmenopausal than the ETD group. Consequently all baseline BMD measurements were greater
184

in the HRT group with the exception of LS.
There were no significant changes in median height or weight values during the 1 year follow-up period in either HRT or ETD groups (see table 9.2). Percentage BMD changes for the pQCT radial and DXA hip and spine BMD measurements are shown in tables 9.3 and 9.4 respectively, and depicted in figures 9.1 and 9.2. There were no overall significant changes in any pQCT BMD measurements for either group. There was however a trend towards a fall in BMD at month 8 in the HRT group, which reached significance for Qtot and Qscort, with some recovery by month 12. Significant overall increase was found at LS in both groups, which was statistically significant within 4 months, and further increased after 12 months of treatment. Although there was a trend for all hip BMD measurements to increase, overall significance was only achieved for FN in the HRT group. The results remained unchanged after correction for changes in height and weight. There were no significant relationships between the percentage changes in any of the pQCT BMD measurements and DXA hip or spine BMD changes with either treatment. Comparisons of the percentage changes in pQCT measurements with LS BMD after 12 months of treatment with HRT (r = 0.19, -0.35, 0.26 and 0.19 for Qtot, Qtrab, Qscort andQcort respectively; p = NS for all) and etidronate (r = 0.14, 0.35, 0.01 and -0.01 for Qtot, Qtrab, Qscort and Qcortrespectively; p = NS for all) were typical of comparisons.
9.5 DiscussionThese results shows that changes in BMD induced by both HRT and etidronate during one year of treatment varies between skeletal sites. The most significant and greatest changes occurred at the lumbar spine for both treatments, although there was considerable inter-individual variation. Also, for several
185
îÎf
.women in either group, lumbar spine BMD did not increase during the first year of treatment. Median increases of +6.6% and + 5.3% after one year of treatment with HRT (9.6,9.9,9.10,9.11,9.18) and etidronate (9.15,9.16)respectively are in keeping with previous work. The work presented here suggests that statistically significant changes were detectable at the lumbar spine after only 4 months of treatment with either HRT or etidronate. Present recommendations are that BMD measurements should not be repeated until a patient has been on therapy for 1-2 years(1.145) . This is based upon a change 2.8 times that of the coefficient of variation (CV) being necessary before it can be regarded as real and not due to measurement error (1.88,9.1).The CV for DXA lumbar spine measurements in our centre is 0.9% in young healthy women, but 2.32% in older osteoporotic women.The median change in lumbar spine BMD after 4 months of treatment with HRT was +3.3% which could only be accepted as significant if the precision value for young normal women was applied (ie CV = 0.9% with significant change greater than + 2.52%) . If this figure was applied, then a repeat lumbar spine DXA scan as early as 4 months may indicate response to therapy. However, although the HRT group did not suffer from vertebral fractures, and major spondylosis was not a problem, it is unlikely that the precision value would be as low as 0.9%, due :to the lower BMD values which would result in a higher CV. If the higher CV figure was applied, then a follow up scan after 1 year would be the earliest possible to detect significant change. In the etidronate group, the higher CV for DXA lumbar spine scans would have to be applied (CV = 2.32%, withsignificant change greater than ± 6.4%). Consequently, a repeat scan no earlier than 1 year would be indicated. This implies that the optimum length of time between scans when assessing the response to therapy is dependent upon both the age of the patient (which can affect the precision of the measurement),
186
$
and the expected magnitude and timing of the response to treatment.
It is surprising that the baseline lumbar spine BMD of the ETD group was greater than that of our HRT group bearing in mind they were older and more years postmenopausal. This could be due to age related spinal osteoarthrosis (1.171-1.177) and aortic calcification (1.168,1.169,1.170) elevating spinal BMD results in the ETD group. This should not influence the rate of response at the lumbar spine, although a state of low bone turnover has recently been observed in patients with lumbar spondylosis and osteoarthritis (1.174,1.178,1.179,9.19). Also, we cannot exclude a spurious rise in BMD from further fractures occurring within the area of interest (L2-4) during the first year of treatment, as lumbar spine X-rays were not repeated.This was an attempt to minimise radiation exposure, particularly as the purpose of this work was not to examine the effect of treatment upon fracture rates. I:::Although there was a trend towards an increase in all hip measurements for both groups, this only achieved overall significance for femoral neck BMD in the HRT group. Similar changes in proximal femur BMD have been documented previously with HRT (9.6,9.10,9.11,9.18) and etidronate (9.20,9.21), and tend to be lower than those found at the lumbar spine, presumably due to a smaller proportion of trabecular bone at the former site. Bearing in mind the poorer precision of DXA hip measurements, they would be of less value than spinal measurements for detecting early response to HRT and etidronate. If however, certain situations prevailed, such as
,ïheavy overlying aortic calcification, severe spondylosis or multiple vertebral fractures within the spinal region of interest, then hip measurements may be the better choice for monitoring response, with an appropriately longer interval
187
Î

ibetween scans.
Previous work has shown that radial BMD, as measured by single photon absorptiometry (SPA) is maintained but not increased significantly with HRT (9.8,9.11,9.14) and etidronate (9.7,9.15). Theoretically, by quantifying trabecular BMD independently, pQCT should be more sensitive than SPA in detecting change at appendicular sites, and may mirror or even antedate axial changes measured by DXA. Although radial BMD was maintained, there was no significant increase, even in trabecular BMD in either treatment group. This, and the fact that there were no meaningful relationships between percentage changes at the radius and spine or hip, suggests that the response to treatment at the radius, even within the trabecular component, is different from that at the lumbar spine. It is possible that trabecular BMD may change after more than 1 year of treatment, but previous studies using SPA have shown no significant increase in radial BMD after treatment with HRT for 2 years (9.22), and etidronate for 3 years (9.15).
Early demonstration of response to treatment is important because it may help improve patient compliance(1.201,1.202,9.1), and allow early detection of non-responders which have been found previously with both etidronate (9.20,9.23) and HRT (9.10,9.18,9.22). For such non-responders, compliance with therapy could be checked, the importance of treatment emphasised, or the treatment changed if necessary. Also, proof of response to therapy is important as there is nowsome evidence that the anti-fracture efficacy of treatment isdetermined by both a reduction in bone turnover and an increase in BMD (9.24) . The work presented in this thesis suggests that a repeat measurement after one year would evaluate response to treatment with HRT and etidronate in the majority of cases. When changes smaller than 2. 8x the CV are recorded, such
188

changes could also be interpreted as showing an improvement if there was a consistent upward trend, although this would have to be judged in the context of a given individuals treatment(9.1) . In clinical practice, the interval between follow up scans is likely to be determined largely by individual clinical situations and resources. In most instances, due to the differential effect of HRT and etidronate on axial and appendicular bone, response to treatment would be best determined by a spinal BMD measurement.
189
Î
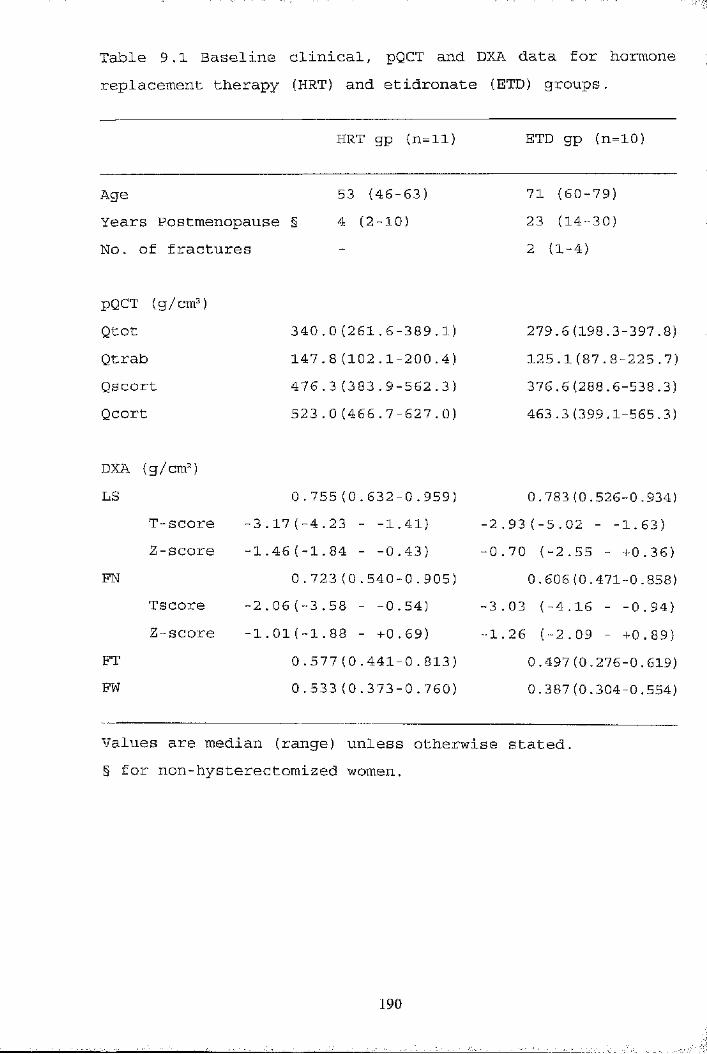
Table 9.1 Baseline clinical, pQCT and DXA data for hormone replacement therapy (HRT) and etidronate (ETD) groups.
HRT gp (n=ll) ETD gp (n=10)
Age 53 (46-63) 71 (60-79)Years Postmenopause § 4 (2-10) 23 (14-30)No. of fractures - 2 (1-4)
pQCT (g/cm )Qtot 340.0 (261.6-389.1) 279.6(198.3-397.8)Qtrab 147.8 (102.1-200.4) 125.1(87.8-225.7)Qscort 476.3 (383.9-562.3) 376.6(288.6-538.3)Qcort 523.0 (466.7-627.0) 463.3(399.1-565.3)
DXA (g/cm )LS 0.755(0.632-0.959) 0.783(0.526-0.934)
T-score 3.17(-4.23 - -1.41) -2.93(-5.02 - -1.63)2-score 1.46(-1.84 - -0.43) -0.70 (-2.55 - +0.36)
FN 0.723(0.540-0.905) 0.606(0.471-0.858)Tscore 2.06(-3.58 - -0.54) -3.03 (-4.16 - -0.94)2-score 1.01(-1.88 - +0.69) -1.26 (-2.09 - +0.89)
FT 0.577(0.441-0.813) 0.497 (0.276-0.619)FW 0.533 (0.373-0.760) 0.387(0.304-0.554)
•i
IÎ*
aT.Î"■'!
IValues are median (range) unless otherwise stated.§ for non-hysterectomized women.
190
1
yIt'if/S:
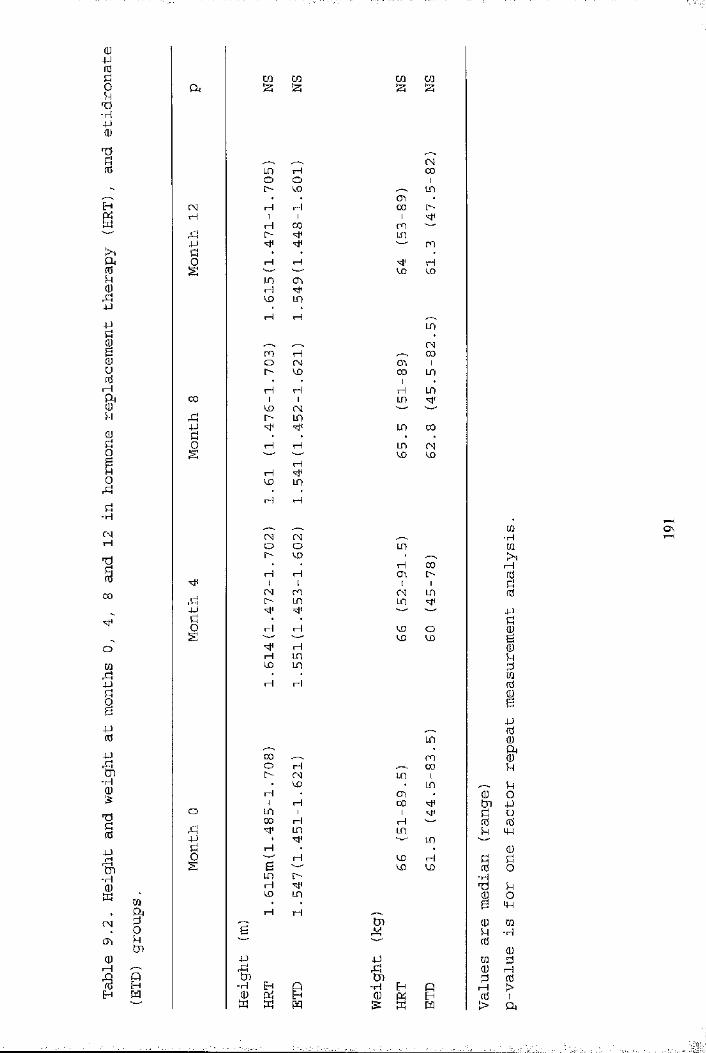
Q)4Jn3§P•H4J0)
1
ID(UnJJ4JIUnJ
H
&U
Üo0rbÜ-HCNrH100
m4Jg4Jrd4J
-H
%
1I-H
SCM(T,(UI—IH
CûIUtJi
M
C/D en CD ena l2i izi J2J
CMm H 00o O 1o CD LOOD
CM H H 00H 1 1 1
iH 00 CMn l> "sM LCD4J CMd • • •O rH rH rHS w CD CDen <TiHvo m
rH HLOCM
CM rH 00O CM CDD 1l> CD 00 LOrH H rH LO
00 1 1 LCD M*VO CMrî l> LCD4J ■= LCD 00k • • . .0 H H LCD CMs CD CD
rHrHCD LCDH rH
CM CMO O LCD[> CD •• • rH COrH H OD l>1 1 t 1(M CM CM LO[> LT) LT)4J 'vt*
Ü t •0 rH rH CD Os CD CD
rHrH LCDCO LCDrH H
LO00 CMO r-f 00I> CM LCD 1• CD • LOrH OD1 H 00 Mio LO 1 1 Mi00 H rHrî LCD LO4J LOk H
0 H CD rHs B CD CDLTD !>
HCO LCDrH rH
tnB y
4J 4Jrd gtjl tJD-H H Q ■H Eh Peu cti Eh eu pcS PW w M S: ffi m
(UIg
-HPB
Q)5+fdCûeu0rH>
CÛ■HCQ>,rHrd54J!bmfdifd(U
65+kO4-)U(dM-t(U8k0+4m
■H
(UprH>1a
o\
I:
1■ |
I.
;
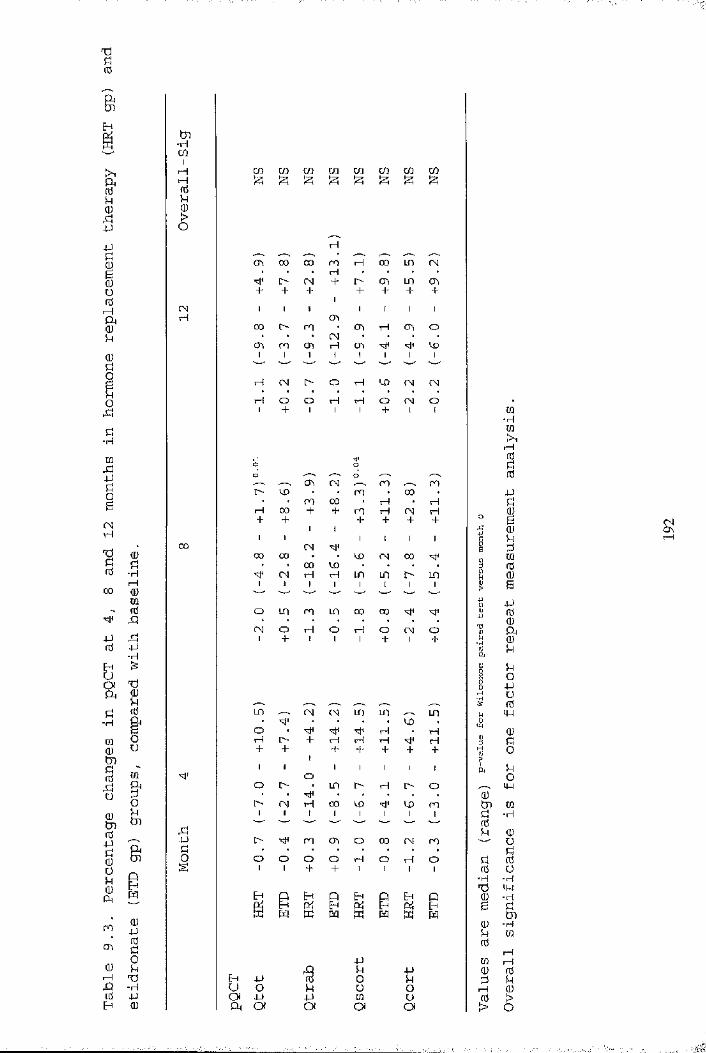
1fC&II4J4J
IUnjI—I!(UoorCln•Hra4J01CNrH
1 II 100 OJ
m" fd ^ 434Jfti
ro
a\
0)
-HCQ0ÎJ)
SO<Dtnfd4-)Ü0ÜU0CM
CQtutn
I0 4J fddsiH -X3
rQ 'H4J0
tn■HCOiH CO CO CO CO CO CO CO COH s s s s iz; s :zi %0d0>o
rH00 00 ro "h 00 in CN• • • rH • • • •o CN + CTi in CA
+ + + + + +CN 1 1 : 1 1 1 1rH o\
CO i> m • CO rH ch O• • • CN • ‘ • •
Ch1
ro1
CTi1
rH1
CTi1 1 1
CD1
H CN l> O rH CD CN CNH o O rH rH O CN O1 + 1 1 1 + 1 1
(T\ CN ro roi> CD • • ro • CO •
CO 00 rH rHrH 00 + + ro H CN rH+ +
I I+ + + +
001 1
CN1 1 1 1
00 00 CD CN CO00 VD
1CNi
H1
rH1
in1 in
1l>1
in1
o in ro in 00 00CN o H o rH o CN o1 + 1 1 1 + 1 +
LO —V CN CN in in .-- inCO
O H HrH i> + rH rH rH HH- +
1H- H- + + +
1 1O
1 t 1 1 IO i> * in l> rH !> o• < ■ • • • •l>1 CN1 H
1001
CD1 1
CD1 ro
1rd4_)r* 1> ro C3 O 00 CN roo O O O o H o rH oS 1 1 + + 1 1 1 1
p p p 5-1 PEh Cti Eh pti Eh 04 EhK m w m w m M M
4JrQ d ■PEh 4J 0 O d
U O d U oOI -U 4J 0 ua a a 04 04
CQ' r H
CQ>1rH0
4J
: In U 0 0 n 0 3 0t iIII sÏ %sI §h, M
O^ M-J 0DH CQ d -H 0U
d0■H
B
0d0CQ0drH>
00sÜ•HMH-H&•HCQr-H I—I 0 d1

d-H
0fipiCNH
■§000
P00PIUd00BPIA“Hrd
0d
■HI—I 0 0 0 43rdP■H
730U0fü0
gUm
giI I0d
-HCM0
d'H
00t71
0P0§
■HP0TJd0
d Oi0 Cndu Fh040 KCo —'0 dp pd Q* d0 0 oo d sd 00 dP p
pS
o \ 1u0 0iH rH43 CM0 0H d
Cn•HcoI
0dICNH
00
p
HOO ro CD
• P CNO O O
co CO co co coV o O s iz; |24 S
IMoo o o o o
ïH 00 y—s. LO CN 00 CNC" CD
m CN * • en LO oH H 1> O H rH CN ■N'+ + + + + + H- +
CN ro OO LO 00 H
ro LO ro 00 O rH 001 t 1 t 1 + 1 1
CD CN tH H ro ro 00 'cP
CD LO ro CN CN LO ro LO+ + + + + H- + +
O O .—. en ro--"-'s. -"—s. o ro00 en 00 • • CN O
ro ro CN LOco 00 C-- CD H ro + ++ + + + + +
1 11 1 1 1 1 1
H LO00 CN o rH o
• • • • • • LOCN1
CN1
ro1 1
CD1
001
rH1
rH1
ro O CN o CN CN H 00
LO iH rH rH ro l>+ + + + + + + +
roCN rH [> H
00 CD mO ro CN CN CN LO
m H LO rH H + CN+ + + + +
1+ +
1 1 i 1 1i>
1 1
00 lO H rH OO • en l>
1Ht 1
in1 1
rH1
[>1
CD1
ro 00 CD CD CN ro en
ro ro iH O CN LO+ + + 1 + + H- +
E-< P Eh P 54 P 54 P04 Eh 04 Eh 04 54 P4 Ehd m M M ffi M K H
co IZi 5-1 !SP k k k
0S’0d
d0■H7300d000drH0>
0■H0rH
rHIPIdd00B
P00»d
dOPu0p
0dodo
p
0-H
0u5U
-HIW"H6 ■H 0
I—I 0 dI
S?
'î
i
■l'il«
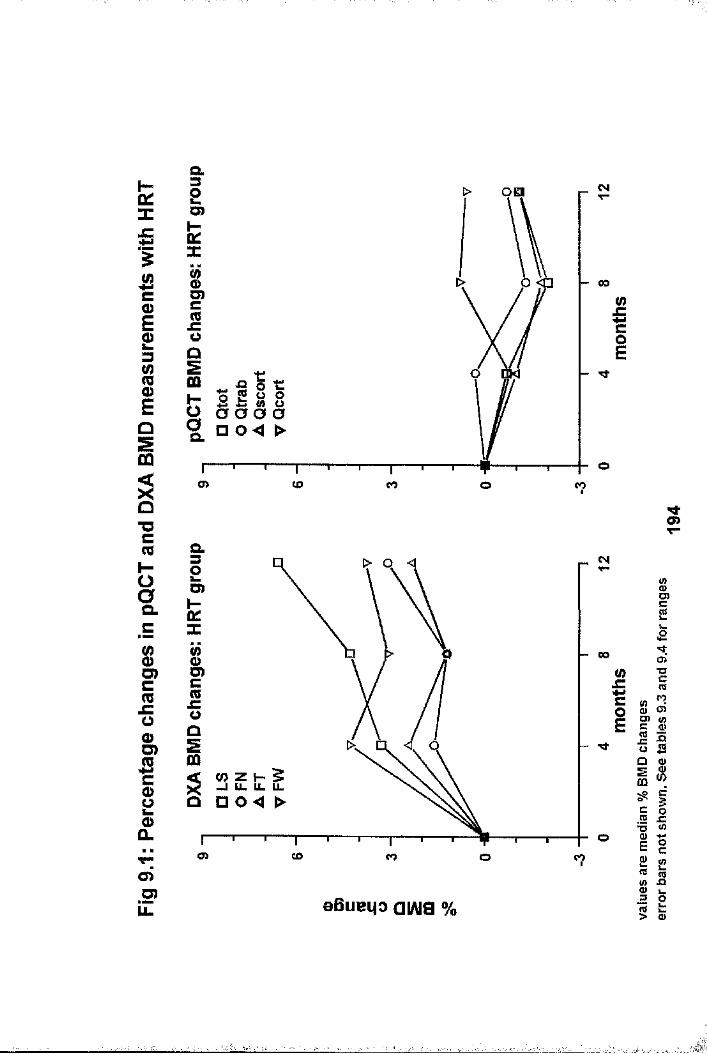
a.lËX
Ic0)I3iEoSm
"Oc
HO0Q.c
1Cm_comO)Sc0>2 o a.o >O )LL
oaD)
JO
o 5 5 0 0% D 0 4 >
o> CO CO o CO
CM
00(0II
D)
G)
(/> 2 H 5 X -1 ll u. u.a n o < >
a > CO CO o
CM
CO(0IoE
S.c(C
o>TOc(98 Sg 8Iffl
aBueiio ai/ug %
c12 _ cs wV) JQI I
X2B
II«ocCO
'H.
'I

îco0fnc0)13iEII"Ocmh-oa.c(/)oO)cmjCO0)D)SCsoû.CMO)O)
CL
Ui
00
oO) co co coo
wii
a
— 00
D).C
2X a o< >o
o> co co o co
aBueqo aiAia %
M>o>
CDCns
0£ci
M:o»"i(Q
S S g 8II ° 8
ic o« JC«
0»o c
« s<D X tII
I
--'À:
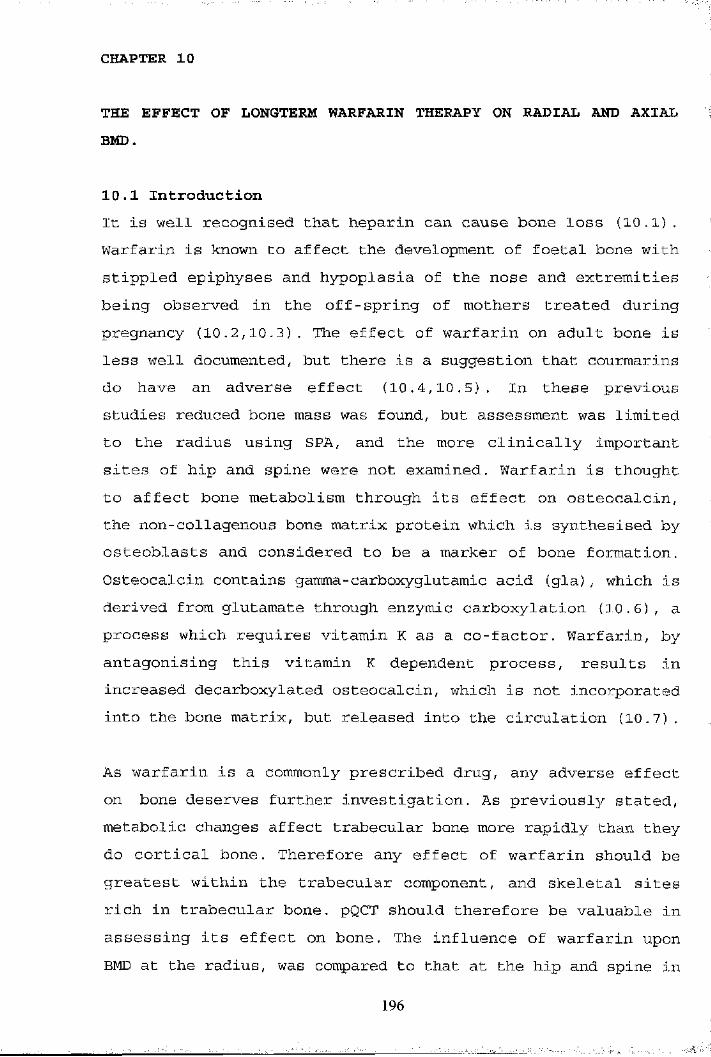
CHAPTER 10
THE EFFECT OF LONGTERM WARFARIN THERAPY ON RADIAL AND AXIAL BMD.
10.1 IntroductionIt is well recognised that heparin can cause bone loss (10.1) . Warfarin is known to affect the development of foetal bone with stippled epiphyses and hypoplasia of the nose and extremities being observed in the off-spring of mothers treated during pregnancy (10.2,10.3). The effect of warfarin on adult bone is less well documented, but there is a suggestion that courmarins do have an adverse effect (10.4,10.5). In these previous studies reduced bone mass was found, but assessment was limited to the radius using SPA, and the more clinically important sites of hip and spine were not examined. Warfarin is thought to affect bone metabolism through its effect on osteocalcin, the non-collagenous bone matrix protein which is synthesised by osteoblasts and considered to be a marker of bone formation. Osteocalcin contains gamma-carboxyglutamic acid (gla), which is derived from glutamate through enzymic carboxylation (10.6), a process which requires vitamin K as a co-factor. Warfarin, by antagonising this vitamin K dependent process, results in increased decarboxylated osteocalcin, which is not incorporated into the bone matrix, but released into the circulation (10.7) .
As warfarin is a commonly prescribed drug, any adverse effect on bone deserves further investigation. As previously stated, metabolic changes affect trabecular bone more rapidly than they do cortical bone. Therefore any effect of warfarin should be greatest within the trabecular component, and skeletal sites rich in trabecular bone. pQCT should therefore be valuable in assessing its effect on bone. The influence of warfarin upon BMD at the radius, was compared to that at the hip and spine in
196
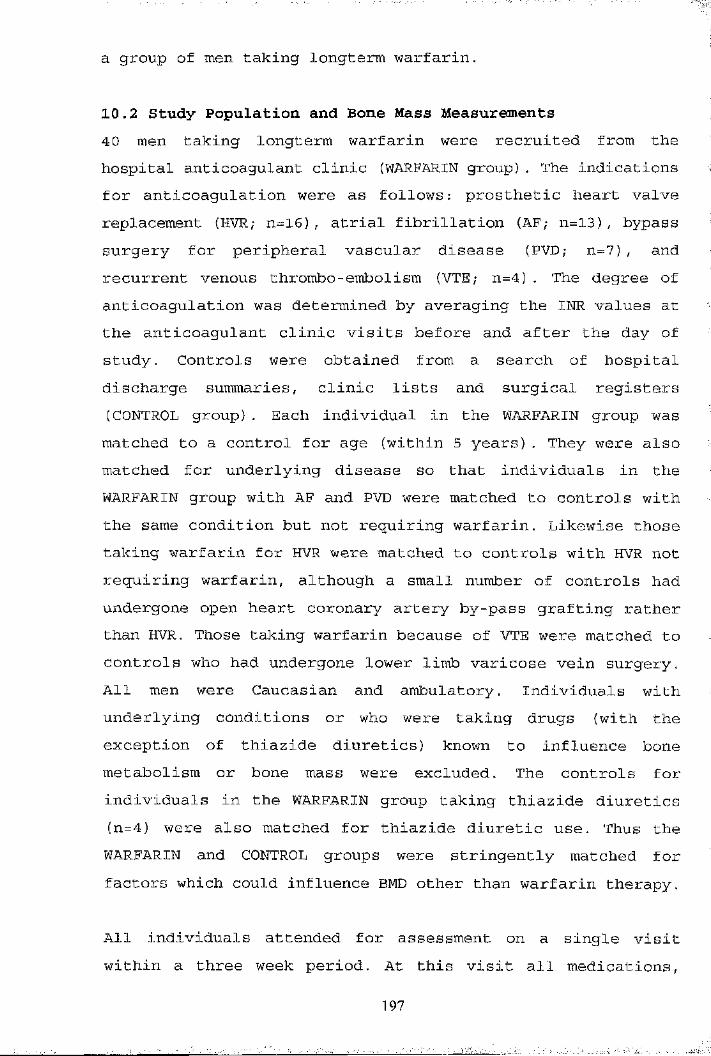
a group of men taking longterm warfarin.
10.2 Study Population and Bone Mass Measurements4 0 men taking longterm warfarin were recruited from the hospital anticoagulant clinic (WARFARIN group). The indications for anticoagulation were as follows: prosthetic heart valve replacement (HVR; n=16), atrial fibrillation (AF; n=13), bypass surgery for peripheral vascular disease (PVD; n=7), and recurrent venous thrombo-embolism (VTE; n=4) . The degree of anticoagulation was determined by averaging the INR values at the anticoagulant clinic visits before and after the day of study. Controls were obtained from a search of hospital discharge summaries, clinic lists and surgical registers (CONTROL group). Each individual in the WARFARIN group was matched to a control for age (within 5 years). They were also
f
matched for underlying disease so that individuals in the WARFARIN group with AF and PVD were matched to controls with the same condition but not requiring warfarin. Likewise those taking warfarin for HVR were matched to controls with HVR not requiring warfarin, although a small number of controls had undergone open heart coronary artery by-pass grafting rather than HVR. Those taking warfarin because of VTE were matched to controls who had undergone lower limb varicose vein surgery. All men were Caucasian and ambulatory. Individuals with underlying conditions or who were taking drugs (with theexception of thiazide diuretics) known to influence bone metabolism or bone mass were excluded. The controls for individuals in the WARFARIN group taking thiazide diuretics (n=4) were also matched for thiazide diuretic use. Thus the WARFARIN and CONTROL groups were stringently matched for factors which could influence BMD other than warfarin therapy.
IAll individuals attended for assessment on a single visit within a three week period. At this visit all medications,
197

including warfarin dose, were checked. Height, weight, smoking habit and alcohol consumption were recorded. A questionnaire about physical activity was completed which gave a composite score with a range of 5 (most active) to 20 (least active) . All men had BMD measurements at the radius by pQCT, and hip and spine by DXA.
10.3 Statistical AnalysesResults for continuous variables were expressed as the mean with standard deviation if the data were normally distributed, otherwise as the median with ranges. Between group comparison was performed using the unpaired t-test. Within group comparison of BMD data was performed using the Kruskal-Wallis test to examine the influence of indication for anticoagulation. In the WARFARIN group, the relationships between bone mass measurements and duration and degree of anticoagulation were examined using univariate regression analyses.
10.4 ResultsAnthropometric, lifestyle and warfarin related data are shown in table 10.1. As might be expected from the matching process, there were only slight, and insignificant differences between the groups for anthropometric and lifestyle variables. One man had received warfarin therapy for 4 months, the remainder for more than 12 months. LS (1.061 ± 0.182 vs 0.95 ± 0.13 9 g/cm^, p=0.003) and Qtrab (219.8 ± 37.1 vs 200 ±39.8 g/cm\ p=0.024) were significantly lower in the WARFARIN group. Whilst the remaining pQCT (Qtot: 398.7 ± 64.2 vs 376.7 ± 61.3 g/cm\Qscort: 533.3 ± 86.5 vs 509.8 ± 77.3 g/cm^, and Qcort; 529.6 ± 70 vs 527.6 ± 61.3 g/cm^) and DXA hip (FN: 0.817 ± 0.122 vs0.801 ± 0.142 g/cm\ FT: 0.794 ± 0.147 vs 0.748 ± 0.13 g/cm\ and FW 0.587 ± 0.106 vs 0.571 ± 0.139 g/cm ) were also lower in the WARFARIN group, the differences failed to reach statistical
198

significance. Figures 10.1 and 10.2 show the pQCT and DXA BMD data for both groups respectively. There were mean percentage differences of -10.4% and -9.0% for LS and Qtrab respectively. The percentage differences for all other measurements were lower: -5.5%, -4.4% and -0.4% for Qtot, Qscort and Qcortrespectively; and -2%, -5.8% and -2.9% for FN, FT and FWrespectively. Controlling for height, age and weight differences between groups did not significantly change the findings. There were no differences in BMD measurements within the subgroups of the WARFARIN group based upon indication for warfarinisation. Linear regression analyses of the WARFARIN group showed that there were no significant relationships between any of the BMD values and dose or duration of warfarin therapy, or with the degree of anticoagulation as indicated by the INR. These relationships with Qtrab and LS BMD are shown in figures 10.3 and 10.4 respectively. Unexpectedly, the slopes of the regression lines of duration of warfarin therapy versus LS and Qtrab BMD were both positive, but failed to reach statistical significance.
10.5 DiscussionThese results show that males treated with longterm warfarin have lower BMD at the radius, spine and hip than age matched male counterparts. The greatest difference was found at the lumbar spine, where trabecular bone accounts for about 65% of the vertebral body bone mass (1.20). Trabecular BMD at the radius was affected to a similar extent, whilst there was very little difference in radial cortical BMD. This suggests that trabecular bone is preferentially affected by warfarin, no doubt due to its increased metabolic rate compared to cortical bone. This is in keeping with the effects of other drugs which have an adverse effect upon bone such as corticosteroids(10.8), and those which have a beneficial effect, such as HRT and etidronate (see chapter 9) . Bearing in mind that the DXA
199
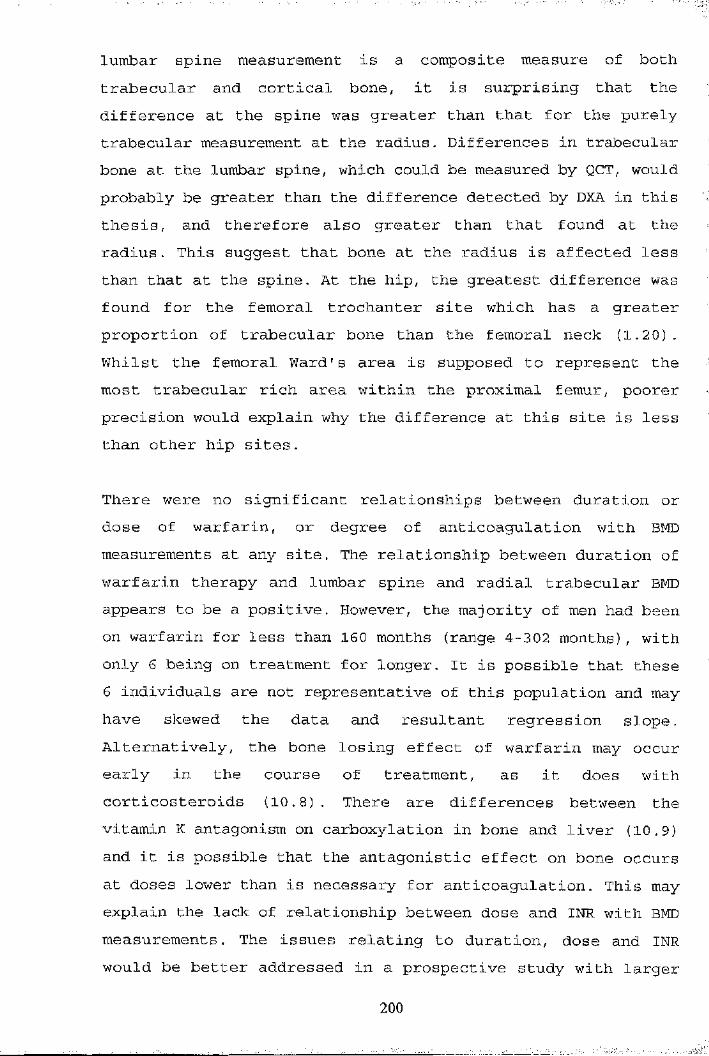
lumbar spine measurement is a composite measure of both trabecular and cortical bone, it is surprising that the difference at the spine was greater than that for the purely trabecular measurement at the radius. Differences in trabecular bone at the lumbar spine, which could be measured by QCT, would
200
probably be greater than the difference detected by DXA in this thesis, and therefore also greater than that found at the radius. This suggest that bone at the radius is affected less than that at the spine. At the hip, the greatest difference was found for the femoral trochanter site which has a greater proportion of trabecular bone than the femoral neck (1.20). Whilst the femoral Ward's area is supposed to represent the most trabecular rich area within the proximal femur, poorer precision would explain why the difference at this site is less than other hip sites.
I
Îs
There were no significant relationships between duration or dose of warfarin, or degree of anticoagulation with BMD measurements at any site. The relationship between duration of warfarin therapy and lumbar spine and radial trabecular BMD appears to be a positive. However, the majority of men had been on warfarin for less than 160 months (range 4-302 months), with only 6 being on treatment for longer. It is possible that these 6 individuals are not representative of this population and may have skewed the data and resultant regression slope. Alternatively, the bone losing effect of warfarin may occur early in the course of treatment, as it does with corticosteroids (10.8). There are differences between the vitamin K antagonism on carboxylation in bone and liver (10.9) and it is possible that the antagonistic effect on bone occurs at doses lower than is necessary for anticoagulation. This may
,explain the lack of relationship between dose and INR with BMD measurements. The issues relating to duration, dose and INR would be better addressed in a prospective study with larger

201
numbers of subjects.
Men were chosen for the study group because the matching of individuals in the warfarin group with controls (for age, thiazide diuretic use and underlying disease) was considered to be very important. This would have been much more difficult had women been studied, as it would have been necessary to match for menopausal status and duration since the menopause as well. Matching individuals for underlying condition proved to be imperfect, as is illustrated by men taking warfarin for venous thromboembolism being matched to controls who had undergone varicose vein surgery. Such difficulties are probably of minor importance in this work, and are inevitable in cross-sectional designs. fIThe clinical importance of these findings are unclear at the
'present time, as there is no fracture incidence data available to date. However, a 10% reduction in BMD is equivalent to about 10 years of age related bone loss (8.40), and around 50% of the difference between postmenopausal and premenopausal women(10.10). It is also comparable to a fall in BMD of almost ISD within the general population (10.11), which is associated with up to a three fold increase in fracture risk (6.10,10.12,10.13). In view of the increasing indications for anticoagulation, such as non-rheumatic atrial fibrillation and poor left ventricular function, perhaps the adverse effect on bone should also be considered when deciding to anticoagulate individuals, particularly those already at increased risk of osteoporosis, such as postmenopausal women.
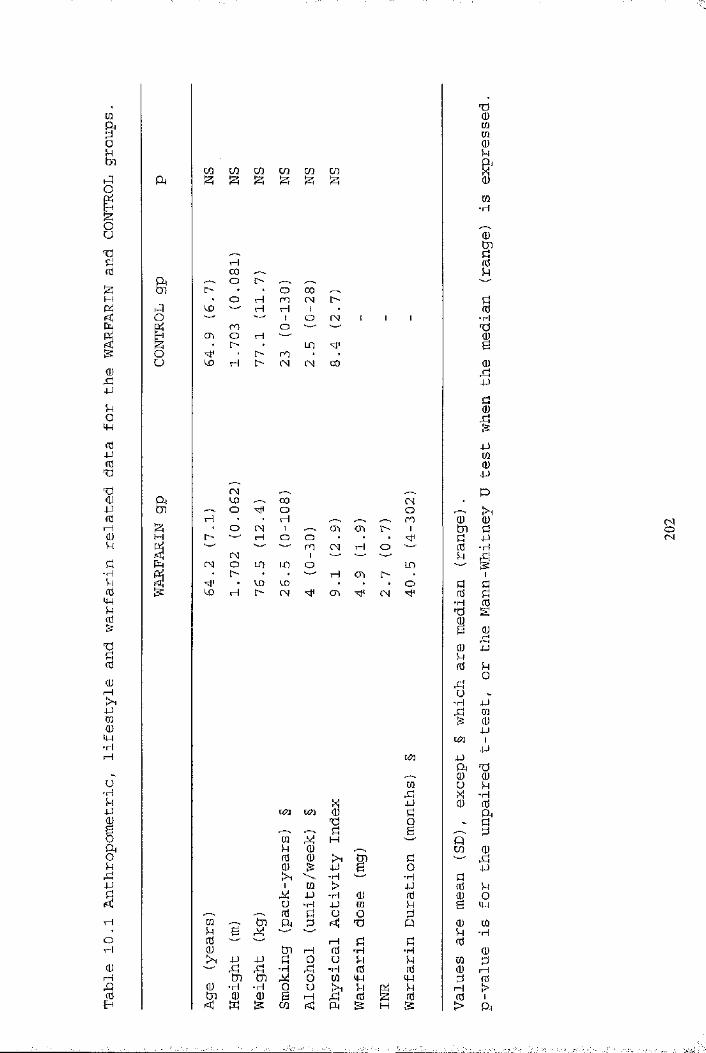
■
CQ3t7l
01u1
0)bjjkoM-inJ4Jfdb%4Jfdr4CÜkk-Hkfd4-Jkfd
I(UI—1[A4JCD0IW■k
u•HkjJI&kbjja0vH0H1
Qa
Io
gII
03 03 CO CD CQ c/3S 12; S 1 !zi S
CD
o\
CD
HCX)o
roOl>
t>rH
l>l>
OroHIom
COCNIoLDCN
l>CN
00
CNCD 03 CMO o O
M • • H s, ro‘ O CN 1 s. 03 03 t> 1l> H o o
r\] mI oq H O
(N o m in o ini> rH 03 l>• CD CD • . . oCD I—1 I> og 03 CM
un pf t tj0 0
m o kb X •rHP 0 0
un K/3 0b
k0 &
r--S k B V, kÜ1 H Qk 0 CD 00 0 Ik m k b0 5= P & o PIk •T*| -rH k1 m > P 0 k
P •rH 0 0 0 0U ■H P m k B p0 k O o k
m --"S to a 2 b P 0 mk B M k -rH0 1—1 k k 00 to H 0 -H ■H 0
p P k 0 Ü k k m kb b -H rk ■H 0 0 0 1—1tJi to o 03 p P k 0
0 •H ■rH 0 u Ik k Pi k f t >0 0 B rH g 0 S 0 0 1
IS CD < PH IS H is > f t
g-Hxii0k0bo"H
un
b003030kIm■H0g2Ü■HbB0b4J
I4Jm0J-)
0I k g ■—• 3:
k4J"H
kI0rk4Jko4J030-PI4J
;aÎ
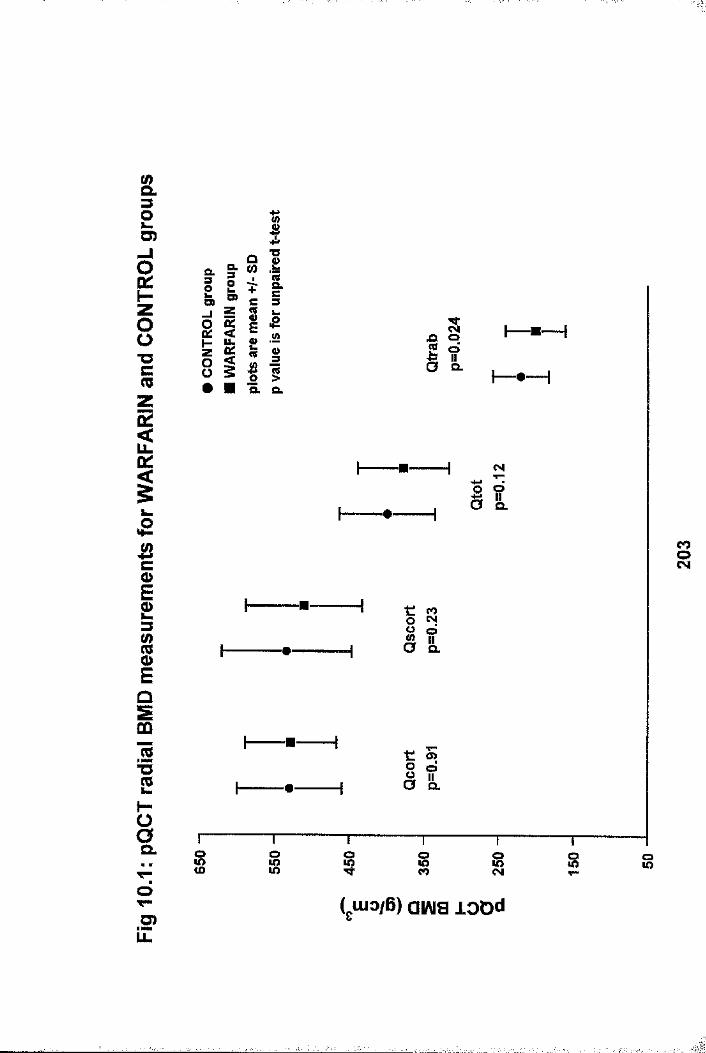
Q.
U)
CL
D)O)
ULCM
Mh-
5OQ.
o>O"Oo.
o. S om 8 8coo
( Ulo/B) aiAia lODdT"u>LL

&3OL.O)
sh"ZO0"Octoza:2oc
1
J2c0)E2
IEûSCû0 c'SL(0T3CCOQ.Z
1CsjOT—O)iZ
I
D)D)
If)LL,LL CL
(OiqOQ.
COo
_j a.
CM o 00 TTocqo o
(uio/B) aiAia vxa
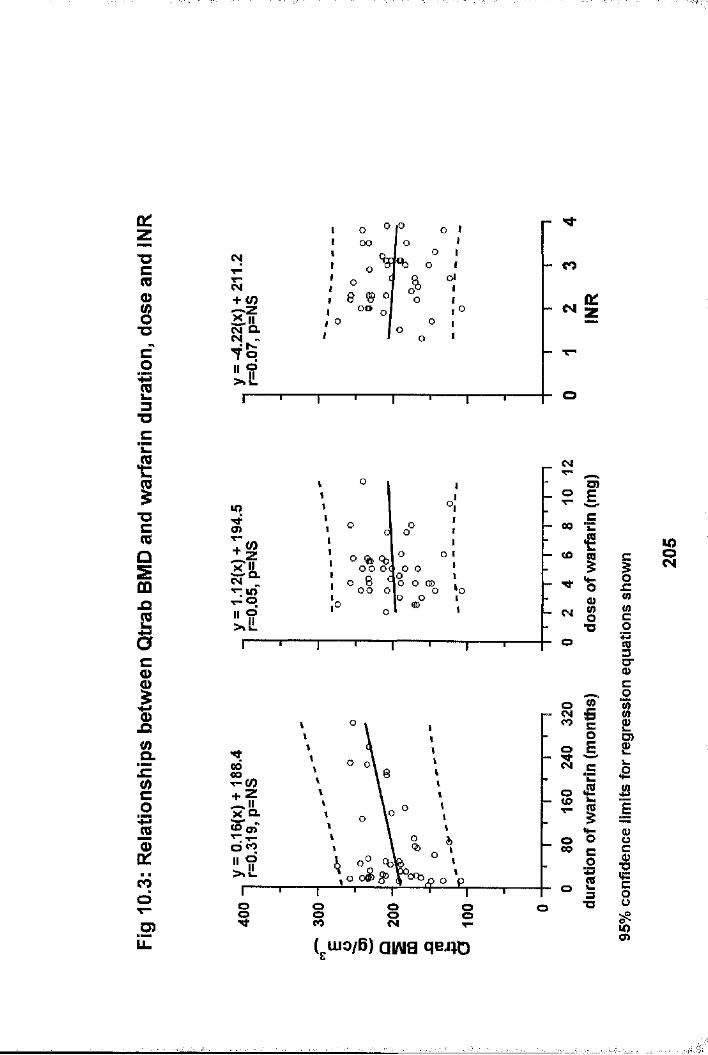
D:
"Ucmos■D
013T3
CM
CM+ <0I I
ooo
%
8 ® ° oo
«bA
O Ii
» I I
d I I
II
O
CM (K:
*ci"Ocns0Sm
1co0)
&(0co%3m0)
cooT—.5>iZ
lOCJ)
O % %oo o< o ooo o
CM
_ o
- MfCM
CMCO
so00
ooo I i
o o
aiE
•ëi*0
8*o
IC0 &'=€101*32 3 ■O
(j.uio/6) ai/\ia qci;o
ij=(0
i1g"c0
1 r£w
sIIf:cgu><J>
V)8
«■
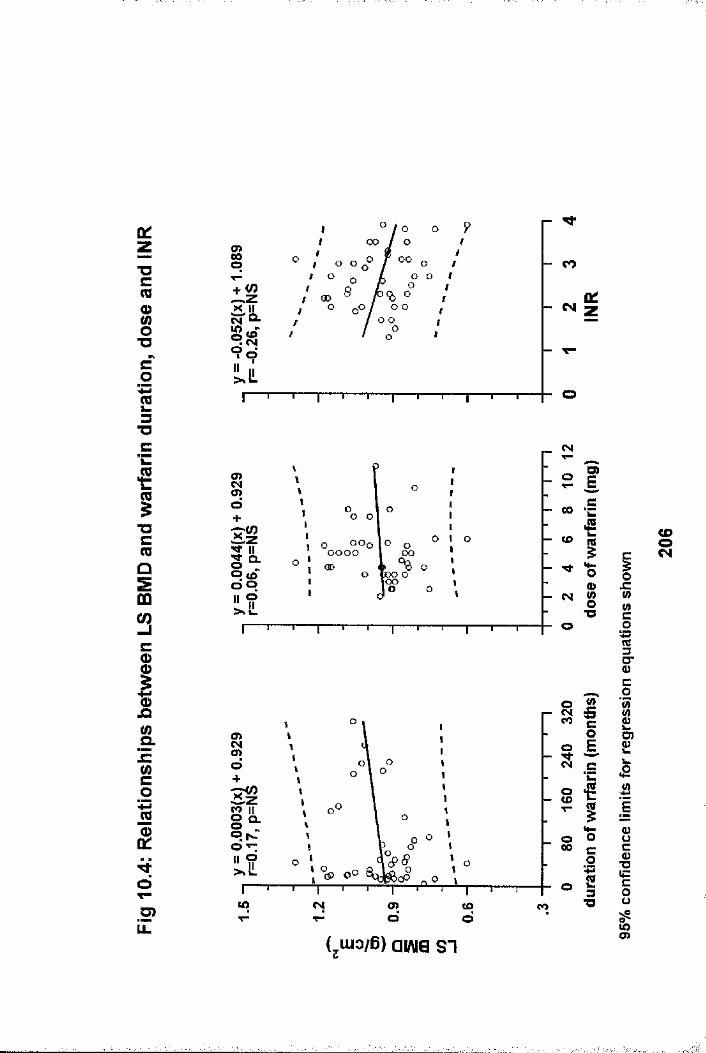
a:zT3Cm<Dg"Oc0ï3" O
c
1"Oc(0013C(DO
OJQ&szinco%
ê.
do>
ooso oo
+ (0 00o o
o o
o
CM Ùl
So >o
»Il 9
G O G O OO
CD
lOO
CM
s | » €
” 1^ O
mCM g
•oo
to CM o> < o co
MO
es, c
- CDO
0O o 00 c o° = XI
(jUio/B) airtia SI
I
Ë0
1C0
1IJ2Ë
1w=c0 u1
ëM
1
I
CHAPTER 11
The effects of disease and corticosteroids on appendicular boneMASS IN POSTMENOPAUSAL WOMEN WITH RHEUMATOID ARTHRITIS: COMPARISON WITH AXIAL MEASUREMENTS
11.1 Introduction.Reduced bone mass is a well recognised feature of rheumatoid arthritis (RA), with many studies showing reductions at both axial and appendicular sites (11.1)» The effect of oral corticosteroid therapy on bone mass in RA is contentious especially at appendicular sites (11.2,11.3). There is evidence to support the concept of generalised bone loss (11.4,11.5), but controversy exists about the distribution and degree of bone loss, and the relative contribution of immobility, low dose corticosteroids and the systemic effects of RA (11.3- 11.8).
The pQCT measurement scan occurs at the ^ultra-distal radius in close proximity to the carpus. As the carpus is frequently involved in RA, and periarticular bone loss is a characteristic feature, pQCT seems an ideal technique to study periarticular bone changes related to RA. Additionally, trabecular bone is metabolically more active than cortical bone, and therefore may be more responsive to stimuli such as corticosteroid therapy(11.9), which is used to treat a proportion of patients with RA. Accordingly, by quantifying trabecular bone, pQCT may be able to differentiate the effects of RA disease activity and corticosteroid therapy on bone at the radial site.
The ankle and subtalar joints are also frequently involved in RA. One might therefore expect the os calcis, which is also a trabecular rich bone (1.21), to be affected in a similar manner to the distal radius by local inflammatory processes and
207I

corticosteroid therapy. It would of interest to determine how calcaneal ultrasound measurements are affected by RA, and how such changes relate to those found with pQCT.
The relative importance of corticosteroids, disease parameters and life style on bone mass in postmenopausal women with RA, were examined using pQCT, and compared with ultrasound, and DXA of hip and spine.
11.2 Study Population, Clinical Assessments and Bone Mass Measurements I
11.2.1 Study Population75 ambulatory, Caucasian, postmenopausal women were studied.The control group comprised of 29 previously normal postmenopausal women, the recruitment of which is discussed in chapter 5 (5.2.point 3). The remaining 46 women had sufferedfrom RA (as defined by the American College of Rheumatology) j:(11.10) for at least 6 months and were recruited from outpatient clinics and a casenote review. 25 of the RA women had been on longterm low dose prednisolone therapy ( lOmg/day) for at least 6 months (RA+P group) . The remaining 21 had never received oral corticosteroids (RA group). Patients who had received intra-articular steroid were not excluded. Subjects with abnormal renal function (serum creatinine >140 //mol/1) orother conditions known to affect bone metabolism were excluded as were individuals taking drugs such as HRT andbisphosphonates. Patients on thiazide diuretics were not excluded. Each individual had all assessments performed on the same day.
11.2.2 Clinical DataData collected included age, height, weight, years since
208
menopause, smoking history (cigarettes/day) and alcohol consumption (units/week). Dietary calcium intake (mg/day) was determined by a locally derived questionnaire, and level of physical activity by the Framingham questionnaire. All individuals underwent lateral thoracolumbar spine x-ray (T4-L5) and fractures were noted (defined as a reduction of 25% in anterior, mid or posterior vertebral body height).
RA patients completed a health assessment questionnaire (HAQ). Articular index (painful joint count only), mean grip strength of three measurements of right and left hands (mm Hg), visual analogue pain score (150mm horizontal line) and the time taken to walk 15 meters on level ground were recorded. X-rays of hands and wrists were scored using the Larsen method. Serum C- reactive protein and rheumatoid factor were measured using standard laboratory methods.
11.2,3 Bone Density MeasurementspQCT was performed at the ultra-distal radius of the nondominant forearm. The effect of RA on in-vivo short-term precision is discussed in chapter 3. Briefly, precision measurements [expressed as the coefficient of variation (CV)] are poorer in the RA population compared to young normals (1.24% vs 1.6%, 1.33% vs 4%, 1.58% vs 1.84% and 1.88% vs 2.8% for Qtot, Qtrab, Qscort and Qcort respectively). pQCT was not possible in one RA subject due to bilateral wrist surgery. Ultrasound of the non-dominant os calcis was performed, but due to machine servicing, ultrasound data is missing from 7 controls and 1 RA subject. DXA hip and spine measurements were performed using a single scanner. Hip measurements were not possible on one RA+P subject due to bilateral hip replacements. Fractured vertebrae within the DXA spinal region of interest were excluded from the analysis. The effect of RA upon precision values of ultrasound and DXA hip and spine
209

measurements was not studied.
11.3 Statistical AnalysesResults for continuous variables were expressed as the mean with standard deviation if the data were normally distributed, otherwise as the median with ranges. Categorical data were examined using the Chi squared (%/) test. Variables common to all three groups were compared using the oneway analysis of variance (ANOVA) or Kruskal-Wallis where appropriate. Subsequent comparisons among groups were performed through the use of Scheffe's multiple comparison test. Variables relevant only to the RA groups were compared using the unpaired t-test or Mann-Whitney U test. Bone measurements across groups were examined having corrected for the influence of age, height, weight and years postmenopause by analysis of covariance with subsequent multiple comparison testing among groups. The independent relationships between corticosteroid use, RA variables, life-style variables and bone mass measurements were examined using Pearson correlation co-efficients and stepwise multiple regression analysis.
11.4 ResultsDetailed clinical data for the three groups are given in Table 11.1. There were no significant differences in age, years postmenopause, height, weight, smoking habit or dietary calcium among groups, although the RA+P group was slightly heavier and more years postmenopause than the others. A greater proportion of the control group consumed alcohol than either RA group, although the amount consumed was not significantly different (p=0.16; Kruskal-Wallis). The physical activity index was significantly higher in the control group compared to either RA group, but not significantly different between RA groups. Thiazide diuretic use was similar for the combined RA groups and control group. 17 (81%) of the RA group and 19 (76%) of the
210

RA+P group were taking disease modifying agents (sulphasalazine, auranofin, hydroxychloroquine, penicillamine, myocrisin, methotrexate or azathioprine). The median disease duration was 4 years greater in the RA+P group (p=0.24, Mann- Whitney U test) and although there was a trend toward worse disease parameters in the RA+P group, significance was reached only for the HAQ. There were more vertebral fractures in the RA groups than controls, although the difference was not significant. ■•%'fIBone mass measurements are shown in figures 11.1 - 11.3. There fwere significant reductions in both RA groups compared to the ifcontrol group for all measurements except the lumbar spine and s|forearm subcortical and cortical BMD. Although Qscort was lower |
Jin both RA groups compared to the control group, this reached if:f
significance only for the RA+P group. pQCT BMD measurements were (control vs RA vs RA+P; overall ANOVA p value: Qtot: 340.6 +/- 67.1 vs 289 +/- 67 vs 285.9 +/- 89.7 g/cm^; p=0.016, Qtrab:174.2 +/- 40 vs 111.8 +/- 52.6 vs 111 +/- 63 g/cm^; p=0.001, Qscort: 466.9 +/- 92.8 vs 413.4 +/- 72.6 vs 393 +/- 102.3g/cm^; p=0.009, Qcort: 495.2 +/- 89.3 vs 518.6 +/- 66.8 vs 498 + /- 97.2 g/cm^; p=NS) . Ultrasound measurements were (control vs f-RA vs RA+P; overall ANOVA p value: BUA: 68.7 +/- 13 vs 49.5 +/- |17 vs 44.6 +/- 20.5 dB/MHz; p=0.001, VOS: 1517 +/- 51.2 vs 1428 f+ /- 36.9 vs 1408 +/- 40.8 m/s ; p=0.001) . DXA BMD measurements
211
:
were (control vs RA vs RA+P ; overall ANOVA p value: LS : 0.89
I+/- 0.16 vs 0.85 +/- 0.21 vs 0.82 +/- 0.18 g/cm^; p=NS, FN:0.78 +/- 0.14 vs 0.68 +/- 0.15 vs 0.65 +/- 0.11 g/cm^ ; p=0.002, FT: 0.61 +/- 0.12 vs 0.55 +/- 0.15 vs 0,52 +/- 0.11 g/cmf;p=0.012, FW: 0.56 +/- 0.14 V S 0.45 +/- 0.14 vs 0.47 +/- 0.08q/crc?} p=0.007). Differences persisted after adjustment for the influence of age, height, weight and years postmenopause. There were no significant differences between the RA groups for any bone mass measurement. Combining the RA groups, the percentage
I
difference in bone mass compared to controls was -36.1%, “15.6%, -8.4% and +2.4% for forearm trabecular, total,subcortical and cortical measurements respectively, -31.7% and -6.6% for calcaneal BUA and VOS respectively, -15,4%, -13.1%and -17.9% for femoral neck, trochanter and Ward's area respectively, and -6.7% for the lumbar spine.
Stepwise multiple linear regression analyses on the whole population are shown in table 11.2. Weight was positively correlated with lumbar spine and hip BMD, radial trabecular BMD and ultrasound measurements. Physical activity was positively correlated with lumbar spine and hip BMD. The independent variable RA (coded 0=no, l=yes) was negatively correlated to radial total, trabecular and subcortical BMD, calcaneal ultrasound measurements and femoral neck and trochanter BMD. Years postmenopause was negatively correlated with radial total, subcortical and cortical BMD. Age was negatively correlated with femoral trochanter BMD. Introducing RA disease variables into the regression analyses for the combined RAgroup showed that the Larsen score (LARS) was negatively correlated with BUA [BUA = 86.25 - 1.04 (LARS); 1^^0.485, F Sig <0.0001], VOS [VOS = 1472.1 - 1.45 (LARS); 1 = 0.185, F Sig = 0.0037], Qtot [Qtot = 347.2 - 1.852 (LARS); R^=0.093, F Sig= 0.0348] and Qtrab [Qtrab = 205.6 - 2.21 (LARS) - 0.06(RhF), R2=0.503, F Sig <0.0001], with rheumatoid factor titre (RhF) being negatively correlated with Qtrab. Table 11.3 shows thecorrelation coefficients of individual RA disease variableswith pQCT and ultrasound measurements for the combined RA \groups. The Larsen score for the non-dominant wrist and whole hand (wrist + MCP's + PIP's) was negatively correlated with Qtrab, BUA and VOS, whilst the Larsen score of the non-dominant wrist was positively correlated with Qcort. Rheumatoid factor titre was negatively correlated with Qtrab, BUA and VOS, whilst grip strength was positively correlated with Qtrab and BUA. The
212:

significant linear regression relationships of Qtrab, BUA and VOS with RA disease variables are shown in figures 11.4 - 11.6 respectively.
11.5 DiscussionThis study has demonstrated marked reductions in appendicular bone mass measurements in patients with RA using both pQCT and ultrasound. Some appendicular measurement changes were more marked than those noted at the femoral neck and lumbar spine, with the changes at the latter site being insignificant in this small study.
pQCT measurements were difficult in a small number of patients with RA, and the precision of pQCT is poorer in this population. There are several reasons for this, which are discussed in chapter 3 - namely a lower mean BMD value in RA patients, and difficulty visualising the radio-carpal joint during the scout scan in patients with more severe RA where the normal anatomical landmarks are distorted. However, unless there is severe destruction and resorption of the distal radius and ulnar, measurement scans in the RA population should be in a position similar to those of the control group. In this study, pQCT trabecular and total BMD measurements were marked reduced in the RA groups (36.1% and -15.6% respectively) compared with controls, with very little difference between the RA groups. These data are in keeping with previous studies examining radial bone loss in patients with non-steroid treated RA using pQCT (11.11,11.12). There are however some important differences between the studies. The previous longitudinal studies examined premenopausal and postmenopausal women with early (< 3 years) RA, whilst the cross-sectional studypopulation reported in this thesis is purely postmenopausal with longer and variable disease duration. The pQCT scanners used also differed. An ^ I rather than x-ray radiation source
213
a
was used previously, trabecular BMD was measured at the 8-10%, and cortical BMD at the distal 1/3 site (rather than the 4% site here). As the proportion of trabecular and cortical bone changes dramatically over short distances at the distal radius (1.17,1.19), these are important differences. Nevertheless, annual rates of loss up to 25% were recorded for trabecular BMD, whilst cortical BMD changes were similar to the control group (11.11), results similar in distribution and magnitude to ours. Rapid trabecular bone loss at the radius occurs early in the disease process with subsequent slowing (11.12). In view of the substantially lower trabecular BMD found in the RA groups, the data presented here would suggest that there is considerable ongoing bone loss beyond this initial period of rapid loss, although this would be better addressed by a longterm longitudinal study. The strong correlation of whole hand and wrist Larsen scores with trabecular BMD suggests that local inflammatory mechanisms responsible for joint damage, and resultant wrist immobility have important adverse effects on ultra-distal radial bone mass, as found previously (11.13) . An increasing rheumatoid factor titre was negatively correlated to trabecular bone, which may be related to more aggressive local disease in such individuals. The correlation of grip strength with trabecular BMD supports the concept that mechanical loading and stimulation has a beneficial effect upon local bone mass (4.2) . In this case, it is detectable within the trabecular component, which being more metabolically active, is more responsive to such stimuli.
As corticosteroid induced bone loss preferentially affects trabecular bone, one might expect pQCT to be a sensitive technique for detecting such an effect. However, it is apparent that there is no significant corticosteroid effect on any of the forearm BMD measurements, even within the trabecular component. The subcortical measurement was significantly lower
214'
in the steroid treated RA group, but not the non-steroid treated RA group compared to controls, but there was no significant difference between the RA groups. The lack of corticosteroid effect is almost certainly due to the juxta- articular, inflammatory driven bone loss (11.14) overwhelming other mechanisms affecting trabecular bone at this site. The radial measurement site is therefore an important consideration. That for SPA is more proximal than pQCT, and as such is further removed from the inflammatory process occurring at the wrist. The effect of corticosteroid could therefore be more pronounced at a more proximal site, which might explain why some have found significantly lower radial bone mass in patients with corticosteroid treated RA (11.2). In keeping with the results reported above, others found no significant corticosteroid effect at the radius (11.3,11.15).
Similarly, immediate postmenopausal bone loss preferentially affects trabecular rather than cortical bone, yet the duration since menopause was negatively correlated with total, subcortical and cortical, but not trabecular BMD. Presumably this is also due to the periarticular inflammatory process overwhelming menopausal effects on trabecular bone, but having much less effect upon cortical bone, which is metabolically less active. Cortical bone comprises 55% of the pQCT total BMD measurement which explains the relationship of duration since the menopause with the latter BMD. Cortical bone is also known to undergo postmenopausal as well as age related change (1.51), as is the pQCT subcortical measurement as discussed in chapter 7 .
There were no difficulties in performing ultrasound of the os calcis in these RA patients as the foot recess was wide enough to accommodate broad feet, and application of the transducers was not impaired by the degree of subtalar deformity. There
215
were reductions in ultrasound attenuation and velocity of - 31.7% and -6.6% respectively in the combined RA group, again with no additional significant steroid effect. Weight was an important determinant of ultrasound measurements as was the Larsen index in the RA groups. The latter finding is particularly intriguing as the Larsen index was measured at the hand and wrist. The same inflammatory mechanisms causing bone loss at the wrist may well effect the trabecular rich os calcis, explaining the correlation between the Larsen index at the wrist and the ultrasound measurements at the os calcis. As for radial trabecular BMD, and presumably for the same reason, both calcaneal ultrasound measurements were negatively correlated with a rising titre of rheumatoid factor. It is difficult to explain the correlation between grip strength and BUA, but this may well reflect similar long-term disease activity in the hands and feet in this group of patients.
There have been many previous studies addressing axial BMD in RA, and these have been reviewed recently (11.1). DXA measurements were included here to allow comparison with pQCT and ultrasound within the same population. A significant reduction in femoral neck BMD of 12.8% (0.71 SD) and 15.4% (0.93 SD) in the RA and RA+P groups respectively, with no significant corticosteroid effect is in keeping with most of the present literature (11.6,11.7,11.8,11.15,11.16). Such reductions are associated with an increased risk of future hip fracture (1.192), which has been recently demonstrated in the RA population (11.17). Weight and physical activity were important determinants of hip BMD in keeping with previous work(11.7,11.8), suggesting that patient mobility helps maintain hip BMD.
The 4.5% and 7.9% reductions in lumbar spine BMD for the RA and RA+P groups respectively failed to reach significance and are
216
smaller than those recorded at the hip, radius and calcaneus. Although the groups were well matched for age, we cannot exclude age and fracture related spinal osteoarthrosis influencing our spinal BMD results (1.171-1.177). Interpretation of the lumbar spine results in the light of previous work has to be cautious because of differences in measurement techniques, study populations and dose of corticosteroid. In those studies which examined postmenopausal women. Hall et al studied larger numbers and found a larger and significant difference of 7.5% between control and non-steroid treated RA groups (11.8). Although a significant difference of 6.5% was found between steroid and non-steroid treated RA groups, the difference was smaller (4.3%), and non-significant when a subgroup with a lower cumulative dose of corticosteroid was examined. Verstraetaen et al studied the effect of higher dose prednisolone in women with much longer disease duration than their non-steroid treated counterparts (11.3). Also, rather unusually, lumbar spine BMD was much higher in the nonsteroid RA group compared to control group, suggesting that either the RA or control group was non-representative. Using QCT, Laan et al found a reduction of 34.7% in lumbar spine trabecular BMD in a low dose steroid-treated RA group compared to a non-steroid treated group (11.18), which is much greater than that reported here. However, QCT measures purely trabecular bone, whereas DXA measures a composite of cortical and trabecular bone, and as such, the techniques are clearly not comparable. In patients with RA, one would not expect differences in radial trabecular BMD (as measured by pQCT) to be comparable to differences in spinal trabecular BMD (as measured by QCT) , as the spine is far removed from the periarticular inflammatory process which profoundly influences radial trabecular BMD. Also, there is poor correlation between radial and axial BMD in the general population (11.19, see chapter 6). Compared to controls. Lane et al (11.15) found DXA
217

218
I:
lumbar spine BMD 8.4% lower in non-steroid treated RA patients, but a non-significant difference for steroid treated patients, although the steroid treated group was small (n=13 for LS BMD measurements). The greater difference in lumbar spine BMD for the non-steroid treated group in comparison to the results presented here, can be explained by the longer duration of RA (mean: 24.5 yrs) in the group studied by Lane et al. Others have examined populations which differed in gender and menopausal status (1.131,11.6,11.7,11.16), or studied the effect of higher dose corticosteroid (11.3,11.7,11.8,11.16) which makes direct comparison with the results reported here difficult. An increased prevalence of vertebral fracture has been demonstrated in steroid treated postmenopausal women with RA (11.20), although there was no non-steroid treated RA group for comparison. The increased prevalence was greater than expected from DXA spinal BMD differences, suggesting a steroid effect on bone architecture as well as mass.
I.I,:
This study has highlighted important changes in appendicular bone mass in RA. There is now good evidence that bone loss occurs early in RA at the radius (11.11,11.12), hip and spine (11.4), with axial bone loss being related to disease and physical activity (11.4). Recently there has been interest expressed in measuring appendicular BMD as a method of monitoring disease activity in RA (11.1,11.21). pQCT and calcaneal ultrasound, by quantifying trabecular bone adjacent to the carpus and ankle respectively, offer novel and unique opportunities to study the effect of RA on periarticular bone, and may be valuable methods of monitoring response to treatments such as disease modifying anti-rheumatic drugs and corticosteroid. Further work is necessary to examine the clinical use of pQCT and ultrasound in RA.

T5■H0 4J10
fi
H 0 fMOOO
0 M
O a o-H
^ IX» CN ^ ^ 00r o O r q uo
o • • oj ^x> o H Ch H ro CM
' o vo o00 o <X> Ch CM Huo • • voro ' CM ^ H roU) H w H ro 00 uo
rH Ch O CM
LOro
ro
■H
■H
CM00
Ch roH CM 00 X )■H
^ I> CMro o
CMco o H 00
ro
uoeu CM
uo CM o ^ro CM 00o î>
co00 00 oH CM o 00
■H
-H
rH
■H- H
■H•H
- H
- H - H U-i
o\o■H I—i■H
- H -H-H
ro
oCM
uo
uoro
00 CM
roCM
uo 00
oroICM
CMH
0 00 4JU24M! 10 U
0 4M U
^ §4-J -iH- H 4-4 0
U^ Ao\o
0m00m
"Hp
PO
O
!>I>
H
ChCO
uoChrH
2-Hfdi
- H4Jxn00
CM
ro
00corH
COCO
COrH
> 1
4JÜ
I000000MU4JrH00ffi
ü■H
rHfd&
BuorH
H00
CDCh
0000
Ch oHrH
X0 0 U t j
gH
tJ) 4-1!h00
- H
4-J-Hfx
Chr*HCM

'ü•H0 4J1fT)04-J00Sm4JT)■H0 U 0 4J 0
1
0■H4J•H!MrU4JSm0■H0 4-J
1
O}M§U04-14MO0U•H4M0■HiM04-J2ô
gU
H
g
0
OUt71PU+
0-H4-1■HSmfj4MU0
rH 0rH 00 rH CDSm 0 O> 0 0 0 O 0>O à d d d O d
01—1Ch0 CNSm4M IIÜ0 BU
•s.uo Ch 0• • /-■% o tnro ro CD drH -—' rH « rH 0CN! O Sm<£{ noIl • H rHrH • • 4* dd rH uo O 0rH uo ro rH rH •rH.—, ■dCH 0• BUOo CD unro œ ro rH 1• * • 00 ( 00 rH drH CH ro UO CH dUO ro rH rH < H 1 0PU04 '—' — -—' CH '—' HCO+ II UO o '—' 4* rH pCh UO CH O CDf=lSd O H* rH HCh'—' Ch uo 4 CH rH CD 00 4 d00W B
0 0B Sm0 00 Sm> tn 0B + 0B ECJ] - dSm 0 0 aO 0 0 Sm 00 4M B O 0 >Sm U r-H T3 0tn O 0 NK U Ch 0 0 d0 0 Ü1 0 d 0B T) B o 0 d 4Md •rH TS 1—1 o 0-H O o •H 4Mrd OJ 4M d 0 0 4M 04M a 0 0 ■H d ■H 0g) Sm B 0 o d Sm 0d 0 0 d 4M rH TZJ d 00 d U 0 O o 0 T) ■rHSm m 0 f! Sm 0 Sm »4M 0 Pi a -H a 0 Sm0 1—1 d d d 00 0 0 Tl 0 o rda d 0 o\o > 0 > rH 4M-H 0 Sm •rH Sm •rH 0 OSM 0 4M a 4M 0tn 1—1 P SM U 0 •rH 00 0 0 >1 1—1 d 0d d d 0 a d 'd 00 0 0 Sm -H B 0 1—10 ■rH 0 d 1 0 d Sm dS > S IZi U o u PU p
Ü0 0 ■H Sm 01U0 I—I 04 -H 4-JI004M4M0UCO01-1OSm4JÜOü0SSm>HOOoV04-k■kinooVa
IUU0gü00H'S-HSM>0
i•Hgu
gSmtJ)
0gSm>LDoOVa44=
- a 0
a+
ta
4Moü0-H000Sm1üSm04J4M04M004M
4Mü0gSm00■HPm
04MI4MTi0Sm■H0II4M004M
4M004MX
TJ0Sm0IÜ0 0 I—I-HSm0>rH0ü
g
0 I—Ig-H00O0
o
i
I
-H -H SmO 0tn a
a
.5.,■'I.
/M
■J'iV
I
1::
î■'
:|
g
C -iL - . ï _"vy
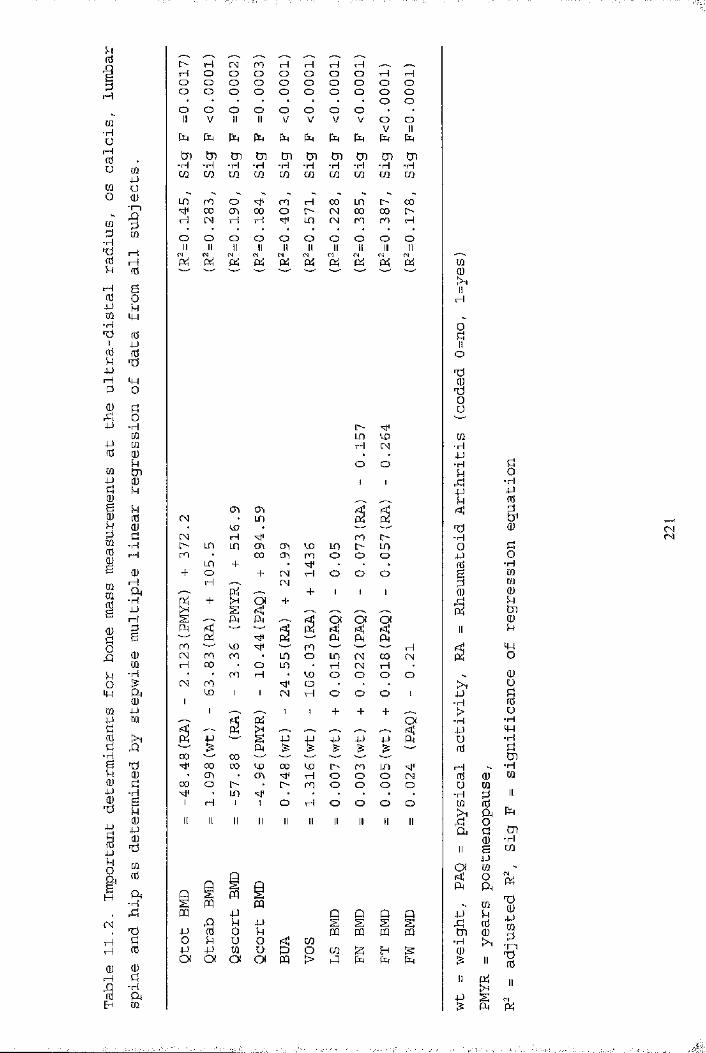
1> H H O O O O O
CN n rH HO O O OO O O OO O O OrH rH ' —-O O rH rHO O O OO O O OO O
O O O O O O O O O O■H
-rH -rH -iH -rH -rH -rH -iH -iH -iH -rH
ljO ro Oœ cri 00rH (N rH rH
rH 0 0 UO l> 00r - CN CO 0 0 OUO CN ro ro rH
roOO O O O O O O O O-H
I—II—I
4H■rH
rH
-H l>UO CO rH CN
O O
CTi CO Kl!
CO • — '—rH roLD co CTi CD Ln uo00 CO ro O O O
CN-rl
roo CN
CNo o o
rH
I—I o o oco
ro ro coro
LO o Ln CN 0 0 CNuo • r i CN rH •
• CO O O O Oo
-ri
CN O O OOI
-rH 0000
• CO 00 o
00 ^ 00 co
• CO00 co i> ro uo'cM rl o C3 o CNo ro o o o o
-rH o o o o o
-HCN
mIIH
oïoT)oum-rH4J•iHu4J
TJ-H04J1(Ug
4J■H>- r i4-)ü( ti
ao-rH4JrtS
&Q)îUo-rH[QCÛ(üUtnCDu
4Ho(UüüfCu
-rHMH-Hg,
1—1 -rHCCS 0 Cûu CÛ
- H u IICÛ 0 k> i a0 tnÇh Ph0 - r lII B
4-Jen
Oi Cû<1: 0 P i
A
4J
-B.
CûkCCS
TJ04-JWtn 0
-H0
II
II Pi II
4J sfil P i
S

m« I4-J m O ex os Sh kl tn
4J
0 4J
I PH ^0i
ï i1 ?
?0
10 (H Üu 0 00 0 Ü4J 00 0 TlB g g0 0u0A m Oi+00 4-J0 Us s.■3'^2 0
0rH 4-J (^0 0
s I I0 ^"g
11;ü rd
p i8 § s8 3 S4-J ü
P
-H
8 f g
i l s^ ex m
üo
P l0 0 5 ei A 0 -Q -P 0 P 4J E-t 4J 0
pd■K •K Ht 0ro 00 rH 00 ro CN CO CO Ht u
rH CN (N CN CN CN 0 CN co H ro ro 'vt' -Hen • • • 0 CN ♦ • rH • • • • P0 0 0 0 0 0 0 0 0 0 0 •rl> 1 1 [ 1 0 0 1 1 0 1 1 1 1 dtn-rlH< Ht 0H< H< HtH« Ht Ht PCO H en ■K CO t> LO CO CO 00 0 CN 0 ro rH CN CO CN CD m d<3 • • • • H ro • • (N ‘ * • *D 0 0 0 0 0 0 0 0 0 0 0pq 1 1 1 1 0 0 1 1 0 1 1 1 1 0-rl
d0d4-J ro CO LO CO Ht pU 0 rH 0 rH rH CN CN ro H CO LO ro 00 0 0 CN CN 0 CN CN rou 0 0 0 0 0ex 0 1 1 1 1 0 0 0 1 0 0 0 0 rH0004-J Vu rH ro I> CN œ I> î> a
0 rH rH H H 0 0 H LO 0 CN ro 0 CN Htu 0 CN rH 0 0 0 Ht0 0 0 0 0 0 0 0 Htex 0 ! 1 1 1 1 0 0 1 0 0 1 0rHHt Ht 0H< Ht Ht 0-K Ht HtA CO CN CN H< H CO 00 ro LO 00 H CO t—1 0 m LO rH H CO rH co LO AP • 0 • • 0 ro • • H • ♦ • • a4-J 0 0 0 0 0 0 0 0 0 Ao< 1 0 1 1 0 0 1 1 0 1 1 1 1 rH00HtHtC.0 00 00 'vf rH œ 00P 0 H 0 0 ro rH 0 H rH rH 00 • 0 • • rH rH rH • 0 . • rHp 0 0 0 0 0 0 0 0ex t 0 1 1 0 0 0 0 1 0 1 1 1 .0AaTJ p Ad Tl 0 LO0 d -H 0d 0 d ,
0 d 00 p0 d 0 p p HtTl 0 d d d0 d 0 0 0 00 0 U ■H 0 d 0 d d 00 d 0 B 0 0 d -rl -ri d0 0 0 ü 0 u 0 B B 0d T) 1—1 0 TJ d 0 Ü 0 00 0 1 -rH 0 TJ TJ 0rH 0 0 0 d 0 d 1 1 00 d ■iH 0 0 a p >1 -rl d d d d0 0 d 0 d d P 0 0 0 0 rH■H rH T) d 0 0 -H p P d 0d 0 0 d d B > 0 U >Flj Tï 0 w 0 d tn 0 -rl d 0K 0 ■rH Oi TS p 0 0 P a p 0 0 0d d d tn H 0 0 d d Urd A Tl 0 0 d 0 0 0 0 Ti 0 0 dP 0 > p 0 d 0 > -rl 0 ü 0■H d U -ri d 0 0 [—1 -rH 0 0 0 00 A p 0 p 0 P p -H0 -rl 0 rH d U U 0 d d P0 0 >1 rH rd 0 p -rl 0 B 0 0 -rlU u rH d U a d I—1 0 0 d 0 0 d0 0 -H B P ■rl 0 0 d 0 d d tn0 0 0 d -rl d -rH 0 d d 0 0 -H>H >-J Q u Pi 0 > ffi Pi e> Pi d d en
S<N

12 2ICoc
1 ÎifI I■g %W "Uf :
23O)
111■ o<
Q(0TC3E2<8ICL
— I
I— o -
[— <1— I— O ---1
■o
£
■> I ' I ' I ' I « I ' rCNI O 00 <0 CM
im&sIeI■oc
j=fI&OS
CO
(^uio/B) aiAia v x a
O)c1WIIc&E8t3E8cOS1‘o«12OS
CON
CL C M 32cn
IsIst
a
II
s?CL

■osa w(A a.
I I
- 1I I= 1I II— T3§ SCLN
23,0)iZ
D)
Q.3
<2III■ o< i
8
1£<8ÎQ.
I I <1-* I— o-
o
I o I
jai
s
i I I ; I S
(mo/6) a w a l O D d
$3«%a.0 c 0)1I*ocrafszO)'5SZ
s,(QD)I Mf t
CM
1 O)18
t:ooa
11Ü wo ^
c * .2I Î% t« ufft0
.a:■- j-liS
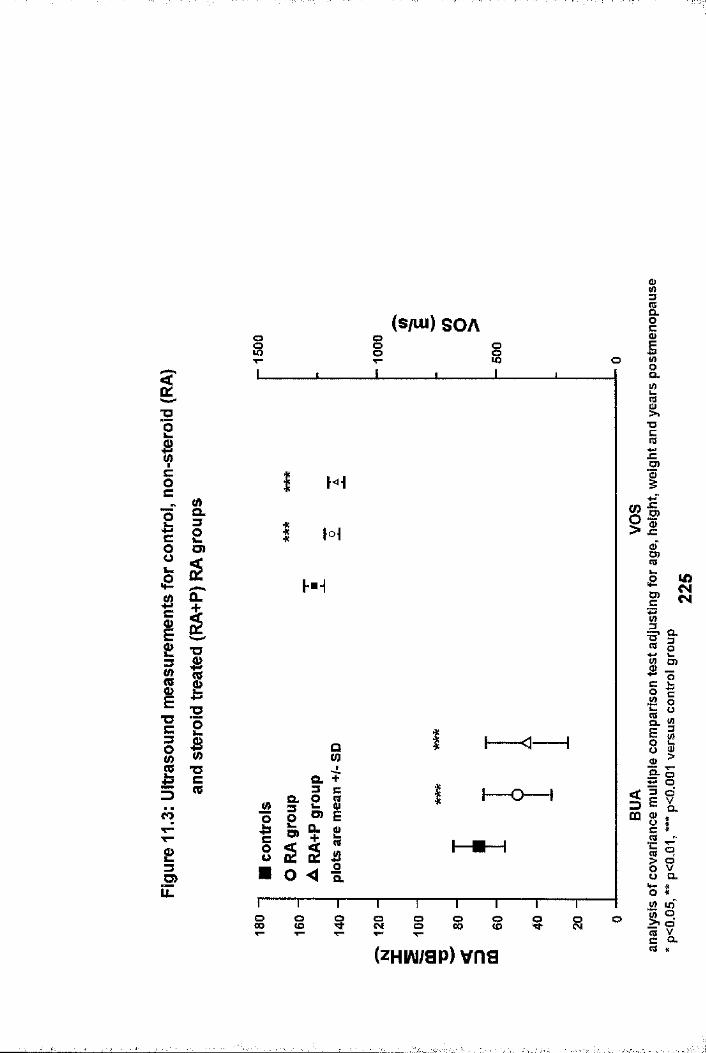
CL
I OO i oo.
■o
JEO)Hi
i tO.
D) CD
CD
O.•OCD
"O Ou
a.£L ImiO) CLcû ncoD)
Roa.O)
’« o ^ oo00 o o s o oCL(zHW/ap) vns

&3
Ig■O0>cI8k.&iASgI-o“OcceaIcI.1'jzs01 £
£3O)ÏZ
oC? OT u
V)
S 8 § 8 § S o
?s
sQ
(çduio/a) qc4D
a u) %. ##
I 8 8 s I s °(jUio/B) qeJUî
CL
- S
• •
g s S s g s( uio/B) qcjïb
£B0B2B1 I
(0CMCM
c»
® °
- g
og s g s
(giuo/B) qc40
B
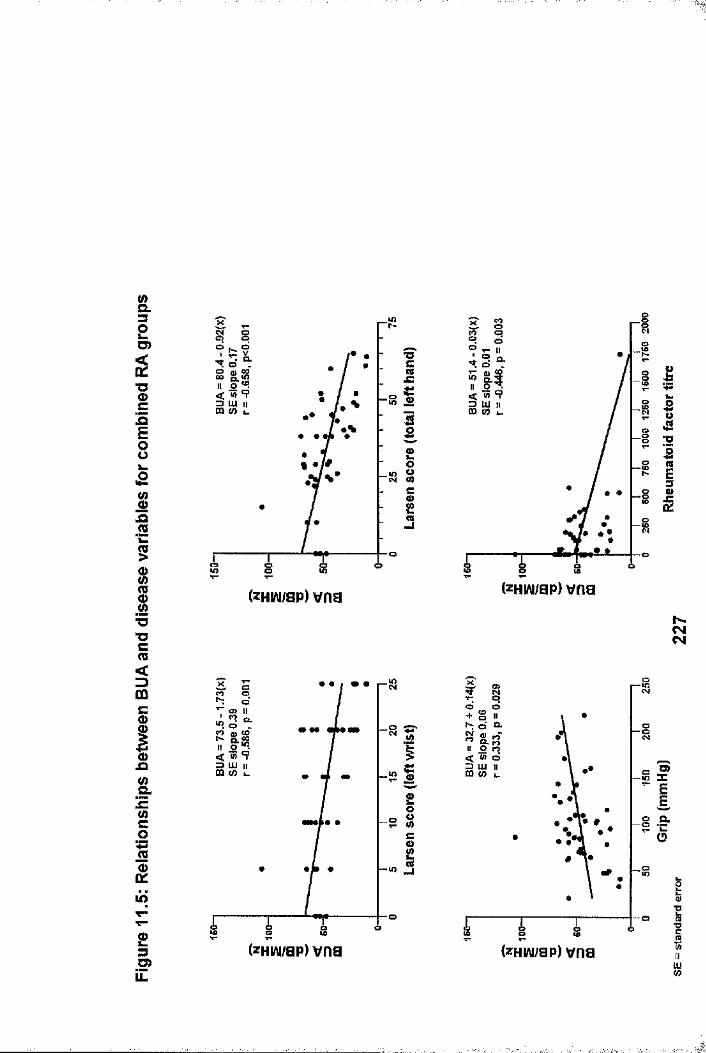
(/)Q.32S)
%cZE8i
s5I"O■Oc(0<3mc0)I.o.e-MC0■■s1lO
23U)
I?LU 11(0 i_
lO
Oo ■o
■acn«
Bo
(zHiAi/ap) vna
i—ïï* #
-R##
3 UJ II CQ (0 L.
o
£ Og 5
(zHiAi/ap) vna
r~S
a.
» 9
■O
J=
CMCM
2 O.
o tï
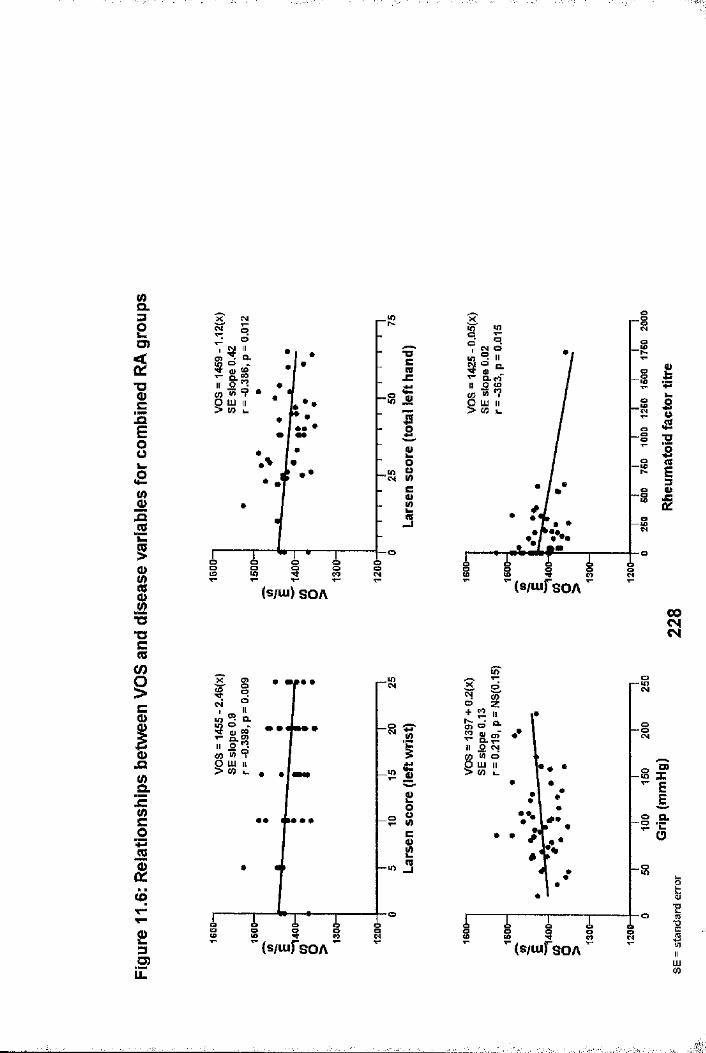
&=32O)
■g. £
E8
8ja.2k.5
IT3C(0
iCIJQSr■gCi23■S?UL
CM
CL
gco Ǥs
■o
•Oc
h-g ojSp
o0
CM W
1es
(s/iu) S O A
o
If)
_o!• • •
4>
8Cg23
(s/iufsOA
CL
S i 8 (s/oifsOA
RCM
i» f
ïi
gî■;î..

CHAPTER 12
OVERALL CONCLUSIONS AND DISCUSSION.Briefly, the aims of this thesis were to examine the use of pQCT in the field of osteoporosis. The precision of pQCT was studied in different populations. The effect upon precision of minimising the difference between scan voxel numbers in follow- up scans was also investigated. The effect of dominance in individuals of normal day-to-day activity was studied. Normative data from the local female population was obtained, from which, important anthropometric determinants were determined, and estimated rates of change derived. pQCT was variably compared to DXA measurements and calcaneal ultrasound in a number of different situations. These were: perimenopausal changes in HMD; the relationships with other bone mass measurements and the implications for screening; discrimination of vertebral and hip fracture populations from non-fracture controls; the effect of HRT and etidronate therapy upon HMD and the implications for monitoring treatment; the effect of warfarin upon HMD; and the effect of disease and low dose corticosteroid in postmenopausal women with rheumatoidarthritis.
The precision of the Stratec XCT 960 pQCT scanner was comparable to other scanning modalities such as DXA with precision values of 1-2%. Although less precise than the multi- slice pQCT technique, it is cheaper and more ubiquitous. The precision was found to be poorer in older postmenopausal women with vertebral fracture, and in women with rheumatoid arthritis It is likely that the precision of the Stratec XCT 960 pQCT system could be improved by increasing the number of scan slices, thus increasing the measurement sample size. However, this would result in a longer scan time, and consequently a greater chance of movement artifact. The local radiation dose
229
would also be increased, although this is unlikely to be a problem, as the radiation dose associated with the present system is so low.
Precision was shown to be influenced by the difference between voxel numbers of repeat scans, suggesting that scan voxel numbers can be used as a surrogate marker of cross-sectional area, and an aid to positioning during repeat scanning. This is an important consideration in repeat scanning of the ultra- distal radius, as absolute BMD, and the proportion of cortical and trabecular bone change significantly over short distances (1.16-1.19). With the present Stratec system, beyond standardization of the scanning technique, further improvement in precision is possible by limiting the difference in voxel numbers between repeat scans. At the present time, a difference of 30 voxels or less is recommended from the work presented in chapter 3. However, this should be further validated, for example, by an in-vitro cadaveric study. Dominance influenced radial BMD by only 1-2% in individuals of normal physical activity. Although not statistically significant, it does have important clinical implications. A lack of consistency with respect to which forearm is scanned, would introduce a further 1-2% variance in BMD measurements. It was our policy therefore, to always scan the non-dominant forearm unless there had been a previous Colles fracture, and to always scan the same forearm in longitudinal studies.
The importance of acquiring a normal range based upon the local population was shown in chapter 5. BMD values of the normal range derived from the Grampian region of Scotland were greater than those of the manufacturers and a previously reported German population (1.50). The population sample was somewhat lacking in numbers in the 30-3 9 years age group, which unfortunately negates any meaningful attempt to address the
230
' - - ' '.■ : ''J-

issue of timing of peak bone mass. Not surprisingly, age was negatively correlated with all pQCT BMD measurements in multiple regression analyses. Weight was found to be positively correlated, inspite of the radius being a non-weight bearing site. The negative correlation for height with total and trabecular BMD measurements is surprising, but may indicate that taller women have thinner radii.
The cross-sectional pQCT data presented in this thesis indicates that radial BMD was stable from the age of 18 years until the menopause, which is inkeeping with almost all of the previous literature(1.50,1.51,1.63,1.68,1.69,1.70,1.78,1.79). However, the longitudinal data from 23 normal premenopausal women (mean age 47.2 year, range 46-54 years) showed a significant decrease in total and subcortical BMD (-1.04% and -1.35% respectively) after follow up for one year, inspite of ongoing regular menses. The differences in results between estimated and observed rates of change illustrate that population variability hides small changes in BMD in cross- sectional data, which can be better determined in precise, longitudinal studies. Premenopausal changes in radial BMD should be clarified with more long term, prospective studies involving greater numbers of participants.
The menopause is considered to induce profound bone loss. The pQCT data in chapter 7 of this thesis, derived from the cross- sectional studies supports this finding in part. When all postmenopausal women were considered as a single group, estimated rates of bone loss up to -1.39%/yr were found. Surprisingly however, the rate of trabecular BMD loss for postmenopausal women was generally lower than that of other pQCT BMD measurements. It also gradually increased with the duration since the menopause, which is contrary to the accepted theory that trabecular bone is preferentially affected
231

immediately following the menopause (1.49,1.64,1.66,1.67,1.74-1.77), at least at the radius. In contrast, the work in chapter 7 showed that subcortical bone was preferentially affected in the early postmenopausal years. This supports the recent observation that during this period, remodelling results in trabecularization of endosteal cortical bone and expansion of the intramedullary radial cavity at the expense of the cortical shell, whilst there is little change in trabecular BMD (6.6). This was confirmed when changes in pQCT BMD around the menopause were examined further by comparing early postmenopausal and late premenopausal women in a cross- sectional study, where a greater difference was found in subcortical than trabecular BMD. In this perimenopausal group, it was also apparent that difference in radial BMD measurements were less than those found at the hip and spine as measured by DXA.
It is appreciated that bone mass at one skeletal site does not necessarily reflect that of another. This was borne out in the work presented in chapter 6, where there was at best, only moderate correlation between radial pQCT BMD measurements, calcaneal ultrasound and axial hip and spine measurements. Additionally, the longitudinal studies which examined annualized rates of change in premenopausal and postmenopausal women in chapter 7, albeit in small numbers, and only after 12- 18 months of follow-up, showed that there was no relationship between changes at the radius and those at either the hip or spine. Further study of these relationships involving a greater number of individuals followed for a longer duration are required. Pending these studies and prospective studies addressing fracture prediction using pQCT, these preliminary findings suggest that pQCT has little role as either a screening or pre-screening tool (eg. for axial DXA assessment), should population based screening for osteoporosis risk ever
232
become a reality. Essentially a single radial measurement did not adequately predict axial BMD, and serial measurements did not reflect changes in axial BMD in the short-term.
At the present time, fracture prediction is best achieved by BMD assessment. In chapter 8, a retrospective study comparing axial DXA with radial pQCT measurements showed that radial trabecular BMD was superior to all other measurements in discriminating vertebral fracture from non-fracture populations. In contrast, the discriminatory power of all pQCT measurements was poor in a retrospective study of hip fractures, and significantly worse than DXA femoral neck BMD. This suggest that pQCT may be useful in the prediction of vertebral fractures, but less so for hip fractures. Prospective studies are now required to confirm this suggestion.
Monitoring response to drug therapy is an established indication for BMD assessment (1.145,1.146,1.153,1.154,9.1). Preliminary work presented in chapter 9 compared changes in J;'
■3
radial pQCT BMD measurements with DXA hip and spine measurements in response to HRT and cyclical etidronate during the first year of treatment. The results showed that the response to both drugs follows a similar pattern, with a significant increase in spinal BMD evident within 4 months and further increase thereafter. In contrast, there was a more gradual increase in hip BMD, while radial BMD, including the trabecular measurement, remained virtually unchanged. This suggests that in the majority of cases, response to these therapies is best assessed at the lumbar spine. This needs to be confirmed by larger studies with longer follow-up. It should be borne in mind however, that as lumbar spine DXA measurements can be influenced by severe spondylosis (1.171-1.177), multiplefractures and overlying aortic calcification (1.168,1.169,1.170), it is not always the best measurement for
233Ï

234
monitoring purposes. Based upon the data presented here, there is no suggestion that pQCT could be used as an alternative, although further work, as suggested above, is necessary before its use in this area can be completely discounted.
ÏMonitoring the effect of drugs with an adverse effect upon bone is equally important. Such an effect is epitomised by corticosteroid therapy. Unfortunately, it was not possible to examine the role of pQCT in monitoring steroid induced boneloss per se, but this area is undoubtedly deserving of future study. It was however possible to examine the potential adverseeffect of warfarin upon bone, a side-effect seldom considered.In a case control study of males presented in chapter 10, lumbar spine and radial trabecular BMD were almost one standard deviation lower at each site in those men on longterm warfarin compared to the control group. Bearing in mind the increasing use of warfarin, this is an important adverse effect to be aware of. In considering the effect of HRT, etidronate and warfarin on radial BMD, there appears to be disparity in the
::results. It seems strange that radial trabecular BMD was unchanged with both HRT and etidronate, yet significantly decreased by warfarin. The study designs must be borne in mind however. The HRT/etidronate effects were studied for only one year in a longitudinal study, whereas the warfarin effect was examined in a cross-sectional design where the drug had been given for a median duration of 40.5 months (range 4-302). The disparity in results could be related to the duration of drug therapy, warfarin having had a much longer time to exert its effect upon radial bone, than HRT or etidronate. With longerfollow up, a significant increase in radial BMD may have been found with HRT and etidronate.
Rheumatoid arthritis (RA) is one of the many conditions which is known to induce bone loss and cause osteoporosis (11.1,11.4-
,1
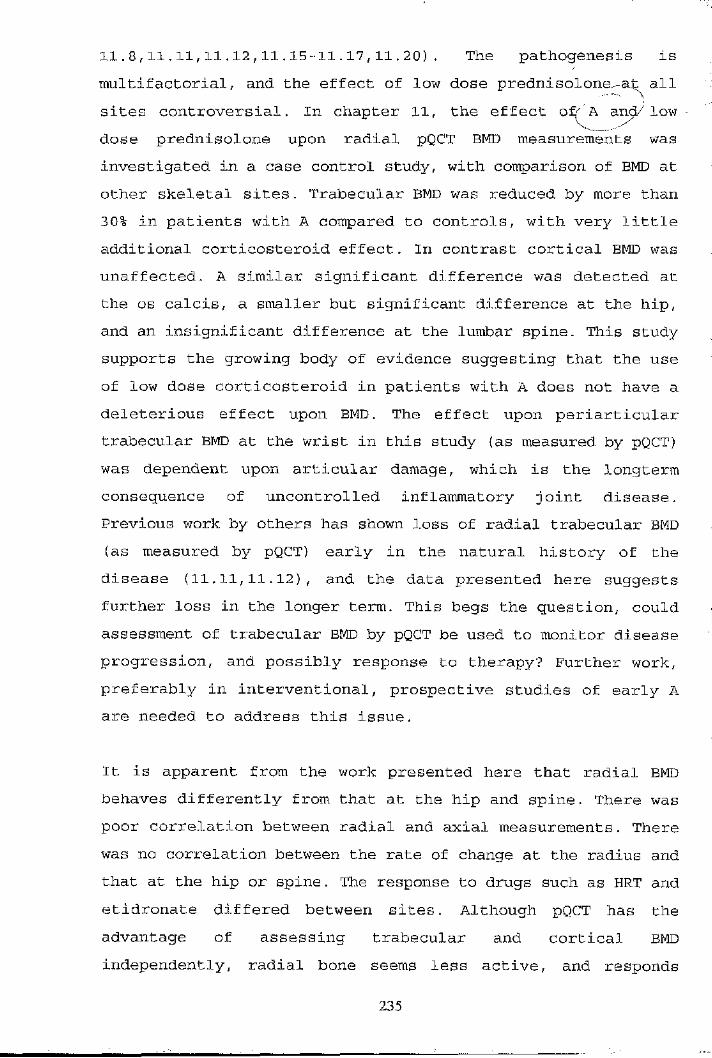
11.8,11.11,11.12,11.15-11.17,11.20). The pathogenesis is multifactorial, and the effect of low dose prednisolone^at all sites controversial. In chapter 11, the effect o^^A and/ low dose prednisolone upon radial pQCT BMD measurements was investigated in a case control study, with comparison of BMD at other skeletal sites. Trabecular BMD was reduced by more than 30% in patients with A compared to controls, with very little additional corticosteroid effect. In contrast cortical BMD was unaffected. A similar significant difference was detected at the 08 calcis, a smaller but significant difference at the hip, and an insignificant difference at the lumbar spine. This study supports the growing body of evidence suggesting that the use of low dose corticosteroid in patients with A does not have a deleterious effect upon BMD. The effect upon periarticular trabecular BMD at the wrist in this study (as measured by pQCT) was dependent upon articular damage, which is the longterm consequence of uncontrolled inflammatory joint disease. Previous work by others has shown loss of radial trabecular BMD (as measured by pQCT) early in the natural history of the disease (11.11,11.12), and the data presented here suggests further loss in the longer term. This begs the question, could assessment of trabecular BMD by pQCT be used to monitor disease progression, and possibly response to therapy? Further work, preferably in interventional, prospective studies of early A are needed to address this issue.
It is apparent from the work presented here that radial BMD behaves differently from that at the hip and spine. There was poor correlation between radial and axial measurements. There was no correlation between the rate of change at the radius and that at the hip or spine. The response to drugs such as HRT and etidronate differed between sites. Although pQCT has the advantage of assessing trabecular and cortical BMD independently, radial bone seems less active, and responds
235
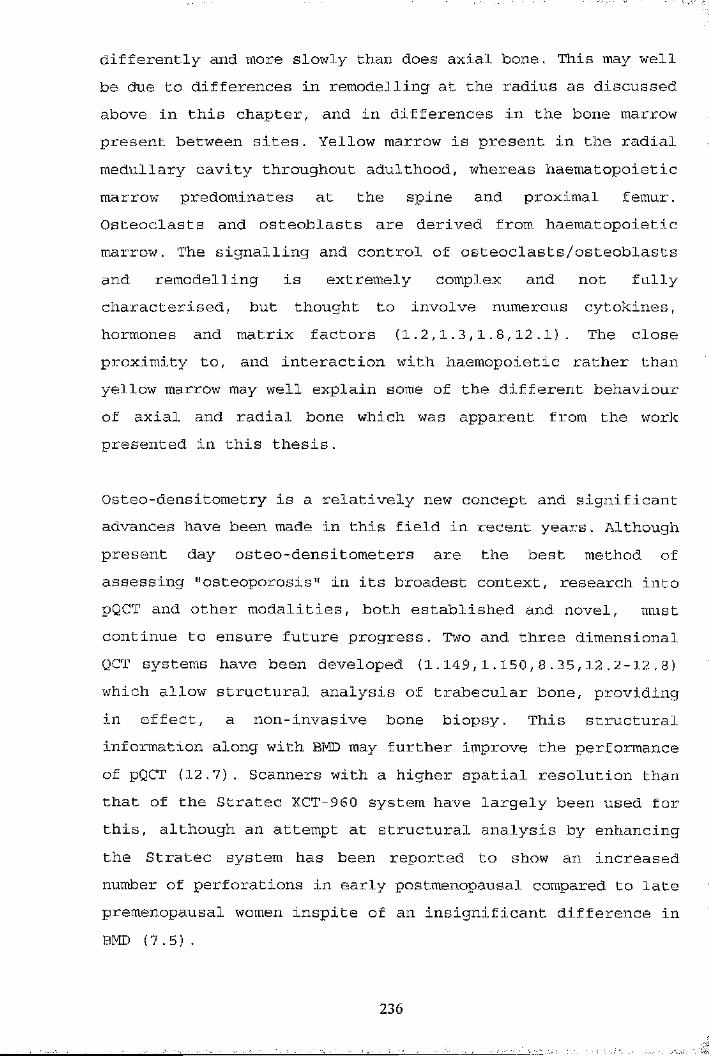
differently and more slowly than does axial bone. This may wellbe due to differences in remodelling at the radius as discussed above in this chapter, and in differences in the bone marrow present between sites. Yellow marrow is present in the radial medullary cavity throughout adulthood, whereas haematopoietic marrow predominates at the spine and proximal femur. Osteoclasts and osteoblasts are derived from haematopoietic marrow. The signalling and control of osteoclasts/osteoblasts and remodelling is extremely complex and not fully characterised, but thought to involve numerous cytokines, hormones and matrix factors (1.2,1.3,1.8,12.1). The close proximity to, and interaction with haemopoietic rather than yellow marrow may well explain some of the different behaviour of axial and radial bone which was apparent from the work presented in this thesis.
Osteo-densitometry is a relatively new concept and significant advances have been made in this field in recent years. Although present day osteo-densitometers are the best method of assessing "osteoporosis" in its broadest context, research into pQCT and other modalities, both established and novel, must continue to ensure future progress. Two and three dimensional QCT systems have been developed (1.149,1.150,8.35,12.2-12.8) 'which allow structural analysis of trabecular bone, providing in effect, a non-invasive bone biopsy. This structural information along with BMD may further improve the performance of pQCT (12.7). Scanners with a higher spatial resolution than that of the Stratec XCT-960 system have largely been used for this, although an attempt at structural analysis by enhancing the Stratec system has been reported to show an increased number of perforations in early postmenopausal compared to late premenopausal women inspite of an insignificant difference in BMD (7.5) .
236

The work for this thesis evaluating the role of pQCT in osteoporosis was done within a limited timescale. Consequently it has its limitations and is far from being all inclusive. However, it has addressed some of the important issues which must be covered in the development of an osteo-densitometer, and has highlighted areas where pQCT may, and may not have a role in the management of patients with osteoporosis. Further work is necessary to confirm some of these findings, and address areas not covered by this work. Like most research, issues hitherto not realised, or poorly documented, have been raised which are worthy of future investigation. The most likely fruitful areas for further research and development into pQCT would be :
► The use of scan voxel numbers to improve precision,and aid repositioning in repeat scanning.
► The use of pQCT to study age related changes in BMDand bone remodelling.
► The use of pQCT in fracture prediction, moreespecially vertebral fracture. It may have additive predictive value in conjunction with axial DXA, as has calcaneal ultrasound in hip fracture prediction (8.19) .
► The use of pQCT in determining BMD changes inresponse to corticosteroid therapy
► The use of pQCT as an assessment tool for monitoringdisease progression and response to therapeutic intervention in rheumatoid arthritis, and possibly other inflammatory arthritides.
► Further assessment of structural considerations, both radial geometric indices, and trabecular microstructure.
237
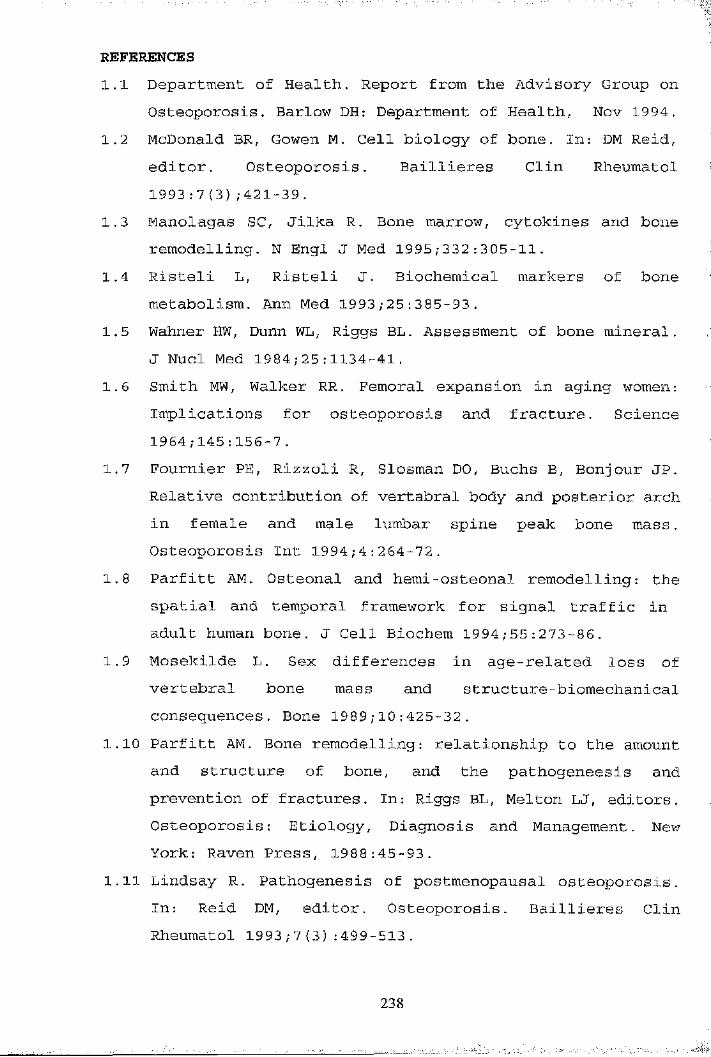
REFERENCES1.1 Department of Health. Report from the Advisory Group on
Osteoporosis. Barlow DH: Department of Health, Nov 1994.1.2 McDonald BR, Gowen M. Cell biology of bone. In: DM Reid,
editor. Osteoporosis. Baillieres Clin Rheumatol 1993:7(3);421-39.
1.3 Manolagas SC, Jilka R. Bone marrow, cytokines and bone remodelling. N Engl J Med 1995;332:305-11.
1.4 Risteli L, Risteli J. Biochemical markers of bone metabolism. Ann Med 1993;25:385-93.
1.5 Wahner HW, Dunn WL, Riggs BL. Assessment of bone mineral. J Nucl Med 1984;25:1134-41.
1.6 Smith MW, Walker RR. Femoral expansion in aging women: Implications for osteoporosis and fracture. Science 1964;145:156-7.
1.7 Fournier PE, Rizzoli R, Slosman DO, Buchs B, Bonjour JP. Relative contribution of vertabral body and posterior arch in female and male lumbar spine peak bone mass. Osteoporosis Int 1994;4:264-72.
1.8 Parfitt AM. Osteonal and hemi-osteonal remodelling: the spatial and temporal framework for signal traffic in adult human bone. J Cell Biochem 1994;55:273-86.
1.9 Mosekilde L. Sex differences in age-related loss of vertebral bone mass and structure-biomechanical consequences. Bone 1989;10:425-32.
1.10 Parfitt AM. Bone remodelling: relationship to the amount and structure of bone, and the pathogeneesis and prevention of fractures. In: Riggs BL, Melton LJ, editors. Osteoporosis: Etiology, Diagnosis and Management. New York: Raven Press, 1988:45-93.
1.11 Lindsay R. Pathogenesis of postmenopausal osteoporosis. In : Reid DM, editor. Osteoporosis. Baillieres Clin Rheumatol 1993 ; 7 (3):499-513.
238
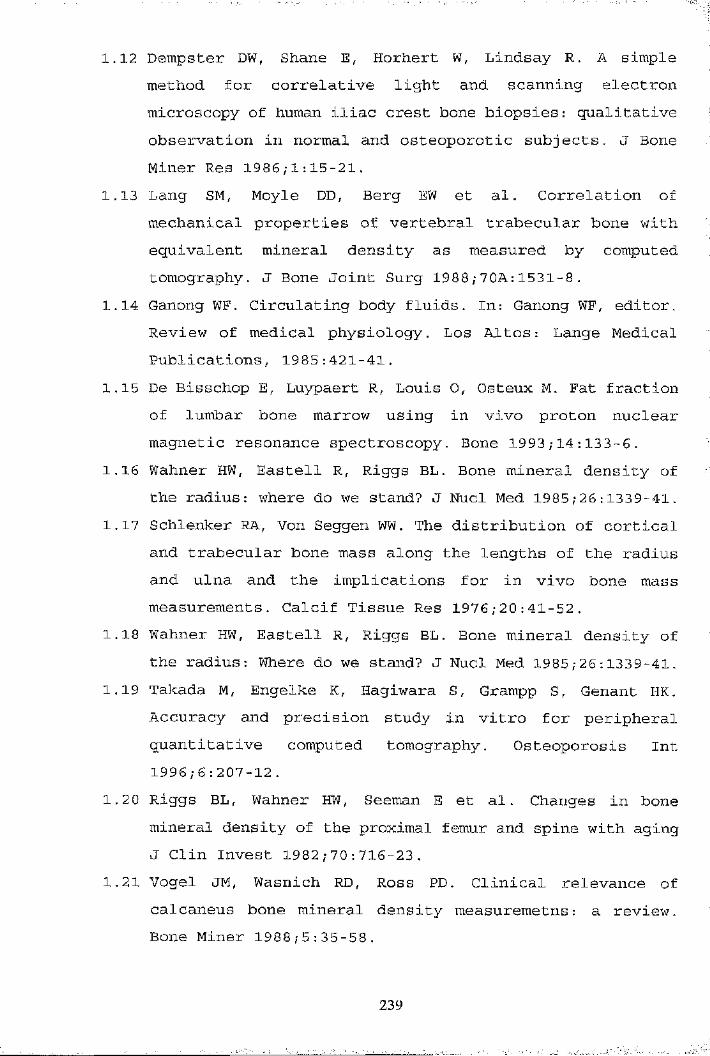
1.12 Dempster DW, Shane E, Horhert W, Lindsay R. A simple method for correlative light and scanning electron microscopy of human iliac crest bone biopsies: qualitative observation in normal and osteoporotic subjects. J Bone Miner Res 1986;1:15-21.
1.13 Lang SM, Moyle DD, Berg EW et al. Correlation of mechanical properties of vertebral trabecular bone with equivalent mineral density as measured by computed tomography. J Bone Joint Surg 1988;70A:1531-8.
1.14 Ganong WF. Circulating body fluids. In: Ganong WF, editor. Review of medical physiology. Los Altos : Lange Medical Publications, 1985:421-41.
1.15 De Bisschop E, Luypaert R, Louis 0, Osteux M. Fat fraction of lumbar bone marrow using in vivo proton nuclear magnetic resonance spectroscopy. Bone 1993;14:133-6.
1.16 Wahner HW, Eastell R, Riggs BL. Bone mineral density of the radius : where do we stand? J Nucl Med 1985;26:1339-41.
1.17 Schlenker RA, Von Seggen WW. The distribution of cortical and trabecular bone mass along the lengths of the radius and ulna and the implications for in vivo bone mass measurements. Calcif Tissue Res 1976;20:41-52.
1.18 Wahner HW, Eastell R, Riggs BL. Bone mineral density of the radius: Where do we stand? J Nucl Med 1985;26:1339-41.
1.19 Takada M, Engelke K, Hagiwara S, Grampp S, Genant HK. I
Accuracy and precision study in vitro for peripheral quantitative computed tomography. Osteoporosis Int 1996;6:207-12.
1.20 Riggs BL, Wahner HW, Seeman E et al. Changes in bone mineral density of the proximal femur and spine with aging J Clin Invest 1982;70:716-23.
1.21 Vogel JM, Wasnich RD, Ross PD. Clinical relevance of calcaneus bone mineral density measuremetns: a review. Bone Miner 1988;5:35-58.
239
1.22 Melton LJ III, Chao EY, Lane J. Biomechanical aspects of fractures. In : Riggs BL, Melton LJ III, editors.Osteoporosis: Etiology, Diagnosis, and Management. NewYork: Raven Press, 1988:111-31
1.23 Hansson T, Roos B, Nachemson A. The bone mineral content and ultimate compressive strength of lumbar vertebrae. Spine 1980;5:46-55.
1.24 Dempster DW, Ferguson-Pell MW, Mellish RW et al. Relationship between bone structure in the iliac crest andbone structure and strength in the lumbar spine. Osteoporosis Int 1993;3:90-6.
1.25 Moro M, Hecker AT, Bouxsein ML, Myers ER. Failure loads of thoracic vertebtae correlates with lumbar bone mineral density measured by DXA. Calcif Tissue Int 1995;56:206-9.
1.26 Lotz J, Hayes W. The use of quantitative computed tomography to estimate risk of fracture of the of the hip from falls. J Bone Joint Surg 1990 ;72A;689-700.
1.27 Courtney A, Wachtel EF, Myers ER, Hayes WC. Age releted reductions in the strength of the femur tested in a fall loading configuration. J Bone Joint Surg 1995 ;77A:387-95
1.28 Beck T, Ruff CB, Warden KE, Scott M, Rao G. Predicting femoral neck strength from bone mineral data: a structural approach. Invest Radiol 1990;25:6-18.
1.29 Horsman A, Currey JD. Estimation of mechanical properties of the distal radius from bone mineral content and cortical width. Clin Orthop 1983;176:298-304.
1.30 Myers ER, Sebeny EA, Hecker AT et al. Correlation between photon absorption properties and failure loads of the distal radius in vitro. Calcif Tissue Int 1991;49:292-7.
1.31 McBroom RJ, Hayes WC, Edwards WT, Goldberg RP, White AA. Prediction of vertebral body compressive fracture using quantitative computed tomography. J Bone Joint Surg 1985;67A;1206-14.
240
1.32 Carter DR, Hayes WC. Bone compressive strength: the influence of density and strain rate. Science 1976;194:1174-6.
1.33 Carter DR, Hayes WC. The compressive behaviour of bone as a two phase porous structure. J Bone Joint Surg 1977;59A:954-62.
1.34 Rockoff SD, Sweet E, Bluestein J. The relative contribution of trabecular and cortical bone to the strength of human lumbar vertebrae. Calcif Tissue Res 1969;3: 163-75.
1.35 Mazess RB. Fracture risk: a role for compact bone. Calcif Tissue Int 1990;47:191-93.
1.36 Spadaro JA, Werner FW, Brenner RA, Fortino MD, Fay LA, Edwards WT. Cortical and trabecular bone contribute strength to the osteopenic distal radius. J Orthop Res 1994;12:211-8.
1.37 Louis 0, Boulpaep F, Willnecker J, Van den Winkel P, Osteaux M. Cortical mineral content of the radius asssessed by peripheral QCT predicts compressive strength on biomechanical testing. Bone 1995;16:375-9.
1.38 Specker BL, Brazerol W, Tsang RC, Levin R, Searcy J, Steichen J. Bone mineral content in children 1 to 6 years of age. Am J Dis Child 1987;141:343-44.
1.39 Glastre C, Braillon P, David L, Cochat P, Meunier PJ, Delmas PD. Measurement of bone mineral content of the lumbar spine by dual energy x-ray absorptiometry in normal children: correlations with growth parameters. J Clin Endocrinol Metab 1990;70:133 0-3.
1.40 Hui SL, JohnstonCC, Mazess RB. Bone mass in normal children and young adults. Growth 1985;49:34-43.
1.41 Faulkner RA, Bailey DA, Drinkwater DT, McKay HA, Arnold C, Wilkinson AA. Bone densitometry in Canadian children 8-17 years of age. Calcif Tissue Int 1996;59:344-51.
241
242
1.42 De Schepper J, Derde MP, Van den Broeck M, Piepsz A, Jonckheer MH. Normative data for lumbar spine bone mineral content in children: influence of age, height, weight and pubertal stage. J Nucl Med 1991;32:216-20.
1.43 Gilsanz V, Gibbens DT, Roe TP et al. Vertebral bonedensity in children: effects of puberty. Radiology1988;166:847-50.
1.44 Sabatier JP, Guaydier-Souquieres G, Laroche D et al. Bone mineral acquisition during adolescence and early adulthood - a study in 574 healthy females 10-24 years of age.Osteoporosis Int 1996;6:141-8.
1.45 Theintz G, Buchs B, Rizzoli R et al. Longitudinal monitoring of bone mass accumulation after 16 years of age at the levels of lumbar spine and femoral neck in female subjects. J Clin Endocrinol Metab 1992;75:1060-5.
1,4 6 Bonjour J, Theintz G, Law F, Slosman D, Rizzoli R. Peakbone mass. Osteoporosis Int 1994:4(Suppl 1):7-13.
1.47 Johnston CC, Slemenda CW. Peak bone mass, bone loss and risk of fracture. Osteoporosis Int 1994;4(Suppl l):43-5.
1.48 Nordin BEC. Bone mass, bone loss, bone density and fractures. Osteoporosis Int 1993;3(Suppl l):l-7.
1.49 Sambrook P, Kelly P, Eisman J. Bone mass and aging. In: Reid DM, editor. Osteoporosis. Baillieres Clin Rheumatol 1993 ;7 (3) :479-98.
1.50 Butz S, Wuster C, Scheldt-Nave, Gotz M, Ziegler R. Forearm BMD as measured by peripheral quantitative computed tomography (pQCT) in a German reference population. Osteoporosis Int 1994;4:179-84.
1.51 Geusens P, Dequeker J, Verstraeten A, Ni j s J. Age, sex, and menopause related changes of vertebral and peripheral bone: population study using dual and single photon absorptiometry. J Nuc Med 1986;27:1540-9.

1.52 Kelly PJ, Eisman JA, Twomey L, Sambrook PN. Sex differences in peak adult bone mass. J Bone Miner Res 1990;5:1169-75.
1.53 Karantanis AH, Kafel-Ezra JA, Glares DC, Quantitative computed tomography for bone mineral measurement: technical aspects , dosimetry, normal data and clinical applications. Br J Radiol 1991;64:298-304.
1.54 Cann CE, Genant HK, Kolb FO, Ettinger B. Quantitative computed tomography for prediction of vertebral fracture risk. Bone 1985;6:1-7.
1.55 Gilsanz V, Boechat MI, Roe TF, Loro ML, Sayre JW, Goodman WG. Gender differnces in vertebral body size in children and adolscents. Radiology 1994;190:673-7.
1.56 Gilsanz V, Boechat MI, Gilsanz R, Loro ML, Roe TF, Goodman WG. Gender differences in vertebral sizes in adults: biomechanical implications. Radiology 1994;190:678-82.
1.57 Faulkner RA, McCulloch RG, Fyke SL et al. Comparison of areal and estimated volumetric bone mineral density values between older men and women. Osteoporosis Int 1995;5:271- 5 .
1.58 Smith DA, Nance WE, Won Kang K, Christian JC, Johnston CC. Genetic factors in determining bone mass. J Clin Invest 1973;52:2800-8.
1.59 Pocock NA, Eisman AJ, Hooper JL, Yeates MG, Sambrook PN,Eberl S. Genetic determinants of bone mass in adults: a twin study. J Clin Invest 1987;80:706-10.
1.60 Hansen MA. Assessment of age and risk factors on bone density and bone turnover in healthy premenopausal women. Osteoporosis Int 1994;4:123-8.
1.61 Mazess RB, Barden HS, Eberle RW, Denton M. Age changes of spine density in posterior-anterior and lateral projections in normal women. Calcif Tissue Int 1995;56:201-5.
Ï
243
,1
3
I1.62 Matkovic V, Jelic T, Wardlaw GM et al. Timing of peak bone
mass in Caucasian females and its implication for the ■§:
prevention of osteoporosis. Inference from a cross- sectional model. J Clin Invest 1994;93:799-808.
1.63 Jelic T, Wardlaw GM, Ilich JZ et al. Timing of peak bone 1 mass in causasian females. J Bone Miner Res 1992 ; 7 (1) : 187.
1.64 Smith DAS, Hosie CJ, Deacon AD, Hamblen DL. Quantitative fY-tay computed tomography of the radius in normal subjects ■;and osteoporotic patients. Br J Radiol 1990;63:776-82.
1.65 Slosman DO, Rizzoli R, Richard C, Donath A, Bonjour JP. Longitudinal measurements of regional and whole body bone mass in young healthy adults. Osteoporosis Int 1994;4:185-90. i
■I:1.66 Dempster DW, Lindsay R. Pathogenesis of osteoporosis. f Lancet 1993;341:797-805.
J-1.67 Riggs BL, Melton LJ III. Evidence for two distinct fsyndromes of involutional osteoporosis. Am J Med 1983; i75:899-901.
1.68 Pocock NA, Eberl S, Eisman JA et al. Dual photon absorptiometry in normal Australian women: a cross-sectional study. Med J Aust 1987;146:293-7. |
1.69 Riggs BL, Wahner HW, Dunn WL, Mazess RB, Offord KP, Melton LJ III. Differential changes in bone mineral density of the appendicular and axial skeleton with ageing. J Clin Invest 1980;67:328-35.
1.70 Riggs BL, Wahner HW, Melton LJ III, Richelson LS, Judd HL,Of ford KP. Rates of bone loss in the appendicular and axial skeletons of women. Evidence of substantial vertebral bone loss before the menopause. J Clin Invest 1986;77:1487-91.
1.71 Krolner B, pors Nielsen S, Bone mineral content of the•Ilumbar spine in normal and osteoporotic women: cross-
sectional and longitudinal studies. Clin Sci 1982 ; 62:329- 36.
244:

1.72 Schaadt 0, Bohr H. Different trends in age-relateddiminution of bone mineral content in the lumbar spine, femoral neck and femoral shaft. Calcif Tissue Int 1988; 42 :71-6.
1.73 Hansen MA, Overgaard K, Christiansen C. Spontaneouspostmenopausal bone loss in different skeletal areas followed up for 15 years. J Bone Miner Res 1995;10:205-10.
1.74 Block LE, Smith R, Gluer CC, Steiger P, Ettinger B, Genant HK. Models of spinal trabecular bone loss as determined by quantitative computed tomography. J Bone Miner Res 1989;4:249-57.
1.75 Ruegsegger P, Durand E, Dambacher MA. Localization of regional forearm bone loss from high resolution computed tomographic images. Osteoporosis Int 1991;1:76-80.
1.76 Ruegsegger P, Durand EP, Dambacher MA. Differentialeffects of aging and disease of trabecular annd compactbone density of the radius. Bone 1991;12 ; 99-105.
1.77 Nilas L, Christiansen C. Rates of bone loss in normal women : evidence of accelerated trabecular bone loss after the menopause. Eur J Clin Invest 1988;18:529-34.
1.78 Ruegsegger P, Dambacher MA, Ruegsegger E, Fischer JA, Anliker M. Bone loss in premenopausal and postmenopausal women. J Bone Joint Surg 1984 ;66A:1015-23.
1.79 Recker RR, Lappe JM, Davies M, Kimmel DB. Changes in bone mass immediately before the menopause. J Bone Miner Res 1992 ; 7 : 857-62 .
1.80 Sowers MR, Clark MK, Hollis B, Wallace RB, Jannausch M. Radial bone mineral density in pre and perimenopausal women: a prospective study of rates and risk factors for loss. J Bone Miner Res 1992;7:647-57.
1.81 Szejnfeld VL, Atra E, Baracat EC, Aldrighi JM, Civetelli R. Bone density in white Brazilian women: rapid loss at the time around the menopause. Calcif Tissue Int 1995;56:186-91.
245

"M1.82 Baran D, Sorensin A, Grimes J et al. Dietary modification
with dairy products for preventing vertebral bone loss in premenopausal women: a three year prospective study. J Clin Endocrinol Metab 1990;70:264-70.
1.83 Prior JC, Vigna YM, Barr SI, Kennedy S, Schulzer M, Li DK. Ovulatory premenopausal women lose cancellous spinal bone; five year prospective study. Bone 1996;18:261-7.
1.84 Baran DT. Magnitude and determinants of premenopausal bone loss. Osteoporosis Int 1994;4 (Suppl l):31-4.
1.85 Haddaway MJ, Davie MWJ, HcCall IW. Bone mineral density in healthy normal women and reproducibility of measurements in spine and hip using dual energy x-ray absorptiometry.Br J Radiol 1992;65:213-7,
1.86 Kanis JA, Adami S, Bone loss in the elderly. Osteoporosis Int 1994;4 (Suppl 1) : 59-65
1.87 Parfitt AM. Interpretation of bone densitometry measurements: disadvantages of a percentage scale and a discussion of some alternatives. J Bone Miner Res1990;5:537-40.
1.88 Peel N, Eastell R. Measurement of bone mass and turnover. In: Reid DM, editor. Osteoporosis. Baillieres Clin Rheumatol 1993;7(3)479-98.
1.89 Schapira D, Shapira C. Osteoporosis: the evolution of a scientific term. Osteoporosis Int 1992;2:164-7.
1.90 Nordin BEC. The definition and diagnosis of osteoporosis. Calcif Tissue Int 1987;40:57-8.
1.91 Concensus Development Conference. Prophylaxis and treatment of osteoporosis. Osteoporosis Int 1991;1:114-7.
1.92 World Health Organisation. Assessment of osteoporotic fracture risk and its role in screeing for postmenopausal osteoporosis. Kanis JA, World Health Organisation, Geneva, 1994.
1.93 Melton LJ. How many women have osteoporosis now? J Bone Miner Res 1995;10:175-7.
246
■il- 1 L: ' ' '' ' -"i :: y.;-
1.94 Melton LJ III. Epidemiology of fractures. In: BL Riggs, LJ Melton III, editors. Osteoporosis: Etiology, Diagnosis, and Management. New York: Raven Press, 1988:133-54.
1.95 Cooper C. Epidemiology and public health impact of osteoporosis. In : Reid DM, editor. Osteoporosis. Baillieres Clin Rheumatol 1993 ; 7 (3 ) : 459-77 .
1.96 Melton LJ, Chrischilles EA, Cooper C, Lane AW, Riggs BL.How many women have osteoporosis? J Bone Miner Res 1992;7:1005-10.
1.97 Kanis JA, McCloskey EV. Epidemiology of vertebral osteoporosis. Bone 1992 ;13 :Sl-SlO.
1.98 Kannus P, Parkkari J, Sievanen H, Heinonen A, Vuori I, Jarvinen M. Epidemiology of hip fractures. Bone 1996;18{Suppl 1):57S-63S.
1.99 Maggi S, Kelsey JL, Litvak J, Heyse SP. Incidence of hip fractures in the elderly: a cross-sectional analysis. Osteoporosis Int 1991;1:232-41.
1.100 Kanis JA. The incidence of hip fracture in Europe. Osteoporosis Int 1993;3(Suppl l):10-5.
1.101 Kanis JA and the WHO study group. Assessment of fracture 1 risk and its application to screening for postmenopausal osteoporosis: a synopsis of the WHO report. Osteoporosis If Int 1994;4:368-81. I
1.102 Kenzora JE, McCarthy RE, Lowell JD, Sledge CB. Hip fracture mortality. Relationship to age, treatment, preoperative illness, time of surgery, and complications.Clin Orthop 1984;186:45-6,
1.103 Clayer MT, Banze RJ. Morbidity and mortality following fractures of the femoral neck and trochanteric regions: | analysis of risk factors. J Trauma 1989;29:1673-8.
1.104 Davies KM, Recker R, Heaney RP. Normal vertebral dimensions and normal variation in serial measurements of vertebrae. J Bone Miner Res 1989;4:341-9.
t247
3

1991;6:207-15.
248
’’ MI
1.105 Melton LJ, Kan SH, Frye MA, Wahner HW, O'Fallon M, Riggs, :
BL. Epidemiology of vertebral fractures in women. Am J Epidemiol 1989;129:1000-11.
1.106 Black DM, Cummings SR, Stone K, Hudes E, Palermo L, Steiger P. A new approach to defining normal vertebral dimensions. J Bone Miner Res 1991;6:883-92.
1.107 Eastell R, Cedel SL, Wahner HW, Riggs BL, Melton LJ. Classification of vertebral fractures. J Bone Miner Res
1.108 Minne HW, Leidig G, Wuster C et al. A newly developed spine deformity index (SDI) to quantitate vertebral crushfractures in patients with osteoporosis. Bone Miner 1988;3:335-49.
1.109 Genant HK, Wu CY, Van Kuijk C, Nevitt MC. Vertebral fracture assessment using a semiquantitative technique. J Bone Miner Res 1993 ; 8 ; 1137-48.
1.110 Cooper C, Atkinson EJ, Jacobsen SJ, O'Fallon WM, Melton LJ. Survival following vertebral fractures: a population- based study. J Bone Miner Res 1992;7 (Suppl 1):174.
1.111 Boyle IT, Secondary osteoporosis. In: Reid DM, editor. Osteoporosis. Baillieres Clin Rheumatol 1993;7(3): 515-34.
1.112 Dempster DW, Arlot MA, Meunier PJ. Mean wall thickness and formation periods of trabecular bone packets in corticosteroid induced osteoporosis. Calcif Tissue Int 1983;35:410-7.
1.113 Brescot C, Meunuer PJ, Chapuy MC, Lajeune E, Darby AJ. Histomorphometric profile, pathophisiology & reversibility of corticosteroid induced osteoporosis. Metab Bone Dis Rel Res 1979;1:303-11.
1.114 Wajchenberg BL, Pereira VG, Kieffer J, Uric S. Effects of dexamethasone on calcium metabolism and Ca kinetics in normal subjects. Acta Endocrinol(Copenh) 1969;61:173-92.
1.115 Suzuki Y, Ichikawa Y, Saito E, Homma M. Importance of
249
increased calcium excretion in the development of secondary hyperparathyroidism of patients under glucocorticoid therapy. Metabolism 1983;32:151-6.
1.116 Eastell R. Management of corticosteroid-induced:■
osteoporosis. J Intern Med 1995/237:439-471.117 Sakakura M, Takebe K, Nakagawa S. Inhibition of
luteinising hormone secretion induced by synthetic LRH by long term treatment with glucocorticoids in human subjects. J Clin Endocrinol Metab 1975;40:774-9.
1.118 Hsueh AJ, Erickson GF. Glucocorticoid inhibition of FSH- induced oestrogen production in cultured rat granulosa cells. Steroids 1978;32:639-48.
1.119 Crilly RG, Marshall DH, Nordin BEG. Metabolic effects of corticosteroid therapy in post-menopausal women. J Steroid Biochem 1979;11:429-33.
1.12 0 MacAdams MR, White RH, Chipps BE. Reduction in serum testosterone levels during chronic glucocorticoid therapy.Ann Intern Med 1986;104:648-51.
1.121 Danisova A, Sebokova E, Kolena J. Effect ofcorticosteroids on oestradiol and testosterone secretionby granulosa cells in culture. Exp Clin Endocrinol 1987;89:165-73.
1.122 Sambrook PN, Eisman JA, Champion GD, Pocock NA. Sex hormone status and osteoporosis in post-menopausal women with rheumatoid arthritis. Arthritis Rheum 1988;31:973-8.
1.123 Sambrook PN, Birmingham J, Champion GD, Kelly P et al. Post-menopausal bone loss in Rheumatoid Arthritis: Effect of oestrogens and androgens. J Rheumatol 1992/19:357-61^
1.124 Crilly RG, Cawood M, Marshall DH, Nordin BE. Hormonal status in normal, osteoporotic and corticosteroid treated post-menopausal women. J R Soc Med 1978;71:733-6.

1.125 Seeman E, Kumar R, Hunder GG, Scott M, Heath H, Riggs BL. Production, degradation and circulating levels of 1,25- dihydroxyvitamin D in health and chronic glucocorticoid excess. J Clin Invest 1980;66:664-9.
1.126 Colette C, Monnier L, Pares Herbute N, Blotman F, Mirouze J. Calcium absorption in corticoid treated subjects: Effects of a single oral dose of calcitrol. Horm Metab Res 1987;19:335-8.
1.127 Luckert BP, Adams JS. Calcium and phosphorus homeostasis in man: effects of corticosteroids. Arch Intern Med 1976;136:124-53.
1.128 Gennari C, Civitelli R. Glucocorticoid-induced osteoporosis. Clin Rheum Dis 1986;12:637-54.
1.12 9 Reid IR, Heap SW, Determinants of vertebral mineral density in patients receiving long-term glucocorticoid therapy. Arch Intern Med 1990;150:2545-8.
1.130 Sambrook PN, Kelly PJ, Keogh A et al. Bone loss after cardiac transplantation: a prospective study. J Heart Lung Transpl 1994;13:116-21.
1.131 Garton MJ, Reid DM. Bone mineral density of the hip and anteroposterior and lateral dimensions of the spine in men with rheumatoid arthritis: effects of low-dose corticosteroids. Arthritis Rheum 1993;36:222-8.
1.132 Baylink DJ. Glucocorticoid-induced osteoporosis. N Eng J Med 1983;309:306-8.
1.133 Adinoff AD, Hollister JR. Steroid induced fractures and bone loss in patients with asthma. N Eng J Med 1983;309:265-8.
1.134 Sambrook P, Birmingham J, Kempler S et al. Corticosteroid effects on proximal femur bone loss. J Bone Miner Res 1990;12 1211-6.
1.135 Sambrook PN, Jones G . Corticosteroid osteoporosis. Br J Rheumatol 1995;34:8-12.
250

...
1.136 LoCascio V, Bonucci E, Imbirabo et al. Bone loss after glucocorticoid therapy. Calcif Tissue Int 1984 ; 36 :435-43^
1.137 Montemurro L, Fraioli P, Riboldi A, Delpiano S, Zanni D, Rizzato G. Bone loss in prednisolone treated sarcoidosis: a two year follow up. Ann Ital Med Int 1990;5:164-8.
1.138 de Deuxchaisnes CN, Devogelaer JP, Esselinckx W et al. The effect of low dose glucocorticoids on bone mass in rheumatoid arthritis: a cross-sectional and longitudinal study using single photon absorptiometry. Adv Exp Med Biol
I
1984;171:210-39.1.139 Ruegsegger P, Medici TC, Anliker M. Corticosteroid-
induced bone loss. A longitudinal study of alternate day therapy in patients with bronchial asthma using quantitative computerised tomography. Eur J Clin Pharmacol 1983 ;25:615-20 .
1.140 Avioli L. Osteoporosis in rheumatoid arthritis. Arthritis Rheum 1987;30:830-1.
1.141 Reid DM, Nicoll JJ, Smith MA, Higgins B, Tothill P, Nuki G. Corticosteroids and bone mass in asthma : comparisons with rheumatoid arthritis and polymyalgia rheumatica. Br Med J 1986;293:1463-6.
1.142 Packe GE, Douglas JG, McDonald A, Robins SP, Reid DM. Bone density in asthmatic patients taking high dose inhaled beclomethasone dipropionate and intermittent systemic steroids. Thorax 1992;47:414-7.
1.143 Medici TC, Ruegsegger P. Does alternate-day cloprednol therapy prevent bone-loss? A longitudinal double blind, controlled clinical study. Clin Pharmacol Ther 1990;48:455-66.
1.144 American College of Rheumatology Task Force on Osteoporosis Guidelines. Recommendations for the prevention and treatment of glucocorticoid-induced osteoporosis. Arthritis Rheum 1996 ;1791-1801.
251
1.145 Comp S ton JE, Cooper C, Kanis JA. Bone densitometry in clinical practice. Br Med J 1995;310:1507-10.
1.146 Kanis JA, Devogelaer JP, Gennari C. Practical guide for the the use of bone mineral density measurements and assessment of treatment of osteoporosis. Osteoporosis Int 1996;6:256-61.
1.147 Sartoris DJ, Resnick D. Current and innovative methods for noninvasive bone densitometry. Radiol Clin North Am 1990;28: 257-78.
1.148 Wilson CR, Fogleman I. Densitometry and bone mineral measurement. Curr Opin Rheumatol 1990;2:369-78.
1.149 Ruegsegger P. The use of peripheral QCT in the evaluation of bone remodelling. Endocrinologist 1994;4:167-76.
1.15 0 Gluer CC, Engelke K, Lang TF, Grampp S, Genant HK. Quantitative computed tomography (QCT) of the lumbar spine and appendicular skeleton. Eur J Radiol 1995;20:173-8.
1.151 van Daele PLA, Burger H, De Laet CEDE, Pois HAP. Ultrasound measurement of bone. Clin Endocrinol 1996;44:363-9.
1.152 Majumdar S, Genant HK. A review of the recent advances in magnetic resonance imaging in the assessment of osteoporosis. Osteoporosis Int 1995;5:79-92.
1.153 Lang P, Steiger P, Faulkner K, Gluer C, Genant HK. Current techniques and recent developments in quantitative bone densitometry. Radiol Clin North Am 1991;29:49-76.
1.154 Jergas M, Genant HK. Current methods and recent advances in the diagnosis of osteoporosis. Arthritis Rheum 1993;36:1649-62.
1.155 Cummings SR, Kelsey JL, Nevitt MC, O'Dowed KJ. Epidemiology of osteoporosis and osteoporotic fractures. Epidemiol Rev 19 85;7:178-208.
1.156 Garton MJ, Robertson EM, Gilbert FJ, Gomersall L, Reid DM. Can radiologists detect osteopenia on plain radiographs? Clin Radiol 1994;49:118-22.
252

1.157 Singh M, Nagrath AR, Maini PS. Changes in trabecular pattern of the upper end of the femoral neck as a measure of osteopenia. J Bone Joint Surg 1970 ;52A:457-67.
1.158 Root VCM, Kesselaer SMMJ, Clevers GJ, de Hooge P, Weits T, van der Werken. Evaluation of the Singh index for measuring osteoporosis. J Bone Joint Surg 1996 ;78B: 831-4.
1.159 Masud T, Jawed S, Doyle DV, Spector TD. A population study of the screening potential of assessment of trabecular pattern of the femoral neck (Singh index): the Chingford Study. Br J Radiol 1995;68:389-93.
1.160 Yates AJ, Ross PD, Lydick E, Epstein RS. Radiographic absorptiometry in the diagnosis of osteoporosis. Am J Med 1995;98(2A):41S-47S.
1.161 Cosman F, Herrington B, Himmelstein S, Lindsay R. Radiographic absorptiometry: a simple method fordetermination of bone mass. Osteoporosis Int 1990;2:34-8.
1.162 Ravn P, Overgaard K, Huang C, Ross PD, Green D, McClung M. Comparison of bone densitometry of the phalynges, distal forearm and axial skeleton in early postmenopausal women
253
participating in the EPIC study. Osteoporosis Int 1996;6:308-13.
1.163 Adami S, ZamberIan N, Gatti D et al. Computed radiographie absorptiometry and morphometry in teh assessment os postmenopausal bone loss, Osteoporosis Int 1996;6:8-13.
1.164 Swezey R, Draper D, Swezey AM. Bone densitometry: comparison of dual energy x-ray absorptiometry to radiographic absorptiometry. J Rheumatol 1996;23:1734-8.
1.165 Wishart JM, Horowitz M, Bochner M, Need AG, Nordin BEC. Relationships between metacarpal morphometry, forearm and vertebral density and fractures in postmenopausal women. Br J Radiol 1993;66:435-40.
i
254
S
I1.16 6 Kuiper JW, van Kuijk C, Grashuis JL, Ederveen AGH, Schutte
HE. Accuracy and the influence of marrow fat on quantitative CT and dual-energy x-ray absorptiometry measurements of the femoral neck in vitro. Osteoporosis Int 1996;6:25-30.
1.167 Hangartner TN, Johnston CC. Influence of fat on bone measurments with dual-energy absorptiometry. Bone Miner 1990;9:71-81.
1.168 Drinka PJ, DeSmet AA, Bauwens SF, Rogot A. The effect of overlying calcification on lumbar bone densitometry. Calcif Tissue Int 1992;50:507-10.
1.169 Frye MA, Melton LJ III, Bryant SC et al. Osteoporosis and calcification of the aorta. Bone Miner 1992;19:185-94.
1.17 0 Hoshino H, Kushida R, Takahashi M, Ohishi T, Sugiyama E,Inoue T* The influence of aortic calcification on spinal bone mineral density in vitro. Calcif Tissue Int 1996;59;21-3.
1.171 Masud T, Langley S, Wiltshire P, Doyle DV, Spector TD. Effect of spinal osteophytosis on bone mineral density measurements in vertebral osteoporosis. Br Med J 1993;307:172-3.
1.172 Jones G, White C, Nguyen T, Sambrook PN, Kelly PJ, Eisman J. Prevalent vertbral deformities - relationship to bone mineral density and spinal osteophytosis in elderly men and women. Osteoporosis Int 1996;6:233-9.
1.173 Yu W, Gluer CC, Fuerst T, Grampp S, Li Y, Genant HK. Influence of degenerative joint disease on spinal bone mineral measurements in postmenopausal women. Calcif Tissue Int 1995;57:169-74.
1.174 Peel NFA, Barrington NA, Blumsohn A, Colwell A, Hannon R, Eastell R. Bone mineral density and bone turnover in spinal osteoarthritis. Ann Rheum Dis 1995;54:867-71.
I

quantitative ultrasound parameters reflect bone structure Calcif Tissue Int 1994;55:46-52.
255
1.175 Peacock DJ, Egger P, Taylor P, Cawley MID, Cooper C.Lateral bone density measurements in osteoarthritis of thelumbar spine. Ann Rheum Dis 1996;55:196-8.
1.176 Yu W, Gluer CC, Fuerst T et al. Influence of degenerative joint disease on spinal bone mineral measurements inpostmenopausal women. Calcif Tissue Int 1995;57:169-74.
1.177 von der Recke P, Hansen MA, Overgaard K, Christiansen C.The impact of degenerative conditions in the spine on bone mineral density and fracture risk prediction. Osteoporosis Int 1996;6:43-9.
1.178 Dequeker J, Mokassa L, Aerssens J. Bone density and OA. J Rheumatol 1995 ;22(suppl) : 98-100.
1.179 Nevitt MC, Lane NE, Scott JC, and the Study ofOsteoporotic Fractures Research Group. Radiographic
■osteoarthritis of the hip and bone mineral density. Arthritis Rheum 1995;38:907.
1.180 Goh JCH, Low SL, Bose K. Effect of femoral rotation on bone mineral density measurements with dual energy x-ray absorptiometry. Calcif Tissue Int 1995;57:340-3.
1.181 Langton CM, Evans GP, Hodgkinson R, Riggs CM. Ultrasonic,.
elastic and structural properties of cancellous bone. In :Ring EFG, editor. Current Research in Osteoporosis andBone Mineral Measurement. London: British Institute ofRadiology, 1990:10-11.
1.182 Gluer CC, Wu CY, Genant HK. Broadband ultrasound attenuation signals depends on trabecular orientation. An in vitro study. Osteoporosis Int 1993;3:185-91.
1.183 Gluer CC, Wu CY, Jergas M, Goldstein SA, Genant HK. Three
i
1.184 Han S, Rho J, Medige J, Ziv I, Ultrasound velocity andbroadband attenuation over a wide range of bone mineral density. Osteoporosis Int 1996;6:291-6.
1.185 Hans D, Arlot ME, Schott AM, Roux JP, Kotzki PO, Meunier PJ. Do ultrasound measurements on the os calcis reflect more the bone microarchitecture than the bone mass?: a two dimentional histomorphometric study. Bone 1995;16:295-300.
1.186 Brooke-Wavell K, Jones PR, Pye DW. Ultrasound and dual x- ray absorptiometry measurments of the calcaneus: influences of region of interest location. Calcif Tissue Int. 1995;57:20-4.
1.187 Petley GW, Roins PA, Aindow JD. Broadband ultrasonic attenuation: are current measurement techniques inherently inaccurate? Br J Radiol 1995;68:1212-14.
1.18 8 Wu CY, Gluer CC, Jergas M, Bendavid E, Genant HK. The impact of bone size on broadband ultrasound attenuation. Bone 1995;16:137-41
1.189 Ruegsegger P, Elsasser U, Anliker M, Gnehm H, Kind H, Prader A. Quantification of bone mineralization using computed tomography. Radiology 1976;121:93-7.
1.190 McClean BA, Overton TR, Hangartner TN, Rathee S. A special purpose x-ray fan-beam CT scanner for trabecular bone density in the appendicular skeleton. Phys Med Biol 1990;35:11-9.
1.191 Cummings SR, Black D. Bone mass measurements and risk of fracture in Caucasian women: a review of findings from prospective studies. Am J Med 1995 ; 98{Suppl 2A):24S-28S.
1.192 Cummings SR, Black DM, Nevitt MC et al. Bone density at various sites for prediction of hip fracture Lancet 1993;341:72-5.
1.193 Mallmin H, Ljunghall S. Distal radius fracture is an early sign of general osteoporosis: bone mass measurements in a population-based study. Osteoporosis Int 1994;4:357-61.
1.194 School of Public Health. Effective Heath Care: Screening for osteoporosis to prevent fractures. School of Public Health, 1992 (No 1).
256
1.195 Torgerson DJ, Garton MJ, Donaldson C, Russell IT, Reid DM. Recruitment methods for screening programmes : trial of an improved method within a regional osteoporosis study. Br Med J 1993;307:99.
1.196 Garton MJ, Torgerson DJ, Donaldson C, Russell IT, Reid DM. Recruitment methods for screening programmes: trial of a new method within a regional osteoporosis study. Br Med J 1992;305:82-4.
1.197 Black DM. Why elderly women should be screened and treated to prevent osteoporosis. Am J Med 1995 ; 98(2A)67S-75S.
1.198 Maxim P, Ettinger B, Spitalny GM. Fracture protection provided by long-term estrogen treatment. Osteoporosis Int 1995;5:23-9.
1.199 Lufkin EG, Wahner HW, O'Fallon WM et al. Treatment of postmenopausal osteoporosis with transdermal estrogen. Ann Int Med 1992 ;117;1-9.
1.200 Larcos G . What factors influence general practitioners commencement of hormone replacement in perimenopausal women. Br J Clin Pract 1996;50:6-8.
1.201 Rubins SM, Cummings SR. Results of bone densitometry affects women's decisions about taking measures to prevent fractures. Ann Intern Med 1992;116:990-5.
1.202 Ringa V, Legesert B, Breart G . Determinants of hormone replacement therapy among postmenopausal women enrolled in the French GAZEL cohort. Osteoporosis Int 1994;4:16-20.
1.203 Kroger H, Huopio J, Honkanen R et al. Prediction of fracture risk using axial bone mineral density in a perimenopausal population: a prospective study. J BoneMiner Res 1995;10:302-6.
1.204 Stewart A, Torgerson DJ, Reid DM. Prediction of fractures in perimenopausal women: a comparison of dual energy x-ray absorptiometry and broad band ultrasound attenuation. Ann Rheum Dis 1996;55:140-2.
257
I■s;

I
1.205 Earnshaw SA, Hosking DJ. Clinical usefulness of risk factors for osteoporosis. Ann Rheum Dis 1996;55:338-9.
1.206 Raisz LG. Assessment of the risk of osteoporosis at the menopause: therapeutic consequences. Osteoporosis Int 1994;4 (Suppl 1):53-7.
1.2 07 Ribot C, Tremollieres F, Fouilles JM. Can we detest women with low bone mass using clinical risk factors. Am J Med 1995;98(Suppl 2A):52S~55S.
1.208 Kleerekoper M, Peterson E, Nelson D et al. Identification of women at risk for developing postmenopausal osteoporosis with vertebral fractures: role of history and single photon absorptiometry. Bone Miner 1989;7:171-86.
1.209 Cooper C, Shah S, Hand DJ et al. Screeing for vertebral osteoporosis using individual risk factors. Osteoporosis Int 1991;1:48-53.
2.1 Abbaszadegen H, Adolphson P, Dalen N, Jonsson U, Sjoberg H, Kalen S. Bone mineral loss after Colles' fracture. Acta Orthop Scand 1991;62:156-8.
2.2 Massie A, Reid DM, Porter RW. Screening for osteoporosis: Comparison between dual energy X-ray absorptiometry and broadband ultrasound attenuation in 1000 perimenopausal women. Osteoporosis Int 1993;3:107-10.
2.3 Tothill P, Avene11 A, Reid DM. Precision and accuracy of measurements of whole-body mineral: comparison between Hologic, Lunar and Noralnd dual-energy X-ray absorptiometers. Br J Radiol 1994;67:1210-7.
3.1 Grampp S, Lang P, Jergas M et al. Assessment of the skeletal status by peripheral quantitative computed tomography of the forearm: short-term precision in vivo and comparison to dual x-ray absorptiometry. J Bone Miner Res 1995;10:1566-76.
3.2 Bland M. An introduction to medical statistics. Oxford: Oxford Medical Publications, 1990.
258

4.1 Gubin B, Kasper MJ. Can vigorous exercise play a role in osteoporosis prevention? A review. Osteoporosis Int 1992;2:55-69.
4.2 Mauhan R, Abel R, Watson J, Weir J. Forearm composition and muscle function in trained and untrained limbs. Clin Physiol 1986;6:389-96.
4.3 Pirnay F, Bodeux M, Crielaard J, Franchimont P. Bone mineral content and physical activity. Int J Sports Med 1987;8:331-5.
259
4.4 Huddleston AL, Rockwell D, Kulund D, Harrison B. Bone mass in lifetime tennis athletes. JAMA 1980;244:1107-9.
4.5 Jacobson P, Beaver W, Grubb S, Taft T, Talmage R. Bone density in women: college athletes and older athleticwomen. J Orthop Res 1984;2:328-32.
4.6 Sandler R, Cauley J, Hom D, Sashin D, Kriska A. The effects of walking on the cross-sectional dimensions of the radius in postmenopausal women. Calcif Tissue Int 1987;41:65-9 .
4.7 Ayalon J, Simkin A, Leichter I, Raifmann S. Dynamic bone loading exercises for postmenopausal women: effect ondensity of the distal radius. Arch Phys Med Rehabil 1987 ; 68 : 280-3 .
4.8 Simkin A, Ayalon J, Leichter I. Increased trabecular bone density due to bone-loading exercises in postmenopausal osteoporotic women. Calcif Tissue Int 1987;40:59-63.
4.9 Beverly M, Rider T, Evans M, Smith R. Local bone mineral response to brief exercise that stresses the skeleton. Br Med J 1989;299:233-5.
4.10 Rikli R, McManus B . Effects of exercise on bone mineral content in postmenopausal women. Res Q Exerc Sport 1990;61:243-9.
4.11 Rico H, Gonzales-Roila J, Revilla M, Villa LF, Gomez- Castresana F, Escribano J. Cortical versus trabecular bone mass: influence of activity on both bone compartments.Calcif Tissue Int 1994;54:470-2.
4.12 Faulkner KG, Genant HK, McClung M . Bilateral comparison of femoral bone density and hip axis length from single and fan beam DXA scans. Calcif Tissue Int 1995;56:26-31.
4.13 Bonnick SL, Nichols DL, Sanborn CF, Payne SG, Moen SM, Heiss CJ. Right and left proximal femur analyses: is there a need to do both? Calcif Tissue Int 1996;58:307-10,
4.14 Dretakis E, Damilakis J, Kontakis G, Gourtsoyiannis N. Variation between os calces as measured by broadband ultrasound attenuation. Br J Radiol 1994;67:636-8.
5.1 Mazess RB, Barden HS, Ettinger M et al. Spine and femur density using dual photon absorptiometry in US white women. Bone Miner 1987;2:211-9.
5.2 Hedlund LR, Gallager JC. The effect of age and menopause on bone mineral density of the proximal femur. J Bone Miner Res 1989;4:639-42.
5.3 Harris S, Dawson-Hughes B. Rates of change in bone mineral density of the spine, heel, femoral neck and radius in healthy postmenopausal women. Bone Miner 1992;17:87-95.
5.4 Silman A. European Vertebral Osteoporosis Study: an overview. In: EFJ Ring, DM Elvins, AK Bhalla, editors. Current research in osteoporosis and bone mineral measurement III: London, British Institute of Radiology, 1994 :16
5.5 Reeve J, Kroger H, Nijs J et al. Radial cortical and trabecular bone densities of men and women standardized with the European forearm phantom. Calcif Tissue Int 1996;58:135-43 .
260
5.6 Dequeker J, Pearson J, Reeve J et al. Dual x-rayabsorptiometry: cross-calibration and normative reference ranges for the spine. Results of a European Community Concerned Action. Bone 1995;17:247-54.
5.7 Simmons A, Barrington S, O'Doherty MJ, Cakley AJ. Dualenergy X-ray absorptiometry normal reference range use within the UK and the effect of different normal ranges on the assessment of bone density. Br J Radiol 1995;68:903-9.
5.8 Pearson J, Dequeker J, Reeve J et al. Dual x-rayabsorptiometry of the proximal femur : normal Europeanvalues standardised with the European Spine Phantom. J Bone Miner Res 1994;10:315-24.
5.9 Lehmann R, Wapniarz M, Randerath 0 et al. Dual energy X- ray absorptiometry at the lumbar spine in German men and women: a cross-sectional study. Calcif Tissue Int1995;56:350-4.
5.10 Petley GW, Cotton AM, Murrills AJ et al. Reference ranges of bone density for women in southern England: the impact
'I'of local data on the daignosis of osteoporosis. Br J Radiol 1996;69:655-60.
5.11 Parra-Cabrera S, Hernandez-Avila M, Tamayo-y-Orozco J, Lopez-Carrillo L, Meneses-Gonzalez F. Exercise and reproductive factors as predictors of bone density among osteoporotic women in Mexico City. Calcif Tissue Int 1996;59: 89-94 .
5.12 Michaelsson K, Bergstrom R, Mallmin H, Holmberg L, Wolk A, Ljunghall S. Screening for osteopenia and osteoporosis: selection by body composition. Osteoporosis Int 1996;6:120-6.
5.13 Pocock NA, Eisman JA, Yeates MG, Sambrook PN, Eberl S. Physical fitness is a major determinant of femoral neck and lumbar spine bone mineral density. J Clin Invest 1986;78:618-21,
261

5.14 Davis JW, Ross PD, Wasnich RD. Relation of height and weight to the regional variations in bone mass among Japanese-American men and women. Osteoporosis Int 1995;5:234-8.
6.1 Lai K, Rencken M, Dinkwater BL, Chestnut III CH. Site of bone density measurement may affect therapy decision Calcif Tissue Int 1993;53:225-8.
6.2 Pouilles JM, Tremollieres F, Ribot C. Spine and femur densitometry at the menopause: Are both sites necessary in the assessment of the risk of osteoporosis. Calcif Tissue Int 1993;52:344-7.
6.3 Greenspan SL, Haiti and-Ramsey, Myers E. Classification of osteoporosis in the elderly is dependent on site specific analysis. Calcif Tissue Int 1996;58:409-14.
6.4 Kanis JA and the WHO study group. Assessment of fracture risk and its application to screening for postmenopausal osteoporosis: a synopsis of the WHO report. Osteoporosis Int 1994;4:368-81.
6.5 Wasnich RD, Ross PD, Davis JW, Vogel JM. A comparison of single versus multiple BMC measurements for assessment of spine fracture probability. J Nucl Med 1989;30:1166-71.
6.6 Gatti D, Rossini M, Zamberlan N, Braga V, Fracassi E, Adami S. Effect of aging on trabecular and compact bone components of proximal and ultradistal radius. Osteoporosis Int 1996;6:355-60.
6.7 Schneider P, Borner W, Mazess RB, Barden H. The relationship of peripheral to axial bone density. Bone Miner 1988;4:279-87.
6.8 Hosie CJ, Smith DA, Deacon AD, Langton CM. Comparison of broadband ultrasound attenuation of the os calcis and quantitative computed tomography of the distal radius. Clin Phys Physiol Meas 1987;8:303-8.
262

6.9 Ross P, Genant HK, Davis J, Miller P, Wasnich R. Predicting vertebral fracture incidence from prevalent fractures and bone density among non-black, osteoporoticwomen. Osteoporosis Int 1993;3:120-6.
6.10 Ross PD, Davis JW, Epstein RS, Wasnich RD. Pre-existing factors and bone mass predictvertebral fracture incidence
I
in women. Ann Intern Med 1991;114:919-23..
7.1 Hassager C, Christiansen C. Measurement of bone mineral
I
density. Calcif Tissue Int. 1995;57:1-5.7.2 Fujii Y, Chikawa T, Nakamura T, Goto B, Fujita T.
Comparison of trabecular bone density at vertebral and radial sites using quantitative computed tomography. Osteoporosis Int 1996;6:486-90.
7.3 Garton M, Martin J, New S et al. Bone mass and metabolism in women aged 45-55. Clin Endocrinol 1996;44:563-70.
7.4 Bjarnason K, Hassager C, Ravan P, Christiansen C. Early posmenopausal diminution of forearm and spinal bone mineral density: a cross-sectional study. Osteoporosis Int 1995;5:35-8 .
7.5 Takagi Y, Fugii Y, Miyauchi A, Goto B, Takakashi K, Fujita T. Transmenopausal changes of trabecular bone density and structural pattern assessed by peripheral quantitative computed tomography in Japanese women. J Bone Miner Res 1995;10:1830-4.
8.1 Kanis JA, McCloskey EV. Epidemiology of vertebral osteoporosis. Bone 1992 ;13 :Sl-SlO.
8.2 Cooper C, Melton LJ. Vertebral fracture: How large is the silent epidemic? Br Med J 1992;304:793-4.
8.3 Gardsell P, Johnell O, Nilsson BE, Gullberg B, Predicting various fragility fractures in women by forearm bone densitometry: a follow-up study. Calcif Tissue Int 1993 ;52:348-53 .
8.4 Cummings SR. Are patients with hip fractures more osteoporotic? Am J Med 1985;78:487-94.
263
J:
8.5 Sugimoto T, Kanbara Y, Shiraishi H et al. Femoral and spinal bone mineral density in Japanese osteoporotics with hip fracture. Osteoporosis Int 1994;4:144-8.
8.6 Firooznia H, Golimbu C, Rafii M, Schwartz MS, Alterman ER. Quantitative computed tomography assessment of spinal trabecular bone II. In osteoporotic women with and without vertebral fractures. J Comput Asst Tomogr 1984;8:99-103.
8.7 Bjarnason K, Nilas L, Hassager C, Christiansen C. Dual energy X-ray absorptiometry of the spine - decubitus lateral versus anteroposterior projection in osteoporotic women: comparison to single x-ray absorptiometry of the forearm. Bone 1995;16:255-60.
8.8 Stewart A, Felsenberg D, Kalidis L, Reid DM. Vertebral fractures in men and women: how discriminative are bone mass measurements? Br J Radiol 1995;68:614-20.
8.9 Duboeuf F, Jergas M, Schott A, Wu CY, Gluer C, Genant HK.A comparison of bone densitometry measurements of the central skeleton in postmenopausal women with and without vertebral fracture. Br J Radiol 1995;68:747-53.
8.10 Heuck A, Block J, Gluer CC, Steiger P, Genant HK. Mild versus definate osteoporosis: Comparison of bone densitometry techniques using different statistical - models. J Bone Miner Res 1989;4:891-900.
8.11 Melton LJ, Atkinson EJ, O'Fallon M, Wahner HW, Riggs BL. Long-term fracture prediction by bone mineral assessed at differenct skeletal sites. J Bone Miner Res 1993;8:1227- 33 .
8.12 Schott AM, Weill-Engerer S, Hans D, du Boeuf F, Delmas PD, Meunier PJ. Ultrasound discriminates patients with hip fracture equally well as dual energy X-ray absorptiometry and independently of bone mineral density, J Bone Miner Res 1995;10:243-9.
264ii
8.13 Stewart A, Reid DM, Porter RW. Broadband ultrasound attenuation (BUA) and dual energy x-ray absorptiometry (DXA) in women with hip fracture: which technique discriminates fracture risk? Calcif Tissue Int 1994/54: 456-9 .
8.14 Turner CH, Peacock M, Timmerman L, Neal JM, Johnson CC. Calcaneal ultrasonic measurements discriminate hip fracture independently of bone mass. Osteoporosis Int 1995;5:130-5.
8.15 Mautalen C, Vega E, Gonzalez D, Carrilero P, Otano A, Silberman F. Ultrasound and dual x-ray absorptiometry densitometry in women with hip fracture. Calcif Tissue Int 1995;57:165-8.
8.16 Porter RW, Miller CG, Grainger D, Palmer SB. Prediction of hip fracture in elderly women: a prospective study. Br Med
:J 1990;301:638-41.
-,8.17 Bauer DC, Gluer CC, Pressman AR et al. Braodband ultrasonic attenution (BUA) and the risk of fracture: a prospective study. J Bone Miner Res 1995 ;10 :S175.
8.18 Hans D, Dargent P, Schott AM et al. Ultrasound parameters predict hip fracture independently of hip bone density: the EPIDOS prospective study. J Bone Miner Res1995;10:S169.
8.19 Hans D, Dargent-Molina P, Schott AM et al.::
Ultrasonographic heel measurements to predict hip fracture in elderly women: the EPIDOS prospective study. Lancet 1996;348:511-4.
8.20 Gluer CC, Cummings SR, Bauer DC et al. Osteoporosis: Association of recent fractures with quantitative US findings. Radiology 1996;199:725-32.
8.21 Bauer DC, Gluer CC, Genant HK, Stone K. Quantitative ultrasound and vertebral fracture in postmenopausal women.J Bone Miner Res 1995;10:353-8.
:265
I
8.22 Ross P, Huang C, Davis J et al. Predicting vertebral deformity using bone densitometry at various skeletal sites and calcaneus ultrasound. Bone 1995;16:325-32.
8.23 Genant HK. Universal standardization for dual x-rayabsorptiometry: patient and phantom cross-calibration
'vresults. J Bone Miner Res 1995;10:997-8. |8.24 Peacock M, Turner CH, Liu G, Manatunga AK, Timmerman L, If
Johnston CC. Better discrimination of hip fracture using bone density, geometry and architecture. Osteoporosis Int 1995;5:167-73.
8.25 Cummings SR, Cauley JA, Palermo L et al. Racialdifferences in hip axis lengths might explain racial differences in hip fracture. Study of Osteoporosis Fractures Research. Osteoporosis Int 1994 :4 ; 226-9. I
8.26 Faulkner KG, Cummings SR, Black D, Palermo L, Gluer CC, Genant HK. Simple measurement of femoral geometry predicts
?hip fracture: the study of osteoporotic fractures. J Bone Miner Res 1993 : 8 ; 1211-7.
8.27 Mikail MB, Vaswani AN, Aloia JF. Racial differences in femoral dimentions and their relation to hip fracture. Osteoporosis Int 1996;6:22-4.
8.28 Karlsson KM, Sernbo T, Obrant KJ, Redlund-Johnell I, f Johnell O. Femoral neck geometry and radiographic signs of osteoporosis as predictors of hip fracture. Bone
-I:1996;18:327-30. f-;v
8.29 Slemenda CW, Turner CH, Peacock M et al. The genetics of Iproximal femur geometry, distribution of bone mass and |bone mineral density. Osteoporosis Int 1996;6:178-82.
8.30 Berry E, Truscott JG, Stewart SP, Smith MA. Spatial distribution of femoral bone mineral in dual energy x-ray absorptiometry images: a possible technique to improve discrimination between normal and osteoporotic patients.Br J Radiol 1996;69:743-50.
266f
8.31 Kanis JA, McCloskey EV. Evaluation of the risk of hip
I
fracture. Bone 1996 ;18(Suppl 3) :127S-132S.8.32 Cummings SR, Nevitt MC. Non-skeletal determinants of
fractures: the potential importance of the mechanics of falls. Study of Osteoporosis Fractures Research. Osteoporosis Int 1994;4(Suppl 1):67-70.
8.33 Pinilla TP, Boardman KC, Bouxsein ML, Myers ER, Hayes WC. Impact direction from a fall infuences the failure load of the proximal femur as much as age-related bone loss. Calcif Tissue Int 1996;58:231-5.
8.34 Gilsanz V, Loro ML, Roe TF, Sayre J, Gilsanz R, Schulz EE. Vertebral size in elderly women with osteoporosis. Mechanical implications and relationship to fractures. J Clin Invest 1995;95:2332-7.
8.35 Mundinger A, Wiesmeier B, Dinkel E, Helwig A, Beck A, Schulte Moenting J. Quantitative image analysis of vertebral body architiecture - improved diagnosis in osteoporosis based on high resolution computed tomography. Br J Radiol 1993,66:209-13.
8.3 6 Schneider P, Borner W, Ability of peripheral QCT at theradius in comparison to DEXA of the spine to diagnose vertebral fractures in postmenopausal women. In*. Christiansen CC, Overgaard K, editors. Osteoporosis: Etiology, Diagnosis, and Management. New York: RavenPress, 1990:921-4.
8.3 7 Grampp S, Jergas M, Lang P et al. Quantitative CTassessment of the lumbar spine and radius in patients with osteoporosis. AJR 1996;167:133-40.
8.3 8 Ruegsegger P, Anliker M, Dambacher M. Quantification oftrabecular bone with low dose computed tomography. J Comput Assist Tomogr 1981;5:384-90.
8.39 Hui SL, Slemenda CW, Johnston CC. Baseline measurement of bone mass predicts fracture in white women. Ann Intern Med 1989,111:355-61.
1.
267

268
8.40 Hui SL, Slemenda CW, Johnston CC. Age and bone mass as predictors of fracture in a prospective study. J Clin Invest 1988;81:1804-9.
:■8.41 Marshall D, Johnell O, Wedel H. Meta-analysis of how well measures of bone mineral density predict occurrence of osteoporotic fractures. Br J Med 1996;312:1254-59.
8.42 Bouxsein ML, Courtney AC, Hayes WC. Ultrasound and densitometry of the calcanues correlate with the failure loads of cadaveric femurs. Calcif Tissue Int 1995 ; 56:99- 103 .
9.1 Miller PD, Bonnick SL, Rosen CJ. Consensus of an international panel on the clinical utility of bone mass measurements in the detection of low bone mass in the adult population. Calcif Tissue Int 1996;58:207-14.
9.2 Bergstrom R, Bergkvist L. Hormone replacement therapy and the risk for first hip fracture. A prospective, population-based cohort study. Ann Intern Med 1990;113:95- 103 .
9.3 Cauley JA, Seely DC, Ensrud K, Ettinger B, Black D, Cummings SR. Estrogen replacement therapy and fractures in older women. Ann Intern Med 1995;122:9-16.
9.4 Ettinger B, Genant HK, Cann CE. Long-term estrogen replacement therapy prevents bone loss and fractures. Ann Intern Med 1985;102:319-24.
9.5 Spector TD, Brennan P, Harris PA, Studd JWW, Silman AJ. Do current regimes of hormone replacement therapy protect against subsequent fractures? Osteoporosis Int 1992;2:219-
■24.9.6 Grey AB, Cundy TF, Reid IR. Continuous combined
oestrogen/progestogen therapy is well tolerated and increases bone mineral density at the hip and the spine in postmenopausal women. Clin Endocrinol 1994;40:671-7.
1
269
:;î
9.7 Hasling C, Charles P, Jensen FT, Mosekilde L. A comparison of the feffects of oestrogen/progestogen, high-dose oral calcium, intermittent cyclical etidronate and an ADFR
,regime on calcium kinetics and bone mass in postmenopausal women with spinal osteoporosis. Osteoporosis Int 1994/4 :191-203.
9.8 Kohrt WM, Snead DB, Slatopolsky E, Birge SJ. Addiitive effect of weight-bearing exercise and estrogen on bone mineral density in older women. J Bone Miner Res 1995;10:1303-11.
9.9 Grey A, Cundy T, Evans M, Reid I. Medroxyprogesterone acetate enhances bone mineral density response to oestrogen in late post-menopausal women. Clin Endocrinol 1996;44:293-6.
9.10 Evans SF, Davie MWJ. Low and conventional dose transdermal oestradiol are equally effective at preventing bone loss in spine and femur at all postmenopausal ages. Clin Endocrinol 1996;44:79-84.
9.11 Kohrt WM, Birge SJ. Differential effects of estrogen treatment on bone mineral density of the spine, hip, wrist and total body in late postmenopausal women. Osteoporosis Int 1995;5:150-5.
9.12 Armamento-Villareal R, Civitelli R. Estrogen action on the bone mass of postmenopuasal women is dependent on body mass and initial bone density. J Clin Endocrinol Metab 1995;80:776-82.
9.13 Wimalawansa SJ. Combined therapy with estrogen and.etidronate has an additive effect on bone mineral density
in the hip and vertebrae: four-year randomised study. Am J Med 1995;99:35-42.
9.14 Marslew U, Overgaard K, Riis BJ, Christiansen C, Two new combinations of estrogen and progestogen for prevention of postmenopausal bone loss: long term effects on bone, calcium, and lipid metabolism, climacteric symptoms and bleeding. Obstet and Gynecol 1992;79:202-10.
9.15 Storm T, Thamsberg G, Steiniche, Genant HK, Sorensen OH. Effects of intermittent cyclical etidronate therapy on bone mass and fracture rate in women with postmenopausal osteoporosis. N Eng J Med 1990;322:1265-71.
9.16 Watts NB, Harris ST, Genant HK et al. Intermittent cyclical etidronate treatment of postmenopausal osteoporosis. N Engl J Med 1990;323:73-9.
9.17 Storm T, Kollerup G, Thamsborg G, Genant HK, Sorensen OH. Five years of clinical experience with intermittent cyclical etidronate for postmenopausal osteoporosis. J Rheumatol 1996;23:1560-4.
9.18 Hillard TC, Whitcroft SJ, Marsh MS et al. Long-term effects of transdermal and oral hormone replacement therapy on postmenopausal bone loss. Osteoporosis Int 1994;4:341-8.
9.19 Marcelli C, Favier F, Kotzki PO, Ferrazzi V, Picot M-C,Simon L. The relationship between osteoarthritis of thehands, bone mineral density , and osteoporotic fractures .in elderly women. Osteoporosis Int 1995;5:382-8.
9.2 0 Silberstein EB, Schnur W. Cyclical oral phosphate and etidronate increase femoral and lumbar bone mineral density and reduce lumbar spine fracture rate over three years. J Nuc Med 1992;33:1-5.
9.21 Harris ST, Watts NB, Jackson RD et al. Four-year study of intermittent cyclical etidronate treatment of postmenopausal osteoporosis: three years of blindedtherapy followed by one year of open therapy. Am J Med 1993;95:557-67.
270
9.22 Hassager C, Jensen SB, Christiansen C. Non-responders to hormone replacement therapy for the prevention of postmenopausal bone loss: do they exist? Osteoporosis Int 1994;4:36-41.
9.23 Evans RA, Somers NM, Dunstan CR, Royle H, Kos S. The effect of low dose cyclical etidronate and calcium on bone mass in early postmenopausal women. Osteoporosis Int 1993;3:71-5.
9.24 Riggs BL, Melton LJ, O'Fallon WH. Drug therapy for vertebral fractures in osteoporosis: evidence that decreases in bone turnover and increases in bone mass both determine anti-fracture efficacy. Bone 1996 ;18(Suppl 3):197S-201S.
10.1 Avioli LV. Heparin induced osteopenia: an appraisal. Adv Exp Biol Med 1975;52:375-87.
10.2 Hall JG, Paul RM, Wilson KM. Maternal and fetal sequelae of anticoagulation during pregnancy. Am J Med 1980;79:122- 40 .
10.3 Shaul W, Emery H, Hall JC. Chondrodysplasia punctata and maternal warfarin use during pregnancy. Am J Dis Child 1975;129:360-2.
10.4 Fiore CE, Tamburino C, Foti R, Grimaldi D. Reduced bone mineral content in patients taking oral anticoagulants. South Med J 1990,83 ;538-42 .
10.5 Resch H, Pietschmann P, Krexner E, Willvonseder R. Decreased bone mineral content in patients under anticoagulant therapy with phenprocoumon. Eur Heart J 1991;12:439-41.
10.6 Haarlem LJM, Knapen MJH, Hamulyak K, Vermeer C. Circulating osteocalcin during anticoagulant therapy. Thrombos Haemost 1988;60:79-82.
10.7 Price PA, Williamson MK, Effects of warfarin on bone. J Biol Chem 1981;256:12754-9
271
'10.8 Gennari C, Civitelli R. Glucocorticoid-induced osteoporosis. Clin Rheum Dis 1986;12:637-54.
10.9 Price PA, Kaneda Y. Vitamin K counteracts the effects of warfarin in liver but not in bone. Thromb Res 1987/46:121- 31.
10.10 Mazess RB, Bardon H, Ettinger M, Schultz E. Bone density of the radius, spine, and proximal femur in osteoporosis.J Bone Miner Res 1988;3:13-8.
10.11 Riggs BL, Melton LJ. Involutional osteoporosis. N Engl J Med 1986;314:1676-86.
10.12 Black DM, Cumming SR, Genant HK, Nevitt MC, Palermo L, Browner W. Axial and appendicular bone mineral density predict fractures in older women. J Bone Miner Res 1992;7:633-8.
10.13 Cumming SR, Black DM, Nevitt MC et al. Appendicular bone density and age predict hip fractures in women. JAMA 1990;263;655-8 .
11.1 Deodhar AA, Woolf AD. Bone mass measurement and bone metabolism in rheumatoid arthritis: A review. Br J Rheumatol 1996;35:309-22.
11.2 Butler RC, Davie MWJ, Worsfold M, Sharp CA. Bone mineral content in patients with rheumatoid arthritis: relationship to low-dose steroid therapy. Br J Rheum 1991;30: 86-90.
11.3 Verstraeten A, Dequeker J. Vertebral and peripheral bone mineral content and fracture incidence in postmenopausal patients with rheumatoid arthritis: effect of low dose corticosteroids. Ann Rheum Dis 1986;45:852-76.
11.4 Gough AKS, Lilley J, Eyre S, Holder RL, Emery P. Generalised bone loss in patients with early rheumatoid arthritis. Lancet 1994;344:23-7.
■f
272

11.5 Reid DM, Kennedy NS, Smith MA, Tothill P, Nuki G. Total body calcium in rheumatoid arthritis: effects of disease activity and corticosteroid treatment. Br Med J 1982 ;285:330-2 .
11.6 Sambrook PN, Cohen ML, Eisman JA, Pocock NA, Champion GD, Yeates MG. Effect of low dose corticosteroid on bone mass in rheumatoid arthritis: a longitudinal study. Ann Rheum Dis 1989;48:535-8.
11.7 Sambrook PN, Eisman JA, Champion GD, Yeates MG, Pocock NA, Eberl S. Determinants of axial bone loss in rheumatoid arthritis. Arthritis Rheum 1987;30:721-8.
11.8 Hall GM, Spector TD, Griffin AJ, Jawad ASM, Hall ML, Doyle DV. The effect of rheumatoid arthritis and steroid therapy
■V':
on bone density in postmenopausal women. Arthritis Rheum 1993 ;36: 1510-6.
11.9 Lo Cascio V, Bonucci E, Imbimbo B et al. Bone loss in response to long-term glucocorticoid therapy. Bone Miner 1990;8:39-52.
11.10 Arnett EC, Edworthy SM, Bloch DA et al. The American Rheumatism Association 1987 revised criteria for the classification of rheumatoid arthritis. Arthritis Rheum 1988; 31:315-24.
11.11 Sambrook PN, Ansell BM, Foster S, Gumpel JM, Hesp R, Reeve J. Bone turnover in early rheumatoid arthritis. 2. Longitudinal bone density studies. Ann Rheum Dis 1985;44; 580-4.
11.12 Sambrook PN, Shawe D, Hesp R et al. Rapid periarticular bone loss in rheumatoid arthritis. Arthritis Rheum 1990;33:615-22.
11.13 Toyoda T, Inokuchi 8, Saito S, Horis Y, Tomita S. Bone loss of the radius in rheumatoid arthritis. Comparison between 34 patients and 40 controls. Acta Orthop Scand1996;67:269-73.
'
I
273
11.14 Joffe I, Epstein S. Osteoporosis associated with rheumatoid arthritis: pathogenesis and management. Seminars in Arthritis Rheum 1991;20:256-72.
11.15 Lane NE, Pressman AR, Star VL, Cummings SR, Nevitt MC. Rheumatoid arthritis and bone mineral density in elderly women. J Bone Miner Res 1995;10:257-63.
11.16 Sambrook PN, Eisman JA, Yeates, Pocock NA, Eberl S, Champion GD. Osteoporosis in rheumatoid arthritis: safety of low dose corticosteroids. Ann Rheum Dis 1986;45:950-3
11.17 Cooper C, Coupland C, Mitchell M . Rheumatoid arthritis, corticosteroid therapy and the risk of hip fracture. Ann Rheum Dis 1995;54:49-52.
11.18 Laan RFJM, van Riel PLCM, Erning LJTO, Lemmens JAM, Riujs SHJ, van de Putte LBA. Vertebral osteoporosis in rheumatoid arthritis patients: effect of low dose prednisolone therapy. Br J Rheumatol 1992;31:91-6.
11.19 Martin JC, Reid DM. Appendicular measurements in screening women for low axial bone mineral density. Br J Radiol 1996;69:234-40.
11.20 Peel NFA, Moore DJ, Barrington NA, Bax DE, Eastell R. Risk of vertebral fracture and relationship to bone mineral density in steroid treated rheumatoid arthritis. Ann Rheum Dis 1995;54:801-6.
11.21 Reid DM, England AJ. Peripheral bone mass measurements - is there any clinical value in rheumatoid arthritis? Br J Rheumatol 1996;35:109-10.
12.1 Parfitt AM. Problems in the application of in vitrosystems to the study of human bone remodelling. Calcif Tissue Int 1995 ; 56(Suppl 1):S5-S7.
12.2 Feldkamp LA, GoldsteinSA, Parfitt AM, Jesion G, Kleerekoper M. The direct examination of three-dimentional bone architecture in vitro by computed tomography. J Bone Miner Res 1989;4:3-11.
274
12.3 Kuhn JL, Goldstein SA, Feldkamp LA, Goulet RW, Jesion G Evaluation of a microcomputed tomography system to study trabecular bone structure. J Orthop Res 1990;8:833-42.
12.4 Durand EP, Ruegsegger P. Cancellous bone structure: Analysis of high resolution CT images with run-length methods. J Comput Assist Tomogr 1991;15:133-39.
12.5 Kaissl W, Reugsegger P. 3D-QCT at peripheral measuring sites. Osteoporosis Int 1991:1:193.
12.6 Chevalier F, Laval-Jeantet AM, Laval-Jeantet M, Bergot C. CT images of the vertebral trabecular network in vitro. Calcif Tissue Int 1992;51:8-13.
12.7 Gordon CL, Webber CE, Adachi JD, Christoforous N. In vivo assessment of trabecular bone structure at the distal radius from high resolution computed tomography images. Phys Med Biol 1996;41:495-508.
12.8 Muller R, Hahn M, Vogel M, Delling G, Ruegsegger P. Morphometric analysis of non-invasively assessed bone biopsies: comparison of high resolution computed tomography and histologic sections. Bone 1996;18:215-20.
275

APPENDIX 1 Glossary of Abbreviations
ACTHAPANOVAAPAUCBMDBMUBUAX"
CAMPCMCTCVdB/MHzDHEADPADXAETDFNFSHFTFWgHRTHVRkg
LARSL2-L4LHLHRHLS
Adrenocorticotrophic Hormone Atrial Fibrillation Analysis of Variance Antero-posterior Area Under the Curve Bone Mineral Density Basic Multicellular UnitBroadband Ultrasound Attenuation (calcaneal site)
Chi squareCyclic Adenosine-3',5'-monophosphatecenti-meterComputed TomographyCo-efficient of VariationDecibel / Mega HertzDehydroepiandrosteroneDual Photon AbsorptiometryDual Energy X-Ray AbsorptiometryEtidronateDXA Femoral Neck BMD Follicle Stimulating Hormone DXA Femoral Trochanter BMD DXA Femoral Ward's Area BMD grammesHormone Replacement Therapy Heart Valve Replacement Kilogram Larsen Score2nd to 4th lumbar vertebrea Luteinizing HormoneLuteinizing Hormone Releasing Hormone DXA Lumbar Spine BMD
276
mm/sMCPMXANS1-CTP
1-NTP
PBMPICPPINPPIPPOSTPREpQCT
PVDQcortQCTQscortQtotQtrabRARA+PRhFROCROISDSPAT4-L5T-Score
MeterMeter / Second Metacarpo-Phalangeal Joint Morphometric X-ray Absorptiometry Statistically Non-SignificantCross-linked Carboxyterminal Telopeptide of Type 1 CollagenCross-linked Aminoterminal Telopeptide of Type 1 Collagen Peak Bone MassCarboxyterminal Propeptide of Type 1 Collagen Aminoterminal Propeptide of Type 1 Collagen Proximal Inter-Phalangeal Joint Postmenopausal Women Premenopausal WomenPeripheral Quantitative Computed Tomography (ultra-distal radial site)Peripheral Vascular DiseasepQCT Cortical BMDQuantitative Computed TomographypQCT Subcortical BMDpQCT Total BMDpQCT Trabecular BMDRheumatoid ArthritisSteroid Treated RA groupRheumatoid FactorReceiver Operator CurveRegion of InterestStandard DeviationSingle Photon Absorptiometry4th thoracic to 5th lumbar vertebraeThe number of standard deviations above orbelow the mean value of young normals
,
II
i
:î
I277

VN Voxel NumberVN-diff Difference in voxel numbersVOS Ultrasonic Velocity {calcaneal site)VTE Recurrent Venous Thrombo-embolismWB DXA Whole BodyWB-ARM DXA Arm BMD (derived from the whole body DXA
scan image)WB-BMD DXA Whole Body BMDYPM Years Postmenopauseyr YearZ-Score The number of standard deviations above or
below the sex and age related normal mean
278
APPENDIX 2 Papers Published from the Thesis Work
1. Philip WJU, Martin JC Richardson JM, Webster J, Reid DM, Douglas AS. Decreased axial and peripheral bone mineral density in patients taking long term warfarin.Quarterly Journal of Medicine 1995;88:635-40
2. Martin JC, Reid DM.Appendicular measurements in screening women for low axial bone mineral density.British Journal of Radiology 1996;69:234-40
3. Martin JC, Munro R, Campbell MK, Reid DM.Effects of disease and corticosteroids on appendicular bone mass in postmenopausal women with rheumatoid arthritis: comparison with axial measurements.British Journal of Rheumatology 1997;36:43-50
■1.
I
279
APPENDIX 3 Abstracts Published from the Thesis Work
2. Martin JC, Reid DM.Comparison of dual energy x-ray absorptiometry (DXA), peripheral quantitative computed tomography (pQCT) and ultrasound of the os calcis (CUBA) in screening perimenopausal women for osteopenia. Bone & Tooth Society, London, Dec 1993.Bone 1994
3. Martin JC, Philip W, Richardson J, Webster J, Reid DM, Douglas AS.
280
I
Martin JC. Munro R, Reid DM.Comparison of peripheral and axial bone mineral density (BMD) with bone ultrasound in postmenopausal women with rheumatoid arthritis on longterm corticosteroids.British Journal of Rheumatology 1992 ;32(Abst Suppl) :40
Effects of longterm warfarin therapy on bone mineraldensity (BMD) at peripheral and axial sites. Scottish Medical Journal 1994/39:153
Martin JC, Munro R, Reid DM.Bone mass at multiple bone sites in Rheumatoid Arthritis (RA): Effects of disease and corticosteroid therapy. British Journal of Rheumatology 1994/33(Abst Suppl 1):83
Martin JC, Reid DM. Comparison of axial and peripheral bone loss in perimenopausal women.Bone and Mineral 1994/25(Abst Suppl 2):S2 7
7. Martin JC. A England, DM Reid
1Reid DM.The use of scan voxel numbers to improve the precision of peripheral quantitative computed tomography (pQCT).Current Research in Osteoporosis and bone Mineral Measurement III 1994: p53
Can changes in appendicular bone predict axial bone mineral density (BMD) during treatment with hormone replacement therapy (HRT) and cyclical etidronate?. British Journal of Rheumatology 1995/34(Abst Suppl 2):S72
Reid DM, Stewart A, Martin JC.Does quantitative ultrasound have utility in predicting fractures and monitoring therapy in osteoporosis: comparison with dual enery X-ray absorptiometry (DXA). Current Research in Osteoporosis and bone Mineral Measurement IV 199 6: p57
9. Martin JC, A Stewart, DM ReidDiscrimination of hip fractures by peripheral quantitative computed tomography (pQCT): comparison with dual energy x- ray absorptiometry (DXA) of the hip and calcaneal ultrasound measurements.British Journal of Rheumatology 1996/35(Abst Suppl 2):p6.
£i

APPENDIX 4 Presentations from the Thesis to LearnedSocieties
1. Effects of longterm warfarin therapy on bone mineral density (BMD) at peripheral and axial sites.Scottish Society for Experimental Medicine, Dundee, December 1993.
2. Bone mass at multiple bone sites in Rheumatoid Arthritis (RA): Effects of disease and corticosteroid therapy. British Society for Rheumatology General Meeting, Brighton April 1994.
3. Comparison of axial and peripheral bone loss in perimenopausal women.The 10th International Bone Densitometry Workshop, Venice, April 1994.
4. The use of scan voxel numbers to improve the precision of peripheral quantitative computed tomography (pQCT),The 4th Bath Conference on Osteoporosis and Bone Mineral Measurement, June 1994.
GLASGOWONIVERSnrIHRART
282