10390544.pdf - Enlighten: Theses
344
https://theses.gla.ac.uk/ Theses Digitisation: https://www.gla.ac.uk/myglasgow/research/enlighten/theses/digitisation/ This is a digitised version of the original print thesis. Copyright and moral rights for this work are retained by the author A copy can be downloaded for personal non-commercial research or study, without prior permission or charge This work cannot be reproduced or quoted extensively from without first obtaining permission in writing from the author The content must not be changed in any way or sold commercially in any format or medium without the formal permission of the author When referring to this work, full bibliographic details including the author, title, awarding institution and date of the thesis must be given Enlighten: Theses https://theses.gla.ac.uk/ [email protected]
-
Upload
khangminh22 -
Category
Documents
-
view
0 -
download
0
Transcript of 10390544.pdf - Enlighten: Theses

https://theses.gla.ac.uk/
Theses Digitisation:
https://www.gla.ac.uk/myglasgow/research/enlighten/theses/digitisation/
This is a digitised version of the original print thesis.
Copyright and moral rights for this work are retained by the author
A copy can be downloaded for personal non-commercial research or study,
without prior permission or charge
This work cannot be reproduced or quoted extensively from without first
obtaining permission in writing from the author
The content must not be changed in any way or sold commercially in any
format or medium without the formal permission of the author
When referring to this work, full bibliographic details including the author,
title, awarding institution and date of the thesis must be given
Enlighten: Theses
https://theses.gla.ac.uk/

REGULATION OF IMMUNE RESPONSES BY THE L3 OF Bmgia pahangi
VICTORIA ANN GILLAN
A thesis submitted for the degree of Doctor of Philosophy
Department of Veterinary Parasitology, Faculty of Veterinary Medicine
Glasgow University
February 2004
©V.A. Gillan 2004

ProQuest Number: 10390544
All rights reserved
INFORMATION TO ALL USERS The quality of this reproduction is dependent upon the quality of the copy submitted.
In the unlikely event that the author did not send a com p le te manuscript and there are missing pages, these will be noted. Also, if material had to be removed,
a note will indicate the deletion.
uestProQuest 10390544
Published by ProQuest LLO (2017). Copyright of the Dissertation is held by the Author.
All rights reserved.This work is protected against unauthorized copying under Title 17, United States C ode
Microform Edition © ProQuest LLO.
ProQuest LLO.789 East Eisenhower Parkway
P.Q. Box 1346 Ann Arbor, Ml 48106- 1346

Table of Contents
Table of Contents i
DECLARATION x
ACKNOWLEDGEMENTS xi
SUMMARY xiii
LIST OF ABBREVIATIONS xvi
LIST OF FIGURES AND TABLES xxi
Chapter 1. Introduction 1
1.1. Parasite Life Cycle 2
1.2. The Clinical Spectrum o f Disease 3
1.2.1. The microfilaraemic state 4
1.2.2. Acute manifestation of Lymphatic Fiiariasis 4
1.2.3. Chronic manifestations of Lymphatic Fiiariasis 5
1.2.4. Tropical Pulmonary Eosinophilia 5
1.2.5. Endemic Normals 6
1.3. Diagnosis and Treatment 6
1.3.1 Parasitological diagnosis 6
1.3.2 Serodiagnosis 8
1.3.3. Treatment and control of Lymphati c Filariasi s 8
1.4. Immunology o f Lymphatic Fiiariasis 9
1.4.1. Proliferative suppression 10
1.4.2 In utero exposure to filarial Ag 11
1.4.3. lL-4 in Lymphatic Fiiariasis 12
1.4.4. IL-10 in Lymphatic Fiiariasis 14
1.4.5. The role of Antigen Presenting Cells in Lymphatic Fiiariasis 18
1.4.6. T regulatory cells in Lymphatic Fiiariasis 20
1.4.7. The importance of the L3 in Lymphatic Fiiariasis 22
1.5. Mouse model o f fiiariasis 25

1.5.1. Murine infection with MF 26
1.5.2. Murine infection with adult parasites 28
1.5.3. Murine infection with L3 30
1.6. Iinmunoregulation 33
1.6.1. T cell phenotype and effector function 33
1.6.2. T cell activation and tolerance 34
1.6.3. B7-1/B7-2-CD28/CTLA-4 pathway 36
1.6.4. CD28 and CTLA-4 - opposing functions 37
1.7. Factors influencing the pathway o fT cell differentiation 41
1.7.1. The role of the APC 41
1.7.2. B7-1 and B7-2 can bias towards the Thl or Th2 phenotype 46
1.7.3. The role of cytokines 47
1.7.3.1. The lL-12 family of Thl inducing cytokines 47
1.7.3.1.1. lL-12 47
1.7.3.1.2. IL-23 and lL-27 49
1.7.3.2. lL-4andIL-13 50
1.7.3.3. IL-lOandTGF-P 51
1.8. Parasitic models ofThl/Th2 development 57
1.9. Treg cells 60
1.10 Aims of thesis 64
11

Chapter 2. Materials and Methods 66
2.1. The Parasite 66
2.1.1. Mosquito life cycle 66
2.1.2. Parasite life cycle 66
2.1.3. Recovery of infective larvae and microfilariae 67
2.1.4. Preparation of adult antigen extracts 67
2.2. Animals and infection protocols 67
2.2.1. Standard infections 67
2.2.2. Mosquito infections with L3 68
2.2.3. Adult implants 6 8
2.2.4. Other mouse strains 69
2.3. Preparation o f spleen cells 69
2.3.1. Proliferation assay 70
2.3.2. In vitro treatments 70
2.3.3. In vivo treatments 71
2.3.4. Analysis of cytokine production by ELISA 71
2.3.5. Analysis of nitrite by the Greiss reaction 73
2.4. FACS staining 73
2.4.1. Cell surface staining 7 3
2.4.2. CFSE staining 74
2.4.3. FACS gating 75
2.5. Magnetic Separations 80
2.5.1. Cell depletion 80
2.5.2. Cell purification 81
2.6. Analysis o f cytokine mRNA expression following infection with L3 82
2.6.1. RNA extraction 82
2.6.2. RT-PCR detection of ÎL-10 and TGF-p 83
2.6. Statistical analysis 87
2.7. Buffers/Solutions 87
2.7.1. Cell culture 87
2.7.2. General purpose 87
111

2.7.3. ELISA buffers 87
2.7.4. RNA preparation 87
2.7.5. DNA preparation 88
2.7.6. FACS buffers 88
2.7.7. MACS buffer 89
2.7.8. Greiss reagent 89
.
IV

Chapter 3. Infection of IL-4-/- mice with L3 ofB. pahangi results in increased
microfilaraemia and a skewed immune response 90
5.1. Introduction 90
3.2. Results 93
3.2.1. Investigating the role o f IL~4 in vivo 93
(i) Worm recoveries from IL-4-/- mice 93
(ii) MF recovery from IL-4-/- and WT mice 93
(iii) Recovery of MF after implantation of adult worms 94
3.2.2. Cellular recruitment into the peritoneal cavity of IL-4-/- mice 95
3.2.3. Ag-specific immune responses of splenocytes from L3 infected and IL-4-/-
BALB/c mice 95
(i) Ag-specific cytokine responses 96
(ii) Ag-specific proliferative responses 96
(iii) ConA driven proliferative responses 97
3.2.4. Investigating the proliferative defect observed in IL-4-/- mice 97
(i) CFSE staining of cells from L3 infected IL-4-/- and wild-type mice in Ag
stimulated culture 97
(ii) Ex vivo staining of splenocytes from L3 infected and control IL-4-/- and wild-
type mice 98
(iii) Production of NO 99
(iv) Inhibition of iNOS with AMG 99
(v) Neutralization of IFN -y 100
(vi) Addition of recombinant-IL-4 to cultures of Ag-stimulated splenocytes from L3
infected IL-4-/- and wild-type mice 101
3.3. Discussion 117

Chapter 4, IL-10 down-regulates Thl cytokine production and CD4^cell
proliferation in L3 infection 125
4.1. Introduction 125
4.2. Results 129
4.2.1. Ag-spedfic immune responses of splenocytes from L3 infected mice +/- anti-
IL-lOMAb 129
(i) Ag-specific cytokine responses 129
(ii) Ag-specific proliferative responses 130
4.2.2. Investigating the cellular source of IL-10 130
4.2.2.1. In vitro depletion experiments 130
(i) Depletion of CD4^ cells 131
(ii) Depletion of B cells 131
4.2.2.2. S emi - quantitative real time RT-PGR 131
(i) IL-10 mRNA expression in CD4^ and B220^ cells 132
4.2.3. Investigating the role of IL-10 in vivo 132
(i) Ag-specific proliferative responses of splenocytes from L3 infected mice in
which IL-1 OR has been blocked 13 3
(ii) Ag-specific cytokine responses of splenocytes from L3 infected mice in which
IL-1 OR has been blocked 133
(iii) CFSE staining of cells from L3 infected mice in which IL-IOR has been blocked
134
(iv) Ex vivo staining of splenocytes from L3 infected mice in which IL-IOR has
been blocked 135
4.2.4. The role of mosquito transmission on immune responses 135
(i) Cytokine responses of splenocytes and lymph nodes of mice infected with L3
via syringe or natural transmission 136
(ii) Ag-specific proliferative responses of splenocytes and lymph node cells of mice
infected with L3 via syringe or natural transmission 136
4.2.5. Infection with different doses of L3 137
(i) Cytokine responses of splenocytes of mice infected with 50, 25 or 10 L3 137
(ii) Ag-specific proliferative responses of splenocytes of mice infected with 50, 25
or 10 L3 138
VI

Chapter 5. The L3 of B. pahangi elicits a population of CD4 CD25 CTLA-4^ cells
which regulate proliferation and cytokine production 161
5.1. Introduction 161
5.2. Results 164
5.2.1. T cell characterization 164
(i) IL-10 and TGF-(3 mRNA expression in CD4+ cells from L3 infected mice
164
(ii) Three-colour FACS analysis of CD4'*' cells from L3 infected mice 164
5.2.2. L3 induced CD4^CD25^CTLA4^ cells are IL-4 independent 166
(i) IL-10 and TGF-p expression is IL-4 independent 166
(ii) Tlu'ee-colour FACS analysis of CD4^ cells from L3 infected wild-type and IL-4-
/ - mice 166
5.2.3. Investigating the regulatory role of CD25^ cells in vivo 167
(i) Three-colour FACS analysis of CD4^ cells from L3 infected mice given
neutralizing CD25" Ab (PC61) 167
(ii) Ag-specific and spontaneous proliferation of splenocytes from L3 infected mice
given PC61 and GLl 13 168
(iii) Ag-specific and spontaneous cytokine production of splenocytes from L3
infected mice given PC61 or GLl 13 169
5.3. Discussion 183
Vlll

Chapter 6. B cells modulate immune responses in mice infected with L3 190
6.L Introduction 190
6.2. Results 193
6.2.1. The role of B cells in L3 infection 193
(i) B cell depletion and pMT experiments 193
(ii) Ag-specific proliferative responses 193
(iii) CFSE labelling of splenocytes from L3 infected mice 194
(iv) Ag-specific cytokine responses after in vitro depletion of B cells 195
(v) Ag-specific cytokine responses of L3 infected pMT mice 195
6.2.2. Investigating a role for B7 cell surface molecules expressed on B cells 196
(i) B7-1 and B7-2 expression on the surface of B220^ cells 196
(ii) Effect of IL-10 on the expression of B7-1 and B7-2 on the surface of B220'^ cells
197
(iii) Effect of in vitro neutralization of IL-10 on B7-1 and B7-2 expression 197
(iv) B7-I and B7-2 expression in IL-10-/- mice 198
(v) Effect of neutralizing B7-1 and B7-2 on Ag-specific proliferation 199
(vi) Effect of neutralizing B7-1 and B7-2 on Ag-specific cytokine production
199
6.3. Discussion 216
Chapter 7. General Discussion 223
References 232
IX

DECLARATION
The author was responsible for all the experiments carried out in this thesis, except
where it is otherwise stated. No part of this work has been submitted for any other
degree but has been reproduced in part in the following publication:
Devaney, E., V. Gillan, I. Wheatly, J. Jenson, R. O’Connor and P. Balmer. 2002.
Interleukin-4 influences the production of microfilariae in a mouse model of Brugia
infection. Parasite Immunol. 24: 29-37.
Victoria Gillan
January 2004
X

ACKNOWLEDGEMENTS
At the top of the list I would like to thank my supervisor, Professor Eileen Devaney, for
her support and encouragement, not to mention her patient critical reading of this
manuscript. Huge thanks to everyone I have worked with in the department. Thanks to
those who started me off, Paul Balmer and Jessica Jenson for patient explanations and
to Isia Wheatly. To Richard O ’Connor, who despite being a million miles away remains
a great friend with a superb sense of perspective (as well as being a demon on the axe).
To Fiona Thompson for not just giving out mol-biol advice, but for always being a
supportive, true friend. To all the remaining ED labettes, Kerry O’Neill for all her
brilliant teclmical help, for always laughing at my jokes and for choccies when I was
blue. To Mags McFayden for all her long hours in the insectary and shoulder massages
when I was in knots. To Kirsty Maitland, for being the new guy at the same time as me
and for always being a calming influence (and for providing lab mascot, Morgan). To
Tez Scanlon, heehee, too many good nights and great chats to get into, thanks for those,
they were greatly needed! Also to Dr Jane Kinnaird who has helped me out on
occasions when I needed her most - thank you. Thanks also to Willie Weir for all his
help with PC hell! Big thanks to everyone downstairs, Neil Bennet, Colin Chapman,
Catriona and Davie.
Thank you to the MRC for funding for this project and to the University of Glasgow for
allowing me to study here and to Professor Tait, the Department of Vet Parasitology for
funding my travel to international meetings. Thank you to Dr Rachel Lawrence for
allowing us to carry out experiments in her lab in Manchester and providing us with
pMT mice. Also thank you to Dr Judi Allen for having pMT mice sent to Glasgow for
me and to Helen Goodridge for all her excellent TaqMan tuition. Thank you also to Dr
Adrian Mountford for providing the PC61 cell-line. Special mention has to go to all
those at Manchester University who made me feel like part of their team in Boston
when I was on my lonesome.
Many thanks go out to my friends and family who have had to put up with me (and not
only in the last three years). To Gillian for convincing me to do this in the first place
and being the best flat mate ever. To Wendy, Katie and Elizabeth for being the ones I
rely on for all forms of mental health! The best friends I could ever have asked for. To
XI

Melissa and Robyn for constantly reminding me of the important things in life and to
Jules for many cups of tea in the barn over the last three years. Also to the team at 62
Great George Street, late nights, games galore and laughs. One member in particular
though, Graeme Gillan, for being a constant source of pride and delight - everyone
should have a brother and friend like him. And to my other “favourite boy.” Special
thanks to Rob for putting up with it ALL and for always trying his best to understand.
For making life easier just by being there. Thanks also to Tony for providing rest and
recuperation in the sun. And last but not least, to my parents for their love and support.
Thanks to my Dad for hilarious presents and for always keeping a cool-head and to my
Mum, for “just doing her job” but forever going above and beyond the call of duty.
XII

SUMMARY
Lymphatic filarial worms are mosquito borne parasites which cause chronic disease in
humans. Infection is characterized by proliferative suppression of T cells in the host and
a skewing of the immune response, away from an IFN-y producing Thl response,
towards a Tli2 or regulatory phenotype, with production of IL-4 and IL-10. In this
study, a mouse model was used to investigate the role of the infective form of the
parasite (the third stage larvae, L3) in regulating immune responses. BALB/c mice were
infected by the subcutaneous route to mimic the natural transmission of the parasite, and
immune responses generated by the L3 were analysed.
Experiments carried out in the intact BALB/c mouse showed that infection with L3
results in increased IL-4, IL-10 and IL-5 with no IL-2 or IFN-y, a similar situation to
that observed in infected humans. In order to investigate the key components in this
skewing of the immune response, experiments were carried out using IL-4-/- mice. IL-4
was shown to have a role in down-regulating Thl responses in wild type mice, as
Imock-out animals produced elevated levels of IL-2 and IFN-y. Flowever these mice still
had the capacity to produce IL-5, IL-13 and IL-10, suggesting that although IL-4 is an
important Th2 cytokine, it may be dispensable in the initiation of such a response. In
addition, reduced levels of proliferation of CD4^ and B220^ cells were observed in
infected IL-4-/- mice. Despite elevated levels of IFN-y, this reduction in proliferation
was not associated with increased production of NO, and neutralizing IFN-y itself did
not restore proliferative responses. Addition of iiL-4 to cultures of splenocytes from
these mice had a mild effect but did not result in a significant increase in proliferation.
Treatment of splenocytes from intact mice with anti-IL-10 MAb in vitro resulted in
increased levels of IL-2 and IFN-y, but no significant effect on Ag-specific proliferation
was observed. However, when mice were treated with an anti-IL-lOR MAb the opposite
effect was seen, with a significant increase in levels of proliferation and no alteration in
cytokines. When examined by FACS it was shown that CD4" cells were the major
population which expanded during IL-IOR blockade. In addition, CD4^ cells were
found to be the major source of IL-10 post-infection with L3, suggesting these cells may
X lll

modulate their own proliferation, or perhaps these cells were of a regulatory nature.
Experiments were also carried out to determine the effect of natural transmission on
host immune responses. L3 were administered via syringe inoculation or via mosquito
transmission. Splenocytes from mice infected via syringe inoculation had an increased
capacity to produce cytokines and displayed higher levels of proliferation. Further
experiments demonstrated that cytokine and proliferative responses were not dose-
dependant therefore there may be factors within mosquito saliva which down-regulate
immune responses in the mouse model.
To further characterize the cellular source of IL-10 produced in response to infection
with L3, RT-PCR was carried out. These experiments demonstrated that CD4^ cells
produce not only IL-10 but another regulatory cytokine TGF-(3. Further phenotypic
analysis of the CD4’ population in L3 infected mice identified a small percentage of
CD4^CD25^CTLA-4^ cells which were not present in MF infected or control mice.
These cells were IL-4 independent, as was expression of IL-10 and TGF-
(3 mRNA. Limiting the expansion of these cells in vivo with the administration of an
anti-CD25 MAb, resulted in elevated levels of Ag-specific and spontaneous cytokine
and proliferative responses, indicating that these cells are essential for regulating
immune responses to infection with L3.
The aim of the final part of this study considered the role of B cells in L3 infection. It
was shown by CFSE staining that B cells were the major population which proliferate in
response to restimulation with parasite Ag, and B cells were also shown to be a source
of IL-10, suggesting an important function for these cells. Experiments carried out in
pMT mice confirmed results from depletion experiments as levels of Ag-specific
proliferation were decreased in these mice. However, B cell depletion experiments
showed that levels of IFN-y were significantly increased post-depletion, with decreased
levels of Th2 cytokines and IL-10, suggesting that B cells are important in maintaining
Th2 responses at least in the BALB/c mouse. This profile of cytokine responses differed
from that in pMT mice. Further experiments demonstrated that B cells act as APC in
this system, as most B7-l^ and B7-2‘ cells in splenocyte cultures from L3 infected mice
were also B220^. B7-1 and B7-2 expression was shown to be regulated by IL-10 as
neutralizing IL-10 in vitro or analyzing splenocytes from IL-10-/- mice resulted in
XIV

significantly increased expression of these costimulatory molecules. As B cells have
been shov^n to be a source of IL-10, this suggests another mechanism of negative
feedback, where production of IL-10 leads to down-regulation of costimulatory
molecules on the surface, thus attenuating the efficiency of these cells to present Ag to
CD4^ cells.
XV

LIST OF ABBREVIATIONS
Ab antibody
Ag antigen
AMG aminoguanidine
APC allophycocyanin
APC antigen presenting cell
ATP annual transmission potential
BCR B cell receptor
BSA bovine serum albumin
CFA circulating filarial antigen
CFSE cai'boxyyfluuorescein diacetate succinimidyl ester
Ci Curie
CO2 carbon dioxide
ConA concanavalin A
CP chronic pathology
cpm counts per minute
CTLA-4 cytotoxic T lymphocyte-associated antigen
DC dendritic cell
ddHzO double distilled water
DEC diethylcarazamine
DEPC diethyl pyrocarbonate
DNA deoxyribonucleic acid
DNase deoxyribonuclease
dNTP deoxynucleotide triphosphate
XVI

d.p.i. days post infection
EAE experimental autoimmune encephalitis
EDTA ethylenediamine tetra acetic acid
ELISA enzyme linked immunoabsorbent assay
EN endemic normal
ES excretory secretory
FACS fluorescence activated cell sorting
FITC fluorescein isothiocyanate
FCS fetal calf serum
g gram
GEO generalised onchocerciasis
GITR glucocorticoid-induced TNF receptor
GM-CSF granulocyte-macrophage colony-stimul;
HBSS Hanks balanced salt solution
HCL hydrochloric acid
ICT immunoclii'omatographic test
IFN-y interferon-y
Ig immunoglobulin
IL interleukin
iNOS inducible nitric oxide synthase
i.p. intra-peritoneal
JAK janus activating kinase
KCL potassium chloride
KH2PO4 potassium dihydrogen phosphate
1 litre
X V ll

L3 infective larvae
LAP latency associated peptide
LF lymphatic fiiariasis
LN lymph node
LPS lipopolysaccharide
M molar
MAb monoclonal antibody
MHC major histocompatability complex
pCi micro Curie
Pg microgram
pi microlitre
ml millilitre
pM micromolar
mM millimolai’
mRNA messenger RNA
MF microfilaria
MF+ microfilaraemic
MF- amicrofilaraemic
min minute
NaCl sodim cholride
NaHCOs sodium bicarbonate
Na2HP04 di-sodium hydrogen phosphate
NaOH sodium hydroxide
Na4Cl ammonium chloride
NK natural killer
X V lll

NO nitric oxide
°C degrees centigrade
CD optical density
OVA ovalbumin
PBS phosphate buffered saline
RNA ribonucleic acid
RNase ribonuclease
RT-PCR reverse transcriptase-polymerase chain reaction
PBMC peripheral blood mononuclear cells
PC phosphocholine
PEC peritoneal exudate cells
Pg picogram
PGE2 prostaglandin E2
PPIA phytohaemagglutin
PMA phorbol myristate acetate
PNG Papua New Guinea
PS phosphatidylserine
pTh precursor Th cells
r recombinant
R receptor
rpm revolutions per minute
RT room temperature
s.c. subcutaneously
SD standard deviation
SEB staphylococcal enterotoxin B
XIX

STAT signal transducer and activator of transcription
TCR T cell receptor
Tg transgenic
TGF-p transforming growth factor-p
Th T helper
TNF-a tumour necrosis factor-a
Treg T regulatory cell
TT tetanus toxoid
U unit
XX

LIST OF FIGURES AND TABLES
Chapter 1
Figure 1.1. Diagram of CD28 and CTLA-4 interactions with their ligands 40
Figure 1.2. DC Maturation 45
Figure 1.3. Differentiation processes of Thl and Th2 cells 56
Figure 1.4. Diagrammatic representation of the development
of Treg cells 63
Chapter 2
Figure 2.1. FACS gating 77
Table 2.1. TaqMan primer and probe sequences 85
Figure 2.2. The TaqMan principle 86
Chapter 3
Table 3.1. The recovery of worms from IL-4-/- or WT BALB/c
mice is not significantly different at any time point post-infection 102
Table 3.2. Adult worm and MF recoveries at day 77 p.i. demonstrate that
IL-4-/- mice contain significantly more MF than WT mice 103
Table 3.3. Implantation of adult worms into the peritoneal cavity
of IL-4-/- or WT mice results in equivalent production of MF 104
Figure 3.1. Recovery of MF in IL-4-/- mice correlates with the number of adult
female worms 105
Figure 3.2. Cell recruitment into the peritoneal cavity is reduced
in infected IL-4-/- mice compared to that of WT mice 106
XXI

Figure 3.3. Splenocytes from L3 infected IL-4-/- mice display an altered Ag-specific
cytokine profile compared to that of their wild-type counterparts 107
Figure 3.4. Splenocytes from L3 infected IL-4-/- mice display significantly
lower Ag-specific proliferation compared to that of their wild-type counterparts 108
Figure 3.5. Splenocytes from L3 infected wild-type and IL-4-/- mice display similar
levels of mitogen-driven proliferation 109
Figure 3.6. CD4^ and B220^ cells proliferate less well in IL-4-/- mice compai'ed to
wild-type mice 110
Figure 3.7. Proliferation of CD4^ and B220^ cells is significantly reduced in IL-4-/-
mice compared to WT controls 111
Figure 3.8. Ex vivo staining of splenocytes from L3 infected and control IL-4-/- and
wild-type BALB/c mice showed no significant differences between groups 112
Figure 3.9. Levels of nitrite from 96 hour cultui'es are not significantly different
between IL-4-/- mice and their wild type counterparts 113
Figure 3.10. Addition of AMG to splenocytes from L3 infected BALB/c and IL-4-/-
mice had no significant effect on Ag-specific proliferation of either group 114
Figure 3.11. Addition of IFN-y Neutralizing MAb to splenocytes from L3 infected
BALB/c and IL-4-/- mice had no significant effect on Ag-specific proliferation of either
group 115
Figure 3.12. Addition of recombinant IL-4 to splenocytes from L3 infected BALB/c
and IL-4-/- mice had no significant effect on Ag-specific proliferation of either
group 116
xxn

Chapter 4
Figure 4.1. Neutralizing IL-10 in Ag-stimulated cultures of splenocytes from L3
infected mice resulted in significantly increased levels of Thl cytokines 139
Figure 4.2. Neutralizing IL-10 in Ag-stimulated cultures of splenocytes from L3
infected mice did not alter levels of Ag-specific proliferation 140
Figure 4.3. Depletion of CD4^ and B cells from spleens of L3 infected mice resulted
in decreased levels of Ag-specific IL-10 141
Figure 4.4. Semi-quantitative RT-PCR carried out on ex vivo splenocytes from L3
infected mice shows that CD4^ cells express more IL-10 mRNA relative to HPRT than
do B220'" cells 142
Figure 4.5. In vivo neutralization of IL-IOR resulted in increased levels of Ag-
specific proliferation in splenocytes from L3 infected mice 143
Figure 4.6. In vivo neutralization of IL-IOR resulted in no differences in cytokine
production 144
Figure 4.7. CFSE labelling of splenocytes from L3 infected mice shows that the
proliferation of CD4^ cells is increased when IL-IOR is blocked 145
Figure 4.8. CFSE staining demonstrates that mean levels of proliferation of CD4^
cells from L3 infected mice is increased when IL-1 OR is blocked 146
Figure 4.9. CD4^ expansion is increased in L3 infected mice given blocking IL-1 OR
Ab 147
Figure 4.10. Ex vivo staining of splenocytes from L3 infected mice shows no
difference in levels of cellular populations in the spleens of mice in which IL-IOR was
blocked 148
Figure 4.11. Cytokine responses to L3 are exaggerated in mice infected via
syringe compared to mice infected by mosquito bite 149
X X lll

Figure 4.12. Proliferative responses in spleens and lymph nodes of mice infected with
L3 via syringe inoculation are exaggerated compared to mice exposed to infective
mosquitoes 150
Figure 4.13. Cytokine responses of mice given 50, 25 or 10 L3 are not significantly
different 151
Figure 4.14. Ag-specific proliferative responses of mice given 50, 25 or 10 L3 are not
significantly different at any time point 152
Chapter 5
Figure 5.1. CD4^ cells analysed ex vivo from L3 infected mice express more IL-10
and TGF-(3 mRNA relative to HFRT mRNA than do B cells 170
Figure 5.2. Three colour FACS analysis demonstrates that a population of CD4^
cells which co-express CD25 and CTLA-4 are expanded in L3 infected mice 171
Figure 5.3. L3 infected mice have a higher percentage of CD4" cells which co
express CD25 and CTLA-4 than MF infected or control animals 172
Table 5.1. Expression of cell surface markers on the surface of CD4^ cells from
splenocytes of L3 and MF infected mice 173
Figure 5.4. CD4’*’ cells analysed ex vivo from L3 infected IL-4-/- mice express
equivalent levels of IL-10 and TGF-(3 mRNA to WT mice 174
Figure 5.5. Three colour FACS labelling shows that a population of CD4^ cells
which co-express CD25 and CTLA-4 is also expanded in splenocyte cultures from L3
infected IL-4-/- mice 175
Figure 5.6. Mean percentage of CD4^ cells which co-express CD25 and CTLA-4
from L3 infected and control IL-4-/- mice and wild type mice 176
XXIV

Figure 5.7. Three colour FACS analysis of cells from L3 infected mice given
neutralizing CD25 MAh show reduced levels of CD4^ cells which co-express CD25
and CTLA-4 177
Figure 5.8. Three colour FACS analysis of cells demonstrates that administration
of CD25 blocking MAb results in a significant decrease in the percentage of CD4^
cells co-expressing CD25 and CTLA-4 178
Figure 5.9. Levels of Ag-specific and spontaneous proliferation of splenocytes
from L3 infected mice given neutralizing CD25 MAb are significantly increased
compared to those given isotype matched control MAb 179
Figure 5.10. Ag-stimulated cytokine responses of splenocytes of L3 infected mice
given neutralizing CD25 MAb, are significantly increased compared to those given
isotype matched control 180
Figure 5.11. Spontaneous cytokine responses of splenocytes from L3 infected mice
given neutralizing CD25 MAb are significantly increased compared to those given
isotype matched control 181
Table 5.2. Net levels of Ag-speeiflc cytokine production from splenocytes of
mice depleted of CD25^ cells prior to infection with L3 182
Chapter 6
Figure 6.1. Depletion of B cells from splenocytes of L3 infected mice results in
reduced levels of Ag-specific proliferation 201
Figure 6.2. Splenocytes from L3 infected pMT mice display significantly lower Ag-
specific proliferation compared to their wild-type counterparts 202
Figure 6.3. CFSE labelling of cells from L3 infected mice in Ag-stimulated culture
shows that B cells proliferate in response to Ag 203
XXV

Figure 6.4. B cells proliferate in response to L3 infection 204
Figure 6.5. Depletion of B cells from spleens of L3 infected mice results in
decreased levels of Ag-specific IL-10 and lL-5 205
Table 6.1. Changes in cytokine levels post-depletion of B cells 206
Figure 6.6. Splenocytes from L3 infected pMT mice produce less IL-10 compared to
those from L3 infected WT mice 207
Figure 6.7. Two colour FACS labelling shows increased expression of B7-1 and
B7-2 on the surface of B220^ cells fi'om L3 and MF infected mice compared to
control mice 208
Figure 6.8. The majority of cells expressing B7-1 or B7-2 co-express B220 209
Figure 6.9. The percentage of B cells which express B7-1 and B7-2 is elevated when
IL-10 is neutralized 210
Figure 6.10. Neutralizing IL-10 results in increased levels of B7-1 and B7-2
expression on splenocytes 211
Figure 6.11. The percentage of B cells which express B7-1 and B7-2 is higher in IL-
10-/-mice 212
Figure 6.12. B7-1 and B7-2 are up-regulated on B cells from IL-10-/- mice 213
Figure 6.13. Neutralizing B7-1 and B7-2 in cultures of splenoeytes from L3 infected
mice results in significantly reduced levels of proliferation at 48 and 72 hours 214
Figure 6.14. Neutralizing B7-1 and B7-2 in cultures of splenocytes from L3
infected mice results in significantly reduced levels of specific cytokines 215
XXVI

Chapter 1. Introduction
Lymphatic filariasis (LF) is a debilitating disease of humans which is responsible for
considerable pathology and morbidity in tropical regions of the world. There are
approximately 751 million individuals living in endemic areas where transmission is
Imown to oceur and of these individuals, an estimated 128 million people are infected
(Michael et a l, 1996). In a World Health Organisation (WHO) report in 1995, LF was
named as the second leading eause of permanent and long-term disability worldwide.
The mosquito transmitted, long-lived nematodes of the genera Wuchereria and Brugia
are the causative agents of LF with Wuchereria bancrofti aecounting for 91% of
infections and Brugia malayi and Brugia tiinori responsible for the remaining 9%.
Infection with B. malayi occurs in South and South East Asia, whereas B. timori has
only been detected in approximately 40,000 individuals on the Indonesian islands of
Timor, Flores, Rote and Alor (Scott, 2000). Bancroftian filariasis occurs throughout the
tropics and subtropics, with the exception of the Middle East where infection is only
prevalent in Egypt. The widespread occurrence of these filarial infections is
predominantly associated with the geographical distribution and parasite compatibility
of the vector mosquito. For example, W. bancrofti can be transmitted by many different
species of mosquito, however its main vectors are the domesticated, night-feeding urban
mosquito Culex quinquefasciatus, with Anopheles spp. and Aedes spp. being more
common in rural areas. It is the ability of this parasite to be transmitted by a number of
different vectors that results in bancroftian filariasis being so widespread. Conversely,
the definitive host of W. bancrofti is very specific, the only occurrence of natural
infection is in humans. Mosquitoes of the genus Anopheles, Aedes and Mansonia,
transmit Brugian filariasis. B. malayi is predominantly a parasite of man although it is
also a zoonosis, with monlcey, cat and dog reservoirs and this animal reservoir is very
I

important in terms of infection control. B. timori is transmitted via Anopheles
harbirtostris and natural infection is limited to humans. B. pahangi is a natural parasite
of wild and domestic animals in South East Asia and has proved to be a useful
experimental species, as infections in laboratory animals such as the jird, Meriones
unguiculatus, will develop to patency (Ash and Riley, 1970).
1.1. Parasite Life Cycle
There are no free-living forms of these parasites and the full developmental cycle takes
place in the mosquito (intermediate) host where larval development occurs and in the
human (definitive) host where larval and adult development takes place. Like other
nematodes, the lymphatic filariae have five developmental stages in their life cycle.
Infection of the definitive host is initiated by the bite of a mosquito which harbours
mature, infective third stage larvae (L3) (approximately 1.5 x 0.3 mm in size), which are
present in the head and mouthparts of the mosquito. The L3 is released from the
mosquito’s proboscis onto the skin and the larvae enter the body via the pmicture
wound (Denham and McGreevy, 1977). Once the dermis has been penetrated the L3
enters the lymphatic system of the human host. The moult from the L3 to the fourth
stage larvae (L4) occurs between days nine and fourteen post infection (p.i.). In a
process, which can take 3 - 1 2 months (depending on species), L4 develop into sexually
mature adults which dwell primai’ily in the afferent lymphatics. The adult parasites are
white, unsegmented and thi*ead-like and the females are approximately double the size
of the males (e.g. B. pahangi male adult measures 22 x 0.1 mm whereas the female
measures 48 x 1.5 mm). After mating the females constantly produce sheathed
microfilarae (MF/Ll) that circulate in the bloodstream, and are available for ingestion
by a mosquito upon taking a blood meal. An interesting aspect of the microfilaraemic

stage of infection is the dramatic fluctuation in numbers of MF in the blood over the
course of 24 hours. In most W. bancrofti endemic areas MF are nocturnally periodic, in
that they are at maximum numhers in the blood at night and virtually disappear' from the
circulation during the day when they are concentrated in the lungs (Spencer, 1973).
This phenomenon ensures that MF are available in the peripheral blood at high
concentration when vector species are feeding.
Once ingested by the mosquito the MF (measuring only 210 x 6 pm) migrate from the
blood meal and penetrate the mid-gut where they pass through the haemoeoel before
migrating to the thoracic muscles where development is initiated (Agudelo-Silva and
Spielman, 1985). The development of the parasite into the L2, then subsequently the L3
is temperature dependent (optimal 28^C and 80% humidity) and by the eighth day the
majority of the parasites are L3 or in the process of moulting. Within two days the ' I
mature L3 will migrate from the flight muscles and will associate with the feeding
structures in the head of the mosquito which facilitates their transmission to the
definitive host.
1.2. The Clinical Spectrum of Disease
There are many different clinical manifestations of LF ranging from asymptomatic
microfilaraemia to gross pathology. In addition a proportion of exposed individuals
remain uninfected. These people are termed endemic normals or asymptomatic
amicrofilaraemics. The clinical manifestations vary from one endemic area to another
and also differ depending on the parasite involved. The wide spectrum of the disease is
summarised below.

1.2.1. The microfilaraemic state
The vast majority of infected individuals living in an endemie area display few overt
eiinieal manifestations of filariasis, despite the presence of high levels of MF in the
peripheral blood (Kumaraswami, 2000). However, although these individuals appear to
be clinically asymptomatic, recent evidence suggests that virtually all these individuals
suffer from some form of sub-clinical disease. For example approximately 40% of MF+
individuals have low-grade renal damage which is associated with the presence of MF,
not adult parasites (Dreyer et a l, 1992) and many patients present with abnormal
patterns of lymphatic flow (Freedman et a l, 1994; Suresh et a l, 1997). Therefore the
clinical aspects of the microfilaraemic state are more complex than was first thought.
However, despite these distinct signs of pathology associated with microfilaraemia, the
majority of individuals remain in this state for decades without developing either
chronic or acute pathologies (Kumaraswami, 2000).
1.2.2. Acute manifestation of Lymphatic Filariasis
Adenolymphangitis (ADL) is the term used to characterise recurrent attacks of fever
associated with inflammation of the lymph nodes and/or lymph vessels. Recurrent
attacks of fever associated with lymphadenitis are more commonly seen in Brugian
filariasis than with bancroftian filariasis. In Brugian filariasis the affected lymph nodes
are mostly situated in the inguinal and axillary regions with inflammation along the
course of the distal lymphatic vessels (Partono, 1987). These acute attacks may last up
to 6 weeks, therefore resulting in prolonged periods of inability to work. These episodes
are characterised by warmth, tenderness and local pain of the limb, breast or male
genitalia. ADL is generally associated with individuals who are amierofilaraemic
(Ottesen and Nutman, 1992).

1.2.3. Chrome manifestations of Lymphatic Filariasis
Clironic pathology (CP) only develops in a small proportion of infected individuals and
rarely occurs before the age of 15 (Partono, 1987). Individuals presenting with
pathology are generally amierofilaraemic (Ottesen and Nutman, 1992). Pathology
associated with filariasis manifests as hydrocoele, chyluria, lymphoedema and
elephantiasis. The symptoms of pathology are primarily caused by living or
degenerating worms resident in the lymphatic vessels (Dreyer and Piessens, 2000), but
these conditions are often exacerbated by the presence of fungal or bacterial infections.
The infected individuals are predisposed to secondary infections due to impaired
lymphatic drainage (Jamal and Pani, 1990), although some individuals do develop
lymphoedema without the presence of secondary infections. In these cases it is thought
that the worms themselves are the primary cause of pathology (Dreyer and Piessens,
2000). Swelling of the limbs is the most common presentation of pathology. In
bancroftian filariasis the entire limb is normally affected, but in Brugian filariasis the
leg below the laiee and the arm below the elbow are typically affected.
1.2.4. Tropical Pulmonary Fosinophilia
TPE is a rare clinical manifestation associated with W. bancrofti infection. It is thought
to reflect an immunological hyper-responsiveness to the parasite (particularly the MF
stage) which presents as eosinophil counts greater than 3000/ml, increased levels of IgE
and anti-filarial Abs (Ottesen and Nutman, 1992). MF are typically absent from the
blood of these individuals, although dead or dying MF have been identified in lung
biopsies. Symptoms include cough, dyspnoea and wheezing (Spry and Kumaraswami,
1982). This condition has been shown to respond well to treatment with the anti-filarial
drug diethylcabazamine (DEC).

1.2.5. Endemic Normals
In most areas where filariasis is endemic, a proportion of individuals do not show any
clinical manifestations of the disease and are amicrofilai'aemic despite having been
exposed to infective larvae. With the advent of more sensitive diagnostic teclmiques, i.e.
circulating Ag tests, the number of endemie normals has decreased, as many individuals
test positive for filarial Ag despite appearing to be MF free (Moore and Copeman,
1994). Therefore the absence of MF alone is not satisfactory for determining whether an
individual is infection h'ee. In addition ultrasound examinations can now determine
whether an individual is an amierofilaraemic adult worm carrier or a normal, uninfected
individual (Amaral et a l, 1994).
1.3, Diagnosis and Treatment
Diagnosis of LF can be carried out in two ways. Firstly, it is possible to detect the
parasite itself or to detect parasite products by circulating Ag tests; secondly, serology
can be carried out to identify an immune response to the parasite.
1.3.1 Parasitological diagnosis
Detection of MF is the most common form of parasitological diagnosis. In most parts of
the world MF are periodic (Manson, 1883), in that they appear at their highest load at
night. Therefore it is imperative that blood be taken for diagnostic purposes when MF
reach peak levels (between 10 PM and 2 AM). Traditionally this form of diagnosis is
made by staining blood films for the presence of MF. However patients with low levels
of MF may not be detected using this method (20 MF / ml of blood required for reliable
diagnosis). Alternatives to this method have been developed and have proved more

sensitive, such as membrane filtration. This technique involves taking 1 ml of blood and
passing it through a polycarbonate membrane with a 3 to 5 pm pore size. MF, which
have been retained on the membrane, can be stained with Giemsa. This method is twice
as sensitive as carrying out blood films but is more expensive and requires venous
puncture. Both of these methods have other disadvantages, sueh as colleetion of
samples at night and the inability to detect occult infection, when MF are not present in
the circulation (Eberhard and Lammie, 1991).
Circulating Ag detecting tests for Wuchereria infection can be carried out at any time
therefore eradicating the requirement for nocturnal sampling and this form of diagnosis
is now recognized as the method of choice for W. bancrofti infection. Previously,
monoclonal Abs which recognise phosphocholine (PC), a secretory-excretory product
of filarial parasites, were used in ELISA to determine whether an individual has
circulating filarial Ag (CFA) in their blood (Weil et a l, 1997). However this method
was difficult to perform in the field, therefore a rapid-format filarial Ag test using an
ICT (immunocliromatographic test) card was designed by ICT Diagnostics (Balgowlah,
New South Wales, Australia). Human serum or plasma is added to a pink sample pad
that contains dried polyclonal antifilarial antibodies coupled to colloidal gold. Antigen-
antibody complexes form and the gold-labelled conjugate eoncentrates to form a pink
line visible after 5 minutes. This assay has a reported sensitivity of 96-100% and a
specificity of 100% (Weil et a l, 1997). Since the advent of this technique, many
individuals thought previously to be endemic normals have proved to harbour infection.

1.3.2 Serodiagnosis
Serodiagnosis is useful for the detection of Brugian infections, as circulating Ag
detecting tests are not available for Brugian infection. Serological detection is generally
carried out using the ELISA format. However, such techniques have proved to be
problematic due to poor specificity, as extensive eross-reactivity is found in the sera of
individuals infected with closely related parasites (Voiler and De Savigny, 1981);
(Maizels et a l, 1985). In addition, serodiagnosis does not distinguish between past and
current infections. However, greater specificity can be achieved by detecting Brugia-
specific antibodies of the IgG4 subclass. IgG4 levels are greatly up-regulated in actively
infected individuals, but not in those who have had previous infections. In addition this
assay can be useful in assessing the effectiveness of treatment, as levels of IgG4 fall
after chemotherapy (Terhell et a l, 1996); (Atmadja et a l, 1995). However this form of
diagnosis is not as specific as parasitological diagnosis.
1.3.3. Treatment and control of Lymphatic Filariasis
In 1998, a Global Programme to Eliminate LF was initiated and is active in 18 of the 80
endemic countries worldwide. The two principle goals of the Programme are to
interrupt transmission of the infection and to treat and prevent the disability caused by
the disease. However, it is of great importance to ensure that these goals are reached in a
cost effective and socially acceptable manner. To eliminate, or more realistically reduce
the level of transmission, all at-risk individuals are treated with a yearly, single dose of
a two-drug regime to reduce levels of MF in the circulation below those required to
sustain transmission, and to kill adult worms. The drugs of choice are; albendazole (400
mg) plus diethylcabamazine (DEC) (6 mg/kg), or albendazole (400 mg) plus ivermectin
(200 pg/kg) in sub-Saharan Africa. This regimen will require to be administered for

several years to correspond with the reproductive life span of adult worms.
Alternatively DEC can be added to cooking/table salt to ensure daily consumption of
the drug over a 6-12 month period (Ottesen, 2000). In addition, transmission of the
parasite can be affected by reducing the nmnber of mosquitoes in an endemie area by
spraying breeding grounds with biocides, or by reducing the biting activity of the
mosquitoes using insecticide impregnated bednets.
In terms of relieving physical pain and suffering associated with the disease, the main
strategy involves treatment of secondary opportunistic bacterial and fungal infections,
which are the primary cause of the worsening of lymphoedema. The basic components
of managing lymphoedema are meticulous hygiene, prevention and cure of entry
lesions, exercise, elevation and wearing proper shoes. Treatment of the affected limb
with antibiotics and antiseptics will alleviate bacterial infections. Proper management of
lymphoedema should result in increased quality of life for the patient, therefore
educating the community on these basic measures should make a significant difference
towards the control of filariasis (Dreyer et a l, 2002).
1.4. Immunology of Lymphatic Filariasis
Filarial parasites cause clii’onic infections which evoke host responses and immuno-
pathological changes. The wide spectriun of disease associated with filariasis reflects an
equally wide range of host responses to infection. Most studies have involved
comparing the immune response of microfilaraemies, chronic pathology patients and
endemic normals. In general it has been shown that peripheral blood mononuclear cells
(PBMC) from individuals with patent microfilaraemia are unable to generate cellular
immune responses to filarial antigens, thus distinguishing their immune response from

that of non-infected individuals in an endemic area. In contrast, PBMC from patients
with cinonic pathology (who are typically MF negative) display increased cellular
reactivity to filarial Ag (Ottesen et a l, 1977; Piessens et a l, 1980a; King et a l, 1992).
However, despite these differences in responsiveness between clinical groups, there are
eertain features of the immune response whieh each group have in common, for
example, a certain degree of Ag-specific proliferative suppression (Piessens et a l,
1980a; Ottesen, 1992; Yazdanbakhsh et a l, 1993a; Sartono et a l, 1995a), high levels of
IL-4 (King et a l, 1992; Mahanty et a l, 1991; Mahanty et a l, 1993; Yazdanbakhsh et
a l, 1993b), and down-regulated levels of IFN-y (King et a l, 1992; Raviehandran et a l,
1997).
1.4.1. Proliferative suppression
T cell hyporesponsiveness is a characteristic of human filaiial infection but many other
infectious diseases show a similar pattern of down-regulated immune responses. For
example in visceral leishmaniasis, lepromatous leprosy, tuberculosis and
schistosomiasis, PBMC show poor Ag-specific proliferation. In general this
unresponsiveness is attenuated upon treatment (Maizels et al., 2000). In terms of LF,
this defect is most profoundly observed in individuals who are microfilaraemic (Ottesen
et a l, 1977; Piessens et a l, 1980a; Yazdanbakhsh et a l, 1993a). PBMC taken from
microfilaraemic individuals fail to proliferate to filarial Ag whereas in most studies,
mitogen stimulated responses remain intact (Ottesen et a l, 1977). These depressed
levels of proliferation may be regarded as a form of immunological tolerance. In
contrast, PBMC taken from EN and chronic pathology patients will proliferate to
varying degrees (Maizels et a l, 1995), although all clinical groups display a certain
degree of suppression (Yazdanbaklish et a l, 1993a). However in a study by King et al
1 0

(2001), T cells from individuals who lived in a high intensity transmission village in
Papua New Guinea (PNG) exhibited depressed levels of proliferation in response to
non-filarial Ag and phytohaemagglutin (PHA) compared to individuals who lived in a
low transmission area. These results suggest a role for the incoming L3 in mediating
uni'esponsiveness as the subjects were matched for levels of infection. In addition, a
series of studies carried out by Cooper et al (1998, 1999) demonstrated that infection
with Onchocerca volvulus effects the efficacy of vaccines. Notably, post-vaccination
with tetanus toxoid (TT), proliferative, antibody and IFN-y levels were significantly
greater in individuals who were not infected. Infected individuals did however produce
TT specific IL-10 (while non-infected individuals did not), suggesting that IL-10 has a
role in down-regulating non-filarial Ag responses.
The precise mechanisms underlying the proliferative suppression are not yet fully
elucidated but may include clonal deletion, induction of anergy, an imbalance in
cytokine production, clonal exhaustion or the development of regulatory cell
populations (Maizels et a l, 2000). The induction of this “tolerance” is however, likely
to be only partial as some studies have shown that it can be reversed with ehemotherapy
(Piessens et a l, 1981; Sartono et a l, 1995b).
1.4.2 In utero exposure to filarial Ag
As referred to above one possible explanation of the proliferative defect in LF is a form
of immunological tolerance. In support of this hypothesis, Haitian children born to
mothers infected with W. bancrofti were observed to be more susceptible to filarial
infection than those born to uninfected mothers (Lammie et a l, 1991). In an additional
study carried out in the Cook Islands, the offspring of mothers who were MF+ remained
1 1

unresponsive to MF Ag tlii'oughout their lives, suggesting that clonal deletion of Ag-
reactive T cells may occur due to in utero exposure to parasite Ag (Steel et a l, 1994). In
a recent study in an area of Kenya where W. bancrofti is endemic, children of infected
mothers had a three to four-fold increased risk of filarial infection as determined by
CFA, compared to children born to uninfected mothers. In addition, ehildren of infected
mothers exhibited elevated levels of IL-5 and IL-10, and depressed levels of
proliferation in response to MF Ag compared to children of uninfected mothers.
However, the response to adult Ag was markedly different as there was no difference in
cytokine production or proliferation between the groups. These results support the
concept that in utero exposure to filarial Ag increases the offspring’s susceptibility to
W. bancrofti infection and polarises the immune response towards Th2 (Malhotra et a l ,
2003). However some studies have shown that treatment with DEC can result in the
recovery of Ag-specific proliferative responses, at least in the short term, thus arguing
against clonal deletion (Lammie et a l, 1992; Sartono et a l, 1995a). However this is a
controversial area as other studies have shown no recovery of proliferative responses
post-chemotherapy (Steel and Ottesen, 2001), indieating that clearance of infection is
not sufficient to restore immune responsiveness, at least to a comparable level with EN
individuals. Therefore infection with filarial parasites appears to induee long-term
defects in the ability to respond to parasite Ag. These findings underline the fact that
there are many different pathways whieh may result in Ag-specific unresponsiveness in
LF.
1.4.3. IL-4 in Lymphatic Filariasis
Although PBMC from microfilaraemies do not proliferate in response to parasite Ag
they have the ability to produce cytokines. T cells from these individuals, along with
1 2

EN and cln'onic pathology patients secrete significant amounts of Ag-specific IL-4, with
a resultant down-regulatioii in IFN-y responses (Nutman et a l, 1987; Mahanty et a l,
1996b). This has been demonstrated at the protein level (Mahanty et a l, 1996b) and at
the mRNA level (Dimock et a l, 1996). In the latter study it was shown that levels of IL-
4 mRNA did not differ between PBMC from MF+, MF-, CFA+ or CFA- individuals
upon in vitro stimulation with parasite Ag. As PBMC from putatively immune CFA-
individuals also express elevated levels of IL-4 in the absence of infection, the L3 to
which all individuals are exposed may be the stimulus for IL-4 production in this group.
Levels of IL-4 correlate inversely with levels of IFN-y in filarial infected individuals,
however when the cells that produce IL-4 and IFN-y were enumerated and compared
between patients with chronic pathology and those with an active infection, it was
observed that the ratio of IFN-y:IL-4 producing cells was higher in patients with CP and
lower in MF+ individuals (King et a l, 1993). Therefore it has been suggested that
despite elevated levels of IL-4 in individuals from all clinical groups, it is the down-
regulation of IFN-y producing cells in microfilaraemic individuals that may be the
important factor in maintaining parasite infeetion (Maizels et a l, 1995; Sartono et a l,
1997). The presence of the parasite is clearly associated with down-regulation of IFN-y
production as MF+ individuals who are given chemotherapy can produce IFN-
y (Sartono et a l, 1995a).
Interestingly, although IL-4 responses are elevated in active infection, IL-5 is not co-
ordinately up-regulated (Sartono et a l, 1997). When Ag-specific IL-5 responses were
examined as a function of clinical status and age, it was shown that MF- individuals had
higher levels of IL-5 than MF+ and that IL-5 decreased significantly with increasing age
1 3

in both MF+ and MF- individuals. This is quite different to the situation with IL-4
where levels of IL-4 were not different between MF+ and MF- individuals. In addition,
IL-4 levels increase with age in MF+ individuals and decrease in MF- individuals.
Therefore the cytokine disregulation observed in LF is observed in both Thl and Th2
subsets suggesting that immune responses to filarial parasites do not fall neatly into the
Thl/Th2 paradigm. This theory was discussed in a review by Allen and Maizels (1997),
which notes that even though the Th2 bias in the immune response to filarial infection
makes the Thl/Th2 model attractive, it does not account for the mechanisms of
hyporesponsiveness observed in filarial patients.
1.4.4. IL-10 in Lymphatic Filariasis
As discussed above, the exact nature of Ag-specific hyporesponsiveness has yet to be
elucidated. The role of IL-10 has been of interest in LF due to its capacity to block
activation of cytokine synthesis and several accessory macrophage functions. These
functions render IL-10 a potent suppressor of the effector functions of macrophages, T
cells andNK cells, at least in murine models (Fiorentino et a l, 1989). Initial studies into
the role of IL-10 in LF were carried out by neutralizing IL-10 in cultures of PBMC from
W. bancrofti infected MF+ individuals. The characteristic T cell hyporesponsiveness
was reversed when IL-10 was neutralized. In addition a similar but less pronounced
effect was observed when TGF-P was neutralized (King et a l, 1993). In another study,
it was found that PBMC from MF+ individuals secreted large amounts of spontaneous
IL-10. Levels of IL-10 increased when cells were re-stimulated with mixed sex adult or
microfilarial Ag but not adult male Ag, suggesting that IL-10 production is regulated by
MF Ag, but also may suggest a role for adult female Ag. IL-10 levels were inversely
1 4

correlated with levels of Thl cytokines, indicating a role for IL-10 in down-regulating
Thl responses in these individuals (Mahanty et a l, 1996b).
In a more recent study, Mahanty et al investigated the regulation of antigen specific
immune responses by IL-10 and IL-12. These two cytokines have opposing functions as
IL-12 has a critical role in the stimulation of IFN-y from NK cells and T cells (D'Andrea
et a l, 1993). Confirming the previous findings of King el al (1993), neutralizing anti-
IL-10 was shown to enhance proliferation in response to restimulation with B. malayi
adult antigen in 78% of MF+ infected individuals (Mahanty et a l, 1997). These studies
indicate that IL-10 plays a critical role in the hyporesponsiveness to antigen that is
associated with MF+. As a result of IL-10 blockade, levels of IFN-y increased two-fold
in 73% of MF+ subjects studied, in keeping with the hypothesis that IL-10 inhibits IFN-
y secretion in response to antigen (Mahanty et a l, 1997). However these results also
demonstrate that MF+ individuals have antigen-specific T cells capable of moimting a
Thl response under the appropriate conditions. In the same study, when IL-12 was
neutralized, levels of IL-5 increased in Ag stimulated cultures while levels of IFN-y
decreased. Augmentation of Type 2 responses by anti-IL-12 suggests that there are
significant amounts of IL-12 in the Ag-driven cultures but that the inhibitory effects of
endogenously secreted IL-10 on Type 1 responses to Ag are not effectively attenuated
by IL-12.
To gain understanding of the molecular basis of the Thl hyporesponsiveness,
Raviehandran et al (1997), performed RT-PCR to determine the levels of cytokine
mRNA in PBMC from W. bancrofti infected MF+, CP and endemic normal individuals.
Unstimulated PBMC from EN individuals had a purely Thl pattern with no IL-4 or IL-5
1 5

expression. In PBMC from MF+ there was a marked decrease in the expression of Thl
cytokines (IFN-y and IL-2), paralleled by increased expression of IL-10. Comparatively
little IL-10 expression was observed in CP patients and a ten-fold increase in levels of
IFN-y and IL-2 was observed between CP and MF+ individuals. PBMC and adherent
cells in MF+ patients stimulated with Ag or medium only were also shown to express
greater levels of IL-10 mRNA in comparison to individuals with elephantiasis. When
IL-10 expression in response to parasite antigen was examined it was found that only
MF+ individuals expressed IL-10 and that there was a significant negative correlation
between IL-10 mRNA expression and PBMC proliferation in the MF+ individuals in
comparison with CP and EN patients (Raviehandran et a l, 1997). This study lends
further support to the hypothesis that IL-10 is involved in the down-regulation of the
Thl response. However when studying individuals infected with Brugia malayi a
similar phenomenon was not observed. PBMC from MF+, CP and EN individuals were
cultured with B. malayi antigen and a range of different reagents were added in an
attempt to reverse the proliferative defect. These included IL-2, IL-7, anti-IL4, anti-IL-
10, anti-CD2, anti-CD27, anti-CD28, indomethacin, phorbol myristate acetate (PMA) or
calcium ionophore. Co-culture with IL-2, IL-7 and PMA were the only conditions
which resulted in enhanced proliferation to parasite antigen, but only in a few cases.
Neutralizing antibodies to IL-10 did not restore responsiveness to antigen (Sartono et
a l, 1995b). Furthermore, higher levels of IL-10 mRNA expression were observed in CP
patients infected with W. bancrofti than in MF+ patients using PBMC re-stimulated
with fractionated B. pahangi Ag (Dimock et a l , 1994).
These contrasting findings may be due to a number of different factors, e.g. different
species of parasite studied (W bancrofti or Brugia species), different geographical
1 6

strains of parasites i.e. studies by Dimock et al, King et al and Sartono et al were
carried out in different endemie regions (Haiti, Madras, India and Indonesia,
respectively). In addition, the use of different antigens for restimulation {B. malayi, B.
pahangi), possible differences in past chemotherapy, differences in transmission rate or
the use of cryopreserved cells (Sartono et a l, 1997) may all contribute to the conflicting
results described above.
IL-10 has also heen postulated to play an important role in the regulation of CD4^ T cell
responses induced by the parasitic trematode Schistosoma. In a recent study, the
contribution of IL-10 and IFN-y to the regulation of Thl and Th2 cytokine responses
was investigated in individuals with differing clinical forms of S. mansoni. It was
demonstrated, by the use of cytokine neutralization procedures, that early disease is
associated with a significant IFN-y response and that IL-10 contributes to the
suppression of that response during both early and chronic infection. This is due to the
measurable cross- regulation between IL-10 and IFN-y, with IL-10 neutralization up
regulating IFN-y production and vice versa (Montenegro et a l, 1999). Broadly similar
results were obtained in a study in which responses to adult worm Ag (AWA) were
investigated using fresh or cryopreserved PBMC from individuals clironically infected
with Schistosoma haematobium (Grogan et a l, 1998). Neutralizing IL-10 alone resulted
in increased background levels of proliferation of PBMC, but did not increase levels of
AWA-specific proliferation in freshly isolated cells or cryopreserved eells. Also, IFN-
y levels were increased when IL-10 was neutralized, however this increase was 4-fbld
greater in freshly isolated cells compared to cryopreserved cells. IL-4 was unaffected by
anti-ILlO MAb. IL-10, therefore has a down-regulatory effect on Thl responses in S.
haematobium infection but plays no role in modulating IL-4 responses. This study was
1 7

also informative in that it demonstrated a difference in the use of cryopreserved and
freshly isolated cells (Grogan et al., 1998).
1.4.5. The role of Antigen Presenting Cells in Lymphatic Filariasis
One of the major ways in which IL-10 modulates T cell responses is via an indirect
effect on antigen presenting cells (AFC). Evidence from several studies has indicated
that defeets in antigen presentation are critieal for development of peripheral tolerance
in LF (Ottesen, 1979; MacDonald et a l, 1999). For example, an important study
indicated that IL-10 from infected individuals may be produced by adherent cells
(Mahanty et a l, 1996b). The role of impaired APC function in LF was investigated by
examining the expression of the costimulatory ligands B7-1 (CD80) and B7-2 (CD86),
which are present on the surface of professional APC. The importance of the “second
signal” in the activation of responder T cells which initiate Ag-specific responses is
outlined in Section 1.6. Raviehandran et al addressed the possibility that T cell
hyporesponsiveness in individuals infected with W. bancrofti could result from the
absence of costimulatory signals delivered by APC. mRNA levels of B7-1 were
compared in PBMC from EN, CP and MF+ individuals. Levels of B7-1 expression on
unstimulated PBMC from MF+ individuals were very low compaied to the basal level
observed in CP individuals. However, most significant was the baseline expression of
B7-1 in EN, in which cells from every individual expressed spontaneous B7-1. In
response to parasite Ag, there was a general up-regulation of B7-1 in both MF+ and CP
individuals but the level of B7-1 expression in EN individuals did not increase. It was
suggested that high Ag-load down-regulates the expression of spontaneous B7-1 in
MF+ individuals. Interestingly, it was shown that IL-10 levels do not correlate with B7-
1 expression. B7-2 was not examined and this molecule may be of major interest in
1 8

future studies on the role of costimulatory molecules in filariasis (Raviehandran et a l,
1997). In individuals infected with Loa loa levels of B7 were found to be similar
between MF+ and MF- groups, however this study failed to discriminate between B7-1
and B7-2 (Baize, 1997). In a study using experimental animals (Giambartolomei et a l,
2001), monkeys infected with B. malayi were divided into two groups depending on the
ability of their PBMC to divide in response to BmAg - responders and non-responders.
All of the responders were found to express significantly higher levels of B7-1, whereas
half of the non-responders showed no increase in B7-1 and the other half only showed a
marginal increase. High levels of B7-2 were observed in all monkeys, regardless of
stimulation. Therefore this study demonstrates an association between BmAg induced
proliferative responses and expression of B7-1 but not B7-2. The general consensus
from these experiments appears to be that proliferative capacity is associated with an
up-regulation of B7-1 expression, although not all the studies reviewed above examined
the role of B7-1 and B7-2 as separate ligands.
As described above, many studies have attempted to discover the underlying cause of
proliferative suppression but none have found a single factor which is universally
successful at restoring proliferation. Recently, the impact of transmission intensity on
the host immune response in two villages in PNG where the transmission intensity of W.
bancrofti differed by 63-fold was investigated (King, 2001). Residents of the high
transmission village had impaired lymphocyte proliferation and IFN-y production in
response to parasite Ag, to the non-parasite Ag streptolysin-0 and to the APC-
dependent mitogen phytohaemagluttanin. By contrast, lymphocyte proliferation and
IFN-y production in response to the mitogen PMA and ionomycin (which directly
activates protein kinase C and facilitates influx of Ca' into the cell and does not require
1 9

APC help) was similar between individuals from both areas. In addition, CD4^ cells
which had been purified from individuals living in the area of high transmission could
be activated with immobilised anti-CD3 (that cross-links the T cell receptor) and anti-
CD28 (which provides an important costimulatory signal). This study provides further
evidence that impaired APC function modulates the ability of PBMC to proliferate in
response to filarial Ag.
Other studies have shown that Ag-specific hyporesponsiveness is mediated, in part, by
diminished APC function and is most obvious when PBMC are stimulated with MF Ag
(Semnani et a l, 2001; Semnani et a l, 2003). DC exposed to live MF up-regulate the
expression of ICAM-1 and undergo increased levels of apoptosis compared to
unexposed DC. While MF exposed DC up-regulate IL-8, RANTES, IE -la , TNF-a and
IL-P, levels of IL-12 and IL-10 were down-regulated. Soluble excretory secretory (ES)
products from MF also resulted in this down-regulation of cytokine production but to a
lesser degree. In addition, exposed DC were less able to stimulate CD4^ cells to produce
IFNy and IL-5 (Semnani et a l, 2001; Semnani et a l, 2003). The eonsensus from the
studies reviewed above is that infection with filarial parasites has a marked effect on the
ability of professional APC to present Ag to CD4^ cells effectively, thus inhibiting the
ability of immune cells to mount appropriate responses.
1.4.6. T regulatory cells in Lymphatic Filariasis
T regulatory cells (Treg) are a family of CD4^ cells that are anti-inflammatory and
profoundly suppressive. Tlnee populations of Treg cells have been identified to date:
Th3 (Weiner, 2001), Trl (Roncarolo et al., 2001b) and, perhaps the best characterised,
CD4^CD25^ cells, which typically co-express CTLA-4 and OX-40 (Read and Powrie,
2 0

2001). These regulatory T cells have the ability to inhibit potentially harmful immune
responses via cell-to-cell contact dependent mechanism or by the secretion of eytokines
such as TGF-j3 and IL-10. Most studies to date investigating the role of Treg cells in
filariasis have been carried out in humans and indeed it has been proposed that many of
the features of LF could be accounted for by the induction of Treg eells, rather than a
Tli2 bias (Maizels and Yazdanbakhsh, 2003). One sueh study investigated the role of
CTLA-4 in mediating diminished levels of Ag-specific T cell responsiveness that is
characteristically observed in filariasis patients. It was observed that individuals who
inhabited endemic areas had a higher frequency of CD4^CTLA-4^ cells than expatriate
infected or uninfected individuals. In addition MF+ patients had a higher frequency of
CD4^CTLA-4^ cells than MF- individuals. These studies suggest that length of
exposure to the L3 and patency of infection are factors associated with the expression of
CTLA-4. In addition the greatest intensity of CTLA-4 expression occurred on
CD4’*’CD25'*' cells. Neutralizing CTLA-4 in vitro resulted In increased levels of IL-5 and
decreased levels of IFN-y, indicating a role for this molecule in regulating host
responses to filarial infections (Steel and Nutman, 2003).
Further studies have examined the role of regulatory T eells in chronic infection with
the related filarial nematode O. volvulus. Individuals with a patent infeetion i.e.
generalised onchocerciasis (GEO), display an Ag-specific proliferative
hyporesponsiveness similar to that described above for LF. It was shown that IL-10 and
TGF-p mediate this response, as neutralizing these cytokines resulted in the reversal of
the proliferative defect. O. volvulus-s^Qcific T cells cloned from GEO PBMC produced
no IL-2 and high IL-10 and TGF-p, similar to Th3/Trl cells, indicating that these cells
may be involved in maintaining O. volvulus hyporesponsiveness (Doetze et a l, 2000).
2 1

In an additional study, it was found that these Treg cells display elevated levels of
CTLA-4 after stimulation and are able to inhibit proliferation of other T cells in eo-
culture (Satoguina et a l, 2002). More reeently it has been found that S. mansoni
specific lyso-phosphatidylserine (PS) activated the Toll-like receptor 2 and affected DC,
such that mature DC gained the ability to induce the development of IL-10-producing
Treg cells (van der Kleij et a l, 2002), Taken together, the evidence outlined above
suggests a role for Treg cells in the maintenance of hyporesponsiveness in helminth
infection.
1.4.7. The importance of the L3 in Lymphatic Filariasis
Defining the role of individual life cycle stages in polarising the immune response in
human infection can be very difficult as individuals living in an endemic area are
exposed to multiple different life cycle stages simultaneously. As the L3 is the first life
cycle stage to which the host is exposed, the immune response elicited by the L3 is
likely to influence both the establishment of the parasite and the development of
immunity.
Evidenee in humans that an immune response is directed against the L3 comes from the
observation that a percentage of individuals inhabiting an endemic area will remain
infection-free (endemic normals) despite exposure to L3. The presence of EN has given
rise to the theory of concomitant immunity (whereby individuals are resistant to
incoming L3 but camiot clear their adult parasites) (Day et a l, 1991). Despite a lack of
knowledge regarding the parasitological state of endemic normals, it was previously
thought that these individuals were resistant/immune to infection with the L3, whereas
microfilaraemic individuals were susceptible. However with the advent of more
2 2

sensitive diagnostic procedures it appears that the endemic normal is a very rare
individual, at least in areas of high transmission (Day, 1991; Freedman et a l, 1989;
Lalitha et a l, 1998).
Population dynamic studies (Day, 1991; Vanamail et a l, 1989) have argued that the
concept of the endemic normal should be replaced by the hypothesis that concomitant
immunity exists in the majority of the adult population in filariasis-endemic areas. For |
example, the rate of gain and loss of W. bancrofti infection was estimated duiing a
control programme in Pondicherry, South India. The results suggested that the age
distribution of bancroftian filariasis is primarily determined by age-dependency in the
rate of acquisition of infection. The rate of gain of infection, based on levels of MF, was
shown to peak in the 16-20 year age group and then decline in adulthood. This was
proposed as evidence for acquired resistance to new infection (Vanamail et a l, 1989). A
longitudinal study of the age-specific dynamics of W. bancrofti infection in a
community of East Sepik Province, PNG was carried out. MF density and levels of PC-
containing Ag in individuals were used as measures of adult worm burden. Over a 12
month period significant increases in the levels of circulating PC-Ag was noted in
subjects less than or equal to 20 years of age, but not in subjects greater than 20 years of
age (Day et a l, 1991). These data are therefore consistent with the acquisition of
resistance to superinfection with age. Further analysis indicated that resistance was
directed at the L3 as, when the age-specific dynamics of the Ab response to the L3
surface was examined in this population, a correlation was established between age and
prevalence of Ab. Adults, but not children, had detectable anti-L3 surface Ab
irrespective of adult worm burden (Day et al, 1991). In conclusion, it appears that
children living in this endemic area continued to accumulate adult worms, whereas
2 3

worm burden was stable in adults. These studies support the notion of concomitant
immunity, directed at restricting incoming larval parasites but ineffective at eliminating
existing adult parasites.
Clear evidence of acquired resistance to trickle infection of L3 in B. pahangi infected
cats also supports the hypothesis of concomitant immunity. Cats trickle-infected with
L3 become resistant to re-infection and this resistance is directed at the L3, with the
majority being destroyed within 24 hours of infection. Adult worms in these animals
can be long-lived with a life expectancy of two years and arise from early infections
when the animals are naïve (Denham ei al., 1983). More recent studies involving the
relationship between the levels of transmission of the L3 and the development of
infection and disease in bancroftian filariasis have been carried out in two endemic
villages in East Africa. One village had an ATP (annual transmission frequency,
determined by the number of L3 to which an individual is theoretically exposed to per
year), nine times higher than that of the other (Michael et a l, 2001). A particular focus
of this work was to understand the contribution of host immunity in regulating infection
and in the development of chronic disease, and the role of exposure rate in generating
such immunity. In the high ATP village, prevalence and mean intensity of MF and
incidence of pathology (hydrocele and lymphoedema) were significantly higher. In
addition, the geometric mean MF count was also significantly higher (almost 20 times)
in the higher transmission community. These data were interpreted to suggest that while
immunity against infection reflects past experience of adult worms acting against the
establishment of L3, the immunopathological component of lymphoedema is apparently
more related to cumulative experience of larvae rather than adult worms. Flowever this
interpretation requires further investigation.
2 4

The importance of the L3 in modulating the immune responses of individuals living in
an area of high transmission compared to responses of individuals living in a loAV
transmission area was investigated study populations from villages in PNG (King,
2001). High levels of L3 transmission were shown to affect Th2 responses with levels
of IL-5 being significantly elevated compared to that of the low transmission area.
However, levels of IL-4 and IL-10 secreted from PBMC were not significantly different
between groups. It was notable that in this study, levels of IL-10 and TGF-(3 did not
correlate with depressed levels of proliferation or IFN-y levels, a result in contrast to a
previous repoit from India (King et a l, 1993). One of the other interesting results from
the PNG study was the identification of elevated plasma IL-4 in individuals from the
high transmission village (almost two-fold higher). However, it was notable that this
increase in IL-4 was not observed in PBMC culture. It was suggested that the IL-4 is
likely to derive from mast cells and basophils in the skin, as these cells are abundant in
dermal tissues where the L3 are inoculated. These cells may therefore play a critical role
in host defence, particularly across epithelial barriers such as the skin. Together, the
studies summarised above strongly indicate that the L3 evokes an early immune
response in the human host. Further information on the role of the L3 in generating a
response will be discussed with reference to work carried out using the mouse model of
infection.
1.5. Mouse model of Brugian filariasis
Immunological studies of human filariasis are complicated by many factors, including
exposure to multiple life cycle stages, differences in worm burdens and infection status,
prior and current exposure to L3, use of chemotherapy and the presence of concomitant
infections. The use of laboratory animals allows some of these factors to be controlled
2 5

and has provided invaluable information on the immune response to filarial parasites.
The ideal animal model would be inbred, would harbour the full developmental cycle of
the parasite, display similar pathology to that seen in humans and mimic the
immunological characteristics of the human infection. A model with all these traits is
not available, therefore most studies have been carried out in mice. A surprising amount
has been leaimt from the mouse model. Although not fully permissive to filarial
infection (with the exception of Litomosoides sigmodoniis), mice can support single life
cycle stages of Brugia sp for a limited time, allowing investigation of the immune
response to each stage. Unfortunately a suitable animal model for W. bancrofti has not
been found, as it will not survive in intact or immunocompromised mice.
There are several features of the immune response which are similar in the hmnan and
mouse infections, such as the characteristic proliferative defect and skewing of the
immune system towards a predominantly Th2 type response. Each life cycle stage of the
parasite can elicit differing immune responses and thus the ability to implant the various
stages of development into the mouse model allows the responses to be interpreted
independently of each other. It is notable that different life cycle stages elicit different
immune responses in the murine host, suggesting that natural infection with filarial
pai'asites induces a complex array of immunological responses in the infected
individual.
1.5.1. Murine infection with MF
Experiments caiTied out by Pearlman et al (1993b) examined cytokine production in
BALB/c mice inoculated i.p. with live MF of B. malayi. At early time points (12-14
days) splenocytes from these animals produced an Ag~specific ThI-like response with
2 6

elevated levels of IFN-y and little IL-5. However at later time points levels of IL-5
increased, with a resultant decrease in levels of IFN-y. Peritoneal exudate cells (PEC)
from mice which had been immunized three times with soluble microfilarial Ag were
recovered four days after MF challenge and were cultured with MFAg. These cells
produced elevated levels of IL-4 and IL-5 with no increase in Ag driven IL-2 or IFN-
y. Depletion experiments demonstrated that CD4^ cells were the main source of IL-4
and IL-5. In addition IL-10 was shown to have a role in controlling IFN-y production in
splenic and lymph node cells from mice chronically exposed to live MF or immunized
multiple times with soluble Ag. Addition of neutralizing IL-10 MAb resulted in
increased levels of IFN-y production in splenic and lymph mode cells from these
animals (Pearlman et a l, 1993a). In similar experiments from a different laboratory in
which BALB/c mice were infected with MF i.v, IFN-y was detected at early time points
with a gradual increase in IL-4. It was also found that the IFN-y response to MF was
independent of the dose of MF administered, in the range of 10 to 10 (Lawi*ence et a l,
1994). Furthermore, popliteal lymph node cells from BALB/c mice infected via the
footpad with MF of B. pahangi express IFN-y in the absence of IL-10 or IL-4 at day
four post infection (Osborne and Devaney, 1998). These results indicate that an early
IFN-y response to MF is accompanied by a later more modest Th2 response.
Interestingly, recent data identified a MF-specific protein (Bm-SPN-2, a secreted
serpin) which is a prominent T cell Ag. It was found that mice infected with MF of B.
malayi mounted a strong Bm-SPN-2 specific Thl response which was short-lived. By
day 35 responsiveness to Bm-SPN-2 was lost. These findings are important as Bm-
SPN-2 was recognised by mouse and human T and B cells and is the first example of a
MF-specific secreted molecule that acts on T cells (Zang et a l, 2000). Studies in the
2 7

mouse model demonstrated that the proliferation of splenocytes from MF infected
BALB/c mice was suppressed in an Ag-specific manner, in contrast to splenocytes from
L3 infected mice, which proliferated well under identical conditions (Osborne et a l,
1996). Cells from MF infected animals had been activated as demonstrated by elevated
levels of IFN-y in Ag-stimulated cultures. Similar to the situation observed in human
infection, levels of mitogen stimulated proliferation were not suppressed. Further
studies carried out in MF infected mice demonstrated that the proliferative defect was
associated with elevated production of NO, induced by IFN-y (O'Connor et a l
2000). Inhibition of iNOS or infection of IFN-y receptor laiock-out mice resulted in
normal levels of Ag-specific proliferation. Moreover it was shown that elevated levels
of NO in these cultures induced apopto sis of CD4^ T cells (Jenson et a l 2002). It was
hypothesised that the apoptosis of activated T cells represents a negative feedback
system, which limits the expansion of potentially harmful pro-inflammatory cells
(O’Connor and Devaney, 2002).
1.5.2. Murine infection with adult parasites
Although immunocompetent mice are resistant to natural infection with B. malayi or B.
pahangi, adult worms can be implanted and survive for up to 90 days. In contrast to the
situation observed in mice infected with MF, mice implanted with the adult stage of
Brugia develop a profound Tli2 response with elevated levels of IL-4 and good Ag-
specific proliferative responses (Lawrence et a l, 1994). Mice implanted with female
worms displayed a stronger immune response than those Implanted with adult males,
although the response of both groups of animals followed a similar pattern. Levels of
IL-2 and IFN-y remained low in these animals. This is in stark contrast to responses
observed in MF infected animals, where levels of IFN-y remained high until 28 days
2 8

post-infection, and although an IL-4 response was observed at this time point, levels of
this cytokine remained less than 10% of that observed in response to adult female
worms. Furthermore CDA^ cells were identified as the source of the IL-4 produced in
response to adult worms (Lawrence et a l, 1994). These results are interesting as they
demonstrated that the IL-4 (Th2) response is dominant despite the continual release of
IFN-y inducing MF from the adult females.
Studies which have attempted to unravel the ways in which adult parasites modulate the
immune system have demonstrated a multitude of mechanisms, ranging from
suppressive ES products, the generation of a suppressive APC population and the
induction of suppressor cytokines IL-10 and TGF-|3. Using the filarial parasite
Acanthocheilonema viteae an ES product (ES62) was identified which was
immunomodulatory and down-regulated immune responses. ES62 is a phosphoryl-
choline (PC)-containing glycoprotein to which PC is covalently attached via an N-type
glycan. PC is found on components of the ES of all human filarial nematodes examined
to date, (reviewed by Harnett et a l, 1999; Harnett and Harnett, 1999). It was further
shown that ES62 interacts directly with APC, signalling dendritic cells to acquire a
phenotype which drives the development of Th2 cells (Whelan et a l, 2000). In these
studies the responses of GM-CSF matured DC exposed to EPS or ES62 were compared.
It was shown that exposure of DC to LPS results in a phenotypic Thl response
compared to the Th2 response generated by ES62. ES62 also appears to inhibit B cell
stimulation and proliferation (Harnett and Harnett, 1993). These results indicate that the
production of ES62 by adult parasites modulates the immune response towards a Th2
phenotype and can reduce levels of proliferation of the B cell population.
2 9

The role of the adult parasite in eliciting a population of suppressive APC has been
extensively studied by the Allen group. Intraperitoneal implantation of adult worms or
L3, but not MF, leads to the generation of PEC which suppress the proliferation of T
cell clones without blocking Ag-specific cytokine production in vitro (Allen et a l,
1996). It was demonstrated that IL-4 was essential for the induction of this non-specific
suppressor cell population but that IL-10 was not a key component. IL-4-/- mice were
unable to generate a suppressive PEC population while mice given anti-IL-4 at the time
of infection still developed Th2 responses but were unable to generate the suppressive
PEC population. Therefore it appears that early IL-4 production, and not necessarily
Th2 establishment, is the essential factor in the development of the proliferative block.
In these experiments, infection of IL-10 -/- mice generated fully suppressive PEC. A
partial role for IL-10 was suggested as compared to the wild type mice, PEC from IL-
10-/- mice induced less profound suppression of hybridomas. These IL-4 dependent
suppressor cells were later described as F4/80+ alternatively activated macrophages and
their suppressive function was found to operate via a cell-cell contact dependent
mechanism. Interestingly, these cells were found to suppress proliferation of various
transformed cell lines, including many human tumour cell lines, thus indicating that the
suppressive mechanism was neither species nor cell type specific (Loke et a l, 2000a).
1.5.3. Murine infection with L3
Studies from many groups have highlighted the importance of the L3 in modulating
host immune responses in mouse models. Infection of mice with the L3 of Brugia
malayi (Lawrence et a l, 1995) or B. pahangi (Osborne and Devaney, 1998) results in a
Th2 type response with elevated production of IL-4 and low IFN-y and IL-2, similar to
adult parasites. To further investigate the role of this Th2 response, experiments were
3 0

carried out in IL-4-/- mice. C57BL/6 IL-4 deficient mice or their corresponding WT
counterparts were infected with 100 L3 of B. malayi i.p. Cytokine responses from these
animals showed slightly decreased levels of IL-5 compared to WT mice, but no
elevation of IFN-y levels. These data were interpreted to suggest that Thl cells were not
primed in response to infection with L3 (Lawrence et a l, 1995). However in
experiments in which IL-10 was neutralized in vitro, splenocytes from L3 infected
BALB/c mice produced IFN-y and IL-2 without altering levels of IL-4 or IL-5,
suggesting that Thl cells were primed by L3, but suppressed by IL-10 (Osborne and
Devaney, 1999).
Further studies on the role of the adherent APC population in mice infected with B.
pahangi, demonstrated that replacement of the resident APC population with APC from
control mice reversed the inliibition of Thl responses (Osborne and Devaney, 1999).
The precise phenotype of the suppressive APC in this system was not identified.
However it was notable that the irradiation of resident APC had the same effect,
suggesting that the suppressive population may be B cells, as these cells are more
susceptible to y irradiation that other APC (Sopori et a l, 1985). Although these
experiments also showed that neutralizing IL-10 resulted in elevated levels of IFN-y and
IL-2, no link between the role of IL-10 and the suppressive APC population was sought
(Osborne and Devaney, 1999). Therefore the data presented above demonstrate that Thl
and Th2 cells are primed in response to the L3 but Thl cells are suppressed by IL-10
and the APC population.
The cytokine environment at the point of T cell priming is very important in
determining the differentiation of precursor (p) Th cells into Thl or Th2 cells (see
3 1

section 1.7). In light of this, experiments were carried out to investigate the pattern of
cytokine mRNA expression within the draining lymph node shortly after infection with
L3. Mice were infected via the footpad and at 24 hours p.i. the popliteal lymph nodes
were removed and cytokine gene expression was measured by semi-quantitative RT-
PCR. These experiments showed that the L3 elicited a dramatic burst of IL-4
transcription within 24 hours of infection, defining the L3 as a potent stimulator of the
Th2 response. Cell separation experiments demonstrated that an ap ^CD4'CD8" (a
double negative) T cell population was responsible for the production of early IL-4
(Osborne and Devaney, 1998). Further characterisation of these cells indicated that this
population may be NKl.F^ T cells (Balmer and Devaney, 2002). It is not known what
components of the L3 stimulate the early IL-4, but the surface of the L3 contains both
lipid and carbohydrate moieties and the components of the surface are known to turn
over within 24 hours of entry into the mammalian host (Carlow et a l , 1987). Therefore
one of these moieties may be involved in priming NK cells for IL-4 production.
Experiments carried out by the Raj an group have concentrated on factors which
contribute to the clearance of a primary infection when L3 of Brugia are administered
i.p. Primed B cells from mice immunized with the L3 of B. pahangi adoptively
transferred into athymic recipients protected these animals from challenge infection
(Paciorkowski et a l, 2003). Further investigation showed that B cells were required for
the early production of Th2 cytokines. These results were inteipreted to suggest that
primed peritoneal B cells were sufficient to transfer protection against B. pahangi
infection in mice. IgE has also been shown to have a role in determining the
susceptibility of the host strain. IgE-/- mice were more permissive to primary infection
with L3 of B. malayi than WT mice. Infected IgE-/- mice also displayed defective IgGl
3 2

production suggesting that there may be other contributing factors to the permissiveness
observed in the KO animals (Spencer et a l, 2003b).
The data presented above indicate that the host-parasite interaction is complex and
highly evolved. However it remains unclear whether the Th2 response to the parasite
protects the host from pro-inflammatory pathology or whether the parasite induces Tli2
responses to maintain its survival. Whatever the case, analysis of the responses to
different life cycle stages has led to the conclusion that there are many different ways in
which the parasite can modulate host responses and that each life cycle stage exploits a
different mechanism of modulation.
1.6. Immunoregulation
1.6.1. T cell phenotype and effector function
In a seminal study, Thl and Th2 cells were first distinguished as two different subsets
(Mosmann ei a l, 1986). A panel of mouse helper T cell clones were characterized into
two groups according to their lymphokine production. Type 1 helper cells (Thl)
produced IL-2, IFN-y, GM-CSF and IL-3 in response to Ag and APC or to ConA. T
helper 2 cells (Th2) produced IL-3, BSFl, and two other activities unique to the Th2
subset, a mast cell growth factor distinct from IL-3 (now known to be IL-5) and a T cell
growth factor distinct from IL-2 (now known to be IL-4). A subsequent study showed
that Th2 clones also have the ability to synthesise IL-4 and IL-5 (Cherwinski et a l,
1987). Thl and Th2 cells are derived from ThO cells which have the capacity to produce
all these cytokines. ThO cells are thought to be derived from naïve T cells (pTh) as they
differentiate towards the Thl or Th2 pathway. This new paradigm changed the way in
which the immunology of infectious disease was studied, with particular regard to
3 3

Leishmania infection in mice, which was instrumental in establishing the functional
relevance of disease models in understanding these pathways. However, it has become
increasingly clear that the concept of Thl/Tli2 cannot account for every aspect of the
immune response. In this section, I review the mechanisms by which T cells are
activated to effector status or tolerized to result in suppression of immune responses, the
role of APC and cytokines in determining the phenotype of differentiated T cells and
finally, the role of Treg cells.
1.6.2. T cell activation and tolerance
Lymphocytes have to distinguish self from non-self while at the same time directing
immune responses. To avoid damage to self, these responses must be tightly regulated.
The ‘two signal’ concept of lymphocyte activation was proposed to explain
discrimination of self from non-self (Bretscher and Cohn, 1970; revised Bretscher,
1999) and has been a useful model of activation and tolerance ever since. Naïve
preciu'sor Th (pTh) cells are activated after interaction of the T cell receptor (TCR) with
the peptide antigen major histocompatability complex (MHC) (signal 1). Signal 2 is
generated via an interaction between costimulatory molecules on the antigen presenting
cell (APC) and counter receptors on the T cell, such as the B7-CD28 interaction. In the
absence of signal 2, the generation of signal 1 alone results in a state of inactivation and
the pTh cell is rendered anergic. The 2 signal model oversimplifies the various ways in
which a T cell reacts to each signal; in some cases T cell activation can occur in the
absence of signal 2, if the TCR signal is very strong. In addition, positive and negative
signals can be received by the T cell via the costimulatory receptors expressed on their
surface (e.g. CTLA-4-B7 interaction). Also, the 2 signal model was designed with the
activation of naïve pTh cells in mind, however the immune response to foreign Ag is a
3 4

diverse process in which costimulatory signals can be delivered to Ag-experienced T
cells. It has become clear in recent years that the balance of protective immunity and
tolerance relies on a tightly regulated regime of stimulation and inhibition signals
(Sharpe and Freeman, 2002).
There are a growing number of T-cell costimulatory molecules, but the best
characterized system is the B7-1/B7-2-CD28/CTLA-4 pathway (see Figure 1),
discussed in detail below (Karandikar et a l, 1998; Oosterwegel et a l, 1999; Sansom,
2000; Salomon and Bluestone, 2001; Chambers et a l, 2001). B7-1/2 and CD28/CTLA-
4 are now known to be pail of a much larger family of molecules as at least two new
pathways have been discovered in recent years. The first involves the interaction of
ICOS (a member of the CD28 family, inducible T cell co-stimulator) with ICOSL
(ICOS ligand) (Hutloff et a l, 1999). The second involves the PD-1 receptor which
interacts with two new B7 family members, PD-Ll and PD-L2 (Ishida et a l, 1992;
Freeman et a l, 2000). ICOS interaction with ICOSL enhances all basic T cell responses
to a foreign Ag, namely proliferation, secretion of lyniphokines, up-regulation of
molecules that mediate cell-cell interaction and effective help for Ab secretion by B
cells. Unlike CD28, ICOS is not constitutively expressed on the surface of T cells but
has to be induced, and does not up-regulate the production of IL-2 but induces the
synthesis of IL-10 (Hutloff et a l, 1999).
The PD-1 pathway is thought to be critical for the induction and/or maintenance of
peripheral T cell tolerance to self-Ag. Expression of PDL is induced by IFN- y and
recent data suggests that this might mediate some negative regulatory effects of IFN-
y (Latchman et a l, 2001). Interaction of PD-1 with PD-Ll or PD-L2 results in inhibition
3 5

of TCR-mediated proliferation and cytokine production, although levels of IL-4 and IL-
13 were not easily down-regulated, suggesting that Th2 cytokine expression may be less
sensitive to the effects of the PD-1 pathway (Latchman et a l, 2001).The properties of
the best characterised system, B7 interaction with CD28 or CTLA-4, are discussed
below.
1.6.3. B7-I/B7-2-CD28/CTLA-4 pathway
CD28 and CTLA-4 (CD 152) are transmembrane proteins, both of which are found on
the surface of T cells. CD28 is abundantly expressed on the majority of resting T cells
whereas CTLA-4 appears predominantly after T cell activation. These molecules share
30% homology and bind to the B7 family members with high affinity (Alegre et a l,
1996). The complexity of the CD28/CTLA-4 receptor interactions results from the fact
that there are two natural ligands for these receptors, namely B7-1 (CD80) and B7-2
(CD8 6). Both of these molecules can interact with either receptor, however as they
share only 25% homology, it has been postulated that these molecules have differing
functions. B7-1 and B7-2 are found on the surface of APC such as DC, monocytes and
activated B cells (Razi-Wolf et a l, 1992; Azmiia et a l, 1993; Inaba et a l, 1994). B7-1
is induced slowly after activation, whereas B7-2 is abundant on the surface of APC and
its expression is rapidly increased after stimulation. However, experiments in B7-1/B7-
2 -/- mice, indicated that B7-1 is more potent in terms of activation, as naïve cells
respond less well to B7-2 and this is perhaps associated with B7-2 binding to CD28 for
a shorter time than B7-1. However, primed cells respond to both molecules equally
(Fields et a l, 1998; Schweitzer and Sharpe, 1998).
3 6

1.6.4. CD28 and CTLA-4 - opposing functions
CD28 receives signals from both B7-1 and B7-2, which ultimately results in the co
stimulation which is required for efficient T cell activation. In the absence of this signal,
the cells will become unresponsive and tolerant to Ag. This theory was substantiated
when it was shown that APC, which were highly impaired in Ag presentation, were
unable to activate T cells to respond to the same Ag (Jenkins et ah, 1987; Jenkins and
Schwartz, 1987). Along with other experiments, which described the rescue of T cell
anergy by the addition of a costimulatory signal, these studies are consistent with the
notion that CD28-B7-1 interactions are critical for T cell activation (Gimnii et a l, 1991;
Linsley ei a l, 1991). Recently results have come to light that suggest that CD28 may
play a role in the development and homeostasis of Treg cells. CD4^CD25^ cells, which
control autoimmune diabetes, are profoundly decreased in CD28-/- and B7-1/B7-2-/-
NOD (nonobese diabetic) mice. Adoptive transfer of this regulatory population into
CD28 deficient animals can prevent or delay diabetes (Salomon et a l, 2000). Therefore
a substantial amount of data suggests that CD28 is a critical molecule in T cell
activation and regulation.
Several studies have shown that blocking CTLA-4 results in increased T cell
proliferation (Krummel and Allison, 1995). The most convincing data set, however,
comes from experiments carried out in CTLA-4-/- mice, which develop lympho-
proliferative disease suggesting a key role for CTLA-4 in maintaining self-tolerance
(Tivol et a l, 1995; Waterhouse et a l, 1995). However despite the undeniable
importance of CTLA-4, its inhibitory pathway is still not fully understood. Interestingly,
within 24 hours of activation (when surface levels of CTLA-4 are very low) CTLA-4
has been found to block T cell function, preventing the up-regulation of activation
3 7

markers, entry into the cell cycle and the generation of IL-2. CTLA-4 is detected post
activation on activated T cells at higher levels, however these are not typically the cells
upon which it acts, suggesting that there may be an alternative function for CTLA-4
expression on the surface of activated T cells (Krummel and Allison, 1996; Walunas et
a l, 1996). While it has been shown that CTLA-4 is crucial in maintaining a balance in
T cell activation, matters are somewhat complicated by the fact that CD28 and CTLA-4
have opposite functions but share the identical ligands, B7-1 and B7-2.
Thus, it is of interest to decipher how T cells “decide” whether to use CTLA-4 or CD28.
Various mechanisms have been described in different model systems, none of which are
mutually exclusive. Firstly, the idea of ligand competition has been proposed in many
studies. This model suggests that CTLA-4 acts as a competitive inhibitor for the ligands
B7-1 and B7-2, so as to limit T cell activation. This concept is more likely to occur
during secondary stimulation of T cells as resting T cells express undetectable amounts
of CTLA-4. The ligand competition model of CTLA-4 regulation would require that
CTLA-4 be expressed in sufficient levels to sequester ligands away from CD28, thus
preventing a costimulatory signal being received. This model does not require a
signalling component as it would rely on the higher affinity of CTLA-4 for B7-1 and
B7-2 than CD28 (Chambers et a l, 1998; Chambers et a l, 1999).
Alternatively CTLA-4 signalling is a possible mode of action, whereby CTLA-4 is
proposed to interfere with TCR signalling events (Marengere et a l, 1996; Brunner et
a l, 1999). This hypothesis is supported by the observation that inhibition via CTLA-4
can occur in the absence of CD28 (Fallarino et a l, 1998). Finally it has been shown that
a population of Treg cells express CTLA-4 on their surface (Takahashi et a l, 2000), so
it is possible that these cells regulate T cell activation, a concept which is supported by
3 8

the development of spontaneous autoimmune disease when these cells are removed
(Sakaguchi et a l, 1995; Itoh et a l, 1999) (these cells will be discussed in more detail in
Section 1.9). For a schematic representation of the interactions of CTLA-4 and CD28
with their ligands refer to Figure 1.1.
;
3 9

APC
Tcell
CD80 (B7-1) up-regulation
CD86(B7-2)
CTLA-4
CD28RECYCLING #
#CTLA-4 transcription
Figure 1.1. Diagram of CD28 and CTLA-4 interactions with their ligands
B7-2 is typically expressed at higher levels on the surface of APC and is found more widely than B7-1. B7-1 is induced on the surface of APC via a number of stimuli and is expressed at lower levels. B7-2 is therefore the primary ligand for CD28. CD28 expression is constitutive on the surface of T cells whereas CTLA-4 is not expressed on resting T cells. Interaction of B7 with CD28 and T cell receptor stimulation result in the up-regulation of CTLA-4, however CD28 stimulation is not absolutely required for up- regulation of CTLA-4. CTLA-4 expression is thought to be transient at the cell surface and rapidly re-intemalised by a clathrin pit mechanism. It should be noted that both ligands can interact with both receptors.
4 0

1.7. Factors influencing the pathway of T cell differentiation
1.7.1. The role of the APC
Gajewski et al (1991) examined the ability of distinct APC populations to stimulate
proliferation of OVA- specific Thl and Th2 clones. It was shown that both subsets
proliferated well in response to OVA in the presence of whole spleen cells, however,
purified B cells stimulated optimal proliferation of Th2 clones. Optimal proliferation of
Thl clones was observed when adherent cells were used as APC. These results
indicated that co-factors produced by professional APC influenced the differentiation of
Thl and Th2 cells, with B cells preferentially inducing a Th2 response whereas adherent
cells induce a more Thl-like response. Further studies investigated the roles of various
APC in driving a Thl or Tli2 response. In a study using the SCID mouse and the
nematode parasite Nippostrongylus brasiliensis, it was shown that DC had the ability to
prime both Thl and Th2 cells (Ronchese et a l, 1994). However a subsequent study
disputed this and demonstrated that DC predominantly produce IL-12, an important
cytokine in driving the Thl response. Furthermore, in this study it was shown that DC
could induce the development of Thl cells from Ag-specific naïve LECAM-1
(leukocyte endothelial adhesion molecule, CD62L) bright CD4^ T cells obtained from
ap-T C R Tg mice, indicating that DC play a direct role in the development of IFN-
Y producing Thl cells (Macatonia et a l, 1995). Other studies have examined the role of
macrophages in stimulating a biased response. Although macrophages are dedicated
APC in vitro, they exert this activity only after activation with IFN-y. However
macrophages are an important source of IL-12 and may therefore favour the
development of Thl cells. Indeed, depletion of macrophages in vivo supports a Th2
4 1

response in BALB/c mice sensitized with bovine serum albumin (BSA) or ovalbumin
OVA (Brewer et al., 1994).
Since these discoveries, research into the role of APC has become much more advanced
with the discovery of the “alternatively activated” APC (APC2). In parallel to the
Thl/Tli2 dichotomy, APC may be subdivided into pro-inflammatory, classically
activated APC such as mature dendritic cells or IFN-y activated effector macrophages
and anti-inflammatory, alternatively activated APC such as IL-10 activated immature
dendritic cells and IL-4 induced suppressor macrophages. These APC2 have now been
shown to mediate an indispensable pathway of APC function. It is believed that
classically and alternatively activated APC secure the balance between pro-
inflammatory and anti-inflammatory immune reactions.
Classically activated macrophages are activated by exposure to IFNy, TNF-a, or LPS
whereas exposure to IL-4, IL-10 or PGE2 elicits a population of alternatively activated
macrophages. These cells are known to be important in the inhibition of T cell
proliferation. One study examined the role of IL-4-iiiduced alternatively activated
macrophages in a human co-culture system in vitro. It was found that alternatively
activated macrophages had the ability to inliibit mitogen-mediated proliferation of CD4^
T cells independently of IL-10. The expression of costimulatory molecules, NO or
prostaglandin synthesis was also down-regulated. Inhibition of phenotypic
differentiation of T cells by alternatively activated macrophages is paralleled by a lack
of maturation of T cells (Schebesch et a l, 1997). Alternatively activated macrophages
have also been identified in helminth infection. Clironic infection of mice with Taenia
crassiceps led to the generation of a macrophage population which could suppress the
4 2
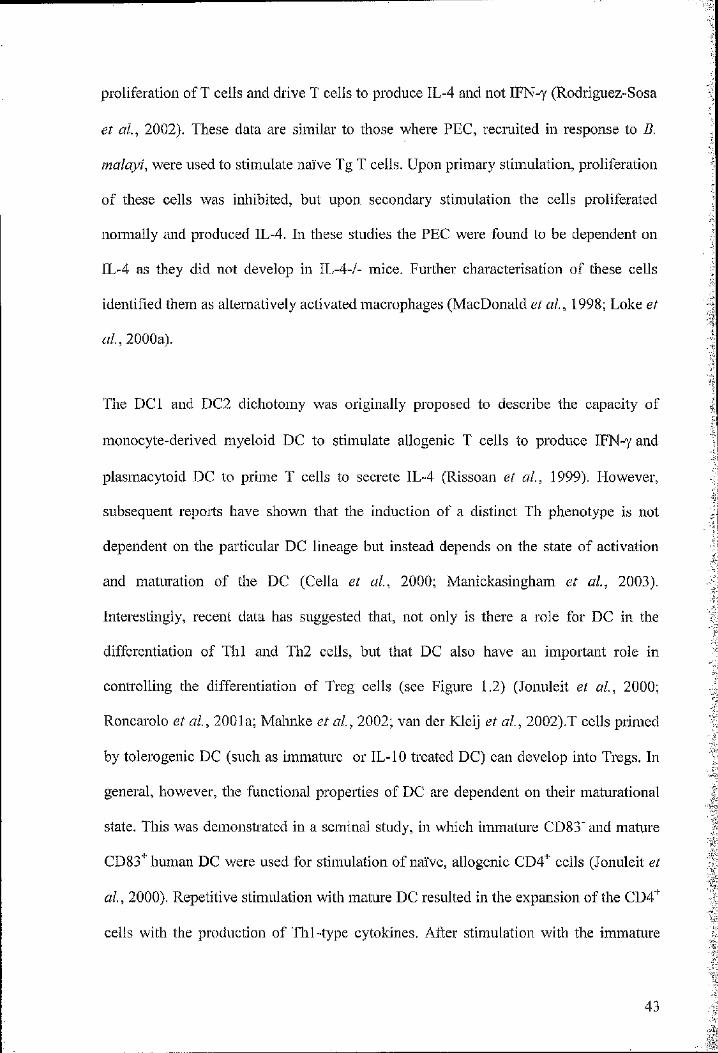
proliferation of T cells and drive T cells to produce IL-4 and not IFN-y (Rodriguez-Sosa
et a l, 2002). These data are similar to those where PEC, recruited in response to B.
malayi, were used to stimulate naïve Tg T cells. Upon primary stimulation, proliferation
of these cells was inhibited, but upon secondary stimulation the cells proliferated
normally and produced IL-4. In these studies the PEC were found to be dependent on
IL-4 as they did not develop in IL-4-/- mice. Further characterisation of these cells
identified them as alternatively activated macrophages (MacDonald et a l, 1998; Loke et
a l, 2000a).
The DCl and DC2 dichotomy was originally proposed to describe the capacity of
monocyte-derived myeloid DC to stimulate allogenic T cells to produce IFN-y and
plasmacytoid DC to prime T cells to secrete IL-4 (Rissoan et a l, 1999). However,
subsequent reports have shown that the induction of a distinct Th phenotype is not
dependent on the particular DC lineage but instead depends on the state of activation
and maturation of the DC (Celia et a l, 2000; Manickasingham et a l, 2003).
Interestingly, recent data has suggested that, not only is there a role for DC in the
differentiation of Thl and Th2 cells, but that DC also have an important role in
controlling the differentiation of Treg cells (see Figure 1.2) (Jonuleit et a l, 2000;
Roncarolo et a l, 2001a; Maluike et a l, 2002; van der Kieij et a l, 2002).T cells primed
by tolerogenic DC (such as immature or IL-10 treated DC) can develop into Tregs. In
general, however, the functional properties of DC are dependent on their matuiational
state. This was demonstrated in a seminal study, in which immature CD83" and mature
CD83‘ human DC were used for stimulation of naïve, allogenic CD4" cells (Jonuleit et
a l, 2000). Repetitive stimulation with mature DC resulted in the expansion of the CD4^
cells with the production of Thl-type cytokines. After stimulation with the immature
4 3

DC the T cells displayed an inability to proliferate which could not be reversed by the
addition of iiL-2, restimulation with PBMC or with mature dendritic cells. These cells
displayed an up-regulation of CTLA-4 and despite losing their ability to produce IL-2,
IL-4 and IFN-y, could produce IL-10. In addition, in co-culture these cells had the
ability to suppress Ag-driven proliferation of Thl cells in a cell-contact dependent
mechanism. These data strongly indicate that DC (depending on their state of
activation) can drive the differentiation of Treg cells. In another important study it was
shown that DC matured in the presence of a lipid derived from S. mansoni eggs (lyso-
phosphatidylserine), results in the induction of IL-10-producing Treg cells via an
interaction with TLR2 (Toll-like receptor). These data therefore suggest a role for
tolerized/immature DC in inducing a Treg population in helminth infection (van der
Kleij et a l, 2002).
4 4

Steady state. No maturation,
Tissue resident. Immature DC.
Immature
iInduction o f Treg
infection, inflammation. Full maturation
Maturation in the presence o f IL-10. DC m odulation
Mature DC
Modulated DC ii
TO LERA N C E
Anergic T cells Apoptoic T cells IL-lO-t- Treg cells TGF-P+ Treg cells
Induction o f effector T cells
IM M UNITY
Figure 1.2. DC MaturationImmature DC capture Ag from dying cells (self matter) and foreign Ag. In the steady state, DC remain immature but enter lymph nodes and prime resting T cells to become Treg cells. Post-infection with a microbe, pro-inflammatory cytokines stimulate the differentiation of DC and these cells mature. Mature DC efficiently prime resting T cells to develop into T effector cells. However the function of the mature DC can be significantly altered if matured in the presence of IL-10 or TGF-p. This results in the conversion of immunostimulatory DC into tolerizing DC (adapted from Mahnke et ai , 2002).
4 5
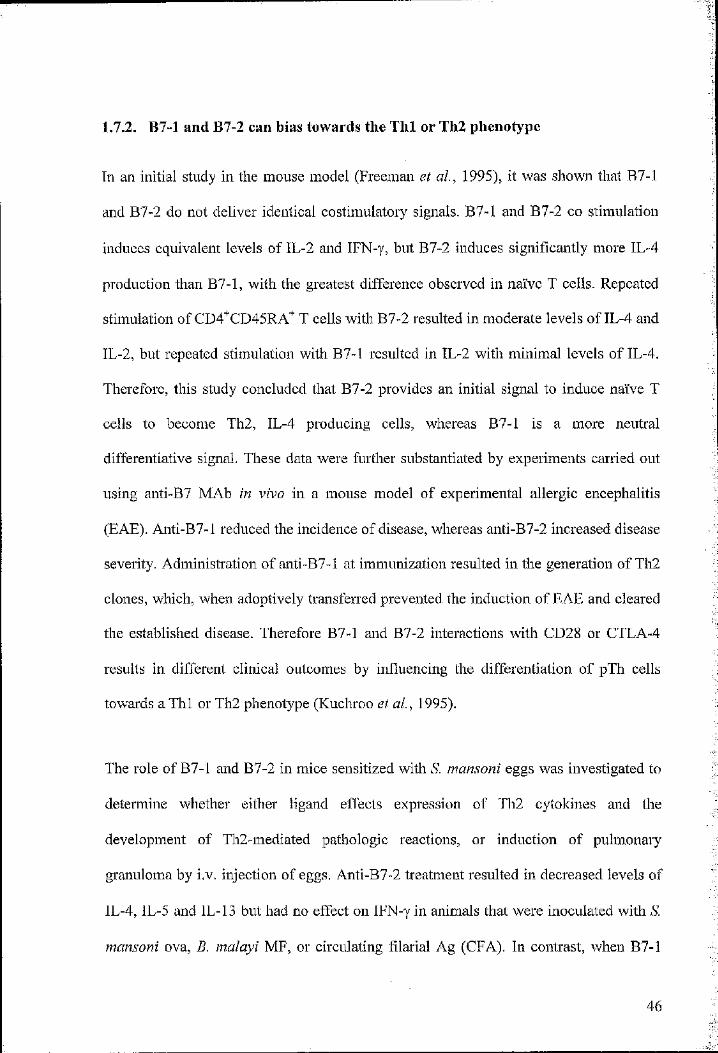
1.7.2. B7-1 and B7-2 can bias towards the Thl or Th2 phenotype
In an initial study in the mouse model (Freeman et a l, 1995), it was shown that B7-1
and B7-2 do not deliver identical co stimulatory signals. B7-1 and B7-2 co stimulation
induces equivalent levels of IL-2 and IFN-y, but B7-2 induces significantly more IL-4
production than B7-1, with the greatest difference observed in naïve T cells. Repeated
stimulation of CD4^CD45RA^ T cells with B7-2 resulted in moderate levels of IL-4 and
IL-2, but repeated stimulation with B7-1 resulted in IL-2 with minimal levels of IL-4.
Therefore, this study concluded that B7-2 provides an initial signal to induce naïve T
cells to become Th2, IL-4 producing cells, whereas B7-1 is a more neutral
differentiative signal. These data were further substantiated by experiments carried out
using anti-B7 MAb in vivo in a mouse model of experimental allergic encephalitis
(EAE). Anti-B7-1 reduced the incidence of disease, whereas anti-B7-2 increased disease
severity. Administration of anti-B7-l at immunization resulted in the generation of Th2
clones, which, when adoptively transferred prevented the induction of EAE and cleared
the established disease. Therefore B7-1 and B7-2 interactions with CD28 or CTLA-4
results in different clinical outcomes by influencing the differentiation of pTh cells
towards a Thl or Th2 phenotype (Kuchroo et a l, 1995).
The role of B7-1 and B7-2 in mice sensitized with S. mansoni eggs was investigated to
determine whether either ligand effects expression of Tli2 cytokines and the
development of Th2-mediated pathologic reactions, or induction of pulmonary
granuloma by i.v. injection of eggs. Anti-B7-2 treatment resulted in decreased levels of
IL-4, IL-5 and IL-13 but had no effect on IFN-y in animals that were inoculated with S.
mansoni ova, B. malayi MF, or circulating filarial Ag (CFA). In contrast, when B7-1
4 6

was neutralized, IFN-y was inhibited in mice sensitized with S. mansoni ova. In
addition, anti-B7-2 treatment inhibited pulmonary granuloma formation by 74% and
levels of IL-5 and IL-13 transcripts were decreased by 20- and 5-fold respectively
compared to mice given Ig control only. Anti-B7-1 had no such effect (Subramanian et
a l, 1997). These data therefore support the hypothesis that B7-1 tends to promote the
differentiation of Thl responses whilst B7-2 interactions promote Th2 differentiation.
1.7.3. The role of cytokines
The transmission between innate and adaptive immunity is a tightly regulated process,
which involves both the secretion of soluble mediators and cell to cell contact. In
particular the cytokine milieu that is established during the innate response to pathogens
creates a suitable environment for the migration of Ag-specific T cells to lymph nodes
where they meet APC. As described above Thl, Tli2 and Treg differentiation is
associated with the phenotype of the APC that is involved in presentation o f Ag to the T
cell. However T cell responses are also determined by the pattern of cytokines that are
present during the clonal expansion of T cells (Mosmann and Coffman, 1989) as
discussed below.
I.7.3.I. The IL-12 family of Thl inducing cytokines
1.7.3.L1. IL-12
IL-12 is a pro-inflammatory cytokine that favours Thl differentiation and forms a link
between innate and adaptive imnumity (refer to Figure L3A). The main producers of
IL-12 are phagocytes (i.e. monocytes, macrophages and neutrophils) and DC in
response to pathogens (i.e. bacteria, fungi, intracellular parasites and viruses). IL-12
4 7

induces T cells and NK cells to produce several cytokines - for example GM-CSF and
TNF-a, however it is extremely efficient at inducing the production of IFN-y. It has also
been shown that IL-12 has a strong synergistic effect with CD28/B7 interactions in
inducing proliferation and cytokine production (Kobayashi et a l, 1989; Chan et a l,
1991; Kubin et a l, 1994; Murphy, 1994). The role of IL-10 in regulating IL-12
production has been the focus of many studies, showing that IL-10 inhibits IL-12
production and B7 expression on the surface of monocytes. These two effects are
largely responsible for the ability of IL-10 to down-regulate IFN-y production by
lymphocytes, because anti-CD28 Ab and IL-12 can reverse the inhibitory effect of IL-
10 on IFN-y production (Kubin et a l, 1994).
IL-12 is expressed as a heterodimer formed by a 35-kDa light chain known as p35 and a
40-kDa heavy chain known as p40 (Kobayashi et a l, 1989). Recently it was discovered
that IL-12 p40 associates not only with IL-12 p35 but also with another molecule p i9,
to form a new heterodimeric cytokine, IL-23 (Oppmann et a l, 2000). Another newly
discovered cytokine is IL-27, which consists of Epstein Barr virus-induced gene 3
(EBÏ3), a p40 related protein, and p28, a newly discovered IL-12 p35 - related
polypeptide (Pflanz et a l , 2002). Because of these recently discovered cytokines, it is
now thought that the role of IL-12 has been over-interpreted. Many in vivo experiments
caii'ied out in the past used IL-12 p40-/- mice to investigate the role of IL-12. However
when experiments were carried out in IL-12 p35 mice many discrepancies were found
between the p40 and p35 -/- mice (Becher et a l, 2002). It now seems probable that at
least some of these discrepancies are due to the fact that IL-23 also utilises the IL-12
p40 protein subunit.
4 8

I.7.3.I.2. IL-23 and IL-27
IL-23 is secreted by mouse and human DC, however the biological activities of IL-23
differ from that of IL-12, at least in the murine model. For example, unlike IL-12,
murine IL-23 does not induce IFN-y. IL-23 is also reported to induce strong
proliferation of memory T cells but not of naïve T cells, whereas IL-12 has no effect on
memory T cells (Oppmann et a l, 2000). In addition, it has been recently shown that
murine IL-23 can induce the production of the pro-inflammatory cytokine IL-17 from
memory T cells. However, in humans the function of IL-23 is less distinct from IL-12
(Oppmann et a l, 2000). Data from pl9-deficient mice are clearly required to fully
elucidate the role of IL-23 in the murine model. Studies on EAE (experimental
autoimmune encephalitis) in p40-/- and p35-/- mice give contrasting results and suggest
that IL-12 may not be as important for the establishment of disease as was once thought.
Instead IL-23 fulfils this role. Recently, transgenic p i9 (IL-23 deficient) mice have been
shown to develop multi-organ inflammation, infertility and premature death. These
mice display lymphocyte and macrophage infiltrates in organs and increased numbers of
circulating neutrophils (Wiekowski et a l, 2001). These data clearly indicate a role for
IL-23 in IL-12 related responses.
IL-27 is produced early by activated APC and has been shown to be functionally very
similar to IL-12 in that it is able to induce clonal proliferation of naïve T cells and
synergises with IL-12 in IFN-y production by naïve T cells (Pflanz et a l, 2002).
Interestingly IL-27 binds to a newly discovered receptor expressed in large amounts on
the surface of naïve T cells, named WSX-1 (Yoshida et a l, 2001). This receptor does
not associate with IL-12 (Chen et a l, 2000; Pflanz et a l, 2002) and has been shown to
4 9

be required in the early initiation, but not the maintenance, of the Till response
(Yoshida et a l, 2001). This indicates that IL-27 may interact with naïve T cells before
IL-12, driving Thl development, but IL-12 is then required in the maintenance of this
response (Yoshida et a l, 2001; Pflanz et a l, 2002).
In summary the expression of the receptors on T cells for the IL-12 family of cytokines
is an important factor in the differentiation of Thl cells. Expression of the receptor for
IL-27 on naïve T cells enables the initiation of Thl responses (Chen et a l, 2000; Pflanz
et a l, 2002) and subsequent up-regulation of IL~12Rp2 (Szabo et a l, 1997) allows IL-
12 to become active in the induction and maintenance of effector Thl responses (Park et
a l, 2000; Yap et a l, 2000). However, activation of Thl memory cells appears to be
restricted to IL-23 (Oppmann et a l, 2000). IL-18 then synergizes with IL-12 after IL-12
has induced the IL-18R (Afkarian et a l, 2002) and this cascade of events will
eventually lead to the production of IFN-y and the resultant activation of macrophages
and DTH responses. For a diagrammatic representation of the role of IL-12, IL-23, IL27
and IL-18 in the differentiation of Thl type response, see Figure 1.3 A.
I.7.3.2. IL-4 and IL-13
IL-4 was identified as a cytokine that was instrumental in the generation of the Th2
responses when it was shown that IL-4 and IL-2 are required for the in vitro generation
of IL-4 producing T cells (see Figure 1.3B) (Le Gros et a l, 1990). When stimulated
with either Con A or Ag in the presence of IL-4, CD4^ cells become primed to follow
the Th2 differentiation pathway and after 48 hours these cells switch off IFN-y gene
transcription (Nakamura et a l, 1997). These data indicated that IL-4 was important in
directing pTh cells down the pathway of Th2 differentiation. Th2-driven responses are
5 0

important in disease processes including allergies, asthma and helminth infection.
Although IL-4 is a key cytokine in the development of Th2 responses, recent studies of
IL-4 receptor (IL-4R)-mediated signalling pathways have implied the presence of
alternative routes for Tli2 induction (Kaplan el a i, 1996; Shimoda et al., 1996; Takeda
et al., 1996; Earner et al., 1998). One other way in which Th2 development can be
affected is via IL-13, posing the question of how these cytokines can compensate for
one another (McKenzie, 1998).
IL-13 shares -30% homology with IL-4 and appears to have overlapping biological
activities. This is due, in part, to these two cytokines utilising the common IL-4Ra
chain as a component of their receptor complexes and signalling through a shared signal
transducer and activator of transcription (STAT) 6-dependent pathway (Zurawski et a l ,
1993). IL-4 and IL-13 are produced mainly by Th2-like cells and mast cells (Burd et a l,
1995) and it has been demonstrated that they share many biological functions. They
both have the ability to suppress the production of IL-1 and TNF-a from monocytes and
macrophages (de Waal Malefyt et a l, 1993a) and can induce B cells to undergo Ig
isotype switching (Punnonen et a l, 1993). There are however differences in their
molecular function, notably the ability of IL-4 to induce cellular proliferation. The
functions of IL-13 and IL-4 are best described when examining their role in infection
with L. major and T. muris (discussed in Section 1.8). For a diagrammatic
representation of the pathway of Th2 development, see Figure 3B.
I.7.3.3. IL-10 and TGF-p
IL-10 was originally identified as a molecule secreted by Th2 cells that could inhibit the
synthesis of Thl cytokines. IL-10 is produced by most haemopoitic cells and its
5 1

expression is regulated both transcriptionally and at the level of niRNA stability. The
functional receptor for IL-10 consists of a heterodimer between IL-lORl and IL-10R2,
(reviewed Moore et a l, 2001). The expression of IL-1 OR determines whether cells will
respond to the effects of IL-10. For example, T cells can down-regulate expression of
IL-lORl to become resistant to the suppressive effects of IL-10, whereas activated
monocytes can up-regulate IL-lORl and become susceptible to a negative feedback
pathway (Liu et a l, 1994). Like other cytokines from this family, IL-10 mediates its
effects via the activation of the Jalc/STAT pathway (Moore et a l, 2001). The principal
role of IL-10 is to down-regulate overwhelming and dangerous inflammatory immune
reactions. To do this IL-10 has the ability to suppress virtually all pro-inflammatory
cytokines and chemokines, while at the same time inhibiting the expression of B7-1 and
B7-2 on the surface of APC (Moore et a l, 2001).
TGF-P belongs to a large family of proteins, which are highly conserved tluoughout
evolution. In mammals, three members of this family, TGF-pl - |33, have an important
role in regulating immune responses. All three molecules signal through the same
receptor complex which consists of TGF-pRl and R2 (Letterio and Roberts, 1998). The
effect of TGF-j3 is mediated by activation of the SMAD family of transcription factors
(Attisano and Wrana, 2002). TGF-p is synthesised as a precursor protein and is released
in an inactive form as either a small or large latent complex (Gleizes et a l, 1997). In the
small complex, a homodimer of active TGF-(3 is associated with a protein, known as
latency associated protein (LAP), which consists of a homodimer of inactive TGF-p. In
the large complex, LAP is additionally associated with the latent TGF-p binding protein
(LTBP), which then allows the complex to associate with the extracellular matrix.
Activation of TGF-p in vitro can be achieved by disruption of the non-covalent
5 2

interaction between TGF-p and LAP by heating or acidification. In vivo activation
occurs extracellularly and likely involves the cleavage or conformational modification
of LAP (Gleizes et a l, 1997). TGF-p has anti-proliferative effects on CD4^ T cells as it
has the ability to block production of IL-2 and to up-regulate cell cycle inhibitors
(Gorelik and Flavell, 2002). This suppressive cytokine also has the ability to block the
differentiation of Thl and Th2 cells via effects on the transcription factors required for
expression of IFN-y (T-bet) (Gorelik et a l, 2002) and IL-4 (GATA-3) (Heath et a l,
2000). In terms of APC, TGF-p can inhibit the activation of macrophages and their
ability to produce pro-inflammatory cytokines (Gorelik and Flavell, 2002).
TGF-p and IL-10 were shown to work synergistically with one another in down-
regulating immune responses. In studies in mice, IL-10 has been shown to regulate the
production of TGF-p and vice versa and it was initially shown that exogenous IL-10 can
stimulate TGF-P in vitro (Seder et a l, 1998). This observation was further substantiated
by experiments examining intestinal epithelial cells transgenic for IL-10 (De Winter et
a l, 2002), which display increased levels of TGF-p. Furthermore, IL-10-/- mice
produce less TGF-p than wild-type mice (De Winter et a l, 2002). In a reciprocal
fashion TGF-p can also enhance levels of IL-10. For example, treatment of colitis by
administration of a plasmid encoding TGF-p provides a beneficial effect via elevated
levels of IL-10 production (Kitani et a l, 2000). These studies indicate that blocking one
of these suppressive cytokines has a corresponding effect on the other.
T cell anergy is described as a continuous state of unresponsiveness to rechallenge with
fully competent APC. There are two ways in which a T cell can be rendered anergic.
The first way has been discussed previously (section 1.6.2) and involves the absence of
5 3

co-stimulation (“signal 2”). Alternatively T cell anergy can be induced when T cells are
activated in the presence of IL-10 or are stimulated with APC which have been pre
treated with IL-10 (Groux et al., 1996; Steinbrink et a l, 2002). These results show that
not only can IL-10 effect T cell function via the APC, but IL-10 can also have a direct
effect on T cells themselves. After cells have become anergized by the presence of IL-
10, they acquire regulatory properties which are cytokine independent (Steinbrink et a l,
2002). In addition this level of unresponsiveness cannot be reversed by the addition of
rIL-2 (Groux et a l, 1996; Perrin et a l, 1999). IL-10 anergized cells are unable to
produce cytokines, but when “forced” to proliferate with high concentrations of anti-
CD3, a population of T cells which has the ability to produce cytokines arises. These
cells produce IL-10 and TGF-p and have been termed TiT cells (as discussed in Section
1.9) (Groux et a l, 1997). Therefore it appears that these regulatory cells go through two
stages of differentiation to become Trl cells. It has been suggested that these are the
most powerful regulatory cells, because of their direct effect on other T cells, and their
ability to affect proliferation via APC by the production of IL-10.
In the mouse, IL-10 alone is not sufficient to induce a state of hyporesponsiveness
equivalent to that seen in human cells. Only mouse T cells primed with IL-10 and TGF-
p are hyporepoiisive in vivo (Zeller et a l, 1999). However, studies into human T cell
anergy reported that IL-10 was fully capable of inducing anergy without TGF-p . In
addition, rTGF-pi or 2 added to IL-10 did not increase the level of anergy induced by
IL-10, nor synergize with IL-10 to promote the differentiation of Trl cells (Levings et
a l, 2001). The reason for the differing role of TGF-P in the mouse and in the human
remains to be elucidated. In conclusion it appears that both IL-10 and TGF-P are
required for the differentiation of Trl cells in the mouse model, whereas IL-10 has the
5 4

ability to function independent of TGF-p in the generation of these cells in the human
system.
5 5

Figure 1.3. Differentiation processes of Thl and Th2 cells
A. The delivery of Ag to the TCR via the APC, results in an up- regulation of IL-12R. APC derived IL-12 and IL-27 results in the priming of naïve T cells toward a Thl phenotype. IL-27 binds to WSX-1 and IL-12 signals via STAT4 to initiate the up-regulation of IFN-y. IFN-y activates STATl,which induces the transcription factor T-bet. IL-12 induces the IL-18 receptor, which allows binding of IL-18 which results in lL-18 synergizing with IL-12 to increase IFN-y. IL-18 can activate NFkB which can also amplify the IFN-y response. Memory T cells respond to IL-23 which enliances proliferation of effector cells and increases IFN-y responses (adapted from Robinson and O'Garra, 2002).
B. The mechanisms involved in Th2 differentiation are less well understood. IL-4 is the key cytokine involved in inducing Th2 differentiation, however the early source of IL-4 varies in different models. NK cells, mast cells or differentiating T cells themselves have been proposed to produce early IL-4. Early IL-4 activates STAT6, which induces GATA3. GATA3 has many important effects including involvement in cliromatin remodelling of the IL-4/IL-13 locus. Also, c-Maf and NFAT transcription factors are important in regulating production of IL-4, IL-5 and IL-13 (adapted from, Agnello et al., 2003).

Naïve CD4+ ThlIL-18
Thl Effector
lL-18
IL-12
IL-18R
Thl
L- 8R
IL-12R
% %STAT4
C D 4T cell ► STAT
STAT4STAT4
L- 2R
1L-12RWSX-1
L-12
1L-23R
lL-12 lL-23
B
Th2
1L-12R1L-12R
NAFT
► IL-13C-M af
GATA3
STAT6
L-4R
56

1.8. Parasitic models of Thl/Th2 development
In terms of parasite immunology, the first demonstration of the importance of the Thl
/Th2 balance in the regulation of disease outcome in vivo came from studies in the
mouse model of Leishmania major. Infection of inbred strains of mice with L major
demonstrated that the differential development of Thl or Tli2 cells during experimental
cutaneous ieislnnaniasis determines the outcome of infection (Reiner and Locksley,
1995). Infection of resistant mice (C57BL/6, CBA and C3H/He) with L major results in
the onset of an IL-12 dependent Thl response, which results in elevated levels of IFN-
y and healing. BALB/c mice, on the other hand, are susceptible to infection and develop
a parasite specific Th2 response, with elevated levels of IL-4, progressive lesions and
eventually die. It has been shown that early production of IL-4 results in Th2
polarisation and therefore the suppression of the Thl IFN-y response which is
responsible for activating infected macrophages for parasite killing (Green et aL, 1990;
Liew et a l, 1990). Early IL-4 is produced by a population of CD4" cells with a
V(34Va8 T cell receptor, as VJ34-deficient BALB/c mice mount a stronger Thl response
than wild-type mice and appear to control lesion development (Launois et a l, 1997).
However the role of IL-4 in disease progression is controversial as demonstrated by
experiments in IL-4Ra mice (Mohrs et a l, 1999; Noben-Trauth et a l, 1999), STAT6,
and BCL6 deficient mice (Dent et a l, 1999). The complex interplay of IL-4 and IL-13
was dissected using IL-13 transgenic mice and IL-13 -/- mice (Matthews et a l, 2000).
In this study it was shown that over expression of IL-13 in transgenic mice makes the
normally resistant C57BL/6 mouse strain susceptible to L. major infection even in the
absence of IL-4. In addition IL-13 -/- BALB/c mice are resistant to infection. This
5 7

resistance is independent of IL-4, however when IL-4 was deleted along with IL-13
there was an additive effect (Matthews et a l, 2000). The healing response of L. major
infection is characterised by an early Thl response with elevated levels of IFN-y and IL-
12 (Nacy et a l, 1991; Swihart et a l, 1995). Interestingly a recent study has reported a
role for WSX-1 in the initiation of Thl responses and resistance to L. major infection.
WSX-1-/- mice were remarkably susceptible to L. major infection, showing impaired
IFN-y production in early phases of infection. However, IFN-y production during the
later stages of infection was not impaired in the WSX-/- mice. These data therefore
indicate that WSX-1 is essential for the initiation of Thl responses but dispensable for
their maintenance (Yoshida et a l, 2001). The role of IL-10 in promoting disease
progression in Ieislnnaniasis was investigated by examining lesion development
following L. major infection of susceptible BALB/c mice deficient in IL-10. Where
normal BALB/c mice develop unhealing progressive lesions containing many parasites,
IL-10-/- mice controlled disease progression and relatively small numbers of parasites
were recovered.
The importance of the Thl response in clearing infection with L. major has been widely
demonstrated whereas IL-4 and IL-13 have been shown to be important in maintaining
infection. In contrast, resistance to the gastrointestinal nematode T. muris is dependent
on the Th2 pathway. When IL-4 was blocked in resistant mice, a Thl response was
generated with the development of chronic disease. In addition, administering IL-4 to
strains of mice which are susceptible to infection with T. muris resulted in the expulsion
of worms (Else et a l, 1994). These results were later confirmed in IL-4-/- mice infected
with T. muris. These animals failed to mount a sufficient Th2 response and therefore
could not expel the parasite (Bancroft et a l, 1998). In further experiments it was found
5 8

that the background strain of mouse was important in whether worms were expelled or
not. For example, C57BL/6 mice deficient in IL-4 develop chronic uniesolving
infection, while BALB/C mice deficient in IL-4 clear infection suggesting an IL-4
independent pathway of immunity, at least in BALB/c mice (Bancroft et al., 1998; Artis
et a l, 1999; Bancroft et a l, 2000). This led to studies which investigated the role o f IL-
13 in T. muris infection. As discussed in Section 1.7.3.2, IL-4 and IL-13 have
overlapping biological activities, therefore it was important to understand the function
of this cytokine in regulating Th2 responses. IL-13 was neutralized in vivo in IL-4-/-
C57BL/6 mice and it was shown that these mice could expel their parasites, thus
indicating that IL-13 is an important cytokine in regulating resistance to T. muris.
In contrast, mouse strains that are susceptible to T. muris respond to infection by
producing IFN-y and IL-12 and develop chronic infection (Else et a l, 1992). The
importance of IFN-y in the maintenance of infection in susceptible strains of mouse (e.g.
BIO.BR, AKR) was demonstrated by neutralization of this cytokine in vivo, resulting in
the expansion of Th2 cells and clearance of infection (Else et a l , 1994). In addition,
when rIL-12 was administered to a resistant strain of mice (BALB/K), these mice
developed elevated levels of IFN-y and were unable to clear their parasites (Bancroft et
a l, 1997). IL-18 has been shown to work in synergy with IL-12 in promoting Thl
priming (Okamura et a l, 1995) and has a role in the regulation of responses to T. muris.
In susceptible animals infected with T. muris, IL-12, IL-18 and IFN-y mRNA were
detected in sequence. IL-18-/- mice expelled their worms faster than IL-12-/- mice. IL-
18-/- mice did not produce significantly different amounts of IFN-y compared to their
wild type counterparts but they did produce significantly more IL-13. Interestingly,
when resistant mice were given rIL-18, the mice developed a chronic infection. Similar
5 9

results were obtained in IFN-y-/- mice indicating an important role for IL-18 in
regulating immune responses to T. muris (Helmby et a l, 2001).
The role of IL-10 in regulating immune responses to T. muris has also been
investigated. It was found that normally resistant mice (C57BL/6) mice were rendered
susceptible to infection with T. muris when IL-10 was knocked out. This susceptibility
correlated with an increase in levels of Thl cytokines (Schopf et a l, 2002). Taken
together, these data demonstrate the importance of a Thl response for establishment of
infection, whereas the production of Th2 cytokines plays a vital role in the expulsion of
this parasite. Interestingly, additional experiments have identified a role for TNF-a in
the regulation of IL-13 mediated expulsion of T. muris (Artis et a l, 1999). Using mice
deficient in TNF-aR signalling or anti-TNF-a MAh treatment has demonstrated a role
for TNF-a in regulating Th2 cytokine-mediated responses. In vivo blockade of TNF-
a in normally resistant mice did not alter IL-4, IL-5 or IL-13 production in the draining
lymph node, but levels of worm expulsion were significantly delayed. TNFR -/- mice
failed to expel T. muris, producing high levels of Thl cytokines suggesting that the
absence of TNF-a at the onset of infection alters the phenotype of the response elicited.
1.9. Treg cells
Although evidence for polarized CD4^ T cell cytokine secretion profiles that define Thl
and Th2 subsets is indisputable, these extremely polarized responses are usually
observed under highly contrived experimental conditions. The real challenge to the Thl-
Th2 paradigm comes when attempts are made to apply this simplistic dichotomy in
explaining immune system-dependent disease conditions. These and other issues have
recently caused a spate of interest in a recently re-discovered group of cells, namely the
6 0

Treg cells. These cells have a suppressive function and are distinguishable by their
cytokine profile (IL-10 and TGF-P) and mechanism of suppression. So far at least three
separate T regulatory cell types have been characterised. Th3 cells were first discovered
during studies into oral tolerance, where low dose administration of Ag was Imown to
result in active suppression of immune responses. These cells are IL-4 independent and
CD8 6 dependent, requiring interaction with APC. Th3 differentiation is enlianced by
culture with TGF-p, IL-4, IL-10 and anti-IL-12, and matme Th3 cells predominantly
secrete TGF-p and varying amounts of IL-10 and IL-4. In addition, these cells express
CTLA-4 on their surface (Weiner, 2001). Trl cells were initially discovered in studies
of CD4^ cells which were activated in the presence of IL-10 and rendered anergic.
Analysis of this population at the clonal level showed a subset of T cell clones with a
unique cytokine profile, secreting high levels of IL-10 and TGF- p, moderate IFN-y and
IL-5 with little or no IL-2 or IL-4. These cells have been shown to be involved in the
down-regulation of immune responses in vivo and in vitro via the production of IL-10
and TGF-p (Roncarolo et a l, 2001a) Lastly, the third group of Treg cells are the
naturally occurring CD4^CD25^ cells which have potent suppressor functions in vivo
and in vitro. Removal of these cells from normal rodents is associated with the
development of various autoimmune diseases. Although it has been suggested that
suppression by these cells is cytokine independent, they are known to produce IL-10,
TGF- p and low levels of IL-4 or IL-2. Consequently the role of these cytokines is
controversial. One study suggested that the production of IL-10 from CD4‘ CD25’ cells
may lead to the induction of CD4’*’CD25' cells which suppress immune responses via
the production of IL-10 (i.e. CD4^CD25^ cells induce Trl like cells) (Dieckmaim et a l,
2002). CD4^CD25^ cell suppression is thought to be linked to their ability to inhibit IL-
2 production but also requires cell to cell contact to induce suppression which may be
6 1

associated with surface bound TGF-P, LAP, CTLA-4 or GITR. In addition these cells
differ from Th3 and Trl cells in that CD25^ cells exist in the thymus as suppressor cells,
while Th3/TiT cells can arise from any naïve peripheral CD4^ cell (Read and Powrle,
2001). Until recently very little was known about the molecular mechanism of the
development of CD25^ regulatory cells, but in a study by Hoii et al (Hori et a l, 2003)
the gene Foxp3 was shown to encode a transcription factor which is specifically
expressed in naturally arising Treg cells (see Figure 1.4A).
Regulatory cells have the capacity to inhibit potentially harmful immune responses and
have been described in various experimental systems. Best characterised aie the
CD4^CD25^ cells which have been shown to prevent inflammatory bowel disease (Read
et a l, 2000) and inhibit autoimmune diabetes in rats (Stephens and Mason, 2000).
Treatment with monoclonal Ab specific for CD25 has been shown to suppress a variety
of tumours in mice (Onizuka et a l, 1999). In addition, several studies have indicated the
role of CD4’ CD25’ cells in transplant tolerance, by preventing auto immunity and
enabling the development of tolerance to organ, tissue and cell transplants (Wood and
Sakaguchi, 2003). Regulatory T cells also function in immune responses to various
infectious agents, whether it be fungal, viral, bacterial or parasitic infections and these
studies are reviewed in Chapter 5. Figure 1.4 illustrates the pathways leading to the
development of Treg cells.
6 2

Figure 1.4. Diagrammatic representation of the development of Treg cells
A. Treg cells which express Foxp3 aie produced in the thymus, however CD4+ cells which are found in the periphery may also acquire regulatory properties. Loss of function mutations of Foxp3 results in wasting disease and lymphoproliferative disorders. Treg cells inhibit activation of CD4+ effector cells, therefore have an important role in the prevention of these disorders (adapted from O'Garra and Vieira, 2003).
B. Naïve T cells differentiate in the thymus and cells which are selected include low-affinity TCR T cells and high affinity TCR natural CD4'^CD25’ Treg cells (Trn). Conventional T cells and Tregs are exported to the periphery where they respond to Ag. Conventional CD4+ cells become either T helper or Treg cells depending on the affinity of their- TCR to Ag, the strength of co-stimulatory signals and the cytokine environment. Stimulation of naïve T cells with regulatory DC can result in the generation of a population of Treg cells (Trl cells), in addition IL-10 can also induce this population. TGF-p and IL-2 can cause Thp cells to differentiate towards a Th3 phenotype. These two Treg cells produce IL-10 and TGF-p and can suppress T cell prolferation in a cytokine dependent mamier. CD4^CD25^ cells (Trn) suppress T cell proliferation in a cytokine independent, contact dependent manner in vitro (adapted from, Horwitz et a l, 2003).

Thymus
NORMALM CE
C D 4X D 25
CD25
SUPPRESSION
PeripheryRegulation o f immune response
Foxn3-/-
TccllFoxp3-/-
Thymus
No CD4+CD25+ T cells
NO SUPPRESSION
Lymphoproliferative disorders Wasting disease
Periphery
B
HELPER
THYMUS
REGULATORY
L- 0L- 2
DC-2
6 3

1.10 Aims of thesis
The infective third stage larvae of filarial worms have potent immuno-modulatory
effects on the host immune system. The aims of this thesis were to define how L3
modulate cytokine and cellular immune responses in a well-characterised mouse model
of infection.
The specific aims are detailed below.
• IL-4 is a prototypic Th2 cytokine and is secreted by PBMC of all individuals in
an endemic area. Ag-specific IL-4 is produced by splenocytes and lymph node
cells from L3 infected BALB/c mice, therefore it was of interest to investigate
whether IL-4 had a role in worm survival and to analyze immune responses in
IL-4-/- mice.
• IL-10 is Imown to be important in maintaining hyporesponsiveness in MF+
individuals and is up-regulated in L3 infected mice. However, as the cellulai*
sources of IL-10 have not been defined, I set out to investigate the role of IL-10
in L3 infection and to identify the major source of IL-10 in the mouse model.
Recent data suggests the presence of Treg cells in chronic infectious disease.
Although the L3 of Brugia is the infective form, the production of elevated IL-
10 suggests that the L3 may induce a suppressor cell population. Therefore
experiments were carried out to determine whether infection with L3 elicits Treg
cells.
There are many immune cells which ar e known to present Ag to T cells and the
capacity of B cells to carry out this function, along with their ability to produce
modulatory cytokines was investigated in the L3 BALB/c model.
6 4

65
III

Chapter 2. Materials and Methods
2.1. The Parasite
2.1.1. Mosquito life cycle
Mosquitoes {Aedes aegypti) were kept in mesh cages in a purpose built insectary
maintained at a temperature of 28”C and relative humidity of 75-80%. To maintain
stocks, mosquitoes were fed twice weekly with heparinized rabbit blood using an
artificial membrane feeder. Eggs were collected on moist Whatman 3 mm filter papers
which were placed in cages. The papers were then removed and dried and stored until
required. Eggs were hatched by placing the egg papers in plastic trays containing tap
water with yeast tablets to feed the developing larvae. Pupae were picked daily and
placed in cages. Adult mosquitoes were fed on a diet of sucrose before being starved 24
hours prior to receiving a blood meal.
2.1.2. Parasite life cycle
Adult parasites and microfilaria were obtained from the peritoneal cavity of infected
jirds {Meriones unguiculatus), which had been infected intraperitoneally with 250 L3
of B. pahangi for at least tlnee months. Jirds were killed by CO2 inhalation. Worms
were obtained by repeated peritoneal lavage with Hanks Balanced Salt Solution (HBSS,
Invitrogen) at 37®C. Adult worms were washed in HBSS and transferred to liquid
nitrogen until they were required for the preparation of parasite extracts. The MF
contained in the peritoneal washings were given a further wash in HBSS before being
resuspended in heparinized rabbits blood at a concentration of 400/20 pi. The infected
blood was then fed to mosquitoes using an artificial membrane feeder.
6 6

2.1.3. Recovery of infective larvae and microfilariae
Microfilariae were obtained from the peritoneal cavity of infected jirds by extensive
washing with HBSS. 1ml ddH2 0 was added to lyse any erythrocytes present. MF were
then washed in HBSS at 37°C and separated from host cells by centrifugation twice
over Histopaque-1077 (Sigma, Poole, Dorset) at 1200 rpm for 15 minutes with no
brake. MF were washed twice, resuspended in HBSS and coimted. L3 were extracted
fi'om infected mosquitoes at day 9 p.i. using standard methods (Devaney and Jecock,
1991).
2.1.4. Preparation of adult antigen extracts
Soluble extract of B. pahangi adult worms, for use in cell culture, was prepared by
extensive homogenisation on ice of frozen mixed sex adult worms in RPMI-1640
(Dutch Modification, containing 5 mM glutamine, 5 mM HEPES, 100 U/ml penicillin
and 100 pg/ml streptomycin, all Invitrogen, UK). The homogenate was incubated on ice
for a further 60 minutes with occasional agitation. The suspension was transferred to an
Eppendorf tube and centrifuged at 4°C at 10,000g for 30 minutes. The supernatant was
removed and sterilized by centrifugation through a 0.45 pm Spin-X filter unit (Co-star,
UK) and assayed for protein concentration using the BioRad method. Aliquots were
then stored at -70°C.
2.2. Animals and infection protocols
2.2.1. Standard infections
6 -week-old male BALB/c mice were purchased from Harlan-Olac (Bicester, U.K.) and
were maintained in filter-topped cages. Unless stated otherwise, groups of 5 BALB/c
6 7

mice were infected sub-cutaneously (s.c.) with either 50 L3 or 1 x 10 MF or an
equivalent volume of HBSS in the scruff of the neck. Syringes used for inoculation of
L3 were flushed with HBSS after use and the remaining L3 counted. If ten or more L3
remained, these were re-injected. Mice were typically culled on day 12 post-infection
(unless otherwise stated) by CO2 inhalation and spleens were removed.
2.2.2. Mosquito infections with L3
In some experiments, mice were infected by allowing mosquitoes to feed directly.
Mosquitoes were infected as described above and blood fed females were removed to a
separate cage. On day 9 p.i., 20 mosquitoes were dissected and the numbers of L3
counted to give an average number of L3 per mosquito. The appropriate number of
infected mosquitoes were then allowed to feed on the shaved abdomen of an individual
mouse, so that each mouse would receive a minimum of 50 L3. The fed female
mosquitoes were dissected after feeding to confirm that most L3 had been transmitted.
Controls in these experiments were mice infected by syringe inoculation or given HBSS
alone in the scruff of the neck.
2.2.3. Adult implants
Groups of 5 BALB/c mice were also infected with adult worms by implanting 10 adult
female worms into the peritoneal cavity. Adult worms were obtained from the
peritoneal cavity of infected jirds as described previously. Mice were anaesthetized
using Halothane and 10 female worms were introduced into the peritoneal cavity
through a small incision, using a sterile glass probe. The incision was clipped and mice
allowed to recover in warmed boxes. These animals were housed individually for the
duration of the experiment. Mice were killed by CO2 inhalation and spleens were
6 8

removed. In addition the peritoneal cavity of these mice was washed extensively with
HBSS to assess adult worm and MF recovery.
2.2.4. Other mouse strains
In additional experiments, 6 -week-old IL-4 deficient mice on the BALB/c background
were infected with MF, L3 or adult worms using the same protocols as described above.
Groups of 10-week-old male B cell deficient (IgM transmembrane domain) pMT or IL-
10-/- mice on the C57BL/6 backgromid were infected with L3 by the s.c. route. IL-10-/-
mice were obtained from Dr. R. Lawrence at the University of Manchester and pMT
mice were obtained from either Dr. J Allen at the University of Edinburgh or Dr. R.
Lawrence. Appropriate controls were used in all experiments.
2.3. Preparation of spleen cells
Spleens were removed aseptically and single cell suspensions were prepared in RPMI
by homogenising the tissue tlnough Nytex mesh using sterile syringe barrels (Cadisli
and Sons, London U.K.). Remaining tissue debris was removed by passage of the
suspension through Nytex mesh. Erythrocytes were lysed using 0.83% NH4CI (pH 7.2)
following which the single cell suspension was washed twice in RPMI. The number of
viable lymphocytes was assessed by the Trypan Blue exclusion method. The cells were
resuspended at 1 x 1 0 / ml (for proliferation assays) or 2 x 1 0 / ml (for cytokine
assays) in RPMI containing 20% heat inactivated FCS (Invitrogen) to give a final
concentration of 1 0 %.
6 9

2.3.1. Proliferation assay
Proliferation of splenocytes was measured by the incorporation of thymidine.
Triplicate 100 pi cultures (5 x 10 cells / well) in 96-well flat-bottomed half-area plates
(Costar) were incubated in the presence or absence of 10 pg/ml adult antigen. This
concentration of Ag was shown to be optimal in previous experiments (Osborne,
1997a). Cells were cultured at 37°C in an atmosphere of 5% CO2 and pulsed with 0.5
pCi of thymidine/well (Amersham) during the last 16 hours of incubation. The cells
were harvested and radioactivity measured in a “Topcount” Microplate Scintillation
Counter (Canberra Packard Instrument Company).
2.3.2. In vitro treatments
In certain experiments rat anti-mouse IL-10 MAb (JESS-5, Pharmingen, UK) or IgGl
isotype matched control MAb (R59-40, Pharmingen) were added to Ag-stimulated and
medium only culture at a final concentration of 1 pg/ml (anti-IL-10). After such
treatment, the proliferation and cytokine responses of the cells were assessed. IL-10 was
measured by cytokine ELISA assay, which demonstrated that this cytokine had been
successfully neutralized in JESS-5. In addition, in all experiments purified anti-mouse
CD80 (B7-1, 16-lOAl) and purified anti-mouse CD8 6 (B7-2, GLl) were added to Ag-
stimulated culture at a final concentration of 1 pg/ml. When these Ab were added to
culture simultaneously the final concentration was 2 pg/ml. For experiments in IL-4-/-
mice, IFN-y neutralizing MAb (XMG1.2) or isotype matched control (R3-34, both
Phaiiningen) were added to medium only and Ag-stimulated culture at a concentration
of 100 pg/ml. After such treatment the proliferative responses of the cells were assessed
as described in 2.3.1.
7 0

In other experiments the following supplements were added to both antigen-stimulated
and medium only cultures. All concentrations given refer to final concentrations active
in culture: Recombinant lL-4 (rIL-4, Sigma) at 500 pg/ml and 1 ng/ml; Aminoguanidine
(AMG, Sigma) at 500 mM. The proliferative and cytokine responses of these cells were
compared to those in unsupplemented cultures.
2.3.3. In vivo treatments
In some experiments mice were injected intraperitoneally with neutralizing IL-IOR
MAh (IB 1.3a, Pharmingen) or matched isotype control (GL113) at a concentration of
10 pg on day 0 and 4 and 7 post infection. In other experiments, mice were injected
intraperitoneally with neutralizing CD25 MAh (PC61) or isotype matched control
(GL113) at a concentration of 0.5 mg/ml on day -4 and -2 prior to infection.
Hybridomas were cultured in RPMl 1640 + 10% PCS, 1% glutamine, 1%
penicillin/streptomycin, 50 pM 2-mercaptoethanol, 2% petone and glucose solution, at
37^C with 5% CO2 . PC61 and GL113 Ab were prepai'ed by ammonium sulphate
precipitation of hybridoma supernatant and subsequent dialysis against PBS (Maizels et
al 1991). The Ab was sterilized using a syringe filter and protein concentration was
determined by carrying out a 1:10 dilution and taking an OD280 reading (Perkin Elmer
U.V. Spectrophotometer). Ab was stored at 4° C. Proliferation assays, cytokine assays
and FACS analysis were carried out on the splenocytes from each group of animals as
described in 2.3.1, 2.3.4 and 2.4 respectively.
2.3.4. Analysis of cytokine production by ELISA
Spleen cells were incubated at 1x10^ cells/ml in 1ml cultures in 24-well fiat-bottomed
plates (Costar) in the presence of Ag (10 pg/ml) or medium only. Supernatants were
7 1

harvested at 48 hours, unless otherwise stated. After centrifugation for 5 mins at 13,000
rpm the cell-free supernatants were stored in aliquots at -20°C. Levels of IL-2, IL-4, IL-
5, IL-10 and IFN-y were determined by two-site ELISA using Ab pairs purchased from
Pharmingen. The optimal concentrations for the capture and detecting antibodies were
determined in preliminary experiments. Results are expressed as pg/ml in reference to
commercially available standards (IL-12, IL-4, IL-5 and IL-10 from Pharmingen and
IFN-y from R and D Systems, UK). The sensitivity of the assay was determined as the
mean + 3 SD of the 16 wells containing medium only (RPMI 10% FCS). For
measurement of IL-13, the Murine Quantikine kit (R and D Systems) was used
according to the manufacturers guidelines. For the measurement IL-2, IL-4, IL-5, IL-10
and IFN-y, ELISA plates (Corning Easy Wash) were coated with 50 pl/well capture Ab
in PBS, over-night at 4°C and then blocked with 150 pl/well PBS, 0.5% Tween 20
(PBS.T20), 10% FCS for 45 minutes at 37°C. During this incubation, samples were
defrosted and doubling dilutions of the recombinant cytokine standards were prepared
in RPMI/10% FCS on a separate plate. ELISA plates were then washed twice with
PBS/T.20 quickly and twice for 3 minutes. Samples, standards and RPMI/10% FCS
were transferred to plates at 50 pl/well for 2 hours at R.T. Plates were washed as
described above and biotinylated secondary antibody diluted in 1% BSA PBS/T.20 was
added at 50 pl/well for 1 hr at R.T. Plates then were washed as before. Streptavidin
peroxidase (Serotec, UK) diluted 1/1000 in 1% BSA PBS/T.20 was added at 75 pl/weli
for 1 hr at R.T. Plates were washed as before and TMB peroxidase substrate (KPL, UK)
was added at 100 pl/well for 10 minutes. Plates were read at 620 nm in a Dynatech
MR5000 automated ELISA reader.
7 2

2.3.5. Analysis of nitrite by the Greiss reaction
The Greiss reaction was used to measure nitrite levels in culture supernatant, using the
following protocol. 50 pi of cell culture supernatant and 50pi of Greiss reagent (see
2.7.8) were mixed in 96 well flat bottomed plates and incubated at room temperature for
10 minutes before absorbance was determined at 560 mn (all samples were tested in
duplicate). NO2’ concentration was calculated from a standard curve using two-fold
dilutions of a stock control solution of sodium nitrite at 10 pg/ml. Sensitivity was
determined as the mean + 3 SD of the 16 wells containing medium only (RPMI 10%
FCS).
2.4. FACS staining
2.4.1. Cell surface staining
Cells to be stained were removed from culture, transferred to FACS tubes (Falcon), and
washed twice in 200 pi of staining buffer (see 2.7.6), by centrifugation at 1000 ipm for
5 minutes. 2x10^ cells were stained with 2 pg/test of fluroclirome-conjugated antibody
in staining buffer or staining buffer only (100 pl/sample) on ice for 20 min. Cells were
washed twice in staining buffer as before and resuspended in 300 pi of fixation buffer
(see 2.7.6) if not to be analysed immediately. Stained samples were stored in the dark at
4 °C. Samples were gated on lymphocytes, as determined by size and granularity
(forward and side scatter). Monoclonal antibodies used were as follows, anti-mouse
CD4 (L3T4), anti-mouse CD45R/B220 MAb (RA3-6B2), anti-mouse CD8 (Ly-2), anti
mouse CD152 (CTLA-4, UC10-4F10-11 ), anti-mouse CD25 (PC61), anti-mouse CD80
(B7-1, 16-lOAl) and anti-mouse CD8 6 (B7-2, GLl) (all Pharmingen). In experiments
examining the expression of CTLA-4, B7-1 and B7-2, Fc block (Pharmingen) was used
7 3

at a concentration of 1 pg/test to reduce non-specific binding. Fc block was added to
samples along with the antibody of choice. Isotype controls used were as follows, Rat
IgG2a-FITC (KLH/G2a-1-1, Southern Biotechnology Associates), rat IgG2a-APC
(R35-95), rat IgGl-PE (both Pharmingen).
All samples were analysed on a Becton Dickinson FACScalibur (department of
Immunology, University of Glasgow). Data analysis was carried out by using Becton
Dickinson’s CellQuest software.
2.4.2. CFSE staining
Splenocytes were harvested from mice as described in 2.3. Cells were labelled with
CFSE ex-vivo and then cultured with or without stimulation, prior to cell surface
staining and flow cytometric analysis. After counting the number of viable splenocytes,
5 X 10 cells/sample were washed twice in 5 ml sterile PBS by centrifugation at 1000
rpm for 5 minutes. Cells were then incubated in 10 pM CFSE in PBS (Molecular
Probes, Netherlands) at 5 x 10 cells/sample for 8 mln at R.T. The reaction was stopped
by the addition of 5 ml of RPMI containing 20% FCS. All samples were washed twice
in RPMI 10% FCS. Stained cells were plated out in 1 ml cultures as described
previously, with or without stimulation, for 96 hr prior to cell surface staining and
FACS analysis. CFSE labelled cells were hai'vested and surface stained with either an
anti-mouse CD4 APC conjugated MAb (L3-T7), anti-mouse B220 APC conjugated
MAb (RA3-6B2), anti-mouse CD8 (Ly-2) or isotype matched control (R35-95) (all
Pharmingen), as described above, prior to FACS analysis. Samples were gated on total
lymphocytes, as determined by forward and side scatter and CD4^, B220^ or CD8
lymphocytes for analysis of CFSE staining profiles. Controls in each experiment
7 4

comprised unstained cells, cells stained with anti-CD4 or anti-B220 or isotype matched
control only and cells stained with CFSE only cultured In medium alone.
2.4.3. FACS gating
Lymphocytes were initially gated by means of their physical properties in terms of size
and granularity (forward and side scatter) (Figure 2.1 A). The number of positively
stained lymphocytes [in this example CD4^ cells were stained with FITC (FL-1)] were
determined using gates set with the isotype control for the particular flurochrome,
shown in B. Positively stained lymphocytes are shown in panel C. Histogram statistics
ai'e also shown, indicating that CD4^ cells make up 19.8% of gated lymphocytes.
For three colour staining, lymphocytes were gated as shown in Figure 2.1.D, CD4^
cells were stained with FITC and the gate was set on positive cells to create region 2
(R2)(D). The dot plot shown in E is gated on R2 and an isotype control (for PE and
APC) was analysed to plot a quadrant, allowing analysis of CD4^ (FITC), CD25’*' (APC
stained (FL-4)) and CTLA-4+ (PE stained (FL-2) cells as shown in F. Quadrant
statistics are also shown demonstrating that 5.98% of CD4^ cells also express CD25 and
CTLA4.
CFSE labelling was used to track the proliferation of specific cell types. Cellular
division can be visualised by the serial halving of FL-1 fluorescence, therefore if CSFE
labelling is coupled with cell surface staining (APC, FL-4), the proliferation of specific
cell types can be analysed by flow cytometry. The gates were set using FL-4 isotype
control stained cells (G). The example given in H depicts the division of CD4^ cells.
7 5

Histogram statistics are shown and it can be seen that 6.05% of total lymphocytes are
dividing CD4^ cells.
7 6

) ' ' zoo 400 600 800 1000FSC+I
B C
Isotype c M1-CD4+
FL1-H FL1-H
File: vic18.2.03.021
Sample ID:Tube:Acquisition Date: 18-Feb-3
Gated Events: 55223
X Parameter: FL1-H (Log)
Histogram Statistics
Log Data Units: Linear Values
Patient ID:Panel:Gate: No Gate
Total Events; 55223
Marker Left, Right Events % Gated % Total Mean Geo Mean CV Median Peak ChAllM1
1, 9910
14, 58825522310936
100.0019.80
100.0019.80
10.5841.68
4.1436.95
236.69105.85
2.7437.18
139
7 7

D
CD4+
— I ■ ■ ■ ■ I I I ■ ■ I ■ ■ I 1 1 ■ ■ ■ ■ I I » ' f f
0 200 400 600 800 1000FSC4H
o O '
1Isotype c
1
1 0.
10'- 1 0 '
FL2-H10 ' 10
FL2-H
CD4+CD25+ CTLA-4+
I l l l I I I I I Mil I
1?
File: vic18.2.03.019 Sample ID:Tube:Acquisition Date: 18-Feb-3 Gated Events: 9629 X Parameter: FL2-H (Log) Quad Location: 24, 25
Quadrant Statistics
Log Data Units: Linear Values Patient ID:Panel:Gate: G2Total Events: 66806 Y Parameter: FL4-H (Log)
uad Events % Gated % Total X Mean X Geo Mean Y MeanUL 1902 19.75 2.85 10.03 8.49 1102.00UR 576 5.98 0.86 64.25 51.62 856.29LL 7067 73.39 10.58 6.37 5.91 6.87LR 84 0.87 0.13 55.30 42.88 13.71
7 8

H
Isotype c
FL1-H
DividingCD4+/^
FL1-H FL1-H
File: vic27.5.02.019 Sample ID:Tube:Acquisition Date: 27-May-2 Gated Events: 18171 X Parameter: FL1-H (Log) Quad Location: 183, 13
Quadrant Statistics
Log Data Units: Linear Values Patient ID:Panel:Gate: G1Total Events: 29733 Y Parameter: FL4-H (Log)
uad Events % Gated % Total X Mean X Geo Mean Y Mean Y Geo MeanUL 1099 6.05 3.70 39.21 26.95 422.22 250.99UR 2787 15.34 9.37 633.84 588.78 211.50 134.94LL 5113 28.14 17.20 43.31 27.71 3.37 2.67LR 9172 50.48 30.85 836.86 681.27 1.91 1.58
vic27.5,02.027
1 0 ' 10 ‘ 10 '’ FL1-H
File: vic27.5.02.027 Sample ID:Tube:Acquisition Date: 27-May-2 Gated Events: 9038 X Parameter: FL1-H (Log) Quad Location: 93, 15
Quadrant Statistics
Log Data Units: Linear Value Patient ID:Panel:Gate: G4Total Events: 17490 Y Parameter: FL4-H (Log)
Quad Events % Gated % Total X Mean X Geo Meat Y Mean Y Geo MearUL 60 0.66 0.34 34.28 24.52 353.48 53.09UR 1283 14.20 7.34 722.70 621.33 351.32 92.94LL 591 6.54 3.38 28.37 19.96 2.81 2.08LR 7104 78.60 40.62 1158.46 851.29 1.91 1.56
7 9

2.5. Magnetic Separations
2.5.1. Cell depletion
In experiments to determine the cellular source of IL-10, splenocytes from L3 infected
animals were depleted of either CD4’*’ or B220^ cells by magnetic separation, prior to in
vitro culture. Splenocytes were prepared as described previously and pooled from five
L3 infected mice. Unseparated cells were plated out prior to depletion for proliferation
and cytokine assays as described in 2.3.1 and 2.3.4 respectively. At this point 5 x 10
cells were removed for FACS analysis and stained with an isotype control antibody
(KLH/G2a-1-1, Pharmingen) for use in setting gates for FACS. The remaining pooled
cells were washed in PBS and then stained with either an anti-CD4 or anti-B220 FITC
conjugated MAb (L3T4 or RM4-5, both Pharmingen) in 500 |l.i1 of PBS on ice for 20
minutes. Both Abs were used at 2 |al/2 x 10 cells. Cells were then washed twice in PBS
and 5 x 1 0 ^ cells were taken for FACS analysis to determine the percentage of CD4^
and B cells in total splenocyte preparations. Cells were then resuspended at 90 |l x 1 of
buffer/10^ cells in degassed separation buffer (see 2.7.6) prepared to MACS
specifications, with anti-FITC beads (10 p.1 of beads/10^ cells) and incubated on ice for
15 minutes. Cells were washed in separation buffer and resuspended in 500 jul of
separation buffer. Prior to passing cells over the positive selection LS column (Miltenyl
Biotec), 3 ml of separation buffer was passed over the column. Cells were loaded onto
the column followed by 9 ml of buffer and collected upon exit from the column. Cells
were washed in PBS and 5 x 1 0 ^ cells were removed for FACS analysis to determine
the efficiency of the depletion. Cells were then resuspended in RPMI containing FCS
2 0 % and plated out as described previously for proliferation and cytokine assays.
8 0

2.5.2. Cell purification
For RNA extraction CD4^ and B220^ cells were purified from splenocytes of L3
infected animals by magnetic separation. Splenocytes were prepared as described
previously and pooled from five L3 infected mice. At this point 5 x 10 cells were
placed in a cryotube and frozen in liquid nitrogen for RNA extraction from whole
splenocytes. 5x10^ cells were removed for FACS analysis and stained with an isotype
control antibody (KLFl/G2a-l“l, Pharmingen) for use in setting gates for FACS. The
remaining pooled cells were washed in PBS and then stained with either an anti-CD4 or
aiiti“B220 FITC conjugated MAb (L3T4 or RM4-5) both Pharmingen) in 500 pi of PBS
on ice for 20 minutes. Both Abs were used at 2pi / 2 x 10 cells. Cells were then washed
twice in PBS and 5 x 10 cells were taken for FACS analysis to determine the
percentage of CD4^ and B cells in total splenocyte preparations. Cells were then
resuspended in degassed separation buffer (90 pi of buffer/10^ cells) with anti-FITC
beads (10 pi of beads/10^ cells) and incubated on ice for 15 minutes. Cells were washed
and resuspended in 500 pi of buffer. 3 ml of separation buffer was passed over the
positive selection LS column (Miltenyl Biotec) and cells were then loaded onto the
column followed by 9 ml of buffer and collected upon exit from the column. To collect
purified CD4^ or B220^ cells, the column was removed from the magnet and placed on
a new collection tube. 5 ml of buffer was applied to the reservoir of the column and the
cells were firmly flushed out using the plunger supplied with the column. 5 x 1 0 ^ cells
were then taken for FACS analysis to determine the efficiency of the purification. The
purified CD4^ and B220^ cells were placed in a cryotube and stored in liquid Nitrogen.
81

2.6. Analysis of cytokine mRNA expression following infection with L3
2.6.1. RNA extraction
Cells from the purification experiments described above were removed from liquid
nitrogen and total RNA was extracted using TRIzol (Invitrogen), according to the
manufacturer’s instructions. 1 ml of TRIzol was added to the cryotube containing cells
and heated to 60“C for 10 minutes. The samples were then vortexed. At this point 3 pg
of glycogen (Invitrogen) was added to each sample to act as an RNA carrier. 200 pi of
cholorform was added and the samples were shaken for 15 seconds. After centrifugation
at 4 °C for 10 minutes at 12,000 rpm the aqueous layer containing RNA was pipetted off
into a fresh Eppendorf tube. 0.5 ml of isopropanol was added to each sample to
precipitate the RNA (0.5 ml isopropanol for every ml of TRIzol initially used). Samples
were then incubated at room temperature before further centrifugation at 4 °C for 10
minutes at 12,000 rpm. A small pellet of RNA was then formed and the supernatant was
removed using a Pasteur pipette attached to a suction pump. To enhance subsequent
solubility, 1 ml of 75% ethanol was added to each tube (1 ml of ethanol for every ml of
TRIzol initially used) and the sample was vortexed. Samples were then centrifuged at
4°C for 5 minutes at 7500 rpm. The pellet formed was dissolved in an appropriate
amount of diethyl pyrocarbonate (DEPC) H2O (10 ql - 30|ul) and incubated at 55 - 60 °C
for 10 minutes to ensure the RNA was dissolved.
The RNA was then quantified by spectrophotometry at OD260 and checked by ethidium
bromide staining on 1% agarose mini-gels. Before the gel was poured, the mini-gel tanlc
and combs were washed in 0.25M HCl, and three times in DEPC treated H2O. For a 50
ml mini-gel, 0.5 g agarose was melted in a solution containing 5 ml lOX MOPS buffer
8 2

and 39.5 ml of DEPC H2O by boiling in the microwave. The solution was cooled to 55
°C. In a fumehood, 8.5 ml of 17% formaldehyde was added, mixed and the gel was
poured. 1 pi of 500 ng/ml ethidium bromide, 1 pi loading buffer and 1 pi of formamide
was added to 1-5 pg of each RNA sample. Prior to electrophoresis, the RNA samples
were denatured by heating to 65 °C for 10 minutes. When the gel was set, the RNA
samples were loaded and the gel was run in IX MOPS buffer at 45V for 30-40 mins.
RNA was visualised on the UV transilluminator. RNA was aliquoted and stored in
DEPC-treated El2 0 at -70°C until used.
2.6.2. RT-PCR detection of IL-10 and TGF-p
The reverse transcription reaction was carried out in a total volume of 20 pi. 2 pi of
random primers (Promega) were added to 10 pi of total RNA (2 pg) and the mix was
heated to 70 °C for 10 mins and then cooled on ice for 10 mins. 4 pi of first strand
buffer (Invitrogen), 2 pi DTT (Invitrogen) and I pi 10 mM dNTP mix were added and
incubated at 42 °C. I pi of Superscript (reverse transcriptase) was added to the mix
which was heated to 42°C for 50 mins with a final extension of 70 °C. 1 pi of RNase
was added and the reaction was incubated at 37 °C for 20 mins. The reaction was then
chilled on ice and stored at -20 °C.
Real time quantitative reverse-transcriptase-PCR was carried out using the TaqMan
method with gene specific primers and internal probes for IL-10 and TGF-p and HPRT
(Cruachem) designed to specifically amplify the target cDNA as these primers were
designed to span an intron/exon boundary and thus anneal specifically to cDNA (primer
and probe sequences shown in Table 2.1). FIPRT was used as the constitutively
8 3

expressed gene. All primers and probes were HPLC purified and lyophilised. For the
standard TaqMan protocol, primers were used at a concentration of 10 pM and probes at
5 pM. Each reaction of 25 pi volume contained 12.5 pi TaqMan Universal PCR Master
Mix (Applied Biosystems), 1 pi probe, 0.75 pi each primer and 9 pi H^O. Sufficient
mastermix was prepared to analyse each sample in triplicate including a non-template
control (water alone). 24 pi of mastermix was then aliquoted into the appropriate wells
of a Micro Amp Optical 96 well reaction plate (Applied Biosystems). 1 pi of previously
prepared cDNA (or FUG in the case of the non-template controls) was then added to the
wells. Once the samples were added the plate was sealed with Optical Caps (Applied
Biosystems). Plates were then spun at 1400 rpm for 1 min to ensure that there were no
bubbles in the samples, as this interferes with the laser beam. The plate was then placed
in the ABI/PRISM 7700 detection system which was set to the following cycling
conditions; 50 for 2 mins, 95 “C for 10 mins, 95 for 15 secs and 60 ”C for 1 min.
At the end of the run the software generates a series of amplification plots relating to the
samples. The graph shows the cycle numbers plotted against fluorescence. Data from
this software was exported into EXCEL where a series of Ct values (the number of
cycles at which the amplification plot for the particular sample crosses the threshold
line) was generated. When these data were pasted into the previously prepared analysis
template the calculations normalise the data to the HPRT gene. The percentage values
for each of the samples (IL-10 or TGF-(3) were plotted to determine the relative
expression levels for the gene of interest. Therefore the normalized value for IL-10 or
TGF-P mRNA expression in each sample was calculated as the relative quantity of
either IL-10 or TGF-(3 divided by the relative quantity of HPRT (xlOO). A diagram of
the TaqMan principle shown in Figure 2.2.
8 4

Figure 2.1. FACS gating
A-C2x10^ cells from splenocyte cultures of L3 infected mice were stained with FITC labelled anti-mouse CD4 MAb or the isotype matched control. Panel A shows typical gating of lymphocytes in terms of size and granularity. Panels B and C are gated on this region therefore display events taking place within this area. Panel B shows FLI fluorescence of the isotype control from which the Ml region can be set. M l is the region in which all CD4^ cells will fall when stained with anti-CD4 MAb (panel C).
D-F2x10^ cells from splenocyte cultures of L3 infected mice were stained with FITC labelled anti-mouse CD4, PE labelled anti-mouse CTLA-4 and APC labelled anti-mouse CD25. Panel D shows gating on all CD4^ events which lie within the total lymphocyte population (see panel A). Panel E shows events collected when cells were stained with isotype controls for FITC, PE and APC, thus allowing the quadrant to be set which displays CD4‘ cells which co-express CTLA-4 and CD25 (panel F).
G-J2 X 10® CFSE stained and non-CFSE stained cells from splenocyte cultures of L3 infected mice were stained with APC labelled anti-mouse CD4 or the isotype matched control. Panel G shows cells which were not stained with CFSE and stained with FITC and APC isotype control. Panel H shows cells stained with CFSE and anti-CD4. As CFSE loses fluorescence as cells divide, dividing CD4^ cells are shown in the upper left hand part of the quadrant. Panel I is a histogram which shows the distinct peaks which represent each cellular division luidergone by the total lymphocyte population. The overlay represents CD4^ cell division. Panel J shows cells which have been cultured with medium only and the statistics below represent the percentage of dividing cells. It can be seen here that the percentage of dividing lymphocytes is much lower in cells horn medium only cultures compared to Ag stimulated cultures.

HPRT Forward 5’-GCA GTA GAG CGC CAA AAT GG-3’
Reverse 5’-AAC AAA GTC TGG CCT GTA TCC AA-3’
Probe 5’-FAM-TAA GGT TGC A AG CTT GOT GGT GAA
AAG GA-TAMRA-3’
IL-10 Forward 5’-ACA ACA TAG TGC TAA CCG ACT CCT T-3’
Reverse 5’-AGG TAA AAC TGG ATC ATT TCC GAT A-3’
Probe 5’-FAM-TGG CAA CGC AAG TAA CGC TTA AAG
TCC TG-TAMRA-3’
TGF-(3 Forwai-d 5 -CGC CAC TGA TAG GCC TGA G T - 3 ’
Reverse 5 ’ - ACA AGA GCA GTG AGC GGT GA - 3 ’
Probe 5’ - FAM-TGA ACC AAG GAG ACG GA-TAMRA -
3’
Table 2.1. TaqMan primer and probe sequences
Primer and probe sequences were selected by the using the Primer Express software (ABI/Perkin Elmer). Probe sequences were designed according to the following criteria. The melting temperature (T„i ) was between 65 and 67 °C, the 5’ end of the probe was not a guanosine residue, runs of an identical residues were avoided and the polymorphic site was near the centre of the probe. Primer sequences were designed according to the following guidelines. The G-C content was within the 20 to 80 % range, runs of an identical neucleotide were avoided, the Tm was between 58 and 60 °C, the five neucleotides at the 3’ end had no more than two G and/or C bases and the forward and reverse primers were placed as close as possible to the probe without overlapping the probe.
8 5

TAMRAFAM
T.P.F.P.
SSDNA5’-5 ’3 ,
R.P.
V TAMRA
► TaqssDNA 3" ssDNA 5^
5 ’3 ’
T aq<R.P.
Figure 2.2. The TaqMan principle
During PCR annealing, primers and the fluorogenic probe anneal to denatured singlestranded DNA template. As long as the probe is intact, TAMRA (the 3’ quencher dye) absorbs the fluorescent emissions of FAM (5’ reporter dye). During extension, the probe is cleaved by the 5’ nuclease activity of the Taq, separating the reporter from the quencher signal which results in increased fluorescence of the reporter dye which is quantitative for the initial amount of template. F.P. - forward primer; R.P. - reverse primer; T.P. - flurogenic probe; Taq - Taq Polymerase.
8 6

2.6. Statistical analysis
The Mann-Whitney [/-test was used to determine the statistical significance of
differences between groups. p<0.05 was considered to be a significant difference.
2.7. Buffers/Solutions
2.7.1. Cell culture
Ammonium chloride solution: Mix 9 vols of 0.83% w/v NH4 Cl in ddH2 0 with 1 vol of
2.06% w/v Tris-HCl pH 7.65. pH adjusted to 7.2. Sterilize by autoclaving and store at
4 T .
2.7.2. General purpose
PBS: 137 mM NaCl, 8.1 mM Na2H P04, 2.7 mM KCl, 1.47 mM KH2PO4 in ddH2 0 . pH
adjusted to 7.2. Sterilize by autoclaving and store at R.T.
2.7.3. ELISA buffers
0.06 M Carbonate Buffer, pH 9.6: To 45.3 ml of 1 M NaHCO] add 18.2 ml of IM
Na2C0 3 and make solution to 1 litre with ddH2 0 .
PBS/0.05% Tween 20: 500 pi of Tween 20 was added per litre of sterile PBS.
2.7.4. RNA preparation
DEPC (Diethylpyrocarbonate) - treated H2O: add 900 pi of DEPC to 900 ml of ddH2 0
and dissolve by autoclaving. Store at R.T.
8 7

Ethidium Bromide for RNA Work: 500 ng/ml stock solution dilute in DEPC-treated
H2O. Store in the dark at R.T.
Loading Buffer (5x): 10% Ficoll, 0.5 % SDS, 0.06% bromophenol blue in ddH2 0 . Store
at R.T.
MOPS (MOPS (3-[N-Morpholino]propanesulphonic acid) buffer (lOx): 0.05 M Na
acetate, pH 7, 0.01 M EDTA, 0.2 M MOPS in dd H2O, Store at R.T. Dilute to Ix for
working concentration.
2.7.5. DNA preparation
Ethidium Bromide for DNA Work: 10 mg /ml stock in dd H2O. Store in the dark at R.T.
Working concentration 100 pg/ml diluted in dd H2O.
TAE buffer (50x): 2 M Tris-HCl, 5.17% glacial acetic acid, 0.05M EDTA pH 8.2 in dd
H2O. Store at R.T. Dilute to Ix for working concentration.
2.7.6. FACS buffers
Staining Buffer: PBS/2 % FCS, 0.2 % sodium azide, pH 7.4-7.6 , filter sterilize and store
at 4 T .
Permeabilization Buffer: PBS/2 % FCS, 0.2 % sodium azide, 0.1 % saponin (Sigma) pH
7.4-7.6, filter sterilize and store at 4°C.

Fixation Buffer; 14 ml lOx PBS, 10.8 ml 37.5% formaldehyde, 75.2 ml H2O, filter
sterilize and store at 4* 0.
2.7.7. MACS buffer
50 ml PBS, 250 mg BSA, 200 pi EDTA. Degass,
2.7.8. Greiss reagent
Mix equal volumes of 0.1% a-naptyl-amine and 1% sulphanilamide, 5% phosphoric
acid. Store at 4
8 9

Chapter 3. Infection of IL-4-/- mice with L3 of pahangi results in inereased
microfilaraemia and a skewed immune response
3.1. Introduction
IL-4 is a central Th2 cytokine because of its ability to drive naïve T cells towards the
Th2 pathway while diverting Th cells from differentiation down the Thl pathway. In
recent years the use of mice in which the IL-4 gene has been deleted has provided an
important tool in analysing the role of IL-4 in parasitic infection. As reviewed in the
general Introduction, studies into murine infection with Leishmania major and Trichuris
muris have highlighted the role of IL-4 in driving Th2 responses and the role of the Thl
vs Th2 balance in host immunity or susceptibility to infection. In this chapter I
examined the role of IL-4 in murine infection with the filarial nematode B. pahangi.
The rodent filarial nematode, Litmosoides sigmodontis is a useful model for examining
host immune responses to filarial parasites over the course of infection, as L3 develop
into MF producing adults in some inbred strains of mouse, such as the BALB/c.
Experiments carried out in IL-4-/- mice on the BALB/c background, have shown that
MF levels are up to 100-fold greater and that microfilaraemia is significantly prolonged
in KO mice compared to WT BALB/c mice. The difference in MF levels is thought to
relate to the fecundity of the adult worms because there is no difference in the recovery
of MF when injected directly into mice (Volkmann et al,, 2001). The importance of the
genetic background of knockout mice was highlighted in a study examining
susceptibility of L. sigmodontis BALB/c mice and IL-4-/- mice on the C57BL/6
background. WT BALB/c mice are susceptible to infection with L. sigmodontis, while
WT C57BL/6 mice are resistant. However infection of IL-4-/- C57BL/6 mice results in
a susceptible phenotype with worm recovery comparable to that of WT BALB/c mice.
9 0

However despite similar levels of susceptibility, the immune responses of these animals
are remarkably different with WT BALB/c mice exhibiting a strong Th2 response and
IL-4-/- C57BL/6 mice exhibiting a Thl response. These data suggest that parasite
clearance in a resistant host is Tli2 dependent but a susceptible host can allow parasite
development despite a Th2 response (Le Goff et al., 2002).
IL-4 is also thought to play a role in susceptibility to Brugia infection. Again, the
studies carried out to date emphasize the importance of the background strain of mouse
used. The original study reported no difference in the recovery of L3, MF or adult
worms from IL-4-/- mice on the C57BL/6 background, despite profound alterations in
the immune response in these animals (Th2 to Thl switch in the case of adult and L3
infection) (Lawrence et a l, 1995). However C57BL/6 mice are not susceptible to
Brugia infection and one of the aims of the work of the work described in this chapter
was to investigate the role of IL-4 in the susceptible BALB/c mouse. Infection of
BALB/c mice with L3 of B. pahangi results in an early burst of IL-4 transcription from
a population of CD4'CD8“a|3 T cells in the draining popliteal lymph nodes and this IL-4
functions primarily to promote Tli2 responses (Oshorne and Devaney, 1998). However
Spencer et al showed that in the absence of IL-4, IL-4R or Stat6 , BALB/c mice were
significantly more susceptible to infection with either B. malayi or B. pahangi
Somewhat surprisingly the transfer of T cells from IL-4-/-, IL-4R-/- and Stat6 -/- mice
into SCID recipients induced host protection comparable to that mediated by T cells
from a WT origin. These data suggest that while T cells are required for host protection,
they need not respond to or produce IL-4 (Spencer et a l , 2003a).
9 1

There are many unanswered questions regarding the role of IL-4 in lymphatic filariasis.
The L3 has been shown to direct an early hurst of IL-4 post-infection, but the
importance of this remains unclear. Is IL-4 correlated with resistance or susceptibility?
If so, which life cycle stages are affected by IL-4 mediated responses. In this chapter, I
set out to determine whether IL-4 had any affect on the development of Brugia L3 in the
mouse model and to investigate whether Ag-specific immune responses varied
significantly between L3 infected IL-4-/- and WT BALB/c mice.
9 2

3.2. Results
3.2.1. Investigating the role of IL-4 in vivo
(i) Worm recoveries from IL-4-/- mice
The worm recovery experiments were carried out in collaboration with Prof. E.
Devaney. For these experiments, mice were infected with 50 L3 of .S .pahangi by the
i.p. route, so that worms could be recovered easily. At the following time points the
numbers of larvae were recovered and counted: day 6 (moulting L3-L4), day 8 (L4),
day 15 (L4), day 27 (L4 to adults) or days 71-77 (patent adults). As shown in Tahle 3.1,
there was no significant difference in recovery of the larvae from the IL-4-/- mice
compared to WT mice at any of the time points. The recovery of worms from both
strains remained very steady at 30-40% until after the final moult (post-day 27). At day
70 plus, more adult worms were recovered from the IL-4-/- mice than the wild-type
mice but this difference was not statistically significant {p >0.05).
(ii) MF recovery from IL-4-/- and WT mice
Mice were infected i.p. with 50 L3 of B. pahangi and at day 71 or day 77 post-infection
the levels of MF produced by adult worms in each strain of mouse were determined.
The results from the experiment carried out on day 77 post-infection are presented. As
shown in Table 3.2, seven of ten infected BALB/c mice contained adult worms, while
five of ten contained MF. In contrast, six out of six IL-4-/- mice contained adult worms
and MF. MF recoveries were significantly different between the strains of mice {p =
0.0318) with IL-4 -/- mice containing ~ 8 fold more MF than WT mice. It can be seen
from Figure 3.1 that there was a wide range in the numbers of MF recovered from
9 3

individual animals. This was correlated with the numbers of adult females in ÏL-4-/-
mice (r = 0.993, p^O.OOl), but not in wild type mice. When WT mice contained the
same numbers of adult worms as IL-4-/- mice, significantly fewer MF were recovered
from WT mice by comparison. By expressing the data as mean MF per adult female
worm it can he concluded that the worms from IL-4-/- mice are more fecund than those
from WT mice (3329 vs 722 MF per adult female, respectively, Table 3.2). In addition,
dissection of individual female worms from IL-4-/- mice showed that these worms
contain many more MF at all stages of development than did adult female worms from
WT mice. Even in WT mice that had MF in the peritoneal cavity, the adult female
worms contained very few developing stages or mature MF. Similar results were
obtained from an experiment analysed on day 71 post-infection.
(iii) Recovery of MF after implantation of adult worms
The results from the experiment described above could relate to an increased rate of MF
killing or reduced fecundity of female worms in WT BALB/c mice. In order to
distinguish between the two possibilities, ten adult female B. pahangi were implanted
into the peritoneal cavity of five BALB/c mice and five IL-4-/- mice. The results of this
experiment are presented in Table 3.3. Adult worms and MF were recovered 2 weeks
post-infection. At this time point IL-4-/- mice contained more adult female worms than
WT mice and this difference just reached statistical significance (worm recovery, 7.8 ±
0.8 in IL-4-/- mice and 6.2 + 0.8 in WT mice, p < 0.05). However levels of MF were
not significantly different between the two strains of mice. When these results are
expressed as MF per adult female worm it can be seen that there was no difference in
MF levels, suggesting that IL-4 does not affect MF survival or the ability of sexually
9 4

mature female worms to continue producing MF, but rather acts to the fecundity of
developing worms.
3.2.2. Cellular recruitment into the peritoneal cavity of IL-4-/- mice
Mice were infected i.p. with 50 L3 of B. pahangi and at day 27 post-infection the
peritoneal washings were analysed for cell counts and cell phenotype. The peritoneal
washings from BALB/c mice contained significantly more cells than those from IL-4-/-
mice (Figure 3.2A). The recruitment of individual cell types was analysed by staining of
cytospin preparations (carried out in the Haematology Lab, Veterinary Pathology,
University of Glasgow). Infected WT mice contained more eosinophils and
macrophages, compared to IL-4-/- mice, but there was very little difference in the
numbers of lymphocytes and neutrophils, while mast cells accounted for a very small
proportion of the total cells found in the peritoneum. At day 71 post-infection, the total
cell number was greatly reduced compared to day 27 p.i. but the wild type mice still
contained more eosinophils and macrophages than the IL-4-/- mice (see Figure 3.2B).
3.2.3. Ag-specific immune responses of splenocytes from L3 infected and IL-4-/-
BALB/c mice
In order to investigate whether Ag-specific immune responses in L3 infected IL-4-/-
mice were significantly different to these of WT mice, groups of five IL-4-/- mice and
five WT mice were infected s.c. with 50 L3 of B. pahangi. In these experiments the
mice were infected s.c. to better mimic the natural route of infection with L3. At day 12
p.i. spleens were removed from these animals and in vitro analysis was carried out.
9 5

(i) Ag-specific cytokine responses
Cytokine responses of splenocytes from L3 infected IL-4-/-, BALB/c wild type mice
and control uninfected mice were measured after 72 hours of in vitro restimulation with
10 pg/ml B. pahangi adult Ag. These experiments were carried out on several occasions
and similar results observed in each. The results of a representative experiment showing
levels of Ag-driven cytokines are presented in Figure 3.3. Splenocytes from L3 infected
IL-4-/- mice generated an altered cytokine profile compared to those of their wild type
counterparts, with a significant increase in Ag-specific IL-2 and IFN-y, cytokines which
were only ever seen at very low levels in L3 infected wild-type mice. In addition a
reduction in IL-5 and IL-10 was observed in IL-4-/- mice. IL-5 was reduced to
significant levels in all experiments while the reduction in IL-10 reached significant
levels in only one of five experiments. In all experiments, levels of IL-13 were not
significantly different between IL-4-/- and wild-type mice, although there was a
tendency for IL-13 levels to be higher in IL-4-/- mice.
(ii) Ag-specific proliferative responses
Proliferative responses of splenocytes from L3 infected IL-4-/- and wild type BALB/c
mice were measured over a time course of in vitro restimulation with 10 pg/ml B.
pahangi adult Ag. Control mice received HBSS alone. Several experiments were carried
out each of which gave similar results. In the representative experiment shown in Figure
3.4, levels of Ag-specific proliferation were significantly lower in IL-4-/- mice
compared to that of their wild-type counterparts after 72 and 96 hours incubation with
Ag. The time-course from 48 to 96 hours indicates that the differences in proliferative
responses are unlikely to reflect a difference in the kinetics of the Ag-specific
9 6

proliferative response in IL-4-/- mice. There are a number of possible explanations for
this apparent decrease in proliferation. One possibility is that the cells which proliferate
in response to the L3 may use IL-4 as a growth factor. Alternatively, the increase in
IFN-y in these cultures (as shown in Figure 3.3) may be cytostatic or may lead to an
increase in nitric oxide resulting in the suppression of Ag-specific proliferative
responses.
(iii) ConA driven proliferative responses
Proliferative responses of splenocytes from L3 infected IL-4-/- and wild type BALB/c
mice and control uninfected mice were measured at 48 hours of in vitro restimulation
with 1 pg/ml of ConA. In the representative experiment shown in Figure 3.5, levels of
ConA driven proliferation were not significantly different between IL-4-/- mice and
wild-type mice, suggesting that the cells from IL-4-/- mice have the capacity to
proliferate and that the defect in proliferation described is Ag-specific in nature.
3.2.4. Investigating the proliferative defect observed in IL-4-/- mice
In order to investigate the mechanisms by which Ag-specific proliferative responses
were decreased in L3 infected IL-4-/- mice compared to wild-type mice, a number of
experiments were carried out as described below.
(i) CFSE staining of cells from L3 infected IL-4-/- and wild-type mice in Ag
stimulated culture
CFSE staining is a sensitive technique used for tracking the proliferation of specific cell
types (see Materials and Methods 2.4.2), and was used in this experiment to investigate
9 7

the phenotype of proliferating cells in IL-4-/- and wild-type mice. CFSE staining was
carried out prior to in vitro stimulation of splenocytes with 10 pg/ml B. pahangi adult
Ag. At 96 hours cells were harvested and labelled with anti-CD4 MAh, anti-CD8 MAh
or B220 MAh. The samples were then analyzed by flow cytometry. The data shown in
Figure 3.6 and 3.7 are from a representative experiment, with Figure 3.6 showing cells
from individual mice, with means of five mice shown in Figure 3.7. The first point
apparent from Figure 3.6 is that the major cell type proliferating in L3 infected mice in
response to Ag restimulation were B cells with - 1 6 % of B220^ cells proliferating in
response to Ag in wild-type mice compared to - 5 % of CD4^ cells. As can be seen in
Figure 3.7, proliferating B cells account for - 17% of total lymphocytes in wild-type
mice while proliferating CD4" cells account for approximately - 5% of total
lymphocytes in these mice. In the KO mice, proliferating B cells account for only - 7 %
of total lymphocytes while proliferating CD4" cells aecount for - 3 % of total
lymphocytes. When examining data as mean percentages it can be seen that the
percentage of B cells and CD4^ cells that proliferated in response to Ag were
significantly reduced in L3 infected IL-4-/- mice compared to that of their wild-type
counterparts. No significant difference in the proliferation of CD8 cells was observed
during the eourse of these experiments.
(ii) Ex vivo staining of splenocytes from L3 infected and control IL-4-/- and
wild-type mice
One possible explanation for decreased levels of CD4^ and B220^ proliferation
observed in the splenocyte cultures from L3 infected IL-4-/- mice may be due to
diminished numbers of these cell populations ex vivo. To investigate whether there were
differences in the cellular make up of the spleen in wild-type and IL-4-/- mice.
9 8
|î

splenocytes were phenotyped ex vivo using anti-CD4 MAb, anti-B220 MAb and anti-
CD8 MAb. However, as can be seen from Figure 3.8, the percentage of CD4’*', B220^
and CD 8 cells were constant between both WT and IL-4-/- mice and control uninfected
and L3 infected mice. Therefore it can be concluded that the decreased levels of
proliferation observed in L3 infected IL-4-/- mice compared to that of L3 infected wild-
type mice is not a reflection of a different cellular make-up in the spleens of the
respective strains of mouse.
(iii) Production of NO
IFN-y is known to be a potent inducer of iNOS. The production of NO by activated
macrophages has been identified as a factor mediating suppression in several models of
parasitic infection (Candolfi, 1994; Dai, 1999, O’Connor 2000). Therefore to assess the
production of NO in vitro, the Greiss reaction was carried out on supernatants of Ag-
stimulated splenocytes from L3-infected IL-4-/- and wild type mice. Figure 3.9 shows
the results of one such assay. This analysis demonstrated that there were elevated levels
of NO in cultures from L3 infected IL-4-/- mice compared to cultures from infected
wild-type mice, however this difference did not reach statistical significance in any one
of tliree experiments.
(iv) Inhibition of iNOS with AMG
Aminoguanidine (AMG) is an iNOS inhibitor and was used to determine whether the
increased levels of IFN-y produced by cells from L3 infected IL-4-/- mice might
suppress proliferative responses by induction of iNOS. Ag-stimulated cultures of
splenocytes from L3 infected IL-4-/- and wild-type mice and control uninfected mice
were supplemented with 500 pM AMG. As shown in Figure 3.10 the inhibition of NO
9 9

production did not result in increased proliferation in cultures of Ag-stimulated
splenocytes from L3 infected IL-4-/- animals. Nitrite levels were efficiently reduced by
AMG in these experiments (data not shown). Therefore, despite the high levels of IFN-
y in cultures of splenocytes from L3-infected IL-4-/- mice, there was a minimal increase
in levels of NO and blocking the production of NO had no effect on proliferation.
(v) Neutralization of IFN-y
An IFN-y neutralizing MAb was used to determine whether the increased levels of IFN-
y produced by cells from L3 infected IL-4-/- mice might suppress proliferative
responses, as IFN-y is known to have cytostatic effects on T cells as well as inducing
NO from macrophages. Ag-stimulated cultures of splenocytes from L3 infected IL-4-/-
and wild-type mice and control uninfected mice were supplemented with 1 0 0 pg/ml
IFN-y neutralizing MAb. Figure 3.11 shows the Ag-stimulated proliferative responses in
the presence and absence of anti-IFN-y MAb over a time-course of in vitro culture. It
can be seen that neutralization of IFN-y did not result in increased proliferation in these
cultures. Therefore, despite high levels of IFN-y being produced in cultures of
splenocytes from L3 infected IL-4-/- mice, blocking the production of IFN-y had no
significant effect on proliferation. Measmement of cytokine levels demonstrated that
IFN-y was effectively neutralized using this concentration of MAb. A range of
additional cytokines were also measuied but there were no differences between the +/-
MAb groups (data not shown).
1 0 0

(vi) Addition of recombinant-IL-4 to cultures of Ag-stimulated splenocytes from
L3 infected IL-4-/- and wild-type mice
In an attempt to reverse the defect in Ag-specific proliferation, recombinant (r)IL-4 was
added to splenocytes from L3 infected IL-4-/- mice at concentrations ranging from 100
pg/ml to 1000 pg/ml. Proliferative responses were then measured over a time course of
in vitro restimulation with 10 pg/ml B. pahangi Ag. Three experiments were carried out
giving similar results. The results of a representative experiment are presented in Figure
3.12 showing only those cultures supplemented with the highest dose of rIL-4 (1000
pg/ml). In these experiments there was a trend towards increased levels of Ag-specific
proliferation when rIL-4 was added to cultures of splenocytes from IL-4-/- mice.
However this difference did not reach statistical significance at any time point, with any
concentration of rIL-4. These data suggest that the lack of IL-4 in vivo has a profound
effect on the proliferation of cells in vitro and although proliferation can be rescued to a
certain degree by rIL-4, this never reached significance. In addition levels of Ag-
specific cytokines were not altered when rIL-4 was added to cultures at any
concentration (data not shown).
1 0 1

Time post infection BALB/cIL-4-/- BALB/c WT
Day 6 36.8 ± 22.6% (n=6) 36.2+ 13.9% (n=7)
Day 8 28.8+ 11.1% (n=5) 47.3 ±23.9%(n=4)
Day 15 28.9 +21.2% (n=6) 38.5 ± 14.5% (11=8)
Day 27 36.7 ± 11.6% ( n- 6) 34.2 ± 14.2% (n = 6)
Day 71 14.1 + 11.4% (n = 13) 7.4 + 7.7%(n=12)
Day 77 20.5 ± 19.0 % ( n - 6) 10.9 ±7.7% (n= 10)
Table 3.1. The recovery of worms from IL-4-/- or WT BALB/c mice is not
significantly different at any time point post-infection
IL-4-/- and wild-type (BALB/c) mice were infected intra-peritoneally with 50 L3 of B. pahangi. Figures show the mean percentage recovery of worms ± SD from the peritoneal cavity of infected mice at different time points post infection. Numbers in parenthesis denote the number of animals per group, p >0.05 at all time points.
1 0 2

IL-4-/- BALB/c
No. of mice with adult worms
6 / 6 7/10
Total no. of males: females
38:28 23:30
No. mice with MF 6 / 6 <710*
Mean no. MF per mouse with MF
23952 ± 30485 3023 +2139
Mean MF per adult female with MF
3329 ± 2794 722 ±510**
Table 3.2. Adult worm and MF recoveries at day 77 p.i. demonstrate that IL-4-/- mice contain significantly more MF than WT mice
IL-4-/- and BALB/c wild-type mice were infected intra-peritoneally with 50 L3 of B. pahangi. The table shows the numbers of adult worms recovered at day 77 p.i. from the two groups of mice, the total numbers of male and female worms recovered from the respective group, the numbers of mice with MF, the mean (±SD) numbers of MF recovered and the mean nimibers of MF per adult female worm
Two mice with adult females contained no adult males hence no MF ** Statistical significance between MF recoveries from IL-4-/- mice and WT mice (p= 0.0318)
1 0 3

IL-4-/ WT BALB/c
No. of adult females recovered
7.4 ± 0.8 6 . 2 ± 0 . 8 *
No. of MF recovered 1.61 ± 0.233x10^ 1.4 ±0.18x10^
No. of MF per adult female
2.2 X 10 2 . 2 X 1 0 ^
Table 3.3. Implantation of adult worms into the peritoneal cavity of IL-4-/- or WT mice results in equivalent production of MF
Ten female B. pahangi were implanted in to the peritoneal cavity of 5 BALB/c WT mice or 5 IL-4-/- mice. Adult worms and MF were recovered 2 weeks post-infection. The data above shows the niunber of adult females recovered from infected mice and the total number of MF in the peritoneal lavage of the mice. MF are also represented as the number of MF per adult female recovered.
* Recovery of adult female worms between two strains was significantly different ip < 0.05).
1 0 4

80000 70000 60000
g 50000 40000
H 30000 20000
10000
04 6 8 10 12
No female worms
Figure 3.1, Recovery of MF in IL-4-/- mice correlates with the number of adult female worms
IL-4-/- mice were infected intra-peritoneally with 50 L3 of B. pahangi. At 77 d.p.i. MF and adult worms were recovered. The graph shows the number of MF in the peritoneal lavage of five IL-4-/- mice plotted against the number of female worms recovered from individual mice. MF levels show positive correlation with adult female worm burden (r= 0.993, 0.001).
1 0 5

Figure 3.2. Cell recruitment into the peritoneal cavity is reduced in infected IL-4- /- mice compared to that of WT mice
IL-4-/- and wild-type (WTL3) mice were infected intra-peritoneally with 50 L3 of B. pahangi. The graph shows the number of cells per ml in the peritoneal lavage ofBALB/c WT (■) mice or IL-4-/- (□) at 27 days p.i. (A) or 71 days p.i. (B). Total cells (1) were enumerated by Coulter counting while numbers of eosinophils (2), neutrophils (3), lymphocytes (4), macrophages (5) or mast cells (6) were counted by differential staining of slides prepared by cytospin. The results are presented as means plus SD of six mice per group.
* significant difference between IL-4-/- and WT mice.
WT vs IL-4-/- tdav 27 p.i.) WT vs IL-4-/- tdav 71 n.i.lTotal cells p ~ 0.007 Total cellsp = 0.004Eosinophils p = 0.007 Eosinophils p = 0.0001Macrophages p = 0.011 Macrophages p ~ 0.02

Day 27
No of cells ^ ^X 10"
J É Ù
B2.00
Day 71
No of cellsX 10^
1.50
1.00
0.50
0.00
1 0 6

Figure 3.3. Splenocytes from L3 infected IL-4-/- mice display an altered Ag- specific cytokine profile compared to that of their wild-type counterparts
IL-4-/- (K0L3) and wild-type (WTL3) mice were infected sub-cutaneously with 50 L3 of B. pahangi or an equal volume of HBSS only (C). At 12 d.p.i., splenocytes (I x 10^/ml) were re-stimulated in vitro with 10 pg/ml B. pahangi adult Ag. Ag-specific cytokine responses were measured at 72 hours. Results are expressed as pg/ml and all values represent the mean and standard deviation of five mice per group.
* significantly different (p= < 0.05) WT mice vs KO mice IL-10, WTL3 vs K0L3 j(?=0.102

IL-2 IFN.
3500
3000
2500
g 2000
A 1500
1000
500
0 i Û .
900080007000600050004000300020001000
0WTL3 WTC K0L3 KOC WTL3 WTC KOL3 KOC
IL-4
350
300
250
- 2 0 0 -I
^ 150
100
50
0WTL3 WTC K0L3 KOC
25000
20000
15000
10000
5000
0
IL-5
WTL3 WTC K0L3 KOC
IL-10
12000
0000
2000 4
25000
20000
15000
10000
5000
0
IL-13
IWTL3 WTC K0L3 KOC WTL3 WTC KOL3 KOC
1 0 7

Figure 3.4. Splenocytes from L3 infected IL-4-/- mice display significantly lower Ag-specific proliferation compared to that of their wild-type counterparts
IL-4-/- (K0L3) and wild-type (WTL3) mice were infected sub-cutaneously with 50 L3 of B. pahangi or an equal volume of HBSS only (C). At 12 d.p.i., splenocytes from individual mice from each group were re-stimulated in vitro with 10 pg/ml B. pahangi adult Ag. Ag-specific proliferative responses from whole splenocytes were measured at 48 (A), 72 (B) and 96 (C) hours. Results are expressed as cpm.48 hours p=0.3913 (K0L3 vs WTL3)72 hours p=0.037396 hours y;=0.0304 “ “
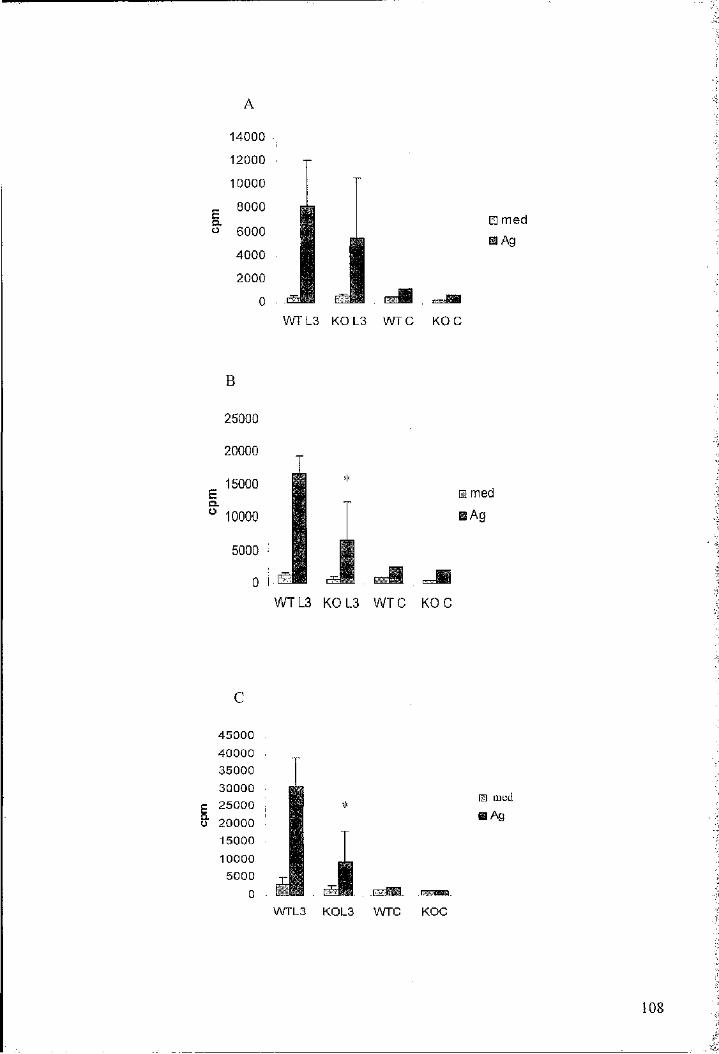
A
14000
12000
10000
6000
4000
2000
Il med m Ag
WT L3 KO L3mNI.WTC KOC
B
15000
5000 '
m med lAg
WTL3 K0L 3 WTC KOC
C
45000
40000 35000
30000 c 25000
o 20000 15000
10000 5000
0
H med
# Ag
WTL3 KOL3 WTC KOC
1 0 8
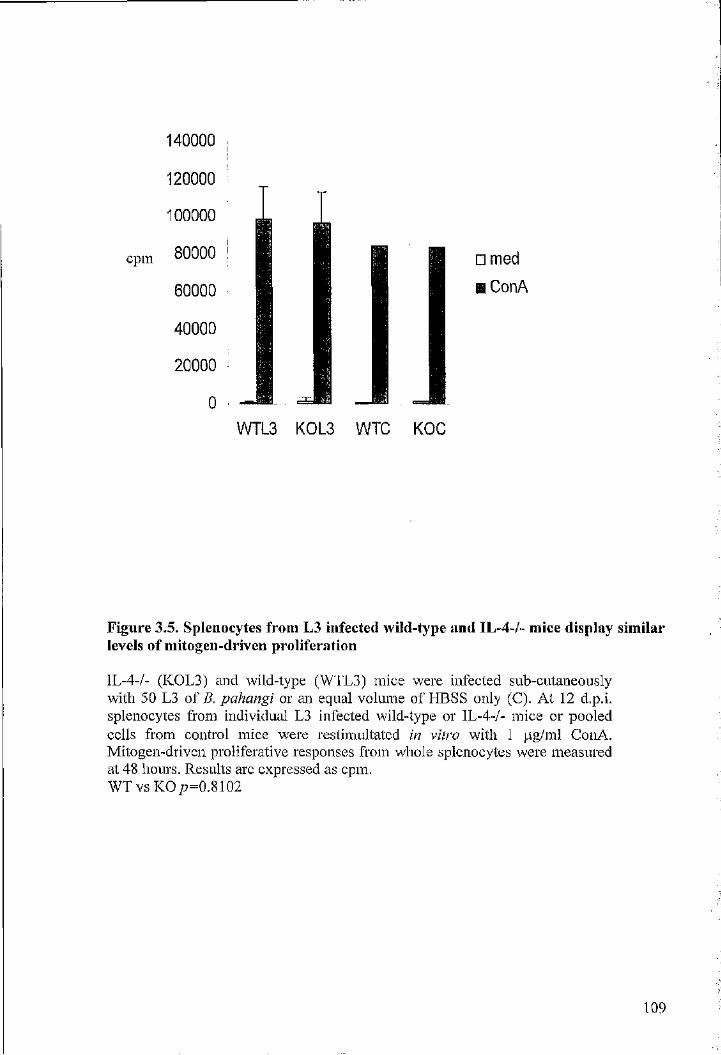
cpm
140000
120000
100000
80000
60000
40000
20000
0 ■
1 med
a ConA
WTL3 K0L3 WTC KOC
Figure 3.5. Splenocytes from L3 infected wild-type and IL-4-/- mice display similar levels of mitogen-driven proliferation
IL-4-/- (K0L3) and wild-type (WTL3) mice were infected sub-cutaneously with 50 L3 of B. pahangi or an equal volume of HBSS only (C). At 12 d.p.i, splenocytes from individual L3 infected wild-type or IL-4-/- mice or pooled cells from control mice were restimultated in vitro with 1 pg/ml ConA. Mitogen-driven proliferative responses from whole splenocytes were measured at 48 hours. Results are expressed as cpm.WT vs K 0p=0.8102
1 0 9

Fig 3.6. CD4^ and B220^ cells proliferate less well in IL-4-/- mice compared to wild-type mice
Splenocytes from wild-type (A and B) and IL-4-/- (C and D) mice given 50 L3 of B. pahangi or an equal volume of HBSS were labelled with CFSE and cultured with 10 pg/ml B. pahangi adult Ag for 96 hoins. Cells from control animals did not proliferate and, for simplicity, are not shown. Cells were then harvested, stained with anti-CD4 MAb (A and C) or anti-B220 MAb (B and D) and analysed by flow cytometry. Each panel shows the staining profile of CD4^ or B220" splenocytes in an individual mouse. The numbers at the top left hand corner of each panel indicate the percentage of CD4" or B220^ cells displaying reduced fluorescence intensity in FL-1, indicating they have divided in Ag-stimulated culture. These figures are representative of the responses of five animals per group.

CD4' B B220
APCpositivecells
21
: 1.6
F ÿ : '\#:
.. . ..• ■
10“ 1 0 ' io<
WT
IL-4-/-
CFSE
110

Figure 3.7. Proliferation of CD4^ and B220^ cells is significantly reduced in IL-4-/- mice compared to WT controls
Splenocytes from lL-4-/- (K0L3) and wild-type (WTL3) mice given 50 L3 of B. pahangi or an equal volume of HBSS (C), were labeled with CFSE and cultured with 10 pg/ml B. pahangi adult Ag for 96 hours. Cells were then harvested, stained with anti-CD4 MAb or anti-B220 MAb and analysed by flow cytometry. Data shown in A and B are mean results from five animals per group (excluding control animals where cells were pooled) and results are expressed as a percentage of total dividing lymphocytes. Graph A illustrates the mean percentage of total lymphocytes which have divided from groups of five mice (WTL3 vs K0L3, jc=0.02). Graph B shows division of individual cell types as a percentage of dividing lymphocytes (CD4’ division WTL3 vs K0L3 ;?=0.02; B220^ division WTL3 vs K0L3 ;?=0.02).

45
40
% 35ojs 30
I2501)■S 20>-5 15o 10
5
0WT L3 KO L3
□WTC KOC
B
25
S 20J 8 Q.K '5
I 10I 5
□ CD8
■ CD4
□ B220
WTL3 K0L3 WT C KOC
111

60
50
40
I s o
20
10
0
□ %CD4 ■ %B220□ %CD8
WTL3 WTC KOL3 KOC
Figure 3.8. E x vivo staining of splenocytes from L3 infected and control IL-4-/- and wild-type BALB/c mice showed no significant differences between groups
Splenocytes from IL-4-/- (K0L3) and wild-type (WTL3) mice given 50 L3 of B. pahangi or an equal volume of HBSS only (C) were surface stained ex vivo 12 d.p.i. with anti-CD4 MAb, anti-B220 MAb and anti-CDS MAb and analyzed by flow cytometry. All results represent the mean +/- standard deviation of five animals per group.
112

30
25
20115a
10
5
0WTL3 WTC KOL3 KOC
Figure 3.9. Levels of nitrite from 96 hour cultures are not significantly different between IL-4-/- mice and their wild type counterparts
IL-4-/- (KG) and wild-type (WT) mice were infected sub-cutaneously with 50 L3 of B. pahangi or an equal volume of HBSS only (C). At 12 d.p.i. splenocytes from individual mice from each group were re-stimulated in vitro with 10 pg/ml B. pahangi adult Ag. Nitrite levels from whole splenocytes were measured in supernatants collected at 96 hours. Results are expressed as ng/ml. (WTL3 vs K0L3 p= 0.7133).
113

Figure 3.10, Addition of AMG to splenocytes from L3 infected BALB/c and IL-4- /- mice had no significant effect on Ag-specific proliferation of either group
IL-4-/- (K0L3) and wild-type (WTL3) mice were infected sub-cutaneously with 50 L3 of B, pahangi or an equal volume of HBSS only (C). At 12 d.p.i,, splenocytes from individual mice from each group were restimultated in vitro with 10 pg/ml B. pahangi adult Ag in the presence or absence of 500 pM AMG. Ag-specific proliferative responses from whole splenocytes were measured at 48 (A), 72 (B) and 96 (C) hours. Results are expressed as cpm.
WTL3 VS K0L3 KQL3+Ag vs KQL3+Ag+AMG
48 hoursp=0.39 48 hoursp==\72 hours/?=0.0373 72 hoursp=Q.66596 hours j!;=0.0367 96 hours^=0.4034

A
14000
12000
10000
u 6000
4000
□ med ■ Ag□ Ag+AMG
WT L3 KO L3 WT C KG C
B
25000
20000
Eau
15000
10000
5000
0WT L3 KOL3 WTC KOC
□ med ■ Ag□ Ag+AMG
C
EQ.O
60000
50000
40000
30000
20000
10000
0
□ med 0 Ag□ Ag+AMG
r-W l = 0 0
WTL3 KOL3 WTC KOC
114

Figure 3.11. Addition of IFN-y neutralizing MAb to splénocytes from L3 infected BALB/c and IL-4-/- mice had no significant effect on Ag-specific proliferation of either group
IL-4-/- (K0L3) and wild-type (WTL3) mice were infected sub-cutaneously with 50 L3 of B. pahangi or an equal volume of HBSS only (C). At 12 d.p.i. splenocytes from individual mice from each group were restimultated in vitro with 10 p.g/ml B. pahangi adult Ag in the presence or absence of 1 pg/ml neutralizing IFN-y MAb. Ag-specific proliferative responses from whole splenocytes were measured at 48 (A), 72 (B) and 96 (C) hours. Results are expressed as cpm.WTL3 VS KQL3 K0L3+Ag vs KOL3+Ag+aIFN-y48 hoursy?=0.39 48 hours^=0.885272 hoursp=0.0373 72 hoursp=0.66596 hoursy?=0,0367 96 hours/?=1

A 48 hours
18000 16000 14000 12000
E 10000o 8000
6000 4000 2000 li
□ med ■ Ag□ alFN-y
WTL3 K0L3 WTC KOC
B72 hours
40000350003000025000
I 2000015000100005000
0
c
60000
50000
40000
I 30000 o
20000
10000
□ med■ Ag□ alFN-y
c : ^WTL3 KOL3 WTC KOC
96 hours
□ med ■ Ag□ alFN-y
WTL3 K0L3 WTC KOC
115

Figure 3.12. Addition of recombinant IL-4 to splenocytes from L3 infected BALB/c and IL-4-/- mice had no significant effect on Ag-specific proliferation of either group
IL-4-/- (K0L3) and wild-type (WTL3) mice were infected sub-cutaneously with 50 L3 of B. pahangi or an equal volume of HBSS only (C). At 12 d.p.i. splenocytes from individual mice from each group were restimultated in vitro with 10 qg/ml B. pahangi adult Ag and recombinant IL-4 was added at 1000 pg/ml to each individual culture. Ag-specific proliferative responses from whole splenocytes were measured at 48 (A), 72 (B) and 96 (C) hours. Results aie expressed as cpm.
WTL3 VS K0L3 KOL3vsKOL3+IOOO pg rIL-4
48 hours /?=0.0662 48 hours;?=0.193972 hoursjy=0.0304 72 hoursp=0.3I2396 hours p=0.0304 96 hoursp=0.3123

48 hours
120000
100000
80000
I 60000
40000
20000
0 i□ med■ A g
□ Ag+rlL-4
WTL3 WTC KOL3 KOC
B 72 hours
180000 160000 140000 120000
B 100000S' 80000
60000 40000 20000
0
140000
120000
100000
80000
60000
40000
20000
0
É□ med ■ A g
□ Ag+rlL-4
WTL3 WTC KOL3 KOC
96 hours
c J z i
□ med ■ A g
□ A g + r I L - 4
WTL3 WTC KOL3 KOC
116

3.3. Discussion
The results presented in this chapter used IL-4-/- mice on the BALB/c background to
study the role of IL-4 in parasite survival and immune modulation. The first
experiments showed that IL-4 had little effect on worm recoveries from mice infected
intraperitoneally with B. pahangi L3 as there was no significant difference in worm
recoveries at any time point between the groups. However, IL-4 appeared to have a
down-regulatory effect on the numbers of MF produced by adult female worms as IL-4-
/- animals contained vastly more MF compared to WT mice. As adult female worms
from IL-4-/- mice contained more MF at all stages of development compared to worms
from WT mice, it was hypothesised that IL-4 may limit worm fecundity. Implantation .1
of mature, fecund female worms into IL-4-/- and WT mice confirmed this theory, as the
number of MF recovered was no different between worms from IL-4-/- animals and WT
animals, thus ruling out the possibility of increased MF killing in WT mice. Therefore,
although IL-4 does not appear to affect L3 to adult development, it clearly has a role in
modulating the fecundity of worms. Alternatively, rather than a direct effect on female
worms, IL-4 may also affect adult male worms. It was shown previously that male
worms were more susceptible to the effects of irradiation than female worms in gerbils
infected with irradiated L3 of B. pahangi (Devaney et a l, 1993) indicating that males
may be less resistant to oxidative or immunological stress. However in the present study
male worms were recovered, although the ratio of males : females was reduced in WT
mice compared to IL-4-/- mice. These results are similar to experiments carried out in
the L. sigmodontis model, where MF in the peritoneum of IL-4-/- BALB/c mice were
increased 100-fold compared to WT mice post-infection with L3 (Volkmann et a l,
2001). However, whether IL-4 effects adult female fecundity directly or indirectly is not
known. Infection of IL-5-/- mice with the nematode Strongyloides ratti resulted in
1 1 7

increased egg production (Ovington et a l, 1998). IL-5 was shown to affect worm
survival and fecundity as IL-5-/- mice harboured 60% more worms and these worms
were more fecund that those taken from WT mice. The results presented in this Chapter
demonstrate that levels of IL-5 are significantly greater in WT mice than in IL-4-/-
mice. Thus IL-5 may have a similar effect on adult B. pahangi to that described for S.
ratti. No direct link between IL-5 and worm fecundity could be made during the course
of these experiments, but it would be interesting to implant adult Brugia into the
peritoneum of IL-5-/- mice and directly investigate the role of IL-5 in MF production
and fecundity of adult worms.
It was notable that despite the fact that worm recoveries, following i.p. infection with
L3 were very similar between mouse strains, the immunological responses were very
different. Following s.c. infection with L3, splenocytes from WT mice produced Th2
cytokines with no IL-2 or IFN-y production. However in IL-4-/- mice elevated levels of
IL-2 and IFN-y and significantly reduced levels of IL-5 were observed. IL-10 levels had
a tendency to decrease in IL-4-/- mice but this difference only reached statistical
significance in one out of five experiments. These data demonstrate that the L3 can
prime Thl cells in response to infection but in WT mice these are suppressed by a
mechanism involving IL-4. The ability of IL-4-/- mice to produce typical Th2 cytokines
(IL-5, IL-10 and IL-I3) is interesting. An obvious candidate for Th2 induction in the
absence of IL-4 is IL-13, although, experiments in L. major infected mice have shown
that Tli2 priming can occur via an alternative pathway, independent of both IL-4 and IL-
13 (as judged by the stable Th2 marker ST2L) (Kropf et a l, 1999). In the experiments
described above, the source of Th2 cytokines was not determined and it is possible that
cell types other than CD4^ cells may account for IL-5, IL-10 and IL-13. Therefore,
1 1 8

further experiments would be required to unequivocally demonstrate that Th2 cells are
expanded in IL-4-/- mice infected with B. pahangi.
In addition, there were major differences between IL-4-/- and BALB/c mice in the
cellular make up of the peritoneal exudates in infected animals. Numbers of eosinophils
were significantly higher in WT animals, results similar to those from the L
sigmodontis model, where levels of eosinophilia were greatly reduced in IL-4-/- mice
(Vollanami et a l, 2001). This result was not unexpected as levels of IL-5, a growth
factor for eosinophils are significantly lower in IL-4-/- animals, and, in addition IL-4 is
known to be chemotactic for eosinophils (Moser et a l, 1993; Johnson el a l, 1998).
Eosinophils have been shown to be involved in the development of protective immunity
to the L3 of T. sigmodontis. Worm recoveries were similar during a primary infection of
IL-5-/- mice or WT mice but during challenge infection, IL-5-/- mice were unable to
generate protective immunity, whereas intact mice cleared their parasites. Further
analysis indicated that eosinophils had a role in worm killing (Le Goff et a l, 2000).
Based on the results of Le Goff et al, it would be interesting to study worm recovery in
secondary infection in IL-4-/- mice. Macrophage numbers were also reduced in IL-4-/-
mice. Macrophages have been implicated in worm killing in various experimental
systems, such as the jird or the mouse infected with B. pahangi, where adherent cells
are required for MF killing (Karavodin and Ash, 1982; Oxenham el a l, 1984).
Furthermore, macrophages have long been suspected to modulate immune responses to
filarial infection. For example, in 1980 it was shown that removal of adherent cells from
PBMC of filarial infected humans reversed the proliferative defect, suggesting that
macrophages play a role in maintaining hyporesponsiveness in human infection
(Piessens et a l, 1980b). More recent studies in the mouse model suggested adherent
1 1 9

cells may produce IL-10 and thus down-regulate immune responses (Osborne and
Devaney, 1999). These data clearly indicate that IL-4 is important for recruitment of
specific cell types into the peritoneal cavity of infected mice. However, despite high
cellular recruitment in WT mice, worm recovery was not affected. The importance of
cellular infiltration in pathology in relation to IL-4 has been highlighted in studies on O.
volvulus where IL-4-/- BALB/c mice develop exacerbated pathology due to increased
neutrophil infiltration of the corneal stroma (Pearlman et a l, 1996; Hall et a l, 2002).
In terms of Ag-specific immune responses of IL-4-/- and WT mice, one of the most
interesting results was the reduced levels of proliferation observed in the IL-4-/-
animals. In order to determine if this defect was Ag-specific, splenocytes from WT and
L3 infected mice were also stimulated with the mitogen ConA. No differences were
observed in response to ConA, indicating that the defect in proliferation observed was
Ag-specific. It was demonstrated by CFSE labelling that the percentage of CDd"*" and
3220"^ proliferation was significantly decreased in L3 infected IL-4-/- mice, suggesting
that, in response to Ag, IL-4 may be acting as a growth factor for these cell types. This
hypothesis was tested by supplementing the medium with concentrations of rIL-4 up to
1000 pg/ml. However, although there was a slight increase in proliferative responses to
Ag in splenocytes from IL-4-/- mice, this difference never reached significance.
Phenotypic analysis of the cellular population in the spleen of L3 infected IL-4-/- or WT
mice ex vivo revealed no significant difference, ruling out the possibility that differences
in proliferation relate to diminished numbers of specific cell populations ex vivo.
Splenocytes from L3 infected IL-4-/- mice secrete high levels of IFN-y, which can
induce NO production from classically activated macrophages and result in a
1 2 0

consequent reduction in proliferation (Candolfi et a l, 1994; Dai and Gottstein, 1999;
O'Connor and Devaney, 2002). To assess the production of NO in vitro in my
experiments, the Greiss reaction was carried out on supernatants of Ag-stimulated
splenocytes from L3 infected IL-4-/- and wild type mice. These results demonstrated,
somewhat surprisingly, that there was no significant difference in levels of NO in
cultures from IL-4-/- mice compared to wild type mice, despite significantly increased
levels of IFN-y. However, to rule out possible effects of low-level NO, further
experiments were undertaken. Aminoguanidine (AMG), an iNOS inliibitor, was used to
determine whether the increased levels of IFN-y produced by cells from L3 infected IL-
4-/- mice might suppress proliferation responses by induction of iNOS. Inhibition of NO
production did not result in increased proliferation in cultures of Ag-stimulated
splenocytes from L3 infected IL-4-/- animals. Finally to ensure that elevated levels of
IFN-y observed in cells from IL-4-/- mice were not cytostatic, IFN-y was neutralized in
vitro. However, anti-IFN-y had no effect on the proliferation of cells from L3 infected
IL-4-/- mice. These results in IL-4-/- mice contrast with those reported from S. mansoni
infection. In that model, WT mice develop chronic disease but survive, whereas IL-4-/-
animals suffer fatal disease. Disease severity was seen to correlate with increased levels
of NO and enhanced IFN-y production. Splenocytes from IL-4-/- mice displayed a
similar defect in proliferation to that described in this Chapter, and it was shown that in
the S. mansoni model, NO was largely responsible for impaired T cell function (Patton
et a l, 2002). In contrast to the results presented here, neutralization of IFN-y in
splenocyte cultures from S. mansoni infected mice resulted in the rescue of
proliferation. In addition, when administered in vivo improvements in the gross
appearance of the liver and reduction in granuloma size resulted. (La Flamme et a l,
2001). It is notable that the cytokine milieu is very complex in cultures from L3 infected
121

IL-4-/- mice compared to WT mice with IL-2 and IFN-y production as well as IL-10 and
IL-13 and some IL-5. Therefore, these typically Th2 type cytokines (or in the case of
IL-10, Treg) may have a role in down-regulating the production of NO from classically
activated macrophages, despite high levels of IFN-y,
The results presented in this Chapter show that Ag-specific proliferation in IL-4-/-
animals was significantly reduced but this could not be attributed to NO or IFN-y
production as has been observed in other model systems. These results present an
interesting conundrum, in that splenocytes from L3 infected IL-4-/- mice secrete
substantial levels of IFN-y yet this does not appear to induce significant amounts of NO.
This situation contrasts with that observed when mice were infected with MF of B.
pahangi, where high levels of IFN-y (in the same order as observed in L3 infected IL-4-
/- mice) resulted in NO production and a consequent proliferative defect (O'Connor et
a l, 2000; Jenson et a l, 2002; O'Connor and Devaney, 2002). As L3 of Brugia are
reported to direct the activation of alternatively activated macrophages in the peritoneal
cavity of C57BL/6 mice (Allen and Loke, 2001), it is interesting to speculate whether a
similar ceil may be induced in this system. Alternatively activated macrophages have
been shown to suppress the proliferation of T cell clones in a non-specifie manner, but
are reportedly IL-4 dependent. Whether a similar population may be elicited in L3
infected IL-4-/- BALB/ c mice remains unlaiown. It is pertinent to note that these cells
can be activated by IL-13 (Doyle et a l, 1994). IL-13 and IL-4 share certain overlapping
biological activities, as both cytokines utilise the IL-4Ra chain as a component of their
receptor complexes and signal though a shared transducer (Zurawski et a l, 1993). IL-13
is found in large amounts in splenocyte culture from L3 infected IL-4-/- BALB/ c mice
and perhaps would be sufficient to prime these alternatively activated macrophages. By
122

investigating levels of arginase or urea (indicative of alternatively activated
macrophages) in these cultines in relation to levels of NO (indicative of classically
activated macrophages), it would be possible to determine whether alternatively
activated macrophages are present. One possibility for reduced levels of proliferation
observed in splenocytes from IL-4-/- mice may be due to a reduced capacity of APC
from KO animals to efficiently present Ag (i.e. via an effect on B7-1, B7-2 or MHC
class II molecules). One way in which this could be investigated would be to analyze
cells by FACS or to perform “mixing” experiments, whereby purified CD4^ cells from
naïve animals are cultured with APC from WT or IL-4-/- mice. These experiments
would indicate whether APC function is effected in IL-4-/- mice.
Although it was not possible to identify the basis of the proliferative defect observed in
L3 infected IL-4-/- mice, one possibility yet to be investigated is that splenocytes from
IL-4-/- mice undergo increased apoptosis when re-exposed to Ag in vitro. Data
presented in this Chapter show that levels of Ag-specific proliferation in IL-4-/- mice
are significantly different to that of WT mice only after 72 and 96 hours. The defect is
not observed at 48 hours suggesting that the cells start to proliferate, but cannot
maintain cellular divisions. It would be worthwhile investigating apoptosis in these
cultures using Annexin V staining at various time points to determine whether
differences exist between L3 infected WT and IL-4-/- cells. It was notable that, when
carrying out FACS analysis on CFSE stained splenocytes from IL-4-/- mice, fewer
events were collectable when gating on live lymphocytes compared to WT mice. This
may provide indirect evidence that these cells are undergoing apoptosis in culture.
The results presented in this Chapter demonstrated that the presence or absence of IL-4
did not significantly influence the recovery of the parasite from the peritoneal cavity of
1 2 3

BALB/c mice, despite major differences in cytokine profile and cellular infiltration
between groups. While these results indicate that IL-4 or IL-4-/- mediated responses are
not required for killing a primary infection of L3 of B. pahangi, their involvement in
protective immunity to challenge infection has yet to be demonstrated. Perhaps the most
significant effect of IL-4 demonstrated by these experiments was its effect on worm
fecundity, as female worms from IL-4-/- mice were significantly more fertile than
worms from WT mice. Exactly how IL-4 affects worm fecundity remains unclear and
will require further investigation.
1 2 4

Chapter 4. IL-10 down-regulates Thl cytokine production and CD4^ cell
proliferation in L3 infection
4.1. Introduction
IL-10 was first described as cytokine synthesis inhibitory factor (CSIF), a product of
mouse Th2 cells that was shown to inhibit activation and cytokine production by Thl
cells (Fiorentino et a l, 1989). IL-10 inhibits cytokine production via an indirect effect
on accessory cells, such as monocytes and macrophages. Flowever in the absence of
APC, IL-10 can affect T cells directly by suppressing production of IL-2 (de Waal
Malefyt et a l, 1993b; Taga et a l, 1993). IL-10 was found to profoundly down-regulate
the synthesis of monokines, the production of NO and the expression of class II MHC
and costimulatory molecules on activated monocytes and macrophages. In vivo and in
vitro studies have also demonstrated a role for IL-10 in modulating B,T, NK, dendritic
and mast cell function. IL-10 can also inhibit the production of IL-12, which in turn
suppresses the stimulation of NK cells, the activation of macrophages, DC and
IFN-y Thl responses (Moore et al., 2001). These studies therefore indicate the diverse
effects of this cytokine in dampening and, ultimately, terminating inflammatory
responses.
In terms of infectious disease, the challenge faced by the immune system is to respond
to such an extent that infection is eliminated while minimizing the non-specific injury to
host tissue. Most of what has been learned about IL-10 in infectious disease derives
from studies carried out in mice, where levels of IL-10 have been manipulated in vivo or
in vitro. In murine studies of schistosomiasis, rIL-10 inhibited the proliferation of
schistosome-specific T cell clones (Flores Villanueva ei a l, 1993) and down-regulated
1 2 5

expression of B7 costimiilatory molecules on APC (Flores Villanueva et a l, 1994). The
administration of an IL-lO/Fc fusion protein (with a prolonged half-life in vivo) caused
a decrease in Thl responses in infected mice which resulted in a reduction in granuloma
size. These results suggest that regulation of Thl responses reduces the
immunopathologic damage associated with schistosomiasis (Flores-Villanueva et a l,
1996). Flowever, there is conflicting evidence as to whether IL-10 is required for the
immune down-modulation, which defines the transmission from the acute to the chronic
disease state in S. mansoni infection in the mouse model (Wynn et a l, 1998); (Sadler et
a l, 2003).
As the Thl/Tli2 balance is essential in determining the outcome of L major infection,
experiments have also been carried out to examine the role of IL-10 in this model
system. One particular study gave a clear demonstration that IL-10 contributes to
susceptibility to L major in BALB/c mice. It was shown that normal BALB/c mice
develop progressive lesions, whereas IL-10-/- BALB/c mice control disease progression
and have 1000-fold fewer parasites by week 5 post-infection (Kane and Mosser, 2001).
IL-10 has also been shown to be a critical anti-inflammatory molecule in other disease
models in mice e.g. IL-10-/- mice develop inflammatory bowel disease and other
exaggerated inflammatory responses (Kuhn et a l, 1993). In human inflammatory
disease, the therapeutic potential of IL-10 has been tested in specific patient populations
such as those with Crohn’s disease (van Deventer et a l, 1997), rheumatoid arthritis
(RA) (Keystone et a l, 1998), psoriasis (Asadullah et a l, 1998) and hepatitis C (Nelson
et a l, 2000) - all chronic inflammatory conditions. In both Crohn’s disease and RA, IL-
10 had a trend towards efficacy and a good safety profile and in cases of psoriasis, after
a seven week treatment, there was a significant decrease in the psoriatie area in 9/10
1 2 6

Ipatients (van Deventer et a l, 1997; Asadullah et a l, 1998). Conversely when IL-10 is
neutralized in PBMC from leprosy patients, proliferative responses are entranced:|
(Sieling cr a/., 1993). JII
The role of IL-10 in lymphatic fiiariasis has been the subject of several studies by the ' '
Nutman laboratory. In the original study (King et a l, 1993) it was shown that
neutralizing IL-10 with a monoclonal antibody restored proliferative responses in
cultures of PBMC from W. bancrofti infected individuals. Interestingly, similar results
were obtained with neutralizing antibody to TGF-p. In a subsequent study by Mahanty
et al, T cell proliferative responses were studied in asymptomatic microfilaraemics
(MF+) and it was shown that MF+ individuals were preferentially hyporesponsive to
microfilarial derived antigens via induction of IL-10 (Mahanty et a l, 1996a). The
concurrent reduction in IFN-y and IL-2 observed in this study is in agreement with
previously reported results of down-regulated Thl cytokine secretion in MF+
individuals (King et a l, 1993; Yazdanbakhsh et a l, 1993a) and is consistent with the
notion that parasite antigen-specific Thl responses are inhibited in MF+ individuals.
These studies were notable in that they illustrated that PBMC from MF+ individuals
secrete more spontaneous IL-10 (without stimulation) than CP individuals. Spontaneous
IL-10 was found to be secreted by plastic adherent cells (Mahanty et a l, 1996b),
suggesting that cells, other than T lymphocytes, are producing IL-10 and that APC
(adherent cells) have a role in suppressing the immune response in active infection. All
in all, these data suggest that MF+ individuals preferentially produce IL-10 in response
to MF-derived Ag, in an inverse pattern to that observed with Thl cytokines. The L3
stage of B. pahangi is also laiown to induce high levels of IL-10 in antigen-stimulated
spleen cell cultures from BALB/c mice. Neutralization of IL-10 resulted in the secretion
1 2 7

of IFN-y and IL-2 without affecting levels of Ag-specific IL-4 or IL-5 (Osborne and
Devaney, 1999). In addition, APC were also shown to contribute to the suppression of
mitogen-driven Thl responses in spleen cells from L3-infected animals, although a
direct role for IL-10 in modulating APC function was not shown.
The aims of the experiments in this chapter were three-fold. Firstly, as deseribed above,
IL-10 is known to effect in vitro cytokine responses in mice infected with L3, but
nothing is known of the role of IL-10 in vivo in this model system. Secondly, IL-10 is
produced by a variety of cell types including T cells, B cells activated mast cell lines,
activated macrophages and kératinocytes (Fiorentino et a l, 1989) and T regulatory cells
(Roncarolo et a l, 2001b). Consequently, it was of interest to determine the source of
IL-10 in mice infected with L3, as a first step to determine whether this life cycle stage
can elicit a population of Treg cells. Thirdly, studies in L major infected mice have
shown that sand fly transmission enhances lesion size and parasite burden within the
lesion (Titus and Ribeiro, 1988). This effect is thought to be associated with a
vasodilatory peptide which reportedly up-regulates levels of IL-10 (Bozza et a l, 1998).
Therefore, it was of interest to examine the role of mosquito saliva on L3 transmission
using natural feeding methods.
1 2 8

4.2. Results
4.2.1. Ag-specific immune responses of splenocytes from L3 infected mice +/- anti-
IL-10 MAb
In these experiments groups of five BALB/c mice were injected sub-cutaneously with
50 L3 of B. pahangi or an equal volume of HBSS only. At 12 d.p.i. spleens were
removed for in vitro analysis. 10 qg/ml of neutralizing anti-IL-10 (JESS-25A) or
isotype matched control (R59-40) was added to Ag-stimulated cultures from L3 infected
and control mice. In addition, Ag only cultures were set up,
(i) Ag-specific cytokine responses
Cytokine responses of splenocytes from L3 infected and control animals in the presence
and absence of neutralizing anti-IL-10 were measured after 72 hours of in vitro
restimulation with 10 pg/ml B. pahangi adult Ag. Figure 4.1 shows levels of Ag-driven
cytokines in supernatants produced by spleen cells after 72 hours of in vitro culture.
Cells incubated in medium only did not produce any of the cytokines measured. These
results confirm that IL-10 is important in regulating IL-2 and IFN-y production, in that
neutralizing IL-10 significantly up-regulates the production of these Thl cytokines.
However, although there was a trend for increased levels of IL-4 and IL-5 when IL-10
was neutralized, these differences did not reach statistical significance. These results
confirm those previously reported following in vitro neutralization of IL-10 (Osborne
and Devaney, 1999)
1 2 9
(ii) Ag-specific proliferative responses
Proliferative responses of splenocytes from L3 infected and control mice in the presence
and absence of neutralizing anti-IL-10 were measured over a time course of in vitro
restimulation with 10 pg/ml B. pahangi adult Ag. As shown in Figure 4.2, at no time
point (48 or 72 hour) did anti-IL-10 have an effect on Ag-stimulated proliferation, as
previously reported (Osborne, 1999).
4.2.2. Investigating the cellular source of IL-10
Defining the phenotype of the cells responsible for IL-10 production is important in
terms of understanding how the L3 polarizes the immune response. For example, do
high levels of IL-10 merely reflect Th2 polarization or is IL-10 produced by cells other
than Th2 cells?
4.2.2.1. In vitro depletion experiments
In an attempt to characterize the cellular source of IL-10, selected populations were
depleted from splenocytes from L3 infected BALB/c mice. In these experiments the
appropriate cellular population was depleted from pooled splenocytes using magnetic
beads and the relevant cell surface Ab. Depletions were monitored by FACS analysis
and in all experiments were greater than or equal to 95% efficient. Cytokine responses
were compared in Ag-stimulated cultures of depleted and non-depleted populations at
48 hours. Post depletion, cells were cultured at 1 x 10 / ml per sample, thus cell
numbers in cultures from depleted splencytes did not contain fewer cells than whole
splenocyte cultures.
1 3 0

(i) Depletion of CD4^ cells
In three separate experiments, depletion of CD4^ cells resulted in a dramatic decrease in
levels of IL-10 relative to unseparated splenocytes from the same animals, although
levels of IL-10 were never reduced to background despite the removal of almost all
CD4^ cells. The results of a representative experiment are shown in Figure 4.3, where
levels of IL-10 were decreased by 60% (mean value of three experiments 71% ± 12.3
reduction in IL-10). In addition levels of IL-4 were reduced by 40% and IL-5 by 60%
(mean values of tliree experiments 45% ±12 and 73.5 %± 20.5 respectively). No Thl
cytokines were detected in supernatants from CD4'*' depleted cultures or whole
splenocyte cultures.
(ii) Depletion of B cells
In four separate experiments, depletion of B220’*' cells resulted in a more modest effect
on IL-10 production relative to unseparated splenocytes from the same animals. The
results of a representative experiment are shown in Figure 4.3, where levels of IL-10
were reduced by 40% (mean data for four experiments 53.5% ± 14.85).
4.2.2.2. Semi-quantitative real time RT-PCR
The results of the depletion experiments suggested that CD4^ cells were the major
producers of IL-10 with B cells contributing to a lesser extent. However using this
method it was not possible to rule out indirect effects of depletion, e.g. the depletion of
one cell type could affect the ability of another cell to produce IL-10. Therefore a more
direct method of determining the cellular source of IL-10 was required. To address this
point IL-10 mRNA levels from purified CD4^ cells and B cells were quantified by real
1 3 1

time PCR using the ABI/PRISM 7700 sequence detection system. Analyses were
performed using primers and an internal fluorescent TaqMan probe specific to IL-10
and HPRT. All samples were rmi in triplicate.
(i) IL-10 mRNA expression in CD4^ and B220^ cells
At 12 d.p.i. CD4^ or B cells were purified from the spleens of ten L3 infected mice
using magnetic separation. Depletions were monitored by FACS and in all experiments
were greater than or equal to 95% efficient (data not shown). Following RNA
extraction, real time RT-PCR was carried out on the selected populations. Figure 4.4
shows IL-10 mRNA levels relative to HPRT and demonstrates that the CD4^ population
express approximately two-fold more IL-10 mRNA compared to B cells. This
experiment was carried out tlii'ee times and each data set showed a similar profile. Thus
the results on mRNA expression in different cellular populations equate reasonably well
with those from the depletion experiments, measuring levels of IL-10 protein.
4.2.3. Investigating the role of IL-10 in vivo
The in vitro experiments described above demonstrate that IL-10 can suppress the
production of Thl cytokines in response to the L3 and indicate that Thl cells are
primed, but are suppressed by IL-10. To investigate the role of IL-10 in vivo, an
antibody which neutralizes the IL-10 receptor was administered to mice
intraperitoneally at days 0, 4 and 7 post-infection at a dose of 10 qg each injection. The
use of this Ab gave further insight into the role of IL-10 in the immune response elicited
by the L3.
1 3 2

(i) Ag-specific proliferative responses of splenocytes from L3 infected mice in
which IL-IOR has been blocked
Data from previous experiments demonstrated that neutralizing IL-10 in vitro had no
effect on levels of Ag-specific proliferation of splenocytes from L3 infected mice,
despite a significant increase in levels of Thl cytokines. However, as shown in Fig. 4.5,
after mice have been infected with L3 and then treated with IL-IOR neutralizing Ab,
levels of Ag-specific proliferation were significantly increased compared to mice given
the isotype control, suggesting a role for IL-10 in down-regulating proliferation in vivo.
This increase in proliferation was shown to be Ag-specific in nature as when cpm from
medium only cultures were subtracted from cpm in Ag-stimulated cultures, there was
still a significant difference in the levels of proliferation between mice given IL-IOR
MAb and mice given the isotype control (p== 0.0122).
(ii) Ag-specific cytokine responses of splenocytes from L3 infected mice in
which IL-IOR has been blocked
It was shown previously that neutralising IL-10 in vitro resulted in increased levels of
IL-2 and IFN-y. However, results shown in Fig. 4.6 demonstrate that neutralising IL-
1 OR in vivo did not result in any changes in cytokine profile, with levels of IL-4, IL-5
and IL-10 remaining consistent between groups and no Thl cytokines observed.
1 3 3

(iii) CFSE staining of cells from L3 infected mice in which IL-IOR has been
blocked
In an attempt to define the phenotype of the cells that proliferate when the IL-IOR is
blocked, CFSE staining (see Materials and Methods 2.4.2) was carried out prior to in
vitro stimulation with 10 qg/ml B. pahangi adult Ag. At 96 hours, cells were harvested
and labelled with anti-CD4 MAb or B220 MAb and the samples were analyzed by flow
cytometry. The data shown in Figure 4.7 and 4.8 are from a representative experiment
in which the proliferation of CD4^ and B cells were followed using CFSE. The FACS
plots in Figure 4.7 show cells from individual mice, which are representative of a group
of five, with the means of five mice shown in Figure 4.8. These results demonstrate that
levels of B220^ proliferation are unaffected by the neutralization of IL-IOR, with -15%
of B cells proliferating in mice given the neutralizing Ab, or given the isotype control
(Figure 4.8). However, there is a difference in the levels of CD4^ proliferation between
these groups of mice. In splenocytes culture from isotype control treated mice, -5% of
CD4^ cells proliferate compared to -13.5% in cultures from mice given the neutralizing
Ab (Figure 4.8). However the difference in proliferation of CD4^ cells between the
groups did not reach statistical significance (p=0.0662). In Figure 4.9, histogram plots
generated by the flow cytometer are shown to illustrate the division of CD4^ and B220^
cells. The plots represent two individual animals from a group of five infected with 50
L3 of B. pahangi and given either neutralizing IL-IOR MAb (panel A) or isotype
matched control (panel B). It can be seen from these plots that the division of B220^
cells (green overlay) and CD4^ cells (pink overlay) accounts for the majority of dividing
cells in these cultures. The initial peak which is shown at approximately 10 on the x
axis reflects undivided cells while the peak to the left represents cells which have
1 3 4

divided. It can be seen that there are fewer CD4^ cells dividing in panel B, which is
from the mouse which received GLl 13.
(iv) Ex vivo staining of splenocytes from L3 infected mice in which IL-IOR has
been bloeked
Ex vivo staining of splenocytes from L3 infected mice given IBL3a or GLl 13 was
carried out using anti-CD4 MAb, anti-B220 MAb and anti-CD8 MAb, to investigate
whether there were differences in the cellular make up of the spleen after the
administration of IBI.3a. One possible explanation for the increased levels of CD4^ cell
proliferation observed in the splenocytes from L3 infected mice given IBI.3a compared
to L3 infected mice given GLl 13, may be due to differences in numbers of these cell
populations ex vivo. However, it can be seen from Figure 4.10 that this is not the case,
as the percentage of CD4^, B220^ and CD8^ cells are not significantly different between
groups. Therefore it can be concluded that neutralizing the IL-IOR directly affects
proliferation of CD4^ cells, following Ag-restimulation.
4.2.4. The role of mosquito transmission on immune responses
In all the afore mentioned experiments, mice were infected with L3 by syringe
inoculation. In the sand fly-leishmania system there is now evidence that sand fly saliva
inoculated along with the parasite, has a major effect on the immune response (Ribeiro,
1987). In particular, the principle vasodilator in sand fly saliva, a peptide termed
maxadilan (MAX) (Lerner et a l, 1991) has been shown to have the ability to decrease
levels of IFN-y mainly by up-regulating levels of IL-10 (Bozza et a l, 1998). It is not
clear- at present whether this effect is specific to the sand fly or might be shared with
other Diptera. Experiments carried out to investigate the role of mosquito saliva in
1 3 5

transmission of L3, included analysis of cytokine production in the spleen and
peripheral lymph nodes following syringe inoculation or natural transmission via
mosquito bite. The number of L3 administered to the mice by the mosquitoes was
estimated by counting L3 per mosquito prior to and after feeding (as described in
Materials and Methods 2.2.2). The relevant controls included mice infected sub-
cutaneously with 50 L3 and mice given HBBS alone. At 12 d.p.i. spleens were removed
and cytokine and proliferation assays were carried out.
(i) Cytokine responses of splenocytes and lymph nodes of mice infected with
L3 via syringe or natural transmission
Cytokine responses of splenocytes and lymph nodes from syringe infected and naturally
infected and control animals were measured after 72 hours of in vitro restimulation with
10 qg/ml B. pahangi adult Ag. Figure 4.11 shows levels of Ag-driven cytokines in
supernatants produced by spleen cells and lymph node cells after 72 hours of in vitro
culture. These results show that there are significantly higher levels of IL-4, IL-5 and
IL-10 produced by splenocytes from syringe inoculated mice compared to those from
mice exposed to infective mosquitoes. In addition levels of IL-4 and IL-10 were
significantly higher in lymph node cells from syringe inoculated mice compared to
mosquito exposed mice.
(ii) Ag-specific proliferative responses of splenocytes and lymph node cells of
mice infected with L3 via syringe or natural transmission
Proliferative responses of splenocytes and lymph node cells from syringe infected and
naturally infected and control animals were measured after 48, 72 and 96 hours of in
vitro restimulation with 10 qg/ml B. pahangi adult Ag. Figure 4.12 shows that although
1 3 6
___

there are slight differences in the levels of proliferation in splenocytes from syringe
inoculated mice compared to naturally infected animals, this did not reach significance
at any time point. However at 96 hours, levels of proliferation were significantly higher
in lymph node cells from syringe inoculated animals compared to levels in lymph node
cells from mosquito exposed animals. However levels of proliferation are extremely
low and indeed were lower than the proliferation of splenocytes from control animals.
Lymph nodes from control animals were not used in these experiments as they were too
small.
4.2.5. Infection with different doses of L3
As there were significant differences in the levels of IL-4, IL-5 and IL-10 between
splenocytes from syringe inoculated and mosquito exposed mice, it was important to
ascertain whether this was a dose dependent effect (i.e. there was a possibility that
mosquito exposed animals were not receiving as many L3). In order to investigate this
possibility, groups of five mice were infected with either 50, 25 or 10 L3 and control
animals were given HBSS. A tl2 d.p.i. spleens were removed and cytokine assays were
carried out.
(i) Cytokine responses of splenocytes of mice infected with 50, 25 or 10 L3
Cytokine responses of splenocytes from all groups were measured after 72 hours of in
vitro restimulation with 10 pg/ml B. pahangi adult Ag. Figure 4.13 shows that there
were no significant differences in the levels of IL-4, IL-5 and IL-10 between the groups.
Therefore there was no dose dependent effect on cytokine production.
1 3 7
(ii) Ag“Specific proliferative responses of splenocytes of mice infected with 50,
25 or 10 L3
Ag specific proliferative responses of splenocytes from all groups were measured after
48, 72 and 96 hours of in vitro restimulation with 10 pg/ml B. pahangi adult Ag. Figure
4.14 shows that despite being infected with different numbers o f L3, there was no
significant difference in levels of proliferation at any time point between any group.
1 3 8

Figure 4.1. Neutralizing IL-10 in Ag-stimulated cultures of splenocytes from L3 infected mice resulted in significantly increased levels of Thl cytokines
Mice were infected s.c. with 50 L3 of B. pahangi or an equal volume of HBSS only (C). At 12 d.p.i., splenocytes (1 x lOVml) were re-stimulated in vitro with 10 pg/ml B. pahangi adult Ag (Ag). Ag-specific cytokine responses were measured at 72 hours in the presence of Ipg/ml neutralising IL-10 Ab (alL-10) or Ipg/ml isotype matched control (isoc). Results are expressed as pg/ml and all values represent the mean and standard deviation of five mice per group.
IL-2 - Ag vs aIL-10/?= 0.0122 isoc vs aIL-10 p= 0.0122
IL-4 - Ag vs nalL-10 p= 0.0947 isoc vs alL -10p= 0.5309
lL-5 - Ag vs aIL-10 0.0947 isoc vs aIL-10p= 0.2101

IL-2 IFN-y
1400
1 2 0 0 t
1 0 0 0 4-
Ê 800 T
^ 600
400
200 0
□ L3
■ C
Ag Ag+ISOC Ag+alL-10
1400
1200 1000
Ë 800
^ 600
400
200 0
ÜL3 ■ C
Ag Ag+lSOC Ag+aIL-10
lL -4 lL -5
200
150
150
0Ag
14000
12000
10000
□ L3 g 8000
■ C ^ 6000 I
4000
2000 0
Ag+lSOC Ag+alL-10
E3L3
■ C
Ag Ag+lSOC Ag+alL-10
IL -10
7000
6000
5000
g 4000
a 3000
2000
1000
0
□ L3
■ C
Ag Ag+isoc Aa+alL-lO
1 3 9

A 48 hours
18000
16000
14000
12000 £ 10000 U 8000
60 00
40 00
2000 0
med isoc Ag+alL-10
□ L3
■ C
B72 hours
40000
35000
30000
25000
Q. 20000u15000
10000
5000
0 Ji□ L3
■ C
med Ag isoc Ag+alL-10
Figure 4.2. Neutralizing IL-10 in Ag-stimulated cultures of splenocytes from L3 infected mice did not alter levels of Ag-specific proliferation
Mice were infected sub-cutaneously with 50 L3 of B. pahangi or an equal volume of HBSS only (C). At 12 d.p.i., splenocytes (5 x lOVml) were re-stimulated in vitro with 10 pg/ml B. pahangi adult Ag (Ag) in the presence or absence of 1 pg/ml neutralizing IL-10 Ab (aIL-10) or 1 pg/ml isotype matched control (isoc). Ag-specific proliferative responses were measured by uptake of H thymidine at 48 hours (A) and 72 hours (B). Results are expressed as mean cpm incorporated in triplicate wells and all values represent the mean and standard deviation of five mice per group.
140

A
2000018000 -
16000 -
14000 -
12000 -
10000o. 8000 -
6000 -4000
20000
45000 40000 35000 30000 25000 20000 -
15000 - 10000 5000
0 J-
IL-IO
1
L3 L 3 -C D 4
lL-5
B
140
120
100
1 80 ^ 60
40
20
0
D
40000
35000
30000
_ 25000
i 20000
15000
10000
5000
0
lL-4
1
L3 L3-CD4
IL -1 0
1
L3 L3-CD4 L3 L3-B
Figure 4.3. Depletion of CD4 or B cells from spleens of L3 infected mice resulted in decreased levels of IL-10
Mice were infected sub-cutaneously with 50 L3 of B. pahangi or an equal volume of HBSS only (C). At 12 d.p.i. splenocytes from L3 infected mice were then pooled and CD4^ or B cells were depleted from culture using MACS anti-FITC beads and passing the suspension through MACS magnetic columns. The negative fraction was then restimultated in vitro with 10 pg/ml B. pahangi adult Ag. Ag-specific cytokine responses from whole splenocytes (L3) and splenocytes depleted of CD4^ (L3-CD4) were measured at 72 hours (A-C). Panel D represents IL-10 levels from whole splenocytes and splenocytes depleted of B cells. Results are expressed as pg/ml.
141

14
12IL-10 mRNA expression g relative toHPRT
CD4 B220
HPRT IL-10
CD4 100 11
B220 100 5
Control 100 0.02
Figure 4.4. Semi-quantitative RT-PCR carried out on ex vivo splenocytes from L3 infected mice shows that CD4+ cells express more IL-10 mRNA relative to HPRT than do B220 cells
Mice were infected s.c. with 50 L3 of B. pahangi or an equal volume of HBSS only (C). At 12 d.p.i. splenocytes from L3 infected mice were pooled and magnetically separated into purified CD4^ and B220^ cells. Semi-quantitative RT-PCR was carried out on these cells (using the TaqMan method) and levels of IL-10 mRNA are expressed relative to the constitutive gene HPRT.
142

60000
50000
40000
I . 30000u
20000
10000
0
□ MED E Ag
L3+IBI.3a L3+GLII3
üeÆ
C
Figure 4.5. In vivo neutralization of IL-IOR resulted in increased levels of Ag-specific proliferation in splenocytes from L3 infected mice
Two groups of BALB/c mice were infected sub-cutaneously with 50 L3 of B. pahangi and a third group were given an equal volume of HBSS only (C). One of the infected groups was injected intraperitoneally with 10 pg neutralizing IL-IOR MAb (IBI.3a) and the other group received the same concentration of isotype control (GLl 13) at day 0, 4 and 7 postinfection. At 12 d.p.i., splenocytes (5 x 10^/ml) were re-stimulated in vitro with 10 pg/ml of B. pahangi adult Ag and Ag-specific proliferative responses were measured by uptake of H thymidine at 72 hours. Results are expressed as mean cpm incorporated in triplicate wells and all values represent the mean and standard deviation of five mice per group.Data show an increase in levels of proliferation when IL-IOR is blocked.(L3+IBI.3a Ag vs L3+GL113 Ag /;=0.0216).
143

IL-4IL-5
1800 1 1600 - 1400 - 1200
I 1000 % 800
600 400 200
0
14000
12000
10000
8000
6000
4000
2000 -I
0
1
lB1.3a GLl 13 lBL3a GLl 13
IL-10
14000
12000
10000
8000
6000
4000
2000
0lB1.3a GLl 13
Figure 4.6. In vivo neutralization of IL-IOR resulted in no differences in cytokine production
Two groups of BALB/c mice were infected sub-cutaneously with 50 L3 of B. pahangi and a third group were given an equal volume of HBSS only (C). One of the infected groups was injected intraperitoneally with 10 pg neutralizing IL-IOR MAb (IBI.3a) and the other group received the same concentration of isotype control (GLl 13) at day 0, 4 and 7 postinfection. At 12 d.p.i., splenocytes (1 x 10%rl) were re-stimulated in vitro with 10 pg/ml of B. pahangi adult Ag and Ag-specific cytokine responses were measured by ELISA. Results are expressed as pg/ml and all values represent the mean and standard deviation of five mice per group.
IL-4 - IBI.3a vs GLl 13/7=1 IL-5 - IBI.3a vs GLl 13/7 = 0.7728 IL-10 - IBI.3a vs GLl 13 p = 0.6650
144

Figure 4.7. CFSE labelling of splenocytes from L3 infected mice shows that the proliferation of CD4^ cells is increased when IL-IOR is blocked
Two groups of BALB/c mice were infected sub-cutaneously with 50 L3 of B, pahangi. One of the infected groups was injected intraperitoneally with 10 pg neutralising IL-IOR MAb (IBI.3a) (A and C) and the other group received the same concentration of isotype control MAb (GLl 13) (B and D) at day 0, 4 and 7 post infection. Splenocytes from these mice were labelled with CFSE and cultured with 10 pg/ml B. pahangi adult Ag. Cells were harvested at 96 hours, surface stained with anti-CD4^ MAb (A and B) or anti-B220 MAb (C and D) and analyzed by flow cytometry. Each panel shows the CFSE staining profile of CD4" or B220^ splenocytes from an individual mouse. The numbers at the top left hand corner of each panel indicate the percentage of CD4'*’ or B220^ cells displaying reduced fluorescence intensity in FL-1, indicating they have divided in Ag-stimulated culture. These figures are representative of the responses of five animals per group.

IBI.3a GLl 13
APCpositivecells
o "1 1 inum*
o
oo
Î - 0
oo
1 0 ' 10 '
FL1-H FL1-H
<210 10' 10
FL1-H
B
! 4.8
-1^1 iiimi|yi*iTiiii(jJW ÊK m m it.y
CD4
o \ Lmiiiii
B220
D
CFSE
145

25
20
15
10
□ CD4+ ■ B220
lB1.3a GL113
Figure 4.8. CFSE staining demonstrates that mean levels of proliferation of CD4 cells from L3 infected mice are increased when IL-IOR is blocked
Two groups of BALB/c mice were infected sub-cutaneously with 50 L3 of B. pahangi. One of the infected groups was injected intraperitoneally with 10 pg neutralizing IL- IOR MAb (IBI.3a) and the other group received the same concentration of isotype control MAb (GLl 13) at day 0, 4 and 7 post-infection. Splenocytes from these mice were labelled with CFSE and cultured with 10 pg/ml B. pahangi adult Ag. Cells were harvested at 96 hours, surface stained with anti-CD4 MAb or anti-B220 MAb and analyzed by flow cytometry. Graphs show the mean levels of proliferation of CD4^ or B cells calculated from CFSE labelling at 96 hours of 5 mice per group. No difference in B cell proliferation was observed while CD4^ proliferation showed a tendency to increase when IL-IOR was blocked but did not reach significancep=0.0662.
146

FL -H
B
PL -H
Figure 4.9. CD4^ expansion is increased in L3 infected mice given blocking IL-IOR Ab
Two groups of BALB/c mice were infected sub-cutaneously with 50 L3 o f# , pahangi. One of the infected groups was injected intraperitoneally with 10 pg neutralizing IL- IOR MAb (IBI.3a) (A) and the other group received the same concentration of isotype control MAb (GLl 13) (B) at day 0, 4 and 7 post-infection. Splenocytes from mice given 50 L3 of B. pahangi s.c. were labelled with CFSE and cultured with 10 pg/ml B. pahangi Ag. After 96 hours the cells were harvested and labelled with anti-CD4 MAb or anti-B220 MAb and analysed by flow cytometry. The purple fill shows the CFSE staining profile of total splenocytes. The green overlay represents the CFSE staining profile of CD4^ cells and the pink overlay shows the CFSE staining profile of B220^ cells.
1 4 7

45
40 -
35 -
30
25
20
15
10
5 -
0
□ l B 1 . 3 a
O G L 1 1 3
rlC D 4 B220 CDS
Figure 4.10. Ex vivo staining of splenocytes from L3 infected mice shows no difference in levels of cellular populations in the spleens of mice in which IL-IOR was blocked
Two groups of BALB/c mice were infected sub-cutaneously with 50 L3 of B. pahangi. One of the infected groups was injected intraperitoneally with 10 pg neutralizing IL- lOR MAb (lBI.3a) and the other group received the same concentration of isotype control MAb (GLl 13) at day 0, 4 and 7 post infection. Splenocytes from these mice were surface stained ex vivo 12 d.p.i. with anti-CD4 MAb, anti-B220+ MAb and anti- CD8+ MAb and analyzed by flow cytometry. All results represent the mean +/- standard deviation of 5 animals per group.
148

Figure 4.11. Cytokine responses to L3 are exaggerated in mice infected via syringe compared to mice infected by mosquito bite
One group of mice were infected sub-cutaneously with 50 L3 of B. pahangi via syringe inoculation. A second group of mice were infected via mosquito transmission, so that each animal was estimated to receive approximately 50 L3. A third control group were given HBSS. At 12 d.p.i., spleens and lymph nodes were removed. Ag-specific cytokine responses were measured at 72 hours. Results are expressed as pg/ml and all values represent the mean and standard deviation of five mice per group.
SL3sp - syringe inoculation, spleen ML3sp - mosquito transmission, spleen SLN - syringe inoculation, lymph node MLN - mosquito transmission, lymph node
IFN-y - SL3sp vs ML3spp = 0.2506 SLN vs MLN p = 1
IL-4 - SL3sp vs ML3spp = 0.0367 SLN vs MLN p < 0.05
IL-5 - SL3sp vs ML3sp p = 0.0122 SLN vs MLN p = 0.0947
IL-10 - SL3sp vs ML3sp p = 0.0367 SLN vs MLN j!7 = 0.0122

IFN-y IL-4
2000
1500
1000
500 ■SL3sp ML3sp SLN MLN
400 350 ! 300
- 250 1 ,2 0 0
150 100 50 0 I I
SL3sp ML3sp SLN MLN
IL-5 IL-10
100000
80000 -
60000
40000
20000
SL3sp ML3sp SLN MLN
HC
6000
5000
4000
3000
2000
1000
0 ISL3sp ML3sp SLN MLN
1 4 9
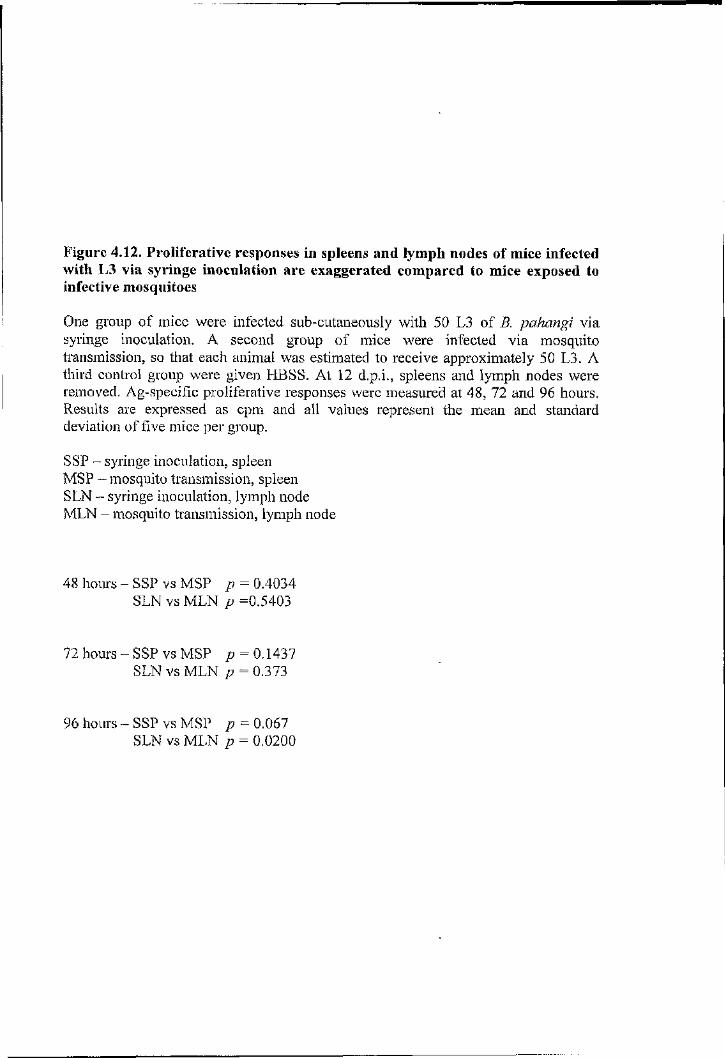
Figure 4.12. Proliferative responses in spleens and lymph nodes of mice infected with L3 via syringe inoculation are exaggerated compared to mice exposed to infective mosquitoes
One group of mice were infected sub-cutaneously with 50 L3 of B. pahangi via syringe inoculation. A second group of mice were infected via mosquito transmission, so that each animal was estimated to receive approximately 50 L3. A third control group were given HBSS. At 12 d.p.i., spleens and lymph nodes were removed. Ag-specific proliferative responses were measured at 48, 72 and 96 hours. Results are expressed as cpm and all values represent the mean and standard deviation of five mice per group.
SSP - syringe inoculation, spleen MSP - mosquito transmission, spleen SLN - syringe inoculation, lymph node MLN - mosquito transmission, lymph node
48 hours - SSP vs MSP p = 0.4034 SLN vs MLN p =0.5403
72 hours - SSP vs MSP p = 0.1437 SLN vs MLN p = 0.373
96 hours - SSP vs MSP p = 0.067 SLN vs MLN p = 0.0200

48 hours
30000
25000
20000
I 15000o10000
5000
SSP MSP SLN MLN c
72 hours
70000600005000040000300002000010000
0
96 hours
60000 j50000 40000
I 30000 20000 10000
0SSP MSP SLN MLN
□ MED
■ Ag
□ MED
■ A g
SSP MSP SLN MLN c
□ MED ■ Ag
150

Figure 4.13. Cytokine responses of mice given 50, 25 or 10 L3 are not significantly different
One group of five mice were infected sub-cutaneously with 50 L3 B. pahangi. A second group were given 25 L3 and a third group given 10 L3. A fourth group of control mice were given HBSS. At 12 d.p.i., spleens were removed from these mice. Ag-specific cytokine responses were measured at 72 hours. Results are expressed as pg/ml and all values represent the mean and standard deviation of five mice per group.
IL-4- 5 0 vs 25^ = 0.4034 50 vs p ~ 0.2963 25 vs 10^ = 1
IL-5- 5 0 vs 25;? = 0.5309 50 vs lOp = 0.8345 25 vs 10p = 0.7540
IL-10- 5 0 vs 25 j!? = 0.8345 50 vs 10 j!? = 0.5309 25 vs 10 p = 0.4034

lL-4 IL-5
900 800 700 600
Ë 500 g 400 -1
300 200 100
0
7000
T T□ A g
60005000
4000 -^ 3000 -
2000
1000 -
50 25 10 50 25
□ Ag
10
lL-10
80007000600050004000300020001000
0
□ A g
50 25 10
151

Figure 4.14. Ag-specific proliferative responses of mice given 50, 25 or 10 L3 are not significantly different at any time point
One group of five mice were infected sub-cutaneously with 50 L3 B. pahangi. A second group were given 25 L3 and a third group given 10 L3. A fourth group of control mice were given HBSS. At 12 d.p.i., spleens were removed from these mice. Ag-specific proliferative responses were measured at 48, 72 and 96 hours. Results are expressed as cpm and all values represent the mean and standard deviation of five mice per group.
48 hours - 50 vs 25 /; = 0.2101 50 vs 10p = 0.6761 25 vs 10p = 0.2101
72 hours - 50 vs 25 p = 0.8345 50 vs lOp = 0.0510 25 vs 10p = 0.1437
96 hou rs-50vs25p= = 0.5309 50 vs lOp = 0.6761 25 vs lOp = 0.4034

48 hours
Ea.
80000 -i
60000
40000
20000 -
□ ined ■ A g
10
72 hours
140000 120000 -i
100000
80000 60000 40000 20000
0
■T *
□ med a A g
50 25 10
96 hours120000
100000
a. 60000
40000
20000
□ med ■ A g
50 25 10
152

4.3. Discussion
The results presented in this Chapter highlight the importance of IL-10 in the regulation
of immune responses in L3 infected BALB/c mice. Initial experiments carried out using
a neutralizing anti-IL-10 MAb in vitro confirmed that IL-10 has an important role in
suppressing the production of Thl cytokines, IL-2 and IFN-y. The increase in IFN-y
may derive from Thl cells or alternatively could derive from activated macrophages.
When IL-10 is neutralized, macrophages may become activated and, in turn produce
IFN-y. This involves a mechanism whereby IL-10 can inliibit IFN-y gene transcription
within monocytes by controlling aspects of the IFN-y signalling pathway (Ito et a l,
1999). In terms of Th2 cytokine production, IL-4 and IL-5 also had a tendency to
increase in the absence of IL-10, however these differences did not reach statistical
significance in any experiment. These results suggest that IL-10 is suppressing cytokine
production by Thl cells and possibly Th2 cells, to a lesser extent. In this respect, it
might be predicted that neutralizing IL-10 in vitro would result in increased levels of
proliferation. Previously, IL-10 has been shown to down-regulate proliferation of T
cells via an affect on AFC (Ding et a l, 1993), but IL-10 has also been shown to have a
direct effect on T cells in the absence of AFC by inhibiting IL-2 production (de Waal
Malefyt et a l, 1993a). However, in numerous experiments in this study, levels of
proliferation were never significantly different between cultines where IL-10 was
neutralized or not. It is possible that neutralizing IL-10 in vitro has an effect on the
ability of Thl cells to produce cytokines without affecting their proliferation. Other
studies have described a similar scenario where proliferation and cytokine production
are differentially regulated (Evavold and Allen, 1991; Allen et a l, 1996). Alternatively,
as alluded to above, cell types other than CD4^ cells may produce IFN-y but not
proliferate. This could be investigated using intra-cellular cytokine staining to identify
1 5 3

the cellular source of IFN-y. Finally, the concurrent production of Thl and Th2
cytokines may be cross-regulatory, so that no increase in Thl or Th2 proliferation is
observed in vitro.
As in vitro assays had determined that IL-10 had a role in cytokine regulation but not
down-regulation of proliferation in cultures from L3 infected mice, it was of interest to
investigate the role of IL-10 in vivo. An obvious way to examine the role of IL-10 in the
mouse model of Brugia would be to use IL-10-/- mice. Unfortunately, the conditions in
the Animal Unit at the University of Glasgow are not compatible with the survival of
IL-10-/- mice as they are prone to pro-inflammatory pathologies such as inflammatory
bowel disease. An alternative approach is to neutralise the effects of IL-10 in vivo using
a blocking IL-IOR Ab (O'Farrell et a l, 1998; Belkaid et a l, 2001). Using this Ab had
the added benefit of ensuring that the background strain of mouse was the same as used
in previous experiments. In contrast to the in vitro situation, blockade of IL-IOR in vivo
showed very little difference in cytokine production. However, there was a significant
increase in levels of proliferation in splenocytes from mice given the neutralizing Ab
compared to those receiving the isotype control. These results are intriguing, as the L3
generates good proliferative responses in the intact mouse in the presence of IL-10.
However after in vivo administration of this Ab, levels of proliferation were seen to
almost double. It was therefore of interest to identify the cellular population inhibited by
IL-10. FACS analysis of CFSE stained cells demonstrated that CD4^ cells were the
major population which expanded during IL-IOR blockade. As IL-IOR is expressed on
the surface of APC and on T cells (Asadullah et a l, 2003), blockade of IL-IOR will
result in altered signals being delivered to CD4^ cells from APC and/or direct effects
upon T cells both of which could result in increased levels of proliferation. Ligation of
1 5 4
the IL-10 receptor results in signalling via the Jak/Stat pathway and has multiple
downstream effects. For example, IL-10 suppresses inflammatory responses via its
effect on pro-inflammatory cytokines, chemokines, APC and costimulatory molecules
(Moore et a l, 2001). IL-10 promotes an anti-inflammatory Th2 response by inliibiting
the production of IL-12 from APC, thus suppressing the production of IFN-y from T
cells. Macrophages are particularly susceptible to these effects, with IL-10 down-
regulating the production of TNF-a, IL-1, IL-6, IL-12 and the expression of MFIC class
II and B7-1 and B7-2 on the cell surface. Altogether, the ability of macrophages to
present Ag efficiently to T cells is attenuated by IL-10 (Fiorentino et a l, 1989; de Waal
Malefyt et a l, 1993b). Besides the dominating indirect impact via the APC, IL-10 can
also exert some direct effect on T cells. Naive T cells are larown to be more sensitive to
the effects of IL-10 due to the down-regulation of the IL-IOR on activated cells (Liu et
a l, 1994). IL-10 was shown to inliibit T cell proliferation in the presence of CD28 co
stimulation (Akdis et a l, 2000). In addition, the presence of IL-10 during the activation
of naïve T cells results in these cells developing a regulatory phenotype, characterised
by weak proliferation and absence of IL-2 after repeated stimulation (Groux et a l,
1997). Thus, increased levels of CD4'^ proliferation observed when IL-IOR is blocked,
may be attributed to one or more of the suppressive mechanisms of IL-10 mentioned
above.
Neutralizing IL-10 in vitro resulted in production of Thl cytokines but had no effect on
proliferation. In contrast blockade of the IL-IOR in vivo produced the opposite effect, no
difference in cytokines but an increase in proliferation. Interestingly when the IL-IOR
Ab was used in vitro, the results were identical to neutralizing IL-10 (increased IL-2 and
IFN-y). How can these differences be reconciled? Perhaps in the in vivo situation IL-
1 5 5
___

lOR is blocked very quickly after the administration of L3, allowing little time for the
down-regulatory effects of IL-10 to be manifest, resulting in more efficient Ag
presentation to CD4^ cells with a consequent increase in proliferation. However it is
difficult to account for the fact that no increase in Thl cytokines is observed. This may
reflect a difference in sensitivity to receptor blockade in different cells. In the case of
the in vitro system where IL-10 is present during T cell priming in vivo, IL-IO may
inliibit the ability of Thl cells to divide, but after neutralization of IL-IO in vitro they
have the ability to release cytokines. For example, cells which have been continuously
exposed to IL-10 can be rendered anergic and these cells cannot recover from this state
even with the addition of IL-2. Therefore, it may be the case that cells primed in the
presence of IL-10 are unable to proliferate even when IL-10 is neutralized in vitro. An
interesting experiment in this respect would be to examine proliferation by CFSE using
cell surface markers for Thl and Th2 cells, and to determine whether the CD4" cells
that expand following blockade of the receptor are CD25', as it has been shown in
previous in vitro studies, that CD4^CD25^ cells have the ability to suppress proliferation
of co-cultured CD4"^CD25"T cells (Takahashi ei a l, 1998).
Defining the phenotype of the cells responsible for the production of IL-10 in response
to L3 infection is important in terms of understanding how the L3 polarizes the immune
response e.g. does IL-10 derive from a Th2 or perhaps Treg phenotype or from an AFC
(B cells or macrophages). Initial attempts to identify the source of IL-10 using intra
cellular cytokine staining were unsuccessful (data not shown), therefore, to define the
cellular source of IL-10, depletions of selective populations were carried out on
splenocytes of L3 infected mice. These experiments showed that CD4^ cells were the
major producers of IL-10 with B cells contributing to a lesser extent. In addition.
1 5 6

depletion of CD4^ cells had marked effects on levels of Ag-specific IL-4 and
particularly IL-5. While it is clear from these experiments that depletion of both CD4^
and B cells has a dramatic effect on cytokine production, a more direct method of
defining the cellulai' soince of IL-10 was required. Quantitative RT-PCR on selected
cellular populations confirmed the depletion experiments, in that CD4^ cells were
demonstrated to produce the majority of IL-10 with B cells having a lesser role. As
there is an additional sub-set of CD4^ cells which have regulatory properties, either by
their ability to produce IL-10 (Trl and Tli3) or via cell to cell contact dependant
mechanisms (CD4^CD25^ cells), the finding that CD4^ cells are the major source of IL-
10 clearly required further investigation (see results presented in Chapter 5).
Finally, the remaining experiments in this Chapter were carried out to determine
whether mosquito saliva had an effect on the transmission of L3 in the mouse model,
and if there was an effect, whether IL-10 played a role. These experiments were
relevant, as it has been reported previously that sand fly saliva has potent
immunomodulatory functions. When L. major is administered to mice along with sand
fly salivary gland lysate, disease is exacerbated and the parasite burden is greatly
entranced (Titus and Ribeiro, 1988). One important vasodilatory peptide in sand fly
saliva, termed maxadilan (MAX), has been shown to induce elevated levels of IL-10
(Bozza et a l, 1998), thus down-regulating levels of IFN-y and NO, which in this system
is beneficial to the parasite (Titus et a l, 1994). Salivary gland lysate also has a profound
ability to suppress T cell proliferation in a non-specific mamrer (Titus, 1998). Therefore,
to determine whether the saliva of mosquitoes has any such affect mice were either
exposed to infective mosquitoes, which were estimated to transmit -50 L3 per mouse,
or to syringe inoculation (the method of infection used during the course of all
1 5 7

experiments up to and beyond this point). When examining cytokine responses from
both groups of animals it appeared that the group which received L3 via natural
transmission, had a reduced capacity to produce cytokines (it is notable that splenocytes
in this experiment were producing low levels of IFN-y, a rare occurrence in most
experiments). This contrasts to the sand fly system, where elevated levels of IL-10 are
observed. When levels of proliferation were measured in splenocytes and lymph node
cells, a general reduction in proliferation was observed in cells (lymph node cells and
splenocytes) from the animals which received L3 via mosquito transmission.
While these differences could be due to an inhibitory effect of mosquito saliva during
the course of transmission, they may also be accounted for by fewer L3 being
administered by mosquito transmission than by syringe inoculation. To clarify this
point, additional experiments were carried out in which varying numbers of L3 were
administered to mice. Somewhat surprisingly, cytokine analysis of supernatants from
cultures of splenocytes from mice infected with 50, 25 or 10 L3 showed very little
difference in levels of IL-4, IL-5 and IL-10. In addition, levels of Ag-specific
proliferation between the groups was not significantly different at any time point. These
results confirm that the L3 is an extremely potent modulator of the immune response, in
that as few as 10 L3 polarised the immune response towards the Th2 phenotype. In
addition, it casts doubt on the possibility that differences between syringe and mosquito
administered L3 can be solely accounted for by variation in levels of transmission.
Whether there is an inmumosuppressive component in saliva injected simultaneously
with L3 when a blood meal is taken or whether natural transmission of L3 is
immunologically “silent” requires further investigation. For example, L3 could be
administered via syringe along with salivary gland lysate from mosquitoes.
1 5 8

Interestingly, previous studies have shown that mosquito saliva contains factors which
modulate cytokine expression (Gillespie et a l, 2000). Saliva from the malaria vector
Anopheles stephensi has a strong neutrophil chemotactic activity (Owhashi et a l, 2001)
while Aedes aegypti (the species used in this study) salivary gland extracts were
reported to stimulate TNF-a release from mast cells (Bissomiette et a l, 1993). During
mosquito transmission, L3 are deposited in the skin where they presumably encounter
different populations of APC compared to those administered via syringe inoculation. In
addition, they may migrate to the lymphatics with different kinetics compared to those
administered by s.c. inoculation. Either factor could influence the subsequent immune
response.
In conclusion it is apparent that IL-10 has an important role in controlling immune
responses in the mouse model post-infection with the L3 of B. pahangi. However the
way in which IL-10 modulates these responses remains inconclusive as there are many
different ways in which this potent anti-inflammatory cytokine can operate.
Neutralization of IL-10 in vitro resulted in the production of Thl cytokines, suggesting
that IL-10 can suppress Thl responses, however it is not clear whether IFN-y is being
produced by macrophages or T cells. When IL-IOR was neutralized in vivo, a different
situation was observed where cytokine levels were unchanged but Ag-specific
proliferation was enlianced. Experiments to examine the cellular' source of IL-10
demonstrated that a population of CD4^ cells are the main producers of IL-10 with B
cells contributing to a lesser extent. Further experiments to characterise the phenotype
of these cells are presented in Chapter 5. Finally, there appeared to be no obvious role
for IL-10 in the natural transmission of L3, in contrast to the situation observed in the
sand üylLeishmania model. There may however be immunomodulatory properties in
1 5 9

mosquito saliva which down-regulate levels of Th2 cytokines but this does not appear to
be associated with elevated IL-10. Alternatively, natural infection with L3 may be a less
immrmo - stimulatory route than s.c. inoculation.
1 6 0

Chapter 5. The L3 of B. pahangi elicits a population of CD4 CD25 CTLA-4^ cells
which regulate proliferation and cytokine production
5.1. Introduction
Over 40 years ago, experiments demonstrated that thymectomy of mice three days after
birth leads to systemic autoimmiinity, indicating the importance of T cells in the
regulation of tolerance. Recently there has been a re-emergence of interest in the theory
of regulatory T cells. The modern view of these cells is based on research by Sakaguchi,
who demonstrated that the adoptive transfer of T cells depleted of CD25^ cells resulted
in multi-organ autoimmunity in recipient animals (Sakaguchi et a l, 1995; Asano et a l,
1996). Since these seminal studies, an enormous amount has been learnt about Treg
cells. These cells were demonstrated to induce active suppression of T cell fnnction,
which is essential for the induction of peripheral tolerance to both foreign and self
antigens (Roncarolo et a l, 2001b). The different subsets and properties of these cells
have been outlined in the main Introduction, but it is also important to understand the
role of Treg cells in relation to infectious disease. Studies carried out on Candida
albicans have shown that CD4^CD25^ regulatory T cells are essential for memory-
protective immunity to this fmigal infection in mice (Montagnoli et a l, 2002). Iwashiro
et al further demonstrated a mechanism of virus-induced immunosuppression by means
of the generation or expansion of CD4^CD25^ cells in mice persistently infected with
the Friend retrovirus (Iwashiro et a l, 2001a; Iwashiro et a l, 2001b), while CD4^'CD25^
cells were shown to have an essential role in the control of Pneumocystis carinii
pneumonia in mice (Hori et a l, 2002). In terms of parasitic infections, CD4^CD25^
cells have been studied in mice infected with L. major. In this system, they regulate
progressive disease by controlling production of early IL-4, an essential cytokine
1 6 1

determining whether an infected animal will progress towards a resistant (Thl) or a
susceptible phenotype (Th2). Depletion of CD4^CD25^ cells from susceptible BALB/c
mice resulted in increased levels of IL-4 and exacerbated disease (Aseffa et a l, 2002).
In an additional study, resistant C57BL/6 mice were infected with L. major and it was
demonstrated that a population of parasite specific CD4^CD25^ cells accumulate at the
site of infection in the dermis, where they suppress the ability of effector T cells to
eliminate the parasite from the skin (Belkaid et a l, 2002). This equilibrium between T
effector and Treg function enables the host to develop resistance to further infection
whilst benefiting the parasite by enabling transmission by its vector to continue.
Removal of the CD4^CD25"^ population resulted in total eradication of the parasite from
the site of infection, resulting in the loss of concomitant immunity. Thus it appears that
elimination of CD4^CD25^ cells in L. major infection can make resistant mouse strains
more resistant and susceptible mouse strains more susceptible. The Belkaid study also
demonstrated a role for IL-10 in the survival of parasites within C57BL/6 mice, in that
IL-10-/- mice or mice given IL-IOR Ab, eradicated the parasites resulting in a loss of
concomitant immunity. IL-10 produced by CD4^CD25^ cells may suppress parasite
killing by macrophages, but this does not rule out other possible mechanisms of
suppression, such as cell-contact via CTLA-4 or GITR binding. CD4^CD25"* cells have
also been shown to have a role in modulating responses in mice infected with
Plasmodium berghei NK65. Following infection and administration of an anti-CD25
MAh, the proportion of CD4^CD25^ cells within the CD4~ population decreased despite
a general increase in the number of CD4^ cells. Depletion of CD25^ cells resulted in a
delayed growth of parasitaemia during challenge infection, particularly in immunised
mice. These findings are interesting in that they demonstrate that CD4"^CD25^ cells are
able to influence protective immunity to P. berghei NK65 (Long et a l, 2003).
162
I

In terms of fiiariasis most studies to date have considered the function of Treg cells in
human disease. For example the role of Treg cells in onchocerciasis was examined by
Doetze et al who demonstrated that hypo-responsiveness observed in O. volvulus
infected individuals was associated with the presence of these cells (Doetze et a l,
2000), More recently, analysis of T cells from individuals with lymphatic fiiariasis
showed that a population of CTLA-4^ cells are expanded in hyporesponsive individuals.
Addition of neutralizing Ab to CTLA-4 to PBMC culture, resulted in increased levels of
IL-5 and decreased levels of IFN-y, indicating that CTLA-4 plays a role in maintaining
the Thl/Th2 balance (Steel and Nutman, 2003). Finally, it has been found that S.
mansoni specific lyso-phosphatidylserine (PS) activated the Toll-like receptor 2 and
affected dendritic cells such that mature dendritic cells gained the ability to induce the
development of IL-lO-producing Treg cells (van der Kleij et a l, 2002).
The experiments in this chapter set out to investigate whether Treg cells were induced
following infection of BALB/c mice with the L3 of B. pahangi While it is generally
considered that L3 induce a strong Tli2 response in infected mice, many previous
observations are consistent with the induction of Tregs. These cells were characterised
in terms of cell surface markers, cytokine production and their ability to down-regulate
proliferative responses.
1 6 3

5.2. Results
5.2.1. T cell characterization
(i) IL-10 and TGF-(3 inRNA expression in CD4+ cells from L3 infected mice
T regulatory cells frequently co-express another suppressor cytokine, TGF-p, along with
IL-IO. Therefore the first experiments investigated the possibility that CD4" cells from
L3 infected mice might also produce TGF- p. To address this point, quantitative RT-
PCR was carried out using primers and probes for TGF-p, IL-10 and HPRT on RNA
isolated from CD4^ and B cells purified from the spleens of ten L3 infected mice at 12
d.p.i. CDd*" and B cells were purified using magnetic beads (as described in Material
and Methods 2.6.1). In all experiments the efficiency of the purifications was greater
than or equal to 95% (data not shown). The results of these experiments confirmed that
CD4^ cells from L3 infected mice produced TGF-p (Figure 5.1) along with IL-10. The
B220" population expressed very low levels of TGF-p in the experiment shown.
However, in a subsequent experiment TGF-p was not detected in the B220^ population.
It is notable that although the absolute amount of IL-10 expression in this experiment is
lower than that described previously (Figure 4.5), the relative levels of IL-10 mRNA
expressed by CD4^ and B220^ cells is similar. This finding confirms that the L3 of B.
pahangi elicit a population of CD4^ T cells that express both IL-10 and TGF-p in the
BALB/c mouse model.
(ii) Three-colour FACS analysis of CD4^ cells from L3 infected mice
An alternative way to identify T regulatory cells is to analyse cell surface markers
which are associated with this population. Such markers include co-expression of CD4
1 6 4

with one or more of CD25, CTLA-4 (CD 152), GITR, 0X40 (CD134), CD 103 or Ly6
(McHugh et al, 2002). Therefore three-colour FACS analysis was carried on
splenocytes from L3 infected, MF infected and control mice using anti-CD4 MAh
(FITC), anti-CD25 MAb (APC) and anti-CTLA-4 (PE). Mice infected with MF were
included in these experiments as splenocytes from these animals display a Thl-type
cytokine profile, and it was therefore of interest to compare the expression of these cell
surface markers in L3 and MF infected animals. In these experiments, cells were
cultured with Ag for 72 hours prior to labelling and flow cytometry. The FACS plots in
Figure 5.2 show results from individual mice, representative of the group of five
animals, while Figure 5.3 shows the mean percentage of CD4^ cells which co-express
CD25^ and CTLA-4^ for each group of five animals. These data showed that
CD4'^CD25'^CTLA-4^ cells were expanded only in cultures from L3 infected mice
where they comprised ~7 % of total CD4^ cells. In control or MF infected mice, this
population accounted for ~ 2% of total CD4^ cells.
The results of this same experiment are presented in Table 5.1, and show the percentage
of CD4" cells that also express each individual marker. As would be expected, there was
no significant difference in the percentage of lymphocytes expressing CD4^ in either
group (L3 CD4+ vs MF CD4^, p= 0.0518; L3 CD4"" vs C CDd"", 0.0518).
Approximately 25% of CD4^ cells from L3 infected mice expressed the activation
marker CD25, while control uninfected mice and MF infected mice express only low
levels of CD25 (-6-7%). This is somewhat surprising, as it might be expected that
infection with MF would cause activation of CD4^ cells. As with CD25, CTLA-4 was
expressed only on a significant percentage of cells from L3 infected mice. Although
CD25 is also a marker of T cell activation, the co-expression of CTLA-4 on a
1 6 5
proportion of the CD25^ population indicates that L3, but not MF, elicit a population of
T cells with some characteristics of T regulatory cells.
5.2.2. L3 induced CD4 CD25 CTLA4^ cells are IL-4 independent
One population of T regulatory cells, the Tli3 cells have been identified in JL-4-/-
animals which suggests that these cells do not require the Th2 pathway to undergo their
process of differentiation (Powiie et al, 1996). It was therefore of interest to carry out
experiments in IL-4-/- mice and compare the results to those previously described from
L3 infected wild-type mice.
(i) IL-10 and TGF-p expression is IL-4 independent
In the first analysis, the expression of IL-10 and TGF-p mRNA was quantified from
purified CD4^ or 8220"^ cells from IL-4-/- or WT mice, as described previously.
Following RNA extraction and cDNA synthesis (as described in Materials and Methods
2.6), real-time RT-PCR was carried out on the selected populations. Figure 5.4 showst
IL-10 and TGF-p mRNA expression relative to HPRT in CD4^ and B220^ cells from L3
infected wild-type and IL-4-/- mice. Although levels of IL-10 and TGF-p mRNA were
slightly lower in KG mice vs WT mice, the difference was not significant, suggesting
that the expression of these cytokines are not IL-4 dependent in this model.
(ii) Three-colour FACS analysis of CD4^ cells from L3 infected wild-type and
IL-4-/- mice
Three-colour FACS analysis was carried on splenocytes from L3 infected wild-type and
IL-4-/- mice following in vitro re stimulation with Ag, as described previously. The
1 6 6

FACS plots in Figure 5.5 show data from individual mice, representative of the group,
while Figure 5.6 depicts the mean percentage of CD4^ cells which co-express CD25 and
CTLA-4 in splenocytes from five L3 infected wild-type or IL-4-/- mice. This analysis
demonstrates that there was no difference in the expression of CD25 or CTLA-4 in
CD4" cells from WT or IL-4-/- mice. Both groups of infected animals showed a large
increase in this population compared to their uninfected counterparts (see Figure 5.6).
5.2.3. Investigating the regulatory role of CD25^ cells in vivo
The experiments described above demonstrate that a population of T cells with some of
the characteristics of T regulatory cells was expanded in vitro, only in culture from L3
infected mice. In order to investigate whether these cells were present in vivo and to
investigate their function, further experiments were required. To this end, a neutralizing
Ab (PC61) was used to deplete CD25^ cells in vivo, prior to L3 infection.
(i) Three-colour FACS analysis of CB4^ cells from L3 infected mice given
neutralizing CD25^ Ab (PC61)
In these experiments, mice were treated with 0.5 mg (total protein) of PC61 (anti-CD25
MAb) or 0.5 mg of GL113 (isotype matched control) on days - 4 and -2 prior to s.c.
infection with 50 L3 of B. pahangi Administration of the MAb prior to infection is
important to ensure that T cells activated by infection are not targeted (Onizuka et al,
1999). On day 12 p.i., spleens were harvested and splenocytes cultured in vitro for 72
hours with 10 pg/ml B. pahangi Ag. Three-colour FACS analysis was then carried on
splenocytes from L3 infected mice given either PC61 or GL113, using the combination
of anti-CD4 MAb, anti-CD25 MAb and anti-CTLA-4. The FACS plots in Figure 5.7
show the results from individual mice, with the mean percentages of CDd"*’ cells co
1 6 7

expressing CD25 and CTLA-4 in PC61 treated mice and GL113 treated mice shown in
Figure 5.8. In mice given PC61 MAb, there was a significant reduction in the
percentage of CD4^CD25"*’CTLA-4'^ cells compared to those given the isotype control,
indicating that the Ab was effectively depleting these cells. However, at the dose given,
the PC61 Ab did not completely ablate the CD25^CTLA-4^ population. In most
experiments, -50% reduction in the numbers of these cells was observed.
(ii) Ag-specific and spontaneous proliferation of splenocytes from L3 infected
mice given PC61 and GL113
To determine whether the removal of a significant proportion of the CD25^ CTLA-4^
population had any effect on immune responses, proliferation and cytokine assays were
carried out. Proliferative responses of splenocytes from L3 infected mice given either
PC61 or GL113 were measured over a time course of in vitro culture with medium only
or 10 pg/ml B. pahangi adult Ag. Control mice received HBSS alone. Three
experiments were carried out, each of which gave similar results (see Figure 5.9). Two
points are immediately obvious from this experiment, firstly, levels of Ag-specific
proliferation were significantly higher in splenocytes from mice given PC61 compared
to mice given GL113 after 72 and 96 hours incubation. Secondly, it was notable that
levels of spontaneous proliferation (medium only) were significantly increased in
cultures from PC61 treated mice at all time points. The increase in the levels of Ag-
specific and spontaneous proliferation in cultures from mice depleted of CD25^ cells in
vivo, indicates a regulatory function for this population
1 6 8

(iii) Ag-specific and spontaneous cytokine production of splenocytes from L3
infected mice given PC61 or GL113
Cytokine responses of splenocytes from L3 infected mice given either PC61 or GLl 13
MAb treatment and control iminfected mice were measured after 72 hours of in vitro
culture with medium only or 10 pg/ml B. pahangi adult Ag. The results of a
representative experiment are presented in Figure 5.10. Mice depleted of CD25^cells in
vivo, produced significantly more IL-10 and IL-4 than animals given the isotype control
MAb. There was also a trend for levels of IL-5 to increase but this did not reach
statistical significance. In the experiment shown, splenocytes from mice given the
isotype control Ab secreted low levels of IFN-y, which were not significantly altered in
mice given PC61. Interestingly, cells from PC61 treated mice also produced large
amounts of spontaneous cytokines in medium only cultures. As is shown in Figure 5.11,
spontaneous IL-2 was detected in medium only culture whereas this cytokine is rarely
seen in Ag-stimulated cultures. Table 5.2 shows the results of this experiment as the net
levels of Ag-stimulated and spontaneously produced cytokines from mice depleted of
CD25^ cells prior L3 infection.
1 6 9

A
B
i—a:
4.5 -,CU3:
4 -
2 3.5 -3 -
2 5 ■T
■|2 -
11.5 -
S1
0.5 -0 -
f— 1.8 -,odCU2C 1.6 -2 1.4 -
1 1.2 -1 -
.1 0.8
I 0.6 -
2 0.4CO
u. 0.2 -
g 0 -
CD4 B220
CD4 B220
Figure 5.1. CD4 cells analysed ex vivo from L3 infected mice express more IL-10 and TGF-p mRNA relative to HPRT mRNA than do B cells
Mice were infected s.c. with 50 L3 of B. pahangi or an equal volume of HBSS only (C). At day 12 p.i., splenocytes from L3 infected mice were pooled and magnetically separated into purified CD4^ and B220^ cells. Quantitative RT-PCR was carried out on these cells and levels of IL-10 and TGF-p mRNA were expressed relative to HPRT. Quantitative RT-PCR was carried out using the TaqMan method (as described in Materials and Methods 2.6.2).
170

Figure 5.2. Three colour FACS analysis demonstrates that a population of CD4^ cells which co-express CD25 and CTLA-4 are expanded only in L3 infected mice
Mice were infected s.c. with 50 L3 or 1X10^ MF of B. pahangi, or an equal volume of HBSS only. At day 12 p.i., splenocytes from L3 infected (A), MF infected (B) and FIBSS control mice (C) were cultured with 10 pg/ml B. pahangi adult Ag for 72 hours. Cells were harvested and stained with anti-mouse CD4 MAb, anti-mouse CD25 MAb and anti-mouse CTLA-4 MAb, each bound to a different flurochrome (CD4 - FITC, CD25-PE, CTLA-4-APC). Cells were analysed by flow cytometry using gates set with isotype matched control MAb. Each panel shows the staining profile of an individual mouse from each group. The numbers at the top right hand corner of each panel indicate the percentage of CD4^ cells which are CD25’ and CTLA-4\ These figures are representative of the responses of five animals per group.

L3 B MF
à
CD25 f -
2‘
° , . '■ ................ .....................1 , - ^ r i rrrr.
52
10‘FL2-H
■f1
L- •
lO'’FL2-H
CTLA-4
Control
#
1.43
FL2-H
1 7 1

% CD4' cells coexpressing
CD25 and CTLA-4
9
87 4
6
5
4
3
2 H 1
0
Figure 5.3. L3 infected mice have a higher percentage of CD4 cells which coexpress CD25 and CTLA-4 than MF infected or control animals
Mice were infected s.c. with 50 L3 or 1 X 10 MF of B. pahangi, or an equal volume of HBSS only. At 12 d.p.i. splenocytes from L3 infected (L3), MF infected (MF) and HBSS control mice (C) were cultured with 10 pg/ml B. pahangi adult Ag for 72 hours. Cells were harvested and stained with anti-CD4 MAb, CD25 MAb and CTLA-4 MAb, each bound to a different flurochrome (CD4 - FITC, CD25-PE, CTLA-4-APC). Graph depicts significant differences in the expression of CD4^CD25^CTLA-4^ cells between groups. Statistical analysis was carried out on results from 5 mice per group. Results are expressed as mean percentage of CD4^ cells expressing CD25 and CTLA-4.
L3 VS M F ,p = 0 .0 3 4 L3 vs C,/7=0.034
172

% CD4% CD4
co-expressing CD25
% CD4co-expressing
CTLA-4
% CD4 co-expressing
CD25 CTLA-4
L3 17.7 ± 1.8 24.66 ± 1.17 7.59 ±0.59 6.9 ± 0.44
MF 23 ±2.7 7.93 ±0.65 1.82 ±0.19 1.32 ±0.195
C 20.37 ±0.93 6.77±0.34 3.34 ±0.48 2.13±0.23
Table 5.1. Expression of cell surface markers on the surface of CD4^ cells from splenocytes of L3 and MF infected mice
Mice were infected s.c. with 50 L3 or 1 X 10 MF of B. pahangi, or an equal volume of HBSS only. At 12 d.p.i. splenocytes from L3 infected (L3), MF infected (MF) and HBSS control mice (C) were cultured with 10 pg/ml B .pahangi adult Ag for 72 hours. Cells were harvested and stained with anti-CD4 MAb and CD25 MAb and CTLA-4 MAb, each bound to a different flurochrome (CD4 - FITC, CD25-PE, CTLA-4-APC). Figures shown in Table 5.1 represent the % of splenocytes which express CD4’*', the percentage of CD4^ cells which express CD25^ alone, CTLA-4 alone and the percentage of CD4^ cells which co-express both of these cell surface markers.
1 7 3

IL-IO
14
12
2 10 -
2 6
2 -
□ 1L-4KO
□ WT
aCD4 B220
TGF-p
2 6•■= 5
g '
□ 1L-4RO
□ WT
CD4 B220
Figure 5.4. CD4 cells analyzed ex vivo from L3 infected IL-4-/- mice express equivalent levels of IL-10 and TGF-P mRNA to WT mice
IL-4-/- (IL-4 KO) and wild-type (WT) mice were infected s.c. with 50 L3 of B. pahangi or an equal volume of HBSS only. At day 12 p.i. splenocytes from L3 infected mice were pooled and magnetically separated into purified CD4^ and B220^ cells. Efficiency of the purification was analysed by FACS at > 95%. RT-PCR was carried out on these cells and levels of IL-10 and TGF-p mRNA were expressed relative to HPRT. Quantitative RT-PCR was carried out using the TaqMan method (as described in Materials and Methods 2.6.2).
174

CD25r -
WT
4 r ,. 9.36
# -
: #
■
10‘F L 2 -H
CTLA-4
B
af - 18.31
y : :
’ .A . .
1• ■
1 0 ' 10''F L 2 -H
10A4
Figure 5.5. Three colour FACS labelling shows that a population of CD4 cells which co-express CD25 and CTLA-4 is also expanded in splenocyte cultures from L3 infected IL-4-/- mice
Splenocytes from L3 infected wild type (WT) (A) and IL-4-/- mice (B) were cultured with 10 pg/ml B. pahangi adult Ag for 72 hours. Cells were harvested and stained with anti-mouse CD4 MAb, anti-mouse CD25 MAb and anti-mouse CTLA-4 MAb, each bound to a different flurochrome (CD4 - FITC, CD25-PE, CTLA-4-APC) and analysed by flow cytometry. Gates were set on CD4^ cells and these cells were then analysed for the expression of CD25 and CTLA-4 Each panel shows the staining profile of an individual mouse from each group. The numbers at the top right hand comer of each panel indicate the percentage of CD4^ cells which are CD25^ and CTLA-4^. These figures are representative of the responses of five animals per group.
1 7 5

IT)(NQU
soo%
Tj-QQJo
14
12
10
<hJHUT3§
WTL3 WTC K0L3 KOC
Figure 5.6. Mean percentage of CD4 cells which co-express CD25 and CTLA-4 from L3 infected and control lL-4-/- mice and wild type mice
Splenocytes from L3 infected and control (C) wild type (WT) and IL-4-/- mice (KO) were cultured with 10 pg/ml B. pahangi adult Ag for 72 hours. Cells were harvested and stained with anti-CD4 MAb and CD25 MAb and CTLA-4 MAb, each bound to a different flurochrome (CD4 - FITC, CD25-PE, CTLA-4-APC) and analysed by flow cytometry. Analysis was carried out on results from 5 mice per group for L3 infected animals and results are expressed as mean percentage. Cells pooled from five animals for control animals.
176

G L l 13
CD25
8.5
:
? ' f''Cv»• . /Ac
10 'FL2-W
CTLA-4
PC61
04.5
10'FL2-H
Figure 5.7. Three colour FACS analysis of cells from L3 infected mice given neutralizing CD25 MAb show reduced levels of CD4^ cells which co-express CD25 and CTLA-4
Splenocytes from two groups of mice given GLl 13 (A) or PC61 (B) prior to infection with 50 L3 of B. pahangi, were cultured with 10 pg/ml B. pahangi adult Ag for 72 hours. Cells were harvested and stained with anti-mouse CD4 MAb, anti-mouse CD25 MAb and anti-mouse CTLA-4 MAb, each bound to a different flurochrome (CD4 - FITC, CD25-PE, CTLA-4-APC) and analysed by flow cytometry. Each panel shows the staining profile of an individual mouse from each group. The numbers at the top right hand comer of each panel indicate the percentage of CD4^ cells which are CD25^ and CTLA-4^. These figures are representative of the responses of five animals per group.
177

u
(N801)c
CLX
i
109876543210
1
V.'- \
L3+GL113 L 3 + P C 6 1
Figure 5.8. Three colour FACS analysis of cells demonstrates that administration of CD25 blocking MAb results in a significant decrease in the percentage of CD4 cells co-expressing CD25 and CTLA-4
Splenocytes from two groups of mice given GLl 13 or PC61 prior to infection with 50 L3 of B. pahangi, were cultured with 10 pg/ml B. pahangi adult Ag for 72 hours. C represents responses in control animals. Cells were harvested and stained with antimouse CD4 MAb and anti-mouse CD25 MAb and anti-mouse CTLA-4 MAb, each bound to a different flurochrome (CD4 - FITC, CD25-PE, CTLA-4-APC) and analysed by flow cytometry. Graph displays mean data from a group of five mice.
L3 + PC61 VS L3+ GLl 13,p=0.0122
L3 + PC61 VS C/? = 0.0369
L3 + GL113 VSC/7 = 0.02
178

Figure 5.9. Levels of Ag-specific and spontaneous proliferation of splenocytes from L3 infected mice given neutralizing CD25 MAb are significantly increased compared to those given isotype matched control MAb
Two groups of mice were given either PC61 (L3+PC61) or GLl 13 (L3+GL113) prior to s.c. infection with 50 L3 of B. pahangi. At day 12 p.i., splenocytes from these groups of mice and control mice (C) were cultur ed with medium only and 10 pg/ml B, pahangi adult Ag for 48 (A),72 (B) and 96 (C) hours and proliferative responses were measured. Results are expressed as cpm.
Spontaneous proliferation (medium culture)48 hours p=0.02l6 (L3+PC61 vs L3+GL113)72 hours j?=0.012296 hours p=0.0122 “ “
Ag-speeific proliferation
48 hours /?=0.0947 (L3+PC61 vsL3+GL113) 72 hours/?=0.0122 “ “96 hours p=0.0367 “ “

A
25000
20000
15000
10000
5000
0 [iJL3+PC61 L3+GL113
□ MED
■ Ag
40000
30000
20000
10000 -
L3+PC61 L3+GL113
□ MED
■ A g
E&
C
50000
40000
30000
20000
10000
0
*
a #
□ M ED
■ Ag
L3+PC61 L3+GL113 C
179

Figure 5.10. Ag-stimulated cytokine responses of splénocytes of L3 infected mice given neutralising CD25 MAb are significantly increased compared to those given isotype matched control
Two groups of mice were given PC61 (L3+PC61) or GL113 (L3+GL113) prior to s.c. infection with 50 L3 of 5. pahangi. At 12 d.p.i. splenocytes from these groups of mice and control mice (C) were cultured with 10 pg/ml B. pahangi adult Ag. Ag- specific cytokine responses were measured at 72 hours. Results are expressed as pg/mi and all values represent the mean and standard deviation of five mice per group.
L3+PC61 vs L3+GL113
IL-5, =0.1437IL-4,p=0.0369IL-10,j)=0.0216IFN-y, p =0.8354
* significantly different.

IFN-v IL-4
1200 -,
1000 -
800 -
600
400
200 - 1 0
500 1
400 -T
g 300
200 - { .
100 -
0L3+PC61 L3+GL113 PC61 GL113
IL-10
16000 14000 4 12000
10000
8000 6000 4000 2000 -I
0
ID54500 1 4000 3500
_ 3000 Ë 2500 % 2000
1500 1000 500 H
0
PC61 GL113 L3+PC61 L3+GL113
180

Figure 5.11. Spontaneous cytokine responses of splenocytes from L3 infected mice given neutralising CD25 MAb are significantly increased compared to those given isotype matched control
Two groups of mice were given PC61 (L3+PC61) or GL113 (L3+GL113) prior to s.c. infection with 50 L3 of B. pahangi. At 12 d.p.i. splenocytes from these groups of mice and control mice (C) were cultured with medium only. Spontaneous cytokine responses were measured at 72 hours. Results are expressed as pg/ml and all values represent the mean and standard deviation of five mice per group.

IL-2 I F N - v
700
600
500
g 400
^ 300
200
1000
i 800
PC6I GL113 L3+PC61 L3+GL113
300
250200
150100
500
lL-4 lL-5
8000 7000 6000
_ 5000 & 4000
3000 2000 1000
0
Q.
PC61 GL113 PC61 Œ113
lL-10
1000
800 -
£ 600 -'obD. 400
200 -
0 -13+PC6I L3+GL113
181

Ag-stimulated cytokine levels
(pg/ml)
Spontaneous cytokine levels
(pg/ml)
Net amount of Ag- specific cytoldne
production (pg/ml)
IL-2 0 370.06 -370.06
IFN-y 465.455 724.425 -258.97
IL-4 305.56 110.945 194.055
IL-5 12405.18 4752.275 7652.905
IL-10 3269.1 589.05 2680.05
Table 5.2. Net levels of Ag-specific cytokine production from splenocytes of mice depleted of CD25^ cells prior to infection with L3
A group of mice were given PC61 prior to s.c. infection with 50 L3 of B. pahangi, At day 12 p.i. splenocytes from these groups of mice were cultured with medium only (RPMI+) or with 10 pg/ml B. pahangi adult Ag. Ag-stimulated and spontaneous cytokine responses were measured at 72 hours. To calculate the net amount of Ag-specific cytokine production, levels of spontaneous cytokines were subtracted from levels of Ag- stimulated cytokines. Results are expressed as pg/ml.
1 8 2

5.3. Discussion
Experiments carried out in Chapter 4 indicated that a population of CD4^ cells produced
IL-10 in response to L3 infection, and when IL-IOR was blocked in vivo, increased
levels of Ag-specific proliferation resulted. With recent studies reporting that T cells
cloned from O. volvulus infected individuals bear the characteristics of Trl cells
(produce elevated levels of IL-10, TGF-p and express CTLA-4) (Doetze et a l, 2000;
Satoguina et al., 2002), it was of interest to further characterize the cellular source of
IL-10 in the B. pahangi mouse model. Therefore the experiments outlined in this
Chapter were carried out to investigate if L3 infection resulted in the expansion of Treg
cells and also to define the role of Tregs in L3 infection.
Initial experiments confirmed that CD4^ T cells are the main producers of IL-10, and
also demonstrated that this population express elevated levels of TGF-|3 ex vivo.
Characteristically, these two cytokines are associated with the presence of a regulatory
population of T cells. Trl cells have been shown to produce high levels of IL-10 and
TGF-p (Weiner, 2001), and Tli3 cells produce high levels of TGF-p with varying
amounts of IL-10 (Roncarolo et a l, 2001b). The role of cytokines in the suppressive
mechanisms of CD4^CD25^ cells is controversial. Although these cells do produce IL-
10, it is thought that cell-cell contact is their mode of suppression, with surface bound
TGF-p being implicated (Nalcamura et a l, 2001; Nakamura et a l, 2004). However,
although my results show that the CD4^ population express both cytokines, they do not
determine whether an individual cell co-expresses IL-10 and TGF-p. To confirm if an
individual cell was producing both cytokines, intra-cellular cytokine staining, ELISPOT
or single cell RT-PCR would be required.
1 8 3

Further characterization of the CD4^ population was carried out by examining the cell
surface expression of markers commonly associated with a regulatory phenotype. There
are many markers which have been reported to be associated with Treg cells (GITR,
0X40, LAP) (Read and Powrie, 2001; Nakamura et al. 2004 ). However, the markers I
chose to use in the course of my experiments were CD4, CD25 and CTLA-4. CTLA-4
was selected, as this molecule had been identified previously to be expressed on the
Treg cells identified in the O. volvulus studies (Satoguina et a l, 2002). In addition, a
significant role for CTLA-4 was recently identified in mediating the diminished parasite
Ag-specific hyporesponsiveness observed in W. bancrofti infected individuals. In that
study, the greatest intensity of CTLA-4 expression occurred on CD4'*'CD25'^ cells (Steel
and Nutman, 2003). In splenocyte culture from L3 infected mice there was a significant
expansion of CD4^ cells which co-expressed CD25 and CTLA-4, compared to cells
from MF infected or control animals. This was, therefore, a strong indication that the L3
of B. pahangi elicited a population of Treg-like cells in the mouse model. It was also
observed that the percentage of activated cells (CD25‘ ) was much higher in L3 infected
animals compared to MF infected animals, as was the proportion of cells expressing
CTLA-4. This is not surprising, as cells which have been activated express elevated
levels of CTLA-4 after stimulation. However when CD4 cells co-express both
molecules, it suggests that these cells may be regulatory in function. These results are
intriguing, in that these cells are not expanded in MF infected mice, whereas the most
significant down-regulation in proliferation seen in human studies is in MF+ patients.
Also, CD25 is a marker of activation, yet in MF infected mice, the expression of this
marker was not up-regulated. However, previous studies have shown that CD4^ cells are
clearly activated in MF infected mice, as demonstrated by their ability to produce Ag-
specific IFN-y (Jenson et a l, 2002) and also to express high levels of an alternative
1 8 4

marker of activation, CD44 (O'Connor and Devaney, 2002).These results suggest that
the L3 and MF stages of the parasite use different mechanisms to down-regulate
immune responses, at least in the mouse. However the situation is bound to be more
complex in infected humans, who are exposed to multiple life cycle stages
simultaneously.
To further characterize these cells, parallel experiments were carried out in IL-4-/- mice.
Previous studies showed that IL-4 was not required for the development of a population
of Treg cells which down-regulated the effects of Thl-mediated colitis in the mouse.
This effect was dependent on TGF-p, but these cells did not require IL-4 (Powrie et al.,
1996). Therefore RT-PCR was carried out on purified CD4^ and 3220"*' cells from WT
and IL-4-/- mice infected with L3 to detect levels of IL-10 and TGF-p mRNA
expression. These experiments showed that there was no significant difference in
mRNA levels for either cytokine in the CD4^ population, supporting the hypothesis that
these cytokines are being produced by T cells other than Th2 cells. However, Th2 cells
can expand via an IL-4 independent pathway (Fluang et a l, 1997; Bird et a l, 1998;
Kropf et a l, 1999) therefore, further experiments would be required to formally prove
that IL-10 and TGF-P are expressed by Treg cells. For example, it would be possible to
distinguish between Th2 and Treg cells by using RT-PCR to detect Foxp3, the
transcription factor associated with Treg cells (O'Garra and Vieira, 2003; Sakaguchi,
2003) or ST2L which is a marker for Th2 cells (Kropf et a l, 1999). However, further
experiments carried out in IL-4-/- mice demonstrated that there was similar expansion
of CD4'^CD25'^CTLA-4^ cells in splenocyte cultures from these animals compared to
infected WT mice, lending fuither support to the hypothesis that these cells are a
regulatory population, that may express IL-10 and TGF-p.
1 8 5

In order to investigate the function of these cells in L3 infected mice, depletion
experiments were carried out using an Ah (PC61), which eliminates CD25'*' cells. It was
important to administer this Ab prior to infection, as administration post-infection
would lead to the depletion of activated cells which express CD25 (the a chain of the
high affinity IL-2R) upon activation, whereas administration before infection targets
Treg cells (Sakaguchi et a l, 1995). It is notable that ~ 25% of CD4’*' cells express CD25
post-infection with L3 but only - 7% of this sub-population co-express CTLA-4.
Therefore, cells co-expressing all three markers are a minor population within the
splenocyte cultures from these animals. However results from these experiments
demonstrated that this small population was vital in regulating immune responses to
infection with L3. FACS analysis of splenocyte cultures from animals given PC61,
revealed a significant reduction in the expansion CD4^CD25^CTLA4"^ cells in vitro. In
all experiments there was approximately 50% reduction in the numbers of Treg cells
following administration of PC61. This may relate to the fact that the MAb was not
affinity purified prior to administration. In future experiments, the Ab could be purified
using Protein G columns, which would allow a higher concentration of pure Ab to be
administered and may further reduce expansion of Treg cells. Another interesting point
from these experiments was that the percentage of CD4^CD25^ cells did not decrease in
splenocyte cultures from mice given PC61 (data not shown), indicating that activated
cells were not being deleted. This provides additional confirmation that the depleted
population are regulatory cells, as opposed to activated cells.
Proliferation and cytokine assays were carried out on splenocytes from PC61 treated
animals to investigate whether these cells had a regulatory function. Depletion of Tregs
had a profound effect on immune Ag-specific responses but also affected spontaneous
1 8 6

H
Iresponses (medium only). For example, Ag-specific proliferation was significantly
' Ienhanced in PC61 treated mice. Along with the ability to down-regulate Thl responses,
■4
Treg cells can also suppress Th2 responses (although to a lesser extent) (Cosmi et a l, "%
2003), therefore, increased levels of proliferation observed in PC61 treated mice may
reflect modulation of Th2 responses by Treg cells as proposed by Maziels and
Yazdanbakhsh (2003). In addition, elevated levels of spontaneous proliferation were,n
observed demonstrating an extreme dysregulation in the absence of Treg cells. Similar
results were observed with Ag-specific cytokine responses, where levels of IL-4 and IL-
10 were significantly higher in cultures of splenocytes from mice given PC61. Increased , i■Ï
levels of IL-5 were observed in each experiment but this did not reach statistical
significance, while no effect was observed on levels of IFN-y. In addition, the potent
immunomodulatory effect of these cells was demonstrated by spontaneous cytokine
production in these cultures. In intact mice, spontaneous cytokine production is never
observed. Flowever in mice given PC61, there were elevated levels of each cytokine
(IL-2, IFN-y, IL-4, IL-5, IL-10). Again this illustrates that removal of these regulatory
cells appears to have resulted in major dysregulation of responses. Interestingly, in the
absence of these cells, IL-10 was elevated, suggesting that Treg cells may regulate IL-
10 production by other cell types, such as Th2 cells. These results suggest a complex
network of regulation in which Thl responses ai*e limited by Th2 cells elicited by
helminth infection, with Tregs then preventing an overwhelming Th2 response, which
can also be damaging to the host.
Other parasitic models which have utilized the PC61 Ab to eliminate Treg cells have
shown that the balance between T effector and Treg mechanisms is important for
parasite clearance (Long et al., 2003; Hisaeda et a l, 2004). In addition, in the L. major
1 8 7

system, elimination of CD4^CD25^ cells resulted in a sterile cure with loss of
concomitant immunity. This is a very different model system to that described in this
thesis, as the Belkaid studies deal with a chronic infection where up to 50% of 004^^
cells in the dermis are CD25" cells. In addition, IL-10 produced by these CD4^CD25
cells has been shown to have an important role in parasite persistence. Transfer of
CD4^CD25^ and CD4^CD25' cells from IL-10-/- mice into RAG-/- mice resulted in
complete clearance of parasites. In contrast, when cells from WT mice were implanted,
this resulted in non-healing lesions at the dermal site and maintenance of parasitaemia.
These data indicate that IL-10 may modulate APC function, directly inhibiting IFN-y or
rendering macrophages refractory to activation. Therefore, in this system, IL-10 has a
role in the establisliment of persistent infection, which in the long term results in
concomitant immunity, with benefits to both host and parasite (Belkaid et a l, 2002).
These studies and those presented in this Chapter address the question as to whether
immune suppression elicited by Tregs protects the parasite or the host. This is a difficult
question to answer as maintenance of parasitaemia is required for resistance in the L
major and Plasmodium studies and also for the transmission of the parasite. From these
studies it appears that the presence of Tregs is involved in maintenance of low-level
infection. In the context of lymphatic filaiiasis, there are many outstanding questions.
Do L3 elicit Treg cells in humans? Do these cells regulate immune responses that might
otherwise kill adults and MF? How does protective immunity develop in this situation?
Clearly, to answer these questions, further investigation into the role of Treg cells in
filarial infection is required.
1 8 8

Investigations into the role of Treg cells in infectious disease are only just beginning
(see 5.1) as previously most studies were carried out examining their properties in
autoimmune disease and tumour immunity. Now these cells have been shown to be
involved in parasitic, bacterial and fungal infection. However despite recent advances
there are still many unanswered questions relating to Treg cells. For example, three
different subsets of Treg have been defined, CD4"^CD25^, Trl and Tli3, but there are
many similarities between these groups and further study is required to define their
origins. In terms of helminth infection, the work of van der ICleij and colleagues (2002)
is very important as they identified IL-10 producing Treg cells (which were clearly in a
separate lineage from Th2 cells), the APC driving this population and the molecule
responsible for this immune response. Whether a similar cell type is involved in
initiation of responses that give rise to a Treg population in the L3 infected BALB/c
mouse remains to be seen. Further characterization of these cells and the L3-specific
molecules which induce their development are required.
1 8 9

Chapter 6. B cells modulate immune responses in mice infected with L3
6.1. Introduction
The development of appropriate and effective immune responses requires T cells to
come into contact with antigen-bearing cells of many sorts, such as DC, macrophages
and B cells. Various sub-groups of APC are essential in initiating and directing T cell
responses (as reviewed in the Introduction). APC provide ligands for signalling via the %
TCR by processing and presenting Ag in the form of peptides associated with MHC
class I or II molecules, or lipid molecules bound to CDl proteins. These cells also
deliver a costimulatory signal to the T cell via B7-1 and B7-2 ligation with CD28 on the
surface of the T cell. In addition, DC can influence the pathway of differentiation by the
secretion of cytokines (Banchereau and Steinman, 1998). However, CD4" cells must
also physically associate with Ag-bearing, Ag-receptor activated B cells (Cyster, 1999;
Jenkins et a l, 2001). B cells aie a major component of the adaptive mammalian
immune system as they have the unique ability to secrete immunoglobulins of various
isotypes. Alone, this property ensures that B cells are essential to immunity, but
activated B cells can also produce a variety of chemokines and cytokines and act as
APC. For example, the role of B cells in Ag-presentation has been described in the
NOD mouse model of autoimmune type 1 diabetes. B cells were shown to contribute to
the disease as they have the ability to preferentially trigger pathogenic CD4^ cells
(Silveira et a l, 2002), thus initiating insulitis and sialitis (Noorchashm et a l, 1997). B
cells can act as potent APC, in the main part due to the ability of the Ig receptor to
mediate rapid and specific Ag-uptake (Chesnut and Grey, 1981). Early experiments in B
cell-deficient mice supported the hypothesis that B cells play a significant role in Ag-
presentation required for T cell activation (Hayglass et a l, 1986; Kurt-Jones et a l.
1 9 0

1988). Ron et al (1987) described a major role, for B cells in T cell priming in LN of
mice. Irradiated mice injected i.v. with purified T cells manifested poor T cell priming
in the LN after s.c. injection with Ag. It was reasoned that as B cells are highly radio
sensitive, the lack of B cells resulted in decreased levels of T cell priming. To confirm
this, i.v. injection of B cells into irradiated recipients of T cells led to high priming of T
cells in the LN after s.c. injection of Ag (Ron and Sprent, 1987).
Initital studies into the expression of B7 on the surface of B cells described up-
regulation of this molecule (B7-1 was the only molecule Imown at this time) on the
surface of activated B cells and its ligation with the CD28 receptor on the surface of
naïve T cells. The co stimulatory effect of this interaction was also demonstrated as
stimulation of T cells with B7^ transfected cells resulted in increased proliferation and
production of IL-2 (Linsley et al., 1991). Further studies identified an additional ligand
for CD28 which was constitutively expressed on the surface of DC and expressed on
activated B cells. This molecule was named B7-2 and was shown to co-stimulate naïve
T cells upon exposure to alloantigen. Interestingly, B7-1 was shown to be expressed on
the surface of only a subset of B cells after 48- hours, whereas B7-2 was shown to be
expressed on the surface of the majority of LPS-activated B cells within 6-12 hours
post-stimulation (Lenschow et a l, 1993). In a subsequent study it was shown that naïve
B cells do not express B7-1 and B7-2, but that engagement of the B cell receptor (BCR)
resulted in the rapid up-regulation of B7-2 on the B cell surface. These data help explain
why Ag-pulsed B cells are such potent APC (Lenschow et a l, 1994).
I chose to investigate the properties of B cells in relation to infection with L3 due to a
number of key factors. Firstly, it has been shown previously that B cells preferentially
induce a Th2 type response in OVA-specific clones from lymph node cells, compared to
1 9 1

adherent cells which induce Thl type responses (Gajewski et a l, 1991). Therefore,
there was a possibility that B cells were acting as APC post-infection with L3 in the
mouse model, as splenocytes from infected animals produce high levels of Tli2
cytokines. Secondly, previous data from this model system has shown that infection of
BALB/c mice with the L3 of B. pahangi resulted in inhibited Thl responses. However,
when APC from control mice were added to cultures in place of resident APC, this
inhibition was reversed. Although the phenotype of the suppressive APC was not
identified, it was notable that irradiation of the resident APC resulted in reversal of Thl
inhibition. As mentioned previously, B cells are very sensitive to radiation, suggesting
that B cells may be the suppressive APC in this model system (Osborne and Devaney,
1999). In addition, recent work carried out by Wilson and colleagues, demonstrated that
ES-62, a major ES product of filarial nematodes, has a potent immuno-modulatory
effect on B cells, rendering them hyporesponsive to Ag-stimulation. In addition, a
separate lineage of B cells, B1 cells, has been shown to produce IL-10 in response to
exposure to ES-62 (Wilson et a l, 2003a; Wilson et a l, 2003b) and taken together, these
results suggest that the secreted products of helminth parasites can modulate B cell
responses.
Therefore, the work presented in this chapter aimed to further clarify the role of B cells
in L3 infection, in terms of cytokine production, capacity to proliferate in response to
Ag, and Ag presentation.
1 9 2
6.2. Results
6.2.1. The role of B cells in L3 infection
(i) B cell depletion and pMT experiments
To define the role of B cells in L3 infection, experiments were carried out with groups
of five BALB/c mice injected sub-cutaneously. with 50 L3 of B. pahangi or an equal
volume of HBSS. At 12 dp.i., spleens were removed and B cells were depleted from
single cell suspensions using magnetic beads and a FITC anti-mouse B220 MAb (RA3-
6B2) (see Materials and Methods 2.5.1). The efficiency of the depletion was analysed
by FACS and was greater than, or equal to 95% in all experiments. Proliferation and
cytokine assays were carried out on the remaining depleted populations. In addition,
similar experiments were carried out with groups of five L3 infected B-cell deficient
(pMT) mutant mice on the C57BL/6 background. At 12 d.p.i. spleens were removed
from these animals and the appropriate controls and in vitro analysis was carried out.
(ii) Ag-specific proliferative responses
Proliferative responses of splenocytes from L3 infected mice, pre- and post-depletion of
B cells were measured after 72 hours of in vitro re-stimulation with 10 pg/ml B.
pahangi adult Ag. As shown in the representative experiment in Figure 6.1, depletion of
the B cell population resulted in a decrease in levels of Ag-specific proliferation (62%
decrease in the experiment shown). In tlnee separate experiments, the mean percentage
reduction was 49%± 15.17 compared with whole splenocytes culture (p=0.0809). As in
vitro depletion of B cells had a major effect on Ag-specific proliferation, the role of B
cells in L3 infection was further examined using pMT mice. As illustrated in Figure 6.2,
1 9 3

levels of Ag-specific proliferation were significantly lower (85% reduction) in
splenocytes from L3 infected pMT mice, than in wild type mice (p =0.013). Despite the
fact that the pMT mice are on the C57BL/6 background the results were similai' to those
obtained by depletion of B cells from BALB/c mice. These data suggest that either B
cells may be proliferating in response to re-stimulation with Ag, or that B cells may act
as APC for CD4^ T cell proliferation.
(iii) CFSE labelling of splenocytes from L3 infected mice
In order to define the precise role of B cells in L3 infected BALB/c mice, CFSE staining
was carried out prior to in vitro stimulation of cells with 10 pg/ml B. pahangi adult Ag.
At 96 hours cells were harvested and labelled with anti-CD4 MAb, anti-B220 MAb or
CD8 MAb. The samples were then analyzed by flow cytometry. Figures 6.3 and 6.4
show data from a representative experiment (medium only controls not shown) in which
the proliferation of CD4^, B220^ and CD8^ cells were tracked using CFSE. The FACS
plots in Figure 6.3 are from individual mice, whereas Figures 6.4A and B depict the
mean results from five mice. It can be seen from these Figures that the major cell type
proliferating in response to Ag is in fact the B cell population with proliferating B220^
cells accounting for 17% of the total lymphocyte population. Proliferating CD4^ cells
accounted for ~ 5% and proliferating CD8^ cells only ~ 2.2% of the total lymphocyte
population (Figure 6.4A). When the results are expressed as a percentage of dividing
cells, it is clear that B cells account for the majority of the dividing cells in L3 infected
mice (Figure 6.4B). Therefore it can be concluded that B cells have the ability to
proliferate in response to L3 infection in an Ag-specific manner. These data confirm
findings outlined in 3.2.4, where it was shown that B cells proliferate in response to Ag,
in both WT and IL-4-/- mice.
1 9 4

(iv) Ag-specific cytokine responses after in vitro depletion of B cells
In four separate experiments, the depletion of B cells from splenocytes of L3 infected
mice resulted in decreased levels of Ag-specific cytokines. The results of a
representative experiment are shown in Figure 6.5. As shown previously, levels of IL-
10 were reduced by 40%, results which are similar to those from mRNA expression,
where B cells were shown to account for ~ 40% of IL-10 message. However of all
cytokines measured, levels of IL-5 were most reduced (75% in the experiment shown),
while little difference was recorded in IL-4 levels (22% reduction in the experiment
shown). Levels of IFN-y were increased in two out of four experiments (75% increase in
the experiment shown), while in the remaining two experiments, there was no increase
following B cell depletion. No IL-2 was detected in either group. The mean percentage
decrease/increase in cytokines post-depletion of B cells in several experiments is shown
in Table 6.1 and illustrates a consistent decrease in Th2 cytokines following B cells
depletion.
(v) Ag-specific cytokine responses of L3 infected pMT mice
Cytokine responses of splenocytes from L3 infected and control pMT mice were
examined at 72 hours. As shown in Figure 6.6, levels of IL-10 were reduced by 60% in
the KO mice compared to levels in their wild type counterparts. Flowever, IL-4 and IL-5
remained unchanged between groups. No IL-2 or IFN-y was detected in either group.
The reduction in levels of IL-10 in pMT mice was similar to that described previously
following depletion of B cells from BALB/c mice. However in contrast to the depletion
experiments, there was no difference in levels of IL-5 or IL-4. It is notable that levels of
these cytokines were considerably lower in both pMT mice and their WT counterparts
1 9 5

compared to BALB/c mice. This may be due to the fact that pMT mice aie on the
C57BL/6 background while the depletion experiments were carried out in BALB/c mice
(the parasite induces a stronger Th2 response in the BALB/c mice than in C57BL/6
mice).
6.2.2. Investigating a role for B7 cell surface molecules expressed on B cells
As B cells generate a Th2 like response with model Ag such as OVA, it is possible that
these cells act as APC in mice infected with B. pahangi. An important way in which
APC modulate T cell responses is by the expression of their costimulatory ligands B7-1
and B7-2. Therefore the following experiments examined the role of these molecules in
L3 infection. B7-1 and B7-2 are known to play an essential role in the proliferative
capacity of T cells via interaction with the co stimulatory molecule CD28, so it was of
interest to investigate the possibility of increased expression of these molecules on
splenic cells which had been primed by the L3 compared to that of control animals. MF
infected animals were also included in some of these experiments as these mice display
a different, more Thl-like profile.
(i) B7-1 and B7-2 expression on the surface of B220^ cells
Splenocytes from L3 infected, MF infected and control BALB/c mice were restimulated
in vitro with 10 pg/ml B. pahangi adult Ag for 72 hours. Cells were then harvested and
two-colour FACS analysis was carried out to determine the percentage of B220’ cells
which expressed B7-1 or B7-2. Figure 6.7 shows FACS plots from individual mice,
representative of a group of five. In control animals -7.8% of total lymphocytes co
express B220 and B7-1 while ~ 3.6% co-express B220 and B7-2. Following infection
with L3 the expression of both B7-1 and B7-2 on B cells is up-regulated with -14.8% of
1 9 6

all lymphocytes expressing B7-1 and B220 and 21.7% expressing B7-2 and B220.
Infection with MF results in a similar up-regulation of B7-1 on the surface of B220^
cells (-15.9%) whereas approximately 10.2% of total lymphocytes from these animals
co-express B220 and B7-2. These results indicate that infection with L3 and MF
induces the up-regulation of both B7-1 and B7-2 on the surface of B cells. Flowever the
L3 has the ability to up-regulate B7-2 with approximately double the efficiency of MF.
These data also show that the vast majority of cells which express B7-1 or B7-2 are in
fact B cells, with -90% of B7-2" cells co-expressing B220 and 70% of B7-l^ cells co
expressing B220 (Figure 6.8). However, further analysis of these data indicated that not
all B cells express B7-1 or B7-2 (see Figure 6.7).
(ii) Effect of IL-10 on the expression of B7-1 and B7-2 on the surface of B220^
cells
Previous experiments described in this thesis have shown that neutralizing IL-10 in
vitro has a significant effect on cytokine production in splenocytes culture from L3
infected mice. In addition when IL-IOR was blocked in vivo levels of Ag-specific
proliferation were increased significantly in splenocytes from infected mice. One
mechanism by which IL-10 can affect T cell responses is via its effect on APC, where it
is reported to down-regulate expression of B7-1 and B7-2. To assess the effect of IL-10
on B7-1 and B7-2 in L3 infected mice, experiments were carried out using IL-10-/-
mice and in vitro neutralization of IL-10.
(iii) Effect of in vitro neutralization of IL-10 on B7-1 and B7-2 expression
Splenocytes from L3 infected mice were re-stimulated in vitro for 72 hours with 10
pg/ml B. pahangi adult Ag, Ag plus 1 pg/ml neutralizing IL-10 MAb or Ag plus 1 pg/ml
1 9 7

isotype matched control. Cells were then harvested and two colour FACS analysis was
performed as described previously. The results of these experiments are shown in
Figure 6.9 demonstrate that neutralizing IL-10 results in a small, but significant increase
in the percentage of B cells that express B7-1 and B7-2. Notably and confirming
previous results, in all these experiments more B cells from L3 infected mice express
B7-2 than B7-1. The percentage of lymphocytes which co-express B7-1 or B7-2 and
B220 was increased in cultures where IL-10 was neutralized compared to Ag only or Ag
plus isotype control cultures. Figure 6.10 shows mean results of five mice per group as a
percentage of total lymphocytes which co-express B7-1 or B7-2 and B220.
(iv) B7-1 and B7-2 expression in IL-10-/- mice
During the course of this study, there was an opportunity to infect IL-10-/- mice on the
C57BL/6 background at the University of Manchester. Splenocytes from L3 infected
IL-10-/- mice and their wild type counterparts were re-stimulated in vitro with 10 pg/ml
B. pahangi adult Ag for 72 hours. Cells were then harvested and two-colour FACS
analysis performed as described above. Figure 6.11 shows FACS plots from an
individual WT and IL-10-/- mouse. It can be seen that the expression of both B7-1 and
B7-2 on B cells is elevated in IL-10-/- mice. In addition, B7-2 and in part B7-1 are also
expressed on a significantly higher percentage of non-B cells in IL-10-/- mice. Figure
6.12 shows the mean percentage of total lymphocytes which co-express B220 and B7-1
or B7-2 and demonstrates a number of differences between the groups. L3 infected IL-
10-/- mice express significantly higher levels of both B7-1 and B7-2 compared to L3
infected WT mice, consistent with the role of IL-10 in regulating expression of these
CO stimulatory molecules. Included in Figure 6.12 is data from eontrol animals, which
shows that levels of B7-1 are significantly up-regulated in L3 infected KO animals
1 9 8

compai'ed to control uninfected IL-10-/- mice, whereas this result did not reach
significance in WT animals. However, when examining expression of B7-2 on B cells
from both KO and wild type mice, levels were significantly increased between L3
infected and control animals from both groups of mice.
(v) Effect of neutralizing B7-1 and B7-2 on Ag-specific proliferation
The following experiments were carried out to address the significance of B7-1 and B7-
2 in the regulation of proliferation. As infection with L3 results in a significant up-
regulation of these molecules on the surface of B cells, it was proposed that blocking
the B7-1/2 interaction with CD28 might influence T cell proliferation.
Proliferative responses of splenocytes from L3 infected mice were measured over a time
course from 48 to 96 hours of in vitro re-stimulation with 10 pg/ml B. pahangi adult Ag
in culture containing 1 pg/ml neutralizing B7-1, B7-2 or both MAb or the appropriate
isotype control. Figure 6.13 shows data from 48 and 72 hour cultures. At 48 hours,
levels of Ag-specific proliferation were significantly reduced when either B7-1, B7-2 or
both molecules were neutralized. However, at 72 horns levels of Ag-specific
proliferation were only reduced significantly when B7-2 was neutralized. Neutralization
of both molecules together resulted in reduced levels of proliferation but this failed to
reach statistical significance. By 96 hours, no differences were observed (data not
shown).
(vi) Effect of neutralizing B7-1 and B7-2 on Ag-specific cytokine production
Ag-specific cytokine responses of splenocytes from L3 infected mice were measured
after 72 hours of in vitro re-stimulation with 10 pg/ml B. pahangi adult Ag, Ag plus
1 9 9

1 pg/ml anti-B7-l MAb or Ag plus 1 pg/ml anti-B7-2 MAb or Ag plus both Abs. As
shown in the representative experiment in Figure 6.14, levels of Ag-specific IL-5 were
significantly reduced when B7-2 or both molecules were neutralized together.
Neutralization of B7-1 also reduced levels of IL-5, but this did not reach statistical
significance. Levels of both IL-4 and IL-10 were significantly reduced when B7-1 and
B7-2 were neutralized simultaneously but no significant difference was observed when
either B7-1 or B7-2 was neutralized alone. Interestingly, despite the significant decrease
in Tli2 cytokines observed in these experiments, there was no consequent increase in
Ag-specific IL-2 or IFN-y.
2 0 0

5 . 20000-
5oa -
□ M-l) ■ Ag
UiTEan C n t a n L 3 p o o l4 f io d ls L 3 p o o l-B o d ls
Figure 6.1. Depletion of B cells from splenocytes of L3 infected mice results in reduced levels of Ag-specific proliferation
Mice were infected sub-cutaneously with 50 L3 of B. pahangi or an equal volume of HBSS only (C). At 12 d.p.i. splenocytes from L3 infected mice were pooled and B cells were depleted using MACS anti-FITC beads and magnetic columns. The negative fraction was then re-stimulated in vitro with 10 pg/ml B. pahangi adult Ag. Ag-specific proliferative responses from whole splenocytes from five animals (L3 mean), from pooled cells prior to depletion (L3pool+Bcells) and from splenocytes depleted of B cells (L3pool-Bcells) were measured at 72 hours. Results are expressed as cpm.
201
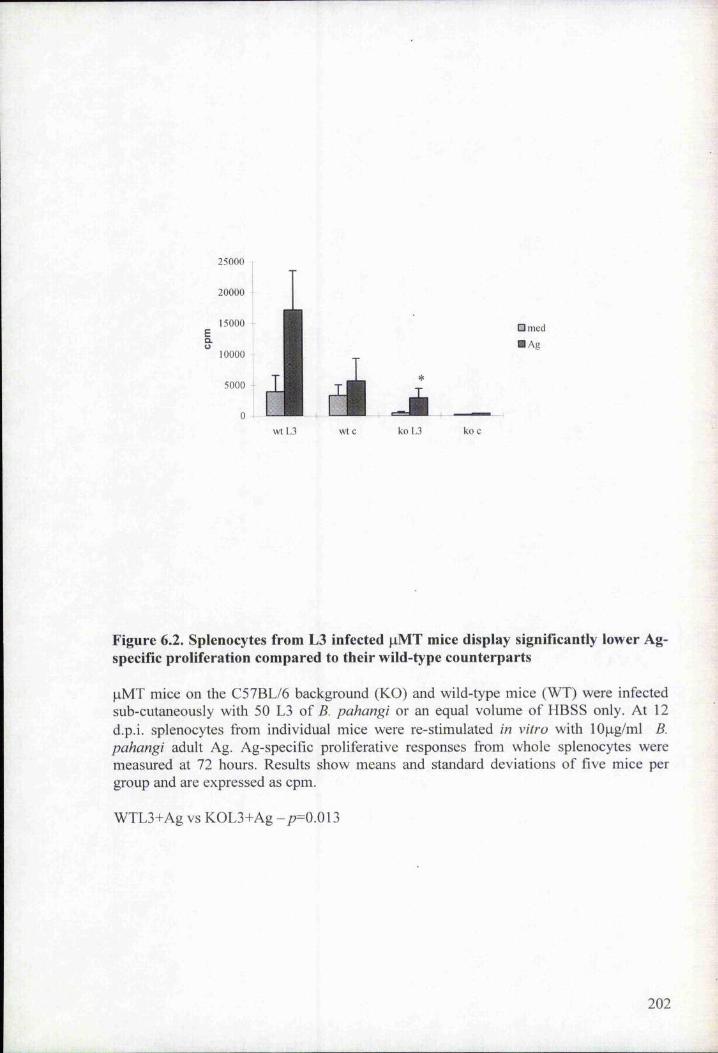
25000
20000 -
15000
wt L3
àwt c
□ med 0 Ag
ko L3 ko c
Figure 6.2. Splénocytes from L3 infected pMT mice display significantly lower Ag- speciflc proliferation compared to their wild-type counterparts
|iMT mice on the C57BL/6 background (KO) and wild-type mice (WT) were infected sub-cutaneously with 50 L3 of B. pahangi or an equal volume of HBSS only. At 12 d.p.i. splenocytes from individual mice were re-stimulated in vitro with lOpg/ml B. pahangi adult Ag. Ag-specific proliferative responses from whole splenocytes were measured at 72 hours. Results show means and standard deviations of five mice per group and are expressed as cpm.
WTL3+Ag vs K0L3+Ag -/7=0.013
202

Figure 6.3. CFSE labelling of cells from L3 infected mice in Ag-stimulated culture shows that B cells proliferate in response to Ag
Splenocytes from BALB/c mice given 50 L3 of B. pahangi (A - C) or an equal volume of HBSS (D - F), were labelled with CFSE and cultured with lOpg/ml B. pahangi adult Ag. Cells were harvested at 96 hours, surface stained with anti-CD4 MAb (A and D) or anti-B220 MAb (B and E) or anti-CD8 (C and F) and analyzed by flow cytometry. Each panel shows the CFSE staining profile of CD4^, B220'*' or CD8^ splenocytes in an individual mouse. The numbers at the top left hand corner of each panel indicate the percentage of CD4^, B220^ or CD8^ cells displaying reduced fluorescence intensity in FL-1, indicating they have divided in Ag-stimulated culture. These figures are representative of the responses of five animals per group.

CDAD
COG
Cc
o
! 0 . 6
■ ' ' % .
■-.r-'o •■•••' •
FL 1-H
B
APCpositivecells
FLNH
B220
i 1 . 5
#~ 1 ■- r t irnti" r Ti>wq~r
F L 1 -H
CDS'
': 'V W
1 0 ' 10‘ 10 '
F L 1-H
?<\L
: 1 . 9 ..■*- :•• ■? ' •
2 # %
F L 1 -H
CFSE
203

A
20oo15
25
15 10s
C D 8+
□ L3
■ C
C D 4+
JB 220+
B
60
50
40
apI 30
I 20
10
0CD8+ CD4+ B220+
Figure 6.4. B cells proliferate in response to L3 infection
Splenocytes from mice given 50 L3 of B. pahangi or an equal volume of HBSS (C), were labelled with CFSE and cultured with 10 pg/ml B. pahangi adult Ag for 96 hours. Cells were harvested, stained with anti-CD4 MAb, anti-CD8 MAb or anti B220 MAb and analysed by flow cytometry. Graph A depicts the mean results of five animals per group, expressed as division of individual cell types as a percentage of total lymphocytes. Graph B depicts the mean results of five animals per group expressed as division of individual cell types as a percentage of dividing cells.
Graph A stats L3 infectedCD8^ division vs CD4'^/? = 0.0122 CD8'’ division vs B220^ p= 0.0122 CD4^ division vs B220^ p= 0.0122
C vs L3 infected C D 8 > = 0.0864 C D 4 > = 0.020 B 220> = 0.020
Graph B stats CD4 vs B220p =0.0122 CD4 VS CD8/7 =0.147 B220 VS CD 8p =0.0216
204

IL-4 IL-5
600 n
«300 -
200 -
00 -
18000 H
16000
14000
12000
Ë 10000
S 8000
6000
4000
2000
0
L3-B L3-B
14000
12000
10000 g 8000
^ 6000
4000
2000
0
lL-10
3500
3000
2500
IFN-y
J c 2000
% 1500
1000 -
j Ë ' 500
4 0
L3 L3-B L3 .3 -0
X
Figure 6.5. Depletion of B cells population from spleens of L3 infected mice results in decreased levels of Ag-specific IL-10 and IL-5
Mice were infected sub-cutaneously with 50 L3 of B. pahangi or an equal volume of HBSS only (C). At 12 d.p.i. splenocytes from L3 infected mice were pooled and B cells were depleted from culture using MACS anti-FITC beads and magnetic columns. The negative fraction was then re-stimulated in vitro with 10 pg/ml B. pahangi adult Ag. Ag-specific cytokine responses from whole splenocytes (L3) and splenocytes depleted of B cells (L3-B) were measured at 72 hours. Results are expressed as pg/ml.
205

IL-4 IL-5 IL-10 IFN-y
% change in cytokine levels post-depletion
of B cells
32+11.3DECREASE
(n-4)
80.5 ±27.5 DECREiASE
(n=4)
53.5 ± 14.85 DECREASE
(n=4)
59.5 ±40.4 INCREASE
(n=2)
Table 6.1. Changes in cytokine levels post-depletion of B cells
Mice were infected sub-cutaneously with 50 L3 of B. pahangi or an equal volume of HBSS only (C). At 12 d.p.i. splenocytes from L3 infected mice were pooled and B cells were depleted from culture using MACS anti-FITC beads and magnetic columns. The negative fraction was then re-stimulated in vitro with 10 pg/ml B. pahangi adult Ag. Ag-specific cytokine responses from whole splenocytes (L3) and splenocytes depleted of B cells (L3-B) were measui'ed at 72 hours. Results are expressed a mean percentage decrease or increase in cytokine levels post-depletion of B cells in four separate experiments, except for IFN-y which is the mean of two experiments.
206

Figure 6.6. Splenocytes from L3 infected pMT mice produce less IL-10 compared to those from L3 infected WT mice
Five pMT mice (KO) (C57BL/6 backgi'ound) and five WT mice (C57BL/6 background) were infected sub-cutaneously with 50 of L3 B. pahangi or an equal volume of HBSS only. At 12 d.p.i., splenocytes from individual mice from each group were restimultated in vitro with lOpg/ml B. pahangi adult Ag. Ag-specific cytokine responses from whole splenocytes were measured at 72 hours. Results show means and standard deviations of five mice per group and are expressed as pg/ml.
IL-10 - WTL3 vs KOL3 = p=0.5403 IL-4 - WTL3 vs KOL3 = p=0.4647 IL-5 - WTL3 vs K0L3 = p=0.3711

IL -4
I
140
120 4 100
80
60
40
20
0
. . . .
WTL3 WTC KOL3
- 1 KOC
lL-5
5000 4500 4000 3500 --
- 3000 -- i 2500 -
2000 -
1500 - 1000 500
0WTL3 WTC K 0L 3.
- I
KOC
IL-10
30000
25000
20000
i 15000
10000
5000
0
‘
a..'
1 ’
1■ L - -
WTL3 WTC KOL3 KOC
207

Figure 6.7. Two colour FACS labelling shows more B220^ cells express B7-1 and B7-2 in L3 and MF infected mice compared to control mice
Mice were infected s.c. with 50 L3 of B. pahangi, or 1 X 10 MF or an equal volume of HBSS only. At day 12 p.i. splenocytes from L3 infected (A and B), MF infected (C and D) and HBSS control mice (E and F) were cultured with 10 pg/ml B. pahangi adult Ag for 72 hours. Cells were harvested and stained with anti-mouse B220 and either anti-mouse B7-1 MAb anti-mouse or B7-2 MAb (B220 - APC, B7-1/B7-2 - FITC). Cells were analysed by flow cytometry. Each panel shows the staining profile of an individual mouse from each group. The numbers at the top right hand corner of each panel indicate the percentage of splenocytes which are B220'" and either B7-1'' or Wl-2^. These figures are representative of the responses of five animals per group.

B7-1 B B7-2
B220+ cells
14.83%
F L 1 -H
15.29%
F L 1 -H
7.81%
21.7%
10FL1+I
10.19%
L3
•*o ' * *""• o '10* lO'^ 10
FL1-H
3.68%
MF
FL1-H FL1-H
B7+ cells
208
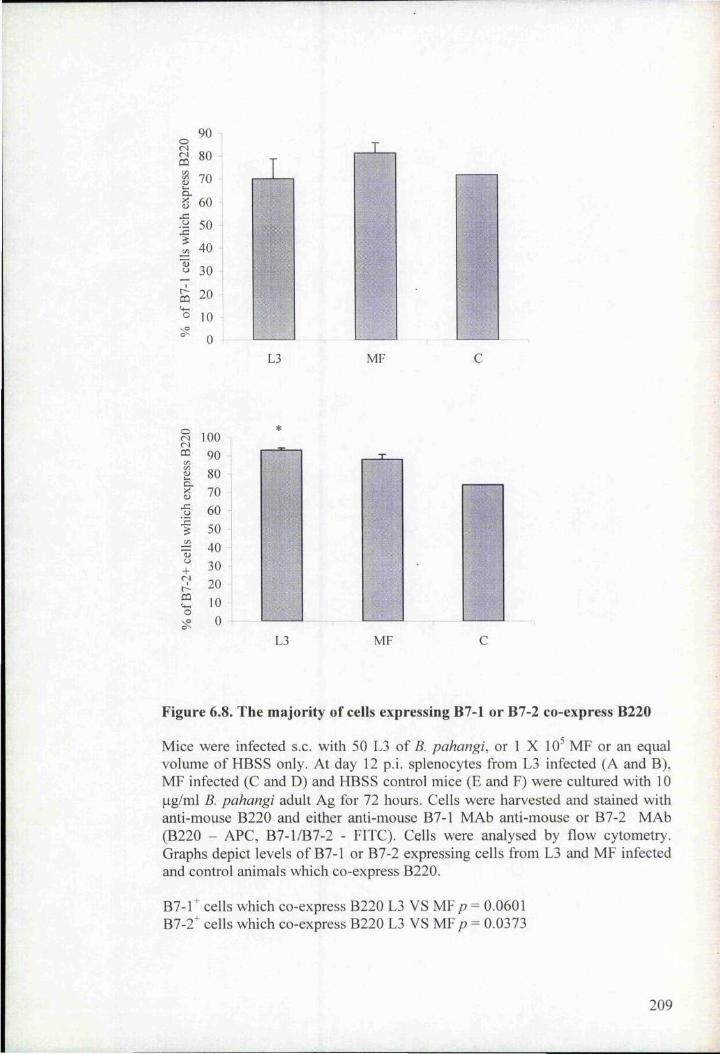
0s 80g 70
g 60j=•J1 40^ 30
20
10
0
CD
I .T
4 L
L3 MF
otN(NCD
j=
+<NC+CD(+-O
100
90 -j 80
70
60
50
40
30
20 10
0
........... T
- Î ■
:c S r i! -,.
1 Î
3 .-; :
L3 MF
Figure 6.8. The majority of cells expressing B7-1 or B7-2 co-express B220
Mice were infected s.c. with 50 L3 of B. pahangi, or 1 X 10 MF or an equal volume of HBSS only. At day 12 p.i. splenocytes from L3 infected (A and B),MF infected (C and D) and HBSS control mice (E and F) were cultured with 10pg/ml B. pahangi adult Ag for 72 hours. Cells were harvested and stained with anti-mouse B220 and either anti-mouse B7-1 MAb anti-mouse or B7-2 MAb (B220 - APC, B7-1/B7-2 - FITC). Cells were analysed by flow cytometry. Graphs depict levels of B7-1 or B7-2 expressing cells from L3 and MF infected and control animals which co-express B220.
B7-l^ cells which co-express B220 L3 VS MF p = 0.0601 B7-2^ cells which co-express B220 L3 VS MF p = 0.0373
209

Figure 6.9. The percentage of B cells which express B7-1 and B7-2 is elevated when IL-10 is neutralized
Mice were infected s.c. with 50 L3 of B. pahangi. At 12 d.p.i., splenocytes (1 x 10^/ml) were re-stimulated in vitro with 10 pg/ml B. pahangi adult Ag (A and D) in the presence of 1 pg/ml neutralizing IL-10 Ab (B and E) or 1 pg/ml isotype matched control (C and F) for 72 hours . Cells were harvested and stained with anti-mouse B220 and either anti-mouse B7-1 MAb (A-C) or anti-mouse B7-2 MAb (D-F) (B220-APC, B7-1/B7-2 - FITC). Cells were analysed by flow cytometry. Each panel shows the staining profile of an individual mouse from each group. The numbers at the top right hand corner of each panel indicate the percentage of splenocytes which are B220'' and either B7-l^ or B7-2'". These figures are representative of the responses of five animals per group.

A B7-1 DB7-2
Ti r r i n ii| I i m u Ull| I IIHI
Ag
F L 1 -H
B
B220+cells
ftwvr I
25.06
I 4ll iil|
Ag + aIL-10
irtf vvin ii|10 10
F L 1 -H
19.34
Ag + isotype C
F L 1 -H
B7+ cells
210

Figure 6.10. Neutralizing IL-10 results in increased levels of B7-1 and B7-2 expression on splenocytes
Mice were infected s.c. with 50 L3 of B. pahangi. At 12 d.p.i,, splenocytes (1 x 10^/ml) were re-stimulated in vitro with 1 Opg/ml B. pahangi adult Ag in the presence of 1 pg/ml neutralizing IL-10 Ab (aIL-10) or 1 pg/ml isotype matched control for 72 hours. Cells were harvested and stained with anti-mouse B220 and either anti-mouse B7-1 Mab (A) or anti-mouse B7-2 Mab (B) (B220 - APC, B7-1/B7-2 - FITC). Cells were analysed by flow cytometry. Graphs depict the mean percentages of splenocytes which are B7-1/2 expressing B220'’ cells from 5 mice per group.
B7-Î expression
L3Agvs L3AIL-10 = 0.0122L3isoc vs L3 AIL-10 = 0.0122
B7-2 expression
L3Ag vs L3AIL-10 = 0.0122 L3isoc vs L3AIL-10 = 0.0601

i 20 18 16 14 12
10 -
8
6 4 2 0
T
L3Ag L3AgfaiL-I0 L3Agfisoc
B
Cû 42
_c
+o
a?
&
30
25 -
20
15
10
0 4—
L3Ag L3Ag+aIL-10 L3Ag+isoc
211

Figure 6.11. The percentage of B cells which express B7-1 and B7-2 is higher in IL-10-/- mice
Wild-type (WT) and IL-10-/- mice were infected s.c. with 50 L3 of B. pahangi. At 12 d.p.i. splenocytes from WT (A and C) and IL-10-/- mice (B and D) were cultured with 10 pg/ml B. pahangi adult Ag for 72 hours. Cells were harvested and stained with anti-mouse B220 and either anti-mouse B7-1 MAh or anti-mouse B7-2 MAb (B220 - APC, B7-1/B7-2 - FITC). Cells were analysed by flow cytometry. Each panel shows the staining profile of an individual mouse from each group. The numbers at the top right hand corner of each panel indicate the percentage of splenocytes which are B220^ and either B7-1'* or B7-2'''. These figures are representative of the responses of five animals per group.

B220+cells
W T B
1 0 ' lO*- 1 0 ' F L 1-H
10' 10‘ 10" F L 1-H
D
IL-10-/-
B7-1
- n - . ■ W f r - r t i i i> i | . ■■■■■j
10^ 10 10^ 10'^ 10^ F L 1 -H
% V T 1 i ii r | ■ r i n n
1 0 ' 10 * 10 ' 10
B7-2
F L 1 -H
B7+ cells
212

Figure 6.12. B7-1 and B7-2 are up-regulated on B cells from IL-10-/- mice
Wild-type (WT) and IL-10-/- (KO) mice were infected s.c. with 50 L3 o f B. pahangi. At day 12 p.i. splenocytes from WT and IL-10-/- mice were cultured with 10 pg/mlB. pahangi adult Ag for 72 hours. Cells were harvested and stained with anti-mouse B220 and either anti-mouse B7-1 MAh (A) or anti-mouse B7-2 MAh (B) (B220 - APC, B7-1/B7-2 - FITC). Cells were analysed by flow cytometry. Graphs depict the mean percentages of splenocytes which are B7-1/2 expressing B220^ cells from 5 mice per group.
B7-1 expression B7-2 expression
K0L3 vs WTL3 = 0.0122 KOL3 vs WTL3 = 0.0122K0L3 vs KOC = 0.02 KOL3 vs KOC = 0.0369WTL3 vs WTC = 0.0814 WTL3 vs WTC = 0.02

16
CL
Où
g■oIIog
o
14
12
= 10 -
6
4 -
0 +
T' '
T 'il .
. -
KOL3 KOC WTL3 WTC
B
occ
gCNfflfe
O
I30
25
20 4
15
10
5
0
T
KOL3 KOC WTL3 WTC
213

Figure 6.13. Neutralizing B7-1 and B7-2 in cultures of splenocytes from L3 infected mice results in significantly reduced levels of proliferation at 48 and 72 hours
Mice were infected sub-cutaneously with 50 L3 .6. pahangi or an equal volume of HBSS only. At 12 d.p.i., splenocytes were re-stimulated in vitro with lOpg/ml B. pahangi adult Ag. Ag-specific proliferative responses were measured at 48 (A) and 72 (B) hours in the presence or absence of 1 pg/ml neutralizing B7-1 (AB71) or/and B7-2 (AB72). Results are expressed as cpm and all values represent the mean and standard deviation of five mice per group.
48 hours 72 houis
Ag vs AB7-1 = 0.0304 Ag vs AB7-1 = 0.67Ag vs AB7-2 = 0.0304 Ag vs AB7-2 = 0.0217Ag vs B71/B72 = 0.0304 Ag vs B71/B72 - 0.0601

A48 hours
45000 40000 35000 30000
E 25000 ^ 20000
15000 10000 5000
0
□ L3
■ c
MED Ag AB71 AB72 AB71/2
B
45000 40000 35000 30000
e 25000o 20000
15000100005000
0
72 hours
Ù -
1
0L 3
D C
MED Ag AB71 AB72 AB71/2
214

Figure 6.14. Neutralizing B7-1 and B7-2 in cultures of splenocytes from L3 infected mice results in significantly reduced levels of specific cytokines
Mice were infected sub-cutaneously with 50 L3 .6. pahangi or an equal volume of HBSS only. At 12 d.p.i., splenocytes (1 x 10^/ml) were re-stimulated in vitro with lOpg/ml B. pahangi adult Ag. Ag-specific cytokine responses were measured at 72 hours in the presence or absence of 1 pg/ml neutralizing B7-1 (AB71) or/and B7-2 (AB72). Results are expressed as pg/ml and all values represent the mean and standard deviation of five mice per group.
IL-5
Ag vs B7-1 = 0.0606 Ag vs B7-2 = 0.0304 Ag vs B7-l/2 = 0.0302
IL-4
Ag vs B7-2 = 0.2101Ag vs B7-I = 0.4 Ag vs B7-1/2 = 0.02
IL-10
Ag vs B7-1 = 0.2101 Ag vs B7-2 - 0.2101 Ag vs B7-l/2 = 0.0373

IL-5
20000 18000 16000 14000
_ 12000 & 10000 8000 6000 4000 2000
0Ag AB7-1 AB7-2 AB7-1/2
IL-4
600
500
400
& 300D,
200
100 H
0
□ L3 ■ C
Ag AB7-1 AB7-2 AB7-1/2
IL-10
7000
6000
5000
Ê 4000'5oo. 3000
2000
1000
0 i
□ L3 me
Ag AB7-1 AB7-2 AB7-1/2
215

6.3. Discussion
The results presented in this chapter indicate that B cells play an important role in the
development of immune responses in mice infected with L3 of B. pahangi via the
ability to proliferate, to act as APC and to produce cytokines. Infection with Brugia L3
results in the up-regulation of Th2 cytokines and good proliferative responses at day 12-
post infection. The contribution of B cells to this response was investigated by either
depleting B cells from culture or by carrying out experiments in B cell deficient mice
(pMT mice on the C57BL/6 background). The results of depletion experiments
indicated that B cells were important in the development of good proliferative responses
in the spleen of infected animals, as there was a 62% reduction in proliferation post
depletion. In vivo experiments in pMT mice gave similar results, in that the proliferative
capacity of splenocytes from L3 infected pMT mice was significantly lower than that of
WT mice. However, these experiments do not identify the precise role of B cells, as
removal of one population of cells may have dramatic effects on the ability of another
population to expand. For example, B cells may proliferate in response to the L3 but
may also act as APC for T cells, as described in other model systems (Noorchashm et
a l, 1997; Silveira et a l, 2002). Therefore, cells from L3 infected and control animals
were labelled with CFSE and cultured for 96 hours to track proliferation of dividing
cells. Data from these experiments revealed that B cells were in fact the major
splenocyte population dividing in response to Ag, confirming previous experiments in
IL-4-/- mice (Chapter 3). Therefore, one explanation for the decrease in proliferation
following depletion or in pMT mice is the lack of B cell expansion.
Similar to this situation, studies on the role of B cells in S. mansoni infected mice have
shown that splenic B220" , CD4', CDS' (B cells) proliferate in response to a sugar found
2 1 6

on soluble egg antigen (SEA) named lacto-N-fucopentaose (LNFPIII) which contains
the trisaccharide Lewis^ Ag. In addition, LNFPIII induced splenic B cells to produce IL-
10 (Veiupillai and Harn, 1994). Whether the L3 of B. pahangi contain similar molecules
that induce B cells to proliferate and produce cytokines is not known. Fmther
experiments in murine S. mansoni infection examined the role of B-1 cells
(CD5'"B220'’) from the peritoneum of infected animals. These cells are autoreactive,
have been shown to produce large amounts of IL-10 and are typically found in the
peritoneal and plural cavities but not in the spleen (O'Garra et a l, 1992). Exposure to
SEA or LNFPIII resulted in elevated numbers of B-1 cells in susceptible hosts (CBA/J,
C3H/HeJ and BALB/c). These studies also identified a role for IL-12, IL-10 and IFN-
Y in regulating the expansion of B-1 cells (Veiupillai et a l, 1996). Although the focus of
these studies was peritoneal B-1 cells, it was also observed that coincident with the
decline in B-1 expansion observed 5 to 6 weeks post-infection, splenic CD23 '"B220'
cells increased from 11% to 30% of total splenocytes. These results indicate that the
expansion of B-1 cells at 2 to 3 weeks post infection may initiate the down-regulation of
Thl responses and that the continued release of IL-10 by splenic B cells during the
acute phase of infection may continue to polarize the immune response towards a Th2
phenotype (Veiupillai et a l, 1997). Therefore, in that model system B cells are
expanding and also producing Th2 enhancing cytokines.
These results are similar' to data presented in this Chapter, in that B cells proliferate in
response to infection with the L3 of B. pahangi and also contribute to the production of
cytokines such as IL-4, IL-5 and IL-10. In the absence of the splenic B cell population,
levels of IL-5 and IL-10 were dramatically reduced, while a more modest effect on IL-4
levels was observed. One interpretation of these results is that B cells are affecting the
2 1 7

ability of T cells to produce Tli2 cytokines, an observation supported by the production
of IFN-y in the absence of these suppressive Th2 cytokines. These results indicate the
importance of B cells in maintaining a Th2 type environment in WT mice. An
alternative explanation is that B cells themselves are a source of Th2 cytokines, as
demonstrated for IL-10 in Chapter 4. Additional studies will be required to address this
point using either TaqMan RT-PCR or ELISPOT. In this study, an interesting
correlation was observed between the strength of the IL-10 response and the production
of IFN-y post-depletion of B cells. For example-, in the experiment shown in Figure 6.5
levels of IL-10 were reduced to approximately 6400 pg/mi post-depletion of B cells. In
the other experiment where IFN-y was detected, levels of IL-10 were reduced to 4000
pg/ml following B cell depletion. However, in the experiments where IFN-y was not
detected following the removal of B cells, IL-10 levels were much higher,
(approximately 20,000 pg/ml post depletion). Thus, it is possible that the intensity of the
IL-10 response determines whether IFN-y is produced or not. The differences in IL-10
levels between experiments may relate to the viability of L3 used or the differences in
the batch of Ag used to re-stimulate the splenocytes.
Interestingly, in L3 infected pMT mice there were no significant differences in cytokine
production compared to WT animals. Presumably in vivo in pMT mice, other cell types
compensate for the lack of B cells by acting as APC for cells. It is notable that
levels of IL-10 and IL-5 were lower in L3 infected pMT mice than in WT mice,
although these differences did not reach statistical significance. In addition, no IFN-
y was detected in the KO animals as was observed in some B cell depletion
experiments. However, these results are complicated by the fact that the pMT mice
available were on the C57BL/6 background while all other experiments used BALB/c
2 1 8

mice. Ideally, further experiments would be carried out using KO mice on the BALB/c
background. Although the removal of B cells results in a decrease in Ag-specific Th2
responses, L3 are still capable of inducing a-Tli2 response in infected pMT mice,
reinforcing the concept that this life cycle stage is important in driving the T helper bias.
The results of this present study are in contrast to the situation observed with T. muris
infection of pMT mice (Blackwell and Else, 2001). These animals were permissive to
infection, producing significantly less IL-4 and IL-5 compared to resistant WT mice. In
addition T. muris infected pMT mice produced increased levels of IFN-y compared to
WT mice indicating that these mice mount a Thl response in the absence of B cells,
thus conferring susceptibility. The importance" of B cells in this model system was
further eonfirmed when it was shown that reconstitution with B cells from WT mice
restores resistance to T. muris, with elevated levels of IL-4 and IL-5.
B cells can modulate the host response to parasitic infection, particularly via their
capacity to produce IL-10. Additionally, B cells may also enhance the production of IL-
10 and Th2 cytokines from other cell types while down-regulating potentially harmful
Thl responses. The role of B cells has been investigated in other parasitic infections
using Xid mice, which are deficient in B-1 cells. Lack of B-1 cells and B-cell derived
IL-10 in mice carrying the Xid immunodeficiency was associated with reduced Th2-
induced granuloma formation in S. mansoni infection (Velupillai ei a l, 1997) and
lowered susceptibility to L major (Floerauf et a i, 1994). The Xid mouse has also been
used in studies on L. sigmodontis. Worm development in susceptible BALB/c mice is
controlled by CD4^ cells and worm loads correlate negatively with Th2 cytokine
production. BALB/c.Xid mice were shown to be more susceptible than WT mice to L3
2 1 9

of L. sigmodontis with a lower Th2 response, which was attributed to the decrease in IL-
10 from B cells (Al-Qaoud et a l, 1998). These studies further support the hypothesis
that B cells are a source of IL-10 in many parasite systems.
One way in which IL-10 modulates the immune response is via the regulation of B7-1
and B7-2 on the surface of APC. The up-regulation of these ligands on the surface of B
cells post-infection with L3 implies that B cells act as APC in this model. As the ligand
for CD28 and CTLA-4, the level of expression of B7-1 and B7-2 on APC is an
important determinant of T cell activation. FACS analysis of splenic B cells illustrated
that infection with L3 resulted in a significant up-regulation in levels of both B7-2 and
B7-1 compared to control animals. In addition there was a significant increase in the
percentage of B220^ cells that express B7-2 in L3 infected mice compared to that of MF
infected mice. Up-regulation of B7-2 is consistent with the observation that L3 elicit a
strong proliferative response and induce Th2 like cytokines in the mouse model.
However in MF infection reduced capacity to up-regulate B7-2 may partially account
for reduced levels of proliferation observed in splenocytes from MF infected animals.
However, expression of B7-1 on the surface of B220^ cells from MF infected mice was
equal to that of L3 infected mice. Co-stimulation via B7-1 has been shown to be
associated with up-regulation of Thl responses (Freeman et a l, 1995; Kuchroo et a l,
1995), therefore this may be a contributing factor to the production of IFN-y in cultures
from MF infected mice. Co-stimulation via B7-2 in L3 infected mice may be a strong
enough stimulus to promote a Th2 over a Thl response.
The role of IL-10 in modulating expression of B7-1 and B7-1 on the surface of B cells
from L3 infected mice was first examined using a neutralizing IL-10 MAb in vitro. It
220

was found that neutralizing IL-10 resulted in significant up-regulation of both B7-1 and
B7-2. These results were further substantiated in a single experiment in which IL-10-/-
mice on the C57BL/6 background were infected with L3 of B. pahangi. B cells from IL-
10-/- animals exhibited elevated levels of both B7-1 and B7-2 compared to those of
their WT counterparts. These data confirm previous findings that IL-10 regulates the
ability of cells to proliferate via its effect on APC. Therefore it is possible that B cells
act in a negative feedback mechanism to restrict Th2 expansion in mice infected with
L3 of Brugia. B cells produce IL-10, which in turn modifies the expression of surface
costimulatory molecules, thus attenuating their own efficiency in presenting Ag to T
cells. This may be a further important mechanism of regulating Th2 responses in
Brugia infection.
To further clarify the role of B7-1 and B7-2 in L3 infection, these molecules were
neutralized in vilro and cytokine and proliferation assays were carried out. When B7-1
and B7-2 were neutralized together there was a significant reduction in proliferation of
splenocytes from L3 infected mice at 48 and 72 hours. The effects of neutralizing B7-1
and B7-2 individually also gave interesting results. When B7-1 was neutralized alone,
proliferation was only significantly reduced at 48 hours and levels recovered after this
time point. However, when B7-2 was neutralized levels of proliferation were
significantly inhibited at 48 and 72 hours. It has been reported previously that B7-1 and
B7-2 deliver different costimulatory signals. Stimulation of naïve T eells with B7-2
results in a more Th2 like response with the production of IL-4, by comparison to
stimulation with B7-1 (Freeman et a l, 1995). With this in mind it is probable that
neutralizing B7-2 will have a greater effect on levels of proliferation in response to the
L3 as this life cycle stage induces Tli2 cells. However the results of these experiments
2 2 1

suggest that B7-1 does play an important role in the co-stimulation of T cells, at least at
48 hours of culture, as a reduction in proliferation was observed at this time point.
Cytokine responses in these cultures were also examined and levels of IL-5, IL-4 and
IL-10 were significantly reduced when B7-1 and B7-2 were neutralized simultaneously.
Only IL-5 was reduced significantly when B7-2 was neutralized alone, whilst
neutralizing B7-1 had no significant effect on any of the cytokines measured (although
levels of IL-5 were reduced, this did not reach statistical significance). As there was no
concurrent increase in the levels of Thl cytokines, it is likely that the reduction in
cytokine levels reflects lower levels of proliferation in these cultures.
The results presented in this chapter highlight the importance of B cells in filarial
infection, in terms of the expression of costimulatory molecule (i.e. acting as APC),
producing anti-inflammatory cytokines and proliferating in response to infection. While
results of the depletion experiments indicate that B cells provide help for Th2 cells,
pMT mice also generate a Th2 response. These results indicate that B cells are not
essential for Th2 generation and provide further evidence for the strong Th2 priming
nature of the L3.
222

C hapter 7. General Discussion
Lymphatic filarial worms have an extraordinary ability to modulate host immune
responses. These long-lived helminth parasites down-regulate pro-inflammatory
iimnune responses (Maizels et a l, 2000), in a maimer which protects the parasite from
being eliminated, but in turn, minimizes severe pathology in the host. PBMC from
infected individuals display a skewing of the immune response, secreting IL-4 and IL-
10 in favour of inflammatory Thl cytokines. IL-4 is the prototype Th2 cytokine and IL-
10, although produced by many cells types, has recently been shown to be produced by
Treg cells (Groux et a l, 1997; Poussât et a l, 2003; Battaglia and Roncarolo, 2004). In
fact, in some studies, neutralizing IL-10 or TGF-P in cultures of PBMC from infected
individuals resulted in elevated levels of proliferation (King et a l, 1993). Therefore,
what was once thought to be a skewing of the immune response towards a Th2
phenotype, is also likely to involve the expansion of regulatory cells; together these
mechanisms will result In the down-regulation Thl responses and suppression of Ag-
speciflc proliferation in infected individuals. However Treg cells suppress both Thl and
Th2 responses and it is equally likely that Treg cells in lymphatic filariasis also function
to suppress over-expansion of Th2 cells, which can also be pathogenic. In endemic
areas some degree of proliferative suppression occurs in each clinical group, even EN
and those who have cleared their parasites (Yazdanbakhsh et a l, 1993a). This suggests
that the L3 may be the cause of this suppression, as all groups are constantly exposed to
incoming infective larvae. In addition, proliferative suppression has been linked to
intensity of L3 transmission, lending further support to the theory that the L3 is a highly
immunoregulatory life cycle stage (King, 2001).
223

Results described in this thesis confirm that the L3 of B. pahangi is a potent modulator
of immune responses in the mouse model. Previous experiments have shown that IL-4
mRNA transcripts can be detected in draining lymph nodes of mice at 24 hour post
infection with L3 (Osborne and Devaney, 1998). In the current study, it was
demonstrated that IL-4 was essential for down-regulating Thl responses, as elevated
levels of IL-2 and IFN-y were detected in splenocytes from L3 infected IL-4-/- mice. In
addition, levels of Ag-specific proliferation were significantly reduced, with B cell and
CD4^ expansion inhibited in the absence of IL-4. These results demonstrate that in WT
mice, L3-driven IL-4 has a major effect on Thl cells. Extrapolation of these results to
humans would suggest that infection with L3 may lead to the development of IL-4
producing cells prior to the establishment of patent adults. Interestingly, in areas of high
transmission of W. bancrofti, plasma IL-4 increases but PBMC derived IL-4 does not,
indicating that IL-4 may be produced by cells other than T cells. In fact, it was shown
that basophils preferentially respond to L3 extracts with IL-4 secretion (King et a l,
2001). As these cells are present in the dermis, events in the skin immediately following
infection may be an important determinant of subsequent responses. The importance of
early events in the skin was well documented in a study by Hogg et al, who
demonstrated that elevated levels of IL-12 were detected in skin-draining lymph nodes
following immunization with irradiated cercariae of S. mansoni. In that study, IL-10
was implicated in the development of immunity, as challenge infection with irradiated
parasites resulted in lower levels of IL-10. IL-10 was also shown to have an important
role in controlling inflammation at the infection site as IL-10-/- mice displayed a
thickening of the dermis with elevated cellular infiltration to the site. Thus, production
of early IL-10 at the site of infection controls Thl events which lead to immunity (Hogg
et a l, 2003). In this study, immune responses were compared in the draining lymph
2 2 4

node and spleen of mice infected by mosquito transmission or syringe inoculation of
L3. No major effect was observed, although it was notable that lymphocytes from mice
that had been infected via mosquito transmission were generally less responsive to Ag
restimulation. However, whether mosquito transmission of L3 is immunologically
“silent” or whether mosquito saliva contains immunomodulatory factors, has yet to be
determined. In light of work carried out in the schistosome model, future studies should
attempt to investigate cytokines and cell types which are present at the site of infection.
Although IL-4-/- mice showed a dramatic change in the immune response to the L3,
there was no difference in worm recovery compared to WT mice . However, there was a
significant difference in the levels of MF produced by adult female worms in IL-4-/-
mice. Therefore, IL-4, or IL-4 driven responses, appears to affect the fecundity of the
adult worm. It is interesting to consider whether IL-4 may have a similar effect in
humans. Although there are no studies that have indicated a direct link between MF
levels and IL-4, a seasonal study of infected individuals showed that MF density
decreased in April to July and increased in July to November. IFN-y levels appeared to
be associated with low parasite density, but a small increase in IL-4 levels was noted
between July and November in MF+ subjects. These results are difficult to interpret as
the numbers of individuals studied was very small and there are known differences in
mosquito biting rates (and presumably transmission of L3) in wet and dry areas
(Sartono et a l, 1999).
Along with IL-4, IL-10 has been implicated in the control of Thl responses (Moore et
al., 2001). As infection of mice with L3 of Brugia leads to elevated levels of IL-10 with
diminished Thl responses, experiments were carried out to determine the role of this
225

inliibitory cytokine. Results from these experiments indicated an important role for IL-y
10 in down-regulating Thl responses and in addition, when IL-IOR was blocked in vivo, j
levels of proliferation were significantly enhanced. This increase in proliferation was,S
found to be CD4 specific, as levels of B cell proliferation were unaffected. These
results are similar to those observed using PBMC from infected humans where
spontaneous and Ag-driven levels of IL-10 correlate negatively with levels of T cells
proliferation (Mahanty et a l, 1996b). Additionally, neutralizing IL-10 resulted in a |4
significant elevation in levels of lymphocyte proliferation to filarial Ag in MF infected5
humans (King et a l, 1993). In the infected human, MF Ag has been implicated in the"I
production of IL-10, but the data presented in this thesis suggest that the L3 is also an
important stage for the induction of an IL-10 response. Although infected humans (who
harbour all life cycle stages) have been shown to express high levels of both
spontaneous and Ag-specific IL-10, it is very difficult to study the human disease in
terms of stage-specific responses and this is where the laboratory animal is extremely
useful. While long-lived adult parasites or MF probably have a role in maintaining the
production of IL-10, which ultimately suppresses damaging Thl responses and T cell
proliferation, the initial life cycle stage which induces IL-10 may be the L3.
In the past, immune responses in lymphatic filariasis used the Thl/Tli2 dichotomy to
explain the down-regulation of IFN-y and proliferation associated with active infection.
However, further studies indicated that lymphatic filariasis did not fit neatly into the
Thl/Tli2 cross-regulation observed in inbred mouse models of parasite infection (Allen
and Maizels, 1997). For example, while IFN- y is clearly suppressed, so is IL-5,
suggesting that both Thl and Tli2 responses are modulated over the course of infection
(Sartono et a l, 1997). Thus, additional mechanisms of suppression have been the focus
226

of recent studies. IL-10 has long been known to be produced by a variety of cell types
(Fiorentino et a l, 1989), However the concept of Treg cells has been the focus of many
recent studies. The suppressive activity of at least two of the Treg subsets (Th3 and Trl
cells) is associated with IL-10 and TGF-p, while the role of cytokines is controversial in
the mode of action of the CD4'^CD25^subset. These cells are thought to function via a
cell-cell contact dependant mechanism, which may involve surface bound TGF-(3 or
CTLA-4. The notion that Treg cells may be elicited in filarial infection is not surprising
as the generation of a suppressive cell type could explain immune responses in infected
individuals. For example, the induction of IL-10 and TGF-p, proliferative
hyporesponsiveness, down-regulation of IFN-y and IL-5 responses and constant
exposure of T cells to parasite Ag all support the hypothesis that filarial worms may
induce Treg cells. The first formal proof of a Treg population in filarial infection came
with the cloning of T cells from PBMC of O. volvulus infected individuals. These T
cell clones had a unique cytokine profile consistent with Trl cells (no IL-2 but high IL-
10 and/or TGF-y6 production) (Doetze el a l, 2000). In addition, CD4’*'CD25’ CTLA-4^
cells have been shown to be important in maintaining the Thl/Th2 balance in W,
bancrofti individuals (Steel and Nutman, 2003). As these are chronic infections of
humans it might be expected that the long-lived adult worms would induce such a
population. Therefore, it was somewhat surprising during the course of these
experiments in L3 infected mice, to identify a population of CD4" cells which co
express CD25^ and CTLA-4^, suggesting that regulatory T cells are being generated in
response to the L3. These cells were not observed in MF infected animals or control
uninfected animals suggesting that, at least in the mouse, this is an L3-specific effect. In
additional experiments, adult worms were implanted into the peritoneal cavity of mice,
but this did not result in the development of these cells in the spleen (data not shown).
227

This observation may be due to the fact that peritoneal implantation does not result in
vigorous immune responses in the spleen. However, CD4^CD25^CTLA4^ cells were
elicited in L3 infected IL-4-/- mice and these mice also had the ability to express IL-10
and TGF-p, demonstrating that these cytokines are being produced via an IL-4
independent pathway. Although the development of Treg cells may be associated with
chronic infection and long-term exposure to Ag, these experiments demonstrate just
how potent the effects of infection with the L3 can be. The profound
immunomodulatory effects of the L3 are also evident in infected humans as
demonstrated in studies in PNG by King et al (2001), who compared immune responses
of individuals from villages with different levels of L3 transmission. Immune responses
were suppressed in individuals from the high transmission village, even when MF and
CFA levels were equivalent, indicating an L3-speciflc effect. Levels of proliferation of
PBMC from individuals from the high transmission village were 11-fold less than that
of those from the low transmission village. A degree of “spill over” was also observed,
as PBMC from individuals in the area of high transmission also had a reduced capacity
to proliferate in response to non-parasite Ag and PHA.
Experiments described in this thesis attempted to demonstrate the regulatory function of
the CD4'CD25^ CTLA-4"'' cells by depletion with an anti-CD25 MAb (PC61). PC61
treatment resulted in a 50% reduction in the expansion of CD4^CD25"''CTLA-4^ T cells
from L3 infected mice and Ag-specific and spontaneous cytokine and proliferative
responses were increased in these cultures. Further studies are required to phenotype the
cells that expand in the absence of Tregs cells, but these are likely to be T cells
(Sakaguchi et a l, 1995). Interestingly, when the Treg population was reduced, elevated
levels of IL-10 were observed. However the depletion of these cells appeared to
228

override any of the effects of IL-10 described previously, i.e. down-regulating Thl
responses and proliferation. These data therefore implicate a Treg population in the
control of immune responses to the L3 and gives rise to an interesting question. Are
these T cells naturally occurring and non-specific or is there a population of Treg cells
which can develop into Ag-specific T cells after exposui'e to L3? Other studies on the
role of Treg cells in bacterial (McGuirk and Mills, 2002) and protozoan infection
(Belkaid et a l, 2002) have also addressed this point, with Belkaid at al defining a
population of L. major Ag-specific CD4'''CD25^ Treg cells at the site of infection
(Belkaid et a l, 2002). In addition, parasites may have the ability to mediate the
conversion of naïve T cells to Treg-like cells by mechanisms, such as that described by
van der Kleij et al In that study DC were shown to induce IL-10 producing Treg cells
when matured in the presence of a lipid fraction from S. mansoni eggs (van der Kleij et
a l, 2002). Further analysis is clearly required of parasite moleeules, which drive this
response, along with more precise characterization of Treg cells.
Other experiments in this thesis aimed to examine to role of B cells in filarial infection,
an area which has been neglected until recently. Both macrophages and DC have been
implicated in driving the characteristic Th2 response elieited by helminth infection. For
example work by the Allen lab has described the development of alternatively activated
macrophages in the peritoneum of C57BL/6 mice infected with L3 or adult worms of B.
malayl These cells were shown to be IL-10 independent and IL-4 dependent, but have
not yet been identified in the spleen or in the BALB/c mouse (MacDonald et a l, 1998;
Alien and Loke, 2001). Alternatively activated macrophages suppress the proliferation
of T cell clones and non-lymphoid cells by a cell-contact dependent mechanism (Loke
et a l, 2000b). DC have also been shown to be important in the generation of a Th2
229

response, as demonstrated by studies using the PC bearing ES62 secreted by A. vitae
(Goodridge et a l, 2001). However, as B cells have been shown to be a source IL-10
preferentially diverting naïve T cells towards the Th2 pathway (Gajewski el a l, 1991),
experiments were carried out to examine the role of these cells In L3 infection. B cells
were shown to be the major proliferating population in splenocyte cultures from L3
infected mice and were shown to be an important source of IL-10. Depletion of B cells
also resulted in diminished levels of IL-4 and IL-5, and interestingly in two out of four
experiments, levels of IFN-y were increased, suggesting that B cells preferentially
inhibit Thl responses by affecting Th2 expansion, perhaps through the production of
IL-10 or via effects on T cells during Ag presentation. To investigate the latter, the
expression of costimulatory molecules B7-1 and B7-2 were measured on the B cell
surface. Firstly it was shown that levels of B7-2 were significantly up-regulated on the
surface of B cells from L3 infected animals compared to MF infected or control mice.
This observation is in keeping with other studies which have demonstrated that B7-2 is
important in the generation of a Th2 response. Another interesting finding in these
experiments was that in L3 infected IL-10-/- mice, or when IL-10 was neutralized in
cultures from L3 infected WT mice, a significant increase in B7-1 and B7-2 was
observed. These results suggest that IL-10 has no preference for either molecule and
demonstrates a mechanism by which IL-10 might be involved in modulating of
proliferative responses in this model system. The production of IL-10 by B cells and
consequent down-regulation in B7-1/2 expression, is proposed to represent a negative
feedback mechanism to control CD4^ responses in the mouse.
One important factor which is missing from these studies is an understanding of the
component/s of the L3 which cause the characteristic skewing of the immune response.
2 3 0

Molecules associated with immunomodulation have been identified in B. malayi from
the EST project (Maizels et a l, 2001). For example a cystatin which interferes with the
MFIC class II pathway, blocking Ag-presentation has been characterized (Manoury et
a l, 2001). A similar molecule is secreted by O. volvulus (onchocystatin) (Schonemeyer
et a l, 2001). B. malayi MF have also been shown to synthesize and release
Prostaglandin E%, and this molecule may have effects on macrophages and DC (Liu et
a l, 1992). Therefore it would be of considerable interest to investigate whether
molecules secreted by the L3 of B. pahangi, are involved in eliciting a population of
Treg-like cells, or inducing the production of high levels of IL-4, TGF-|3 and IL-10.
The results presented in this thesis have identified novel mechanisms by which the L3
modulate immmie responses, particularly with respect to B cell expansion and the
development of a Treg-like population. These data confirm that the L3 use a
multiplicity of mechanisms to influence the host immune response. However it is
important to remember that the L3 can also induce protective immunity in both mice
and man, suggesting that under the appropriate conditions the immune response can
override the modulatory effects of the L3. With the identification of novel molecules
which stimulate protective immunity (Gregory et a l, 2000), the challenge for the future
will be to dissect the mechanistic basis by which the host-parasite interaction results in
a balance between regulatory and effector functions.
2 3 1

1:
References
:5
Afkarian, M., Sedy, J. R., Yang, J., Jacobson, N. G., Cereb, N., Yang, S. Y,, Murphy, T.
L. and Murphy, K. M. (2002). T-bet is a STATl-induced regulator of IL-12R
+expression in naive CD4 T cells. Nat. Immunol. 3: 549-557. J
Agudelo-Silva, F. and Spielman, A. (1985). Penetration of mosquito midgut wall byI
sheathed microfilariae. J. Invertebr. Pathol. 45: 117-119.
Akdis, C., A., Joss, A., Akdis, M., Faith, A. and Blaser, K. (2000). A molecular basis
for T cell suppression by IL-10: CD28-associated IL-10 receptor inlhbits CD28 tyrosine
phosphorylation and phosphatidylinositol 3-kinase binding. F.A.S.E.B.J. 14: 1666-1668.
Alegre, M. L., Noel, P. J., Eisfelder, B. J., Chuang, E., Clark, M. R., Renier, S. L. and
Thompson, C. B. (1996). Regulation of surface and intracellular expression of CTLA4
on mouse T cells. ^ Immunol. 157: 4762-4770.
Allen, J. E., Lawi-ence, R. A. and Maizels, R. M. (1996). APC from mice harbouring the
filarial nematode, Brugia malayi, prevent cellular proliferation but not cytokine
production. Int. Immunol. 8: 143-151.
Allen, J. E. and Maizels, R. M. (1997). Thl-Th2: reliable paradigm or dangerous
dogma? Immunology Today 18: 387-392.
232

Allen, J. E. and Loke, P, N. (2001). Divergent roles for macrophages in lymphatic
filariasis. Parasite Immunol. 23: 345-352.
Al-Qaoud, K., Fleischer, B. and Hoerauf, A. (1998). The Xid defect imparts
susceptibility to experimental murine filariosis- -association with a lack of antibody and
IL-10 production by B cells in response to phosphorylcholine. Int. Immunol. 10: 17-25.
Amaral, F., Dreyer, G., Figueredo-Silva, J., Noroes, J,, Cavalcanti, A., Samico, S.,
Santos, A. and Coutinho, A. (1994). Live adults worms detected by ultrsonography in
human bancroftian filariasis. Xm. J, Trop. Med. Hyg. 50: 753-759.
Artis, D., ITumphreys, N. E., Bancroft, A. J., Rothwell, N. J., Potten, C. S. and Grencis,
R. K. (1999). Tumor Necrosis Factor-a Is a Critical Component of Interleukin 13—
mediated Protective T Helper Cell Type 2 Responses duiing Helminth Infection. J. Exp.
Med. 190: 953-962.
Asadullah, K., Sterry, W., Stephanek, K., Jasulaitis, D., Leupold, M., Audring, H.,
Volk, H.-D. and Docke, W.-D. (1998). IL-10 Is a Key Cytokine in Psoriasis . Proof of
Principle by IL-10 Therapy: A New Therapeutic. Approach. J. Clin. Invest. 101: 783-
794.
Asadullah, K., Sterry, W. and Volk, H, D. (2003). Interleukin-10 Therapy—Review of a
New Approach. Pharmacol. Rev. 55: 241-269.
233
I

Asano, M., Toda, M., Sakaguchi, N. and Sakaguchi, S. (1996). Autoimmune disease as
a consequence of developmental abnormality of a T cell subpopulation. J. Exp. Med.
184: 387-396.
Aseffa, A., Gumy, A., Launois, P., MacDonald, H. R., Louis, J. A. and Tacchini-
Cottier, F. (2002). The Early IL-4 Response to Leishmania major and the Resulting Th2;■!
Cell Maturation Steering Progressive Disease in BALB/c Mice Are Subject to the
Control of Regulatory CD4^CD25^ T Cells. J. Immunol. 169: 3232-3241.
Ash, L. R. and Riley, J. M. (1970). Development of Brugia pahangi in the jird Meriones
unguiculatus with notes on infections in other rodents. J. Parasitai. 56: 962-968.
Atmadja, A. K., Atkinson, R., Sartono, E., Partono, F., Yazdanbakhsh, M. and Maizels,
R. M. (1995). Differential decline in filaria-specific IgGl, IgG4, and IgE antibodies in
Brugia mrz/oyi-infected patients after diethylcarbamine chemotherapy. J. Infect. Dis.
172: 1567-1572.
Attisano, L. and Wrana, J. L. (2002). Signal Transduction by the TGF-|3 Superfamily.
Science. 296: 1646-1647.
Azuma, M., Ito, D., Yagita, H., Okumura, K., Phillips, J. H., Lanier, L. L. and Somoza,
C. (1993). B70 antigen is a second ligand for CTLA-4 and CD28. Nature. 366: 76-79.
Baize, S., Wahl, G., Soboslay, P.T., Egwang, T.G., Georges, A.J. (1997). T helper
responsiveness in human Loa loa infection; defective specific proliferation and cytokine
2 3 4

production by CD4+ T cells from microfîlaraemjc subjects compared with
amicrofilaraemics. Clin. Exp. Immunol. 108: 272-278.
Balmer, P. and Devaney, E. (2002). NK T Cells Are a Source of Early Interleukin-4
following Infection with Third-Stage Larvae of the Filarial Nematode Brugia pahangi.
Infect. Immun. 70: 2215-2219.
Banchereau, J. and Steinman, R. M. (1998). Dendritic cells and the control of immunity.
Nature. 392: 245-252.
Bancroft, A. J., Else, K. J., Sypek, J. P. and Grencis, R. K. (1997). Interleukin-12
promotes a chronic intestinal nematode infection. Eur. J. Immunol. 27: 866-870.
Bancroft, A. J., McKenzie, A. N. J. and Grencis, R. K. (1998). A Critical Role for IL-13
in Resistance to Intestinal Nematode Infection. J. Immunol. 160: 3453-3461.
Bancroft, A. J., Artis, D., Donaldson, D. D., Sypek, J. P. and Grencis, R. K. (2000).
Gastrointestinal nematode expulsion in IL-4 knockout mice is IL-13 dependent. Eur. J.
Immunol. 30: 2083-2091.
Barner, M., Mohrs, M., Brombacher, F. and Kopf, M. (1998). Differences between IL-
4R a-deficient and IL-4-deficient mice reveal a role for IL-13 in the regulation of Th2
responses. Curr. Biol. 8: 669-672.
Battaglia, M. and Roncarolo, M. G. (2004). The role of cytokines (and not only) in
inducing and expanding T regulatory type 1 cells. Transplantation. 77: S I6-18.
235
Ji-

Becher, B., Diirell, B, G. and Noelle, R. J. (2002). Experimental autoimmune
encephalitis and inflammation in the absence of interleukin-12. J. Clin. Invest. 110:
493-497.
■"1 I ;
I3:■!
■ ;
,1Belkaid, Y., Hoffmann, K. F., Mendez, S., Kamhawi, S., Udey, M. C., Wynn, T. A. and I
Sacks, D. L. (2001). The Role of Interleukin (IL)-IO in the Persistence o f LeishmaniaÇ■ ii
major in the Skin after Healing and the Therapeutic Potential of Anti-IL-10 Receptor
Antibody for Sterile Cure. J. Exp. Med. 194: 1497-1506.
Belkaid, Y., Piccirillo, C. A., Mendez, S., Shevach, E. M. and Sacks, D. L. (2002). |'1'
CD4^CD25^ regulatory T cells control Leishmania major persistence and immunity.
Nature. 420: 502-507.
Bird, J. J., Brown, D. R., Mullen, A. C., Moskowitz, N. H., Mahowald, M. A., Sider, J. j'
R., Gajewski, T. F., Wang, C. R. and Reiner, S. L. (1998). Helper T cell differentiation |
is controlled by the cell cycle. Immunity. 9: 229-237.
Bissomiette, E. Y., Rossignol, P. A. and Befiis, A. D. (1993). Extracts of mosquito
salivary gland inhibit tumour necrosis factor a release from mast cells. Parasite
Immunol. 15: 27-33.
Blackwell, N. M. and Else, K. J. (2001). B Cells and Antibodies Are Required for
Resistance to the Parasitic Gastrointestinal Nematode Trichuris muris. Infect. Immun.
69: 3860-3868.
j:
2 3 6

Bozza, M., Soares, M. B., Bozza, P. T., Satoskaf, A. R., Diacovo, T. G., Brombacher,
F., Titus, R. G., Shoemaker, C. B. and David, J. R. (1998). The PACAP-type I receptor
agonist maxadilan from sand fly saliva protects mice against lethal endotoxemia by a
mechanism partially dependent on IL-10. Eur. J. Immunol. 28: 3120-3127.
Bretscher, P. and Cohn, M. (1970). A theory of self-nonself discrimination. Science.
169: 1042-1049.
Bretscher, P. A. (1999). A two-step, two-signal model for the primary activation of
precursor helper T cells. P.A/zt.X 96: 185-190.
Brewer, J. M., Richmond, J. and Alexander, J. (1994). The demonstration of an
essential role for macrophages in the in vivo generation of IgG2a antibodies. Clin. Exp.
Immunol. 97: 164-171.
Brunner, M. C., Chambers, C. A., Chan, F. K.-M., Hanke, J., Winoto, A. and Allison, J.
P. (1999). CTLA-4-Mediated Inliibition of Early Events of T Cell Proliferation. J.
Immunol. 162: 5813-5820.
Buelens, C., Willems, F., Delvaux, A., Pierard, G., Delville, J. P., Velu, T. and
Goldman, M. (1995). Interleukin-10 differentially regulates B7-1 (CD80) and B7-2
(CD86) expression on human peripheral blood dendritic cells. Eur. J. Immunol. 25:
2668-2672.
2 3 7

Burd, P. R., Thompson, W. C., Max, E. E. and Mills, F. C. (1995). Activated mast cells
produce interleukin 13. J. Exp. Med. 181: 1373-1380.
Candolfi, E., Hunter, C. A. and Remington, J. S. (1994). Mitogen- and antigen-specific
proliferation of T cells in murine toxoplasmosis is inlhbited by reactive nitrogen
intermediates. Infect. Immun. 62: 1995-2001.
Carlow, C. K. S., Perrone, R., Spielman, A. and Phillip, M. (1987). A developmentally
regulated surface epitope expressed by the infective larvae of Brugia malayi which is
rapidly lost after infection. Molecular paradigms for erradicating helminth parasites.
Alan R. Inc., New York: 301-310.
Celia, M., Facchetti, F., Lanzavecchia, A. and Colonna, M. (2000). Plasmacytoid
dendritic cells activated by influenza virus and CD40L drive a potent THl polarization.
Nat. Immunol. 1: 305-310.
Chambers, C. A., Sullivan, T. J., Truong, T. and Allison, J. P. (1998). Secondary but not
primary T cell responses are enhanced in CTLA-4-deficient CD8+ T cells. Eur. J.
Immunol. 28: 3137-3143.
Chambers, C. A., Kulms, M. S. and Allison, J. P. (1999). Cytotoxic T lymphocyte
antigen-4 (CTLA-4) regulates primary and secondary peptide-specific CD4^ T cell
responses. P.N.A.S. 96: 8603-8608.
238

Chambers, C. A., Kuhns, M. S., Egen, J. G. and Allison, J. P. (2001). CTLA-4-mediated
inliibition in regulation of T cell responses: mechanisms and manipulation in tumor
immunotherapy. Annu. Rev. Immunol. 19: 565-594.
Chan, S. H., Perussia, B., Gupta, J. W., Kobayashi, M., Pospisil, M., Young, PL A.,
Wolf, S. P., Young, D., Clark, S. C. and Trmchieri, G. (1991). Induction of interferon y
production by natural killer cell stimulatory factor: characterization of the responder
cells and synergy with other inducers. J. Exp. Med. 173: 869-879.
Chen, Q., Ghilardi, N., Wang, H., Baker, T., Xie, M. H., Gurney, A., Grewal, I. S. and
de Sauvage, F. J. (2000). Development of Thl-type immune responses requires the type
I cytokine receptor TCCR. Nature. 407: 916-920.
Cherwinski, H. M., Schumacher, J. H., Brown, K. D. and Mosmann, T. R. (1987). Two
types of mouse helper T cell clone. III. Further differences in lymphokine synthesis
between Thl and Th2 clones revealed by RNA hybridization, functionally monospecific
bioassays, and monoclonal antibodies. J. Exp. Med. 166: 1229-1244.
Chesnut, R. and Grey, H. (1981). Studies on the capacity of B cells to serve as antigen-
presenting cells. J Immunol. 126: 1075-1079.
Cooper, P. J., Espinel, L, Paredes, W., Guderian; R. H. and Nutman, T. B. (1998).
Impaired tetanus-specific cellular and humoral responses following tetanus vaccination
in human onchocerciasis: a possible role for interleukin-10. J. Infect. Dis. 178: 1133-
1138.
239

Cooper, P. J., Espinel, L, Wieseman, M., Paredes, W., Espinel, M., Guderian, R. H. and!
Nutman, T. B. (1999). Human Onchocerciasis and Tetanus Vaccination: Impact on the
Postvaccination Antitetanus Antibody Response. Infect. Immun. 67: 5951-5957.
Cosmi, L., Liotta, F., Angeli, R., Mazzinghi, B., Santarlasci, V., Manetti, R., Lasagni,
L., Vanini, V., Romagnani, P., Maggi, E., Annunziato, F. and Romagnani, S. (2003).
Th2 cells are less susceptible than Thl cells to the suppressive activity of CD25^
regulatory thymocytes because of their responsiveness to different cytokines. Blood. :
[Epub ahead of print].
Cyster, J. G. (1999). Chemokines and Cell Migration in Secondary Lymphoid Organs.
Science. 286: 2098-2102.
Dai, W. J. and Gottstein, B. (1999). Nitric oxide-mediated immunosuppression
following murine Echinococcus multilocularis infection. Immunology. 97: 107-116.
D'Andrea, A., Aste-Amezaga, M., Vallante, N. M., Ma. X„ , Rubin, M. and Trinchieri,
G. (1993). Interleukin 10 (IL-10) inhibits human lymphocyte interferon y-production by
suppressing natural killer cell stimulatory factor/IL-12 synthesis in accessory cells. J.
Exp. Med. 178: 1041-1048.
Day, K. P. (1991). The Endemic Normal in Lymphatic Filariasis: A Static Concept.
Parasitol. Today. 7: 341-343.
2 4 0

Day, K. P., Gregory, W. F. and Maizels, R. M. (1991). Age-specific acquisition of
immunity to infective larvae in a bancrofti an filariasis endemic area of Papua New
Guinea. Parasite Immunol. 13: 277-290.
de Waal Malefyt, R., Figdor, C. G., Huijbens, R., Molian-Peterson, S., Bennett, B.,
Culpepper, J., Dang, W., Zurawski, G. and de Vries, J. E. (1993a). Effects of IL-13 on
phenotype, cytokine production, and cytotoxic function of human monocytes.
Comparison with IL-4 and modulation by IFN-y or IL-10. J. Immunol. 151: 6370-6381.
de Waal Malefyt, R., Yssel, H. and de Vries, J. E. (1993b). Direct effects of IL-10 on
subsets of human CD4^ T cell clones and resting T cells. Specific inliibition of IL-2
production and proliferation. c7 Immunol. 150: 4754-4765.
De Winter, H., Elewaut, D., Turovskaya, O., Huflejt, M., Shimeld, C., ITagenbaugh, A.,
Binder, S., Takahashi, I., Kronenberg, M. and Cheroutre, H. (2002). Regulation of
mucosal immune responses by recombinant interleukin 10 produced by intestinal
epithelial cells in mice. Gastroenterology 122: 1829-1841.
Denham, D. A. and McGreevy, P. B. (1977). Brugian filariasis: epidemiological and
experimental studies. Adv. Parasitol. 15: 243-309.
Denham, D. A., McGreevy, P. B., Suswillo, R. R. and Rogers (1983). The resistance to
re-infection of cats repeatedly inoculated with infective larvae of Brugia pahangi.
Parasitology. 86: 11-18.
2 4 1

Devaney, E., Bancroft, A. and Egan, A. (1993), The effect of irradiation on the third
stage larvae of Brugia pahangi. Parasite Immunol. 15: 423-437.
Dieclanann, D., Bruett, C. H., Ploettner, H., Lutz, M. B. and Schuler, G. (2002). Human
CD4^CD25^ Regulatory, Contact-dependent T Cells Induce Interleukin 10-producing,
Contact-independent Type 1 -like Regulatory T Cells. J. Exp. Med. 196: 247-253.
Dimock, K., Eberhard, M. and Lammie, P. (1996). Thl-like antifilarial immune
responses predominate in antigen-negative persons. Infect. Immun. 64: 2962-2967.
Dimock, K. A., Addiss, D. G., Eberhard, M. L. and Lammie, P. J. (1994). Differential
proliferative and interleukin-10 responses to fractionated filarial antigens: preferential
recognition by patients with chronic lymphatic dysfunction. J. Infect. Dis. 170: 103-412.
Ding, L., Linsley, P., Huang, L., Germain, R. and Shevach, E. (1993). IL-10 inhibits
macrophage costimulatory activity by selectively inliibiting the up-regulation of B7
expression. J. Immunol. 151: 1224-1234.
:■t;
3
I
Dent, A. L., Doherty, T. M., Paul, W. E., Sher, A. and Staudt, L. M. (1999). BCL-6-
Deficient Mice Reveal an IL-4-Independent, STAT6-Dependent Pathway That Controls
Susceptibility to Infection by Leishmania major. J. Immunol. 163: 2098-2103.
Devaney, E. and Jecock, R. M. (1991). The expression of the Mr 30,000 antigen in the■ 1.3
third stage larvae o f Brugia pahangi. Parasite Immunol. 13: 75-87.
2 4 2

Doetze, A., Satoguina, J., Burchard, G., Ran, T., Loiiger, C., Fleischer, B. and Hoerauf,
A. (2000). Antigen-specific cellular hyporesponsiveness in a chronic human helminth
infection is mediated by T(h)3/T(r)l-type cytokines IL-10 and transforming growth
factor-(3 but not by a T(h)l to T(h)2 shift. Int. Immunol 12: 623-30.
Doyle, A. G., Herbein, G., Montaner, L. J., Minty, A. J., Caput, D., Ferrara, P. and
Gordon, S. (1994). Interleukin-13 alters the activation state of murine macrophages in
vitro: comparison with interleukin-4 and interferon-y. Eur. J. Immunol 24: 1441-1445.
Dreyer, G., Ottesen, E. A., Galdino, E., Andrade, L., Rocha, A., Medeiros, Z., Moura,
I., Casimiro, L, Beliz, F. and Coutinho, A. (1992). Renal abnormalities in
microfilarémie patients with Bancroftian Elariasis. J. Trop. Med. Hyg. 46: 745-751.
Dreyer, G. and Piessens, W. F. (2000). Worms and microorganisms can cause
lymphatic disease in residents of filariasis-endemic areas. In Lymphatic Filariasis.
London, Imperial College Press. Nutman, T.B..
Dreyer, G., Addiss, D., Dreyer, P. and Noroes, J. (2002). Basic Lymphoedema
Management, Hollis Publishing Company. Dreyer, G.
Eberhard, M. L. and Lammie, P. J. (1991). Laboratory diagnosis of filariasis. Clin. Lah.
Med. 11: 977-1010.
Else, K. J., Hultner, L. and Grencis, R. K. (1992). Modulation of cytokine production
and response phenotypes in murine trichuriasis. -Parasite Immunol 14: 441-449.
2 4 3

Else, K. J., Finkelman, F. D., Maliszewski, C. R. and Grencis, R. K. (1994). Cytokine-
mediated regulation of clnonic intestinal helminth infection. J. Exp. Med. 179: 347-351.
Evavold, B. D. and Allen, P. M. (1991). Separation of IL-4 production from Th cell
proliferation by an altered T cell receptor ligand. Science. 252: 1308-1310.
Fallarino, F., Fields, P. E. and Gajewski, T. F. (1998). B7-1 engagement of cytotoxic T
lymphocyte antigen 4 inliihits T cell activation in the absence of CD28. J. Exp. Med.
188: 205-210.
Fields, P. E., Finch, R. J., Gray, G. S., Zollner, R., Thomas, J. L., Stminhoefel, K., Lee,
K., Wolf, S., Gajewski, T. F. and Fitch, F. W. (1998). B7.1 Is a Quantitatively Stronger
Costimulus Than B7.2 in the Activation of Naive CD8^ TCR-Transgenic T Cells. J.I
Immunol. 161: 5268-5275. 2
Fiorentino, D. F., Bond, M. W. and Mosmann, T. R. (1989). Two types of mouse T
helper cell. IV. Th2 clones secrete a factor that inhibits cytokine production by Thl
clones, J. Exp. Med. 170: 2081-2095.
Flores Villanueva, P. O., Chikunguwo, S. M., Harris, T. S. and Stadecker, M. J. (1993).
Role of IL-10 on antigen-presenting cell function for schistosomal egg-specific
monoclonal T helper cell responses in vitro and in vivo. J. Immunol. 151: 3192-3198.
244

Flores Villanueva, P. O., Reiser, H. and Stadecker, M. J. (1994). Regulation of T helper
cell responses in experimental murine schistosomiasis by IL-10. Effect on expression of
B7 and B7-2 costimulatory molecules by macrophages. J. Immunol. 153: 5190-5199.
Flores-Villanueva, P. O., Zheng, X. X., Strom, T. B. and Stadecker, M, J. (1996).
Recombinant IL-10 and IL-lO/Fc treatment down-regulate egg antigen-specific delayed
hypersensitivity reactions and egg granuloma formation in schistosomiasis. J. Immunol.
156:3315-3320.
Foussat, A., Cottrez, F., Brun, V., Fournier, N., Breittmayer, J.-P. and Groux, H. (2003).
A Comparative Study between T Regulatory Type 1 and CD4^CD25^ T Cells in the
Control of Inflammation./. Immunol. 171: 5018-5026.
Freedman, D. O., Nutman, T. B. and Ottesen, E. A. (1989). Protective immunity in
hancroftian filariasis. Selective recognition of a 43-kD larval stage antigen by infection-
free individuals in an endemic area. J. Clin. Invest. 83: 14-22.
Freedman, D. O., de Almeida Filho, P. J., Besh, S., Maia e Silva, M. C. and Braga, C.,
Maciel, A. (1994). Lymphoscintigraphic analysis of lymphatic abnormalities in
symptomatic and asymptomatic human filariasis. J. Infect. Dis. 170: 927-933.
Freeman, G. J., Boussiotis, V. A., Anumanthan, A., Bernstein, G. M., Ke, X. Y.,
Rennert,, P.O., G., G .S .,, Gribben, J. G. and Nadler, L. M. (1995). B7-1 and B7-2 do
not deliver identical costimulatory signals, since B7-2 but not B7-1 preferentially
CO stimulates the initial production of IL-4. Immunity. 2: 523-532.
2 4 5

Freeman, G. J., Long, A. J., Iwai, Y., Bourque, K., Chernova, T., Nishimura, H., Fitz, L.
J., Malenkovich, N., Okazaki, T., Byrne, M. C., Horton, H. F., Fouser, L., Carter, L.,
Ling, V., Bowman, M. R., Carreno, B. M., Collins, M., Wood, C. R. and Honjo, T.
(2000). Engagement of the PD-1 Immunoinhibitory Receptor by a Novel B7 Family
Member Leads to Negative Regulation of Lymphocyte Activation. J. Exp. Med. 192:
1027-1034.
Gajewski, T. F., Pinnas, M., Wong, T. and Fitch, F. W. (1991). Murine Thl and Th2
clones proliferate optimally in response to distinct antigen-presenting cell populations.
J. Immunol. 146: 1750-1758.
Giambartolomei, G. FL, Lasater, B. L., Villinger, F. and Dennis, V. A. (2001).
Diminished expression of the costimulatory ligand CD80 (B7.1) gene correlates with
antigen-specific cellular uinesponsiveness in rhesus monlceys with lymphatic filariasis.
Acta. Tropica. 78: 67-71.
Gillespie, Mbow and Titus, R. G. (2000). The immunomodulatory factors of
bloodfeeding artlnopod saliva. Parasite. Immunol 22: 319-331.
Gimmi, C., Freeman, G., Gribben, J., Sugita, K., Freedman, A., Morimoto, C. and
Nadler, L. (1991). B-Cell Surface Antigen B7 Provides a Co stimulatory Signal That
Induces T Cells to Proliferate and Secrete Interleukin 2. P.N.A.S. 88; 6575-6579.
2 4 6

Gleizes, P.-E., Munger, J. S., Nunes, L, Plaipel, J. G., Mazzieri, R., Noguera, I. and
Rifldn, D. B. (1997). TGF-[3 Latency; Biological Significance and Mechanisms of
Activation. Stem Cells 15; 190-197.
Goodridge, H. S., Wilson, E. H., Harnett, W., Campbell, C. C., Flarnett, M. M. and
Liew, F. Y. (2001). Modulation of Macrophage Cytokine Production by ES-62, a
Secreted Product of the Filarial 'N&matode Acanthocheilonema viteae. J. Immunol 167:
940-945.
Gorelik, L., Constant, S. and Flavell, R. A. (2002). Mechanism of Transforming Growth
Factor p-induced Inhibition of T Helper Type 1 Differentiation. J. Exp. Med. 195: 1499-
1505.
Gorelik, L. and Flavell, R. A. (2002). Transforming growth factor-p in T-ceil biology.
Nat. Rev. Immunol. 2: 46-53.
Green, S. J., Meltzer, M. S., Flibbs, J. B. J. andNacy, C. A. (1990). Activated
macrophages destroy intracellular Leishmania major amastigotes by an L-arginine-
dependent killing mechanism. J. Immunol. 144: 278-283.
Gregory, W. F., Atmadja, A. K., Allen, J. E. and Maizels, R. M. (2000). The Abundant
Larval Transcript-1 and -2 Genes of Brugia malayi Encode Stage-Specific Candidate
Vaccine Antigens for Filariasis. Infect. Immun. 68: 4174-4179.
2 4 7

Grogan, J. L., Kremsner, P. G., Deelder, A. M. and Yazdanbakhsh M. (1998). The
effect of anti-IL-10 on proliferation and cytokine production in human schistosomiasis:
fresh versus cryopreserved cells. Parasite Immunol. 20: 345-349.
Groux, H., Bigler, M., de Vries, J. E. and Roncarolo, M. G. (1996). Interleukin-10
induces a long-term antigen-specific anergic state in human CD4" T cells. J. Exp. Med.
184: 19-29.
Groux, H., O'Garra, A., Bigler, M., Rouleau, M., Antonenko, S., de Vries, J. E. and
Roncarolo, M. G. (1997). A CD4^ T-cell subset inhibits antigen-specific T-cell
responses and prevents colitis. Nature. 389: 737-742.
Hall, L. R., Berger, R. B., Diaconu, E. and Pearlnian, E. (2002). Onchocerca volvulus
keratitis (river blindness) is exacerbated in BALB/c IL-4 gene laiockout mice. Cellular
Immunology 216: 1-5.
Harnett, W. and Harnett, M. M. (1993). Inlhbition of murine B cell proliferation and
down-regulation of protein kinase C levels by a phosphorylcholine-containing filarial
excretory-secretory product. J. Immunol. 151: 4829-4837.
Harnett, W., Deehan, M., R.„ Houston, K., M., and Harnett, M., M. (1999).
Immunomodulatory properties of a phosphorylcholine-containing secreted filarial
glycoprotein. Parasite Immunol. 21: 601-608.
2 4 8

Harnett, W. and Harnett, M. M. (1999). Phosphorylcholine: friend or foe of the immune
system?/mmtOTo/. Today. 20: 125-129.
Hayglass, K. T., N ai des, S. J., Scott, C. F. J., Benacerraf, B. and Sy, M. S. (1986). T cell
development in B cell-deficient mice. IV. The role of B cells as antigen-presenting cells
in vivo. J. Immunol. 136: 823-829.
Heath, V. L., Murphy, E. E., Crain, C., Tomlinson, M. G. and O'Garra, A. (2000). TGF- 1
,5
P1 down-regulates Th2 development and results in decreased IL-4-induced STAT6
iactivation and GATA-3 expression. Eur. J. Immunol. 20: 2639-2649.
"I
Helmby, H., Takeda, K., Akira, S. and Grencis, R. K. (2001). Inteiieuldn (IE)-18
Promotes the Development of Chronic Gastrointestinal Helminth Infection by
Dowm-egulating IL-13. J. Exp. Med. 194: 355-364.
Hisaeda, FI., Maekawa, Y., Iwakawa, D. and Okada, FI. (2004). Escape of malaiia
parasites from host immunity requires CD4^CD25^ regulatory T cells. Nat. Med. 10: 29-
30.
Hoerauf, A., Solbach, W., Lohoff, M. and Rollinghoff, M. (1994). The Xid defect
determines an improved clinical course of murine leishmaniasis in susceptible mice. Int.
Immunol. 6: 1117-1124.
249

Hogg, K. G., Kumkate, S. and Mountford, A. P. (2003). IL-10 regulates early IL-12-
mediated immune responses induced by the radiation-attenuated schistosome vaccine.
Int. Immunol. 15: 1451-1459.
Hori, S., Carvalho, T. L. and Demengeot, J. (2002). CD25^CD4^regulatory T cells
suppress CD4^ T cell-mediated pulmonary hyperinflammation driven by Pneumocystis
carinii in immunodeficient mice. Eur. J. Immunol. 32: 1282-1291.
Hori, S., Nomura, T. and Sakaguchi, S. (2003). Control of Regulatory T Cell
Development by the Transcription Factor Foxp3. Science. 299: 1057-1061.
Huang, H., Hu-Li, J., Chen, H., Ben-Sasson, S. and Paul, W. (1997). IL-4 and IL-13
production in differentiated T helper type 2 cells is not IL-4 dependent. J. Immunol.
159: 3731-3738.
Hutloff, A., Dittrich, A. M., Beier, K. C., Eljaschewitsch, B., Kraft, R.,
Anagnostopoulos, I. and Kroczek, R. A. (1999). ICOS is an inducible T-cell co
stimulator structurally and functionally related to CD28. Nature. 21: 263-266.
Inaba, K., Witmer-Pack, M., Inaba, M., Hathcock, K. S., Sakuta, FL, Azuma, M.,
Yagita, FL, Okumura, K., Linsley, P. S. and Ikehara, S. (1994). The tissue distribution
of the B7-2 co stimulator in mice: abundant expression on dendritic cells in situ and
during maturation in vitro. J. Exp. Med. 180: 1849-1860.
2 5 0

Ishida, Y., Agata, Y., Shibahara, K. and Honjo, T. (1992). Induced expression of PD-1,
a novel member of the immunoglobulin gene superfamily, upon programmed cell death.
E.M.B.OJ. 11: 3887-95.
Ito, S., Ansari, P., Sakatsume, M., Dickensheets, PI., Vazquez, N., Donnelly, R. P.,
Lamer, A. C. and Finbloom, D. S. (1999). Interleukin-10 Inhibits Expression of Both
Interferon-a and Interferon-y Induced Genes by Suppressing Tyrosine Phosphorylation
3of STATE Mood 93: 1456-1463.
Itoh, M., Takahashi, T., Sakaguchi, N., Kuniyasu, Y., Shimizu, J., Otsuka, F. and
Sakaguchi, S. (1999). Thymus and Autoimmunity: Production of CD25+CD4+
Naturally Anergic and Suppressive T Cells as a Key Function of the Thymus in
Maintaining Immunologic Self-Tolerance. J. Immunol 162: 5317-5326.
Iwashiro, M., Messer, R. J., Peterson, K. E., Stromnes, I. M., Sugie, T. and Hasenki'ug,
K. J. (2001a). Immunosuppression by CD4^ regulatory T cells induced by chronic
retroviral infection. P.N.A.S. 98: 9226-9230.
Iwashiro, M., Peterson, K., Messer, R. J., Stromnes, I. M. and Hasenlanig, K. J. (2001b).
CD4^ T Cells and y Interferon in the Long-Term Control of Persistent Friend Retrovirus
Infection. J. Virol 75: 52-60.
Jamal, S. and Pani, S. P. (1990). The clincal perspectives and research needs in
lymphatic filariasis. Misc. Publ Vector Control Research Centre 16: 29-41.
251

Jenkins, M. K., Pardoll, D. M., Mizuguchi, J., Chused, T. M. and Schwartz, R. H.
(1987). Molecular events in the induction of a nom’esponsive state in interleukin 2-
producing helper T-lymphocyte clones. P.N.A.S: 84: 5409-5413.
Jenkins, M. K. and Schwartz, R. PI. (1987). Antigen presentation by chemically
modified splenocytes induces antigen-specific T cell unresponsiveness in vitro and in
vivo.J. Exp. Med. 165: 302-319.
Jenkins, M. K., Khoruts, A., Ingulli, E., Mueller, D. P., McSorley, S. J., Reinliardt, R.
P., Itano, A. and Pape, K. A. (2001). In vivo activation of Ag-specific CD4 T cells. Ann.
Rev. Immunol. 19: 23-45.
Jenson, J. S., O'Connor, R., Osborne, J. and Devaney, E. (2002). Infection with Brugia
microfilariae induces apoptosis of CD4^ T lymphocytes; a mechanism of immune
unresponsiveness in filariasis. Eur. J. Immunol. 32; 858-867.
Johnson, E. H., S chynder- Candrian, S., Raj an, T. V., Nelson, F. K., Lustigman, S. and
Abraham, D. (1998). Immune responses to third stage larvae of Onchocerca volvulus in
interferon-y and interleukin-4 laiockout mice. Parasite Immunol. 20: 319-324.
Jonuleit, H., Schmitt, E., Schuler, G., Knop, J. and Enk, A. H. (2000). Induction of
Interleukin 10-producing, Nonproliferating CD4^ T Cells with Regulatory Properties by
Repetitive Stimulation with Allogeneic Immature Human Dendritic Cells. J. Exp. Med.
192: 1213-1222.
252

Kane, M. M. and Mosser, D. M. (2001). The Roie of IL-10 in Promoting Disease
Progression in Leislnnaniasis. J. Immunol. 166: 1141-1147.
Kaplan, M. H., Schindler, U., Smiley, S. T. and Griisby, M. J. (1996), Stat6 is required
for mediating responses to IL-4 and for development of Th2 cells. Immunity. 4; 313-
319.
Karandikar, N. J., Vanderlugt, C. L., Blue stone, J. A. and Miller, S. D. (1998). 3J:
Targeting the B7/CD28 :CTLA-4 co stimulatory system in CNS autoimmune disease. J. ' :
Neuroimmimol. 14: 10-18.
Karavodin, L. M. and Ash, L. R. (1982). Inhibition of adherence and cytotoxicity by
circulating immune complexes formed in experimental filariasis. Parasite Immunol 4:
1- 12 .
Keystone, E., Wherry, J. and Grint, P. (1998). IL-10 as a therapeutic strategy in the
treatment of rhemnatoid artliritis. Rheum. Dis. Clin. North. Am. 24: 629-639.
King, C. L., Kumaraswami, V., Poindexter, R. W., Kumari, S., Jayaraman, K., Ailing,
D. W., Ottesen, E. A. and Nutman, T. B. (1992). Immunologic tolerance in lymphatic
filariasis. Diminished parasite-specific T and B lymphocyte precursor frequency in the
microfilarémie state, d Clin. Invest. 85: 1403-1410.
King, C. L., Mahanty, S., Kumaraswami, V., Abrams, J. S., Regunathan, J., Jayaraman,
K., Ottesen, E. A. and Nutman, T. B. (1993). Cytokine control of parasite-specific
253

anergy in human lymphatic filariasis. Preferential induction of a regulatory T helper
type 2 lymphocyte subset. J. Clin. Invest. 92: 1667-1673.
King, C. L. (2001). Transmission intensity and human immune responses to lymphatic
filariasis. Parasite Immunol. 23; 363-371.
King, C. L., Connelly, M., Alpers, M. P., Bockarie, M. and Kazura, J. W. (2001).
Transmission Intensity Determines Lymphocyte Responsiveness and Cytokine Bias in
Human Lymphatic Filariasis. J. Immunol 166: 7427-7436.
Kitani, A., Fuss, I. J., Nakamura, K., Schwartz, O. M., Usui, T. and Strober, W. (2000).
Treatment of Experimental (Trinitrobenzene Sulfonic Acid) Colitis by Intranasal
Administration of Transforming Growth Factor (TGF)-P 1 Plasmid: TGF-P 1-mediated
Suppression of T Helper Cell Type 1 Response Occurs by Interleukin (IE)-10 Induction
and IL-12 Receptor p 2 Chain Downregulation. J. Exp. Med. 192: 41-52.
Kobayashi, M., Fitz, L., Ryan, M., Hewick, R. M., Clark, S. C., Chan, S., Loudon, R.,
Sherman, F., Perussia, B. and G., T. (1989). Identification and purification of natural
killer cell stimulatory factor (NKSF), a cytokine with multiple biologic effects on
human lymphocytes. J. Exp. Med. 170: 827-845.
Kropf, P., Schopf, L. R., Chung, C. L., Xu, D., Liew, F. Y., Sypek, J. P. and Muller, I.
(1999). Expression of Th2 cytokines and the stable Th2 marker ST2L in the absence of
IL-4 during Leishmania major infection. Eur. J. Immunol 29: 3621-3628.
254

î
Kfummel, M. F. and Allison, J. P. (1995). CD28 and CTLA-4 have opposing effects on
the response of T cells to stimulation. J. Exp. Med. 182: 459-465.
Krummel, M. F. and Allison, J. P. (1996). CTLA-4 engagement inliihits IL-2
accumulation and cell cycle progression upon activation of resting T cells. J. Exp. Med.
183:2533-2540.■
Kubin, M., Kamoun, M. and Trinchieri, G. (1994). Interleukin 12 synergizes with
B7/CD28 interaction in inducing efficient proliferation and cytokine production of *3I
human T cells. J. Exp. Med. 180: 211-222.
Kuchroo, V. K., Das, M. P., Brown, J. A., Ranger, A. M., Zamvil, S. S., Sobel, R. A.,
Weiner, FI. L., Nabavi, N. and Glimcher, L. H. (1995). B7-1 and B7-2 co stimulatory
molecules activate differentially the Thl/Tli2 developmental pathways: application to
autoimmune disease therapy. Cell. 80: 707-718. ;■
Kuhn, R., Lohler, J., Rennick, D., Rajewsky, K. and Muller, W. (1993). Interleukin-10-
deficient mice develop clii'onic enterocolitis. Cell. 75: 263-274.
Kumaraswami, V. (2000). The Clinical Manifestations Lymphatic Filariasis. In
Lymphatic Filariasis. London, Imperial College Press. Nutman, T.B.
Kurt-Jones, E., Liano, D., Hayglass, K., Benacerraf, B., Sy, M. and Abbas, A. (1988).
The role of antigen-presenting B cells in T cell priming in vivo. Studies of B cell-
deficient mice. J. Immunol. 140: 3773-3778.
255

La Flamme, A. C., Patton, E. A. and Pearce, E. J. (2001). Role of F Interferon in the
Pathogenesis of Severe Schistosomiasis in Interleukin-4-Deficient Mice. Infect. Immun.
69: 7445-7452.
Lalitha, P., Ravichandran, M,, suba, S., Kaliraj, P., Narayanan, R. B. and Jayaraman, K.
(1998). Quantitative assessment of circulating antigens in human lymphatic filariasis: a
field evaluation of monoclonal antibody-based ELISA using blood collected on filter
strips. Trop. Med. Int. Health 3: 41-45.
Lammie, P. J., Hitch, W. L., Walker Allen, E. M., Hightower, W. and Eberhard, M, L.
(1991). Maternal filarial infection as risk factor for infection in children. Lancet. 337:
1005-1006.
Lammie, P. J., Hightower, A. W., Richards, F. O. J., Bryan, R. T., Spencer, H. C.,
McNeeley, D. F., McNeeley, M. B. and Eberhard, M. L. (1992). Alterations in filarial
antigen-specific immunologic reactivity following treatment with ivermectin and
diethylcarbamazine. Am J Trop Med LIyg. 46: 292-295.
Latclnnan, Y., Wood, C. R., Chernova, T., Chaudhary, D., Borde, M., Chernova, I.,
Iwai, Y., Long, A. J., Brown, J. A., Nunes, R., Greenfield, E. A., Bourque, K.,
Boussiotis, V. A., Carter, L. L., Carreno, B. M., Malenkovich, N., Nishimura, H.,
Okazaki, T., Honjo, T., Sharpe, A. FI. and Freeman, G. J. (2001). PD-L2 is a second
ligand for PD-1 and inhibits T cell activation. Nat. Immunol. 2: 261-268.
256

Lauiiois, P., Maillard, I., Pingel, S., Swihart, K. G., Xenarios, I., Acha-Orbea, PL,
Diggelmami, PL, Locksley, R. M., MacDonald, H. R. and Louis, J. A. (1997). IL-4
rapidly produced by V p 4 V a 8 CD4^ T cells instructs Th2 development and
susceptibility to Leishmania major in BALB/c mice. Immunity. 6: 541-549.
Lawrence, R. A., Allen, J. E., Osborne, J. and Maizels, R. M. (1994). Adult and
microfilarial stages of the filarial parasite Brugia malayi stimulate contrasting cytokine
and Ig isotype responses in BALB/c mice. J. Immunol. 153: 1216-1224.
Lawrence, R. A., Allen, J. E., Gregory, W. F., Kopf, M. and Maizels, R. M. (1995).
Infection of IL-4-deficient mice with the parasitic nematode Brugia malayi
demonstrates that host resistance is not dependent on a T helper 2-dominated immune
response, d. Immunol. 154: 5995-6001.
Le Goff, L., Loke, P., Ali, H. F., Taylor, D. W. and Allen, J. E. (2000). Interleukin-5 Is
Essential for Vaccine-Mediated Immunity but Not Imiate Resistance to a Filaiial
Parasite. Infect. Immun. 68: 2513-2517.
Le Goff, L., Lamb, T. J., Graham, A. L., Harcus, Y. and Allen, J. E. (2002). IL-4 is
required to prevent filarial nematode development in resistant but not susceptible strains
of mice. Int. J. Parasitol. 32: 1277-1284.
Le Gros, G., Ben-Sasson, S. Z., Seder, R., Finkelman, F. D. and Paul, W. E. (1990).
Generation of interleukin 4 (IL-4)-producing cells in vivo and in vitro: IL-2 and IL-4 are
required for in vitro generation of IL-4-producing cells, d. Exp. Med. 172: 921-292.
257

Lenschow, D., Su, G., Zuckerman, L., Nabavi, N., Jellis, C., Gray, G., Miller, J. and
Bluestone, J. (1993). Expression and Functional Significance of an Additional Ligand
For CTLA-4. P.N.A.S. 90: 11054-11058.
Lenschow, D., Sperling, A., Cooke, M., Freeman, G., Rhee, L., Decker, D., Gray, G.,
Nadler, L,, Goodnow, C. and Bluestone, J. (1994). Differential up-regulation of the B7-
1 and B7-2 costimulatory molecules after Ig receptor engagement by antigen. J.
Immunol. 153; 1990-1997.
Lerner, E., Ribeiro, J., Nelson, R. and Lerner, M. (1991). Isolation of maxadilan, a
potent vasodilatory peptide from the salivary glands of the sand fly Lutzomyia
longipalpis. J. Biol. Chem. 266: 11234-11236.
Letterio, J. J. and Roberts, A. B. (1998). Regulation of immune responses by TGF-p.
Annu. Rev. Immunol. 16.
Levings, M. K., Sangregorio, R., Galbiati, F., Squadrone, S., de Waal Malefyt, R. and
Roncarolo, M.-G. (2001). IFN-a and IL-10 Induce the Differentiation of Human Type 1
T Regulatory Cells. J. Immunol. 166: 5530-5539.
Liew, F. Y., Millott S., Parkinson, C., Palmer, R. M. and Moncada, S. (1990).
Macrophage killing of Leishmania parasite in vivo is mediated by nitric oxide from L-
arginine. J. Immunol. 144: 4794-4797.
258

ILinsley, P., Brady, W., Grosmaire, L., Aruffb, A., Damle, N. and Ledbetter, J. (1991).
■sBinding of the B cell activation antigen B7 to CD28 costimulates T cell proliferation
Iand interleukin 2 ruRNA accumulation. J. Exp. Med. 173: 721-730.
1
Liu, L. X., Buhlmami, J. E. and Weller, P. F. (1992). Release of prostaglandin E2 byI
microfilariae of Wuchereria bancrofti and Brugia malayi. Am. J. Trop. Med. Hyg. 46:
520-523. -I■
sLiu, Y., Wei, S. H., Flo, A. S., de Waal Malefyt and R., M., K.W. (1994). Expression
cloning and characterization of a hmnan IL-10 receptor. J. Immunol. 152: 1821-1829.
Loke, P., MacDonald, A. S. and Allen, J. E. (2000a). Antigen-presenting cells recruitedI
by Brugia malayi induce Th2 differentiation of naive CD4^ T cells. Eur. J. Immunol. y
30: 1127-1135.
Loke, P., MacDonald, A. S., Robb, A., Maizels, R. M. and Allen, J. E. (2000b).
Alternatively activated macrophages induced by nematode infection inhibit proliferation %
via cell-to-cell contact. Eur. J. Immunol. 30: 2669-2678.
Long, T. T. A., Nakazawa, S., Onizuka, S., Huaman, M. C. and Kanbara, H. (2003).
Influence of CD4^CD25^ T cells on Plasmodium berghei NK65 infection in BALB/c
mice. Int. J. Parasitol. 33: 175-183.
Macatonia, S. E., Hosken, N. A., Litton, M., Vieira, P., Hsieh, C. S., Culpepper, J. A.,
Wysocka, M., Trinchieri, G., Murphy, K. M. and O'Garra, A. (1995). Dendritic cells
259

Mahanty, S., Abrams, J. S., Limaye, A. P. and Nutman, T. B. (1991). Linlcage of
interleukin-4 and interleukin-5 production in
+ Iproduce IL-12 and direct the development of Thl cells from naive CD4 T cells. J. A. .
Immunol. 154: 5071-5079.
MacDonald, A. S., Maizels, R. M., Lawrence, R. A., Dransfield, I. and Allen, J. E.
(1998). Requirement for In vivo Production of IL-4, But Not IL-10, in the Induction of
Proliferative Suppression by Filarial Parasites. J. Immunol. 160: 1304-1312.
MacDonald, A. S., Loke P. and Allen, J. E. (1999). Suppressive antigen-presenting cells
in Helminth infection. Pathobiology. 67: 265-268.
i
■I
human helminth infections. Trans. Assoc. Am. Physicians. 104; 296-303.
ÎMahanty, S., King, C. L. and Kmnaraswami (1993). IL-4- and IL-5-secreting
lymphocyte populations are preferentially stimulated by parasite-derived antigens in
human tissue invasive nematode infections. J. Immunol. 151: 3704-3711.
Mahanty, S., Luke, FL E., Kumaraswami, V., Narayanan, P. R., Vijayshekaran, V. and
Nutman, T. B. (1996a). Stage-Specific Induction of Cytokines Regulates the Immune
Response in Lymphatic Filariasis. Experimental Parasitol. 84: 282-290.
Mahanty, S., Mollis, S. N., Ravichandran, M., Abrams, J. S., Kumaraswami, V.,
Jayaraman, K., Ottesen, E. A. and Nutman, T. B. (1996b). High levels of spontaneous
260

and parasite antigen-driven interleukin-10 production are associated with antigen-
specific hyporesponsiveness in human lymphatic filariasis. J. Infect. Dis. 173: 769-773.
Mahanty, S., Ravichandran, M., Raman, U., Jayaraman, K., Kumaraswami, V. and
Nutman, T. (1997). Regulation of parasite antigen-driven immune responses by
interleukin- 10 (IL-10) and IL-12 in lymphatic filariasis. Infect. Immun. 65: 1742-1747.
Mahnke, K., Schmitt, E., Bonifaz, L., Enk, A. H. and Jonuleit, H. (2002). Immature, but
not inactive: the tolerogenic function of immature dendritic cells. Immunol. Cell Biol.
80:477-483.
Maizels, R. M., Sutanto, L, Gomez-Priego, A., Lillywhite, J. and Denham, D. A. (1985).
Specificity of surface molecules of adult Brugia parasites; cross-reactivity with antibody
from Wuchereria, Onchocerca and other human filarial infections. Trop. Med.
Parasitol. 36: 233-237.
Maizels, R. M., Sartono, E., Kimiiawan, A., Partono, F., Selkirk, M. E. and
Yazdanbaklish, M. (1995). T-cell activation and the balance of antibody isotypes in
human lymphatic filariasis. Parasitol. Today. 11: 50-56.
Maizels, R. M., Allen, J. E. and Yazdanbaldish, M. (2000). Immunology of Lymphatic
Filariasis: Current Controversies. In Lymphatic Filariasis. London, Imperial College
Press. Nutman, T.B.
2 6 1

Maizels, R. M., Blaxter, M. L. and Scott, A. L. (2001). Immunological genomics of
Brugia malayi: filarial genes implicated in immune evasion and protective immunity.
Parasite Immunol. 23: 327-344.
Maizels, R. M. and Yazdanbakhsh, M. (2003). Immune regulation by helminth
parasites: cellular and molecular mechanisms. Nat. Rev. Immunol. 3: 733-744.
Maihotra, I., Ouma, J. H., Wamachi, A., Kioko, J., Mungai, P., Njzovu, M., Kazura, J.
W. and King, C. L. (2003). Influence of Maternal Filariasis on Childhood Infection and
Immunity to Wuchereria bancrofti in Kenya. Infect. Immun. 71: 5231-5237.
Manickasingham, S. P., Edwards, A. D., Schulz, O, and Reis e Sousa, C. (2003). The
ability of murine dendritic cell subsets to direct T helper cell differentiation is
dependent on microbial signals. Eur. J. Immunol. 33: 101-107.«1
Manoury, B., Gregory, W. F., Maizels, R. M. and Watts, C. (2001). Bm-CPI-2, a
cystatin homolog secreted by the filarial parasite Brugia malayi^ inhibits class II MHC-
restricted antigen processing. Current Biology 11: 447-451.
Manson, P. (1883). The Filaria Sanuis Hominis H.K. Lewis, London.
Marengere, L. E., Waterhouse, P., Duncan, G. S., Mittrucker, H. W., Feng, G. S. and
Mak, T. W. (1996). Regulation of T cell receptor signaling by tyrosine phosphatase
SYP association with CTLA-4. Science. 212: 1170-1173.
262

Matthews, D. J., Emson, C. L., McKenzie, G. J., John, H. E., Blackwell, J. M. and
McKenzie, A. N. J. (2000). IL-13 Is a Susceptihility Factor for Leishmania major
Infection, d Immunol 164: 1458-1462.
McGuirk, P. and Mills, K. H. G. (2002). Pathogen-specific regulatory T cells provoke a
shift in the Thl/Tli2 paradigm in immunity to infectious diseases. Trends in Immunol
23; 450-455.
McHugh, R.S., Whitters, M.J., Piccirillo, C.A., Young, D.A., Shevach, E.M.,
Collins, M., Byrne, M.C. (2002). CD4^CD25^ Immunoregulatroy T cells: Gene
expression analysis reveals a functional role for the Gluccocorticoid-Induced TNF
Receptor. Immunity. 16: 311-323
McKenzie, G. J., Emson, C.L., Bell, S.E., Anderson, S., Fallon, P., Zurawski, G.,
Murray, R., Grencis, R., McKenzie, A.N. (1998). Impaired development of Th2 cells in
IL-13-deficient mice. Immunity. 9: 423-432.
Michael, E., Bundy, D. A. and Grenfell, B. T. (1996). Re-assessing the global
prevalence and distribution of lymphatic filariasis. Parasitology. 112: 409-428.
Michael, E., Simonsen, P. E., Malecela, M., Jaoko, W. G., Pedersen, E. M., Mukoko,
D., Rwegoshora, R. T. and Meyrowitsch, D. W. (2001). Transmission intensity and the
immunoepidemiology of hancroftian filariasis in East Africa. Parasite Immunol 23:
373-388.
263

Mohrs, M., Ledermaiin, B., Kohler, G., Dorfmuller, A., Gessner, A. and Brombacher, F.:,ï3
(1999). Differences Between IL-4- and IL-4 Receptor a-Deficient Mice in Chronic
Leishmaniasis Reveal a Protective Role for IL-13 Receptor Signaling. J. Immunol. 162:
Romani, L. (2002). B7/CD28-Dependent CD4'^CD25^ Regulatory T Cells Are Essential
Components of the Memory-Protective Immunity to Candida albicans. J. Immunol.
169: 6298-6308.
Montenegro, S. M., Miranda, P., Mahanty, S., Abath, F. G., Teixeira, K. M., Coutinlio,
E. M., Brinkman, J., Goncalves, 1., Domingues, L. A., Domingues, A. L., Sher, A. and
Wymi, T. A. (1999), Cytokine production in acute versus chronic human
Schistosomiasis mansoni: the cross-regulatory role of interferon-y and interleukin-10 in
the responses of peripheral blood mononuclear cells and splenocytes to parasite
antigens, d Infect. Dis. 179: 1502-1514.
Moore, K. W., de Waal Malefyt, R., C., R.L., and O'Garra, A. (2001). Interleukin-10
and the interleukin-10 receptor. Annu. Rev. Immunol. 19: 683-765.
Moore, S. J. and Copeman, D. B. (1994). A highly specific and sensitive monoclonal
antibody-based ELISA for the detection of circulating antigen in hancroftian filariasis.
Trop. Med. Parasitol. 41: 403-406.
7302-7308.iI
Montagnoli, C., Bacci, A., Bozza, S., Gaziano, R., Mosci, P., Sharpe, A. H. and
264

Moser, R., Groscurth, P., Carballido, J. M., Bruijnzeel, P. L., Blaser, K., ITeusser, C. H.
and Fehr, J. (1993). Interleukin-4 induces tissue eosinophilia in mice: correlation with
its in vitro capacity to stimulate the endothelial cell-dependent selective transmigration
of human eosinophils, d Lah. Clin. Med. 122: 567-575.
Mosmann, T. R., Cherwinski, H., Bond, M. W., Giedlin, M. A. and Coffinan, R. L. î
(1986). Two types of murine helper T cell clone. I. Definition according to profiles of
lymphokine activities and secreted proteins, d Immunol. 136: 2348-2357.
:
Mosmann, T. R. and Coffman, R. L. (1989). THl and TH2 cells: different patterns of
lymphokine secretion lead to different functional properties. Annu. Rev. Immunol. 7:
145-173.
Murphy, E. E., Terres, G., Macatonia, S.E, Hsieh, C.S., Mattson, J., Lanier, L.,
Wysocka, M., Trinchieri, G., Mmphy, K., O'Garra, A. (1994). B7 and interleukin 12
cooperate for proliferation and interferon y production by mouse T helper clones that are
unresponsive to B7 costimulation, d Exp. Med. 180: 223-231.
Nacy, C. A., Meierovics, A. L, Belosevic, M. and Green, S. J. (1991). Tumor necrosis
factor-a: central regulatory cytokine in the induction of macrophage antimicrobial
activities. PM/zoô/o/ogy. 59: 182-184.
Nakamura, K., Kitani, A. and Strober, W. (2001). Cell Contact-dependent
Immunosuppression by CD4^CD25^ Regulatory T Cells Is Mediated by Cell Surface-
bound Transforming Growth Factor-(3. d Exp. Med. 194: 629-644.
2 6 5

Nakamura, K., Kitani, A., Fuss, L, Pedersen, A., Harada, N., Nawata, H. and Strober,
W. (2004). TGF"P1 Plays an Important Role in the Mechanism of CD4^CD25^
Regulatory T Cell Activity in Both Humans and Mice. J. Immunol 172: 834-842.
Nakamura, T., Lee, R. K., Nam, S. Y., Podack, E. R., Bottomly, K. and Flavell, R. A.
(1997). Roles of IL-4 and IFN-y in stabilizing the T helper cell type 1 and 2 phenotype.
J. Immunol 158: 2648-2653.
Nelson, D. R., Lauwers, G. Y., Lau, J. Y. and Davis, G. L. (2000). Interleukin 10
treatment reduces fibrosis in patients with chronic hepatitis C: a pilot trial of interferon
nonresponders. Gastroenterology. 118: 655-660.
Noben-Trauth, N., Paul, W. E. and Sacks, D. L. (1999). IL-4- and IL-4 Receptor-
Deficient BALB/c Mice Reveal Differences in Susceptibility to Leishmania major
Parasite Substrains. J. Immunol 162: 6132-6140.
Noorchaslnn, FL, Noorchaslim, N., Kern, J., Rostami, S. Y., Barker, C. F. and Naji, A.
(1997). B-cells are required for the initiation of insulitis and sialitis in nonobese diabetic
mice. Diabetes. 46: 941-946.
Nutman, T. B., Kumaraswami, V. and Ottesen, E. A. (1987). Parasite-specific anergy in
human filariasis. Insights after analysis of parasite antigen-driven lymphokine
production, d Clin. Invest. 79: 1516-1523.
266

O'Farrell, A. M., Liu, Y., Moore, K. and L., M. A. (1998). IL-10 inhibits macrophage
activation and proliferation by distinct signaling mechanisms: evidence for Stat3-
dependent and independent pathways. Æ M f?. O.d 17: 1006-1018.
O'Comior, R. A., Jenson, J. S. and Devaney, E. (2000). NO Contributes to Proliferative
Suppression in a Murine Model of Filariasis. Infect. Immun. 68: 6101-6107.
O'Comior, R. A. and Devaney, E. (2002). Nitric Oxide Limits the Expansion of
Antigen-Specific T Cells in Mice Infected with the Microfilariae of Brugia pahangi.
Infect. Immun. 70: 5997-6004.
O'Garra, A., Chang, R., Go, N., Hastings, R., Haughton, G. and Howard, M. (1992). Ly-
1 B (B-1) cells aie the main source of B cell-derived interleukin 10. Eur. J. Immunol.
22:711-717.
O'Garra, A. and Vieira, P. (2003). Twenty-first century Foxp3. Nat. Immunol. 4: 304-
306.
Okamura, H., Tsutsi, H., Komatsu, T., Yutsudo, M., Hakura, A., Tanimoto, T., Torigoe,
K., Okura, T., Nukada, Y. and Hattori, K. (1995). Cloning of a new cytokine that
induces IFN-y production by T cells. Nature. 378: 88-91.
Onizuka, S., Tawara, I., Shimizu, J., Sakaguchi, S., Fujita, T. and Nakayama, E. (1999).
Tumor Rejection by in vivo Administration of Anti-CD25 (Interleukin-2 Receptor-a)
Monoclonal Antibody. Cancer Res. 59: 3128-3133.
2 6 7
:

Oosterwegel, M. A., Mandelbrot, D. A., Boyd, S. D., Lorsbacli, R. B., Jarrett, D. Y.,
Abbas, A. K. and Sharpe, A. H. (1999), The Role of CTLA-4 in Regulating Th2
Differentiation. J. Immunol 163: 2634-2639.
Oppmann, B., Lesley, R,, Blom, B., Timans, J. C., Xu, Y., Hunte, B., Vega, F., Yu, N.,
Wang, J., Singh, K., Zonin, P., Vaisberg, E., Churakova, T., Liu, M., Gorman, D.,
Wagner, J., Zurawski, S., Liu, Y., Abrams, J. S., Moore, K. W., Rennick, D., de Waal-
Malefyt, R., Hamium, C., Bazan, J. F. and Kastelein, R. A. (2000). Novel p i9 protein
engages IL-12p40 to form a cytokine, IL-23, with biological activities similar as well as
distinct from IL-12. Immunity. 13; 715-725.
Osborne, J., Hunter, S. and Devaney, E. (1996). Anti-interleukin-4 modulation of the
Tli2 polarized response to the parasitic nematode Brugiapahangi. Infect. Immun. 64:
3461-3466.
Osborne, J. and Devaney, E. (1998). The L3 of Brugia induces a Th2-polarized
response following activation of an IL-4-producing CD4'CD8' a(3 T cell population. Int.
Immunol 10: 1583-1590.
Osborne, J. and Devaney, E. (1999). Interleukin-10 and antigen-presenting cells actively
suppress Thl cells in BALB/c mice infected with the filarial parasite Brugia pahangi.
Infect. Immun. 67: 1599-1605.
2 6 8

269
Ottesen, E. A., Weller, P. F. and Heck, L. (1977). Specific cellular immune
unresponsiveness in human filariasis. Immunology. 33: 413-421.
Ottesen, E. A. (1979). Modulation of the host response in human schistosomiasis. I.
Adherent suppressor cells that inhibit lymphocyte proliferative responses to parasite
antigens./. Immunol. 123: 1639-1644. ;■
Ottesen, E. A. (1992). The Wellcome Trust Lecture. Infection and disease in lymphatic
filariasis: an immunological perspective. Parasitol. 104: Suppl: S71-79.
Ottesen, E. A. and Nutman, T. B. (1992). Tropical Pulmonary Eosinophilia. Annu. Rev.
Med. 43: 417-242.
Ottesen, E. A. (2000). Editorial: The Global Programme to Eliminate Lymphatic
Filariasis. Trop. Med. Int. Health. 5: 591-594.
Ovington, K. S., McKie, K., Matthaei, K. I., Young, I. G. and Behm, C. A. (1998).
Regulation of primary Strongyloides ratti infections in mice: a role for interleukin-5.
Immunology. 95: 488-493.
Owhashi, M., Harada, M., Suguri, S., Ohmae, H., I and shii, A. (2001). The role of
saliva o f Anopheles stephensi in inflammatory response: identification of a high
molecular weight neutrophil chemotactic factor. Parasitol. Res. 87: 376-382.
___

Oxenham, S. L., Mackenzie, C. D. and Denliam, D. A. (1984). Increased activity of
macrophages from mice infected with Brugia pahangi: in vitro adherence to
microfilariae. Parasite Immunol. 6: 141-156.
Paciorkowski, N., Shultz, L. D. and Rajan, T. V. (2003). Primed Peritoneal B
Lymphocytes Are Sufficient To Transfer Protection against Brugia pahangi Infection in
M\co. Infect. Immun. 71; 1370-1378.
Park, A. Y., Hondowicz, B. D. and Scott, P. (2000). IL-12 Is Required to Maintain a
Thl Response During Leishmania major Infection. J. Immunol. 165: 896-902.
Partono, F. (1987). The spectrum of disease in lymphatic filariasis. Ciba Found Symp.
127: 15-31.
Patton, E. A., La Flamme, A. C., Pedras-Vasoncelos, J. A. and Pearce, E. J. (2002).
Central Role for Interleukin-4 in Regulating Nitric Oxide-Mediated Inliibition of T-Cell
Proliferation and y Interferon Production in Schistosomiasis Infect. Immun. 70: 177-
184.
Pearlman, E., Flazlett, F. E. J., Boom, W. H. and Kazura, J. W. (1993a). Induction of
murine T-helper-cell responses to the filarial nematode Brugia malayi. Infect. Immun.
61:1105-1112.
Pearlman, E., Ki'oeze, W. K., Hazlett, F. E., Chen, S. S. A., Mawhorter, S. D., Boom,
W. FI. and Kazura, J. W. (1993b). Brugia malayi: Acquired Resistance to Microfilariae
in BALB/C Mice Correlates with Local Th2 Responses. Exp. Parasitol. 76: 200-208.
2 7 0

Pearlman, E., Lass, J. H., Bardenstein, D. S., Diaconu, E., Hazlett, J., Fred E., Albright,
J., Higgins, A. W. and Kazura, J. W. (1996). Onchocerca yolvulus-MQàmtoà Keratitis:
Cytokine Production by IL-4-Deficient Mice. Exp. Parasitol. 84; 274-281.
Perrin, G. Q., Johnson, H. M. and Subramaniani, P. S. (1999). Mechanism of
Interleukin-10 Inliibition of T-Helper Cell Activation by Superantigen at the Level of
the Cell Cycle. Blood. 93: 208-216.
Pflanz, S., Timans, J. C., Cheung, J., Rosales R., Kanzler, H., Gilbert, J., Hibbeit, L.,
Churakova, T., Travis, M., Vaisberg, E., Blumenschein, W. M., Mattson, J. D., Wagner,
J. L., To, W., Zurawski, S., McClanahan, T. K., Gorman, D. M., Bazan, J. F., de Waal
Malefyt, R., Rennick, D. and Kastelein, R. A. (2002). IL-27, a heterodimeric cytokine
composed of EBI3 and p28 protein, induces proliferation of naive CD4^ T cells.
Immunity. 16: 779-790.
Piessens, W. F., McGreevy, P. B., Piessens, P. W., McGreevy, M., Koiman, I., Saroso,
J. S. and Dennis, D. T. (1980a). Immune responses in human infections with Brugia
malayi'. specific cellular uni'esponsiveness to filarial antigens. J. Clin. Invest. 65: 172-
179.
Piessens, W. F., Rati way anto. S., Tuti, S., Palmieri, J. H., Piessens, P. W., Koiman, I.
and Dennis, D. T. (1980b). Antigen-specific suppressor cells and suppressor factors in
human filariasis v ifh. Brugia malayi. N. Engl. J. Med. 302: 833-837.
2 7 1

Piessens, W. P., Ratiwayanto, S., Piessens, P. W., Tuti, S., McGreevy, P. B., Darwis, F.,
Palmieri, J. R., Koiman, L and Dennis, D. T. (1981). Effect of treatment with
diethyicarbamazine on immune responses to filarial antigens in patients infected with
Brugia malayi. Acta. Trop. 38: 227-234.
Powrie, F., Calino, J., Leach, M. W., Mauze, S. and Coffman, R. L. (1996). A critical
role for Transforming Growth Factor-p but not Interleukin 4 in the suppression of T
helper Type-1-mediated Colitis by CD45RB'°^ CD4'^ T cells. J. Exp. Med. 183: 2669-
2674.
Pumionen, J., Aversa, G., Cocks, B., McKenzie, A., Menon, S., Zurawski, G., Malefyt,
R. and de Vries, J. (1993). Interleukin 13 Induces Interleukin 4-Independent IgG4 and
IgE Synthesis and CD23 Expression by Human B Cells. P.N.A.S. 90: 3730-3734.
Ravichandran, M., Mahanty, S., Kumaraswam, i. V., Nutman, T. B. and Jayaraman, K.
(1997). Elevated IE-10 mRNA expression and downregulation of Thl-type cytokines in
microfilaraemic individuals with Wiichereria bancrofti infection. Parasite Immunol. 19:
69-77.
Razi-Wolf, Z., Freeman, G., Galvin, F., Benacerraf, B., Nadler, L. and Reiser, H.
(1992). Expression and Function of the Murine B7 Antigen, the Major Costimulatory
Molecule Expressed by Peritoneal Exudate Cells. P.N.A.S. 89: 4210-4214.
Read, S., Malmstrom, V. and Powrie, F. (2000). Cytotoxic T Lymphocyte-associated
272

Antigen 4 Plays an Essential Role in the Function of CD25^CD4^ Regulatory Cells that
Control Intestinal Inflammation. J. Exp. Med. 192: 295-302.
Read, S. and Powiie, F. (2001). CD4" regulatory T cells. Curr. Opin. Immunol. 13: 644-
649.
major. Annu. Rev. Immunol. 13: 151-177.
Ribeiro, J. M. C. (1987). Role of Saliva in Blood-Feeding by Artliropods. Ann. Rev.
Entomol. 32: 463-478.
Rissoan, M.-C., Soumelis, V., Kadowald, N., Grpuard, G., Briere, F., de Waal Malefyt,
R. and Liu, Y.-J. (1999). Reciprocal Control of T Helper Cell and Dendritic Cell
Differentiation. iSc/c/îce. 283: 1183-1186.
Rodriguez-Sosa, M., Satoskar, A. R., Calderon, R., Gomez-Garcia, L., Saavedra, R.,
Bojalil, R. and Terrazas, L. I. (2002). Chronic Helminth Infection Induces Alternatively
Activated Macrophages Expressing High Levels of CCR5 with Low Interleukin-12
Production and Th2-Biasing Ability. Infect. Immun. 70: 3656-3664.
Ron, Y. and Sprent, J. (1987). T cell priming in vivo: a major role for B cells in
presenting antigen to T cells in lymph nodes. J. Immunol. 138: 2848-2856.
!J!
,'S
Reiner, S. L. and Locksley, R. M. (1995). The regulation of immunity to Leishmania f
■a?:-î
2 7 3

Roncarolo, M., G.„ Levings, M. K. and Traversari, C. (2001a). Differentiation of T
Regulatory Cells by Immature Dendritic Cells. J. Exp. Med. 193: 5-9.
Roncarolo, M. G., Bacchetta, R., Bordignon, C., Narula, S. and Levings, M. K. (2001b).
Type 1 T regulatory cells. Immunol. Rev. 182: 68-79.
Ronchese, F., Hausmann, B. and Le Gros, G. (1994). Interferon-y- and interleukin-4-
producing T cells can be primed on dendritic cells in vivo and do not require the
presence of B cells. Eur. J. Immunol. 24: 1148-1154.
Sadler, C. H., Rutitzky, L. I., Stadecker, M. J. and Wilson, R. A. (2003). IL-10 is crucial
for the transition from acute to chronic disease state during infection of mice with
Schistosoma mansoni. Eur. J. Immunol. 33: 880-
Sakaguchi, S., Sakaguchi, N., Asano, M., Itoh, M. and Toda, M. (1995). Immunologic
self-tolerance maintained by activated T cells expressing IL-2 receptor a-chains
(CD25). Breakdown of a single mechanism of self-tolerance causes various
autoimmune diseases. / Immunol. 155: 1151-1164.
Sakaguchi, S. (2003). The origin of F0XP3-expressing CD4^ regulatory T cells: thymus
or periphery./. Clin. Invest. 112: 1310-1312.
Salomon, B., Lenschow, D. J., Rliee, L., Ashourian, N., Singh, B., Sharpe, A. and
Bluestone, J. A. (2000). B7/CD28 costimulation is essential for the homeostasis of the
274

CD4^CD25^ immunoregulatory T cells that control autoimmune diabetes. Immunity. 12:
431-440.
Salomon, B. and Bluestone, J. A. (2001). Complexities of CD28/B7: CTLA-4
costimulatory pathways in autoimmunity and transplantation. Annu. Rev. Immunol. 19:
225-252.
Sansom, D. M. (2000). CD28, CTLA-4 and their ligands: who does what and to whom?
Immunology. 101: 169-177.
Sartono, E., Kruize, Y. C., Kurniawan, A., van der Meide, P. H., Partono, P., Maizels, y
R. M. and Yazdanbakhsh, M. (1995a). Elevated cellular immune responses and
interferon-y release after long-term diethyicarbamazine treatment of patients with
human lymphatic filariasis. / Infect. Dis. 171: 1683-1687.
Sartono, E., Kruize, Y. C., Partono, P., Kurniawan, A., Maizels, R. M. and
Yazdanbaldish, M. (1995b). Specific T cell unresponsiveness in human filariasis:
diversity in underlying mechanisms. Parasite Immunol. 17: 587-594.
Sartono, E., Kimize, Y. C., Kurniawan, A., Maizels, R. M. and Yazdanbaklish, M.
(1997). Depression of antigen-specific interleukin-5 and interferon-y responses in
human lymphatic filariasis as a function of clinical status and age. J. Infect. Dis. 175:
1276-1280.
275

Sartono, E., Lopriore, C., Ki’uize, Y. C. M., Kurniawan-Atmadja, A., Maizels, R. M.
and Yazdanbaldish, M. (1999). Reversai in microfilarial density and T cell responses in
human lymphatic filariasis. Parasite Immunol. 21: 565-571.
Satoguina, J., Mempel, M., Larbi, J., Badusche, M., Loliger, C., Adjei, O., Gachelin, G., J
Fleischer, B. and Hoerauf, A. (2002). Antigen-specific T regulatory-1 cells are
associated with immunosuppression in a chronic helminth infection (onchocerciasis).
Microbes and Infection 1291-1300.
y
ISchebesch, C., Kodelja, V., Muller, C., Hakij, N . , , Bisson, S., Orfanos, C. E. and :|
Goerdt, S. (1997). Alternatively activated macrophages actively inhibit proliferation of
peripheral blood lymphocytes and CD4^ T cells in vitro. Immunology. 92: 478-486.
Schonemeyer, A., Lucius, R., Sonnenburg, B., Brattig, N., Sabat, R., Schilling, K., *'
Bradley, J. and Hartmann, S. (2001). Modulation of Human T Cell Responses and
Macrophage Functions by Onchocystatin, a Secreted Protein of the Filarial Nematode
Onchocerca volvulus. J. Immunol. 167: 3207-3215.
Schopf, L. R., Hoffmann, K. F., Cheever, A. W., Urban, J. F., Jr. and Wynn, T. A.
(2002). IL-10 Is Critical for Host Resistance and Survival During Gastrointestinal
Helminth Infection. J. Immunol. 168: 2383-2392.
Schweitzer, A. N. and Sharpe, A. H. (1998). Studies Using Antigen-Presenting Cells /
Lacking Expression of Both B7-1 (CD80) and B7-2 (CD86) Show Distinct
276

Requirements for B7 Molecules During Priming Versus Restimulation of Th2 But Not
Thl Cytokine Production. J. Immunol. 161; 2762-2771.
Scott, A. L. (2000). Lymphatic-dwelling Filariae. In Lymphatic Filariasis. London,
Imperial College Press. Nutman, T.B.
Seder, R. A., Marth, T., Sieve, M. C., Strober, W., Letterio, J. J., Roberts, A. B. and
Kelsall, B. (1998). Factors Involved in the Differentiation of TGF-p-Producing Cells
from Naive CD4^ T Cells: IL-4 and IFN-y Have Opposing Effects, While TGF-p
Positively Regulates Its Own Production. J. Immunol. 160: 5719-5728.
■ :
Semnani, R. T., Sabzevari, H., Iyer, R. and Nutman, T. B. (2001). Filarial Antigens
Impair the Function of Human Dendritic Cells during Differentiation. Infect. Immun.
69: 5813-5822.
Semnani, R. T., Liu, A. Y., Sabzevari, H., Kubofcik, J., Zhou, J., Gilden, J. K. and
Nutman, T. B. (2003). Brugia malayi Microfilariae Induce Cell Death in Fluman
Dendritic Cells, Inhibit Their Ability to Make IL-12 and IL-10, and Reduce Their
Capacity to Activate CD4^ T Cells. J. Immunol. 171: 1950-1960.
Sharpe, A. H. and Freeman, G. J. (2002). The B7-CD28 superfamily. Nat. Rev.
Immunol. 2: 116-126.
Shimoda, K., van Deursen, J., Sangster, M. Y., Sarawar, S. R., Carson, R. T., Tripp, R.
A., Chu, C., Quelle, F. W., Nosaka, T., Vignali, D. A., Doherty, P. C., Grosveld, G.,
2 7 7

Paul, W. E. and Ihle, J. N. (1996). Lack of IL-4-induced Th2 response and IgE class
switching in mice with disrupted Stat6 gene. Nature. 380: 630-633.
Sieling, P. A., Abrams, J. S., Yamamura, M., Salgame, P., Bloom, B. R., Rea, T. H. and
Modlin, R. L. (1993). Immunosuppressive roles for IL-10 and IL-4 in human infection.
In vitro modulation of T cell responses in leprosy. J. Immunol. 150: 5501-5510.
Silveira, P. A., Johnson, E., Chapman, H. D., Bui, T., Tisch, R. M. and Serreze, D. V.
(2002). The preferential ability of B lymphocytes to act as diabetogenic APC in NOD
mice depends on expression of self-antigen-specific immunoglobulin receptors. Eur. J.
Immunol. 32: 3657-3666.
Sopori, M., Cohen, D., Cherian, S., Perrone, R. and Kaplan, A. (1985). Antigen
presentation in the rat. II. An Ia+ radiosensitive T cell can present antigen to primed la-
T cells. / Immunol. 134: 1369-1373.
Spencer, H. (1973). Tropical Pathology. Berlin, Springer-Verlag,.
Spencer, L., Shultz, L. and Rajan, T. V. (2003a).' T Cells Are Required for Host
Protection against Brugia malayi but Need Not Produce or Respond to Interleukin-4.
Infect. Immun. 71: 3097-3106.
Spencer, L. A., Porte, P., Zetoff, C. and Rajan, T. V. (2003b). Mice Genetically
Deficient in Immunoglobulin E Are More Permissive Hosts than Wild-Type Mice to a
278

ï•I
Primary, but Not Secondary, Infection with the Filarial Nematode Brugia malayi. Infect. [jf
Immun. 71; 2462-2467.
I
ISpry, C. J. F. and Kumaraswami, V. (1982). Tropical Pulmonary Eosinophilia. Semin.
SHaematol. 19.
Steel, C., Guinea, A., McCarthy, J. S. and Ottesen, E. A. (1994). Long-term effect of
prenatal exposure to maternal mlcrofilaraemia on immune responsiveness to filarial
parasite antigens. Lancet. 343: 890-893.
Steel, C. and Nutman, T. B. (2003). CTLA-4 in Filarial Infections: Implications for a
Role in Diminished T Cell Reactivity. J. Immunol. 170: 1930-1938.
Steinbrinlc, K., Graulich, E., Kubsch, S., Knop, J. and Enk, A. H. (2002). CD4+ and
CD8 anergic T cells induced by interleukin-10-treated human dendritic cells display
antigen-specific suppressor activity. Blood. 99: 2468-2476.
Stephens, L. A. and Mason, D. (2000). CD25 Is a Marker for CD4" Thymocytes That
Prevent Autoimmune Diabetes in Rats, But Peripheral T Cells with This Function Are
Found in Both CD25'^ and CD25" Subpopulations. J. Immunol. 165: 3105-3110.
Steel, C. and Ottesen, E. A. (2001). Evolution of immunologic responsiveness of
persons living in an area of endemic bancrofti an filariasis: a 17-year follow-up. J, Infect.
Dis. 184: 73-79.
2 7 9

Subramaniaii, G., Kazura, J. W., Pearlman, E., Jia, X., Malhotra, I. and King, C. L.
(1997). B7-2 requirement for helminth-induced granuloma formation and CD4 type 2 T
helper cell cytokine expression. J. Immunol. 158: 5914-5920.
Suresh, S., Kumaraswami, V., Suresh, I., Rajesh, K., Suguna, G., Vijayasekaran, V.,
Ruckmani, A. and Rajamanickam, M. G. (1997). Ultrasonographic diagnosis of
subclinical filariasis. / Ultrasound Med. 16:45-49.
Szabo, S. J., Dighe, A. S., Gubler, U. and Murphy, K. M. (1997). Regulation of the
Interleukin (IL)-12R p 2 Subunit Expression in Developing T Helper 1 (Thl) and Th2
Cells. J. Exp. Med. 185: 817-824.
Taga, K., Mostowski, H. and Tosato, G. (1993). Human interleukin-10 can directly
inhibit T-cell growth. Blood. 81: 2964-2971.
Takahashi, T., Kuniyasu, Y., Toda, M., Sakaguchi, N., Itoh, M., I, wata, M., Shimizu, J.
and Sakaguchi, S. (1998). Immunologic self-tolerance maintained by CD25'^CD4’
naturally anergic and suppressive T cells: induction of autoimmune disease by breaking
their anergic/suppressive state. Int. Immunol 10: 1969-1980.
Swihart, K., Fruth, U., Messmer, N., Hug, K., Behin, R., Huang, S., Del Giudice, G.,
Aguet, M. and Louis, J. (1995). Mice from a genetically resistant background lacking
the interferon y receptor are susceptible to infection with Leishmania major but mount a
polarized T helper cell 1 -type CD4" T cell response. J. Exp. Med. 181: 961-971.
2 8 0
Takahashi, T., Tagami, T., Yamazaki, S., Uede, T., Shimizu, J., Sakaguchi, N., Mak, T.
W, and Sakaguchi, S. (2000). Immunologie Self-Tolerance Maintained by CD25^CD4^
Regulatory T Cells Constitutively Expressing Cytotoxic T Lymphocyte-associated
Antigen 4. J. Exp. Med. 192: 303-310.
Takeda, K., Tanaka, T., Shi, W., Matsimioto, M., Minami, M., Kashiwamura, S.,
Nakanishi, K., Yoshida, N., Kishimoto, T. and Akira, S, (1996). Essential role of Stat6
in IL-4 signalling. Nature. 380: 627-630.
Terhell, A. J., Haarbrink, M., Abadi, K., Bromieberg, D. C., Tieleman, M. C., Asri, M.
and Yazdanbakhsh, M. (1996). A filter paper technique for the detection of filarial IgG4
in lymphatic filariasis. Trans. R. Soc. Trop. Med. Hyg. 90: 196-198.
Titus, R. G. and Ribeiro, J. M. (1988). Salivary gland lysates from the sand fly
Lutzomyia longipalpis enhance Leishmania infectivity. Science. 239: 1306-1308.
Titus, R. G., Theodos, C. M., Shanlcar, A. H. and Hall, L. R. (1994). Interactions
Leishmania major and macrophages. Immunol. Ser. 60: 437-459.
Titus, R. G. (1998). Salivary Gland Lysate from the Sand Fly Lutzomyia longipalpis
Suppresses the Immune Response of Mice to Sheep Red Blood Cells in vivo and
Concanavalin A in vitro. Exp. Parasitol. 89: 133-136.
Tivol, E. A., Borriello, F., Schweitzer, A. N., Lynch, W. P., Bluestone, J. A. and
Sharpe, A. H. (1995). Loss of CTLA-4 leads to massive lymphoproliferation and fatal
2 8 1

imiltiorgan tissue destruction, revealing a critical negative regulatory role of CTLA-4.
Immunity. 3: 541-547.
van der Kleij, D., Latz, E., Brouwers, J. F. H. M., Kruize, Y. C. M., Schmitz, M., Kurt-
Jones, E. A., Espevik, T., de Jong, E. C., Kapsenberg, M. L., Golenbock, D. T., Tielens,
A. G. M. and Yazdanbakhsh, M. (2002). A Novel Host-Parasite Lipid Cross-talk.
Schistosomal lyso-phosphatidyl serine activates toll-like receptor 2 and effects limmune
polarization. / Biol. Chem. 277: 48122-48129.
van Deventer, S., Elson, C. and Fedorak, R. (1997). Multiple doses of intravenous
interleukin 10 in steroid-refractory Crohn's disease. Crohn's Disease Study Group.
Gastroenterology. 113: 383-389.
Vanamail, P., Subramaniaii, S., Das, P. K., Pani, S. P., Rajagopalan, P. K., Bundy, D. A.
and Grenfell, B. T. (1989). Estimation of age-specific rates of acquisition and loss of
Wuchereria bancrofti infection. Trans. R. Soc. Trop. Med. Hyg. 83: 689-693.
Velupillai, P. and Ham, D. (1994). Oligosaccharide-Specific Induction of Interleukin 10
Production by B220^ Cells from Schistosome-Infected Mice: A Mechanism for
Regulation of CD44- T-Cell Subsets. P.N.A.S. 91: 18-22.
Velupillai, P., Sypek, J. and Harn, D. (1996). Interleukin-12 and -10 and y interferon
regulate polyclonal and ligand-specific expansion of murine B-1 cells. Infect. Immun.
64: 4557-4560.
282

■ 1
Velupillai, P., Secor, W., Horauf, A. and Harn, D. (1997). B-1 cell (CD5'"B220"')
outgrowth in murine schistosomiasis is genetically restricted and is largely due to.".J
activation by polylactosamine sugars. J. Immunol 158: 338-344.
Volkmann, L., Saeftel, M., Bain, O., Fischer, K., Fleischer, B. and Hoerauf, A. (2001).
Interleukin-4 Is Essential for the Control of Microfilariae in Murine Infection with the
Vû?iûdi Litomosoides sigmodontis. Infect. Immun. 69: 2950-2956.
Voiler, A. and De Savigny, D. (1981). Diagnostic serology of tropical parasitic diseases.
J. Immunol Methods. 146: 1-29.
Walunas, T. L., Bakker, C. Y. and Bluestone, J. A. (1996). CTLA-4 ligation blocks
CD28-dependent T cell activation. J. Exp. Med. 183: 2541-2550.
Waterhouse, P., Penninger, J. M., Timms, E., Wakeham, A., Shahmian, A., Lee, K. P.,
Thompson, C. B., Griesser, H. and Mak, T. W. (1995). Lymphoproliferative disorders
with early lethality in mice deficient in Ctla-4. Science. 270: 985-988.
Weil, G. J., Lammie, P. J. and Weiss, N. (1997). The ICT Filariasis test: a rapid antigen
test for diagnosis of bancroftian filariasis. ParasitolToday. 13: 401-404.
Weiner, H. L. (2001). Induction and mechanism of action of transforming growth
factor-p-secreting Th3 regulatory cells. Immunol Rev. 182: 207-214.
2 8 3

Whelan, M., Harnett, M. M., Houston, K. M., Patel, V., Harnett, W. and Rigley, K. P.
(2000). A Filarial Nematode-Secreted Product Signals Dendritic Cells to Acquire a
Phenotype That Drives Development of Th2 Cells. J. Immunol 164: 6453-6460.
Wiekowski, M. T., Leach, M. W., Evans, E. W., Sullivan, L., Chen, S.-C., Vassileva,
G., Bazan, J. F., Gorman, D. M., Kastelein, R. A., Narula, S. and Lira, S. A. (2001).
Ubiquitous Transgenic Expression of the IL-23 Subunit p i 9 Induces Multiorgan
Inflammation, Rimting, Infertility, and Premature Death. J. Immunol 166: 7563-7570.
Wilson, E. H., Deehan, M. R., Katz, E., Brown, K. S., Houston, K. M., O'Grady, J.,
Harnett, M. M. and Harnett, W. (2003a). Hyporesponsiveness o f murine B lymphocytes
exposed to the filarial nematode secreted product ES-62 in vivo. Immunology. 109: 238-
245.
Wilson, E. H., Katz, E., Goodridge, H. S., Harnett, M. M. and Harnett, W. (2003b). In
vivo activation of murine peritoneal B1 cells by the filarial nematode
phosphorylcholine-containing glycoprotein ES-62. Parasite Immunol. 25: 463-466.
Wood, K. J. and Sakaguchi, S. (2003). Regulatory T cells in transplantation tolerance.
Nat. Rev. Immunol. 3: 199-210.
Wynn, T. A., Cheever, A. W., Williams, M. E., Hieny, S., Caspar, P., Kulm, R., Muller,
W. and Sher, A. (1998). IL-10 Regulates Liver Pathology in Acute Murine
Schistosomiasis mansoni But Is Not Required for Immune Down-Modulation of
Chi'onic Disease. J. Immunol 160: 4473-4480.
2 8 4

Zang, X., Atmadj a, A. K., Gray, P., Allen, J. E., Gray, C. A., Lawrence, R. A.,
Yazdanbaldish, M. and Maizels, R. M. (2000). The Serpin Secreted by Brugia malayi
Microfilariae, Bm-SPN-2, Elicits Strong, but Short-Lived, Immune Responses in Mice
and Humans. / Immunol. 165: 5161-5169.
Yap, G., Pesin, M. and Sher, A. (2000). Cutting Edge: IL-12 Is Required for the
Maintenance of IFN-y Production in T Cells Mediating Chronic Resistance to the
Intracellular Pathogen, Toxoplasma gondii. J. Immunol. 165: 628-631.
Yazdanbakhsh, M., Paxton, W. A., Kruize, Y. C., Sartono, E., KumaraswamiA, van het
Wout A, Selkirk ME, Partono F and RM., M. (1993a). T cell responsiveness correlates
differentially with antibody isotype levels in clinical and asymptomatic filariasis. J.
Infect. Dis. 167: 925-931.
Yazdanbaldish, M., Sartono, E., Kruize, Y. C., Kurniawan, A., van der Pouw-Kiaan, T.,
van der Meide, P. H., Selkirk, M. E., Partono, F., Hintzen, R. Q. and van Lier, R. A.
(1993b). Elevated levels of T cell activation antigen CD27 and increased interleuldn-4
production in human lymphatic filariasis. Eur. Jfm m unol. 23: 3312-3317.
Yoshida, H., Hamano, S., Senaldi, G., Covey, T., Faggioni, R., Mu, S., Xia, M.,
Wakeham, A. C., Nishina, H., Potter, J., Saris, C. J. and Mak, T. W. (2001). WSX-1 is
required for the initiation of Thl responses and resistance to L. major infection.
Immunity. 15: 569-578.
285

Zeller, J. C., Panoskaltsis-Mortari, A., Murphy, W. J., Ruscetti, F. W., Narula, S.,
Roncarolo, M. G. and Blazar, B. R. (1999). Induction of CD4^ T Cell Alloantigen-
Specific Hyporesponsiveness by IL-10 and TGF-p. J. Immunol. 163: 3684-3691.
Zurawski, S., Vega F., Huyghe B. and Ziuawski G. (1993). Receptors for interleukin-
13 and interleukin-4 are complex and share a novel component that functions in signal
transduction. E.M.B.O.J 12: 3899-3905.
%
286