Thermodynamic Metrics for Aggregation of Natural Resources in Life Cycle Analysis: Insight via...
8
Thermodynamic Metrics for Aggregation of Natural Resources in Life Cycle Analysis: Insight via Application to Some Transportation Fuels ANIL BARAL AND BHAVIK R. BAKSHI* William G. Lowrie Department of Chemical and Biomolecular Engineering, The Ohio State University, Columbus, Ohio 43210 Received August 24, 2009. Revised manuscript received November 18, 2009. Accepted November 19, 2009. While methods for aggregating emissions are widely used and standardized in life cycle assessment (LCA), there is little agreement about methods for aggregating natural resources for obtaining interpretable metrics. Thermodynamic methods have been suggested including energy, exergy, and emergy analyses. This work provides insight into the nature of thermodynamic aggregation, including assumptions about substitutability between resources and loss of detailed information about the data being combined. Methods considered include calorific value or energy, industrial cumulative exergy consumption (ICEC) and its variations, and ecological cumulative exergy consumption (ECEC) or emergy. A hierarchy of metrics is proposed that spans the range from detailed data to aggregate metrics. At the fine scale, detailed data can help identify resources to whose depletion the selected product is most vulnerable. At the coarse scale, new insight is provided about thermodynamic aggregation methods. Among these, energy analysis is appropriate only for products that rely primarily on fossil fuels, and it cannot provide a useful indication of renewability. Exergy- based methods can provide results similar to energy analysis by including only nonrenewable fuels but can also account for materials use and provide a renewability index. However, ICEC and its variations do not address substitutability between resources, causing its results to be dominated by dilute and low- quality resources such as sunlight. The use of monetary values to account for substitutability does not consider many ecological resources and may not be appropriate for the analysis of emerging products. ECEC or emergy explicitly considers substitutability and resource quality and provides more intuitive results but is plagued by data gaps and uncertainties. This insight is illustrated via application to the life cycles of gasoline, diesel, corn ethanol, and soybean biodiesel. Here, aggregate metrics reveal the dilemma facing the choice of fuels: high return on investment versus high renewability. 1. Introduction Due to the highly multivariate nature of the results of life cycle studies, several methods have been devised for comparing and aggregating the results. Aggregate metrics are appealing for communicating findings, for convenient comparison between alternatives, and for decision making. Life cycle impact assessment (LCIA) involves aggregation of various emissions into midpoint and end-point indicators by use of characterization factors, and several standardized LCIA methods are available (1, 2). Comparable approaches to aggregate diverse natural resources for the purposes of estimating their consumption and its impacts exist but are not as mature or standardized. Methodologies such as abiotic depletion potential (ADP) (3) and surplus energy (2) have been used for quantifying resource use in LCIA, but they deal mainly with nonrenewable resources such as minerals and fossil fuels. ADP aggregates nonrenewable resources by use of characterization factors that are derived from the rates of extraction of minerals and ores compared to their reserves. Surplus energy measures damage to resources in terms of additional energy required for extracting low-quality resources as abundant and high- quality resources become depleted. Other methods such as ecological footprint analysis (EFA) deal mainly with renewable resources and aggregate them in terms of the global land area required to regenerate them (4). EFA does not directly measure the depletion or stocks of nonrenewable resources but indirectly quantifies fossil fuel use on the basis of the forest area required to sequester CO 2 emitted from fuel combustion. In addition, thermodynamic concepts such as calorific value and exergy have been suggested for aggregation of resources in life cycle assessment (LCA) and have been particularly popular, even among lay people (5), for compar- ing transportation fuels (6-10). However, the reduction in dimensionality due to aggregation usually causes loss of information about the variables being combined. An implicit assumption is that the resources being aggregated are substitutable. Thus, popular metrics such as energy return on investment and net energy add the calorific values of crude oil, natural gas, and coal, implying that a joule of natural gas energy may be substituted by a joule of coal energy. Depending on the materials and their application, such substitutability may not be possible since, for example, natural gas may be converted to electricity more efficiently than coal. Thus, for generating electricity, natural gas is a higher quality resource than coal. If the resources being aggregated include both renewable and nonrenewable resources, the disparity between their qualities can be even more significant. Clearly, a joule of sunlight or biomass energy is not able to do the same extent and type of work as a joule of coal energy. The presence of such quality differences and ignoring them in energy analysis has led some researchers to even question the relevance and usefulness of such metrics for decision making (5). Similar challenges also arise in the aggregation of emissions done in impact analysis. However, impact assessment relies on characterization factors to represent the variables in terms of a common unit such as equivalents of CO 2 for aggregating all greenhouse gas emissions. The issue of energy quality and aggregation of different resources has received some attention (11) and various quantities such as exergy, emergy, and monetary value have been suggested for capturing differences in resource quality. While exergy is the useful energy that can be theoretically extracted from a given system and hence deals with the energy quality issue to some extent, emergy adjusts for the quality of resources by a transformation index or transformity. This quantity is analogous to the characterization factors used in LCIA. Most resources have exergy as a fundamental property, making exergy-based aggregation more inclusive than EFA, * Corresponding author. Tel: +1-614-292-4904; fax: +1-614-292- 3769; e-mail: [email protected]. Environ. Sci. Technol. 2010, 44, 800–807 800 9 ENVIRONMENTAL SCIENCE & TECHNOLOGY / VOL. 44, NO. 2, 2010 10.1021/es902571b 2010 American Chemical Society Published on Web 12/18/2009
-
Upload
independent -
Category
Documents
-
view
3 -
download
0
Transcript of Thermodynamic Metrics for Aggregation of Natural Resources in Life Cycle Analysis: Insight via...
Thermodynamic Metrics forAggregation of Natural Resources inLife Cycle Analysis: Insight viaApplication to Some TransportationFuelsA N I L B A R A L A N D B H A V I K R . B A K S H I *
William G. Lowrie Department of Chemical and BiomolecularEngineering, The Ohio State University, Columbus, Ohio 43210
Received August 24, 2009. Revised manuscript receivedNovember 18, 2009. Accepted November 19, 2009.
While methods for aggregating emissions are widely usedand standardized in life cycle assessment (LCA), there is littleagreement about methods for aggregating natural resourcesfor obtaining interpretable metrics. Thermodynamic methods havebeen suggested including energy, exergy, and emergyanalyses. This work provides insight into the nature ofthermodynamic aggregation, including assumptions aboutsubstitutability between resources and loss of detailed informationabout the data being combined. Methods considered includecalorificvalueorenergy, industrialcumulativeexergyconsumption(ICEC) and its variations, and ecological cumulative exergyconsumption (ECEC) or emergy. A hierarchy of metrics is proposedthat spans the range from detailed data to aggregate metrics.At the fine scale, detailed data can help identify resourcesto whose depletion the selected product is most vulnerable. Atthe coarse scale, new insight is provided about thermodynamicaggregation methods. Among these, energy analysis isappropriate only for products that rely primarily on fossil fuels,and it cannot provide a useful indication of renewability. Exergy-based methods can provide results similar to energy analysis byincluding only nonrenewable fuels but can also account formaterials use and provide a renewability index. However, ICECand its variations do not address substitutability betweenresources, causing its results to be dominated by dilute and low-quality resources such as sunlight. The use of monetaryvalues to account for substitutability does not consider manyecological resources and may not be appropriate for the analysisof emerging products. ECEC or emergy explicitly considerssubstitutability and resource quality and provides more intuitiveresults but is plagued by data gaps and uncertainties. Thisinsight is illustrated via application to the life cycles of gasoline,diesel, corn ethanol, and soybean biodiesel. Here, aggregatemetrics reveal the dilemma facing the choice of fuels: high returnon investment versus high renewability.
1. Introduction
Due to the highly multivariate nature of the results of lifecycle studies, several methods have been devised forcomparing and aggregating the results. Aggregate metricsare appealing for communicating findings, for convenient
comparison between alternatives, and for decision making.Life cycle impact assessment (LCIA) involves aggregation ofvarious emissions into midpoint and end-point indicatorsby use of characterization factors, and several standardizedLCIA methods are available (1, 2). Comparable approachesto aggregate diverse natural resources for the purposes ofestimating their consumption and its impacts exist but arenot as mature or standardized.
Methodologies such as abiotic depletion potential (ADP)(3) and surplus energy (2) have been used for quantifyingresource use in LCIA, but they deal mainly with nonrenewableresources such as minerals and fossil fuels. ADP aggregatesnonrenewable resources by use of characterization factorsthat are derived from the rates of extraction of minerals andores compared to their reserves. Surplus energy measuresdamage to resources in terms of additional energy requiredfor extracting low-quality resources as abundant and high-quality resources become depleted. Other methods such asecological footprint analysis (EFA) deal mainly with renewableresources and aggregate them in terms of the global landarea required to regenerate them (4). EFA does not directlymeasure the depletion or stocks of nonrenewable resourcesbut indirectly quantifies fossil fuel use on the basis of theforest area required to sequester CO2 emitted from fuelcombustion.
In addition, thermodynamic concepts such as calorificvalue and exergy have been suggested for aggregation ofresources in life cycle assessment (LCA) and have beenparticularly popular, even among lay people (5), for compar-ing transportation fuels (6-10). However, the reduction indimensionality due to aggregation usually causes loss ofinformation about the variables being combined. An implicitassumption is that the resources being aggregated aresubstitutable. Thus, popular metrics such as energy returnon investment and net energy add the calorific values ofcrude oil, natural gas, and coal, implying that a joule of naturalgas energy may be substituted by a joule of coal energy.Depending on the materials and their application, suchsubstitutability may not be possible since, for example,natural gas may be converted to electricity more efficientlythan coal. Thus, for generating electricity, natural gas is ahigher quality resource than coal. If the resources beingaggregated include both renewable and nonrenewableresources, the disparity between their qualities can be evenmore significant. Clearly, a joule of sunlight or biomass energyis not able to do the same extent and type of work as a jouleof coal energy. The presence of such quality differences andignoring them in energy analysis has led some researchersto even question the relevance and usefulness of such metricsfor decision making (5). Similar challenges also arise in theaggregation of emissions done in impact analysis. However,impact assessment relies on characterization factors torepresent the variables in terms of a common unit such asequivalents of CO2 for aggregating all greenhouse gasemissions.
The issue of energy quality and aggregation of differentresources has received some attention (11) and variousquantities such as exergy, emergy, and monetary value havebeen suggested for capturing differences in resource quality.While exergy is the useful energy that can be theoreticallyextracted from a given system and hence deals with the energyquality issue to some extent, emergy adjusts for the qualityof resources by a transformation index or transformity. Thisquantity is analogous to the characterization factors used inLCIA. Most resources have exergy as a fundamental property,making exergy-based aggregation more inclusive than EFA,
* Corresponding author. Tel: +1-614-292-4904; fax: +1-614-292-3769; e-mail: [email protected].
Environ. Sci. Technol. 2010, 44, 800–807
800 9 ENVIRONMENTAL SCIENCE & TECHNOLOGY / VOL. 44, NO. 2, 2010 10.1021/es902571b 2010 American Chemical SocietyPublished on Web 12/18/2009
ADP, and surplus energy. However, there is no consensus onthe most appropriate approach. Studies that apply andcompare multiple resource aggregation schemes to the samedata are uncommon since most papers focus on mainly onescheme (7, 9, 10).
The primary contributions of this work are that it highlightsthe assumptions implicit in various aggregation schemes andprovides insight into the features, pros, and cons of ther-modynamic aggregation schemes. The schemes consideredin this work include cumulative energy; industrial cumulativeexergy consumption (ICEC), often referred to as exergy, andits variations; and ecological cumulative exergy consumption(ECEC), which is closely related to emergy. A monetaryweighting scheme is also considered. After a unified intro-duction to these methods in the next section, these schemesare applied to four transportation fuelsscorn ethanol,soybean biodiesel, gasoline, and dieselsto provide a com-parative assessment in the context of life cycle resource use.Life cycle inventory data were obtained via hybrid modelsconstructed from ecologically-based life cycle assessment(Eco-LCA) (12). Such applications are essential for under-standing the features of various aggregation approaches anddetermining their appropriate use. Since aggregation leadsto loss of information, disaggregated and normalized ther-modynamic data are also presented along with aggregatemetrics. This results in a hierarchy of metrics from detailedto aggregate that can provide unique insight about thevulnerability of selected fuels to specific ecosystem goodsand services, and a holistic view for decision making.
2. Concepts and Methods2.1. Resource Aggregation. All the common aggregationschemes, including those considered in this work, may berepresented as
xj ) ∑ λixi (1)
Here, xi represents the physical property of the ith resource,usually calorific value, exergy, or mass. λi is the qualitycorrection factor for the corresponding resource, and jx isthe aggregate value for all resources. Equation 1 implies thatλixi units of the ith resource may be replaced by λi+1xi+1 unitsof the (i+1)th resource. Results of various methods describedhere for the selected fuels are presented in section 3.4.
2.1.1. Energy Analysis. This approach considers xi to bethe calorific value of resources such as coal, oil, and naturalgas. It treats all λi to be unity, thus ignoring any differencesin energy quality. One commonly used metric in energyanalysis is energy return on investment, rE, defined as theratio of the calorific value of the produced fuel to the totalcalorific value of the resources used for converting the rawmaterials into the fuel, not including the feedstock.
Cleveland et al. (11) have considered various approachesfor quality correction and have claimed that monetary valueis most appropriate. Their argument is that market valuescapture many quality aspects of resources such as theirabundance, human preference, cleanliness, and convenienceof use. In this approach, the quality correction factor maybe calculated as
λi )pi
pb(2)
where pi and pb are the prices per joule (J) of the ith resourceand the fuel selected as the basis, respectively. A shortcomingof this approach is that it may not capture externalities, andbecause market values are dictated by subjective humanfactors, they may have temporal and spatial variations eventhough the qualities of the resources under considerationremain unchanged.
2.1.2. Industrial Cumulative Exergy Consumption Analy-sis. Exergy is defined as the maximum useful energy that canbe obtained as the system achieves equilibrium with thereference environment. Exergy analysis has been widely usedin engineering for evaluating systems and identifying op-portunities for efficiency improvement (9) and is oftenproposed as a way of accounting for the quality of resources(13, 14) because exergy considers only that part of a resourcethat can be converted to useful work. Exergy is a betterindicator of quality than calorific value, since it can accountfor differences such as those due to temperatures of heat ordifferent chemical potentials of materials. In terms of eq 1,the quality indicator, λi, for exergy analysis may be writtenas
λi )Exi
xi(3)
where xi may be the calorific value, enthalpy, or mass, andExi is the exergy content.
Since both fuels and nonfuel resources have exergy, thisquantity can be used to compare and aggregate manydifferent types of resources: a distinct advantage over energyanalysis. Studies based on exergy analysis of the life cycle oftransportation fuels (9, 10, 15) present aggregate metrics suchas renewability factor (15) and exergetic breeding factor (9).These aggregate metrics were obtained by cumulative exergyconsumption or demand (CEC) analysis, also called industrialcumulative exergy consumption (ICEC) analysis to indicatethe emphasis on industrial and economic activities (16).
While aggregation based on exergy is appealing, the resultscan be misleading since a joule of exergy of different resourcessuch as coal, natural gas, biomass, and sunlight is not fullysubstitutable. This problem is particularly severe in thecomparison and aggregation of renewable and nonrenewableresources, as illustrated in sections 3.3 and 3.4. In response,Dewulf et al. (17) have proposed to consider only the exergythat is actually used in industrial processes. This approachcalculates the cumulative exergy extraction from the naturalenvironment (CEENE) and ignores resources that do notdirectly enter the selected life cycle. For example, only 2%of the incident sunlight on land is included in CEENE sincethat is the fraction metabolized by plants. CEENE alsoexcludes the overburden in mining since it is not used byindustry. However, the part that is not used still must beproduced to get the useful fraction. That is, producing the2% metabolized sunlight cannot be done without the other98%. This situation is analogous to allocation in LCA.
The correction factor used in CEENE is a modification ofeq 3 with the numerator being the extracted or used exergyinstead of the total exergy of the resource. Thus, thenumerator may be written as γiExi where γi is the fractionextracted. For solar exergy, γi ) 0.02. This approach still doesnot account for quality differences between various sourcesand considers the metabolized solar exergy to be equivalentto oil exergy. While this is an improvement over traditionalICEC analysis, other resources in addition to the metabolizedsunlight are needed to convert biomass into the concentratedand higher quality of fossil fuels. CEENE ignores these alongwith differences in the quality of resources.
2.1.3. Ecological Cumulative Exergy Consumption orEmergy Analysis. A conceptually appealing approach foraddressing the issue of energy quality was developed byOdum (18) via emergy analysis. Emergy is equivalent tocumulative exergy consumption when ecosystems are alsoincluded in the calculation and may be referred to asecological cumulative exergy consumption (ECEC) (19). Thisapproach aims to represent all resources in terms of acommon numeraire, or unit of account, usually as solarequivalents. As a simple illustration, consider a hypotheticalsupply chain for a biofuel where 1000 J of sunlight is needed
VOL. 44, NO. 2, 2010 / ENVIRONMENTAL SCIENCE & TECHNOLOGY 9 801
to produce 10 J of biomass, which is used to produce 1 J offuel. This implies that a joule of fuel is equivalent to 10 J ofbiomass, which is equivalent to 1000 J of sunlight. Thus, 1J of the biofuel is equal to 1000 solar equivalent joules (sej),and adding different resources in terms of their solarequivalents satisfies the assumption of substitutability. Thisapproach retains information about resource quality andtherefore diminishes criticism about the loss of informationdue to aggregation (20).
The quality correction factor in emergy analysis is givenas
λi )Emi
xi(4)
where xi is usually the exergy, energy, or mass of the ithresource and Emi is its ECEC or emergy. The quality indicatorλi is referred to as the transformity and converts all resourcesinto solar equivalent joules. It has been proposed thatresources with higher transformities are of higher qualityand may be scarcer (18). Unlike all the approaches discussedin this section, ECEC is able to quantify the contribution ofmany ecosystem goods and services, which may make it moreappropriate for evaluation of ecological aspects. AlthoughOdum (18) and others have calculated the solar equivalentsof many resources, the emergy approach relies on knowledgeabout complex ecosystems, which is likely to be inaccurateand incomplete. Despite being conceptually appealing,emergy analysis has been controversial and has not beenused widely as an aggregation method for environmentalaccounting (21). Comparative studies, as in this work, areessential to understand and select appropriate aggregationmethods.
2.2. Ecologically-Based Life Cycle Assessment. Theresults in this article are from Eco-LCA, which accounts forthe role of ecosystem services in LCA (12). Currently, itaccounts for many provisioning and supporting services andsome regulating services by representing their flows inphysical units. Existing LCA methods do account for someecological resources, mainly provisioning services, andsuggest aggregation schemes discussed in section 1. Eco-LCA considers a much larger variety of ecological resourcesand develops a hierarchy of metrics according to the degreeof aggregation as illustrated in section 3. The methodsdiscussed in section 2.1 appear as special cases of the Eco-LCA approach, as illustrated in section 3.3.
At the economy scale, an Eco-LCA model based on the1997 U.S. economic input-output (EIO) model has beendeveloped and is available as user-friendly software (22). Itcombines the EIO model with information about the relianceof economic sectors on specific ecosystem services. Thismodel may be used to easily calculate the ecosystem servicesneeded to support the final demand from any sector. Thisapproach is similar to that of EIO-LCA (23) but with somesignificant differences due to the inclusion of ecosystemservices and the use of thermodynamic and hierarchicalmetrics in Eco-LCA (12). The results in this article are basedon a tiered hybrid Eco-LCA model developed by combiningdata about industrial processes and their supporting eco-system services with the economy-scale Eco-LCA model.
3. Application to Transportation Fuels3.1. Data Sources. This work relies on detailed data aboutthe life cycles of gasoline, corn ethanol, diesel, and soybeanbiodiesel (see Supporting Information). Relevant exergy andtransformity numbers were obtained from the literature(10, 13, 18) for inputs from ecosystems to processes in thelife cycle and to economic sectors. Such information hasbeen used to calculate ratios of physical to monetary flowfor each economic sector (12), which were used in this workfor calculating the cumulative energy, ICEC, and ECEC values
for resources from economic sectors entering the life cycleof each fuel. The ECEC values of resources were combinedto avoid double counting by considering appropriate al-location rules (18, 19). In general, the ECEC of mostcoproduced resources may not be added, while that ofresources produced over different time frames or obtainedby splitting a resource may be added. Examples of coproducedresources include sunlight, biomass, wind, rain, and hydro-potential since they are driven by solar input and producedconcurrently. ECEC of soil may be added to that of sunlightsince soil may be considered to be the product of energyavailable in the past. Also, the ECEC values of variousnonrenewable resources may be added since their trans-formities are calculated by allocating the inputs in proportionto the quantity of each resource. A similar approach has alsobeen used for calculating CEENE (17). To determine the well-to-wheel efficiency, distance traveled per unit of ICEC andECEC were calculated for a Chevrolet Impala 2006 and alight-duty truck (LDT2).
ICEC was allocated among coproducts in proportion totheir mass and market values to evaluate the effect of theallocation method, but the results in this section are mainlyfrom mass-based allocation. Market-value-based allocationassigns more weight to fuels than their correspondingcoproducts, causing the ICEC metrics to be larger. However,the overall trend between different fuels remains unchanged,as shown in Supporting Information. Following the emergyalgebra rules, ECEC was not allocated since coproducts havedifferent physical and chemical characteristics and henceshould have different transformities (18). Sensitivity of ICECand ECEC was analyzed by varying crop yields per hectare.
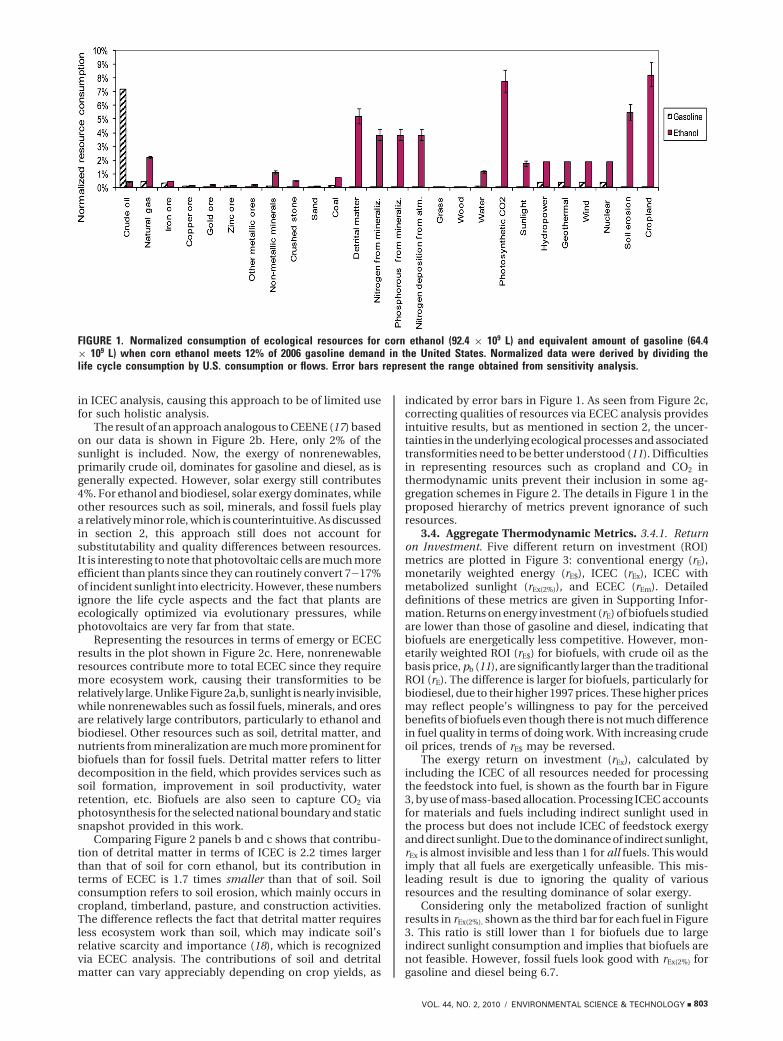
3.2. Disaggregated Normalized Data. For comparing theuse of multiple resources, Figure 1 shows the results fromthe hybrid Eco-LCA models for corn ethanol and gasolineafter the life cycle consumption of each resource wasnormalized with the corresponding total U.S. consumptionor flow. This graph is for a future scenario in which cornethanol would substitute 12% of motor gasoline demand inthe US: 64.4 billion liters (17 billion gallons) in 2006 (8), whichamounts to 92.4 billion liters (24.4 billion gallons) of cornethanol based on the capacity of the fuel to drive a vehiclefor a kilometer. The normalized values indicate the limitingfactors and vulnerabilities to loss of ecological resources ofeach fuel.
As shown, soil erosion, cropland use, and nitrogen andphosphorus from mineralization would account for 5%, 8%,and 4% of the national consumption, respectively. Thesenumbers are for mass-based allocation. Without allocation,they will double since mass-based allocation assigns about50% share to corn ethanol. Among the resources considered,consumption of nitrogen and phosphorus from mineraliza-tion, soil erosion, and cropland use can vary appreciablydepending on corn and soybean yields, as shown by thesensitivity bars in Figure 1.
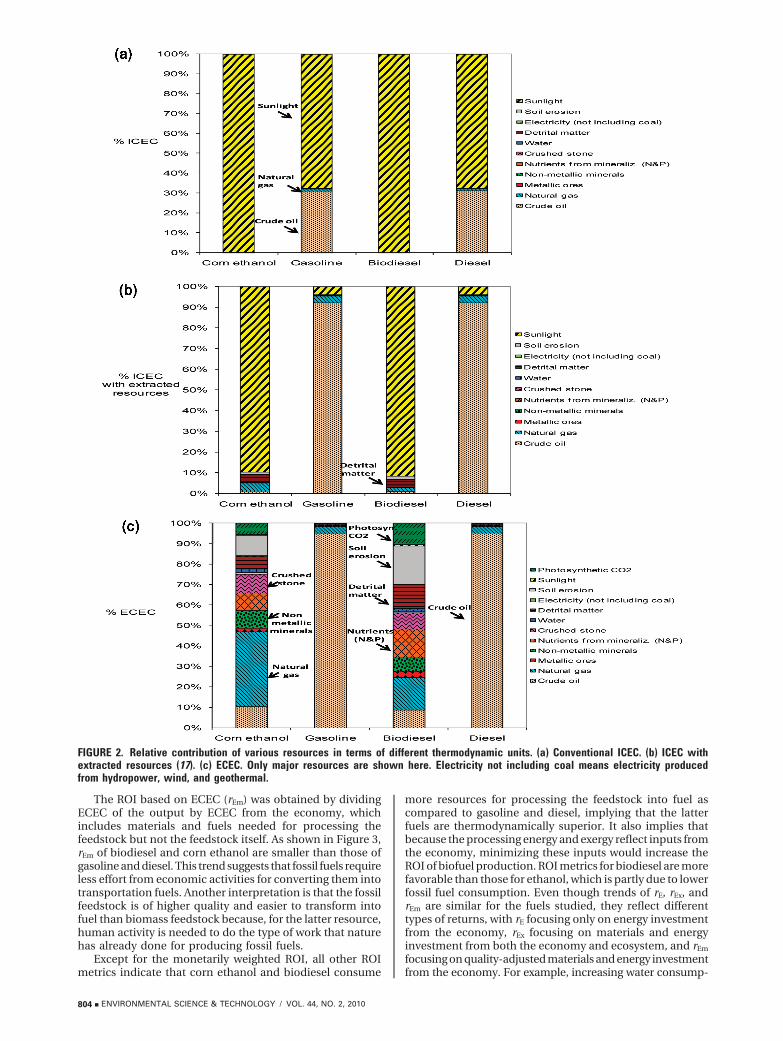
3.3. Disaggregated Thermodynamic Data. Figure 2depicts the relative contribution of each resource in termsof ICEC, ICEC with metabolized sunlight, and ECEC of variousfuels. As can be seen from Figure 2a, sunlight emerges as thepredominant contributor to ICEC, even for gasoline anddiesel. Although sunlight is not directly involved in theproduction of petroleum-based fuels, it is consumed indi-rectly via the supporting economic activities. In ICEC, solarexergy is based on the large amount of sunlight irradiatedto forestry and agriculture per year, and even a small fractiontransferred to other economic sectors from the forestry andagriculture sectors translates into very high ICEC in com-parison to the exergy consumed via other resources. Sunlightis a very dilute and low-quality resource as compared tocrude oil and other resources, but this difference is ignored
802 9 ENVIRONMENTAL SCIENCE & TECHNOLOGY / VOL. 44, NO. 2, 2010
in ICEC analysis, causing this approach to be of limited usefor such holistic analysis.
The result of an approach analogous to CEENE (17) basedon our data is shown in Figure 2b. Here, only 2% of thesunlight is included. Now, the exergy of nonrenewables,primarily crude oil, dominates for gasoline and diesel, as isgenerally expected. However, solar exergy still contributes4%. For ethanol and biodiesel, solar exergy dominates, whileother resources such as soil, minerals, and fossil fuels playa relatively minor role, which is counterintuitive. As discussedin section 2, this approach still does not account forsubstitutability and quality differences between resources.It is interesting to note that photovoltaic cells are much moreefficient than plants since they can routinely convert 7-17%of incident sunlight into electricity. However, these numbersignore the life cycle aspects and the fact that plants areecologically optimized via evolutionary pressures, whilephotovoltaics are very far from that state.
Representing the resources in terms of emergy or ECECresults in the plot shown in Figure 2c. Here, nonrenewableresources contribute more to total ECEC since they requiremore ecosystem work, causing their transformities to berelatively large. Unlike Figure 2a,b, sunlight is nearly invisible,while nonrenewables such as fossil fuels, minerals, and oresare relatively large contributors, particularly to ethanol andbiodiesel. Other resources such as soil, detrital matter, andnutrients from mineralization are much more prominent forbiofuels than for fossil fuels. Detrital matter refers to litterdecomposition in the field, which provides services such assoil formation, improvement in soil productivity, waterretention, etc. Biofuels are also seen to capture CO2 viaphotosynthesis for the selected national boundary and staticsnapshot provided in this work.
Comparing Figure 2 panels b and c shows that contribu-tion of detrital matter in terms of ICEC is 2.2 times largerthan that of soil for corn ethanol, but its contribution interms of ECEC is 1.7 times smaller than that of soil. Soilconsumption refers to soil erosion, which mainly occurs incropland, timberland, pasture, and construction activities.The difference reflects the fact that detrital matter requiresless ecosystem work than soil, which may indicate soil’srelative scarcity and importance (18), which is recognizedvia ECEC analysis. The contributions of soil and detritalmatter can vary appreciably depending on crop yields, as
indicated by error bars in Figure 1. As seen from Figure 2c,correcting qualities of resources via ECEC analysis providesintuitive results, but as mentioned in section 2, the uncer-tainties in the underlying ecological processes and associatedtransformities need to be better understood (11). Difficultiesin representing resources such as cropland and CO2 inthermodynamic units prevent their inclusion in some ag-gregation schemes in Figure 2. The details in Figure 1 in theproposed hierarchy of metrics prevent ignorance of suchresources.
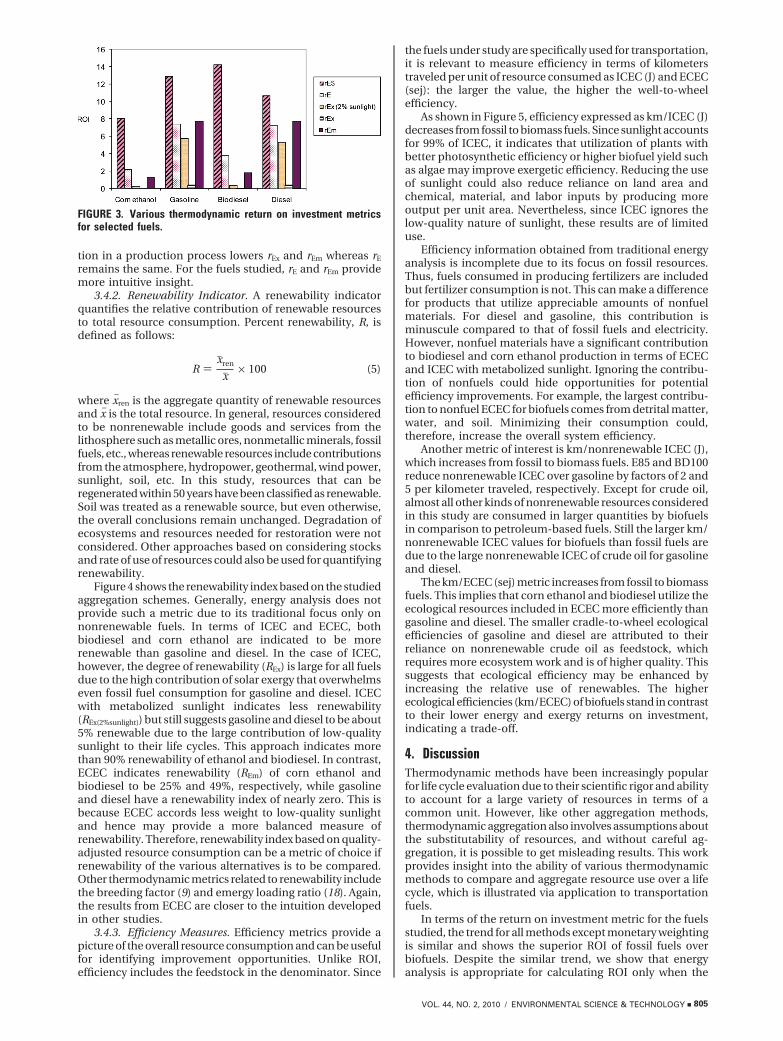
3.4. Aggregate Thermodynamic Metrics. 3.4.1. Returnon Investment. Five different return on investment (ROI)metrics are plotted in Figure 3: conventional energy (rE),monetarily weighted energy (rE$), ICEC (rEx), ICEC withmetabolized sunlight (rEx(2%)), and ECEC (rEm). Detaileddefinitions of these metrics are given in Supporting Infor-mation. Returns on energy investment (rE) of biofuels studiedare lower than those of gasoline and diesel, indicating thatbiofuels are energetically less competitive. However, mon-etarily weighted ROI (rE$) for biofuels, with crude oil as thebasis price, pb (11), are significantly larger than the traditionalROI (rE). The difference is larger for biofuels, particularly forbiodiesel, due to their higher 1997 prices. These higher pricesmay reflect people’s willingness to pay for the perceivedbenefits of biofuels even though there is not much differencein fuel quality in terms of doing work. With increasing crudeoil prices, trends of rE$ may be reversed.
The exergy return on investment (rEx), calculated byincluding the ICEC of all resources needed for processingthe feedstock into fuel, is shown as the fourth bar in Figure3, by use of mass-based allocation. Processing ICEC accountsfor materials and fuels including indirect sunlight used inthe process but does not include ICEC of feedstock exergyand direct sunlight. Due to the dominance of indirect sunlight,rEx is almost invisible and less than 1 for all fuels. This wouldimply that all fuels are exergetically unfeasible. This mis-leading result is due to ignoring the quality of variousresources and the resulting dominance of solar exergy.
Considering only the metabolized fraction of sunlightresults in rEx(2%), shown as the third bar for each fuel in Figure3. This ratio is still lower than 1 for biofuels due to largeindirect sunlight consumption and implies that biofuels arenot feasible. However, fossil fuels look good with rEx(2%) forgasoline and diesel being 6.7.
FIGURE 1. Normalized consumption of ecological resources for corn ethanol (92.4 × 10⁹ L) and equivalent amount of gasoline (64.4× 10⁹ L) when corn ethanol meets 12% of 2006 gasoline demand in the United States. Normalized data were derived by dividing thelife cycle consumption by U.S. consumption or flows. Error bars represent the range obtained from sensitivity analysis.
VOL. 44, NO. 2, 2010 / ENVIRONMENTAL SCIENCE & TECHNOLOGY 9 803
The ROI based on ECEC (rEm) was obtained by dividingECEC of the output by ECEC from the economy, whichincludes materials and fuels needed for processing thefeedstock but not the feedstock itself. As shown in Figure 3,rEm of biodiesel and corn ethanol are smaller than those ofgasoline and diesel. This trend suggests that fossil fuels requireless effort from economic activities for converting them intotransportation fuels. Another interpretation is that the fossilfeedstock is of higher quality and easier to transform intofuel than biomass feedstock because, for the latter resource,human activity is needed to do the type of work that naturehas already done for producing fossil fuels.
Except for the monetarily weighted ROI, all other ROImetrics indicate that corn ethanol and biodiesel consume
more resources for processing the feedstock into fuel ascompared to gasoline and diesel, implying that the latterfuels are thermodynamically superior. It also implies thatbecause the processing energy and exergy reflect inputs fromthe economy, minimizing these inputs would increase theROI of biofuel production. ROI metrics for biodiesel are morefavorable than those for ethanol, which is partly due to lowerfossil fuel consumption. Even though trends of rE, rEx, andrEm are similar for the fuels studied, they reflect differenttypes of returns, with rE focusing only on energy investmentfrom the economy, rEx focusing on materials and energyinvestment from both the economy and ecosystem, and rEm
focusing on quality-adjusted materials and energy investmentfrom the economy. For example, increasing water consump-
FIGURE 2. Relative contribution of various resources in terms of different thermodynamic units. (a) Conventional ICEC. (b) ICEC withextracted resources (17). (c) ECEC. Only major resources are shown here. Electricity not including coal means electricity producedfrom hydropower, wind, and geothermal.
804 9 ENVIRONMENTAL SCIENCE & TECHNOLOGY / VOL. 44, NO. 2, 2010
tion in a production process lowers rEx and rEm whereas rE
remains the same. For the fuels studied, rE and rEm providemore intuitive insight.
3.4.2. Renewability Indicator. A renewability indicatorquantifies the relative contribution of renewable resourcesto total resource consumption. Percent renewability, R, isdefined as follows:
R )xjren
xj× 100 (5)
where jxren is the aggregate quantity of renewable resourcesand jx is the total resource. In general, resources consideredto be nonrenewable include goods and services from thelithosphere such as metallic ores, nonmetallic minerals, fossilfuels, etc., whereas renewable resources include contributionsfrom the atmosphere, hydropower, geothermal, wind power,sunlight, soil, etc. In this study, resources that can beregenerated within 50 years have been classified as renewable.Soil was treated as a renewable source, but even otherwise,the overall conclusions remain unchanged. Degradation ofecosystems and resources needed for restoration were notconsidered. Other approaches based on considering stocksand rate of use of resources could also be used for quantifyingrenewability.
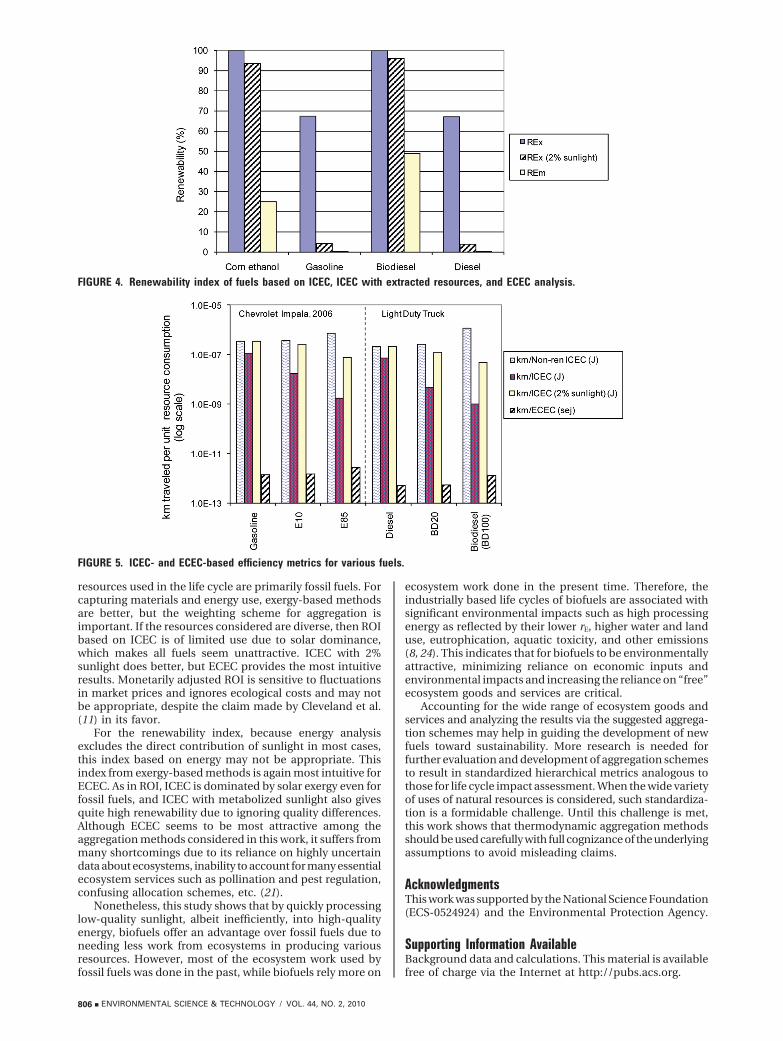
Figure 4 shows the renewability index based on the studiedaggregation schemes. Generally, energy analysis does notprovide such a metric due to its traditional focus only onnonrenewable fuels. In terms of ICEC and ECEC, bothbiodiesel and corn ethanol are indicated to be morerenewable than gasoline and diesel. In the case of ICEC,however, the degree of renewability (REx) is large for all fuelsdue to the high contribution of solar exergy that overwhelmseven fossil fuel consumption for gasoline and diesel. ICECwith metabolized sunlight indicates less renewability(REx(2%sunlight)) but still suggests gasoline and diesel to be about5% renewable due to the large contribution of low-qualitysunlight to their life cycles. This approach indicates morethan 90% renewability of ethanol and biodiesel. In contrast,ECEC indicates renewability (REm) of corn ethanol andbiodiesel to be 25% and 49%, respectively, while gasolineand diesel have a renewability index of nearly zero. This isbecause ECEC accords less weight to low-quality sunlightand hence may provide a more balanced measure ofrenewability. Therefore, renewability index based on quality-adjusted resource consumption can be a metric of choice ifrenewability of the various alternatives is to be compared.Other thermodynamic metrics related to renewability includethe breeding factor (9) and emergy loading ratio (18). Again,the results from ECEC are closer to the intuition developedin other studies.
3.4.3. Efficiency Measures. Efficiency metrics provide apicture of the overall resource consumption and can be usefulfor identifying improvement opportunities. Unlike ROI,efficiency includes the feedstock in the denominator. Since
the fuels under study are specifically used for transportation,it is relevant to measure efficiency in terms of kilometerstraveled per unit of resource consumed as ICEC (J) and ECEC(sej): the larger the value, the higher the well-to-wheelefficiency.
As shown in Figure 5, efficiency expressed as km/ICEC (J)decreases from fossil to biomass fuels. Since sunlight accountsfor 99% of ICEC, it indicates that utilization of plants withbetter photosynthetic efficiency or higher biofuel yield suchas algae may improve exergetic efficiency. Reducing the useof sunlight could also reduce reliance on land area andchemical, material, and labor inputs by producing moreoutput per unit area. Nevertheless, since ICEC ignores thelow-quality nature of sunlight, these results are of limiteduse.
Efficiency information obtained from traditional energyanalysis is incomplete due to its focus on fossil resources.Thus, fuels consumed in producing fertilizers are includedbut fertilizer consumption is not. This can make a differencefor products that utilize appreciable amounts of nonfuelmaterials. For diesel and gasoline, this contribution isminuscule compared to that of fossil fuels and electricity.However, nonfuel materials have a significant contributionto biodiesel and corn ethanol production in terms of ECECand ICEC with metabolized sunlight. Ignoring the contribu-tion of nonfuels could hide opportunities for potentialefficiency improvements. For example, the largest contribu-tion to nonfuel ECEC for biofuels comes from detrital matter,water, and soil. Minimizing their consumption could,therefore, increase the overall system efficiency.
Another metric of interest is km/nonrenewable ICEC (J),which increases from fossil to biomass fuels. E85 and BD100reduce nonrenewable ICEC over gasoline by factors of 2 and5 per kilometer traveled, respectively. Except for crude oil,almost all other kinds of nonrenewable resources consideredin this study are consumed in larger quantities by biofuelsin comparison to petroleum-based fuels. Still the larger km/nonrenewable ICEC values for biofuels than fossil fuels aredue to the large nonrenewable ICEC of crude oil for gasolineand diesel.
The km/ECEC (sej) metric increases from fossil to biomassfuels. This implies that corn ethanol and biodiesel utilize theecological resources included in ECEC more efficiently thangasoline and diesel. The smaller cradle-to-wheel ecologicalefficiencies of gasoline and diesel are attributed to theirreliance on nonrenewable crude oil as feedstock, whichrequires more ecosystem work and is of higher quality. Thissuggests that ecological efficiency may be enhanced byincreasing the relative use of renewables. The higherecological efficiencies (km/ECEC) of biofuels stand in contrastto their lower energy and exergy returns on investment,indicating a trade-off.
4. DiscussionThermodynamic methods have been increasingly popularfor life cycle evaluation due to their scientific rigor and abilityto account for a large variety of resources in terms of acommon unit. However, like other aggregation methods,thermodynamic aggregation also involves assumptions aboutthe substitutability of resources, and without careful ag-gregation, it is possible to get misleading results. This workprovides insight into the ability of various thermodynamicmethods to compare and aggregate resource use over a lifecycle, which is illustrated via application to transportationfuels.
In terms of the return on investment metric for the fuelsstudied, the trend for all methods except monetary weightingis similar and shows the superior ROI of fossil fuels overbiofuels. Despite the similar trend, we show that energyanalysis is appropriate for calculating ROI only when the
FIGURE 3. Various thermodynamic return on investment metricsfor selected fuels.
VOL. 44, NO. 2, 2010 / ENVIRONMENTAL SCIENCE & TECHNOLOGY 9 805
resources used in the life cycle are primarily fossil fuels. Forcapturing materials and energy use, exergy-based methodsare better, but the weighting scheme for aggregation isimportant. If the resources considered are diverse, then ROIbased on ICEC is of limited use due to solar dominance,which makes all fuels seem unattractive. ICEC with 2%sunlight does better, but ECEC provides the most intuitiveresults. Monetarily adjusted ROI is sensitive to fluctuationsin market prices and ignores ecological costs and may notbe appropriate, despite the claim made by Cleveland et al.(11) in its favor.
For the renewability index, because energy analysisexcludes the direct contribution of sunlight in most cases,this index based on energy may not be appropriate. Thisindex from exergy-based methods is again most intuitive forECEC. As in ROI, ICEC is dominated by solar exergy even forfossil fuels, and ICEC with metabolized sunlight also givesquite high renewability due to ignoring quality differences.Although ECEC seems to be most attractive among theaggregation methods considered in this work, it suffers frommany shortcomings due to its reliance on highly uncertaindata about ecosystems, inability to account for many essentialecosystem services such as pollination and pest regulation,confusing allocation schemes, etc. (21).
Nonetheless, this study shows that by quickly processinglow-quality sunlight, albeit inefficiently, into high-qualityenergy, biofuels offer an advantage over fossil fuels due toneeding less work from ecosystems in producing variousresources. However, most of the ecosystem work used byfossil fuels was done in the past, while biofuels rely more on
ecosystem work done in the present time. Therefore, theindustrially based life cycles of biofuels are associated withsignificant environmental impacts such as high processingenergy as reflected by their lower rE, higher water and landuse, eutrophication, aquatic toxicity, and other emissions(8, 24). This indicates that for biofuels to be environmentallyattractive, minimizing reliance on economic inputs andenvironmental impacts and increasing the reliance on “free”ecosystem goods and services are critical.
Accounting for the wide range of ecosystem goods andservices and analyzing the results via the suggested aggrega-tion schemes may help in guiding the development of newfuels toward sustainability. More research is needed forfurther evaluation and development of aggregation schemesto result in standardized hierarchical metrics analogous tothose for life cycle impact assessment. When the wide varietyof uses of natural resources is considered, such standardiza-tion is a formidable challenge. Until this challenge is met,this work shows that thermodynamic aggregation methodsshould be used carefully with full cognizance of the underlyingassumptions to avoid misleading claims.
AcknowledgmentsThis work was supported by the National Science Foundation(ECS-0524924) and the Environmental Protection Agency.
Supporting Information AvailableBackground data and calculations. This material is availablefree of charge via the Internet at http://pubs.acs.org.
FIGURE 4. Renewability index of fuels based on ICEC, ICEC with extracted resources, and ECEC analysis.
FIGURE 5. ICEC- and ECEC-based efficiency metrics for various fuels.
806 9 ENVIRONMENTAL SCIENCE & TECHNOLOGY / VOL. 44, NO. 2, 2010
Literature Cited(1) Bare, J. C.; Norris, G. A.; Pennington, D. W.; McKone, T. TRACI:
The tool for the reduction and assessment of chemical andother environmental impacts. J. Ind. Ecol. 2002, 6 (3-4), 49–78.
(2) Goedkoop, M.; Spriensma, R. Eco-Indicator 99: A DamageOriented Method for Life Cycle Impact Assessment; Pre Consult-ants: Amersfoort, The Netherlands, 2000. Available at http://www.leidenuniv.nl/cml/ssp/projects/lca2/report_abiotic_de-pletion_web.pdf (accessed on July 2, 2009).
(3) Van Oers, L.; De Koning, A.; Guinee, J. B.; Huppes, G. AbioticResource Depletion in LCAsImproving Characterisation Factorsfor Abiotic Resource Depletion as Recommended in the New DutchLCA Handbook; Report DWW-2002-061; RWS-DWW, Road andHydraulic Engineering Institute, Public Works Department,Delft, The Netherlands, 2000.
(4) Ewing, B.; Reed, A.; Rizk, S. M.; Galli, A.; Wackernagel, M., Kitzes,J. Calculation Methodology for the National Footprints Accounts,version 1.1; Global Footprint: Oakland, CA, 2008. Available athttp://www.footprintnetwork.org/en/index.php/GFN/page/ecological_footprint_atlas_2008 (accessed on July 2, 2009).
(5) Schulz, W. The costs of biofuels. Chem. Eng. News 2007, 85 (51),12–16.
(6) Pimentel, D.; Patzek, T. Ethanol production using corn, switch-grass, and wood; biodiesel production using soybean andsunflower. Nat. Resour. Res. 2005, 14 (1), 65–76.
(7) Farrell, A. E.; Plevin, R. J.; Turner, B. T.; Jones, A. D.; O’Hare,M.; Kammen, D. M. Ethanol can contribute to energy andenvironmental goals. Science 2006, 311 (5760), 506–508.
(8) Hill, J.; Nelson, E.; Tilman, D.; Polasky, S.; Tiffany, D. Environ-mental, economic, and energetic costs and benefits of biodieseland ethanol biofuels. Proc. Natl. Acad. Sci. U.S.A. 2006, 103(30), 11206–11210.
(9) Dewulf, J.; Van Langenhove, H.; Van De Velde, B. Exergy-basedrenewability assessment of biofuel production. Environ. Sci.Technol. 2005, 39 (10), 3878–3882.
(10) Patzek, T. W. Thermodynamics of the corn-ethanol biofuel cycle.Crit. Rev. Plant Sci. 2004, 23 (6), 519–567.
(11) Cleveland, C. J.; Kaufman, R. K.; Stern, D. I. Aggregation and therole of energy in the economy. Ecol. Econ. 2000, 32 (2), 301–317.
(12) Zhang, Y., Baral. A., Bakshi, B. R. Toward accounting forecological resources in life cycle assessment. Environ. Sci.Technol. (accepted).
(13) Szargut, J.; Morris, D. R.; Steward, F. R. Exergy Analysis ofThermal, Chemical and Metallurgical Processes, 1st ed.; Hemi-sphere Publications: New York, 1988.
(14) Cuengel, Y. A.; Boles, M. A. Thermodynamics, an EngineeringApproach; McGraw-Hill Inc: New York, 1994.
(15) Berthiaume, R.; Bouchard, C.; Rosen, M. A. Exergetic evaluationof the renewability of a biofuel. Exergy Int. J. 2001, 1 (4), 256–268.
(16) Ukidwe, N. U.; Bakshi, B. R. Industrial and ecological cumulativeexergy consumption of the United States via the 1997 input-output benchmark model. Energy 2007, 32, 1560–1592.
(17) Dewulf, J.; Bosch, M. E.; De Meester, B.; Van der Vorst, G.; VanLangenhove, H.; Hellweg, S.; Huijbregts, M. A. J. Cumulativeexergy extraction from the natural environment (CEENE): acomprehensive life cycle impact assessment method for resourceaccounting. Environ. Sci. Technol. 2007, 41 (24), 8477–8483.
(18) Odum, H. T. Emergy and Environmental Decision Making; JohnWiley & Sons: New York, 1996.
(19) Hau, J. L.; Bakshi, B. R. Expanding exergy analysis to accountfor ecosystem products and services. Environ. Sci. Technol. 2004,38 (13), 3768–3777.
(20) Giampietro, P. Comments on “The energetic metabolism of theEuropean Union and the United States” by Haberl andcolleagues. J. Ind. Ecol. 2006, 10 (4), 173–185.
(21) Hau, J. L.; Bakshi, B. R. Promise and problems of emergy analysis.Ecol. Model. 2004, 178 (1-2), 215.
(22) Center for Resilience and Process Systems Engineering Group.Ecologically-Based Life Cycle Assessment (Eco-LCA). Availableat resilience.osu.edu/ecolca-ui/ (accessed on April 10, 2009).
(23) Green Design Institute. EIOLCA.net, Carnegie Mellon University.Available at http://www.eiolca.net/about.html (accessed onApril 2009).
(24) Kim, S.; Dale, B. Environmental aspects of ethanol derived fromno-tilled corn grain: nonrenewable energy consumption andgreenhouse gas emissions. Biomass Bioenergy 2005, 28, 475–489.
ES902571B
VOL. 44, NO. 2, 2010 / ENVIRONMENTAL SCIENCE & TECHNOLOGY 9 807