Thermal expansion of clay building bricks - Nvlpubs.nist.gov
21
U. S. DEPARTMENT OF COMMERCE NATIONAL BUREAU OP STANDARDS RESEARCH PAPER RP1414 Part of Journal of Research of the N.ational Bureau of Standards, Volume 27. August 1941 THERMAL EXPANSION OF CLAY BUILDING BRICKS By Culbertson W. Ross ABSTRACT The coefficients of thermal expansion of 139 bricks were measured over the range -10° to +40 0 C (14 0 to 104 0 F). These bricks included 1 sampl e of sand-lime, 9 of fire-cl ay , and 61 of clay and shale bricks. The clay and shale bricks repre- sented a wide range in properti es and included samples from various districts in the United States. Th e coefficients of 87 per cent of the cl ay and shale bricks were between 5 and 7 millionths per 0 C (2.8 to 3.9 per 0 F). The average coefficient of the clay bricks was 6.0 (3.3), of the shale bricks 6.1 (3.4), and of the fireclay bricks 3.9 millionths per 0 C (2 .2 per 0 F). No relation was observed between the thermal expansion and the other physical properties of the bricks. CONTENTS Page I. Introduction _______________ _____________________ _________ _______ 197 II. Description of apparatus __________ ___________ ____ _____ _____ ___ ___ 198 III. Test procedure__ ________________ ________________________ ________ 202 IV. Accuracy of the measur ements __ _______ _____________________ ______ 202 V. Experimental results _______ _______ ______________ _________ _____ ___ 213 VI. Conclusions _____ ________ _____ ____ __ __ _____ ________ __ ___________ 215 I. INTRODUCTION The change in length of building bricks du e to temperature changes is one of the factors sometimes blamed for cracking of brick-masonry walls. Inasmuch as a bett er knowledge of the thermal expansion of bricks should be useful in the study of this and other problems of structural design, measurements have been made of the linear thermal expansion of 139 bricks, representing 1 lot of sand-lime, 9 of fire-clay, and 61 of clay and shale bricks. These bricks, representing the product of various localities in the United States, were available from other investigations and tests and comprised bricks having a wide range in properties. The coefficients of expansion were measured over the temperature range _10 0 to +40 0 C (14 0 to 104 0 F), or approximately the range to which they might be subjected in structures. The other physical tests which are customarily used a.s a measure of quality have been made on the bricks as a matter of record and in the hope that there might be some relation between them and the thermal expansion. Previous tests of the thermal expansion of bricks have usually been made in connection with the study of some other property of the bricks and are not very extensive. The Watertown Arsenal report of 1896 gives th e thermal expansion of ;22 claY' Il-nd hricks over the temperA-tur t) range 33 0 to 212 0 F 197
-
Upload
khangminh22 -
Category
Documents
-
view
0 -
download
0
Transcript of Thermal expansion of clay building bricks - Nvlpubs.nist.gov
U. S. DEPARTMENT OF COMMERCE NATIONAL BUREAU OP STANDARDS
RESEARCH PAPER RP1414
Part of Journal of Research of the N.ational Bureau of Standards, Volume 27. August 1941
THERMAL EXPANSION OF CLAY BUILDING BRICKS
By Culbertson W. Ross
ABSTRACT
The coefficients of thermal expansion of 139 bricks were measured over the range -10° to +400 C (140 to 1040 F). These bricks included 1 sample of sand-lime, 9 of fire-clay, and 61 of clay and shale bricks. The clay and shale bricks represented a wide range in properties and included samples from various districts in the United States.
The coefficients of 87 percent of the clay and shale bricks were between 5 and 7 millionths per 0 C (2.8 to 3.9 per 0 F). The average coefficient of the clay bricks was 6.0 (3.3), of the shale bricks 6.1 (3.4), and of the fireclay bricks 3.9 millionths per 0 C (2.2 per 0 F). No relation was observed between the thermal expansion and the other physical properties of the bricks.
CONTENTS Page
I. Introduction _______________ _____________________ _________ _______ 197 II. Description of apparatus __________ ___________ ____ _____ _____ ___ ___ 198
III. Test procedure__ _ _ _ _ _ _ _ _ _ _ _ _ _ _ _ _ _ _ _ _ _ _ _ _ _ _ _ _ _ _ _ _ _ _ _ _ _ _ _ _ _ _ _ _ _ _ _ _ 202 IV. Accuracy of the measurements __ _______ _____________________ ______ 202 V. Experimental results _______ _______ ______________ _________ _____ ___ 213
VI. Conclusions _____ ________ _____ ____ __ __ _____ ________ __ ___________ 215
I. INTRODUCTION
The change in length of building bricks due to temperature changes is one of the factors sometimes blamed for cracking of brick-masonry walls. Inasmuch as a better knowledge of the thermal expansion of bricks should be useful in the study of this and other problems of structural design, measurements have been made of the linear thermal expansion of 139 bricks, representing 1 lot of sand-lime, 9 of fire-clay, and 61 of clay and shale bricks. These bricks, representing the product of various localities in the United States, were available from other investigations and tests and comprised bricks having a wide range in properties. The coefficients of expansion were measured over the temperature range _10 0 to +40 0 C (140 to 1040 F), or approximately the range to which they might be subjected in structures. The other physical tests which are customarily used a.s a measure of quality have been made on the bricks as a matter of record and in the hope that there might be some relation between them and the thermal expansion.
Previous tests of the thermal expansion of bricks have usually been made in connection with the study of some other property of the bricks and are not very extensive.
The Watertown Arsenal report of 1896 gives the thermal expansion of ;22 claY' Il-nd shal~ hricks over the temperA-turt) range 33 0 to 212 0 F
197
198 Journal oj Research oj the National Bureau oj Standards {Vol. 17
(approx. 00 to 1000 C). The bricks were kept immersed in water, and tbe changes in length were measured by means of a 6-inch strain-gage r eading to 0.0001 inch. The coefficients of thermal expansion ranged from 3.7 to 13.6 millionths per 0 C (2.1 to 7.6 per 0 F), with an average of 6.3 (3.5). Fifty percent were within the range 5 to 7 (2.8 to 3.9).
Palmer 1 reported t ests on six types of clay and shale and two types of fire-clay bricks. A 20-inch Whittemore strain gage was used to measure the length changes in specimens consisting of three bricks cemented together with litharge-glycerin cement. The bricks were measured in a cold room at _80 C and in another room at + 250 C. (17.6 0 and 77 0 F). Bricks of each type were divided into two classes, one harder burned than the other. The thermal expansion of the harder burned bricks was in general somewhat less than that of the softer bricks. The coefficients of thermal expansion of the clay and shale bricks were between 3.9 and 8.5 millionths per 0 C (2.2 to 4.7 per 0 F), with an average of 5.6 (3.1). The coefficient for the fireclay bricks was about 3.7 millionths per 0 C (2.1 per 0 F).
Ingberg and Foster 2 reported thermal-expansion measurements on 16 hollow clay tile, a material somewhat similar to clay bricks. These measurements were made by the interferometer method and over a much larger temperature range than used in the present investigation. From 00 to 3000 C (320 to 572 0 F) , the coefficients ranged from 5.1 to 7.3 millionths per 0 C (2.8 0 to 4.1 per 0 F) for the 10 clay and shale tile, with an average of 6.2 (3.4). The range of the coefficients of the six fire-clay tile was from 3.5 to 6.8 millionths per o C (1.9 0 to 3.8 per 0 F), with an average of 5.5 (3.1).
II. DESCRIPTION OF APPARATUS
The Tuckerman optical strain gage 3 was used to make the thermalexpansion measurements in this investigation. The thermal expansion of the gage was determined by noting the change of the reading with a change in temperature when the gage was mounted on a metal bar, which had been measured from _10 0 to +400 C in the thermalexpansion section of this Bureau. In the same way, the change in the reading between different temperatures with the gage mounted on a brick gave the difference between the thermal expansion of the gage and brick, and thus the thermal expansion of the brick.
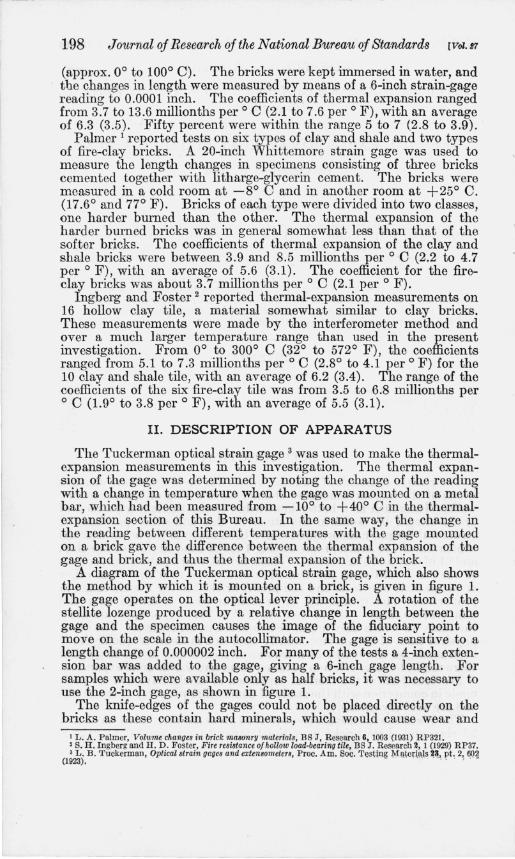
A diagram of the Tuckerman optical strain gage, which also shows the method by which it is mounted on a brick, is given in figure 1. The gage operates on the optical lever principle. A rotation of the stellite lozenge produced by a relative change in length between the gage and the specimen causes the image of the fiduciary point to move on the scale in the autocollimator. The gage is sensitive to a length change of 0.000002 inch. For many of the tests a 4-inch extension bar was added to the gage, giving a 6-inch gage length. For samples which were available only as half bricks, it was necessary to use the 2-inch gage, as shown in figure 1.
The knife-edges of the gages could not be placed directly on the bricks as these contain hard minerals, which would cause wear and
I L. A. P almer, Volume changes in brick masonry materials, BS J, Research 6, 1003 (1931) R P321. 2 S. H. Ingberg and H . D . Foster, Fire resistance oj hollow load·bearing tile, BS J. Research 2, 1 (1929) RP37. 3 L . B . T uckerman , Optical strain gages and extmaometers, Proc. Am. Soc. Testin" ~l\\crio ls 23\ pt. 2, 602
(1923). " ." ". . , .•

Ross] Thermal '/'!''xpansion oj Building Bricks 199
change the lever arm of the stellitc lozenge. Iron plates about 0.1 inch in width were cemented to the bricks with cellulose lnitrate cement to provide bearings for the knife-edge The gage)'IflS held on the specimen by a Drflss ring flnil screw.
\~ I '.
.~ ~
<!
~ ,;:; <;)
'" ~ , ~
" \ ,
/1\ \ \ \ \
~ , ~ , ""
~ IS. ,~
"'-." "'" .~
..3 ~ '" c ,
'"tl ,'t ., .~ ~ ;:l
c
~ ~ ., "" <:l ."
'" ',. <:l
",'0' n'::'" .t: '" ~ <> '.z; ~ c
'" <:l
,~ ~ ... - ~ <::
., "'" <>
~ ., -S '0' ~ <:l ... "" <:l .,.
Q
I ....; 1"1 ~ ~ ;:;
;.=;
Numerous tests were made, from time to time, on calibrated bars to check the constancy of the gages. The thermal expansion of a 6-inch gage, as determined by s ven tests on such a bar, is given in table 1.

200 Jou1'nal oj Research oj the National Bureau, oj Standards [Vol, tfr
TAJlLE l.- Coefficient of thermal expansion of 6-inch gage H, as determined by seven tests on a calibrated bar over a period of 2)1:; years
Coefficient of I I Date thermal expan-sion, _ 10° to
+400 C 1---------, -i I ,Millionths per 0 C I Jnne H , 1937__ ___ ____________ ____ ________ 11.78
August 12, 1937___ __ ___________ _____ ___ __ _ 11.76 I February 3,1938____________________ _____ 11.78
i J~,~~'~~rM8 -1-9-~~~~~~:: :: : : :::: ::: : ::::::: ~;:~~ I Angust 31, 1939_____ _____ ____ ______ ___ ____ 11.77 ! February 17, 1940 _______ __ ___ ____ __ ____ __ 11.79 ,
The coefficients of thermal expansion of an iron bar as determined by four tests with 2-inch gages and of an aluminum alloy bar as deter~ mined by two tests are given in table 2. These show the reproducibility of data obtained with 2-inch gages on metal bars which did not require mounting plates.
TABLE 2.-CoeJficient of thermal expansion of an iron bar and of an aluminum alloy bar, as determined by tests with 2-inch gages
Gage
Coefficient oC
t~k:~'~ i~P~~-+100 C, of an
iron bar
Milli01lth8 per 0 C D_ ___ _________ _ 11. 38 R______ __ __ ___ 11.43 F_ _____ ____ ____ 11. 36 G_ __ ____ __ ____ _ 11.38
I Coefficient of I[
I th.errnal ex,pan-
Gage slOno -10 to +40 C, of an
'1 alum~~ alloy I D ______ ___ ,. __ _ . MilIiO'/llh8~iT3;C 0 ______ ____ ____ 1 22.33
A sketch of the controlled temperature oven in which the tests were made is shown in figure 2. Approximately 1 watt per 00 elevation above room temperature was required to balance the heat loss. The heat input was controlled manually. The copper plates distributed the heat so that, at equilibrium, there was less than 0.10 0 difference between the temperatures of the thermometers. The temperature for the lower point of the range was obtained by circulating cold brine through the copper tubes neal' the top and bottom of the oven.
The temperatures were measured by means of six copper wire "esistance thermometers placed in the copper box about the bricks ill t.he locations shown. Their resistance was measured with a Whcat.. tone bridge and galvanometer. They were calibrated to 0.10 0 by means of a six-jullction thermocouple and a portable potentiometer after being placed in the oven. The calibration was checked on seyeral later occasions and showed no change as great as 0.10 O.
The gages were read with the autocollimator through holes in the eover of the oven. These holes were normany closed by wooden plugs. The removal of the plugs did not I).How enough au' to circulate J'I'Om the room Ulto the oven to cause an observable change in the readjng of the gage in the few seconds reqnlred for the Tr,easurcment.

13;:"1---151 .
r.
F/?OIYT //Ie#' (Coyer remoyeo' one! 17/09'<:'0" door or Copper box omil/ed J
SECTlOIY ON 1l-11
FIGURE 2.-Diagram of the Dilen in which the thermal expansion tests were made.

202 Journal of Research of the N at'ional Burea1l of Standards [Vol, $7
The bricks were supported in the oven by small pieces of rubber cut from automobile tire inner tubes, which allowed the position of the bricks to be adjusted so that the gages could be viewed through the openings in the oven and helped to prevent vibration from the floor being transmitted to the bricks and gages.
III. TEST PROCEDURE
The bricks were dried at a temperature of 105° to 110° C before the tests. The gages were then mounted on the bricks and the bricks and gages placed in the oven and their position adjusted so that the gages could be viewed through the openings in the door of the oven.
The temperature of the oven was raised to about 40° C and, after the temperature of the oven thermometers became uniform, the readings of the gages were recorded. About 5 hours was required for the temperature to become uniform after the oven had reached the approximate temperature desired. The cooling brine was turned on and the overnight period of 17 hours was allowed for the temperature of the oven to reach the lower point of the range and become uniform, usually at about _ 10° C. The readings were again recorded and the temperature of the oven raised to 40° O.
The bricks were subjected to two cycles of cooling and hea,ting, giving four values of the thermal expansion . The average of the four values was taken as the value of the thermal expansion for the test. A number of tests were made on each brick.
Different gages usually were used in the different tests of a given brick and the tests on each brick were spread over a considerable period of time as a further check on the constancy of the gages. More tests were made on the bricks tested with the 2-inch gages than on those tested with the 6-inch gages as the data obtainecl with the shorter gage Were less consistent.
After the thermal-expansion tests were completed, the compressive strength, the modulus of rupture, the 5-hour boiling absorption, and the 24-hour water absorption were determined for the oricks in accordanc.e with m~thods of ASTM Specification 067-39.4 The compressive strength and modulus of rupture of cored bricks were computed on the basis of the actual sections rather than the gross measurements. The compressive strength and modulus of rupture of bricks 19 to 40 were determined by McBurney and Richmond.6
IV. ACCURACY OF THE MEASUREMENTS
The chief limit on the accuracy of the thermal-expansion measurements was a lack of precision in estimating the length of the portion of the bricks within the gage length. Both the iron plates and thp cellulose nitrate cement have a higher thermal expansion than thl' bricks, and considerable ullcertainty exists as to the effective point. of attachment. The 0.1 inch of the gage length occupied by the plates amounts to 5 percent of the 2-inch and 1.7 percent of the 6-inch gagr length. Discrepancies between the values of the thermal expansion from different tests on the same brick were frequ ently as large 3 S
, Am, Soc, for 'resting ?vlaterials Standards. pt. 2, 104 (1039), ' J, W. McBurney and J, 0 , Richmond-Strength, Absorption, and Resistance (0 Laboratory :r'l'cczinR
and 'l'hawing of Building Bricks Prodnced in tile United States, Building Materials nnd Structures (1940). 1 ' BS Report BMS60,
I 'I

R088] Thermal Expansion oj Building Bticks 203
this. However, as most of the tests did not give values that differed hy these amounts, and since the average of the values from several tests was taken to obtain the fi nal value, it is believed that the error in the final value for the thermal expansion of a brick is substantially Jess than 1.7 percent for the data obtained with the 6-inch gages and 5 percent with the 2-inch gages. The variation hetween different tests on metal bars which did not require the mounting plates was much less, as may be seen from titble 2.
After the oven temperature was changed, considerable time was required for the temperature of the bricks to approach that of the oven. Since a substantial difference between the temperature of the bricks and that of the gages at the time readings are made might be expected to introduce an errol', the time required for the temperatures to approach equilibrium was checked by placing a resistance thermometer in a hole drilled in the center of one of the bricks and comparing its temperature with that of the oven thermometers and the readings of the gages. These data, which were obtained while the temperature was being raised, are given in table 3. In this table the apparent coefficients of thermal expansion of the bricks have been computed, for the conditions at each time interval after 30 minutes, from the change in the readings of the gages and the change in temperature of the oven thermometer which indicated the lowest temperature. This thermometer was located at the center of the bottom of the copper box, and from its location would be expected to give a better indication of the temperature of the bricks than any of the other five shown in figure 2.
TABLE 3.- Changes in the tem.perature of the oven therm.om.eters, in the tem perature of one of the bricks, and in the readings of the gages as the temperature of the oven was raised from. the lower to the higher point of the range
I Highest I Lowest 'l'her· Change of Coefficient Change of Coeffieient Time after heat was of 6 oven of 6 ovell mometer reading of of thcr!"ul read ing of of thormal
turned on (min) ther· (her· ill brick gage I·Ion cxpa,nsl on' gage.li' on expansion I mome· mome· 101 brick 101 or Orick brick 12' of brick 122 ters ters 101-
iVfillionths Millionths M illionths Millionth8 cC °C ° C In . per tn. per °C in . p er in. per oC
0 ... . . .......... ........ -10.9 - 10.9 -10.9 0 - ---- - -- -- -- 0 ------ -- ----BO .............. .... .. .. +3. 7 +2.4 -8.0 68 .. · .. .. s:is· 75 -- - --- - --- - -GO ................ .. .... 25.0 20. 9 + 1. 7 210 230 4. 63 90 ... .... .......... .. ... 41.0 36.2 14.7 317 5.05 353 4.37 120 . .. .. ............... '12.3 39.2 26.5 332 5. 15 378 4.32 l BO .. .......... '12.4 41.1 36. 2 337 5. 30 387 4.42 240 ......... ............ . 42.2 41. 5 39.7 339 5. 31 390 4. 42 330 ................... .. 41. 8 41.6 '11.0 341 5.28 392 4.39 1,270 b ........ ...... .... 38.5 38. 4 38. 5 321 5.27 368 4.40
• From - 10.9° C to the temperature givon in the third column. b Heating current reduced slightly and oven allowed to stand all night for this reading.
The surprisingly small error caused by the temperature of the bricks, gages, and oven not being equal may be accounted for by noting in table 4 that the thermal expansion of the gages was about twice that of the bricks and that they were mounted on the surface of the bricks where their temperature would be abou t midway between that of the bricks and that of the oven thermometers. Thus, if the temperature of the oven is 40° 0, of the gage 350 0, and of the brick 30° 0, and the coefficiont for the gage is 12 millionths per °0 and for

204 Journal oj Research oj the National Bureau oj Standards [1701. t7
the briek 6 millionths pel' °C, both would be 0.000060 ineh per ineIt shorter than they would be if all temperatures were 40° C. rrhel'e woulJ then be no relative ehange in length, and the gage would read the same as it would if all the temperatures were 40° C. Several tests were made on other bricks and with the t emperature going down . as well as up, with similar results. This automatic compensation I was not used to shorten the time required for the tests and would 1
be less effective for bricks for which the thermal expansion was substantially different from those of the brieks given in table 3. For most of the bricks it lessens the likelihood of small differences between the temperatures of the bricks and gages, causing errors in the thermal expansions obtained.
TABLE 4.- Consiants a and b for expressing the thermal expansion as a two-term equation in powers of ihe temperatuTe
, I ' II I i I I I I Thermal I I I 'rhermal
Number of Constant Constant expansion , I Number of I Constant Consinn! expansion, brick ! a b -lO° to I brick a b _.100 t o
-----1 +40° c _____ 1 ________ +4~ I I, Millionlhs I Millionths
53 _________ ____ __ 1 Xlr~5 X~?~;7 p er °f,55 100.. ___________ 1 Xlr~ I X.18~; ptr o~ 15 54______________ __ -1.9.) .018 5.50 , 104 ____ ___________ , 5.55 . 012 5.00 64 __ ______________ .>.20 I .013 5.60 105 _______________ 1 5.50 . 012 5. 85 69___ _____________ 5.65 .012 ! 6. 00 11:1.._______ ______ 3.55 .011 3.00 70 ________________ 5.40 . 012 5.75114. _______________ 3. 90 . 010 4.20
76 ___ ___ .. _________ -1. 85 .011 !I
8L ______ _______ ·1.95 . 012
~L:::::::::::::I t ~ :gg 86..___ ____ _____ __ ·1 .76 .012 89 _______________ _ 90 ______________ _ _ 92 _______________ _ 94 ______ ___ _____ _ _ PD ____ __________ __
4. 85 4. 45 2. 90
5.5(, 8.10 I
.013
. 01 5
.013
. 009
. 013
5.20 5.30 5. 25 5.05 5.10
0.25 4.00 3.30 8. 35 5. gO
1l5 __________ _____ 3. 95 .012 4.30 133. _. _______ _____ 5.95 . 013 6.35 134 __ _____ ,, ___ . __ 6.15 . D13 6.55 135 _. ____________ 5. 85 . Oll 6.20 136 _______________ 4.95 . 012 5.30 137 _______________ 11. 55 .029 12.40 138 __ _____ _____ . __ 10. 85 . 028 11. 70 J 39 ___ ____ ___ _____ 9.40 .020 10.20
Stflndard bar __ __ 11. J4 . 0132 11.51 Gage Ii ____ __ __ __ II. 32 . 0153 n . 78 Gage F ______ ____ I 11. 42 . 0148 11. 86
In some of the tests the expansion measured as the temperature increased was substantially different from that as the temperature decreased, as shown in table 5. This might be taken to indicate an irreversible change in the length of the brick due to a change in water content or to the temperature changes. However, as other tests on the same brick frequently did not show this change in length, it probably was due to a slight shifting or creep of the plates on which the gages were mounted rather than to changes in length of the brick. The average of the values from such tests was usually in good agreement with others which did not show this apparent change in length.
The differences between the thermal expansions of the gages, bricks, and calibrated bars, for the small temperature range used in this investigation, are very nearly proportional to the temperature. Since the differential method was used, the variation of the temperature range of several degrees does not affect appreciably the values of the thermal expansions obtained.

Ross] Thermal J!-'.fpansion oj BU'ilding Brick-~ 205
'l',~BLE 5.- Thermal expanbion dala , - lCo to +400 C, Jar two bricks, w-ith 6-incJl gageJ
~;~~ .~:~~_e:_- :: : ::::::::: :::::::::: :::::::::::::: : :I w Iy IV III 1~2 Change in rending of gage, millionths inch per inch
poro C
Temperature de~rcasing __ _______ ___ _____ ' ___ ____ ___ _ 7, ,11 Temperature increasing ________ ______ __ ___ __ _______ _ 7,19
7,39 7,30 ~~:i:~:~:~~~~ i~g::l:;:: ::: ::::: ::: ::::::::::::: :::: ---Ayerago. ____________________________ _________ _ 7,32
Coefficient of thennal expansion of gage _ _ _ ____ ______ 11. 78 Coefficient of t.hermal expansion of brick____ _ __ __ __ __ 1,46 Final average . . _________ ________ ______ _________________ ____ ___ _ Standard deviation ______ ________________________________ _____ _
7.38 7,39 7.41 7. 38
---7,39
11. 86 4, 47 4,47 0,01
7,63 7.53/ 7, 49 7,50 7,51 7. 52 7,49 7.52
------7,51 7. 52
11,86 11.78 4,32 4.26
7,~g
7.47 7.5-1 7. 48 ---7.52
11.86 4,34 4,31 O,()-I
There is some evidence in the data that the 2-inch gages gave a value of the coefficient of expansion about 0.2 millionths per 0 0 higher than that given by the 6-inch gages. Tests were made with both gages on similar bricks, 1 to 5, 6 to 11, and 12 to 18, and both gages were used on the same bricks for the seven given at the end of table 6.
The values of the coefficient of thermal expansion found by means of the 2-inch gages for both halves of the same brick agreed within 0.2 millionth per 0 0, except for bricks 12 and 15, which are unusually soft bricks. Of comse, there is no reason why the thermal expansions of both halves of a brick should be the same, but the fact that, except for this one type, the independently determined expansions of the two halves agreed so closely leads one to expect that the random error in the values is less than this amount. A systemn,tic error would not be disclosed by this comparison.

1'ABLE 6.-CoejJicient of thermal expansion of 139 bricks over the ternperatw'e range - 10° to + 40° C. 'with description and the data for the other phys'ical tests rnade on the sarne bricks
Brick NO.4
Mate· rial
[C, clay; S, shale; }" fire·clay; SL, sand·lime; SM , soft mud; SC, side cut; DP, dry press; EC. eud cut; DD. down draft; lTD, up draft]
Method of form ing 'Kiln
-----------------
I I COll· :Nlanufacturer's J.JocaliLY of production prossh"e
grade nam e' strength
Modul us ofrup·
ture
5·hollT 24·hour I Satura· boiling water abo tion co· a bsorp- sorption, I efIi eient t ion, B C (G/B)
Coefficient of 1 hormal expansion
Rootmean Num'l "Quare of ber of deyiation test s from mean
Percent P e.rcent .I.'\fillionths ! Afilliontli s - 1'---1----1--1 --·---,---1----1 1a.. . .. . F 8C ............ _..... Kittannjn~...... . W estern Pennsylvania I .. r.~!~~·:' .. .. r.~!~~:2--' dry W~ig; t dry weit~t ...... .... per o*~: 2 "per 0208
~A~ •• ••. ! .... ! ••••••••••••••••••• · ••••• •• •• : •••• W""!~"".~·o •••••• ~~ •• ·.·~~I ,!! ,!I.··. , ~.-- '" =C~~ 6b.... . . 8 8C .. . ............ _ .................... ...... do. ............... 5, 100 1,360 10.7 7.4 .69 *6_ 3 4 .04 iii...... S 8e. __ . ..... __ ... __ ........ _ ........... . .... do ...... _......... . ......... .......... 12,1 8_9 .73 *6_1 2 . 05 i b ...... S 80 ........ .............. _ .... _ ........ . ... . do ..... ... ........ 4,400 1,180 12,5 9.4 _i5 *6,2 3 .11 Sa...... 8 se .................. , ...... ... ___ ...... . _ .... do ... _ ....... ___ ........ __ .... _._ .. _. _ 10_2 6.8 .6i *6_3 .! . OS 8b .... .. S SC_ ..... .. _ ..... _ .. _ ........ -. . _ .. _ ... . . . . _tlo ... _ ••.• _ .•.•. . _ 6,200 1,340 9. 3 5.1 . 55 *6_1 6 .06 9a_..... . S SO ........ _ ..... . . .. . _ .. _ ... _ ... __ .......... do ............................... . .. _. 11. S 7. 6 .64 *6.3 . 05
!!;,~ilg ;2~ ............. 1: 1 ~~ ~.~. ~! =-! ! I---·~ - ~:~ =1 : 12&. .... C Dp ... . ... 1 ........ . _ . .................. Wasilmgtoll, D. O. ···1···- -.-- . .......... 19.8 17.2 .87 *7.5 8 0.1 8 12b . .. .. 0 DP ........... _ ................. _ ....... do . . ..... ....... 2,150 laO 20.2 17.5 .87 *0.5 4 . 21 13". .... C DP ............... . ....... - ............... do_-' ... __ . ...... .... ..... ........•. 19.5 1 11.0 .60 *6. 7 5 .06
l~L~~~ ~ ~L~~~~~ ~~~~~~~~:~ ~~~~~~~ ~:~~:~~~~~~~ ::~:~~~~~~;~~:::~;~::J::· ~~~~::1::·::: ~~::i ti:i i~J :~ 1 1~ I ~ ~~i 15b_. ... ~ Dp ....... ... .. ......... ............ . ..... do .............. . 1 a,500 I :;70 I 14.2 I 1?9 .67
1' ·6 . ~ 7 . O~
J6....... C Dp ........ . .............. -- ........... _uo ........ -.. -' 4.000 480 I 14.4/ 12.0 I .S3 6. 4c' 2 .03 17....... C DP ......... . ....... , .. _ ................ _ .. _. do ........... _ .. 11 2,000 : 250 IS. 1 15.4 .85 1 P..85 i 2 . 01 IS...... . 0 DP ....... ~ . ....... ·······I .. · .. dO ........ . ..... 2. 500 1 __ . ~90 1~~I __ ·_84_1 ___ tl.50 1 __ 2_ .04 -1
Avg ....... ....................... .. , ..•....•. .•...... ' .... _............... ... 2, 600 I 300 17. 5 14.9 .S5 *6.7 .. _...... . .. .
Brick No."
la I b 2a 2b 3a 3b
4 5
A vg.
6a 6b ia 7b 8a 8b 9a 9b 10 11
Avg.
12>1 12b 13a 13b ]4" 14h lfla 15h
AW:.
16 17 18
tv o Cl:>
~ ~ ;;:; ~ ~ ~ '" "" '" ~ " <:'-;;.-
~ .... ;;.-
'" ~ ~ .,., . o ... .,., ~
~ ~ '" ~ ~ V:> .... i=l ~
~ ~
""
~ ~

l~ ... " c se .. _ .. _OD ..•.. 8elecL White_ ...• Whitewater, Wis. __ ._. l , ooo ! 100 1 3212'.71 , 26. 6 , O.S2 ·8. ~ ~~ I 0. 16 1 ?{l1.-.. .. -.-..... 1 C SM . .. ___ . Scove... Stock_. __ . __ . ... . D etroit, Mich ......... 1 1. 400 , 590 18. 8 ! .83 *0.0 . 07 _ (' SM . ...... UD .... . SelectHard_ ... . . K ingston, N. y· ····_·1 6. 100 1 780 19.0 149 1 .7S *6. 2 . 16 ~:: :::::! ~ SM. _ .. . . . Scove ... Kiln run .... . .... Lebanon,N.H···_···1 ~:~ I 1,950 zU 2: 9 :~ *5.2 .03
;~·· ··· ··I s BL::::: gg::::: ·:';icg~ ______ ::::::::: ~~~hl~id~f';:~·_~::::::1 5.500 1 . ~~g 15.3 iU .83 :~J 64Q I :g~ 26:::::::' O&S DI' . . .. -. . Scave.. . Picked Reds .... _ Sheridan, W yo._._._.. 4,200 320 13.8 11.1 .80 *6.5 . 09
2i.. . . _._1· ~ ~b· ____ ·:::: g~cli.:: ~o~~~rihar(C: §;;:::;~'~S}~pii::-:.::I ~:~ l,~~g i~:i 1~: ~ i :~~ :u ~ I :~g 2iL ... _ 1': 80 .. _._ ... Tunnel. Common ... __ ._ .. Cleveland, Ohio ... _.1 6,700 700 11.8 ~: ~ 1 '.?'~ *6.5 ~ .07 29...... . SC ...... - ... . ...... Clinl¢r. .... _ .. _. Richmond, Va .... ___ 'I 7,000 1.350 ll.8 v *.>.9 .12 30. _ . .. '1 8 D1' . . _ .. __ DD ..... RedFacc __ ._ . . .. Birminghum,AJa ..... 15,800 2.160 7. 0 4.1 1 .59 ' 4.7 . 11 :U....... C SM . ...... Scove ... Extei-iOL_ .. _._ ... D etroi t, M ich .... _.... S. 600 2.320 10.8 4.4 .41 *5.7 [. .08 ~2 .... __ .1 S 8C .... .... DD ..... H arde ... _ ........ Alton, TlL ....... _.. 16,700 2,370 3.0 .• .23 *6.U 5 .0
~L:::: I ~ ~g::::.::: g~cli.:: ~?~:X~Ch.·::::: ~~fri~~~e?RiOd ::::::::1 ~~:ggg ~:m U U :~ :g:b : :Y~ ~5 ..... .. 1 0 SM ..... . • Scove . .. Kiln run . ...... _. Lebanon,N.H ....... ' 14,600 2. 500 8.6 5.5 .64 *5. 3 . 07 !$6. . ..... S 8C ...... . DD ..... ClinkeL ._ ..... _. Allentown, P a ... _ ... 12.000 2,U60 5. 2 2. fo . 50 *6. 8 .16 ~7. __ ._. . 0 SC ...... •. DD_ .... R eds_ ... . .. __ ._ .. Evansville, Ind ._..... 14.100 2.000 .2 .5 .15 *5.9 .04 1 38....... S SM ... _ . .. Seove ... Clinker. .. __ .. _ .. Cleveland,Ohio .... _. 10.100 1,700 1.5.5 *5.3 .11 39....... v SM .. _._ .. DD .. ... ..... do . . . . _ ... ... . New London, Wis.... 9. 500 1,130 1.5 5 10.; .159 ' fl. 7 I . 05
:~a~~~~:: g ~~L ··· :: .~~::::: .~~~!~~.t!~~~: :::: .~.~~~:_~~~~_~~:~ .?~.i~: ._.:~~~ .... _~~~~_ 20' ~ I 15:~ .7i:U g~ 41b..... C 8M ..... . _._ ........ _._ ........ __ ._ .... __ .... _ ... _ .......... 3.700 430 19. 3 14. 3 .74 *5. i 05 .~ ~~~~ C • ' M ~ ~ ~~ ~ .. ~ ~ ~ ~ ~~ ~ ~~~. ~~ ~ ~~~. ~~~ ~ ~ .. ~ ~ ~~~ ~~~ ~~~~ ~~~ ~ ~ ~ ~ ~ .. ~~ ~ ~~~ ~ ~~ ~~~ ~~ .. ~ .. ~~ ~ '" '" " .,~, I ' " ~i:··;I~.f ••• ~~· •.•• ;-,.· •• ·01~~~:-~~I •••• • ••••••••••••• • •• ···1 ••• '::. ; •• '; ~- :!l!='ji ,~ • ~ ~-'~~ l~11 ~~I Hb... . . s SO . . .•.. • • ··········I·····dO ....... _ .. 1 .... _._ .. _ .......... __ ._, 8,100 1,950 6.0 I 3.81 .63 *6.G 3, 10 I
~~::>~=--, ' .. ~;~'w l w.li·""":,,O'~': -!ji-- ::rII~~'~~ 47b. . . .. C ... do ....... ,_._ . . _ .... I .. _ ....... _ ....... I ..... dO .... - ......... _. 5. 300 1. 000 11 . 8 9.3\ .79 \ 015.5 1 ~ .U4 1
1-----'----- , - -------------------!lvg ..• .:..::.:..::= .:..::.:..:..::.:..::I.:..:..::.:..::I.:.:..:..::.:..~.:..::.:.:.:.:..:..:::...:. ._ ...................... 1 5,100 I~ ~ __ 9_. 6_1_-.:2:. ___ .~.:..:.:..:..:::...:. . .:..:.:..:.:= ___ ____ ____ _______ - , ___ --__ . ___ 1 __ - . ___________ I
Sep footnotes at end of table.
In 20 21 22 23 24 2,1 26 27 28 29 30 31 32 33 34 . 5 36 37 3 ~9 40
41 ,. 41b 42a 12b
43B 43b
ar go
448 44b
avg.
4511 45b
46a 46b 47a 47b
avg.
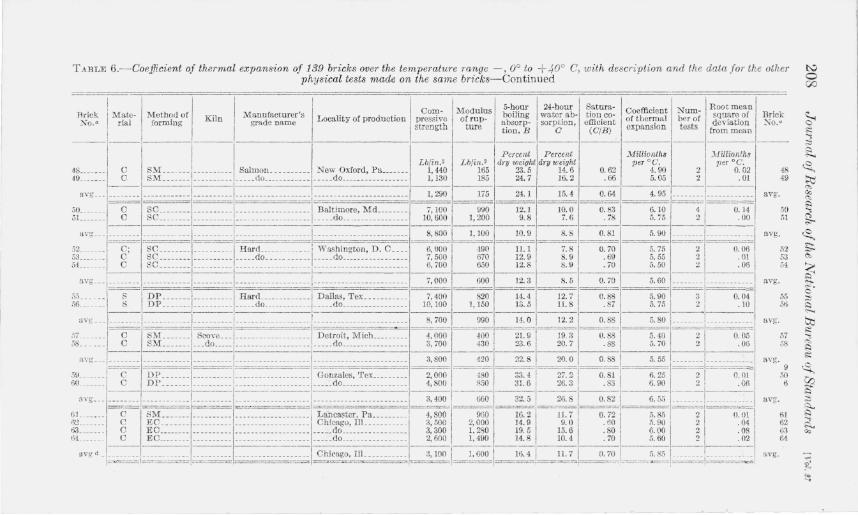
TABLE 6.--CoejJicient of thermal expans'ion of 13.9 bricks over the temperature range -, 0 0 to +.fO° C, with description and the data for the other physical tests made on the same bricks-Continued
E rick I' MMc· il'<!etb'?d of I Kl'ln ~ranufacturer's I C~'.". 1 Modulus I ~~~?r~~ ~t~~~h. ~~~u~: i Coefficient Num· ~~~~~e~t I ~o . " nal Iormmg grade name Locality of production preS~lve of rup~ I absorp- sorpiion, efficient of thertpal ber of deviation ----'1---1------____ strength ~ tion, ~ __ C__ (CIB) expansIOn tests fro m mean
Percent Percent .'JilllOnth, 1 },fililOnth.
I Lb/in,2 Lb/in.' dry Weight dTY wezyht peT cC, }JeT cC.
'18 .. __ ._ _ C SM ___ ______________ Salmon __________ New Oxford, P u __ ._ ___ 1,440 165 23.5 14. 6 0,62 4,90 21 002
:~~; I~~~I~S,2:;I B"':'M·:~';]I~-~~~ ~~,- :i; :~--t~}-:~I 52._.__ __ C; SC _________________ . Hard _____ .... __ ___ 1 Wash in gton, D . C____ 6,900 490 11.1 7.8 II 0,70 5,75 2 0, 06 :,L__ _ C SC _____ _____ _____________ do _______________ _ do_________________ 7,500 (i70 12.9 8.9 , 69 5, 55 21 .01
::~II~~~~~~omnI D.'~~':n~ --~ ~- "~~I __ ;[L:~~ _ :i,=1!;1:d~ ,;7 .______ C I SM _______ Scove ___ ------------------- Detroit, Mich___ ______ 4, 000 4001 21.9 19,3 0, 88 5,40 21 0,05
j8 __ ": __ I_~_~~I---dO----- ------------------- _____ do ____ __ __ _________ ~, 700 _~I~~--·-88-, 5, 70 21 __ ~'1
~::;H--']~IE~-2:1~?:'~:~'n"~-I- ~t~[!lj~L~t :i _ !~I~-~: :-~b 6J. __ ___ I C SM __ __ ., __ ---- ---- -- ------------ -------' Lancaster, Pa__ _______ 4, SOO I 950 16,2 11.7 0,72 I ,),8,5 21 0,01 ~L_____ C EC _______ ---------- -------- -------- --- Ch!cagu, 111.____ __ ____ 3,500 2,000 I 14. 9 9,0 .60 I 5.90 I 2 .04 t\3. .. _.". C EO _____ ___ ______________ ___________ _________ do ____ ________ ____ _ 3, 300 1. 280 19,5 15,6 .80 6.00 21 .08
"t~~l;~- _I~:_;_~~~~=~ ~=~ ==--=~ ~;~~~i=·:: :~~I~~L ~::~ ~ :~:~ = 0: :_~I==-.,-~;~~J~~J~~~~~_~O~
48 49
a\"g.
50 51
avg.
52 53 M
avg.
55 5ti
avg-.
.07 C8
avg. 9
50 6
avg.
61 62 63 64
avg.
I:,,;) o 00

s.:;·····1 c; S~L. _____ i _______ · __ I ___ ________________ HudsonVallcy,N.Y_.I ~,700 I 380 I 23.7 19.7 1 0. 83, 6.55 2 0. 01 1
66 ------ 0 sM __ _____ I~I------------------- _____ dO_· ___ _____ _______ I __ 6_,~~~~~ ___ ._7J_II---5. 75 :_~I .O! I 67~::~:::!~- ~- . ~~~:::- ~I::::-- .:: ::::::::::::::::::: -~~~s-~!;-~~;~;:~:~:: II ~:~ I ::~-I-' ~.i-=:. : 1- ~:~ , : ~: 1- . ~f-----~~~~-68._. ___ ./ __ 0_ Si\f.~=~._._ ... _ .. . .... ____ . __ _______ . ____ do .... __ ____ _______ ~I~~I-~-I .81 5.75 i __ 2_' 05
69~=~::: ::~:::: ~~~::::.~I/:- ::::: :::::::::-:::::::::I' ;':;:r-t;;,~~-t:;~:~~'--~~:-I 1:::~~ 1- :;~ ~- 1:.: I 1:. ~I ~. ::. :: ~: II~- ·-~t-----·~~~~· 70___ _ __ S So . ____ .. _. .. ___ .. _________________ __ ____ do ________________ . 16,000 1.6,10 2.6 09 . 35 .5.75 2 .CO 71._.___ _ S SO. __ ___ . -. -.----- - .---. ______ . _____ ______ do _______ ___ .__ ____ 13, 700
1
1,910 5.3 2.Y I .55 6.05 1 ~ I .01 -'-1---1,·-- - ----- ---1-------1---1
av[; ___ .----.-- -- - ---- __ 1 .. _ -.-.- . --. --------- ------ - - ----- - .. ---------.-.- H,:lOO 1,~70 4. 4 ' ~ 21 0. 49 I 5.95 .--- --I . 72. __ ____ s so _____ ·_·I··_: _____ · ----.- ------------- Martinsburg, W. Va _. 6,500 I J,130 1 12.0--- \J 9 - 0.82 1=-- 6 8-=;: ='~ 3 0 Oi I 73.._ ____ S SO_. ____ '1'_ ------ ------ --___ __ . _________ do._. _____ . ___ . ____ 6,~~ __ 730 ___ ~~ .8:3 10. 70 2 ____ 04_
avg ___ -- - - - --- -----------t·-------· ;;.~- ... ---.. -.-- -- -.- --- -.-- -- ----.-- -. 6,200 930 /~12 5 10 4 _ 0.82 ~ 6~~ ·--- -:..::.:.1 -':':' "1 74 .. __ __ C DP ___ ___ I __ ---------- ---------.----- Washington, D. 0.___ 2,740 280 1 17.0 J4.1 0.M5 6.30 21 001
n~~~::: ==~~=.~~~~:::::::::::: --:::~~ ____ ::::::::::::::: ~ :~~ i- ::.: ___ :::~ 0':: I-~~=I~:;.:o==-.~~ 76____ ___ 0 ,;M_. ____ .. _. ______ _ Sand struck. __ . __ L ebnnon, N . R __ .____ _ 8, 000 1,310 I 9. 6 5.0 0.52 1 5.20 2 0.02
~~~~~~~~ --- ~ --. -~~~~~~~~: :::~~::~~: ~~~ ~~~~~~~-:~~;:~~~~~~~~~~~~ * _ !:::: ::: ::! 0:: I---;,~i==~ 79.. ._ ___ 0 SM ___ .. __ .. __ .. ____ Li ght burned, Lebanon, 1". fl ___ .... 6,300 910 17.0 13.9 0.82 5.10 ' 2 I 0.02
sand struck. 1 80 ____ ._ . C SM _._. ______ ._. ___ . . ___ _ do . __ ._ . _ ___ _ _____ do __ __ __ . _________ . 3,400 460 19.4 16. 9 . 87 5.45
1
1 5 .09 81.. _____ C S ~\L_. ___ . .... _____ _ . __ ._do. ______ .... __ _____ do. ___________ .. ___ 4.500 810 18.1 14.5 .80 5. 30 2 .03
---- ---------------avg ________ __ _______ __ . _ .. _._ .. _._ .. ___ . ______ __ ______ ._. __ .. __ . _____ .________ 4.700 730 18.2 15. 1 0. 80 I 5.30 _. ______ . __________ _ I.. ===I====~·c~===~~=="=~~====I=======
82 ____ __ 0 SM. ___ ._ . ' ____ .... __ H a rd burn ed, Lebanon, N. R_ _______ 12,700 1,130 5.4 2.7 0.50 5.25 2 0. 05
65 66
a\g.
67 as
avg.
69 70 71
avg.
72 73
avg.
74 i5
asg.
76 77 78
Ul"g.
79
80 S1
a'g.
32 water s t ruck. 83.. _____ 0 8:\1. ________ _ .. _________ _ do ___________ . . _. __ do. __ ___ _____ ______ 16,OaO 1,920 8. 3 5. 3 .64 5. 10 2 .01
R"'"g !~;t~~J!!-:-:L :!::!~ !:~! I _-! !!_ !L "~~IJ!c -- ~ i~!1 83 84 ~5 86
avg.
See footnotes a t end of table.

TABLE 6.- Coe.fliC'ient of thermal expansion of 139 bricks over the temperat1lre range - 100 to + 44 0 C, with description and the data for the other pkys1:cal tests made on the same bricks-Continued
I ! Com ~ ?\1odulu:; a-hour 24-bour Sutura- Coefficient I Num- Root mean I Brick Mate· Method of 1 Kiln Mannfaciurer 's Locality of production pressive of rup. boiling water ab· tion co· of thermal ber of square of Brick No.a rial forming grade naUle strength ture absorp- sorption, effideot expansion tests deviation No.~
I tiOll. B C (C/B) from mean ----------.-,----,'-----------------
87.. ____ _
88 ______ _ 89 ______ _ 90.. .... __
C
C C C
1
SM .. ____ -'-- _______ _ L i gh t h ards, Lebanon , N. R _______ _ ,,'Tater struck.
SM ______________________ do ___ ____ __ ____ ___ _ do __ _____ ________ _ SM ______________________ do _________________ do ________________ _ SM __ ____ ___ _____________ do .. __________ ____ _ do ________________ _
avg __________ _ _______ __________ ___ __ -- __ _____ __________ -------- .. ___________ __
91. . __ . __
Lb/in.' 7,400
7,200 7, 300 7,800
7,400
Percent Lb/in.' dry weight
1,350 16.5
930 17. a 1, 070 18 .. 5
790 17. 2 --------
1, 030 17. 3
Percent Millionths J'vlillionlhs dry weight per °e. per °e.
13. ·1 0.81 5.00 0.01
13.9 .82 5.00 2 .06 15.6 .84 5.25 a . 03 l4.9 .87 4.90 2 . 01
----14.4 0. 84 5.05 --- - - - -- ------------
92.. _. __ _ F F 80 ______ _____ _______ __ __ ____ __ ___ __ ______ ___ do__ _______________ 17, iOO 2,830 2.'1 .,. . 29 3.:]1) .01
--- ----------------1---1-----1 av!(___ ___ _____ ____________ __________ ______ _____ ____ ____ ________ __ ___ ___________ 18.000 2,760 2.2 O.G 0.27 3.2'> __________________ _
87
88 89 90
avg.
91 92
se ______ __ ---------- ------- --- --------- Kittanning, Pa________ 18,200 '1'-- ~,-::/OO - 2.0 · 0.5 -=-==0"'."'2"'fi'·'-===:<."'2"'5=1=== = 0.06
1- -,==~~~=~~~~===I=====I==~ avg.
93,. _____ C SC __________ __________________ __ _______ ' Whitewater, Wis______ 2. 000 650 34.4 3t. 3 0.91 8.10 2 0.04 93 94,. ____ _ C SC_ . _____ _____ ______________________________ do________ __ ____ __ _ ,1,100 950 28.6 24.6 0. 86 S. 35 2 0.04 94
1----1----1-------1---------·----------------- -----1-----I
9.,3Vg
-- - - - --~-l~~--~----- ~-:-----~ ~~~~~;~~----:---:: -~~~~~;:t~-~~:~-~----:- ~::~ - 1, :~~- ==~:: ~ ~ ::: - ~: :: 1- :~;- ---- 0. 01
96~~:~:::1~-:~---':~~~~ ::.:::~~ ______ ::::::::: :::::~~ ____ :::::::::~::::~=_';:~~=_ :::~: _ :~:~ ___ ;:: ~:;~= :::~ ~~=-=~ 01.. _____
1
s sc _____ ___ --- ------ - __ ___ do .. __________ M ason City, Ia_______ 17. 400 2,300 2.9 1 1.~ I 0.62 5.10 2 0.02 US_ ___ ___ S SO _____ ... ____ ___________ .do __ _____ ____ ____ _ .do __ .. _______ ______ _ 14,200 1.190 10. 8 4.9 .4.5 5.15 J _________ __ _ 99_ ___ ___ S SC ________ _______________ do ____ ________ _ ___ do .. ___________ .. __ _ 13,800 J, ·130 13.9
1 10.2 .73 5. 15 2 .00
;81:::::: ' ~ ~8:::: :_:: :::::::::: :::::g~:::::::::::: ::::: 3~::::::::::: : :::: : f~:~gg i:~~g ~:3 1 ~:~ 1------~ i9- ~:~~ ~ :g~ avg __ _ =-:-= _________ .. --1- ___ .:.: ____ ---- ---- ----:----- - -----------------:------ __ .27• 000- - 1,680 7.2_1 ~3.7 :_ O. ~.!:... --=-":;~15 ;:..:..;~;;:.;;~_~~~----
]02______ C EC--- --- T -- -- _______________________ P hiiadelphia,Pa .. ____ 5.400 1,070 l5.4 ' 10.8 I 0.70 .1. 90 21 0. 05
!~~,glgr - -~ -U;i '~ 1- ~u :~:L ~~L~~I- ~~I
avg.
95 96
ayg.
g7 98 99
100 101
avg.
102 103 104 105
avg.

4. GOO 4; loo 4,100
avg e ______ .. _. ___ . __ _____ _____ _______ ___ __ _____ _________ __ ___ __ . ________ _____ _ 4, 1oo =~I=-====1==== 109___ ___ I" SC _______ __ ___ ______ Enameled ________ Black Lick . Ohio _____ _ 21,Oon no_____ _ 1" SC ________ _______ __ __ ____ do __ _______ __ _ Momence, IlL ______ _ _ ll, ZOO
111.___ __ F SC ______ • ___ .... ______ _ do_. ___ .. ___ . Columbus. Ohio. ___ ._ 17, 3oo 112_ _____ F BC _____ . __ __ . ______ _ ___ ._ do ___ . __ ._. __ . Canton,Ohio ____ ._ . __ 23. GOO 113______ .F 8C __ ._. __ . _. _______ .. _. __ do ... ____ . __ __ Columbus,Ohio _. __ _ . 18,2oo 114__ ____ ~. se ___ ____ _______ . __ ._ do __ . . . _ . . ___ ____ __ do __________ . __ . . __ 19, ROO 11.5 __ __ ._ F SC _______ . _. __ . ____ .. ____ do __ . ___ ____ _____ ._do _____ _ .. ___ .. ___ _ 21, 8oo
--------------------1------------1---------------1------a-vg c __ --- ---- - -- --------- - -- --- - --- --------.----- -- -- -- - - --- ---------- --- --- -
11u_. ___ _ 11'--___ _ 118 __ ___ _ 119 __ _ • __ 120 __ • __ _ 121._._._ 122 ____ _ _ 123 _____ _
C S C 8 8 C C C
SC _. ____ . __ __ ___ . ____ ___ ______________ ___ __ _ . ________ __ . ___ __ _ _ SC. __ ._. ___ . ______________________ . __ . _ M ason City.lowa ___ . SM ___ ____ __ . __ . ____ Rcclairued __ ._. __ Paducah, K entucky .. _ 8 C ___ ._ ._. ____ _____ . ___ .. __ ._. ___ __ _____ Cleveland,Ohio ______ _ SC ____ . _____ . ___ . _____ ._. __ . ____ __ _ ._ . ____ _ do ____ _ . ______ __ . __ SM _______ __________ _____ __ . __ __ . _____ . Baltimore, Md .. ___ . __ SM ___ ____ __ ______ ____ __ ... _ .. __ ________ _ ___ . _do _______ . ___ __ _ . __ SM . _____ . ___ _______ ______ . ______________ ._do ______ _ ._. ______ _
avg d ._ --- --._- - -------. - --- - --------- ------- --- - -_ . ---- ---.---------_.-.-----_ .
12L. __ _ 125_. ___ • 126. _. __ _
8 S S
SC __ . ____ __ __ __ ___ _________ ___ _____ ____ Martinsburg, ~Y. Va __ SC _________ . __ __ ___ __ ______ ______ . ___ . ___ __ . do . . _. __ __ . _. _._. SC. ______ _ ._. ______ . ____ ._. _____ .. ___________ do _____ ________ . __ _
a'g. ___ ______ . ___________ . _____ __ ____ . ___ . ____ ______ . ___ . __ ._. ______ ________ . __
127____ __ C SC _____ _ . __________ __ . ___________ . ____ _ Baltimore, Md._. ___ _ _ 128_ ____ _ C SC _____ . _. ____ . ____ ___ ____ ._ .. __________ . ___ do __ . __ . _______ ___ _ 129______ C SC. ___ ____ . -- --.---.- __ ____ . __________ __ 1 __ . do _____ _ . _______ __ _
a"g ____ . _____ . ___________ _ . ______ ._ . ____ . ______ .. -----l. ~- ___ . ___ . ___ . ___ . __
I~7: ::::: gEL::::: :::::::::: ~::::::::::::: : :::: I_~l"~dg_~~~~: _'_'~::.:::: : l 13:;~::: .. _~ ____ ~~:::::: : :::::::::: ==-=~=I::::-~~--~~::::::::-:::: :
See footnotea at end of table.
2O, Roo
3. BOO 10,4oo
7,4oo 12, 700 5,5oo 2,590 2.100 2; 100
2, 260
19. 700 18, 6oo 18. 600
19.000
5,300 5,600 3,600
4,800
2, 170 4,120 2,500
2,9oo
- - - '-
H90 19_ 9 11.8 0_ 59 630 I
660 17.0 1l.8 .69 10. 2.) 5oo 16.2 12.0 . 74 10. 75
----------------------580 16_ 6 11. 9 0. 72 10.50
------- - ---- o. 2~1~ 4_ 05 1, 600 4.3 0_ 9
950 8. 5 4_ i . M 4_10 1,050 6.4 4.2 .66 4. 45 1,430 0.6 4. 7 . 84 '1.55 2. 230 5. I 2.3 . 45 3.90 1,960 4.8 2. 2 . 46 4.20 2,240 5.5 3.1 .56 4.30 ------------2.1oo 5. 2 2. 6 0. 51 4.25 - - ----===
760 25.8 22.2 0. 86 5.90 840 15.0 9.1 .61 5.35 860 17.4 14.8 .85 6.30
1. 750 6.8 ? -_. , .40 5. 95 950 12.8 10.4 .81 6.50 620 17.2 10.2 .59 4.45 620 17.0 9. 6 . 56 4.30 490 18. 7 11.3 . 60 4.30 ------------580 17. 6 10. 4 O .• 58 4.35
= -= = = =--=== 2, ;IOG 3.4 2.0 0.59 6.25 1.080 3.2 1.5 .47 6. 10 2, 290 3.4 1. 9 .56 6.25
--------1,890 3.3 1. 8 0.54 6.20
----------= =--= 780 13.9 10.2 0.73 4.20 830 1~.8 P.6 .7U 4. 10 670 15.5 11. 3 .73 4.50
---------760 l4.4 10. 4 0.72 4.25
------ ----195 18.2 15.8 0.87 6.25 270 16. 6 14.3 .86 6.65 160 20. 2 IS.R .93 6. 45
---- ----- - ---210 18.3 16. 3 0.89 6.45
=:==1== ==--=
2 0.03 I lOG 4 . 08
I 107
3 _ U3 108
-- -.- --- ---- - .- -- --- ayg.
3 0.06 109 2 _ 01 110 2 .01 III 2 . OO 112 2 .01 113 2 .03 115 2 . 06 114
--- -- --- ._-----.---- avg.
2 0.04 116 2 .00 117 2 . 01 118 2 .04 119 2 .04 120 2 .OJ 121 3 .04 122 2 . 04 12'3
-------- - - -. . --- - - - ~ avg. ---=---=
0.05 124 2 .06 125 2 .01 126
-.------ ------------ avg.
3 0.03 12i 2 .Il 128 2 .03 129
-- ~ ----- ----------- - avg.
3 0.01 130 3 . O~ 131 3 .08 132
- -.---------- avg.

'[' .\£1;)'; 6.- CoeJJident of thermal expansio?l of 193 bricks over the temperatw'e Tang~ __ 100 to +.Wo C, with description and the data jar the other physical tests made on the same bricks- ·Continued
~ Bricks 19 t.o 40 are similD.r to 1 to 22 in the H'Yater Absorption of Building Bricks." Am . Soc. 'l'est ing iVlaterial, 36. pt. 1,260 (1923) . No. 22 is from the same sample as 35, nnd there is no brick corresponding to )l o. 17 of the abov report. The remainder of l.hebricks arc ill the same ord6r as in that rellort . '1'he compressi I'e strength and mojulw; of rupture for thew bricks were obtained by McBurney and R ichmond, BuildiIlI.t :vIaterbls and Structures (1940) NBS Ileport BMSeO.
Bricks 05 to D6, 97 to 101, 106, 109 to 115, and 119 to 120 were corod. Bricks 57 and 58 are similar to 20, but of a later shipment. Bricks 6. and 68 are from a difIerent manufacturer, but of similar raw material s to
65 and 66. Bricks 72 and 73 are of the same type as 69 and ii, but are not as hard burned. Bricks 79 to 81 are from the s"me manufacturer as 76 to 78, but are not as bard burned_ Bricks 87 to 90 are similar to. but nor as h~rd burned as 82 to 86.
:~: 5 I *3.4 *5.3 *6.1 *':}.3 *5.4 *6.9
3
II ~I
I
0.17 .10 .17 .08 .24 .02 .06 . 26
.jb
55 b 91 b 98 b
115 b
l!7 ab U 7b b
120 b
Bricks 91 and 92 are similar to 1 to 5, but froID" shipment received at a much later date. Bricks 93 and 9~ are similar to 19, but from a later shipment . They have a high lime
content. Bricks 97 to 101 are similar to Kos. 26 to 30 in the report "Water Absorption of Building
Bricks." Am. Soc. 'resting Materials 3G. pt. I, 260 (1923). Bricks 137 to 139 seem to ho.,e slag Or cinder materia! mixed with the clay. bTbermal expansion tests were made with both r,- and 2-inch gages. The coefficient
obtained with the 6-incll gages and data from the other pbysical tests are given in this table.
o Average is for last 4 items only. d Average is for last 3 items only. • A vorage is fdr last 2 items only_ • Data obtained witb 2-mcb gagas
Thermal Expansion of Building Bricks 213
V. EXPERIMENTAL RESULTS
Table 6 presents the thermal expansions of the 139 bricks used in this investigation, the data from the other physical tests, and a description of the bricks. Bricks 107 and 108 are sand-lime bricks and, while omewhat extraneous to this investigation, are of interest and havo
been included. Bricks 19 to 40 are similar to those used in an investigation of different methods of making water absorption tests on bricks.6
Tho saturation coefficient is the ratio of the 24-hour water absorption to the 5-hour boiling absorption (seo footno te 4). The number of thermal-expansion tests made on each specimen is given, as well as the standard deviation. The values from the different tests with the 2-inch gages were weighted, the weight depending on the spread of the four values of the thermal expansion found with each test.
In order to show the methods used in computing the thermal expansion from the tests and other characteristics of the data, more details are given in table 5 for the two tests with the 6-inch gages on brick 121 and the three tests on brick 122.
Thermal expansions over a large range of temperature are frequently expressed by a two-constant equation in powers of the temperature, such as
in which Lo is the length of the specimen at the base temperature, LI is the length at the temperature t, and a and b are constants . An effort was made to obtain the second constant, b, for some of the bricks by taking a reading at a temperature intermediate between the highest and the lowest. This constant is given in table 4 for the bricks On which two tests gave values which differed by less than 0.002 X 10-°.
17 ~ 16 !:: IS LeeeND , 14
.~ /3 0 Clay bnck
la /2 l8J SClI7d-//me bricx ~/I ~ 10 ~ /'ire-clay brick I') !J
" 8 ~ .~ 7 Shale. brick
'<s 6 ~ 5 (!J Clo,Y ami SbO'k briCk
~ 4
1 .3
~ Z
I
155 1M
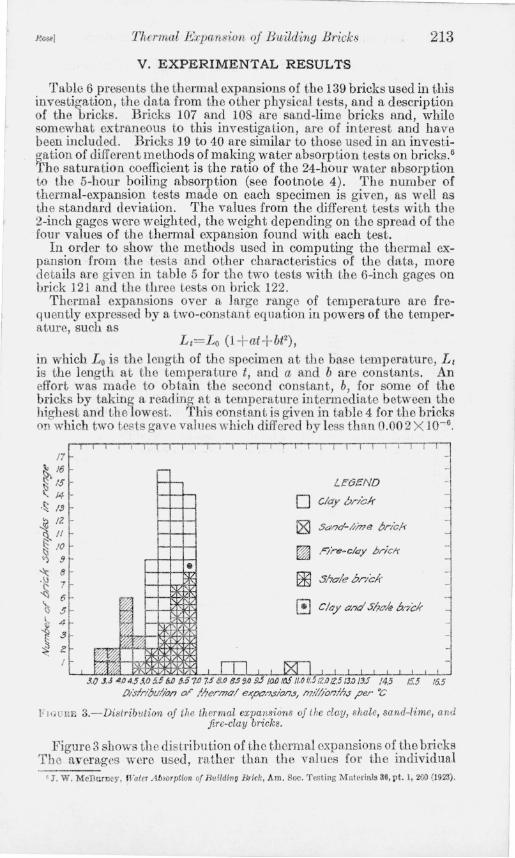
l· l 'JUUE 3.-Dislribution of the thermal expansions of ihe clay, shale, sand-lime, and fire-clay bricks.
Figure 3 shows the distrlbu tion of the thermal expansions of the brieks The averages were used, rather than the values for the individual
, J. W. McBurney, Water Absorpti011 of B uildillU Bdck, Am. Soc. T esting M aterials 30, pt. 1, 260 (1923) .

214 Journal oj Research oj the National BUl'e([u oj Sta.nda.rds [Vol. B1
bricks, in the cases in which more than one bricl from the same lot was t ested.
In figure 3 it may be noted that the coefficients of thermal expansion of 54 of the 61 lots of clay and shale bricks, or 89 percent, were between 5 and 7 millionths pel' 0 C. This may be compared with the 2~ bricks in the report of the Watertown Arsenal, of which the coefficients for 11 bIicks were within this range. Four of the 12 values for clay and shale bricks given by Palmer, and 8 of the 10 for clay and shale tile given by Ingberg and Foster were within the same range. Except for the rather unusual bricks from Whitewater, Wisc. (Nos. 19, 93, and 94) and from Columbus, Miss. (Nos. 137 to 139) the "cut off" at a thermal expansion of 7 millionths per 0 C for clay and shale brick is very sharp .
The few values above 7 and below 5 millionths per 0 C among the clay and shale bricks are chiefly limited to the softer clay bricks (5-hour boiling absorption above 14 percent).
The thermal expansions of the fire-clay bricks showed some tendency to decrease with increasing hardness, but the samples are scarcely numeIOUS or representative enough to draw any conclusions on this point.
The thermal expansion of the clay and shale bricks was compared in turn with the compressive strength, modulus of rupture, 5-hour boiling absorption, ~4-hour water absorption, and saturation coefficient. No correlation was found between the thermal expansion and these properties, and, even among bricks from the same shipment, there was no consistent tendency for the thermal expansion to increase or d ecrease with differences of hardness of burning, as indicated by the above physical properties.
The distribution of the thermal expansions with different methods of forming was studied, but nothing significant was found. The only two types of bricks having coefficients above 7 millionths per 0 C were both side-cut clay bricks.
The probable errol', or rather the probable difference between the thermal expansion of an unknown sample of bricks and the arithmetic mean, has been computed on the basis of the tests reported in this paper and is given in table 7. The probable errol' for the clay and shale bricks and the clay bricks is larger, chiefly owing to the largo departure of the coefficient for bricks numbered 137 to 139 from the mean.
TABLE 7.-Probable errol' if the arithmetic mean of the coe.fJicients of thermal expan. ion is assumed as the coefficient of a brick for which the coefficient is 1mknown
'I'ypes of brick Number of Arit.bmetic Probablr· lots mean error
----Jlfillionths ,1Jillionths
1Jer °C per 0(/ r,J 6.1 0.7
32 0.0 I .1
38 6.0 " 22 6.1 .1
Clay and shalc ________________________________________________ _
Clay and shale with 5-hour boiling nhsorpiions less thaH 14 1 perccnt ___________________ __________________________________ _
f~~re~= = = = = == = == = = = = == = = = = == == = = = = == =::::: ::~:::::::::: =:: __ ::.'--------'--.-.

ROB8) Thermal E.rpansion oj Building Bricks 215
VI. CONCLUSIONS
1. The average values of the coefficients of thermal expansion, their range, and the number of samples tested for different types of clay bricks are given in table 8. For comparison, similar data are given from previous investigations.
TABLE S.-Average coefficient of thermal expansion (in millionths per 0c) of di.t!erent types of clay bricks from this and previous investigations
[The values in parentheses are in milliontbs per OF)
Average co· Number of efficient of Range of coefficient of
T ypes of clays specimens tbermal ex· t bermal expansion pansion
PRESE NT PAPER ( RRICH.S) -100 TO + 400 C (14° TO 104 0 F)
so l 41 15
6.0(3.3) 14.2 to 12.4 (2.3 to 6.9) 6. 1(3.4) 4.7 to 6.8 (2.6 to 3.8) 3. 9(2.2) 3.0 to 4.6 (I. 7 to 2.6)
PALMF.R {RR1CJ\S)-So TO 25° C (1 8° TO 7 7° F)
Surface clay ....................... .. ......... '''1 ~:;~ia;;.~::: : ::::::.: :::::::::: :::::::::::.:.::::::
0.6(3.7)14 .7 to 8.5 (2.6 to 4.7) 4.8(2.7) 4.1 to 5.2 (2.3 to 2.9) 3. 7(2. 1) I 3.6 to 3.8 (2.0 to 2.1)
INGRERG (HOLLOW TILE) 0 ° TO 300° C (32° TO 5720 F)
6.2(3. 4) 15.1 to 7.3 (2.8 to 4.1) 6. 1 (3. 4) 5.7 to 6.9 (3.2 to 3.8) 5.5(3. 1) 3.5 to 6.8 (1.9 to 3.8)
WATERTOWN ARSENAL (RRlCR S) 0 .60 TO 1000 C (33 0 TO 212° F)
c lsynndshaJe· .. · .. ·· · .. .. · .. .... .. · .... · ........ .. 1 6.3(3.5) 1 3.7 (0 13.6 (2.1 to 7.6)
2. The coefficients of thermal expansion of 89 percent of the clay and shale bricks were between 5 and 7 millionths per 0 C (2.8 and 3.9 'per 0 F ), the average being 6.1 (3.4). The value, 6 millionths pel' ° C (3.3 per 0 F), is a good value to assume for the thermal expansion of clay and shale bricks, the probable errol', as computed from the data of this paper, being aboutO.7millionthper °C (0.4 per OF). Of course, if an accurate knowledge of the thermal expansion of any bricks is desired, the above assumption could scarcely be substituted for an actual test.
3. There was no significant difference between the average thermal expansion of the clay and shale bricks. The few values of the coefficient above 7 and below 5 millionths per ° C are chiefly limited to the softer clay bricks (5-br boiling absorption above 14 percent).
4. The thermal expansion of the fire-clay bricks was much lower than that of the clay and shale bricks. The number tested, however, was scarcely large enough, nor were the bricks representive enough to allow definite conclusions to be drawn as to the thermal expansion of other fire-clay bricks.
200723-41-8

216 J our'nat of Research of the National Bureau oj Standards [Vol . t1
5. There was apparently no significant correlation between the thermal expansion and the other physical properties of clay and shale bricks which are customarily measured as tests of quality, and even among bricks from the same shipment there was no consistent tendency for the thermal expansion to either increase or decrease with differences of hardness of burning.
VVASHINGTON, June 18, 194J.
o

MATHEMATICAL TABLES
Attention is invited to a series of publications which is being prepared by the Project for the Computation of Mathematical 'Tables conducted by the Federal Works Agency, Work Projects Administration for the City of New York under the sponsorship of the National Bureau of Standards.
To date, six tables have been made available through the National Bureau of Standards. These are listed below:
MT1. TABLE OF THE FIRST TEN POWERS OF THE INTEGERS FROM 1 TO 1000: (1938) V III + 80 pages; heavy paper cover. 50 cents.
MT2. TABLES Of THE EXPONENTIAL FUNCTION eO;
The ranges and intervals of the argument and the number of decimal places in the entries are given below:
Interval Number of Range of x ofx decimals given
- 2. 5COO to 1. ODeD 0.0001 18 1. 0000 to 2. 5000 .0001 15 2. 500 to 5.000 .001 15 5.00 to 10.00 .01 12
(1939) XV + 535 pages; bound in buckram, $2.00.
MT3. TABLES OF CIRCULAR AND HYPERBOLIC SINES AND COSINES POR RADIAN ARGUMENTS: Contains 9 decimal place values of sin x, cos x, sinh x, and cosh x for x (in radians) ranging from
o to 2 at intervals of 0.0001. (1939) XVII + 405 pages; bound in buckram, $2.00.
MT4. TABLES or SINES AND COSINES POR RADIAN ARGUMENTS: Contains 8 decimal place values of sines and cosines for radian arguments ranging from 0 to 25
at intervals of 0.001. (1940) XXIX+275 pages; bound in buckram. $2.00.
MT5. TABLES OF SINE, COSINE. AND EXPONENTIAL INTEGRALS. VOLUME I: Values of these functions to 9 places of decimals from 0 to 2 at intervals of 0.0001. (1940) XXVI+444 pages; bound in buckram, $2.00.
MT6. TABLES Of SINE, COSINE, AND EXPONENTIAL INTEGRALS, VOLUME II: Values of these functions to 10 places of decimals and 9 or 10 significant figures from
o to 10 at intervals of 0.001. (1940) XXXVII + 225 pages; bound in buckram. $2.00.
Payment is required in advance. Make remittance payable to the "National Bureau of Standards", and send with order, using the blank form on the page facing this one for the purpose.
Above prices are for delivery in the United States and its possessions and in countries extending the franking privilege. To other countries the price of MTl is 65 cents and that of MT2, MD, MT4, MT5, MT6 is $2.50 each remittance to be made payable in United States currency.
Copies of these publications have been sent to various Government depositorie throughout the country, such as public libraries in large cities, and colleges and universities, where they can be consulted.
A mailing list is maintained for those who desire to receive announcements regarding new tables as they become available. A list of the tables it is planned to publish will be sent on request.