
The Young Scientists Forum Symposium - National Science ...
225
PROCEEDINGS OF THE YOUNG SCIENTISTS FORUM SYMPOSIUM January 23, 2015 National Science and Technology Commission Young Scientists Forum
-
Upload
khangminh22 -
Category
Documents
-
view
1 -
download
0
Transcript of The Young Scientists Forum Symposium - National Science ...

PROCEEDINGS OF
THE YOUNG SCIENTISTS FORUM SYMPOSIUM
January 23, 2015
National Science and Technology Commission
Young Scientists Forum
The Young Scientists Forum Symposium
YSF SYMPOSIUM
JANUARY 23, 2015
Organized by
National Science and Technology Commission
Young Scientists Forum
EDITORS
Dr. LDB Suriyagoda
Dr. Indika Herath
Ms. Lohini Athiththan
Dr. Nilanthi Wijewardhana

© National Science and Technology Commission 2015
Responsibility of the content of papers included in this publication remains with the respective authors. Views and opinions expressed in the papers are of the respective authors but not of National Science and technology Commission.
ISBN: 978-955-8630-06-8
Published by: National Science and Technology Commission No. 9/31, 10/31, Dudley Senanayake Mawatha Colombo 08 Web: www.nastec.lk

i
PROCEEDINGS OF THE YOUNG SCIENTISTS FORUM SYMPOSIUM
Table of Contents i
Message from the Chairman, National Science and Technology Commission vi
essage from the Director, National Science and Technology Commission Vii
Message from the Chairmen, Young Scientist Forum viii
Forward by the Editors ix
-Research Papers-
In vitro lipase, cholesterol esterase and cholesterol micellization inhibitory
activities of leaf and bark of Cinnamomum zeylanicum Blume (Ceylon
cinnamon) W. P. K. M. Abeysekera, G. A. S. Premakumara and W. D. Ratnasooriya 1
Sex hormone profiles and anthropometric parameters of post menopausal
breast cancer patients H.M.K Akalanka, S. Ekanayake and K. Samarasinghe 5
Socio-cultural change in Meemure village in Kandy district: twenty years
after the prohibition of Chena cultivation
D.T.H. Ananda and C.A.D. Nahallage 9
An analysis of air pollution in selected cities of Sri Lanka using multivariate
control charts D. N. S. Attanayake and R. A. B. Abeygunawardana 13
An algorithm to find optimal order quantity when price discounts are allowed
M.M.R. Balasooriya and D.M. Samarathunga 17
C-reactive protein and fibrinogen levels in smokers with coronary artery
disease E. M.S. Bandara, S. Ekanayake, A.D. Kapuruge and C.A. Wanigatunge 21
Potential anti-tumor compounds from Asparagus officinalis L.
P.K.G.S.S. Bandara, K. Takahashi and K. Nabeta 25
Wound healing active constituent from Ficus racemosa linn. bark
N.S. Bopage, K. H. Jayawardena, S. C. Wijeyaratne, A. M. Abeysekera and G.M.K.B.
Gunaherath 29
Identification of resistant accessions of Capsicum spp. for breeding mealy bug
resistant chili: a greenhouse trial M. D. M. Chamikara, M. Ishan, S. S. Karunadasa, V. D. W. Kasthuriarachchi, R. V.
Lelwala, M. K. D. I. Perera, P. I. Rajapaksha and S. D. S. S. Sooriyapathirana 33
ii
Extracts of Alpinia calcarata (lesser galangal) inhibits production of
inflammatory mediator-nitric oxide in raw 264.7 murine macrophages
M. Chandhrakanthan, S. Kathirgamanathar, S. M. Handunnetti and G. A. S.
Premakumara
37
Current status of postharvest handling of cut flowers and cut foliage at
production sites in the Up Country of Sri Lanka G.D.R.K. Chandrasena, R.H.M.K. Ratnayake AND J.C. Edirisinghe 41
Factors affecting preference for genetically modified foods: a pilot study
among undergraduates Y.A.P.K. Dayasena, I.C. Hettiarachchi and P. Sivashankar 45
Serum insulin levels – is it a good indicator in chronic type-2 diabetes
mellitus subjects? Y.S.M. Dissanayake and L.V. Athiththan 49
Isolation, characterization and identification of lactic acid bacteria from
fermented indigenous rice flour D.M.W.D. Divisekera, W.A.A.I. Warunasinghe and I.G.N. Hewajulige 53
Investigation of antibacterial properties of endophytic fungi isolated from
Nymphaea nouchali endemic to Sri Lanka and the isolation of chaetoglobosin
C from the endophytic Chaetomium sp. D.M.R.K. Dissanayake, P. B. Ratnaweera, E. D. DE Silva, D. E. Williams, C.D.
Wijayarathne, R.L.C. Wijesundera and R. J. Andersen 57
Determination of antibacterial activity of Sri Lankan tea brews by broth
microdilution assay T. M. Erandika, P.D. Abeysinghe, R.N. Pathirana and S. Abeysinghe 61
Preparation of microwave irradiated cellulose based biodegradable supper
absorbent polymer (SAP) for agricultural applications T.N. Fernando, A.G.B. Aruggoda, C. K. Disanayaka and S. Kulathunge 65
Amplified fragment length polymorphism genome scan to reveal selection
signatures in Asian tiger mosquito (Aedes albopictus) G. H. Galhena, M. A. Shaw and R. Butlin 69
Recycling of spent grit into asphalt
N. R. G. Gamage 73
Effect of nitrogen on growth and oil content of Chlorella vulgaris for
biodiesel production A.M. Gammanpila, C.P. Rupasinghe and S. Subasinghe 77
Molecular cytogenetic characterization of the first reported Sri Lankan child
with a de novo 9p inverted duplication (p13.3p23)
I.U.H. Godapitiya, I. Kariyawasam, V. Udalamaththa, U.N.D. Sirisena and
V.H.W. Dissanayake 81

iii
Do different cooking methods affect glycaemic index of rice?
M. D. T. L. Gunathilaka, and S. Ekanayake 85
Effect of hermetic conditions of hermetically sealed large capacity cocoons
for storage of soybean (Glycine max) D.M.C.C. Gunathilake, W.M.C.B. Wasala and B.M.K.S. Thilakarathne 88
Event classification and abnormal event detection in videos
H.M.S.P.B. Herath, P.H. Perera, W.S.K. Fernando, M.P.B. Ekanayake, G.M.R.I.
Godaliyadda and J.V. Wijayakulasooriya 92
Viral burden and diversity in acute respiratory tract infections in children in
selected areas of Sri Lanka J.A.A.S. Jayaweera, F. Noordeen, A.J. Morel, F.N.N. Pitchai, H.S. Kothalawela,
A.M.S.B. Abeykoon and J.S.M. Peiris 96
Use of information on rainfall behavior to assist timely management of
agronomic operations in rubber plantations in the agro ecological region –
WL1a P. W. Jeewanthi, W. Wijesuriya and J. K. S. Sankalpa 100
Altered appearances: social meanings of dress during the Kotte period
P.V.M.Karunaratne 104
Phenolic content and antioxidant activities of legumes as affected by different
processing conditions K.D.D. Kumari, A.L.F. Sifna and G.A.P. Chandrasekara 108
Thermal characterization of graphite, graphite-oxide (GO) and graphene (GN)
by thermogravimetric analysis (TGA/DTA), and optimization of temperature
of graphite-oxide to graphene by HTA/XRD C.H. Manoratne, I.R.M. Kottegoda and S.R.D. Rosa 112
In vitro antibacterial activity of catechins from refuse green tea against drug-
resistant Pseudomonas aeruginosa S.S. Mediwake, I.S.K. Vithanage, V. Thevanesam, E.W.M.A. Ekanayake and B.M.R.
Bandara 116
In-vitro and field efficacy of kasugamycin on Xanthomonas campestris pv.
campestris, the black rot pathogen in cabbage L.D.C. Mendis, K.P. Somachandra and M.L.M.C. Dissanayake 120
Effect of water quality parameters on benthic macroinvertebrates D.S.N.
Munasinghe and M.M.M. Najim 124
Degree of maternal transfer of antibodies against measles, mumps and rubella
to newborns of pre- and post- vaccination era mothers M.
Nadhikala, P.P.S.L Pathirana, S. Peiris, S.M. Handunnetti and G.C.S. Galagoda 128

iv
Identification of differentially expressed genes in Brassica juncea and
Camelina sativa upon Alternaria brassicae challenge
N.M.C. Nayanakantha, S. Rawat and A. Grover 132
Relationship between renal function parameters cystatin C, serum creatinine
and blood urea with body fat content measured by bio- impedance analysis of
apparently healthy females living in a selected urban area of Colombo district M. S. N. F. Nihla and P. P. R. Perera 136
Combined application of 1-methylcyclopropene (1-MCP) and ascorbic acid
best improves the postharvest longevity and quality of Alstroemeria spp. cut
flowers B.S. Obadamudalige, C.K. Beneragama, G. Wijesuriya and S.M.M.R. Mawalagedera 140
The factors hampering the innovation in small and medium scale firms in the
food and beverage industry in Sri Lanka H.M.L. Peiris, G.H.I. Anjalee and A.M.T.P. Athauda 144
Provision of low cost gelling agents for in vitro seed germination of sunflower
(Helianthus annuus L.) P.C.D. Perera and N. Dahanayake 148
Impact of cartoon movies on behaviour of school children: a case study of
Mihinthale DS division D. A. M. Perera, H.A.B.W. Hettiarachchi and R.G.S.K Udayangani 152
Physical, chemical and microbial analysis of bottled drinking water in Jaffna
peninsula K. Ragila, P. Abiman, A. C. Thavaranjit and P. Iyngaran 155
Cognitive dissonance as a factor of influence fashion G.M. Ranathunga 159
Effect of silicon application on downy mildew in bitter gourd (Momordica
charantia L.) leaves R.M.R.N.K. Ratnayake, W.A.M. Daundasekera, H.M. Ariyarathne and M.Y.U.
Ganehenege
163
Application of weap model for assessing irrigation water availability–case
study of Deduru Oya reservoir D.S. Sampath, S.B. Weerakoon, B.K. Mishra and S. Herath 167
Evaluation of the antagonistic nature of extracellular compounds secreted by
some selected bacterial antagonists against Colletotrichum truncatum, the
causal agent of anthracnose disease in chilli H.B.P. Sandani, N.P. Ranathunge and P.L.N. Lakshman 171
v
Land suitability evaluation for rubber cultivation using multi criteria decision
approach and GIS: special focus on the Ampara district J.K.S. Sankalpa, S. Karunaratne and W. Wijesuriya 175
Effects of biochar produced from different feed stock materials on soil
properties in sandy regosol of Jaffna, Sri Lanka
S. Senthuran and N. Gnanavelrajah 179
Acceptance of a clinical pharmacy service by other members in the healthcare
team: experience in a tertiary care hospital in Sri Lanka L.G.T. Shanika,
S. Jayamanne, N. Wijekoon, J. Coombes, I. Coombes, D. Perera, N. Mamunuwa, V.
Pathiraja, H. A. De Silva and A. Dawson 183
Foreign direct investment as a catalyst for economic growth in Sri Lanka
P. Sivashankar 187
Inter-relationship between the prevalence of tick infestation on cattle and the
factors related to breed, physiological stage, management and diversification
systems E. Subalini, S. Dasinaa and S. Thanuejah 191
Possibilities of sharing multi species in a cage based on their food preference
using graph coloring technique G. K. H. Thondilege, G. H. J. Lanel and P. D. A. G. D. De Almeida 194
Biodegradation of Eichhornia crassipes towards biofuel production
A. Thurairajah, R.R. Ratnayake, N. Gnanavelrajah and M. Kathirgamanathan 198
Assessment of soil micronutrient availability in different cultivated and
uncultivated soils in Jaffna peninsula S. Vijayakumar, R. R. Ratnayake and N. Gnanavelrajah 202
Analysis on the rise of religious crisis and national integration of post war Sri
Lanka N. Weerasekara and R.K.S. Navodani 206
Author Index 210
Panel of Reviewers 212

vi
Message from the Chairman
National Science and Technology Commission
Prof. Dhammika A. Tantrigoda
It is with pleasure that I send this message on the occasion of the inauguration of the 4
th
Annual Research Session of the Young Scientists Forum (YSF) of the National Science
and Technology Commission (NASTEC). The Annual Research Session of YSF provides
a stage for presentation and discussion of latest scientific research findings of its
membership. I am happy to note that 53 presentations covering a multitude of academic
disciplines will be made at this year’s YSF research sessions. I am sure YSF membership
will make use of this opportunity to interact with each other and share their knowledge,
experience and wisdom.
I would like to take this opportunity to show my gratitude to the hardworking YSF
Steering Committee and to the dedicated NASTEC officials for organizing this important
I hope the annual sessions will be a great success as in the last three years with active
participation of all members of the YSF. I wish good luck for the proceedings of the
sessions and all future endeavours of YSF.

vii
Message from the Director
National Science and Technology Commission
Dr. Muditha Liyanagedara
I consider it as a privilege to give this message for the 4
th YSF Symposium. I have been
observing the development of this annual event since its inception in 2012. I am happy to
say that its success is quite satisfactory. The demand for the symposium has been
increasing every year and the standard of the symposium is also maintaining at a high
level to give it to a due prestige.
NASTEC sponsors this event to promote a mutually beneficial research network among
young scientists. General awareness of the research fields of each other, significance and
relevance of them to one’s research work may lead to collaborative research which would
be more productive.
The message that I would like to give to the young scientists of this country is that it is
high time for them to initiate research that brings direct economic benefits to the country.
This should be started at the research planning stage. If the planning can be extended up
to the identification of potential investors for the commercialization of their
products/services, that would give more value to their research.

viii
Message from the Chairman
Young Scientist Forum
Dr. Chalinda Beneragama
On behalf of the Organizing Committee, it is an honor and a privilege for me to welcome
you to the Fourth Young Scientists Forum (YSF) Symposium of National Science and
Technology Commission (NASTEC).
This symposium brings together researchers interested in the ever advancing state-of-the-
art in the fields of Agricultural Sciences, Biochemistry, Biotechnology, Economics,
Engineering, Environmental sciences, Health Sciences, Information Technology,
Medicine, Microbiology, Molecular Biology, Physical Sciences and Social Sciences.
High caliber meritorious contributions from researchers make this symposium a viable
gathering platform of paramount importance for young scientists.
The committee received 82 submissions from all corners of the country which reflects the
nationwide nature of this symposium. Each paper was peer reviewed typically by two
specialized reviewers. Following the rigorous review process, you will find 53 extended
abstracts appear in the symposium proceedings, corresponding to an acceptance rate of
64%.
The organization of the YSF Symposium is entirely voluntary. The review process
required an enormous effort from the members of the YSF Steering Committee, and I
would therefore like to thank all its members together with the reviewers for their
contribution to the success of this symposium. I would like to express my sincere thanks
and gratitude to Prof. Dhammika Tantrigoda, the Chairman of NASTEC and to Dr.
Muditha Liyanagedara, the Director of NASTEC for their invaluable guidance and
continual support for the symposium, being the main strength for the YSF. Ms. Asha
Pitadeniya, Scientific Programme Manager of NASTEC and the Symposium Coordinator,
deserves a very special word of appreciation for her tireless work with full of commitment.
Moreover, I wish to thank the Editorial Board for their excellent team work in producing
the Proceedings of the Symposium. The helping hand lent by all the staff members of the
NASTEC is also gratefully acknowledged.
I strongly believe you will find the symposium productive, informative, and enjoyable. I
wish the YSF Symposium all the very best in everything!

ix
Forward by Editors
Dr. LDB Suriyagoda
Dr. Indika Herath
Ms. Lohini Aththithan
Dr. Nilanthi Wijewardhana
The Research Symposium of Young Scientists Forum (YSF) 2014 was intended to
provide a platform for young scientists and professionals of various disciplines to
exchange their knowledge and to discuss their new research findings. This symposium
provides a great opportunity for them to present their work to a scientific audience and to
obtain feedback. The YSF symposium is also an opportunity for networking among the
scientists of different disciplines which is vital for future multidisciplinary research
opportunities on current research needs.
For this year’s Symposium, we received 82 extended abstracts from various disciplines.
They were first screened by the editors, and 53 papers were selected through a double-
blind review process. As per the decision of the steering committee of YSF 2014, the
authors of all the selected papers were given an opportunity to present their findings at
the symposium.
The editorial board wishes to thank all the authors for their valuable contribution to make
this symposium a success. We are also thankful to the panel of reviewers for their
valuable input through the review process. The editorial board would like to express their
sincere gratitude to Professor D. A. Thanthirigoda, Chairman, National Science and
Technology Commission (NASTEC) for his guidance extended to YSF throughout the
year. We are very much thankful for Dr. Muditha Liyanagedara, The Director, NASTEC
for his constant support. We would also like to express our sincere gratitude to other YSF
steering committee members for their support and cooperation. Our very special thank is
for Ms Asha Pitadeniya, and NASTEC staff members for all the support in organizing the
symposium and preparation of proceedings. The symposium would not be a success
without their dedication and hard work.
While congratulating all the authors who have been selected to present their research, we
wish the YSF Symposium 2014 a great success.
Proceedings of the Young Scientist Forum Symposium
1
IN VITRO LIPASE, CHOLESTEROL ESTERASE AND CHOLESTEROL MICELLIZATION INHIBITORY ACTIVITIES OF LEAF AND BARK OF
Cinnamomum zeylanicum Blume (CEYLON CINNAMON)
W. P. K. M. Abeysekera1, G. A. S. Premakumara1,* and W. D. Ratnasooriya2,3
1Industrial Technology Institute (ITI), 363, Bauddhaloka Mawatha, Colombo 07
2Department of Zoology, Faculty of Science, University of Colombo
3Faculty of Allied Health Sciences, General Sir John Kothalawala Defence University,
Ratmalana, Sri Lanka
Introduction Cinnamomum zeylanicum Blume (Ceylon cinnamon) is indigenous to Sri Lanka and used as a spice in several countries. According to some Sri Lankan traditional physicians the bark and leaf of this plant is claimed to possess anti-lipidemic effects by inhibition of lipid digestion and/or absorption. Scientifically anti-lipidaemic properties of bark of cinnamon have shown in various in vitro and in vivo models. However, anti-lipidaemic properties of Ceylon cinnamon bark via lipase, cholesterol esterase and cholesterol micellization inhibitory activities were not previously reported. Moreover, anti-lipidaemic properties of leaf of Ceylon cinnamon is not Investigated to date worldwide. In this connection this study was initiated to investigate anti-lipidemic potential of bark and leaf of Ceylon cinnamon via in vitro lipase, cholesterol esterase and cholesterol micellization inhibitory activities. Materials and Methods Ethanolic and dichloromethane:methanol (DCM:M) extracts of bark and leaf Powdered 20 g of each alba grade bark and leaf were extracted into 200 mL of 95 % ethanol in a soxhlet extractor and 200 mL of DCM:M (1:1 v/v) at room temperature for 7 days. The extracts were filtered separately and evaporated under reduced pressure and freeze dried. Freeze dried ethanolic and dichloromethane:methanol (DCM:M) extracts of bark and leaves were used for analysis of anti-lipidemic properties. Anti-lipidemic activity of bark and leaf extracts: Anti-lipidemic activity of bark and leaf extracts of Ceylon cinnamon were evaluated using in vitro lipase, cholesterol esterase and cholesterol micellization inhibitory assays. Statistical analysis: Statistical analysis of the data were done using SAS version 6.12. One way analysis of variance (ANOVA) and the Duncan’s Multiple Range Test (DMRT) were used to determine the differences among treatment means and P < 0.05 was considered as significant. Values are indicated as mean ± SD.

Proceedings of the Young Scientist Forum Symposium
2
Results and Discussion Significant differences were observed between bark and leaf extracts of Ceylon cinnamon for in vitro anti-lipase activity (p < 0.05) with, bark extracts having significantly high activity compared to leaf extracts (p < 0.05). Further,
ethanol leaf and DCM:M leaf showed only 12.92 1.37 and 19.71 1.10 % inhibition at the highest studied concentration of 600 µg mL-1. The IC50 values
of ethanol bark and DCM:M bark were 301.09 5.73 and 297.57 11.78 µg mL-1 respectively. Moreover, the dose response relationship of ethanol bark and DCM:M bark are given in Table 1. Table 1. Anti-lipase activity of ethanol and DCM:M bark extracts of Ceylon cinnamon
Concentration (µg mL-1) % Inhibition
Ethanol bark DCM:M bark
37.5 55.27 ± 3.59 55.66 ± 3.07 75 49.54 ± 0.29 52.07 ± 1.96
150 27.35 ± 4.43 24.14 ± 3.11 300 5.30 ± 1.28 17.95 ± 5.72 600 5.74 ± 0.80 12.50 ± 1.32
IC50 (µg mL-1) 301.09 ± 5.73a 297.57 ± 11.78a
Data represented as mean ± SD (n=3). Mean values in the column superscripted by different letters for bark extracts were significantly different at p < 0.05. Both bark and leaf extracts of Ceylon cinnamon showed significant (p < 0.05) in vitro cholesterol esterase inhibitory activity in a dose dependent manner. However, bark extracts had significantly high activity compared to leaf extracts (p < 0.05). Moreover, ethanol extracts showed high activity than DCM:M extracts. The dose response relationship of bark extracts and leaf extracts are given in Figure 1 and Figure 2. Both ethanol and DCM:M bark and leaf extracts of Ceylon cinnamon showed Cholesterol micellization inhibitory activity in a dose dependent manner. However, bark extracts had significantly high activity compared to leaf extracts (p < 0.05). The IC50 values of ethanol bark, ethanol leaf, DCM:M bark and DCM:M leaf were 0.23 ± 0.01, 0.62 ± 0.01, 0.48± 0.01 and 1.14 ± 0.05 mg ml-1 respectively. The dose response relationship of ethanol and DCM:M bark and leaf extracts for cholesterol micellization inhibitory activity is given in Table 2.

Proceedings of the Young Scientist Forum Symposium
3
Figure 1. Cholesterol esterase inhibitory activity of ethanol and DCM:M bark extracts of Ceylon cinnamon. IC50 values: Ethanol bark 30.62 ±1.67a µg mL-1; DCM:M bark: 34.39 ± 0.91b µg mL-1. IC50 values superscripted by different letters are significantly different at p < 0.05.
Figure 2. Cholesterol esterase inhibitory activity of ethanol and DCM:M leaf extracts of Ceylon cinnamon. IC50 values: Ethanol leaf 110.19 ± 3.27a µg mL-1; DCM:M leaf: 160.83 ± 8.32bµg mL-1. IC50 values superscripted by different letters are significantly different at p < 0.05.
Table 2. Cholesterol micellization inhibitory activity of bark extracts of Ceylon cinnamon
Concentration (mg mL-1)
% Inhibition of cholesterol solubility in micelles
Ethanol bark
DCM:M bark
Ethanol leaf
DCM:M leaf
EGCG
0.25 98.09 ± 0.56 73.94 ± 0.88 70.84 ± 0.80 43.59 ± 1.57
96.75 ± 1.08
0.5 69.48 ± 0.89 62.15 ± 1.06 44.54 ± 0.66 29.00 ± 0.61
69.78 ± 1.16
1 49.48 ± 0.85 19.36 ± 2.05 29.08 ± 1.11 12.83 ± 1.96
55.16 ± 0.58
IC50 (mg mL-1
) 0.23 ± 0.01a 0.48±0.01
b 0.62 ±
0.01c
1.14 ± 0.05
d
0.15 ± 0.01
Note: Data represented as mean ± SE (n=3). Mean values in the column superscripted by different letters for bark and leaf extracts were significantly different at p < 0.05. We have previously reported anti-oxidant properties of leaf and bark extracts of Ceylon cinnamon. Leaf and bark extracts of Ceylon cinnamon had potent anti-oxidant activities via multiple mechanisms. Oxidative stress is now known to be involved in hyperlipidaemia; it is indeed an early event in the evolution of hyperlipidaemia. As free radicals are involved in lipid peroxidation and related hyperlipidaemic activities anti-oxidants can play a vital role in antilipidaemic activities. It has been reported that phenolic compounds show the ability to inhibit the formation of cholesterol micelles. Therefore, observed antilipidaemic activities of leaf and bark extracts of Ceylon cinnamon may be

Proceedings of the Young Scientist Forum Symposium
4
due to the presence of anti-oxidative compounds. Further, experiments are in progress to isolate active compounds and efficacy in in vivo studies.
Conclusions and Recommendations
It is concluded that both bark and leaf extracts of Ceylon cinnamon possess lipase, cholesterol esterase and cholesterol micellization inhibitory activities. Bark had higher activity compared to leaf for all the above bioactivities. This is the first study to report lipase, cholesterol esterase and cholesterol micellization inhibitory activities of bark and leaf of Ceylon cinnamon worldwide. References Abeysekera WPKM, Premakumara GAS, Ratnasooriya WD (2013) In vitro antioxidant
properties of bark and leaf extracts of Ceylon cinnamon (Cinnamomum zeylanicum Blume). Tropical Agricultural Research 24: 128-138.
Jin D, Xu Y, Mei X, Meng Q, Gao Y, Li B, Tu Y (2013) Anti-obesity and lipid lowering effects of theaflavins on high-fat diet induced obese rats. Journal of Functional Foods 5: 1142-1150.
Kim YS, Lee YM, Kim H, Kim J, Jang D, Kim JH, Kim JS (2010) Anti-obesity effect of Morus bombycis root extract: Anti-lipase activity and lipolytic effect. Journal of Ethnopharmacology 130: 621-624.
Kirana C, Rogers PF, Bennett LE, Abeywardena MY, Patten GS (2005) Naturally derived micelles for rapid in vitro screening of potential cholesterol-lowering bioactives. Journal of Agricultural and Food Chemistry 53: 4623-4627.
Pietch M, Gutschow M (2005) Synthesis of tricyclic 1,3-oxazin-4-ones and kinetic analysis of cholesterol esterase and acetyl cholinesterase inhibition. Journal of Medicinal Chemistry 48: 8270-8288.
Sheng X, Zhang Y, Gong Z, Huang C, Zang YQ (2008) Improved insulin resistance and lipid metabolism by cinnamon extract through activation of peroxisome proliferator-activated receptors. PPAR Research, Article ID 581348.

Proceedings of the Young Scientist Forum Symposium
5
SEX HORMONE PROFILES AND ANTHROPOMETRIC PARAMETERS OF POST MENOPAUSAL BREAST CANCER PATIENTS
H.M.K Akalanka1*, S. Ekanayake1 and K. Samarasinghe2
1Department of Biochemistry, Faculty of Medical Sciences,
University of Sri Jayewardenepura 2Department of Pathology, Faculty of Medical Sciences,
University of Sri Jayewardenepura
Introduction Breast cancer (BC) is the most common carcinoma among women in Sri Lanka. According to the Cancer Registry 2007, the incidence of BC in Sri Lankan women is increasing since past few decades and the crude BC incidence is 19 per 100,000 population. It is found that mammary gland proliferation is increased with oestrogen, thus is reported to be associated with risk for BC (Enderson and Feigelson 2000; Russo et al 2000). Studies have shown that testosterone is found to enhance mammary tumor growth. Nevertheless progesterone and BC risk is grossly studied but results remain controversial. It is also reported that post-menopausal women being overweight and obese have the risk of BC due to adiposity related increase in levels of endogenous oestrogen concentrations (Bianchini et al. 2002; Lahmann et al. 2004). Thus in the present study, serum sex hormone concentrations of newly diagnosed post-menopausal BC women were determined and data correlated with anthropometric parameters of each patient as no related data among Sri Lankan BC women exist. This study was conducted to (i) determine serum estrogen, testosterone and progesterone concentrations of newly diagnosed post-menopausal BC patients, (ii) measure/calculate anthropometric parameters (weight, height, body mass index (BMI), waist circumference (WC), hip circumference (HC), waist: hip ratio (WHR) mid upper arm circumference (MUC)) of BC patients and (iii) study possible correlations between serum estrogen, testosterone and progesterone concentrations and anthropometric measures. Meterials and Methods Consent was obtained from newly diagnosed post-menopausal Sri Lankan BC patients (n=75) from National Cancer Institute Maharagama for the participation of the study. Serum total 17-β estradiol, total testosterone and progesterone concentrations were measured using an enzyme immunoassay

Proceedings of the Young Scientist Forum Symposium
6
competition method with final fluorescent detection methodology with immunoanalyzer (VIDAS Progesterone Ref 30409 assay kits, VIDAS Testosterone Ref 30418 assay kits and VIDAS estradiol II Ref 30431 assay kits (Biomerieux, France). Weight, height, BMI, WC, HC, MUC and WHR of each BC patient was measured/calculated. BMI ≥23 and >25 were considered as overweight and obese respectively. Over 80 cm of WC and WHR of ≥ 0.80 were considered as risk category and significances were analyzed. Descriptive statistics, K independent sample test (Kruskal Wallis) and Spearman correlations were determined using the statistical software SPSS version 16 (Ethical approval Number- 651/12). Results and Discussion Mean age of menopause of the study population was 50 (±3) years and mean (±SEM) testosterone, estrogen and progesterone concentrations of the study sample were 0.22 ng mL-1 (±0.16), 27.8 pg mL-1 (±0.52) and 0.57ng mL-1 (±0.15), respectively. The average hormone concentrations according to the age category are stated in Table 1. Accordingly, 43 %, 40 % and 17 % of BC women were present in each age category respectively. Table 1. Testosterone, estrogen and progesterone concentrations of BC women according to the age
Age Category (Years)
Testosterone ±SEM (ng mL-1)
Estrogen ±SEM (pg mL-1)
Progesterone ±SEM (ng mL-1)
51-60 n= 32
0.25±0.03 (0.09-0.61)
29.69±9.24 (0.89-210)
0.52±0.13 (0.24-3.60)
61-70 n=30
0.17±0.02 (0.09-0.64)
23.54±7.19 (0.89-183)
0.27±0.01 (0.24-0.63)
71-79 n= 13
0.19±0.03 (0.09-0.43)
12.25±1.24 (8.9-22.4)
0.51±0.20 (0.24-2.87)
Reference range 0.1-0.9 < 58 < 0.41
Among the total group, 88 % had testosterone below half of the recommended upper value (0.9 ng mL-1) and among them, 26 % had levels below the lower reference margin (0.1 ng mL-1). None of the participants had testosterone above the recommended upper value. Twenty two percent of the study group had progesterone above the upper limit (0.41 ng mL-1). From the total group, 47 % had progesterone below half of the recommended upper limit. Only 9 % had oestradiol II above 58 pg mL-1 (upper limit of normal). From the total group, 87 % had oestradiol II below half of the recommended upper

Proceedings of the Young Scientist Forum Symposium
7
value. Significant differences in serum hormone concentrations with respect to age was not observed (P>0.05). Among the patients, 64 % had BMI greater than 23 and 40 % among them were obese. According to WC, 67 % of women were in the risk category. With respect to WHR, 90 % belonged to the risk category. The mean values of anthropometric parameters are given in Table 2.
Table 2. Anthropometric parameters of BC patients
Anthropometric parameter (Unit) Mean Minimum Maximum
Weight (kg) 56.0± 1.41 34.00 90.00
Height (m) 1.51± 0.01 1.38 1.70
BMI (kg m-2) 24.8± 0.50 17.00 35.60
Waist (cm) 84.0± 1.50 33.00 116.00
Hip (cm) 91.0± 2.70 0.88 121.00
WHR 0.87± 0.60 0.76 0.99
MUC (cm) 28.4± 1.80 21.00 40.00
Oestrogen showed significant positive associations with BMI(r=0.3, p=0.02), MUC (r=0.4, p=0.00) and weight (r=0.4, p=0.00). Progesterone showed significant positive associations with BMI(r=0.3, p=0.02), MUC (r=0.3, p=0.03) and weight (r=0.3, p=0.01), even though oestradiol II was closer to lower limit of normal in most of the individuals. However, testosterone showed a significant association(r=0.28, p=0.02) only with BMI. WC, HC or WHR were not significantly associated with oestrogen, progesterone or testosterone. Even though testosterone and oestrogen are reported to be positively associated with BC, majority of participants had estrogen and testosterone below half of the recommended upper value while one fifth of the study population had elevated serum progesterone concentrations. Conclusions and Recommendations Majority of the patients were either overweight or obese and had low oestrogen which may have contributed to the high BMI, WC and WHR irrespective of the positive correlations observed with oestrogen.

Proceedings of the Young Scientist Forum Symposium
8
References Enderson BE, Feigelson HS (2000) Hormonal carcinogenesis. Carcinogenesis 21:427-
433. Russo J, Hu YF, Yang X, Russo IH (2000) Developmental, cellular, and molecular basis of
human breast cancer. Journal of the National Cancer Institute Monographs pp. 17–37.
Bianchini F, Kaaks R, Vainio H (2002) Overweight, obesity, and cancer risk. Lancet Oncology 3: 565–574.
Lahmann PH, Hoffmann K, Allen N, van Gils CH, Khaw KT, Tehard B, Berrino F, Tjonneland A, Bigaard J, Olsen A et al. (2004) Body size and breast cancer risk: findings from the European Prospective Investigation into Cancer and Nutrition (EPIC). International Journal of Cancer 111: 762–771.

Proceedings of the Young Scientist Forum Symposium
9
SOCIO-CULTURAL CHANGE IN MEEMURE VILLAGE IN KANDY DISTRICT:TWENTY YEARS AFTER THE PROHIBITION OF CHENA
CULTIVATION
D.T.H. Ananda1* and C.A.D. Nahallage1 1Department of Sociology and Anthropology, University of Sri Jayewardenepura
Introduction In the recent past many cultures around the world have undergone extensive changes. Meemure village is an interesting example that has continuously undergone changes in the last two decades. Meemure is traditionally an agricultural village with a population of about 331 people, which has its own specific culture as a result of being isolated from main stream Sri Lankan society for a long time and some of the unique cultural traits associated with Meemure cannot be seen elsewhere in the country. Mythical stories related to king Rawana have dignified the pre-history of this village and have disclosed that the villagers are descendants of king Rawana and the Yaksha tribe. Meemure villagers have developed specific cultural traits from the beginning. Religious practises and rituals, food customs, Chena cultivation practises, paddy cultivation practises are among the unique traditional systems they developed and maintained. However they were confronted with a huge problem after the government prohibited their Chena cultivation practice in 1988. Various cultural practices related to kinship and marriage, economy, religion and traditional knowledge etc. are entwined together to form one fully integrated cultural system. When one or more traits get disrupted it affects the whole cultural system. Other factors that contributed to the change in the Meemure culture are the increase in the assimilation with outside society, the exodus of the young generation, a decline in the practise of the traditional knowledge system, innovation, devolution and forcible change: forced to adapt only to paddy cultivation. These factors cause, misery and community degradation which is colloquially known as a “Culture Crash”. Some cultures cannot survive after being exposed to cultural changes. People of the Meemure village underwent this phase. Even though some of these cultural changes could be beneficial and adaptive, it might still be difficult for individuals within that particular culture to accept them. Thus cultural change is considered as a social problem even though it is a part of the necessary process of adaptation. The main objective of this study was to discover the consequences of the prohibition of Chena cultivation toward Meemure village and its unique culture. Materials and Methods

Proceedings of the Young Scientist Forum Symposium
10
The study was carried out from April to November 2013. Questionnaire surveys were conducted to gather information about the cultural history and synchronic cultural traits on the Meemure village. The population of the Meemure village consists of 331 people including 115 families; 40 families were randomly selected for the questionnaire with the aim of including individuals from families who have been living in the village for many generations. Five elderly individuals who were highly knowledgeable about their cultural heritage were selected for in-depth interviews. Observation and participant observation methods were used for comparison of cultural practises. Study Area: Meemure village is situated in Kandy district; Ududumbara Secretariat Division, belonging to the Meemure Grama Niladari Division [N 07.433330 and E 08.833330]. It is a 5 km2 village in the middle of the Knuckles Conservation Forest. From Colombo to Meemure village it is 229 km. There are no electricity facilities in Meemure village.
Figure 1. A) Kandy District, B) Ududumbara secretariat division, C) Meemure Grama Niladari Division (highlighted) Results and Discussion The single most significant factor that contributed to the change in their culture is the prohibition of Chena cultivation in 1988. The National Heritage Wilderness Area Act in 1988 defined areas above 3500 ft. as protected areas which included their hereditary Chena cultivating lands. It terminated their self-sustaining economy and consequently these people had to look outside their village to find necessary resources that are now not available in the village. When they were under the power of traditional political authorities they had not such limitations because the traditional leaders knew the link between man and the nature excessively. During the time when villagers depended on Chena and Paddy cultivation they had enough food such as mun (green gram-Phaseolus aureus), thala (sesame), iringu (wheat), kurakkan (Eleusine coracana), undu (Phaseolus mungo) etc. Due to this self-sustaining life they hardly went out of the village for their daily

Proceedings of the Young Scientist Forum Symposium
11
requirements. In those days hey had to visit the nearest town of Kandy only about twice a year to get cloth, salt and other a few other basic requirements. In these visits they had taken their Chena harvest, orange (Citrus sinensis), honey, areca nuts (Areca catechu), and betel to exchange for other goods or to sell. At present they have to find other ways to get these daily requirements such as vegetables and grains. Therefore the villagers travel 38 km to reach the nearest town of Hunnasgiriya to meet their daily needs. It opened the doors to the outside world on a regular basis and villagers started to settle in these areas. As a result, more marriages occurred between Meemure people and people from outside villages. In addition villagers have sold their village lands for cheaper price and have settled in urban areas. Assimilation has increased by 52 % among three generations. From the sample size of 40 families including 148 children; only 43 % of them are remaining in the village and 57 % have migrated to urban areas for work, marriage or to educate their children. Exodus of young has become a major problem in the village. Lacks of facilities in the village have made young people to migrate from the village for seeking job opportunities elsewhere. During the earlier times collective agrarian lifestyle supplied their daily needs. However at present they have to find everything individually for their own survival. Thus the decision of young people to migrate out of the village to support themselves cannot be halted. The traditional knowledge system prevailing in the society is now limited only to the older generation as new generations do not practice or benefit from that knowledge. Thus their traditional cultural knowledge does not get passed down to the next generation through socialization. The traditional knowledge and community relations have been disturbed and these factors have produced individuals who know very little about their traditions or history. As a result of the prohibition of Chena cultivation, Meemure villagers are practising only paddy cultivation and have absorbed modern farming methods. Many facets of Meemure life and their cultural traits have changed and been lost without replacement. Acceptance of new innovation leads to the loss of older ones. Some aspects of Chena cultivation such as traditional chena pala (shack), pendi weta (stockade around the chena), vee atuwa (traditional paddy storing system different from other areas), and food storing methods such as iringu aduththa, iringu uga (buck wheat storing systems) are unique cultural traits which are not being practiced by modern day Meemure villagers (Ananda and Nahallage 2014). Religious practises such as Yakkama and Adukku Pujawa are specific characteristics in Meemure culture that are slowly diminishing. Meemure villagers continue to practice their religious ceremonies despite the fact that

Proceedings of the Young Scientist Forum Symposium
12
the farming practices which they were built upon no longer exist Also television and radio has replaced the traditional gathering of the villagers into a nearby house for discussion or entertainment at night or during other free time; 86 % of the families use radios, 44 % televisions and 35 % have telephones. Solar-cells are used by 88 % of the families in the village. The traditional embalming methods that they used to postpone the putrefaction of the body such as honey, betel and arecanut mixture and mee (Madhuca longifolia) leafs, seeds, barks and tumeric etc. These practices are specific to them and are no longer practised since they rely on the modern methods used by the main society. There is a new tendency among the villagers to let their school age children stay in urban temples until they finish schooling, in this way they can attend urban schools which have far more facilities than the village school does. Meemure primary school is older than 100 years. In 2011 there were only 12 children in the school with 3 teachers and classes up to grade 5. This represents 24 % of the school going children in the village. Seventy six percent of the children are going to nearby schools in Kaikawala (2 km from the village), Hunnasgiriya (38 km) and to schools in Kandy (116 km). As a consequence the majority of the people remaining in the village are of the older generation and the children below five years of age. Conclusions and Recommendations As well as outside influence, materialistic and technological factors have forced a number of cultural changers upon Meemure people. Many of these changes have arisen as a result of alterations in the Meemure traditional agrarian society. Most extreme cases of cultural collapse occur as a result of displacement of traditional political authority by the conquerors who know nothing about the culture they control. Eventually as anthropologists our duty is to document these specific cultural practices for future generations before it altogether diminishes from our society. References Ananda T, Nahallage C (2014) Traditional agricultural practises unique to Meemure
village, Kandy district Sri Lanka. International Journal of Multidisciplinary Studies 1: 11-21.

Proceedings of the Young Scientist Forum Symposium
13
AN ANALYSIS OF AIR POLLUTION IN SELECTED CITIES OF SRI LANKA USING MULTIVARIATE CONTROL CHARTS
D. N. S. Attanayake1* and R. A. B. Abeygunawardana1
1Department of Statistics, University of Colombo
Introduction Since the world began, decaying vegetable matters, dead animals and products of forest fires had produced noxious gaseous to the environment indicating there was no truly unpolluted environment ever. Thus, the matter of air pollution came into existence with the technological development of the human. Air pollution can be introduced as a silent hazard compared to the other hazards, since it is invisible and can be classified as Indoor and Outdoor pollution where in this study only outdoor air pollution was considered. Air pollutants are the chemical substances that are harmful to human and other living beings. Even though Statistical Process Control (SPC) is a well practiced and widely spread tool of quality monitoring, application of SPC to monitor air quality is not frequent. On the other hand applications of SPC to monitor air quality in Sri Lanka are even harder to find. Two scientists Corbett and Pan emphasize that “applying SPC tools to environmental monitoring has substantial potential, whether for air, water or other emissions”. Additionally, many scientists and organizations have researched and revised the quality of the air surrounded Colombo city, the commercial capital of Sri Lanka, a few attempts have been made to have a look on the quality of air of the cities other than Colombo. Thus, through this research the eminence of the atmosphere of few other locations in addition to Colombo was investigated using SPC techniques.
Materials and Methods The concentrations of the five criteria air pollutants; Carbon Monoxide (CO), Sulphur Dioxide (SO2), Nitrogen Dioxide (NO2), Ozone (O3) and Particulate Matter (PM 10) were used to evaluate the quality of air surrounds the cities Colombo (Townhall area), Kandy, Maharagama and Kurunegala. Concentrations were measured in mg m-3 during 1.00 p.m. to 4.00 p.m. and the study period was October, 2010 to April, 2013.
The statistical approach used to evaluate the quality of air is control charts. A control chart is a graphical representation of a quality characteristic that has

Proceedings of the Young Scientist Forum Symposium
14
been measured over time. Main features of a control chart are the center line which represents the average value of the quality characteristic at in-control state, upper control limit and the lower control limit. For the individual evaluations of the process level both Individual and Moving Range (I-MR) charts and Exponentially Weighted Moving Average (EWMA) charts were constructed. I-MR chart represents an individual chart together with a moving range chart enabling easier interpretation of both charts and is a control chart for variables. On individual chart each data point is plotted as a separate point and on moving range chart difference between two successive data points is plotted as they come from the process in a sequential order. The EWMA chart can be used instead of Shewhart control chart when the objective is to detect small shifts in the process level and variability. Multivariate charts were employed as the air pollutants need simultaneous process monitoring. The multivariate counter parts of the above univariate charts, Hotteling T2 and Genralized variance chart and Multivariate EWMA respectively were employed depending on the correlation of different air pollutants. Both univariate and multivariate EWMA (MEWMA) charts were used due to their sensitivity of notifying small process shifts and insensitivity to normality assumption of the variables. Results and Discussion According to I-MR charts CO concentrations at each location were in-control and SO2 process was out-of-control only at Kurunegala.
EW
MA
Year
Month
2013201220122012201220112011201120112010
MarDecSepJunMarDecSepJunMarDec
0.30
0.25
0.20
0.15
0.10
0.05
0.00
__X=0.0757
UCL=0.1311
LCL=0.0202
In
div
idu
al
Va
lue
Year
Month
2013201220122012201220112011201120112010
MarDecSepJunMarDecSepJunMarDec
2
1
0
-1
-2
_X=0.069
UC L=1.969
LC L=-1.831
Mo
vin
g R
an
ge
Year
Month
2013201220122012201220112011201120112010
MarDecSepJunMarDecSepJunMarDec
2.0
1.5
1.0
0.5
0.0
__MR=0.714
UC L=2.334
LC L=0
1
1
Ind
ivid
ual
val
ue
Mo
vin
g ra
nge
EWM
A
Figure 1. I-MR chart and EWMA chart of NO2 at Colombo Even though the I-MR chart of CO concentrations at Maharagama was in-control, EWMA chart depicted an out-of-control process. Contradictory to I-MR charts, EWMA charts of SO2 depicted out-of-control processes at Colombo, Kandy and Kurunegala and a decline in the process level was practiced. A

Proceedings of the Young Scientist Forum Symposium
15
decrement in the process mean was experienced in EWMA charts of NO2 after February, 2011 at all the locations (Fig. 1). Both I-MR and EWMA charts illustrated PM10 concentration at Colombo were uncontrolled. Though I-MR charts were not applied to the O3 data (since the data are not normal), considering the robustness to the normality assumption, EWMA charts were constructed. Based on the obtained figures it was concluded that all the processes are out-of-control and the out-of-control alarms appeared at the beginning of the process. Foremost disadvantage of applying univariate control chart is the omission of relationships among the variables. The remedy used to overcome this problem was the application of multivariate process monitoring and controlling techniques. Hotelling T2 chart is the multivariate counterpart of Shewahrt control charts. Application of the T2 and variance charts to monitor the process shifts of CO and O3 at Colombo revealed that the combined process is out-of-control and this result was proven by MEWMA chart (Fig. 2). Even though the Hotelling T2 charts constructed to monitor the joint process of SO2 and NO2 concentrations at Kandy and Kurunegala were in-control, MEWMA charts depicted out-of-control processes. Hence it is advisable to use MEWMA chart over Hotelling T2 chart.
Figure 2. Hotteling T2 chart and MEWMA chart for CO and O3 at Colombo Considering the correlations between the three gases CO, SO2 and NO2, Hotelling T2 chart was applied to the three pollutants and the figure showed an in-control process. On the other hand MEWMA chart depicted an out-of-control process.
MEW
MA
Year
Month
2013201220122012201220112011201120112010
MarDecSepJunMarDecSepJunMarDec
5
4
3
2
1
0
UCL=1.421

Proceedings of the Young Scientist Forum Symposium
16
Conclusions and Recommendations Based on the results it can be concluded that SO2, NO2 and O3 concentrations were not at acceptable levels in the four locations selected due to the out-of-control processes observed under both I-MR and EWMA charts employed. PM10 concentration at Colombo and CO concentration at Maharagama were uncontrolled. Thus, the air at the four locations was polluted with respect to the five criteria air pollutants. When appraising and controlling the quality of air environmental organizations should focus on the simultaneous process monitoring of SO2 and NO2; CO and O3. Both multivariate and univariate EWMA control charts can be efficiently used in detecting moderate to small shifts in the process level and are successful as a phase II monitoring procedure. Shewhart type control charts (I-MR and Hotelling T2 along with generalized variance chart) can be utilized in identifying large shifts in the process level. EWMA chart outperforms I-MR chart in appraising the quality of air due to the insensitivity to normality and efficiency in uncovering small shifts. Concentrating on the sources of pollutants following suggestions can be proposed to reduce the concentrations in air.
Implementation and maintenance of vehicle emission standards
Quality of the fuel or gasoline should be continuously monitored and must be maintained in order to raise the quality of air
Enhance the vehicle emission test facilities of CleanCo Lanka Limited
Employment of a proper traffic controlling system
Industries must pay attention on releasing the pollutants to the air in excessive amounts and government must play a role to secure the quality of air
References Corbett CJ, Pan JN (2002) Evaluating environmental performance using statistical
process control techniques. European Journal of Operational Research 139: 68-83.
Halliday EC (1961) A Historical Review of Atmospheric Pollution. World Health Organization, Monograph Series. No.46.
Montgomery DC (2005) Introduction to Statistical Quality Control. 5th edition. Willey, New York.
Proceedings of the Young Scientist Forum Symposium
17
AN ALGORITHM TO FIND OPTIMAL ORDER QUANTITY WHEN PRICE DISCOUNTS ARE ALLOWED
M.M.R. Balasooriya1* and D.M. Samarathunga1
1Department of Mathematics, Faculty of Science, University of Peradeniya
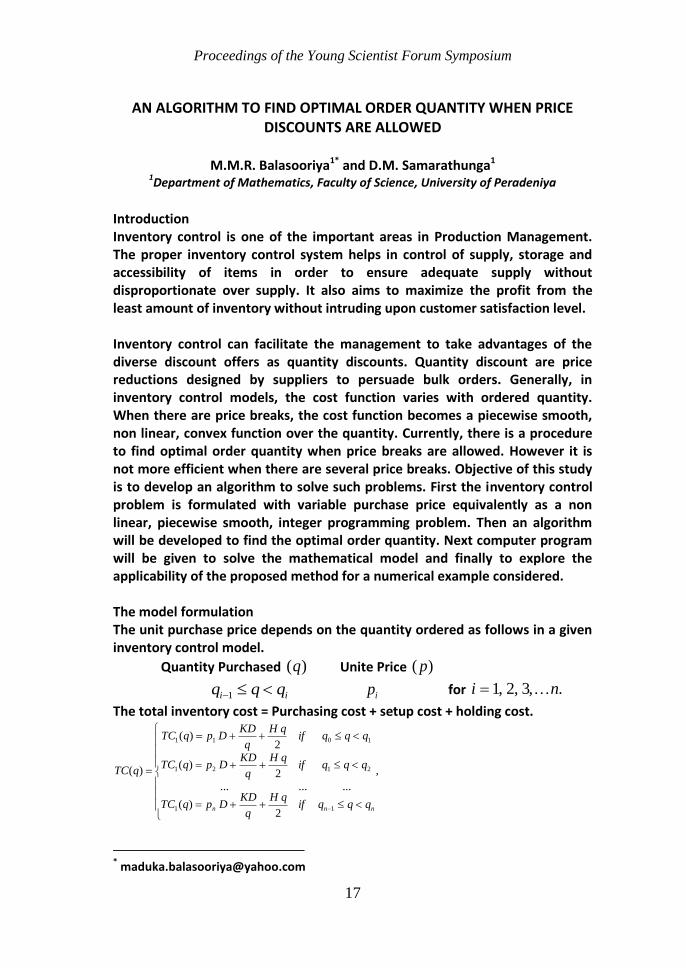
Introduction Inventory control is one of the important areas in Production Management. The proper inventory control system helps in control of supply, storage and accessibility of items in order to ensure adequate supply without disproportionate over supply. It also aims to maximize the profit from the least amount of inventory without intruding upon customer satisfaction level. Inventory control can facilitate the management to take advantages of the diverse discount offers as quantity discounts. Quantity discount are price reductions designed by suppliers to persuade bulk orders. Generally, in inventory control models, the cost function varies with ordered quantity. When there are price breaks, the cost function becomes a piecewise smooth, non linear, convex function over the quantity. Currently, there is a procedure to find optimal order quantity when price breaks are allowed. However it is not more efficient when there are several price breaks. Objective of this study is to develop an algorithm to solve such problems. First the inventory control problem is formulated with variable purchase price equivalently as a non linear, piecewise smooth, integer programming problem. Then an algorithm will be developed to find the optimal order quantity. Next computer program will be given to solve the mathematical model and finally to explore the applicability of the proposed method for a numerical example considered. The model formulation The unit purchase price depends on the quantity ordered as follows in a given inventory control model.
Quantity Purchased )(q Unite Price )( p
ii qqq 1 ip for .,3,2,1 ni
The total inventory cost = Purchasing cost + setup cost + holding cost.
,
2)(
.........2
)(
2)(
)(
11
2121
1011
nnn qqqifqH
q
KDDpqTC
qqqifqH
q
KDDpqTC
qqqifqH
q
KDDpqTC
qTC
Proceedings of the Young Scientist Forum Symposium
18
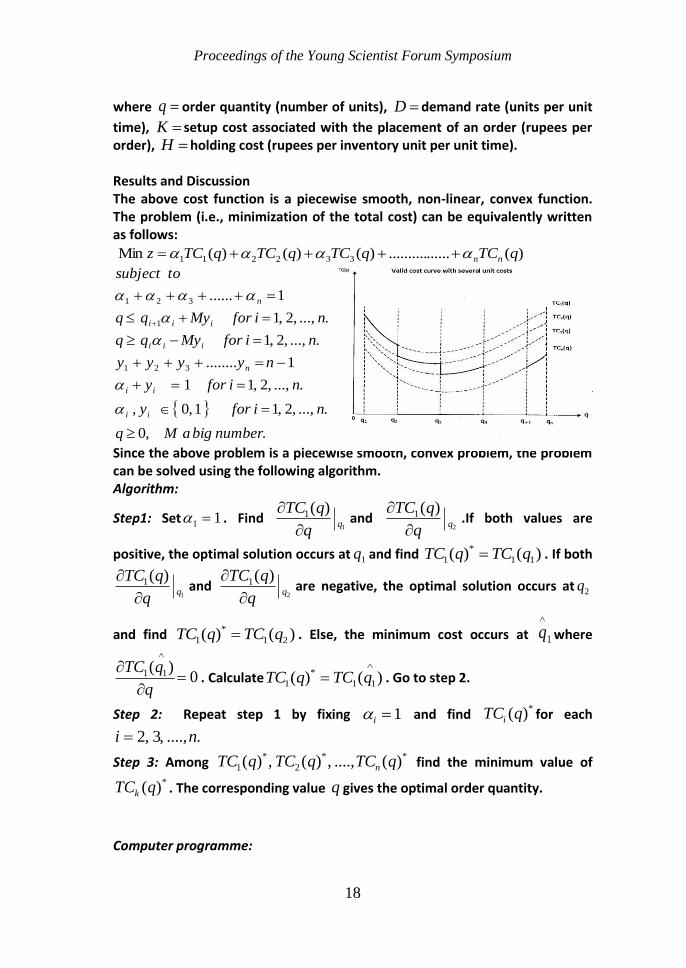
where q order quantity (number of units), D demand rate (units per unit
time), K setup cost associated with the placement of an order (rupees per order), H holding cost (rupees per inventory unit per unit time). Results and Discussion The above cost function is a piecewise smooth, non-linear, convex function. The problem (i.e., minimization of the total cost) can be equivalently written as follows:
)(................)()()(Min 332211 qTCqTCqTCqTCz nn
Since the above problem is a piecewise smooth, convex problem, the problem can be solved using the following algorithm. Algorithm:
Step1: Set 11 . Find 1
)(1q
q
qTC
and
2
)(1q
q
qTC
.If both values are
positive, the optimal solution occurs at 1q and find )()( 11
*
1 qTCqTC . If both
1
)(1q
q
qTC
and
2
)(1q
q
qTC
are negative, the optimal solution occurs at 2q
and find )()( 21
*
1 qTCqTC . Else, the minimum cost occurs at 1
q where
0)( 11
q
qTC. Calculate )()( 11
*
1
qTCqTC . Go to step 2.
Step 2: Repeat step 1 by fixing 1i and find *)(qTCi for each
.....,,3,2 ni
Step 3: Among **
2
*
1 )(....,,)(,)( qTCqTCqTC n find the minimum value of*)(qTCk . The corresponding value q gives the optimal order quantity.
Computer programme:
.,0
....,,2,11,0,
....,,2,11
1........
....,,2,1
....,,2,1
1......
321
1
321
numberbigaMq
nifory
nifory
nyyyy
niforMyqq
niforMyqq
tosubject
ii
ii
n
iii
iii
n

Proceedings of the Young Scientist Forum Symposium
19
Next, a computer programme has been developed for this algorithm using “R software”. Case study: In this example the optimal order quantity can be found when the annual demand is 2000 units and each order costs Rs. 1000 and annual holding cost is 40 % of unit cost. The unit costs depends on the quantity ordered as, Rs. 100 when quantities less than 500, Rs. 80 when quantities between 500 and 999 and Rs. 60 when quantities of 1000 or more. Here, D =2000, K =Rs. 1000 an order, H =0.4* p and p varies and is either
Rs. 100, Rs.80, Rs.60.
When 1,,01 3211 yyy , 1001 q and 5002 q
Then qq
qTC 20102
102)(6
5
1
and
0100
10220
)(2
61
1
q
q
qTC, 0
500
10220
)(2
61
2
q
q
qTC.
minqfun <- function(q1,q2,K,D,p,I) # q1 <q2
{ A <- ((I*p)/2 -(K*D)/(q1^2)) B <- ((I*p)/2 -(K*D)/(q2^2))
if(A> 0 & B >0) { return(q1)} else if(A< 0 & B <0)
{ return(q2)}Else {q <- sqrt((2*K*D)/(I*p)) return(q)}}
cqfun <- function(q,p,D,K,I){ res <-p*D + (K*D)/q + (I*p*q)/2
return(res)}
#Run from
q1 <- c(100,500,1000) q2 <- c(500,1000,1500) p <- c(1,0.8,0.6)
data <- cbind(q1,q2,p) D <- 2000 K <- 10 I <- 0.4 n <- 3
results <- matrix(NA,nrow = n,ncol=2) # q , cq for(i in 1:n){ results[i,1]
<- minqfun(data[i,1],data[i,2],K,D,data[i,3],I)
results[i,2] <- cqfun(results[i,1],data[i,3],D,R,I)} alphai <-
which.min(results[,2]) minCq <- results[alphai,2] minq <-
results[alphai,1]minCq minq
Proceedings of the Young Scientist Forum Symposium
20
Therefore minimum cost occurs when 0)(1
q
qTCat 23.316ˆ q and
83.648,212)ˆ(1 qTC .
When 1,,01 3122 yyy , 5002 q and 10003 q .
Then qq
qTC 16102
106.1)(6
5
2
and
0500
10216
)(2
62
2
q
q
qTC, 0
1000
10216
)(2
62
3
q
q
qTC.
Therefore minimum cost occurs at 5002 q and .000,172)( 22 qTC
When ,1,,01 2133 yyy 10003 q and 15004 q .
Then qq
qTC 12102
102.1)(6
5
3
and
01000
10212
)(2
63
3
q
q
qTC, 0
1500
10212
)(2
63
4
q
q
qTC.Therefore
minimum cost occurs at 10003 q and .000,134)( 33 qTC
Then minimum costs at each category are 83.648,212.)23.316(1 RsqTC ,
000,172.)500(2 RsqTC and 000,134.)1000(3 RsqTC . Therefore, to
achieve minimum cost, the company should buy 1000 items from the supplier with the cost of Rs. 134,000. Conclusions and Recommendations In this study a new method to find the optimal order quantity is proposed when there are price brakes. The propose model can be applied to solve inventory control model with variable purchase price. In general it can be applied to solve any unconstraint minimization problem with piecewise smooth, nonlinear convex integer programming problem.
References Chawala KK, Gupta V (2005) Operations Research. Kalyani Publishers, New Delhi,
India. Taha HA (2011) Operations Research, An Introduction. Pearson International Edition,
New Jersy,USA.

Proceedings of the Young Scientist Forum Symposium
21
C-REACTIVE PROTEIN AND FIBRINOGEN LEVELS IN SMOKERS WITH CORONARY ARTERY DISEASE
E. M. S. Bandara1*, S. Ekanayake1, A. D. Kapuruge2 and C. A. Wanigatunge3
1Department of Biochemistry, Faculty of Medial Sciences,
University of Sri Jayewardenepura, Nugegoda, Sri Lanka 2Cardio-thoracic Unit, Sri Jayewardenepura General Hospital, Nugegoda, Sri Lanka
3Department of Pharmacology, Faculty of Medial Sciences, University of Sri Jayewardenepura, Nugegoda, Sri Lanka
Introduction Cigarette smoking is a major modifiable risk factor for the development of cardiovascular diseases. Smoking is associated with alteration in lipid profile, coronary vasomotor reactivity, platelet aggregation, and prothombotic states. These are the main factors related to atherosclerosis. Cigarette smoking is also associated with increase in several inflammatory markers such as C-reactive
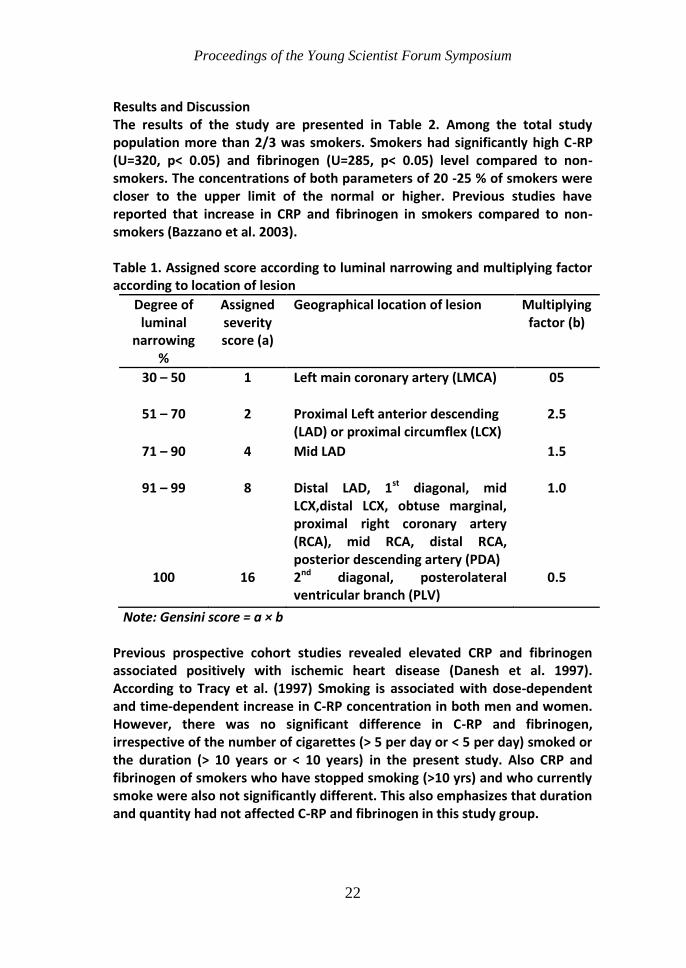
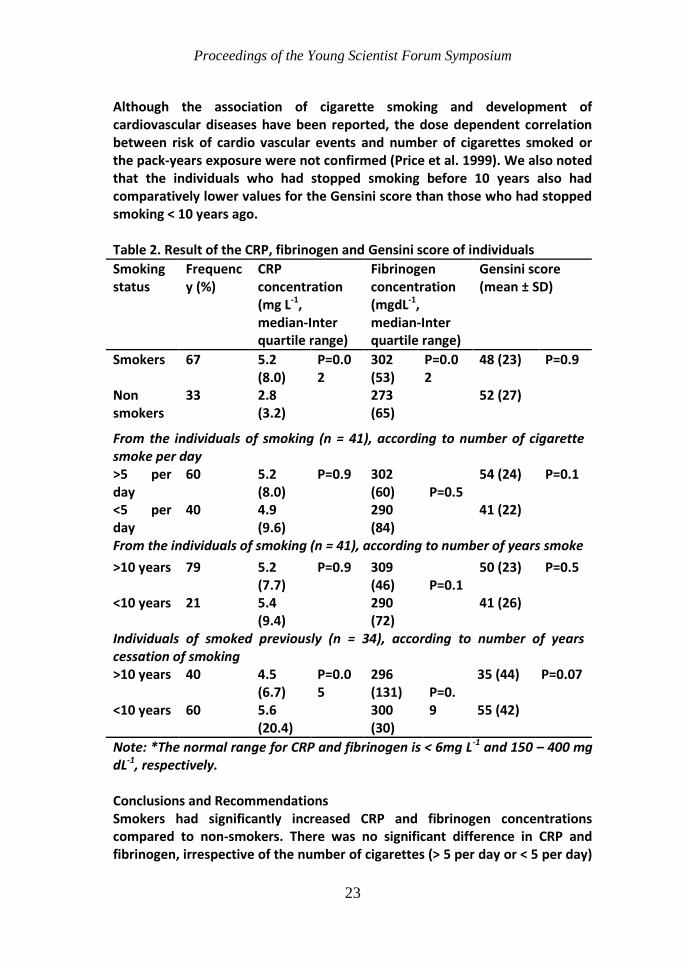
protein (C-RP), interleukin -6 and tumor necrosis factors-. These inflammatory responses are essential factors for initiation and the development of atherosclerosis. Since smoking has a fairly high prevalence in Sri Lanka, we assessed the CRP and fibrinogen concentrations of male patients awaiting Coronary Artery Bypass Graft surgery both smokers and non-smokers to study their association with disease severity score. Materials and Methods The study is a cross sectional descriptive study carried out at the Cardio-thoracic Unit of Sri Jayewardenepura General Hospital. The ethical approval was obtained from University of Sri Jayewardenepura (Approval No.635/12) and Sri Jayewardenepura General Hospital. There were 64 (age 56.9 ± 10) male patients in the study group. C-RP was determined using immuno-turbidometry assay and fibrinogen was determined by thrombin time. An interviewer administered questionnaire was used to collect data on smoking. Coronary Artery Disease (CAD) severity was evaluated by Gensini score (Gensini 1975). The Gensini score was computed by assigning a severity score according to the degree of luminal narrowing and geographical importance of each coronary stenosis as seen in the coronary angiogram. The assigned severity score according to the degree of luminal narrowing was multiplied by a factor considering the geographical importance of coronary artery (Table 1). The sum of all coronary arteries was expressed as the Genisini score. Mann-Whitney U test was used to analyse the result (SPSS version 16).
Proceedings of the Young Scientist Forum Symposium
22
Results and Discussion The results of the study are presented in Table 2. Among the total study population more than 2/3 was smokers. Smokers had significantly high C-RP (U=320, p< 0.05) and fibrinogen (U=285, p< 0.05) level compared to non- smokers. The concentrations of both parameters of 20 -25 % of smokers were closer to the upper limit of the normal or higher. Previous studies have reported that increase in CRP and fibrinogen in smokers compared to non-smokers (Bazzano et al. 2003). Table 1. Assigned score according to luminal narrowing and multiplying factor according to location of lesion
Degree of luminal
narrowing %
Assigned severity score (a)
Geographical location of lesion Multiplying factor (b)
30 – 50 1 Left main coronary artery (LMCA) 05
51 – 70 2 Proximal Left anterior descending (LAD) or proximal circumflex (LCX)
2.5
71 – 90 4 Mid LAD 1.5
91 – 99 8 Distal LAD, 1st diagonal, mid LCX,distal LCX, obtuse marginal, proximal right coronary artery (RCA), mid RCA, distal RCA, posterior descending artery (PDA)
1.0
100 16 2nd diagonal, posterolateral ventricular branch (PLV)
0.5
Note: Gensini score = a × b Previous prospective cohort studies revealed elevated CRP and fibrinogen associated positively with ischemic heart disease (Danesh et al. 1997). According to Tracy et al. (1997) Smoking is associated with dose-dependent and time-dependent increase in C-RP concentration in both men and women. However, there was no significant difference in C-RP and fibrinogen, irrespective of the number of cigarettes (> 5 per day or < 5 per day) smoked or the duration (> 10 years or < 10 years) in the present study. Also CRP and fibrinogen of smokers who have stopped smoking (>10 yrs) and who currently smoke were also not significantly different. This also emphasizes that duration and quantity had not affected C-RP and fibrinogen in this study group.
Proceedings of the Young Scientist Forum Symposium
23
Although the association of cigarette smoking and development of cardiovascular diseases have been reported, the dose dependent correlation between risk of cardio vascular events and number of cigarettes smoked or the pack-years exposure were not confirmed (Price et al. 1999). We also noted that the individuals who had stopped smoking before 10 years also had comparatively lower values for the Gensini score than those who had stopped smoking < 10 years ago. Table 2. Result of the CRP, fibrinogen and Gensini score of individuals
Smoking status
Frequency (%)
CRP concentration (mg L-1, median-Inter quartile range)
Fibrinogen concentration (mgdL-1, median-Inter quartile range)
Gensini score (mean ± SD)
Smokers 67 5.2 (8.0)
P=0.02
302 (53)
P=0.02
48 (23) P=0.9
Non smokers
33 2.8 (3.2)
273 (65)
52 (27)
From the individuals of smoking (n = 41), according to number of cigarette smoke per day >5 per day
60 5.2 (8.0)
P=0.9 302 (60)
P=0.5
54 (24) P=0.1
<5 per day
40 4.9 (9.6)
290 (84)
41 (22)
From the individuals of smoking (n = 41), according to number of years smoke
>10 years 79 5.2 (7.7)
P=0.9 309 (46)
P=0.1
50 (23) P=0.5
<10 years 21 5.4 (9.4)
290 (72)
41 (26)
Individuals of smoked previously (n = 34), according to number of years cessation of smoking >10 years 40 4.5
(6.7) P=0.05
296 (131)
P=0.9
35 (44) P=0.07
<10 years 60 5.6 (20.4)
300 (30)
55 (42)
Note: *The normal range for CRP and fibrinogen is < 6mg L-1 and 150 – 400 mg dL-1, respectively. Conclusions and Recommendations Smokers had significantly increased CRP and fibrinogen concentrations compared to non-smokers. There was no significant difference in CRP and fibrinogen, irrespective of the number of cigarettes (> 5 per day or < 5 per day)
Proceedings of the Young Scientist Forum Symposium
24
smoked or the duration (> 10 years or < 10 years).Even though not significant those who had smoked for more than 10 years had higher Gensini score compared to those who smoked for <10 year. This indicate that the severity of the CAD is less in the individuals who stopped smoking before 10 years compared to individuals stopped smoking < 10 years ago. Even though this is not significant it indicates the severity of CAD is reduced if the period of smoking is less. Acknowledgment The financial support by NSF/RG/2011/HS/18 grant of National Science Foundation. All the individuals participated for the study and support provided by staff, Cardio-thoracic unit of Sri Jayewardenepura General Hospital. References Bazzano LA, He J, Muntner P, Vupputuri S, Whelton PK (2003) Relationship between
cigarette smoking and novel risk factors for cardiovascular disease in the United States. Annals of Internal Medicine 138: 891–897.
Danesh J, Collins R, Appleby P, Peto R (1998) Association of fibrinogen, C-reactive protein, albumin, or leukocyte count with coronary heart disease: meta-analyses of prospective studies. JAMA 279: 1477-82.
Gensini GGMD (1975) The coronary artery disease scoring and retrrieval system. In: Gensini GGMD, ed. Coronary Arteriography. Mount Kisco, New York: Futura Publishing Co., 271-274.
Price JF, Mowbray PI, Lee AJ, Rumley A, Lowe GD, Fowkes FG (1999) Relationship between smoking and cardiovascular risk factors in the development of peripheral arterial disease and coronary artery disease: Edinburgh Artery study. European Heart Journal 20: 344–53.
Tracy RP, Psaty BM, Macy E, Bovill EG, Cushman M, Cornell ES, Kuller LH (1997) Lifetime smoking exposure affects the association of C-Reactive Protein with vardiovascular disease risk factors and subclinical disease in healthy elderly subjects. Arteriosclerosis, Thrombosis, and Vascular Biology 17: 2167–2176.

Proceedings of the Young Scientist Forum Symposium
25
POTENTIAL ANTI-TUMOR COMPOUNDS FROM Asparagus officinalis L.
P.K.G.S.S. Bandara1*, K. Takahashi2 and K. Nabeta2
1 Department of Genetics and Plant Breeding,
Rubber Research Institute of Sri Lanka 2
Division of Applied Bioscience, Research Faculty of Agriculture, Hokkaido University, Kita-9, Nishi-9, Kita-ku, Sapporo 060-8589, Japan
Introduction Of the genus Asparagus, Asparagus officinalis is the most commercially important species and it has been used for a long time as an anti-cancer herbal medicine. Pharmacological studies on this plant have shown that a variety of biological activities such as, antitumor, anti-inflammatory, antifungal, antiviral and antioxidant. Among commonly consumed vegetables, antioxidant activity of asparagus, based on dry weight, has been ranked as the highest. Cancer is one of the most detrimental diseases and currently massive research works have been conducted all over the world to discover new anti-cancer agents from natural product sources. The potential of using natural products as anti-cancer agents was recognized in the 1950s by the U.S. National Cancer Institute (NCI) and has since made major contributions to the discovery of new naturally occurring anti-cancer agents. According to the international agency for research on cancer (IARC), which is a part of the world health organization (WHO), by the year 2030, there will be 20 to 25 million incident cases of cancer and 13 to 16 million cancer deaths annually. Currently, over 50 % of anti-cancer drugs have been isolated from natural sources. It is of paramount importance to explore novel naturally occurring anti-cancer agents from plant kingdom and therefore, this study was started with the objective of identifying potential anti-tumor active compounds from A. officinalis. Materials and Methods Cladophylls of A. officinalis were used for the extraction of antitumor active compounds. In the extraction process, air dried and powdered 600 g of cladophyll of A. officinalis was extracted with 500 mL of 70 % aqueous ethanol and evaporated to dryness. The resultant aqueous residue was thrice extracted with an equal volume of ethyl acetate. The organic layer and the aqueous layers were collected separately and the organic layer was dehydrated with Na2SO4 and concentrated under reduced pressure to afford fraction A (3.6 g). The aqueous layer was extracted with n-butanol to afford fraction B.

Proceedings of the Young Scientist Forum Symposium
26
The fraction A was subjected to a silica gel column chromatography (SGC) with CHCl3-CH3OH in increasing order of polarity to obtain 10 fractions (A1 to A10). The fraction A3 with comparatively higher anti-tumor activity was re-chromatographed over silica gel with n-hexane-EtOAc (80:20) to afford 9 fractions (A3.1 to A3.9). From fraction A3.3, compound 1 (18.2 mg) was purified by PTLC with n-hexane-EtOAc (70:30). Compound 2 (14.4 mg) was purified by PTLC with n-hexane-EtOAc (50:50) from fraction A3.6. The fraction A3.5 was further subjected to reversed phase HPLC (C18 silica column with 250 mm x 20 mm i.d.) with 90 % aqueous acetonitrile as the isocratic mobile phase at a flow rate of 5 mL min-1 to afford compound 3 (10.2 mg). The fraction B was thrice extracted with an equal volume of n-butanol and concentrated under reduced pressure to afford brown residue (4 g). It was then subjected to SGC with CH3OH-CHCl3 in increasing order of polarity to obtain 3 fractions (B1 to B3). The active fractions B1 and B2 were further separated by the reverse phase HPLC (C18 silica column with 250 mm x 20 mm i.d.) using 40 % and 70 % aqueous CH3OH, respectively as the isocratic mobile phase at a flow rate of 5 mL min-1 to afford compounds 4 (7.4 mg) and 5 (40 mg), respectively. The structures of extracted compounds were elucidated based on one and two dimensional NMR and MS spectroscopy. Additionally, NMR data were compared with those reported in literature. The 1H-NMR and 13C-NMR spectra (500 MHz for 1H-NMR and 125 MHz for 13C-NMR) were generated using CD3OD or CDCl3 as solvents. Anti-tumor activity of each isolated compound was screened against HL-60 cells using MTT bioassay and IC50 values of isolated compounds were calculated as described previously. The statistical significance of antitumor activity of all the compounds was analyzed by t-test at p < 0.05. Results and Discussion Based on the results of the present study, compound 1 (phytol), 2 (phytene-1,2-diol) and 3 (betulin) were found to have a significantly higher anti-tumor activity compared to that of compound 5 (methyl (25S) protodioscin) (Fig. 1), which is a well-known anti-tumor active compound (Table 1). The inhibitory activity of phytol isolated from Perilla leaves on HT-29 human colon cancer cells, MG-63 osteosarcoma cells and AZ-521 gastric cancer cells have been described and as an anti-tumor component in Scutellaria barbata has been found to be phytol. However, it seems that studies on anti-tumor activity of phytol have not yet been carried out up to a satisfactory level. The compound 2 has slightly lower IC50 value compared to that of compound 1 (Table 1). This activity difference is likely to be due to the additional OH group present in the compound 2. This speculation was further supported by the results obtained by Hibasami et al. (2002) which explain that a higher apoptotic activity has been observed in diol and triol type of phytol against lymphoid leukemia Molt 4B cells indicating the number of OH groups might be an important criterion in

Proceedings of the Young Scientist Forum Symposium
27
determining anti-tumor activity. During the extraction process of the present study, phytol has been obtained as the major component in quantity wise leading to determine that A. officinalis is a rich source for phytol. Other than phytol, A. officinalis might be considered as a rich source for methyl protodioscin since the amount of methyl protodioscin also seemed to be significantly high. The compound 3 (betulin) (Fig. 1) has also shown comparatively higher activity against HL-60 cells. Betulenic acid, a derivative of betulin, is a well-known compound which has various biological activities including anti-tumor activity as well. Figure 1. Structures of purified compounds. The only difference between betulin and betulenic acid is the presence of carboxylic acid group at C-28 of betulinic acid. A. officinalis is well known as a rich source of flavonoids mainly rutin which is a strong antioxidant. Compound 4 (rutin) (Fig. 1), isolated from A. officinalis has not shown significant anti-tumor activity against HL-60 cells suggesting that it might not be a potent anti-tumor active compounds. However, it is a well-known flavonoid with high antioxidant activity. Among spirostanol type and furostanol type steroidal saponins isolated from A. acutifolius, only spirostanol type steroidal saponins have shown strong antifungal activity against pathogenic yeast. In the present study, the compounds 5 was identified to be furostanol type steroidal
O
O
O
O
O
O
OCH3
CH3
CH3
O
O
O
CH3 OH
OH
OH
OH
CH3
CH3
OH
OH
OH
OH
OH
OH
OH
OH
CH3
H
H
H
Methyl (25S) prtodioscin (5)
CH2
CH3
OH
CH3 CH3
CH3 OH
CH3
CH3
Betulin (3)
OOH
OH
OH
O
OH
O
OOO CH3
OH
OH
OHOH
OH
OH
Rutin (4)
CH3
OH
CH3CH3CH3
CH3 Phytol (1)
CH3
OH
CH2CH3CH3
CH3
OH Phytene-1,2-diol (2)

Proceedings of the Young Scientist Forum Symposium
28
saponins (methyl (25S) protodioscin) and found to have no significant antitumor activity against HL-60 cells (IC50 values >100 µg mL-1) (Table 1). Table 1. IC50 values of isolated compounds against HL-60 cells
Compound IC50 value (µg mL-1) 1 15.7
2 12.3 3 15.1 4 >100.0 5 >100.0
Conclusions and Recommendations The compound 1 (phytol), 2 (phytene-1,2-diol) and 3 (betulin) are the potential anti-tumor active compounds available in A. officinalis. Further investigation should be performed to elucidate the specificity of anti-tumor activity of each compound against different cancer cell lines. Finally, Asparagus species available in Sri Lanka should be thoroughly investigated to identify potential novel anti-tumor active agents. References Cragg GM, Newman DJ (2005) Plants as a source of anti-cancer agents. Journal of
Ethnopharmacology 100: 72-79. Fulda S (2008) Betulinic acid for cancer treatment and prevention. International
Journal of Molecular Science 9: 1096-1107. Hibasami H, Kyohkon M, Ohwaki S, Katsuzaki H, Imai K, Ohnishi K, Ina K, Komiya T
(2002) Diol- and triol- types of phytol induce apoptosis in lymphoid leukemia Molt 4B cells. International Journal of Molecular Medicine 10: 555-559.
Huang XF, Kong L (2006) Steroidal saponins from roots of Asparagus officinalis. Steroids 71: 171-176.
Jang DS, Cuendet M, Fong HHS, Pezzuto JM, Kinghorn AD (2004) Constituents of Asparagus officinalis evaluated for inhibitory activity against Cyclooxgenase-2. Journal of Agricultural and Food Chemistry 52: 2218-2222.

Proceedings of the Young Scientist Forum Symposium
29
WOUND HEALING ACTIVE CONSTITUENT FROM Ficus racemosa Linn. BARK
N. S. Bopage1, K. H. Jayawardena2, S. C. Wijeyaratne3, A. M. Abeysekera4
and G. M.K.B. Gunaherath1* 1Department of Chemistry, the Open University of Sri Lanka, Nawala, Nugegoda 2Department of Zoology, the Open University of Sri Lanka, Nawala, Nugegoda
3Department of Botany, University of Sri Jayewardenepura, Nugegoda
4Department of Chemistry, University of Sri Jayewardenepura, Nugegoda
Introduction Ficus racemosa Linn. (Ficus glomerata Roxb.) is a large, deciduous tree which belongs to family Moraceae and exhibits wound healing activity. Wound is an injury that results in opening or breaking of the skin. The classical model of wound healing is divided into three sequential, yet overlapping phases: (1) inflammatory, (2) proliferate and (3) remodeling. Immediately after an injury, a fibrin clot is formed to limit the active bleeding (homeostasis). In the inflammatory phase, bacteria and debris are removed by phagocytic action. Proliferate phase is characterized by angiogenesis, collagen deposition, granulation tissue formation, epithelialization, and wound contraction. In the remodeling phase, collagen is remodeled and realigned along tension lines and cells. From ancient times plant preparations have been used to enhance wound healing though few of them have been either evaluated scientifically for their efficacy or studied for their mechanism of action. The present study was undertaken with the view of identifying potential wound healing constituent(s) of hexanes extract of stem bark of F. racemosa through bioactivity directed fractionation using wound healing assay (WHA). Materials and Methods Extraction and Fractionation of the Plant material: Dried powdered stem bark of F. racemosa Linn. (500 g) was sequentially extracted with hot hexanes, dichloromethane (CH2Cl2), ethyl acetate (EtOAc) and methanol (MeOH) and the solvents were removed under vacuum at 40 ⁰C to obtain the respective extracts and were assayed for the wound healing potential. Among these four extracts, the hexanes extract was found to be the most active on wound healing assay (Table 1). The hexanes extract was fractionated using column chromatography on silica gel to give 11 major fractions. These fractions were subjected to wound healing assay and those showed significant wound healing activity (>75 %) were further fractionated/ investigated. Establishment of cell cultures: Baby Hamster Kidney (BHK) cell cultures were established in the laboratory using standard in-vitro methods. At the
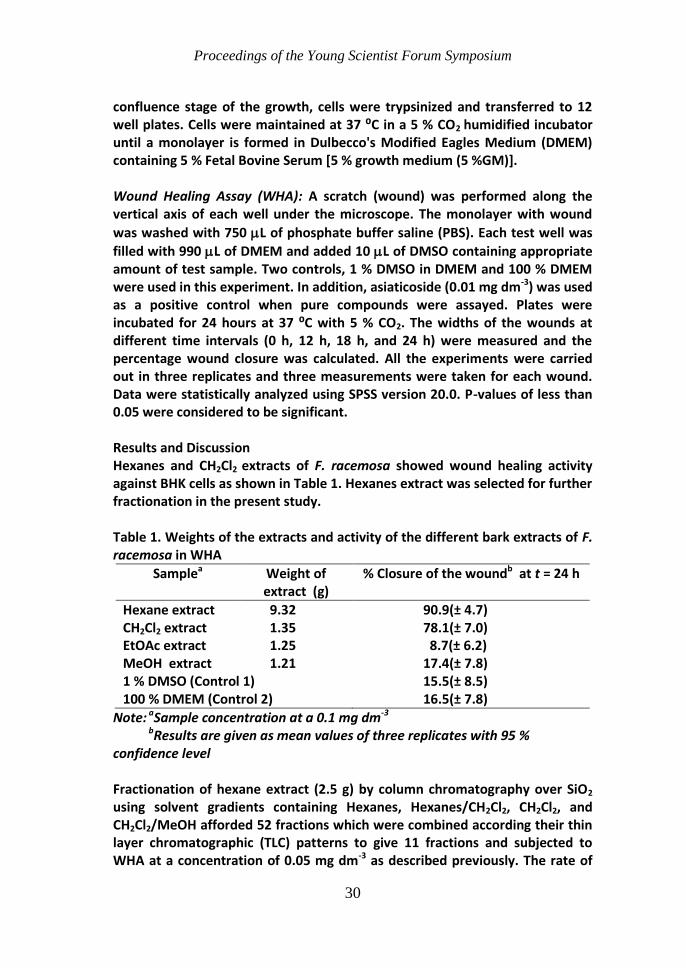
Proceedings of the Young Scientist Forum Symposium
30
confluence stage of the growth, cells were trypsinized and transferred to 12 well plates. Cells were maintained at 37 ⁰C in a 5 % CO2 humidified incubator until a monolayer is formed in Dulbecco's Modified Eagles Medium (DMEM) containing 5 % Fetal Bovine Serum [5 % growth medium (5 %GM)]. Wound Healing Assay (WHA): A scratch (wound) was performed along the vertical axis of each well under the microscope. The monolayer with wound
was washed with 750 L of phosphate buffer saline (PBS). Each test well was
filled with 990 L of DMEM and added 10 L of DMSO containing appropriate amount of test sample. Two controls, 1 % DMSO in DMEM and 100 % DMEM were used in this experiment. In addition, asiaticoside (0.01 mg dm-3) was used as a positive control when pure compounds were assayed. Plates were incubated for 24 hours at 37 ⁰C with 5 % CO2. The widths of the wounds at different time intervals (0 h, 12 h, 18 h, and 24 h) were measured and the percentage wound closure was calculated. All the experiments were carried out in three replicates and three measurements were taken for each wound. Data were statistically analyzed using SPSS version 20.0. P-values of less than 0.05 were considered to be significant. Results and Discussion Hexanes and CH2Cl2 extracts of F. racemosa showed wound healing activity against BHK cells as shown in Table 1. Hexanes extract was selected for further fractionation in the present study. Table 1. Weights of the extracts and activity of the different bark extracts of F. racemosa in WHA
Samplea Weight of extract (g)
% Closure of the woundb at t = 24 h
Hexane extract 9.32 90.9(± 4.7) CH2Cl2 extract 1.35 78.1(± 7.0) EtOAc extract 1.25 8.7(± 6.2) MeOH extract 1.21 17.4(± 7.8) 1 % DMSO (Control 1) 15.5(± 8.5) 100 % DMEM (Control 2) 16.5(± 7.8)
Note: aSample concentration at a 0.1 mg dm-3
bResults are given as mean values of three replicates with 95 % confidence level Fractionation of hexane extract (2.5 g) by column chromatography over SiO2
using solvent gradients containing Hexanes, Hexanes/CH2Cl2, CH2Cl2, and CH2Cl2/MeOH afforded 52 fractions which were combined according their thin layer chromatographic (TLC) patterns to give 11 fractions and subjected to WHA at a concentration of 0.05 mg dm-3 as described previously. The rate of

Proceedings of the Young Scientist Forum Symposium
31
healing was calculated at 24 h from initial stage. Among these, fraction 4 showed highest activity (93.3 % wound closure at 24 h) while fractions 2, 3, 5 and 6 also showed high (>75 %) wound healing activity, which compelled further fractionation of these column fractions (Table 2). Table 2. Weights of the column fractions and activity of the column fractions
of the hexane extract of stem bark of F. racemosa in WHA
Sample a Weight of fraction (mg) % Closure of the woundb at t = 24 h
01 233.8 45.9 (± 5.6) 02 1314.8 90.0 (± 3.4) 03 19.7 87.6 (± 4.0) 04 5.1 93.1 (± 3.1) 05 20.5 84.1 (± 1.5) 06 8.8 76.7 (± 2.6) 07 103.6 12.7 (± 3.1) 08 157.7 17.0 (± 5.4) 09 94.5 10.0 (± 2.4) 10 289.3 13.0 (± 4.0) 11 31.5 21.5 (± 4.2) 1 % DMSO (Control 1) 7.9 (± 4.3) 100 % DMEM (Control 2) 9.4 (± 3.2)
Note: a Sample concentration at a 0.05 mg dm-3
b Results are given as mean values of three replicates with 95% confidence level Fraction 4 was found to contain one major compound which was isolated by preparative TLC and identified as lupeol m.p. 213 – 215 ⁰C (lit. 215 ⁰C) by comparison with an authentic sample (TLC, Co-TLC and mixed m.p.). Fraction 2 was found as oily fraction and contained five major compounds. One of the major compounds was identified as lupeol on TLC. This fraction (500 mg) was chromatographed over a column of silica gel solvent gradients containing hexanes, hexanes/CH2Cl2, CH2Cl2, and CH2Cl2/MeOH afforded yielding 59 fractions. The column fractions were pooled according their TLC patterns to give 13 major sub fractions F1–F13. The sub fraction F2 (25 mg) was contained three constituents. About 10 mg of this fraction further purification by repeated preparative TLC , α-amyrin acetate was isolated (2 mg), identity was confirmed by TLC, Co-TLC, m.p. (m.p. 224 – 225 ⁰C) (Lit. 227 ⁰C) and mixed m.p. with an authentic sample. The sub fraction F6 (32 mg) on further purification yielded white crystalline compound (29 mg), which was identified as lupeol acetate by TLC, Co-TLC. Its identity was confirmed by m. p. (m. p. 216 – 217 ⁰C) (lit. 218 ⁰C) and mixed m. p. with an authentic sample. These isolated compounds were subjected to WHA at a concentration of 0.01 mg dm-3 and
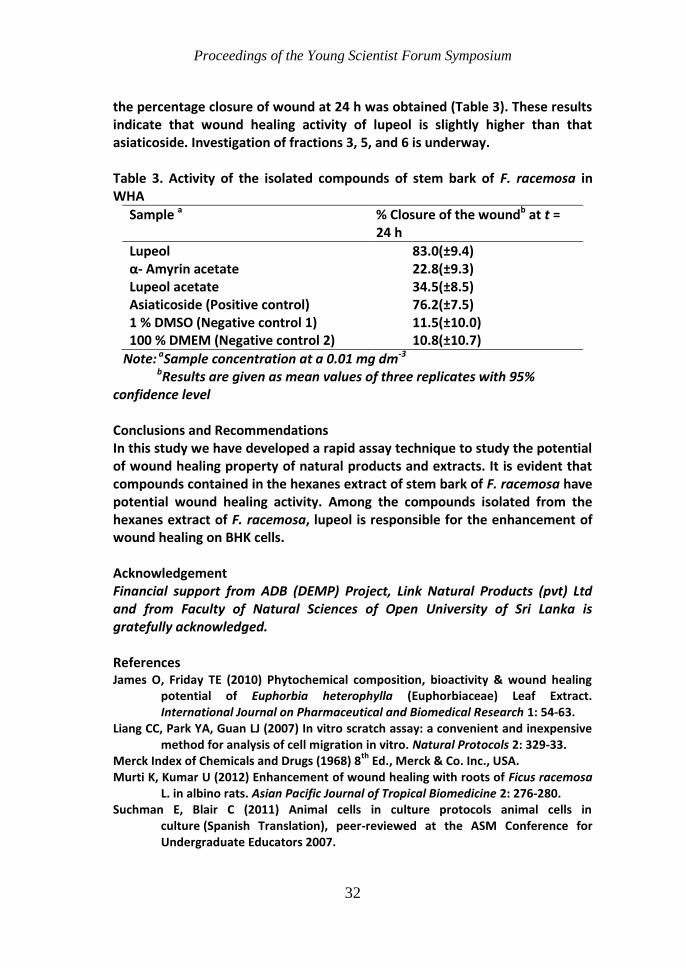
Proceedings of the Young Scientist Forum Symposium
32
the percentage closure of wound at 24 h was obtained (Table 3). These results indicate that wound healing activity of lupeol is slightly higher than that asiaticoside. Investigation of fractions 3, 5, and 6 is underway. Table 3. Activity of the isolated compounds of stem bark of F. racemosa in WHA
Sample a % Closure of the woundb at t = 24 h
Lupeol 83.0(±9.4) α- Amyrin acetate 22.8(±9.3) Lupeol acetate 34.5(±8.5) Asiaticoside (Positive control) 76.2(±7.5) 1 % DMSO (Negative control 1) 11.5(±10.0) 100 % DMEM (Negative control 2) 10.8(±10.7)
Note: aSample concentration at a 0.01 mg dm-3
bResults are given as mean values of three replicates with 95% confidence level Conclusions and Recommendations In this study we have developed a rapid assay technique to study the potential of wound healing property of natural products and extracts. It is evident that compounds contained in the hexanes extract of stem bark of F. racemosa have potential wound healing activity. Among the compounds isolated from the hexanes extract of F. racemosa, lupeol is responsible for the enhancement of wound healing on BHK cells. Acknowledgement Financial support from ADB (DEMP) Project, Link Natural Products (pvt) Ltd and from Faculty of Natural Sciences of Open University of Sri Lanka is gratefully acknowledged. References James O, Friday TE (2010) Phytochemical composition, bioactivity & wound healing
potential of Euphorbia heterophylla (Euphorbiaceae) Leaf Extract. International Journal on Pharmaceutical and Biomedical Research 1: 54-63.
Liang CC, Park YA, Guan LJ (2007) In vitro scratch assay: a convenient and inexpensive method for analysis of cell migration in vitro. Natural Protocols 2: 329-33.
Merck Index of Chemicals and Drugs (1968) 8th
Ed., Merck & Co. Inc., USA. Murti K, Kumar U (2012) Enhancement of wound healing with roots of Ficus racemosa
L. in albino rats. Asian Pacific Journal of Tropical Biomedicine 2: 276-280. Suchman E, Blair C (2011) Animal cells in culture protocols animal cells in
culture (Spanish Translation), peer-reviewed at the ASM Conference for Undergraduate Educators 2007.

Proceedings of the Young Scientist Forum Symposium
33
IDENTIFICATION OF RESISTANT ACCESSIONS OF Capsicum spp. FOR BREEDING MEALY BUG RESISTANT CHILI: A GREEN HOUSE TRIAL
M. D. M. Chamikara1, M. Ishan1, S. S. Karunadasa1, V. D. W. Kasthuriarachchi1,
R. V. Lelwala1, M. K. D. I. Perera1, P. I. Rajapaksha1 and S. D. S. S. Sooriyapathirana1*
1Department of Molecular Biology and Biotechnology, Faculty of Science,
University of Peradeniya, Sri Lanka
Introduction Chili (Capsicum spp.), a vegetable crop grown in Sri Lanka, is an important flavouring constituent in meals. Approximately 750 million Rupees of GDP is contributed by chili annually. Mealy bug belongs to family Pseudococcidae is an insect pest in various crops such as chili, papaya, guava, banana and citrus which is a huge threat to Sri Lankan cultivations. Mealy bug infestations can be typically observed as cotton-like masses on the above part of the plants especially on fruits and flowers. Adult mealy bugs suck plant sap and inject toxic substances that lead to crooked fruits, chlorosis, plant stunting and early leaf and fruit drop. Infestation of this pest, leads to excessive application of pesticides by the farmers. Consequently these chemical pesticides cause health risks and environmental pollution. Breeding of resistant chili varieties seems the most promising solution to reduce excessive usage of chemicals for a developing country like Sri Lanka. Therefore the current study was conducted to assess the variation of a set of Capsicum spp. germ plasm of Sri Lanka towards the resistance to mealy bug infestation. Materials and Methods Seeds of 44 wild chili selections (accessions) were collected from a farm at Viskamgama in Rathnapura District, Sri Lanka (6° 32′ 31.7′′ N 80° 22′ 16.6′′ E) and grown in a greenhouse at University of Peradeniya (Yala season, 2014) with four replicates each. Five commercial chili varieties, MI-hot, MI-2, Varaniya miris, CA-8 and Bell pepper, were also grown along with wild accessions in four replicates. After three months of establishment, severe natural mealy bug infestation was observed at a varying degree on the greenhouse grown chili accessions and commercial varieties. Thus we took the advantage of characterizing these accessions for mealy bug resistance before applying control measures for the continuity of the project for other objectives of the study. A categorical scale (Category 1=No infestation, Category 2=Slight infestation, Category 3= Moderate infestation, Category 4= Severe infestation) (Fig. 1) was used to rank the individual plants for the degree of infestation by

Proceedings of the Young Scientist Forum Symposium
34
mealy bugs. The data were analyzed using ANOVA procedure in statistical package SAS 9.3. Results and Discussion There was a significant effect of the chili accession on the degree of infestation of mealy bugs (P<0.0001) and R2= 98.91 %. Out of 49 accessions, seven (16 %) displayed no infestation (Class 1), 31 (63 %) displayed slight infestation (Class 2). Four (8%) were with moderate infestation (Class 3) and 6 (12 %) were with severe infestation (Class 4). All accessions that showed least infestation (Class 1 and 2) were wild collected ones. Out of five commercial varieties (MI-hot, MI-2, CA-8, Bell Pepper, Varaniya miris), MI-hot and MI-2, which are popular Sri Lankan chili varieties were in Category 4 undergone severe infestation (Fig. 2). Moreover bell pepper was in Category 3 and CA-8, a popular Sri Lankan pepper (curry chili) and Varaniya miris were in Category 2. This demonstrated a critical situation of the chili cultivation as most of the popular varieties are vulnerable to the mealy bug attack. Seven wild collected accessions showed complete resistance to the mealy bug attack and others showed partial resistance. These resistant accessions could be used as parents in future to develop mealy bug resistant chili varieties in breeding. Figure 1. Severity classes of the Pseudococcidae sp (mealy bug) attack on the chili plant. a: Not infested under heavy presence in the surrounding (Severity Class 1); b: Slight infestation (Severity Class 2); c: Moderate infestation (Severity Class 3); d: Severe Infestation (Severity Class 4)(Scale bar= 1 cm).
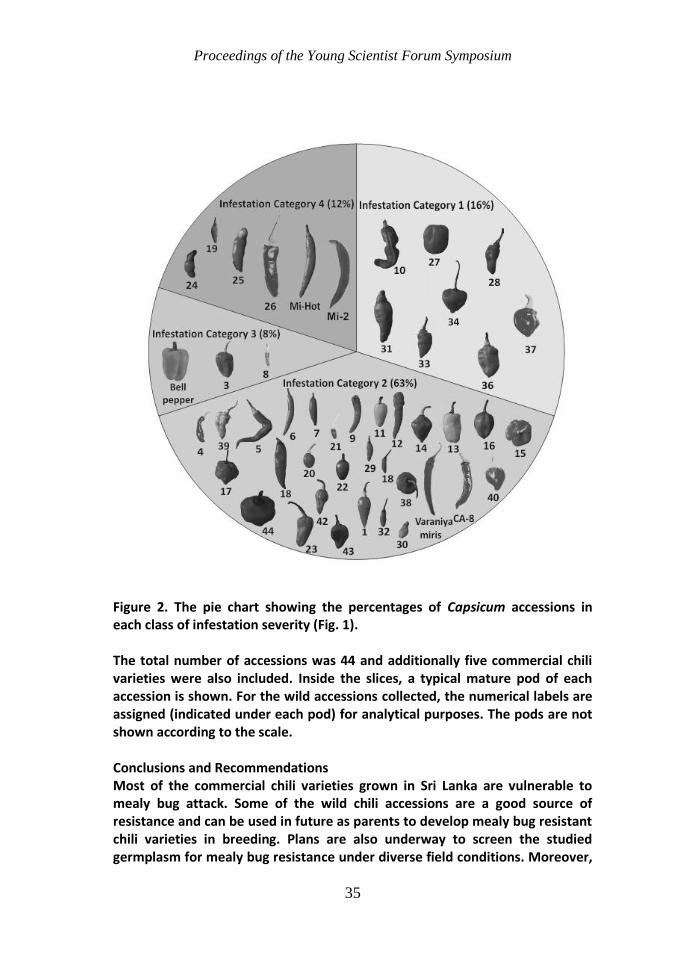
Proceedings of the Young Scientist Forum Symposium
35
Figure 2. The pie chart showing the percentages of Capsicum accessions in each class of infestation severity (Fig. 1). The total number of accessions was 44 and additionally five commercial chili varieties were also included. Inside the slices, a typical mature pod of each accession is shown. For the wild accessions collected, the numerical labels are assigned (indicated under each pod) for analytical purposes. The pods are not shown according to the scale. Conclusions and Recommendations Most of the commercial chili varieties grown in Sri Lanka are vulnerable to mealy bug attack. Some of the wild chili accessions are a good source of resistance and can be used in future as parents to develop mealy bug resistant chili varieties in breeding. Plans are also underway to screen the studied germplasm for mealy bug resistance under diverse field conditions. Moreover,

Proceedings of the Young Scientist Forum Symposium
36
the segregating populations can be produced by crossing mealy bug resistant and sensitive accessions, to dissect the underlying genetics of the tolerance. Detailed Quantitative Trait Loci (QTL) mapping procedure can be carried out to tag the candidate genes and linked molecular markers to the resistance. These molecular markers can be used to expedite the chili breeding in Sri Lanka. Further to the discovering of the genetic basis of mealy bug resistance, the same set of germplasm is also currently being used by our group to characterize the genes related to pungency, fruit size and shape as they are the most important quality traits in chili. References Piragalathan A, Pakeerathan K, Thirukkumaran G, Mikunthan G (2014) Efficacy of
different insecticide and bio-rationals against papaya melaybug, paracoccus marginatus (Hemiptera: Pseudococidae) infestation in home gardens. Middle-East Journal of Science Research 21: 1689-1693.
Sirisena UGAI, Watson GW, Hemachandra KS, Wijayagunasekara HNP (2013) Mealybug (Hemiptera: Pseudococidae) species on economically important fruit crops in Sri Lanka. Tropical Agriculture Research 25: 69-82.
Proceedings of the Young Scientist Forum Symposium
37
EXTRACTS OF Alpinia calcarata (LESSER GALANGAL) INHIBITS PRODUCTION OF INFLAMMATORY MEDIATOR-NITRIC OXIDE IN RAW
264.7 MURINE MACROPHAGES
M. Chandhrakanthan1, S. Kathirgamanathar1*, S. M. Handunnetti2 and G. A. S. Premakumara1
1Industrial Technology Institute, Colombo, Sri Lanka
2Institute of Biochemistry, Molecular Biology and Biotechnology,
University of Colombo, Sri Lanka
Introduction Inflammatory diseases such as rheumatoid arthritis (RA) are associated with increased production of nitric oxide (NO), due to its activation of the inducible nitric oxide synthase pathway (Farrell et al. 1993). NO plays a critical role in the pathogenesis of joint inflammation and tissue damage, since the severity of RA can be reduced by the administration of NOS inhibitors in mouse model. Many cell types especially macrophages can be induced to produce NO by bacterial cell wall lipopolysaccharides (LPS). Therefore, inhibition of NO production in LPS stimulated RAW 264.7 cells is one of the possible ways to screen for anti-inflammatory drugs. Alpinia calcarata Roscoe (Family: Zingiberaceae) commonly known as lesser galangal in English, heen araththa in Sinhala, nattaratta in Tamil is widely used in Sri Lankan traditional medicine as a remedy for bronchitis, cough, respiratory ailments, diabetics, asthma and arthritis. Maharasnadhi Quathar (MRQ) is a polyherbal formulation used to treat RA which contains mainly 80 % of A. calcarata and 25 other plant materials. Studies on MRQ has proven that it can significantly and dose-dependently inhibit carrageenan-induced rat paw oedema and in RA patients, after 3 months of MRQ treatment, there was a marked improvement in the pain and inflammation as well as in the mobility of the affected joints (Thabrew et al. 2008). Previous studies on anti-inflammatory activity of hot water and ethanolic extracts of A. calcarata have shown significant inhibition of inflammation in carrageenan-induced rat paw oedema (Arawwawala et al. 2011). Based on the highly acclaimed properties of A. calcarata, the present study investigated the in vitro NO inhibition of LPS induced RAW 264.7 murine macrophages. Materials and Methods Reagents and chemicals: Mouse macrophage cell line RAW 264.7 was obtained from American Type Culture Collection (ATCC) and grown in RPMI medium supplemented with 10 % fetal bovine serum (FBS), 100 units mL-1 penicillin and streptomycin. All the cell culture reagents and lipopolysaccharide (LPS),

Proceedings of the Young Scientist Forum Symposium
38
Sulphanilamide, N-(naphthyl) ethylenediamine dihydrochloride, sodium nitrite, N-monomethyl-L-arginine acetate salt (NMMA) and 3-(4,5-dimethyl-2-thiazolyl)-2,5-diphenyl tetrazolium bromide (MTT) were purchased from Sigma Aldrich, USA. Plant material and extraction: The shade dried and powdered separate plant parts (rhizome, leaf, stem and root) of A. calcarata were extracted with petroleum ether in hot and cold conditions to analyze the best way of extraction depends on the activity of extract. Hot extraction was performed in Soxhlet apparatus whereas the cold extraction was performed by maceration under cold conditions. Extracts were further filtered and solvents were evaporated in rotary vacuum evaporator under reduced pressure. Dried and powdered rhizome and leaves (500 g) were hydro distilled in Clevenger apparatus for 8 h to distill the essential oils. MTT assay for cell viability: Mouse macrophage cell line RAW 264.7 were cultured in 96 well flat bottom plate at concentration of 1x10⁵ cells/well at 37 °C and 5 % CO2 . After 14 h of pre-conditioning, cells were treated with various concentrations of extracts and oil (7.8-500 µg mL-1) and (0.1-50 µg mL-1) respectively for 30 min. Thereafter, culture media was removed and MTT dye
(5 mg mL-1) was added to the cultures and further incubated for 3.5 h at 37 C. The formazan crystals made due to dye reduction by viable cells were dissolved in acidified isopropanol (1N HCl). Index of cell viability was calculated by measuring the optical density of colour produced by MTT dye reduction at 570 nm (Scudiero et al. 1988). Nitric oxide inhibition assay: The RAW cells were cultured in RPMI 1640 at cell concentration of 1x10⁵ cells/well for 6 h in 96 well plates. Cells were then treated with LPS (1 µg mL-1) with 7.8-250 µg mL-1 and 0.1-2.5 µg mL-1 of extracts and oil respectively for 30 min. Cells were washed with culture medium, resuspended in LPS containing medium for 24 h at 37 °C and 5 % CO2. The culture supernatants were collected and they were used to assess nitrite concentration as a measure of NO production. Equal volume of Griess reagent was mixed with the cell supernatant (100 µL) and the absorbance was measured at 540 nm (Yadav et al. 2003). Cells were treated with 1 mM NMMA as a positive control. The concentration of nitrite was calculated from standard curve drawn with known concentration of sodium nitrite. The results were expressed as mean ± SEM. Results and Discussion Effect of extracts and oils on RAW 264.7 cell viability: MTT is a pale yellow substrate reduced by living cells to yield a dark blue formazan product. This process requires active mitochondria to produce the product. MTT assay was performed to find out the possible cytotoxicity of A. calcarata extracts and

Proceedings of the Young Scientist Forum Symposium
39
oils, when treated for 30 min. Cells showed comparable viability, >80 % in extracts treated with less than 500 µg mL-1 and 5 µg mL-1 for oil (Fig. 1a).
(a) (b)
Figure 1. (a) Viability of RAW 264.7 macrophages in the presence of extracts at 500 and 250 µg mL-1 and oils at 5 and 2.5 µg mL-1. (b) Percentage of NO production by RAW 264.7 after treatment with extracts, oils and NMMA (+ control) with LPS stimulation. Data are expressed as mean ± SEM of two independent experiments performed in duplicates. Hence the concentration of (250-7.8 µg mL-1) of extracts and (2.5-0.1 µg mL-1) of oil were determined as non toxic and suitable for NO inhibition assay. In the present study, hot and cold solvent extracts of rhizome and leaf and the oils exhibited toxicity at higher concentrations where as stem and root had no toxicity and they have increased the macrophage proliferation in some concentrations. Inhibition of LPS induced NO production by A. calcarata extracts and oils: Murine macrophage RAW 264.7 cells were stimulated in vitro with LPS to produce NO and the effect of A. calcarata extracts on NO inhibition was assessed. All A. calcarata extracts, inhibited NO production in a dose-dependent manner. The unstimulated cells secreted NO at the basal level of 3.39 ± 0.01 µM, while the untreated LPS-stimulated cells showed an increase in NO production (67.20 ± 3.31 µM). NMMA, a standard NOS inhibitor was used as the positive control and it inhibited NO (12.91 ± 0.01 µM; 88.1 % inhibition) at 1mM. Among the A. calcarata extracts tested, hot extracts and oils of rhizome and leaf significantly inhibited NO production at all concentrations tested and the IC50 for petroleum ether extracts of rhizome and leaf are 124.2 ± 0.1, 156.1 ± 0.7 µg mL-1 (Fig. 1b). The stem and root extracts also inhibited NO production at 250 µg mL-1 (35.0 ± 1.5 and 51.8 ± 3.5) which is

Proceedings of the Young Scientist Forum Symposium
40
comparatively less than rhizome and leaf (73.2 ± 2.2 and 67.0 ± 3.5). Many studies have demonstrated that the NO inhibitory effect in RAW264.7 cells is due to the down regulation of iNOS. Inducible nitric oxide synthase (iNOS) is a soluble enzyme that catalyses the production of NO and the generation of high concentrations of NO through the activation of iNOS by immune stimulating cytokines and the activation of inducible nuclear factors such as NF- B may predispose an individual to arthritic conditions. Thus, the inhibition of iNOS exerts a beneficial anti-inflammatory effect on inflammatory disorders. This study demonstrated that the hot solvent extract and oils of A. calcarata rhizome and leaf significantly inhibited NO production in LPS-stimulated murine macrophage cells and scavenged NO radicals effectively. Conclusions and Recommendations In conclusion, this study has shown promising NO inhibition by A. calcarata with less or no cytotoxicity. Among them hot solvents extracts and essential oils of rhizome and leaf showed highest inhibition patterns than the other plant parts. We can conclude that the active compounds in rhizome and leaf are associated with this activity and further isolation and identification of compounds is necessary to validate the findings and the present study also validate the traditional use of A. calcarata for the treatment of RA in Sri Lanka. Acknowledgement This work was supported by National Research Council (NRC 12-081). References Arawwawala LDAM, Arambewela LSR, Ratnasooriya WD (2011) Alpinia calcarata: A
potential anti-inflammatory agent. Journal of Ethnopharmacology 139: 889-892.
Farrel AJ, Blake DR, Palmer RM, Moncada S (1992) Increased concentrations of nitrite in synovial fluid and serum samples suggest increased nitric oxide synthesis in rheumatic diseases. Annals of the Rheumatic Diseases 51:1219-1222.
Scudiero DA, Shoemaker RH, Paull KD, Monks A, Tierney S, Nofziger TH, Currens MJ, Seniff D, Boyd MR (1988) Evaluation of a soluble tetrazolium/formazan assay for cell growth and drug sensitivity in culture using human and other tumor cell lines. Cancer Research 48: 4827-4833.
Thabrew MI, Dharmasiri MG, Senaratne L (2003) Anti-inflammatory and analgesic activity in the polyherbal formulation Maharasnadhi Quathar. Journal of Ethnopharmacology 85:261-267.
Yadav PN, Liu Z, Rafi MA (2003) A Diarylheptanoid from Alpinia officinarum inhibits proinflammatory mediators via inhibition of Mitogen-activated protein kinase, p44/42 and transcription factor nuclear factor-kB. The Journal of Pharmacology and Experimental Therapeutics 305:925-931.

Proceedings of the Young Scientist Forum Symposium
41
CURRENT STATUS OF POSTHARVEST HANDLING OF CUT FLOWERS AND CUT FOLIAGE AT PRODUCTION SITES IN THE UP COUNTRY OF SRI LANKA
G.D.R.K. Chandrasena1, R.H.M.K. Ratnayake1* and J.C. Edirisinghe2
1Department of Horticulture and Landscaping Gardening and
2Department of Agribusiness Management,
Faculty of Agriculture and Plantation Management, Wayamba University of Sri Lanka
Introduction The floriculture industry in Sri Lanka earns significant foreign exchange and generates employment, thereby, empowering rural communities. Although reliable statistics are rare on present status of the domestic market, a gradual increase in the local use of cut flowers and foliage is partly reflected by the recent expansion and distribution of retail flower shops in many urban and suburban areas of the Island. Retail outlets scattered throughout the production areas and in Western (WP), North Western (NWP) and Central (CP) Provinces are the popular centres where the cut flowers are sold for local consumption. A range of tropical and temperate cut flower and foliage species are supplied to retail sites through various channels. The reliable supply of high quality cut flowers is important in maintaining customer satisfaction. Insufficient quality management or improper actions at different stages of handling cause a quality loss of products. Postharvest quality and vase life of cut ornamentals could be maintained throughout the distribution process by adopting correct handling practices, including proper postharvest treatments. Postharvest handlings chains have been well characterised and standard treatments have been adopted elsewhere in the world. In Sri Lanka, it is essential to conduct a systematic study to clearly recognize the handling chains involved in cut flower supply channels for the domestic market. With a view to identify the shortcomings throughout the cut flower distribution chains, we have characterized the retail handling and major problems in retails sites revealed. This study was, therefore, conducted to identify the current handling practices in growers' and intermediaries' sites located in the up country of Sri Lanka. The outcome will help recognize the drawbacks in current handling systems. Materials and Methods Sampling and data collection: The study was conducted from January to June 2014. A sample of 34 cut flower growers and intermediaries in Uva and Central Provinces were selected for the survey. This sample also included the suppliers to retail sellers in WP and NWP. Information was gathered using a structured,

Proceedings of the Young Scientist Forum Symposium
42
pre-tested questionnaire with face-to-face interviews. The information collected included: main products, methods of cultivation, harvesting details, quality of supplies, pre-treatments given to harvested produce, packaging and modes of transport, storage conditions, sanitation, postharvest problems, and financial and marketing aspects. Data analysis: Data were descriptively analyzed using STATA (Stata Crop, United States) software package. Results and Discussion Species composition at production sites: Of the producers for the local market in the up country region, 98 % engaged in cut flower production instead of cut foliage. The species distribution among the respondents was: roses (77 %), gerbera (53 %), chrysanthemum (27 %), alstroemeria (24 %), white daisy (21 %), anthurium (6 %), orchid (3 %), zinnia (3 %), and others (< 3 %). The majority of growers (59 %) produced cut flowers and foliage in open field conditions while 41 % used protected houses such as poly-tunnels and net-houses. Harvesting and postharvest handling at production and distribution sites: Table 1 presents the handling operations at production sites along with identified drawbacks. Lack of use of pre-treatments after harvesting, such as pulses with flower food and preservative compounds, could have undesirable consequences along the marketing channel. Temperature is the single most important factor in the keeping quality of stored floriculture products. Respiration, sprouting, water loss, change of chemical composition and the development of storage diseases are all influenced by temperature. Maintenance of low temperatures during transportation is, therefore, crucial to obtain maximum end-user life in cut ornamentals. Cut flowers and foliage produced in up country were sent to retail destinations mainly in Colombo (77 %) and Gampaha (74 %; WP), Kandy (74 %) and Nuwara Eliya (65 %; CP), and in other districts (35 %). Although the effects are unseen at the producer level, the implications given in Table 1 could decrease the potential post-harvest life of cut flowers. The standard corrugated fiberboard boxes (CFB) were used by a limited proportion of respondents to pack relatively high valued species such as roses. About 10 – 25 flower stems were bundled together, covered with newspapers and arranged in the CFB by placing cypress leaves and newspapers in between. Dry transport in traditional bamboo cages causes serious transport damages to products arriving at the retail centres. Our previous research reported that in retail sites, cut flowers and foliage supplies were occasionally (by 56 %) or rarely (by 31 %) rejected mainly due to damages occurred during transport; 37 % for cut flowers and 40 % for cut foliage. Around 35 % of cut flower rejections and 39 % of cut foliage rejections were caused by wilting.
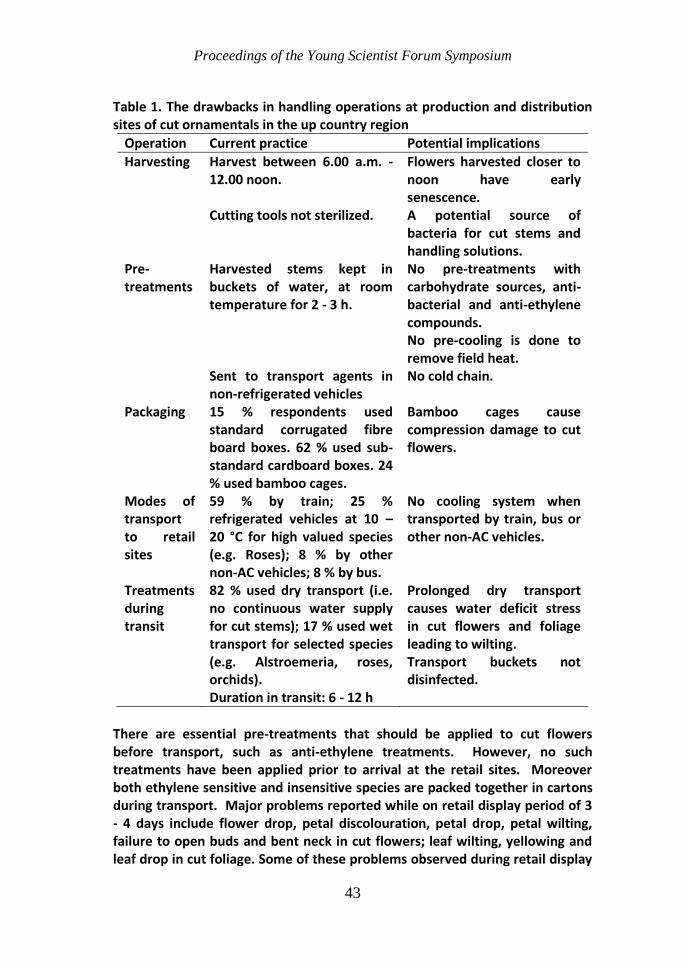
Proceedings of the Young Scientist Forum Symposium
43
Table 1. The drawbacks in handling operations at production and distribution sites of cut ornamentals in the up country region
Operation Current practice Potential implications
Harvesting Harvest between 6.00 a.m. - 12.00 noon.
Flowers harvested closer to noon have early senescence.
Cutting tools not sterilized. A potential source of bacteria for cut stems and handling solutions.
Pre-treatments
Harvested stems kept in buckets of water, at room temperature for 2 - 3 h.
No pre-treatments with carbohydrate sources, anti-bacterial and anti-ethylene compounds. No pre-cooling is done to remove field heat.
Sent to transport agents in non-refrigerated vehicles
No cold chain.
Packaging 15 % respondents used standard corrugated fibre board boxes. 62 % used sub-standard cardboard boxes. 24 % used bamboo cages.
Bamboo cages cause compression damage to cut flowers.
Modes of transport to retail sites
59 % by train; 25 % refrigerated vehicles at 10 – 20 °C for high valued species (e.g. Roses); 8 % by other non-AC vehicles; 8 % by bus.
No cooling system when transported by train, bus or other non-AC vehicles.
Treatments during transit
82 % used dry transport (i.e. no continuous water supply for cut stems); 17 % used wet transport for selected species (e.g. Alstroemeria, roses, orchids). Duration in transit: 6 - 12 h
Prolonged dry transport causes water deficit stress in cut flowers and foliage leading to wilting. Transport buckets not disinfected.
There are essential pre-treatments that should be applied to cut flowers before transport, such as anti-ethylene treatments. However, no such treatments have been applied prior to arrival at the retail sites. Moreover both ethylene sensitive and insensitive species are packed together in cartons during transport. Major problems reported while on retail display period of 3 - 4 days include flower drop, petal discolouration, petal drop, petal wilting, failure to open buds and bent neck in cut flowers; leaf wilting, yellowing and leaf drop in cut foliage. Some of these problems observed during retail display
Proceedings of the Young Scientist Forum Symposium
44
could also be a result of poor ethylene management. Thus, the handling practices adopted at production and distribution sites could have a direct relationship with postharvest problems reported in retail sites. Conclusions and Recommendations This field survey on qualitative aspects revealed that, least precautions have been taken at production and distribution sites to preserve the quality of cut flower products. The drawbacks include: lack of cold chain management during storage and transport to slow down the inherent physiological processes, non-application of appropriate pre-treatments such as pulsing with food sources, preservatives and anti-ethylene treatments (for ethylene sensitive species), and sub-standard packaging. These factors could significantly contribute towards the decreased quality of products at retail and consumer sites. Acknowledgement Financial assistance by the Wayamba University Research Grant (No. SRHDC/RP/04/13-12) is gratefully acknowledged. References Anon (2012) Sri Lanka Export Development Board (SLEDB). Floriculture Industry Trade
Information. Available from: http://www.srilankabusiness. com/trade info/srilankaproduct/foliage.htm. Accessed 30.12.2013.
Faragher J, Slater T, Joyce D, Williamson V (2002) Postharvest Handling of Australian Flowers – from Australian Native Plants and Related Species. Rural Industries Research and Development Corporation (RIRDC). Publication No. 02/021. Barton, ACT, Australia.
Hoogerwerf A, Simons AE, Reinders MP (1994) A system view on horticultural distribution applied to the postharvest chain of cut flowers. Agricultural Systems 44: 163-180.
Idirisinghe IMSP, Ratnayake RHMK, Edirisinghe JC (2013) Current status of postharvest handling of cut flowers and foliage in the retail sites of Western and North Western Provinces of Sri Lanka.

Proceedings of the Young Scientist Forum Symposium
45
FACTORS AFFECTING PREFERENCE FOR GENETICALLY MODIFIED FOODS: A PILOT STUDY AMONG UNDERGRADUATES
Y.A.P.K. Dayasena1, I.C. Hettiarachchi2 and P. Sivashankar3*
1Postgraduate Institute of Science, University of Peradeniya
2, 3 Department of Agribusiness Management, Sabaragamuwa University of Sri Lanka
Introduction At present, there is a growing demand for Genetically Modified foods (GMF) as well as a growing public concern for GMF due to health risks. GMF are available in many countries. GMF are agricultural and livestock products where genes are artificially manipulated to get favorable traits. With rising living standards, public is much concerned about health, environmental and ethical issues arising from the consumption of GMF. Though there are very few studies to prove the negative effects of GMF, the skepticism within the consumers is high. To alleviate these studies on GMF preferences are needed. Though, a study in 2012 has looked into the preference of GMF and GMF labeling in Sri Lanka, it reveals that most of the consumers are in fact not heard about GMF. This study attempts to assess the preference for GM foods by university students and what factors shape their decisions to purchase GMF. This study differs from previous studies as this includes more variables on environmental and health concerns, geographic location, income, and awareness. Further, it is reasonable to get the respondents who have a fair level of education, or who know about GM foods, to look in to other variables. Materials and Methods A sample of 120 university students was randomly interviewed during the months of July and August, 2014 at the faculty of agricultural sciences of the Sabaragamuwa University of Sri Lanka. University Students represent all the differences in terms of location, and socio-economic differences from around the country. GM foods are not popular in Sri Lanka. Thus, going for a sample which has some understanding about the topic than going for the general public is justifiable. Pre tested questionnaire captured information related to Socio-economic details, Knowledge on GM foods, awareness and perceptions on GM foods and their level of willingness to consume GM foods if available in the market using likert scale. Probit regression and simple descriptive statistics were used to analyze the data. Probit regression is suitable as the dependent variable is a limited binary response variable. Many studies have used probit regression for numerous

Proceedings of the Young Scientist Forum Symposium
46
applications in the field of applied economics and more specifically on hypothetical markets to estimate the market demand. Demand is a function of price (P), product attributes (A) and income (I). This is extended with the inclusion of psychological factors and perceptions of respondents (C). Socio-demographic factors and knowledge and awareness about the product are the key things which make the consumer to make a decision regarding a new product. The general theoretical model becomes: Y = f (P, A, I, C). Accordingly, decision to consume GM Foods is based on the attributes of the GM food (environmental, health risks, and toxicity) and the individual’s psychological characteristics like (perceptions, awareness, and knowledge) about the use of GM foods, food security, as well as attitudes towards new technologies and products and its price. The following empirical equation is used in the probit regression (Table 1).
Results and Discussion Out of the total 64.4 % of the respondents were female and rest were (35.6 %) males. About 52 % of them were final year students followed by 32.5 % of third year students. Most of them come from Semi urban areas (56.8 %) followed by 27 % of rural residents. Among them 43.2 % of their households were earning a monthly income of between Rs. 25,000 to Rs. 40,000. Around 21 % of them were getting a monthly house hold income above Rs. 40,000. Respondents can get information on GM foods from multiple sources. Most of the students have got to know about GM foods from the classes (59.5 %) and from the Internet (56 %). About 46.7 % are familiar with plant derived GM products and 38 % are familiar with plant and animal derived GM foods. Nearly 56 % of respondents think that GM foods are beneficial. Majority of the respondents are skeptic to buy nutritionally enhanced GM foods. Finally, 30 % say that they will buy GM foods if they are introduced in Sri Lanka, 56 % say that they will not buy GM food and 22 % are not decided. Though 47 % of respondent agree to GM crops are pest resistant, 51 % of the students do not even like to use GM foods in animal feed to improve meat quality. The main reasons to reject GM foods are thinking they are unhealthy, artificial and are a threat to the environment. According to the probit model only gender, year of study, indices for environmental risk and health risk are significantly affecting the decision to consume GM foods at the price similar to Non GM foods. The pseudo R2 is around 47 %. Probability value for the whole model is below 0.05, the whole
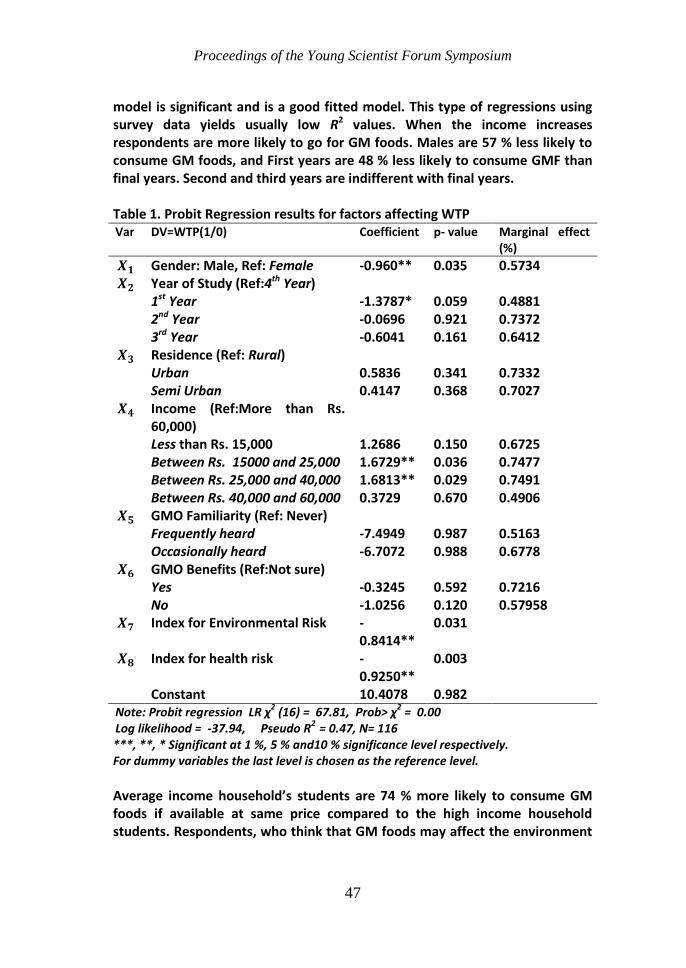
Proceedings of the Young Scientist Forum Symposium
47
model is significant and is a good fitted model. This type of regressions using survey data yields usually low R2 values. When the income increases respondents are more likely to go for GM foods. Males are 57 % less likely to consume GM foods, and First years are 48 % less likely to consume GMF than final years. Second and third years are indifferent with final years. Table 1. Probit Regression results for factors affecting WTP Var DV=WTP(1/0) Coefficient p- value Marginal effect
(%)
Gender: Male, Ref: Female -0.960** 0.035 0.5734 Year of Study (Ref:4th Year) 1st Year -1.3787* 0.059 0.4881 2nd Year -0.0696 0.921 0.7372 3rd Year -0.6041 0.161 0.6412 Residence (Ref: Rural) Urban 0.5836 0.341 0.7332 Semi Urban 0.4147 0.368 0.7027 Income (Ref:More than Rs.
60,000)
Less than Rs. 15,000 1.2686 0.150 0.6725 Between Rs. 15000 and 25,000 1.6729** 0.036 0.7477 Between Rs. 25,000 and 40,000 1.6813** 0.029 0.7491 Between Rs. 40,000 and 60,000 0.3729 0.670 0.4906 GMO Familiarity (Ref: Never) Frequently heard -7.4949 0.987 0.5163 Occasionally heard -6.7072 0.988 0.6778 GMO Benefits (Ref:Not sure) Yes -0.3245 0.592 0.7216 No -1.0256 0.120 0.57958 Index for Environmental Risk -
0.8414** 0.031
Index for health risk -0.9250**
0.003
Constant 10.4078 0.982 Note: Probit regression LR χ
2 (16) = 67.81, Prob> χ
2 = 0.00
Log likelihood = -37.94, Pseudo R2
= 0.47, N= 116 ***, **, * Significant at 1 %, 5 % and10 % significance level respectively. For dummy variables the last level is chosen as the reference level.
Average income household’s students are 74 % more likely to consume GM foods if available at same price compared to the high income household students. Respondents, who think that GM foods may affect the environment
Proceedings of the Young Scientist Forum Symposium
48
and health of consumers, are less likely to consume GM foods at the price similar to non GM counterparts. Conclusions and Recommendations This paper studied the university students’ awareness and perceptions on GMF and factors affecting their preference for GMF. Still the sample showed awareness regarding GM foods is quite low. Especially due to the nature of the subject many respondents were skeptical about the GM foods. More than half of the respondents know about the benefits of the GM products, Still 56 % of the respondents are not willing to buy GM foods if they are introduced in to Sri Lankan market. Mostly the perceptions regarding GM foods are through internet and classes, yet with the absence of scientific proof for those perceptions, a considerable amount of respondents are neutral on the given statements and undecided on purchasing GM foods. Our findings are in line with the general acceptance of GM foods in Europe and Some East Asian countries. Female students and final year students are more likely to consume GMF. Average income household student are more likely to consume GMF at the same price of their conventional counterparts. Negative believes on environment and health, negatively affects the consumption of GMF. Since the GM products are not available in the local market and consumers are not aware of it, it is hard to measure the consumer awareness and willingness to consume GMF. It is expected that in future people might adapt to GM foods and GM products with more market penetrations and marketing. A comprehensive study on actual consumers is important to make policy decisions and for industries. References Al-Khayri JM, Hassan MI (2012) Socio-demographic factors influencing public
perception of genetically modified food in Saudi Arabia. American Journal of Food Technology 7: DOI:10.3923/ajft.2012.101.112
Kim RB (2012) Consumer attitude of risk and benefits toward genetically modified (GM) foods in South Korea: implications for food policy. Inzinerine Ekonomika-Engineering Economics 23: 189-199.
Kimenju SK, De Groote H (2008) Consumer willingness to pay for genetically modified food in Kenya. Agricultural Economics 38: 35–46.
Lancaster K (1971) A new approach to consumer theory. Journal of Political Economy 74: 132-157.
Senarath SN, Karunagoda RP (2012) Consumer attitudes towards labelling of genetically modified foods in Sri Lanka. Tropical Agricultural Research 23: 283 -288.
Proceedings of the Young Scientist Forum Symposium
49
SERUM INSULIN LEVELS – IS IT A GOOD INDICATOR IN CHRONIC TYPE-2 DIABETES MELLITUS SUBJECTS?
Y.S.M. Dissanayake1 and L.V. Athiththan1*
1Department of Biochemistry, University of Sri Jayewardenepura, Sri Lanka
Introduction Type 2 diabetes (T2D) is characterized by hyperglycaemia due to defects in secretion of insulin and its action. Insulin resistance (IR) and hyperinsulinaemia are considered as key features of T2D. Worldwide prevalence of T2D has been increasing significantly. About 347 million people worldwide have diabetes and 90 % of them have T2D. South East Asian region accounts for the 2nd highest number of T2D cases and in Sri Lanka prevalence of diabetes was 10.3 % in 2008. The IR is a condition where insulin levels are higher than expected and also relatively higher to the level of glucose in the blood. Therefore hyperinsulinaemiais often caused by IR where geneticand environmental factors influence hyper secretion of insulin hormone from β-cells which ultimately leads to hyperinsulinemia.IR is the major underlying causative factor of metabolic syndrome (MS) and is one of the risk factors for several non-communicable diseases (NCD) such as type 2 diabetes, dyslipidaemia and cardiovascular diseases (CVD). Several studies have introduced IR as a powerful predictor of T2D. Fastingserum insulin (FSI) level of normal healthy subjects in Sri Lanka was, 93.42 ± 54.17 (21.53-376.42) pmol L-1, while FSIamong Sri Lankan diabetics was 150.71 ± 87.37 (41.67-390.31) pmol L-1 (Senevirathne et al. 2009). IR in urban and rural adult population in Sri Lanka was 22.3 %. T2D is linked with basal hyperinsulinaemia, reduced sensitivity to insulin, and disturbances in insulin release. Even thoughFSI is currently being measured in diabetes subjects some studies state that chronic T2D subjects with FPG exceeding 7.8 mmol L-1 secretes insulin levels at a low level which is similar to healthy non-diabetic individual or even lower. Therefore in chronic diabetics, basal insulin secretion and FSI can be within the normal range or even lower. Even though studies have indicated serum insulin level as a marker of IR. Eventually, C-peptide has gained attention as an alternative marker for IR, which is a protein that is co-secreted with insulin on an equimolar basis from pancreatic beta cells. Unlike insulin, it doesn’t undergo hepatic first pass metabolism, has a longer half‐life, and has been recognized as a more stable and accurate marker of endogenous insulin secretion and the pancreatic health.

Proceedings of the Young Scientist Forum Symposium
50
Hence this study was carried out to identify insulin resistance, hyperinsulinaemia and its association with FPG in a selected Sri Lankan T2D population and also to assess the clinical relevance of FSI in chronic diabetes subjects. Materials and Methods Diabetic subjects (121) aged 27-80 years who were already diagnosed as having diabetes mellitusby a registered medical practitioner or government hospitals and attend the clinic at Family Practice Centre, Faculty of Medical Sciences, University of Sri Jayewardenepura were enrolled, after obtaining ethical approval from the Ethics Review Committee of USJP. Informed written consent was obtained prior to the study. An interviewer administered questionnaire was used to collect information about socio-demographic factors, family history of diabetes, lifestyle patterns and physical activity. About 3 mL of 8 - 10 hours overnight fasting venous blood samples were obtained from each subject to analyze FPG and FSI. Glucose oxidase method was used to measure plasma glucose level and solid phase Enzyme-Linked Immunosorbent Assay (ELISA) method was used for serum insulin assay. IR was estimated by the HOMA-IR, using the equation HOMA-IR= [FSI (µU mL-1) x FPG (mmol L-1)]/22.5 (Schianca et al. 2003). FPG level was classified based on World Health Organization criteria [WHO, 2006].Hyperinsulinaemia was measured when FSI is ≥75th percentile of its distribution (Freiberg et al. 2004).As a measure of IR, subjects having HOMA-IR ≥ 2.6 was taken as insulin resistant(Schianca et al. 2003). Results were analyzed using SPSS version 16 and Microsoft Excel 2010. Correlations and significant differences were determined and p<0.05 was considered as significant.
Results and Discussion Among the 121 study subjects, 64.5 % (n = 78) were females. Mean age of the study population was 59 ± 11 years. Most of the subjects were residing in Colombo (66.9 %) and majority had a monthly income <Rs. 20000 (72.7 %). Majority of the study population (62.8 %) had diabetes ≥ 5 years. Among the study population, 58.7 % had a family history of diabetes.Those who had FPG ≥7 mmol L-1 (n=59), 66.1 % had a known family history for diabetes. These findings were supported by several prospective studies where first-degree family history had a strong correlation with twofold increased risk of future T2D. This denotes that genetic predisposition is a risk factor in development of T2D and those with family history should have proper screening time to time and ones who are already diagnosed should have a proper follow up and monitoring.
Proceedings of the Young Scientist Forum Symposium
51
Study subjects had an average FPG value of 8.0±3.45 mmol L-1 which indicates a poor glycaemic control among the subjects.Large number of the study population (82.7 %) had FPG value above the normal range (≥4.0-5.6 mmol L-1) suggestive of poor glycaemic control among the subjects.In this study population, good percentage (56.2 %) of subjects monitors FPG levels monthly. Blood glucose monitoring at least once in every 3 months would enable to see the effect of treatment and aids in assessing the patients’ compliance. It is recommended that subjects with high risk and those who have complications should monitor their FPG levels at least every 3 months. Geometric mean of FSI among the subjects was 34.67 ± 2.3 pmol L-1 which was below the given normal FSI value for normoglycaemic subjects (Senevirathne et al. 2009). Among the hyperinsulinaemicsubjects geometric mean of FSI was 89.12 ± 2.3 pmol L-1. Though mean FSI of these subjects were within the normal range (18-172 pmol L-1) (Sultan et al. 2010) mean FSI of hyperinsulinaemic subjects was lesser than the given mean FSI for diabetics. Subjects whose FPG was ≥7 mmol L-1, had a mean serum insulin level of 39.8 ± 1.8 pmol L-1 which indicates that FSI is normal in these T2D subjects. Concerning the duration of having diabetes among the T2D subjects even with high FPG, both groups with the duration less than and greater than 5 years had (less) geometric mean of insulin levels but similar in both groups (FPG 8.3 and 7.8 mmol L-1 and insulin 33.1 and 36.3). This may be due to deterioration of beta cells and are unable to maintain insulin secretion hence FSI decline precipitously. Yet 38 % of the study subjects were insulin resistant according to HOMA-IR valuesand their mean FPG and FSI levels were 9.7 ± 4.3 mmol L-1 and 69.18 ± 1.58 pmol L-1, respectively. Out of the subjects who had FPG ≥7 mmol L-1, 54.2 % hadHOMA-IR ≥2.6 but only 20.3 % of them had hyperinsulinaemia. Further FPG and FSI had a significant positive correlation with IR (p=0.000).Significantly higher mean FPG levels (p<0.05) were observed with insulin resistant subjects (HOMA-IR ≥2.6) and lesser frequency of screening (< monthly) for FPG. Despite monthly income ≥ Rs. 20 000, lesser frequency of screening was observed in these study subjects and also they had FSI & HOMA-IR ≥2.6 which was significantly higher (p<0.05). These findings were supported by American Diabetes Association (2010), indicating that T2D is strongly linked with insulin resistance but diabetics are not necessarily to become hyperinsulinaemic. Thus chronic T2D subjects can present with normal FSI hence low FSI in chronic diabetics is not an indicator of good control. Yet, hyperinsulinaemia can be a strong predictor of development of T2D and metabolic syndrome.

Proceedings of the Young Scientist Forum Symposium
52
Conclusions and Recommendations Though it is assumed that poorly controlled chronic diabetic subjects have high FSI, this study demonstrates that, FSI is not a good indicator to assess glycaemic control in chronic T2D subjects. FPG and FSI have a significant correlation with IR. Furthermore, frequency of screening of FPG levels and first degree family history plays a major role in the FPG levels in T2D subjects. Therefore it is recommended to increase the FPG screening frequency at least once in 3 months in subjects with a known family history and not to assess the FSI values in chronic T2D. Acknowledgement Department of Biochemistry, Faculty of Medical Sciences, University of Sri Jayewardenepura for financial support & laboratory assistance. Dr. W.A.A. Wijeysiri, Department of Community Medicine, Faculty of Medical Sciences, University of Sri Jayewardenepura for the statistical advice. Ms. Kasuni Walatara, for the guidance and advices on statistical analysis and for the assistance during the project. Medical and laboratory staff of the Family Practice Centre for their assistance during sample collection. References American Diabetes Association (2010) Diagnosis and classification of diabetes mellitus.
Diabetes Care 33: 62-69. Freiberg MS, Cabral HJ, Heeren TC, Vasan RS, Ellison RC (2004) Alcohol consumption
and the prevalence of the metabolic syndrome in the US: A cross-sectional analysis of data from the Third National Health and Nutrition Examination Survey. Diabetes Care 27: 2954 – 2959.
Schianca GPC, Rossi A, Sainaghi PP, Maduli E and Bartoli E (2003) The Significance of Impaired Fasting Glucose versus Impaired Glucose Tolerance. Diabetes Care 26: 1333–1337.
Senevirathne HR, Lankeshwara D, Wijerathne S, Somasunderam N, Athukorale De (2009). Serum insulin patterns and the relationship between insulin sensitivity and glycaemic profile in women with polycystic ovary syndrome, International Journal of obstetrics and Gynecology 116:1722-1728.
Sultan S, Subhan F, Deepa F, Subhan K, Tahir F. 2010. Evaluation of fasting serum insulin in different age groups of the local population. Pakistan Journal of Biochemistry and Molecular Biology 43: 76-79.

Proceedings of the Young Scientist Forum Symposium
53
ISOLATION, CHARACTERIZATION AND IDENTIFICATION OF LACTIC ACID BACTERIA FROM FERMENTED INDIGENOUS RICE FLOUR
D.M.W.D. Divisekera1*, W.A.A.I. Warunasinghe2 and I.G.N. Hewajulige1
1Food Technology Section, Industrial Technology Institute, Colombo 7
2Faculty of Agricultural Sciences, Sabaragamuwa University of Sri Lanka
Introduction Rice (Oryza sativa L.) is the largest cereal prominently cultivated in Sri Lanka. Sri Lanka has indigenous rice varieties with high nutritional value. The research evidences regarding Lactic Acid Bacterial fermentation of indigenous rice in Sri Lanka is very rare. Lactic acid bacteria (LAB) from food sources are being extensively studied due to its diversified role in human health. Their function extends from normalization of intestinal microbiota composition in the gut and immunomodulation to metabolic effects such as reduce serum cholesterol effects, reduce toxic effects and lactose hydrolysis. Non-digestible foods provide nutritional substrate for the growth of lactic acid bacteria. Lactic acid bacteria (LAB) in traditional fermented foods are beneficial for flavoring foods and inhibiting pathogenic as well as spoilage bacteria in the products. According to the previous research evidences, rice can be used to develop functional foods with enhancing gastrointestinal health. The objective of this study is to isolate, characterize and identify the Lactic Acid Bacteria associated with fermented indigenous rice flour. Materials and Methods Four indigenous rice varieties namely Kaluheenati, Kuruluthuda, Suwadhel and Madathawalu were purchased from known farmer fields, milled to passed through a 0.5 mm sieve, mixed with sterilized distilled water (1:2 ratio, w/v) and allowed to ferment at 30 °C for 24 h. Serial dilutions were prepared up to 10-3 with sterilized saline from fermented sample, 0.1 ml from each dilution were spread on sterile MRS agar plates (Hi-Media, India) and incubated at 37 °C for 24 h (Suthan et al. 2010). Each colony forming unit isolated was streaked on fresh MRS plates to examine the purity, followed by gram staining. All purified isolates were inoculated in MRS broth and incubated (37 °C, 24h). Biochemical tests, indole, methyl red, vogus–prosker, citrate utilization, gelatin liquefaction, H2S production, starch hydrolysis, urease and catalase were performed. DNA of the isolates was extracted using an in-house optimized SDS proteinaseK DNA extraction method. For the PCR, primers 1492R (5'TACGGYTACCTTGTTACGACTT - 3') and 27F (5'-AGAGTTTGATCMTGGCTC AG-3') were selected and for the sequencing, primers 518F (5' CCAGCAGCCGCGGTAATACG 3') and 800R (5' TACCAGGGTATCTAATCC

Proceedings of the Young Scientist Forum Symposium
54
3') were selected. The 16S rDNA sequencing was carried out at Macrogen-South Korea and sequence alignment was carried out by Basic Local Alignment Search Tool. Results and Discussion Seven organisms were isolated from fermented rice flour. Gram staining and colony characterization of the isolates from fermented rice flour is represented in Table 1, and Table 2 represents the biochemical and molecular level identification of the isolates. Table 1. Gram staining and colony morphology of the isolates from fermented indigenous rice flour
Among the seven isolates, three organisms were able to isolate from fermented flour of Kaluheenati. Two organisms were able to isolate from fermented flour of Suwadel, where as one organism was able to isolate from fermented flour of Madathawalu and Kuruluthuda. All the seven isolates were observed to be Gram positive, morphologically observed to be cocci.
Ric
e v
arie
ty
Iso
late
nu
mb
er
Gra
m s
tain
Size
Surf
ace
Text
ure
Co
lor
Ele
vati
on
Mar
gin
Kaluheenati
1 positive cocci
Punctiform Glistening Mucoid Creamy white
Raised Entire
Kaluheenati
2 positive cocci
Punctiform Glistening Mucoid Creamy white
Flat Entire
Kaluheenati
3 positive cocci
Punctiform Glistening Mucoid Creamy white
Raised Entire
Suwandel 4 positive cocci
Medium Glistening Mucoid White Raised Entire
Suwandel 5 positive cocci
Medium Glistening Mucoid White Pulvinate
Entire
Madatha-walu
6 positive cocci
Medium Glistening Mucoid White Pulvinate
Entire
Kurulu-thuda
7 positive cocci
Punctiform Glistening Mucoid White Raised Entire
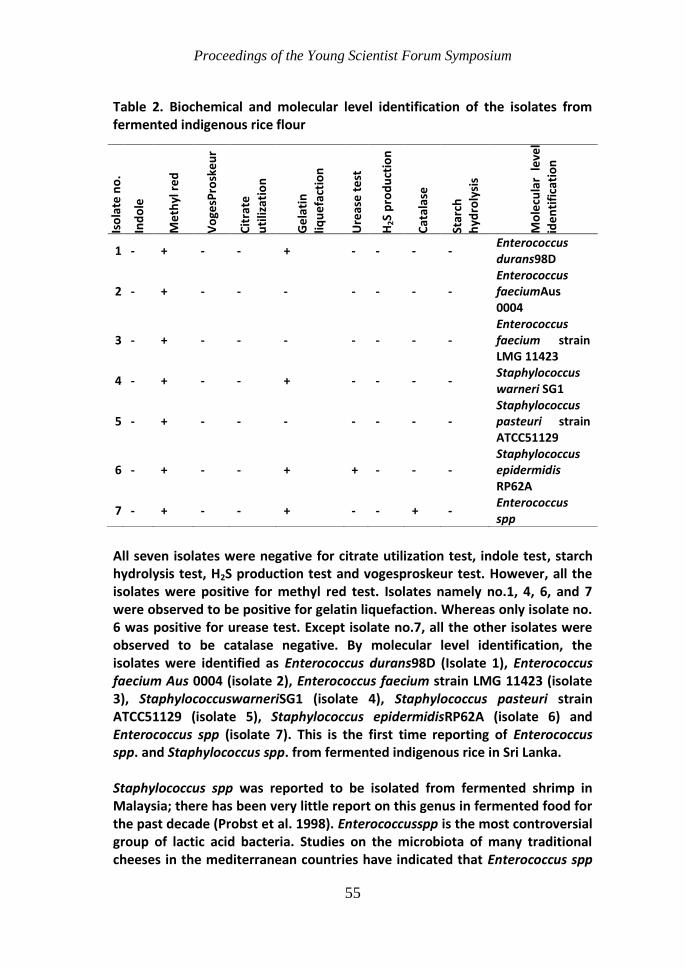
Proceedings of the Young Scientist Forum Symposium
55
Table 2. Biochemical and molecular level identification of the isolates from fermented indigenous rice flour
All seven isolates were negative for citrate utilization test, indole test, starch hydrolysis test, H2S production test and vogesproskeur test. However, all the isolates were positive for methyl red test. Isolates namely no.1, 4, 6, and 7 were observed to be positive for gelatin liquefaction. Whereas only isolate no. 6 was positive for urease test. Except isolate no.7, all the other isolates were observed to be catalase negative. By molecular level identification, the isolates were identified as Enterococcus durans98D (Isolate 1), Enterococcus faecium Aus 0004 (isolate 2), Enterococcus faecium strain LMG 11423 (isolate 3), StaphylococcuswarneriSG1 (isolate 4), Staphylococcus pasteuri strain ATCC51129 (isolate 5), Staphylococcus epidermidisRP62A (isolate 6) and Enterococcus spp (isolate 7). This is the first time reporting of Enterococcus spp. and Staphylococcus spp. from fermented indigenous rice in Sri Lanka. Staphylococcus spp was reported to be isolated from fermented shrimp in Malaysia; there has been very little report on this genus in fermented food for the past decade (Probst et al. 1998). Enterococcusspp is the most controversial group of lactic acid bacteria. Studies on the microbiota of many traditional cheeses in the mediterranean countries have indicated that Enterococcus spp
Iso
late
no
.
Ind
ole
Me
thyl
re
d
Vo
gesP
rosk
eu
r
Cit
rate
uti
lizat
ion
Ge
lati
n
liqu
efa
ctio
n
Ure
ase
te
st
H2S
pro
du
ctio
n
Cat
alas
e
Star
ch
hyd
roly
sis
Mo
lecu
lar
leve
l
ide
nti
fica
tio
n
1 - + - - + - - - - Enterococcus durans98D
2 - + - - - - - - - Enterococcus faeciumAus 0004
3 - + - - - - - - - Enterococcus faecium strain LMG 11423
4 - + - - + - - - - Staphylococcus warneri SG1
5 - + - - - - - - - Staphylococcus pasteuri strain ATCC51129
6 - + - - + + - - - Staphylococcus epidermidis RP62A
7 - + - - + - - + - Enterococcus spp

Proceedings of the Young Scientist Forum Symposium
56
play an important role in the ripening of these cheeses, probably through proteolysis, lipolysis, and citrate breakdown, hence contributing to their typical taste and flavor. Enterococcus spp are also present in other fermented foods, such as sausages and olives. However, their role in these products has not been fully elucidated. Production of bacteriocins by Enterococcsspp is also well documented. Enterococcus sppare nowadays used as probiotics even though these have been associated with a number of human infections. E. faecium have been applied in human as probiotic supplements. Since 2004, ten preparations (9 different strains of E. faecium) are authorized as additives in food in the European Union that are proposed to be clinically effective in the prevention and treatment of antibiotic associated diarrhea in children. Enterococcus hirae (Streptococcus faecalis) ATCC 9790 is a Gram positive lactic acid bacterium and reported to be isolated from fermented fish. E. durans use as co-cultures in the production of Feta cheese and a white-brined cheese. Among the seven isolates in this study, Enterococcus faeciumis the most frequently reported species among the Enterococcus spp. that literature reveals as a starter culture for fermentation (Moreno et al. 2006). There is no data available in the literature on isolation of Enterococcus spp. from fermented indigenous rice flour. Therefore, this is the first time reporting of Enterococcus spp. from fermented indigenous rice in Sri Lanka. Conclusions and Recommendations
Seven potential probiotic isolates namely; Enterococcus durans98D Enterococcus faecium Aus 0004, Enterococcus faecium strain LMG 11423, Staphylococcus warneri SG1, Staphylococcus pasteuri strain ATCC51129, Staphylococcus epidermidis RP62 and Enterococcus spp were isolated from fermented indigenous rice flour. The contribution of potential probiotics to the organoleptic and functional properties of fermented food products are important characteristics for their application in food technology. Therefore, a proper toxicological study should be conducted to assess the safety of the isolates for use as a starter; also functional properties of the isolates should be investigated. References Moreno MRF, Sarantinopoulos P, Tsakalidou E, Vuyst LD (2006) The role and
application of enterococci in food and health. International Journal of Food Microbiology 106:1-24.

Proceedings of the Young Scientist Forum Symposium
57
INVESTIGATION OF ANTIBACTERIAL PROPERTIES OF ENDOPHYTIC FUNGI ISOLATED FROM Nymphaea nouchali ENDEMIC TO SRI LANKA AND THE
ISOLATION OF CHAETOGLOBOSIN C FROM THE ENDOPHYTIC Chaetomium sp.
D.M.R.K. Dissanayake1, P. B. Ratnaweera1,2, E. D. De Silva1*, D. E. Williams2,
C.D. Wijayarathne1, R.L.C. Wijesundera3 and R. J. Andersen2 1 Department of Chemistry, University of Colombo, Sri Lanka
2 Department of Earth, Ocean and Atmospheric Sciences,
University of British Columbia, Canada 3 Department of Plant Sciences, University of Colombo, Sri Lanka
Introduction Endophytic fungi which reside symbiotically inside plants are considered to be an outstanding source of novel bioactive secondary metabolites. However, only a few studies have been carried out so far to evaluate the potential of endophytic fungi inhabiting Sri Lankan biota (Ratnaweera et al. 2014). The rich biodiversity and the high degree of endemism among Sri Lankan plants suggest the possibility that the endophytes contained in them may have unique biosynthetic capabilities leading to the production of unique metabolites with varied biological activities. Therefore, the investigation of the endophytic fungi of Sri Lankan endemic plants for the presence of antimicrobial substances becomes especially attractive. The present study was carried out to isolate and characterize the antimicrobial substances produced by laboratory cultures of endophytic fungi isolated from the aquatic endemic plant Nymphaea nouchali (Nil Manel in Sinhalese). Materials and Methods Specimens of N. nouchali were collected from Udugampola, Gampaha District, Sri Lanka. Healthy leaves, stems, sepals and petals of the plant were surface sterilized, within five hours of collection, by sequentially washing with sterile distilled water (2 min), 70 % Ethanol (30 sec) and 5 % NaOCl solution (1.5 min). Next sterilized plant parts were dried, cut into 0.5 cm2 segments and placed on dilute Malt Yeast Agar (dMYA) plates under aseptic conditions and left at room temperature up to seven days, until endophytic fungi emerged. The emergent fungi were sub-cultured on Potato Dextrose Agar (PDA) to obtain 24 pure cultures (10 from leaves, 05 from stem, 05 from sepals and 04 from petals) of morphologically distinct endophytic fungi. Next each distinct fungal species was cultured on 06 PDA plates (120 mm × 20 mm) for 03 - 05 weeks and the culture media together with the fugal mycelia were extracted in to

Proceedings of the Young Scientist Forum Symposium
58
ethyl acetate and concentrated under reduced pressure to obtain 24 crude organic extracts. Antibacterial activity of the resulting 24 organic extracts were evaluated using disc diffusion method against Staphylococcus aureus (ATCC 25923), Pseudomonas aeruginosa (ATCC 9027), Escherichia coli (ATCC 35218), and Bacillus cereus (ATCC 11778) at 300 and 50 µg disc-1 (National Committee for Clinical Laboratory Standards 2003). The obtained results were statistically analyzed by one way ANOVA using Minitab. The fungus RDNM-04, which was active at 50 µg disc-1 against S. aureus and B. cereus, was selected for compound isolation and molecularly identified by analysis of the nucleotide sequence of the ITS region using BLAST analysis. In order to isolate active metabolite(s) the fungus was grown large scale on PDA (250 Petri dishes, 120 mm × 20 mm) for 18 days until sporulation. The culture medium together with the fungal mycelium was next extracted with EtOAc (3
1.5 L) and the extract was filtered and concentrated at reduced pressure to obtain the crude organic extract. The organic extract (2.2 g) was subjected to bioassay guided fractionation, first by normal phase silica gel column chromatography (2 cm × 25 cm column; gradient elution starting with hexane, then mixtures of hexane/EtOAc to EtOAc) to give 58 mg of active material which was further purified by re-chromatographing on silica gel (1.5 cm × 35 cm column; gradient elution from hexane/EtOAc, 30:70 to EtOAc/MeOH, 30:70) to give 20 mg of the active fraction. The final purification was achieved by size-exclusion chromatography on Sephadex LH 20 (1.5 cm × 60 cm column with MeOH:CHCl3, 1:1) to obtain 7.5 mg of a white amorphous solid which gave a single spot on thin layer chromatography. The 1H, 13C and 2D NMR (COSY, HSQC, HMBC) spectral data of the pure active compound were obtained using a Bruker ADVANCE 600-MHz spectrophotometer (DMSO-d6 used as a solvent) while mass spectroscopic (MS) data were obtained using a Bruker Esquire-LC electrospray spectrophotometer. Results and Discussion The results of antibacterial bioassays showed that of the 24 fungal extracts, 15 were inactive against all 04 bacterial species tested. Of the 09 active extracts, all inhibited the growth of S. aureus and B. cereus at 300 µg disc-1 while only 02 extracts (RDNM-01 and RDNM-18) were active against P. aeruginosa and E. coli at this concentration. At 50 g disc-1 RDNM-01, RDNM-04, RDNM-06, RDNM-18 and RDNM-22 were active against S. aureus and B. cereus while only RDNM-1 and RDNM-18 were active against P. aeruginosa and E. coli (Table 1). A GenBank search for similar sequences showed that the 18S rRNA gene

Proceedings of the Young Scientist Forum Symposium
59
sequence of RDNM-04 contain 99 % sequence identity to that of Chaetomium sp. Table 1. Antibacterial activity of the organic extracts of endophytic fungi isolated from Nymphaea nouchali (Mean±SE) Large scale culturing of the fungus RDNM-04 yielded 2.2 g of crude extract and bioassay guided fractions yielded 7.5 mg of a white pure active compound. High resolution mass spectral data (M+, 528.6429 g mol-1) indicated a molecular formula of C32H36N2O5. Interpretation of 1H, 13C and 15N NMR together with 2D (COSY, HSQC, HMBC, HSQC) NMR data identified the structure of active compound as the known cytochalasan, Chaetoglobosin C (Fig. 1). A comparison of 13C NMR values obtained in the present study for chaetoglobosin C with the reported data (Sekita et al. 1976) is given in Table 2.
Figure 1. Chemical Structure of the Chaetoglobosin C. Chaetoglobosin C, a member of the cytochalasan family of compounds, was first isolated from the fungus Chaetomium globosum from Japan in 1976 together with the Chaetoglobosin A, D, E and F.
Identification No. of
Fungi
Origin
Antibacterial activity (µg disc-1) (Inhibition zone diameter - mm)
S. aureus B. cereus P. aeruginosa E. coli
300
50
300
50
300
50
300
50
RDNM-
01 Sepals 17±0.2 12±1.2 22±0.3 12±0.8 8±0.5 7±0.3 15±1.4 8±0.9
RDNM-
04 Leaves 16±1.3 13±0.5 19±0.6 10±0.2 - - - -
RDNM-06
Leaves 14±0.1 10±0.9 16±0.5 14±1.6 - - - -
RDNM-
13 Stem 11±0.3 - 11±0.8 - - - - -
RDNM-
18 Leaves 25±0.2 15±1.4 27±1.6 17±1.1 8±0.6 8±0.1 20±2.3 10±0.3
RDNM-20
Leaves 10±0.4 - 12±0.1 - - - - -
RDNM-
21 Stem 08±0.2 - 09±0.5 - - - - -
RDNM-
22 Sepals 12±0.4 07±0.6 14±0.9 08±1.0 - - - -
RDNM-23
Leaves 09±0.2 - 08±0.7 - - - - -
+ve
control 23±1.0 21±0.9 21±0.8 22±2.6 20±2
21±1.
8 22±1.5 22±1.9

Proceedings of the Young Scientist Forum Symposium
60
Table 2. Comparison of 13C NMR data of chaetoglobosin C from the present study with published data in DMSO-d6
13C (ppm)
C# Present study Published data C# Present study Published data C# Present study Published data
1 173.96 173.79 13 127.08 127.04 22 37.17 37.04
3 52.38 52.25 14 133.14 133.11 23 196.28 196.04
4 48.50 48.35 15 39.15 39.47 2’ 121.03 120.86
5 36.19 36.10 16 32.63 32.50 3’ 108.07 108.02
6 56.75 56.87 16’ 19.43 19.28 3a’ 127.80 127.63
7 60.31 60.28 17 155.92 155.56 4’ 118.42 118.25
8 48.19 48.24 18 131.05 130.95 5’ 125.58 125.02
9 62.40 62.25 18’ 10.08 9.93 6’ 118.78 118.25
10 31.73 31.88 19 208.29 208.00 7’ 111.35 111.22
11 12.42 12.30 20 205.48 205.15 1a’ 135.88 135.81
12 19.13 18.99 21 31.98 31.88
Conclusions and Recommendations N. nouchali harbors many endophytic fungi which are capable of producing antibacterial substances. Although the antibacterial compound isolated from the fungal extract RDNM-4 proved to be known, the possibility of isolating new biologically active compounds from the remaining active extracts still remains. Thus it can be concluded that the endophytic fungi of Sri Lankan endemic flora are a valuable potential source for the isolation of bioactive metabolites and more investigations should be performed to realize its true potential. Acknowledgement Financial assistances by the National Science Foundation under the grant RG/2012/NRB/01. References National Committee for Clinical Laboratory Standards (2003) Performance Standards
for Antimicrobial Disc Susceptibility Tests, Approved Standard, Document M2-A8. Wayne: National Committee for Clinical Laboratory Standards.
Ratnaweera PB, Williams DE, de Silva ED, Wijesundera RLC, Dalisay DS, Andersen RJ (2014) Helvolic acid, an antibacterial nortriterpenoid from a fungal endophyte, Xylaria sp. of orchid Anoectochilus setaceus endemic to Sri Lanka. Mycology 5: 23-28.
Sekita S, Yoshihira K, Natori S, Kuwano H (1976) Structure of chetoglobosin C, D, E and F, cytotoxic indol-3-yl-[13] cytochalasans from Chaetomium globosum. Tetrahedron Letters 17: 1351-1354.
Proceedings of the Young Scientist Forum Symposium
61
DETERMINATION OF ANTIBACTERIAL ACTIVITY OF SRI LANKAN TEA BREWS BY BROTH MICRODILUTION ASSAY
T. M. Erandika1, P.D. Abeysinghe1*, R.N. Pathirana2 and S. Abeysinghe3
1Department of Botany, University of Ruhuna, Matara, Sri Lanka
2Kotalawala Defence Academy, Ratmalana, Sri Lanka
3Tea Research Institute, Thalawakele, Sri Lanka
Introduction Even though pharmacological industries have produced a number of new antibiotics in the last three decades, the development and the rapid spread of strains resistant to the synthetic antibiotics by micro-organisms have become a global problem. In general, bacteria have the genetic ability to transmit and acquire resistance to drugs which are utilized as therapeutic agents. Some ‘hospital-acquired’ infections may be resistant to a number of clinically efficacious antibiotics and become less effective even to the high dosage of antibiotics. Therefore, measures such as controlling the use of antibiotics or search for new drugs or natural products have to be carried out to overcome this problem. The antibacterial effect of many herbs and other materials of plant origin are widely known. Studies have been conducted on the possibility of using plant extracts in treating diseases caused by microbial strains resistant to antibiotics. These investigations also include tea (Camellia sinensis) extracts. Some investigations have found inhibitive properties of black, green and pu-erh teas in relation to Staphylococcus aureus, and Staphylococcus epidermidis, and of black and green teas in relation to Vibrio cholerae, Vibrio mimicus, Plesiomonas shigelloides. Sri Lanka is the third largest tea producer and the exporter in the world. Although only few researches have been carried out on the antibacterial properties of teas produced within the island. Therefore, objective of the present study was to investigate antibacterial properties of different brands of tea manufactured in Sri Lanka using microdilution assay which is simple, sensitive, rapid, robust and a reliable method. Materials and Methods Methicillin-resistant Staphylococcus aureus (MRSA) and Mycobacterium smegmatis (MS) were used for investigation. Fourteen avalilable black tea samples were obtained from Tea Research Institute (TRI), Sri Lanka. Ten green
Proceedings of the Young Scientist Forum Symposium
62
tea samples were obtained from Melfort Green Teas (Pvt) Ltd, Peliyagoda, Sri Lanka (Table 1). Each tea sample (2 g) was brewed with 100 ml of boiled water in a covered container for 6 minutes, 1 ml of filtrate was transfered in to sterilized centrifuge tubes. The dry matter content of tea were measured using oven method (at 110 ± 5 °C temperature for constant mass). Triplicates of brews were prepared from each tea sample and triplicates of assays were carried out using each brew to have nine replicates. Determination of Minimum Inhibitory Concentration (MIC): The minimum inhibitory concentration (MIC) of each tea brew was determined using the previously described broth microdilution colorimetric assay with slight modifictions. Main modification was the adding resazurin indicator after the incubation of the plates (previous method added the indicator before incubation). The microtitre plates including eight rows and twelve columns with 96 wells were prepared for the assay in aseptic conditions. A volume of 100 µl of tea brews were pipetted into each wells in the first row. To all wells in other rows 50 µl of sterilized distilled water was added. Serial dilutions were performed from first to last row in each coloumn (in serially descending concentrations) using a micro pipette to make 50 µL of the tea brew in each well. The excess volume in the last row was discarded. Using a micropipette 40 µl of 2.5 × strength LB broth was added to each well to ensure that the final concentration of nutrient broth was single strength. Finally, 10 µl of bacterial suspension (5×10⁶ CFU mL-1) was added to each well to achieve a concentration of 5×10⁵ CFU mL-1 in the well. Amoxillin (1mg mL-1) and distilled water were used as positive and negative controls respectively in each plate. As a sterility control one tea sample was used without bacteria. Sealed plates were incubated for 18 hours at 37 °C and then 30 µl of 0.25 mg mL-1 resazurin solution as a bacterial growth indicator was added to all microplate wells. The plates were incubated further for 30 minutes. The color change was then assessed visually. Any color changes from purple to pink or colorless were recorded as positive. The lowest concentration at which color change occurred was taken as the MIC value which was the MIC for the test material and bacterial strain. All analyses were conducted in nine replicates, and the results were expressed as mean ± standard deviation (SD). The differences between means were first analyzed by ANOVA test and then Duncan’s multiple range tests (p < 0.05) using the SAS version 9.1.3 software.

Proceedings of the Young Scientist Forum Symposium
63
Results and Discussion Dry matter content of tea brews was within the wide range from 5.34 (Pekoe (a)) to 8.25 mg mL-1 ( BOPF (a)). Therefore, boiled water extractable compounds of tea are highly depends on the tea grades. Table 1. Minimum Inhibitory Concentration (MIC) of brews from Sri Lankan black and green tea against Mycobacterium smegmatis (MS) and Methicillin-resistant Staphylococcus aureus (MRSA)
Tea type
Sample Dry weight
of brew (mg mL-1
)
MIC (mg mL-1
)
MS MRSA
Bla
ck t
ea
BOP 6.84 1.43 ± 0.40 ef
0.38 ± 0.09 f
BOPF (a) 8.25 2.78 ± 0.89 a 0.94 ± 0.33
bcd
BOPF (b) 5.77 1.95 ± 0.32 bcdef
1.72 ± 0.49 a
BOPF (c) 7.15 1.92 ± 0.68 bcdef
0.56 ± 0.18 ef
BOPI (a) 6.15 2.05 ± 0.72 abcde
1.03 ± 0.36 cb
BOPI (b) 5.58 2.48 ± 0.58 abc
0.85 ± 0.29 bcde
Dust (I) (a) 5.58 1.24 ± 0.64 f 0.70 ± 0.28
cdef
Dust (I) (b) 6.2 1.64 ± 0.85 def
0.86 ± 0.24 bcde
Dust (a) 6.35 1.68 ± 0.48 def
0.63 ± 0.18 def
Dust (b) 6.06 2.65 ± 0.75 ab
1.15 ± 0.39 b
OPI (a) 5.38 2.24 ± 0.63 abcd
0.82 ± 0.28 bcde
OPI (b) 5.64 2.04 ± 0.70 abcde
0.78 ± 0.36 cde
Pekoe (a) 5.34 1.93 ± 0.66 bcdef
0.96 ± 0.33 bcd
Pekoe (b) 6.24 1.73 ± 0.80 cdef
0.65 ± 0.18 def
Gre
en
te
a
Chunmee (I) 6.19 1.20 ± 0.38 q 0.28 ± 0.10
stu
Chunmee (II) 7.59 2.00 ± 0.70 p 0.63 ± 0.22
pq
Fanning's 7.15 0.55 ± 0.19 r 0.79 ± 0.19
p
Gun Powder 7.15 0.70 ± 0.22 r 0.40 ± 0.09
rs
Hyson 6.36 0.66 ± 0.19 r 0.42 ± 0.15
rs
OPA 7.14 0.69 ± 0.43 r 0.37 ± 0.11
rs
Sp. Hyson 6.62 1.20 ± 0.41 q 0.32 ± 0.20
stu
Ceylon Sen.OPA 6.58 0.55 ± 0.19 r 0.59 ± 0.20
q
Ceylon Tencha 7.72 0.38 ± 0.12 r 0.25 ± 0.09
s
Cut twist curl (CTC)
7.14 0.35 ± 0.11 r 0.52 ± 0.21
qr
Note: Values are mean (n=9) ± standard deviation (SD). Values with the same superscript letter within each column and within each black and green tea categories are not significantly different (p≤0.05). Bold letters are for the best tea samples with lowest MIC values in each of black and green tea for each bacterium. Black and green tea samples were analized seperatly.
In our study, MRSA was more sensitive than that of MS for all tea brews of all tea grades. From tested black tea samples Dust (I) a and BOP grade had the

Proceedings of the Young Scientist Forum Symposium
64
best antibacterial activity with the 1.24 mg mL-1 and 0.38 mg mL-1 MIC values for MS and MRSA respectively. BOPF (a) tea sample had the lowest antibacterial activity for MS from the tested black teas with 2.78 mg mL-1 MIC value. Although dry matter content of BOPF (a) was highest, it may consist of less amount of active ingredients of BOPF (a) sample. Therefore, its antibacterial activity of BOPF (a) may be low. BOPF (b) was the sample with the lowest antibacterial activity for MRSA with the 1.72 mg mL-1 MIC value. The properties of tea which inhibit bacterial growth are mainly related to their polyphenolic components. In vivo and in vitro investigations have observed the beneficial effect of green tea catechins in the treatment of periodontal disease which is caused by mainly Porphyromonas gingivalisand, Tannerella forsythia and Actinobacillus actinomycetemcomitans. The best antibacterial activity was shown by the CTC green tea and Ceylon Tencha green tea with 0.35 and 0.25 mg mL-1 MIC values for MS and MRSA species respectively. Almost all green tea samples had higher antibacterial activity for both bacteria strains than those of black tea. The lowest inhibition activity measured by the MIC for green teas for MS and MRSA were shown by the Chunmee(II) green tea (2.00 mg mL-1) and Fanning’s green tea (0.79 mg mL-
1), respecively.
Conclusions and Recommendations Both Sri Lankan green and black tea brews have good antibacterial activity against MS and MRSA bacteria species. However, a detailed biological and phytochemical studies are needed to find out the chemical constituents responsible for their activities. The antibacterial compounds in tea should be seperated and purified. Antibacterial activity of purified compounds should be further tested for MRSA and MS bacteria. Acknowledgement The authors are grateful for the financial support provided by the TURIS grant, University of Ruhuna, Sri Lanka (RU/DVC/PRO/139). Special thanks to Melfort Green Teas (Pvt) Ltd, Peliyagoda, Sri Lanka for supplying green tea samples.
References Anonymous (1980) ISO 3103: Tea Preparation of Liquor for Use in Sensory Tests,
International Organization for Standardization, Geneva, Switzerland. 1- 4. Kelegama S (2010) The case for liberalization of tea imports for increasing value
addition and enhansing tea exports of Sri Lanka. Nascimento GGF, Locatelli J, Freitas PC, Silva GL (2000) Antibacterial activity of plant
extracts and phytochemicals on antibiotic-resistant bacteria. Brazilian Journal of Microbiology 31:247-256.
Satyajit DS, Nahar L, Kumarasamy Y (2007) Microtitre plate-based antibacterial assay incorporating resazurin as an indicator of cell growth, and its application in the in vitro antibacterial screening of phytochemicals. Methods 42: 321-324.

Proceedings of the Young Scientist Forum Symposium
65
PREPARATION OF MICROWAVE IRRADIATED CELLULOSE BASED BIODEGRADABLE SUPPER ABSORBENT POLYMER (SAP) FOR
AGRICULTURAL APPLCAITIONS
T.N. Fernando1, A.G.B. Aruggoda1*, C. K. Disanayaka2 and S. Kulathunge2
1 Department of Agricultural and Plantation Engineering,
Faculty of Engineering Technology, the Open University of Sri Lanka, Nawala, Nugegoda
2Atomic Energy Authority, No 60/460, Baseline road, Orugodawatta, Wellampitiya,
Colombo, Sri Lanka
Introduction Superabsorbent polymers (SAPs) are highly swollen, hydrophilic polymer networks, capable of absorbing 400-1500 g of water per dry gram of SAP is having the possibility of applying on wide range of industries such as agricultural, medicinal, environmental, horticultural etc. Cellulose based biomaterials could be used as raw materials for developing SAP with high biodegradability, high strength after absorbing water, less water soluble components, strong water retaining ability and mould proofing ability (Czaja et al. 2007). Therefore, SAP from cellulose is cheap and superior in performance. Most agricultural residues such as corn stove, wheat straw, rice straw and bagasse which referred as lignocellulosic materials, are rich in cellulose fibers. Microwave technology is a green method for chemical synthesis of cellulose because of its high efficiency and homogenous nature of heating. The present study focused on synthesizing SAP by graft copolymerization of cellulose from bagasses and acrylic acid, using N, N- MethyleneBisAcrylamide (MBA) as a cross linker and Potassium persulfate (K2S2O8/KPS) as an initiator in an aqueous solution under microwave irradiation. Materials and Methods Cellulose was prepared by using alkaline pretreatment method as described by Feng et al. (2010) and it’s percentage was determined using chlorinated method as described in Google Book (2014). SAP was prepared using a set up as described in Figure 01. Certain amount of MBA, Acrylic acid and 5 mol L-1 NaOH solutions were mixed and kept in an ice bath until use. 1.0 g of bagasse cellulose and 50 mL of de- ionized water were added to the vacuum flask. Temperature was adjusted to 150 oC and content inside was stirred continuously. Simultaneously oxygen free nitrogen gas was bubbled in to the solution for 30 minutes. Thereafter, certain amount of KSP was added and stirred continuously for 15 minutes by reducing the temperature to 90 oC. Pre
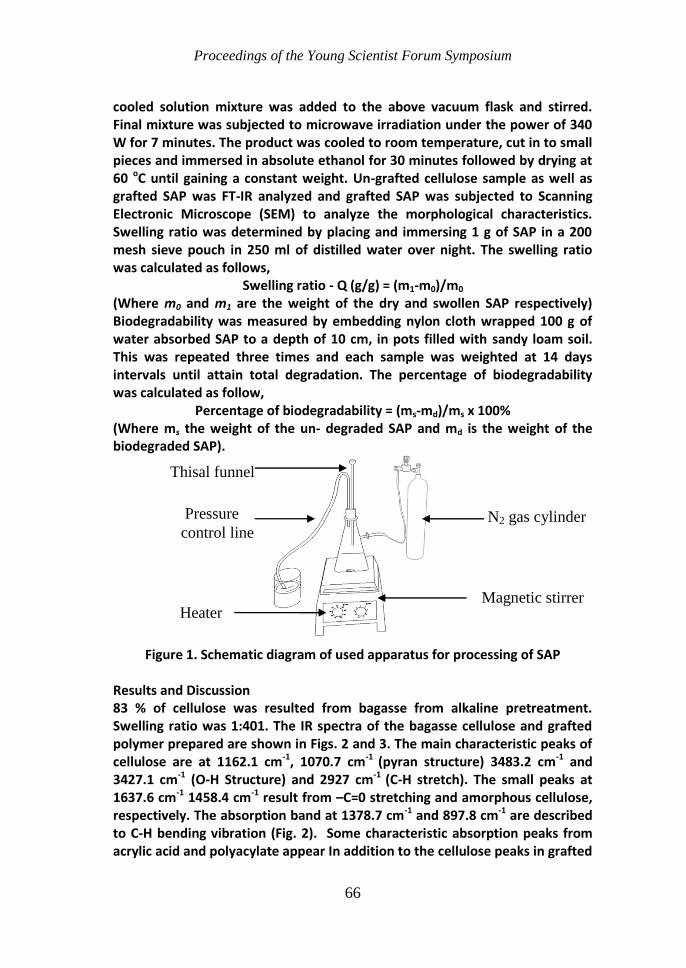
Proceedings of the Young Scientist Forum Symposium
66
cooled solution mixture was added to the above vacuum flask and stirred. Final mixture was subjected to microwave irradiation under the power of 340 W for 7 minutes. The product was cooled to room temperature, cut in to small pieces and immersed in absolute ethanol for 30 minutes followed by drying at 60 oC until gaining a constant weight. Un-grafted cellulose sample as well as grafted SAP was FT-IR analyzed and grafted SAP was subjected to Scanning Electronic Microscope (SEM) to analyze the morphological characteristics. Swelling ratio was determined by placing and immersing 1 g of SAP in a 200 mesh sieve pouch in 250 ml of distilled water over night. The swelling ratio was calculated as follows,
Swelling ratio - Q (g/g) = (m1-m0)/m0
(Where m0 and m1 are the weight of the dry and swollen SAP respectively) Biodegradability was measured by embedding nylon cloth wrapped 100 g of water absorbed SAP to a depth of 10 cm, in pots filled with sandy loam soil. This was repeated three times and each sample was weighted at 14 days intervals until attain total degradation. The percentage of biodegradability was calculated as follow,
Percentage of biodegradability = (ms-md)/ms x 100% (Where ms the weight of the un- degraded SAP and md is the weight of the biodegraded SAP).
Figure 1. Schematic diagram of used apparatus for processing of SAP
Results and Discussion 83 % of cellulose was resulted from bagasse from alkaline pretreatment. Swelling ratio was 1:401. The IR spectra of the bagasse cellulose and grafted polymer prepared are shown in Figs. 2 and 3. The main characteristic peaks of cellulose are at 1162.1 cm-1, 1070.7 cm-1 (pyran structure) 3483.2 cm-1 and 3427.1 cm-1 (O-H Structure) and 2927 cm-1 (C-H stretch). The small peaks at 1637.6 cm-1 1458.4 cm-1 result from –C=0 stretching and amorphous cellulose, respectively. The absorption band at 1378.7 cm-1 and 897.8 cm-1 are described to C-H bending vibration (Fig. 2). Some characteristic absorption peaks from acrylic acid and polyacylate appear In addition to the cellulose peaks in grafted
N2 gas cylinder
Thisal funnel
Pressure
control line
Heater Magnetic stirrer

Proceedings of the Young Scientist Forum Symposium
67
cellulose (Fig. 3). The peak at 1718.1 cm-1 corresponded to the carboxyl absorption from grafted Poly Acrylic Acid (PAA). Furthermore, the bands at 1577.2 cm-1, 1399.6 cm-1 and 1419 cm-1 corresponded to the sodium carboxyl group indicating the PAA (Na) grafting to cellulose. SEM indicates clear inter connected porous surface in SLSAP (Fig. 1). This surface morphology may accelerate the penetration of water into the polymer network. Biodegradability of SAP under average soil temperature of 29 °C and at 10 cm depth in soil and with the average environment temperature 32 °C was shown in Fig. 4. The SAP was degraded by about 81.45 % at incorporated sandy loam soil in 56 days.
Figure 2. FT-IR spectra of un-graft cellulose
Figure 3. FT-IR spectra of graft SAP

Proceedings of the Young Scientist Forum Symposium
68
Plate 1. SEM diagram of grafted SAP Figure 4. Biodegradability of Cellulose grafted SAP with time
Time (Days)
Bio
deg
rad
abili
ty (%
)
Modified microwave oven was used to produce SAP Feng et al. (2010). The whole procedure had done under the microwave power of 160 W. In the present experiment, conventional heating as well as microwave irradiation were used for SAP development. 340 W microwave power was used for irradiation process according to results of Jing et al. (2011). According to the definitions of SAP, 400-1500 g of swelling recommended by it’s own dry weight. Swelling ratio of the SAP has reached this super absorbent range. Further, due to high biodegradability within 56 days it can be recommended as environment friendly material. According to Feng et al. (2010) high temperature may improve the activation of some microorganisms and accelerate the biodegradation and furthermore, the porous structure allows microorganisms to go easily inside the network, which also favors its biodegradation. Conclusions and Recommendations SAP prepared by graft polymerization of acrylic acid onto the chain of cellulose from bagasse under microwave irradiation. The grafted product was biodegradable, had a porous structure and swelled 401 times on its own dry weight with distilled water. References Czaja WK, Young DJ, Kaweeki M (2007) Biomacromolecules 8: 1-12. Feng H, Li J and Wang L (2010) Preparation of biodegradable flax shive cellulose based
superabsorbent polymer under microwave irradiation. Bio Resources 5: 1484-1495
Google Books (2014) Green Chemistry for Environmental Remediation. [ONLINE] Available at: http://books.google.lk/. [Accessed 13 February 2014].
Jing S, Li XJ, Zhao D (2011) Microwave irradiated preparation of superabsorbent resin by grafted copolymerization of cellulose and acrylic acid/ acrylamide. Advanced Materials 148-149:799-802.

Proceedings of the Young Scientist Forum Symposium
69
AMPLIFIED FRAGMENT LENGTH POLYMORPHISM GENOME SCAN TO REVEAL SELECTION SIGNATURES IN ASIAN TIGER MOSQUITO
(Aedes albopictus)
G. H. Galhena1*, M. A. Shaw2 and R. Butlin3
1Department of Zoology, University of Colombo, Sri Lanka
2Institute of Integrative and Comparative Biology, University of Leeds, UK
3Department of Animal and Plant Sciences, University of Sheffield, UK
Introduction Aedes albopictus (Skuse), commonly known as the Asian tiger mosquito is recognized worldwide for its medical importance. It shows an aggressive daytime human-biting behavior and transmits many viruses, including dengue, LaCrosse, and West Nile. In Sri Lanka, the mosquito is largely responsible for the dengue epidemics in both peri-urban and rural settings. Since it was first recorded from India, it has undergone a dramatic global expansion facilitated by human activities. Due to its successive colonization of various habitat types, it is now listed as one of the top 100 invasive species by the Invasive Species Specialist Group, and is considered to be the most invasive mosquito species. This successful invasion of A. albopictus is mainly attributed to its ecological plasticity and strong competitive aptitude. Genomic scans are useful in identifying potential adaptive loci under selection at the genomic level. All loci across the genome are anticipated to possess similar demography and neutral evolution history of populations, including genetic drift and gene dispersal. If variation of a locus is beyond the genomic pattern with an unusual frame of higher genetic differentiation, it is deemed an ‘‘outlier locus’’ under natural selection. The outlier locus can be identified explicitly in the genes under selection and also in neutral flanking regions due to hitchhiking effects. Amplified fragment length polymorphisms (AFLPs) are reported to be the most efficient molecular approach to identify candidate genomic regions under selection. As such current study was aimed to identify the candidate loci under selection in A. albopictus in Sri Lanka, using an AFLP genome scan to understand the extent of its adaptive evolution in relation to current and historical mosquito control strategies.
Materials and Methods Fourth stage larvae of A. albopictus were collected (n = 512) using standard dipping method in dengue endemic areas. Collections were made in a hierarchical manner on a logarithmic scale ranging from 1 m to 100 km. Accordingly 16 villages belonging to four regions in Sri Lanka (i.e. Colombo, Kandy, Anuradhapura and Pollonnaruwa) were sampled covering eight sites

Proceedings of the Young Scientist Forum Symposium
70
per village. Only four randomly selected larvae were taken from each container after identification up to the species level with the aid of morphological identification keys of Aedes larvae. Samples were preserved in absolute alcohol and were stored at 4 °C. Genomic DNA was extracted using phenol chloroform method. The AFLP procedure was carried out based on Vos et al. (1995) with following modifications: Genomic DNA was digested with EcoRI and MseI for 3 hours at 37 °C and immediately followed by ligation with EcoRI and MseI adapters overnight at 16 °C. Diluted ligated products were used as a template to conduct the pre-amplification. Each ligated product was amplified twice with two different primer combinations (Combination-1; EcoRI+A and MseI+C, Combination-2; EcoRI+T and MseI+C). The pre-amplification reaction was carried out for 20 cycles of 30 seconds (s) at 94 °C, 30 s at 56 °C and 1 min at 72 °C with a final extension of 10 min at 72 °C. Diluted (10x) pre-amplified products were used as templates for the selective PCR amplifications conducted with five primer combinations. Pre-amplification primer combination-1 was subjected to three selective amplifications (Mse1_CAC, Mse1_CGA and Mse1_CTC with EcoR1_TCT), combination-2 was subjected to two selective amplifications (Mse1_CTG and Mse1_CAT with EcoR1_ ATC). Each selective EcoR1 primer was fluorescent-labeled at 5`end. Thermal cycling program was 94 oC for 2 min followed by 10 cycles of 94 oC for 20 s, 66 oC for 30 s with temperature decrease of 1 oC per cycle and 72 oC for 2 min. Another 25 cycles were carried out in the sequence of 94 oC for 30 s, 56 oC for 30 s and 72 oC for 3 min before a final extension of 30 min at 60 oC. All selective PCR products were immediately transferred and kept at -20 oC until they were run in the DNA sequencer within the course of 5 days. The selective PCR products were separated by electrophoresis on an ABI 3130 XL automated sequencer (Applied Biosystems) with a ROX-500-labeled internal size standard (Applied Biosystems). Software GeneMapper 3.7 (Applied Biosystems) was utilized to collect and score fluorescent AFLP data. Altogether 557 polymorphic AFLP fragments were scored for presence (1) or absence (0) to establish the matrix of genetic identity of the sampled individuals. Outlier loci were tracked using the program Dfdist. Samples were run assuming a total of 32 demes representing the subpopulations occupying the 16 villages. The null distribution was generated, based on 10,000 simulated loci, with a mean Fst similar to the trimmed mean Fst calculated from the empirical distribution: Trimmed mean Fst is computed by removing the 30% highest and lowest Fst values observed in the empirical data set and thus is an estimate of the average “neutral” Fst value uninfluenced by outlier loci. Analyses were performed at 99 % confidence levels. Heterozygosity for each village was calculated using HICKORY v 1.0.4.

Proceedings of the Young Scientist Forum Symposium
71
Results and Discussion Forty nine loci were identified as potential outliers having Fst values outside the simulated 0.99 quantiles. The 10,000 simulated loci were built up in 10 different runs, since the program did not allow simulating them together for all 16 villages. Consequently, during each run 1000 loci were simulated and the empirical data set was compared with each set of simulated loci to detect outliers. An example plot corresponding to a single run is provided in Fig. 1. The simulated mean Fst value varied from 0.0503 to 0.0541 during the ten runs. The observed mean Fst from the Dfdist program for all 16 populations was 0.04876. Eighteen loci were consistently observed outside of the 0.99 quantiles across all runs and were regarded as true outliers corresponding to real selection signatures. They represent 3.2 % of the total polymorphic loci (557) detected. The fragment sizes and Fst values of these loci are presented in Table 1. The remaining 31 loci which did not show consistent outlier behavior during the ten runs might represent false positives. Such loci might exhibit a variation pattern in the tail of the neutral distribution simply by chance (type I error), due to statistical bias or due to some degree of departure between the simulated and the empirical data. However, such outlier loci due to chance are not expected to exhibit parallel trends in several comparisons while true outliers would stand out in each comparison. It is further possible that demographic events like bottlenecks to produce apparent selection signatures. The relatively high heterozygosity estimates which ranged from 0.24 to 0.26 within the tested 16 village populations make genetic bottlenecks an unlikely event. Hence, the 18 loci identified as true outliers might represent loci under directional selection or those that are linked to genomic areas that are under directional selection. Although the actual cause of this outlier behavior cannot be inferred without perusing these loci further, it is possible at least some of these loci could represent insecticide resistant genes. Other sources of diversifying selection which might have caused the outlier behavior might include odor reception, parasitic pressures and sexual selection. Conclusions and Recommendations This is the first report on detection of selection signatures by genome scan in A. albopictus. As observed 3.2 % of candidate loci are under diversifying selection, indicating that A. albopictus is indeed undergoing local adaptation. This might in part reflect the pressure put on the mosquito genome as a result of continues mosquito control campaigns. In order to discern the exact cause of selection pressure and to identify the genes under adaptive evolution, AFLP bands need to be sequenced and matched to their corresponding genomic locations which would be a future extension of this study.

Proceedings of the Young Scientist Forum Symposium
72
F ST
Figure 1. Example plot corresponding to a single run in Dfdist drawn between FST and heterozygosity showing outlier loci: Each dot indicates an AFLP locus while outliers are presented as red dots. The line immediately below the outlier loci represents the 99 % confidence interval. Table 1. AFLP Loci under diversifying selection
Marker Fragment length (bp) FST
EcoR1_ ATC & Mse1_CTG 136 0.2487 EcoR1_ ATC & Mse1_CTG 225 0.1351 EcoR1_ ATC & Mse1_CAT 190 0.1485 EcoR1_ ATC & Mse1_CAT 281 0.1476 EcoR1_ ATC & Mse1_CAT 292 0.1477 EcoR1_TCT & Mse1_CGA 192 0.1151 EcoR1_TCT & Mse1_CGA 300 0.1385 EcoR1_TCT & Mse1_CGA 422 0.3111 EcoR1_TCT & Mse1_CTC 105 0.1366 EcoR1_TCT & Mse1_CTC 131 0.1326 EcoR1_TCT & Mse1_CTC 147 0.1476 EcoR1_TCT & Mse1_CTC 182 0.1474 EcoR1_TCT & Mse1_CTC 193 0.2381 EcoR1_TCT & Mse1_CTC 228 0.2547 EcoR1_TCT & Mse1_CTC 232 0.1694 EcoR1_TCT & Mse1_CTC 316 0.1364 EcoR1_TCT & Mse1_CTC 382 0.1573 EcoR1_TCT & Mse1_CAC 269 0.1970
References Amarasingha FP (1995) Illustrated keys to the genera of mosquitoes (Diptera:
Culicidae) in Sri Lanka. Journal of National Science Council Sri Lanka 23:183-211.
Beaumont MA, Balding DJ (2004) Identifying adaptive genetic divergence among populations from genome scans. Molecular Ecology 13:969-980.
Vos P, Hogers R, Bleeker M, Reijans M, Lee TVD, Hornes M, Friters A, Pot J, Paleman J, Kuiper M, Zabeau M (1995) AFLP: a new technique for DNA fingerprinting. Nucleic Acid Research 23:4407-4414.
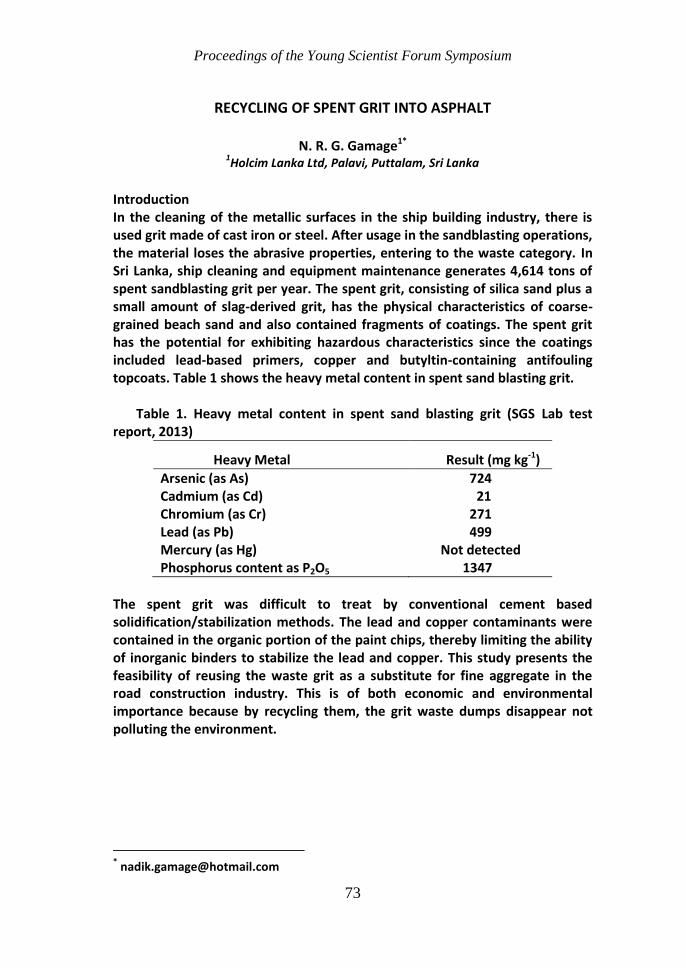
Proceedings of the Young Scientist Forum Symposium
73
RECYCLING OF SPENT GRIT INTO ASPHALT
N. R. G. Gamage1* 1Holcim Lanka Ltd, Palavi, Puttalam, Sri Lanka
Introduction In the cleaning of the metallic surfaces in the ship building industry, there is used grit made of cast iron or steel. After usage in the sandblasting operations, the material loses the abrasive properties, entering to the waste category. In Sri Lanka, ship cleaning and equipment maintenance generates 4,614 tons of spent sandblasting grit per year. The spent grit, consisting of silica sand plus a small amount of slag-derived grit, has the physical characteristics of coarse-grained beach sand and also contained fragments of coatings. The spent grit has the potential for exhibiting hazardous characteristics since the coatings included lead-based primers, copper and butyltin-containing antifouling topcoats. Table 1 shows the heavy metal content in spent sand blasting grit. Table 1. Heavy metal content in spent sand blasting grit (SGS Lab test report, 2013)
Heavy Metal Result (mg kg-1)
Arsenic (as As) 724 Cadmium (as Cd) 21 Chromium (as Cr) 271 Lead (as Pb) 499 Mercury (as Hg) Not detected Phosphorus content as P2O5 1347
The spent grit was difficult to treat by conventional cement based solidification/stabilization methods. The lead and copper contaminants were contained in the organic portion of the paint chips, thereby limiting the ability of inorganic binders to stabilize the lead and copper. This study presents the feasibility of reusing the waste grit as a substitute for fine aggregate in the road construction industry. This is of both economic and environmental importance because by recycling them, the grit waste dumps disappear not polluting the environment.

Proceedings of the Young Scientist Forum Symposium
74
Materials and Methods Spent grit (Fig. 1) sample was sieved and particle size distribution is shown in Fig. 2.
Figure 2. Particle size distribution of used sand blasting grit
Figure 1. Spent Grit sample
Three asphalt samples were made by replacing 5 % of fine aggregate with grit. The quantity of Grit and rock was used as shown in Table 2. 4.76 % bitumen content was selected as it was the optimum bitumen percentage for that type of rock. Table 2. Quantity of grit, rock and bitumen in asphalt
Bitumen
Aggregate
type
Total aggregate
weight
Sieve Size (mm)
% weight 20 10 5 2.4 1.2 0.6 0.3 0.15 0.075 Pan
4.76 57.1 Rock 1082 (90%) 11 201 199 205 81 80 71 89 84 60
Grit 60 (5%) 32 28
Total Aggregate weight 1143
Total Asphalt 1200
Marshall Stability and flow of asphalt samples (Fig. 3) was measured and calculated.
Figure 3. Asphalt sample
Toxicity Characteristic Leaching Procedure (TCLP) was performed for asphalt sample. The aim of this work has been to investigate leaching of asphalt that

Proceedings of the Young Scientist Forum Symposium
75
may have an influence on the release of trace elements such as chromium, zinc and manganese, magnesium that are regarded as pollutants. Results and Discussion Based on the results in Table 3, it was observed that 5 % (weight percentage of total mixture) of grit can be fed into asphalt by maintaining required parameters of asphalt. Table 3. Marshall Stability and Flow of Asphalt sample
There are four bins in asphalt plant having less than 4 mm, 7.5 mm, 16 mm and 24 mm particle size respectively. Spent Grit can be fed into bin 1 (less than 4 mm particle) using front end loader by 13 % of total weight of bin 1. Balance percentage would be normal 87 % fine aggregate as rock. Average Asphalt production per day (average plant) = 500 MT Grit consumption per day = 25 MT Number of plant working days per year = 200 Grit consumption per year (single average plant) = 5,000 MT Based on the above results, total ship building industry in Sri Lanka spent grit would be consumed by one average plant itself. There are five layers of road construction; 200 mm thickness of Gravel layer is laid on the soil first and then 150 mm of Aggregate Base Coat (ABC) is spread on it. After that there is a prime coat which is a bitumen layer. Then Tack coat is applied and after that asphalt is put on it. Bitumen is a binding agent and it is insoluble in water. So Tendency of leaching of asphalt is very low. Furthermore, bitumen is highly impermeable to the passage of water. As asphalt layer would be above the bitumen layer (prime coat) it is confirmed that there is no tendency of any leachate coming out of asphalt.
Specification No : ASTM - D - 1559 -76
No. of Blows : 75, each face
Sample No:
Bitumen % by wt of Mix
Specimen height (mm)
Specimen wt.
Bulk volume
(cm3)
Bulk Specific Gravity (gcm-3)
Marshall Stability
in air (g)
Saturated Surface Dry (g)
in water (g)
Measured (kN)
Correc-tion Factor
Corrected (kN)
Flow (0.25 mm)
A 4.76 60.0 1192 1192.4 707.2 485.2 2.46 14.45 1.09 15.75 12
B 4.76 59.0 1187 1187.8 703.9 483.9 2.45 14.91 1.09 16.25 12
C 4.76 60.0 1187 1188.0 705.1 482.9 2.46 12.48 1.09 13.60 6
Average 2.457 15.20 10
Marshall Stability / kN = Min 8; Marshall Flow/0.25mm = Min 8 Max 16 (As per RDA specifications)

Proceedings of the Young Scientist Forum Symposium
76
Table 4. TCLP Test Results (ITI Lab test report, 2013)
Test/unit Test method Test values (mgL-1)
Limit of detection (mgL-1) Lead (as Pb)
AAS/Flame
Not detected
0.1 Cadmium (as Cd)
Not detected
0.02 Chromium (as Cr)
Not detected
0.05 Copper (as Cu) Not
detected 0.05
Barium (as Ba) Not detected
0.5 Antimony (as Sb)
Not detected
0.5 Zinc (as Zn) 0.27 Arsenic (as As)
AAS/VGA Not
detected 0.001
Selenium (as Se) Not detected
0.001 Mercury (as Hg) Not
detected 0.001
Note: AAS - Atomic Absorption Spectrometry VGA - Vapor Generation Accessory
As per results in Table 4, only Zinc was detected as leachable metal tested by the Toxicity Characteristic Leaching Procedure (TCLP) but it is well below the regulatory limit. Regulatory limit for same is 5 mg L-1 maximum. So the leachable metals tested by the TCLP test did not exceed regulatory limits. Conclusions and Recommendations Based on the results of Marshall Stability test and TCLP test, it was concluded that 5 % of spent grit can be fed into asphalt by maintaining required physical performance characteristics of asphalt as well as disposal the spent grit environmental friendly manner. References ITI Lab Test Report (2013) ITI, Available at Holcim Lanka Ltd, Palavi, Puttalam. SGS Lab Test Report (2013) SGS Lanka Pvt Ltd, Report no : 4665012230. Available at
Holcim Lanka Ltd, Palavi, Puttalam.

Proceedings of the Young Scientist Forum Symposium
77
EFFECT OF NITROGEN ON GROWTH AND OIL CONTENT OF Chlorella vulgaris FOR BIODIESEL PRODUCTION
A.M. Gammanpila1*, C.P. Rupasinghe1 and S. Subasinghe2
1Department of Agriculture Engineering, Faculty of Agriculture, University of Ruhuna,
Mapalana, Kamburupitiya, Sri Lanka 2Department of Crop Science, Faculty of Agriculture, University of Ruhuna, Mapalana,
Kamburupitiya, Sri Lanka
Introduction Petro-diesel fuel has been used as a source of energy since many years. However, it is understood that the petroleum reserves are to be depleted in less than 50 years at the rate of present consumption. Further, the use of mineral oil has several negative environmental effects, such as emission of greenhouse gases. In recent years biodiesel has received considerable attention as a biodegradable and renewable source of energy. It can be produced from renewable biomass by transesterification of triglycerides. Production of biodiesel from microalgae is a newly emerging field because of their high oil content and rapid biomass production. Microalgae are photosynthetic microorganisms which convert sunlight, water and CO2 to sugars, from which macromolecules such as lipids and Triacylglycerols (TAGs) are synthesized. Some of the species of microalgae already possess high oil concentration and they can be manipulated to produce more oil. A number of factors have been shown to influence the oil concentration of algae, such as nitrogen deficiency, phosphate limitation and temperature fluctuation. Nutrient deficiency, on the other hand, is a major limiting factor in the cultivation of microalgae as it directly impacts on the cellular metabolic activities and biochemical constituents, thereby creating a physiological imbalance which ultimately results in lower photosynthetic activity and slower growth. The present study was conducted to investigate the growth response and oil content of a green alga, Chlorella vulgaris, by varying the concentrations of nitrate (NaNO3) in the growth medium with an aim to obtain optimum NaNO3 concentration for biomass cultivation for biodiesel production. Materials and Methods The pure Chlorella vulgaris cultures were grown in 25 ppt (parts per thousand) saline water in an outdoor culture system under protected house for 32 days growth period. The medium used for cultivation was Guillard and Ryther’s modified F/2 media. The original nitrogen source concentration in

Proceedings of the Young Scientist Forum Symposium
78
the Guillard and Ryther’s modified F/2 media was 0.075 gLˉ1 of NaNO3. The experiment was performed with three treatments, such as; half concentration of original, original concentration and double of the original concentration. The cultures were aerated with mechanical aerators. All the glassware and media were sterilized prior to inoculation. All the experiments were carried out in triplicates. Cell growth analysis: Optical density (O.D) measurement at 665 nm was used to monitor cell growth by UV/visible spectrophotometer (Shimatzu, Japan) three times per week. All cultures were initiated with an O.D. of about 0.18. Based on the constructed calibration curve (R2= 0.9428), the numbers of cells were determined with relevant to the measured O.D. Oil extraction: The cells were harvested at the stationary phase by chemical flocculation using 0.1 g of FeCl3 L
-1. The cells were washed once with distilled
water and dried in an oven for 6 hours at 105 C for dry weight estimation. The oil content of the dried algae samples were then determined using Soxhlet apparatus. Statistical analysis: The statistical analysis was done by using Minitab 14 version. One-way Analysis of Variance (one-way ANOVA) was performed at 95 % level of probability in order to test the significance differences of oil content and growth performances under different NaNO3 concentrations. When the test resulted p < 0.05 a Turkey post-hoc test was performed for pair wise comparisons. Results and Discussions Figure 1. Growth curve of Chlorella vulgaris grown in Guillard and Ryther’s modified F/2 medium with different initial NaNO3 concentration Fig. 1 shows the growth curve of Chlorella vulgaris grown in Guillard and Ryther’s modified F/2 medium with different concentrations of NaNO3 in the medium.
0
5000
10000
15000
20000
25000
30000
0 5 10 15 20 25 30 35
Nu
mb
er
of
cells
(×
10
6)
Culture period (Days)
0.0375 g
0.075 g
0.15 g Lˉ1 0.15 gL-
1
0.075
gL-1

Proceedings of the Young Scientist Forum Symposium
79
As evident from the graph, by increasing the NaNO3 concentration, growth of Chlorella vulgaris also increased. At day 32, maximum number of cells (27286 × 106) was recorded in the culture with double the concentration of nitrate (0.15 gLˉ1). Number of cells in the culture medium with half of the original nitrate concentration (0.0375 gLˉ1) decreased initially and enters to lag phase after 25 days. Table 1 shows the dry biomass and lipid extraction results of the Chlorella vulgaris cultures grown in different nitrate concentrations. Table 1. Dry biomass, oil content and oil yield of the Chlorella vulgaris cultures grown in different NaNO3 concentrations
NaNO3 Concentration
(g Lˉ1)
Dry biomass (g Lˉ1)
Oil content (%) Oil yield (g Lˉ1)
0.0375 1.14 ± 0.07a 21.01 ± 1.09a 0.24 ± 0.01a 0.075 1.66 ± 0.14b 18.30 ± 0.26b 0.30 ± 0.02b 0.15 2.32 ± 0.08c 13.83 ± 0.98c 0.32 ± 0.02b
Note: a, b, c indicate the values which were significantly different at p<0.05. Dry biomass and the percentage oil contents in the cultures with different NaNO3 concentrations were significantly different (p<0.05). Cultures with highest nitrate concentration (0.15 gLˉ1) resulted significantly a higher dry biomass but significantly lower percentage oil content than the other cultures. A significantly highest oil accumulation and lowest dry biomass was recorded when the cultures were grown at half the original nitrate concentration (0.0375 gLˉ1). However, the oil yield at half the original nitrate concentration was significantly lower than other treatments. According to the results, Chlorella vulgaris growth is directly proportional to the concentration of NaNO3 in the medium. As nitrate concentration increased in the medium, enhancement in biomass concentration was recorded and an increasing trend is observed in oil content as the nitrate
concentration decreased. This result is in accordance with that of Nigam et al. (2011). They reported a loss of biomass and higher oil accumulation when green alga, Chlorella pyrenoidosa was exposed to nitrogen deficient conditions. Further, it was reported that, transferring cells to nitrogen-free medium, with no nitrogen source also led to an increase in oil content of 4% against control. It has earlier been found that under nitrogen starvation conditions, nitrogen containing macromolecules and carbon reserve compounds like carbohydrates and fats are accumulated.

Proceedings of the Young Scientist Forum Symposium
80
According to the results, it can be concluded that, nitrogen starvation in the culture medium can enhance the oil content of Chlorella vulgaris but lower the growth rate and hence decrease the final oil yield. Acknowledgement Financial assistances by National Research Council Research grants (11-195) References Dayananda C, Sarada R, Shamala TR, Ravishankar GA (2006) Influence of nitrogen
sources on growth, hydrocarbon and fatty acid production by Botryococcus braunii. Asian Journal of Plant Sciences 5: 799-804.
Guillard RRL (1975) Culture of Phytoplankton for Feeding Marine Invertebrates. Plenum Press, New York, New York.
Huang G, Chen F, Wei D, Zhang X, Chen G (2010) Biodiesel production by microalgal biotechnology. Applied Energy 87: 38 - 46.
Makarevičienė V, Andrulevičiūtė V, Skorupskaitė V, Kasperovičienė J (2011) Cultivation of microalgae Chlorella sp. and Scenedesmus sp. as a potentional biofuel feedstock. Environmental Research, Engineering and Management 3: 21 – 27.
Nigam S, Rai MP, Sharma R (2011) Effect of Nitrogen on growth and lipid content of Chlorella pyrenoidosa. American Journal of Biochemistry and Biotechnology 7: 124-129.
Proceedings of the Young Scientist Forum Symposium
81
MOLECULAR CYTOGENETIC CHARACTERIZATION OF THE FIRST REPORTED SRI LANKAN CHILD WITH A DE NOVO 9P INVERTED
DUPLICATION (p13.3p23)
I.U.H. Godapitiya1, I. Kariyawasam1, V. Udalamaththa1, U.N.D. Sirisena1 and V.H.W. Dissanayake1*
1Human Genetics Unit, Faculty of Medicine, University of Colombo
Introduction Compared to other rare chromosomal disorders, duplication of the short arm of chromosome 9 (partial trisomy 9p) is not uncommon. With the first reported case in 1970 more than 150 patients have been reported so far. After abnormalities in chromosomes 21, 18, and 13, trisomy 9p is the fourth most common chromosome anomaly in a live-born. In most reported patients, the trisomic segment of 9p duplications was transmitted from a parent carrying a reciprocal balanced translocation and only a few were due to de novo duplications. Patients with partial trisomy of the short arm of chromosome 9 often present a wide spectrum of phenotypic features including developmental delay, craniofacial abnormalities such as bulbous nose, hypertelorism and limb abnormalities with small nails and fifth-finger clinodactyly. The objective of this study was to perform cytogenetic molecular characterization of a child having dysmorphic features, intellectual disability, delayed bone age, development and speech. Materials and Methods A four year old Sri Lankan male child who presented to the Human Genetics Unit with delayed bone age, development and speech with intellectual disability and dysmorphic features was clinically evaluated. Cytogenetic studies were performed after obtaining ethical approval from the ethics review committee, Faculty of Medicine, University of Colombo. Peripheral venous blood samples were obtained from the child and his parents after obtaining a written informed consent. Metaphase chromosome spreads preparation from peripheral blood lymphocyte cultures and GTL-banding was performed according to standard methods. Thirty metaphase spreads of each parent were captured and analyzed along with twenty metaphase spreads of the child. The maximum band resolution achieved in the child’s spreads was 550 according to the International System of Cytogenetic Nomenclature 2009. Fluorescent in situ Hybridization (FISH) technique was performed on the metaphase chromosome spreads of the child using gene/region specific FISH probes (Empire Genomics) according to the manufacturer’s protocol. The
Proceedings of the Young Scientist Forum Symposium
82
initial cell culture was harvested using standard cytogenetic protocol. The fixative (Carnoy’s 3:1 methanol:acetic acid) in sample tube was changed until supernatant was colourless, then refixed in fresh fixative prior to slide preparation. Three drops of suspension were added to the slide in a vertical angle. The slides were gently rotated to make a thin cell suspension and were kept parallel until a grainy appearance was observed to drain the excess suspension. The BAC clones used for the specific genes were RP11-627M21 for DMRT 1 gene located at 9p24.3 and RP11-145E14 for RMRP gene located at 9p13.3. The probes were fluorescently labeled from the time of manufacture with spectrum Green and spectrum Red respectively. From each of the probe mixtures, 10 μL were added on to the slides (2 μL probe + 8 μL hybridization buffer) separately. A clean 22 × 22 mm cover slip was applied on to each slide and the edges were sealed using rubber cement. The probes were hybridized with metaphase chromosomes in a ThermoBrite Hybridizer; denaturation at
73 C for 2 minutes, followed by hybridizing at 37 C for 16 hours. After the hybridization, the slides were taken and the cover slips were removed and
placed in a pre-warmed WS1 (0.4xSSC/0.3 % NP-40) at 73 C solution and left to stand in WS1 (agitating ~10sec) for exactly 2 minutes. Then the slides were transferred to WS2 (2xSSC/0.1 % NP-40) at room temperature for 1 minute. The slides were dried in the dark, and counterstained with 10 μL of 4’, 6-diamidino-2-phenylindole (DAPI) and covered with 22 × 22 mm cover slips. After 15-30 minutes the slides were visualized and the images were captured using the epifluorescence microscope. Results and Discussion The following dysmorphic features were noted: strabismus, low set anteverted large ears (bat ears), broad nasal root, short philtres, a mouth with downturned corners with a prominent lower lip, short and broad hands with short fingers with 5th finger clindodactyly, bilateral simian creases and micropenis with bilateral testes (Fig. 1). Cytogenetic analysis detected a karyotype of 46, XY, add (9pter) (Fig. 2). All thirty metaphase spreads of each parent showed a normal karyotype. Since it was only thirty spreads were analyzed from each parent, we cannot completely exclude mosaicism but can infer that the child’s karyotype may probably be due to a de novo rearrangement as the parents did not show any phenotypic features. In the FISH analysis, the probe targeting the RMRP gene at 9p13.3 confirmed an inverted duplication 9p and the probe targeting the DMRT1 gene at 9p24.3 terminal verified no terminal deletion/duplication (Fig. 3).

Proceedings of the Young Scientist Forum Symposium
83
Figure 1. Clinical phenotype of the patient: (A) Side view showing frontal bossing (B) front view showing low set anteverted large ears (bat ears), broad nasal root, short philtres, a mouth with downturned corners with a prominent lower lip, (C) short and broad hands with short fingers with 5th finger clindodactyly and bilateral simian creases (D) short leg showing sandal gap (E) micropeniswith bilateral testis.
Figure 2. Identification of the 9p inverted duplication by conventional karyotyping:Ideogram of chromosome 9 showing the normal and the inverted duplicated region (red, green, red markers) and cut-out of the abnormal and normal chromosome 9 in G-banding at a resolution of 550 bands.
Figure 3. Characterization of the 9p inverted duplication by FISH analysis: (A) and (B) FISH analysis using spectrum red for RMRP gene at 9p13.3, (C) and (D) FISH analysis using spectrum green for DMRT 1 gene at 9p24.3. Arrow indicates the inverted duplication of 9p13.3 region.
Hence the final karyotype of the patient after molecular-cytogenetic characterization was 46, XY, ish dup(9)(p13.3p23). So far, de novo duplications of this chromosomal region have previously been described in approximately 15 patients worldwide. To our knowledge this is the first reported case of a child with de novo 9p inverted duplication in Sri Lanka. The 9p22.1; p23 region had been proposed to be the critical region for the 9p duplication syndrome phenotype. Duplications of 9p11.2 to 9p13.1 are believed to be natural chromosome variants with no reported abnormal phenotype. Published reports show that haplo insufficiency of DMRT 1, 2, and 3 results in gonadal abnormalities in the male. Even though in our patient the expected FISH signals for DMRT 1 gene were seen, we can suggest that due to the inversion of the duplicated segment which has involved the 9p terminal region may have disrupted one of the above mentioned genes in order to give the micropenis phenotype.

Proceedings of the Young Scientist Forum Symposium
84
Conclusions and Recommendations We can imply that the phenotypic features observed in this child are in concordance with the spectrum of clinical features seen in children with duplication of the 9p22.3-p23 critical region. Further genetic evaluation with advanced molecular cytogenetic techniques such as microarray along with FISH for break point analysis would be useful to confirm the diagnosis and to identify the affected genes. References Bonaglia MC, Giorda R, Carrozzo R, Roncoroni ME, Grasso R, Borgatti R, Zuffardi O
(2002) 20-Mb duplication of chromosome 9p in a girl with minimal physical findings and normal IQ: narrowing of the 9p duplication critical region to 6 Mb. American Journal of Medical Genetics 112: 154-9.
Di Bartolo DL, El Naggar M, Owen R, Sahoo T, Gilbert F, Pulijaal VR, Mathew S (2012) Characterization of a complex rearrangement involving duplication and deletion of 9p in an infant with craniofacial dysmorphism and cardiac anomalies. Molecular Cytogenetics 5: 31.
Rethore MO, Larget-Piet L, Abonyi D, Boeswillwald M, Berger R, Carpentier S, Cruveiller J, Dutrillau B, Lafourcade J, Penneau M, Lejeune J (1970) 4 cases of trisomy for the short arm of chromosome 9. Individualization of a new morbid entity. Annales de Génétique 13: 217-32.
Tsezou A, Kitsiou S, Galla A, Petersen MB, Karadima G, Syrrou M, Sahlen S, Blennow E (2000) Molecular cytogenetic characterization and origin of two de novo duplication 9p cases. American Journal of Medical Genetics 91: 102-6.
Zou YS, Huang XL, Ito M, Newton S, Milunsky JM (2009) Further delineation of the critical region for the 9p-duplication syndrome. American Journal of Medical Genetics A 149: 272-276.

Proceedings of the Young Scientist Forum Symposium
85
DO DIFFERENT COOKING METHODS AFFECT GLYCAEMIC INDEX OF RICE?
M. D. T. L. Gunathilaka1, and S. Ekanayake1*
1Department of Biochemistry, Faculty of Medical Sciences,
University of Sri Jayewardenepura, Nugegoda, Sri Lanka
Introduction Glycaemic index (GI) reflects the blood glucose response after a starchy meal. Many factors affect the GI including degree of starch gelatinization which depends on the amount of water added and the method of cooking. During cooking, heat and water soften the hard compact starch granules causing these to imbibe water, swell and eventually disrupt. As a result of that, individual amylose and amylopectin molecules are released leading to gelatinization. This makes starch more bioavailable for the action of enzymes causing increased glucose absorption. Rice is the staple food in Sri Lanka contributing to glycaemic carbohydrates and thus to the glycaemic response. Several studies had been conducted in the world, as well as in Sri Lanka to determine the GI of different rice varieties. Though it is believed that some basmati rice varieties imported to Sri Lanka have low GI, adequate research data on GI of these varieties is not available. Thus, the present study was conducted to evaluate the GI and the effect of two different cooking methods on GI of two imported basmati varieties (Pakistan basmati rice:-PBR; Indian basmati rice:-IBR) commonly purchased by Sri Lankans. Materials and Methods
After following an unstructured interview type market survey, two basmati rice varieties were selected for the study IBR and PBR. GI of the two rice varieties was determined using the standard method. The GI study was designed as a randomized cross over study. Volunteers (n=10) were advised to undergo 8-10 hour fasting the day before each test day. A dietary recall of the previous night was taken from each volunteer on each test day due to secondary meal effect and the palatability and adequacy of portion size of two basmati rice varieties were recorded. About 200 µL of fasting blood sample was taken from the participants by finger prick using an Accu Check meter. Finger tips were wiped thoroughly with surgical spirit and disposable lancets were used to prick fingers.
Two basmati rice varieties were cooked separately in a rice cooker (Panasonic) and microwave (LG) by adding water (1 cup of rice (110 g): 1 cup of water (150 mL).

Proceedings of the Young Scientist Forum Symposium
86
The test meal (IBR and PBR) containing an available 50 g carbohydrate portion (IBR:-147 g and PBR:-151 g) to be consumed within 10-15 minutes with 250 mL of water was provided. Further finger prick blood samples (as above) at 30, 45, 60, 90 and 120 minutes were obtained. Eppendorf tubes containing dried residues of NaF (10 μL) were used for blood collection. Blood glucose was analyzed using a glucose kit (GOD-PAP/BIOLABO–France). Likewise, test meal was given on two different days to the same participants by keeping a three day wash out periods. Above procedure was followed with the standard. Glucolin (gsk Glaxco Wellcome Ceylon Ltd, Sri Lanka) that contained dextrose monohydrate was used as the standard food and 55 g corresponding to 50 g available carbohydrate was dissolved in 250 mL and given on two diffrent days to the same participants by keeping a three day wash out period. The following equation was used to calculate the Glycaemic Load (GL) of each individual and finally GL of a food was calculated as an average of ten values.
100
portion serving normal onein tecarbohydra ofweight GIGL
The data was analyzed using the Statistical Package for Social Science (SPSS) Software (19th version) and Microsoft office Excel 2007. Chemical compositions are presented as mean ± SD and the GI values as mean ± SD. The results were analyzed using independent sample t-test by using SPSS (19th version) with 95 % taken as confidence interval. Results and Discussion The GI values of IBR cooked in the rice cooker (GI=54±8) or microwave (GI=43±6) belonged to low GI category (Table 1). These values are compatible with the values obtained from another study conducted by Srinivasa et al. (2013) who reported that the GI of an Indian basmati rice variety cooked in an electric cooker that belonged to low GI (54.93) category. The GI values of PBR cooked in rice cooker (GI=64±12) or microwave (GI=56±14) belonged to medium GI category (Table 1). Henry et al. (2005) studied commercially available four basmati in the UK and observed that the GI of all four basmati rice varieties belonged to medium GI (GI values- 52, 57, 67 and 69) category. Thus, present study results are compatible with the reported data for basmati rice varieties. The GI values of the two rice varieties cooked using the rice cooker or microwave were not significantly different (p<0.05). However, there was a percentage reduction in GI values in PBR (12.5 %) and IBR (20.4 %) when cooked in a microwave oven compared to rice cooker method. GL is the product of the GI and the amount of available carbohydrate of the actual
1
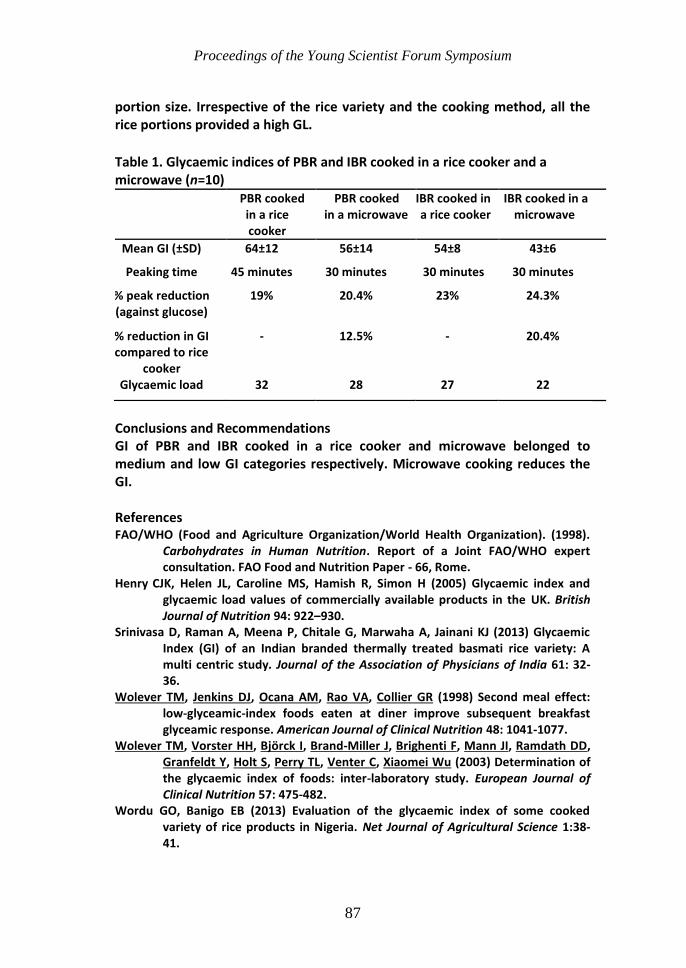
Proceedings of the Young Scientist Forum Symposium
87
portion size. Irrespective of the rice variety and the cooking method, all the rice portions provided a high GL.
Table 1. Glycaemic indices of PBR and IBR cooked in a rice cooker and a microwave (n=10)
PBR cooked in a rice cooker
PBR cooked in a microwave
IBR cooked in a rice cooker
IBR cooked in a microwave
Mean GI (±SD) 64±12 56±14 54±8 43±6
Peaking time 45 minutes 30 minutes 30 minutes 30 minutes
% peak reduction (against glucose)
19% 20.4% 23% 24.3%
% reduction in GI compared to rice
cooker
- 12.5% - 20.4%
Glycaemic load 32 28 27 22
Conclusions and Recommendations GI of PBR and IBR cooked in a rice cooker and microwave belonged to medium and low GI categories respectively. Microwave cooking reduces the GI. References FAO/WHO (Food and Agriculture Organization/World Health Organization). (1998).
Carbohydrates in Human Nutrition. Report of a Joint FAO/WHO expert consultation. FAO Food and Nutrition Paper - 66, Rome.
Henry CJK, Helen JL, Caroline MS, Hamish R, Simon H (2005) Glycaemic index and
glycaemic load values of commercially available products in the UK. British Journal of Nutrition 94: 922–930.
Srinivasa D, Raman A, Meena P, Chitale G, Marwaha A, Jainani KJ (2013) Glycaemic Index (GI) of an Indian branded thermally treated basmati rice variety: A multi centric study. Journal of the Association of Physicians of India 61: 32-36.
Wolever TM, Jenkins DJ, Ocana AM, Rao VA, Collier GR (1998) Second meal effect: low-glyceamic-index foods eaten at diner improve subsequent breakfast glyceamic response. American Journal of Clinical Nutrition 48: 1041-1077.
Wolever TM, Vorster HH, Björck I, Brand-Miller J, Brighenti F, Mann JI, Ramdath DD, Granfeldt Y, Holt S, Perry TL, Venter C, Xiaomei Wu (2003) Determination of the glycaemic index of foods: inter-laboratory study. European Journal of Clinical Nutrition 57: 475-482.
Wordu GO, Banigo EB (2013) Evaluation of the glycaemic index of some cooked variety of rice products in Nigeria. Net Journal of Agricultural Science 1:38-41.
4
http://www.ncbi.nlm.nih.gov/pubmed/?term=Brighenti%20F%5BAuthor%5D&cauthor=true&cauthor_uid=12627186

Proceedings of the Young Scientist Forum Symposium
88
EFFECT OF HERMETIC CONDITIONS OF HERMETICALLY SEALED LARGE CAPACITY COCOONS FOR STORAGE OF SOYBEAN (Glycine max)
D.M.C.C. Gunathilake1*, W.M.C.B. Wasala1 and B.M.K.S. Thilakarathne1
1 Research and Development Center, Institute of Post-Harvest Technology,
Jayanthi Mawatha, Anuradhapura, Sri Lanka
Introduction Studies conducted in Sri Lanka have shown that nearly 14 % to 18 % of soybean is lost during postproduction operations due to improper post-harvest techniques. These studies also found, major component of these losses occurred during storage practices. On the other hand, sometimes soybean price drops even less than cost of production at the harvesting season due to high supply. Hence, it needs to promote farmers to store their product till the off-season in order to overcome this problem. Hermetically sealed cocoon storage is one of the suitable storage methods for grains and pulses (durable crops) because it can overcome most of storage problems. However, they should be dried up to 12 % moisture content before hermetic storage (Donahaye et al. 1991). Many research studies carried out abroad and few studies conducted in Sri Lanka revealed that growth of fungus, insects and pests can be inhibited under the hermetic storage conditions; and also metabolic rate of pulse will be decreased due to lack of oxygen (Donahaye et al. 1991; Villers et al. 2009). No research studies have been reported in Sri Lanka for evaluation its impacts in altering of physical properties and quality parameters of soybean under commercial scale hermetic (modified atmospheric) storage in local climatic conditions. Therefore, this research study was conducted by storing soybean in commercial scale hermetic storage conditions for 7 months and compared the occurrence of quality changers in soybean seeds such as moisture content, germination percentage, nutritional properties (protein) and physical properties namely bulk density, thousand seed mass, kernel hardness and colour in comparison with soybean stored in conventional warehouse. Materials and Methods Soybean variety PB-01 was used for this study. Seed was dried up to 12 % moisture content. The 1220 kg of soybean seeds bagged in poly-sack was stored inside the cocoon and sealed. Cocoon was placed in warehouse and the same amount of soybean seeds bagged in poly-sack bags place warehouse as a conventional storage method as treatments. The 20 soybean samples as methods outlined by Bal et al. (1978) were used initially and after the storage trail to measure moisture content, germination percentage, nutritional

Proceedings of the Young Scientist Forum Symposium
89
properties (protein) and physical properties namely bulk density, thousand seed mass, kernel hardness and colour as responses. American oil chemists’ society (AOCS) method (AC 2-41 (14)) was adapted to analysis the moisture content of soybean. Standard germination test, 50 soybean seeds placed in germination paper wrapped with adequate water and covered with polyethylene sheet and kept room temperature for 7 days was performed. Oxygen level inside the sealed cocoons was measured using oxygen meter manufactured by Grain Pro Inc, USA once a two week till the end of the experiment. Inside temperature of hermetically sealed cocoon and warehouse were measured using thermo couples. Soybean seed color was measured by using Mini-scan XE plus Hunter Lab Colorimeter (L, a, and b values were measured). Compression test (yield stress) by seed hardness tester was carried out to measure seed hardness. Force at rupture was considered as the hardness. Five replicates were considered for compression test and the measured force were averaged. 1000 seed mass obtained by measuring mass of the 10 seeds for ten times at 3 replicates averaged and multiplying average weight by 100. Bulk density apparatus was used to measure bulk density of soy bean. Each treatment was replicated two times. Analysis of Variance (ANOVA) on Complete Randomized Design (CRD) was performed and treatment means were separated by the DNMTR at α = 0.05 level of significance. Results and Discussion Change of oxygen level and temperature inside the hermetically sealed cocoon:Fig. 1 shows the reduction of oxygen percentage inside the hermetic cocoon. Oxygen percentage of hermetic cocoon reduced from 20.5 % (ambient environment O2 percentage) to 9.4 % during 7 months storage. The temperature fluctuation was also low inside the cocoon in comparison to warehouse.
Figure 1. Change of oxygen% inside of the sealed cocoon during the experiment

Proceedings of the Young Scientist Forum Symposium
90
Comparison of moisture content, germination percentage, nutritional properties and physical properties: Table1 shows the mean moisture content (MC) of samples. It was clear from the results that soybean seed moisture percentage was significantly changed in conventional warehouse samples in comparison to its initial moisture percentage and moisture percentage of hermetically sealed stored samples for 7 month. During the experimental period, dry climate (low relative humidity) was observed therefore seed moisture was evaporated. But seed moisture was not evaporated under sealed hermetic condition. Germination percentage (GM) of the cocoon sample after 7 months storage was shown a significant reduction compared to initial values and warehouse samples. Warehouse samples have shown higher germination percentage than cocoon samples. This result proves previous results obtain by Narayan et al. (1988), that seed viability can be lost under low oxygen storage conditions. Protein percentage (PRO) of the soybean seed has been protected under hermetic storage than conventional warehouse storage, because metabolic function of seed is reduced under low oxygen storage. However, protein content was reduced with time at both storage methods. It was not significant. Thousand seed mass (TSM) significantly reduced in conventional warehouse storage compared to hermetically sealed cocoon. Hermetically sealed cocoon preserved soybean seed mass due to slow metabolic rate of seeds and also weight difference of soy bean i.e. total initial weight to total final weight for 7 months also low in cocoon in comparison to warehouse storage. Growth of fungus, insect and pests were inhibiting under the hermetic storage conditions due to lack of oxygen and the metabolic rate of seed was also be decreased due to lack of oxygen (Donahaye et al. 1991; Villers et al. 2009). Table 1. Change of seed parameters (responses) stored under different storage conditions Storage method
MC %
PRO % GM % TSM BD Hd SC
L a b
Initial Mean values
11.2a 36.31
a 96.12
a 146.5
a 775.2
b 7.04
a 54.15
a 3.70
a 15.34
a
Cocoon Mean values
11.1a 36.04
a 44.45
c 141.7
b 790.9
a 5.85
c 53.34
a 3.25
a 15.36
a
Warehouse Mean values
9.92b 35.12
a 70.32
b 130.4
c 789.2
a 6.35
b 51.98
a 4.14
a 15.87
a
Note: *Columns having same letter are not significantly difference at = 0.05 by
DMRT MC-moisture percentage, PRO-protein percentage, GM-germination, TSM-thousand seed mass, BD-bulk density, Hd-seed hardness, and SC-seed colour

Proceedings of the Young Scientist Forum Symposium
91
Bulk density (BD) was increased in both cocoon and warehouse samples against its initial value. However, non-significant change of bulk density was observed between cocoon and warehouse samples for 7 months storage. Therefore, soybean seed mass increased compared to volume increased. Seed hardness (HD) values were reduced compared to its initial values in both storage methods and the hardness of the cocoon samples also reported low value than warehouse samples for 7 months storage. Soybean seed colour (SC) was reduced slightly from its initial value in both storage methods. However seed colour was also slightly lower in warehouse stored soybean in comparison to cocoon stored soybean for 7 months of storage. Conclusions and Recommendations Oxygen percentage of soybean stored cocoon reduced from 20.5 % (ambient environment O2 percentage) to 9.4 % for 7 months. Temperature fluctuation inside the hermetic cocoon was very low. Change of moisture percentage during storage was not significant among storage methods. Germination was significantly low in cocoon sample. Protein percentage was slightly reduced in both storage methods. Seed mass was preserved in hermetic storage and seed hardness. Bulk density of soybean increased during storage and it was highly increased in hermetically sealed cocoon. Soybean seed colour was preserved slightly by sealed cocoon storage. Hermetically sealed cocoon storage has some advantages in comparison to conventional warehouse storage for large scale commercial soybean/pulse storage. However, it is recommended to maintain hermetically sealed condition throughout storage period to gain those advantages. References Bal S, Pual S (1978) Measurement of Grain –Cereal Quality, REPC publication No.72,
New Delhi, India. Chin DV, Kieu TT (2006) Study on hermetically sealed storage system for rice seed.
Journal of Omonrice 14: 64-70. Donahaye E, Navarro S, Ziv A, Blasuschild Y, Weerasinghe D (1991) Storage of paddy
in hermetically sealed plastic liners in Sri Lanka. Journal of Tropical Science 31: 109-121.
Narayan R, Chauhan GS, Verma NS (1988) Changes in the quality of soybean during storage. Part 2 – Effect of soybean storage on the sensory qualities of the products. Journal of Food Chemistry 30: 181-190.
Villers P, De Bruin T, Navarro S (2009) Development and applications of the hermetic storage technology, In proceeding of the 9
th International Working
Conference on Stored Product Protection, Philippine.

Proceedings of the Young Scientist Forum Symposium
92
EVENT CLASSIFICATION AND ABNORMAL EVENT DETECTION IN VIDEOS
H.M.S.P.B. Herath1*, P.H. Perera1, W.S.K. Fernando1, M.P.B. Ekanayake1, G.M.R.I. Godaliyadda1 and J.V. Wijayakulasooriya1
Department of Electrical and Electronic Engineering, Fculty of Engineering, University of Peradeniya, Sri Lanka
Introduction Series of actions performed by an object forms the structure of a video event. For an example a man walking down a street could be treated as a video event and the event itself is defined by the characteristics of his motion throughout the video. Hence an event can be represented using a feature space which is a collection of features associated to an objects’ motion such as object location, speed, direction etc. Event classification is the process of assigning an event identity to a newly observed event. It is used excessively in applications such as security monitoring, traffic surveillance, emergency detection systems and abnormal event detection systems etc. The paper proposes a supervised classification approach to classify such events using the principle of Dynamic Time Warping (DTW) and in the process to identify abnormal events using a conformity score. Materials and Methods In supervised classification (Zhang and Schuller 2012) set of event classes are predefined and representative templates of each event class is maintained. A distance measure is evaluated between an observed event and every event template to determine the class identity of the event. Event Distance Measures: Since events are defined using associated feature trajectories, event similarity can be evaluated in terms of temporal features which describe them. Temporal feature trajectories of tracked object location, speed or any informative feature could be extracted from a foreground estimation and tracking methodology similar to the one proposed in (Fernando 2014). Use of conventional signal comparison processes like correlation, direct mean square error, and trajectory statistics comparison are inappropriate in such feature trajectory comparison since the length of compared trajectories would be different. This brings up the necessity of using more specific trajectory comparison methodologies in event detection applications. The method considered should be able to compare multi-dimensional feature trajectories of different lengths and generate. Moreover, it should reflect a clear scalar distance between the compared events. Since the comparison is

Proceedings of the Young Scientist Forum Symposium
93
carried out between two trajectories, it is important that the comparison mechanism captures trajectory shape and placement information. Dynamic Time Warping (DTW): DTW method is a method that focuses on the trajectory shape and placement during the comparison process removing certain non-linear variations in the time domain of the sequences. As explained by Muller (2007), DTW is an existing method that could be used in comparing temporal trajectories (signals) of different lengths. This method is used in finding an optimal temporal alignment between the compared two trajectories. DTW for event comparison: Employment of DTW for event comparison requires a cost function to be defined such that higher dimensional features could be incorporated. In handling this cost matrix is proposed using squared norm of the vector differences according to,
(1)
where is the length of . For the explanation of the method consider the speed trajectories of two different events illustrated in Figure 1. The corresponding cost matrix calculated using the equation (1) is shown in Figure 2 where brightly shaded areas denote higher costs.
Conformity score of two events is calculated based on a quantity, total alignment cost. In DTW the total alignment cost between the trajectories is defined to be the sum of the costs when moving from the bottom-left corner to the top-right corner of the cost matrix in a specified path. The cost associated with minimal cost path that is available is defined to be the minimum cost of alignment. As an additional constraint for the optimal path selection, the motion of optimization is restrained such that the path always moves forward in time (Muller 2007). A possible alignment path is illustrated in Figure 2 on the cost matrix. Conformity score is obtained by dividing the total alignment cost by an approximated length of the aligning path.
Figure 1. Two Speed Trajectories to be
Compared using DTW
Figure 2. Alignment Cost Matrix used in DTW

Proceedings of the Young Scientist Forum Symposium
94
Event classification: At periodic intervals an event is compared against the set of predefined event templates using the DTW method and corresponding conformity scores for each template is obtained. Each event is attributed to the event template that gives the minimum conformity score. Moreover, obtained conformity scores are compared against a predetermined threshold and if the obtained conformity score is greater than , the corresponding event is classified as an abnormal event as in,
(2)
where is the conformity score between the observed event and the th event template. is the identified event. To determine the threshold an analysis on a training data set is carried out. In the analysis, conformity score of arbitrarily selected events with training set population are calculated and conformity score histogram is constructed. The resulting histogram has two separable regions that correspond to “conformity scores with same event class” and “conformity score with different event classes”. Parameter is selected to be equal to a conformity value that separates these two regions. Figure 3 illustrates how this process was carried out for a sample data set. The obtained value for in this application was 11.
Results and Discussion The overall event classification was tested in an outdoor environment focusing on human motions. Figure 4(a) shows an image of the environment and Figure 4(b) shows two of the template trajectories for event classes that had multiple occurrences throughout the experiment. The experiment was conducted over 50 object location trajectories and multiple occurring event trajectories were imposed as the reference events. Figure 5 (a) & (b) illustrates frame sequences where each of the events is identified and indicated with number corresponding to the event. The representative numbers for events are in accord with the ones marked in Figure 4(b). Each of
Figure 3. Process of Obtaining the Threshold (T)

Proceedings of the Young Scientist Forum Symposium
95
the events (a) & (b) in Figure 5 undergoes an unclassifiable time period initially where the conformity score denotes them as unclassifiable according to equation (2) and they are denoted by “0”. Proper identification of the event class has been observed after this observation time period. Events that do not match any of the templates are classified as abnormal events according to equation (2) and they continue to be marked as “0” following the observation time.
Conclusions and Recommondations The adoption of DTW into event classification problem enables to compare feature trajectories based on the shape of the trajectory accurately. This adoption gives better comparison results compared to standard algorithms due to the inherent ability of removing nonlinear temporal variations. The results obtained for a set of real life videos demonstrates that DTW accurately distinguishes events based on feature trajectories. Abnormal activities that differ from standard event templates can be identified using the conformity score threshold. References Fernando WSK, Perera PH, Herath HMSPB, Ekanayake MPB, Godaliyadda GMRI,
Wijayakulasooriya JV (2014) Human motion tracking under dynamic background conditions, In International Conference on Industrial and Information Systems (ICIIS):proceedings of the ninth ICIIS conference, Gwalior, 15-17 December 2014, IEEE. “In Press”.
Muller M (2007) Information Retrieval for Music and Motion, Springer, Berlin, pp. 69-84.
Zhang Z, Schuller B (2012) Semi-supervised learning helps in sound event classification, In Acoustics, Speech and Signal Processing (ICASSP), Kyoto, 25-30 March 2012, IEEE, pp. 333 - 336.
Proceedings of the Young Scientist Forum Symposium
96
VIRAL BURDEN AND DIVERSITY IN ACUTE RESPIRATORY TRACT INFECTIONS IN CHILDREN IN SELECTED AREAS OF SRI LANKA
J.A.A.S. Jayaweera1,2*, F. Noordeen2, A.J. Morel3, F.N.N. Pitchai2,
H.S. Kothalawela2, A.M.S.B. Abeykoon2 and J.S.M. Peiris4
1Department of Microbiology, Faculty of Medicine and Allied Sciences,
Rajarata University of Sri Lanka 2
Department of Microbiology, Faculty of Medicine, University of Peradeniya 3Teaching Hospital, Gampola
4School of Public Health, University of Hong Kong, Hong Kong
Introduction Acute respiratory tract infection (ARTI) represents the most common acute illness evaluated in childhood. ARTIs range from the common cold, a mild, self-limited catarrhal syndrome to life threatening lower respiratory tract infections. Viruses account for most ARTIs (Meneghetti 2011). Several viruses are associated with ARTI and associated respiratory diseases. The most frequently reported viruses in newborns and children under 5 years are respiratory syncytial virus, parainfluenza types 1, 2, 3, adenovirus, influenza virus types A, B, corona virus, coxsackievirus, enterovirus, human boca virus and human metapeumovrus (Muller-Pebody et al. 2002). Viruses cause majority of ARTI but only small percentage of these infections results in severe or fatal disease. Viral ARTI lead to secondary bacterial infections in healthy children by lowering immunity in the respiratory tract and that allows the invasion of bacteria (Graham 1990). There is evidence for marked seasonal variation in viral incidence, which is higher during the colder months in countries with temperate climates (Musher 2003). In countries with tropical climates the seasonality is variable according to the temperature-dependent local weather pattern such as humidity or rainfall (Muller-Pebody et al. 2002). Differences in the prevalence of viral infections can also be observed between community groups.Epidemiological studies on ARTIs of viral aetiology in the Sri Lankan paediatric population have not been performed. However, there is a recent study mainly related to influenza virus in patients attended for treatment for ARTI to North Colombo Teaching Hospital in the Western Province of Sri Lanka showing different seasonal patterns (Perera et al. 2010). By identifying seasonality pattern and the prevalence of viral causes in childhood ARTI, we will be able to take early preventive actions to assist to reduce childhood ARTI as well as associated morbidity and mortality. At the same time by identifying the viral aetiology, the number of consultations and irrational use of antibiotics can be reduced.

Proceedings of the Young Scientist Forum Symposium
97
Materials and Methods The ethical approval for the study was obtained from ethical and higher degree committees of the Faculty of Medicine, University of Peradeniya. This is a epidemiological study of inward paediatric patients (1 month to 5 years) with clinically diagnosed ARTI. Nasopharyngeal aspirates (NPA) of patients with ARTI were obtained at Teaching Hospital Gampola (THG) and the Professorial Unit, Anuradhapura (PUA) from March 2013 to July 2014. Indirect immunofluorescence (IF) test by DAKO IMAGEN™ (UK) respiratory screening reagents were used to screen for 8 respiratory viruses. Polymerase chain reaction (PCR) was performed using virus specific primers on the IF negative NPA sediments for hMPV, hBoV and corona viruses. Basic descriptive analyses were done by means of central tendency. Results and Discussion Out of 430 from children with ARTI from THG, 262 (61 %) were males. Patients with bronchiolitis were 309 (72 %); bronchopneumonia was 73 (17 %), laryngotracheobronchitis was 34 (8 %) and pharyngitis was 9 (2 %). Mean age of inward patients with ARTI was 1.22 years (SD±1.08). Out of 385 children with ARTI from PUA, 268 (69.5 %) were males. Mean age of patients in the PUA cohort was 1.04 years (SD±0.93). In the PUA cohort, bronchiolitis was noted in 271 (70.5 %), laryngotracheobronchitis was noted in 29 (7.6 %), bronchopneumonia was noted in 26 (6.8 %), acute infective rhinitis was noted in 24 (6.2 %) and pharyngitis was noted in 12 (3.2 %) children. A few patients (n=55) had cyanotic congenital cardiac anomalies, 34 from PUA and 21 from THG. Sum of 172 (40 %) patients in THG were exposed to passive tobacco smoking and 26 (6 %) were exposed to dust following industrial air pollution. Whereas in PUA cohort, 85 (22 %) were exposed to passive smoking and 169 (44 %) were exposed to dust of road construction. Out of 430 and 385 NPAs from THG and PUA, 156 (36.3 %) and 144 (37.3 %) were positive for viral screening using IFA. Following typing, RSV was found in 96 and 84 samples from TAG and PUA, respectively. Para influenza 1, 2 and 3 viruses were positive in 4, 21 and 3 from THG and 3, 15 and 5 in PUA, respectively. Adenovirus was positive in 20 and 22; influenza A in 3 and 2 and influenza B in 9 and 14 in THG and PUA, respectively. RT-PCR detected 11 hMPV. Six hMPV, 8 parainfluenza 1 and 18 parainfluenza 2 were positive from RSV positive samples in THG. hBoV and corona viruses were not detected in our study cohort either as primary pathogen or as co-infection with RSV. Out of 300 respiratory virus positive cases 88 (61 %) and 118 (75.6 %) patients were on antibiotics in PUA and THG cohorts, respectively. There was a significant different noted in ARTI between males and females (P=0.01; α,

Proceedings of the Young Scientist Forum Symposium
98
0.05). Peak viral detection was found in both centres in May-July in 2013; May-June in 2014 in THG. A peak in April 2013 and in December-January 2014 was noted in PUA (Figs. 1 and 2)
Figure 1. Number of IFA and PCR positive NPA with viral aetiology in inward patients with ARTI in THG from March 2013-July 2014
Figure 2. Number of IFA and PCR positive NPA with viral aetiology in inward patients with ARTI in PUA from March 2013-July 2014 Conclusions and Recommendations Depends on IFA viral aetiology accounted for 36.9 % of the ARTI cases in THG and PUA. RSV is the most common virus responsible for childhood ARTI. Peak viral detection was found in both centres in May-July in 2013; May-June in 2014 in THG. A peak in April 2013 and in December-January 2014 was noted in PUA. Acknowledgement University of Peradeniya Resaerch Grant No - RG/AF/13/38/M; UGC Grant for JAAS Jayaweera’s MPhil research.

Proceedings of the Young Scientist Forum Symposium
99
References Graham NM (1990) The epidemiology of acute respiratory infections in children and
adults: a global perspective. Epidemiology Review 12:149-78. Meneghetti A (2011) Upper Respiratory Tract Infection. Available at:
http://emedicine.medscape.com/ over view [Accessed 21 September 2011]. Muller-Pebody B, Edmunds WJ, Zambon MC, Gay NJ, Crowcroft NS (2002)
Contribution of respiratory syncytial virus to bronchiolitis and pneumonia-associated hospitalizations in English children, April 1995-March 1998. Epidemiology and Infection 129: 99-106.
Musher DM (2003) How contagious are common respiratory tract pathogens? New England Journal of Medicine 348: 1256-1266.
Perera KVHKK, Chan KH, Ma E, Peiris JSM (2010) Influenza virus infections among a sample of hospital attendees in Ragama, Sri Lanka. Ceylon Medical Journal 55: 40-44.

Proceedings of the Young Scientist Forum Symposium
100
USE OF INFORMATION ON RAINFALL BEHAVIOUR TO ASSIST TIMELY MANAGEMENT OF AGRONOMIC OPERATIONS IN RUBBER PLANTATIONS IN THE AGRO ECOLOGICAL REGION – WL1a
P. W. Jeewanthi1, W. Wijesuriya1* and J. K. S. Sankalpa2
1Biometry
Section, Rubber Research Institute of Sri Lanka, Dartonfield, Agalawatta
2Agricultural
Economics Unit, Rubber Research Institute of Sri Lanka, Dartonfield,
Agalawatta
Introduction Agronomic operations in rubber plantations from planting through felling are closely linked with the amount and pattern of rainfall. Hence, rainfall can be regarded as the major climatic factor which directly affects the productivity of rubber plantations. Observational evidence indicates that changes of climatic factors such as rainfall, have significantly affected diverse set of natural and human systems and activities in many countries (Hansen 2002). This necessitates detail analyses of rainfall for effective planning of agro-management practices in rubber plantations. Understanding the rainfall patterns provide information on adverse conditions with respect to both dry and wet conditions in a particular area. Yogaratnam (2001) reported that the ideal annual rainfall for rubber falls within the range of 1650 mm to 3000 mm. The tree performance is severely affected when rainfall over a six months period recorded less than 500 mm especially when rainfall is not uniformly distributed over the year. It seems that rainfall is not a limiting factor in the rubber growing areas of the Low Country Wet Zone of Sri Lanka. However, no detail studies were found in literature in the recent years giving emphasis on comparing the crop calendar with the existing rainfall patterns to suggest appropriate dates for different agro-management practices for rubber cultivation. Hence, studying the rainfall pattern, probability of occurring a wet day, number of wet days and length of wet and dry spells within a particular period is also of immense importance as rainfall amount in planning agricultural operations in Rubber cultivation. This study was conducted as an initial step to identify the rainfall behavior in three major rubber growing areas employing Markov chain models, a classical model to express a stochastic process (Gabriel and Neumann 1962). Materials and Methods Data: Daily rainfall values of three meteorological stations in the Agro Ecological Region, WL-1a namely; Agalawatta, Avissawella and Ratnapura
Proceedings of the Young Scientist Forum Symposium
101
were used covering the period from 1980 to 2010. A wet day (a dry day) is defined as one with ≥3 mm (<3 mm) of rainfall per day according to the water requirement of Rubber. Markov Chain Model and Estimation of Parameters: The process of occurrence of wet(W) and dry(D) days can be described by a 2-state Markov chain with wet and dry days as the two states. The transition probability matrix for a given standard week P describing the 2-state Markov chain model is;
with P00 + P01 = 1 and P10 + P11 = 1 , where P00,P01,P10 and P11 are the transition probabilities; P00 = probability of occurring a dry day given that the preceding day was a dry day [P (D/D)], P01 = P(W/D), P10 = P (D/W) and P11 = P (W/W). As the next step, each day in a year was grouped into the categories; D/D, W/D, D/W and W/W. This procedure was adopted subsequently for all the years considered for the analysis. Then the maximum likelihood estimates of probabilities; P00, P01, P10 and P11 were obtained for the 52 standard weeks. According to Cox and Miller (1965), after a sufficiently long period of time, it is expected to settle down to a condition of statistical equilibrium with steady state or equilibrium probabilities which are independent of the initial conditions. So for a given standard week (SW), the limiting probabilities are
given by
corresponding to dry and
wet days, respectively (Ross, 1996). According to the above proof, probability of day in a given SW being a wet day is . Let, X= number of wet days within a given SW, X~ binomial (n, ) with n=7 or 8 (8 in only two occasions). Therefore, the expected number of wet days (E(X)) for a given SW is defined as, E(X) = n* . The dry spell (or run) lengths are very important statistical descriptors of dry periods in a rubber growing area. Let, D is the length of dry spell in a given SW, D ~ Geometric ( ). Therefore, the expected lengths of the dry spells (E(D)) for a given SW is defined as, E(D) = 1/ . Results and Discussion As depicted in Fig. 1, the probability of a day in a given SW being a wet day in Agalawatta and Ratnapura is very much similar over the year. However, a marked deviation was found for Avissawella, where the mid-year dry period is more pronounced. The estimated number of wet days per SW also showed the same sequence (Fig. 2). In Avissawella, the number of wet days equals 3 in 22 weeks out of 52. In Agalawatta and Ratnapura, the number of wet days equals 4 in 24 and 25 weeks out of 52, respectively. None of the weeks had 5 wet days in Avissawella (Table 1). The Expected dry run if the beginning of a SW is given a dry day is depicted in Fig. 3. Accordingly, during the initial part of the year, in Avissawella a relatively dry period is observed compared to the

Proceedings of the Young Scientist Forum Symposium
102
other two areas. Although less in magnitude, the similar sequence is observed during the mid-year dry period.
Figure 1. Probability of a day in a given standard week being a wet day
0
1
2
3
4
5
6
1 6
11
16
21
26
31
36
41
46
51
No
of
we
t D
ays
Standard Week
0
1
2
3
4
5
6
1 6
11
16
21
26
31
36
41
46
51
Standard Week
0
1
2
3
4
5
6
1 6
11
16
21
26
31
36
41
46
51
Standard Week
Figure 2. Expected number of wet days per standard week in (a) Agalawatta, (b) Ratnapura and (c) Avissawella Table 1. No of wet days per standard week in Agalawatta, Ratnapura and Avissawella
No of wet days per week
No of weeks out of 52 standard weeks
Agalawatta Ratnapura Avissawella
1 5 2 8 2 7 10 12 3 13 12 22 4 24 25 10
5 3 3 0
(a) (b) (c)

Proceedings of the Young Scientist Forum Symposium
103
Figure 3. Expected dry run if the beginning of a standard week is given a dry day Conclusions and Recommendations A marked difference is observed in Avissawella for probability of a day in a given standard week being a wet day, expected number of wet days and expected dry run. Planting season which coincides with 16th to 22nd week should be strictly followed in Avissawella area. A slight delay in planting which frequently happen due planting material demand will have a relatively low risk in Agalawatta and Ratnapura. Further, more emphasis should be paid on moisture conservation measures during the initial part of the year and the mid-year in Avissawella compared to the other two areas. Since it records more number of expected wet days in Ratnapura and Agalawatta during the year, more attention should be paid on arresting rain interference for harvesting using rain guards. References Cox DR, Miller HD (1965) The Theory of Stochastic Processes. London: Chapman and
Hall. Gabriel KR, Neumann J (1962) A Markov chain model for daily rainfall occurrence at
Tel Aviv. Quarterly Journal of the Royal Meteorological Society 88: 90–95. Hansen JE (2002) A brighter future. Journal of Climatic Change 52: 435-440. Ross SM (1996) Stochastic Process, 2nd Ed. New York: John Wiley & Sons. Yogaratnam N (2001) Land Suitability Evaluation, Selection, and Soil Conservation. A
Hand Book of Rubber. I (Agronomy), Rubber Research Institute of Sri Lanka.

Proceedings of the Young Scientist Forum Symposium
104
ALTERED APPEARANCES: SOCIAL MEANINGS OF DRESS DURING THE KOTTE PERIOD
P.V.M.Karunaratne1*
1Department of Textile and Clothing Technology, Faculty of Engineering,
University of Moratuwa, Moratuwa
Introduction Fashion of dress gives social meanings. The social meanings of dress are embedded in various social contexts or various circumstances. These meanings are constantly altered by the appearances in which they are found in social/ historical context which frame space and time. The objective of the study is to find out how the meanings are embedded and altered by the appearances in which they are found in social contexts framing space and time. The historical context of the Kotte era (1411-1597 AD) was thoroughly explored through its significant dresses and analyzed theoretically in order to understand social meanings of new styles that were reconfigured elements of clothing created by the royalty of that period after they embraced Christianity. Materials and Methods Trouser (pantaloons), coat (cabaya), jacket (hettaya) short jacket with collar (manthe hettaya) and articles of clothing (items) such as attached collar (tippet), were observed and analyzed. The systematic pictorial analysis reveals many new meanings that were created, which influenced transmission of their “context”. The conceptual framework of the study is based on the qualitative research method. Sequence of in-depth observational studies was carried out with selected temple murals, cloth paintings, wood and stone carvings, sculptures and ivory carvings at the Munich Treasury in Germany. The literature review employed original documents, manuscripts, chronicles, records of foreign travellers, published research and inscriptions. The validity of the data was confirmed by cross checking with literary sources. Results and Discussion The king was the culminating point of the pyramid in society and represented the state and the center of political life. The concept of king is distinguished by the term Maharaja (great king) or Rajadhiraja (ruler of the king) Mahipathi (lord of the earth) and Deva (god).The title corresponds to ‘Our Majesty’. Culture built certain stereotypes for the king as a living god that affected the cognition of people in society. The representation of the god in sculpture or in

Proceedings of the Young Scientist Forum Symposium
105
paintings therefore could be hypothesized as the representation of a king. Because the artists of the period had no imagination of how such a god should be represented, they saw the live model of the king who was considered the lord of the earth. The king used 64 royal ornaments which signified royalty had to wear at his consecration and at important state occasions. He used fine white silk cloth for the lower dress and shawls for head covering. It was because of the culturally built social code regarding silk and fine cotton that people identified royalty or luxurious sophistication. Color became the signified purity according to tradition. The pictorial references given below show that the king dressed differently according to the day and the place where he represented himself.
Figure 1 Figure 2 Figure 3 Figure 4 Figure 5 Fig. 1 shows king Buwanekabahu V11 (1521-1555) at the royal platform Chitakuta Mandape at the palace of Kotte. He wore 64 royal ornaments, a long wrap cloth and is wearing the multi tired crown, holding a lotus flower, one of the five emblems of the Lord Buddha. Fig. 2 shows the king receiving a visitor in the king’s audience hall by wearing a head-dress instead of a crown with limited upper body jewelry. Fig. 3 shows the king participating in a ritual ceremony in front of the god Shiva. The king wore a different type - dress. Fig. 4 shows prince Dharmapala at the coronation ceremony in Portugal wearing a Sri Lankan king’ dress exclusive to the emperor viz the headband, the single necklace of pearls called ekavali and the divine dagger called acchijja – cchurika. Fig. 5 shows prince Dharmapala is wearing a long coat over a long piece of cloth after he was crowned as a Portuguese king. His (cabaya+ long wrap cloth) new dress resembles and obeys the Portuguese crown. Altered appearances found in new social contexts
Figure 6 Figure 7 Figure 8 Figure 9 Figure 10 Figure 11 Figure 12 Figure 13

Proceedings of the Young Scientist Forum Symposium
106
It is noticed that most of the early kings of the Kandyan era were educated under Portuguese Franciscans and baptized by them. King Wimaladharmasooriya 1 (1591-1604) (Fig. 6) was known as Konappu Bandara who was grown and educated under Franciscans by the name of Dom Joao de Austria Mudaliyar. He embraced Buddhism and became the king of the Kandyan kingdom, as it was an important qualification for the kingship. The son of king Senarath (1604-1635) (Fig. 7) king Rajasinghe 11’s (1635-1687) (Fig. 8) dress habits also show how he changed his mind with the impact of the environment he had grown up. Knox says, ‘he was not wont to keep to one fashion, but changes as his fancy leads him’. King Wimaladhramasooriya 1 introduced the Kameesa hettaya or Juan hettaya with a tippet (collar) (Figs. 11, 12, 13) while prince Dharmapla first introduced the cabaya. King Wimaladhramasooriya 1 wore the thuppotti for the lower dress. King Rajasinghe 11 wore a long sleeved jacket with long breeches. The study revealed that an article of clothing (tippet) has many possible meanings and so there is likely to be a certain degree of ambiguity. The articles of clothing that are worn together may have numerous possible meanings and they also interact with one another to produce additional ambiguities. It is also observed that the jacket of king Wimaladhramasooriya 1 had an attached collar known as the tippet. This dress article was also utilized by kings Keerthi Sri Rajasinghe and Sri Wrickrama Rajasinghe. However the size of the article is seen to be bigger than the tippet of Wimaladhramasooriya 1. It is known that these kings practiced oiling their hair as etiquette and they separately attached the tippet to the neck line of the jacket as a protective dress item which they supposed would not allow oil to run into their jacket. In this way the signification of tippet would be fashion attitudes, or daily habits of the royalty. However, king Wimaladhramasooriya 1’s tippet being attached to the jacket would signify a different signification from Keerthi Sri Rajasinghe and Sri Wrickrama Rajasinghe’s tippet. Furthermore, the study also revealed that there is a high degree of social variability in the link between signifier (dress) and signified (concept) when it comes to appearance. The royal dress with long sleeved coat (cabaya) and a lower piece of cloth of the Kotte period developed to a special costume called thuppotti during the Kandyan era. The thuppotti means the whole garment which was worn by the elite of Kandy. The thuppotti dress has now become a fashionable garment at wedding ceremonies. Many people love to wear thuppotti on their wedding day. Social order is established regarding dress of each category. Social codes were more stable than in the present days to interpret dress messages.

Proceedings of the Young Scientist Forum Symposium
107
Conclusions and Recommendations The study revealed that dresses or clothes are semantically unstable, because the meaning is directly related to the context, when clothes are considered as texts; it was typical in hierarchical societies for clothes to function as ‘closed’ texts with a relatively stable and fixed meaning. This is also proved by the dress of prince Dharmapala; king Wimaladhramasooriya 1 and king Rajasinghe 11 These dresses were embedded in the Portuguese influenced social, cultural and historical context of the sixteenth and seventeenth centuries. These four royal personages were brought up in the Portuguese social context from their childhood. The kings Keerthi Sri Rajasinghe and Sri Wrickrama Rajasinghe’s dresses were also embedded in Dutch and British influenced social contexts. Within that western influenced social context all the seven dresses of the above said kings prevailed at a certain time period, remaining as fixed dresses of the royalty. These examples also show that dress signs rely heavily on social contexts in order for a message to be comprehended. Therefore, the applicability of fashion meanings of the Kotte period to the present as well as to the future is possible. References Codrington HW (1910) Notes on Some of the Principal Kandyan Chiefs and Headmen
and their Dresses. H.C Cottle, Government Printer Ceylon. Coomaraswamy A (1956) Medieval Sinhalese Art. 2nd ed. New York: Pantheon Books. Ferguson D (1907) The discovery of Ceylon by the Portuguese in 1505: Journal of
Royal Asiatic Society Ceylon Branch 19: 59. Geiger W (1960) Culture of Ceylon in the Medieval Times. Wiesbaden, Heinz Bechert. Knox R (1966) Historical Relation of Ceylon. Dehiwala: Tissara Publications. Pieris PE (1992) Ceylon the Portuguese Era 2
nd edition, Vol 1,: Thisara Publishers,
Dehiwala. Silva OM ( 1990) Fidalgos in Kotte 1505-1656. Harwoods, Colombo.
Proceedings of the Young Scientist Forum Symposium
108
PHENOLIC CONTENT AND ANTIOXIDANT ACTIVITIES OF LEGUMES AS AFFECTED BY DIFFERENT PROCESSING CONDITIONS
K.D.D. Kumari1*, A.L.F. Sifna1 and G.A.P. Chandrasekara1
1Department of Applied Nutrition, Faculty of Livestock, Fisheries and Nutrition,
Wayamba University of Sri Lanka
Introduction Legumes are plants belonging to the family Fabaceae. They are edible seeds, borne in pods that often open along with two seams. Legumes have two types according to the way of storing energy. The leguminous oilseeds such as soya bean and groundnut store energy as lipids. The pulses such as peas, beans, and lentils store energy as starch. Legumes are rich in proteins, and a good source of essential amino acid lysine, but are deficient in sulphur containing amino acids such as, methionine and cysteine. Therefore legumes are valuable complementary food to cereals due to differences of individual amino acid compositions. Phenolic compounds such as phenolic acids, flavanoids, and condensed tannins and their antioxidant activities are identified and characterized in food legumes. Phenolic compounds can act as antioxidants via different mechanisms and provide beneficial health effects to humans. Processed legumes play a vital role in the diet of Sri Lankans. Therefore a study was conducted to determine the phenolic content and antioxidant activities of legumes commonly consumed in Sri Lanka as affected by different processing methods. Materials and Methods Six different types of commonly consumed legumes, namely Phaseolus aureus (Green gram; cultivar: Ari), Phaseolus mungo (Black gram; cultivar: Anurada), Cicer arietinum (Chickpea; Red, Yellow), Vigna unguiculata (Cowpea; cultivar: Varuni), and Glycine max (Soybean; cultivar: PB1) were used in this study. Samples were processed by soaking (12 hour, room temperature in water 1:5 (w/v)), peeling (manually), boiling (boiled in distilled water 1:1 (w/v) for 30 minutes) and germination. The raw and processed legume samples were freeze dried and defatted using hexane (1:5 w/v). Soluble phenolic compounds were extracted using 50 % acetone (v/v), shaking in a water bath, for 8 h at 10±5 ºC. The extracts were tested for their total phenolic content (TPC) by folin-ciocalteu reagent, and total flavonoid content (TFC) by Alluminium (III). Antioxidant activities were measured by reducing power (RP) capability of donating electrons, ferrous ion chelating activity (FICA), and
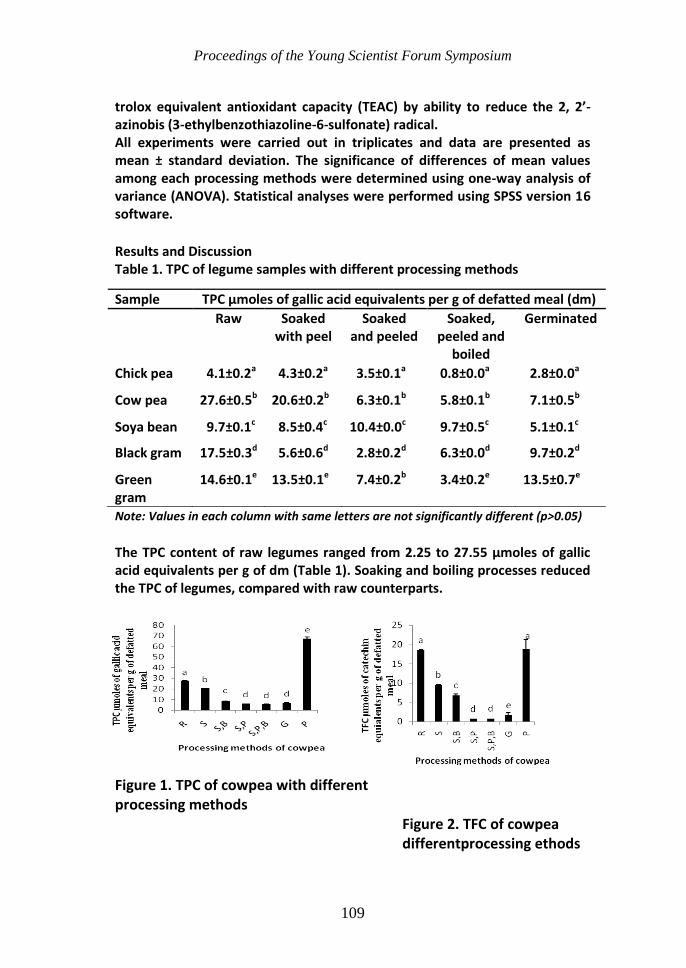
Proceedings of the Young Scientist Forum Symposium
109
trolox equivalent antioxidant capacity (TEAC) by ability to reduce the 2, 2’-azinobis (3-ethylbenzothiazoline-6-sulfonate) radical. All experiments were carried out in triplicates and data are presented as mean ± standard deviation. The significance of differences of mean values among each processing methods were determined using one-way analysis of variance (ANOVA). Statistical analyses were performed using SPSS version 16 software.
Results and Discussion Table 1. TPC of legume samples with different processing methods
Note: Values in each column with same letters are not significantly different (p>0.05)
The TPC content of raw legumes ranged from 2.25 to 27.55 µmoles of gallic acid equivalents per g of dm (Table 1). Soaking and boiling processes reduced the TPC of legumes, compared with raw counterparts.
Figure 1. TPC of cowpea with different processing methods Figure 2. TFC of cowpea
differentprocessing ethods
Sample TPC µmoles of gallic acid equivalents per g of defatted meal (dm)
Raw Soaked with peel
Soaked and peeled
Soaked, peeled and
boiled
Germinated
Chick pea 4.1±0.2a 4.3±0.2a 3.5±0.1a 0.8±0.0a 2.8±0.0a
Cow pea 27.6±0.5b 20.6±0.2b 6.3±0.1b 5.8±0.1b 7.1±0.5b
Soya bean 9.7±0.1c 8.5±0.4c 10.4±0.0c 9.7±0.5c 5.1±0.1c
Black gram 17.5±0.3d 5.6±0.6d 2.8±0.2d 6.3±0.0d 9.7±0.2d
Green gram
14.6±0.1e 13.5±0.1e 7.4±0.2b 3.4±0.2e 13.5±0.7e
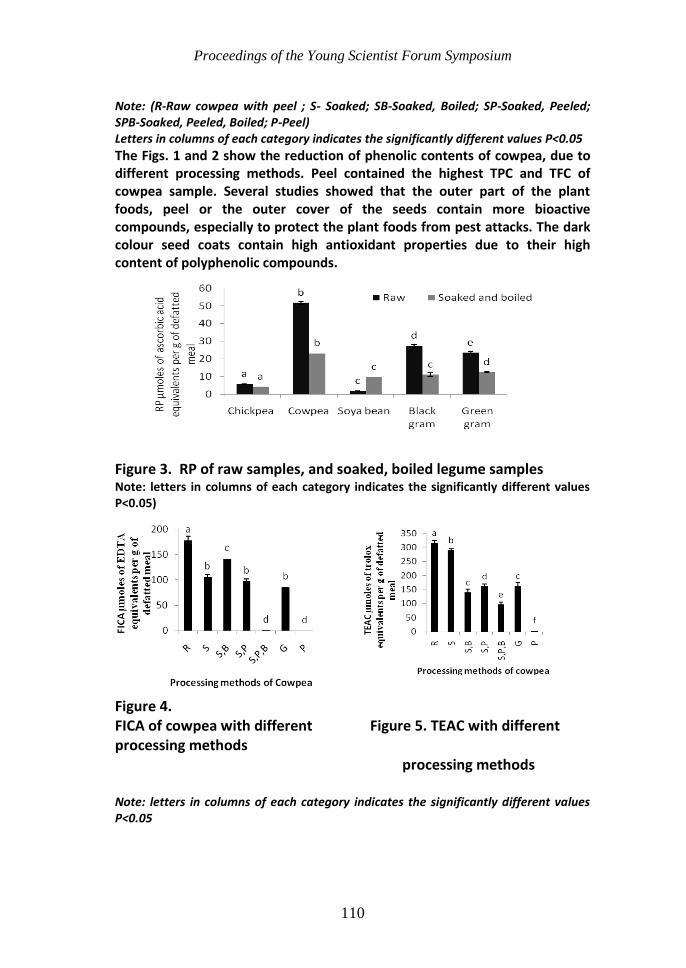
Proceedings of the Young Scientist Forum Symposium
110
Note: (R-Raw cowpea with peel ; S- Soaked; SB-Soaked, Boiled; SP-Soaked, Peeled; SPB-Soaked, Peeled, Boiled; P-Peel) Letters in columns of each category indicates the significantly different values P<0.05
The Figs. 1 and 2 show the reduction of phenolic contents of cowpea, due to different processing methods. Peel contained the highest TPC and TFC of cowpea sample. Several studies showed that the outer part of the plant foods, peel or the outer cover of the seeds contain more bioactive compounds, especially to protect the plant foods from pest attacks. The dark colour seed coats contain high antioxidant properties due to their high content of polyphenolic compounds.
Figure 3. RP of raw samples, and soaked, boiled legume samples Note: letters in columns of each category indicates the significantly different values P<0.05)
Figure 4. FICA of cowpea with different Figure 5. TEAC with different processing methods
processing methods
Note: letters in columns of each category indicates the significantly different values P<0.05

Proceedings of the Young Scientist Forum Symposium
111
Processing methods changed the antioxidant activities of raw legumes (Figs. 3, 4 and 5). The reduction of TPC content due to soaking and boiling is reason of having the low RP values of the legume samples. Soaking will softens the cell walls of legumes and soluble phenolics can leach into the soaked water. According to the Mohamed et al. (2011), soaking of legume seeds reduced phenolic contents and more reduction observed with the increasing of period of soaking. Thermal processes have a large influence in phenolics availability in foods which depends on their magnitude and duration. Xu and Chang (2008) reported that the soaking, boiling and steaming significantly reduced the phenolic contents and antioxidant activities of cool season food legumes including green pea, yellow pea, chick pea and lentil. Conclusions and Recommendations Legumes are rich sources of phenolic compounds and they possess antioxidant activities. Antioxidant activities are significantly different among the legumes. Cowpea contained more phenolic compounds per g of defatted meal among other legumes examined. The peel of the legumes contains the highest content of phenolic compounds except soya bean. The processing changes the phenolic content and their antioxidant properties of legumes. Legumes are potential source of antioxidants which can be utilized as functional foods in the management of non communicable diseases. Further studies are warranted to identify best food processing methods to retain more phenolic contents and their antioxidant activities of legumes.
References Chandrasekara A, Shahidi F. (2010) Content of insoluble bound phenolics in millets
and their contribution to antioxidant capacity. Journal of Agricultural and Food Chemistry 58: 6706-6714.
Irina I, Mohamed G. (2012) Biological Activities and Effects of Food Processing on Flavonoids as Phenolic Antioxidants, Advances in Applied Biotechnology. Available from: http://www.intechopen.com/books/advances-in-applied- biotechnology/biological-activities-and-effects-of-food-processing-on-flavonoids-as-phenolic-antioxidants.
Mohamed RK, Gibriel Y, Nagwa MHR, Ferial MAS, Esmat AA (2011) Influence of legume processing treatments individually or in combination on their trypsin inhibitor and total phenolic contents. Australian Journal of Basic and Applied Sciences 5: 1310-1322.
Xu B, Chang SK (2008) Antioxidant capacity of seed coat, dehulled bean, and whole black soybeans in relation to their distributions of total phenolics, phenolic acids, anthocyanins, and isoflavones. Journal of Agricultural and Food Chemistry 56: 8365 -8373.
Proceedings of the Young Scientist Forum Symposium
112
THERMAL CHARACTERIZATION OF GRAPHITE, GRAPHITE-OXIDE (GO) AND GRAPHENE (GN) BY THERMOGRAVIMETRIC ANALYSIS (TGA/DTA),
AND OPTIMIZATION OF TEMPERATURE OF GRAPHITE-OXIDE TO GRAPHENE BY HTA/XRD
C.H.Manoratne1*, I.R.M.Kottegoda1 and S.R.D.Rosa2
1Materials Technology Section, Industrial Technology Institute, Colombo 7, Sri Lanka
2Department of Physics, Faculty of Science, University of Colombo, Sri Lanka
Introduction Exports of local minerals are discouraged without a value addition in the present strategies of government policies. Adding value to the local minerals is advised to increase the foreign revenue; as a result graphite is identified as a potential mineral that can be value added. Graphene (Gn) and graphite-oxide (GO) are such value added products which have become wonder materials in the present research and development in every part of the world. Since the separation of single-layer graphene (SLG) in 2004 has made scientists to explore the suitable applications of Gn as it shows two dimensionality and unique physical properties (Janowska et al. 2010). The intermediate product of GO has also been attracted by the scientists recently as a potential carbon-based nanomaterial for producing graphene (Su et al. 2009). Chemical composition (purity), particle size, surface area, surface morphology, and the thermal behavior etc. are some of important properties need to be analyzed as they highly govern the final properties in any application (Wissler 2006). To name few, the powder size influences the ultimate properties of graphite oxide and graphene (Jiang et al. 2000). Therefore, in this partial study an attempt was devoted to study the relative fraction of edge sites and the oxidation behavior of graphite and its derivatives and to optimize the conversion temperature of GO to Gn. Materials and Methods Commercially available local graphite powder as received with the average
particle size (d50) ~ 110 m was reduced in particle size ((d50) ~ 37 m) by using ball-milling. A planetary ball mill was used by maintaining the ball-to-powder ratio of 5:4. Total pebbles volume is taken as 50 % (V) of the mill volume. Pebbles in three sizes, i.e. large in 20 % by V volume, medium size pebbles in 40 % by V, and small size pebbles in 40 % by V. Water is added sufficiently enough to wet the powder about 8 % by V. The effect of ball milling time was optimized by collecting milled powders at an interval of 1 h up to 24 of milling and measuring particle size distribution.

Proceedings of the Young Scientist Forum Symposium
113
The resulting powder was dried and used for synthesizing of graphite oxide. Modified hummer method (Kottegoda et al. 2001) was adopted for the synthesis of GO and Gn. Materials were characterized by using SDT Q600 Simultaneous Thermogravimetric Analyzer under N2 flow. The weight change and true differential heat flow on the same sample from ambient to 1500 °C was measured. The reduction or the conversion of graphite-oxide to graphene was systematically studied with the High Temperature Attachment (HTA) attached to the XRD (Rigaku Ultima IV/HTA). The morphology of the products was studied by the SEM (LEO 1420VP). Results and Discussion Thermal characterization of graphite, graphite-oxide and grapheme:
Figure 1. TGA/DSC plots for (a) Graphite, (b) GO, and (c) Gn The Fig. 1 shows the simultaneous measurement of weight change and true differential heat flow (TGA/DTA) on the sample of graphite (a), graphite-oxide (b) and graphene (Gn) from ambient to 1500 °C. As seen in the Fig. 1(a) the graphite was highly stable up to 1000 °C, and revealed pyrolysis of oxygen-containing functional groups available in the graphite layers as the derivative
shows three peaks as a function of temperature appearing at around
50 °C, 430 °C and 1230 °C, respectively. The GO shows slight mass decrease from room temperature to 150 °C and significant decrease from 150 °C to 200
(a) (b)
(c)
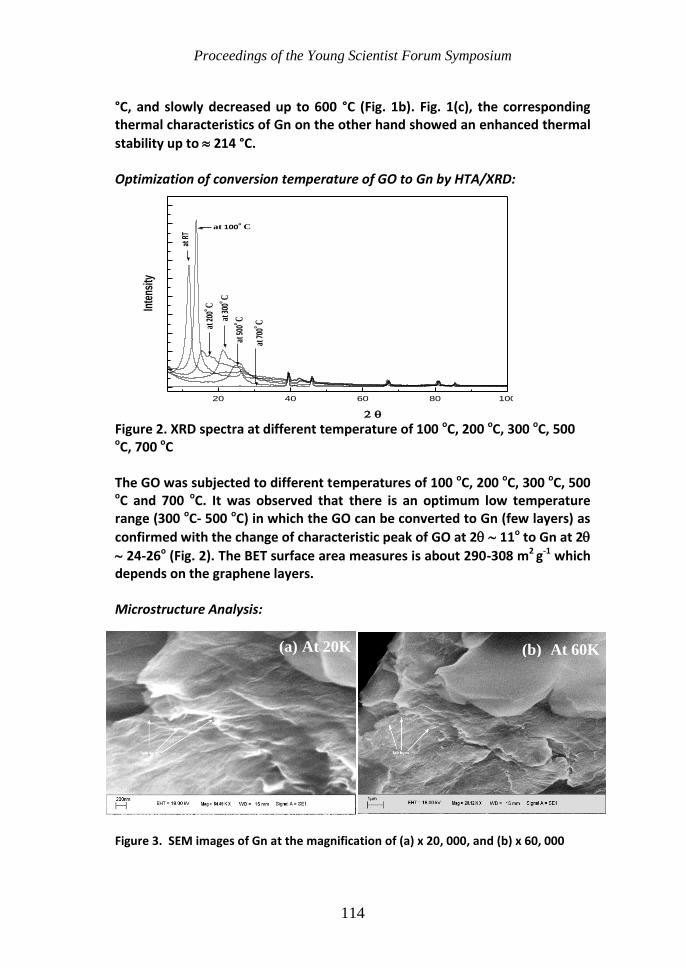
Proceedings of the Young Scientist Forum Symposium
114
°C, and slowly decreased up to 600 °C (Fig. 1b). Fig. 1(c), the corresponding thermal characteristics of Gn on the other hand showed an enhanced thermal
stability up to 214 °C. Optimization of conversion temperature of GO to Gn by HTA/XRD: Figure 2. XRD spectra at different temperature of 100 oC, 200 oC, 300 oC, 500 oC, 700 oC The GO was subjected to different temperatures of 100 oC, 200 oC, 300 oC, 500 oC and 700 oC. It was observed that there is an optimum low temperature range (300 oC- 500 oC) in which the GO can be converted to Gn (few layers) as
confirmed with the change of characteristic peak of GO at 2 11o to Gn at 2
24-26o (Fig. 2). The BET surface area measures is about 290-308 m2 g-1 which depends on the graphene layers. Microstructure Analysis: Figure 3. SEM images of Gn at the magnification of (a) x 20, 000, and (b) x 60, 000
(a)
(a) At 20K (b) At 60K
20 40 60 80 100
at 7
00o C
at 5
00o Cat
300
o C
at 2
00o C
at 100o C
at R
T
Inte
nsity

Proceedings of the Young Scientist Forum Symposium
115
The morphology of Gn was observed at the magnifications of (a) x 20,000 and (b) x 60,000. As marked by the arrows it can be observed that the graphite structure has been split during the synthesis process (oxidation/reduction) and the few layers of graphene are conspicuous. Conclusions and Recommendations Thermogravimetric analysis reveals pyrolysis of oxygen-containing functional groups available in the graphite layers, GO, and to some extent in Gn layers. The XRD spectra obtained at different temperature also confirmed this phenomenon. The temperature (range) for conversion of GO to Gn was optimized. The findings will be effectively used in optimum practical synthesis of GO, Gn, and graphene composites for the applications in Li-ion batteries in the future. References Janowska I, Chizari K, Ersen O, Zafeiratos S, Soubane D, Da Costa V, Speisser V,
Boeglin C, Houllé M, Bégin D, Plee D, Ledoux M, Pham-Huu C (2010) Microwaves synthesis of large few-layer graphene sheets in aqueous solution of ammonia. Nano Research 3: 126-137.
Jiang W, Nadeau G, Zaghib K, Kinoshita K (2000) Thermal analysis of the oxidation of natural graphite — effect of particle size. Thermochimica Acta 351: 85–93.
Kottegoda IRM, Idris NH, Lu L, Wang JZ, Liu HK (2011) Synthesis and characterization of graphene–nickel oxide nanostructures for fast charge–discharge application. Electrochimica Acta 56: 5815–5822.
Su CY, Xu Y, Zhang W, Zhao J, Tang X, Tsai CH, Li LL (2009) Electrical and spectroscopic characterizations of ultra-large reduced graphene oxide monolayers. Chemistry of Materials 21: 5674–5680.
Wissler M (2006) Graphite and carbon powders for electrochemical applications. Journal of Power Sources 156: 142–150.
Proceedings of the Young Scientist Forum Symposium
116
IN VITRO ANTIBACTERIAL ACTIVITY OF CATECHINS FROM REFUSE GREEN TEA AGAINST DRUG-RESISTANT Pseudomonas aeruginosa
S.S. Mediwake1, 2, I.S.K. Vithanage1, 2, V. Thevanesam2, E.W.M.A. Ekanayake2
and B.M.R. Bandara1*
1Department of Chemistry, Faculty of Science, University of Peradeniya
2Department of Microbiology, Faculty of Medicine, University of Peradeniya
Introduction Pseudomonas aeruginosa is a Gram-negative bacterium causing many nosocomial infections such as urinary tract infections, pneumonia and bacteremia. Emergence of multi-drug resistance in P. aeruginosa makes treatment of these infections difficult. New strategies to combat drug-resistance are urgently required. However, new antibiotics are hardly introduced by pharmaceutical companies due to the high cost of producing new drugs and the eventual development of resistance to new antibiotics in organisms (Okeke et al. 2005). Some natural products show antimicrobial properties. Catechins extracted from Camelia sinensis L. (tea) have displayed antibacterial activity against Gram-positive organisms like Staphylococcus aureus and Gram-negatives like Escherichia coli (Taguri et al. 2004). Recent studies in our laboratory reveal that tea catechins have moderate antibacterial activity against drug-sensitive P. aeruginosa (Karunathilake et al. 2007). The objective in the present study is to isolate catechins from refuse green tea and to evaluate the crude catechin fraction (CCF) for antibacterial activity against drug-resistant P. aeruginosa. Over 10-12 % from the total tea harvest is removed as refuse tea - the tea left-over from veins and stems of the tea leaf – during manufacture. New uses of refuse tea will enhance its value and help boost the tea industry in Sri Lanka.
Materials and Methods Refuse green tea samples were obtained from a local factory and CCF was extracted with 70 % aqueous methanol followed by washing with dichloromethane and then with ethyl acetate. Ethyl acetate fraction was concentrated and freeze dried to obtain CCF as a brown colored solid. Thirty P. aeruginosa strains were collected from Teaching Hospital Peradeniya. The identification of P. aeruginosa strains was done using Gram stain, motility, oxidase, catalase, DNase and oxidative-fermentative tests. The antibiotic sensitivity was determined using agar disc diffusion method (CLSI method). The Minimum inhibitory concentration (MIC) of ciprofloxacin

Proceedings of the Young Scientist Forum Symposium
117
against each strain was determined using agar dilution method. P. aeruginosa NCTC 10662, ATCC 27853 were used as the control strains. The antibacterial activity screening of 5 mg mL-1 CCF against all test strains was screened using agar well diffusion assay while MIC of CCF against P. aeruginosa was determined using agar dilution method on Mueller Hinton Agar (MHA). Results and Discussion Twenty three P. aeruginosa strains that had MIC values of ciprofloxacin ranging 8x10⁻³ - >0.128x10⁻³ mg mL-1 were considered as drug-resistant strains. The CCF extracted from refuse tea inhibited six strains of drug-resistant P. aeruginosa in well diffusion assay, and the diameter of the inhibition zones ranged 18 - 21 mm (Fig. 1). The MIC value of the CCF corresponding to each of the 30 drug-resistant P. aeruginosa strains was determined using the agar dilution assay (Andrews 2001), and the results are given in Table 1. MIC values of CCF were in the range 0.3 - >1 mg mL-1. Figure 1. Zones of inhibition around wells in well diffusion assay for catechins against P. aeruginosa (well diameter, 12 mm).
CCF had higher MIC values when compared with ciprofloxacin. Irrespective of the sensitivity of ciprofloxacin for some strains, catechins displayed higher MIC values. In a previous study, the aqueous extract of green tea has exhibited MIC 0.8 mg mL-1 against drug-resistant P. aeruginosa (Radji et al. 2013) while the CCF extracted from fresh tea flush has an MIC value of 0.5 mg mL-1 for eleven P. aeruginosa strains (Karunathilake et al. 2007). Our results together with those from the previous studies suggest that refuse tea catechins are as potent as those available from green tea and fresh tea flush.

Proceedings of the Young Scientist Forum Symposium
118
Table 1. MIC values of ciprofloxacin and CCF against control, drug-resistant and drug-sensitive strains of P. aeruginosa determined using agar dilution
assay
P. aeruginosa (PA) strain
MIC (x 10-3 mg mL-1) of Ciprofloxacin
MIC (mg mL-1) of CCF
PA NCTC 10662 0.25 0.6 PA ATCC 27853 0.25 >1
PA 1 0.25 0.7 PA 2 <0.12 >1
PA 3* 64 >1 PA 4* 128 0.3 PA 5* 64 >1 PA 6 <0.12 >1 PA 7 <0.12 >1
PA 8* 32 >1 PA 9* 32 >1
PA 10* >128 >1 PA 11* >128 0.3 PA 12* >128 0.3 PA 13* 32 >1 PA 14 0.5 >1
PA 15* 16 >1 PA 16* 64 0.3 PA 17* 32 0.6 PA 18* 64 >1 PA 19* 32 >1 PA 20* 8 1 PA 21 2 0.3
PA 22* >128 >1 PA 23 0.25 >1
PA 24* >128 >1 PA 25* 64 0.6 PA 26* 32 0.6 PA 27* 64 0.3 PA 28* 8 >1 PA 29* >128 >1 PA 30* 64 >1
Note: PA*- Ciprofloxacin resistant P. aeruginosa strains

Proceedings of the Young Scientist Forum Symposium
119
Conclusions and Recommendations CCF isolated from refuse green tea displayed moderate antibacterial activity against some of the strains of drug-resistant P. aeruginosa. Further studies on the CCF, to enhance its potency, and its mechanism of action on the bacterial strains are recommended. Acknowledgement Financial assistance by the National Research Council for research grant NRC 12-114 is acknowledged. References Andrews JM (2001) Determination of minimum inhibitory concentrations. Journal of
Antimicrobial Chemotherapy 48: 5–16. Karunathilake AAK, Kumbukgolla WW, Ekanayake EWMA, Thevanesam V, Kumar NS,
Bandara BMR (2007) Screening of antibiotic activity of tea catechins against Pseudomonas aeruginosa and Enterococci. In Proceedings of the Peradeniya University Research Sessions Sri Lanka 12: 89-91.
Okeke IN, Laxminarayan R, Bhutta ZA, Duse AG, Jenkins P, O'Brien TF, Pablos-Mendez A, Klugman KP (2005) Antimicrobial resistance in developing countries. Part I: recent trends and current status. The Lancet Infectious Diseases 5: 481-493.
Radji M, Agustama RA, Elya B, Tjampakasari CR (2013) Antimicrobial activity of green tea extract against isolates of methicillin resistant Staphylococcus aureus and multi- drug resistant Pseudomonas aeruginosa. Asian Pacific Journal of Tropical Biomedicine 3: 663-667.
Taguri T, Tanaka T, Kouno I (2004) Antimicrobial activity of 10 different plant polyphenols against bacteria causing food-borne disease. Biological and Pharmaceutical Bulletin 27: 1965-1969.
Proceedings of the Young Scientist Forum Symposium
120
IN-VITRO AND FIELD EFFICACY OF KASUGAMYCIN ON Xanthomonas campestris pv. campestris, THE BLACK ROT PATHOGEN IN CABBAGE
L.D.C. Mendis1*, K.P. Somachandra2 and M.L.M.C. Dissanayake1
1Faculty of Agricultural Sciences, Sabaragamuwa University of Sri Lanka
2Regional Agricultural Research and Development Centre, Bandarawela
Introduction Cabbage black rot (Xanthomonas campestris pv. campestris (Xcc)) is considered as a very destructive disease of Crucifers worldwide (Sikora 2004). Bacterial diseases in plants are usually controlled by cultural practices and application of antibiotics, up to certain extent. However several limitations and constraints are associated with such practices. Even though copper is not recommended by Department of Agriculture (DOA) as it is a heavy metal, some farmers apply copper-based fungicides to check the disease. Kasugamycin is an antibiotic which belong to active toxicity profile of category IV and it only used in agriculture; there are no known medical or veterinary uses (EAP 2005). It possesses weak or almost no antibacterial activity against common pathogenic bacteria in human or animals (Tamamura et al. 1998). Therefore, use of Kasugamycin in agriculture may not create an adverse effect on environment or human health. Although with all these black rot control methods, still the disease causes heavy losses in cabbage cultivation in the upcountry. Therefore, there is a pressing need to find new feasible control method for black rot disease. Recent studies carried out at RARDC, Bandarawela revealed that Kasugamycin have inhibitory effect on Xcc. Thus, this study was undertaken to investigate the applicability of using Kasugamycin 2 % (Kasumin®) as a feasible control method for black rot disease in cabbage (Brassica oleracea var. capitata) variety “Green Coronet”. Materials and Methods In-vitro experiment was conducted to identify the suitable concentration of Kasugamycin to suppress the growth of Xcc. The selected concentrations were tested in open field under natural disease pressure. Infected leaves with black rot symptoms were collected from field and confirmed the presence of bacteria by oozing out of the bacteria cells under the light microscope. Hundred µl of bacterial suspension was poured onto nutrient agar (NA) plates. Plates were kept in incubator in invert position at 28 °C temperature. Bacterial colonies developed in NA plates after 72 hours were picked up and streaked in yeast dextrose chalk (YDC) for purification; a pathogenicity test was carried out for verification.

Proceedings of the Young Scientist Forum Symposium
121
Three concentrations (100, 200 and 300 ppm) of Kasugamycin solutions were prepared using the commercial formulation 2 % KasuminR. They were tested against Xcc using diffuse disk test (Kirby and Bauer 1961). Copper fungicide (1000 and 2000 ppm) and sterilized distilled water were used as an alternative chemical control and negative control respectively. Diameter of the zone of inhibition was calculated using a metric ruler after 1-2 days after inoculation and data were statistically analyzed to see the differences between treatments. 100 ppm and 200 ppm of Kasugamycin and 2000 ppm copper (DOA recommended concentration) were used for field study. Chemicals were applied as foliar sprays at the time of symptom appearance and continued weekly; four sprays were done during the three months cropping period. Black rot disease severity was calculated using randomly selected eight plants in each plot using 1-4 scale described by Williams et al. (1972) while number of infected leaves plant-1 was counted at the end of the trial and recorded as disease incidence. Data were analyzed using analysis of variance (ANOVA) by SAS and treatment means were separated using the Tukey's Studentized Range (HSD) test at P=0.05. Results and Discussion Isolation and identification of Xanthomonas campestris pv. Campestris:
Plate 3.1.1: Bacterial ooze under 100 magnifications
Plate 3.1.2: Cultured Xcc suspension on Nutrient Agar media
Plate 3.1.3 Xcc streak on Yeast Dextrose Chalk media
Presences of bacteria were confirmed by oozing out of bacterial ooze under 100 × magnification of light microscope (Plate 3.1.1). Bacteria were identified by light gold color colonies on NA medium (Plate 3.1.2) and yellow color culture characteristic on Yeast Dextrose Chalk medium (Plate 3.1.3). Black rot symptoms were observed on leaves of cabbage plants injected with bacterial suspension after 10 to 14 days and no symptoms were developed in leaves inoculated with sterilized distilled water.
1

Proceedings of the Young Scientist Forum Symposium
122
In vitro test: According to results, Kasugamycin at 200 and 300 ppm concentrations showed the significant inhibition (1.5 cm) of bacterial growth and Copper fungicide showed minimum inhibition zone 0.6 cm at both concentrations used (Fig. 3.2.1).
0
0.5
1
1.5
2
100 ppm
Kasugamycin
200 ppm
Kasugamycin
300 ppm
Kasugamycin
1000 ppm
Copper
2000 ppm
CopperMe
an
of
inh
ibit
ory
zo
ne
dia
me
ter
(cm
)
Treatments
1.49a 0.62c 0.63c
Figure 3.2.1: Mean of inhibition zone diameters of Xcc growth under in-vitro condition
1.04bV 1.5a
Table 1. Treatments of the field experiment
Note: Means followed by the same letter are not significantly different according to Tukey's Studentized Range (HSD) test at P ≤ 0.05. *Based on 1-4 scale of Williams (1972) where 1 represent lowest severity and 4 represent highest Kasugamycin in the rate of 100 ppm and 200 ppm showed significant (p=0.05) reduction of disease incidence (8.28) with compare to copper fungicide (Table 3.3.1). However high concentration of Kasugamycin 200 ppm showed lowest diseases severity with compared to lower concentration of Kasugamycin and copper. It revealed 200 ppm of Kasugamycin is best rate to reduced disease severity and disease Incidences. Though, 100 ppm Kasugamycin showed remarkable suppression of Xcc in in-vitro tests, the effect was not observed in the field. Cabbage plants treated with 100 ppm Kasugamycin showed severe black rot symptoms. It may be due to the lack of retention of the chemical in plant tissues or the dosage is insufficient under field conditions. Higher
Treatments Disease incidence Disease severity*
Number of infected leaves
Means of Black rot disease rating
100 ppm Kasugamycin 8.31b 3.09a 200 ppm Kasugamycin 8.28b 2.24b 2000 ppm Copper 9.68a 2.71ab Control 8.74ab 2.42ab
CV % 5.06 6.47
2
3

Proceedings of the Young Scientist Forum Symposium
123
Kasugamycin dose reduced disease incidence however, both doses tested were not suppressed the disease severity. Results revealed that though Kasugamycin showed superior performances in in-vitro tests, but it is less effective to reduced disease severity in field, once cabbage cultivation is infected with pathogen. It may due to effect of various factors at natural environmental conditions which influence the chemical management of plant diseases in the field. Jones and Jones (1985) explained that chemical control methods were relatively ineffective when disease pressure is high. Therefore this phenomenon cannot be explained with the data generated from present study. Further studies were in need to give a firm conclusion on the behavior of Kasugamycin in field level under Sri Lankan context. Conclusions and Recommendations Application of Kasugamycin (200 ppm) is suitable to reduce black rot incidence of cabbage in field level. The conclusion is drawn with the Yala season a result, therefore further studies in Maha season is in need to go for a recommendation. References EPA (2005) Kasugamycin; pesticide fact sheet. U.S. Environmental Protection Agency,
Office of Prevention, Pesticides and Toxic Substances. Federal Register 70: 55748–55752.
Jones JB, Jones JP (1985) The effect of bactericides, tank mixing time and spray schedule on bacterial leaf spot of tomato. Hortscience 98: 244–247.
Sikora EJ (2004) Black Rot of Cabbage. [online] Available at: < www.aces.edu> [Accessed 03 February 2014]. Tamamura T, Sato K (1998) Comparative studies on activities of Kasugamycin and
clinically-used aminoglycoside antibiotics. The Japanese Journal of Antibiotics 52: 57-67.
Williams PH, Staub T, Sutton JC (1972) Inheritance of Resistance in cabbage to black rot. Phytopathology 62: 247-252.
4

Proceedings of the Young Scientist Forum Symposium
124
EFFECT OF WATER QUALITY PARAMETERS ON BENTHIC MACROINVERTEBRATES
D.S.N. Munasinghe1* and M.M.M. Najim1
1Faculty of Science, University of Kelaniya, Kelaniya, Sri Lanka
Introduction Small hydropower projects offer one of the most promising energy resources for long term sustainable development. Small hydropower can, however, exert multiple impacts on local environment, and the impacts which are perceived to be of critical importance are ecological, centered on aquatic flora and fauna. The underlying cause could be attributed to the non-maintenance of sufficient environmental flow downstream, below the weir. The alteration of flow regimes is often claimed to be the most serious and continuing threat to the ecological sustainability of rivers because the duration and seasonal timing of associated low flow conditions can strongly influence organisms directly and via changes to habitat. Benthic macroinvertebrates are an important component of the river biota and are characteristic as stream health indicators. There is a wealth of literature suggesting that macroinvertebrate community composition is tightly linked to in stream hydraulic conditions (i.e flow variation) inadvertently suggesting that the major factor governing benthic macroinvertebrate composition is in stream flow conditions. This research focused on presenting a comparative account of the water quality and the benthic macroinvertebrate species composition and diversity upstream and downstream of the Stream impoundment caused by Mini Hydro Diversion in the Hungampola South/Morontota village section of the Gurugoda Oya. Materials and Methods In the present study six sampling sites (sites A-F) were rationally established in the Hungampola South and Morontota village section in the Gurugoda Oya to capture the effects of different flow regimes on benthic macroinvertebrates. The study was carried out from May to November 2013 with monthly intervals between sampling occasions. At one given sampling site, a transect line perpendicular to the stream was divided into three equal parts and sampling was carried out in the center of these three sections separately. Macroinvertebrates were collected using a standard D-framed dip net consisting of a D-shaped metal frame (0.3 m width and 0.3 m height) holding a conical net (mesh aperture 400 μm). The collected

Proceedings of the Young Scientist Forum Symposium
125
samples were preserved in a solution of Rose Bengal containing 5 % formaldehyde. Later in the laboratory, the material retained was wet sieved through a mesh (0.5 mm aperture) and identified to the nearest possible taxonomic category using standard identification keys. After initial identification, macroinvertebrates were enumerated in their different taxonomic groups. At each sampling site, each time a biological sample was taken, the physico-chemical parameters of the overlying water immediately above the bottom were measured using standard sampling and analytical procedures. The parameters thus measured were temperature, pH, conductivity, water flow velocity, Total Dissolved Solids (TDS), Dissolved Oxygen (DO) and five day Biological Oxygen Demand (BOD5). Results and Discussion During the sampling period (May - November 2013), sixteen (16) different macrobenthic invertebrate taxa belonging to three phyla, viz; Annelida, Mollusca and Arthropoda, were found in the six study sites. In these sites, the number of taxa recorded upstream, above the weir (Sites C, D, E), was higher than that of the downstream sites, below the weir (Sites A, B, C). The total species richness of all the study sites ranged from 7 to 13 during the sampling period and further, the species richness in these six sites increased during months categorized by high rainfall (June and October). Pila sp. dominated all the six study sites where its mean percentage contribution to the total macrobenthic data matrix was 74.49 %. Figure 1. Non-metric Multidimensional Scaling (MDS) plot depicting the temporal and spatial variation of the macrobenthic community assemblages during the study period from May- November 2013.
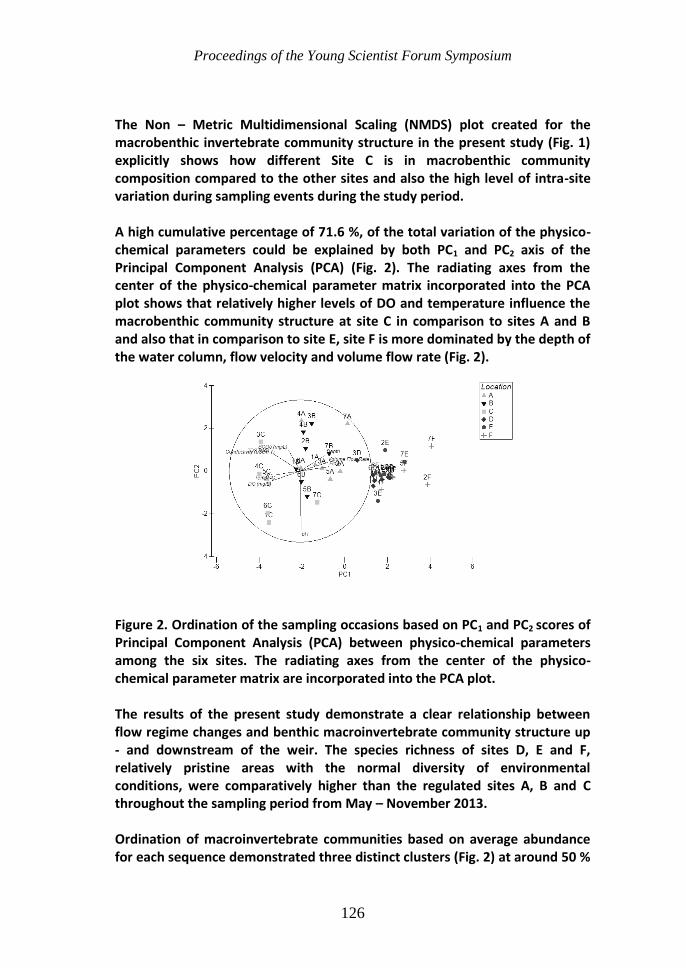
Proceedings of the Young Scientist Forum Symposium
126
The Non – Metric Multidimensional Scaling (NMDS) plot created for the macrobenthic invertebrate community structure in the present study (Fig. 1) explicitly shows how different Site C is in macrobenthic community composition compared to the other sites and also the high level of intra-site variation during sampling events during the study period. A high cumulative percentage of 71.6 %, of the total variation of the physico-chemical parameters could be explained by both PC1 and PC2 axis of the Principal Component Analysis (PCA) (Fig. 2). The radiating axes from the center of the physico-chemical parameter matrix incorporated into the PCA plot shows that relatively higher levels of DO and temperature influence the macrobenthic community structure at site C in comparison to sites A and B and also that in comparison to site E, site F is more dominated by the depth of the water column, flow velocity and volume flow rate (Fig. 2). Figure 2. Ordination of the sampling occasions based on PC1 and PC2 scores of Principal Component Analysis (PCA) between physico-chemical parameters among the six sites. The radiating axes from the center of the physico- chemical parameter matrix are incorporated into the PCA plot. The results of the present study demonstrate a clear relationship between flow regime changes and benthic macroinvertebrate community structure up - and downstream of the weir. The species richness of sites D, E and F, relatively pristine areas with the normal diversity of environmental conditions, were comparatively higher than the regulated sites A, B and C throughout the sampling period from May – November 2013. Ordination of macroinvertebrate communities based on average abundance for each sequence demonstrated three distinct clusters (Fig. 2) at around 50 %

Proceedings of the Young Scientist Forum Symposium
127
similarity in the macrobenthic invertebrate community structure over the period of record (May – November 2013) (Fig. 2; NMDS 2D stress 0.14). ANOSIM confirmed that assemblage composition differed statistically between these three clusters (P < 0.05, Global R 0.751). The most noticeable fact was that site C clustered separately and had the most intra-site variations of taxa between sampling occasions. It was interesting to note that Site C was mostly dominated by nymph varieties throughout the sampling period. Varieties representing orders Ephemeroptera, Plecoptera and Tricoptera (EPT) (For study purposes, the presence of mayfly nymph, stonefly larva and caddisfly larva are taken as the presence of EPT taxa and as EPT taxa richness) were prominant. Rader and Belish (1999) suggested that an increase in water temperature in the dewatered zone in one of their study streams created more favourable conditions for Mayflies, in turn causing increased densities. Also the presence of in-stream rock substrata increases mayfly abundances. High DO levels recorded at site C could also be an important factor in EPT taxa abundance, especially Order Plecoptera which has a high requirement for oxygen. Analysis of physico-chemical properties at this location also show that extreme values were recorded here. Conclusions and Recommendations The study revealed how the species richness and species diversity of the macrobenthic fauna up and downstream of the Stream impoundment caused due to Mini Hydro diversion, as well as the prevailing physico - chemical parameters among the study sites in the Hungampola South/Morontota village section of the Gurugoda Oya varied significantly. It can be also inferred that the flow regime changes play an important role in structuring the benthic macroinvertebrate communities in the region. References Dewson ZS, James AB, Death RG (2007) A review of the consequences of decreased
flow for instream habitat and macroinvertebrates. Journal of the North American Benthological Society 26: 401-415.
Finn MA, Boulton AJ, Chessman BC (2009) Ecological responses to artificial drought in two Australian rivers with differing water extraction. Fundamental and Applied Limnology 175: 231-248.
Rader RB, Belish TA (1999) Influence of mild to severe flow alterations on invertebrates in three mountain streams. Regulated Rivers: Research and Management 15: 353-363.
Wills TC, Baker EA, Nuhfer AJ, Zorn TG (2006) Response of the benthic macroinvertebrate community in a northern Michigan stream to reduced summer streamflows. River Research and Applications 22: 819-836.

Proceedings of the Young Scientist Forum Symposium
128
DEGREE OF MATERNAL TRANSFER OF ANTIBODIES AGAINST MEASLES, MUMPS AND RUBELLA TO NEWBORNS OF PRE- AND POST-
VACCINATION ERA MOTHERS
M. Nadhikala1,2, P.P.S.L Pathirana1*, S. Peiris4, S.M. Handunnetti3 and G.C.S. Galagoda2
1Department of Parasitology, Faculty of Medicine, University of Colombo
2Department of Virology, Medical Research Institute, Sri Lanka
3Institute of Biochemistry, Molecular Biology and Biotechnology, University of
Colombo 4Epidemiology Unit, Ministry of Health, Sri Lanka
Introduction Primary protection against measles, mumps and rubella at birth is provided mainly by maternal antibodies and it gradually decreases with time. These antibodies could hamper the humoral antibody response of infant to vaccination. According to Kacica (1995), the antibody levels were found to be less in mothers born after the beginning of vaccination era when compared with women born before the vaccination era who had natural measles. In Sri Lanka measles vaccination era can be considered as after 1987 since coverage reached 60 % of the population in the national immunization programme that year. The mothers who are below 27 years of age have had measles vaccination and thus could be expected to have anti-measles antibodies which could protect their infants during early infancy. Mothers, who are older than 27 years who were born in pre vaccination era, may not be immune to measles unless they had a natural infection. The prevalence of maternal antibody is based on 3 principal determinants: starting level of maternal antibody, placental transfer of maternal antibody and the rate of decay of maternal antibody after birth. The starting level of antibody depends on the mothers’ vaccination and infection history. Gestational age defines placental transfer therefore preterm neonates receives significantly fewer antibodies (i.e., longer gestation results in a higher ratio). Nicoara (1999) states active placental transfer of Immunoglobulin G (IgG) begins during the third trimester and increases sharply thereafter. At the end of gestation, IgG concentrations in fetal serum exceed maternal levels. Leuridan (2010) suggests HIV- type 1 infection and placental malaria negatively affect placental transfer resulting in less antibodies in infants. The rate of decay is related to maternal age and maternal antibody titer. Early antibody loss in infants is also related to lower maternal age. Decay of maternal antibodies has led to the necessity of

Proceedings of the Young Scientist Forum Symposium
129
vaccination to develop active immunity. Data on antibody prevalence in infants or their mothers was lacking in Sri Lanka to decide the proper timing of the measles, mumps and rubella combined (MMR) vaccination for it to be effective to achieve maximum benefit from vaccination. Therefore studying the level of maternal antibody and the degree of maternal transfer will help for vaccination programme. The objectives of the study were to compare antibody titres in pre- and post-vaccination era mothers (born before and after the year 1987, respectively) and to determine the degree of maternal antibody transfer to their newborns. Materials and Methods This was a cross sectional descriptive study. Two age groups of mothers; below and above 27 years of age who are in the last trimester of pregnancy, were recruited to the study from De Soysa Hospital for Women, Colombo. Blood samples were collected from 100 mothers (venous blood) and their newborns (using cord blood) after getting their written consent. Data on previous history of measles, mumps and rubella infections, vaccination history of the mother, gestational age of baby and weight at delivery of baby were collected. Pre-term and low birth weight babies were excluded. Mothers with any known immunological impairments and who were undergoing administration of blood products or immunoglobulins were also excluded. Mothers and their newborns were categorized into two groups based on the age of the mother; pre- and post-vaccination era mothers and their newborns. There were 57 mothers of pre-vaccination era and 43 mothers of post-vaccination era. 65 % of them had history of prior infections of measles, mumps or both. Ninety eight of the mothers had been vaccinated against rubella and 44 against measles. Antibody levels were measured using commercial ELISA kits (Serion Immundiagnostica GmbH) following manufacturers’ instructions. The cut-off level of sero-positivity for measles, mumps and rubella were considered as 200 mIU mL-1, 100 UmL-1 and 20 IU mL-
1, respectively. The data was analyzed using SPSS software. Mean antibody levels were compared using Student’s t-test. The ethical clearance for this study was obtained from Ethics review committee of Medical Research Institute, Colombo. Results and Discussion ELISA results showed 91 % and 93 % of pre- and post- vaccination era mothers respectively were sero-positive for measles. Similarly, 98 % and 95 % of newborns delivered by pre- and post- vaccination era mothers respectively were sero-positive for measles. The mean IgG concentrations of measles antibodies in newborns exceeded that of maternal levels in a ratio of 2.2:1 in

Proceedings of the Young Scientist Forum Symposium
130
pre-vaccination era mother-infant pairs and in 1.88:1 ratio in post-vaccination era mother-infant pairs. The level of measles antibodies in newborns was significantly correlated with that of their mothers (r=0.818, p<0.001 in pre-vaccination era group; r=0.827, p<0.001 in post-vaccination era group). Pre-vaccination era mothers and their newborns were seropositive for mumps (86 % and 89 %) whereas 93 % and 88 % of sero-positivity was seen in post-vaccination era mothers and their newborns, respectively. All the mothers who had anti-mumps antibodies had transferred antibodies to their newborn. The ratios of IgG concentrations of pre- and post-vaccination era mother-infant pairs were 0.67:1 and 0.74:1, respectively. The level of mumps antibodies in newborns was significantly correlated with that of their mothers (r=0.751, p<0.001 in pre-vaccination era group; r=0.841, p<0.001 in post-vaccination era group). The prevalence of sero-positivity for rubella in pre-vaccination era mother-infant pairs were 94 % and 100 %, respectively and in post-vaccination era it was 95 % and 97 %, respectively. A significant positive correlation was observed between the level of rubella antibodies in mothers and their newborns (r=0.764, p<0.001 in pre-vaccination era group; r=0.865, p<0.001 in post-vaccination era group). The IgG concentration of newborns was higher than that of their mothers in both groups (1.26:1 in pre-vaccination era mother-infant pairs and 1.34:1 in post-vaccination era mother-infant pairs). The results showed that pre-vaccination era mothers had significantly higher levels of antibodies compared to post-vaccination era mothers because they are most likely to have acquired immunity through infection whereas post-vaccination era mothers had less chance for natural boosting due to high vaccination coverage. Although the pre-vaccination era mothers were older than the post-vaccination era mothers, they had significantly higher levels of antibodies against all three diseases, compared to post-vaccination era mothers. This may imply that immunity acquired through infection is long lasting than immunity acquired through vaccination. The degree of maternal antibody transfer to the newborn infants appears to depend on the antibody levels of the mother. Thus the newborns of pre-vaccination era mothers had higher levels of antibodies transferred to them than the newborns of post-vaccination era mothers. An efficient transfer of maternal antibodies has occurred and a majority of the infants were sero-positive (97 % for measles, 89 % for mumps and 99 % for rubella). Conclusions and Recommendations Mothers who were born in the pre- vaccination era and their newborns had higher levels of IgG compared to post-vaccination era mothers and their newborns. There is a high degree of maternal antibody transfer to the

Proceedings of the Young Scientist Forum Symposium
131
newborns against all three diseases giving rise to protective levels of maternal IgG levels in newborns. It is recommended to expand the study consisting larger sample size with assessing functional antibody levels. Acknowledgement Financial assistances by Medical Research Institute for research grant 48/2011 and National Science Foundation for research grant NSF/SCH/ 2013/07 are acknowledged. References Kacica MA (1995) Measles antibodies in women and infants in the vaccine era.
Journal of Medical Virology 45: 227-229. Leuridan E (2010) Early waning of maternal measles antibodies in era of measles
elimination: Longitudinal study. British Medical Journal 340: 1626. Maldonado YA (1995) Early loss measles antibody in infants of mothers with vaccine-
induced immunity. Pediatrics 96: 447-450. Nicoara C (1999) Decay of passively acquired maternal antibodies against measles,
mumps and rubella viruses. Clinical and Diagnostic Laboratory Immunology 6: 868-871.
Proceedings of the Young Scientist Forum Symposium
132
IDENTIFICATION OF DIFFERENTIALLY EXPRESSED GENES IN Brassica juncea AND Camelina sativa UPON Alternaria brassicae CHALLANGE
N.M.C. Nayanakantha1*, S. Rawat2 and A. Grover2
1Rubber Research Institute of Sri Lanka, Dartonfield, Agalawatta, Sri Lanka
2National Research Centre on Plant Biotechnology,
Indian Agricultural Research Institute, New Delhi, 110012, India
Introduction The necrotrophic pathogen Alternaria brassicae causes the globally devastating alternaria black spot disease of Indian mustard (Brassica juncea), an important oilseed crop. No satisfactory source of resistance against A. brassicae has been identified among crop Brassica species. However, resistance to A. brassicae has been found in distantly related species of the family Brassicaceae such as Camelina sativa. A large number of defense-related genes are up-or down-regulated during plant-pathogen interactions. Therefore, it is important to understand the network of genes that govern the resistance to A. brassicae in C. sativa as compared to B. juncea. In this context, suppression subtractive hybridization (SSH) and macroarray (reverse Northern blot) techniques were employed to identify putative defense-related genes expressed during the compatible A. brassicae -B. juncea and incompatible A. brassicae- C. sativa interactions. Materials and Methods Forty five days old plants of C. sativa and B. juncea were inoculated with A. brassicae. Leaf samples were collected at different time intervals viz., 0, 2, 4, 8, 12, 24, 48, 72 and 96 h post inoculation. Control samples were collected from sterile distilled water treated plants. Total RNA was isolated from the A. brassicae inoculated (tester) and water-inoculated (control/driver) leaf tissues of B. juncea and C. sativa using TRIzolTM Reagent (Invitrogen, USA). For each plant species, Poly(A)+ RNA was purified separately from pooled RNA from infected samples using an Oligotex mRNA Midi Kit (Qiagen, US). SSH was performed using the PCR-Select cDNA Subtraction Kit following the guidelines of the manufacturer (Clontech, USA). Subtracted cDNA were inserted directly into pGEM-T Easy T/A cloning Vector (Promega, USA) and then were transformed into Escherichia coli DH5α competent cells (New England Bioscience, UK) in Luria Agar plates with ampicillin (100 mg L-1), X-gal (20 mg mL-1) and IPTG (200 mg mL-1). The cDNA inserts of the recovered positive clones, based on blue/white color selection were amplified by colony PCR in a Thermal Cycler (MJ Research,

Proceedings of the Young Scientist Forum Symposium
133
USA) using M13 forward and M13 reverse primers. All PCR products were analyzed by electrophoresis on 1.0 % agarose-gel. The PCR products of the recovered clones of ≥300 bp showing a single band were were spotted onto Hybond-N+ nylon membranes (Amersham International, UK) in 96-well format in duplicate. Single stranded cDNAs from all four RNA populations were synthesized by using a first strand cDNA synthesis kit (Thermo Scientific, USA). The radio-labeled double stranded cDNAs were synthesized using a decalabelling kit (Thermo Scientific, USA) and α32P-dCTP (BRIT, India). Nylon membranes were hybridized with denatured control and experimental cDNA probes. The membranes were washed and then exposed to Kodak X-ray films and stored at -80 oC for 2–3 for autoradiography. Membranes were scanned and the images were quantified by Image quant software (Imagequant Inc., USA). Those showing >2 fold differential expression were selected for sequencing in an ABI3700 capillary sequencer. Raw nucleotide sequences were manually processed for base calling, vector masking, and ambiguous nucleotides. The Lasergene 7-1 software was used to assemble the good quality ESTs. ESTs were compared with database nucleotide collection (nr/nt) using blastx and blastn (http://www.ncbi.nih.gov). Computational annotation of the EST datasets was performed using the Blast2GO software V1.3.3 (http://www. blast2go.org,) with E value thresholds of e−10. Results and Discussion Suppression subtractive hybridization is a relatively simple and efficient tool that can be used to generate cDNAs enriched for differentially expressed genes of both greater and lesser abundance. Subtracted cDNA libraries identified 56 unigenes from B. juncea and 75 unigenes from C. sativa as shown in Table 1. Representative reverse Northern blots and an agarose gel photograph for colony PCR are shown in Plate 1. The number of transcripts coding for several proteins involved in plant defense (including pathogenesis related proteins) or biotic stress were significantly higher in the resistant C. sativa than in the susceptible B. juncea. Pathogenesis-related proteins viz., Defensin, thionin and PR14 were identified in C. sativa while only thionin were identified in B. juncea (Tables 2 and 3). In most SSH studies with pathogen challenge in other plants, a large number of defense-related genes have been identified apart from major PR genes (Yu et al. 2010). In the present study also, defense-related proteins such as WRKY 70 transcription factor, MLP-like protein, serine/threonine kinase and metallothionin were identified in C. sativa but not in B. juncea. These proteins might play an important role in C. sativa for its resistance to A. brassicae. This is the first report on analysis of differentially expressed genes in C. sativa and B. juncea against A. brassicae by SSH technique.

Proceedings of the Young Scientist Forum Symposium
134
Table 1. Complete sequence analysis of the subtractive cDNA libraries of B. juncea and C. sativa.
Plate 1. Representative differential screening results of macroarrays of the SSH libraries of B. juncea and C. sativa (a-d). (a): control cDNAs of C. sativa, (b): A. brassicae challenged cDNAs of C. sativa, (c): control cDNAs of B. juncea, (d): A. brassicae challenged cDNAs of B. juncea. A representative agarose gel photograph of colony PCR showing different insert lengths ranging from 400bp - >1kb (e).
Conclusions and Recommendations In this study, a screening was performed for genes preferentially expressed in resistant C. sativa compared to that in susceptible B. juncea challenge inoculated by A. brassicae. Some of those genes were found up-regulated in both plant species and may play an important role during A. brassicae infection. Further characterization and functional analysis of these putative genes will enhance our understanding of the molecular mechanisms occurring in resistant C. sativa and susceptible B. juncea during A. brassicae infection. It will provide novel target genes for the development of A. brassicae resistant transgenic B. juncea through genetic engineering. This study will undoubtedly
Species Name
No. of clones used for macroarray
No. of clones sequenced
Quality ESTs
No. of contigs
No. of singlets
Total No. of unigenes
B. juncea
672 195 130 29 27 56
C. sativa
768 205 146 46 29 75

Proceedings of the Young Scientist Forum Symposium
135
shed light on defense signaling pathways in C. sativa conferring its resistance
to A. brassicae.
References Diatchenko L, Lau YFC, Campbell AP, Chenchik A, Moqadam F, Huang B, Lukyanov S,
Lukyanov K, Gurskaya N, Sverdlov ED, Siebert PD (1996) Suppression subtractive hybridization: a method for generating differentially regulated or tissue-specific cDNA probes and libraries. Proceeding of the National Academy of Sciences 93: 6025–6030.
Prasath D, Suraby EJ, Karthika R, Rosana OB, Prameela TP, Anandaraj M (2013) Analysis of differentially expressed genes in Curcuma amada and Zingiber officinale upon infection with Ralstonia solanacearum by suppression subtractive hybridization. Acta Physiologia Plantaram 35:3293–330.
Sharma G, Kumar VD, Haque A, Bhat SR, Prakash S, Chopra VL (2002) Brassica coenospecies: a rich reservoir for genetic resistance to leaf spot caused by Alternaria brassicae. Euphytica 125:411-417.
Yu X, Wang X, Wang C, Chen X, Qu Z, Yu X, Han Q, Zhao J, Guo J, Huang L, Kang Z (2010) Wheat defense genes in fungal (Puccinia striiformis) infection. Functional and Integrated Genomics 10:227–239.
Table 2. Defense/ biotic stress-related genes identified from the SSH library of B. juncea using Blas2GO analysis Contig No.
Accession No. of matching sequence
Matching sequence
Matching sequence from data base
Sequence identity (%)
7 ACH88385.1 B. oleracea (var gemmifera)
vegetative storage protein vsp2
81.6
41 ABO32545.1 B. oleracea lipoxygenase (LOX) 98 44 ACJ68108.1 B. napus thionin 84.2
Table 3. Defense/biotic stress-related genes identified from the SSH library of C. sativa using Blas2GO analysis Contig No.
Accession No. of matching sequence
Matching sequence
Matching sequence from data base
Sequence identity (%)
4 NM_110996.2 A. thaliana serine/threonine kinase 86 5 NP_001077806.1 A. thaliana mlp-like protein 28 (miraculin) 85.8 40 NM_102161.3 A. thaliana
polyketide cyclase dehydrase and lipid transport-like protein (PR14)
79.2
44 NP_181879.1 A. thaliana defensin like proteins 79.4 45 NM_111773.3 A. thaliana metallothionein 74 52 NP_191199.1 A. thaliana WRKY transcription factor 70 76 67 ACJ68108.1 A. thaliana thionin 80.2

Proceedings of the Young Scientist Forum Symposium
136
RELATIONSHIP BETWEEN RENAL FUNCTION PARAMETERS CYSTATIN C, SERUM CREATININE AND BLOOD UREA WITH BODY FAT CONTENT
MEASURED BY BIO- IMPEDANCE ANALYSIS OF APPARENTLY HEALTHY FEMALES LIVING IN A SELECTED URBAN AREA OF COLOMBO DISTRICT
M. S. N. F. Nihla1* and P. P. R. Perera1
1Department of Biochemistry, University of Sri Jayewardenapura
Introduction The term ‘Renal function’ indicates the state of kidney and its efficiency to filter blood. Loss in renal function leads to renal failure which is mainly caused by diabetes or hypertension. Obesity is a leading cause for diabetes and hypertension so as for renal diseases. The prevalence of renal disease is increasing dramatically in the world. Between 8-10 % of the adult population have some form of kidney damage, and every year millions die prematurely of complications related to chronic renal diseases (Dupuis 2013). Body fat content can be accurately determined by bio impedance analysis (BIA) because it has the ability to distinguish fat from muscle. BIA measures percentage body fat, visceral fat content and percentage fat distribution in different compartments of the body by sending an electrical pulse throughout the body. Therefore, BIA can define obesity and central obesity more accurately than anthropometric measures. Renal function could be screened through simple routine tests. Cystatin C, serum creatinine and blood urea are used as biomarkers of kidney dysfunction. Detecting kidney dysfunction at an earlier stage will prevent or slow down the incidence of chronic renal disease and mortality rate. No research has been recorded in Sri Lanka regarding the association of kidney function and BIA. The main objective of this study was to determine the relationship of renal function parameters with body fat percentage and visceral fat content of apparently healthy females living in a selected urban area of Colombo district. Materials and Methods This study was carried out as a descriptive cross sectional study in a community by collecting data from 132 apparently healthy females of Colombo district with no diagnosed long term diseases and who were between 18 to 65 years of age. Sample size was calculated using an online sample size calculator (www.raosoft.com/samplesize.html). Study instruments used were an interviewer administered questionnaire, non-stretchable commercial measuring tape and a Bio electrical impedance

Proceedings of the Young Scientist Forum Symposium
137
analyze machine (Omron Karada Scan Body Fat Analyzer HBF -358, Omron, Japan) An information sheet and a consent form were given to the participants and the procedure was explained to them. Written consent from participants was obtained and data collected using an interviewer administered questionnaire. Bioelectrical impedance analyzer was a portable machine which measures the total body fat percentage, visceral fat content and fat distribution percentages in different body compartments by sending an electrical impulse throughout the body. The machine was kept on a flat surface and the participant was requested to stand on the machine bare footed, holding machine at arm’s length for about 1 min. Height of the participant was fed into the machine and readings obtained. Blood samples were collected by a trained person under aseptic conditions. Blood was drawn from the arm in a sitting position using a sterile syringe after cleaning the area with surgical spirit. Then serum was separated and stored at -20 °C until analysis. Blood urea, serum creatinine and serum cystatin C were analyzed using a fully automated Konelab® analyzer. Data were analyzed using the statistical package for social sciences (SPSS) version 16 and Microsoft excel software. Descriptive analysis was performed to identify the prevalence of different variables (cystatin c, serum creatinine, blood urea, body fat percentage and visceral fat content). One way analysis of variance was used to compare the means of continuous variables. Pearson’s Chi-squared test was used to compare the frequency of categorical variables between groups. Pearson/Spearman correlation was used to analyze the correlation between variables where appropriate. A p- value < 0.05 was considered statistically significant. Ethical clearance for the study was obtained from the Ethics Review Committee, Faculty of Medical Sciences, University of Sri Jayewardenepura (Approval No. HB-04-13). Results and Discussion Among 132 participant’s 40 persons belonged to Sinhala ethnic group and 92 persons to Muslim ethnic group. Table 1 gives the average values of study variables. The study population is at an increased health risk to obesity related diseases due to their high amount of fat deposition in the body. According to the frequency distribution of body fat percentage classification of the study, about 28.0 % of the study population had a ‘high’ body fat percentage and 59.8 % of the population had a ‘very high’ body fat percentage. Only 10.6 % had ‘normal’ body fat percentage and 1.5 % had a ‘low’ body fat percentage. This increased body fat percentage of the population reflects the increase in obesity of this population.

Proceedings of the Young Scientist Forum Symposium
138
Table1. Average values of bio impedance analysis variables and renal function parameters
Variable Mean Reference Value
Body Fat Percentage (%)
35.6 Very High Low: 5.0- 19.9 Normal: 20.0- 29.9 High: 30.0- 34.9 Very High: 35.0- 50.0
Visceral Fat 9.1 Normal Normal: 1- 9.9 High: 10- 14.9 Very High: 15- 30
Cystatin C (mg L-1) 0.95 Normal 1-50 years: 0.55- 1.15 >50 years: 0.63- 1.44
Serum Creatinine (mg dL-1)
0.74 Normal 0.6- 1.1
Blood Urea (mmol L-1) 3.7 Normal 2.1- 7.1
Colombo district is a highly urban area and residents of Colombo district have a life style which leads to obesity. Consumption of fast food and lack of exercise leads to obesity. Females have a higher prevalence of obesity than males and this may be another reason for the higher proportion of obesity in this study population. Table 2. Correlations between renal function parameters and BIA variables
Correlation
coefficient (r) Significance
Cystatin C with Body fat % 0.195 0.025 Cystatin C with Visceral fat content
0.039 0.660
Serum Creatinine with Body fat %
-0.067 0.444
Serum Creatinine with Visceral fat content
-0.139 0.112
Blood Urea with Body fat %
-0.011 0.901
Blood Urea with Visceral fat content
-0.121 0.167
Visceral fat content of the individual reflects their abdominal obesity. According to the frequency distribution of visceral fat content of the study, it shows that 60.6 % of the study population had a ‘normal’ visceral fat content, 21.2 % of the population had a ‘high’ visceral fat content and 18.2 % had a ‘very high’ visceral fat content. Another study done in Sri Lankan females in
Proceedings of the Young Scientist Forum Symposium
139
2008 using DXA scan indicate an average body fat mass of 20.3 kg and 7.7 kg of visceral fat mass (Weerarathna et al. 2008). Research studies have shown that renal function decreases with increasing body fat percentage (Oh et al. 2014). The present study showed a significant correlation (p=0.025) between participants’ cystatin C concentration with their body fat percentage. Neither Serum creatinine or blood urea had a significant relationship with body fat percentage when analyzed with Pearson’s correlation and Pearson’s chi-square tests. This study does not show any association for visceral fat content of the participants’ and their cystatin C, serum creatinnine and blood urea concentrations. This contradicts a study done to examine the association of visceral fat with renal function which revealed that renal function has a significant association with and visceral fat while using cystatin C and not with serum creatinine (Young et al. 2008). Conclusions and Recommondations Renal function parameter cystatin C significantly correlates with the individual’s bio impedance variable body fat percentage. Renal function parameter serum creatinine and blood urea does not relate with participants’ body fat percentage. Renal function parameters cystatin c, serum creatinine and blood urea do not shows a relationship with visceral fat content of the participants. References Dupuis S (2013) World Kidney Day. [Online] Available at: www.worldkidneyday.org
[Accessed 07 09 2013]. Katulanda P, Jayawardena MA, Sheriff MH, Constantine GR, Matthews DR (2010)
Prevalence of overweight and obesity in Sri Lankan adults. Obesity review 11: 751-756.
Oh SW, Ahn SY, Jianwei X, Kim KW, Kim S, Na KY, Chae DW, Kim S, Chin HJ (2014) Relationship between changes in body fat and a decline of renal function in the elderly. PLoS ONE 9: 84052.
Weerarathna TP, Lekamwasam S, Rodrigro M (2008) Prediction of total and visceral fat contents using anthropometric measures of adiposity in women. Ceylon Medical Journal 53: 128-132.
WHO, 2014. Obesity. [Online] Available at: http://www.who.int/gho/ncd/risk factors/ obesity text/ en/ [Accessed 24 06 2014].
Young JA, Hwang SJ, Sarnak MJ, Hoffmann U, Massaro JM, Levy D, Benjamin EJ, Larson MG, Vasan RS, O’Donnell CJ, Fox CS (2008) Association of visceral and subcutaneous adiposity with kidney function. Clinical Journal of the American Society of Nephrology 3: 1786–1791.
Proceedings of the Young Scientist Forum Symposium
140
COMBINED APPLICATION OF 1-METHYLCYCLOPROPENE (1-MCP) AND ASCORBIC ACID BEST IMPROVES THE POSTHARVEST LONGEVITY AND
QUALITY OF Alstroemeria SPP. CUT FLOWERS
B.S. Obadamudalige1*, C.K. Beneragama2, G. Wijesuriya2 and S.M.M.R. Mawalagedera1
1Department of Plant Sciences, Faculty of Agriculture, Rajarata University of Sri
Lanka, Puliyankulama, Anuradhapura, Sri Lanka 2Department of Crop Science, Faculty of Agriculture, University of Peradeniya,
Peradeniya, Sri Lanka
Introduction Alstroemeria spp., commonly known as Peruvian Lily (Choon 2012), is a highly demanded cut flower due to availability of numerous and vibrant colors. Alstroemeria is an ethylene sensitive genus in which the ethylene induced postharvest degradation symptoms include; petal wilting, transparency of petals, petal drop, premature yellowing of leaves and short life of leaves (Choon 2012). These changes reduce the economic value of Alstroemeria spp. cut flowers. The ethylene induced postharvest degradation of cut flowers can be mitigated by applying chemicals, which inhibit ethylene biosynthesis and/or block ethylene receptors. 1-Methylcyclopropene (1-MCP), a blocker of ethylene receptors, is structurally similar to ethylene that has a ten-fold more affinity to ethylene receptors than ethylene. Ascorbic acid (vitamin C) is an antioxidant, which donates electrons to neutralize free radicals. The objective of the study was to improve the vase life and to maintain postharvest quality of Alstroemeria spp. with 1-methylcyclopropene and ascorbic acid application alone and in combination. Materials and Methods Inflorescences of red Alstroemeria spp., with at least three florets were completely red were harvested from fields of commercial growers in Meepilimana, Sri Lanka. The inflorescences were treated either with 200 mL of 57 mM ascorbic acid or with 1-MCP (0.25 ppm) or with both together for six hours. The tested concentrations and exposure duration were optimized in preliminary studies (Obadamudalige et al. 2014). Vase life was counted as the number of days taken for the shedding of first petal in florets. The Percentage fresh weight loss (FWL) for inflorescences was calculated. Total chlorophyll content of leaf extracts and, anthocyanin and glucose contents were measured in petal extracts. The analysis of variance (ANOVA) procedure was performed for the vase life, percentage fresh weight loss and concentrations
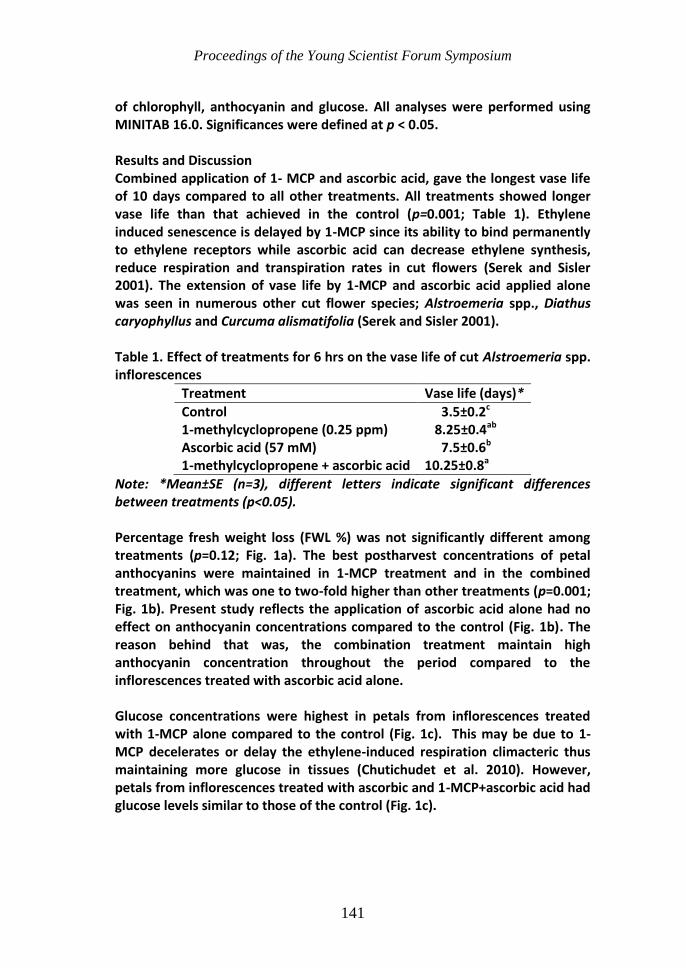
Proceedings of the Young Scientist Forum Symposium
141
of chlorophyll, anthocyanin and glucose. All analyses were performed using MINITAB 16.0. Significances were defined at p < 0.05. Results and Discussion Combined application of 1- MCP and ascorbic acid, gave the longest vase life of 10 days compared to all other treatments. All treatments showed longer vase life than that achieved in the control (p=0.001; Table 1). Ethylene induced senescence is delayed by 1-MCP since its ability to bind permanently to ethylene receptors while ascorbic acid can decrease ethylene synthesis, reduce respiration and transpiration rates in cut flowers (Serek and Sisler 2001). The extension of vase life by 1-MCP and ascorbic acid applied alone was seen in numerous other cut flower species; Alstroemeria spp., Diathus caryophyllus and Curcuma alismatifolia (Serek and Sisler 2001). Table 1. Effect of treatments for 6 hrs on the vase life of cut Alstroemeria spp. inflorescences
Treatment Vase life (days)*
Control 3.5±0.2c 1-methylcyclopropene (0.25 ppm) 8.25±0.4ab Ascorbic acid (57 mM) 7.5±0.6b 1-methylcyclopropene + ascorbic acid 10.25±0.8a
Note: *Mean±SE (n=3), different letters indicate significant differences between treatments (p<0.05). Percentage fresh weight loss (FWL %) was not significantly different among treatments (p=0.12; Fig. 1a). The best postharvest concentrations of petal anthocyanins were maintained in 1-MCP treatment and in the combined treatment, which was one to two-fold higher than other treatments (p=0.001; Fig. 1b). Present study reflects the application of ascorbic acid alone had no effect on anthocyanin concentrations compared to the control (Fig. 1b). The reason behind that was, the combination treatment maintain high anthocyanin concentration throughout the period compared to the inflorescences treated with ascorbic acid alone. Glucose concentrations were highest in petals from inflorescences treated with 1-MCP alone compared to the control (Fig. 1c). This may be due to 1-MCP decelerates or delay the ethylene-induced respiration climacteric thus maintaining more glucose in tissues (Chutichudet et al. 2010). However, petals from inflorescences treated with ascorbic and 1-MCP+ascorbic acid had glucose levels similar to those of the control (Fig. 1c).

Proceedings of the Young Scientist Forum Symposium
142
a
b
c
d
Figure 1. Effect of treatments on (a) percentage fresh weight loss, concentrations of (b) anthocyanin, (c) glucose and (d) chlorophyll in cut Alstroemeria spp. inflorescences measured one, three, five and seven days after treatments with (C) control, (M) 1-methylcyclopropene 0.25 ppm, (A) ascorbic acid 57 mM and the (M+A) combination of the two for 6 hrs. Mean ± SE (n=3) Bars with different letters indicate significant differences across treatments within the day (p<0.05). The combined treatment and 1-MCP alone, best maintained the chlorophyll concentration in leaves, which was five and three times higher compared to those in the control at the seventh day (p<0.05; Fig. 1d). The retention of green color in the leaves is an important postharvest quality parameter in

Proceedings of the Young Scientist Forum Symposium
143
Alstroemeria spp. in which ethylene induces rapid degradation of chlorophyll. Blocking of ethylene receptors by 1-MCP may have inhibited the ethylene induced chlorophyll degradation in leaves of Alstroemeria spp. Conclusions and Recommendations Of the tested postharvest treatments of Alstroemeria spp., combined application of 1-MCP 0.25 ppm and ascorbic acid 57 mM was the most effective treatment for extending vase life and maintaining postharvest quality. Experiment can be repeated under different storage temperatures before, after and during 1-MCP and ascorbic acid treatments to improve vase life and postharvest quality of Alstroemeria spp. cut flowers. References Choon SY, Marta S (2012) The effect of postharvest treatments on flower quality and
vase life of cut Alstroemeria ‘Dancing Queen’. Journal of Fruit and Ornamental Plant Research 20: 147-160.
Chutichudet P, Chutichudet B, Boontiang K (2010) Effect of 1- MCP on vase life and other postharvest qualities of patumma (Curcuma alismatifolia) cv. ‘Chiang Mai Pink’. Trends in Horticulture Research 1: 1-11.
Obadamudalige BS, Beneragama CK, Mawalagedera SMMR (2014) Combined application of 1-methylcyclopropene (1-MCP) and ascorbic acid best improves the postharvest longevity and quality of Alstroemeria spp. cut flowers. In 6
th Annual Research Symposium Proceedings, Faculty of
Agriculture, Rajarata University of Sri Lanka, P.H.P. Prasanna (Eds.) pp. 72. Rajarata University of Sri Lanka, Sri Lanka.
Serek M, Sisler EC (2001) Efficiency of inhibitors of ethylene binding in improvement of the postharvest characteristics of potted flowering plants. Postharvest Biology and Technology 23: 161-166.
Proceedings of the Young Scientist Forum Symposium
144
THE FACTORS HAMPERING THE INNOVATION IN SMALL AND MEDIUM SCALE FIRMS IN THE FOOD AND BEVERAGE INDUSTRY IN SRI LANKA
H.M.L. Peiris1, G.H.I. Anjalee1* and A.M.T.P. Athauda1
1Department of Agribusiness Management, Faculty of Agriculture and Plantation
Management, Wayamba University of Sri Lanka, Makandura, Gonawila
Introduction Food and beverages industry is one of the fastest growing sectors in the Sri Lankan economy and has the potentials to grow further in short and medium term. The product range of the sector consists of processed vegetables, fruits and juices, confectionary and bakery products, rice and cereals, beverages and animal fodder. In year 2011, the contribution to the Gross Domestic Product (GDP) by the food and beverages industry was recorded as 7.9 %. In Sri Lanka, there are 3340 registered small and medium scale food and beverage firms are located island wide and 55.2 % of them are established in the Western and North Western provinces of the country. Innovation is considered as the backbone of entrepreneurship and widely recognized as a key strategy to gain competitive advantages against nations and firms. In entrepreneurial literature it is widely evident that, small firms are much more innovative than large scale firms. The ability to introduce innovation often depends on the characteristics of the small firm. Less bureaucracy, owner expertise, and intimacy between owners and customers can facilitate implementation of innovation. However, small firms are particularly restricted for introducing innovation by their limited physical resource base. In this light, the study was focused on identifying barriers for innovation among small and medium scale firms in the food and beverages industry in Sri Lanka and in turn, to investigate the degree to which those barriers have an effect on the number of product, process and management innovations of food and beverages processing firms. Materials and Methods The data were collected from 155 managers or owners of small and medium scale firms in the food and beverage industry via face-to-face interviews conducted in the Western and North Western provinces covering five districts namely; Colombo, Gampaha, Kalutara, Kurunegala and Puttlam. The sample included six firm types namely; Tea and Non-Alcoholic Beverages (TNAB),

Proceedings of the Young Scientist Forum Symposium
145
Coconut Products (CP), Dairy Products (DP), Fruits, Vegetables and Processed Foods (FVP), Bakery Products (BP) and Other firms (OF). The sample was selected through random sampling technique based on a list obtained from the Department of Census and Statistics, Sri Lanka. A questionnaire was structured and used both Sinhala and English versions and each innovation barrier was scaled using five point Likert Scale ranging from “strongly agree” to “strongly disagree” giving 5 to 1 value range to identify the magnitude of the each barrier to the entrepreneur. Kruskal-Wallis test was conducted among the both internal and external barriers for innovation separately. An index was developed to measure the internal and external barriers. Ordinal Logistic Regression Model was used to evaluate the relationship between number of firm innovations and internal barriers, external barriers for innovation, firm age, average annual turnover, industry type, and number of employees. Results and Discussion The data on innovations were collected under three categories namely; product, process and management innovations. Regardless the firm types, majority of the firms were involved in introducing product innovations compared to other two categories (Fig. 1). Management related innovations were the least common type of innovations among the firms.
51% 57% 58% 54% 56% 57%
32%32% 26% 28% 28% 28%
17% 11% 16% 18% 16% 15%
0%
20%
40%
60%
80%
100%
TNAB CP DP FVPF BP Other
Product Process Management
Figure 1. Product, process and management innovations in each firm type Note: Non-Alcoholic Beverages (TNAB), Coconut Products (CP), Dairy Products (DP), Fruits, Vegetables and Processed Foods (FVPF), Bakery Products (BP) The median values of barriers to innovation were examined by Kruskal-Wallis Test separately for two categories. The probability value (P = 0.000) for the

Proceedings of the Young Scientist Forum Symposium
146
both analysis of internal and external barriers depicted that at least one internal/ external barrier is different from other internal/external barriers. Four out of eight internal barriers were having a median value of three or higher while, four out of six external barriers also had a median value of three or higher (Table 1). Table 1. Results of Kruskal-Wallis test
Internal Barriers External Barriers
Barrier MV AR Barrier MV AR
High cost 4.00 1101.9 Insufficient government support
4.00 602.1
Lack of qualified personals
4.00 878.7 Lack of information about technology
4.00 507.6
Difficulty of keeping qualified employees
3.00 1039.4 Economic turbulence 3.00 529.5
Manager resistance to change
3.00 636.3 Lack of market information
3.00 215.7
Poor accessibility to financial resources
2.00 830.4 Lack of regional infrastructure
1.00 715.1
Excessive risk 1.00 299.9 Lack of external partner opportunities
1.00 223.0
Lack of internal employee training
1.00 353.6
Employee resistance to change
1.00 845.9
Note: MV=Median Value; AR = Average Ranking
Table 2. Results of ordinal logistic regression
Variable Coefficient Probability
Internal barriers -0.0352 0.605 External barriers -0.0679 0.089* Firm age -0.3510 0.103 Firm type: TNAB CP DP FVPF BP
1.6623 0.8999 0.9846
-0.7692 -0.6021
0.072* 0.130
0.061* 0.128 0.584
Average Number of Employees: <5 5 – 10 11 – 15 16 - 20
0.7352 -0.1670 -0.6954 -1.4529
0.606 0.899 0.557 0.227
Average Annual Turnover : < Rs. 1 million Rs. 1 – 2 million Rs. 2 – 3 million Rs. 3 – 4 million
2.3479 0.4251
-0.5050 -0.3327
0.056* 0.701 0.632 0.723
Proceedings of the Young Scientist Forum Symposium
147
The ordinal logistic regression examined the relationship between number of innovations and number of internal barriers, external barriers, firm age, and industry type, average number of employees and average annual turnover of firm (Table 2) and the results indicate that the internal barriers are insignificant to innovation hence have a negative relationship with number of innovations. External barriers were significant at α=0.1 and the negative coefficient suggests that there is a negative relationship with number of innovations. Among firm types, TNAB and DP were significant and have a positive relationship to number of innovations. Out of average annual turnover, only less than one million rupees was significant and has a positive relationship to innovations. Conclusions and Recommendations For a small and medium scale firm in food and beverage industry, the major internal barriers for innovation are high cost, lack of qualified personals, difficulty of keeping qualified employees and manager’s resistance to change. The critical external barriers were insufficient government support, economic turbulence, lack of market information and lack of information about technologies. Only external barriers were found to be significantly associated with number of innovations. Relationship of both internal and external barriers showed a negative impact on the number of innovations introduced by the firm. Among the significant external barriers, the highest ranked barriers were insufficient government support and lack of information about technology. The findings of this study open avenues for relevant authorities and policy makers to re-think on the growth and development of food and beverage sector. Even though, food and beverage sector has been identified as one of the fastest growing industries in the Sri Lankan economy, these barriers to introduce new products and processes would one day affect on hampering that progress. Therefore, it is recommended that the government should make the policy decisions regarding the growth and development of small and medium scale firms in the food and beverage industry in Sri Lanka in order to harvest the optimum benefits from the sector. References Annual Survey of Industries (2011) Department of Census and Statistics, Colombo, Sri
Lanka. Central Bank Annual Report (2011) Central Bank of Sri Lanka, Colombo. Dosi G (1988) Sources, procedures, and microeconomic effects of innovation. Journal
of Evolutionary Economic Literature 26: 1120–1171.
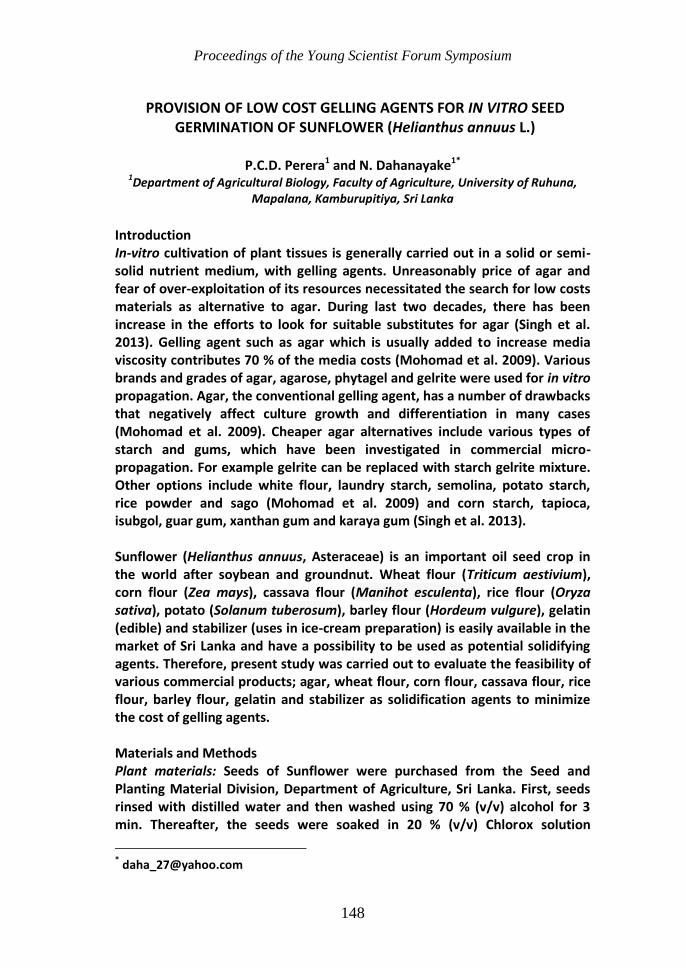
Proceedings of the Young Scientist Forum Symposium
148
PROVISION OF LOW COST GELLING AGENTS FOR IN VITRO SEED GERMINATION OF SUNFLOWER (Helianthus annuus L.)
P.C.D. Perera1 and N. Dahanayake1*
1Department of Agricultural Biology, Faculty of Agriculture, University of Ruhuna,
Mapalana, Kamburupitiya, Sri Lanka
Introduction In-vitro cultivation of plant tissues is generally carried out in a solid or semi-solid nutrient medium, with gelling agents. Unreasonably price of agar and fear of over-exploitation of its resources necessitated the search for low costs materials as alternative to agar. During last two decades, there has been increase in the efforts to look for suitable substitutes for agar (Singh et al. 2013). Gelling agent such as agar which is usually added to increase media viscosity contributes 70 % of the media costs (Mohomad et al. 2009). Various brands and grades of agar, agarose, phytagel and gelrite were used for in vitro propagation. Agar, the conventional gelling agent, has a number of drawbacks that negatively affect culture growth and differentiation in many cases (Mohomad et al. 2009). Cheaper agar alternatives include various types of starch and gums, which have been investigated in commercial micro-propagation. For example gelrite can be replaced with starch gelrite mixture. Other options include white flour, laundry starch, semolina, potato starch, rice powder and sago (Mohomad et al. 2009) and corn starch, tapioca, isubgol, guar gum, xanthan gum and karaya gum (Singh et al. 2013). Sunflower (Helianthus annuus, Asteraceae) is an important oil seed crop in the world after soybean and groundnut. Wheat flour (Triticum aestivium), corn flour (Zea mays), cassava flour (Manihot esculenta), rice flour (Oryza sativa), potato (Solanum tuberosum), barley flour (Hordeum vulgure), gelatin (edible) and stabilizer (uses in ice-cream preparation) is easily available in the market of Sri Lanka and have a possibility to be used as potential solidifying agents. Therefore, present study was carried out to evaluate the feasibility of various commercial products; agar, wheat flour, corn flour, cassava flour, rice flour, barley flour, gelatin and stabilizer as solidification agents to minimize the cost of gelling agents. Materials and Methods Plant materials: Seeds of Sunflower were purchased from the Seed and Planting Material Division, Department of Agriculture, Sri Lanka. First, seeds rinsed with distilled water and then washed using 70 % (v/v) alcohol for 3 min. Thereafter, the seeds were soaked in 20 % (v/v) Chlorox solution

Proceedings of the Young Scientist Forum Symposium
149
(Sodium hypochlorite) for 20 min. Those seeds were rinsed in sterile distilled water for 4-5 times. They were dried onto sterile filter papers. Seed coat was removed with sterile scalpers and pliers. Seeds were introduced to glass tubes (1 seed per tube) containing 3ml of hormone free Murashige and Skoog (MS) basal medium, which was solidified by different gelling agents as stated earlier. The culture medium used for all the experiments was based on MS medium with 30 gL-1 sucrose (Dahanayake et al. 2012) and addition of 100 gL-1 different gelling agents (agar - control, wheat flour, corn flour, cassava flour, potato flour, rice flour, barley flour, stabilizer and gelatin) without plant growth regulators. Medium was autoclaved for 21 minutes at 121 °C after adjusting the pH to 5.8. Experimental design: The lengths of the aseptically raised plant seedlings and number of seeds germinated were recorded after four weeks period. Experiment was repeated three times. All experiments reported here were repeated at least five times with three replicates. Statistical analysis was performed with Duncan’s Multiple Range Test using SAS software (version 9.1.3). The cost analysis was performed using the following formulae;
100/cos
/cos100(%)
kgagaroft
kgagentgellingalternateoftagarwithcompareddeductionCost
Results and Discussion Seedling height as influenced by different gelling agents: The highest seedling height of 6.83 cm observed at the end of the fourth week in MS medium solidified with agar was not significantly different from corn flour (6.43 cm). The lowest seedling height was observed in medium solidified with gelatin (0.12 cm). In addition, treatments rice flour (1.6 cm) and wheat flour (1.73 cm) were not significantly different from each other, while cassava flour (0.77 cm), stabilizer (0.29 cm), grind potato (0.18 cm) and gelatin (0.12 cm) were also on par with each other (Table 1). Seed germination percentage: Highest numbers of seed germination percentage were observed in medium solidified with agar (85 %). Second highest number of seed germination percentage was corn flour (80 %) while third was observed by barley (70 %). Agar, corn flour and barley flour were not significantly different. Number of germinated seeds percentage in wheat flour (40 %) and rice flour (40 %) were not significantly different from each other; besides, cassava flour (10 %), stabilizer (10 %), gelatin (5 %) and grind potato (5%) also not significantly different with each other (Table 1). Corn flour has been found to be the best alternative to agar among used gelling agents. Similar results were observed by Henderson and Kinnersley (1988) and Daud et al. (2011). Growth and differentiation of plant cell cultures was increased when media were gelled with corn flour instead of agar.
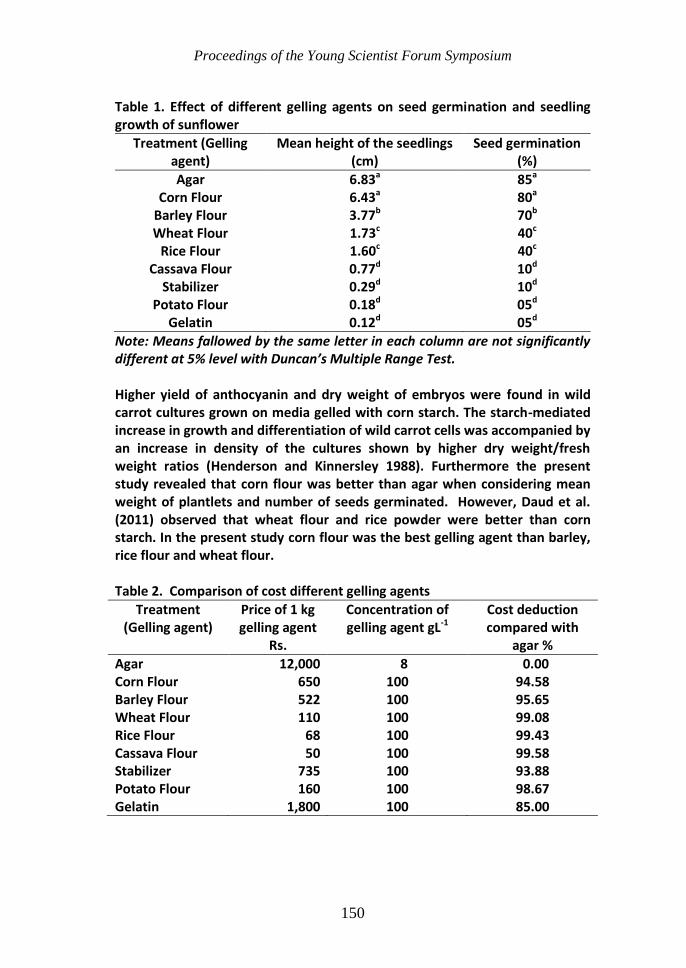
Proceedings of the Young Scientist Forum Symposium
150
Table 1. Effect of different gelling agents on seed germination and seedling growth of sunflower
Treatment (Gelling agent)
Mean height of the seedlings (cm)
Seed germination (%)
Agar 6.83a 85a
Corn Flour 6.43a 80a
Barley Flour 3.77b 70b
Wheat Flour 1.73c 40c
Rice Flour 1.60c 40c
Cassava Flour 0.77d 10d
Stabilizer 0.29d 10d
Potato Flour 0.18d 05d
Gelatin 0.12d 05d
Note: Means fallowed by the same letter in each column are not significantly different at 5% level with Duncan’s Multiple Range Test. Higher yield of anthocyanin and dry weight of embryos were found in wild carrot cultures grown on media gelled with corn starch. The starch-mediated increase in growth and differentiation of wild carrot cells was accompanied by an increase in density of the cultures shown by higher dry weight/fresh weight ratios (Henderson and Kinnersley 1988). Furthermore the present study revealed that corn flour was better than agar when considering mean weight of plantlets and number of seeds germinated. However, Daud et al. (2011) observed that wheat flour and rice powder were better than corn starch. In the present study corn flour was the best gelling agent than barley, rice flour and wheat flour. Table 2. Comparison of cost different gelling agents
Treatment (Gelling agent)
Price of 1 kg gelling agent
Rs.
Concentration of gelling agent gL-1
Cost deduction compared with
agar %
Agar 12,000 8 0.00 Corn Flour 650 100 94.58 Barley Flour 522 100 95.65 Wheat Flour 110 100 99.08 Rice Flour 68 100 99.43 Cassava Flour 50 100 99.58 Stabilizer 735 100 93.88 Potato Flour 160 100 98.67 Gelatin 1,800 100 85.00
Proceedings of the Young Scientist Forum Symposium
151
Cost analysis of agar and corn flour: Economics of using alternative gelling agents was calculated by comparing the standard price of agar (Table 2). The cost of 1 kg of agar was about Rs. 12,000.00 Sri Lankan currency and it is the most expensive gelling agent compared to the other gelling agents tested in this study. Use of corn flour, as an alternative solidifying agent, reduced 94.6 % of expenditure made towards purchase of gelling agent i.e. agar. Comparatively other gelling agents also reduced around 85 %-99 % of expenditure than agar. Conclusions and Recommendations Plant height and seed germination percentage between corn flour and agar were higher than the other gelling agents and were not significantly different. Corn flour (100 gL-1) has shown a greater potential as a cheaper alternative gelling agent for agar based medium for in-vitro seed germination of Sun flower. References Dahanayake N, Ranawake AL, Wanithunga U (2012) Potential of alternative cheap
gelling agents for in vitro micro-propagation of rice (Oryza sativa L.). International Symposium on Agriculture and Environment 312-314.
Daud N, Taha RS, Noor NNM, Alim H (2011) Potential of alternative gelling agents in media for the in vitro micro-propagation of Celosia sp., International Journal of Botany 7:183-188.
Henderson WE, Kinnersley AM (1988) Corn starch as an alternative gelling agent for plant tissue culture. Plant Cell, Tissue and Organ Culture, 15:17-22.
Mohamed MAH, Aasadon AA, Mohaidib MS (2009) Corn and potato starch as an alternative for Solanum tuberosum micropropagation. African Journal Biotechnology 8: 9199 -9203.
Singh B, Singh J, Kaur A (2013) Cost effective plant regeneration protocol for rough lemon (Citrus Jambhiri Lush) using gum kondagogu as gelling agent in plant tissue culture media. Journal of Cell and Tissue Research 13:3535-3540.

Proceedings of the Young Scientist Forum Symposium
152
IMPACT OF CARTOON MOVIES ON BEHAVIOUR OF SCHOOL CHILDREN: A CASE STUDY OF MIHINTHALE DS DIVISION
D. A. M. Perera1*, H.A.B.W. Hettiarachchi 2 and R.G.S.K Udayangani2
1Department of Accountancy, Wayamba University of Sri Lanka
2Department of Social Sciences, Rajarata University of Sri Lanka
Introduction Children spend most of their leisure time in front of television watching cartoon programs. Since it is the most frequent and easily accessible source of entertainment some parents use cartoon movies to keep the children occupied while they are busy with their work. Therefore, time which was previously spent by children in outdoor activities is now replaced with watching cartoons. As a result, most of children in Sri Lanka begin watching cartoons at an early age and by the age of three or four children become enthusiastic viewers. This has become a problem in Sri Lanka, because many children who are becoming addictive to some aggressive cartoons on television have become violent. Many children are attracted through contents of the cartoon programs and they inculcate some positive and negative habits in them (Ali and Muhammad 2013). Among the others, violence is a vital part of most of the cartoon programs, and therefore, children might be induced and attracted by violent content in cartoon movies. Hence, some scholars argue that cartoons have only negative impacts on children (Kellogg 1992; Anderson 2003; Saturnine 2004). Many parents are also in the view that some cartoon movies persuade children’s behaving antagonistic and disreputable. Alternatively, some scholars argue that cartoons have a tremendous impact in improving the cognitive aspects among school children (Ginmann 2003). These contradictory versions show the research gap in this field. Considering the importance of exploring the effects of cartoon on the children’s psychological development, and their behavior patterns, the main objective of this study was to trace the impact of television cartoon programs on the behavior of the school children. Materials and Methods Fifty seven school going children of the age group 6 -13 years were randomly selected from two government schools, situated in Mihinthale DS division of Anuradhapura district of Sri Lanka, as the sample of this study. Considering the sensitiveness of the respondents, this study was designed on survey method and most of the data were obtained through observations. Few focus group discussions also conducted with the parents and the teachers to gather the necessary information. Before starting the data collection, researchers have visited these schools several times and had few focus group discussions

Proceedings of the Young Scientist Forum Symposium
153
with the teachers in the primary section and with some parents. The necessary measures were also taken to minimize the influence on children’s behavior during the data collection stage. The selected children were given few blank papers and crayons and then, they were requested to draw their protagonists. Further, they were given a chance to sign a song in front of other students. No instructions or guidance were provided for the students; they were given the maximum freedom to paint their heroes as they like. While they were painting their pictures, researchers also checked the children’s costumes and accessories, such as school bags, pencil cases, lunch boxes, water bottles, cover pages of books. The main purpose of checking their costumes and accessories were to explore the pictures (i.e. different cartoon characters) printed on them. The gathered data were analyzed by using non-parametric test in Statistical Package for Social Sciences (SPSS) software version 17. Results and Discussion This study has explored that the violence presented in cartoons programs have impacted on children behavior. Most of school children observed during the data collection have imitated their favorite cartoon characters in their leisureliness. Since they were requested to entertain the peers and the audience, 27 students (47 percent) caroled different songs as they like. Interestingly, the majority (59 percent, n=16) of them have used songs in cartoon movies to entertain their peers, and most of those presentations were comparatively aggressive. They have imitated the movements of different cartoon characters. Moreover, it was revealed that they force their parents to buy the same costumes or accessories as displayed by different cartoon characters. It was observed that 81 percent of the children are attracted by the dresses of cartoon character and most of the accessories of these students contained different cartoon characters were printed on. There was no significance difference (p<0.05) among the groups on measure of selecting cartoon movies. Yet, boys preferences exhibited significantly more antagonism than girls (p<0.05). Violence is also integral part of the even those cartoons which are comedic in their genre (Ali and Muhammad 2013). Many boys (54 percent) indicated that they like to fight with their classmates and other children after watching these comedic fights in cartoon movies. Most of the students (68 percent) spend daily 1 to 2 hours in watching cartoons on television in their leisure time. Further it revealed that the cartoon movies dubbed in Sinhala is the most favorite cartoons of 91 percent children. Based on these figures, it can be understood that cartoon watching is the most favorite hobby of the school children (6-13 years of age) in Mihinthale DS division.

Proceedings of the Young Scientist Forum Symposium
154
It also revealed from the study that ‘Ben Ten’ is the most popular cartoon among the boys with the average of 78.6 percent. The most favorite cartoon character of the school going boys is boy in Ben-10. The girls have indicated that they prefer to watch ‘Heda Weda Kello’ with the average of 55.2 percent. Their most favorite cartoon character is ‘Meena’ with other two girls in ‘Heda Weda Kello’ cartoon with the average of 51.7 percent. Majority of the children (63 %) like to watch comedy and a very low number like to watch love and action in cartoon programs. Interestingly, most of these findings compliance with the outcomes of two studies carried out by Ali and Muhammad (2013). Conclusions and Recommendations At present, cartoon movies are most favorite program on television among the school going children of the age group 6-13 years. Cartoons have changed drastically over the years but have their lasting effects on children. Behavior of the children in school is influenced by watching different cartoon programs. Since they have being affected by the cartoons that they usually watch, they like dresses and accessories of their favorite cartoon characters. Due to their tender minds, most of the children try to imitate the actions performed by different characters. Consequently, confirming the findings of Hapkiewicz and Aubrey (1971), this study revealed two facts; the first fact is that there exists strong association between watching cartoon movies and the behavior of the school children in class. The second fact is the violence present in the cartoons has strong association with the behavior of the children. Yet, most of parents are completely unaware the effects of cartoon on their children’s psychological development, and later on their behavior patterns.
References Anderson CA, Berkowitz L, Donnerstein E, Huesmann LR, Johnson JD, Linz D,
Malamuth NM, Wartella E (2003) The influence of media violence on youth. Psychological Science in the Public Interest 4: 81-110
Bibi A, Zehra R (2012) Effects of cartoons on children’s psychology and behavior patterns. Available at: http://www.thenews.com.pk/Todays-News-6-128111-Effects-of-cartoons-on-children%E2%80%99s-psychology-&-behaviour-patterns Accessed on 05/10/2014.
Ginmann M (2003) Cartoons as information. Journal of Information Science 29: 69-77. Hapkiewicz WG, Roden AH (1971) The effect of aggressive cartons on children’s
interpersonal play. Child Development 42: 1583-1585. Kellogg MA (1992) The Toon Boom, TV Guide, 6-8. Saturnine R (2004) The adverse effects of cartoons on the minds of our children. Paper
presented at a Toon-agedy Conference in Estonia.

Proceedings of the Young Scientist Forum Symposium
155
PHYSICAL, CHEMICAL AND MICROBIAL ANALYSIS OF BOTTLED DRINKING WATER IN JAFFNA PENINSULA
K. Ragila1*, P. Abiman1, A. C. Thavaranjit2, and P. Iyngaran1
1Department of Chemistry, Faculty of Science, University of Jaffna, Sri Lanka 2Department of Botany, Faculty of Science, University of Jaffna, Sri Lanka
Introduction People in Sri Lanka have been using bottled drinking water few years. They expect bottled drinking water to be free of microbial contamination and health hazards. People in Jaffna peninsula, depend mainly on ground water for their drinking and other domestic needs due to the unavailability of other water sources such as waterfalls and rivers, and fresh water ponds and insufficiency of water available from rainfall (Mageswaran et al. 2004). However, the ground water in Jaffna is in danger due to over exploitation and pollution caused by excessive usage of agrochemicals and fertilizer (Velauthamoorthy 2001; Balasanthiran 2005). When A9 road was opened after three decades of war, the people in Jaffna started to use bottled drinking water. With the increase of its popularity and usage of its, questions have been raised about it’s the quality and safety of bottled drinking water. Hence this study was conducted to analyze the microbial contamination, physical properties and chemical contents in different brands of bottled water being sold in Jaffna peninsula. Materials and Methods Five different batch numbers of each brand were brought from randomly selected grocery stores in Jaffna peninsula. Sample bottles from a total of 8 brands (labeled as A, B, C, D, E, F, G, and H) were selected for the study; and stored at room temperature (25-30 °C) and the samples are analyzed for physical, chemical and microbiological requirements as follows within 1-6 months from the date of manufacture. Color was measured by visual comparison method; odor and Taste were measured through sensory evaluation method. The amount of phosphate was measured using a Colorimeter (6051 colorimeter, Jenway, UK). The Electrical Conductivity was measured with a conductivity meter (Orion 4 star pH, Conductivity Bench top, Singapore) for analysis. The pH values of the bottled water samples were measured with a pH meter (PHS-3BW pH/mV/Temperature Meter). Alkalinity and Chloride were determined by the titrimetric method. Calcium, Hardness and Magnesium were measured by EDTA titration method. The values of Potassium were measured with the Flame photometer. Number of coliforms and faecal coliforms were determined by the standard membrane filter

Proceedings of the Young Scientist Forum Symposium
156
method and the occurrence of Escherichia coli was also tested. Finally results were compared with the recommended Sri Lankan Standard (SLS) values (Theivendirarajah 1990). The obtained results were analyzed by the t-test
(=0.05 level) and mean values and standard deviations were calculated. Results and Discussion Physical and chemical properties related to analysis are shown in Table 1. The pH values of the 8 different brands of bottled water samples varied from 6.1 to 7.4 and the recommended range is 6.5 to 8.5. Electrical Conductivity content varied from 46.8 to 349.0 μS cm-1, which is far below compares to the SLS recommend value of 750 μS cm-1. Alkalinity of the water samples varied from 76.5 to 284.8 ppm and the SLS recommended value is 400 ppm. Calcium concentration of the water samples varied from 11.4 to 26.6 ppm, which lies within the permit margin of SLS, which allow the calcium concentration up to 100 ppm. Magnesium concentration of the water samples varied from 14.5 to 24.5 ppm and the SLS permitted the magnesium concentration up to 150 ppm. Hardness of the 8 different brands of water samples varied from 99.8 to 145.5 ppm and the SLS recommended hardness is 400 ppm. Potassium concentration of the water samples varied from 0.3 to 1.6 ppm and the SLS permitted the potassium concentration up to 20 ppm. Phosphate concentration of the water samples varied from 1.3 to 2.4 ppm and the SLS permitted the phosphate concentration up to 2.0 ppm. Chloride concentration varied from 101.2 to 172.7 ppm and the SLS permitted the chloride concentration is up to 200 ppm. Salinity varied from 35.1 to 38.8 and the SLS recommended the salinity is up to150 ppm. Only one batch of the brand C (2nd batch), E (2nd batch) and F (1st batch) had very high number of coliforms (data not shown) beyond the accepted level of the SLS. Escherichia coli was present in only one batch of the brand A. Faecal coliforms were observed only in two batches of the brand A among the brands tested, which was not accepted according to the standard. Escherichia coli and faecal should be absent. Coliforms should be less than 10 per 100 mL of sample. Conclusions and Recommendations The results of this study revealed that the values of electrical conductivity, chloride, salinity, alkalinity, calcium, magnesium, total hardness, and potassium in all of the water samples were within the acceptable limits of Sri Lankan Standards for drinking water. The mean value of phosphate ion of E, F, G and H brands exceeded the Sri Lankan Standard limit. The mean value of pH of A, D, F and G exceeded the Sri Lankan Standard limit. First and fourth batches of brand A had high faecal contamination and not suitable for consumption where as one batch of C, E and F had a risk of contamination and not suitable for drinking. When all the parameters are considered, two brands (B and C) out of eight brands analyzed are suitable for human consumption.

Proceedings of the Young Scientist Forum Symposium
157
Table 1. Physical and mineral constituents of different brands of bottled drinking water (mean±st.dev)
Sample A B C D E F G H
Ph
ysic
al p
rop
ert
ies
Colour Colourless Colourless Colourless Colourless Colourless Colourless Colourless Colourless
Odour No Smell No Smell No Smell No Smell No Smell No Smell No Smell No Smell
Taste Tasteless Tasteless Tasteless Tasteless Tasteless Tasteless Tasteless Tasteless
pH 6.5+0.1 7.1+0.4 6.7+0.1 6.4+0.2 7.4+0.4 6.1+0.2 6.6+0.2 7.4 +0.3
Conductivity (μS/cm)
79.7+3.6 81.0 +10.9 48.6 +7.2 46.8 +1.3 122.0 +5.4 104.0+14.9 63.8 +1.9 349+122.1
Min
era
l co
nst
itu
en
ts
Alkalinity (ppm) 159.6+11.9 159+25.3 109 +18.9 90.1+13.2 110.9+19.4 100.4+8.4 76.5 +16.7 285 +86.5
Calcium (ppm) 14.3+1.3 17.3+0.9 11.4+0.7 15.8 +0.9 26.6 +0.6 17.1+1.1 12.2+0.7 18.0+4.4
Magnesium (ppm)
18.0+0.9 16.1+1.0 19.6 +1.1 14.7 +0.7 14.5+1.1 21.5+1.5 17.8 +0.3 24.5 +2.1
Hardness (ppm) 109.8+2.0 109.2+5.7 108.8+2.9 99.8+3.8 126.0+3.5 130.7 +3.4 103.4+2.1 145.5+14.3
Potassium (ppm) 1.3+0.2 1.6+0.2 0.3 +0.2 1.2+0.1 1.5 +0.3 1.4+0.2 0.9+0.2 0.9 +0.2
Phosphate (ppm) 1.5+0.3 1.3+0.3 1.5+0.3 1.7+0.0 2.3+1.1 2.1+0.5 2.4 +0.6 1.9 +0.7
Chloride (ppm) 151.8+3.6 133.5+6.3 115.9 +5.8 115.9 +4.8 131.7 +6.4 156.4+11.2 101.2+7.7 173 +14.5
Salinity (ppm) 37.7+0.2 36.8+0.3 35.9+0.3 35.9+0.3 36.7 +0.3 37.9 +0.6 35.1 +0.4 38.8+0.7
Note: 1ppm=1mg L-1

Proceedings of the Young Scientist Forum Symposium
158
References Balasanthiran V (2005) Investigation of factors affecting the chloride concentration
in selected well water samples in Jaffna peninsula, Research Project Report, University of Jaffna, Sri Lanka.
Mageswaran R, Senthilnanthanan M, Srikaran R, Abiman P (2004) Quality of ground water in selected areas of northern part of Sri Lanka. Proceedings of the 60
th Annual Session, part 1, pp 225. SLAAS, Sri Lanka.
Theivendirarajah K (1990) Microbiology Laboratory Manual. pp 66-69. Velauthamoorthy K (2001) Some quality parameters of ground well water in Jaffna
peninsula. Research Project Report, University of Jaffna, Sri Lanka.

Proceedings of the Young Scientist Forum Symposium
159
COGNITIVE DISSONANCE AS A FACTOR OF INFLUENCE FASHION G.M. Ranathunga141
1Department of Textile and Clothing Technology, Faculty of Engineering,
University of Moratuwa
Introduction The Kandyan period (15th Century to 1815), in the annals of Sri Lanka is very unique since it was a melting pot of cultural fluctuations both local and foreign and as a result marked a signpost of the evolution of the country’s fashion. The Portuguese, The Dutch, The British, South Indian and Siamese dress influences were mixed altogether. Rather than representing the hierarchy, the Sri Lankan sartorial etiquettes were juxtaposed during the reign. The most prominent characteristic of the Kandyan dress was the hybrid formation together of different foreign dress influences. The royalty, especially the king had an exotic taste in foreign fashions; thus he displayed a unique individual personality. Elites also adopted a completely different foreign dress from that of the king; the dress conveyed dignity, their status and occupation. The king, the queen, the elite were in contrast to each other, thus reluctant to keep one line of a continuous tradition. Their dress provoked the viewer’s curiosity, whether they were guided by their beliefs or behavior. The aim of the present research is to identify influencing patterns in fashion from characters of king and queens of the Kandyan kingdom and incubating unique fashion concepts. It is important to study well established and well-practiced concepts in order to incubate new fashion concepts. The vision of their fashion gives new ideas to the field of fashion design. Materials and Methods Reliability of the data which was incorporated in the research is of much concern. Pictorial data were cross checked with different literary sources such as temple murals, particular literature and interviews. Original written sources and true pictorial evidences were used for the research. Temple murals were compared with contemporary sketches which were produced by foreigners (true observations). Finally the reinforced theory was compared with formally established theory in order to verify the reliability of findings. Results and Discussion Most of the early royalties and elites of the Kandyan kingdom had grown up under Portuguese protection due to the instability of sovereignty;
41

Proceedings of the Young Scientist Forum Symposium
160
subsequently they were given Christian education and introduced to Christian society. Later they were baptized and took Western names such as did Queen Kusumasana Devi as Dona Chatherine, Prince Yamasinghe Bandara as Dom Philip and Konappu Bandara as Dom Juwan. The Dutch admiral Spilbergen who first visited the Kandyan territory recorded that king Vimala Dharma Suriya I (previously Dom Juwan) his queen Dona Catherine and their children wore Western dresses (Ferguson 1927). Prince Vijayapala of Matale and king Rajasimha II’s dressed as Western gentlemen. Royalties who had direct foreign influences changed their dress. But however much they adopted a Western lifestyle their tradition, culture and religion were affected to a minimum in those etiquettes. Kandyan kingdom became the sole surviving link in the age long connection between Sinhalese power and the Buddhist religion. It was the heir to the traditional relationship between state and religion (Silva 2005).The society expected a Sinhalese Buddhist king. Therefore, it is obvious that mental tension existed between their desires/beliefs and their behavior. As a result a conflict arose between their beliefs and behavior. According to the convincing evidences some royalties of the Kandyan era had mental tension with their Western dressing habits. Some royalties changed their dress being inspired by foreign dresses. But later they found that foreign influences did not suit their culture. This is evident from prince Vijayapala’s confession: “though I am a Chingala by blood I am a Portuguese in my way and my affection; it may well be that this is the chief reason for my losing my kingdom, treasures, the queen my wife, my son, and all that I possessed, at least reaching this state in which I see myself” (Pieris 1927).
Figure 1. King Vimala Dharma Suriya I (1591-1604), queen Dona Catherine (1602-1613 AD) and king Rajasimha II (1635-1687) clad in Western dresses
Pictorial and written evidences show that when such a situation arose, these concerned either changed their beliefs or behavior to reduce this conflict. Prince Vijayapala changed his beliefs to be able to be suited to his behavior of wearing foreign costumes and accepting the Christian faith. He

Proceedings of the Young Scientist Forum Symposium
161
appreciated and considered western dresses as good and that a little cultural impact and western dress may be beneficial. The idea strengthened his adopted behavior influencing the power of foreign dress habits.
Belief changes its shape
Beliefs and behavior
Figure 2. Change of beliefs to suit to bahavior
In some instances, Kandyan Sinhalese Queens did not change their behavior. It was found that during the Nayakkar period Sinhalese queens never followed superior South Indian Queens’ dress of mottakkiliya. Although Nayakkar queens were given a high position compared to Sinhalese queens the latter never wore mottakkiliya but followed the Sinhalese Buddhist traditional way of dressing. Sinhalese queens did not change their behavior as king Vijayapala did. This process maintained their original behavior of dressing habits and reduced the influencing power.
Figure 3. Murals of Degaldoruwa (Nayakkar queens clad in Mottakkiliya and
Shinhalese queen clad in jacket and a cloth)
This process of influence is similar to learning theory describes in psychology, cognitive dissonance found by social psychologist Festinger 1957 (Puri and Tyler 1998). Festinger (1998) defines that ‘cognitive dissonance which is a state of tension which arises when we realize that two or more of our cognitions are consistent with each other. People seek to reduce cognitive dissonance’. In this situation Kandyan royalty undergo tension if they find that their beliefs are different from their behavior. They tend to reduce the tension by completely changing their beliefs or their behavior .This process can be identified as a theory which strengthens or diminishes influencing fashion of dress. Although, Festinger describes that either behavior or belief changes, there are examples from the Kandyan era that do not purely confirmed to it. There are some instances, where people have changed their beliefs and behavior only half way.

Proceedings of the Young Scientist Forum Symposium
162
Even though, king Vimala Dharma Suriya I, queen Dona Catherine, Prince Vijayapala and Rajasimha II had similar political, religious and social forces to follow the Western way of life, king Vimala Dharma Suriya I controlled his beliefs and behavior only half way in order to suit the needs of the society which he represented. In Spilbergens’ travel records it is recorded that, “Dona Catherine visits no pagodas, Don Joan the king what he does is mostly to please the Sinhalese’ (Ferguson 1927).Therefore his costume shows the hybrid formation of Eastern and Western styles. He rationalized his behavior. The influence pattern which was derived through the analysis was Kandyan kings tend to change their beliefs or behavior when a mental tension arose. Often they selected one option to solve the conflict. Besides, they denied selecting either beliefs or behavior but tend to rationalize behavior then change belief and behavior half way. It was clearly proven that changing behavior or changing perception of behavior facilitate influencing fashion. The reinforced theory addresses the pervasive human tendency to rationalize, and gives three fundamental assumptions.
1. Humans are sensitive to inconsistencies between beliefs and behavior.
2. Recognition of this inconsistency will cause dissonance, and will motivate an individual to resolve the dissonance.
3. Dissonance will be resolved in one of three basic ways. a. Change belief b. Change behavior c. Change perception of behavior and rationalize the behavior.
Conclusions and Recommendations The influencing process of ‘Cognitive dissonance’ is able to change the attitude of fashion. The process is activated in three ways, exerted considerable influences. The key of this process is to build a mental tension between beliefs and behavior. As a result, people automatically tend to solve the conflict in between, consecutively are influenced by various fashion.
References Ferguson D (1927) The earliest Dutch visit to Ceylon. Journal of Royal Asiatic Society
30: 80. Pieris PE (1927) The Prince Vijaya Pala of Ceylon (1634-1654): from the original
documents at Lisbon. Colombo. Puri BK, Tyler PJ (1998). Sciences Basic to Psychiatry. Churchill: Livingstone, London. Silva de KM (2005) A History of Sri Lanka Vijith Yapa Publications, Colombo.

Proceedings of the Young Scientist Forum Symposium
163
EFFECT OF SILICON APPLICATION ON DOWNY MILDEW IN BITTER GOURD (Momordica charantia L.) LEAVES
R.M.R.N.K.Ratnayake142, W.A.M. Daundasekera2, H.M. Ariyarathne3
and M.Y.U. Ganehenege4
1Postgraduate Institute of Science, University of Peradeniya, Sri Lanka
2Department of Botany, Faculty of Science, University of Peradeniya, Sri Lanka
3Horticultural Crop Research and Development Institute, Gannoruwa, Sri Lanka
4 Department of Chemistry, Faculty of Science, University of Peradeniya, Sri Lanka
Introduction Silicon (Si) has been exploited for its beneficial effects in terms of disease control in many plants including wheat, rice, cucumber, cherry, muskmelon, and potato (Rodrigues et al. 2004). Two hypotheses for the Si-enhanced resistance to diseases have been proposed; i. Silicon deposited on the tissue surface acts as a physical barrier and makes the plant cells less susceptible to enzymatic degradation by fungal pathogens, ii. Silicon functions as a signal to induce the production of phytoalexin or expression of pathogensis-induced host-defense responses in the infected plants. Bitter gourd (Momordica charantia L.; Family Cucurbitaceae) is a popular vegetable in south-east asia due to its unique taste and medicinal properties. However, bitter gourd plants are highly susceptible to many fungal diseases leading to loss of yield and product quality. Downy mildew caused by Pseudoperonospora cubensis is one of the major diseases in bitter gourd leaves. The very little published work related to silicon-related work on bitter gourd indicate that this crop is a moderate-silicon accumulator and Si application develops resistance in the plant against Pythium aphanidermatum, a root rot fungus. In this context, this study was conducted to determine the effectiveness of soil-amendment with Si on controlling downy mildew in bitter gourd leaves at field level and to determine if any cytological changes were associated with fungal restriction. Materials and Methods Bitter gourd (Momordica charantia L.) cv. Matale green was seeded on 20 cm diameter plastic pots with 18 L capacity filled with sand: top soil: compost at 2:1:1 ratio as the growing medium and they were arranged in a plant house at Department of Botany, Faculty of Science, University of Peradeniya according to complete randomized design (CRD) with 1m x 1.5 m plant spacing. Level of plant-available Si and pH in soil were assessed before amendment with silica. Potassium silicate (K2SiO3) (20 % SiO2, 8 % K2O; Daejung, Korea) in three concentrations; 100 mg Si kg-1 soil, 200 mg Si kg-1 soil, 300 mg Si kg-1 soil was added to the growing medium once a week
42

Proceedings of the Young Scientist Forum Symposium
164
starting from four leaf stage and continued up to 28 days. Potassium fertilizer was added to control pots as well at appropriate amounts to compensate the effect of added potassium in the form of K2SiO3. Each treatment consisted with 15 pots. Fertilizer application, irrigation, staking, pruning and trellising were done according to Department of Agriculture (DOA) recommendations. Plants were allowed for natural infection since downy mildew is the most prevailing disease in bitter gourd. Downy mildew was identified by disease symptoms and descriptions of International Mycological Institute. Disease severity was rated through external observations on weekly basis using a self-prepared scale (0=no disease, 1 = 1 to 20 %, 2 = 21 to 40 %, 3 = 41 to 60 %, 4 = 61 to 80 %, and 5 = 81 to 100 % of upper leaf surface covered with disease). Disease ratings were used to calculate area under disease progress curve (AUDPC) for each treatment by the midpoint rule method (Campbell and Madden 1990). Number of leaves, flowers, and fruits per plant were counted in seven days interval beginning from four weeks after flowering. Silicon content was determined by a modification of the autoclave-induced digestion procedure of Elliot and Snyder (1991) at 5 weeks and 10 weeks after seedling emergence and the concentration of Si in leaf tissue was determined by a colorimetric analysis. Data were analyzed using ANOVA by SAS for windows version 9.0. Differences between treatment means were obtained by DMNRT at p<0.05. Microtome sections of leaves were observed under light microscope and cuticle – epidermal layer thickness was measured to determine silicon deposition in leaves. Leaf sections were stained with silver amine chromate to observe any Silicon depositions in cells. Results and Discussion Average soluble Si concentration (plant available Si) in the soil suspension was 2.87 mg L-1 and Soil pH of the experimental field was 7.8. When pH levels are too high or too low, minerals are bound to soil particles and thus, unavailable to plants. Si presents in the soil solution as solubalized monosilicic acid [Si(OH) 4] at a pH < 9, and as the silicic anion SiO3
2-at a pH>9 (Raven 2003). Therefore, soil pH Level of the experimental field was suitable for Si application. Downy mildew symptoms were observed in the field at 7 weeks after seeding. Angular chlorotic lesions in the infected leaves, eventually, turned necrotic and curled upwards showing the typical symptoms of the disease. Further, Gray-brown to purplish-black fungal growth was observed at the lower surface of the leaf. Disease severity was increased with the time in all treated and control plants although it was lower in silicon treated plants than that of control plants during the entire period. Thus, area under

Proceedings of the Young Scientist Forum Symposium
165
disease progress curve (AUDPC) was highly significant with treatments but there was no correlation between AUDPC and added Si content (Table 1). Among the three silicon treatments the highest Si accumulation in leaves (2.8 % of the leaf dry matter) was shown by 200 mg Si kg-1 soil and also it showed a highly significant reduction (p < 0.001) in fungal growth and Si content in all control plants was less than 1 % (Table 1). However, accumulated silicon content in 300 mg kg-1 soil was lower than that of the other two silicon treatments. This may be due to the pH of potassium silicate solution which was 10.5, thus addition of increasing amount of Si into the soil may increase soil pH hence Si absorption may be reduced. When pH levels are too high minerals are bound to soil particles and become unavailable to the plant (Raven 2003). Further, this may be the reason for the higher disease appearance linked with 300 mg Si kg-1 soil compared to the other two treatments. Si treatment had no effect on leaf flower or fruit number in plants (Table 2). Cuticle - epidermal layer thickness in Si treated plants ranged from 17.2 – 21.3 µm where in control plants it ranged from 10.3-13.81 µm. Further, it was noted that when bitter gourd plants get diseased cuticle - epidermal layer thickness was decreased thus in the Si treated plants average thickness was 15.8 µm where in the control plants it was 10.2 µm.
Table 1. Effect of soil amendments with silicon in different concentrations on leaf silicon content and disease severity expressed as area under disease progress curve (AUDPC)
Si application rate (mg kg-1 soil)
Si content accumulated in leaves (% leaf dry matter) *
AUDPC*
100 1.9 b 50.05 c 200 2.8 a 43.45 d 300 1.7 c 61.62 b 0 <1.0 d >75.6 a
P value 0.0001 0.0001 * Data based on observation of 70 days after seeding. Any two means in the same column followed by different letters differ significantly according to Duncan’s multiple range test (P<0.05). Note: AUDPC was calculated using disease severity data (on a 0 to 5 scale, where 0 = no disease symptoms and 5 = 81 to 100 % of upper leaf surface covered with disease symptoms of downy mildew).
According to the results, protective role of Si can at least be partly due to the accumulation of Si in the leaves, enhancing their strength and rigidity, which may create a physical barrier to pathogens as described by Rodrigues et al. (2004) and many researchers.
a
a

Proceedings of the Young Scientist Forum Symposium
166
Conclusions and Recommendations Soil amendments with silicon in bitter gourd plants reduced the severity of Downey mildew disease although it did not affect on growth stages. Cytological evidences suggest the physical barrier concept, however, further investigations are needed to explain the mechanism linked with Si application and enhanced disease resistance. Table 2. Variation in number of leaves, flowers and fruits with different silicon treatments
Note: * Observations made 70 days after seeding. Control 1= No addition of silicon but K fertilizer was added to compensate the effect of added K in the form of potassium silicate in 100 mg Si kg-1 soil and Control 3= No addition of silicon but K fertilizer was added to compensate the effect of added K in the form of potassium silicate in 300 mg Si kg-1 soil Acknowledgement Financial assistance by the National Research Council Grant No.NRC/11/118 is highly appreciated. References Campbell CL, Madden LV (1990) Introduction to Plant Disease Epidemiology. New
York: Wiley & Sons. pp. 402–412. Elliot CL, Snyder G (1991) Autoclave-induced digestion for the colorimetric
determination of silicon in rice straw. Journal of Agricultural and Food Chemistry 39: 1118–1119.
Raven JA (2003) Cycling silicon-the role of accumulation in plants. New Phytologist 158: 537-550.
Rodrigues FA, McNally DJ, Datnoff LE, Jones JB, Labbe C, Benhamou N, Menzies JG, Belanger RR (2004) Silicon enhances the accumulation of diterpenoid phytoalexins in rice: a potential mechanism for blast resistance. Phytopathology 94: 177–183.
Si level Leaf Number * (no/plant)
Flower Number * (no/plant)
Fruit Number * (no/plant)
100ppm Si 77.80 ± 6.14 6.32 ± 0.32 4.65 ± 0.08 200ppm Si 82.61 ± 5.32 7.61 ± 0.85 5.12 ± 0.03 300ppm Si 80.61 ± 5.02 6.35 ± 1.32 4.48 ± 0.57 Control 1 81.52 ± 3.32 5.95 ± 2.45 4.52 ± 0.25 Control 2 80.61 ± 2.56 6.32 ± 1.32 4.80 ± 0.64 Control 3 78.61 ± 4.34 5.98 ± 1.58 5.30 ± 0.65
100ppm Si 200ppm Si

Proceedings of the Young Scientist Forum Symposium
167
APPLICATION OF WEAP MODEL FOR ASSESSING IRRIGATION WATER AVAILABILITY–CASE STUDY OF DEDURU OYA RESERVOIR
D.S. Sampath143, S.B. Weerakoon2, B.K. Mishra3 and S. Herath3
1Department of Civil Engineering, Faculty of Engineering, University of Jaffna,
Ariviyal Nagar, Kilinochchi, Sri Lanka 2Department of Civil Engineering, Faculty of Engineering, University of Peradeniya,
Sri Lanka 3Institute for Advance Study of Sustainability, United Nations University, Tokyo,
Japan
Introduction Deduru Oya basin which has an area of 2620 km2 is the sixth largest river basin in Sri Lanka. Rainfall in the basin has a temporal and spatial variation, and is only source of water. Deduru Oya carries flash floods during rainy season and very low flows during dry season. It releases about 1600 MCM of water to the sea annually without being useful purposes. There are several anicuts across it to divert water for irrigation, but there is no single reservoir intercepting the Deduru Oya except the reservoir at Thunmodara which is being constructed under Deduru Oya project (Fig. 1). There is a strong need to regulate Deduru Oya flow for its optimum use especially for irrigation during dry season. The Deduru Oya reservoir project which is under construction is aimed to improve the livelihood of farmers in parts of the North-Western Province by increasing the productivity of its land and water resources by regulating and diverting the water by two main canals. The proposed Left Bank (LB) canal which is 44.1 km long, will supply water to augment about 136 existing storage-based minor irrigation systems in the left bank of the Deduru Oya (Fig. 1). The Right bank (RB) canal is a trans-basin canal to augment water supply to Iginimitiya reservoir which is located in Mee Oya basin (Fig. 1). The proposed irrigable area under LB canal including new developments is about
43
Figure 2. Study area

Proceedings of the Young Scientist Forum Symposium
168
3000 ha. Total irrigable area under Deduru Oya basin is 7000 ha and under Mee Oya basin is 4115 ha (Pre-feasibility Report 2000). This study is focused on the setting up WEAP21 version 3.43 (Water Evaluation And Planning) model to study the impact of annual change in river flow on irrigation water availability under different water management scenarios with the reservoir project. They are the operation of LB canal with the small tanks and without small tanks. Materials and Methods Rainfall or runoff data are not available for the rain-fed small tanks in the minor irrigation system of the LB region. Hydrologic Engineering Center – Hydrologic Modeling System (HEC-HMS) version 3.0.1 developed by US Army Corps of Engineers in USA was used to develop rainfall runoff model for each of the catchment. HEC-HMS model was calibrated and verified for the Tittawella Tank in Kurunegala (Sampath et al. 2014a). Calibrated HEC-HMS model for the Tittawella Tank and rainfall data at Nikaweratiya and Ridi Bendi Ella stations were used to develop inflows to the minor tanks. Also HEC-HMS model was used to simulate flow in the Deduru Oya. Thirty years daily rainfall data from 6 rain gauge stations in the Deduru Oya basin and runoff data at Moragaswewa from 1984 to 1989 together with monthly evaporation data at Batalagoda agro-meteorological station were used in the simulation. Diversions, reservoir storages and losses were also accounted in the study (Sampath et al. 2014b). Calibrated HEC-HMS model of Deduru Oya and rainfall data at Millawa, Kurunegala, Ridibendiella and Wariyapola stations were used to develop inflows to Deduru Oya reservoir. For each of the 136 rain-fed small tanks that will be supplied water by the LB canal, the relevant catchment areas, storage areas, natural streams, land use patterns and cascades were identified for modeling the system. Also 12 directly feeding demand sites were identified. Topography, geology and land use details were collected from the digital data of the Survey Department of Sri Lanka and Arc GIS 9.2 was used as a tool for spatial analysis. For WEAP model application, four types of data viz: Area cultivated annually, Annual water use rate, Monthly variation and Consumption are required at each of the demand sites. Crop water requirement was calculated assuming 105 day low land paddy will be cultivated in an area of 3000 ha under LB canal. Crop water requirement was calculated on monthly basis. Rainfall data at Nikaweratiya and Ridi Bendi Ella station in year 2000 to 2010, Mahailluppallama reference crop evapotranspiration rates and crop factors for each growth stages were used for the calculation of crop water requirements. Computations of irrigation water requirements were made using 60 % application efficiency and 75 % conveyance efficiency. Land
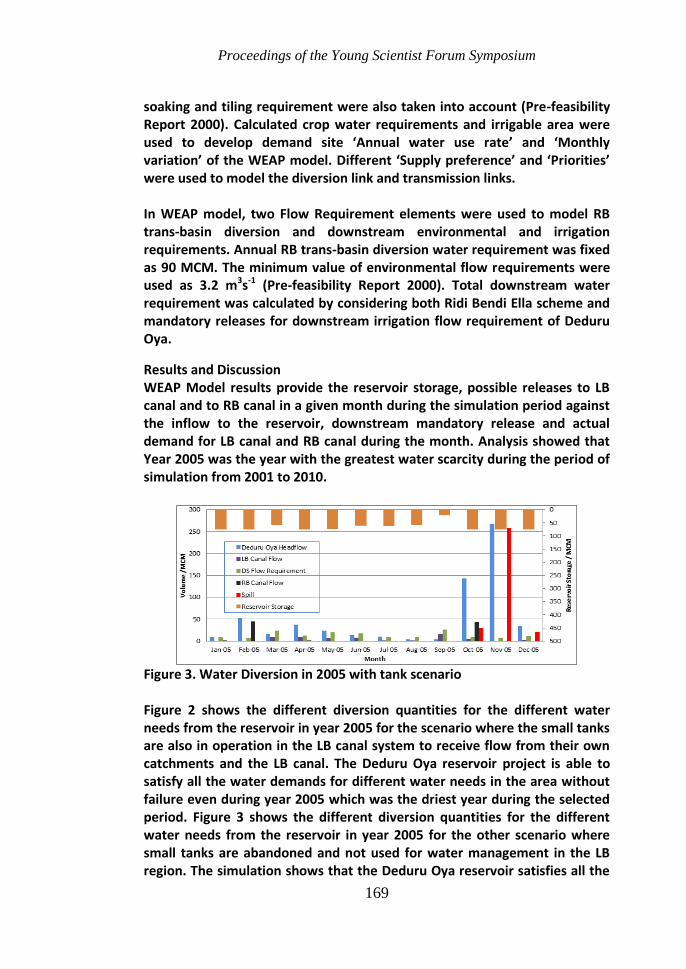
Proceedings of the Young Scientist Forum Symposium
169
soaking and tiling requirement were also taken into account (Pre-feasibility Report 2000). Calculated crop water requirements and irrigable area were used to develop demand site ‘Annual water use rate’ and ‘Monthly variation’ of the WEAP model. Different ‘Supply preference’ and ‘Priorities’ were used to model the diversion link and transmission links. In WEAP model, two Flow Requirement elements were used to model RB trans-basin diversion and downstream environmental and irrigation requirements. Annual RB trans-basin diversion water requirement was fixed as 90 MCM. The minimum value of environmental flow requirements were used as 3.2 m3s-1 (Pre-feasibility Report 2000). Total downstream water requirement was calculated by considering both Ridi Bendi Ella scheme and mandatory releases for downstream irrigation flow requirement of Deduru Oya.
Results and Discussion WEAP Model results provide the reservoir storage, possible releases to LB canal and to RB canal in a given month during the simulation period against the inflow to the reservoir, downstream mandatory release and actual demand for LB canal and RB canal during the month. Analysis showed that Year 2005 was the year with the greatest water scarcity during the period of simulation from 2001 to 2010.
Figure 3. Water Diversion in 2005 with tank scenario Figure 2 shows the different diversion quantities for the different water needs from the reservoir in year 2005 for the scenario where the small tanks are also in operation in the LB canal system to receive flow from their own catchments and the LB canal. The Deduru Oya reservoir project is able to satisfy all the water demands for different water needs in the area without failure even during year 2005 which was the driest year during the selected period. Figure 3 shows the different diversion quantities for the different water needs from the reservoir in year 2005 for the other scenario where small tanks are abandoned and not used for water management in the LB region. The simulation shows that the Deduru Oya reservoir satisfies all the
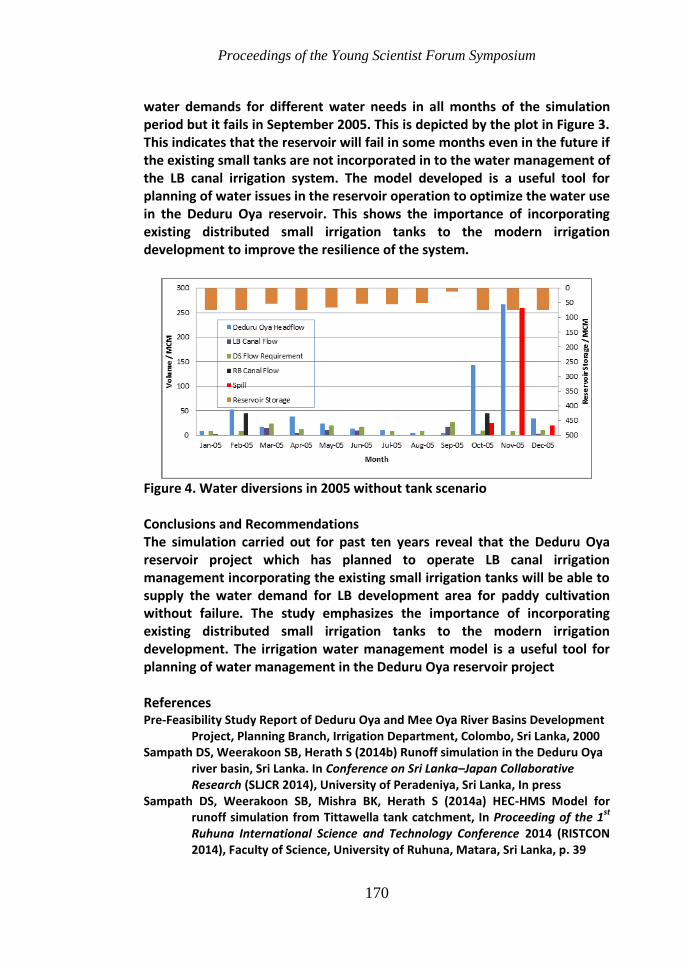
Proceedings of the Young Scientist Forum Symposium
170
water demands for different water needs in all months of the simulation period but it fails in September 2005. This is depicted by the plot in Figure 3. This indicates that the reservoir will fail in some months even in the future if the existing small tanks are not incorporated in to the water management of the LB canal irrigation system. The model developed is a useful tool for planning of water issues in the reservoir operation to optimize the water use in the Deduru Oya reservoir. This shows the importance of incorporating existing distributed small irrigation tanks to the modern irrigation development to improve the resilience of the system.
Figure 4. Water diversions in 2005 without tank scenario Conclusions and Recommendations The simulation carried out for past ten years reveal that the Deduru Oya reservoir project which has planned to operate LB canal irrigation management incorporating the existing small irrigation tanks will be able to supply the water demand for LB development area for paddy cultivation without failure. The study emphasizes the importance of incorporating existing distributed small irrigation tanks to the modern irrigation development. The irrigation water management model is a useful tool for planning of water management in the Deduru Oya reservoir project References Pre-Feasibility Study Report of Deduru Oya and Mee Oya River Basins Development
Project, Planning Branch, Irrigation Department, Colombo, Sri Lanka, 2000 Sampath DS, Weerakoon SB, Herath S (2014b) Runoff simulation in the Deduru Oya
river basin, Sri Lanka. In Conference on Sri Lanka–Japan Collaborative Research (SLJCR 2014), University of Peradeniya, Sri Lanka, In press
Sampath DS, Weerakoon SB, Mishra BK, Herath S (2014a) HEC-HMS Model for runoff simulation from Tittawella tank catchment, In Proceeding of the 1
st
Ruhuna International Science and Technology Conference 2014 (RISTCON 2014), Faculty of Science, University of Ruhuna, Matara, Sri Lanka, p. 39

Proceedings of the Young Scientist Forum Symposium
171
EVALUATION OF THE ANTAGONISTIC NATURE OF EXTRACELLULAR COMPOUNDS SECRETED BY SOME SELECTED BACTERIAL
ANTAGONISTS AGAINST Colletotrichum truncatum, THE CAUSAL AGENT OF ANTHRACNOSE DISEASE IN CHILLI
H.B.P. Sandani1, N.P. Ranathunge244 and P.L.N. Lakshman3 1Board of Study of Faculty of Agriculture, Faculty of Graduate Studies
2Department of Agricultural Biology, Faculty of Agriculture
3Department of Food Science and Technology, Faculty of Agriculture
University of Ruhuna, Mapalana, Kamburupitiya, Sri Lanka
Introduction Chilli, fruit is popular for its spicy nature, in both fresh and dried forms. According to Pakdeevaraporn et al. (2005), anthracnose is a threat which causes up to 50 % loss in chilli yield. Colletotrichum truncatum is one of the most destructive agents of anthracnose disease. It is highly worth to pay attention on biological control means as a reliable alternative in controlling anthracnose when considering the adverse effects of fungicides. The use of microbial antagonists as an alternative is becoming popular. However, one of the possible exceptions is to utilize the extracellular compounds secreted by such antagonists that can effectively control the pathogens. As this is a long term process that leads to separation and identification of responsible compounds, the primary step is to identify the antagonistic properties of the extracellular metabolites of potential candidates. The objective of this study was to evaluate the nature of antifungal compounds secreted by five selected bacterial antagonists against C. truncatum causing anthracnose disease in chilli. Materials and Methods Production of diffusible antifungal substances: The diffusible nature of antifungal compounds secreted by antagonists was evaluated using the cellophane overlay technique (Nourozian et al. 2006). The results were expressed as percent inhibition of radial growth (PIRG) values according to Sariah (1994) compared to control.
PIRG = (R1-R2)/R1 × 100 R1- Radial growth of C. truncatum in control plate; R2- Radial growth of C. truncatum interacting with antagonistic bacteria. Experiment was a randomized design with three replicates and repeated once for better accuracy. Production of volatile antifungal substances: Volatile nature of antifungal compounds was evaluated according to agar strip removal technique
44

Proceedings of the Young Scientist Forum Symposium
172
described by Choi et al. (2006). Experiment was repeated once in completely randomized design with three replicates. The results were expressed as PIRG values compared to a control. Mycelial growth test: First, small agar plugs of seven days old C. truncatum was dipped in each overnight antagonistic bacterial suspension (108 CFU mL-
1) for thirty minutes in sterile test tubes. The treated C. truncatum mycelial plugs were air dried in laminar air flow and transferred onto fresh PDA media separately. Fungal plugs dipped in sterile broth medium were used as
the control. Plates were incubated at 28 C for seven days. Then crude supernatants of overnight nutrient broth cultures of each bacterial antagonist were incorporated with PDA in 2:3 (V/V) ratio and 5 mm size mycelial blocks of C. truncatum was introduced into those media and the radial growth of the fungus was measured. Spore germination test: A volume of 100 μL of C.truncatum spore suspension (106 spores mL-1) was spread over PDA medium using a bent glass rod. Two sterilized filter paper discs (0.5 cm diameter) were placed 3 cm apart from each other on PDA. A volume of 50 μL of each bacterial suspension was pipetted onto filter papers in each plate. Filter paper discs containing 50 μL sterilized nutrient broth served as the control. After 24 hours of incubation
at 28 C, the diameter of the inhibition zones around filter paper discs were measured. All the collected data was analyzed using Dunnet’s test in SAS software. Results and Discussion Volatile and diffusible antifungal substances: According to the results obtained, antifungal substances produced by selected antagonists were diffusible in nature. As shown in Table 1, the mycelial growth of C. truncatum has reduced significantly (p<0.05) in the cellophane overlay technique. Except C31 isolate, all the other antagonists have been able to completely inhibit the radial growth of C. truncatum through their diffusible antifungal substances. As there weren’t any significant inhibition in radial growth of C. truncatum at significant level in agar strip removal technique, the antifungal substances secreted by the antagonists can be considered as non volatile (Table 1). As C31 antagonist doesn’t produce either diffusible or volatile antifungal substances, its bio controlling mechanism may not be antibiosis.
In both experiments of mycelial growth test, inhibition of radial growth of C. truncatum by all the selected antagonists was 100 % compared to the control.

Proceedings of the Young Scientist Forum Symposium
173
Table 1. Growth inhibition of C. truncatum by diffusible and volatile antibiotics produced by antagonistic bacteria at seven days after incubation
Antagonist Inhibition of radial growth (%) ………………………………………………………………… Diffusible antibiotics Volatile antibiotics
F2 100 0 F35 100 0 F65 100 0 F79 100 0 F80 100 0 C31 12 * 0 Control 0 0
Note: * PIRG isn’t significant at p<0.05 level.
Mycelial plugs of C. truncatum have lost their viability due to the effect of antagonistic bacteria when dipped in an overnight culture. In the PDA incorporation method where the media composition was antagonists’ supernatant: PDA in 2:3 ratio didn’t allow the growth of C.truncatum. As shown in Table 2, all the antagonists significantly inhibited the mycelial growth of C. truncatum at p<0.05 level.
Table 2. Effect of antagonistic bacteria on the growth of C. truncatum after seven days of incubation
Antagonist Inhibition of radial growth (%) …………………………………………………………………… Dipping method Incorporation method
F2 100 100 F35 100 100 F65 100 100 F79 100 100 F80 100 100 C31 80 100 Control 0 0
Note: *all Inhibition of PIRG as significant at p<0.05 level
In spore germination test 50 μL of each antagonist which were added to filter paper discs inhibits spore germination significantly giving a clear zone around each disc. But C31 antagonist didn’t show any inhibition on spore germination on the spore lawn. The radius of each inhibition zone is indicated in Fig. 1.

Proceedings of the Young Scientist Forum Symposium
174
Figure 1. Radius of the inhibition zone on C. truncatum spore lawn by each
antagonist
Analysis of all the selected antagonists showed a great antagonism against C. truncatum in many ways. It is clear that mycelial growth and spore germination of C. truncatum are strictly controlled through extracellular antifungal substances F2, F35, F65, F79, F80 antagonists. Rahman et al. (2007), have also stated the antagonistic effect of Burkholderia cepacia and Pseudomonas aeruginosa against Colletotrichum gloeosporioides as discussed above. However C31 antagonist deviates from others, probably because C31 displays fungistatic properties by competition rather than antibiosis. Further studies will be required to confirm this assumption. Conclusions and Recommendations F2, F35, F65, F79, F80 antagonists produce extracellular antifungal compounds which strongly inhibit the mycelial growth and spore germination of C. truncatum. References Choi GJ, Kim JC, Park EJ, Choi YH, Jang KS, Lim HK, Cho KY, Lee SW (2006) Biological
control activity of two isolates of Pseudomonas fluorescence against rice sheath blight. Plant Pathology Journal 22: 289-294.
Nourozian J, Etebarian HR, Khodakaramian G (2006) Biological control of Fusarium graminearum on wheat by antagonistic bacteria. Songklanakarin Journal of Science and Technology 28: 29-38.
Pakdeevaraporn P, Wasee S, Taylor PWJ, Mongkolporn O (2005) Inheritance of resistance to anthracnose caused by Colletotrichum capsici in Capsicum. Plant Breeding 124: 206-208.
Ragsdale NN, Sisler HD (1994) Social and political implications of managing plant diseases with decreased availability of fungicides in the United States. Annual Review in Phytopathology 32:545-557.
Sariah M (1994) Potential of Bacillus spp. as a biocontrol agent for anthracnose fruit rot of chilli: Malayas. Applied Biology 23: 53-60.
Proceedings of the Young Scientist Forum Symposium
175
LAND SUITABILITY EVALUATION FOR RUBBER CULTIVATION USING MULTI CRITERIA DECISION APPROACH AND GIS: SPECIAL FOCUS ON
THE AMPARA DISTRICT
J.K.S. Sankalpa145, S. Karunaratne2 and W. Wijesuriya1
1 Rubber Research Institute of Sri Lanka
2 Faculty of Agriculture & Plantation Management, Wayamba University of Sri
Lanka, Makandura, Gonawila(NWP), Sri Lanka
Introduction A considerable extent of rubber lands in the Wet Zone has been converted to other crops due to unstable price and high cost of production in the rubber sector. Conversion of rubber lands into industrial sites and dwelling units was also common in these areas. Hence, to meet the production targets in the rubber sector, the Government has taken an initiative to expand rubber cultivation into drier areas due to low availability of lands for further expansion in traditional areas. These areas include; Ampara, Anuradhapura, Vavuniya, Kilinochchi and Mullaitivu districts (Anon 2011a). Among these areas, the most extensive and rapid change in expansion of rubber farming occurred in the Eastern province of Sri Lanka. In order to perform in an optimal manner, rubber plantations require certain climatic and physiographical characteristics as listed in the handbook of rubber (Anon 2011b). Hence, it is a basic necessity to identify areas which are suitable for rubber cultivation based on the requirements to reap the maximum benefits. On the other hand, areas with limiting characteristics also should be identified to propose recommendations to minimize adverse impacts. In this regard, crop-land suitability analysis is a most important step in achieving optimum utilization of the available land resources. In this paper we examine the resource quality and accessibility for rubber farming in Ampara district of Sri Lanka using multi criteria and GIS approach of land suitability evaluation. The aim of this multi criteria evaluation with Geographical information systems (GIS) is to provide more flexible and superior mechanism to the decision makers for efficient planning and management in rubber farming in Ampara district. Materials and Methods Study Area and Data used: The study area is bounded within 80⁰ 58 and 81⁰ 52 E longitudes and 7⁰ 44 to 6⁰ 30 latitudes. Different types of data sets were used for rubber land suitability analysis. Various physical properties of the land (Soil and topography) and ecological parameters (temperature and
45

Proceedings of the Young Scientist Forum Symposium
176
rainfall) of the area were used for this purpose. Economic suitability is measured using accessibility to the market via main roads. Soil texture map provided by European commission joint research center and 1:50,000 topographical maps provided by DIVA.org free GIS data sources were used for the study. Temperature and rainfall maps used were developed by Natural Resources Management Centre (NRMC). Preparation of topographic database: USGS SRTM DEM (90 m resolution) was used to produce the slope map for the study area. Slope values were divided into three classes and rating for land suitability was done as proposed by Karunaratne et al. (2011). Preparation of soil database: Physical properties of soils were considered in the analysis. There were 9 soil series in the soil map and was prepared by digitizing the soil texture map of Ampara district. Rating was done for the soil classes according to Karunaratne et al. (2011). Climate data: Temperature and rainfall are the two climatic factors which affect the performance of rubber cultivations. Ratings for these variables were assigned based on the requirements for rubber planting (Anon 2001b) and as proposed by Karunaratne et al. (2011). Market access data base: In this research, in addition to the variables considered by Karunaratne et al. (2011), Market access was determined by the distance from major roads in the district. Euclidean distance road map was prepared using GIS spatial analyst tool. The accessibility attribute also divide into three levels-good, moderate and poor based on distance from road. Obviously the time spent in transporting produce to the roadside increases as accessibility declines due to the greater distance and poorer conditions of the roads Land suitability analysis: Arc GIS 10 software was used for preparing the slope map, temperature maps, mean rainfall map, soil series map and the Euclidean distance map. Those maps were combined as inputs for the land suitability model according to the equation given below. Spatial multi criteria suitability analysis is a process where geographical data is combined and transformed into a decision. Analytical Hierarchical process (AHP) was used to evaluate the priority weights of each factor (Satya 2008). A final value of the weight for each criterion was decided compared with available literature. Table 1. Weight for the model parameters
Parameter Weight (%)
Rainfall 55
Maximum and minimum temperature 2 Slope 15 Elevation 6 Soil type 15 Market access 7

Proceedings of the Young Scientist Forum Symposium
177
Suitability raster model for cultivation,
n
i
m
j
jii rcws1 1
s = suitability for cultivation of rubber, iw = weight
for criteria i, ic = criteria for suitability and jr = restriction
Results and Discussion All inputs were used in index model according to the suitability criteria. Maps were prepared after reclassifying all attributes for each variable. The proposed suitability map for rubber cultivation in the Ampara district and generated criteria are depicted in Fig. 1.
f. Land Suitability
map of Ampara
e. Minimum
Temperature e. Maximum
Temperature
b. Rainfall map c. Slope map
b. Soil map
d. Max. Temperature Map
e. Min. Temperature Map
f. Land suitability map
b. Rainfall map c. Slope map
a. Soil map
Figure 1. Main input parameters and generated Land suitability map. The area which is identified as most suitable can be effectively used for rubber cultivation. Areas having moderate suitability should be given a package of conservation practices to control moisture and nutrient while increasing the market accessibility. Areas having Poor resource quality should be given more attention when converting them into rubber cultivation. Validation of the derived land suitability model was done using
Proceedings of the Young Scientist Forum Symposium
178
available Land Use map for the study area (year 1981). Most of the suitable land areas were overlaid with high dense to low dense vegetation cover. Conclusions and Recommendations Areas falling into most suitable classes can be effectively used for rubber cultivation with minimum conservation and technical effort which is effective for minimizing the cost of production in rubber farming. Percentages of land extent under most suitable, suitable and moderate suitable are 18 %, 35 % and 10 % respectively. Suitable land for cultivation rubber under most suitable, suitable and moderate suitable land areas are 75,996 ha, 147,770 ha and 44,331 ha respectively. The outcomes of this research can be effectively used for better decision making in ground planning and for further expansion schemes for rubber expansion within the district. The analysis could be refined further by incorporating more suitability indicators such as soil chemical properties and present land use condition in the district. References Anon (2011a) Plantation Sector Statistical Pocket Book, Ministry of Plantation
Industries, Colombo 02. Anon (2011b) Hand Book on Rubber Agronomy, Rubber Research Institute of Sri
Lanka. Karunararthna S, Edirisinghe J, Wijesuriya W, Hearths K, Samarappuli L (2011) Land
suitability model for rubber in Moneragala district: first approximation using GIS. Journal of the Rubber Research Institute of Sri Lanka
Saaty L (2008) Decision making with the analytical hierarchy process. Journal of the Services Sciences 1: 1

Proceedings of the Young Scientist Forum Symposium
179
EFFECTS OF BIOCHAR PRODUCED FROM DIFFERENT FEED STOCK MATERIALS ON SOIL PROPERTIES IN SANDY REGOSOL OF JAFFNA, SRI
LANKA
S. Senthuran146 and N. Gnanavelrajah1 1Department of Agricultural Chemistry, Faculty of Agriculture, University of Jaffna
Introduction Soil fertility plays a vital role in agricultural productivity. Sri Lanka’s sandy regosol is one of the major soil groups in dry zone found along or near the coastline of the Jaffna Peninsula covering 25 % of land area. Low nutrient retention and high hydraulic conductivity of sandy regosol soils contribute to the large amount of water and nutrients to be lost beyond the rooting zone of plants and is low in agricultural value. Biochar does increase crop productivity through an improved water holding capacity of the soil, along with improved crop nutrient availability, especially in sandy soils. Biochar is the charred by-product of biomass pyrolysis, the heating of plant-derived material in the absence of oxygen in order to capture combustible gases. Therefore application of biochar could be a solution to low productivity of sandy regosols. With this background, a field experiment was conducted to study the effect of biochar produced from different feed stocks namely paddy husk, coconut nut shell and palmyrah nut shell with combination of departmental recommended fertilizer (DRF) on growth and yield of brinjal and soil properties. Hence objective of this study was to find the effects of three different biochar on soil properties. Materials and Methods Study area: The study area is a low country dry zone located in the Vidaththatpallai located in Thenmaradchi DS Division, Northern Province of Sri Lanka. The soil belongs to sandy regosol. Charred biomass production: Different biomass namely paddy husk, coconut shells and palmyrah nut Shells were charred using two drum method. In this method one small drum filled with biomass was kept inside a big drum so as to put firewood in between the available space and firewood was lit. Charred biomass was broken separately into powder form, sieved by 2 mm and 4 mm sieves and both were mixed at 1:1 ratio. Field experiment: Field experiment was designed with four treatments (Table 1) arranged in a randomized complete block design (RCBD). Details about fertilizer application are given in Table 2. Each treatment was replicated three times. One week after land preparation char was applied at the rate of 10 t ha-1. Char was mixed well with soil at a depth of 15 cm and a
46

Proceedings of the Young Scientist Forum Symposium
180
diameter of 60 cm around each planting hole. Twenty one day old brinjal seedlings were transplanted after two weeks of char incorporation. Irrigation was done manually using buckets made up of palmyrah leaf which is practiced in the sandy soil villages. After the transplantation irrigation was done daily until twenty days and thereafter once in two days. Table 1. Treatments application (DOA) Table 2. Fertilizers Note: DRF-Department of Agriculture Recommended Fertilizer Analysis of soil sample collection and preparation: Sixty days after applying char soil samples were collected from each plot (12 plots) in the experimental field. From each treatment plot three plants were randomly selected and samples were collected within 30 cm radius from plant and up to 15 cm depth. Then collected samples were air dried, crushed and sieved to pass through 2 mm sieve. Available phosphorus, potassium, nitrogen (ammonium and nitrate), CEC, organic matter content, and soil moisture content were measured. Results were analyzed by SAS (9.1) package and the mean separation was done by Duncan multiple range test at p=0.05 Results and Discussion Results showed that biochar application increases the N availability than the fertilizer application alone (Fig. 1.1). Ding et al. (2010) have reported that application of biochar reduced overall cumulative losses of NH4
+-N via leaching which could have been due to increased ammonium adsorption by biochar treated soils. Available P of initial soil was 17.91 mg kg-1. All treatments had higher P availability compared to initial soil.
DRF-Basal :
7.07 kg
(15:65:17)
DRF-1st
top
dressing
Urea
(N)
1.09 kg 1.09 kg
TSP (P) 4.74 kg
MOP
(K)
1.24 kg
Treatment No
Experiment procedure
T1 DRF T2 Paddy husk char +
DRF T3 Coconut shells char +
DRF T4 Palmyrah nut shells
char + DRF

Proceedings of the Young Scientist Forum Symposium
181
6. Moisture content5. Organic matter content (OM)
4. Cation exchange capacity (CEC)
3. Available potassium
1.Available nitrogen 2. Available phosphorous
Figure 1. Effect of different treatments on N availability, P availability, K availability, CEC OM and moister contents with 40 DAP soil. The columns marked with same lowercase letters do not differ significantly (p<0. 05). Error bars, n=3). Note: T1- DRF T2- Paddy husk char + DRF T3- Coconut shells char + DRF T4- Palmyrah nut shells char + DRF. T4 had the highest significant available P compared to all other treatments (Fig. 1.2). Lehmann et al. (2003) has reported that the immediate beneficial effects of bio-char additions for nutrient availability are largely due to the availability of higher K and P. T4 (palmyrah nut shells char + DRF) had the significantly highest available K compared to all other treatments except T2
(paddy husk char + DRF) (Fig. 1.3). All char treatments had higher CEC compared to without char treatment. T4
had the highest CEC, while T1 had the lowest CEC compared to all other

Proceedings of the Young Scientist Forum Symposium
182
treatments (Fig. 1.4). Biochar has high surface area which increases soil CEC. T4 gave the highest organic matter compared to all other treatments and T1
had the lowest (Fig. 1.5). Lehmann (2007) has also reported that high organic carbon was in soils treated with biochar. Moisture content (Fig.1.6) was significantly increased in char added treatments (T2, T3 and T4) compare to without char treatment (T1). Increased moisture content could be attributed due to increased water holding capacity by char. Conclusions and Recommendations Palmyrah nut shell char significantly increased available N, P, K, CEC, organic matter content, and moisture content compared to without char treatment. Though coconut shell char and paddy husk char also improved these properties, significant increases were observed only in available K, CEC, organic matter content and moisture content. References Ding Y, Liu YX, Wu WX, Shi DZ, Yang M, Zhong ZK (2010) Evaluation of biochar
effects on nitrogen retention and leaching in multi-layered soil columns. Water, Air, & Soil Pollution 213: 47-55.
Glaser B, Lehmann J, Zech W (2002) Ameliorating physical and chemical properties of highly weathered soils in the tropics with charcoal–a review. Biology and Fertility of Soils 35: 219-230.
Lehmann J (2007) Bio-energy in the black. Frontiers in the Ecology and Environment 5:381-387.
Lehmann J, de Silva Jr, Steiner C, Nehls T, Zech W, Glaser B (2003) Nutrient availability and leaching in an archaeological Anthrosol and a Ferralsol of the Central amazon basin: fertilizer, manure and charcoal amendments. Plant and Soil 249: 343-357.
Mulcahy DN, Mulcahy DL, Dietz D (2013) Biochar soil amendment increases tomato seedling resistance to drought in sandy soils. Journal of Arid Environments 88: 222-225.
Sohi S, Lopez-Capel E, Krull E, Bol R (2009) Biochar, climate change and soil: a review to guide future research. CSIRO Land and Water Science Report 5: 17-31.

Proceedings of the Young Scientist Forum Symposium
183
ACCEPTANCE OF A CLINICAL PHARMACY SERVICE BY OTHER MEMBERS IN THE HEALTHCARE TEAM: EXPERIENCE IN A TERTIARY
CARE HOSPITAL IN SRI LANKA
L.G.T. Shanika147, S. Jayamanne1,2, N. Wijekoon2, J. Coombes1, I. Coombes1, D. Perera1, N. Mamunuwa1, V. Pathiraja1, H. A. De Silva2 and A. Dawson1
1South Asian Clinical Toxicology Research Collaboration
2Faculty of Medicine, University of Kelaniya
Introduction Clinical pharmacists are part of a multidisciplinary team whom intends to provide a patient-oriented pharmaceutical care to enhance the quality use of medicines (QUM) of patients. Clinical pharmacist takes an accurate medication history of patients’ pre-admission drugs and reviews it for safety, appropriateness and efficacy and provides medicine information to health professionals and patients. Ward based clinical pharmacists interact with other healthcare professionals as a source of drug information and educate them when necessary. Many studies done in different countries in the world have shown the benefits received by patients when a clinical pharmacy service is incorporated to the multi-disciplinary healthcare team. In Sri Lanka, the pharmacists’ direct involvement in patient management is limited and their duty is restricted to drug dispensing. The concept of clinical pharmacy is relatively new to the current healthcare system in Sri Lanka. In Sri Lanka, no research has been previously carried out to evaluate the impact of a ward based clinical pharmacy service in optimizing QUM and the perspectives of the healthcare team on this service. The objectives of this study were to evaluate the rate of acceptance of the clinical pharmacist’s recommendations regarding Drug Related Problems (DRPs) by the healthcare team, to determine the quality and quantity of drug information queries directed to the clinical pharmacist and to assess the level of acceptance of the clinical pharmacist’s service by the other members of the ward staff. Materials and Methods This is a part of a large controlled trial conducted to assess the effectiveness of a clinical pharmacy service in patient management for the first time in Sri Lanka. It was done over a seven month period, in the Professorial Medical Unit of a tertiary care hospital. Patients with defined chronic non-
47

Proceedings of the Young Scientist Forum Symposium
184
communicable diseases who needed long term medications were included in the trial. The control group received current standard care, while the intervention group received a clinical pharmacist’s service in addition to the standard care. DRPs were classified according to the adapted PCNE classification system V5.01.Through prospective (intervention group) or retrospective (control group) medication review the pharmacists identified the DRPs. In the intervention group the clinical pharmacist discussed the hospital related DRPs with the healthcare team (doctors and nurses). The quality and quantity of medicine - related questions directed to the clinical pharmacist by healthcare staff during the study period were also recorded. A staff survey was carried out at baseline before introducing the clinical pharmacy service and at the end of the study to determine the views of doctors and nurses regarding their perceptions of the role of clinical pharmacist as a member of the healthcare team. The survey was conducted through a pre-tested self-administered questionnaire. The questionnaire was peer reviewed prior to the survey. The questionnaire was composed with 9 closed-ended questions. Final question was about assessing the attitudes of staff on specific tasks of the customized clinical pharmacy service in Sri Lanka. An individual consent form was attached with the questionnaire and it clearly explained the purpose of this survey and the participants’ right to grant or withhold the consent voluntarily. Moreover the investigator verbally explained all the information before distributing the questionnaire. Ethics approval for the study was obtained from the Ethics Review Committee of the Faculty of Medicine, University of Kelaniya. The data were input into SPSS, V.21. Descriptive statistics were used to interpret the results. P values less than 0.05 (P > 0.05) were considered to be statistically significant. Results and Discussion In the intervention group a total of 270 (268 doctors and 2 nurses) recommendations regarding DRPs were directed to the healthcare team. Eighty three percent [221/268 (95% CI=77% - 87%; P<0.001)] of the recommendations were accepted by the doctors. Previous acceptance rates reported in the literature range between 69% - 90%. The rate of implementation of the pharmacist’s recommendations was 74.3% [199/268 (95%CI=69% - 79%; P<0.001)] consistent with previous studies. A few DRPs (69/268) were not resolved even though discussed with prescribers. A majority happened when interventions were directed to intern house officers (58/69). This may be due to lack of experience of intern house officers as they started the carrier recently. Prescribers identified some DRPs were not significant to take an action. Almost all pharmacist
Proceedings of the Young Scientist Forum Symposium
185
recommendations on drug-drug interactions (3/3) and prescribing errors (17/17) were accepted by doctors. A large number of recommendations were suggested on untreated indications or missing drugs from prescription (159/268). Out of 159 interventions, 116 were acted upon by doctors [73.0% (95%CI=65% - 80%; P<0.001)]. Two DRPs about missing the drugs on drug chart when recording were discussed with nursing staff were resolved completely. We believe that the development of a good inter-professional relationship with mutual trust greatly contributed to the high rate of acceptance. A total of 17 medication-related questions were directed to the clinical pharmacist during the study period. Nine were from doctors, 4 were from nurses and 4 were from the medical students. The majority of questions from doctors and medical students were related to the doses, indications and available generic substitutions in the market. The nature of the questions directed from nurses’ was using the pharmacist as a source of information about indication, side effects and generic name of the drugs. At the end of the study period the rate of the response to the questionnaire from doctors was higher compared to the baseline survey; 67% (8/12) at baseline and 92.3% (12/13) at the end of the study. The attitudes of the medical staff regarding incorporation of clinical pharmacy service to the current healthcare system were satisfactory at the baseline period. At the end of study, 100% of consultant physicians, 100% of senior registrars, 100% of registrars and 80% of house officers admitted that the incorporation of a clinical pharmacist to the existing health care system would be useful and this collaboration could improve the current standards especially in the public sector hospitals. Ninety-two percent of medical staff would be happy to receive the services from a competent clinical pharmacist. Similarly, Gillespie, et al. (2012) reported that 95% of physicians were satisfied with the incorporation of a new clinical pharmacy service to University Hospital in Uppsala, Sweden. Sixty-seven precent (95%CI=35% - 90%; P>0.05) of medical staff accepted that the pharmacist could advise
medical staff and nurses regarding the issues related to medications. One (8%) prescriber disagreed with that statement and 25% didn’t express any view. Majority [91.7% (95%CI=61.5% - 99.8%; P=0.006)] of medical staff agreed that adding a pharmacist to the team isn’t a waste of money and is necessary to the current healthcare system. Sixty-seven percent of prescribers agreed that pharmacists can play an important role in tailoring drug therapy for individual patients. Ninety-two percent of medical staff acknowledged that pharmacists can play an important role in improving patients’ medication taking behaviour. These data highlight that the clinical

Proceedings of the Young Scientist Forum Symposium
186
pharmacy service has potential to be well accepted and utilized by the medical staff in Sri Lanka. The survey response rate of nursing staff was 80% at baseline. However the nursing staff did not consent to participate in the questionnaire after the study. The perspectives of nursing staff at baseline (before introducing the clinical pharmacy service to the ward) was negative; 58.3% (95%CI=27.7% - 84.8%; P>0.05) stated that there is no need of clinical pharmacy service to the ward and 67% (95%CI=35% - 90%; P>0.05) weren’t happy to welcome this service. Although a wide proportion of doctors acknowledged the importance of clinical pharmacy service, the response received from the nursing staff was negative in the baseline period. Lack of awareness and knowledge about the importance of this service could be a likely reason for this negative response. Moreover, there were fewer opportunities to interact with nurses regarding patients’ drug management and this also could have contributed to the results of the survey. This data emphasize that there is a need to build trust and rapport with nursing staff in order to promote a clinical pharmacy service in Sri Lankan hospitals. Conclusions and Recommendations There was high acceptance and implementation rate of clinical pharmacist’s recommendations regarding DRPs by the medical team. The medical practitioners were satisfied with the inclusion of a ward based pharmacist to the healthcare team. Doctors recognized that this collaboration improves the rate of resolution of DRPs which in turn improves QUM in patients. However there is a need to improve rapport and relationships between the clinical pharmacist and nursing staff with regards to patient drug management. Acknowledgement Financial assistances: South Asian Clinical Toxicology Research Collaboration Research grants Number: NHMRC 630650
References Blix HS, Viktil KK, Moger TA, Reikvam A (2006) Characteristics of drug-related
problems discussed by hospital pharmacists in multidisciplinary teams. Pharmacy World & Science 28: 152-158.
Gillespie U, Mörlin C, Hammarlund-Udenaes M, Hedström M (2012) Perceived value of ward-based pharmacists from the perspective of physicians and nurses. International Journal of Clinical Pharmacy 34: 127-135
The Society of Hospital Pharmacists of Australia (2005) SHPA standards of practice for clinical pharmacy. Journal of Pharmacy Practice and Research 35: 122-146.

Proceedings of the Young Scientist Forum Symposium
187
FOREIGN DIRECT INVESTMENT AS A CATALYST FOR ECONOMIC GROWTH IN SRI LANKA
P. Sivashankar148
1Sabaragamuwa University of Sri Lanka, Beliholoya, Sri Lanka
Introduction Foreign direct investment (FDI), "refers to an investment made to acquire lasting or long-term interest in enterprises operating outside of the economy of the investor." The investment is direct because the investor, which could be a foreign person, company or group of entities, is seeking to control, manage, or have significant influence over the foreign enterprise. It involves participation in management, joint venture, transfer of technology and expertise. Foreign investment can be a significant factor for development of less developed countries. It provides an inflow of capital and funds. Also it contributes to economic growth through an increase in productivity by providing better technologies and managerial skills to the host countries. The relationship between FDI and economic growth has long been a subject of great interest in the field of international development. Developing and transition economies respectively accounted for 45 per cent and 6 per cent of global FDI. FDI is often seen as an important catalyst for economic growth. Empirical studies on the FDI-growth relationship have reported conflicting results. Some studies have found that FDI exerts a positive growth effect on the recipient countries, while others have discovered no such evidence or even a negative effect on growth. Few studies have been conducted on FDI and growth with relevance to developing economies. Yet, the results reveal that the conclusions are country specific and do not support generalization. Given this context, this study investigates the role of FDI in Sri Lankan economic growth. Thus, the objective of the research is to examine the relationship and the direction of causality between FDI and economic growth in Sri Lanka. Trade openness is crucial for acquiring the potential growth impact of FDI. FDI has no impact on long run growth after controlling for the country specific differences in some studies. Although several studies on FDI and growth in developing countries exist, very few studies have been done on Sri Lanka. Methods and Materials Assume a production function of the form of a conventional Cobb-Douglas function,
48

Proceedings of the Young Scientist Forum Symposium
188
Where, Y is aggregate real output; K, capital stock; and L, labour force. Addition of more variables and logarithmic transformation yields the following equation (2).
Where Log depicts the logarithmic form, GDPPC is GDP per capita, FDI is the foreign direct investment, CAP is the amount of capital, EXP is the exports, trend is the time variable for capturing technology improvements, and Open is the dummy for trade openness (0 for 1970 to 1977 and 1 for thereafter). is the intercept of the full linear model and β’s are the respective elasticities. Data for the analysis were obtained from world bank and UNCTAD. The time period taken into account was from 1970 to 2011. The following tests were done to overcome the effects and avoid spurious regression. Unit root test: The objective of the unit root test is to empirically examine whether a series contains a unit root or not. If the series contains a unit root, this means that the series is non-stationary. Otherwise, the series will be categorized as stationary. Co-integration test: This test was used to find out the long-term relation between the variables. Granger causality test (GCT): FDI and GDP growth are, in fact, interlinked and co-related through various channel. There is no theoretical or empirical evidence that could conclusively indicate sequencing from either direction. For this reason, the GCT will be carried out on FDI and GDPPC. Results and Discussion Initially, a GCT was conducted for FDI as dependent variable and GDP per capita as independent variable. Next, another GCT was performed where GDP was the dependent variable and FDI as independent variable.
Table 1. Results of granger causality test
Direction F value Probability
GDPPC does not granger causes FDI 1.36 0.2805 FDI does not granger cause GDPPC 2.61 0.0646* Note: *significant at 10 % significant level
It is concluded that FDI can cause GDP per capita at 10% significant level. This causality is not very strong. Therefore, there is no robust unidirectional relationship of cause and effect. Since both test revealed that probability values were not significant, it can be concluded, that both can granger cause each other and lead to each other. Thus, there is bidirectional causality present between the variables, GDPPC and FDI.

Proceedings of the Young Scientist Forum Symposium
189
To overcome serial correlation and to make data white noise, lagged variables or differenced variables can be used. First order derivatives of the variables were used to remove the non-stationary effect. By differencing, autocorrelation is removed and made to white noise. GCT was performed using Wald test. According to the results, a weak bi-directional causality between differenced logarithmic variables of GDP per capita and FDI inflows were obtained. A robust relationship between these two variables cannot be inferred, as they are only significant at 10 % significant level. Studies on other countries reveal most of the time a unidirectional or bidirectional relationship between these two variables exists in many instances.
Table 2. Results of the granger causality test after differencing
Equation Excluded χ2 df Prob> χ2
Dln_gdp Dln_FDI 8.8761 4 0.064 *
Dln_gdp ALL 8.8761 4 0.064 * Dln_FDI Dln_gdp 7.9601 4 0.093 * Dln_FDI ALL 7.9601 4 0.093 * Note: *significant at 10 % significant level
A regression analysis was employed with GDPPC as the dependent variables as in equation 2. It suggests that the model captures 98 % of variation of independent variables to GDP.
Table 3. Multivariate regression results
Variable Coefficient T value
logFDI 0.0477*** 4.46 logCAP 0.4516 *** 7.29 logEXP -0.0634 -0.83 open - 0.8093*** -9.67 logtrend 0.5948*** 9.07 Constant 12.0114*** 9.6
R2 = 98% Note: ***significant at 1 %, **significant at 5 %, and *significant at 10%
A 1 % increase in FDI increases GDP by 0.047 %, and a 1 % increases in Capital increase GDPPC by 0.45 %. Export coefficient is not significant. When the country is open for trade the GDP reduces by 0.80 %, this suggests that the exports composition might be mostly on raw materials and unprocessed items. This will reduce the income earned and rupee depreciation with the US dollar could have had a serious effect on the income earnings from exports. The dummy also captures only 7 years of closed trade. The dependent variable is on per capita basis, which suggest that the increase in FDI, Exports, and openness will not directly affect the per capita income, it

Proceedings of the Young Scientist Forum Symposium
190
would take some time to materialize in the income per capita. Time increments increase GDPPC by 0.59 %, which also accounts for the technological improvements over the years. The host country situations, especially on human capital, infrastructure, technical know-how and governance issues matter a lot in properly utilizing the Benefits of FDIs.
Conclusions and Recommendations This study examines the relationship between FDI and GDP in Sri Lanka using data from 1970-2011. The results indicated that FDI is one of the key determinants of Sri Lankan economic growth after the 1977 period. The empirical results suggest that one long-run equilibrium relationship exists between GDP, FDI, CAP, Trend and negative relationship with variable, OPEN. The Granger causality approach is then used to investigate the direction of causality flow in the short-run and long-run. The FDI inflows cause an independent influence on economic growth and direction of Granger causation is towards FDI to GDP growth and GDP growth to FDI. Thus, there is bidirectional Granger causality between FDI and economic growth. A unit increases in FDI causes GDP to rise by 0.047 units. GDP increases by 0.45 units per unit increment in capital. In general, the study appears to support the notion of foreign direct investment on GDP growth of Sri Lanka. This finding confirms the relevance of the economic reform programmes in Sri Lanka to reduce macroeconomic instability, remove economic distortions, promote exports and restore sustainable domestic investment for economic growth. However, the country’s protectionist trade policies, direct and indirect regulatory barriers may have impeded foreign investment.
References Balamurali N, Bogahawatte C (2004) Foreign direct investment and Economic
growth in Sri Lanka. Sri Lankan Journal of Agricultural Economics 6: 37-50 Balasubramanyam VN Salisu M. Sapsford D (1996) Foreign direct investment and
growth in EP and IS countries. Economic Journal 106: 92-105. International Monetary Fund (1993) Balance of Payments Manual, 5
th ed,
Washington, D.C. UNCTAD (2012) World Investment Report: Towards a New Generation of Investment
Policies. United Nations. World Bank (2012) World Development Indicators Report 2012. The World Bank,
Washington D.C.

Proceedings of the Young Scientist Forum Symposium
191
INTER-RELATIONSHIP BETWEEN THE PREVALANCE OF TICK INFESTATION ON CATTLE AND THE FACTORS RELATED TO BREED, PHYSIOLOGICAL STAGE, MANAGEMENT AND DIVERSIFICATION
SYSTEMS
E. Subalini149, S. Dasinaa1 and S. Thanuejah1
1Faculty of Agriculture, Eastern University of Sri Lanka, Chenkalady Introduction Ticks are economically the most important ectoparasite of cattle and other domestic species in tropical and subtropical countries (Jongejan and Uilenberg 1994). The ticks cause harm to animals through blood loss, general stress and irritation, depression of immune function and damage to hides and skin (Ghost et al. 2007). Although, economic losses due to ticks are mainly due to the diseases which they transmit (Garcia 2003), financial losses associated with nagging, irritation and depreciation of the value of skins and hides (up to 20 to 30 %) are also significant (Biswas 2003). Susceptibility and Resistance of animals to tick infestation have been influenced by several factors including; species, age, sex, season, breed, photoperiod and management. In Sri Lanka, ticks are the most important of all ectoparasites. The economic loss incurred when they infest livestock particularly, cattle are enormous. To control the tick infestation efficiently well-documented information on the occurrence of ticks is utmost important. To develop a proactive program for ticks' control at smallholder and commercial level, it is important to determine prevalence of ticks and assessing the risk factors of tick infestation are important to recommend best tick control measures. In this context, the present study was designed with the objective to report the prevalence status of ticks in different breeds of cattle at various physiological stages under different management and diversification systems and to analyzing the associations related with the risk factors of the tick prevalence. Materials and Methods The study was conducted in four selected veterinary ranges such as Vantharumoolai, Kokkaddicholai, Kaluwanchikudy and Thumpankeni in Batticaloa district during the period from January 2014 to September 2014. The selected veterinary ranges had comparatively higher cattle population in Batticaloa district. For the analysis, 311 cattle were randomly selected irrespective to their age, sex, breed and physiological stages. Equal numbers of cattle were selected from each veterinary range. The parameters
49

Proceedings of the Young Scientist Forum Symposium
192
recorded were type of breed, sex of animals, physiological stage of animals, management and diversification system. The raw data recorded from the study were entered into Microsoft excel data base system and using SPSS version 22 computer program, data were summarized and analyzed. Chi-square (χ2) test was used to determine the variation in infestation prevalence between different peasant associations. A 5 % significant level was used to determine whether there were significant differences in the parameters measured between the groups. Results and Discussion Out of 311 animals, 124 cattle were tick infested among the study areas. The overall prevalence was 40 %. Chi-square value indicated no significant (P>0.05) association in tick infestation among different breeds of cattle. Higher prevalence of tick infestation was recorded in local cattle (51.61 %) as compared to exotic crossbred cattle (0.8 % to 16.12 %). The higher tick infestation in local cattle might be attributed to differences in management system, lack of supplementary feeding to local cattle breed, lack of control measures against tick on local cattle breeds. Furthermore, it can be assumed that it might be due to lack of interest of farmers about local cattle as well as taking more care to cross breeds than local cattle. Among the exotic crossbred cattle, higher tick infestation was recorded in crossbreds of temperate cattle (65 %) such as Jersey and Friesian as compared to crossbreds of tropical cattle such as Sahiwal, Sindhi and Tharparkar. This finding was supported by the report made by Sajid et al. (2009) where Pakistan's Sahiwal cattle is more resistant to tick infestation than European breeds. Tick resistance is a hereditary trait in Bos indicus cattle (Jongejan and Ulenberg 2004). According to the Chi-square value (χ2=20.64, df=4, P>0.05) a significant association was observed in tick infestation among different physiological stages of cattle. Regardless of the locations under study, the higher prevalence of tick infestation (70.90 %) was recorded in adult cow (heifer, lactating, pregnant and dry) as compared to adult males (4.84 %) and calves (24.19 %). However, the findings of the present study was not agreed with the observation made by Hostis et al. (1996) and Swai et al. (2005) where the depicted that the tick infestation was higher in calves as compared to adult animals. Among the adult females higher tick infestation was observed in lactating animals (54.54 %). Moreover, it was observed that higher number of ticks were localized in an around the udder and teats. During the lactating stage, the lack of immunity in animals and soft tissues and thinner skins of udder would help in the penetration of mouth parts for feeding (Sajid 2007). The results of the study further revealed that a significant association (χ2=21.39, df =2, P<0.05) was observed in tick infestation of cattle among

Proceedings of the Young Scientist Forum Symposium
193
different management systems. Comparatively higher tick infestation was observed in cattle rearing under semi- intensive system (78.22 %) whereas 17.74% intensively operated and 4.03 % extensively operated farms were infested with ticks. Lower tick infestation observed in extensive management system in the study areas indicated that the extensive management system is not favor for the prevalence of ticks in cattle which was well agreed with the report of Durrani (2008) where it was stated that the grazing helps in lesser tick infestation and maximum tick anorectic effect. However, contradictory observation was made in another study (Belew et al. 2011) where it was recorded that the susceptibility of cattle for tick infestation is higher under extensive management system as the extensive cattle are moved anywhere for grazing. The significant association was observed (χ2= 7.94, df=3, P<0.05) in tick infestation of cattle among different diversification system. Higher tick infestation was observed in cattle rearing in monoculture system (80.64 %) whereas under mixed farming system in which the cattle was a major component in crop and livestock farming, the lower tick infestation was recorded (2.42 %). It was observed that under mixed farming system the existence of natural predators for ticks such as crow, minah, and crane is high. Conclusions and Recommendations The results of the study revealed that there were significant association between the prevalence of tick infestation and sex, physiological stage of animal, management and diversification systems. However, no association was recorded between prevalence and type of breed. For further conclusion it should be needed to identify specific tick species and sub species prevailed in cattle under different farming system. References Belew T, Mekonnen A (2011) Distribution of Ixodid ticks on cattle in and around Holeta town, Ethiopia. Global Veterinaria 7: 527-531. Biswas S (2003) Role of veterinarians in the care and management during harvest of
skin in livestock species. In Proc. National Seminar on Leather Industry in Today's Perpective, Kolkatta, India. pp 62-64.
Durrani AZ, Shakoori AR, Kamal N (2008) Bionomics of Hyalomma ticks in three districts of Punjab, Pakistan. J. Anim.Pl. Sci 18: 17-23.
Jongejan F, Uilenberg G (1994) Ticks and control methods. In Blancou J (ed). Ectoparasites of Animals and Control Methods. Sci Tech Rev, 13 (4). Paris, France: Office Internationale des Epizooties (OIE).pp 1201-1226.
Sajid MS (2007) Epidemiology, Acaricidal Resistance of Tick Population Infesting Domestic Ruminants. Ph.D Thesis. University of Agriculture, Faisalabad, Pakistan. pp 47.
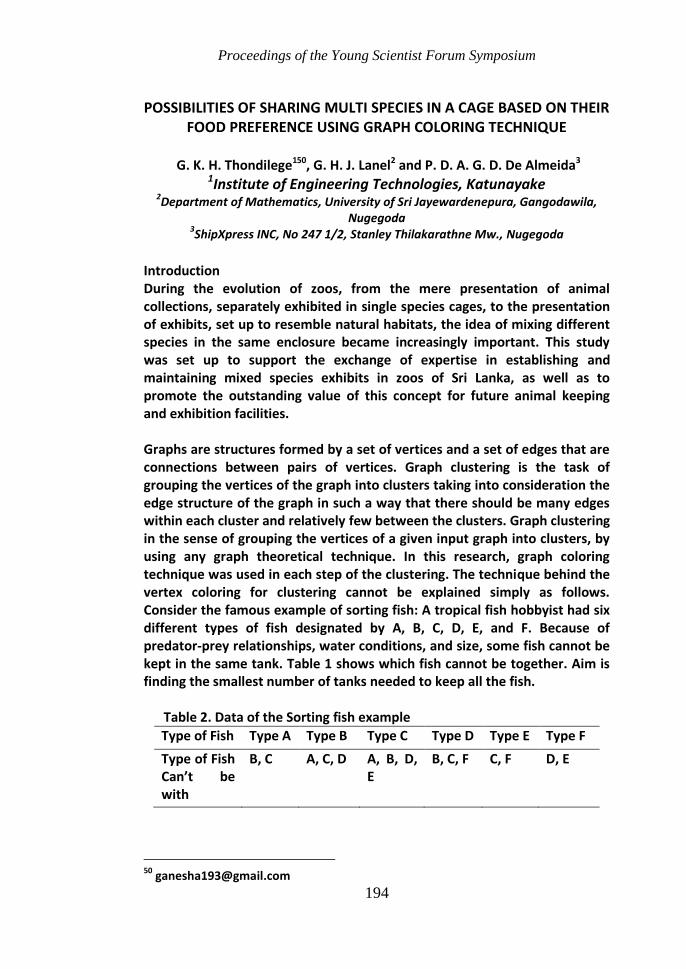
Proceedings of the Young Scientist Forum Symposium
194
POSSIBILITIES OF SHARING MULTI SPECIES IN A CAGE BASED ON THEIR FOOD PREFERENCE USING GRAPH COLORING TECHNIQUE
G. K. H. Thondilege150, G. H. J. Lanel2 and P. D. A. G. D. De Almeida3
1Institute of Engineering Technologies, Katunayake 2Department of Mathematics, University of Sri Jayewardenepura, Gangodawila,
Nugegoda 3ShipXpress INC, No 247 1/2, Stanley Thilakarathne Mw., Nugegoda
Introduction During the evolution of zoos, from the mere presentation of animal collections, separately exhibited in single species cages, to the presentation of exhibits, set up to resemble natural habitats, the idea of mixing different species in the same enclosure became increasingly important. This study was set up to support the exchange of expertise in establishing and maintaining mixed species exhibits in zoos of Sri Lanka, as well as to promote the outstanding value of this concept for future animal keeping and exhibition facilities. Graphs are structures formed by a set of vertices and a set of edges that are connections between pairs of vertices. Graph clustering is the task of grouping the vertices of the graph into clusters taking into consideration the edge structure of the graph in such a way that there should be many edges within each cluster and relatively few between the clusters. Graph clustering in the sense of grouping the vertices of a given input graph into clusters, by using any graph theoretical technique. In this research, graph coloring technique was used in each step of the clustering. The technique behind the vertex coloring for clustering cannot be explained simply as follows. Consider the famous example of sorting fish: A tropical fish hobbyist had six different types of fish designated by A, B, C, D, E, and F. Because of predator-prey relationships, water conditions, and size, some fish cannot be kept in the same tank. Table 1 shows which fish cannot be together. Aim is finding the smallest number of tanks needed to keep all the fish.
Table 2. Data of the Sorting fish example
Type of Fish Type A Type B Type C Type D Type E Type F
Type of Fish Can’t be with
B, C A, C, D A, B, D, E
B, C, F C, F D, E
50

Proceedings of the Young Scientist Forum Symposium
195
Vertex coloring algorithm was applied for the graph and Table 2 shows the solution for the problem. Table 2. Final solution of the sorting fish problem obtained using graph coloring technique
Tank 1 Tank 2 Tank 3 A & D F & C B & E
Similarly in this research, the aim was to investigate the possibilities of multi species sharing the same cage (multi species exhibits) at the National Zoological Gardens, Dehiwala and propose an algorithm that can be used to achieve that target for any zoological garden using graph coloring technique. Materials and Methods During the research the following previous works which were related, but not similar to this work were studied thoroughly in order to come up with a better output. a) Dynamic Graph Clustering Using Minimum Cut Trees (2006) by Robert Gorke, Tanja Hartmann, and Dorothea Wagner, Faculty of Informatics, Karlsruhe Institute of Technology, KIT. b) Hazard rates for clustered populations of David's deer (2008) by Marta Molinska Glura, Tomasz Szwaczkowski and Krzysztof Molinski. Mainly this research was based on some attributes of the animals in the National Zoological Gardens, Dehiwala. A complete set of data relevant to the following attributes at the animals was collected considering 220 animals. a) Animal Inventory (class, order, common name, and the initial group structure) Eg. Mammalia, Primates, Toque Monkey, Male-1, Female-2, Unknown-1 b) Diet list of each animal in the inventory (common name, meal time, food type, and amount in g) and Table 3 shows an example for it. Table 3. Example for the data collected relevant to the animal’s diet list
Common name Meal time Food type
Provided Amount (g)
Toque
Monkey
Morning
Amberalla Gram Plantain Water melon Apple Guava/Mango Orange Cabbage
7 57
121 100 11 64 14 7

Proceedings of the Young Scientist Forum Symposium
196
Using the above data a graph was modeled by considering all the animals and all the food types as vertices and edges as the attribute which food type they are consuming. Then the observed clusters (See Fig. 1 for an example and three clusters were observed as shown) can be extracted as a sub graph at each step below by considering the animals as the vertices and considered attribute in the relevant step as the edges using the modeled graph above. A database was created to store the above data and all the partitioning parts were preceded using the graph coloring technique. Since the original graph consists with end vertices of each edge sharing the common attribute, graph coloring was applied for the compliment graph.
Papaw
Guava/Mango
Plantain
Figure 1. Part of the Initial graph that used for the analysis: (Squares: Two Humped Camel, Reticulated Giraffe, African Elephant, Slender Tailed Meerkat, Hooded Capuchin, White Throated Capuchin, Purple Faced Leaf Monkey), (Stars: Greater Kudu, Arabian Oryx, Scimiter Horned Oryx, Hog Deer, Sambar, Wild Boar, Domestic Ass, Mule), and (Circles: Red Giant Kangaroo, Red Necked Wallaby, Mouse Deer, Squirrel Monkey, Long Haired Spider Monkey, White Fronted Brown Lemur, Slender Loris)
The basic steps of the data analysis are given below and the number of exhibits obtained in each step is given within brackets compare to diet and using JAVA programing proceed all the steps on whole population of animals. 1) Grouped all the animals into three classes namely Mammals, Aves and Reptiles.[3 exhibits] (to avoid the predator-prey effect)
Proceedings of the Young Scientist Forum Symposium
197
2) Grouped by carnivore order (Separated those mammals into different exhibits). [25 exhibits] (to avoid the predator-prey effect) 3) The popular feed/feed combination as Papaw, Plantain and Guava/Mango was identified using the percentages of each food type. Overall 45% of all provided food types represent from that combinations. (Papaw – 19.5 %, Plantain – 14.1 %, Guava/Mango – 10.9 %) 4) Again grouped the each exhibit obtained in step 1 into two exhibits as having papaw and not having papaw for feeding. [6 exhibits] 5) Again grouped the each exhibit obtained in step 4 into two exhibits as having Plantain and not having Plantain for feeding. [12 exhibits] 6) Again grouped the each exhibit obtained in step 5 into two exhibits as having Guava/Mango and not having Guava/Mango for feeding. [24 exhibits] Then finally 49 mixed species exhibits were obtained instead of 220 individual exhibits. Results and Discussion As a result after the step 6 there were 49 exhibits. For example, 1. For class Mammalia and relevant to the feed combination papaw, plantain and not having guava/mango. Red giant kangaroo, Red necked wallaby, Mouse deer, Squirrel monkey, Long haired spider monkey, White fronted brown lemur, and Slender loris.
2. For class Mammalia and relevant to the feed combination papaw, guava/mango and not having plantain. Silver pheasant, Malay great argus pheasant, Chinese ringed necked pheasant, Silky bantam, Eurasion collared dove, Diamond dove, victoria crowned pigeon, Green imperial pigeon, Domestics pigeon, and Spotted dove.
Conclusions and Recommendations In this study the method of graph coloring technique was used to a real world problem and it has been successfully completed up to a certain level with 49 exhibits of mixed animals instead of 220 individual cages. This result can be used practically to build up a zoological garden within a limited area. For further studies we are planning to use other attributes such as height/length, and gestation, dominant character etc. in the analysis.
References Flake W, Tarjan RE, Tsioutsiouliklis K (2004) Graph clustering and minimum cut
trees. Internet Mathematics 1:385–408. Szablewski P (2003) Genetic Variability in Animal Population Kept in Zoological
Gardens. Ph.D. Thesis. The August Cieszkowski Agricultural University of Poznan, Poland.

Proceedings of the Young Scientist Forum Symposium
198
BIODEGRADATION OF Eichhornia crassipes TOWARDS BIOFUEL PRODUCTION
A. Thurairajah1, R.R. Ratnayake251, N. Gnanavelrajah1 and M.
Kathirgamanathan2 1 Faculty of Agriculture, University of Jaffna, Sri Lanka
2 Institute of Fundamental Studies, Hantana Road, Kandy, Sri Lanka
Introduction Energy is an essential input to our day-to-day activities. In the year 2012 the imports of fuel was 26.3 % of all imports (Central Bank of Sri Lanka 2013). Usage of fossil fuels results in the net increase of carbon dioxide in the atmosphere. Therefore, alternative sources of energy with high efficiency and low cost of production is important to meet the energy requirements. Biofuels can be defined as a fuel produced using biological material as a raw material and/or catalysts. Ethanol produced from lignocellulosic materials is considered as a potential transportation fuel. In Sri Lanka, the spread of invasive aquatic plant species is an environmental problem which needs to be controlled. This study aims to examine the appropriateness of water hyacinth (Eichhornia crassipes) as a low cost substrate for biofuel production. Materials and Methods Isolation of cellulolytic microorganisms: Decaying plant materials, compost samples, cow dung and elephant droppings were collected from different places in Kandy. Samples were inoculated on to Bushnell Haas agar with 1 % cellulose and carbendzim (1.7 mgL-1) for bacteria and potato dextrose agar with the antibiotics streptomycin (30 mgL-1) and chloramphenicol (50 mgL-1) for fungi. For the isolation of anaerobic microorganisms, samples were enriched in a modified medium with cellulose for a week at 37 °C (Scott and Dehority 1965). Production of enzymes: Liquid medium from Mandels and Weber (1969) was prepared for culturing isolated aerobic fungal strains with incubation for seven days at 28 °C with shaking at 100 RPM. The bacterial cultures were inoculated into Bushnell Haas broth with 1 % cellulose and 0.05 % proteose peptone and incubated at 35 °C for 3 days with shaking at 100 RPM. Enzyme assays: Total cellulase assay was performed by using Whatman No.1 filter paper as the substrate, according to Mandels et al. (1976). Reducing
51

Proceedings of the Young Scientist Forum Symposium
199
sugars formed by the degradation were measured by using di-nitro salicylic acid reagent (Miller 1959), against D-glucose standards. Xylanase activities were measured by a method modified from Gottschalk et al. (2010) using beech wood xylan (Sigma) as the substrate. The above assays were carried out at 50 °C/pH 4.8 for fungi and 40 °C/pH 6.0 for bacteria. Substrate collection and preparation: Water hyacinth (E. crassipes) was used as the substrate for degradation. It was collected from a site near Mahaweli river in Kandy district and was washed with flowing tap water, sundried for few days and kept in an oven at 50 °C until constant weight was obtained. Dried substrate was cut into small pieces and ground by using plant grinder and sieved through 50µm sieve. The sieved powder was used for the experiment. Degradation of E. crassipes with enzymes from selected micro organisms: Isolates with high cellulase activities were chosen for the degradation. Enzymes were produced by submerged cultivation in a liquid medium (Mandels and Weber 1969). The pH of the enzymes was adjusted to 4.8 for fungi and to 6.0 for bacteria and they were filter sterile using sterile 0.45 μm nylon membrane filters. Five hundred milligram of E. crassipes powder was taken in to separate conical flasks. To each flask, 2 mL of distilled water was added and autoclaved at 121 °C for 20 minutes. 10 mL of sterile crude enzyme was added to each flask. 10 mL of distilled water was added to the controls. Degradation was carried out at 40 °C in with shaking at 100 rpm. Measurement of reducing sugars: Total reducing sugars formed by each enzyme were measured at 24 hour intervals up to 7days of decomposition with di-nitro salicylic acid reagent (DNS) against D-glucose standards. Data analysis: Statistical analysis was done using with SAS package (Complete Randomized Design design). Results and Discussion Isolation of cellulose degrading microorganisms: In the present study, 89 aerobic fungi and 22 aerobic bacteria were isolated from different substrates. Five strains of anaerobic bacteria were isolated from cow dung, elephant dropping and compost samples. Enzymatic degradation of E. crassipes: Accessibility to enzyme is one of the major factors determining the degree of degradation of lignocellulosic materials. Smaller the particle size the better the hydrolysis in terms of the extent and rate of reaction. Therefore, the ground plant materials were sieved by using the smallest available sieve size (50 µm). The dried substrates were not subjected to any other significant pre-treatment than
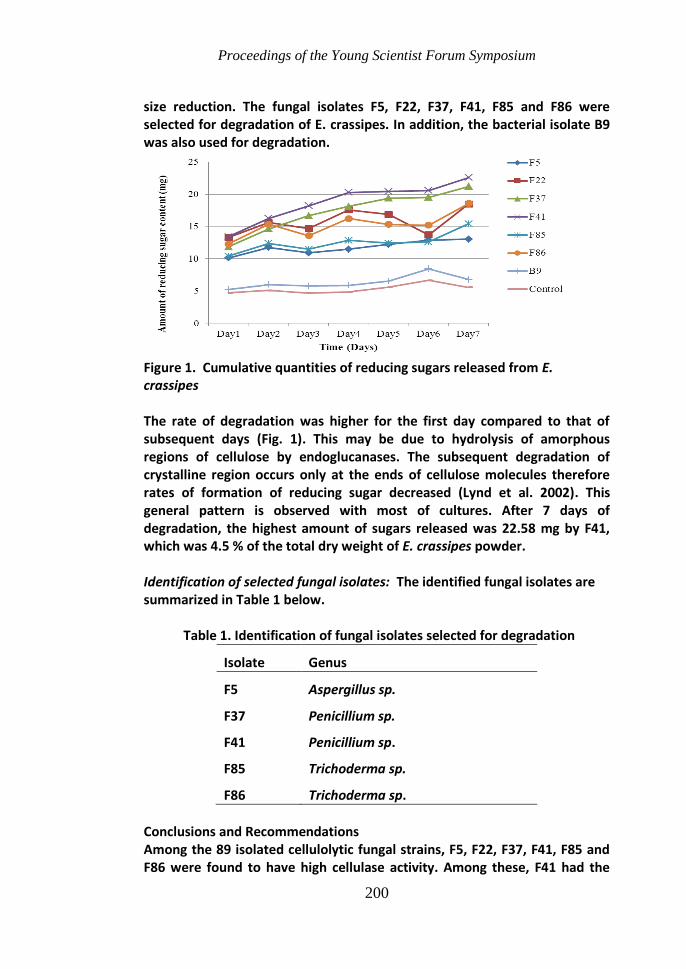
Proceedings of the Young Scientist Forum Symposium
200
size reduction. The fungal isolates F5, F22, F37, F41, F85 and F86 were selected for degradation of E. crassipes. In addition, the bacterial isolate B9 was also used for degradation.
Figure 1. Cumulative quantities of reducing sugars released from E. crassipes The rate of degradation was higher for the first day compared to that of subsequent days (Fig. 1). This may be due to hydrolysis of amorphous regions of cellulose by endoglucanases. The subsequent degradation of crystalline region occurs only at the ends of cellulose molecules therefore rates of formation of reducing sugar decreased (Lynd et al. 2002). This general pattern is observed with most of cultures. After 7 days of degradation, the highest amount of sugars released was 22.58 mg by F41, which was 4.5 % of the total dry weight of E. crassipes powder. Identification of selected fungal isolates: The identified fungal isolates are summarized in Table 1 below. Table 1. Identification of fungal isolates selected for degradation
Isolate Genus
F5 Aspergillus sp.
F37 Penicillium sp.
F41 Penicillium sp.
F85 Trichoderma sp.
F86 Trichoderma sp.
Conclusions and Recommendations Among the 89 isolated cellulolytic fungal strains, F5, F22, F37, F41, F85 and F86 were found to have high cellulase activity. Among these, F41 had the
Proceedings of the Young Scientist Forum Symposium
201
highest sugar yield. In addition to these six fungal strains one bacterial strain B9 was also used in this study. The bacterial strain had lower cellulase activity compared to that of fungal strains. The highest amount of sugars released was 22.58 mg by F41, which was 4.5 % of the total dry weight of E. crassipes powder. Thus, the isolate F41 could potentially be used for degradation of E. crassipes for biofuel production. References Central Bank of Sri Lanka (2013) Annual Report 2013. [Accessed online on 5 May
2014] http://www.cbsl.gov.lk/pics_n_docs/10_pub/_docs/efr/annual_report/AR2013/English/9_Chapter_05.pdf
Gottschalk LMF, Oliveira RA, Bon EPS (2010) Cellulases, xylanases, β-glucosidase and ferulic acid esterase produced by Trichoderma and Aspergillus act synergistically in the hydrolysis of sugarcane bagasse. Biochemical Engineering Journal 51: 72–78.
Lynd LR, Weimer PJ, Van Zyl WH, Pretorius IS (2002) Microbial cellulose utilization: fundamentals and biotechnology. Microbiology and Molecular Biology Reviews 66: 506-577.
Mandels M, Andreotti R, Roche C (1976) Measurement of saccharifying cellulase. Biotechnology and Bioengineering Symposium 6:21 – 33.
Mandels M, Weber J (1969) The production of cellulases. Advances in Chemistry 95: 391–413.
Miller GL (1959) Use of dinitrosalicylic acid reagent for determination of reducing sugar. Analytical Chemistry 31: 426-428.
Scott HW, Dehority BA (1965) Vitamin requirements of several cellulolytic rumen bacteria. Journal of Bacteriology 89:1169-1175.

Proceedings of the Young Scientist Forum Symposium
202
ASSESSMENT OF SOIL MICRONUTRIENT AVAILABILITY IN DIFFERENT CULTIVATED AND UNCULTIVATED SOILS IN JAFFNA PENINSULA
S. Vijayakumar152, R. R. Ratnayake2 and N. Gnanavelrajah1
1 Faculty of Agriculture, University of Jaffna, Jaffna
2 Institute of Fundamental studies, Kandy
Introduction Soil fertility is the foremost important factor to maintain sustainable agriculture. It refers the ability of the soil to supply essential plant nutrients and soil water in adequate amounts and proportions for plant growth and reproduction in the absence of toxic substances which may inhibit plant growth (Foth and Ellis 1997). In the present commercialized world, increasing population has increased the demand on food and land. Farmers are forced to supply the required food through cultivation within the limited land. Thus, they are doing intensive agriculture with the use of high levels of fertilizers to provide the required nutrients and using hybrid varieties for increased production. Farmers mainly focus on macronutrients. Micronutrients are not supplied generally with fertilizers unless through organic manures. Therefore, continuous cultivation could lead to the depletion of micronutrients in soils. There are limited studies carried out on soils of Jaffna regarding micronutrients availability. Therefore, this study has planned to investigate the micronutrient availability in cultivated and uncultivated upland and low land soils in Jaffna district. Materials and Methods Study area: The study was carried out in Jaffna district, Northern Province of Sri Lanka. Jaffna experiences average annual rainfall of 696 mm to 1125 mm and mean temperature is 26 °C to 33 °C. Soil samples were collected by categories of upland and lowland and cultivated and uncultivated land. Here, lowland means paddy cultivated and its adjacent uncultivated lands where as upland means vegetable and field crop cultivated and its adjacent uncultivated lands. Three locations were selected in each category, though 12 locations were selected for sample collection. In this study, concentrations of micronutrient cations were investigated in cultivated and uncultivated lands of both upland and lowland areas at two depths (0-15 cm, 15-30 cm). The design was Completely Randomized Design in three factor factorial with three replicates. Sample analysis: Soil samples were air dried at room temperature and crushed to pass through a 2 mm sieve. Soil suspension was prepared with 1:
52

Proceedings of the Young Scientist Forum Symposium
203
5 Soil : water ratio and pH was determined by using pH meter (Anderson and Ingram 1993). The available micronutrients Zn, Cu, Mn and Fe were determined by extracting the soil with DTPA- Ammonium bicarbonate extract and measured by using atomic absorption spectrophotometer (Soltanpour and Schwab 1977).
Table 1. Sampling sites in Jaffna district
Upland Lowland
Location Cultivated/ Uncultivated
Abbreviation Location Cultivated/ Uncultivated
Abbreviation
Uduvil Cultivated JUC1 Valukaiyaru Cultivated JLC1
Uncultivated JUU1 Uncultivated JLU1
Kondavil Cultivated JUC2 Moolai Cultivated JLC2
Uncultivated JUU2 Uncultivated JLU2
Urumpirai Cultivated JUC3 Ponnaalai Cultivated JLC3
Uncultivated JUU3 Uncultivated JLU3
Results and Discussion Soil pH: Soil pH varied between 5.19 to 8.33 (Table 2) and was not significantly differed between soils, upland/lowland, cultivated/uncultivated lands and depth. However, mean pH was high in upland (7.54). In lowland 15-30 cm shows higher pH than the top soil. Root distribution of paddy occurs in the top soil. Since, most of the nutrient cations are being basic cations, when the crops uptakes the nutrients, that ultimately reduces the pH of top soil. This may be possible reason for this situation.
Table 2. Soil pH in different locations in Jaffna district
Place Depth (cm) pH Place Depth (cm) pH
JUC1 0 - 15 7.2 JLC1 0 – 15 7.05
15 - 30 7.32 15 – 30 7.08
JUU1 0 - 15 7.25 JLU1 0 – 15 6.24
15 - 30 7.36 15 - 30 7.24
JUC2 0 - 15 7.79 JLC2 0 – 15 5.19
15 - 30 7.89 15 – 30 6.88
JUU2 0 - 15 7.26 JLU2 0 – 15 6.4
15 - 30 7.34 15 - 30 7.36
JUC3 0 - 15 8.09 JLC3 0 – 15 6.15
15 - 30 7.3 15 – 30 6.14
JUU3 0 - 15 8.33 JLU3 0 – 15 6.5
15 - 30 7.43 15 - 30 7.62

Proceedings of the Young Scientist Forum Symposium
204
Available micronutrients: (1) Iron- Iron availability showed significant difference among the different sampling locations. The highest value of 227.33 mg kg-1 was obtained in surface layer of lowland uncultivated areas (JLU1) and the lowest value of 3.57 mg kg-1 was obtained in subsurface layer of upland cultivated soils. Soil Iron content was significantly differed with lowland/upland. It was higher in lowland than upland, which is due to the low pH in lowland than upland and hence the iron becomes more available in low pH (Ponnamperuma 1972). According to Benton (2001) classification, availability of iron can vary from very low (0-5 mg kg-1) to very high (> 25 mg kg-1). Only the samples taken from sub-surface layer of JUC2, JUU1 and surface layer of JUC2 soils experienced very low, low and medium level iron availability respectively. Both layer of JUU2, JUC3 and surface layer of JUU1, JLC3 falls under the high (17 – 25 mg kg-1) iron availability and other soils had very high iron availablity (Table 3). (2) Manganese- Mn availability ranged between 6.11 and 35.93 mg kg-1, which lies in low (4 – 8 mg kg-1) to very high (>30 mg kg-1) availability category according to Benton classification in 2001. Manganese availability varied significantly only with elevation which was high in upland. JUC1 had very high amount of Mn availability where as only the upper layer of JLC1 resulted as low Mn availability area. Mn availability in other areas experienced medium and high amount (Table 3). (3) Zinc- Zinc availability ranged between 4.8 – 46.1 mg kg-1. Zinc availability in soils of lowland/upland and cultivated/uncultivated was significantly differed and those were high in upland and uncultivated areas respectively. Zinc availability showed significant different with in the different sampling places (Table 3). According to Benton (2001) Zn availability relies in high (3.1-6 mg kg-1) to very high (>6 mg kg-1) category in Jaffna soils. (4) Copper- Cu availability ranged from 0.67 to 10.38 mg kg-1 and showed significant difference within the sampling places (Table 3). These soils falls between low (0.3-0.8 mg kg-1) to very high (>2.5 mg kg-1) range in Cu availability according to Benton classification, 2001. Except JLC1 and JLU1, other soils had very high Cu content. Low Cu content was observed in surface layer of JLC1. There was no significant difference observed in Cu availability between soils of lowland/upland, cultivated/uncultivated and depth-wise. Note: Means with same letter along the columns are similar

Proceedings of the Young Scientist Forum Symposium
205
Conclusions and recommendations There was a significant variation in micronutrients namely Fe, Mn, Zn and Cu among different places in Jaffna soils. Fe content in soils varied between 3.57 - 227.33 mgkg-1, even though except one place other places had very high amount. Mn, Zn and Cu content ranged between 6.11 – 35.93, 4.81 – 46.1 and 0.67 – 10.38 mgkg-1, respectively. As the nutrient availability varies significantly from place to place in the study area site specific soil testing and fertilizer recommendation for micro nutrients will be useful. References Anderson J, Ingram J (1993) Tropical Soil Biology and Fertility: A Handbook of
Methods. CAB International, Wallingford, 36-42. Benton JJ (2001) Laboratory Guide for Conducting Soil Tests and Plant Analysis. CRC
press. Washington, DC. Foth HD, Ellis BG (1997) Soil Fertility, 2
nd Edn, pp 56-64.
Ponnamperuma F (1972) The chemistry of submerged soils. Advances in Agronomy 24: 29-96.
Soltanpour PA, Schwab A (1977) A new soil test for simultaneous extraction of macro‐and micro‐nutrients in alkaline soils 1. Communications in Soil Science & Plant Analysis 8: 195-207.
Table 3. Mean available micronutrients concentrations in different places in Jaffna
Place
(mg kg-1
of soil DW)
Fe Mn Zn Cu
0 - 15
cm 15 - 30
cm 0 - 15
cm 15 - 30
cm 0 - 15
cm 15 - 30
cm 0 - 15
cm 15 - 30
cm
JUC1 47.57c 30.53
de 35.93
a 34.07
a 16.50
bc 15.43
ef 9.4
b 6.86
ab
JUU1 17.46d 6.52
fg 22.35
d 19.2
c 25.10
a 26.30
b 5.59
e 5.06
abc
JUC2 13.48d 3.57
g 20.77
e 12.92
e 25.56
a 18.97
cd 5.53
e 4.03
abcd
JUU2 18.92d 22.77
e 24.38
c 23.26
b 26.24
a 20.62
c 5.56
e 4.81
abc
JUC3 20.88d 18.07
ef 26.81
b 14.58
d 13.31
c 11.69
gh 8.72
c 7.87
a
JUU3 45.92c 43.55
cd 14.41
f 15.25
d 20.63
b 46.09
a 5.45
e 5.17
abc
JLC1 224.84a 48.95
c 6.11
j 8.15
g 6.04
d 5.73
i 2.38
g 0.67
cd
JLU1 227.33a 148.83
a 9.02
h 10.97
f 4.81
d 11.90
gh 1.1
h 1.61
cd
JLC2 182.72b 119.5
b 20.02
e 14.23
de 14.75
c 13.41
fg 10.38
a 7.41
a
JLU2 214.68a 121.18
b 10.83
g 10.0
f 15.74
c 16.88
de 8.1
d 5.83
ab
JLC3 23.65d 37.71
d 7.52
i 10.06
f 4.86
d 9.01
h 2.9
g 3.15
bcd
JLU3 48.45c 38.86
cd 8.52
hi 8.44
g 16.77
bc 25.41
b 4.05
f 3.86
abcd

Proceedings of the Young Scientist Forum Symposium
206
ANALYSIS ON THE RISE OF RELIGIOUS CRISIS AND NATIONAL
INTEGRATION OF POST WAR SRI LANKA
N. Weerasekara153 and R.K.S. Navodani1 1Department of Social Sciences, Sabaragamuwa University of Sri Lanka, Belihuloya
Introduction Nation building and national integtration are necessary coditions for the development of a country. The main development goal of Sri Lanka is to be a miracle of Asia. As a democratic country, Sri Lanka has accepted to protect the equality, human rights, and minority rights without any discrimination. But Sri Lanka has been facing the problem of nation building from the independence to date. Within post war context, ethnic conflict has been transformed in to a new form of religious crisis in Sri Lanka. There has been a domination of sinhala Buddhist nationalism for pre- colonial period to post war period in Sri Lanka. The priority is given for the sinhala Buddhist identity from policy formulation to party representation and to civil society activities. Sinhal Buddist identity was represented even in the political leadership (Phadnis 1989), and they used the Sinhala Bhuddist nationalist theme in their election movements (Phadnis and Ganguly 2001). Even the legislarure tried to give more opportunities for the Sinhales exepting the minorities, formulating the Sinhal Bhudduist only acts such as 1947 citizenship act, 1956 Sinhala Language act and 1972 and 1978 constituions has been given the more priority to the Bhuddhism (Warnapala 1991). 1957 Bandaranaike- Chelvanaigam agrrement had to tear because of the Sinhala Bhuddist protest. Especially after the civil war, to build up the ethnic harmony and national integtration became as a vital goal of present Sri Lanka. But although the government has implicated many steps for that, a new form of religious crisis has arrisen. Thus, it is worthy to study the reasons and factors that has affected for the rise of religious nationalism and to examine its impact to the national integtration of Sri Lanka.
Meterials and Methods The study mainly based on the secondary data gathered from the secondary sources such as books, articles, party constitutions and Sri Lanka constitution, contemporary reports, contemprary newspapers, acts, magazines, internet articles and books, and the qualitative data analysed by the Descriptive Data Analysis Method. In addition to that the study used primary data selecting 50 respondants to investigate the public opinion on the religious crisis and national intehtraton in Sri Lanka covering farmers,
53

Proceedings of the Young Scientist Forum Symposium
207
civil society activist, party activists, academic scholars, religios society activits and publics using interview method. The study was limited to the time period form 2000 to date. Results and Discussion Today ethnic based crisis has become as a religious base crisis. There are many of reasons for that. The first reason is the impact of the Sinhala Bhuddist Nationalism to the politics. The government and the political leaders are depended on the Bhuddist instructions of the Malwathu and Asgiri Mahanayaka Thoroes for the important political decisions and policies. As the examples; the president Mahinda Rajapaksha met the Maha theores to discuss the problems in the Bhuddha Sasana on 2013.5.22 (http://sinhala.theindependent.lk), The Former president Mrs. Chandrika Bandaranaike met the Thibbatuwawe Siddhartha Thero on 2014.01.18, Rawana Balaya and Bodu Bala Sena met the Maha Thoreos to discuss on the Casino business regulation act and the problems in the Law Faculty on 2014.04.23 (http://www.hirunews.lk), Minister Dinesh Gunawardena met the Maha Theores to get instruction on the North provinicial election and the provincial powers on 2013. 05. 21 and Minister G.L Peeris met the Maha Theoros to get instruction on the rehabilitation and the educational issues on 2012.08.28. And also the present government has eshtablished the Bhuddist Advisory Committee and Gihi Pewadi Anusashaka Sabhawa for the religious advice for the political issues on 2014. 06. 18. Another main reason is the endowment of the main political leadership only to the Sinhalese from D.S. Senanayake to Mahinda Rajapaksha. Another factor is to use the political power against to the minority norms and customs by politicians. Some political leaders tried to disturb the Hindu religious tradition in Munneshwaram Kovil. Another main factor for the rise Sinhala Bhuddist nationalism is to maintain the Bhuddist religion by the Ministry of Bhuddha Sasana. And also Sri Lankan constitution and the political party constitutions have given the formost position for the bhuddism. Article 10 and article 14(1) have given the formost position for the Bhuddism with respecting to other religions (Sri Lanka Constitution 1978). The article 2 of the Sri Lankan Freedom Party constitution has formed the Sri Lanka Freedom Monk Society under the Sri Lankan Freedom Party. And also article 11, 5, has impled that it should be the main part in the Executive Committee (Sri Lanka Freedom Party Constitution 1951). Although United National Party hasn’t given the formost position for the Bhuddism, both parties are engaged the Bhuddist monks with their political activites. Another main problem is to use the religious nationalist ideas for the electoral victories by the political leaders. Although the main political parties haven’t used the religious and nationality based names to address their parties, in practice they are totally religious alleged

Proceedings of the Young Scientist Forum Symposium
208
and many of minority political parties have based on their religion and nationaltity. As the examples; National Heritage Party, All Ceylon Tamil Congress, Illankai Tamil Arasu Kachchi, Sri Lankan Muslim Congress and Eelam National Democratic Liberation Front. And also when the political coalitions form they have addressed only the political advantageous not ethnic harmony. There is no a unity even among the political leader on the contemporary religious issues within the UPFA. Another main factor for the emergence of the religious crisis is to emergence of the Bhuddist political parties and the Bhuddist civil societies against to the minority religious extremism and to protect the Bhuddism such as National Heritage Party, National Monk Front, Desha Hithishee Jathika Viyaparaya, Sinhala Rawaya Organization, and Bodu Bala Sena Organization for the cases such as to aginst to Watareka Wijitha Thero, Pitiduwe Siri Dhamma Thero, Ruwanwelle Sobitha Thero (Rivira 12.3.2012), to Remove the Muslim Church form the Dambulla Secred Lanad and to release the Kuragala secred site on 2012.01.08 (Lakbima 19. 01.2012). The steps taken by the government for the nation building has mainly addressed on the language problem. It has formed the ministry of National Language and Social Integtration and has given its leadership to a minority leader. Although the government has taken some steps to prevent the religious conflicts such as to formulate a National plan to practice the Lessont Learnt Commission Report, to held Maha Samuluwa for the national harmony on 2014.4.7 (Divaina 8.4.2014), to eshtablish a special police task on the religious conflicts, to held the Wishwasaye Agamika Sammuthi Wadasatahana and to form a committee for the religious harmony by the South Asian Policy and Research Centre, the practice and the outcomes are under questioned. According to the reseach and the investigation of the State Language Commission, there are many of weaknesses of the second language training programme(Perera 2008) and there are many of problems and challenges of language policy practicers in the public administrative institutions in Sri Lanka (Ranjith and Weerasekara 2013). According to Lanka Law Society, new police task is a threat for the spirit of law (http://lankafocusnews.com). Conclusions and Recommondations In the whole, the factors and reasons such as, to give the priority to the Sinhala Buddist identity by the tradition, law, policies, political parties and political leaders, and rise of the Sinhala Buddist civil societies and political parties against to the radical minority religious prevalence and mistrust that the government has evaded in representing the Buddhism after the civil war have affected to rise of the religious crisis among the religious groups and it has affected to infract the national integtration of Sri Lanka because the government hesitated and feared to implicate a strong stept to prevent the

Proceedings of the Young Scientist Forum Symposium
209
religious crisis withing the post war context. Therefore the political leaders have used the religious nationalism to fulfil their electoral purposes. Therefore the state constitution, party constitutions and ministry of Buddha Sasana and Religious Affairs should accept the equal position of all religions without limiting to a one religion. And also it is better to join the all religions to get advisors to the politcs. Coalitions should be used for nation building purposes other than the power purposes. Minority political parties should address the every citizens of the country without limiting to only their nation. It is better to implicate a strong stept and laws to prevent the prevalence of the radical religious hejomany. And also the government should have the stable vision on the buiding the national integtration. When the government hasn’t a stable vision and a plan to build up the national integration of Sri Lanka, it will be provided a path to rise of a religious conflict in Sri Lanka. Therefore the government should have a stable solution to build up the national intergtation without hesitating in Sri Lanka. References Abetathne U (2007) Vargika Gatuma Saha Sri Lankika Deshapalana Sanskrithuya.
Abewardhena H (ed). Bhalaya Bedamu Rata Nobedamu. Prayathna Sabha Prakashana.
Gunasekera, Olcott R.G.G, et al. (1996) National Language Policy in Sri Lanka: 1956 to 1996 Three Studies in Its Implementation. International Centre for Ethnic Studies: Kandy.
http://www.divaina.com/2014/04/10/news11.html [Accessed on 2014, May 22]. Phadnis U (1991) Nation Building and Ethnicity in South Asia. Ramakant B.C. Upreti
(ed). Nation Building in South Asia. New Delhi: South Asian Publishers. Ranjith H ( 2013) Language Policy Practices and National Integration of Sri Lanka
(Case Study with Divisional Secretariat office in Balabgoda). International Journal of Arts and Commerce. 2: 6
Warnapala W (1994) Ethnic Strife and Politics in Sri Lanka. New Delhi: Saga Publication.

Proceedings of the Young Scientist Forum Symposium
210
Author Index
Abeygunawardana R.A.B. 13
Edirisinghe J.C. 41 Abeykoon A.M.S.B. 96
Ekanayake S. 5,21,85
Abeysekera W.P.K.M. 1
Ekanayake M.P.B. 92 Abeysekera A.M. 29
Ekanayake E.W.M.A. 116
Abeysinghe P.D. 61
Erandika T.M. 61 Abeysinghe S. 61
Fernando T.N. 65
Abiman P. 155
Fernando W.S.K. 92 Akalanka H.M.K. 5
Galagoda G.C.S. 128
Ananda D.T.H. 9
Galhena G.H. 69 Andersen R.J. 57
Gamage N.R.G. 73
Anjalee G.H.I. 144
Gammanpila A.M. 77 Ariyarathne H.M. 163
Ganehenege M.Y.U. 163
Aruggoda A.G.B. 65
Gnanavelrajah N. 179,198,202 Athauda A.M.T.P. 144
Godaliyadda G.M.R.I. 92
Athiththan L.V. 49
Godapitiya I.U.H. 81 Attanayake D.N.S. 13
Grover A. 132
Balasooriya M.M.R. 17
Gunaherath G.M.K.B. 29 Bandara E.M.S. 21
Gunathilaka D.M.T.L. 85
Bandara P.K.G.S.S. 25
Gunathilake D.M.C.C. 88 Bandara B.M.R. 116
Handunnetti S.M. 37,128
Beneragama C.K. 140
Herath H.M.S.P.B. 92 Bopage N.S. 29
Herath S. 167
Butlin R. 69
Hettiarachchi I.C. 45 Chamikara M.D.M. 33
Hettiarachchi H.A.B.W. 152
Chandhrakanthan M. 37
Hewajulige I.G.N. 53 Chandrasekara G.A.P. 108
Ishan M. 33
Chandrasena G.D.R.K. 41
Iyngaran P. 155 Coombes J. 183
Jayamanne S 183
Coombes I. 183
Jayawardena K.H. 29 Dahanayake N. 148
Jayaweera J.A.A.S. 96
Dasinaa S. 191
Jeewanthi P.W. 100 Daundasekera W.A.M. 163
Kapuruge A.D. 21
Dawson A. 183
Kariyawasam I. 81 Dayasena Y.A.P.K. 45
Karunadasa S.S. 33
De Almeida P.D.A.G.D. 194
Karunaratne P.V.M. 104 De Silva E.D. 57
Karunaratne S. 175
De Silva H.A. 183
Kasthuriarachchi V.D.W. 33 Disanayaka C.K. 65
Kathirgamanathan M. 198
Dissanayake Y.S.M. 49
Kathirgamanathar S. 37 Dissanayake D.M.R.K. 57
Kothalawela H.S. 96
Dissanayake V.H.W. 81
Kottegoda I.R.M. 112 Dissanayake M.L.M.C. 120
Kulathunge S. 65
Divisekera D.M.W.D. 53
Kumari K.D.D. 108

Proceedings of the Young Scientist Forum Symposium
211
Lakshman P.L.N. 171
Rawat S. 132 Lanel G.H.J. 194
Rosa S.R.D. 112
Lelwala R.V. 33
Rupasinghe C.P. 77 Mamunuwa N. 183
Samarasinghe K. 5
Manoratne C.H. 112
Samarathunga D.M. 17 Mawalagedera S.M.M.R. 140
Sampath D.S. 167
Mediwake S.S. 116
Sandani H.B.P. 171
Mendis L.D.C. 120
Sankalpa J.K.S. 100,17
5 Mishra B.K. 167
Senthuran S. 179
Morel A.J. 96
Shanika L.G.T. 183 Munasinghe D.S.N. 124
Shaw M.A. 69
Nabeta K. 25
Sifna A.L.F. 108 Nadhikala M. 128
Sirisena U.N.D. 81
Nahallage C.A.D. 9
Sivashankar P. 45,187 Najim M.M.M. 124
Somachandra K.P. 120
Navodani R.K.S. 206
Sooriyapathirana S.D.S.S. 33 Nayanakantha N.M.C. 132
Subalini E. 191
Nihla M.S.N.F. 136
Subasinghe S. 77 Noordeen F. 96
Takahashi K. 25
Obadamudalige B.S. 140
Thanuejah S. 191 Pathiraja V. 183
Thavaranjit A.C. 155
Pathirana R.N. 61
Thevanesam V. 116 Pathirana P.P.S.L. 128
Thilakarathne B.M.K.S. 88
Peiris J.S.M. 96
Thondilege G.K.H. 194 Peiris S. 128
Thurairajah A. 198
Peiris H.M.L. 144
Udalamaththa V. 81 Perera M.K.D.I. 33
Udayangani R.G.S.K. 152
Perera P.H. 92
Vijayakumar S. 202 Perera P.P.R. 136
Vithanage I.S.K. 116
Perera P.C.D. 148
Wanigatunge C.A. 21 Perera D.A.M. 152
Warunasinghe W.A.A.I. 53
Perera D. 183
Wasala W.M.C.B. 88 Pitchai F.N.N. 96
Weerakoon S.B. 167
Premakumara G.A.S. 1,37
Weerasekara N. 206 Ragila K. 155
Wijayakulasooriya J.V. 92
Rajapaksha P.I. 33
Wijayarathne C.D. 57 Ranathunga G.M. 159
Wijekoon N. 183
Ranathunge N.P. 171
Wijesundera R.L.C. 57 Ratnasooriya W.D. 1
Wijesuriya G. 140
Ratnaweera P.B. 57
Wijesuriya W. 100,17
5 Ratnayake R.H.M.K. 41
Wijeyaratne S.C. 29
Ratnayake R.M.R.N.K. 163
Williams D.E. 57
Ratnayake R.R. 198,20
2

Proceedings of the Young Scientist Forum Symposium
212
Panel of Reviewers
Dr. G. M. D. Abeysekara Dr. L.T.S. Madubashini Prof. L. M. Abeywickrema Dr. Amani Mannakkara Dr. D. C. Abeysinghe Dr. B.E.P. Mendis Mr. K.H.L.B. Adikaram Dr. S. A. V. Moorty Dr. P.N.R.J. Amunugoda Dr. C.A.D.Nahalalge Dr. L.D.A.M. Arawwawala Dr Athula Nainanayake Prof. S. A. Ariyadorai Dr. Eric Perera Dr M. Ariyarathne Prof. M.M. Pathmalal Dr. A. G. B. Aruggoda T. U. S. Peiris Dr. P. M. Atapattu Dr. P. Rasika Perera Ms. L. V. Athinthan Dr. P.A.B.N. Perumpuli Dr. Chammi Attanayake Dr. M.A.B. Prasantha Prof. H. N. N. Bandara Dr. H.K.A. Premachandra Dr. P.W.S.K. Bandaranayake Dr. Lakmini Priyantha Dr. H. D. D. Bandupriya Dr. R.P.N.P. Rajapakse Dr. Chalinda Benaragama Dr. Nalika Ranathunga Dr. G. A. P. Chandrasekara Dr. P.R.M.P. Ranatunga Prof. U. G. Chandrika Dr. D.D.M. Ranasinghe Dr. S.D.M. Chinthaka Dr. Lanka Ranawaka Dr. D.M.D.Costa Dr. R.H.G.Ranil Dr. M. D. S. T. De Croos Ms R.M.R.N.K.Rathnayake Dr. Nilanthi Dahanayake Dr. G.C. Samaraweera Dr. W. S. Dandeniya Mr. A.L. Sandika Ms. J.M.D.J. De Alwis Dr. K. R. D. D. Silva Dr. R.M.C. Deshapriya Dr. Sugandika Suresh Prof. Vajira H.W. Dissanaayke Dr. L.D.B. Suriyagoda Dr. J.C. Edirisinghe Dr. S. Thrikawala Dr. J.P. Eeswara Dr. L.S.K. Udagama Prof. Sagarika Ekanayake Dr. Lakshika A. Udamulla Dr. Prasanna Galhena Dr. H. Waidyasekara Dr. Bawantha Gamage Dr. Jayantha Wattewidanage Dr. Nayana Gunathilake Prof. K. S. Weerasekara Dr. Ajith Gunawardena Dr. Manjula M Weerasekara Dr. Shiroma handunnetti Dr. K.W.L.K. Weerasinghe Dr Indika Herath Prof. N.A.P. Weerakkody Dr. H.M.V.G. Herath Dr. S. R. Weerakoon Dr. U. Hettiarachchi Dr. P. Weligamage Dr. C. Hewage Prof. J. Welihinda Dr. S.M.C. Himali Dr. Sepalika Welikala Dr. N. Y. Hirimuthugoda Dr. Seetha Wickramasinghe Dr. J.M. Jayasinghe Mr. A.K. Wickramasooriya Dr. W. Jayatilaka Dr D.M.D.I. Wijebandara Dr. Anuradha Karunarathne Mrs. Anusha Wijeratne Dr. G. D. Kapila Kumara Dr. R.M.N.A.Wijewardane Dr. Nilantha L. Liyanage Prof. Surangi Yasawardena

Proceedings of the Young Scientist Forum Symposium
213
Young Scientist Forum Symposium 2014
YSF Steering Committee
Coordinator : Ms. Asha Pitadeniya (NASTEC)
Chairman (YSF) : Dr. Chalinda Beneragama
Steering Committee Members: Dr. Buddhika Aruggoda
Ms. Lohini Athiththan
Ms. Nisansala Bopage
Dr. Nilanthi Dahanayake
Dr. Indika Herath
Ms. Shamalie Pieris
Mr. Ashvin Wickremasooriya
Dr. Nilanthi Wijewardena
Dr. LDB Suriyagoda