World Water Forum
219
7 th World Water Forum Science & Technology Process W H I T E P A P E R
-
Upload
khangminh22 -
Category
Documents
-
view
5 -
download
0
Transcript of World Water Forum

7th
WorldWaterForum
S c i e n c e & T e c h n o l o g y P r o c e s s
W H I T E P A P E R


the 7th World Water Forum
Preface
The White Paper, the main outcome of the Science and Technology Process of the 7th World Water Forum, is a praiseworthy result
of the World Water Forum processes. The paper has been prepared by prominent water experts working together to deliver
coherent and insightful responses on scientific and technological tools promoting solutions for pressing global water challenges.
The White Paper accentuates innovative and applicable science and technology on water. The clarity and timeliness of this
document enables us to once again recognize the linkages between emerging technologies and information and how they can
contribute to solving our water problems. We all know that water affects every aspect of our daily lives. However, the intertwined
nature of our relations to the environment calls for more innovative ideas and the upscaling of research for development. This
can only be achieved by deeper cooperation among all actors who stand in the front line of tackling water challenges while
implementing solutions through practical and applicable technologies. We need collective action from government, industry,
academia, and civil society.
The White Paper identifies the current status of water-related science and technology and provides future directions by
identifying ‘innovation and application of science and technologies’ in the sectors of each of the Main Focus areas of the Forum’s
Science and Technology Process: 1. Water Efficiency, 2. Resource Recovery from Water and Wastewater Systems, 3. Water and
Natural Disasters, 4. Smart Technology for Water, 5. Understanding and Managing Ecosystem Services for Water.
We highly commend all contributors who took an active part in the development of this White Paper. We would also like to
express our profound appreciation to the partners of the 7th World Water Forum for highlighting the essential role of science
and technology in resolving today’s and tomorrow’s water challenges. We would also thank the coordinating organization of this
White Paper, K-water and their cooperative partners. Finally, we wish to thank the organizers of the 7th World Water Forum and
especially to the Science and Technology Process Commission for their commitment and support to the Science and Technology
Process.
We sincerely believe that the findings and messages presented in this White Paper will contribute to the discussions around the
Post-2015 development agenda and help the international community commit to collective action in the future towards practical
and tangible science and technology solutions, tools, and methodologies utilizing for water.
Chairman
National Committee for
the 7th World Water Forum
Jung-moo LeePresident
World Water Council
Benedito Braga
Co-Chair
International
Steering Committee
the 7th World Water Forum
Soontak Lee

the 7th World Water Forum
Contributors
Soeun Ahn(Korea Environment Institute), David Butler(University of Exeter), Taesung Cheong(National Institute for Disaster
Prevention), Gyewoon Choi(K-water), Jiyong Choi(Seoul National University), Eun-sung Chung(Seoul National University
of Science and Technology), Katrin Eitrem Holmgren(WSP Sverige), Min-won Jang(Gyeongsang National University), Haksu
Kim(International Leaders Union), Hungsoo Kim(Inha University), Leehyung Kim(Kongju National University), Seongjoon
Kim(Konkuk University), Taewoong Kim(Hanyang University), Taesam Lee(Gyeongsang National University), Hong Li(The
International Water Association), Eun Namkung(Myongji University), Daeryong Park(Konkuk University), Kiyoung Park(K-
water), Kiyoung Park(Konkuk University), Dragan Savic(University of Exeter), Willy Verstraete(Ghent University), Tim
Waldron(Wide Bay Water Corporation), James Workman(USA)
Largus Angenent(Cornell University), Peter Cornel(Technische Universität Darmstadt), Francisco Cubillo(Canal de Isabel II), Cheryl
Davis(San Francisco Public Utilities), Denis Heron(Wide Bay Water Corporation), Gareth James Lloyd(UNEP-DHI Partnership),
Ronnie McKenzie(MIYA), Sudhir Murphy(District of Columbia Water and Sewer Authority), Gustaf Olsson(Lund University), Avi
Ostfeld(Israel Institute of Technology), Mark Vanner(Wide Bay Water Corporation), Stuart White(University of Technology, Sydney)
Coordinators
Ick-Hoon Choi(Korea Environment Corporation), Glen Daigger(University of Michigan), Sangman Jeong(Kongju National
University), Kyung soo Jun(Sungkyunkwan University), Hyeonjun Kim(Korea Institute of Civil Engineering and Building
Technology), Gustav Migues(Veolia Korea), Rabi Mohtar(University of Texas A&M), Pierre-Alain Roche(Conseil général de
l'environnement et du développement durable)
Byungman Choi(K-water), Beongjae Kang(K-water), Youngdae Cho(K-water), Yoonjin Kim(The National Committee for the 7th
World Water Forum), doo-jin Lee(K-water), Jun-yeol Lee(K-water), Jeongyeul Lim(K-water), Namyong Ryu(The National Committee
for the 7th World Water Forum), Seung-mi Ryu(K-water), Beom-sik Yoo(The National Committee for the 7th World Water Forum),
Gihyun Yoo(K-water)
T A B L E O F C O N T E N T S
Resource Recovery from Water and Wastewater Systems2Main Focus
066
068
078
083
2.1
2.2
2.3
2.4
Introduction
Resource Recovery, Its Drivers and Challenges
Accelerating Innovation
Conclusions and Recommendations
064
Preface
Contributors
Executive Summary
006
Water Efficiency1Main Focus
030
031
041
050
055
060
1.1
1.2
1.3
1.4
1.5
1.6
Introduction
Urban Water Efficiency
Industrial Water Efficiency
Agricultural Water Efficiency
Energy Efficiency in Water and Wastewater Systems
Summary and Recommendations
028
Table of Contents
Water and Natural Disasters3Main Focus
092
093
106
123
131
141
3.1
3.2
3.3
3.4
3.5
3.6
Introduction
Climate Change : Impact Assessment and Adaptation
Drought Management in A Changing Climate
Urban Flood Mitigation through Innovative Technology and Management
ICT and GIS Based Water Related Disaster Risk Management
Discussion and Conclusions
Introduction
Urban Water Management
River Basin Management
Design and Implementation of a Smart Water Grid
Water Management and Big Data
Conclusions
090
Smart Technology for Water4Main Focus
150
151
164
169
176
181
4.1
4.2
4.3
4.4
4.5
4.6
148
Understanding and Managing Ecosystem Services for Water5Main Focus
186
187
195
208
211
5.1
5.2
5.3
5.4
5.5
Introduction
Freshwater Ecosystem Services and Economic Valuation : Conceptual Linkages
Science and Technology of Natural and Green Infrastructure Management
Resilience and Transformation
Discussion and Conclusions
184
006
Executive Summary
Water stress and water scarcity are global challenges with far-reaching economic and social implications. Driven by increasing
population, growing urbanization, changing lifestyles and economic development, the total demand for water is rising: from
urban centres, from agriculture and from industry. But efficiency gains lie within our grasp, and can put us on track to achieve
water security for all.
Security won’t arrive by itself. The status quo of single digit incremental efficiency falls well short of the mark. And the imperatives
of climate change add urgency to current water crises. Yet right now we possess the tools and experience to design and
implement a new paradigm of efficient water use, and scale it up quickly to sustain urban, agricultural, industrial and energy
systems everywhere.
This Policy Brief shows why, how, where, and for whom water and energy efficiency goals became real:
This White Paper, as a major outcome of the Science and Technology Process, aims at publishing an ‘Innovative report for
science and technology in water management’. The White Paper will reflect the past, the present, and the future of five key
focuses, mentioning related technologies simultaneously. The 5 Main Focuses of the White Paper are as follows : (a) Water
efficiency, (b) Resource recovery from water and wastewater systems, (c) Water and natural disasters, (d) Smart technology for
water, and (e) Understanding and managing ecosystem services for water.
These Seven Keys ensure vital systems do more with less. Each reveals effective tactics and techniques to reduce leaks and losses,
boost food security, increase productivity, conserve (or generate) power, and build resilience to escalating shocks. They highlight
what has already been achieved and what can be replicated at scale quickly. Efficiency aligns ecological and economic outcomes
so that further waste is not only unacceptable, but also unnecessary.
Main Focus 1 : Water Efficiency
1. City Solutions. Urban water managers who control water losses and combine firm incentives with flexible innovations can quickly
close the projected 40% gap between supply and demand.
2. Agricultural Advances. Farmers who slash waste throughout irrigation systems can grow more food, and earn more per drop,
even with 43% less water.
3. Industrial Innovations. Corporations that push for internal and external efficiency both increase outputs and reduce exposure to
risks, even within zero increases in water supplies.
4. Power Shifts. Judicious early investment can achieve carbon and energy neutrality, or generate net gains, through efficient water
and wastewater processes.
5. Smart Systems. Advanced water technologies – when nested within rigorous legal, administrative, and economic institutions –
enable and accelerate ‘smart systems.’
6. Standard Metrics. More inclusive, exacting, and uniform ways of measuring water will yield efficient outcomes both quickly and
affordably.
7. Stress Relief. The fastest, fairest, cleanest and cheapest path to efficiency involves carefully optimizing water pressure to maintain
priorities while eliminating excessive strains.
007006 /the 7th World Water Forum
Challenge : For decades, cities grew perverse incentives to waste their water. Water prices that do not reflect the economic value
of water. Natural monopolies prevent competitors from driving efficiency. Hard surfaces accelerate runoff to erode, pollute, and
overwhelm plants.. As demand rises, water stress will only intensify. How can professionals relieve compound pressures of rapid
urbanization, thirsty growth, competing demands, nonpoint source pollution, rising labour costs, escalating emissions, and
extreme droughts punctuated by flash floods?
Solution : Urban water managers who control water losses and combine firm incentives with flexible innovations can quickly close the
projected 40% gap between supply and demand.
Action : Whenever governments set binding targets to reduce water use, water losses or greenhouse gas emissions, they
generate a lively market for innovative technology. Consumer demand drove widespread adoption of efficient new household
appliances that save water and energy. To accelerate demand, and the innovation it stimulates, leaders must incentivize efficient
outcomes through tariffs that reflect water’s true value and policies that reward efficiency gains.
Result : With institutional incentives fixed in place, flexible innovations emerge:
· Efficiency in the home comes through rebates to phase out older toilets or appliances in favor of high performance models,
but the most successful programs measure outcomes, not inputs.
· Efficiency in distribution networks that harmonize water loss reduction with water pressure control, gives opportunity for
programs that help flatten a system’s peak demand, create water reserves, and reduce long term capital investment needs.
· Rainwater harvesting links ancient technology with a new urgency to collect and store runoff from rooftops or landscapes
using surfaces containers or underground check dams.
· Harmless, nutrient-rich greywater from sinks, showers, and washers can safely irrigate and fertilize turf, flowers, or fruit trees,
easing strain on energy-intensive treatment plants.
· Low-impact development designs with nature, rather than against it, to slow, spread, and sink runoff, disperse pollutants, and
ease strain on urban infrastructure.
· Advancements in Ground-penetrating radar (GPR) and thermal infrared radiation can ‘x-ray’ networks to reveal vulnerable
areas where a leak is cooler or warmer than the surface it.
1. City Solutions
Challenge : As populations swell in number and income, so does their consumption. Soon we will annually require one billion
additional tons of cereals and 200 million additional tons of livestock. For decades we grew more by expanding cultivated lands
12%, and doubling irrigation. But arable land is scarce and irrigation water is capped; its 70% share is shrinking under competing
demands. At the same time, hungry soils need replenishing with vital nutrients, some of which are finite resources. So how can
we feed ourselves?
Solution : Farmers who slash waste throughout irrigation systems can grow more food, and earn more per drop, even with 43% less
water and use vital nutrients such as nitrogen and phosphorus reclaimed from wastewater.
Action : Effective agricultural water efficiency (AWE) techniques help farmers match every drop to each crop’s needs through
precision technologies. These increase yields and quality while reducing costs of fertilizer, water, energy, and greenhouse gas
releases. The result is higher profits, reliability, and resilience to drought, deluge, reallocations, or price flux.
Result : AWE may involve many forms, tools, tactics and technologies:
· By combining crop selection, irrigation scheduling, and alternative sources of irrigation water, some regions have been able
to reduce irrigation losses 43%.
· Other tools measure soil moisture, assess leaf moisture, deploy conservation tillage, maintain soil fertility, and boost water
retention capacity.
· Farmers can now fine-tune the crop development stage; the timing and amount of water applied to the root zone; or water
2. Agricultural Advances
008
consumed by the crop since the previous irrigation.
· Accurate monitoring– of fertility, crop variety, pest management, sowing date, soil water content, planting density – help
systems reach optimal performance, saving water while enhancing yields.
· In-field sensors, geographic information systems, remote sensing, crop and water simulation models, climate predictions are
deployed in versatile ways.
· In Korea, AWE cut across spatial, temporal, and political scales, engaging competing stakeholders, to achieve different
outcomes:
- AWE targeted 1,570 reservoirs to monitor real-time flow and storage against drought.
- AWE rehabilitated 11 reservoirs to secure 0.28 billion tons of water.
- AWE enhanced performance of 37 irrigation districts in the Yeong-San River basin.
3. Industrial Innovations
4. Power Shifts
Challenge : Public officials worry that failure to quench industrial thirst will stifle economic growth, cause mass unemployment,
and corporate flight. So how much water does it actually need? For decades, no one knew. So they projected arbitrary and
unreliable future demands, and then set about building dams, aqueducts and pipelines to meet fictional targets. The negative
consequences of that supply-side approach have grown intolerable. So how can businesses secure water yet insulate brands from
hidden pressure?
Solution : Corporations that push for internal and external efficiency both increase outputs and reduce exposure to risks, even within
zero increases in water supplies.
Action : ‘Future industrial water demand’ assumptions were higher than reality. But risks remain. Assessments of 700 large
water users show internal and external rewards from industrial efficiency. The first lies within its domain, reducing pressures
and/or flows entering a zone, factory, or subsections of industrial processes. The second, outside it, motivates public-private
partnerships.
Result : Industries cannot exist without water to clean, cool, churn turbines as steam, or become part of the final product. Markets
motivate them to allocate capital and labor for efficiency within and without.
· Just as doctors routinely check blood pressure and heart rate to assess patient health, industrial water professionals use data
logging to anticipate operational risk at all times.
· Internationally branded industries aggressively monitor and benchmark use both carefully and transparently, to limit
exposure to reputational risk.
· Remote web-based platforms analyse, display, and identify wastage and poor management, and then take corrective
measures to avoid damaging the internal water supply network or authority.
· Timing is crucial: highlighting a relatively small (1.5 m3/hr) leak on the 5th July helped industry fix it within days, not months
or years, saving money, water, and risk.
· Data logging has revealed 80% leakage and 10% stolen by water tankers for some industrial zones, leading to corrective
action that saved 90% and opened new opportunities.
Challenge : Urban, agricultural and industrial water systems are energy-intensive. Nonstop pumps use 95% of the power for
distribution; heating and treatment use even more. Water systems often represent the single biggest users of energy. Some drain
20% of the grid. Energy production and distribution, in turn, requires excessive carbon and water, with some plants consuming 5%
of water withdrawals from a basin.
Solution : Judicious early investment can achieve carbon and energy neutrality, or generate net gains, through efficient water and
wastewater processes.
Action : In the water-energy nexus, emerging efficiency for one resource yields comparable gains for the other. Operational
009008 /the 7th World Water Forum
5. Smart Systems
Challenge : For decades – in order to boost health, growth, and prosperity – public policies set out to provide water at any cost.
The heavy asset base these policies delivered were inherently inefficient, contributing to unaccountable waste, and scarcity.
The high costs of operating, maintaining, rehabilitating and replacing these systems contributes to a vicious cycle of low cost
recovery ratio. Those same decades brought gleaming information communication technology. ICT tools can improve demand
response, energy-water nexus, and engagements with family, farm, or factory. But they don’t exist in a vacuum, and without non-
structural reforms, gains from ‘smart’ hardware and software may bleed away.
Solution : Advanced water efficient technologies – when nested within rigorous legal, administrative, and economic institutions –
enable and accelerate ‘smart systems.’
Action : Every tool, however innovative, is only as ‘smart’ as those who wield it. Water professionals achieve efficiency to the
extent they anchor and integrate each tool within the non-structural framework.
Result : To reap the full potential gains from smart technology, professionals should nest them within water rights, allocations,
tariffs, licensing, regulation, storage, abstraction, energy choices, and markets:
· Advanced Metering Infrastructure (AMI), with ‘smart’ sensors and signals, lets consumers choose tariffs, while utilities can
prioritize usage for special purposes and pricing.
· Smart meters allow time of day billing, reduction of peak demand, leak detection, increased distributional efficiency, non-
revenue water reduction, and deferral of capital spending.
· Smart pipes measure water flow and quality to detect strain, temperature or pressure anomalies, so potential leaking can be
checked in real time.
· Smart sensors optimize irrigation water by measuring humidity, rainfall, wind speed/direction, soil temperature/moisture,
atmospheric pressure, and solar radiation.
· Smart rehabilitation sends image-diagnosing robots to inspect pipes, blasts scaling and rust with an ultra-high pressure
water jet, and sprays lining/coating materials evenly inside the pipes.
· Smart green infrastructure – soil, trees, vegetation, wetlands, and open space – can mitigate stormwater runoff and treat it
through local storage, reuse or infiltration.
· Smart asset management optimizes capital, operations and maintenance expenditures by providing the desired level of
service at the lowest infrastructure life-cycle cost.
reforms may require intensive retraining, energy audits, investments and longer term plans. But delay escalates economic and
ecological risks, while action now turns crises into opportunities.
Result : The vicious spiral of rising water/energy demand can be slowed, and even reversed in a positive direction through
conservation, loss prevention, stormwater reduction, or repairs to infiltration. The most effective strategies may convert water
systems into net energy producers.
· Treatment plants may capture and burn biogas from anaerobic digesters to generate some or all of their own electricity,
turning plant into net zero consumers of energy.
· Other technologies may enable industries and agencies to develop closed-loop systems that optimize water use.
· Significant energy gains come by combining demand response, leak detection, storage tanks, automated meters, and
upgrading system pumps, motors, lights, HVAC.
· Micro-hydro may convert pressure and flow in large pipes into electricity, much as a hybrid vehicle harnesses braking power
for energy: an alternative to valves that helps regulate pressure.
· Water supply systems can be integrated with a renewable source of energy such as solar cells, wind turbines, and small or
run-of-river hydropower.
6. Standard Metrics
Challenge : A water authority that seeks efficiency from metered clients – housing developments, golf courses, cane fields,
010
7. Stress Relief
Challenge : Water pressure presents an old, deep challenge of individual vs. collective needs. Centralized, energy-intensive
pumps amplify water velocity that only a few may desire, but most don’t require. The escalating risk is that excessive pressure
compounds stress, leading massive systemic hemorrhaging of water, energy, carbon and money for all. Perversely, the agency
itself may elevate pressure for this very reason: more water forced out means more revenues coming in. But such quick gains
prove illusory, and erode under the mounting expense as stress opens cracks and widens splits until burst pipes bleed efficiency
throughout the system.
Solution : The fastest, fairest, cleanest and cheapest path to efficiency involves carefully optimizing water pressure to maintain priorities
while eliminating excessive strains.
Action : Care may require investing in time, training, trials, and tests. Yet the effort to optimize pressure yields lasting benefits
across every system, urban or rural, ecological or economic, industrial or agricultural. Dramatic efficiency gains may seem silent
and invisible, but are substantial, and immediate.
Result : For most water supply networks, and even in some developing countries with intermittent supply, optimal pressure
management can be among the most cost effective measures to reduce widespread leakage, deterioration, and waste.
· High pressure increases the size of ‘variable leaks’, which illustrate a paradox: systems lose more water at night, when
communities sleep, than during the day, as demand steadily rises.
· Most networks running at 60-90 m can shift down to the average, yet still quite ample, 20-50 m.
· New electronic, flow modulation, and time controllers can each judiciously reduce pressure by up to two thirds, without
compromising the level of service for heavy consumers or fire-fighting.
· Low pressure does not by itself repair or eliminate leaks, but it keeps new ones from forming, and ensures cracks, holes or
joints lose water at a far lower rate, by up to 90%.
· Pressure reduction also further scales back systemic and local demands on energy, as well as associated carbon embedded
within.
manufacturers or power plants –often overlook the single biggest source of waste: itself. ‘Non-revenue water’ (NRW) reveals the
yawning gap between water treated and water invoiced. Loss leaders include: inaccurate billing, deteriorating infrastructure, high
pressure, inexact metering, reservoir overflows, excessive flushing, and illegal connections. These are symptoms of much larger
mistakes: while estimated losses may be a third to half the input volume, the truth is no one really knows for sure.
Solution : More inclusive, exacting, and uniform ways of measuring water will yield efficient outcomes both quickly and affordably.
Action : Too often efficiency is erroneously measured by random or inappropriate metrics. NRW estimates often use simple
percentages, which vary wildly by day or season, depending on weather. Paradoxically, when it rains, and demand falls, NRW
percentage will appear to have increased; conversely, water loss percentages will appear to decrease in a dry year when demand
rises. Both mask the actual physical leaks.
Result : Physical measurement drives efficiency closest to the source with robust and precise indicators.
· The most advanced compares NRW to the length of water mains, or the number of properties or connections, against an
optimal level for those metrics, in an Infrastructure Leakage Index (ILI).
· Avoid confirmation or selection bias, ‘cherry picking’ favorable metrics, categories, inputs, or sources of use.
· High performance dictates that agencies must account not just for some of the water being used in a few random places, but
rather all sources throughout the network.
· Rigorous standardized accounting, through the IWA Water Balance, encompasses the measurement and thus management
of the system as a whole.
· Meters installed throughout the networks, backed by inspectors with listening devices, help identify the real extent of leaks.
· Modern equipment helps track speed, velocity, and source of noise transmission.

011010 /the 7th World Water Forum
· Major benefits for communities by having a more reliable, constant supply of safe drinking water, and moving away from low
pressure intermittent supply problems, and all the impacts that has on livelihoods. This is achieved by firstly removing all
pressure surges that intrinsically occur with interrupted supplies, which in turn commonly cause mass water losses of 50% to
90% in many networks around the world, and impairs any rehabilitation and repair work on pipelines.
Main Focus 2 : Resource Recovery from Water and Wastewater Systems
Civilizations developed water and wastewater systems with a focus on treatment technology. The goal was simple: pull clean
water in, push dirty water out, and make odours disappear as fast as possible.
But our larger and more affluent populations demand far more resources from far fewer supplies. Budgets have shrunk and
climate change is forcing cities and industries to reassess every aspect of our resource life cycles.
As a result, leaders have begun to develop a more sophisticated philosophy and methodology of resource recovery and reuse
– towards a low-carbon ‘re-appearing act’. These concepts are neither new nor radical. But they highlight the troubling gap
between theory and practice, which prevents us from capturing valuable benefits at a large scale.
A fundamental shift in our approach and mentality can lead us beyond conservation, efficiency, or treatment toward the
optimal recovery and reuse of resources. This Executive Summary illustrates why, how, where, and for whom ‘waste’ is becoming
progressively obsolete.
It provides trends, tools, tactics, perspectives, case studies, and solutions. In sum, this paper reframes our water, energy, and
nutrients crisis as an opportunity to create enormous value. The keys to success lie in:
1. Bottom-Line Benefits. Resource recovery and reuse dramatically saves electrical currents and financial currency, effectively
earning money that can be reinvested elsewhere in water utilities.
2. De-carbonization. As governments seek to meet greenhouse gas emissions targets, resource recovery and reuse can slash per
capita carbon emissions by 4% annually.
3. Effluent Mining. Apart from water, energy and nutrients, such as phosphorous, resource recovery and reuse extract new wealth
from an old pool of other compounds and substances.
4. Cyclic Economies. Judicious early investments in reuse and recovery help close the loop in water and wastewater systems,
eliminate externalities and build resilience to escalating risks.
5. Imaginative (Re)Branding. Much as ‘used cars’ are now highly valued as ‘previously owned vehicles’, water and nutrients can be
judged not by their history but by their quality.
6. Linked Outcomes. Water reuse may top the agenda, but the hottest topic relating to resource recovery is connected to energy
efficiency and recovery in water and wastewater systems.
7. Centralized Control. While efficiency and conservation gains may come from devolving authority, recovery and reuse take
advantage of concentrated water, energy, and nutrients
The Keys to Resource Recovery not only ensure lateral transfer of existing best practices, but raise the bar by enabling new
innovations to emerge. Each key reveals the most effective tactics, tools and techniques to generate more energy, enhance
food security, increase productivity, secure more water, bring more nitrogen and phosphorous to market, and build resilience to
012
1. Bottom-Line Benefits
2. Nexus Outcomes
Challenges : Professionals seeking to recover and reuse the valuable resources from water systems may question its affordability.
Financing an overhaul or building a new plant from scratch is daunting. Municipal budgets face fiscal constraints. Even a
progressive leader can’t justify up-front expenses today, without a clear sense of the return on investment. How can leaders
quantify returns – avoided costs, increased savings, new sources of revenue – to ensure gains are easy, clear, dramatic and
perpetual?
Solutions : Resource recovery and reuse generates an electrical current, financial currency, and river currents – natural capital that can
be reinvested into the system.
Actions : Those who make scarce resources ‘reappear’ can collect and market them. There is high value in energy, nutrients
(nitrogen, phosphorous and minerals, including rare earths) and in life’s matrix: water.
Results : Water reuse and reclamation have been developed and practised far more than any other recovered resource, to drive
end users and utilities alike toward real benefits:
· High quality reclaimed water gains value as drinking water, through monitoring and chemical-toxicology technology, as well
as through involvement of different public sectors.
· Recovery of sewage, could earn each European €1.6 per cubic meter; at 50 cubic meters, that equals €80, earning 65% of the
value is in water, 12% is in energy, and 23% in nutrients.
· Utilities can earn €1 by eliminating the capital-intensive costs to treat 1 m3 of water, or make it 'ready to be discharged back
into nature', earning another €50 per capita per year.
Challenge : Recovered energy from wastewater sounds good in theory. But in practice it must compete with fossil fuels that are
cheap, familiar and integrated. Professionals have to adjust infrastructure and institutions to handle biogas or heat. It takes public
resources and political will to kick-start markets. Families and firms often require economic incentives to sort and separate waste
(including bio-solids) for potential fuel sources, much as they already sort organic material for recycling.
Solution : Water reuse has traction, but the hottest topic in water and wastewater systems is energy efficiency, production and recovery.
Action : Systemic changes increase both energy generation and recovery. Most feed into the treatment system, which in turn
boosts efficiency, and may even lead to net energy-positive systems.
Results : To recover energy from used water: 1) turn sludge into biogas through anaerobic digestion to create electricity and heat;
or 2) concentrate, transport and incinerate the digested product for heat. Both involve trade-offs.
· Water with fermentable organic matter, landfills rich in organics, livestock wastes, food wastes and sludge can be
anaerobically digested into biogas (65% methane; 35% carbon dioxide).
· Biogas can be upgraded to compressed natural gas or liquid natural gas for vehicles.
· Within treatment processes, 80% of the chemical energy can be transformed into methane; 35% of the energy in methane
can then be converted into electricity, for 28% efficiency.
· More than 500 used water heat pumps, with thermal energy capacity from 10kW to 20MW, in operation.
· China, Finland, Switzerland, and Canada use thermal energy recovery for on- and off-site district heating, sludge drying, and
sludge digestion.
escalating shocks.
In sum, this paper reveals ‘waste’ as merely a source of food, energy or water. It reminds us that by shifting our fundamental
approach to resource recovery and reuse in our systems, ‘freedom’ really is just another word for nothing left to lose.
013012 /the 7th World Water Forum
3.De-Carbonization
4. Effluent Enhancement
Challenges : Conventional treatment systems don’t just pollute water; they choke air. Organic matter in used water is removed,
by biological oxidation, to CO2. The residual organic carbon, harvested as sludge, is often incinerated into CO2. And external or
internal carbon sources for de-nitrification can result in more greenhouse gas emissions. Energy-intensive ‘dissipation’ (removal
of unwanted characteristics) typically burns fossil fuels, which emit greenhouse gas, which elevates temperatures, which bring
drought, floods, and stress in a vicious cycle of rising costs, shocks, fragility and potential collapse.
Solutions : To meet global carbon reduction targets, resource recovery and reuse offers governments affordable ways to slash annual
per capita emissions by up to 4%.
Actions : Water professionals should also explore harnessing their systems to recover and reuse two increasingly valuable natural
assets: clean air and a stable atmosphere.
Results : Recovery of energy and nutrients can help reduce extreme impacts from climate change:
· Replacing natural gas with biogas requires enrichment of methane and removal of carbon dioxide.
· The current ‘dissipative’ technology demands more energy – up to 1 percent of the total electricity use in industrialized
countries – from fossil fuel than is necessary.
· Beyond water and money, resource recovery can annually save each person 140 kWh in electricity, 530 kWh in heat, and 88
kg (1-4% of all sources) in needless carbon emissions.
· Higher returns on cheaper innovations emerge from research, development, and technology.
Challenges : Most technologies don’t recover nutrients; they just remove them. And nutrients are rarely of either uniform quality
or large quantity. There can be positive or negative consequences of using sludge as fertilizer, as variable levels of mercury and
other heavy metals accumulate over time, and risk excess nutrient loads trickling into streams. High start-up and running costs of
new recovery plants mean the end products can’t compete well at market: it’s still cheaper to mine nutrients than recover them.
Solution : Apart from water, energy and clean air, resource recovery and reuse can extract new wealth from an old pool of nutrients,
compounds and substances.
Action : Treatment plants hold a wealth of nutrients – especially potassium, phosphorus and nitrogen – whose recovery rises with
demand for artificial fertilizer, increased yields, food security and irrigation.
Results : Reusing nitrogen at the recovery site can be upgraded to a valuable feed or food.
· 85 percent of all nutrients are linked to agriculture, but other sectors use recovered products too.
· Resource recovery can be as basic and simple as a $20 waterless composting toilet, which can divert urine and faeces into
harmless, odour-free ammonia and organic dry ‘humanure’.
· Other processes use bacteria to break down sludge, converting human waste into biogas for heating, cooking and generating
electricity.
· As agriculture reaches ‘peak phosphorous’ (90% of which is locked up in five countries) and petroleum-based fertilisers grow
scarce, progressive farmers contract for valuable local sludge.
5. Cyclic Economies
Challenge : 100 years is enough. Despite our fast-changing climate, old treatment plants still burn too much carbon, food, water,
heat and money. Sanitation destroys nitrogen. We dissipate potential proteins into sewage. We consume 2% of the world’s
available energy. So while a 20-30% target for waste reduction sounds nice, it is far from full recovery and remains open-ended.
Solution : Early targeted investments in reuse and recovery can ‘close the loop’ in our systems, eliminate externalities, and build
resilience to escalating risks.

014
6. Imaginative (Re)Branding
7. Appropriate Scales
Challenge : Culture can make or break resource recovery. People typically react to excreta with disgust. They fear contact
with faecal matter as a source of stinking, bacterial, disease-infested filth. They avoid ‘waste’ at all cost. Technology alone can’t
transform public perception, or transform sludge, heavy metals or bioplastics from liabilities into assets. That demands marketing
a brand with strong appeal.
Solution : Just as ‘used cars’ gain high value as ‘previously owned vehicles,’ let us judge water, energy and nutrients not by their history
but by their quality.
Action : By dealing honestly with materials, we can surmount ‘pushing’ new supplies to the ‘pull’ side of demand. No one
complains about aquaculture quality, despite fish whose diet is 50% faecal matter.
Results : The resource paradigm must be cleared from “waste”-related connotations, so that:
· Rather than past processes, focus on future products – clean energy, water security, organic products, phosphates, nitrogen,
biogas, fertilizer, paper, cellulose, rare earths, and other resources
· Existing ‘wastewater treatment plants,’ transform into ‘resource recovery facilities’
· End users – industry, farm, school, family, airport – may be more willing to use a recovered resource if shown how it shrinks,
stops and reverses damage to their self interest.
· Integrate concepts of life cycle assessment, strict quality control and hazard assessment.
· Singapore prioritized Four National Taps: catchment water; imported water; desalinated water; and reclaimed or NEWwater.
· Nano-technology holds promise if it stops scaring people about unknown aquatic consequences.
Challenge Size matters. Some recovered water, energy, carbon or nutrient sources are unsuitable to store or transport over long
distances. The plant where energy is produced may be too far from where it will be consumed. Uncritical intervention can lead to
unnecessary costs or the loss of energy in transmission. Demographic, physical, economic, labor skills and ecological differences
mean resource recovery technology cannot be easily or uniformly transferred. What works here may not succeed there.
Solution : Context-specific gains come from devolving authority, so recovery and reuse optimise water, energy, clean air and nutrients
at the source.
Action : By assessing goals, as well as local supply and demand, professionals develop tools, tactics and techniques that recover
the right resources, in the right way, at the right scale.
Result : The hard, visible, physical plant depends on soft, invisible institutional infrastructure put in place:
· Appropriate technology ensures decentralised and urbanised societies gain efficient supplies.
· Resource recovery is no panacea, target, or goal; it is a means to an end that arises from within.
· Durable outcomes depend on an institution’s clearly defined agenda, concrete policies, financial incentives, legal frameworks,
strict timeframes and cross-sector partnerships.
Action : Components like sulphur, cellulose, metals, and bioplastics will grow valuable with societal acceptance of the cyclic
economy.
Result : A truly closed loop demands that we know exactly what resources can be recovered where, how, and for which markets:
· Research can address and delineate the limits to, and potential of, the cyclic economy.
· That economy exists in the context of both primary materials it will consume and of those potentially supplied by the
reuse loops that will be developed
· Water professionals must work harder with legislators to construct legal frameworks that clearly define and encourage
resource recovery across and within borders.
· Innovative R&D platforms can spur the cyclic economy within the sector of water use and reuse.
015014 /the 7th World Water Forum
· Decentralized and locally situated facilities avoid transport issues (a Swedish system produces biogas next to the bus depot)
between resource recovery and usage.
Main Focus 3 : Water and Natural DisastersIn recent years, water related disasters – floods, droughts and storms – have grown frequent, affected 4.2 billion people, caused
USD 1.8 trillion economic losses, and accounted for 90% of all natural hazards.
Climate change is not coming. It is here. It’s underway. And it will only intensify. Our mitigation depends on green energy sources
that reduce greenhouse gas emissions. But our adaptation depends on water.
Water is the medium through which climate change becomes real. No city or nation is immune from extremes of protracted
droughts punctuated by sudden urban floods. Negative impacts of natural disasters include loss of life, displaced families and
livelihoods, and destruction of billions of dollars in property.
We can’t predict the degree, extent or timing of impacts. But water professionals today far better understand our escalating
vulnerability, and take steps to reduce risk exposure through building resilience.
This Executive Summary illustrates why, how, where, and for whom natural disasters loom large, and offers tested approaches
and techniques to anticipate crises and address them in advance. It reframes unnatural shocks less as crises to manage than as
opportunities to thrive. Success comes if we:
1. Play Offense, Not Defense. Don’t wait and react to future impacts; adopt a proactive approach to water system reforms that
reduce waste, build integrity, and lower exposure to rising risks.
2. Make Drought the Norm. Consider severe and protracted aridity the new rule, with rainfall the rare exception, in order to reach a
new equilibrium heading into perpetually drier future.
3. Embrace Floods, Naturally. Rather than push runoff elsewhere, ease its intensity by slowing it up, spreading its risks out, and
sinking its waters down through low-impact development.
4. Help Living Cities Breathe. Take the lead in turning urban areas into dynamic living organisms, by linking natural water
infrastructure in ways that enhance the built environment.
5. Buy Low (Tech), Sell High (Yields). Invest early in a menu of affordable and interactive options that generate stable, adaptive
outcomes over the many volatile years ahead.
6. Reform Institutions. Explore drought insurance, dam re-optimization, water rights, internal markets, trade in virtual water,
pricing, policy, devolution of authority.
7. Link Silos. Integrate the water-energy-food-health nexus to achieve higher adaptation, mitigation, and valuation of water across
sectors.
The Solutions to Resilience illustrate the value of taking early, deliberate and judicious measures to calmly confront an uncertain
and troubling future – a future that has already arrived, is growing ever more volatile, but to which we can adapt.
Challenge : Climate flux may take the form of record-breaking snows, enduring ice, and frozen ground that disrupts cities and
farms. Conversely, it may bring urban heatwaves, protracted droughts, and cracked and barren soils. Or it may bring increasingly
1. Play Offense, Not Defense
016
Challenge : Drought is no longer what we thought it was. Once considered the exception, it is increasingly becoming the norm.
Few can universally agree on what it means or how to define it. Even scientist and policy makers can’t decide whether a drought
has begun, let alone when, or if, they can declare it has ended. Quantifying the impacts and providing disaster relief are more
difficult for drought than for other natural hazards due to slow, severe, and long-lasting impacts that may run for decades. Also
a global temperature increase of 3-4°C may alter run-off patterns and force another 1.8 billion people to live in a water scarce
environment by 2080. Droughts may be increasing in frequency, severity, and duration, which make the traditional reactive
approach inadequate.
Solution : Assume severe and protracted aridity is now the rule, with rainfall the exception, in order to plan for and reach a new
equilibrium and thrive in a perpetually dry future.
Action : Mobilize around the causes and effects of drought, promote information exchange, and introduce innovative techniques,
trade, and practices that improve food security.
Results : Proactive drought policy options include:
· Securing a risk and early warning system that conducts a vulnerability analysis, impact assessment, and communication
plans;
· Include mitigation and preparedness measures that include the application of effective and affordable practices;
· Build universal awareness by investing in aggressive education, since a well-informed public can share responsibility through
an inclusive, participatory decision-making processes; and
· Enhance policy governance through stronger political commitment and accountability.
2. Assume Drought as the Norm
Challenge : By 2050, rising populations in flood-prone cities, climate change, deforestation, loss of wetlands and rising sea
levels are expected to increase the number of people vulnerable to flood disaster to 2 billion. Urban flooding affects developed
and developing countries alike. The devastating impact of recent deluge, like that which occurred in Thailand in 2011, means
more than half of humankind face volatile weather events in cities. Some degree of exposure to flood risks have long been part
of our life, but climate change elevates flood events to new extremes. Worse, these dangers are compounded by unregulated
urbanization with impermeable land use and development. Hard surface roads, walkways, parking lots and rooftops accelerates
the velocity and amplifies the peak intensity of urban runoff, with devastating consequences in cities around the world.
3. Embrace Floods, Naturally
frequent and intense typhoons and hurricanes. The one constant will be changes in hydrologic systems, water resources, coastal
zones, and oceans. On the whole, wet tropical regions will get wetter, and the dry regions will likely suffer increases in extent,
severity and duration of droughts.
Solution : Don’t wait and react to future impacts; adopt a proactive approach to water system reforms that reduce waste, build
integrity, and lower exposure to rising risks.
Action : Accelerate reforms that have begun to improve the efficiency and integrity of operations, with an emphasis on adaptive,
decentralized, natural infrastructure measures that increase the adaptive capacity to absorb shocks.
Results : Climate resiliency emerges through integrating silos of the system into a whole.
· Water efficiency and pressure management efforts ensure both the availability of more and better water, but also builds a
tighter linkage between supply and demand.
· Low impact development like swales, permeable paving, wetlands and rain gardens can attenuate urban flooding and
recharge groundwater recharge by slowing, spreading, and sinking runoff.
· Aligning built and natural infrastructure – conjunctive use of groundwater or dam reoperation, for examples, -- can minimize
the peaks and valleys of drought impacts downstream.
017016 /the 7th World Water Forum
Challenge : Much of the past century of urban development has involved the construction of hard, and rigid infrastructure –
concrete sidewalks, asphalt roadways, steel sewerage, straight gutters – to keep a city on a firm base and push water elsewhere.
That made sense in an age of reliable weather patterns and a stable climate. But cities no longer live in that age. The solid
framework and foundation have become a liability that elevate temperatures to lethal levels in the urban heat island effect, while
runoff backs up into streets, and streets back up into homes, buildings, and water or energy installations. This highlights a vexing
water and sanitation challenge: a resource can flow clean, with efficient delivery of healthy and equitable water, yet still be fragile.
What was seen as support has now become a corset that inhibits a city’s ability to adapt to escalating stress, choke points and
natural disasters.
Solution : Take the lead in turning urban areas into dynamic living organisms, by linking natural water infrastructure in ways that
enhance the built environment.
Action : Enact new codes that reward the rapid development and deployment of green spaces that bring new flexibility,
distribute local risks and broad responsibility, and build capacity against the worst.
Result : One constant is our need to adapt, when the only sure thing is a sense of uncertainty.
· To avoid rupture, water systems must go beyond ‘robust’ and be able to bounce back against stress.
· As a rule of thumb, the economic, societal, or ecological life of a city grows resilient to the extent to it anticipates, minimizes,
and de-risks water systems.
· Looking ahead, the success of our ‘grey’ systems depends on integration with green, ‘natural infrastructure.’
· But benefits must be shown to be cost-effective, or superior to traditional built approaches, and the most rigorous outcomes
require flexibility.
4. Help Living Cities Breathe
5. Buy Low (Tech), Sell High (Yields)
Challenge : Cities may desire resiliency through adaptive mechanisms, but complex plans take time. They can prove slow and
contentious. Special interests may push for pet projects by geography or sector. And infrastructure – natural or built – may still
require expensive tools, blueprints, labor and capital expenditures. How can cash-strapped urban governments come up with the
money to bring about the necessary changes?
Solution : Invest early in a menu of affordable and interactive options that generate stable, adaptive outcomes over the many volatile
years ahead.
Action : Deploy affordable, participatory and user-friendly tools that maximize durable outcomes, distribute risks and
responsibilities, engage multiple stakeholders, and shift cities to resiliency.
Solution : Rather than push runoff elsewhere, ease its intensity by slowing it up, spreading its risks out, and sinking its waters down
through low-impact development.
Action : Forewarned is forearmed: proactive investments in institutional, technical, and communications capacity to empower
developers, officials and residents to anticipate build resilience.
Result : Reduce direct and subsidiary damages by planning urban areas to absorb and adapt to sudden natural hazards, using
hardware and software tools.
· Enact codes to build or retrofit urban land development that integrates natural infrastructure with the build environment.
· Mitigate impacts of urban flooding by integrating traditional knowledge and developing and early warning systems.
· Develop flood defence systems such as flood gates, doors, and barriers as well as flood forecasting and observation
technologies.
· Improve forecasting, warning systems, and visualization of status that the public can rely on.
018
Challenge : Technology advances globally and economically. Wind power desalinates the sea. Deep aquifer pumps ‘deposit’
seasonal flows into groundwater ‘banks’. Conversion of waste streams into water, or energy, can generate a potentially drought
proof supply. But engineering alone can’t work unless nested within a strong institution. Decision-makers need authority to
weigh residential equity against industrial demands. Pricing strategies require stakeholder engagement. Pooling risks and cross
subsidies demand a deep and stable reservoir of trust, incentives, outreach and coordination.
Solution : Explore drought insurance, dam re-optimization, water rights, tiered rates, internal markets, trade in virtual water, drought
pricing, and devolution of authority.
Action : Engage constituents in honest discussions of future risks as a way to justify simple, small-scale, isolated pilot
demonstration projects that test and build potential institutional reforms and allow the most effective results to emerge on top.
Results : Public, private and philanthropic institutions have allocated funds for sustainable investment strategies, research, and
pilots programs to grow institutional capacity.
· The U.S. coordinates efforts of 13 federal agencies to understand why climate is changing, improve predictions about how
it will change in the future, and to use that information to assess impacts on human systems and ecosystems and to better
support decision making.
· The Netherlands has begun to address, absorb, and build resilience to water impacts from a rising sea level, while the
Rotterdam Approach combines knowledge, action and positioning/marketing.
· Japan’s environment ministry explores both the impact of and adaptation to climate change, and seeks to spread knowledge
of water through “Wise adaptation”
· Korea launched a ‘National Climate Change Adaptation Policy’ with other 13 ministries to reform policy in 7 areas through
basic alternatives for resilience; including tools that help local governments estimate and address vulnerabilities through
Local Climate Change GIS.
6. Reform Institutions
Result : Where uncertainty breeds fear, transparency builds trust: web- and mobile-based information communications
technology (ICT) yields knowledge that can be shared.
· From meters to billing systems to temperature gauges, resilient water managers tap into reliable big data that is cheap,
anonymous and available. Sharing it interactively can fast track resilience.
· Repurpose existing tools like cell phones, archival data, and closed circuit TV into hydro-informatics – the symbiosis of ICT
and water science – to forewarn and forearm stakeholders.
· University researchers harness GIS and 3-D expressions of ‘the Internet of things’ to analyse signals for flood or drought
anomalies that allow intervention in real-time, before it is too late.
· Other recipes combine basic rainfall data with meter readings, add runoff patterns, control for slope, adjust by surface, flood
records, and satellite images. The result: a useful, actionable tool.
· Markets help make interactive technology transfer easier, cheaper, and in some cases free: open platforms integrate water
data, link sensors throughout utility networks, or offer water R&D.
· These tools yield results across space and time, helping anticipate floods, hurricanes, or droughts, and focus on where
damage potential may be highest, allowing managers to rank threat risks.
Challenge: The United Nations’ proposed 17 Sustainable Development Goals includes #6: “Ensure availability and sustainable
management of water and sanitation for all”. At the same time, water underpins all 16 other priorities, and is thus both a target
and means to an end. Yet as water professionals see temperatures and sea levels rising, monitor groundwater salinity, watch
floods escalating and snowpack melting, they lack political capital to build resilience. Water is still rarely seen as the matrix on
which all other sectors depend, and its reveal competition between energy, agriculture, industry, and nature.
Solution : Integrate the water-energy-food-health nexus to achieve higher adaptation, mitigation, and valuation of water across
sectors.
7. Link Silos

019018 /the 7th World Water Forum
Main Focus 4 : Smart Technology for WaterFor millennia Egypt gathered water data from step-like infrastructures. Strategically sited along the river, these durable
instruments measured the seasonal pulse of currents; recorded water quantity and quality; calibrated how much flood irrigation
would benefit all subjects; determined taxation rates based on flow pattern; and detected early potential for risky extremes of
drought or deluge.
The Nilometer may be the oldest information and communications technology (ICT) applied to water.
Pharaoh and farmer alike depended utterly on this ‘smart’ tool. Each recognized it as a means to their own water security. With
time it fortified the social contract through layered scientific understanding.
Since then, our end goals have changed little. We still seek to collect, analyse and share water quality and quantity data in a
quest for security. Our urbanizing, water-stressed world demands faster, smarter, more precise knowledge. Vital data supports
equitable, efficient and ecologically sustainable governance.
But the means at our disposal – the fast-evolving spectrum of clever, complex, costly, and sophisticated tools – may complicate
decisions. This Executive Summary helps professionals leverage ICT to achieve their desired outcomes. We outline the trends,
tactics and case studies that can convert more data into more food, energy, security, life. ‘Smart’ water solutions lie in:
Action : Build collaborative resilience through reforming water policies, and leveraging financing mechanisms, that align with the
goals and interests of key stakeholders.
Results : Water is this century’s common currency of life, health, trade, energy, nutrition and climate change security.
· Efficient water use in agriculture lowers the global commodity food price index, and through virtual water trade this builds
climate resilience for billions of the world’s poorest.
· Secure, reliable, nearby taps allow water-fetching women and children to reinvest spare hours into education or remunerative
labor
· Universal access to clean, safe, water and sanitation slashes disease and death from dehydration.
· Low-impact development approaches filter runoff in ways that heal hypoxic dead zones offshore, boosting the wild fishery
resources on which 4.3 billion depend for vial animal protein.
· Slashing demand for urban water in half eases strain on power grids and lowers carbon emissions.
· Appropriate resource valuation could reduce energy’s hunger for 8-44% of all water withdrawals, and water’s thirst for up to
33% of all energy.
· Cutting food waste from field to fork by 40% would enhance global nutrition for billions without demanding more water;
conversely drip irrigation could produce more food with fewer drops.
1. Nexus management. Intelligent decision-making at systemic levels can incentivise efficient and sustainable use of water and
energy, and reduction of greenhouse gases emissions.
2. Transparent Trust. The most valuable information needs to be free, so any smart water system must be willing to share
information globally and across sectors and segments.
3. Open Doors. The success of any smart water management lies not only in improving the technology, but also in involving,
persuading and preparing multiple stakeholders to adopt it.
4. Empowered Options. Real time monitoring and diagnosis, as well as automatic controls, can improve the supervision and
optimization of water demand-supply management.
5. Appropriate Scales. To enable robust management of big data, support smart monitoring and metering at scales ranging from
basins to households.
020
The Solutions to ICT seeks to build on best practices and enable new innovations. Information may be power, but only if anchored
by those with the wisdom of to use it. Each solution outlines the most effective ways to generate better results, for more people,
in a shorter time, with fewer resources.
Challenge : The world has awakened to the risks of the water-energy nexus. Electricity grids grow thirsty while water grids
demand more and more power to convey, heat and treat what flows through tap or toilet. The nexus escalates greenhouse gas
emissions, increasing exposure to climate impacts. But solutions too often seem slow, cumbersome and expensive; they tend to
be aimed at the supply side of the equation – upgrading pumps, plants and generators – rather than address the real, largest, and
fastest growing source of energy embedded in water: the end user. It is unclear whether, where or how best water professionals
can engage customers in transforming this vicious spiral into a virtuous force for water security, energy efficiency and carbon
reduction.
Solution : Intelligent decision-making at systemic levels can incentivise efficient and sustainable use of water and energy, and reduction
of greenhouse gases emissions.
Action : Set goals that are widely desirable – like avoiding the unmanageable (and managing the unavoidable) impacts of climate
change – then use ICT to build a ‘smart water grid’ (SWG).
Results : A SWG can take many forms, in response to unique contextual and demographic drivers:
· K-water’s SWG is developing new & renewable energy technologies for increasing the efficiency of consumed energy in the
water supply system to at least 30%.
· The ‘Pecan Street Project’ in Austin, Texas is implementing a demonstration complex that combines a smart electricity grid
and smart water grid for 4,900 households across 2.8 Km2, applying AMI, sewage recycling technology and Smart Irrigation
for gardening.
· Following crippling drought in 2004-2007, Queensland, Australia, developed a SWG to secure water by balancing flows and
stabilising supplies at minimum cost.
· Despite high rainfall, Singapore lacks land to capture and store rain. To address shortages, its SWG aims to secure a stable
water supply, predict and respond to rapid changes in the global water situation, establish an R&D center for water
processing technology, and foster international and domestic water companies to become the world's leading water hub.
1. Nexus Management
Challenge : Water is highly transactional. People allocate, ration, charge and pay each other for it. Rural tariffs and urban rates put
a premium on privacy. Commercial clients, irrigators, and residential customers feel sensitive about usage patterns; urban water
providers and governments fear disclosing non-revenue water and waste. Yet ‘smart data’ remains largely worthless if locked up
alone. It serves no purpose removed from context or currency. Real value and knowledge emerge only when information can
be accessed, analysed and used to understand, benchmark, integrate and improve the system as an organic entity throughout
watersheds and across the borders of nations sharing river currents.
Solution : The most valuable information wants needs to be free, so any smart water system must be willing to share information
globally and across sectors and segments.
Action : Set up the network of smart water systems based on who can benefit from data, whether residential customers,
downstream stakeholders, industrial corporations or the government itself.
Result : Many innovative, effective assessment technologies have been developed and can motivate users.
· Detect leaks by fixed or portable hydrophones, magnetic flux or linear polarization resistance.
2. Transparent Trust
6. Broad(band) Foundations. Rapid, reliable decisions require web and mobile-based networks to monitor, acquire and process real-
time data on water level, rainfall, runoff and water quality.
7. Driving Efficiencies. Smart systems, linked to wise legal and economic institutions, can help professionals achieve water and
resource efficiency goals.
021020 /the 7th World Water Forum
Challenge : Despite many attempts to integrate ICT into urban water supply systems, smart technologies continue to face barriers
of sociological, ecological and economic limitations. These include public health fears; cost concerns; database quality; workforce
skills; assessment capacity; and the requirements, technologies and costs of inspection.
Solution : The success of any smart water management depends not only upon improving the technology itself, but also upon
involving, persuading and preparing multiple stakeholders to adopt it.
Action : Rather than present smart meters as a hasty ‘done deal,’ engage clients and other constituents up front, out in the open,
to discuss shared social, economic and ecological benefits: safer working conditions, more accurate readings, billing efficiency,
leak detection and reduced emissions.
Results : However contentious or costly public outreach may seem on the front end, it pays long term dividends in trust, savings,
compliance and accountability.
· K-water shares the data with the KMA (Korea Meteorological Administration), the MOLIT (Ministry of Land, Infrastructure and
Transport of Korea) and other relevant entities, and supports its own employees to check hydrological information through
smart phone applications anytime and anywhere.
· The website of K-water provides real-time data about hydrological conditions and closed-circuit television footage from dams
and weirs to satisfy the public desire for better services.
· Western Australia launched an ongoing campaign with its customers to explain the need to take more responsibility for
water.
3. Opening Doors
Challenge : Climate change impacts will be felt most severely on water availability and quality, affecting human wellbeing,
industry, agriculture, ecosystems, economies and regional stability. Negative water impacts are falling hardest on the
disenfranchised urban and rural poor.
Solution : Real time monitoring and diagnosis, as well as automatic controls, can improve the supervision and optimization of water
demand-supply management.
Action : Provide widespread access to data – or even to the tools that generate that data – in ways that shorten the distance
between provider and recipient, supply and demand.
Result : Smart systems are emerging in affluent cities and developing rural landscapes alike.
· In Africa, Water for People is harnessing ICT by encouraging end users to alert the government when and where a
groundwater pump is broken or contaminated.
· Two-way signals combined with interactive web-mobile alerts allow urban users to see whether they have a leak, where it
may be, what to do about it and how fixing it can save money.
· Connectivity increases accountability, encourages end users to take responsibility and improves the performance and
responsiveness of governments.
4. Empowering Options
· Smart meters indicate anomalies against baselines; signals can alert company and client alike.
Challenge : ICT often seems like a ‘one-size-fits-all’ package that gets marketed and sold to affluent megacities or large industries.
The world may be urban, but cities vary dramatically by region and context. Many water systems – especially older ones, strained
to capacity – are limited by small budgets, outdated technology, unskilled human resources and political constraints. Yet these
are the very systems that could benefit most from having tools that could empower and integrate stakeholders to achieve water
security.
Solution : To enable robust management of big data, support smart monitoring and metering at scales ranging from basins to
households.
5. Appropriate Scales
022
Challenge : Smart water management never emerges in a vacuum. Any ICT system for water – providing broad access for all
stakeholders to high quality hydrological data – must walk before it can run. Egypt’s Nilometer grew refined over decades, but
even it required institutional capacity to track, record, store and share data through a common language base, with shared
access, and constant real-time communication.
Solution : Rapid and reliable decisions require web and mobile-based networks to monitor, acquire and process real-time data on
water level, rainfall, runoff and water quality.
Action : Take advantage of public, shared and relational databases or web-based systems. A smart data processing system
includes: real-time data processing; a client/server communication network configured with satellite, VHF, CDMA, etc; 24/7
monitoring; closed-circuit television footage from major risk areas; and text message services for risk alerts.
Results :
· Smart sensors optimize irrigation water by measuring humidity, rainfall, wind speed/direction, soil temperature/ moisture,
atmospheric pressure, and solar radiation.
· K-water operates a real-time information system to provide data about hydrological conditions; Smart rehabilitation
technology sends image-diagnosing robots to inspect pipes, blasts scaling and rust with an ultra-high pressure water jet,
and sprays lining/coating materials evenly inside the pipes.
· The system functions to combine real-time data (covering water level, rainfall, water quality, etc.) and video footage of closed-
circuit televisions from major dams, weirs or rivers, streams in the country for 24/7 monitoring services.
· Relevant data are collected from sensors installed in monitoring facilities, and transmitted to a communication room, or
control room, through either wired or wireless communications technologies.
Challenge : A century of cheap or free water has accelerated the depreciation of water infrastructure, led to systemic
unaccountable waste, created a culture of entitlement and caused urban and rural water scarcity. ICT tools hold out the potential
to improve demand response, reverse the energy-water nexus into a positive direction, and engage clients to work with the
provider rather than against it. But smart technology alone needs institutional reforms to prevent water from bleeding away,
silent and invisible.
Solution : Smart systems, nested within wise legal and economic institutions, can help professional achieve water and resource
efficiency goals.
Action : To reap the full potential gains from ICT, nest them within water rights, allocations, tariffs, licensing, regulation, storage,
abstraction, energy choices and markets.
Results : Integrating smart tools help build a more efficient and accountable non-structural administrative framework.
· Advanced Metering Infrastructure (AMI), with ‘smart’ sensors and signals, lets consumers choose tariffs, while utilities can
prioritize usage for special purposes and pricing.
· ‘Smart’ meters allow time of day billing, reduction of peak demand, leak detection, increased distributional efficiency, non-
revenue water reduction, and deferral of capital spending.
6. Building Broad(band) Foundations
7. Driving Efficiencies
Action : As technology grows more affordable through economies of scale, it falls within reach of more systems to distribute risks
and encourage resilience.
Results : The right to water corresponds to the responsibility of those who demand it.
· A decentralized water system used for water supply can be understood as a system where intensively concentrated urban
water load is mitigated; a water grid connecting different water supply systems is provided; and a sufficient amount of
storage capacity to provide against any emergency situation is secured.
· Smart asset management optimises capital, operations and maintenance expenditures by providing the desired level of
service at the lowest infrastructure life-cycle cost.
023022 /the 7th World Water Forum
· ‘Smart’ pipes measure water flow and quality to detect strain, temperature or pressure anomalies, so potential leaking can be
checked in real time.
Main Focus 5 : Understanding and Managing Ecosystem Services for WaterRivers have been, and remain, our most vital water infrastructure.
Headwaters collect it. Forests retain it. Meadows control its extremes. Currents deliver it. Eddies produce food from it. Aquifers
store its surplus. Wetlands filter it. Wind and sun desalinate it all over again.
What should nature invoice us for this endless hard and productive work on our behalf? Until recently the answer was: ‘No charge’.
But water professionals have begun to approach this question in radical new ways, developing new valuation tools, and seeking
answers with an increased sense of urgency.
Humans tend not to value what comes for free. We claim water is ‘priceless’ but treat it as worthless. Our cities take reliable
upstream flows for granted, and convert downstream flows into open sewers.
That’s changing, fast. This Executive Summary illustrates why, how, where, and for whom watersheds yield dramatic benefits –
most recently defined as “the direct and indirect contributions of aquatic ecosystems to human well-being” – that enhance what
we’ve built. Successful outcomes emerge if we:
1. Move Nature from ‘Red’ to ‘Black’. Shift aquatic ecosystems across the policy framework from the column of ‘fixed liabilities’ that
we avoid into ‘liquid assets’ that generate yields.
2. Monetise what’s Priceless. Deploy clear analytical tools that give explicit value to the hidden ways natural infrastructure adds
value to society.
3. Slow, Spread & Sink It. Decompress and decentralize urban runoff techniques to bring back a watershed’s former health, rhythm,
velocity, and reliability.
4. Seek Symbiosis. Convert the reactive ‘environmental impact assessment’ into a proactive evaluation of how much development
can benefit from naturally functioning water flows.
5. Scale Economies. Encourage and reward investments in natural water infrastructure at every level, from backyards to river basins,
and rooftops to reefs.
6. De-Risk Development. Leverage nature as a fast, secure, and cost-effective insurance policy against escalating shocks to our
manmade systems.
7. Redefine Relations. Transform nature, neither our subordinate nor superior, into an equal partner with which to build a mutually
dependent, resilient and productive future.
Solutions through Ecosystem Services illustrate that when we secure, value, and invest in natural capital, it repays healthy long term
dividends. Each introduces the most effective ways that ‘natural infrastructure’ of aquatic ecosystems can support water, energy,
and food security, for all, forever.
Challenge : The concept of an “aquatic ecosystem” is easy to grasp but hard to classify or define. All too often it gets ranked as a
complex problem for scientists to explore and for governments to manage. As a result, otherwise healthy rivers – and the fish,
plants and wildlife species within them – loom as a barrier to progress, an obstacle that development must somehow address
or overcome or mitigate (or ignore) so that societies may advance. This misperception has turned out to be harmful not only to
natural infrastructure, but also dangerous to the cities that utterly depend on it. Can cities really reflect the true value of water for
society? Yes.
1. Move ‘Nature’ from Red to Black
024
Challenge : Rivers that belong to everyone are too often valued by no one in particular. Constituents in every government, at
every level, naturally enjoy goods and services watersheds provide for free; conversely, they resent being asked to pay for them.
And while economists can explain on paper the benefits from ‘putting a price tag on nature,’ they can’t win office on promises to
raise the cost of water, the cost of food, and the cost of energy for everyone. If restoration of watersheds is desirable for society,
can its benefits be monetized, without generating a political backlash? Yes.
Solution : Deploy clear analytical tools that give explicit value to the hidden ways natural infrastructure adds value to society.
Action : Present watershed health on a menu of options, demonstrating if, how, where, and why green and low-impact
development is less expensive than built up alternatives.
Results : Measuring ecosystem services in monetary terms is crucial for policy implementation:
· New York City happily invested in the integrity of upstream rural headwaters when shown that doing so cost a fraction of a
downstream urban treatment plant.
· Businesses and officials in seven Northern Andean cities like Quito, Ecuador and Bogota, Columbia invest matching ‘water
funds’ into upstream watersheds for downstream security.
· South Africa’s taxpayers invest in labor intensive projects to remove invasive alien weeds, because doing so generates more
water at less cost than built infrastructure.
· The Netherlands is testing a program to compensate farmers who manage their land for the ecological benefits of watershed
services.
2. Monetise what’s Priceless
Challenge : Every country on earth is undergoing rapid industrialization, an unprecedented experiment with unforeseen
outcomes. As more than half of humanity lives and works in cities, land use patterns generate undesirable impacts both on
and from declining watershed health and stability. Governments easily identified and addressed industrial pipes spewing toxic
discharge, but now face a new threat from rain hitting impermeable surfaces. Runoff from tar rooftops, driveways, roads, parking
lots, and industrial complexes combine new, unwieldy and potentially lethal non-point source (NPS)_ pollution. This NPS cocktail
runs through gutters, and drains into water bodies, as untreated discharge. It steadily poisons rivers with heavy metals, and
suffocates life by biochemical oxygen demand, two thirds of which now come from polluted stormwater runoff. Can cities escape
pollution that rushes in from everywhere all at once? Yes.
Solution : Decompress and decentralize urban runoff techniques to bring back a watershed’s former health, rhythm, velocity, and
reliability.
3. Slow, Spread & Sink It
Solution : Shift aquatic ecosystems across the policy framework from the column of ‘fixed liabilities’ that we avoid into ‘liquid assets’
that generate yields.
Action : Compare the many gains from the integrity of robust watersheds against the rising costs of replacing them in perpetuity
through building new manmade infrastructure.
Results : The most durable and affordable approach to urban development is often the greenest:
· Wetland integrity need not be lost and mitigated but rather reinvested in as an adaptive strategy to reduce impacts from
floodwaters, and costs of stormwater treatment.
· Swales along roadsides filter heavy metals and biochemical that generate savings both from avoided costs and more stable
and productive aquatic life and food security.
· Breaking down curbs into green spaces slow not only runoff, but also traffic, reducing traffic congestion, urban stress and
social risks.
· Centralised stormwater treatment plants finds valuable and complementary support from strategically designed green
spaces, especially at crossroads.
025024 /the 7th World Water Forum
Challenge : Decades ago local, city, regional, and federal governments began to adopt various assessment tools that promised
to reduce the negative impacts on aquatic ecosystems. These have faltered, due largely to inherent flaws and disincentives. First,
they demanded too few and too little in countermeasures, applied too infrequently, coming too late in the planning process.
Also, they pitted environmentalists against private interests in an escalating arms race, with officials caught in the crossfire.
Finally, in trying to avoid the downside of negative damage to watersheds, they ignored the potential upside of positive benefits
from precautionary measures from watersheds. Is there a better way forward? Yes.
Solution : Convert the reactive ‘environmental impact assessment’ into a proactive evaluation of how much development can benefit
from naturally functioning water flows.
Action : Low Impact Development (LID) and natural infrastructure approaches include and integrate the development plan
to overcome hydrological, social and ecological problems caused by urbanization so that humans can coexist with the
ecosystem.
Results : Natural infrastructure doesn’t replace built infrastructure; each supports the other:
· Dams benefit from forests and meadows that stabilize soils, maintain snowpack, attenuate floods, store runoff, and hold back
erosion upstream.
· Lakes, aquifers, floodplains and wetlands provide water storage and therefore reduce the reservoir size along with the labor,
equipment, and mitigation costs to build it.
· Terraced landscapes, green roofs, planted medians, and permeable pavements recharge groundwater, reduce floods, cut
sediment loads, capture pollutants, and filter runoff.
· Well-functioning natural watersheds extend the life of hydropower and irrigation technology, and justify their integration
through a longer, higher return on investment.
4. Seek Symbiosis
Action : Adopt low impact development (LID) and green vegetation cover to intercept, absorb, and store rainfall and runoff in an
affordable and aesthetic policy response.
Results : LID harnesses society’s goals with natural processes in impervious areas as it:
· Eases both the timing and peak of runoff from extreme storms to reduce the sudden surprise, biochemical loads, heavy
metals, and extreme impacts of urban flooding.
· Maintains drinking water supply by decreasing exposure to risks of contaminated stormwater overflows.
· Increases individual property values of sites by improving the exterior aesthetic nature for the community, while lowering the
rising plumbing, insurance, maintenance, and treatment costs for all.
Challenge : Our manmade infrastructure for irrigation, hydropower, or municipal water was built on a foundation of relatively
stable equilibrium, or ‘stationarity,’ but that no longer exists. Water’s quality, quantity, productivity and health is being degraded
at every level. Responses are fragmented. Governments mandates are broken into silos. Urban and rural institutions work in
isolation. Competing users talk past each other. The lack of coordination breeds delays, distrust, and conflict. And the scope is
often narrowed to single issue crises rather than the spectrum of freshwater flows and processes across scales. Can we widen and
expand the set of interests to align stakeholders? Yes.
Solution : Encourage and reward investments in natural water infrastructure at every level, from backyards to river basins, and rooftops
to reefs.
Action : Prioritise a focus on watershed-based outcomes to build policy support, engage water and wastewater operators, and
leverage investments in natural infrastructure.
5. Scaled Economies
026
Challenge : Humanity depends on stable watersheds for food, energy, transportation, health and culture. Unfortunately, these
life-supporting freshwater systems are extremely complex and now increasingly unstable. After millennia of co-evolution
at a literally glacial pace, both nature and societies are being forced to undergo sudden, accelerated and extreme shifts into
undesirable states that may be impossible to reverse. Global change is forcing local economies to confront unprecedented risks.
If we can’t stop or predict disruptive risks, can we absorb and adapt to their inevitable impacts? Yes.
Solution : Leverage nature as a fast, secure, and cost-effective insurance policy against escalating shocks to our manmade systems.
Action : Just as auto insurance companies structure rates based on safe driving, so too can underwriters base premiums and risk
ratings on policies that encourage ‘natural infrastructure ‘ and ‘low impact development.’
Results : Public, private, commercial and industrial complexes take locally and demographically appropriate measures to build
resilience to a more volatile and unstable water future:
· Makanya, Tanzania is investing in rainwater harvesting, conservation tillage, and other productive and affordable small-scale
water innovations to break dryland poverty traps.
· China is investing 100 billion USD over a decade to secure the natural capital of river system services against urban flooding,
loss of topsoil, desertification, and ecotourism.
· Korea’s ‘Four major River Restoration Project’ is investing in natural capital to secure supplies, control floods, enhance water
quality, boost culture, and develop the region.
6. De-Risk Development
Challenge : Our ancestors carved out and grew civilizations alongside rivers. They saw nature as chaos, and sought to bring
order to its hostile and malignant forces of drought, turbulence, and deluge. Their engineers began to subdue, harness, tame
and domesticate aquatic ecosystems, halting, diverting and draining currents before they could ‘empty’ and thus be ‘wasted’ into
the sea. Now younger and more affluent generations seek to reverse these policies. Rejecting the ‘anthropocentric’ mindset for
‘eco-centric’ outlook, they demand rivers be liberated, unleashed, left alone to return to a feral, unruly, and wild existence. Both
enslavement and neglect are impractical and unaffordable in our increasingly thirsty world.
Solution : Transform nature from subordinate or superior into a full and equal partner with which to build a mutually dependent,
resilient and productive future.
Action : Learn to use the services of aquatic ecosystems with the same care a craftsman devotes to his tools, in order to build or
restore useful works with integrity, diversity, durability, and beauty.
Results : Secure development comes from recognizing people and nature as inextricably linked:
· U.S. coastal cities are embracing policies to improve stormwater runoff, water quality, and resilience through natural
7. Redefine Relations
Results : Urban LID policies to integrate retention, infiltration, and circulation can aggregate across groups of actors and
collaborative efforts to yield massive regional benefits:
· Frieberg, Germany applies small scale decentralized types of vegetated swale, infiltration basins, bioretention and
constructed wetlands in urban land use.
· As part of a national project, Chungcheongnam-do, Korea designs small scale bioretention, infiltration trenches, horizontal
subsurface wetlands, and free water surface flows.
· Cities in the UK install green drainage systems to manage runoff and NPS pollutants, leveraging ecological mechanisms that
connect water, green spaces, and scenic values.
· Social networks with a wide scope of actors can connect institutions across scales to build trust, share information, identify
knowledge gaps, and create nodes of expertise.

027026 /the 7th World Water Forum
infrastructure, especially in schools and public spaces.
· Aquatic ecosystems are disrupted by demands to take water away from rivers, but also by changes in land use that affect the
amount and quality of water flowing into them.
· Preservation and regeneration of native open vegetation, or rain gardens, can extend runoff detention time in the sources,
connect impervious areas, and improve drainage.
· Minimizing impervious areas through common values can improve infiltration rates, link flows, absorb extreme risks, and
enhance runoff quality.
· Managing stormwater runoff through natural sources helps reduce impacts, and dependence on conventional drainage
pipes, sewer lines, and treatment ponds.

Efficiency
Main Focus 1
Water Efficiency
We describe the characteristics, the challenges, the smart approaches,
and the innovative technologies of urban, industrial and agricultural
water efficiencies pursuing some scientific or technological solutions
for implementation.

Wat
erEf
ficie
ncy
Main Focus 1 030
1.1 INTRODUCTION
Water scarcity is an international problem with economic
and social effects. Driven by increasing populations,
growing urbanization, changing lifestyles, and economic
development, the total demand for water in urban areas
is rising. The cities and towns of low-income countries and
emerging economies are affected more severely because
of increased consumption and the difficulties involved
in managing complex leaking pipe networks. According
to a World Bank study (2007), the renewable fresh water
availability per capita is expected to halve by 2050 (relative
to 2007), a trend that will probably be exacerbated as climate
change makes many regions hotter and drier or climate
more uncertain. Despite the increased stress on water
resources, many water users, decision-makers and managers
are still unaware of practical, cost-effective water efficiency
improvements they can make. Strategies or plans for water
efficiency are largely lacking, both in public and private
sectors.
The world population rises by approximately 200,000 a week,
and perhaps this alone emphasizes the need for governments
and water utilities not only to increase the absolute volume
of water supply itself but also to focus on improving the
efficiency of water use and conveyance. However, it is
common for lower-income countries to be losing as much
as half the water that it treats and pumps into a distribution
network owing to underground leakage. It is worthy asking
“Why has the expertise of water loss reduction gained in
some countries not been successfully transferred and why
do such enormous losses continue despite the efforts of
aid donors and multi-million dollar projects?” One of those
donors, the World Bank, recognized that the issue has as
many non-physical, non-engineering and non–scientific
factors related to management, government, corruption and
pricing, among others. These are often causes beyond the
control of the utilities.
The greatest water volume saving and financial benefit from
any water utility that can gain in the low-income countries
is through paying attention to underground water losses
leaking from pipe networks. There are many higher income
countries that also struggle with the same issues or fail
to recognize the importance of reducing such losses. This
saving has been proved many times to be far greater than
any other potential gains in efficiency, whether these are
Main Focus 1. W
ater Efficiency
the 7th World Water Forum 031030 /
1.2 URBAN WATER EFFICIENCY1.2.1 Characteristics of Urban Water Efficiency
from reductions in industry or household use. The exception
is in some developed countries, where interventions have
successfully maintained losses from underground leaks
at a much lower level, and they now justifiably focus on
efficiencies in consumer usage.
The reduction of these efficiencies has beneficial environ-
mental and economic impacts on every aspect of running a
water business. The skills for water loss reduction are known,
and have been applied successfully in many places. Therefore
it is also worth asking “Why do we still have most of Asia,
Africa, South America and the Middle East, possibly over a
third of the world still losing such high volumes?”
Developed countries have varying degrees of success,
but many still have to reduce losses to a reasonable level
that would be deemed acceptable by their communities.
“Who needs to be the global leaders on this issue?” is also
a reasonable question to ask, as there appears to be a
void in this arena. The issue is obviously complex. It needs
government leadership, cooperation with aid agencies and
a drive to successfully assist many communities in the world,
through a reinvigorated international effort. The world
needs a major review of water efficiency aspects and water
management, which identifies what can influence successful
change.
Recently, water shortage crises have increased the efficiency
of water management in Korean industrial, urban and
agricultural fields, and energy use in water and wastewater
systems. Many useful approaches have been applied
for efficient water management and some innovative
technologies have been proposed and tested to lead to much
more efficient water use. Korean experiences are introduced
and illustrated as some of the reference for possible
applications.
Governments, aid agencies and water utilities committed
to best practice require the application of a total water
cycle approach to the management of their resource base,
to capture holistic efficiency. Delivering on the notion of
“catchment to tap” requires not only operational, engineering
and corporate professionals, but also catchment and
environmental experts who have first-hand knowledge,
experience and passion to deliver a holistic management
outcome.
The improvement of water use efficiency by industrial,
institutional and individual consumers in buildings,
agriculture and in industrial processes is also very important.
Water efficiency is an indicator of the relationship between
the amount of water required for a particular purpose and
the amount of water used or delivered (Vickers, 2002). A
related concept is water conservation, where the emphasis is
on the accomplishment of a function, task, process or result
with the minimal amount of water. Water efficiency concerns
reducing waste rather than restricting use. It also emphasizes
the influence users can have on water consumption by
making small behavioural changes to reduce water wastage
and by choosing more water-efficient process steps and
products. Another important dimension to water efficiency
is the emphasis on closing the water cycle through recycling
and reuse (AFED, 2010).
In this section, we will describe the characteristics, the
challenges, the smart approaches and the innovative
technologies of the four water efficiencies; urban water
efficiency (UWE), industrial water efficiency (IWE), agricultural
water efficiency (AWE) and energy efficiency in water
and wastewater systems (EE) pursuing some scientific or
technological solutions to implementation.
Urban water systems can be categorized by their water
supply and stormwater systems. Issues of the water supply
system deal with having enough capacity based on water
demands and reducing water losses. Issues of the stormwater
system mainly include prevention and mitigation of urban
flooding as well as reduction of non-point source pollutants.
A major issue that water utilities must address is the
considerable difference between the volume of water they
treat and distribute, and the volume that is invoiced to their
customers. This gap is known as urban water loss, or non-
revenue water, and can be an enormous proportion of the
total amount of water treated and distributed. Experts who
investigate this issue commonly find between a third and a
half of the input volume is lost. Factors contributing to this
gap are related to management methods of water accounting
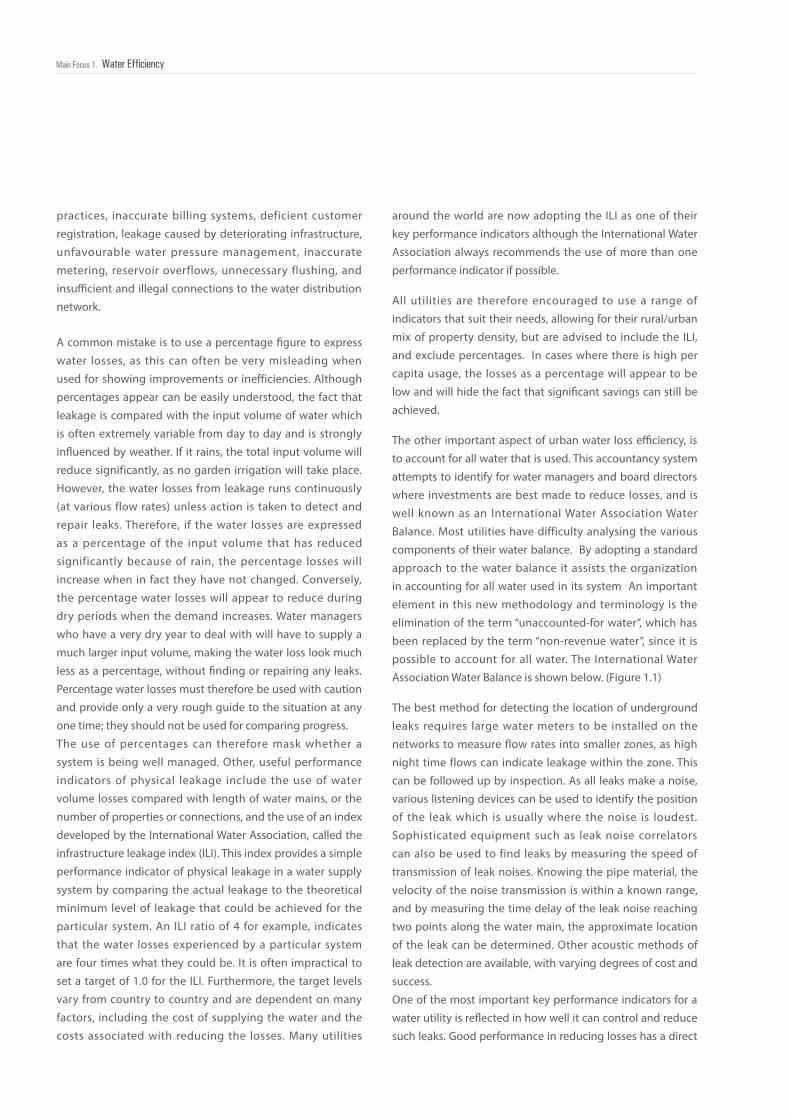
032Main Focus 1. Water Efficiency
practices, inaccurate billing systems, deficient customer
registration, leakage caused by deteriorating infrastructure,
unfavourable water pressure management, inaccurate
metering, reservoir overflows, unnecessary flushing, and
insufficient and illegal connections to the water distribution
network.
A common mistake is to use a percentage figure to express
water losses, as this can often be very misleading when
used for showing improvements or inefficiencies. Although
percentages appear can be easily understood, the fact that
leakage is compared with the input volume of water which
is often extremely variable from day to day and is strongly
influenced by weather. If it rains, the total input volume will
reduce significantly, as no garden irrigation will take place.
However, the water losses from leakage runs continuously
(at various flow rates) unless action is taken to detect and
repair leaks. Therefore, if the water losses are expressed
as a percentage of the input volume that has reduced
significantly because of rain, the percentage losses will
increase when in fact they have not changed. Conversely,
the percentage water losses will appear to reduce during
dry periods when the demand increases. Water managers
who have a very dry year to deal with will have to supply a
much larger input volume, making the water loss look much
less as a percentage, without finding or repairing any leaks.
Percentage water losses must therefore be used with caution
and provide only a very rough guide to the situation at any
one time; they should not be used for comparing progress.
The use of percentages can therefore mask whether a
system is being well managed. Other, useful performance
indicators of physical leakage include the use of water
volume losses compared with length of water mains, or the
number of properties or connections, and the use of an index
developed by the International Water Association, called the
infrastructure leakage index (ILI). This index provides a simple
performance indicator of physical leakage in a water supply
system by comparing the actual leakage to the theoretical
minimum level of leakage that could be achieved for the
particular system. An ILI ratio of 4 for example, indicates
that the water losses experienced by a particular system
are four times what they could be. It is often impractical to
set a target of 1.0 for the ILI. Furthermore, the target levels
vary from country to country and are dependent on many
factors, including the cost of supplying the water and the
costs associated with reducing the losses. Many utilities
around the world are now adopting the ILI as one of their
key performance indicators although the International Water
Association always recommends the use of more than one
performance indicator if possible.
All utilities are therefore encouraged to use a range of
indicators that suit their needs, allowing for their rural/urban
mix of property density, but are advised to include the ILI,
and exclude percentages. In cases where there is high per
capita usage, the losses as a percentage will appear to be
low and will hide the fact that significant savings can still be
achieved.
The other important aspect of urban water loss efficiency, is
to account for all water that is used. This accountancy system
attempts to identify for water managers and board directors
where investments are best made to reduce losses, and is
well known as an International Water Association Water
Balance. Most utilities have difficulty analysing the various
components of their water balance. By adopting a standard
approach to the water balance it assists the organization
in accounting for all water used in its system An important
element in this new methodology and terminology is the
elimination of the term “unaccounted-for water”, which has
been replaced by the term “non-revenue water”, since it is
possible to account for all water. The International Water
Association Water Balance is shown below. (Figure 1.1)
The best method for detecting the location of underground
leaks requires large water meters to be installed on the
networks to measure flow rates into smaller zones, as high
night time flows can indicate leakage within the zone. This
can be followed up by inspection. As all leaks make a noise,
various listening devices can be used to identify the position
of the leak which is usually where the noise is loudest.
Sophisticated equipment such as leak noise correlators
can also be used to find leaks by measuring the speed of
transmission of leak noises. Knowing the pipe material, the
velocity of the noise transmission is within a known range,
and by measuring the time delay of the leak noise reaching
two points along the water main, the approximate location
of the leak can be determined. Other acoustic methods of
leak detection are available, with varying degrees of cost and
success.
One of the most important key performance indicators for a
water utility is reflected in how well it can control and reduce
such leaks. Good performance in reducing losses has a direct
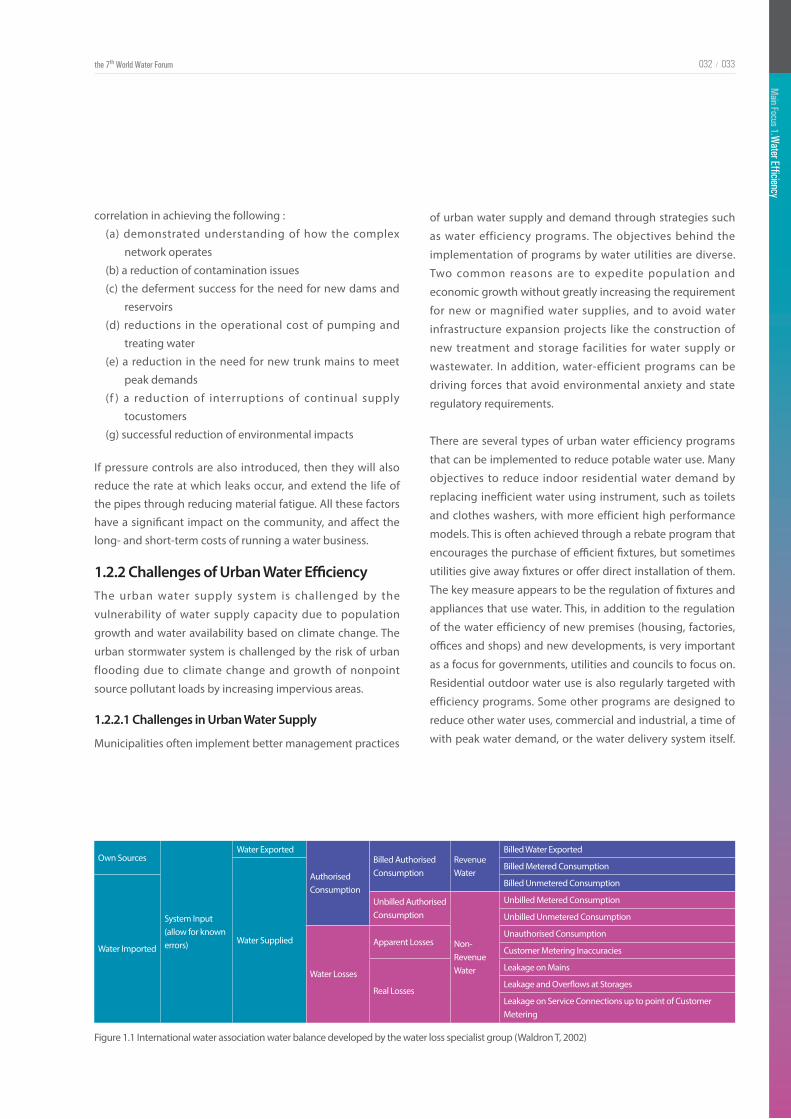
Main Focus 1. W
ater Efficiency
the 7th World Water Forum 033032 /
Figure 1.1 International water association water balance developed by the water loss specialist group (Waldron T, 2002)
Own Sources
System Input (allow for known errors)
Water Exported
Authorised Consumption
Billed Authorised Consumption
Revenue Water
Billed Water Exported
Water Supplied
Billed Metered Consumption
Water Imported
Billed Unmetered Consumption
Unbilled Authorised Consumption
Non-Revenue Water
Unbilled Metered Consumption
Unbilled Unmetered Consumption
Water Losses
Apparent LossesUnauthorised Consumption
Customer Metering Inaccuracies
Real Losses
Leakage on Mains
Leakage and Overflows at Storages
Leakage on Service Connections up to point of Customer Metering
1.2.2 Challenges of Urban Water Efficiency
1.2.2.1 Challenges in Urban Water Supply
The urban water supply system is challenged by the
vulnerability of water supply capacity due to population
growth and water availability based on climate change. The
urban stormwater system is challenged by the risk of urban
flooding due to climate change and growth of nonpoint
source pollutant loads by increasing impervious areas.
Municipalities often implement better management practices
correlation in achieving the following :
(a) demonstrated understanding of how the complex
network operates
(b) a reduction of contamination issues
(c) the deferment success for the need for new dams and
reservoirs
(d) reductions in the operational cost of pumping and
treating water
(e) a reduction in the need for new trunk mains to meet
peak demands
(f ) a reduction of interruptions of continual supply
tocustomers
(g) successful reduction of environmental impacts
If pressure controls are also introduced, then they will also
reduce the rate at which leaks occur, and extend the life of
the pipes through reducing material fatigue. All these factors
have a significant impact on the community, and affect the
long- and short-term costs of running a water business.
of urban water supply and demand through strategies such
as water efficiency programs. The objectives behind the
implementation of programs by water utilities are diverse.
Two common reasons are to expedite population and
economic growth without greatly increasing the requirement
for new or magnified water supplies, and to avoid water
infrastructure expansion projects like the construction of
new treatment and storage facilities for water supply or
wastewater. In addition, water-efficient programs can be
driving forces that avoid environmental anxiety and state
regulatory requirements.
There are several types of urban water efficiency programs
that can be implemented to reduce potable water use. Many
objectives to reduce indoor residential water demand by
replacing inefficient water using instrument, such as toilets
and clothes washers, with more efficient high performance
models. This is often achieved through a rebate program that
encourages the purchase of efficient fixtures, but sometimes
utilities give away fixtures or offer direct installation of them.
The key measure appears to be the regulation of fixtures and
appliances that use water. This, in addition to the regulation
of the water efficiency of new premises (housing, factories,
offices and shops) and new developments, is very important
as a focus for governments, utilities and councils to focus on.
Residential outdoor water use is also regularly targeted with
efficiency programs. Some other programs are designed to
reduce other water uses, commercial and industrial, a time of
with peak water demand, or the water delivery system itself.
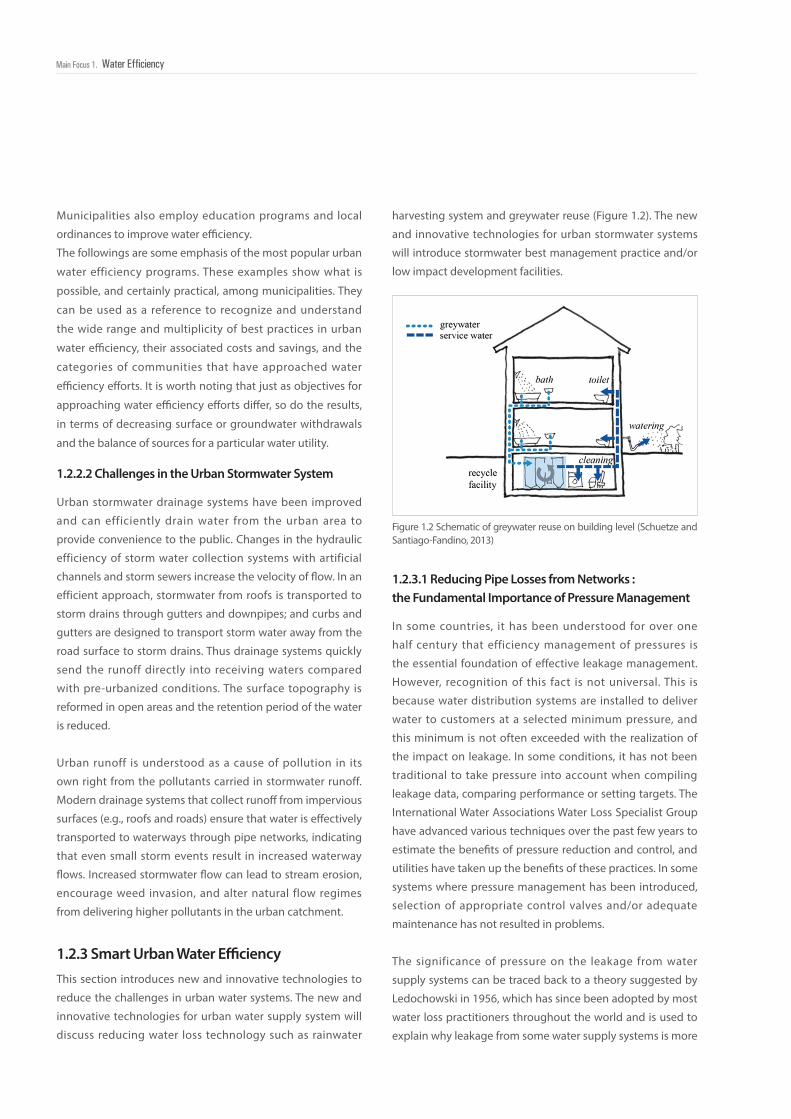
034Main Focus 1. Water Efficiency
Municipalities also employ education programs and local
ordinances to improve water efficiency.
The followings are some emphasis of the most popular urban
water efficiency programs. These examples show what is
possible, and certainly practical, among municipalities. They
can be used as a reference to recognize and understand
the wide range and multiplicity of best practices in urban
water efficiency, their associated costs and savings, and the
categories of communities that have approached water
efficiency efforts. It is worth noting that just as objectives for
approaching water efficiency efforts differ, so do the results,
in terms of decreasing surface or groundwater withdrawals
and the balance of sources for a particular water utility.
1.2.2.2 Challenges in the Urban Stormwater System
Urban stormwater drainage systems have been improved
and can efficiently drain water from the urban area to
provide convenience to the public. Changes in the hydraulic
efficiency of storm water collection systems with artificial
channels and storm sewers increase the velocity of flow. In an
efficient approach, stormwater from roofs is transported to
storm drains through gutters and downpipes; and curbs and
gutters are designed to transport storm water away from the
road surface to storm drains. Thus drainage systems quickly
send the runoff directly into receiving waters compared
with pre-urbanized conditions. The surface topography is
reformed in open areas and the retention period of the water
is reduced.
Urban runoff is understood as a cause of pollution in its
own right from the pollutants carried in stormwater runoff.
Modern drainage systems that collect runoff from impervious
surfaces (e.g., roofs and roads) ensure that water is effectively
transported to waterways through pipe networks, indicating
that even small storm events result in increased waterway
flows. Increased stormwater flow can lead to stream erosion,
encourage weed invasion, and alter natural flow regimes
from delivering higher pollutants in the urban catchment.
This section introduces new and innovative technologies to
reduce the challenges in urban water systems. The new and
innovative technologies for urban water supply system will
discuss reducing water loss technology such as rainwater
In some countries, it has been understood for over one
half century that efficiency management of pressures is
the essential foundation of effective leakage management.
However, recognition of this fact is not universal. This is
because water distribution systems are installed to deliver
water to customers at a selected minimum pressure, and
this minimum is not often exceeded with the realization of
the impact on leakage. In some conditions, it has not been
traditional to take pressure into account when compiling
leakage data, comparing performance or setting targets. The
International Water Associations Water Loss Specialist Group
have advanced various techniques over the past few years to
estimate the benefits of pressure reduction and control, and
utilities have taken up the benefits of these practices. In some
systems where pressure management has been introduced,
selection of appropriate control valves and/or adequate
maintenance has not resulted in problems.
The significance of pressure on the leakage from water
supply systems can be traced back to a theory suggested by
Ledochowski in 1956, which has since been adopted by most
water loss practitioners throughout the world and is used to
explain why leakage from some water supply systems is more
1.2.3 Smart Urban Water Efficiency
Figure 1.2 Schematic of greywater reuse on building level (Schuetze and Santiago-Fandino, 2013)
1.2.3.1 Reducing Pipe Losses from Networks : the Fundamental Importance of Pressure Management
harvesting system and greywater reuse (Figure 1.2). The new
and innovative technologies for urban stormwater systems
will introduce stormwater best management practice and/or
low impact development facilities.

Main Focus 1. W
ater Efficiency
the 7th World Water Forum 035034 /
sensitive to pressure than from others. Perhaps the amazing
aspect is that many water utilities still prefer to provide the
maximum pressure, as more pressure equals more water
billed and hence more income. The basis for the theory by
Ledochowski relates pressure not just to bursting pipes, but
also to opening and closing cracks and splits in buried pipes
as the demand for water by customers changes throughout
the day. Different pipe materials tend either to leak through
small holes whereas other leaks occur through joints and
cracks in the supply pipes and the area of the leak tends to
increase as the pressure increases, usually during the night
while customers draw only a very small amount of water.
Metal pipes are prone to corrosion and as such most leaks
from them tend to occur through holes that which are
generally regarded as fixed area leaks. Leakage from plastic
pipes and asbestos cement pipes often occurs through the
joints and splits along the pipe which can almost close up
completely at low pressures but can open up significantly
at high pressures. Such leaks are termed variable area leaks
because of the size of the pipe split varies according to the
pressure; therefore these types of leak change according
to hourly demands that change the pressure. As demand
reduces when communities sleep, then pressure in the
network rises and opens the splits which lose more water
than during the daytime consumption periods.
John May and Allan Lambert advanced this knowledge
through the International Water Association, and developed
prediction methods for water managers and engineers to
estimate the likely savings that can be achieved through
the introduction of better pressure management. Most
pressure-reduction systems appear to have a payback
period of between 3 months and 2 years, making pressure
management one of the most rewarding interventions
that can be made by a water utility; they also have major
environmental benefits that are rarely evaluated.
Pressure management is clearly one of the most important
interventions to be considered when attempting to drive
down water losses from any water supply system. Leakage
is driven by pressure, and while it must be acknowledged
that pressure management is not the answer in every case,
it is often one of the most cost-effective measures to reduce
leakage and wastage that can be considered.
No “one-size fits all solution” exists in pressure management
applications. It is the responsibility of the water supply
manager or water demand specialist to design and specify
a solution for each system that is both sustainable and
financially viable.
Electronic pressure controllers were first introduced in the
early 1980’s. They provided greater control in allowing the
outlet pressure from the pressure reducing valve to be
adjusted in accordance with either time of day or the flow
requirement through the valve. Since then, various additional
enhancements have been developed either through more
sophisticated electronic devices or through numerous
new hydraulic controllers. Each device has its benefits and
limitations, and the problem facing the water manager is
often to select the most appropriate form of control to suit a
specific application.
Water supply systems worldwide are generally designed
to provide water to consumers at some agreed level of
service. This is often defined as a minimum level of pressure
at the critical point which is the point of lowest pressure in
the system. The typical average system pressure is usually
considered to be of the order of 50 meters with a minimum
pressure of around 20 meters. Many uncontrolled water
networks commonly have pressures of 60-90 meters. It is not
unusual to find extremes of 150 meters in undulating hilly
area, far above the desired pressure that customers would
want. A two-story property has ample pressure at 20 meters
to provide excellent flow to showers and other domestic
needs; therefore systems designed to deliver more than this
will eventually create large volumes of water losses.
However, many parts of the world have systems that have
so many leaks that they have to operate on some form of
intermittent supply where water pressure is only provided for
an hour or two every day or in extreme cases every 2-3 days.
When dealing with such systems which are common in many
parts of the world, it is meaningless to discuss the different
forms of advanced pressure control and the main priority
in such cases must be to provide some level of continuous
supply even if at very low pressure. However, the lack of
pressure control in these systems will have been part of the
reason that the system leaks so badly.
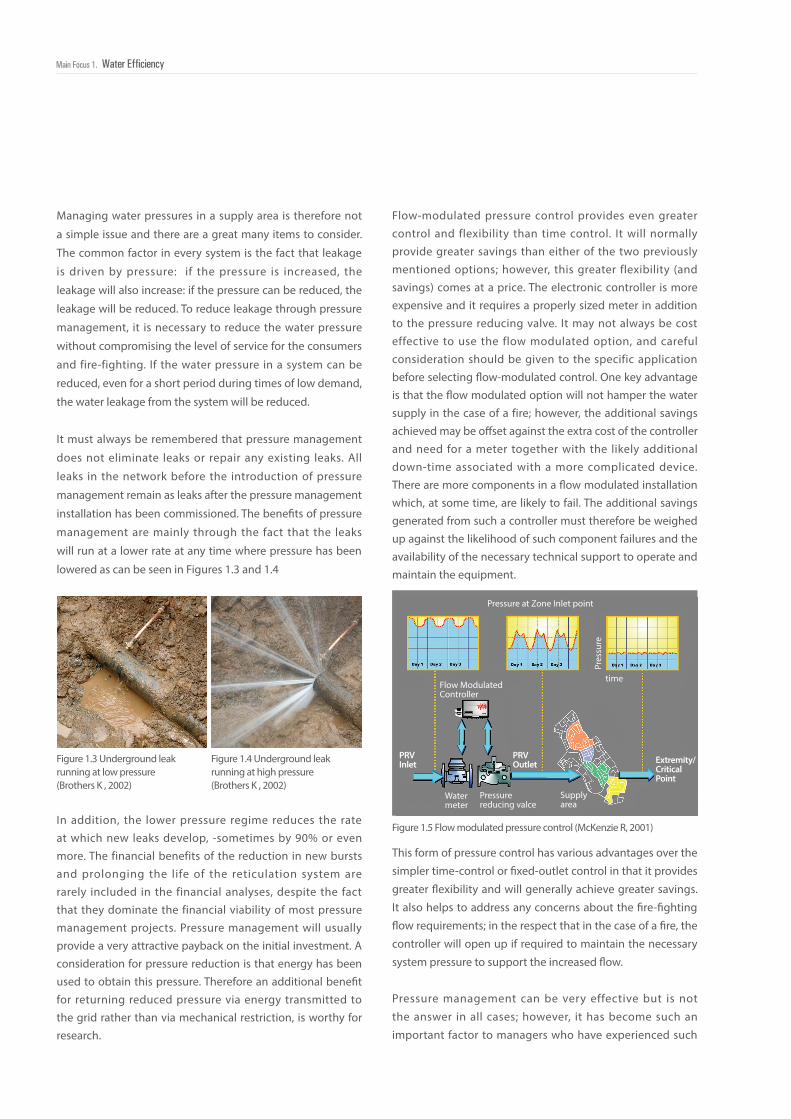
036Main Focus 1. Water Efficiency
Managing water pressures in a supply area is therefore not
a simple issue and there are a great many items to consider.
The common factor in every system is the fact that leakage
is driven by pressure: if the pressure is increased, the
leakage will also increase: if the pressure can be reduced, the
leakage will be reduced. To reduce leakage through pressure
management, it is necessary to reduce the water pressure
without compromising the level of service for the consumers
and fire-fighting. If the water pressure in a system can be
reduced, even for a short period during times of low demand,
the water leakage from the system will be reduced.
It must always be remembered that pressure management
does not eliminate leaks or repair any existing leaks. All
leaks in the network before the introduction of pressure
management remain as leaks after the pressure management
installation has been commissioned. The benefits of pressure
management are mainly through the fact that the leaks
will run at a lower rate at any time where pressure has been
lowered as can be seen in Figures 1.3 and 1.4
In addition, the lower pressure regime reduces the rate at which new leaks develop, -sometimes by 90% or even more. The financial benefits of the reduction in new bursts and prolonging the life of the reticulation system are rarely included in the financial analyses, despite the fact that they dominate the financial viability of most pressure management projects. Pressure management will usually provide a very attractive payback on the initial investment. A consideration for pressure reduction is that energy has been used to obtain this pressure. Therefore an additional benefit for returning reduced pressure via energy transmitted to the grid rather than via mechanical restriction, is worthy for research.
Figure 1.3 Underground leak running at low pressure (Brothers K , 2002)
Figure 1.4 Underground leak running at high pressure(Brothers K , 2002)
Figure 1.5 Flow modulated pressure control (McKenzie R, 2001)
Pressure at Zone Inlet pointPr
essu
re
time
Watermeter
Pressurereducing valce
Supplyarea
PRV Inlet
PRV Outlet
Flow ModulatedController
Extremity/CriticalPoint
This form of pressure control has various advantages over the
simpler time-control or fixed-outlet control in that it provides
greater flexibility and will generally achieve greater savings.
It also helps to address any concerns about the fire-fighting
flow requirements; in the respect that in the case of a fire, the
controller will open up if required to maintain the necessary
system pressure to support the increased flow.
Pressure management can be very effective but is not
the answer in all cases; however, it has become such an
important factor to managers who have experienced such
Flow-modulated pressure control provides even greater control and flexibility than time control. It will normally provide greater savings than either of the two previously mentioned options; however, this greater flexibility (and savings) comes at a price. The electronic controller is more expensive and it requires a properly sized meter in addition to the pressure reducing valve. It may not always be cost effective to use the flow modulated option, and careful consideration should be given to the specific application before selecting flow-modulated control. One key advantage is that the flow modulated option will not hamper the water supply in the case of a fire; however, the additional savings achieved may be offset against the extra cost of the controller and need for a meter together with the likely additional down-time associated with a more complicated device. There are more components in a flow modulated installation which, at some time, are likely to fail. The additional savings generated from such a controller must therefore be weighed up against the likelihood of such component failures and the availability of the necessary technical support to operate and maintain the equipment.
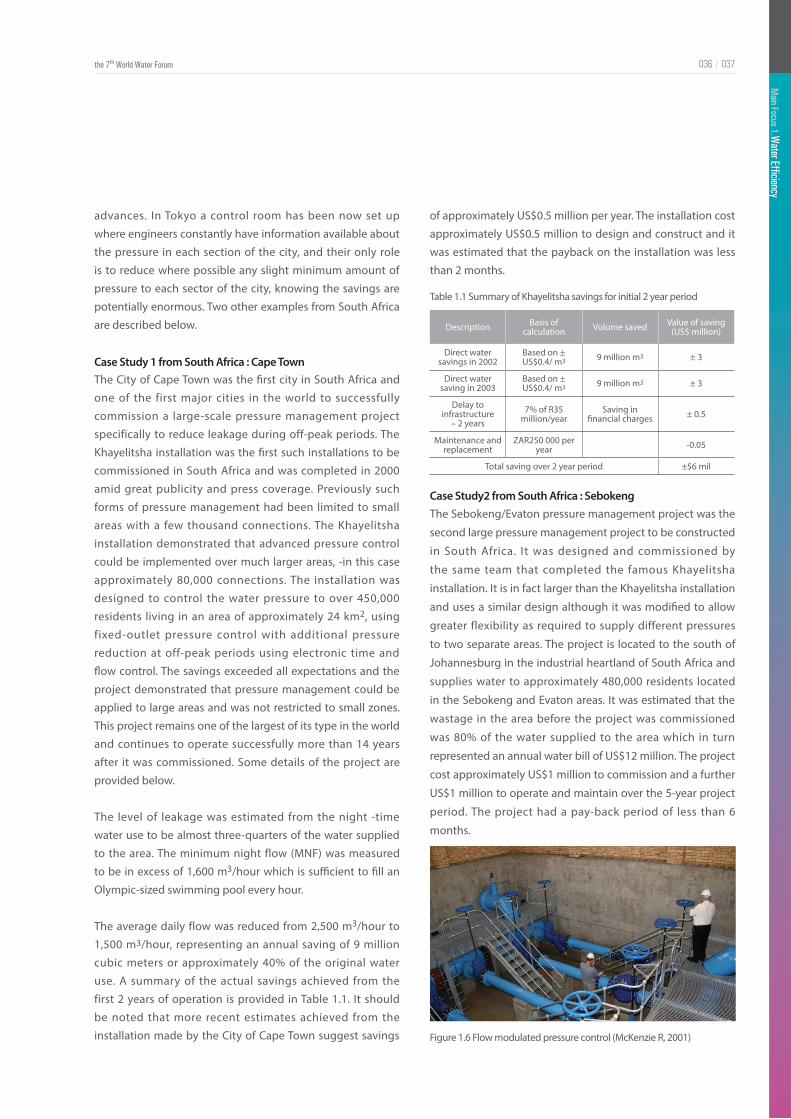
Main Focus 1. W
ater Efficiency
the 7th World Water Forum 037036 /
Table 1.1 Summary of Khayelitsha savings for initial 2 year period
of approximately US$0.5 million per year. The installation cost
approximately US$0.5 million to design and construct and it
was estimated that the payback on the installation was less
than 2 months.
Case Study2 from South Africa : Sebokeng The Sebokeng/Evaton pressure management project was the
second large pressure management project to be constructed
in South Africa. It was designed and commissioned by
the same team that completed the famous Khayelitsha
installation. It is in fact larger than the Khayelitsha installation
and uses a similar design although it was modified to allow
greater flexibility as required to supply different pressures
to two separate areas. The project is located to the south of
Johannesburg in the industrial heartland of South Africa and
supplies water to approximately 480,000 residents located
in the Sebokeng and Evaton areas. It was estimated that the
wastage in the area before the project was commissioned
was 80% of the water supplied to the area which in turn
represented an annual water bill of US$12 million. The project
cost approximately US$1 million to commission and a further
US$1 million to operate and maintain over the 5-year project
period. The project had a pay-back period of less than 6
months.
Description Basis of calculation Volume saved Value of saving
(US$ million)
Direct water savings in 2002
Based on ± US$0.4/ m3 9 million m3 ± 3
Direct water saving in 2003
Based on ± US$0.4/ m3 9 million m3 ± 3
Delay to infrastructure
– 2 years7% of R35
million/yearSaving in
financial charges ± 0.5
Maintenance and replacement
ZAR250 000 per year -0.05
Total saving over 2 year period ±$6 mil
advances. In Tokyo a control room has been now set up
where engineers constantly have information available about
the pressure in each section of the city, and their only role
is to reduce where possible any slight minimum amount of
pressure to each sector of the city, knowing the savings are
potentially enormous. Two other examples from South Africa
are described below.
Case Study 1 from South Africa : Cape TownThe City of Cape Town was the first city in South Africa and
one of the first major cities in the world to successfully
commission a large-scale pressure management project
specifically to reduce leakage during off-peak periods. The
Khayelitsha installation was the first such installations to be
commissioned in South Africa and was completed in 2000
amid great publicity and press coverage. Previously such
forms of pressure management had been limited to small
areas with a few thousand connections. The Khayelitsha
installation demonstrated that advanced pressure control
could be implemented over much larger areas, -in this case
approximately 80,000 connections. The installation was
designed to control the water pressure to over 450,000
residents living in an area of approximately 24 km2, using
fixed-outlet pressure control with additional pressure
reduction at off-peak periods using electronic time and
flow control. The savings exceeded all expectations and the
project demonstrated that pressure management could be
applied to large areas and was not restricted to small zones.
This project remains one of the largest of its type in the world
and continues to operate successfully more than 14 years
after it was commissioned. Some details of the project are
provided below.
The level of leakage was estimated from the night -time
water use to be almost three-quarters of the water supplied
to the area. The minimum night flow (MNF) was measured
to be in excess of 1,600 m3/hour which is sufficient to fill an
Olympic-sized swimming pool every hour.
The average daily flow was reduced from 2,500 m3/hour to
1,500 m3/hour, representing an annual saving of 9 million
cubic meters or approximately 40% of the original water
use. A summary of the actual savings achieved from the
first 2 years of operation is provided in Table 1.1. It should
be noted that more recent estimates achieved from the
installation made by the City of Cape Town suggest savings Figure 1.6 Flow modulated pressure control (McKenzie R, 2001)
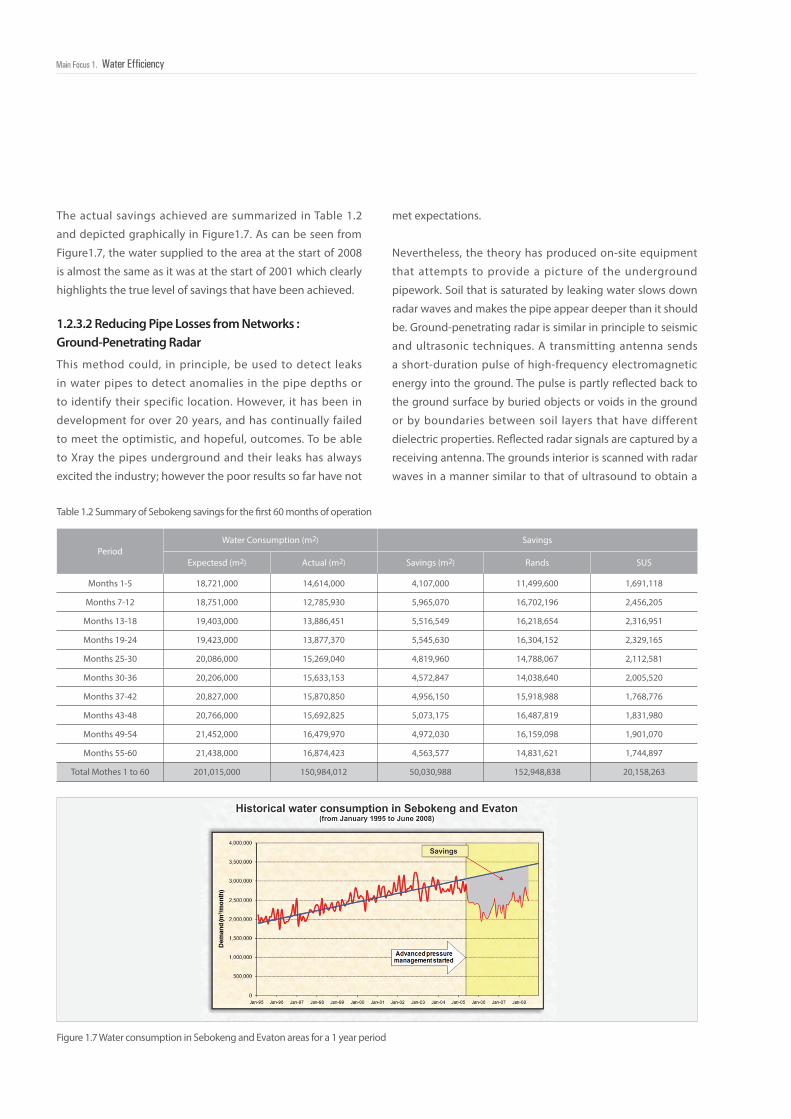
038Main Focus 1. Water Efficiency
Table 1.2 Summary of Sebokeng savings for the first 60 months of operation
This method could, in principle, be used to detect leaks
in water pipes to detect anomalies in the pipe depths or
to identify their specific location. However, it has been in
development for over 20 years, and has continually failed
to meet the optimistic, and hopeful, outcomes. To be able
to Xray the pipes underground and their leaks has always
excited the industry; however the poor results so far have not
Figure 1.7 Water consumption in Sebokeng and Evaton areas for a 1 year period
The actual savings achieved are summarized in Table 1.2
and depicted graphically in Figure1.7. As can be seen from
Figure1.7, the water supplied to the area at the start of 2008
is almost the same as it was at the start of 2001 which clearly
highlights the true level of savings that have been achieved.
1.2.3.2 Reducing Pipe Losses from Networks : Ground-Penetrating Radar
met expectations.
Nevertheless, the theory has produced on-site equipment
that attempts to provide a picture of the underground
pipework. Soil that is saturated by leaking water slows down
radar waves and makes the pipe appear deeper than it should
be. Ground-penetrating radar is similar in principle to seismic
and ultrasonic techniques. A transmitting antenna sends
a short-duration pulse of high-frequency electromagnetic
energy into the ground. The pulse is partly reflected back to
the ground surface by buried objects or voids in the ground
or by boundaries between soil layers that have different
dielectric properties. Reflected radar signals are captured by a
receiving antenna. The grounds interior is scanned with radar
waves in a manner similar to that of ultrasound to obtain a
PeriodWater Consumption (m2) Savings
Expectesd (m2) Actual (m2) Savings (m2) Rands SUS
Months 1-5 18,721,000 14,614,000 4,107,000 11,499,600 1,691,118
Months 7-12 18,751,000 12,785,930 5,965,070 16,702,196 2,456,205
Months 13-18 19,403,000 13,886,451 5,516,549 16,218,654 2,316,951
Months 19-24 19,423,000 13,877,370 5,545,630 16,304,152 2,329,165
Months 25-30 20,086,000 15,269,040 4,819,960 14,788,067 2,112,581
Months 30-36 20,206,000 15,633,153 4,572,847 14,038,640 2,005,520
Months 37-42 20,827,000 15,870,850 4,956,150 15,918,988 1,768,776
Months 43-48 20,766,000 15,692,825 5,073,175 16,487,819 1,831,980
Months 49-54 21,452,000 16,479,970 4,972,030 16,159,098 1,901,070
Months 55-60 21,438,000 16,874,423 4,563,577 14,831,621 1,744,897
Total Mothes 1 to 60 201,015,000 150,984,012 50,030,988 152,948,838 20,158,263
Main Focus 1. W
ater Efficiency
the 7th World Water Forum 039038 /
1.2.3.3 Reducing Pipe Losses from Networks : Thermography
This technique uses thermal infrared radiation and represents
it as visible images. The ground surface above a leak may
seem cooler or warmer than the surface farther away from
it in an infrared radiation image. The differences in the
temperature of leaking water and the overlying soil may
be influenced by this temperature difference; considerable
heat may be transferred between leaking water and surface
soil. Also, soil close to the leak becomes saturated by leaking
water, which may adjust its thermal features and make it a
more active heat sink relative to dry soil away from the leak. A
thermographic examination of an area uses a high-resolution
infrared camera system. The camera should be focused on
the ground surface and should capture images over a period
of time. Several variables such as ambient temperatures of air
and soil, relative humidity, seasonal effects, and others affect
this technique, and it requires sophisticated equipment and
user skill. It is not yet commercially available as an inexpensive,
user-friendly package. However, many experiments have
been performed for many years using infrared photography
from the air. The benefits have been of value only in rural
areas which indicate the ground is not covered by roads and
paths, as the temperature changes do not tend to be shown
in concreate or other construction coverings.
1.2.3.4 Rainwater Harvesting
1.2.3.5 Greywater Reuse
Rainwater harvesting is defined as a technology that is used
for collecting and storing rainwater from rooftops, the land
surface or rock catchments using simple techniques (for
example jars and pots) as well as more complex techniques
(such as underground check dams). Ancient civilizations
within Asia and Africa applied of the techniques and they
can still be used as a major source of drinking water supply in
rural areas. Applied systems are typically composed of three
principal functions: the catchment area, the collection device,
and the conveyance system.
The viability of rainwater harvesting is highly dependent
Greywater is water from bathroom sinks, showers, tubs and washing machines. It may include certain household cleaning products. While greywater may sound “dirty”, it is a harmless and useful source of irrigation water in a yard. If it is discharged into lakes or estuaries, the nutrients in greywater become pollutants. However, they are useful fertilizer for plants. Besides the apparent benefits of saving water, reusing greywater prevents it from entering the sewer or septic system, thereby the reducing the chance that it will pollute local water bodies. Greywater is reused for irrigation by urban residents and in our backyard gardens in the natural hydrological water cycle. The simplest way to use greywater is to connect it to the outside and uses it on garden plants or fruit trees. Also, greywater can be used on vegetables as long as it does not touch edible parts of the plants. It is necessary not to put anything toxic down the drain in any greywater system.
While greywater clearly offers an opportunity to reuse water that would otherwise be discarded, great care must be taken, particularly in hot climates, to ensure that its storage does not become a potential source of bacteria that can result in disease. If a greywater system is not operated and maintained properly, it will fail to provide a safe supply of water for washing and/or irrigation. Anyone proposing to use of greywater must ensure that those who will use it are properly educated on the benefits and pitfalls of such systems to prevent possible contamination of the potable water supply or the spread of disease.
cross-sectional image. If major advances can be made with
this type of technology, then it would be extremely useful
to all water utilities, and be could be used to identify other
buried services such as electrical and telecommunications
cables
on the amount and intensity of rainfall in a specific locality.
Generally, the catchment area and type of catchment
land use can change depending on household demands.
As rainfall distribution is not usually even over the year,
rainwater collection can only provide supplementary
sources for household demands. The feasibility of rainwater
harvesting systems is also a component of: the quantity and
quality of water available from other sources, household size
and per capita water requirements, and budget availability.
The decision-maker has to stabilize the total cost of the
project against the available budget, including the economic
benefit of conserving water provided from other sources. In
the same manner, the cost of physical and environmental
reduction associated with the development of available
alternative sources should be estimated and added to the
economic analysis.
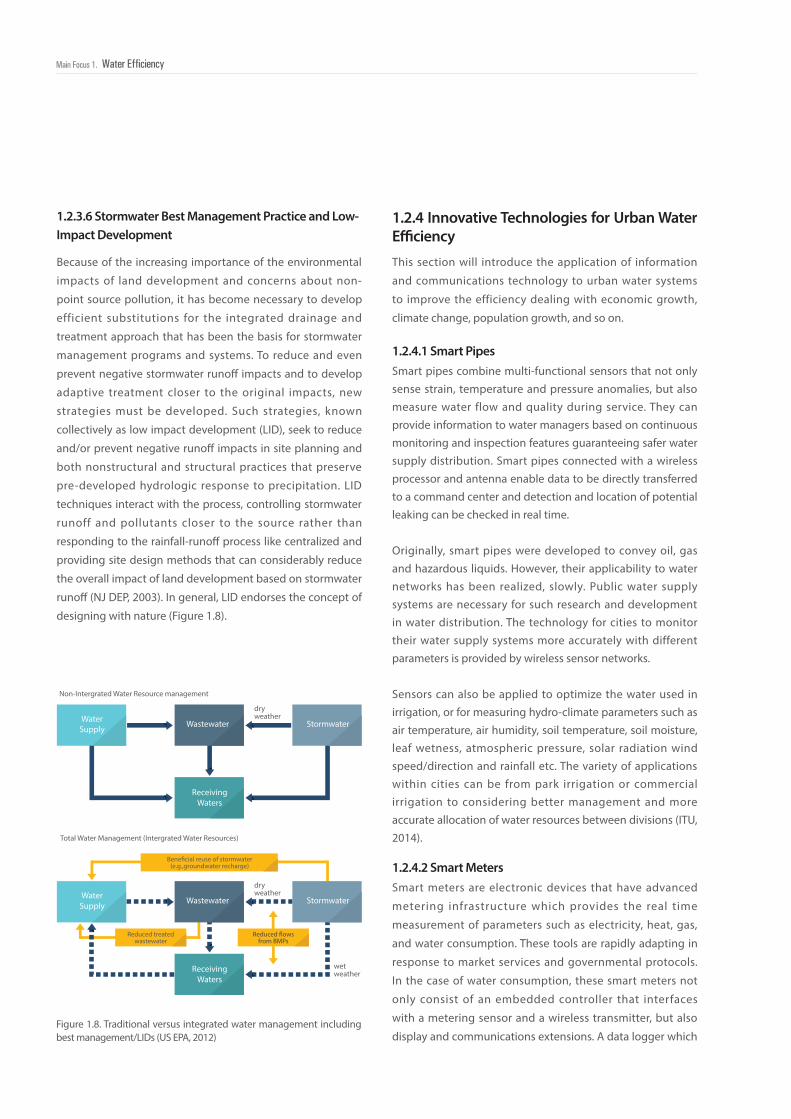
040Main Focus 1. Water Efficiency
Figure 1.8. Traditional versus integrated water management including best management/LIDs (US EPA, 2012)
WaterSupply
Non-Intergrated Water Resource management
dryweather
Wastewater
Bene�cial reuse of stormwater(e.g.,groundwater recharge)
ReceivingWaters
Stormwater
Reduced �owsfrom BMPs
Reduced treatedwastewater
WaterSupply
Total Water Management (Intergrated Water Resources)
dryweather
wetweather
Wastewater
ReceivingWaters
Stormwater
1.2.4 Innovative Technologies for Urban Water Efficiency
1.2.4.1 Smart Pipes
1.2.4.2 Smart Meters
This section will introduce the application of information
and communications technology to urban water systems
to improve the efficiency dealing with economic growth,
climate change, population growth, and so on.
Smart pipes combine multi-functional sensors that not only sense strain, temperature and pressure anomalies, but also measure water flow and quality during service. They can provide information to water managers based on continuous monitoring and inspection features guaranteeing safer water supply distribution. Smart pipes connected with a wireless processor and antenna enable data to be directly transferred to a command center and detection and location of potential leaking can be checked in real time.
Originally, smart pipes were developed to convey oil, gas and hazardous liquids. However, their applicability to water networks has been realized, slowly. Public water supply systems are necessary for such research and development in water distribution. The technology for cities to monitor their water supply systems more accurately with different parameters is provided by wireless sensor networks.
Sensors can also be applied to optimize the water used in irrigation, or for measuring hydro-climate parameters such as air temperature, air humidity, soil temperature, soil moisture, leaf wetness, atmospheric pressure, solar radiation wind speed/direction and rainfall etc. The variety of applications within cities can be from park irrigation or commercial irrigation to considering better management and more accurate allocation of water resources between divisions (ITU, 2014).
Smart meters are electronic devices that have advanced
metering infrastructure which provides the real time
measurement of parameters such as electricity, heat, gas,
and water consumption. These tools are rapidly adapting in
response to market services and governmental protocols.
In the case of water consumption, these smart meters not
only consist of an embedded controller that interfaces
with a metering sensor and a wireless transmitter, but also
display and communications extensions. A data logger which
1.2.3.6 Stormwater Best Management Practice and Low-Impact Development
Because of the increasing importance of the environmental
impacts of land development and concerns about non-
point source pollution, it has become necessary to develop
efficient substitutions for the integrated drainage and
treatment approach that has been the basis for stormwater
management programs and systems. To reduce and even
prevent negative stormwater runoff impacts and to develop
adaptive treatment closer to the original impacts, new
strategies must be developed. Such strategies, known
collectively as low impact development (LID), seek to reduce
and/or prevent negative runoff impacts in site planning and
both nonstructural and structural practices that preserve
pre-developed hydrologic response to precipitation. LID
techniques interact with the process, controlling stormwater
runoff and pollutants closer to the source rather than
responding to the rainfall-runoff process like centralized and
providing site design methods that can considerably reduce
the overall impact of land development based on stormwater
runoff (NJ DEP, 2003). In general, LID endorses the concept of
designing with nature (Figure 1.8).
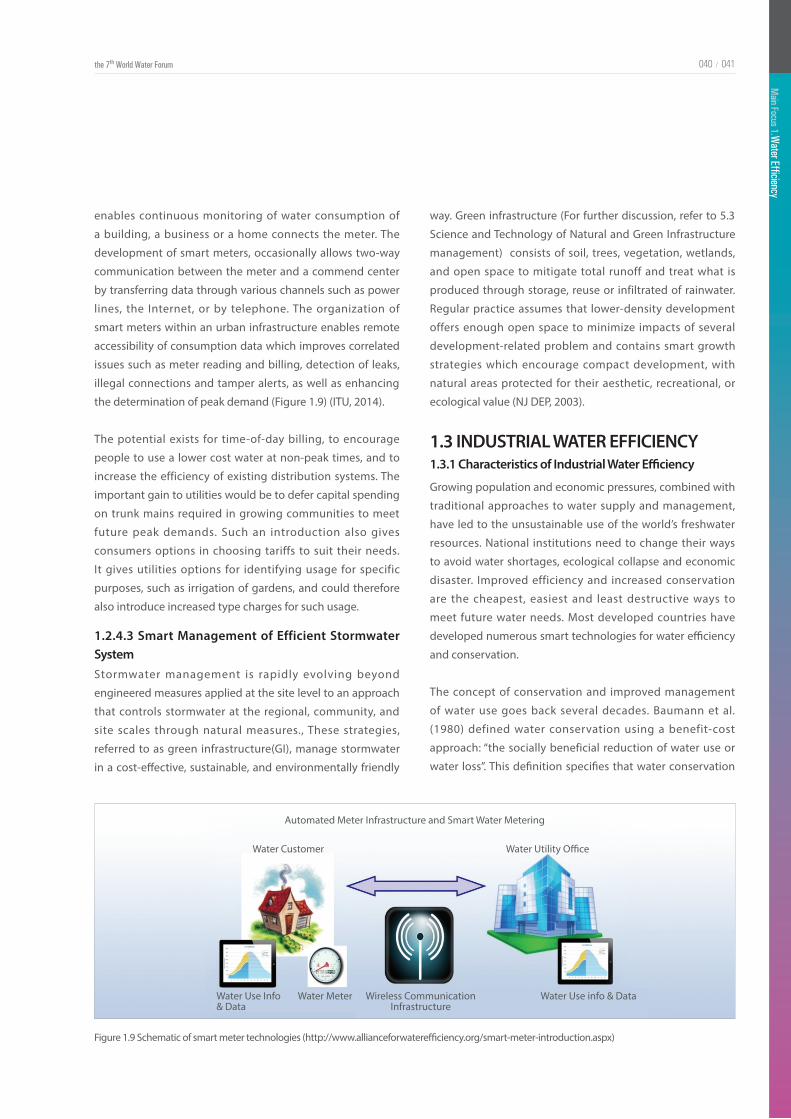
Main Focus 1. W
ater Efficiency
the 7th World Water Forum 041040 /
Figure 1.9 Schematic of smart meter technologies (http://www.allianceforwaterefficiency.org/smart-meter-introduction.aspx)
1.3 INDUSTRIAL WATER EFFICIENCY1.3.1 Characteristics of Industrial Water Efficiency
1.2.4.3 Smart Management of Efficient Stormwater SystemStormwater management is rapidly evolving beyond
engineered measures applied at the site level to an approach
that controls stormwater at the regional, community, and
site scales through natural measures., These strategies,
referred to as green infrastructure(GI), manage stormwater
in a cost-effective, sustainable, and environmentally friendly
Growing population and economic pressures, combined with
traditional approaches to water supply and management,
have led to the unsustainable use of the world’s freshwater
resources. National institutions need to change their ways
to avoid water shortages, ecological collapse and economic
disaster. Improved efficiency and increased conservation
are the cheapest, easiest and least destructive ways to
meet future water needs. Most developed countries have
developed numerous smart technologies for water efficiency
and conservation.
The concept of conservation and improved management
of water use goes back several decades. Baumann et al.
(1980) defined water conservation using a benefit-cost
approach: “the socially beneficial reduction of water use or
water loss”. This definition specifies that water conservation
enables continuous monitoring of water consumption of
a building, a business or a home connects the meter. The
development of smart meters, occasionally allows two-way
communication between the meter and a commend center
by transferring data through various channels such as power
lines, the Internet, or by telephone. The organization of
smart meters within an urban infrastructure enables remote
accessibility of consumption data which improves correlated
issues such as meter reading and billing, detection of leaks,
illegal connections and tamper alerts, as well as enhancing
the determination of peak demand (Figure 1.9) (ITU, 2014).
The potential exists for time-of-day billing, to encourage
people to use a lower cost water at non-peak times, and to
increase the efficiency of existing distribution systems. The
important gain to utilities would be to defer capital spending
on trunk mains required in growing communities to meet
future peak demands. Such an introduction also gives
consumers options in choosing tariffs to suit their needs.
It gives utilities options for identifying usage for specific
purposes, such as irrigation of gardens, and could therefore
also introduce increased type charges for such usage.
way. Green infrastructure (For further discussion, refer to 5.3
Science and Technology of Natural and Green Infrastructure
management) consists of soil, trees, vegetation, wetlands,
and open space to mitigate total runoff and treat what is
produced through storage, reuse or infiltrated of rainwater.
Regular practice assumes that lower-density development
offers enough open space to minimize impacts of several
development-related problem and contains smart growth
strategies which encourage compact development, with
natural areas protected for their aesthetic, recreational, or
ecological value (NJ DEP, 2003).
Automated Meter Infrastructure and Smart Water Metering
Water Customer
Water Use Info & Data
Water Meter Wireless CommunicationInfrastructure
Water Use info & Data
Water Utility Office
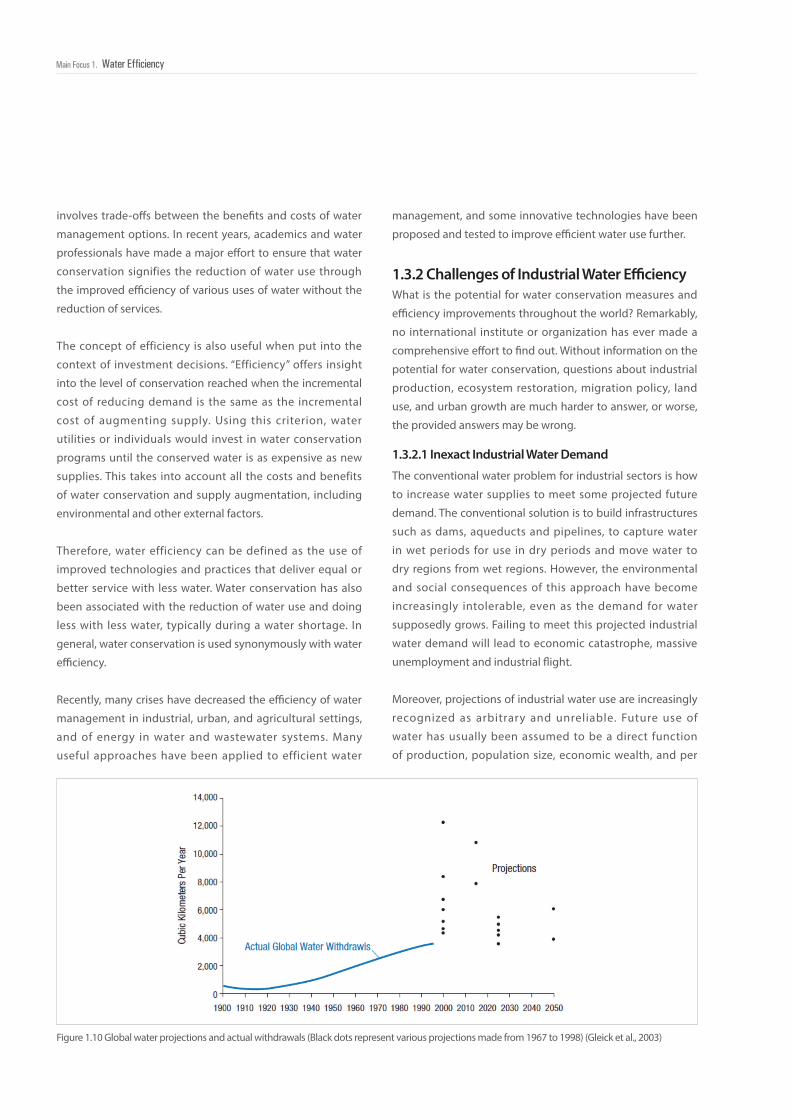
042Main Focus 1. Water Efficiency
1.3.2 Challenges of Industrial Water Efficiency
1.3.2.1 Inexact Industrial Water Demand
What is the potential for water conservation measures and
efficiency improvements throughout the world? Remarkably,
no international institute or organization has ever made a
comprehensive effort to find out. Without information on the
potential for water conservation, questions about industrial
production, ecosystem restoration, migration policy, land
use, and urban growth are much harder to answer, or worse,
the provided answers may be wrong.
The conventional water problem for industrial sectors is how
to increase water supplies to meet some projected future
demand. The conventional solution is to build infrastructures
such as dams, aqueducts and pipelines, to capture water
in wet periods for use in dry periods and move water to
dry regions from wet regions. However, the environmental
and social consequences of this approach have become
increasingly intolerable, even as the demand for water
supposedly grows. Failing to meet this projected industrial
water demand will lead to economic catastrophe, massive
unemployment and industrial flight.
Moreover, projections of industrial water use are increasingly
recognized as arbitrary and unreliable. Future use of
water has usually been assumed to be a direct function
of production, population size, economic wealth, and per
Figure 1.10 Global water projections and actual withdrawals (Black dots represent various projections made from 1967 to 1998) (Gleick et al., 2003)
involves trade-offs between the benefits and costs of water
management options. In recent years, academics and water
professionals have made a major effort to ensure that water
conservation signifies the reduction of water use through
the improved efficiency of various uses of water without the
reduction of services.
The concept of efficiency is also useful when put into the
context of investment decisions. “Efficiency” offers insight
into the level of conservation reached when the incremental
cost of reducing demand is the same as the incremental
cost of augmenting supply. Using this criterion, water
utilities or individuals would invest in water conservation
programs until the conserved water is as expensive as new
supplies. This takes into account all the costs and benefits
of water conservation and supply augmentation, including
environmental and other external factors.
Therefore, water efficiency can be defined as the use of
improved technologies and practices that deliver equal or
better service with less water. Water conservation has also
been associated with the reduction of water use and doing
less with less water, typically during a water shortage. In
general, water conservation is used synonymously with water
efficiency.
Recently, many crises have decreased the efficiency of water
management in industrial, urban, and agricultural settings,
and of energy in water and wastewater systems. Many
useful approaches have been applied to efficient water
management, and some innovative technologies have been
proposed and tested to improve efficient water use further.
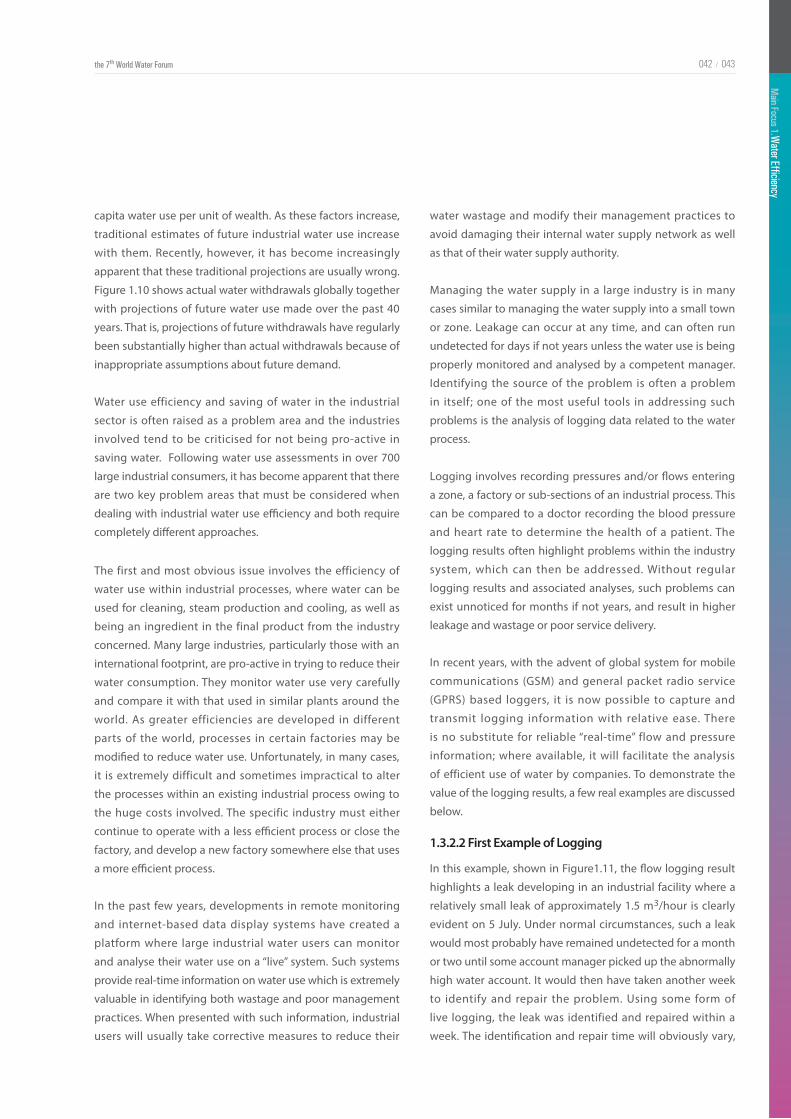
Main Focus 1. W
ater Efficiency
the 7th World Water Forum 043042 /
The first and most obvious issue involves the efficiency of
water use within industrial processes, where water can be
used for cleaning, steam production and cooling, as well as
being an ingredient in the final product from the industry
concerned. Many large industries, particularly those with an
international footprint, are pro-active in trying to reduce their
water consumption. They monitor water use very carefully
and compare it with that used in similar plants around the
world. As greater efficiencies are developed in different
parts of the world, processes in certain factories may be
modified to reduce water use. Unfortunately, in many cases,
it is extremely difficult and sometimes impractical to alter
the processes within an existing industrial process owing to
the huge costs involved. The specific industry must either
continue to operate with a less efficient process or close the
factory, and develop a new factory somewhere else that uses
a more efficient process.
In the past few years, developments in remote monitoring
and internet-based data display systems have created a
platform where large industrial water users can monitor
and analyse their water use on a “live” system. Such systems
provide real-time information on water use which is extremely
valuable in identifying both wastage and poor management
practices. When presented with such information, industrial
users will usually take corrective measures to reduce their
1.3.2.2 First Example of Logging
water wastage and modify their management practices to
avoid damaging their internal water supply network as well
as that of their water supply authority.
Managing the water supply in a large industry is in many
cases similar to managing the water supply into a small town
or zone. Leakage can occur at any time, and can often run
undetected for days if not years unless the water use is being
properly monitored and analysed by a competent manager.
Identifying the source of the problem is often a problem
in itself; one of the most useful tools in addressing such
problems is the analysis of logging data related to the water
process.
Logging involves recording pressures and/or flows entering
a zone, a factory or sub-sections of an industrial process. This
can be compared to a doctor recording the blood pressure
and heart rate to determine the health of a patient. The
logging results often highlight problems within the industry
system, which can then be addressed. Without regular
logging results and associated analyses, such problems can
exist unnoticed for months if not years, and result in higher
leakage and wastage or poor service delivery.
In recent years, with the advent of global system for mobile
communications (GSM) and general packet radio service
(GPRS) based loggers, it is now possible to capture and
transmit logging information with relative ease. There
is no substitute for reliable “real-time” flow and pressure
information; where available, it will facilitate the analysis
of efficient use of water by companies. To demonstrate the
value of the logging results, a few real examples are discussed
below.
In this example, shown in Figure1.11, the flow logging result
highlights a leak developing in an industrial facility where a
relatively small leak of approximately 1.5 m3/hour is clearly
evident on 5 July. Under normal circumstances, such a leak
would most probably have remained undetected for a month
or two until some account manager picked up the abnormally
high water account. It would then have taken another week
to identify and repair the problem. Using some form of
live logging, the leak was identified and repaired within a
week. The identification and repair time will obviously vary,
capita water use per unit of wealth. As these factors increase,
traditional estimates of future industrial water use increase
with them. Recently, however, it has become increasingly
apparent that these traditional projections are usually wrong.
Figure 1.10 shows actual water withdrawals globally together
with projections of future water use made over the past 40
years. That is, projections of future withdrawals have regularly
been substantially higher than actual withdrawals because of
inappropriate assumptions about future demand.
Water use efficiency and saving of water in the industrial
sector is often raised as a problem area and the industries
involved tend to be criticised for not being pro-active in
saving water. Following water use assessments in over 700
large industrial consumers, it has become apparent that there
are two key problem areas that must be considered when
dealing with industrial water use efficiency and both require
completely different approaches.
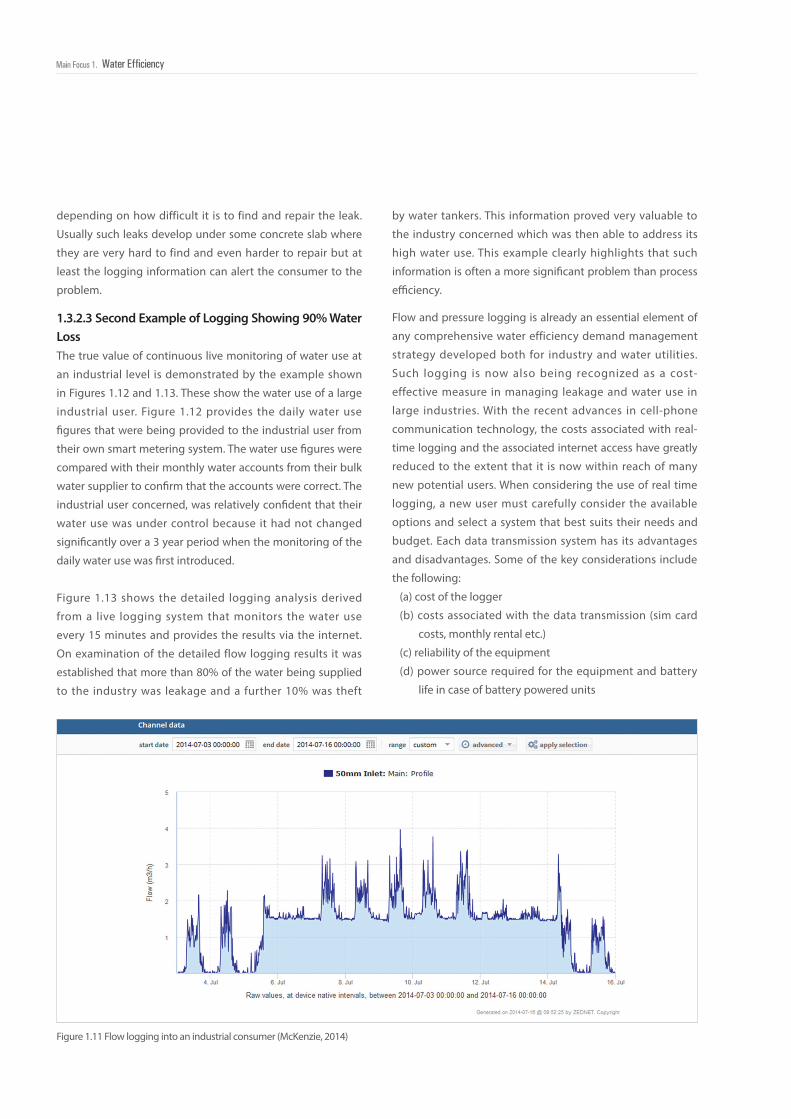
044Main Focus 1. Water Efficiency
Flow and pressure logging is already an essential element of
any comprehensive water efficiency demand management
strategy developed both for industry and water utilities.
Such logging is now also being recognized as a cost-
effective measure in managing leakage and water use in
large industries. With the recent advances in cell-phone
communication technology, the costs associated with real-
time logging and the associated internet access have greatly
reduced to the extent that it is now within reach of many
new potential users. When considering the use of real time
logging, a new user must carefully consider the available
options and select a system that best suits their needs and
budget. Each data transmission system has its advantages
and disadvantages. Some of the key considerations include
the following:
(a) cost of the logger
(b) costs associated with the data transmission (sim card
costs, monthly rental etc.)
(c) reliability of the equipment
(d) power source required for the equipment and battery
life in case of battery powered units
depending on how difficult it is to find and repair the leak.
Usually such leaks develop under some concrete slab where
they are very hard to find and even harder to repair but at
least the logging information can alert the consumer to the
problem.
1.3.2.3 Second Example of Logging Showing 90% Water LossThe true value of continuous live monitoring of water use at
an industrial level is demonstrated by the example shown
in Figures 1.12 and 1.13. These show the water use of a large
industrial user. Figure 1.12 provides the daily water use
figures that were being provided to the industrial user from
their own smart metering system. The water use figures were
compared with their monthly water accounts from their bulk
water supplier to confirm that the accounts were correct. The
industrial user concerned, was relatively confident that their
water use was under control because it had not changed
significantly over a 3 year period when the monitoring of the
daily water use was first introduced.
Figure 1.13 shows the detailed logging analysis derived
from a live logging system that monitors the water use
every 15 minutes and provides the results via the internet.
On examination of the detailed flow logging results it was
established that more than 80% of the water being supplied
to the industry was leakage and a further 10% was theft
Figure 1.11 Flow logging into an industrial consumer (McKenzie, 2014)
by water tankers. This information proved very valuable to
the industry concerned which was then able to address its
high water use. This example clearly highlights that such
information is often a more significant problem than process
efficiency.
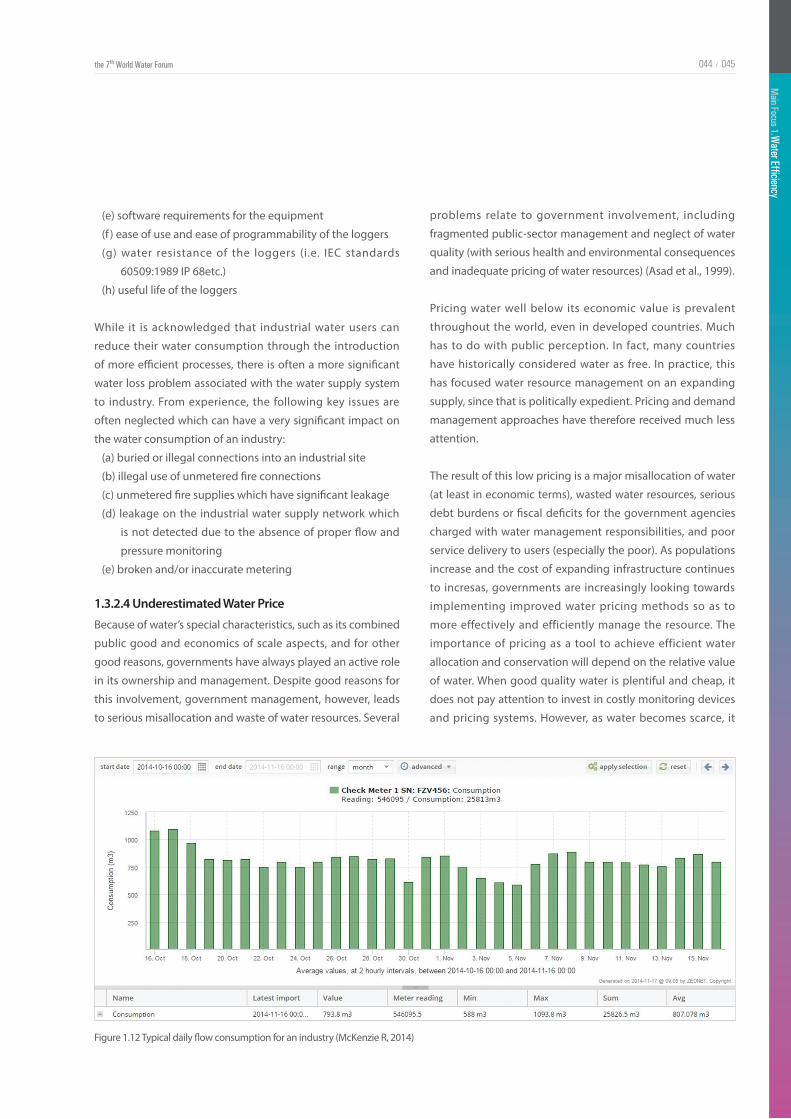
Main Focus 1. W
ater Efficiency
the 7th World Water Forum 045044 /
1.3.2.4 Underestimated Water Price
(e) software requirements for the equipment
(f ) ease of use and ease of programmability of the loggers
(g) water resistance of the loggers (i.e. IEC standards
60509:1989 IP 68etc.)
(h) useful life of the loggers
While it is acknowledged that industrial water users can
reduce their water consumption through the introduction
of more efficient processes, there is often a more significant
water loss problem associated with the water supply system
to industry. From experience, the following key issues are
often neglected which can have a very significant impact on
the water consumption of an industry:
(a) buried or illegal connections into an industrial site
(b) illegal use of unmetered fire connections
(c) unmetered fire supplies which have significant leakage
(d) leakage on the industrial water supply network which
is not detected due to the absence of proper flow and
pressure monitoring
(e) broken and/or inaccurate metering
Because of water’s special characteristics, such as its combined
public good and economics of scale aspects, and for other
good reasons, governments have always played an active role
in its ownership and management. Despite good reasons for
this involvement, government management, however, leads
to serious misallocation and waste of water resources. Several
Figure 1.12 Typical daily flow consumption for an industry (McKenzie R, 2014)
problems relate to government involvement, including
fragmented public-sector management and neglect of water
quality (with serious health and environmental consequences
and inadequate pricing of water resources) (Asad et al., 1999).
Pricing water well below its economic value is prevalent
throughout the world, even in developed countries. Much
has to do with public perception. In fact, many countries
have historically considered water as free. In practice, this
has focused water resource management on an expanding
supply, since that is politically expedient. Pricing and demand
management approaches have therefore received much less
attention.
The result of this low pricing is a major misallocation of water
(at least in economic terms), wasted water resources, serious
debt burdens or fiscal deficits for the government agencies
charged with water management responsibilities, and poor
service delivery to users (especially the poor). As populations
increase and the cost of expanding infrastructure continues
to incresas, governments are increasingly looking towards
implementing improved water pricing methods so as to
more effectively and efficiently manage the resource. The
importance of pricing as a tool to achieve efficient water
allocation and conservation will depend on the relative value
of water. When good quality water is plentiful and cheap, it
does not pay attention to invest in costly monitoring devices
and pricing systems. However, as water becomes scarce, it
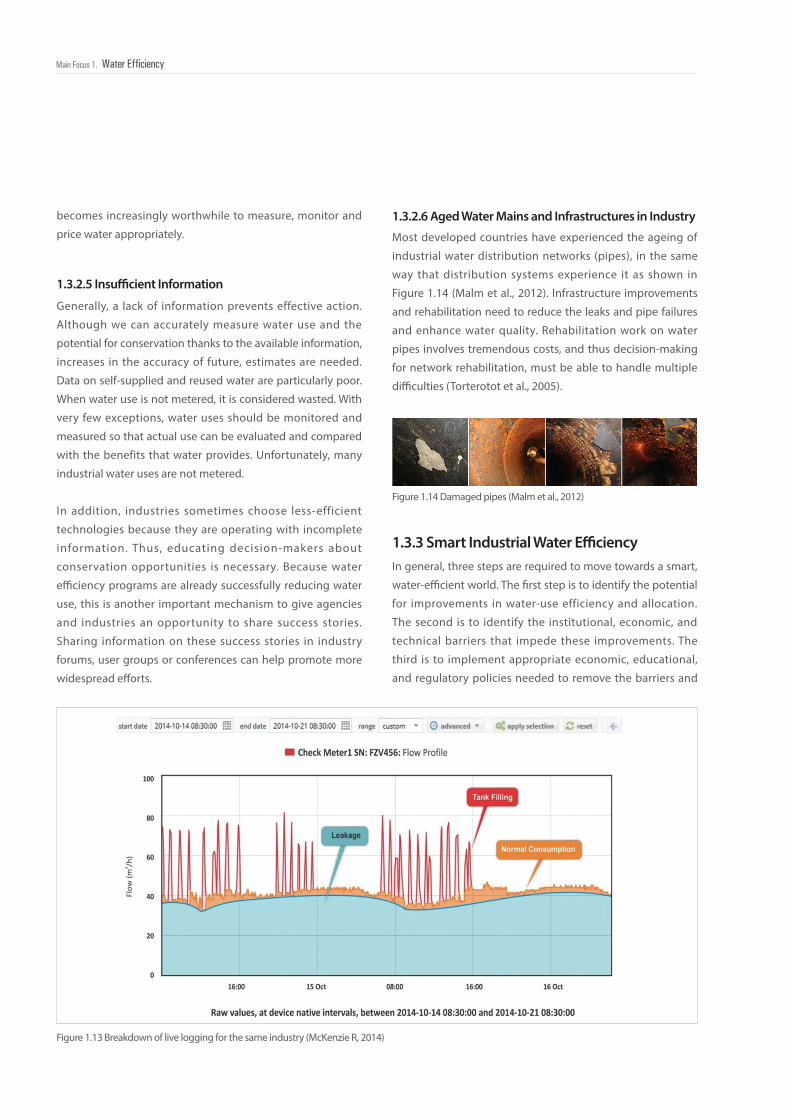
046Main Focus 1. Water Efficiency
1.3.2.5 Insufficient Information
1.3.3 Smart Industrial Water Efficiency
1.3.2.6 Aged Water Mains and Infrastructures in Industry
Generally, a lack of information prevents effective action.
Although we can accurately measure water use and the
potential for conservation thanks to the available information,
increases in the accuracy of future, estimates are needed.
Data on self-supplied and reused water are particularly poor.
When water use is not metered, it is considered wasted. With
very few exceptions, water uses should be monitored and
measured so that actual use can be evaluated and compared
with the benefits that water provides. Unfortunately, many
industrial water uses are not metered.
In addition, industries sometimes choose less-efficient
technologies because they are operating with incomplete
information. Thus, educating decision-makers about
conservation opportunities is necessary. Because water
efficiency programs are already successfully reducing water
use, this is another important mechanism to give agencies
and industries an opportunity to share success stories.
Sharing information on these success stories in industry
forums, user groups or conferences can help promote more
widespread efforts.
Most developed countries have experienced the ageing of
industrial water distribution networks (pipes), in the same
way that distribution systems experience it as shown in
Figure 1.14 (Malm et al., 2012). Infrastructure improvements
and rehabilitation need to reduce the leaks and pipe failures
and enhance water quality. Rehabilitation work on water
pipes involves tremendous costs, and thus decision-making
for network rehabilitation, must be able to handle multiple
difficulties (Torterotot et al., 2005).
In general, three steps are required to move towards a smart,
water-efficient world. The first step is to identify the potential
for improvements in water-use efficiency and allocation.
The second is to identify the institutional, economic, and
technical barriers that impede these improvements. The
third is to implement appropriate economic, educational,
and regulatory policies needed to remove the barriers and
Figure 1.14 Damaged pipes (Malm et al., 2012)
Figure 1.13 Breakdown of live logging for the same industry (McKenzie R, 2014)
becomes increasingly worthwhile to measure, monitor and
price water appropriately.
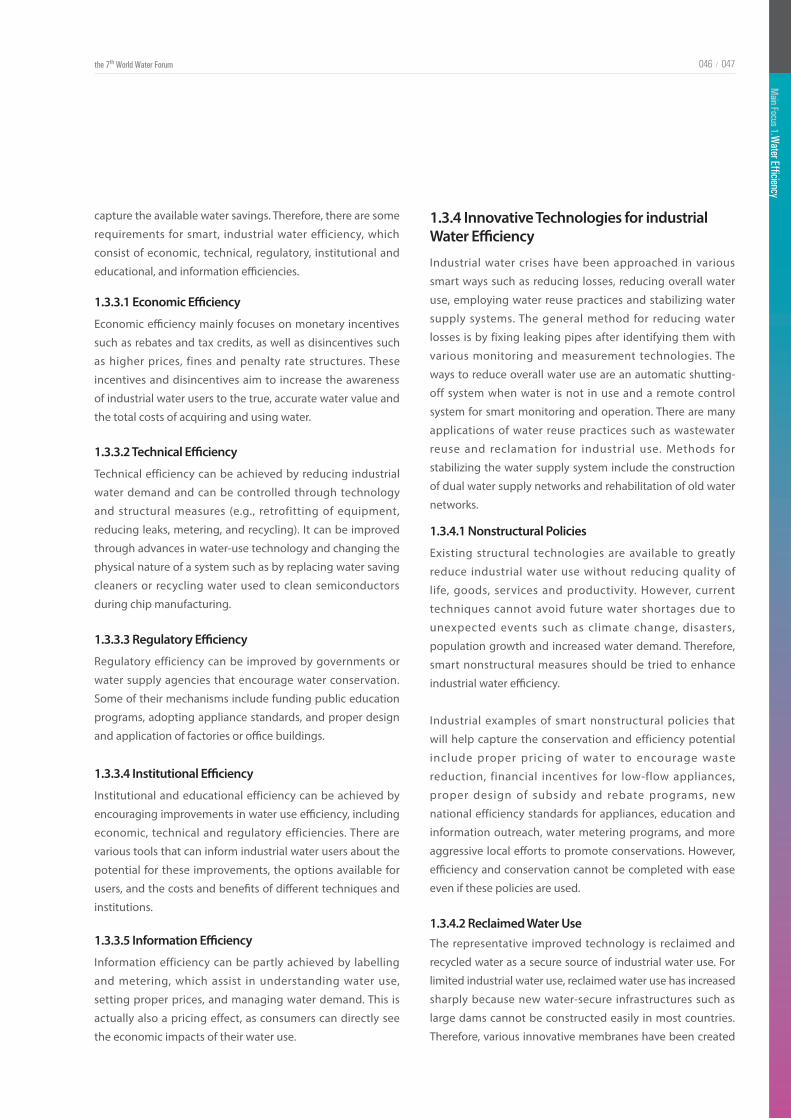
Main Focus 1. W
ater Efficiency
the 7th World Water Forum 047046 /
1.3.3.1 Economic Efficiency
1.3.3.2 Technical Efficiency
Economic efficiency mainly focuses on monetary incentives
such as rebates and tax credits, as well as disincentives such
as higher prices, fines and penalty rate structures. These
incentives and disincentives aim to increase the awareness
of industrial water users to the true, accurate water value and
the total costs of acquiring and using water.
Technical efficiency can be achieved by reducing industrial
water demand and can be controlled through technology
and structural measures (e.g., retrofitting of equipment,
reducing leaks, metering, and recycling). It can be improved
through advances in water-use technology and changing the
physical nature of a system such as by replacing water saving
cleaners or recycling water used to clean semiconductors
during chip manufacturing.
capture the available water savings. Therefore, there are some
requirements for smart, industrial water efficiency, which
consist of economic, technical, regulatory, institutional and
educational, and information efficiencies.
1.3.3.3 Regulatory Efficiency
1.3.3.4 Institutional Efficiency
Regulatory efficiency can be improved by governments or
water supply agencies that encourage water conservation.
Some of their mechanisms include funding public education
programs, adopting appliance standards, and proper design
and application of factories or office buildings.
Institutional and educational efficiency can be achieved by
encouraging improvements in water use efficiency, including
economic, technical and regulatory efficiencies. There are
various tools that can inform industrial water users about the
potential for these improvements, the options available for
users, and the costs and benefits of different techniques and
institutions.
1.3.3.5 Information Efficiency
Information efficiency can be partly achieved by labelling
and metering, which assist in understanding water use,
setting proper prices, and managing water demand. This is
actually also a pricing effect, as consumers can directly see
the economic impacts of their water use.
1.3.4.1 Nonstructural Policies
1.3.4 Innovative Technologies for industrial Water Efficiency
Existing structural technologies are available to greatly
reduce industrial water use without reducing quality of
life, goods, services and productivity. However, current
techniques cannot avoid future water shortages due to
unexpected events such as climate change, disasters,
population growth and increased water demand. Therefore,
smart nonstructural measures should be tried to enhance
industrial water efficiency.
Industrial examples of smart nonstructural policies that
will help capture the conservation and efficiency potential
include proper pricing of water to encourage waste
reduction, financial incentives for low-flow appliances,
proper design of subsidy and rebate programs, new
national efficiency standards for appliances, education and
information outreach, water metering programs, and more
aggressive local efforts to promote conservations. However,
efficiency and conservation cannot be completed with ease
even if these policies are used.
Industrial water crises have been approached in various
smart ways such as reducing losses, reducing overall water
use, employing water reuse practices and stabilizing water
supply systems. The general method for reducing water
losses is by fixing leaking pipes after identifying them with
various monitoring and measurement technologies. The
ways to reduce overall water use are an automatic shutting-
off system when water is not in use and a remote control
system for smart monitoring and operation. There are many
applications of water reuse practices such as wastewater
reuse and reclamation for industrial use. Methods for
stabilizing the water supply system include the construction
of dual water supply networks and rehabilitation of old water
networks.
1.3.4.2 Reclaimed Water UseThe representative improved technology is reclaimed and
recycled water as a secure source of industrial water use. For
limited industrial water use, reclaimed water use has increased
sharply because new water-secure infrastructures such as
large dams cannot be constructed easily in most countries.
Therefore, various innovative membranes have been created
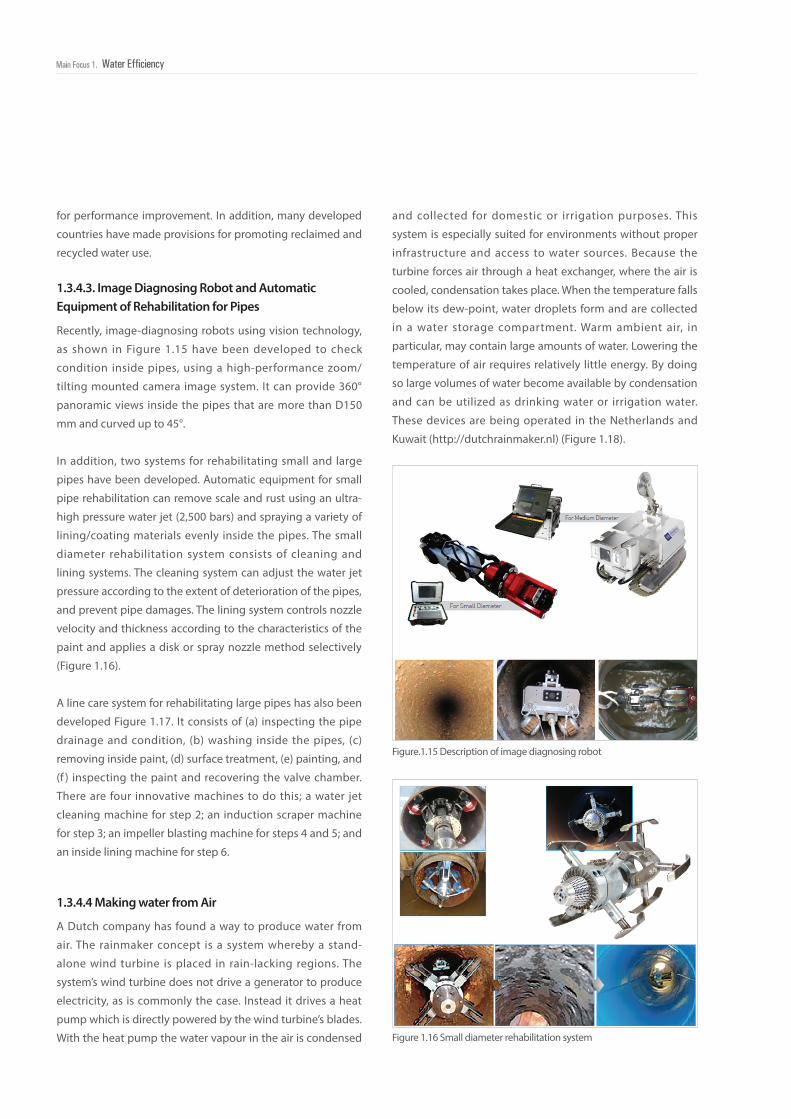
048Main Focus 1. Water Efficiency
1.3.4.3. Image Diagnosing Robot and Automatic Equipment of Rehabilitation for Pipes
Recently, image-diagnosing robots using vision technology,
as shown in Figure 1.15 have been developed to check
condition inside pipes, using a high-performance zoom/
tilting mounted camera image system. It can provide 360°
panoramic views inside the pipes that are more than D150
mm and curved up to 45°.
In addition, two systems for rehabilitating small and large
pipes have been developed. Automatic equipment for small
pipe rehabilitation can remove scale and rust using an ultra-
high pressure water jet (2,500 bars) and spraying a variety of
lining/coating materials evenly inside the pipes. The small
diameter rehabilitation system consists of cleaning and
lining systems. The cleaning system can adjust the water jet
pressure according to the extent of deterioration of the pipes,
and prevent pipe damages. The lining system controls nozzle
velocity and thickness according to the characteristics of the
paint and applies a disk or spray nozzle method selectively
(Figure 1.16).
A line care system for rehabilitating large pipes has also been
developed Figure 1.17. It consists of (a) inspecting the pipe
drainage and condition, (b) washing inside the pipes, (c)
removing inside paint, (d) surface treatment, (e) painting, and
(f ) inspecting the paint and recovering the valve chamber.
There are four innovative machines to do this; a water jet
cleaning machine for step 2; an induction scraper machine
for step 3; an impeller blasting machine for steps 4 and 5; and
an inside lining machine for step 6.
1.3.4.4 Making water from Air
A Dutch company has found a way to produce water from
air. The rainmaker concept is a system whereby a stand-
alone wind turbine is placed in rain-lacking regions. The
system’s wind turbine does not drive a generator to produce
electricity, as is commonly the case. Instead it drives a heat
pump which is directly powered by the wind turbine’s blades.
With the heat pump the water vapour in the air is condensed
Figure.1.15 Description of image diagnosing robot
Figure 1.16 Small diameter rehabilitation system
for performance improvement. In addition, many developed
countries have made provisions for promoting reclaimed and
recycled water use.
and collected for domestic or irrigation purposes. This
system is especially suited for environments without proper
infrastructure and access to water sources. Because the
turbine forces air through a heat exchanger, where the air is
cooled, condensation takes place. When the temperature falls
below its dew-point, water droplets form and are collected
in a water storage compartment. Warm ambient air, in
particular, may contain large amounts of water. Lowering the
temperature of air requires relatively little energy. By doing
so large volumes of water become available by condensation
and can be utilized as drinking water or irrigation water.
These devices are being operated in the Netherlands and
Kuwait (http://dutchrainmaker.nl) (Figure 1.18).
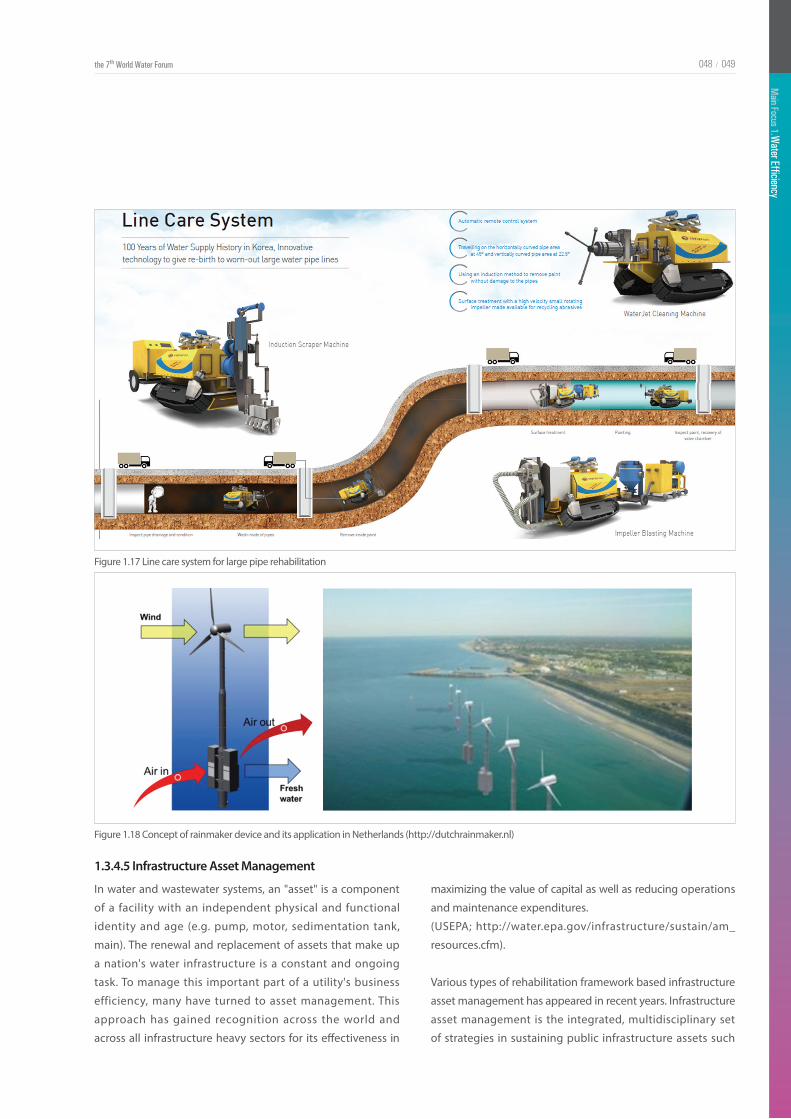
Main Focus 1. W
ater Efficiency
the 7th World Water Forum 049048 /
Figure 1.17 Line care system for large pipe rehabilitation
Figure 1.18 Concept of rainmaker device and its application in Netherlands (http://dutchrainmaker.nl)
1.3.4.5 Infrastructure Asset Management
In water and wastewater systems, an "asset" is a component
of a facility with an independent physical and functional
identity and age (e.g. pump, motor, sedimentation tank,
main). The renewal and replacement of assets that make up
a nation's water infrastructure is a constant and ongoing
task. To manage this important part of a utility's business
efficiency, many have turned to asset management. This
approach has gained recognition across the world and
across all infrastructure heavy sectors for its effectiveness in
maximizing the value of capital as well as reducing operations
and maintenance expenditures.
(USEPA; http://water.epa.gov/infrastructure/sustain/am_
resources.cfm).
Various types of rehabilitation framework based infrastructure
asset management has appeared in recent years. Infrastructure
asset management is the integrated, multidisciplinary set
of strategies in sustaining public infrastructure assets such
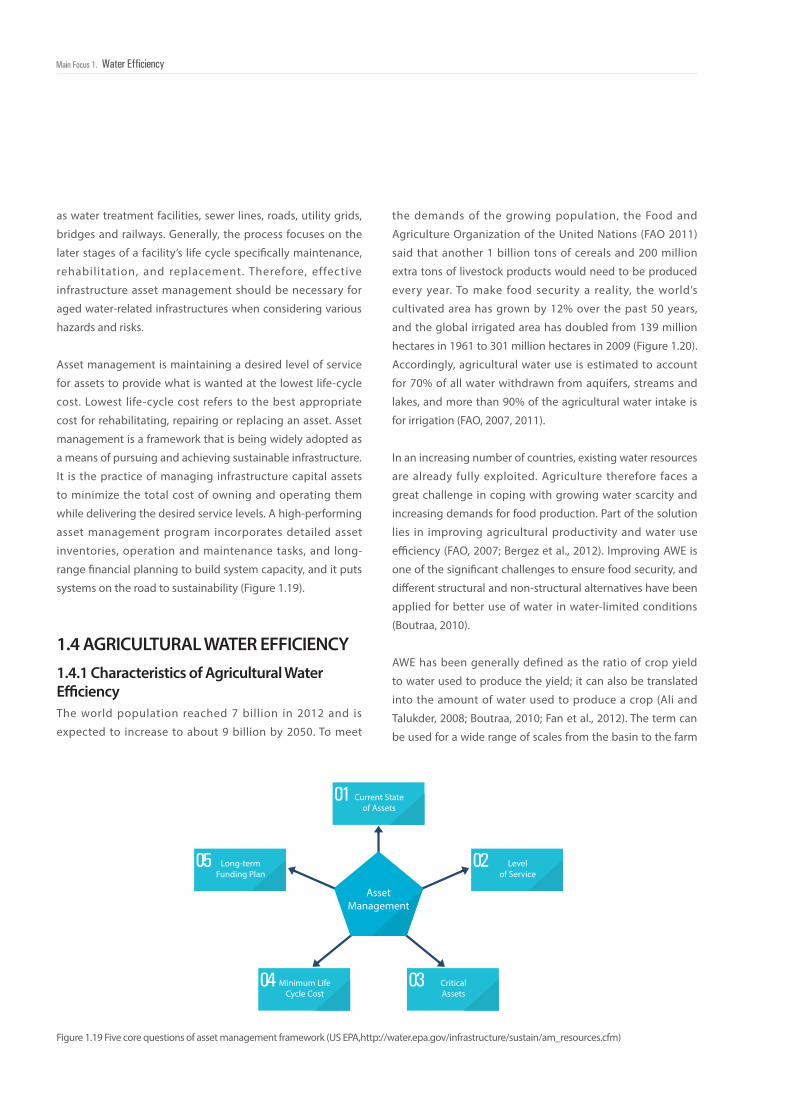
050Main Focus 1. Water Efficiency
1.4.1 Characteristics of Agricultural Water Efficiency
1.4 AGRICULTURAL WATER EFFICIENCY
Figure 1.19 Five core questions of asset management framework (US EPA,http://water.epa.gov/infrastructure/sustain/am_resources.cfm)
The world population reached 7 billion in 2012 and is
expected to increase to about 9 billion by 2050. To meet
Current Stateof Assets
01
Levelof Service
02
CriticalAssets
03Minimum LifeCycle Cost
04
Long-termFunding Plan
05
AssetManagement
as water treatment facilities, sewer lines, roads, utility grids,
bridges and railways. Generally, the process focuses on the
later stages of a facility’s life cycle specifically maintenance,
rehabilitation, and replacement. Therefore, effective
infrastructure asset management should be necessary for
aged water-related infrastructures when considering various
hazards and risks.
Asset management is maintaining a desired level of service
for assets to provide what is wanted at the lowest life-cycle
cost. Lowest life-cycle cost refers to the best appropriate
cost for rehabilitating, repairing or replacing an asset. Asset
management is a framework that is being widely adopted as
a means of pursuing and achieving sustainable infrastructure.
It is the practice of managing infrastructure capital assets
to minimize the total cost of owning and operating them
while delivering the desired service levels. A high-performing
asset management program incorporates detailed asset
inventories, operation and maintenance tasks, and long-
range financial planning to build system capacity, and it puts
systems on the road to sustainability (Figure 1.19).
the demands of the growing population, the Food and
Agriculture Organization of the United Nations (FAO 2011)
said that another 1 billion tons of cereals and 200 million
extra tons of livestock products would need to be produced
every year. To make food security a reality, the world’s
cultivated area has grown by 12% over the past 50 years,
and the global irrigated area has doubled from 139 million
hectares in 1961 to 301 million hectares in 2009 (Figure 1.20).
Accordingly, agricultural water use is estimated to account
for 70% of all water withdrawn from aquifers, streams and
lakes, and more than 90% of the agricultural water intake is
for irrigation (FAO, 2007, 2011).
In an increasing number of countries, existing water resources
are already fully exploited. Agriculture therefore faces a
great challenge in coping with growing water scarcity and
increasing demands for food production. Part of the solution
lies in improving agricultural productivity and water use
efficiency (FAO, 2007; Bergez et al., 2012). Improving AWE is
one of the significant challenges to ensure food security, and
different structural and non-structural alternatives have been
applied for better use of water in water-limited conditions
(Boutraa, 2010).
AWE has been generally defined as the ratio of crop yield
to water used to produce the yield; it can also be translated
into the amount of water used to produce a crop (Ali and
Talukder, 2008; Boutraa, 2010; Fan et al., 2012). The term can
be used for a wide range of scales from the basin to the farm

Main Focus 1. W
ater Efficiency
the 7th World Water Forum 051050 /
Figure 1.20 Evolution of land under irrigated and rainfed cropping (1961-2008) (FAO, 2010b)
1.4.2 Challenges of Agricultural Water Efficiency1.4.2.1 Adaptation to Climate ChangeClimate change is expected to alter the patterns of temperature,
precipitation, and river flows upon which agricultural systems
depend. In the future, weather patterns will become more
uncertain and the frequency of extreme climate events,
such as typhoons and droughts, will increase. This could
make existing water problems even worse in many regions
(Benito et al., 2009). For example, the percentage of global
or to the level of plant part. Different similar terms are in use,
as follows:
(a) Water productivity. This represents the ratio of above-
ground biomass per unit of water transpired by the
crop (Steduto, 2007). Water productivity is often used
with AWE interchangeably but has different meanings.
AWE interests mainly the water districts or management
agencies, while water productivity interests more
farmers and research community (Levidow et al., 2014).
(b) Irrigation efficiency. Irrigation engineers have another
term for AWE: irrigation efficiency. This is expressed
as the ratio of water beneficially used to total water
applied. Sinclair et al. (1984) specifically defined it as the
ratio of biomass per unit of irrigation water used, i.e. the
sum of transpiration by the crop and evaporation from
the soil. There are more than 30 different definitions
of irrigation efficiency currently used (Edkins, 2006).
Irrigation efficiency focuses on the amount of water
released from a water source to ensure beneficial uses
(Jensen, 2007). It provides a measure of how well the
system handles or uses this water, is able to convey it
without ‘waste’ (efficiency component) and convert it
to productive use (efficacy component) (Halsema and
Vincent, 2012).
(c) Water conservation. California DWR (2012) used the
term “water conservation”, defined as the efficient
management of water resources for beneficial uses,
preventing waste or accomplishing additional benefits
with the same amount of water. Water conservation
measures are means of reducing water diverted or
delivered to meet crop water requirements or other
beneficial uses.
AWE is still very low in most developing countries owing
to poor irrigation management and lack of investment in
infrastructure (Fan et al., 2012). Even in developed countries,
most irrigation systems perform below their original capacity
and are not adapted to the needs of today’s agriculture,
which faces unfavorable changes in circumstances. So, more
supportive investment in innovative water-efficient devices
and management technologies is required, which is expected
to contribute water security in the agricultural sector as a
core component of balancing water supply and demand in
the future (Benito et al., 2009).
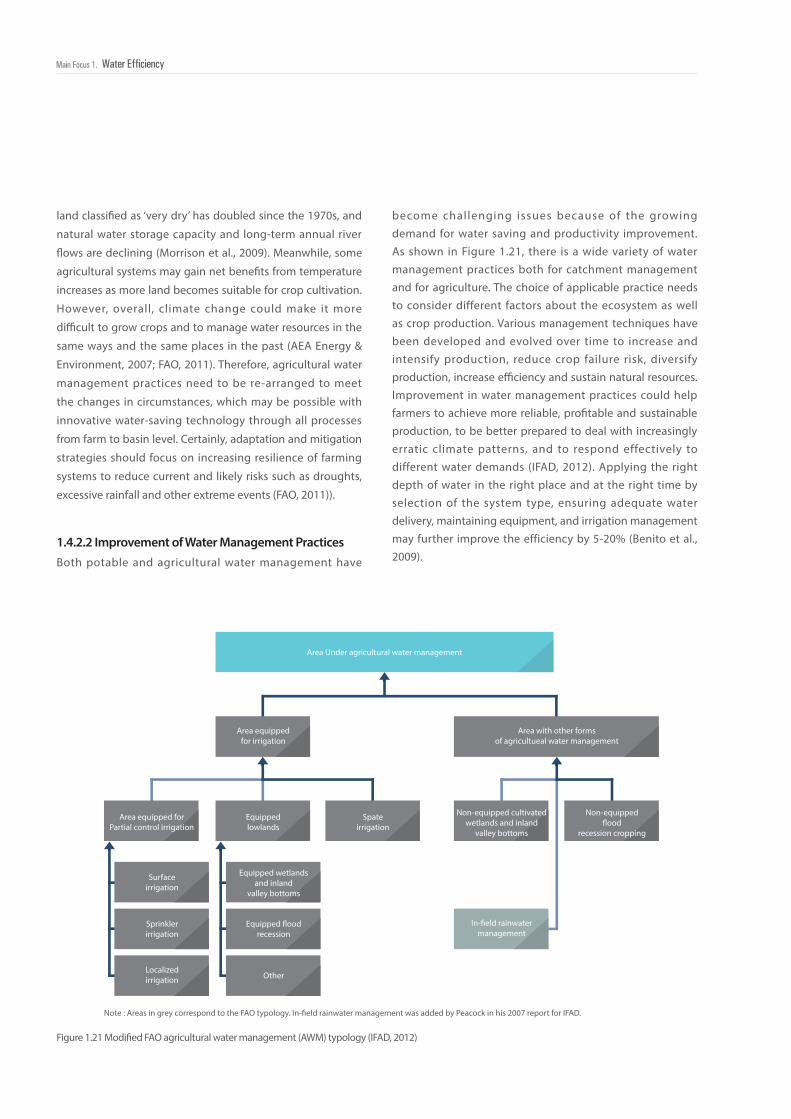
052Main Focus 1. Water Efficiency
Figure 1.21 Modified FAO agricultural water management (AWM) typology (IFAD, 2012)
1.4.2.2 Improvement of Water Management PracticesBoth potable and agricultural water management have
Area Under agricultural water management
Area equippedfor irrigation
Equippedlowlands
Area equipped forPartial control irrigation
Surfaceirrigation
Sprinklerirrigation
Localizedirrigation
Equipped wetlandsand inland
valley bottoms
Equipped �oodrecession
Other
Spateirrigation
Non-equipped cultivatedwetlands and inland
valley bottoms
In-�eld rainwatermanagement
Area with other formsof agricultueal water management
Note : Areas in grey correspond to the FAO typology. In-�eld rainwater management was added by Peacock in his 2007 report for IFAD.
Non-equipped�ood
recession cropping
land classified as ‘very dry’ has doubled since the 1970s, and
natural water storage capacity and long-term annual river
flows are declining (Morrison et al., 2009). Meanwhile, some
agricultural systems may gain net benefits from temperature
increases as more land becomes suitable for crop cultivation.
However, overall, climate change could make it more
difficult to grow crops and to manage water resources in the
same ways and the same places in the past (AEA Energy &
Environment, 2007; FAO, 2011). Therefore, agricultural water
management practices need to be re-arranged to meet
the changes in circumstances, which may be possible with
innovative water-saving technology through all processes
from farm to basin level. Certainly, adaptation and mitigation
strategies should focus on increasing resilience of farming
systems to reduce current and likely risks such as droughts,
excessive rainfall and other extreme events (FAO, 2011)).
become challenging issues because of the growing demand for water saving and productivity improvement. As shown in Figure 1.21, there is a wide variety of water management practices both for catchment management and for agriculture. The choice of applicable practice needs to consider different factors about the ecosystem as well as crop production. Various management techniques have been developed and evolved over time to increase and intensify production, reduce crop failure risk, diversify production, increase efficiency and sustain natural resources. Improvement in water management practices could help farmers to achieve more reliable, profitable and sustainable production, to be better prepared to deal with increasingly erratic climate patterns, and to respond effectively to different water demands (IFAD, 2012). Applying the right depth of water in the right place and at the right time by selection of the system type, ensuring adequate water delivery, maintaining equipment, and irrigation management may further improve the efficiency by 5-20% (Benito et al., 2009).
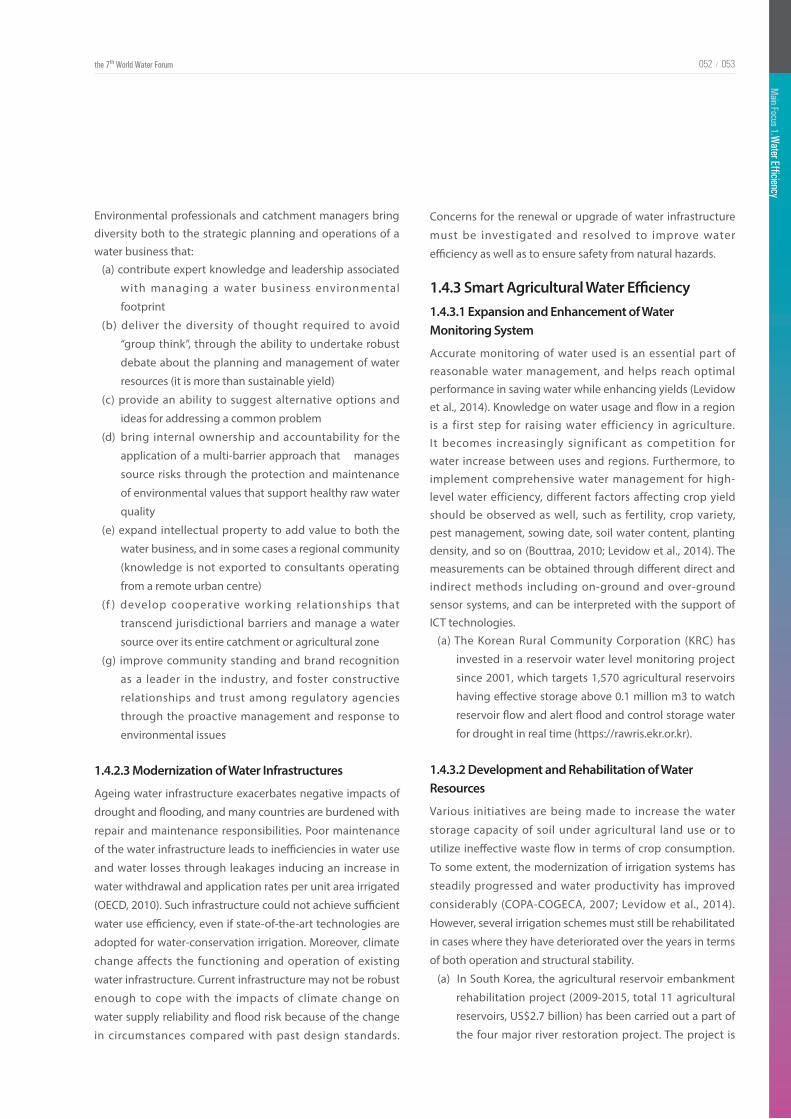
Main Focus 1. W
ater Efficiency
the 7th World Water Forum 053052 /
1.4.2.3 Modernization of Water Infrastructures
1.4.3 Smart Agricultural Water Efficiency1.4.3.1 Expansion and Enhancement of Water Monitoring System
Ageing water infrastructure exacerbates negative impacts of
drought and flooding, and many countries are burdened with
repair and maintenance responsibilities. Poor maintenance
of the water infrastructure leads to inefficiencies in water use
and water losses through leakages inducing an increase in
water withdrawal and application rates per unit area irrigated
(OECD, 2010). Such infrastructure could not achieve sufficient
water use efficiency, even if state-of-the-art technologies are
adopted for water-conservation irrigation. Moreover, climate
change affects the functioning and operation of existing
water infrastructure. Current infrastructure may not be robust
enough to cope with the impacts of climate change on
water supply reliability and flood risk because of the change
in circumstances compared with past design standards.
Environmental professionals and catchment managers bring diversity both to the strategic planning and operations of a water business that:
(a) contribute expert knowledge and leadership associated
with managing a water business environmental
footprint
(b) deliver the diversity of thought required to avoid
“group think”, through the ability to undertake robust
debate about the planning and management of water
resources (it is more than sustainable yield)
(c) provide an ability to suggest alternative options and
ideas for addressing a common problem
(d) bring internal ownership and accountability for the
application of a multi-barrier approach that manages
source risks through the protection and maintenance
of environmental values that support healthy raw water
quality
(e) expand intellectual property to add value to both the
water business, and in some cases a regional community
(knowledge is not exported to consultants operating
from a remote urban centre)
(f ) develop cooperative working relationships that
transcend jurisdictional barriers and manage a water
source over its entire catchment or agricultural zone
(g) improve community standing and brand recognition
as a leader in the industry, and foster constructive
relationships and trust among regulatory agencies
through the proactive management and response to
environmental issues
1.4.3.2 Development and Rehabilitation of Water Resources
Accurate monitoring of water used is an essential part of reasonable water management, and helps reach optimal performance in saving water while enhancing yields (Levidow et al., 2014). Knowledge on water usage and flow in a region is a first step for raising water efficiency in agriculture. It becomes increasingly significant as competition for water increase between uses and regions. Furthermore, to implement comprehensive water management for high-level water efficiency, different factors affecting crop yield should be observed as well, such as fertility, crop variety, pest management, sowing date, soil water content, planting density, and so on (Bouttraa, 2010; Levidow et al., 2014). The measurements can be obtained through different direct and indirect methods including on-ground and over-ground sensor systems, and can be interpreted with the support of ICT technologies.
(a) The Korean Rural Community Corporation (KRC) has
invested in a reservoir water level monitoring project
since 2001, which targets 1,570 agricultural reservoirs
having effective storage above 0.1 million m3 to watch
reservoir flow and alert flood and control storage water
for drought in real time (https://rawris.ekr.or.kr).
Various initiatives are being made to increase the water
storage capacity of soil under agricultural land use or to
utilize ineffective waste flow in terms of crop consumption.
To some extent, the modernization of irrigation systems has
steadily progressed and water productivity has improved
considerably (COPA-COGECA, 2007; Levidow et al., 2014).
However, several irrigation schemes must still be rehabilitated
in cases where they have deteriorated over the years in terms
of both operation and structural stability.
(a) In South Korea, the agricultural reservoir embankment
rehabilitation project (2009-2015, total 11 agricultural
reservoirs, US$2.7 billion) has been carried out a part of
the four major river restoration project. The project is
Concerns for the renewal or upgrade of water infrastructure
must be investigated and resolved to improve water
efficiency as well as to ensure safety from natural hazards.

054Main Focus 1. Water Efficiency
consider investments in more efficient irrigation systems.
The use of new technologies (e.g., soil moisture and canopy
sensors) can be considered to match the water supplied with
the crop water requirements. Careful consideration must be
given to the use of appropriate agricultural practices, such as
conservation tillage, management of soil fertility and water
retention capacity, and irrigation management to reduce
losses (Levidow et al., 2014). The European Commission
also emphasized technological innovation in the field of
water, given that water efficiency will be an increasingly
important factor for competitiveness (CEC, 2008). Within just
the member states of the European Union, the water saving
potential from irrigation is expected to be up to 43% of the
current volume abstracted by new technology and water
management systems (Benito et al., 2009).
Water conservation and water use efficiency may result in
water savings and/or co-benefits including improved water
quality, energy savings and emission reduction of greenhouse
gases. The water saved can be used to meet agricultural,
urban and environmental water demands. Applied irrigation
water that becomes surface tail water or deep percolation
Figure 1.22 Intelligent water management system (TM/TC) applied to Yeong-San River, South Korea
still in progress to secure flood and drought prevention
including stream management flow. The KRC is
expected to secure total 0.28 billion tons of additional
water.
1.4.3.3 Enhancement of Water management Technology
A combination of improved irrigation scheme management,
investment in modern technology, knowledge development
and training can substantially increase water use efficiency
and improve supply to the often poorly-benefited users
(FAO, 2011). AWE gains are possible through suitable crop
selection, proper irrigation scheduling, effective irrigation
techniques, and using alternative sources of water for
irrigation. Highly-efficient irrigation involves fine-turning
the time and amount of water applied to crops based on the
water content in the crop root zone, the amount of water
consumed by the crop since it was last irrigated, and the
stage of crop development. It is essential to plan for irrigation
properly and match the amount of water provided to a
crop's water needs,- both for yield optimization and for water
efficiency (Levidow et al., 2014). To achieve this, it is necessary
to enhance the water management technology and carefully
Main Focus 1. W
ater Efficiency
the 7th World Water Forum 055054 /
1.4.3.4 Development of ICT Applications 1.5 ENERGY EFFICIENCY IN WATER AND WASTEWATER SYSTEMS1.5.1 Characteristics of Energy Efficiency in Water and Wastewater Systems
Water management is complex because it concerns different
spatial and temporal scales and multiple stakeholders with
varying goals. Information on the temporal and spatial
variability of environmental parameters, their impact on soil,
crop, water and other components of farming all play a major
role in formulating farmers’ strategies. Today, farmers and
water-related stakeholders can utilize the convergence of
several technologies including in-field sensors, geographic
information systems (GIS), remote sensing, crop and water
simulation models, prediction of climate and advanced
information processing and wire/wireless communications
(Panchard et al., 2006). Information systems can contribute
to inform decisions about water management allocation. At
the strategic planning level, they enable optimized planning
of irrigation infrastructures assist planning decisions in the
face of increasing climatic variability. At tactical level, they
can be applied for identifying the optimal allocation of
water for a given period (season or year). At the operational
decision-making level, they can contribute to optimizing
water distribution at the farm level by providing technical
information and advice, and offering farmers educational
programs on best practices to adopt (OECD, 2010).
People have been trying to identify reliable methods and
provide recommendations on appropriate equipment for
accounting and measuring used water resources as well as
Water and energy resources are essential to economic growth and public welfare. Water and wastewater treatment systems are among the most energy-intensive facilities owned and operated by local government or public services in most countries. Energy is needed to extract, treat and convey water and wastewater. For decades, the energy consumption by the water and wastewater sector has considerably increased as a result of implementation of new technologies and approaches to safeguard water quality and to meet new regulations.
This section describes water energy efficiency in the water and wastewater sectors. The practice of water and wastewater systems requires new energy management strategies and solutions which need to improve energy efficiency and to be innovative, cost-effective and environmentally friendly.
A membrane as applied to water and wastewater treatment is simply a material that allows some physical, chemical or biological components to pass more readily through it than others. The degree of selectivity depends on the membrane pore size. The coarsest membrane, associated
produced, distributed, consumptive use and return flow
water volumes. Technological developments in respect
of irrigation will encompass sensors and communication,
intelligent watering systems and high-efficiency delivery
mechanisms for water and nutrients, as well as the means of
incorporating all of these elements into irrigation packages
(EIO, 2011; Levidow et al., 2014). In practice, innovative
irrigation practices to enhance water efficiency, gaining an
economic advantage while also reducing environmental
burdens can be hardly implemented without an ICT basis.
Farmers generally lack adequate means and incentives to
know the water use of crops, actual irrigation applications,
the yield response of crops to different water management
practices, and thus current on-farm water efficiency levels
(Levidow et al., 2014). However pumping costs, being the
highest component of total water costs can be the key driver
for change and on-site alterations.
that is recoverable may be used by other farmers, cities or
the environment. However, being more efficient in some
circumstances may mean more costs and more energy use.
So, third-party impacts should not be disregarded before
mandating any significant water conservation or efficiency
measures (California DWR, 2012).
(a) The Korean government has already made progress
in updating and modernizing irrigation practices
and technology, and more advancement is expected
through ICT development. For example, a TM/TC
(tele-metering and tele-control) project has been
realized since 2001 to watch floods and manage
drought in irrigation districts by using information and
communications technology (ICT)-based monitoring
and control technology. The project will be continue
until 2021 with a total spend of US$0.5 billion. So far, it
has been completed in 37 irrigation districts (Figure 1.22).
056Main Focus 1. Water Efficiency
1.5.2 Challenges of Energy Efficiency in Water Treatment and Supply
1.5.2.1 Energy of Water Management
1.5.2.2 Energy Efficiency for Water Supply and Distribution
with microfiltration (MF), can reject particulate matter and retain bacteria. A tighter ultrafiltration membrane can also reject viruses. An even tighter nanofiltration membrane is more selective than reverse osmosis, rejecting a high amount of bulk organic matter and many micro-pollutant, while the tightest/least selective reverse osmosis can also reject singly-charged (i.e. monovalent) ions, such as sodium and chloride. Given that the hydraulic diameter of these ions is less than one nanometer, it stands to reason that the pores in a reverse osmosis membrane are very small - a few nanometers - whereas those of microfiltration may be greater than a micron in size.
Water supply treatment is the process of removing
contaminants from water, making it clean enough for its
desired use, most often to drinking water standards. Several
new energy-intensive advance treatment processes and
technologies are being deployed in the water utility sector
and there are needs to investigate possibilities to reduce
their energy footprint. There is also a need to identify and
optimize existing policies, practices and perceptions to
lower energy consumption associated with water treatment
and distribution. Water distribution systems can be energy
generators rather than energy consumers. This section
explores evaluates the efficiency of energy used to treat and
distribute potable water.
The main goal of sustainable management of water supply
systems is to develop new strategies and solutions that
can guarantee the uninterrupted delivery of good quality
water to populations, with no adverse environmental
consequences, and with as low operational costs as possible.
There are numerous examples of such solutions associated
with water management.
Energy efficiency in water and wastewater sector can be
accomplished through measures such as water conservation,
water loss prevention, stormwater reduction and repairs to
sewer system to prevent groundwater infiltration. Measures
to reduce water consumption, water loss, and wastewater lead
to reductions in energy use, and result in savings associated
with recovering and treating lower quantities of wastewater
and treating and delivering lower quantities of water.
A significant amount of municipal energy use occurs at water
and wastewater treatment facilities. With pumps, motors and
other equipment operating 24 hours a day, 7 days a week,
water and wastewater facilities can be among the largest
consumers of energy in a community and thus among the
largest contributors to the community’s total greenhouse
gas emissions (US EPA, 2013). There are several clear energy
efficiency and demand management opportunities in the
water supply sector. Pumps account for up to 95% of the
energy used to distribute drinking water, so any management
technique that can enhance pump efficiency could have
significant impacts on distribution’s energy consumption.
Energy opportunities have focused on use of efficient
pumping systems (pumps, motors, variable frequency
drives), reduction of distribution leaks and implementation
of automatic meter reading. Unlike water treatment plants,
water distribution systems often do not have the luxury of
moving the bulk of their load off-peak. Not only must pumps
maintain constant pressure within the network, but it is the
end user who ultimately determines when the system bears
the most loads, much like with electrical power grids. Better
knowledge of demand and the use of storage tanks and
water towers can help remedy these difficulties.
Perhaps the largest unanswered question in this area stems
from the possibility that water distribution systems can be
energy generators rather than energy consumers. Installing
micro-hydro technologies in larger pipes can convert energy
from the pressure and flow into electricity (Vilanova and
Balestieri, 2014). These systems could be an energy producing
way to regulate pressure rather than using pressure valves.
Economic and environmental costs in water sector can be
reduced by improving the energy efficiency of the equipment
and operations of water treatment facilities, by promoting the
efficient use of water, and by producing energy in the water
treatment system (Water in the West, 2013). Improvements
in energy efficiency allow the same work to be done with
less energy; improvements in water use efficiency reduce
demand for water, which in turn reduces the amount of
energy required to treat and distribute water.
1.5.2.3 Energy Efficiency for Water Treatment
Main Focus 1. W
ater Efficiency
the 7th World Water Forum 057056 /
Opportunities for improving energy efficiency in these
facilities fall into three basic categories: (a) equipment
upgrades, (b) operational modifications and (c) modifications
to facility buildings. Equipment upgrades focus on replacing
items such as pumps and blowers with more efficient models
(US EPA, 2013).
Operational modifications involve reducing the amount
of energy required to perform specific functions, such as
wastewater treatment. Operational modifications typically
result in greater savings than equipment upgrades, and may
not require capital investments. Modifications to buildings,
such as installing energy-efficient lighting, windows, and
heating and cooling equipment, reduce the amount of
energy consumed by facility buildings themselves.
Water supply systems can be integrated with a renewable
source of energy such as solar cells, wind turbines, and
small micro hydropower (Vilanova and Balestieri, 2014). The
advantages of such solutions are numerous. It is possible
to produce electricity, which can be fed to the national
electricity transmission grid or be used locally. From the point
of view of water supply systems, such solutions can also
be used to power water pumps supplying water to villages
and urban areas, or for supplying water for industrial and
irrigation needs. Such solutions can provide the backbone
for sustainable development in both urban and in rural areas.
When compared with conventional water supply systems,
these solutions have a lower carbon footprint and contribute
The efficient use of water needs to take into account its safe
reuse and the efficiency of the transporting pipe networks,
the process treatment costs and the impacts on society. The
opportunity for water reuse depends on the industrial wastes
entering the sewer networks and the varying standards and
capability of the local sewage treatment plants. The designs
of sewage treatment plants have historically been specified
according to latest scientific knowledge, affordability and
to meet the essential requirements for safety in terms of
both human and environmental impacts. This then results
in the effluent water from sewage treatment plants being
discharged at many different standards. However, this
volume of effluent water can be more than 50% of the water
consumed and used by societies;, therefore any potential
reuse can impact directly on society’s fresh water needs.
1.5.2.4 Improvement of Energy Utilization in Water Applications
1.5.2.5 Renewable Energy from Water System
1.5.3 Smart Wastewater Reuse and System Efficiency
Water treatment utilities can improve energy efficiency
by installing control software, use of efficient pumping
systems (pumps, motors, variable frequency drives), efficient
disinfection equipment, and implementation of lighting
and heating, ventilation, and air conditioning (HVAC)
improvements (US EPA, 2013). Improving energy efficiency
at a water or wastewater treatment facility reduces electricity
demand, thus avoiding the risk of brownouts or blackouts
during high-energy demand periods and helping to avoid the
need to build new power plants. Water efficiency strategies
reduce the risk of water shortages, thus helping to ensure a
reliable and continuous water supply.
Energy savings in the wastewater utility sector are linked
to best management practices and system optimization.
There is also a need to identify and optimize existing policies,
practices and perceptions to lower energy consumption
associated with wastewater treatment use and reclamation of
water and wastewater (US EPA, 2013; WERF, 2010). Substantial
amounts of energy could be extracted from wastewater.
Biogas and biosolids have an enormous potential to offset
the energy needs of wastewater treatment plants, and in
many places varying degrees of such practices have been
started. The potential for renewable energy facilities in water
and wastewater to generate energy savings or costs is little
understood by many from a holistic impact point of view, and
any such analyses will only be advanced once an economic
benefit is available or the industry is motivated towards
achieving such goals.
The first stage of wastewater treatment consists of a network
of sewers collecting wastewater and transporting sewage
from the customer to the wastewater treatment facility.
Wastewater pumps are intrinsically less efficient (than
water pumps) because they pump both liquids and solids.
They therefore have greater clearances between the pump
impeller and the casing, allowing much of the pumped water
1.5.3.1 Energy for Wastewater Collection
towards climate change mitigation.

058Main Focus 1. Water Efficiency
Energy-efficient equipment often has a longer service life
and requires less maintenance than older, less efficient
technologies. Efforts to improve water efficiency or promote
water conservation can also extend the life of existing
infrastructure owing to lower demand, and can avoid the
need for costly future expansions. Wastewater utilities
can improve energy efficiency by modifying of aeration
equipment, anaerobic digestion, lighting and heating,
ventilating and air conditioning (HVAC) improvements,
protection from leaks, installing control software, and using
efficient pumping systems (US EPA, 2013; WERF, 2010).
Upgrading to more efficient equipment and right-sizing
equipment for the capacity of the facility (plants and pipes
often are oversized, to accommodate future peak load).
Pumps and other equipment used beyond their expected
life operate well below optimal efficiency. In addition, energy
is embedded through pipe systems, since leaking drinking
water pipes require more energy to deliver water to the end
user. Leaky sewer lines allow groundwater to infiltrate and
increase the flow of water into the wastewater treatment
plant. All water systems have losses, which are cumulative
along segments of the water-use cycle. Projects to address
water loss and improve end-use efficiency can be promoted
as both water- and energy-savings investments.
It is widely recognized that water utilities need improved
energy management to develop a better understanding
of their current energy use. Optimizing system processes,
Most of this effluent or treated wastewater is returned to
streams, rivers or lakes. However, recycled water presents
many benefits to utilities and customers, such as reduced
energy consumption associated with production, treatment
and distribution of water; a drought-resistant and stable
source of local water; and significant environmental benefits,
like reduced nutrient loads to receiving water bodies
because of reuse of the treated wastewater and thus avoided
discharge (Water in the West, 2013). Water recycling is often
one of the cheapest sources of water, after efficiencies in
agricultural and urban water use, although high capital
investments, public acceptance, strong incentives and
legislation are needed.
Human ingenuity has continued to deliver technology that
can theoretically treat even the most degraded source of
water to a drinking water standard. However, reuse of sewage
effluent holds psychological fears for communities related
to the possibility that the water may still be contaminated
and dangerous, or that human error in treatment may occur.
Therefore they are rarely willing to have such water supplied
for drinking water purposes, regardless of the scientific
advances that enable such standards to be achieved.
However, where the water can be reused safely, usually for
agricultural use, then communities and environmentalists
give enthusiastic support. Unfortunately, the cost of
transporting the effluent from the treatment plants to point
of reuse, whether by pipes of tankers, is prohibitive. This
changes if the environmental impact of discharging locally
may result in an environmental or human safety impact, at
which point alternative options are essential.
Development of sewer systems evolved from buckets to
piping raw sewage into the closest river to treat the waste
through a sewage treatment plant. Contamination of
potable water from sewage in some instances around the
world, has resulted in many countries developing regulatory
regimes that have often forced utilities to adopt the most
technologically advanced treatment process with its high
1.5.3.2 Energy Reduction for Wastewater Treatment
1.5.3.3 Wastewater Reclamation and Reuse
to return to the intake. Ideally, agencies should place potable
water treatment facilities upstream and at a higher elevation
from their customers, with the wastewater treatment facilities
downstream and at a lower elevation, to harness gravity
where possible to cut back on pumping and treatment costs.
Moreover, water intakes are often placed above wastewater
outfalls on rivers (WERF, 2010).
Ageing wastewater collection systems result in additional
inflow and infiltration, leading to higher pumping and
treatment costs. Moreover, infiltration, particularly along
coastlines, leads to deterioration of water quality from
increased total dissolved solids and poses problems for
wastewater reuse.
such as modifying pumping and aeration operations and
implementing monitoring and control systems through
supervisory control and data acquisition systems, can be
used to increase the energy efficiency of equipment.
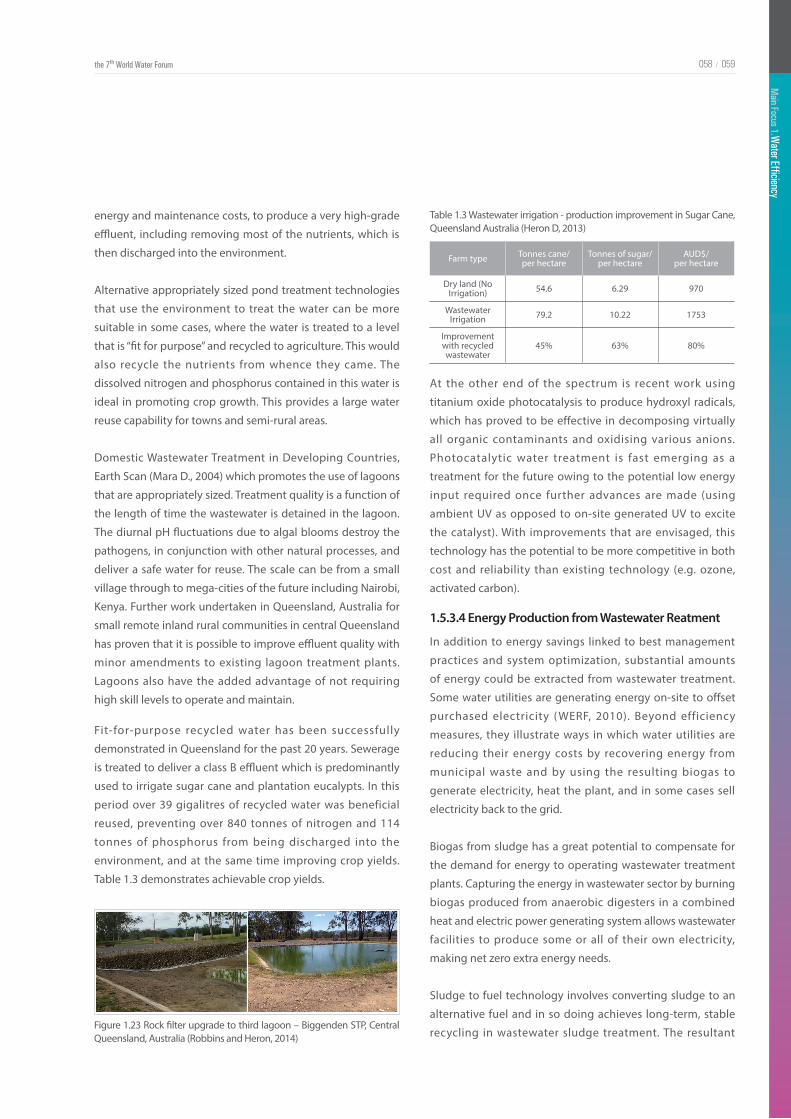
Main Focus 1. W
ater Efficiency
the 7th World Water Forum 059058 /
energy and maintenance costs, to produce a very high-grade
effluent, including removing most of the nutrients, which is
then discharged into the environment.
Alternative appropriately sized pond treatment technologies
that use the environment to treat the water can be more
suitable in some cases, where the water is treated to a level
that is “fit for purpose” and recycled to agriculture. This would
also recycle the nutrients from whence they came. The
dissolved nitrogen and phosphorus contained in this water is
ideal in promoting crop growth. This provides a large water
reuse capability for towns and semi-rural areas.
Domestic Wastewater Treatment in Developing Countries,
Earth Scan (Mara D., 2004) which promotes the use of lagoons
that are appropriately sized. Treatment quality is a function of
the length of time the wastewater is detained in the lagoon.
The diurnal pH fluctuations due to algal blooms destroy the
pathogens, in conjunction with other natural processes, and
deliver a safe water for reuse. The scale can be from a small
village through to mega-cities of the future including Nairobi,
Kenya. Further work undertaken in Queensland, Australia for
small remote inland rural communities in central Queensland
has proven that it is possible to improve effluent quality with
minor amendments to existing lagoon treatment plants.
Lagoons also have the added advantage of not requiring
high skill levels to operate and maintain.
Fit-for-purpose recycled water has been successfully
demonstrated in Queensland for the past 20 years. Sewerage
is treated to deliver a class B effluent which is predominantly
used to irrigate sugar cane and plantation eucalypts. In this
period over 39 gigalitres of recycled water was beneficial
reused, preventing over 840 tonnes of nitrogen and 114
tonnes of phosphorus from being discharged into the
environment, and at the same time improving crop yields.
Table 1.3 demonstrates achievable crop yields.
Figure 1.23 Rock filter upgrade to third lagoon – Biggenden STP, Central Queensland, Australia (Robbins and Heron, 2014)
Table 1.3 Wastewater irrigation - production improvement in Sugar Cane, Queensland Australia (Heron D, 2013)
Farm type Tonnes cane/per hectare
Tonnes of sugar/per hectare
AUD$/per hectare
Dry land (No Irrigation) 54.6 6.29 970
Wastewater Irrigation 79.2 10.22 1753
Improvement with recycled wastewater
45% 63% 80%
At the other end of the spectrum is recent work using
titanium oxide photocatalysis to produce hydroxyl radicals,
which has proved to be effective in decomposing virtually
all organic contaminants and oxidising various anions.
Photocatalytic water treatment is fast emerging as a
treatment for the future owing to the potential low energy
input required once further advances are made (using
ambient UV as opposed to on-site generated UV to excite
the catalyst). With improvements that are envisaged, this
technology has the potential to be more competitive in both
cost and reliability than existing technology (e.g. ozone,
activated carbon).
In addition to energy savings linked to best management
practices and system optimization, substantial amounts
of energy could be extracted from wastewater treatment.
Some water utilities are generating energy on-site to offset
purchased electricity ( WERF, 2010). Beyond efficiency
measures, they illustrate ways in which water utilities are
reducing their energy costs by recovering energy from
municipal waste and by using the resulting biogas to
generate electricity, heat the plant, and in some cases sell
electricity back to the grid.
Biogas from sludge has a great potential to compensate for
the demand for energy to operating wastewater treatment
plants. Capturing the energy in wastewater sector by burning
biogas produced from anaerobic digesters in a combined
heat and electric power generating system allows wastewater
facilities to produce some or all of their own electricity,
making net zero extra energy needs.
Sludge to fuel technology involves converting sludge to an
alternative fuel and in so doing achieves long-term, stable
recycling in wastewater sludge treatment. The resultant
1.5.3.4 Energy Production from Wastewater Reatment
060Main Focus 1. Water Efficiency
Some power supply technologies can also be used by
wastewater utilities to supplement their commercial power
sources (WERF, 2010). To be effective, these auxiliary and
supplemental sources can provide the power necessary to
run the wastewater treatment plant efficiently and effectively,
and have a short start-up time if they are to be used in an
emergency.
Wastewater utilities can implement cogeneration and other
on-site renewable power options to provide reliable power
to wastewater treatment plants on either a continuous or
emergency basis. Although diesel or natural gas power
generators have been used to reduce peak energy demands
on a short-term basis, novel technologies such as solar
panels, wind turbines, low-head hydropower, fuel cells,
wastewater heat recovery and co-digestion driven generators
can provide on-site renewable power on a continuous basis
Water in the West (2013).
For urban water efficiency, it is recommended that the
governments and international aid agencies are asked to
review with urgency their collaborations to reduce the
unacceptably high levels of water losses in many parts of
the world, and to set targets for gaining success in each
country. They are encouraged to radically alter their own
programs to achieve worldwide improvements, and to form
project collaborations with regional and international water
associations. All water utilities provide an annual water loss
audit and a 12 month plan for further reductions. Utilities
report losses using the International Water Association’s
1.5.3.5 Renewable Energy from Wastewater System
1.6 SUMMARY AND RECOMMENDATIONS1.6.1 Recommendations for Urban Water Efficiency
There are some requirements for smart industrial water
efficiency, which consist of economic, technical, regulatory,
institutional and educational, and informative efficiencies.
The industrial water efficiency recommends to encourage
water audits of industry which log all pressures and flows
and to avoid undervaluing water prices. Also, it is necessary
to utilize incentives and disincentives for water saving
and conservation. Encouraging the development and
improvement of water efficient technology and employing
regulations and provisions to encourage industrial water-
efficiency. It support various educational programs to
educate industrial water users on the real value of water and
develop a smart informative water management system to
collect all water-related monitoring data. Finally, rehabilitate
aged water networks and water-related infrastructures
based on infrastructure asset management assessment and
1.6.2 Recommendations for Industrial Water Efficiency
biosolid recovered fuel can be sold as a valuable product and
is a more cost-effective way of recycling dewatered sludge
than disposal. It is also helpful in reducing greenhouse gas
emissions, using carbon-neutral sewage sludge as solid
fuel. Carbinization technology can make efficient use of the
heating value of sewage sludge by drying to low moisture
content, and making further beneficial use of sewage sludge
by producing a pelletized, easy-to-handle biosolid recovered
fuel as a substitute for coal.
infrastructure leakage index, and also losses related to the
number of connections/and/or length of water mains in litres
per connection or kilometer of mains, specifically avoiding
percentages. The research on ground-penetrating radar is
encouraged and advanced, or alternatives are investigated.
The research is encouraged on water pressure controls
(pressure reducing valve) that return energy to communities.
The research is encouraged to investigate low-cost methods
of leakage identifiers on all new underground pipework. The
all utilities employ a water demand management officer with
responsibilities for reducing underground losses. All water
utility boards, and corporations are briefed on the importance
of water loss reduction and the benefits of having water
losses as a key performance indicator of the organization.
The meter manufacturers are encouraged to research, with
smart meters on the inclusion of time of day billing and the
identification of irrigation timings separately to domestic
usage. That methods are identified to resolve comprehensive
and standardized urban water pricing issues. Appliance/
water use technology replacement is accelerated; and water-
efficiency standards are updated. A loading order for water
that can serve as a guidepost for policies and decisions at
local, regional, and country levels is adopted. Water utilities
increase investments on water-efficiency projects. It is
necessary to collect more and better water-use data.
Main Focus 1. W
ater Efficiency
the 7th World Water Forum 061060 /
That water utilities perform an annual energy usage audit,
and develop a 12-month plan for energy reduction. Energy is
required to extract, convey, and deliver water of appropriate
quality for diverse human uses, and then again to treat
wastewaters before their return to the environment. Energy
efficiency in the water and wastewater sector targeted to
reduce energy consumption, to recover energy and resources,
and to minimize the environmental footprint of water and
wastewater systems.
All agricultural regulators should be encouraged to identify
the world’s best practice to introduce major water efficiency
standards and requirements.
The world faces the enormous challenge of producing
almost 50% more food by 2030 and doubling production by
2050. This will probably need to be achieved with less water,
mainly because of growing pressures from urbanization,
industrialization and climate change (OECD, 2010). It will be
important in future for farmers to receive the right guidance
to increase water use efficiency and improve agricultural
water management. Water efficiency improvements can
provide several important benefits to farmers. In particular,
they can increase yields and improve crop quality while
reducing fertilizer, water, and in some cases, energy costs,
resulting in higher profits. Additionally, the efficiency can
improve the reliability of existing supplies and reduce
vulnerability to drought and other water-supply constraints
(Pacific Institute, 2014). Different structural and non-structural
alternatives have been tried to make more efficient water
management in agriculture, and there should be further
discussion on modelling and monitoring approaches for
water management, wireless technology for smart water
management, adopting advanced spatial information
technology (geographic information systems and remote
sensing), encouraging financial investment and sustainable
research and development for increasing agricultural water
efficiency and financing water management infrastructure for
agriculture.
1.6.4 Recommendations for Energy Efficiency
1.6.3 Recommendations for Agricultural Water Efficiency
inspections are suggested.
062Main Focus 1. Water Efficiency
AEA Energy & Environment (2007) Adaptation to climate change in the agricultural sector, European Commission Report AGRI-2006-G4-05.
AFED (2010) Water Efficiency Handbook prepared by Mirata M. and Emtairah T., Arab Forum for Environment and Development, Beirut, Lebanon.
Ali, M.H. and M.S.U. Talukder (2008) Increasing water productivity in crop production - A synthesis, Agricultural Water Management 95, 1201-121.
Bautraa, T. (2010) Improvement of Water Use Efficiency in Irrigated Agriculture: A Review, Journal of Agronomy 9(1), 1-8.
Benito, P., S. Mudgal, D. Dias, V. Jean-Baptiste, M.A. Kong, D. Inman, and M. Muro (2009) Water Efficiency Standards, Bio Intelligence Servie and Cranfield University, Report for European Commission (DG Environment)
Bennett, B., L. Park and R. Wilkinson (2010) Embedded Energy in Water Studies: Water Agency and Function Component Study and Embedded Energy − Water Load Profiles. California Public Utilities Commission.
Berg, Caroline van dan (2014) The Drivers of Non-Revenue Water Policy Research. World Bank Group, pp. 6997.
Bergez, J.E., D. Leenhardt, B. Colomb, J. Dury, M. Carpani, M. Casagrande, M.H. Charron, S. Guillaume, O. Therond, and M. Willaume (2012) Computer-model tools for a better agricultural management: Tackling managers’ issues at different scales - A contribution from systemic agronomists, Computers and Electronics in Agriculture, 86, 89-99.
Bos, M.G. (1980) Irrigation efficiencies at crop production level, ICID Bulletine 29(60), 18-25.
Brothers, K. (2002) DMA Design. Conference Proceedings ISBN 9963875904
Cagle R.F. (2003) Infrastructure Asset Management: An Emerging Direction
California Department of Water Resources (DWR) (2012) A proposed methodology for quantifying the efficiency of agricultural water use, A report to the legislature pursuant to section 10608.64 of the California Water Code, Sacramento, California.
Commission of the European Communities (CEC) (2008) Follow up Communication on Water Scarcity and Droughts in the European Union 414 final, [SEC(2008) 3069]., Brussels.
COPA-COGECA (2007) COPA-COGECA Position on Water Scarcity and Drought, COPA (Committee of Professional Agricultural Organizations), General Confederation of
Agricultural Cooperatives (COGECA), Brussels, http://www.copacogeca.be/Menu.aspx.
Edkins, R. (2006) Irrigation efficiency gaps - Review and stock take, Irrigation New Zealand No: L05264/2.
Eco Innovation Observatory (EIO) (2011) Water Innovation: How Eco-innovation can Contribute to the Sustainability of Europe’s Water Resources. Eco Innovation Observatory.
Environmental Protection Agency (Queensland) and Wide Bay Water Corporation (2004) Managing and Reducing Losses from Water Distribution Systems
Fan, M., J. Shen, L. Yuan, R. Jiang, X. Chen, W.J. Davies, and F. Zhang (2012) Improving crop productivity and resource use efficiency to ensure food security and environmental quality in China, Journal of Experimental Botany 63(1), 1-24.
FAO (2007) La situation mondiale de l’agriculture. Collection FAO: Agriculture 38, FAO, Rome, Italy. ISBN 978-92-5-205750-5.
FAO (2011) The stat of the world’s land and water resources for food and agriculture: Managing systems at risk, FAO, Rome, Italy, ISBN 978-92-5-106614-0.
Gleick P.H., Haasz D., Henges-Jeck C., Srinivasan V., Wolff G., Cushing K.K., and Mann A. (2003) Waste Not, Want Not: The Potential for Urban Water Conservation in California. Pacific Institute.
Halsema, G.E. and L . Vincent (2012) Eff ic ienc y and productivity terms for water management: A matter of contextual relativism versus general absolutism, Agricultural Water Management 108, 9-15.
Heron D, (2013) NSW Government Statewide - Conference Papers 2013
International Fund for Agricultural Development (IFAD) (2012) Challenges and opportunities for agricultural water management in West and Central Africa: Lessons from IFAD experience, IFAD
International Telecommunication Union (ITU) (2014). Smart Water Management in Cities, Technical Report on Smart Water Management for Smart Sustainable Cities, SSC-0122.
Jensen, M. (2007) Beyond irrigation efficiency, Irrigation Science 25, 233-245.
Knox, J.W., E.W. Weatherhead, and J.A. Rodriguez-Diaz (2007) A comparative assessment of trickle and spray irrigation, Report: SC040008/SR3.
Lambert A, (2015) Comparisons of some international success can be monitored on www.leakssuite.com/leakage-tracking-percentages
REFERENCES

Main Focus 1. W
ater Efficiency
the 7th World Water Forum 063062 /
Levidow, L., D. Zaccaria, R. Maia, E. Vivas, M. Todorovic, and A. Scardigno (2014) Improving water-efficient irrigation: Prospects and difficulties of innovative practices, Agricultural Water Management 146, 84-94.
Malm A., Ljunggren O., Bergstedt O., Pettersson T. and Morrision GM (2012) Replacement predictions for drinking water networks through historical data, Water Research, 46, 2149-2158.
Mara D. (2004) Domestic Wastewater Treatment in Developing Countries, Earth Scan.
McKenzie R (2001) South African WRC report TT152/01, Presmac.
McKenzie R (2014) Benchmarking Real Losses and Accounting for Water User Guides, Benchleak, Presmac, and Econoleak.
Morrison, J. , M. Marikawa, M. Murphy, and P. Schute (2009) Water Scarcity & Climate Change: Growing Risks for Businesses & Investors, Ceres and Pacific Institute, A Ceres Report.
New Jersey Department of Environmental Protection (NJ DEP) (2003) Chanpter 2 Low Impact Development Techniques New Jersey Stormwater Best Management Practices Manual, NJ, USA.
OECD (2010) Sustainable management of water resources in agriculture,Paris, www.oecd.org/agr/env.
Panchard, J., Rao, S., Prabhakar, T.V., Jamadagni, H.S., and Hubaux, J.P. (2006) COMMON-Sense Net: Improved water management for resource-poor farmers via sensor networks, Information and Communication Technologies and Development, 2006. ICTD '06. International Conference, 22-33.
Passioura, J. (2006) Increasing crop productivity when water is scarce - from breeding to field management, Agricultural Water Management 80, 176-196.
Pacific Institute (2014) Agricultural water conservation and efficiency potential in California, Natural Resources Defense Council (NRDC) Issue Report
Robbins P and Heron D (2014) WIOA Australia, conference papers
Schuetze, T. and V. Santiago-Fandiño. (2013) Quantitative Assessment of Water Use Efficiency in Urban and Domestic Buildings. Water, 5(3), 1172-1193.
Torterotot J.P., Rebelo M., Werey C., and Craveiro J. (2005) Rehabilitation of water networks: Analysis of the decision making processes. Water Science Technology: Water Supply, 5(2), 23-30.
Turner, A.J., Willetts, J.R. & White, S. (2006) The International Demand Management Framework Stage 1,Institute for Sustainable Futures, University of Technology Sydney, report prepared for Canal Isabel II and International Water Association, [http://cfsites1.uts.edu.au/find/isf/publications/turneretal2006idmf.pdf ].
Turner, A., Willets, J., Fane, S., Giurco, D., Chong, J., Kazaglis, A., and White S. (2010) Guide to Demand Management and Integrated Resource Planning. Prepared by the Institute for Sustainable Futures, University of Technology Sydney for the National Water Commission and the Water Services Association of Australia, Inc. [https://letscrate.com/o9B]
US EPA (2012) Total Water Management, ERA-600-R-12-551, Cincinnati, OH, USA.
US EPA (2013) Energy Efficiency in Water and Wastewater Facilities, Local Government Climate and Energy Strategy Series. EPA-430-R-09-038, Washington, DC.
Vickers, A. (2002) Water Use and Conservation.
Vilanova, M. R. N. and J. A. P. Balestieri (2014) Energy and hydraulic efficiency in conventional water supply systems. Renewable and Sustainable Energy Reviews, 30(2014) 701–714.
Waldron T (2002) Water Audits EPA Queensland, Manual 2. Managing and Reducing Water Losses from Distribution Systems, ISBN 0 7242 9492 9.
Waldron T (2002-2005) Managing and Reducing Water Losses from Distribution Systems, volume 1 to 10 published by Queensland Environmental Agency.
Water in the West (2013) Water and Energy Nexus: A Literature Review, Stanford University, Stanford, CA, USA.
WERF (2010) Overview of State Energy Reduction Programs and Guidelines for the Wastewater Sector Operations Optimization, IWA Publishing. London, United Kingdom.
World Bank (2007) Making the Most of Scarcity.
Recovery
Main Focus 2
Resource Recovery from Water and Wastewater Systems
Global trends, current technology and practices, and existing examples of resource
recovery are expounded on as a means to illustrate the practical need and
opportunity for a concerted effort towards greater resource sustainability through
holistic application of resource recovery methods.
Reso
urce
Rec
over
y fro
mW
ater
and
Was
tew
ater
Sys
tem
s
Main Focus 2 066
2.1 INTRODUCTION
2.1.1 Objectives and Structure of This Chapter
The current global environment has shown trends of
increasing urbanization, growing and more unevenly
distributed world population, and extreme events of floods
and droughts due to climate change. Such factors are leading
to greater pressure on the usage efficiency and allocation of
water, nutrients, and land around the world. Furthermore,
with the rise in global population, there will be higher
resource utilization and an increased need for resources such
as clean water. By necessity, this leads to greater treatment
demands and consequently more costs as well as energy
usage. However, with current practices, although recovering
resources from facilities such as wastewater treatment plants
has drawn increasing attention worldwide, large amounts of
used water are still being dumped or drained directly back
into nature, especially in low-income countries. It is time that
used water (henceforth called “used water” in some parts of
this paper) is re-examined and considered as a form of used
solid, gaseous, and aqueous resources.
Driven by environmental, economic, and ecological benefits,
the importance of water conservation, source separation,
energy efficiency, and resource recovery from water and
wastewater systems are becoming more globally recognized.
The development of re-use and recycling within the water
and wastewater sectors provides major opportunities for
improving environmental performance, creating climate
benefits, reducing costs, and further supporting the resilience
of human and natural systems under water stress.
Resources recovered from water and wastewater systems
can range from water itself to energy, nutrients, and other
materials. Currently, there are already some real applications
for reused water (indirect or direct potable reuse) and
recovered materials in agricultural, industrial, aquifer
management, and urban applications.
Resource recovery from water and wastewater systems is
now a rapidly developing field where science, technology,
and practice come together. A range of new initiatives is
underway to promote and accelerate the development
and uptake of resource recovery science and technologies.
Innovation on resource recovery in the water cycle has been
evolving quickly, but examples of large-scale and marketable
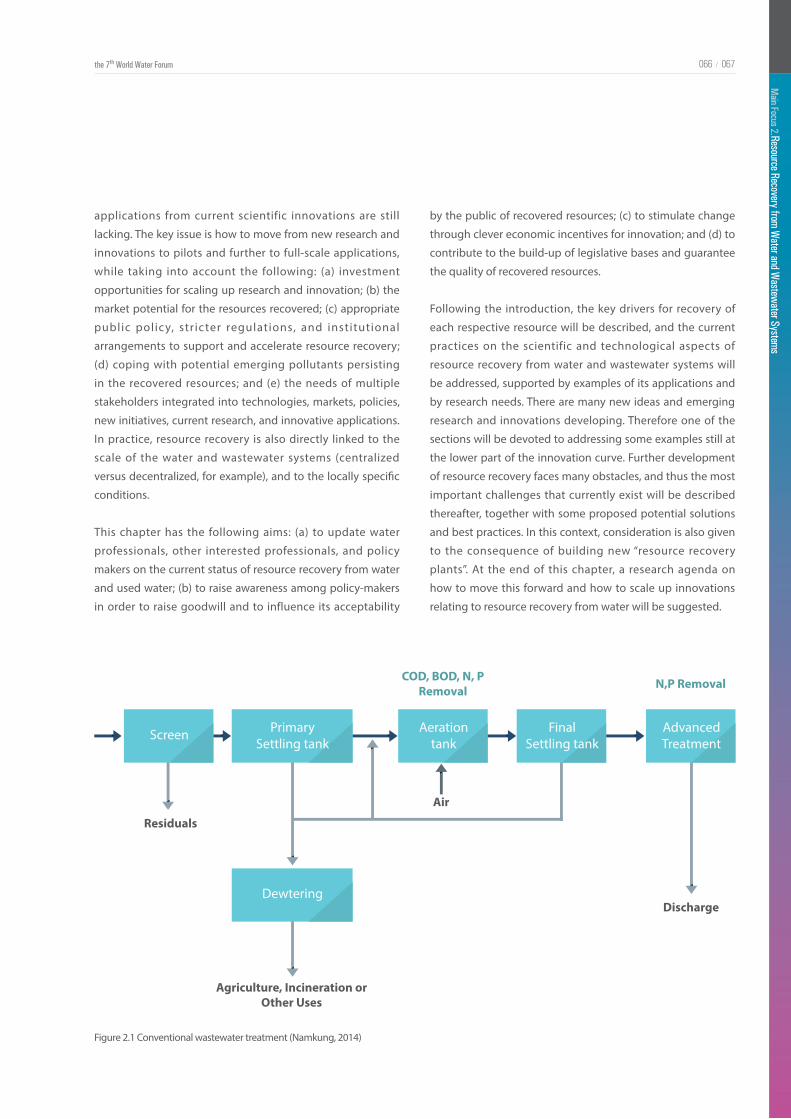
Main Focus 2. Resource Recovery from W
ater and Wastew
ater Systems
067066 /the 7th World Water Forum
Figure 2.1 Conventional wastewater treatment (Namkung, 2014)
applications from current scientific innovations are still
lacking. The key issue is how to move from new research and
innovations to pilots and further to full-scale applications,
while taking into account the following: (a) investment
opportunities for scaling up research and innovation; (b) the
market potential for the resources recovered; (c) appropriate
public policy, str icter regulations, and institutional
arrangements to support and accelerate resource recovery;
(d) coping with potential emerging pollutants persisting
in the recovered resources; and (e) the needs of multiple
stakeholders integrated into technologies, markets, policies,
new initiatives, current research, and innovative applications.
In practice, resource recovery is also directly linked to the
scale of the water and wastewater systems (centralized
versus decentralized, for example), and to the locally specific
conditions.
This chapter has the following aims: (a) to update water
professionals, other interested professionals, and policy
makers on the current status of resource recovery from water
and used water; (b) to raise awareness among policy-makers
in order to raise goodwill and to influence its acceptability
Screen Aerationtank
FinalSettling tank
AdvancedTreatment
PrimarySettling tank
Dewtering
COD, BOD, N, PRemoval N,P Removal
Residuals
Air
Discharge
Agriculture, Incineration orOther Uses
by the public of recovered resources; (c) to stimulate change
through clever economic incentives for innovation; and (d) to
contribute to the build-up of legislative bases and guarantee
the quality of recovered resources.
Following the introduction, the key drivers for recovery of
each respective resource will be described, and the current
practices on the scientific and technological aspects of
resource recovery from water and wastewater systems will
be addressed, supported by examples of its applications and
by research needs. There are many new ideas and emerging
research and innovations developing. Therefore one of the
sections will be devoted to addressing some examples still at
the lower part of the innovation curve. Further development
of resource recovery faces many obstacles, and thus the most
important challenges that currently exist will be described
thereafter, together with some proposed potential solutions
and best practices. In this context, consideration is also given
to the consequence of building new “resource recovery
plants”. At the end of this chapter, a research agenda on
how to move this forward and how to scale up innovations
relating to resource recovery from water will be suggested.
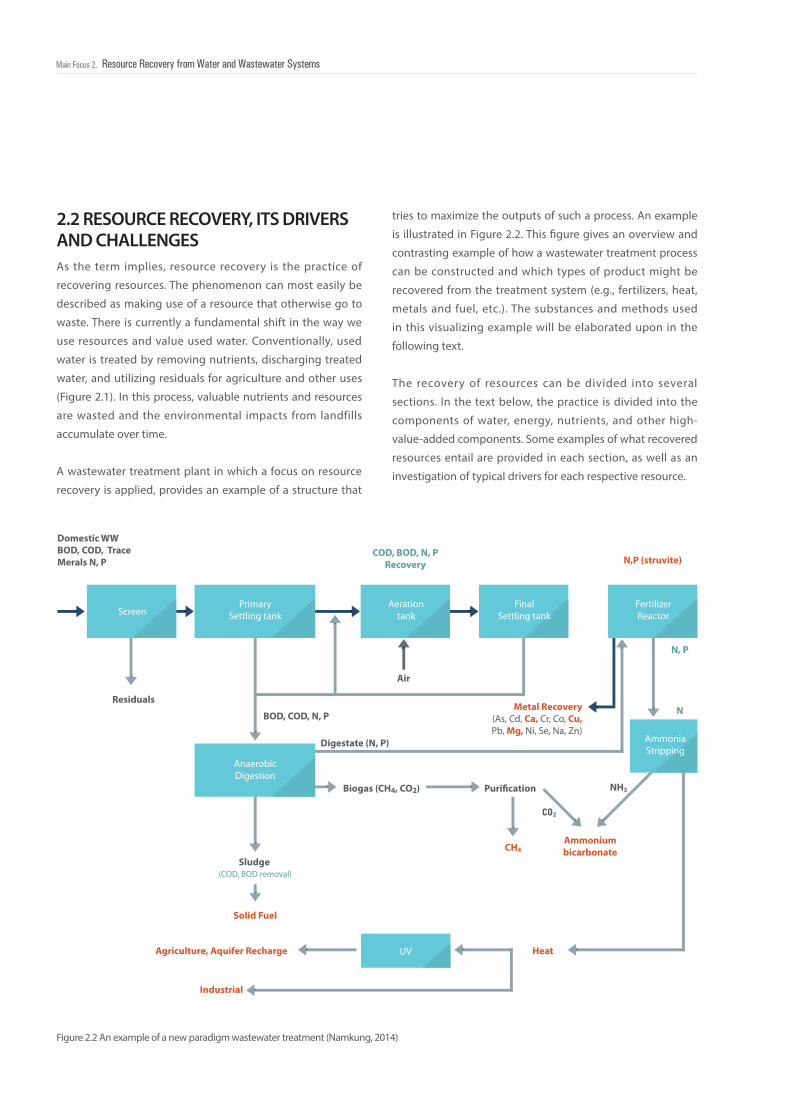
068068Main Focus 2. Resource Recovery from Water and Wastewater Systems
Figure 2.2 An example of a new paradigm wastewater treatment (Namkung, 2014)
2.2 RESOURCE RECOVERY, ITS DRIVERS AND CHALLENGESAs the term implies, resource recovery is the practice of
recovering resources. The phenomenon can most easily be
described as making use of a resource that otherwise go to
waste. There is currently a fundamental shift in the way we
use resources and value used water. Conventionally, used
water is treated by removing nutrients, discharging treated
water, and utilizing residuals for agriculture and other uses
(Figure 2.1). In this process, valuable nutrients and resources
are wasted and the environmental impacts from landfills
accumulate over time.
A wastewater treatment plant in which a focus on resource
recovery is applied, provides an example of a structure that
ScreenAeration
tank
UV
FinalSettling tank
FertilizerReactor
AmmoniaStripping
PrimarySettling tank
AnaerobicDigestion
COD, BOD, N, PRecovery
(COD, BOD removal)
N, P
N
Domestic WWBOD, COD, TraceMerals N, P N,P (struvite)
Solid Fuel
Metal Recovery(As, Cd, Ca, Cr, Co, Cu,Pb, Mg, Ni, Se, Na, Zn)
Residuals
BOD, COD, N, P
Digestate (N, P)
Biogas (CH4, CO2)
CO2
NH3
CH4
HeatAgriculture, Aquifer Recharge
Industrial
Ammoniumbicarbonate
Puri�cation
Air
Sludge
tries to maximize the outputs of such a process. An example
is illustrated in Figure 2.2. This figure gives an overview and
contrasting example of how a wastewater treatment process
can be constructed and which types of product might be
recovered from the treatment system (e.g., fertilizers, heat,
metals and fuel, etc.). The substances and methods used
in this visualizing example will be elaborated upon in the
following text.
The recovery of resources can be divided into several
sections. In the text below, the practice is divided into the
components of water, energy, nutrients, and other high-
value-added components. Some examples of what recovered
resources entail are provided in each section, as well as an
investigation of typical drivers for each respective resource.
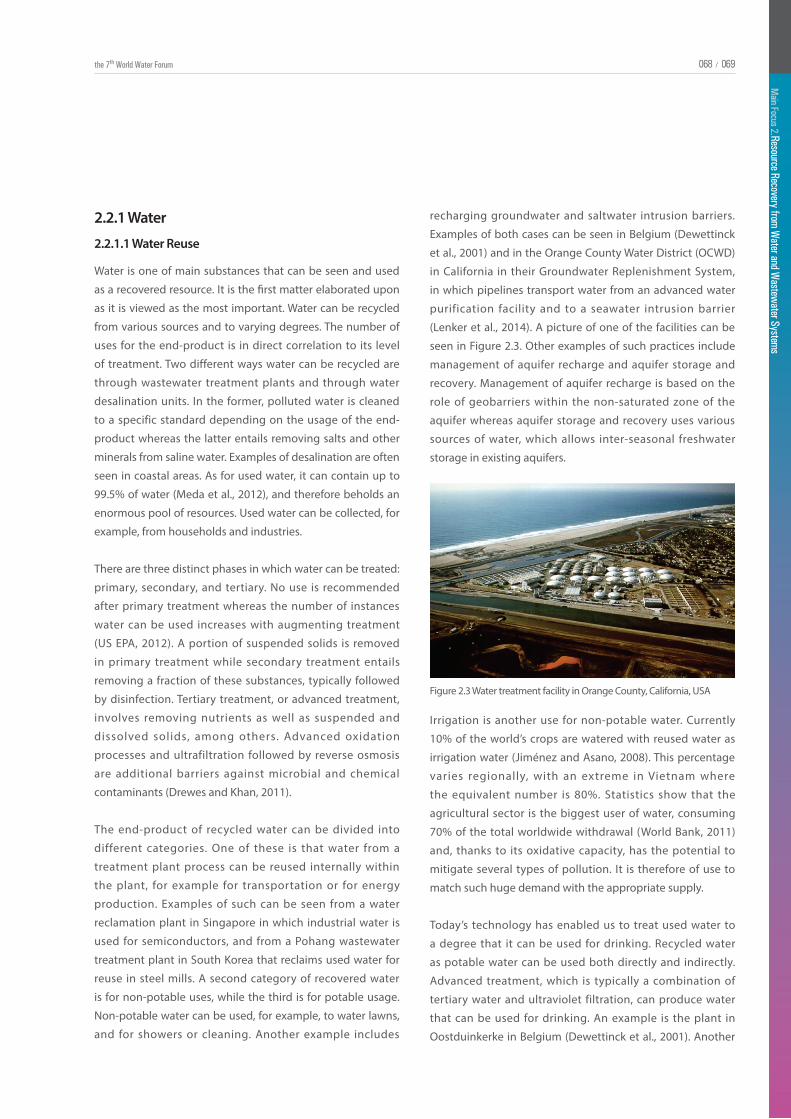
Main Focus 2. Resource Recovery from W
ater and Wastew
ater Systems
069068 /the 7th World Water Forum
Main Focus 2. Resource Recovery from W
ater and Wastew
ater Systems
069068 /
Figure 2.3 Water treatment facility in Orange County, California, USA
Water is one of main substances that can be seen and used
as a recovered resource. It is the first matter elaborated upon
as it is viewed as the most important. Water can be recycled
from various sources and to varying degrees. The number of
uses for the end-product is in direct correlation to its level
of treatment. Two different ways water can be recycled are
through wastewater treatment plants and through water
desalination units. In the former, polluted water is cleaned
to a specific standard depending on the usage of the end-
product whereas the latter entails removing salts and other
minerals from saline water. Examples of desalination are often
seen in coastal areas. As for used water, it can contain up to
99.5% of water (Meda et al., 2012), and therefore beholds an
enormous pool of resources. Used water can be collected, for
example, from households and industries.
There are three distinct phases in which water can be treated:
primary, secondary, and tertiary. No use is recommended
after primary treatment whereas the number of instances
water can be used increases with augmenting treatment
(US EPA, 2012). A portion of suspended solids is removed
in primary treatment while secondary treatment entails
removing a fraction of these substances, typically followed
by disinfection. Tertiary treatment, or advanced treatment,
involves removing nutrients as well as suspended and
dissolved solids, among others. Advanced oxidation
processes and ultrafiltration followed by reverse osmosis
are additional barriers against microbial and chemical
contaminants (Drewes and Khan, 2011).
The end-product of recycled water can be divided into
different categories. One of these is that water from a
treatment plant process can be reused internally within
the plant, for example for transportation or for energy
production. Examples of such can be seen from a water
reclamation plant in Singapore in which industrial water is
used for semiconductors, and from a Pohang wastewater
treatment plant in South Korea that reclaims used water for
reuse in steel mills. A second category of recovered water
is for non-potable uses, while the third is for potable usage.
Non-potable water can be used, for example, to water lawns,
and for showers or cleaning. Another example includes
2.2.1 Water
2.2.1.1 Water Reuse
recharging groundwater and saltwater intrusion barriers.
Examples of both cases can be seen in Belgium (Dewettinck
et al., 2001) and in the Orange County Water District (OCWD)
in California in their Groundwater Replenishment System,
in which pipelines transport water from an advanced water
purification facility and to a seawater intrusion barrier
(Lenker et al., 2014). A picture of one of the facilities can be
seen in Figure 2.3. Other examples of such practices include
management of aquifer recharge and aquifer storage and
recovery. Management of aquifer recharge is based on the
role of geobarriers within the non-saturated zone of the
aquifer whereas aquifer storage and recovery uses various
sources of water, which allows inter-seasonal freshwater
storage in existing aquifers.
Irrigation is another use for non-potable water. Currently
10% of the world’s crops are watered with reused water as
irrigation water (Jiménez and Asano, 2008). This percentage
varies regionally, with an extreme in Vietnam where
the equivalent number is 80%. Statistics show that the
agricultural sector is the biggest user of water, consuming
70% of the total worldwide withdrawal (World Bank, 2011)
and, thanks to its oxidative capacity, has the potential to
mitigate several types of pollution. It is therefore of use to
match such huge demand with the appropriate supply.
Today’s technology has enabled us to treat used water to
a degree that it can be used for drinking. Recycled water
as potable water can be used both directly and indirectly.
Advanced treatment, which is typically a combination of
tertiary water and ultraviolet filtration, can produce water
that can be used for drinking. An example is the plant in
Oostduinkerke in Belgium (Dewettinck et al., 2001). Another
070070Main Focus 2. Resource Recovery from Water and Wastewater Systems
2.2.1.2 Drivers
2.2.1.3 Challenges for Water
As can be seen, there are several steps and phases in which
water can be recovered. Reasons for this push can be many,
and drivers are seen both at local and at global levels. One
important factor is water scarcity. Worldwide demand for
water is increasing due to population growth and changing
lifestyles including changing dietary patterns. This is evident
because global withdrawals have tripled over the past 50
years (WWAP, 2009). It is estimated that withdrawals for water
will exceed current accessible and reliable supplies by 40%
by the year 2030 (Addams et al., 2009). This huge gap can be
minimized by methods of using recovered water.
A report from 2014 further shows that 700 million people
across the world do not obtain drinking water from improved
sources (WHO/UNICEF, 2014). As consumption of water is
necessary for survival, a deficit of the resource can turn into
a question of national security and independence. One big
motive behind the success of the Public Utilities Board (PUB)
in Singapore is because they wanted to decrease levels of
water importation from Malaysia (Tortajada, 2006).
Water scarcity can be linked to the number of available water
resources. One underlying factor to Windhoek’s progressive
idea of using recovered water was that they did not have any
alternative water sources (Law, 2003). The dry region of Saudi
Arabia is another example as it has a goal of meeting 10%
of its water demand by water reuse (Redwood and Huibers,
2008). During a severe drought in Australia from 2005 to
2007, water consumption decreased from 300 to 130 litres
per day (Olsson, 2012). This is another example that illustrates
the driver of water awareness correlated to limited supply.
For treatment plants, using water that is already being
transported to the plant and re-using this internally is much
more effective and efficient than using external water for
While the drivers are many, there are also several challenges
in recovering water. Treating water to a certain level requires
a pool of resources, including adequate equipment, financial
assets, expertise, and knowledgeable staff. It is also necessary
that the quality is assured through testing. Apart from the
technical and scientific skills and equipment that are required
for control, it is also necessary that a functioning, trustworthy
regulatory body is functioning. This body needs to follow
guidelines and set structures in place.
Another challenge could be the rules and regulations
themselves. One challenge might be that there is a lack
of guidelines and set documentation in how to go about
testing, or to have acknowledged targets. On a global level,
there are very few documents guiding recovered practices.
One of the few that exists is the World Health Organization’s
“Guidelines for the safe use of waste water, excreta and
greywater” (WHO, 2006). Even on a regional level, it is rare to
see such documentation. The European Union has its Water
Framework Directive with the overarching goal of reaching
good ecological status in water bodies in all European Union
countries, yet it lacks Union-wide standards in terms of water
reuse as well as in the interconnection between water and
energy (Schröder, 2014).
such purposes. Therefore, costs can be directly offset. The
economic benefits of using recovered water can also be
noticed when using reclaimed water for non-potable water
uses, such as flushing toilets. Money is saved as this water
does not need to be treated to drinking water standards.
Another procedure related to costs is the link between water
quantity and water quality. Discharging water into water
bodies that has not been cleaned can be damaging to the
environment and can disrupt the ecosystems into which it is
released. From this point of view, cleaning water that is being
discharged is cheaper than rehabilitation or reconstruction of
a disoriented ecosystem.
Financial assets as a driver can also be seen on a household
level. In Swedish households, total water consumption was
reduced by 20% upon installing individual water meters
(Olsson, 2012). This example highlights publically shared
information as a further driver for the wiser use of resources.
is in Singapore with its potable recovered water that goes
by the name ‘NEWater’ (Tortajada, 2006). A third example is
Windhoek in Namibia, which has had its direct potable reuse
plant running since the late 1960s (Law, 2003). Recovered and
recycled water can also be used for drinking purposes after
it has first been discharged into an environmental setting,
such as a pond, before it is treated to drinking water quality
standards.
Main Focus 2. Resource Recovery from W
ater and Wastew
ater Systems
071070 /the 7th World Water Forum
Main Focus 2. Resource Recovery from W
ater and Wastew
ater Systems
071070 /
acceptance from the public and decision-makers while
planning construction of water recovery facilities.
Energy is another important resource that can be recovered.
An important reason to focus on energy for resource recovery
is that the energy contained in used water is theoretically
sufficient to cover the energy that is needed for its treatment
(Lazarova et al., 2012). Potential energy, chemically bound
energy, and thermal energy are different major forms of
energy contained in used water (Meda et al., 2012). To a large
extent, energy from used water is stored as thermal energy.
The process of treating used water both requires energy and
can produce different forms of energy in the procedure.
As with water, energy can be recovered from water in several
ways. One of the two major routes of recovering energy from
used water is to turn sludge into biogas through anaerobic
digestion. The other method is to concentrate the sludge
and transport the digested product for central incineration,
with or without anaerobic digestion beforehand. The former
can recover electricity and heat when a combined heat and
power system is installed whereas the latter turns sludge into
heat.
In an anaerobic digestion process, microorganisms transform
the readily biodegradable portion of volatile solids in sludge
(also called biosolids) into biogas. The latter is a mixture
of methane (usually about 65%) and carbon dioxide (the
remaining 35%). Sources of biogas include used water
containing fermentable organic matter, landfills rich in
organics, livestock wastes, and food wastes. Biogas can be
upgraded and supplemented to compressed natural gas and
liquid natural gas, of which the latter can be used as fuel in
vehicles. Using biogas instead of natural gas requires that
the biogas is enriched in methane and that carbon dioxide
is removed. Processes such as pre-treatment in which the
bacterial cells present in the biosolids are broken, and co-
digestion in which readily biodegradable feedstock is added,
are ways to enhance the biodegradable portion of biosolids
from which biogas can be produced. Within the treatment
process (excluding the energy loss due to heat dissipation)
about 80% of the chemical energy contained in the original
reduced matters can be transferred into methane; around
2.2.2 Energy2.2.2.1 Energy Efficiency and Recovery
Rules that do exist, such as on a national and local level, can
be viewed as too rigid and strict and can indirectly be an
obstacle by making the practice too costly. The regulations
set need further to be appropriate and targeted to the local
context for them to be credible and enforced. For example,
when irrigation with used water was banned in Ghana and
Senegal, the policy was mostly ignored (Redwood and
Huiters, 2008) because of the imminent need for water.
If water to and from treatment plants is to be used for
different purposes, such as for both potable and non-potable
uses, an infrastructure is needed. Separation of pipes is then
not only needed in the plant but also in the households and
industries. It is costly and can be tricky to change this with
existing buildings in place, whereas it is easier to include such
ideas in the designing and planning phases. Buildings must
further be connected to a treatment plant that applies such
distribution, or to several different treatment plants to satisfy
the needs.
The human mind-set and way of viewing water is another
factor that can be both an obstacle and an opportunity.
Water is often regarded as an abundant resource, which
makes it more difficult to motivate practices of recovering it.
The way that treated water is valued is also a question put
forth for discussion. Furhtermore, there is a debate on the
use of water both for potable and for non-potable resources.
Some people would not want to drink water that has been
treated from a wastewater treatment plant, even though
it does not inflict any damage to the human body. This is
commonly known as the “yuck” factor. There are numerous
examples in which planned water reuses have failed because
of such opposition. One of these is from California, in which
the public’s unwillingness towards water re-purification
halted the project (website : 2, 3). A contrasting example
from a multi-use recycling project from the West Coast of the
USA highlights efforts in social awareness about water reuse
as a factor in its success (Po et al., 2003). One reason why the
Singaporean example has been so successful is because of
its targeted effort in marketing the brand of potable water as
safe and informing the community of the different processes
and treatment procedures. Using non-potable water for
irrigation or applying human excreta as fertilizers are other
examples in which the attitude of the practice has altered its
speed of implementation. It is therefore vital to encourage
072072Main Focus 2. Resource Recovery from Water and Wastewater Systems
2.2.2.2 Drivers
35% of the embedded energy in the methane can then be
converted into electricity in a combined heat and power unit
(Batstone et al., 2015). The overall energy recovery efficiency
is about 28%.
Heat recovered from treatment plants can be used for district
heating, sludge drying, and thermophilic heating in a sludge
digestion process (Hawley and Fenner, 2012). Thermal energy
from used water can be concentrated by heat pumps. In 2008,
500 used water heat pumps, with thermal capacities varying
between 10 kilowatts and 20 megawatts, were in operation
(Schmid, 2008). The heat can be used on-site and off-site for
district heating. China, Finland, Switzerland, and Canada are
examples of countries in which thermal energy recovery from
used water has been tested (Hawley and Fenner, 2012).
Currently, most recovered energy from treatment plants is
used on-site. This includes both producing electricity and
heat needed for the ongoing processes. An example in which
the produced energy is transported elsewhere is a treatment
plant in Strass, Austria, which sells their excess electricity back
to the grid.
One way to reduce the energy needed for treatment of used
water is to substitute energy-demanding processes by less
demanding ones, for example by replacing the nitrifying–
denitrifying bacteria with anammox bacteria. These latter
bacteria are anaerobic ammonia-oxidizing organisms which
typically require sequencing batch reactors for the process.
The previous focus on energy efficiency is, however, currently
shifting to energy neutrality instead, and having production
that exceeds consumption, which is illustrated by the
Austrian example.
As with motives to recover water, multiple benefits can be
linked to recovering energy. Globally there is a huge demand
for energy. Research shows that our energy consumption has
seen an annual growth rate of 2.4% during the past decade (1).
Further numbers indicate that our energy consumption will
increase by more than 8,000 million tons of oil equivalent in
less than 30 years (Global Energy Statistical Yearbook, 2013).
This alone is a reason to make optimal use of energy sources,
both by reducing energy needs as well as recovering energy.
One important factor in recovering energy is the money that
is to be made, or rather saved. Energy is typically the single
most expensive item in a treatment process. In a wastewater
treatment plant, energy can be derived through using
internal sources that are at hand to create fuel. In producing
energy, money does not have to be in place continuously,
nor is infrastructure necessary to import energy from
elsewhere. There is, however, an initial start-up cost related
to such conversion, and therefore long-term thinking and an
appropriate investment plan are needed.
A driver of energy recovery can be the demand. One such
example is the Austrian treatment plant, which sells the
excess energy back to the grid (Crawford, 2010), thereby
making money while meeting a need. Energy produced can
also be sold as fuel. An example from Stockholm, Sweden,
shows that biogas produced within treatment plants is used
for the capital’s bus fleet (Jonerholm, 2012). These examples
provide a glimpse of how the buyers and users for recovered
energy can be multiplied. The latter example can be
correlated to rules and goals, which can singlehandedly act
as drivers. Stockholm has a goal to be fossil-fuel free by 2050
(City of Stockholm, 2014). This aim functions as an incentive
to produce the supply, such as biogas, that can help meet
that goal and upcoming need.
As is the case with recovered water, energy can easily become
a question and interest of national security. A country that
is able to produce its own energy will have less dependence
on energy-rich countries, which can tie into political will
and diplomacy. This is an example in which incentives that
stem from other sectors can affect the coverage and speed
of recovery. Emission of greenhouse gases, such as carbon
dioxide, methane, and nitrous oxide, can also be reduced
through the process of recovering resources in the energy-
field, which can also act as an accelerator of the practice. One
of the two main drivers for the energy-producing plant in
Austria was its aim to reduce greenhouse gas emissions (Wett
et al., 2007).
One challenge relating to energy efficiency and recovery
is that some energy sources produced are not suitable for
storing or transporting long distances. This requires that the
facility producing the energy is close to where the energy
is to be consumed, thereby avoiding unnecessary costs and
2.2.2.3 Challenges for Energy
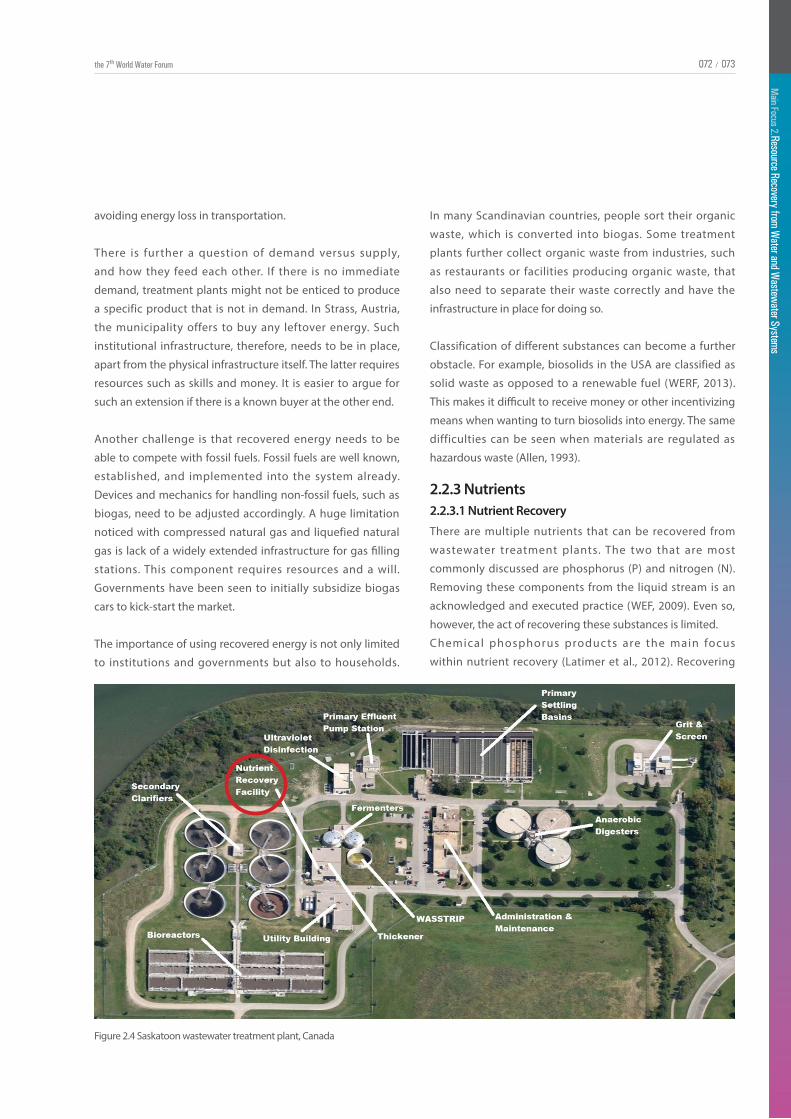
Main Focus 2. Resource Recovery from W
ater and Wastew
ater Systems
073072 /the 7th World Water Forum
Main Focus 2. Resource Recovery from W
ater and Wastew
ater Systems
073072 /
There are multiple nutrients that can be recovered from
wastewater treatment plants. The two that are most
commonly discussed are phosphorus (P) and nitrogen (N).
Removing these components from the liquid stream is an
acknowledged and executed practice (WEF, 2009). Even so,
however, the act of recovering these substances is limited.
Chemical phosphorus products are the main focus
within nutrient recovery (Latimer et al., 2012). Recovering
2.2.3.1 Nutrient Recovery
2.2.3 Nutrients
Figure 2.4 Saskatoon wastewater treatment plant, Canada
avoiding energy loss in transportation.
There is further a question of demand versus supply,
and how they feed each other. If there is no immediate
demand, treatment plants might not be enticed to produce
a specific product that is not in demand. In Strass, Austria,
the municipality offers to buy any leftover energy. Such
institutional infrastructure, therefore, needs to be in place,
apart from the physical infrastructure itself. The latter requires
resources such as skills and money. It is easier to argue for
such an extension if there is a known buyer at the other end.
Another challenge is that recovered energy needs to be
able to compete with fossil fuels. Fossil fuels are well known,
established, and implemented into the system already.
Devices and mechanics for handling non-fossil fuels, such as
biogas, need to be adjusted accordingly. A huge limitation
noticed with compressed natural gas and liquefied natural
gas is lack of a widely extended infrastructure for gas filling
stations. This component requires resources and a will.
Governments have been seen to initially subsidize biogas
cars to kick-start the market.
The importance of using recovered energy is not only limited
to institutions and governments but also to households.
In many Scandinavian countries, people sort their organic
waste, which is converted into biogas. Some treatment
plants further collect organic waste from industries, such
as restaurants or facilities producing organic waste, that
also need to separate their waste correctly and have the
infrastructure in place for doing so.
Classification of different substances can become a further
obstacle. For example, biosolids in the USA are classified as
solid waste as opposed to a renewable fuel (WERF, 2013).
This makes it difficult to receive money or other incentivizing
means when wanting to turn biosolids into energy. The same
difficulties can be seen when materials are regulated as
hazardous waste (Allen, 1993).
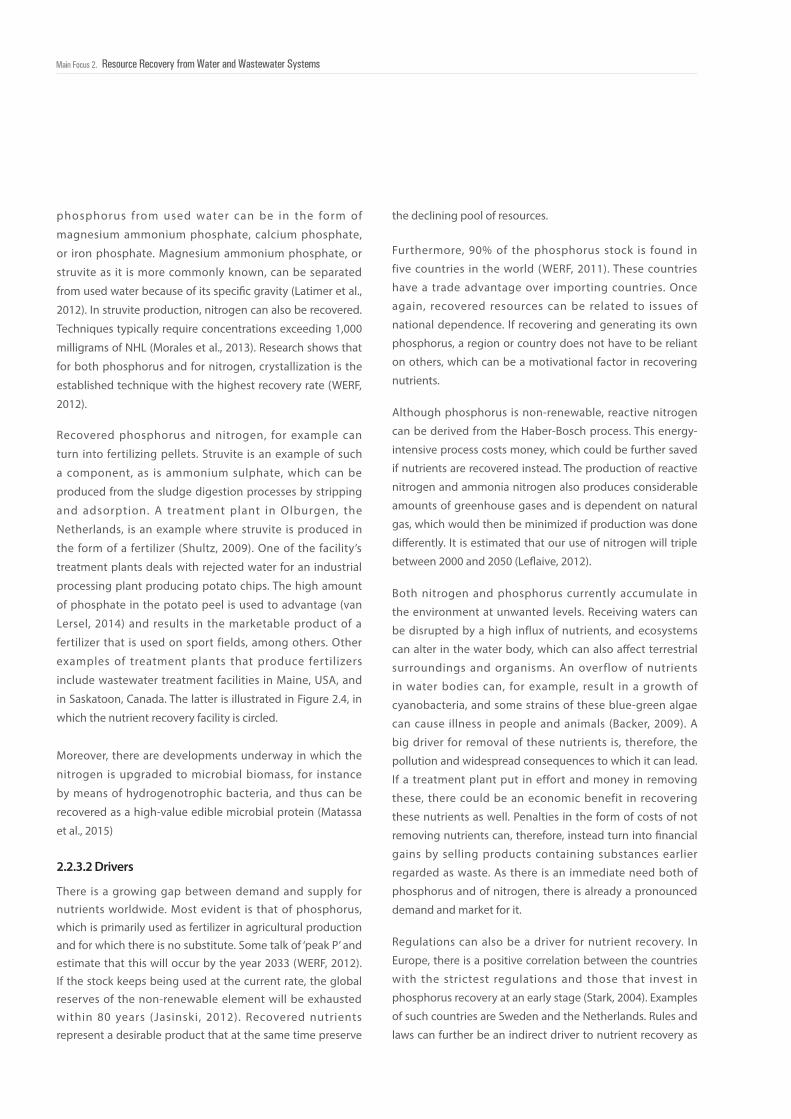
074074Main Focus 2. Resource Recovery from Water and Wastewater Systems
2.2.3.2 Drivers
There is a growing gap between demand and supply for nutrients worldwide. Most evident is that of phosphorus, which is primarily used as fertilizer in agricultural production and for which there is no substitute. Some talk of ‘peak P’ and estimate that this will occur by the year 2033 (WERF, 2012). If the stock keeps being used at the current rate, the global reserves of the non-renewable element will be exhausted within 80 years (Jasinski, 2012). Recovered nutrients represent a desirable product that at the same time preserve
phosphorus from used water can be in the form of
magnesium ammonium phosphate, calcium phosphate,
or iron phosphate. Magnesium ammonium phosphate, or
struvite as it is more commonly known, can be separated
from used water because of its specific gravity (Latimer et al.,
2012). In struvite production, nitrogen can also be recovered.
Techniques typically require concentrations exceeding 1,000
milligrams of NHL (Morales et al., 2013). Research shows that
for both phosphorus and for nitrogen, crystallization is the
established technique with the highest recovery rate (WERF,
2012).
Recovered phosphorus and nitrogen, for example can
turn into fertilizing pellets. Struvite is an example of such
a component, as is ammonium sulphate, which can be
produced from the sludge digestion processes by stripping
and adsorption. A treatment plant in Olburgen, the
Netherlands, is an example where struvite is produced in
the form of a fertilizer (Shultz, 2009). One of the facility’s
treatment plants deals with rejected water for an industrial
processing plant producing potato chips. The high amount
of phosphate in the potato peel is used to advantage (van
Lersel, 2014) and results in the marketable product of a
fertilizer that is used on sport fields, among others. Other
examples of treatment plants that produce fertilizers
include wastewater treatment facilities in Maine, USA, and
in Saskatoon, Canada. The latter is illustrated in Figure 2.4, in
which the nutrient recovery facility is circled.
Moreover, there are developments underway in which the
nitrogen is upgraded to microbial biomass, for instance
by means of hydrogenotrophic bacteria, and thus can be
recovered as a high-value edible microbial protein (Matassa
et al., 2015)
the declining pool of resources.
Furthermore, 90% of the phosphorus stock is found in
five countries in the world (WERF, 2011). These countries
have a trade advantage over importing countries. Once
again, recovered resources can be related to issues of
national dependence. If recovering and generating its own
phosphorus, a region or country does not have to be reliant
on others, which can be a motivational factor in recovering
nutrients.
Although phosphorus is non-renewable, reactive nitrogen
can be derived from the Haber-Bosch process. This energy-
intensive process costs money, which could be further saved
if nutrients are recovered instead. The production of reactive
nitrogen and ammonia nitrogen also produces considerable
amounts of greenhouse gases and is dependent on natural
gas, which would then be minimized if production was done
differently. It is estimated that our use of nitrogen will triple
between 2000 and 2050 (Leflaive, 2012).
Both nitrogen and phosphorus currently accumulate in
the environment at unwanted levels. Receiving waters can
be disrupted by a high influx of nutrients, and ecosystems
can alter in the water body, which can also affect terrestrial
surroundings and organisms. An overflow of nutrients
in water bodies can, for example, result in a growth of
cyanobacteria, and some strains of these blue-green algae
can cause illness in people and animals (Backer, 2009). A
big driver for removal of these nutrients is, therefore, the
pollution and widespread consequences to which it can lead.
If a treatment plant put in effort and money in removing
these, there could be an economic benefit in recovering
these nutrients as well. Penalties in the form of costs of not
removing nutrients can, therefore, instead turn into financial
gains by selling products containing substances earlier
regarded as waste. As there is an immediate need both of
phosphorus and of nitrogen, there is already a pronounced
demand and market for it.
Regulations can also be a driver for nutrient recovery. In
Europe, there is a positive correlation between the countries
with the strictest regulations and those that invest in
phosphorus recovery at an early stage (Stark, 2004). Examples
of such countries are Sweden and the Netherlands. Rules and
laws can further be an indirect driver to nutrient recovery as
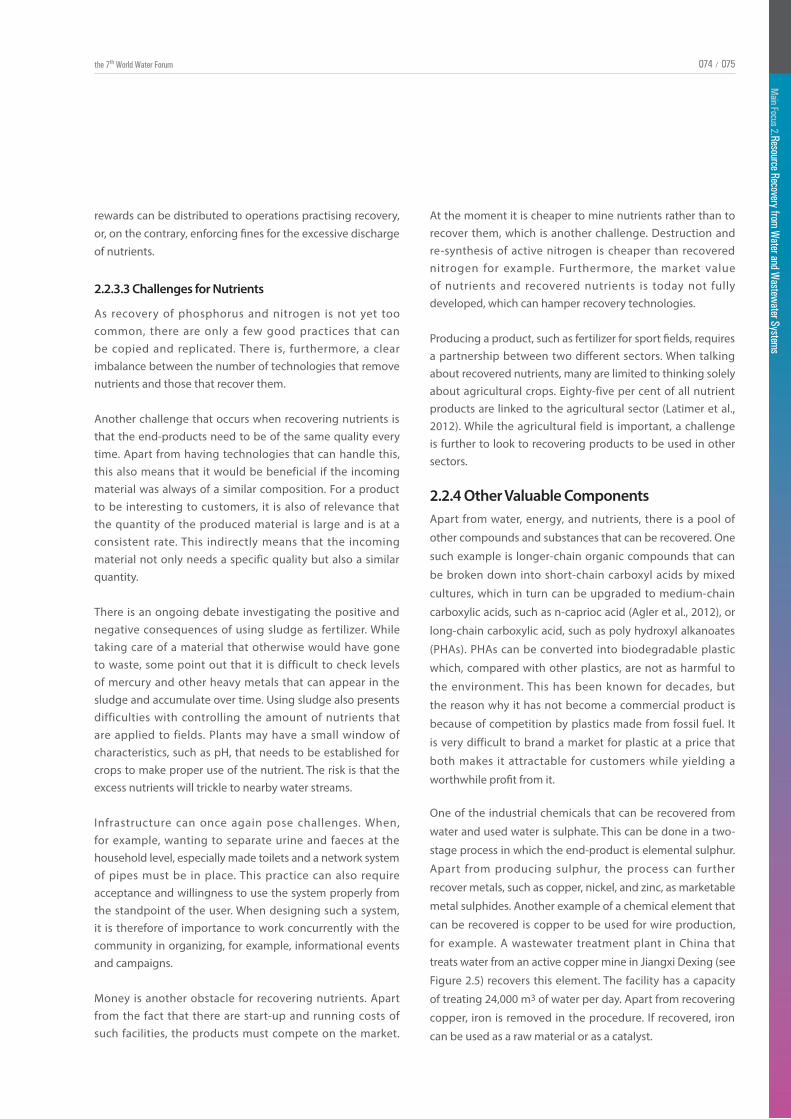
Main Focus 2. Resource Recovery from W
ater and Wastew
ater Systems
075074 /the 7th World Water Forum
Main Focus 2. Resource Recovery from W
ater and Wastew
ater Systems
075074 /
2.2.3.3 Challenges for Nutrients
As recovery of phosphorus and nitrogen is not yet too common, there are only a few good practices that can be copied and replicated. There is, furthermore, a clear imbalance between the number of technologies that remove nutrients and those that recover them.
Another challenge that occurs when recovering nutrients is that the end-products need to be of the same quality every time. Apart from having technologies that can handle this, this also means that it would be beneficial if the incoming material was always of a similar composition. For a product to be interesting to customers, it is also of relevance that the quantity of the produced material is large and is at a consistent rate. This indirectly means that the incoming material not only needs a specific quality but also a similar quantity.
There is an ongoing debate investigating the positive and negative consequences of using sludge as fertilizer. While taking care of a material that otherwise would have gone to waste, some point out that it is difficult to check levels of mercury and other heavy metals that can appear in the sludge and accumulate over time. Using sludge also presents difficulties with controlling the amount of nutrients that are applied to fields. Plants may have a small window of characteristics, such as pH, that needs to be established for crops to make proper use of the nutrient. The risk is that the excess nutrients will trickle to nearby water streams.
Infrastructure can once again pose challenges. When, for example, wanting to separate urine and faeces at the household level, especially made toilets and a network system of pipes must be in place. This practice can also require acceptance and willingness to use the system properly from the standpoint of the user. When designing such a system, it is therefore of importance to work concurrently with the community in organizing, for example, informational events and campaigns.
Money is another obstacle for recovering nutrients. Apart from the fact that there are start-up and running costs of such facilities, the products must compete on the market.
At the moment it is cheaper to mine nutrients rather than to recover them, which is another challenge. Destruction and re-synthesis of active nitrogen is cheaper than recovered nitrogen for example. Furthermore, the market value of nutrients and recovered nutrients is today not fully developed, which can hamper recovery technologies.
Producing a product, such as fertilizer for sport fields, requires a partnership between two different sectors. When talking about recovered nutrients, many are limited to thinking solely about agricultural crops. Eighty-five per cent of all nutrient products are linked to the agricultural sector (Latimer et al., 2012). While the agricultural field is important, a challenge is further to look to recovering products to be used in other sectors.
2.2.4 Other Valuable ComponentsApart from water, energy, and nutrients, there is a pool of
other compounds and substances that can be recovered. One
such example is longer-chain organic compounds that can
be broken down into short-chain carboxyl acids by mixed
cultures, which in turn can be upgraded to medium-chain
carboxylic acids, such as n-caprioc acid (Agler et al., 2012), or
long-chain carboxylic acid, such as poly hydroxyl alkanoates
(PHAs). PHAs can be converted into biodegradable plastic
which, compared with other plastics, are not as harmful to
the environment. This has been known for decades, but
the reason why it has not become a commercial product is
because of competition by plastics made from fossil fuel. It
is very difficult to brand a market for plastic at a price that
both makes it attractable for customers while yielding a
worthwhile profit from it.
One of the industrial chemicals that can be recovered from
water and used water is sulphate. This can be done in a two-
stage process in which the end-product is elemental sulphur.
Apart from producing sulphur, the process can further
recover metals, such as copper, nickel, and zinc, as marketable
metal sulphides. Another example of a chemical element that
can be recovered is copper to be used for wire production,
for example. A wastewater treatment plant in China that
treats water from an active copper mine in Jiangxi Dexing (see
Figure 2.5) recovers this element. The facility has a capacity
of treating 24,000 m3 of water per day. Apart from recovering
copper, iron is removed in the procedure. If recovered, iron
can be used as a raw material or as a catalyst.
rewards can be distributed to operations practising recovery, or, on the contrary, enforcing fines for the excessive discharge of nutrients.
076076Main Focus 2. Resource Recovery from Water and Wastewater Systems
2.2.4.1 Challeges for Other Value-added Components
2.2.5 High- versus Low-income Countries
Figure 2.6 Example of a recovered resource. Photograph: Eitrem Holmgren (2014)
One of the biggest challenges when investigating other
value-added components is the overall economics. For
example, in metal recovery there are high start-up and
operating costs. In the case of PHAs, one of the key hurdles
for growth of commercial PHA applications is the price of the
biopolymer relative to that of conventional fossil-fuel-based
polymers (Anterrieu et al., 2013). Extraction of products from
the used water matrix is technologically also a considerable
obstacle. As has been discussed, some of the obstacles
extend well beyond their sector. This is also important for
high-value-added components. In fact, it might even be
more important in this field than others, seeing the amount
of acknowledgement and research that water and energy is
getting, for example.
Challenges and obstacles for resource recovery can differ
geographically as well. One distinction that can be made is
the number of opportunities that arise in high- versus low-
income countries.
In high-income industrialized countries, coverage by sewage
facilities is high and practically all used water is treated at an
advanced level, which includes removal of carbon, nitrogen,
and phosphorus. In low-income countries, on the other hand,
sewage coverage and treatment rates are seen to be less than
10% (Van Loosdrecht and Brdjanovic, 2014). This difference in
coverage alludes to the amount of attention and focus that
resource recovery is getting.
In low-income countries, the amount of recovered resource
applications can be l inked to l imited f inancial and
governmental suppor t with insuff icient polic y and
regulations. One particular example of hindering resource
recovery in low-income countries is given by Chandran
(2014), which relates to the management of faecal sludge.
This example illustrates obstacles arising from the collection
and treatment of sludge to the potential sales of biosolids.
First, there is a lack of policy and regulations on dumping and
collecting the sludge, and there is a high cost of transporting
the sludge to a treatment centre. At the treatment stage,
there is a lack of political will to invest in treatment of faecal
sludge and no funds are budgeted for the operation and
When recovering metals, features such as initial concentrations
of the metal, origin of used water, and the choice between
recovering one metal and a group of metals, are all such
that needs to be considered. Ion exchange, leaching, using
magnetic nanoparticles, and foam fractionation are examples
of technologies that can recover heavy metals (Kurniawan
et al., 2006). Noble metals from industrial waste effluent can
be recovered through photocatalysis (Kurniawan and Babel,
2003). The by-product ash can be further chemically modified
to recover metals from used water (Aklil et al., 2004).
A resource that is new in resource recovery is cellulose.
Schiphol Airport in the Netherlands is an example, where
wipes used for drying hands are separated and processed
into biomass. This idea is also marketed directly to users while
informing them of the procedure. Figure 2.6 is a photo of a
sticker that is displayed in bathrooms in the airport.
Recovering toilet paper is being further researched. The
idea is to extract cellulose at treatment plants and remake
the same product again. As with all technologies and ideas,
it must function in a suitable context. Recovering cellulose
would, therefore, not be applicable in places where the
culture is such that toilet paper is not used.
Figure 2.5 Copper-recovering treatment plant, China
Main Focus 2. Resource Recovery from W
ater and Wastew
ater Systems
077076 /the 7th World Water Forum
Main Focus 2. Resource Recovery from W
ater and Wastew
ater Systems
077076 /
maintenance of such treatment processes even if it has been
established. Third, even if the sludge is treated and generated
into biosolids, there is no market for compost or biosolids,
especially if they are for community-based initiatives,
which then leads to low sales of biosolids and very limited
additional potential revenue coming from biosolids sales.
Consequently, this whole cycle is not viable economically.
As such, advanced countries can invest in recovering
resources as well as possibly having the institutional
framework and infrastructure to put investments into
practice. Rules and regulations may further be stricter
which can be seen as an accelerator for resource recovery.
Regulatory body moreover needs to be in place to quality
control and assure the procedures are being executed as
decided upon. It has been noted that the rate of development
is correlated to legislation (Stark, 2004), which further
highlights the critical role of guidelines and laws within the
field of resource recovery.
In countries in which the treatment for drinking water is
not very advanced, there might not be an incentive for
having facilities for treating used water, let alone recovering
resources. In fact, in many countries today, water from
households and industries is directly discharged into
streams, lakes, and oceans without prior treatment. While
this is a challenge for starting a resource recovery process,
it also provides an opportunity. When building treatment
facilities, they can be structured in a way that takes care of
the potential resources. For example, water can be internally
reused and the facility can heat itself from the products it
cleans.
Apart from investigating challenges for specific recovered
resources separately, it is also worthwhile contemplating
obstacles and possible consequences that might arise when
building a treatment plant that recovers resources (i.e., a
‘resource recovery plant’), or when transforming an ordinary
treatment plant to a recovery plant. Infrastructure must, for
example, be taken into account. Decentralized and locally
situated plants and facilities could be solutions for avoiding
large transport distances. For example, a treatment plant in
Sweden producing biogas for the buses is located adjacent to
As can be seen from the discussion above, there are several
recurring challenges that are outlined. Resource recovery can
lack financial support and an investment strategy. This relates
especially to technologies and ideas that are at an early stage
of innovation. In addition, bringing research and innovative
technologies into practice also has challenges related to the
dimension of scale to establish a business. A rule of thumb
2.2.6 Consequences of New ‘Resource Recovery Plants’
2.2.7 Common Traits
the bus depot (Jonerholm, 2012). Units recovering heat from
used water is another example in which it is beneficial to
have the source close to the point of usage. Another process
to consider is separating used water from households and
industry, which might be of use and further help stimulate
public acceptance and trust.
Finally, it should be kept in mind that once a new resource
recovery plant is built, it is heavily dependent on continuity
of encouraging overall regulation and legislation. Indeed,
experience of subsidy to the biogas sector in Europe has
shown that an unexpected decrease in financial support can
have dramatic consequences on the overall cost/benefit of
installed plants and, moreover, can destroy the willingness of
the sector dealing with environmental technology to invest
in such recovery approaches. Hence, a major consequence of
private, public, or combined investment in recovery plants is
that the overall conceptual framework of striving for a cyclic
economy and the business model that underpins it must
be secured for several decades to come. This might seem
evident, but the current fluctuations in the prices of fossil fuel
and certain other commodities warrant careful consideration
and dedicated commitment upfront for any large-scale
industrial action in this domain.
Therefore, a holistic and interdisciplinary approach and will
are necessities while discussing and planning increased
resource recovery. Collaboration and communication are
keywords in a process that requires resources as well as a
common vision. This proves another challenge, which can
further be seen in other fields of resource recovery practices.
It is, consequently, necessary to urge for an open mind, not
only when it comes to the development of a specific product
but also in the range of possibilities of products to be
explored.
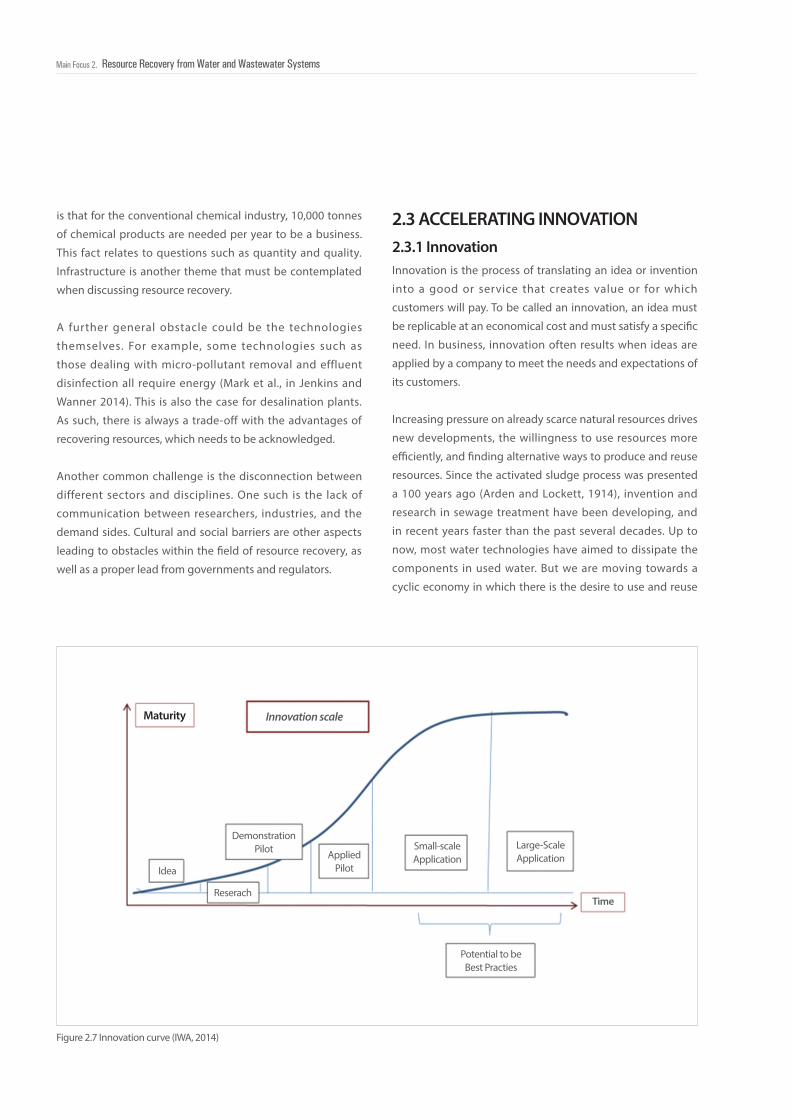
078078Main Focus 2. Resource Recovery from Water and Wastewater Systems
2.3 ACCELERATING INNOVATIONis that for the conventional chemical industry, 10,000 tonnes
of chemical products are needed per year to be a business.
This fact relates to questions such as quantity and quality.
Infrastructure is another theme that must be contemplated
when discussing resource recovery.
A further general obstacle could be the technologies
themselves. For example, some technologies such as
those dealing with micro-pollutant removal and effluent
disinfection all require energy (Mark et al., in Jenkins and
Wanner 2014). This is also the case for desalination plants.
As such, there is always a trade-off with the advantages of
recovering resources, which needs to be acknowledged.
Another common challenge is the disconnection between
different sectors and disciplines. One such is the lack of
communication between researchers, industries, and the
demand sides. Cultural and social barriers are other aspects
leading to obstacles within the field of resource recovery, as
well as a proper lead from governments and regulators.
Innovation is the process of translating an idea or invention
into a good or service that creates value or for which
customers will pay. To be called an innovation, an idea must
be replicable at an economical cost and must satisfy a specific
need. In business, innovation often results when ideas are
applied by a company to meet the needs and expectations of
its customers.
Increasing pressure on already scarce natural resources drives
new developments, the willingness to use resources more
efficiently, and finding alternative ways to produce and reuse
resources. Since the activated sludge process was presented
a 100 years ago (Arden and Lockett, 1914), invention and
research in sewage treatment have been developing, and
in recent years faster than the past several decades. Up to
now, most water technologies have aimed to dissipate the
components in used water. But we are moving towards a
cyclic economy in which there is the desire to use and reuse
2.3.1 Innovation
Figure 2.7 Innovation curve (IWA, 2014)
Idea
Reserach
Demonstration Pilot Applied
Pilot
Small-scale Application
Large-Scale Application
Potential to be Best Practies
Time
Innovation scaleMaturity
Main Focus 2. Resource Recovery from W
ater and Wastew
ater Systems
079078 /the 7th World Water Forum
Main Focus 2. Resource Recovery from W
ater and Wastew
ater Systems
079078 /
2.3.1.1 New Research and Innovative Technologies
With sustainability requirements on energy efficiency,
water reuse, and resource efficiency, for example, recent
changes within water, especially wastewater, systems have
been more rapid than in the 20th century. New research
and innovative technologies link to biological treatment
processes, incorporating discoveries from microbiology into
the treatment process and new technologies on recovering
with minimum destruction and further generate profits
from recovered resources. For this, new research and new
innovations are needed.
There are several phases that a technology or idea must go
through to flourish and evolve into a full-scale application.
Figure 2.7 illustrates these various stages on a scale of
innovation, with the x-axis showing time and the y-axis
maturation. The stages can vary in length and resources
required. Some technologies, for example, need a lot of
prior research and pilot testing before they reach an applied
pilot stage, whereas for others it may take longer to move
from small- to large-scale applications. The latter have the
potential to become both good practices and role models
within their field.
However, there can be several simultaneous processes an
innovation must go through for new ideas or new research to
be obtained. One such can be social acceptance and societal
adoption. An innovation is of no use if a technology is fully
developed and works well in the laboratory but the users
do not accept the procedure or the end-product. Obstacles
along the innovation scale are plenty and, as has been
elaborated upon in the previous section, can deal with policy
aspects, investment, and support in different formats, among
others.
Initial ideas and research that provide solutions to existing
issues tend to have a higher chance of getting funding for
implementation of research and piloting. After reaching
the demonstration and applied pilot stages, some real
applications might be expected, and even commercialized
and used in smaller and larger quantities respectively.
Real applications such as artificial fertilizers have proved that
recovered resources can have potential markets.
chemicals and biofuels, among others. Given below are
several examples of innovative technologies that are at
different stages along the innovation curve.
New ideas and research at an early stage of the innovation
curve can be in the fields of energy, nutrient harvesting,
new biomolecules, and food production (De Vrieze et al.,
2013; Matassa, Boon and Verstraete, 2015). Some examples
are bio-electrochemical systems/processes (BES) (Rabaey et
al., 2010; Pikaar et al., 2014); using light or bacteria/algae to
capture and upgrade products from used water (Hülsen et al.,
2014); implementation of advanced genomic knowledge to
make microbiomes function better (McDougald et al., 2012);
converting recalcitrant organic materials into building blocks
for subsequent biological conversion into liquid fuels and
chemicals (Richter et al., 2013); and using recovered resources
for biopolymers/hydrocolloids.
Especially in the field of energy recovery and energy
efficiency, there are several new technologies that can be
seen in practice or read about. Data in McCarty et al. (2011)
and Batstone et al. (2015) show that anaerobic used water
treatment is the currently most widely applied technology
to recover energy from used water, collected as methane
production. In the USA, approximately 3% of the total
electricity consumption went on used water treatment
in the mid-1990s (Burton, 1996). It was predicted in 1996
that electricity requirements would increase by 20% in the
upcoming 20 years. As has previously been noted, the overall
energy recovery efficiency is approximately 28%. With more
effective methane-driven chemical fuel cells, the efficiency
capacity can increase from 28% to 40%.
Some innovative technologies within the realm of energy
focus on low-energy treatment concepts during the
treatment process, such as Verstraete’s “major and minor
water line system” (Verstraete et al. 2009) and McCarty’s
low energy mainline process (McCarty et al. 2011). These
can contribute to substantial changes from conventional
activated sludge to resource-positive platforms (Batstone et
al., 2015).
An alternative to the typically used anaerobic digestion
for energy recovery is through microbial fuel cells, which
generate electricity through oxidation of organic matter
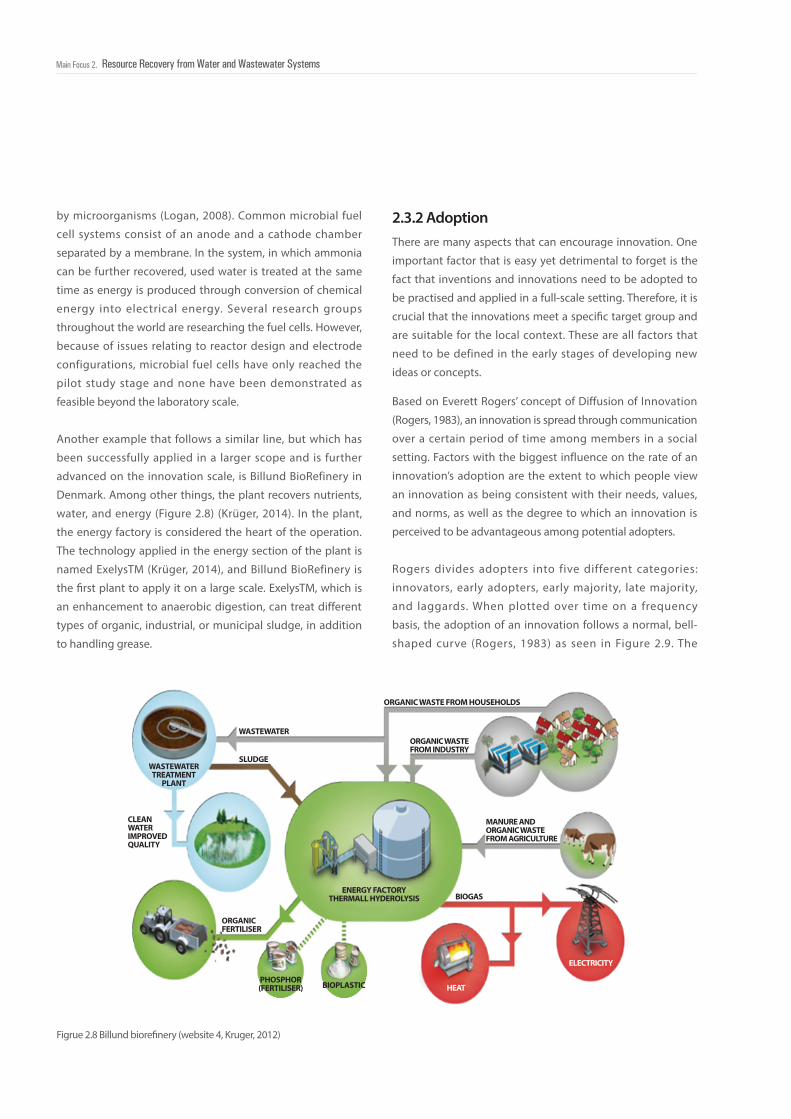
080080Main Focus 2. Resource Recovery from Water and Wastewater Systems
Figrue 2.8 Billund biorefinery (website 4, Kruger, 2012)
2.3.2 AdoptionThere are many aspects that can encourage innovation. One
important factor that is easy yet detrimental to forget is the
fact that inventions and innovations need to be adopted to
be practised and applied in a full-scale setting. Therefore, it is
crucial that the innovations meet a specific target group and
are suitable for the local context. These are all factors that
need to be defined in the early stages of developing new
ideas or concepts.
Based on Everett Rogers’ concept of Diffusion of Innovation
(Rogers, 1983), an innovation is spread through communication
over a certain period of time among members in a social
setting. Factors with the biggest influence on the rate of an
innovation’s adoption are the extent to which people view
an innovation as being consistent with their needs, values,
and norms, as well as the degree to which an innovation is
perceived to be advantageous among potential adopters.
Rogers divides adopters into five different categories:
innovators, early adopters, early majority, late majority,
and laggards. When plotted over time on a frequency
basis, the adoption of an innovation follows a normal, bell-
shaped curve (Rogers, 1983) as seen in Figure 2.9. The
by microorganisms (Logan, 2008). Common microbial fuel
cell systems consist of an anode and a cathode chamber
separated by a membrane. In the system, in which ammonia
can be further recovered, used water is treated at the same
time as energy is produced through conversion of chemical
energy into electrical energy. Several research groups
throughout the world are researching the fuel cells. However,
because of issues relating to reactor design and electrode
configurations, microbial fuel cells have only reached the
pilot study stage and none have been demonstrated as
feasible beyond the laboratory scale.
Another example that follows a similar line, but which has
been successfully applied in a larger scope and is further
advanced on the innovation scale, is Billund BioRefinery in
Denmark. Among other things, the plant recovers nutrients,
water, and energy (Figure 2.8) (Krüger, 2014). In the plant,
the energy factory is considered the heart of the operation.
The technology applied in the energy section of the plant is
named ExelysTM (Krüger, 2014), and Billund BioRefinery is
the first plant to apply it on a large scale. ExelysTM, which is
an enhancement to anaerobic digestion, can treat different
types of organic, industrial, or municipal sludge, in addition
to handling grease.
WASTEWATERTREATMENT
PLANT
CLEANWATERIMPROVEDQUALITY
ORGANIC WASTE FROM HOUSEHOLDS
ORGANIC WASTE FROM INDUSTRY
MANURE ANDORGANIC WASTEFROM AGRICULTURE
BIOGAS
HEAT
ELECTRICITY
WASTEWATER
SLUDGE
ORGANICFERTILISER
PHOSPHOR(FERTILISER)
ENERGY FACTORYTHERMALL HYDEROLYSIS
BIOPLASTIC
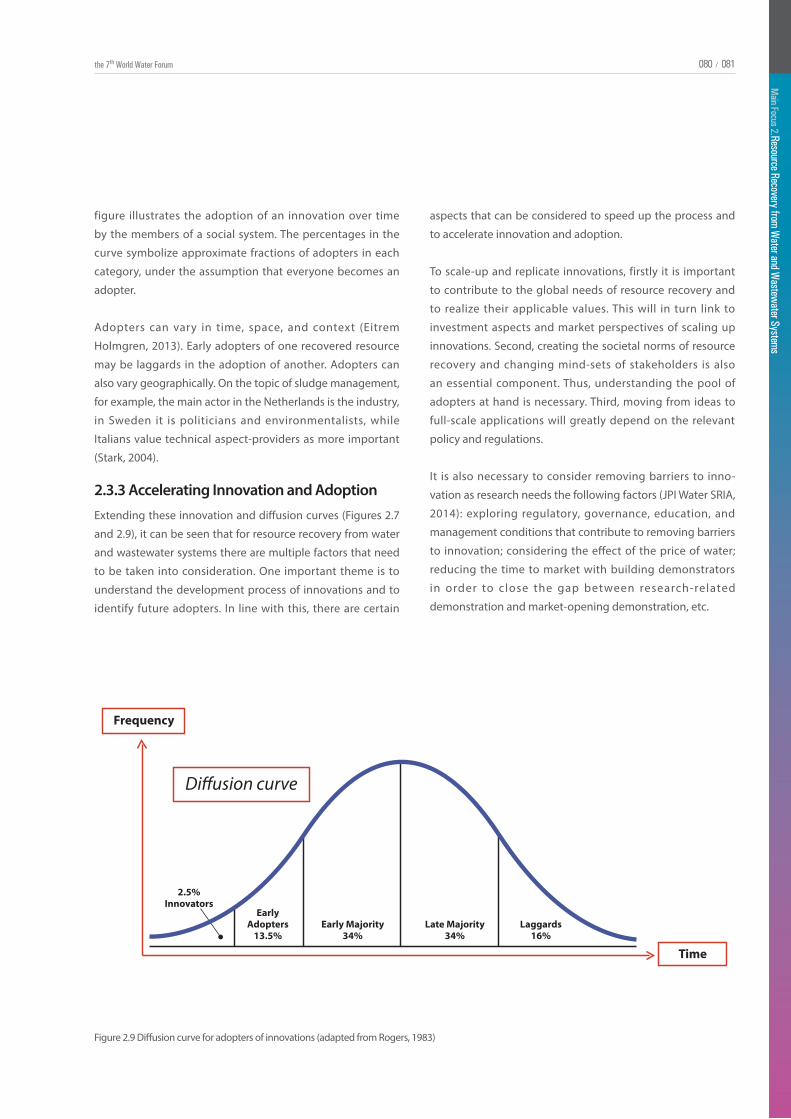
Main Focus 2. Resource Recovery from W
ater and Wastew
ater Systems
081080 /the 7th World Water Forum
Main Focus 2. Resource Recovery from W
ater and Wastew
ater Systems
081080 /
2.3.3 Accelerating Innovation and Adoption
Figure 2.9 Diffusion curve for adopters of innovations (adapted from Rogers, 1983)
Extending these innovation and diffusion curves (Figures 2.7
and 2.9), it can be seen that for resource recovery from water
and wastewater systems there are multiple factors that need
to be taken into consideration. One important theme is to
understand the development process of innovations and to
identify future adopters. In line with this, there are certain
figure illustrates the adoption of an innovation over time
by the members of a social system. The percentages in the
curve symbolize approximate fractions of adopters in each
category, under the assumption that everyone becomes an
adopter.
Adopters can vary in time, space, and context (Eitrem
Holmgren, 2013). Early adopters of one recovered resource
may be laggards in the adoption of another. Adopters can
also vary geographically. On the topic of sludge management,
for example, the main actor in the Netherlands is the industry,
in Sweden it is politicians and environmentalists, while
Italians value technical aspect-providers as more important
(Stark, 2004).
aspects that can be considered to speed up the process and
to accelerate innovation and adoption.
To scale-up and replicate innovations, firstly it is important
to contribute to the global needs of resource recovery and
to realize their applicable values. This will in turn link to
investment aspects and market perspectives of scaling up
innovations. Second, creating the societal norms of resource
recovery and changing mind-sets of stakeholders is also
an essential component. Thus, understanding the pool of
adopters at hand is necessary. Third, moving from ideas to
full-scale applications will greatly depend on the relevant
policy and regulations.
It is also necessary to consider removing barriers to inno-
vation as research needs the following factors (JPI Water SRIA,
2014): exploring regulatory, governance, education, and
management conditions that contribute to removing barriers
to innovation; considering the effect of the price of water;
reducing the time to market with building demonstrators
in order to close the gap between research-related
demonstration and market-opening demonstration, etc.
2.5%Innovators
EarlyAdopters
13.5%Early Majority
34%Late Majority
34%Laggards
16%
HEAT
ELECTRICITY
Frequency
Time
Di�usion curve
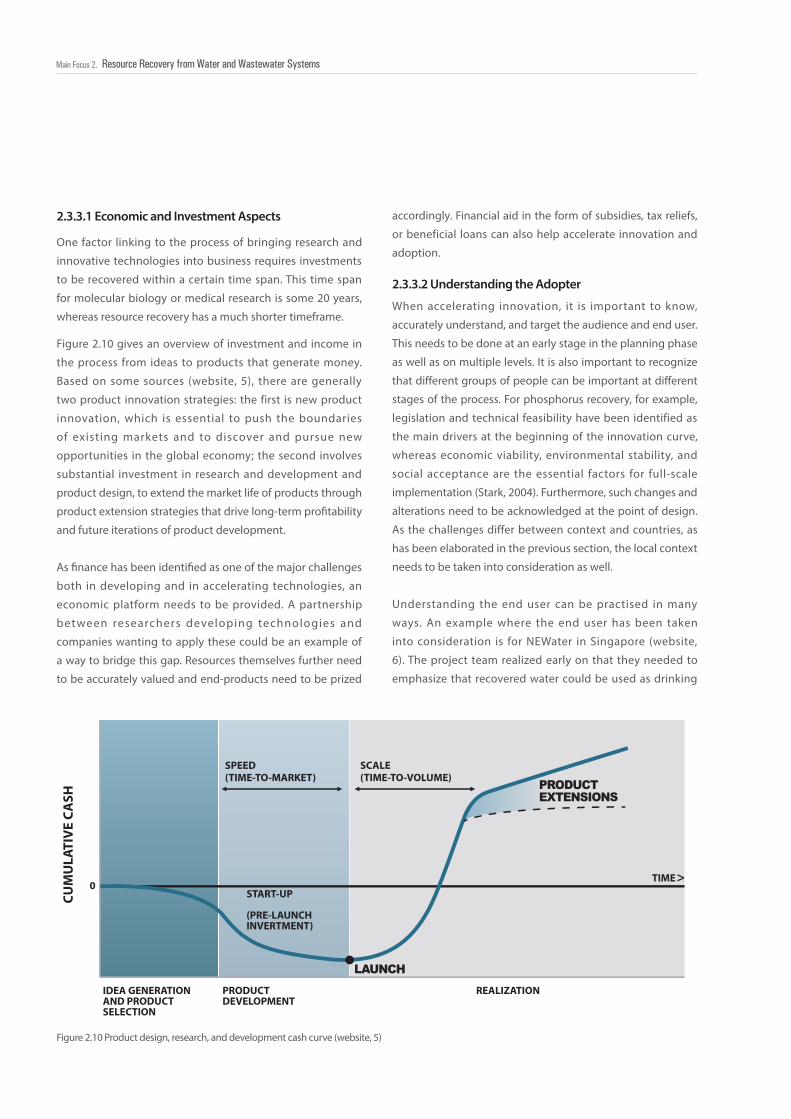
082082Main Focus 2. Resource Recovery from Water and Wastewater Systems
Figure 2.10 Product design, research, and development cash curve (website, 5)
Figure 2.10 gives an overview of investment and income in
the process from ideas to products that generate money.
Based on some sources (website, 5), there are generally
two product innovation strategies: the first is new product
innovation, which is essential to push the boundaries
of existing markets and to discover and pursue new
opportunities in the global economy; the second involves
substantial investment in research and development and
product design, to extend the market life of products through
product extension strategies that drive long-term profi tability
and future iterations of product development.
As fi nance has been identifi ed as one of the major challenges
both in developing and in accelerating technologies, an
economic platform needs to be provided. A partnership
between researchers developing technologies and
companies wanting to apply these could be an example of
a way to bridge this gap. Resources themselves further need
to be accurately valued and end-products need to be prized
When accelerating innovation, it is important to know,
accurately understand, and target the audience and end user.
This needs to be done at an early stage in the planning phase
as well as on multiple levels. It is also important to recognize
that diff erent groups of people can be important at diff erent
stages of the process. For phosphorus recovery, for example,
legislation and technical feasibility have been identified as
the main drivers at the beginning of the innovation curve,
whereas economic viability, environmental stability, and
social acceptance are the essential factors for full-scale
implementation (Stark, 2004). Furthermore, such changes and
alterations need to be acknowledged at the point of design.
As the challenges differ between context and countries, as
has been elaborated in the previous section, the local context
needs to be taken into consideration as well.
Understanding the end user can be practised in many
ways. An example where the end user has been taken
into consideration is for NEWater in Singapore (website,
6). The project team realized early on that they needed to
emphasize that recovered water could be used as drinking
2.3.3.2 Understanding the Adopter
2.3.3.1 Economic and Investment Aspects
One factor linking to the process of bringing research and
innovative technologies into business requires investments
to be recovered within a certain time span. This time span
for molecular biology or medical research is some 20 years,
whereas resource recovery has a much shorter timeframe.
SPEED(TIME-TO-MARKET)
START-UP
(PRE-LAUNCHINVERTMENT)
SCALE(TIME-TO-VOLUME)
LAUNCHIDEA GENERATIONAND PRODUCTSELECTION
PRODUCTDEVELOPMENT
REALIZATION
CUM
ULA
TIV
E CA
SH
TIME0
>
PRODUCTEXTENSIONS
accordingly. Financial aid in the form of subsidies, tax reliefs,
or beneficial loans can also help accelerate innovation and
adoption.
Main Focus 2. Resource Recovery from W
ater and Wastew
ater Systems
083082 /the 7th World Water Forum
Main Focus 2. Resource Recovery from W
ater and Wastew
ater Systems
083082 /
2.3.3.3 Policy and Regulations
water, thus overcoming the ‘yuck factor’. They did this
through successfully campaigning and providing people
with sufficient information to raise public awareness. The
launch of the NEWater project was done simultaneously with
a massive outreach through media, briefings at community
centres and schools, panel debates, and study visits to the
water treatment location site. One of the main goals with
this launch was to prove that it was safe to drink the treated
water. The term “NEWater” proved to be effective as well
because it encouraged, rather than discouraged, people to
consume the product. In other projects, the phrase “recycled
water” as opposed to “repurified” water has been suggested.
Rebranding can also be done through changing the
phrase “wastewater reuse” to “water reuse”, the latter being
considered as more appealing (UN, 2014).
A way of influencing future adopters is to provide successful
case studies and demonstration test sites. These can act as
role models and show positive results, which can trigger
further technologies and ideas. Another way of increasing
the pool of potential adopters and users is through having
technologies that can perform several steps and result
in multiple outputs. Examples can help offset costs while
maximizing outcomes, which are appealing components for
adopters.
Information and data collection can be further keys in
accelerating both innovation and adoption. For example,
realizing that some resources, such as phosphorus, are rapidly
decreasing throughout the world could be an incentive for
generating new ideas to recover them. Spreading information
about a new technology and its successes could further
attract new adopters.
2.4. CONCLUSIONS AND RECOMMENDATIONS
As has been discussed, regulations and policies need to
be carefully taken into consideration when up-scaling a
technology. The importance of laws and guidelines can be
factors determining the development of resource recovery
from water and wastewater systems. Regulations need to
be in place and they need to be enforced and followed
up. It is also desirable that policies help stimulate and
encourage both innovation and adoption. Examples of these
are tax reliefs, subsidies, and lenient regulations on new
technologies.
2.4.1 ConclusionsThis paper has described different resources in terms of
water, energy, nutrients, and others to be recovered. Among
others, current practices on resource recovery from water and
wastewater systems have been overviewed along with their
drivers and challenges.
(a) As the first focus and top of the agenda, water reuse
and reclamation have been developed and practised
far more than any other resources that have been
recovered. Reclaimed water can have a quality as high
as any other drinking water, through best practices
combined with top-notch technology, particularly
monitoring technology and chemical-toxicology
technology, as well as through involvement of different
public sectors. Through the review and examples shown
in this paper, drivers, challenges, and potential solutions
to overcome challenges are provided.
(b) Although water reuse is on the top of the agenda,
An example of the influence of policy and regulation on
resource recovery can be seen in China. In 2000, China issued
an official plan named “Technology and Policy of Municipal
Sewage Treatment and Pollution Prevention and Control”
(website, 7, 9). This action plan for water pollution prevention
and control was submitted to the central government by
the Ministry of Environment in November 2014 for approval
(website, 9). There are a series of specific regulations and
approaches about used water collection, treatment, disposal,
and recycling use for many purposes including environmental
protection, resource conservation and recycling, industrial
sustainable development, as well as biological and ecological
security and health. To enhance the implementation of the
policies and regulations, China’s State Council announced
plans at the end of 2011 to spend RMB3.4 trillion (US$536
billion) on environmental protection before the end of 2015,
of which RMB380 billion (US$60 billion) would go to urban
wastewater systems including reuse. More than half (56%)
of this is expected to come from private sources (website,
8). This example highlights the push from government as
well as positive interaction between government and the
private sector for an accelerated development in used water
treatment and resource recovery.
084084Main Focus 2. Resource Recovery from Water and Wastewater Systems
In the overall context of recovery of resources from water
and used water, there are several recommendations that can
be made, targeting practitioners, developers, adopters, and
innovators as well as decision-makers who indirectly can
change the course of resource recovery.
(a) The good practices and role models that are currently
being applied should be further investigated and
learned from. These existing “showcases” give evidence
and possibilities of other up-scaled applications, and
at the same time they should be examined in detail in
terms of their technical and economic validity, and their
appropriateness for extension and general application
worldwide. Specifically, these cases should be used
to open up discussions with the social and cultural
sectors to assess and adjust their overall acceptability
in the context of different religions, cultural habits, and
economic benefits.
(b) New ideas and innovative technologies relating to
resource recovery from water and used water are being
increasingly developed. This enables the possibility of
exploring the potential of resource recovery from water
to its full capacity. Plenty of new areas are only starting
to be examined (such as blue energy resulting from
mixing cleaned used water and seawater, electro-(bio)
synthesis in used water, food from secondary resources,
etc.) and have to receive the mandate and the support
to cover new grounds. Yet, at the same time, there is
a necessity to explore carefully the boundaries of the
eco-efficiency of each of these potential developments
and potential recovery products, and the way they can
accommodate the needs of the ever-growing economy
of the entire planet.
(c) Systematic management and integration in planning
2.4.2 Recommendations
the hottest topic relating to resource recovery is
connected to energy efficiency and recovery in water
and wastewater systems. Energy-related matters
within water and wastewater systems include both
energy production and recovery. Most of the energy
forms generated or recovered are reused to feed into
the treatment system, which in turn increase energy
efficiency and occasionally lead to energy-positive
systems.
(c) There are multiple nutrients that can be recovered from
wastewater treatment plants, with phosphorus and
nitrogen being the most commonly recovered nutrients.
Nutrient recovery was partly triggered by the success
of using artificial fertilizer for food production, which
also stimulated discussion on food security and utilizing
reused water for irrigation. The time has also come to
reuse nitrogen by directly upgrading it at the site of
recovery to a valuable feed or food.
(d) Valuable components such as sulphur, cellulose, metals,
and biochemically generated organics (bioplastics
for instance) have potential to gain more attention as
societal acceptance of the cyclic economy gains more
importance.
There are some common themes that can be derived
from the different resources that can be recovered. One
is that there is a great need for the resource while there is
not a specific demand for recovered resources per se. This
distinction is of great importance. There is a shift in mind-set
that is needed as the current, urgent demand may be met by
resource production through alternative methods. The status
of “recovered resource” must be cleared from its all too often
“waste”-related connotation.
Financial assets as well as rules and regulations can act both
as obstacles and as opportunities. More technologies are
needed while at the same time the end-products must have
a fair chance of competing on the market. The user, be it a
treatment plant, a farmer, a school, residents in households,
or an airport, must accept the practice and be willing to use
it. Collaborations between different stakeholders, such as
public and private partnerships, are few today; as such, there
is great room for improvement. Many of the technologies
and resource recovery practices further require that different
sectors work together, preferably at an early stage of the
process.
The intrinsic and added value of material and substances that
is referred to as “waste” needs to be realized and approached
accordingly. It is also important to keep in mind that what
might be practised in one setting may not be suitable or
appropriate in another, thereby highlighting the need to plan
context-specific approaches. Fear of unacceptance can be
a challenge in the field of resource recovery as it can hinder
ideas and projects. In recovering resources, a trade-off will
always be seen and it is important to weigh holistically the
short- and long-term benefits against the costs.

Main Focus 2. Resource Recovery from W
ater and Wastew
ater Systems
085084 /the 7th World Water Forum
Main Focus 2. Resource Recovery from W
ater and Wastew
ater Systems
085084 /
national bodies of legislators to construct workable
legal frameworks in which resource recovery is clearly
defined for its operational acceptability across borders
and within each country. Moreover, the water sector
should also interact with policy-makers in terms
of economic platforms that will facilitate the cyclic
economy within the sector of water use and reuse, as
well as innovative research and development within this
field.
(f ) There is a major need to promote financing for research
and development in the science and technology of
resource recovery at large, and embedding it in the
planning of global needs for the coming decades. It is
essential to encourage both innovation and transition
towards upscaling the implementations of resource
recovery, particularly in the water sector. Research can
be of a further critical nature in the sense that it dares to
address and delineate the limits that can be attained by
the cyclic economy. Indeed, resources to be recovered
are limited and the sustainability of the planet must be
assessed in the context both of the primary materials
it needs and will continue to consume and of those
potentially supplied by the reuse loops that will be
developed.
Overall, resource recovery from water and wastewater
systems should be empowered by the fact that it will
bring forward new technical approaches that will become
integrated in rural systems as well as in industrial society
at large. These technical approaches will, thus, help
decentralized and highly urbanized societies to have better
and more efficient supply of water in all its applications.
Moreover, on a global scale, this new way of integrating the
cyclic economy in the world of water supply and use will
strongly help to abate climate change as it affects the critical
issues of energy saving and emission of greenhouse gases
in many ways. It is of prime importance to inform decision-
makers and the general public as a matter of urgency about
the potential but also the risks and limits of resource recovery
from water and wastewater systems. Finally, it is crucial to
set well-defined agendas for concrete policies to proceed in
terms of financial encouragement for these new approaches
and to establish legal frameworks with timeframes of at
least several decades, so that the overall perspectives of
resource recovery will become internationally recognized and
accepted as well as practised.
are vital. This considers the option of dealing with
resource recovery from water not only post factum,
but upfront in the water chain where pristine resources
are used. In other words, it is of value to do as other
sectors are doing, which are now orienting themselves
towards recovery and therefore interact a priori
with the designers of commodities (e.g., electronic
apparatus, cars, etc.) so that they can be de-assembled
in an elegant way, allowing re-use without entailing
excessive costs. To do so, the water industry needs to
liaise with its partners such as the food, detergent,
and pharmaceutical industries, as well as relevant
stakeholders. Collaborations such as these can aid in
approaching a design of processes and products that
are conceived not to be destined as end of pipe, but
rather as part of a cyclic economy. To reach potential
environmental and economic benefits from the
recovered resources, the water industry will have to
bridge with other industrial sectors such as the energy,
chemical, food, and manufacturing industries to
identify and particularly quantify the potential demands
that these sectors hold in terms of commodities
recovered from the water cycle. Moreover, the water
sector should also align with the industrial sector
dealing with the recycling of solid and other wastes.
Indeed, it is essential that the recycling processes are
fully focused on the “pull” side and moreover acquire
sufficient dimension of scale that they can be properly
engineered and controlled in terms of mass flow and
quality performance. The research agenda should
clearly identify and address the overall chain as well as
upgrade the concept of “water treatment” to the level of
“downstream processing”.
(d) It is of crucial importance to communicate to society
in general and to the stakeholders such as end users
in particular that the drinking and used water sector is
willing to contribute to minimizing damaging practices
by integrating process steps that no longer only use,
but also re-use, the resources that are present in the
water cycle. To that extent, the water sector will have
to integrate the concepts of life cycle assessment, strict
quality control, and hazard assessment in this cyclic way
of dealing with water.
(e) It is also of crucial importance that the water sector
intensifies its interactions with international and
086086Main Focus 2. Resource Recovery from Water and Wastewater Systems
Addams, L., Boccaletti, G., Kerlin, M., and Stuchtey, M. (2009).Charting our water future: economic frameworks to inform decision-making. McKinsey and Company, New York, USA.
Agler, M. T.; Spirito, C. M.; Usack, J. G.; Werner, J. J.; Angenent, L. T., Chain elongation with reactor microbiomes: upgrading dilute ethanol to medium-chain carboxylates. Energy Environ. Sci. 2012, 5, (8), 8189-8192.
Ardern, E. and Lockett, W.T. (1914) Experiments on the Oxidation of Sewage Without the Aid of Filters, Journal of the Society of Chemical Industry, Vol 33, No 10, pp 523 - 539 (presented at Manchester Section meeting on April 3, 1914).
Asano, T., Burton, F. L., Levernez, H. L., Tsuchihashi, R., and Tchobanoglous, G. (2007). Water Reuse Issues, Technologies, and Applications. McGraw Hill, New York.
Backer, L. C. (2002). Cyanobacterial harmful algal blooms (CyanoHABs): Developing a public health response. Lake and Reservoir Management, 18(1), 20-31.
Batstone, D.J., Hülsen, T., Mehta, C.M., Keller J. (2015), Platforms for energy and nutrient recovery from domestic used water: A review, Chemosphere, article in press, available online 6 November 2014, ISSN 0045-6535, Article in Press http://dx.doi.org/10.1016/j.chemosphere.2014.10.021.
Burton, F. L. (1996) Water and Wastewater Industries: Characteristics and Energy Management Opportunities; CR-106941; Electric Power Research Institute, Inc. (EPRI), Community Environmental Center: St. Louis, MO.
Caldwell , P.(2009) .Energy efficient sewage treatment : Can energy positive sewage treatment works become the standard design? Third European Waste and Wastewater Management Conf .
Chandran, K. (2014), Technologies and framework for resource recovery and beneficiation from human waste.in: Ahuja S (edited, 2014), Water Reclamation and Sustainability, Elsevier, ISBN: 978-0-12-411645-0.
City of Stockholm (2014). Roadmap for a fossil fuel-free Stockholm 2050. Blomquist.
De Vrieze, J., De Lathouwer, L., Verstraete, W., Boon, N. (2013) High-rate iron-rich activated sludge as stabilizing agent for the anaerobic digestion of kitchen waste, Water Research, Vol. 47, Issue 11, pp. 32-41.
Dewettinck, T., Van Houtte, E., Geenens, D., Van Hege, K., and Verstraete, W. (2001). HACCP (Hazard Analysis and Critical Control Points) to guarantee safe water reuse and drinking water production-a case study.Water Science and Technology, 43(12), 31-38
REFERENCES
Du Pisani P. L. (2006) Direct reclamation of potable water at Windhoek”s Goreangab Reclamation Plant, Desalination, vol. 188, pp: 79-88.
Eitrem Holmgre, K. (2013) Adsorbing for appropriateness: An interdisciplinary evaluation of the implementation of a defluoridation technique in rural Tanzania.Disssertation, Purdue University, http://docs.lib.purdue.edu/dissertations/AAI1549342/
Hardi, E., and Latta, P. (2009).Biogas Injection in the Local Natural Gas Grid- Issues and Solutions, Monitoring and Control in Pilot Case.Alliander Presented at World Gas Conference (WGC), Buenos Aires, Argentina.
Hawley, C., and Fenner, R. (2012). The potential for thermal energy recovery from wastewater treatment works in southern England. Journal of Water and Climate Change, 3(4), 287-299.
Howe, C. and Mitchell, C (edited, 2012), Water Sensitive Cities, IWA publishing, ISBN: 9781843393641.
IWA Resource Recovery Cluster (2014, under review) State of the Art Compendium Report: Resource Recovery from Water, the International Water Association.
Jasinski, S. M. (2012) Minerals Commodities Summary: Phosphate Rock. U.S. Geological Survey, Mineral Commodity Summaries, January 2012. http://minerals.usgs.gov/minerals/pubs/commodity/phosphate_rock/mcs-2012-phosp.pdf (accessed 8 February 2014).
Jenkins, D. and Wanner, J (edited, 2014), Activated Sludge – 100 Years and Counting, IWA Publishing, ISBN 9781780404936 (Hardback), ISBN 9781780404943 (eBook).
J iménez, B. , and Asano, T. (2008). Chapter 1: Water Reclamation and Reuse Around the World. In B. Jimenez and T. Asano (Eds.) Water Reuse- an International Survey of current practice, issues and needs (pp. 3-27). London, UK: IWA Publishing
Jonerholm, K (2012). Production and supply of biogas in the Stockholm region. Baltic Biogas Bus. (http://www.balticbiogasbus.eu/web/Upload/Supply_of_biogas/Act_4_6/Production%20and% 20supply% 20of% 20biogas% 20in% 20the% 20Stockholm% 20region.pdf, accessed 3 Feb. 2015)
Jung, E. E., Jain, A., Voulis, N., Doud, D. F.R., Angenent, L. T. , Erickson, D., (2014) Stacked optical waveguide photobioreactor for high density algal cultures, Bioresource Technology, Vol. 171, Pages 495-499.
Krüger.(2012) EXELYSTM Continuous Thermal Hydrolysis. http://www.kruger.dk/krugeras/ressources/files/1/17017,SVR_Exelys_2012_EN_web.pdf (accessed 2014)

Main Focus 2. Resource Recovery from W
ater and Wastew
ater Systems
087086 /the 7th World Water Forum
Main Focus 2. Resource Recovery from W
ater and Wastew
ater Systems
087086 /
Kurniawan, T.A., and Babel, S., (2003). A research study on Cr (VI) removal from contaminated wastewater using low-cost adsorbents and commercial activated carbon. In: Second Int. Conf. on Energy Technology towards a Clean Environment (RCETE), vol. 2. Phuket, Thailand, 12–14 February, pp. 1110–1117.
Kurniawan, T. A., Chan, G., Lo, W. H., and Babel, S. (2006). Physico–chemical treatment techniques for wastewater laden with heavy metals. Chemical engineering journal, 118(1), 83-98.
Law, I. B.,(2003) Advanced Reuse – from Windhoek to NEWater and Beyond, the International Desalination & Water Reuse Quarterly, Vol 13, Issue 1
Lazarova, V., Peregrina, C., & Dauthuille, P. (2012). Chapter 6: Towards energy self-sufficiency of wastewater treatment. In Lazarova, V., Choo, K. H., & Cornel, P. (Eds.).Water-energy interactions in water reuse (pp 87-127). London, United Kingdom: IWA Publishing.
Leflaive, X. (2012). “Water Outlook to 2050: The OECD calls for early and strategic action”, GWF Discussion Paper 1219, Global Water Forum, Canberra, Australia.
Lenker, C., Harclerode, M., Aragona, K., Fisher, A., Jasmann, J., and Hadley, P. W. (2014). Integrating Groundwater Conser vation and Reuse into Remediation Projects. Remediation Journal, 24(2), 11-27.
Logan, B. E. (2008). Microbial fuel cells.John Wiley and Sons.
Matassa, S., Boon, N., Verstraete, W. (2015) Resource recovery from used water: The manufacturing abilities of hydrogen-oxidizing bacteria, Water Research, Vol. 68, Issue 1 pp: 467-478, ISSN 0043-1354, http://dx.doi.org/10.1016/j.watres.2014.10.028
McCarty, P. L., Bae, J. and Kim, J. (2011) Domestic Wastewater Treatment as a Net Energy Producer - Can This be Achieved? Environ. Sci. Technol., vol. 45, issue 7100.
McDougald, D, Rice, S. A., Barraud, N., Steinberg, P. D., and StaffanKjelleberg, S., (2012) Should we stay or should we go: mechanisms and ecological consequences for biofilm dispersal, Nature Reviews | Microbiology, Vol. 10, issue 39.
Meda, A., Lensch, D., Schaum., and Cornel, P. (2012). Chapter 2: Energy and water: relations and recovery potential. In. V. Lazarova, K.H Choo, and P. Cornel (Eds.).Water–energy interactions of water reuse, 21-35.
Mo, W., and Zhang, Q. (2013). Energy–nutrients–water nexus: Integrated resource recovery in municipal wastewater treatment plants. Journal of environmental management, 127, 255-267.
Molle, B., Brelle, F., Bessy, J., and Gatel, D. (2012) Which water quality for which uses? Overcoming over-zealous use of the precautionary principle to reclaim wastewater for appropriate uses, Irrigation and Drainage, Volume 61, Issue Supplement S1, pp 87–94.
Olsson, G. (2012). Water and energy: threats and opportunities. IWA Publishing.
Pikaar, I., Mejia Likosova, E., Freguia, S., Keller, J., Rabaey, K., & Yuan Z. (2014, accepted) Electrochemical abatement o f hyd ro g e n s u l f i d e f ro m w a s t e s t re a m s, C r i t i c a l Reviews in Environmental Science and Technology, DOI: 10.1080/10643389.2014.966419
Po, M., Nancarrow, B. E., and Kaercher, J. D. (2003). Literature review of factors influencing public perceptions of water reuse (pp. 1-39). Victoria: CSIRO Land and Water.
Rabaey, K.,Butzer, S., Brown, S., Keller, J. and Rozendal, R. A. (2010). High current generation coupled to caustic production using a lamellar bioelectrochemical system. Environ. Sci. Technol. Vol 44, Issue 11, pp 4315−4321.
Rabaey, K., and Verstraete, W. (2005). Microbial fuel cells: novel biotechnology for energy generation. TRENDS in Biotechnology, 23(6), 291-298.
Redwood, M., and Huibers, F. (2008). Chapter 11: Wastewater Irrigation in Urban Agriculture. In B. Jimenez and T. Asano (Eds.) Water Reuse- an International Survey of current practice, issues and needs (pp. 228-241). London, UK: IWA Publishing.
Richter, H., Martin, M. E. and Angenent L. T. (2013).A two-stage continuous fermentation system for conversion of syngas into ethanol. Energies, Vol. 6, No. 8, pp. 3987-4000.
Rogers, Everett M. (1983).Diffusion of Innovations. New York: Free Press. ISBN 978-0-02-926650-2.
Sartorious C., van Horn J., and Tettenborn, F. (2011).Phosphorus recovery from wastewater – state-of-the-art and future potential. Proceedings of Nutrient Recovery and Management 2011, January 9-12, 2011, Miami, FL, CD-ROM, Water Environment Federation, Alexandria, VA, USA.
Schröder, R. (2014). European Water Policy [PowerPoint slides]. Presented 1 April 2014 at WWTmod2014.
Siezen, R. J. and Galardini, M. (2008), Genomics of biological wastewater treatment, Microbial Biotechnology, vol. 1, pp: 333–340. doi: 10.1111/j.1751-7915.2008.00059.x
Stark, K. (2004). Phosphorus recovery–Experience from European countries.In Proceedings of Polish-Swedish seminars, Stockholm June 6-8.

088088Main Focus 2. Resource Recovery from Water and Wastewater Systems
Strategic Research and Innovation Agenda, V1.0 (2014): European JPI Water.
Tim Hülsen, Damien J. Batstone, Jürg Keller, Phototrophic bacteria for nutrient recovery from domestic wastewater, Water Research, Volume 50, 1 March 2014, Pages 18-26, ISSN 0043-1354, http://dx.doi.org/10.1016/j.watres.2013.10.051. (http://www.sciencedirec t .com/science/ar t ic le/pi i/S0043135413008579)
Tortajada, C. (2006). Water Management in Singapore, International Journal of Water Resources Development, 22:2, 227-240, DOI: 10.1080/07900620600691944
Van Loosdrecht M. C. M., Kuba T. van Veldhuizen H. M. Brandse F. A. and Heijnen J. J. (1997), Environmental impacts of nutrient removal processes: case study, J. Environ. Eng., Issue 123, 33–40.
Van Loosdrecht, M. C. M. , and Brdjanovic D. (2014) Anticipating the next century of wastewater treatment, Science, 27 June 2014, Vol. 344 No. 6191 pp. 1452-1453, DOI: 10.1126/science.1255183
Van Loosdrecht M. C. M., SeahH., Wah, Y. L., and Cao,Y. S., (2014) the next 100 yearsin“Jenkins, D. and Wanner, J (edited, 2014), Activated Sludge – 100 Years and Counting, IWA Publishing, ISBN 9781780404936 (Hardback), ISBN 9781780404943 (eBook)”, pp. 407- 424
Verstraete, W and Vlaeminck, S.E. (2011), ZeroWasteWater: short-cycling of wastewater resources for sustainable cities of the future. International Journal of Sustainable Development & World Ecology, Vol. 18, No. 3, June 2011, 253–264.
Water Environment Federation (WEF) (2009).Design of Municipal Wastewater Treatment Plants, Manual of Practice No. 8, 5th ed., Water Environment Federation, Alexandria, VA (USA).
Water Environment Research Foundation (WERF). (2011). Nutrient Recovery State of the Knowledge - As of December 2010. WERF. September 2011.
World Health Organization (WHO) (2006).Guidelines for the Safe Use of Wastewater, Excreta and Greywater: Volume 4- Excreta and greywater use in agriculture. Paris, France: WHO Library Cataloguing-in-Publication Data.
World Water Assessment Programme (WWAP) (2009). The United Nations World Water Development Report 3: Water in a Changing World. Paris: UNESCO, and London: Earthscan.

Main Focus 2. Resource Recovery from W
ater and Wastew
ater Systems
089088 /the 7th World Water Forum
Main Focus 2. Resource Recovery from W
ater and Wastew
ater Systems
089088 /
(1) Orange County”s Groundwater Authority. (2013) About Orange County Water District.http://www.ocwd.com/About.aspx(accessed 9 June 2014)
(2) San Diego plans innovative water repurification project: treating sewage until it’s fit to drink. (n.d.) >The Free Library. (2014). (accessed 8 June 2014) fromhttp://www.thefreelibrary.com/San+Diego+plans+innovative+water+repurification+project% 3a+treating..-a019563316
(3) Lee, M. The San Diego Union Tribune.(2005) Perceptions of Purity Still Cloud City”s Push to Reuse Wastewater.http://www.sandiego.gov/water/pdf/purewater/050712.pdf (8 June 2014)
(4) Principal Drawing of Billund Biorefinery http://www.bil lundbioref iner y.dk/images/Fi ler_ti l_download/Principal_drawing_Billund_BioRefinery.pdf (accessed 24 June 2014)
(5) Product design, research and development: A Canadian Manufacturing Perspective, Industry of Canada, https ://w w w.ic.gc.ca/eic/s i te/dsib - dsib.nsf/v wapj/PDRDReport_en.pdf/$file/PDRDReport_en.pdf, (accessed 20 November 2014)
(6) Singapore”s Public Utility Board. (2014) NEWater.http://www.pub.gov.sg/water/newater/Pages/default.aspx (accessed November 2014)
(7) Wastewater Production, Treatment, and Use in China, report at UN-Water Activity Information System http://www.ais.unwater.org/ais/pluginfile.php/501/mod_page/content/85/report_china.pdf(accessed November 2014)
(8) Five years to clean up China”s wastewater, Global Water Intelligence, http://www.globalwaterintel.com/archive/13/1/general/five-years-clean-chinas-wastewater.html (accessed November 2014)
(9) http://news.163.com/14/1201/09/ACCCL5S100014SEH.html(in Chinese) (accessed 30 November, 2014)
WEBSITES
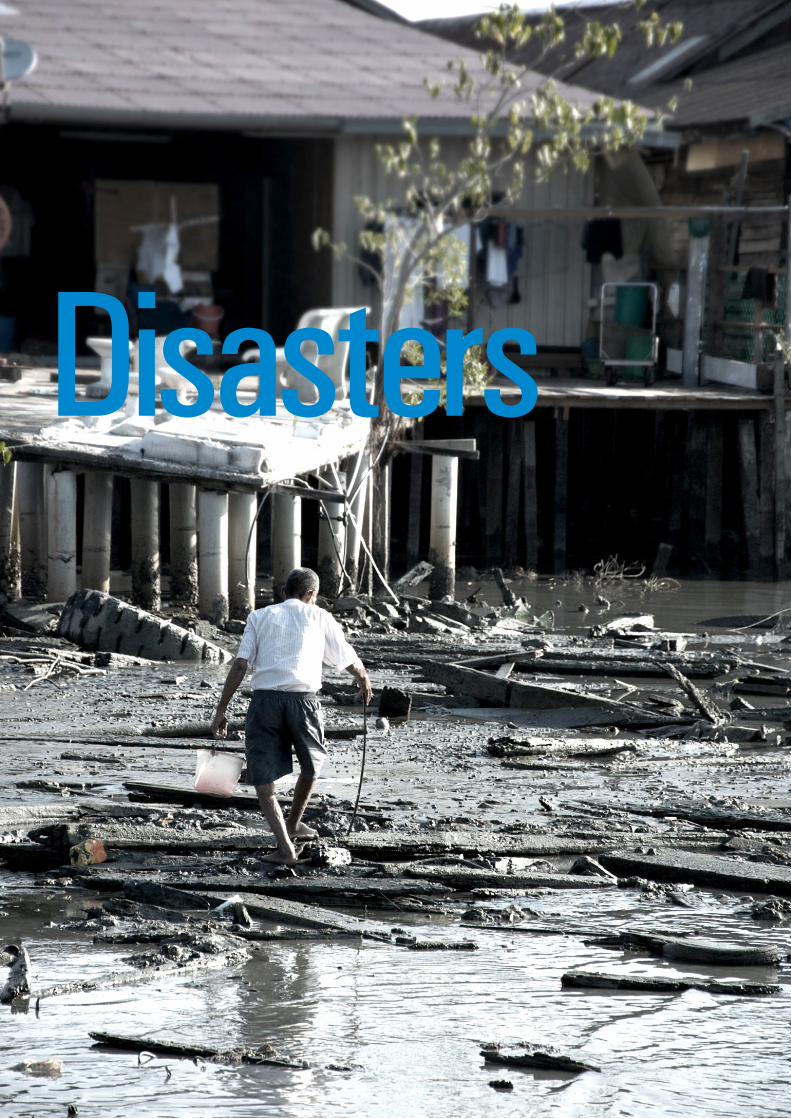
Disasters
Main Focus 3
Water and Natural Disasters
The global climate change is a phenomenon already underway and affects
exceedingly unusual natural patterns of weather events and water cycle.
Therefore we need our efforts to solve water related problems such as
droughts and floods due to the climate change through adaptation.
Wat
er a
nd
Natu
ral D
isast
ers
Main Focus 3 092
3.1 INTRODUCTION
As many devastating impacts of recent natural disasters
such as the flood, drought in Asia, Europe, and America
indicates, mankind is vulnerable to extreme weather events
in both developing and developed countries. Clearly, such
extreme events have already been part of our life but may
be driven even more by climate change in the future. Global
climate change is now well known and its impacts are a stark
reality(Zimmerman, 2002). That is, the global climate change
is a phenomenon already underway and causes exceedingly
unusual natural patterns of weather events and water cycle.
Climate change is predicted to have a range of serious
consequences, some of which will have impact over the
longer term, like droughts, while some have immediate and
obvious impacts, such as intense rainfall and flooding. Floods
and droughts are major natural disasters involving loss of life
and the destruction of property. So, we may need advanced
technologies and measures in order to cope with natural
disasters. Also, the climate change impact and adaptation for
water related disasters are important issues.
As addressed in the section 3.3, quantifying the impacts and
providing disaster relief are more difficult for drought than
for other natural hazards due to long lasting impacts that can
filter through economies and the environment for months,
years and even decades. In recent years, concern has grown
worldwide that droughts may be increasing in frequency,
severity, and duration given changing climatic conditions
and documented increases in extreme climate events. The
frequent occurrence of drought coupled with increasing
severity of its impacts make the traditional reactive approach
inadequate. Proactive risk management is therefore
necessary, particularly to reduce water shortage in water
supply systems. The first phase of a proactive approach is an
assessment of water resources availability. The second phase
foresees a continuous monitoring of hydro-meteorological
variables and water reserves status in order to identify
possible water crises and to apply the necessary mitigation
measures before a real water emergency occurs. By taking
advantage of recent progress in drought monitoring
and climate prediction, governments can empower local
communities to anticipate and prepare for drought and
reduce their impacts. This can be achieved by strengthening
the producer organizations, promoting the climate change
resilient crops and livestock, and facilitating access to market
intelligence, excess water conservation in rainy season
Main Focus 3. W
ater and Natural Disasters
093092 /the 7th World Water Forum
3.2 CLIMATE CHANGE : IMPACT ASSESSMENT AND ADAPTATION3.2.1 Background
and motivating community to save water by reducing
unnecessary use. Drought policy options should be provided
in each of four principle areas: (a) risk and early warning,
including vulnerability analysis, impact assessment, and
communication; (b) mitigation and preparedness, including
the application of effective and affordable practices; (c)
awareness and education, including a well-informed public
and a participatory process; and (d) policy governance,
including political commitment and responsibilities.
Urban flooding, which is addressed in Section 3.4, is a growing
issue for developed and developing countries and for
reducing impact on people, buildings, and municipal and
industrial infrastructure. Furthermore, urban areas are
becoming more vulnerable to flooding than ever before due
to climate change and rapid and unregulated urbanisation
and land use. Therefore, it is important to mitigate the
impacts of urban flooding by integrating latest technologies
and traditional knowledge as well as developing appropriate
management and early warning systems. The major objective
for mitigating urban flood is not only on reducing direct and
subsidiary series damages but also better planning a resilient
urban area to natural hazards. Climate change and fast land
development associated with urbanization and without
appropriate planning further intensify the vulnerability
of the urban areas from flooding. In order to mitigate and
overcome those challenges, technical and management
solutions have been developed. As technical solutions, flood
defence systems such as flood gates, doors, and barriers as
well as flood forecasting and observation technologies are
developed. The representative management solutions for
flood control are the integrated flood management system
and the flood warning system. It is important to note that
the balance between applying the technologies to mitigate
urban flood effects and reshaping the urban environment
into flood defensive is also a critical action in the future.
The section 3.5 reviews the strengths of technologies used
for disaster risk management and the challenges in using
them and introduces useful examples and application
plans of technologies supporting disaster risk management
such as Information and Communication Technology (ICT),
space technology including remote sensing technology,
geographic information system (GIS). These technologies
can play a significant role in the analysis of the potential
risk and can help identify measures to prevent or reduce
damage loss and allow for a resilient recovery from a natural
disaster that can be exacerbated by manmade factors such as
globalization, population growth, poverty, urbanization and
changes in land use and climate change. Although scientific
knowledge and technology are advanced, it is needed
for effective application of these technologies to develop
universal methodologies for disaster risk management
and to convince people who are not familiar with disaster
risk management especially, developing countries and
local communities even in the advanced country. For one
solution, an international platform for information sharing
and technology transferring is suggested in the last part of
the section 3.5. For the successful adaptation, policy-makers
and practitioners should be fully aware of the latest scientific
knowledge on disasters risk management, and be capable
of utilizing those scientific findings. Also national platforms
should be empowered to incorporate technology into real
practice which can help to adopt a common methodology
on data collection and economic analysis of disasters and
also to realize evidence-based policy making on disaster risk
reduction to be practiced globally.
Floods, droughts and windstorms are the most frequently
occurring natural disaster events and account for almost
90% of the 1,000 most disastrous events since 1990(WCDRR,
2014). The occurrence of floods and droughts are expected
to increase with a changing climate, with the IPCC predicting
these water-related disasters to increase in both frequency
and severity, as the whole global water cycle is affected
by global warming. Since the original Rio Earth Summit in
1992 floods, droughts and storms have affected 4.2 billion
people (95% of all people affected by disasters) and caused
USD 1.3 trillion of damage (63% of all damage). USD 2.5
trillion economic losses from disasters so far this century –
70% relate to floods and droughts. Water-related hazards
account for 90% of all natural hazards, and their frequency
and intensity are generally increasing (WWAP, 2012). By
2050, rising populations in flood-prone lands, climate
change, deforestation, loss of wetlands and rising sea levels
are expected to increase the number of people vulnerable
094094094Water and Natural DisastersMain Focus 3.
to flood disaster to 2 billion. Current IPCC projections of
rising temperatures and sea levels and increased intensity
of droughts and storms suggest that substantial population
displacements will take place within the next 30-50 years,
particularly in coastal zones ( WWAP, 2009). A global
temperature increase of 3-4°C could cause changed run-off
patterns and glacial melt will force an additional 1.8 billion
people to live in a water scarce environment by 2080 (NHDR,
2007). Water is key in managing disaster and addressing
climate change impacts, because water is the medium
through which most climate impacts and many disasters
such as droughts and floods are felt.
Climate change is a crucial issue for our future and already
affecting climate, people, and resources in this world. These
impacts are projected to grow and there is the urgent need
to address water related disasters due to the climate change,
especially, in developing countries. Therefore, we need to
mitigate negative impacts and take advantage of possible
opportunities. Also, the adaptation strategies should be
implemented with recognition of both local experiences and
innovative technologies to provide decision makers with
cutting edge information on the vulnerability to climate
change.
Climate change is strongly affecting many aspects of systems
related to snow, ice, and frozen ground; emerging evidence
shows changes in hydrologic systems, water resources,
coastal zones, and oceans (IPCC 2007). Extreme precipitation
events over most of the mid-latitude land masses and over
wet tropical regions will very likely become more intense and
more frequent by the end of this century, as global mean
surface temperature increases (IPCC, 2013). Climate change
has also contributed to a rise in extreme weather events
including stronger typhoon intensity, heavier localized
rainstorm, and increases in extent, severity and duration of
droughts. As hydrologic variation due to the climate change
is becoming more severe in time, especially, floods and
droughts have frequently occurred throughout the world
causing the damage of property and loss of life. Therefore,
more intensive natural disasters such as floods and droughts
3.2.2 Framing the Callenges3.2.2.1 Impact of Climate Change on Water Related Disasters and Climate Risks
are expected to occur in future (UNISDR 2008).
Components of population growth, urbanization, and
industrialization have also an important connection to both
the challenges and solutions to the problem of climate
change. Rapid increase in these components exacerbates
vulnerability to the negative consequences of climate change
– including floods, droughts, environmental deterioration,
and declining food production. For an example, many of the
global megacities (those with populations over 10 million) are
located on the coast: Tokyo, Jakarta, Shanghai, New York City,
Mumbai, Bangkok and Lagos, to name a few. Their locations
are borne out of necessity: 90 percent of global commerce is
done by sea. So while urbanizing along the coastline allows
countries to more easily tap into global trade, coastal cities
may be vulnerable to sea level rise and more frequent and
intense typhoons, hurricanes and other extreme weather
events that could result from climate change(http://gt2030.
com/2012/07/18/urbanization-and-the-global-climate-
dilemma).
Flooding and droughts can cause a range of health impacts
and risks including: death and injury, contaminated drinking
water, hazardous material spills, water shortage, food security,
and water related disease. Water quality and ecological
problems can be also occurred by temperature change due
to the climate change.
Responding to climate-related risks involves decision-making
in a changing world, with continuing uncertainty about the
severity and timing of climate-change impacts and with limits
to the effectiveness of adaptation. Uncertainties about future
vulnerability, exposure, and responses of interlinked human
and natural systems are large. This motivates exploration
of a wide range of socioeconomic futures in assessments
of risks. Key risks are potentially severe impacts relevant to
Article 2 of the United Nations Framework Convention on
Climate Change, which refers to “dangerous anthropogenic
interference with the climate system.” Risks are considered
key due to high hazard or high vulnerability of societies and
systems exposed, or both (IPCC 2013):
(a) Risk of death, injury, ill-health, or disrupted livelihoods
in low-lying coastal zones and small island developing
states and other small islands, due to storm surges,
coastal flooding, and sea-level rise.
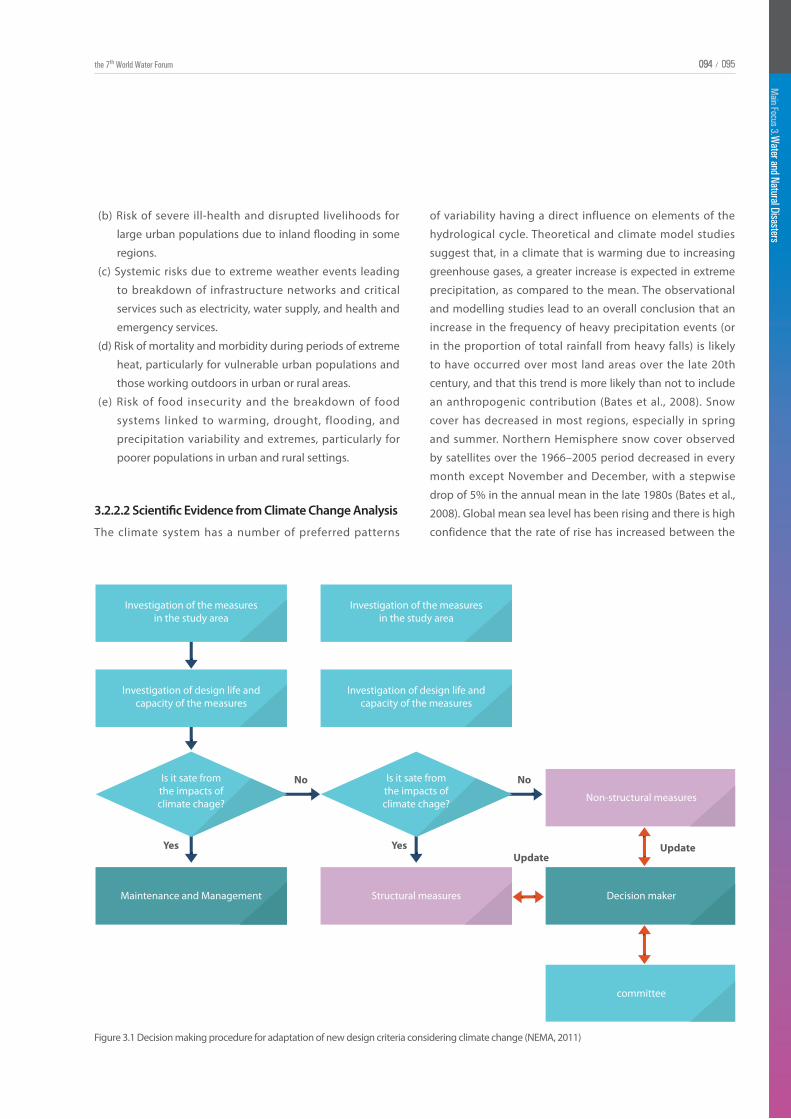
094
Main Focus 3. W
ater and Natural Disasters
095094 /the 7th World Water Forum 094
Main Focus 3. W
ater and Natural Disasters
095/
3.2.2.2 Scientific Evidence from Climate Change Analysis
(b) Risk of severe ill-health and disrupted livelihoods for
large urban populations due to inland flooding in some
regions.
(c) Systemic risks due to extreme weather events leading
to breakdown of infrastructure networks and critical
services such as electricity, water supply, and health and
emergency services.
(d) Risk of mortality and morbidity during periods of extreme
heat, particularly for vulnerable urban populations and
those working outdoors in urban or rural areas.
(e) Risk of food insecurity and the breakdown of food
systems linked to warming, drought, flooding, and
precipitation variability and extremes, particularly for
poorer populations in urban and rural settings.
The climate system has a number of preferred patterns
of variability having a direct influence on elements of the
hydrological cycle. Theoretical and climate model studies
suggest that, in a climate that is warming due to increasing
greenhouse gases, a greater increase is expected in extreme
precipitation, as compared to the mean. The observational
and modelling studies lead to an overall conclusion that an
increase in the frequency of heavy precipitation events (or
in the proportion of total rainfall from heavy falls) is likely
to have occurred over most land areas over the late 20th
century, and that this trend is more likely than not to include
an anthropogenic contribution (Bates et al., 2008). Snow
cover has decreased in most regions, especially in spring
and summer. Northern Hemisphere snow cover observed
by satellites over the 1966–2005 period decreased in every
month except November and December, with a stepwise
drop of 5% in the annual mean in the late 1980s (Bates et al.,
2008). Global mean sea level has been rising and there is high
confidence that the rate of rise has increased between the
Figure 3.1 Decision making procedure for adaptation of new design criteria considering climate change (NEMA, 2011)
Investigation of the measuresin the study area
Investigation of design life andcapacity of the measures
Maintenance and Management
Yes Yes
No No
UpdateUpdate
Is it sate fromthe impacts ofclimate chage?
Investigation of the measuresin the study area
Investigation of design life andcapacity of the measures
Structural measures
Is it sate fromthe impacts ofclimate chage?
Decision maker
committee
Non-structural measures
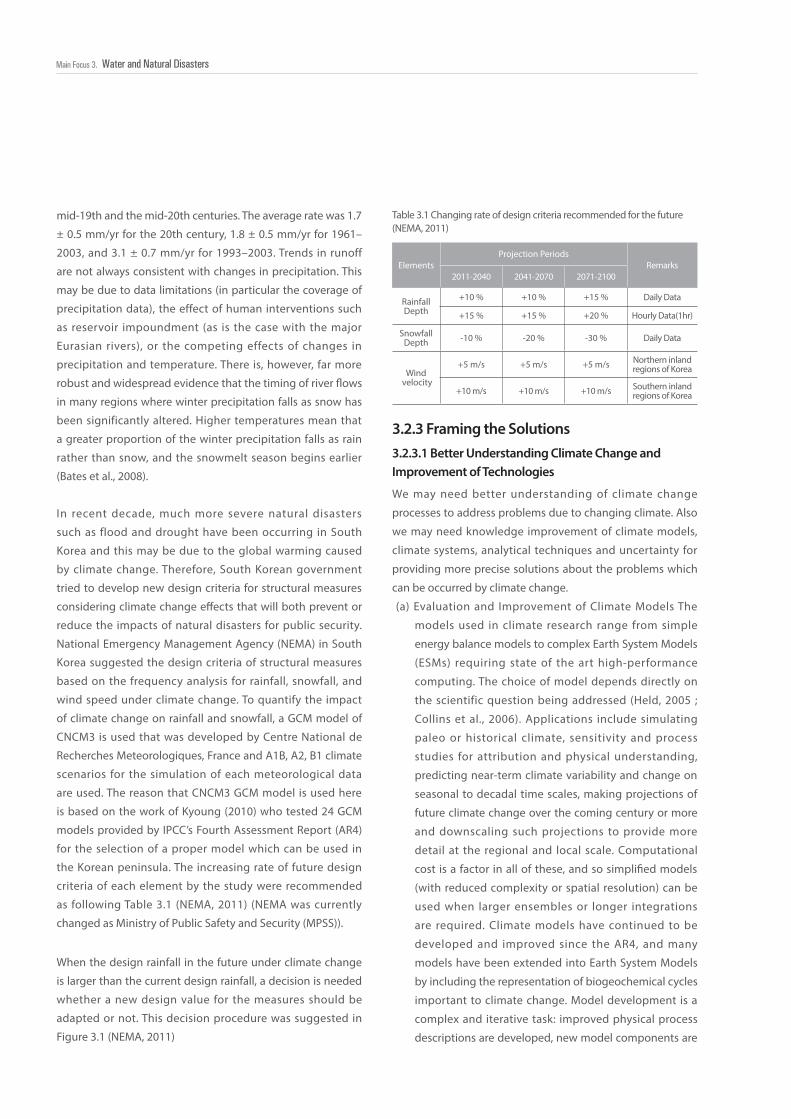
096096096Water and Natural DisastersMain Focus 3.
We may need better understanding of climate change
processes to address problems due to changing climate. Also
we may need knowledge improvement of climate models,
climate systems, analytical techniques and uncertainty for
providing more precise solutions about the problems which
can be occurred by climate change.
(a) Evaluation and Improvement of Climate Models The
models used in climate research range from simple
energy balance models to complex Earth System Models
(ESMs) requiring state of the art high-performance
computing. The choice of model depends directly on
the scientific question being addressed (Held, 2005 ;
Collins et al., 2006). Applications include simulating
paleo or historical climate, sensitivity and process
studies for attribution and physical understanding,
predicting near-term climate variability and change on
seasonal to decadal time scales, making projections of
future climate change over the coming century or more
and downscaling such projections to provide more
detail at the regional and local scale. Computational
cost is a factor in all of these, and so simplified models
(with reduced complexity or spatial resolution) can be
used when larger ensembles or longer integrations
are required. Climate models have continued to be
developed and improved since the AR4, and many
models have been extended into Earth System Models
by including the representation of biogeochemical cycles
important to climate change. Model development is a
complex and iterative task: improved physical process
descriptions are developed, new model components are
3.2.3 Framing the Solutions3.2.3.1 Better Understanding Climate Change and Improvement of Technologies
mid-19th and the mid-20th centuries. The average rate was 1.7
± 0.5 mm/yr for the 20th century, 1.8 ± 0.5 mm/yr for 1961–
2003, and 3.1 ± 0.7 mm/yr for 1993–2003. Trends in runoff
are not always consistent with changes in precipitation. This
may be due to data limitations (in particular the coverage of
precipitation data), the effect of human interventions such
as reservoir impoundment (as is the case with the major
Eurasian rivers), or the competing effects of changes in
precipitation and temperature. There is, however, far more
robust and widespread evidence that the timing of river flows
in many regions where winter precipitation falls as snow has
been significantly altered. Higher temperatures mean that
a greater proportion of the winter precipitation falls as rain
rather than snow, and the snowmelt season begins earlier
(Bates et al., 2008).
In recent decade, much more severe natural disasters
such as flood and drought have been occurring in South
Korea and this may be due to the global warming caused
by climate change. Therefore, South Korean government
tried to develop new design criteria for structural measures
considering climate change effects that will both prevent or
reduce the impacts of natural disasters for public security.
National Emergency Management Agency (NEMA) in South
Korea suggested the design criteria of structural measures
based on the frequency analysis for rainfall, snowfall, and
wind speed under climate change. To quantify the impact
of climate change on rainfall and snowfall, a GCM model of
CNCM3 is used that was developed by Centre National de
Recherches Meteorologiques, France and A1B, A2, B1 climate
scenarios for the simulation of each meteorological data
are used. The reason that CNCM3 GCM model is used here
is based on the work of Kyoung (2010) who tested 24 GCM
models provided by IPCC’s Fourth Assessment Report (AR4)
for the selection of a proper model which can be used in
the Korean peninsula. The increasing rate of future design
criteria of each element by the study were recommended
as following Table 3.1 (NEMA, 2011) (NEMA was currently
changed as Ministry of Public Safety and Security (MPSS)).
Table 3.1 Changing rate of design criteria recommended for the future(NEMA, 2011)
When the design rainfall in the future under climate change
is larger than the current design rainfall, a decision is needed
whether a new design value for the measures should be
adapted or not. This decision procedure was suggested in
Figure 3.1 (NEMA, 2011)
ElementsProjection Periods
Remarks2011-2040 2041-2070 2071-2100
Rainfall Depth
+10 % +10 % +15 % Daily Data
+15 % +15 % +20 % Hourly Data(1hr)
Snowfall Depth -10 % -20 % -30 % Daily Data
Wind velocity
+5 m/s +5 m/s +5 m/s Northern inland regions of Korea
+10 m/s +10 m/s +10 m/s Southern inland regions of Korea
096
Main Focus 3. W
ater and Natural Disasters
097096 /the 7th World Water Forum 096
Main Focus 3. W
ater and Natural Disasters
097/
The U.S. Climate Change Science Program coordinates the
efforts of 13 federal agencies to understand why climate is
changing, to improve predictions about how it will change
in the future, and to use that information to assess impacts
on human systems and ecosystems and to better support
decision making. UK established the Climate Change Act
(2008) that aimed to help reduce the amount of pollution
to help prevent the advancement of global warming. This
act will be implemented till 2050 that help reduce the gas
usage by 80% and increase renewable energy by 15%. In
Netherlands, because the effect of climate change has a
greater influence, the Delta Committee was established an
official committee. Sea level rise is also important issue in
Netherlands. Rotterdam, Netherlands has set the objective to
reduce CO2 emissions by 50% and be fully climate proof by
2025. General aims are to improve the quality of life, create
economic spin-offs and to become an inspiring example to
other delta cities. The Rotterdam Approach rests on three
pillars: knowledge, actions and positioning/marketing.
The following tools assist the development process: the
‘route planner’ sets out milestones for selected key themes,
the 'climate atlas' outlines region-specific impacts of climate
change, scenarios and already implemented measures,
and the ‘barometer’ serves as a communication-oriented
monitoring tool. In France, an example of EXPLORE 2070.
In Japan, the Committee on Climate Change Impacts and
Adaptation Research was established to discuss “Wise
adaptation” under the initiative of the Ministry of the
Environment (MOE), Japan.
In Korea, ‘National Climate Change Adaptation Policy’ was
pronounced by the Ministry of Environment (ME) with other
13 ministries (ME, 2010). These include adaptation policy in
7 areas and 3 basic alternatives for adaptation (Figure 3.2).
The policy for the future considering climate change is being
3.2.3.2 Examples for Adaptation to Climate Change
introduced and the resolution of the models is improved.
After assembly of all model components, model
parameters are adjusted, or tuned, to provide a stable
model climate(IPCC, 2013).
(b) Quantification of Climate System Responses Obser-
vational and model studies of temperature change,
climate feedbacks and changes in the Earth’s energy
budget together provide confidence in the magnitude
of global warming in response to past and future forcing.
The net feedback from the combined effect of changes
in water vapour and differences between atmospheric
and surface warming is extremely likely positive and
therefore amplifies changes in climate. The net radiative
feedback due to all cloud types combined is likely
positive. The equilibrium climate sensitivity quantifies
the response of the climate system to constant radiative
forcing on multi-century time scales. It is defined
as the change in global mean surface temperature
at equilibrium that is caused by a doubling of the
atmospheric CO2 concentration. Equilibrium climate
sensitivity is likely in the range 1.5°C to 4.5°C, extremely
unlikely less than 1°C, and very unlikely greater than
6°C. This assessment reflects improved understanding,
the extended temperature record in the atmosphere
and ocean, and new estimates of radiative forcing.
The rate and magnitude of global climate change is
determined by radiative forcing, climate feedbacks and
the storage of energy by the climate system. Estimates
of these quantities for recent decades are consistent
with the assessed likely range of the equilibrium climate
sensitivity to within assessed uncertainties, providing
strong evidence for our understanding of anthropogenic
climate change(IPCC, 2013).
(c) Analytical Techniques and Uncertainty Hydrometeoro-
logical elements such as precipitation, humidity, and
so on may be obtained from climate change scenarios
and models then need to be downscaled in space and
time for assessing future impacts of natural disasters,
for example, drought and flood analysis in the future.
Downscaling techniques for drought and flood analysis
should be developed for more accurate representations
of the future elements. The reproduction of extreme
values for the future is a challenging problem even
though the techniques have been developed and
therefore the reproduction methods should be
developed for analyzing water related disasters of
drought and flood, and for reducing uncertainty in the
analysis. Even though the researches have shown that
the snowfall will decrease in the future, the number
of extreme snowfall events can also increase in time.
Therefore, the reproduction techniques of extreme
values need to be improved.
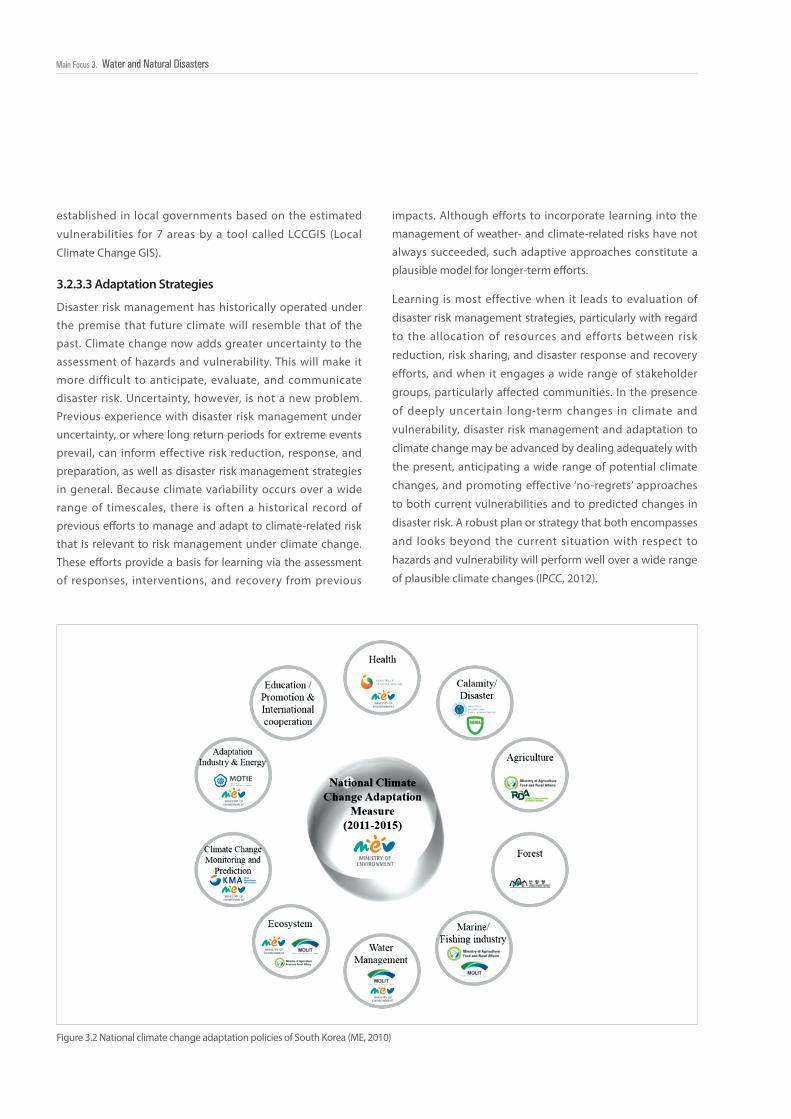
098098098Water and Natural DisastersMain Focus 3.
Disaster risk management has historically operated under
the premise that future climate will resemble that of the
past. Climate change now adds greater uncertainty to the
assessment of hazards and vulnerability. This will make it
more difficult to anticipate, evaluate, and communicate
disaster risk. Uncertainty, however, is not a new problem.
Previous experience with disaster risk management under
uncertainty, or where long return periods for extreme events
prevail, can inform effective risk reduction, response, and
preparation, as well as disaster risk management strategies
in general. Because climate variability occurs over a wide
range of timescales, there is often a historical record of
previous efforts to manage and adapt to climate-related risk
that is relevant to risk management under climate change.
These efforts provide a basis for learning via the assessment
of responses, interventions, and recovery from previous
Figure 3.2 National climate change adaptation policies of South Korea (ME, 2010)
3.2.3.3 Adaptation Strategies
established in local governments based on the estimated
vulnerabilities for 7 areas by a tool called LCCGIS (Local
Climate Change GIS).
impacts. Although efforts to incorporate learning into the
management of weather- and climate-related risks have not
always succeeded, such adaptive approaches constitute a
plausible model for longer-term efforts.
Learning is most effective when it leads to evaluation of
disaster risk management strategies, particularly with regard
to the allocation of resources and efforts between risk
reduction, risk sharing, and disaster response and recovery
efforts, and when it engages a wide range of stakeholder
groups, particularly affected communities. In the presence
of deeply uncertain long-term changes in climate and
vulnerability, disaster risk management and adaptation to
climate change may be advanced by dealing adequately with
the present, anticipating a wide range of potential climate
changes, and promoting effective ‘no-regrets’ approaches
to both current vulnerabilities and to predicted changes in
disaster risk. A robust plan or strategy that both encompasses
and looks beyond the current situation with respect to
hazards and vulnerability will perform well over a wide range
of plausible climate changes (IPCC, 2012).
098
Main Focus 3. W
ater and Natural Disasters
099098 /the 7th World Water Forum 098
Main Focus 3. W
ater and Natural Disasters
099/
3.2.3.4 Lessons Learned and Future Direction
3.2.4 Accelerating Innovation 3.2.4.1 Advanced Climate Change Adaptation
Water related disasters are an important issue and we should
make and implement the plans for adaptation to climate
change. Today, the world faces many challenges: climate
change, water related disasters containing flood and drought.
Solution such as a section 3.2.3.1 offers the possibility of
wise analysis and allows us to see Impacts, Adaption and
Vulnerability differences. It also offers us the ability to acquire
and verify facts. The section 3.2.3.1 now makes it possible to
better understand and communicate the social and physical
complexities of disasters. Climate policies – including water
related disasters – can be more effective when consistently
embedded within broader strategies designed to address
national and regional development pathways. The impact of
climate variability and change, climate policy responses, and
associated socioeconomic development will affect the ability
of communities to achieve development goals. Despite
difficulties and uncertainties, adaptation is critical to prepare
individuals, communities, governments, and international
agencies for the changes that are coming. Understanding the
lessons learned from water related disasters can facilitate the
process of designing and implementing strategies, policies,
and measures to reduce vulnerability and increase adaptive
capacity. And, we will be able to solve climate change related
problems based on scientific understanding, impact and
adaptation, mitigation and international negotiation through
global networks.
Adaptation is place- and context-specific, with no single
approach for reducing risks appropriate across all settings.
Effective risk reduction and adaptation strategies consider
the dynamics of vulnerability and exposure and their
linkages with socio-economic processes, sustainable
development, and climate change. Adaptation planning and
implementation can be enhanced through complementary
actions across levels, from individuals to governments.
National governments can coordinate adaptation efforts
of local and subnational governments, for example by
protecting vulnerable groups, by supporting economic
diversification, and by providing information, policy and
legal frameworks, and financial support. Local governments
and the private sectors are increasingly recognized as critical
to progress in adaptation, given their roles in scaling up
adaptation of communities, households, and civil society
and in managing risk information and financing. A first step
towards adaptation to future climate change is reducing
vulnerability and exposure to present climate variability.
Strategies include actions with co-benefits for other
objectives.
Available strategies and actions can increase resilience across
a range of possible future climates while helping to improve
human health, livelihoods, social and economic well-being,
and environmental quality. Integration of adaptation into
planning and decision making can promote synergies
with development and disaster risk reduction. Adaptation
planning and implementation at all levels of governance
are contingent on societal values, objectives, and risk
perceptions. Recognition of diverse interests, circumstances,
social-cultural contexts, and expectations can benefit
decision-making processes. Indigenous, local, and traditional
knowledge systems and practices, including indigenous
peoples’ holistic view of community and environment, are
a major resource for adapting to climate change, but these
have not been used consistently in existing adaptation
efforts. Integrating such forms of knowledge with existing
practices increases the effectiveness of adaptation. Decision
support is most effective when it is sensitive to context
and the diversity of decision types, decision processes, and
constituencies.
Organizations bridging science and decision making,
including climate services, play an important role in the
communication, transfer, and development of climate-
related knowledge, including translation, engagement, and
knowledge exchange. Existing and emerging economic
instruments can foster adaptation by providing incentives
for anticipating and reducing impacts. Instruments include
public-private finance partnerships, loans, payments for
environmental services, improved resource pricing, charges
and subsidies, norms and regulations, and risk sharing
and transfer mechanisms. Risk financing mechanisms in
the public and private sector, such as insurance and risk
pools, can contribute to increasing resilience, but without
attention to major design challenges, they can also provide
disincentives, cause market failure, and decrease equity.
Governments often play key roles as regulators, providers,
or insurers of last resort. Constraints can interact to impede

100100100Water and Natural DisastersMain Focus 3.
Figure 3.3 Advanced climate change adaptation strategies (IPCC, 2013)
adaptation planning and implementation. Common
constraints on implementation arise from the followings:
limited financial and human resources; limited integration or
coordination of governance; uncertainties about projected
impacts; different perceptions of risks; competing values;
absence of key adaptation leaders and advocates; and limited
tools to monitor adaptation effectiveness. Another constraint
includes insufficient research, monitoring, and observation
and the finance to maintain them. Underestimating the
complexity of adaptation as a social process can create
unrealistic expectations about achieving intended adaptation
outcomes (IPCC, 2013). Figure 3.3 shows flow chart for the
advanced climate change adaptation strategies.
Poor planning, overemphasizing short-term outcomes,
or failing to sufficiently anticipate consequences can
result in maladaptation. Maladaptation can increase the
vulnerability or exposure of the target group in the future,
or the vulnerability of other people, places, or sectors. Some
near-term responses to increasing risks related to climate
change may also limit future choices. For example, enhanced
protection of exposed assets can lock in dependence on
further protection measures. Limited evidence indicates a gap
between global adaptation needs and the funds available
for adaptation. There is a need for a better assessment of
global adaptation costs, funding, and investment. Studies
estimating the global cost of adaptation are characterized by
shortcomings in data, methods, and coverage. Significant co-
benefits, synergies, and trade-offs exist between mitigation
and adaptation and among different adaptation responses;
interactions occur both within and across regions. Increasing
efforts to mitigate and adapt to climate change imply an
increasing complexity of interactions, particularly at the
intersections among water, energy, land use, and biodiversity,
but tools to understand and manage these interactions
remain limited. Examples of actions with co-benefits
include (i) improved energy efficiency and cleaner energy
sources, leading to reduced emissions of health-damaging
climate-altering air pollutants; (ii) reduced energy and water
consumption in urban areas through greening cities and
recycling water; (iii) sustainable agriculture and forestry; and
(iv) protection of ecosystems for carbon storage and other
ecosystem services (IPCC, 2013).
100
Main Focus 3. W
ater and Natural Disasters
101100 /the 7th World Water Forum 100
Main Focus 3. W
ater and Natural Disasters
101/
3.2.4.2 International Cooperation
Climate change is a global challenge and requires a global
solution. Therefore we need global and international
collaborations to solve the climate change problems,
especially, water related disasters. The followings are
collaboration examples of two organizations and a
conference to solve the disaster problems due to the climate
change.
(a) UNISDR
The United Nations (UN) International Strategy for
Disaster Reduction Secretariat (UNISDR) was established
in 1999 as the successor to the Secretariat of the
International Decade for Natural Disaster Reduction.
UNISDR leads the organisation of the Global Platform for
Disaster Risk Reduction, which meets every two years
and has become the main global forum for guidance on
the implementation of the Hyogo Framework for Action
(HFA) and share experience among stakeholders. The
formal mandate of UNISDR is given by the UN General
Assembly, and is to serve as the focal point in the United
Nations system for the coordination of disaster reduction
and to ensure synergies among the disaster reduction
activities of the United Nations system and regional
organisations and activities in socio-economic and
humanitarian fields.
(b) ESCAP/WMO Typhoon Committee
The ESCAP/WMO Typhoon Committee is an inter-
governmental body organized under the joint auspices
of the Economic and Social Commission for Asia and
the Pacific (ESCAP) and the World Meteorological
Organization ( WMO) in 1968 in order to promote
and coordinate the planning and implementation of
measures required for minimizing the loss of life and
material damage caused by typhoons in Asia and the
Pacific. The Typhoon Committee develops activities
under three substantive components: meteorology,
hydrology, and disaster risk reduction (DRR), as well as
in training and research. The mission of the Typhoon
Committee is to reduce the loss of lives and minimize
social, economic and environmental impacts caused
by typhoon-related disasters through integrated and
enhanced regional collaboration.
(c) ACUDR
The Asian Conference on Urban Disaster Reduction
(ACUDR) is a biennial event bringing leading scientists,
decision makers and NGO-agents in the field of disaster
management from the Asian countries. It was agreed
by DMST (Disaster Management Society of Taiwan), ISSS
(Institute of Social Safety Science, Japan) and KOSHAM
(Journal of Korean Society of Hazard Mitigation) during
the annual Symposium of the DMST in 2011.
(a) Updating global and regional vulnerability/resilience to
water related disasters
Vulnerability and exposure to disasters is increasing as
more people and assets locate in areas of high risk. Since
1970, the world’s population has grown by 87 per cent.
During the same time, the proportion of people living in
flood-prone river basins increased by 114 per cent and
on cyclone-exposed coastlines by 192 per cent (UNISDR,
2012).
There are strong trends towards increasing knowledge-
sharing and understanding about building resilience
in communities at risk from water-related disasters,
especially those likely to arise from climate change.
A holistic approach that integrates water into socio-
economic development planning is being adopted and
should be further supported. This approach applies the
principles of integrated disaster risk management and
is a direct form of strengthening resilience and reducing
vulnerabilities to extreme events. Some localities are
already implementing monitoring and people centred
early warning systems in communities most at risk from
water-related disasters. Further support is needed to
mainstreaming a preparedness approach to water-related
disaster management, which responds to the needs of
communities and is implemented efficiently.
Various adaptation measures that respond to climate
variability, and build upon existing land and water
management practices, have the potential to strengthen
the resilience of vulnerable communities to climate
change and to ensure water security, and directly
contribute to sustainable development (WCDRR, 2014).
Governments and water related institutions will need
to be strengthened to deliver results across the broad
spectrum of floods, droughts and related areas.
3.2.4.3 Integration, Improvement, Expansion of Current Knowledge
102102102Water and Natural DisastersMain Focus 3.
(b) Integration of emerging technologies
Technological innovations of water related disasters and
vulnerability to climate change reduction measures
provide unprecedented opportunities to build resilience
and deepen connectivity. Experiences from the region and
around the world have proven that disaster prevention
and preparedness, enabled by communication and space
technologies, can be far more effective and less costly
than ever before(http://www.unescap.org/our-work/ict-
disaster-risk-reduction).
A number of emerging technologies can be integrated
into measures for solving water related disasters and
impact of climate change. Among them, Information and
Communication Technologies(ICT), Nano Technology(NT),
Energy Technology(ET ), Bio Technology(BT ), Remote
Sensing(RS) and Geographic Information System(GIS) can
be utilized in sensing, preparing, and responding to water
related disasters.
The ability to properly measure progress of technologies,
like ICT, GIS, RS and so on, will be a key tool that allows
policymakers to make informed decisions. These emerging
technologies are important tools for understanding and
supporting water related disaster resilient communities.
The section 3.5 reviews some detail information for
emerging technologies related to water disasters.
(c) Improvement of analytical tools and techniques
Improvement of analytical tools and techniques are
related GCMs, limitation of downscaling techniques,
selection of hydrological tools, and uncertainty involved in
both water related disasters and climate change.
GCM is generally a global and continental scale climate
model and can produce relatively reliable weather
forecasts in annual and seasonal values. IPCC 4th
Assessment Report published in 2007 suggested the
ensemble results can be more reliable. However, most
of the GCM models have limitations in its spatial and
temporal resolutions. Also the downscaling techniques
should be advanced for more accurate reproduction of
data in the specific area and time scale concerning surface
water and groundwater.
An appropriate approach for the assessment of uncer-
tainty in climate prediction scenario as well as in
downscaling procedures and hydrological impact
modeling is also significantly important. Uncertainty
measures could provide an estimate of confidence limits
on model results and would be of value in the application
of these results in risk and policy analyses. Development
and application of ensembles of hydrologic models can
be followed for an improved understanding of the impact
of the complexity of process descriptions on simulated
hydrological variables and predictive power, evaluation
of intrinsic variability, and uncertainties in hydrologic
modeling.
It is recommended that improvement is required in the
scaling procedures for the utilization of RCM results in
regional watershed management and evaluation and
improvement of transferability of existing bias correction
methods between station measurements and RCM
outputs for future climate conditions.
(d) Appropriate technology
Appropriate technology is simple enough that people
can manage it directly and on a local level. Appropriate
technology makes use of skills and technology that are
available in a local community to supply basic human
needs.
Commonly discussed as a form of economic development,
this type of sustainable technology is an alternative
to technology transfer from developed to developing
countries. Technology transfer is often patronizing, with
one party telling the other what to do and what they need,
while appropriate technology places both parties on an
equal level. Appropriate technology is attractive because it
makes households and industries more self-sufficient, and
most things can be managed at a local level. It is believed
that technology transfer to developing countries would
bridge the development gaps between developed and
recipient developing countries (Edoho, 2009).
3.2.5 Research & Developing Agenda 3.2.5.1 Increasing Urban Resilience and Sustainability
Resilience is the ability of something to return to its original
shape after it has been pulled, stretched, pressed, bent,
etc. Also urban resilience is defined as the “capability to
prepare for, respond to, and recover from significant multi-
102
Main Focus 3. W
ater and Natural Disasters
103102 /the 7th World Water Forum 102
Main Focus 3. W
ater and Natural Disasters
103/
3.2.5.2 IWRM and Smart Water Grid
The Global Water Partnership's definition of Integrated
Water Resources Management (IWRM) is widely accepted. It
hazard threats with minimum damage to public safety and
health, the economy, and security" of a given urban area.
The resilience concept appears to be particularly pertinent
for framing urban planning and development policies and
programmes. At the international level, this has become
evident by a number of influential publications, conferences,
and projects focusing on climate change adaptation. For
example, the World Bank published a “primer” on “climate
resilient cities” (Prasad et al., 2009), which was directed at
urban decision-makers in east Asia. International urban
capacity-building programmes and conferences have used
notions of resilience prominently in their approach and
programming, such as “urban climate change resilience” and
“resilient cities”.
Resilience not only means preparing cities to better respond
to natural disasters, perhaps even more importantly, it also
means taking steps to prevent disasters. Disasters like the
recent Rio landslide are only partially the result of natural
forces; they are also the result of failed urban planning and
development. This places the imperative for urban disaster
risk reduction squarely in the hands of municipal planners,
politicians and the urban community at large.
(https://agenda.weforum.org/2013/01/the-importance-of-
urban-resilience)
Resilience is also increasingly popular at the national level of
policy-making. This is noticeable, for example, in Australian
policy. In 2011, the Council of Australian Governments, the
peak intergovernmental forum involving representatives of
all three levels of government, adopted a National Strategy
for Disaster Resilience (COAG, 2009). The strategy, aimed at
providing high-level guidance on disaster management,
makes ample reference to climate change impacts as
an important factor in working towards greater disaster
resilience. In 2011, the Australian Government announced
a A$4.5 million climate change adaptation funding stream
for local government, entitled “Building Resilience of Coastal
Communities” (Commonwealth of Australia, 2011). Reference
to resilience can also be found in many municipal climate
change strategies and plans.
states: 'IWRM is a process which promotes the co-ordinated
development and management of water, land and related
resources, in order to maximize the resultant economic and
social welfare in an equitable manner without compromising
the sustainability of vital ecosystems'. The Integrated Water
Resources Management (IWRM) has been recognized as
means for the most efficient water supply, use, conservation,
and water related disaster reduction under the climate
change. Also water is needed to generate energy and at the
same time energy is needed to provide water to homes and
industries. Water provides crucial ecosystem services and a
lack of sanitation and safe drinking water services as well as
polluted water is a major public health threat. Water is thus
not a sector but a vital resource for societies, cultures, the
environment and economies that require strong coordination
to be effectively managed. Therefore, IWRM can also
contribute to environmental and energy disaster prevention.
Research needs as mentioned in the European Strategic
Research and Innovation Agenda highlight the needs of
improving water management to mitigate the harmful
impacts of extreme events considering diagnosing droughts,
floods and impaired water quality as a result of climate
change developing people centered monitoring and extreme
water system, including both expert and local knowledge;
setting up risk management strategies taking into account
socio economic needs, environmental dynamics/risks
and land use in areas vulnerable to droughts and floods;
maximising the reliability of projections of precipitation
at various spatial and time scales; developing integrated
modelling across surface water and groundwater, coastal
and fluvial systems, hydrological and meteorology, water
and sediment transport; improving existing hydrodynamic
models coupled with the development of a monitoring
scheme adapted for aquifers in order to improve the
quantitative management of resource.
Urban water systems face sustainability and resiliency
challenges including water leaks, over-use, quality issues,
and response to drought and natural disasters with the
urbanization process. Information and communications
technology (ICT ) could help address these challenges
through the development of smart water grids that network
and automate monitoring and control devices. Potential
benefits of smart water grids include improved leak
104104104Water and Natural DisastersMain Focus 3.
3.2.5.3 Advancing Technology for Climate Change Analysis and Adaptation
Adaptation can be reactive while in others, it needs to
be anticipated especially for investments with very long
timescales (Hallegatte et al. 2007). Anticipation necessitates
detailed information on how local climates will change.
However, for various reasons detailed in Hallegatte (2009),
future local climates are uncertain: there is still a large
uncertainty on future greenhouse gas emissions, on the
reaction of global temperature to changes in greenhouse
gas concentrations and on how a change in global mean
temperature would translate into changes at the local
scale, the last being particularly important for adaptation in
water management. To cope with this situation of increased
uncertainty, Hallegatte (2009) proposed to follow Lempert
and Collins (2007) and to implement robust anticipated
adaptation strategies that aim at reducing vulnerability in
the largest possible range of climate changes (Nassopoulos
et al. 2012). Now we understand there are multiple sources
of uncertainty in assessing climate change, its impacts,
and moving forward with adaptation responses. In some
cases, uncertainties interact, usually resulting in an increase
in overall uncertainty. Understanding interactions can be
accomplished qualitatively through the use of conceptual
models or expert judgment or quantitatively through models
and decision support systems (Glick et al. 2011).
How to move forward in the face of uncertainty? Although
it would be easy for a natural resource manager to be
paralyzed by uncertainty, there is also a considerable amount
of good advice and recommendations for moving forward
with adaptation strategies amidst this uncertainty. First
many proposed broad adaptation objectives are relatively
robust to uncertainties associated with climate change
– that is good actions regardless of whether projected
changes in climate play out as we think they will (Groves et
al. 2012). Second, there are a number of techniques to help
reduce uncertainties such as using simulation analyses that
account for uncertainties, sensitivity analyses that explore
how robust certain models or adaptation strategies are to
various assumptions, and scenario analyses that examine
a range of possible outcomes of either impact projections
management, water quality monitoring, intelligent flood and
drought management, and energy savings (Mutchek and
Williams, 2014).
or results of implementing adaptation objectives (Glick
et al. 2011). Finally, employing an adaptive management
approach in which adaptation management objectives are
evaluated through monitoring and evaluation (Lawler et al.
2010; Cross et al. 2012) is critical to providing managers the
feedback necessary to make continual changes to address
new information and uncertainty (http://yale.databasin.org/
pages/coping-uncertainty).
The decision-making framework is illustrated on next page
in Figure 3.4. It identifies the key stages comprising ‘good
practice’ in decision-making. It covers the whole decision-
making process, from problem identification through to
implementation and monitoring of the decision. As shown in
the Figure 3.4, these are:
Structuring the problem:
(a) Stage 1 : Identify problem and objectives;
(b) Stage 2 : Establish decision-making criteria, receptors,
exposure units and risk assessment endpoints;
Analysing the problem: (tiered stages)
(a) Stage 3 Assess risk;
(b) Stage 4 Identify options;
(c) Stage 5 Appraise options;
Decision-making:
(a) Stage 6 Make decision;
Post-decision actions:
(a) Stage 7 Implement decision;
(b) Stage 8 Monitor, evaluate and review.
The focus of this section is upon identifying and treating
the risk and uncertainty associated with decisions where
climate change may be a significant factor. This emphasis
is reflected in the level of detail with which the individual
stages in the framework are described. For example, the
options appraisal and decision-making stages require the
use of a variety of standard techniques, and these stages are
therefore described more briefly, although we emphasise the
treatment of uncertainty. The aim of using the framework is
for the decision maker to identify where climate change is
a material consideration. Where climate or climate change
are significant, the decision-maker should aim to identify
adaptation options for the decision (such as no regret
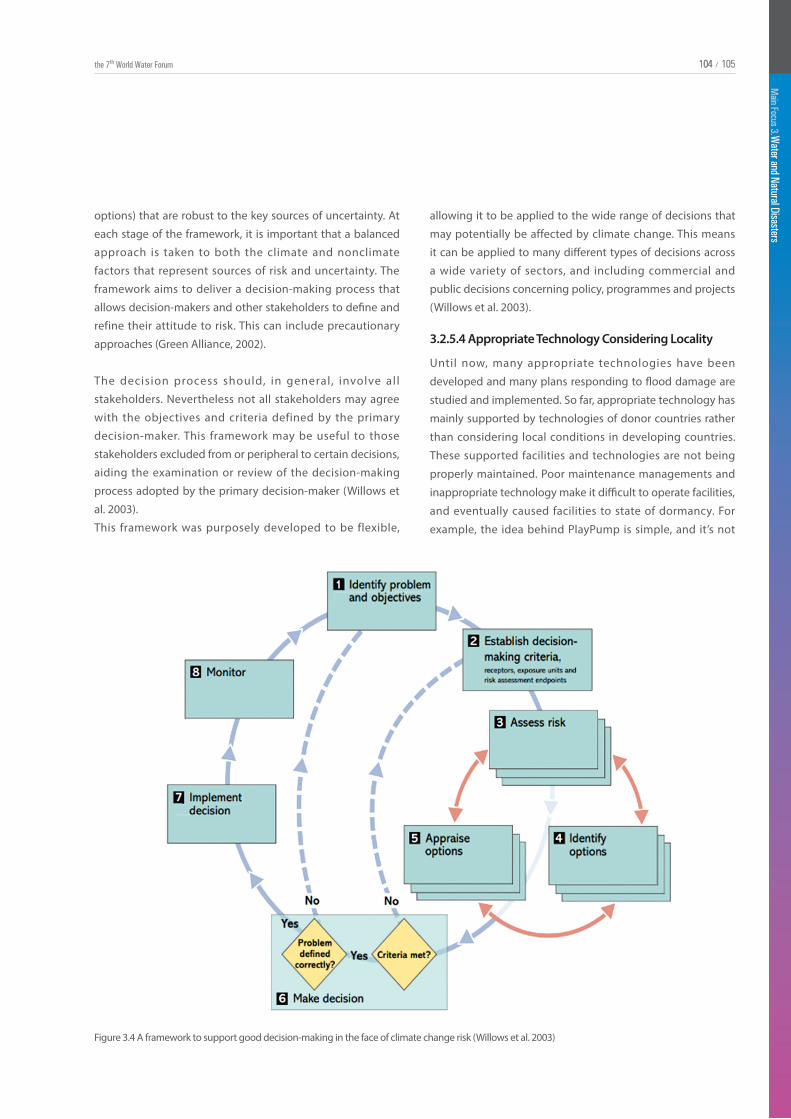
104
Main Focus 3. W
ater and Natural Disasters
105104 /the 7th World Water Forum 104
Main Focus 3. W
ater and Natural Disasters
105/
options) that are robust to the key sources of uncertainty. At
each stage of the framework, it is important that a balanced
approach is taken to both the climate and nonclimate
factors that represent sources of risk and uncertainty. The
framework aims to deliver a decision-making process that
allows decision-makers and other stakeholders to define and
refine their attitude to risk. This can include precautionary
approaches (Green Alliance, 2002).
The decision process should, in general, involve all
stakeholders. Nevertheless not all stakeholders may agree
with the objectives and criteria defined by the primary
decision-maker. This framework may be useful to those
stakeholders excluded from or peripheral to certain decisions,
aiding the examination or review of the decision-making
process adopted by the primary decision-maker (Willows et
al. 2003).
This framework was purposely developed to be flexible,
allowing it to be applied to the wide range of decisions that
may potentially be affected by climate change. This means
it can be applied to many different types of decisions across
a wide variety of sectors, and including commercial and
public decisions concerning policy, programmes and projects
(Willows et al. 2003).
Figure 3.4 A framework to support good decision-making in the face of climate change risk (Willows et al. 2003)
Until now, many appropriate technologies have been
developed and many plans responding to flood damage are
studied and implemented. So far, appropriate technology has
mainly supported by technologies of donor countries rather
than considering local conditions in developing countries.
These supported facilities and technologies are not being
properly maintained. Poor maintenance managements and
inappropriate technology make it difficult to operate facilities,
and eventually caused facilities to state of dormancy. For
example, the idea behind PlayPump is simple, and it’s not
3.2.5.4 Appropriate Technology Considering Locality
106106106Water and Natural DisastersMain Focus 3.
3.2.6 RecommendationsAdaptation is place and context specific, with no single
approach for reducing r isks appropriate across a l l
settings. Adaptation planning and implementation can be
enhanced through complementary actions across levels,
from individuals to governments. Prospects for climate-
resilient pathways for sustainable development are related
fundamentally to what the world accomplishes with climate-
change mitigation. Greater rates and magnitude of climate
change increase the likelihood of exceeding adaptation
limits. Significant co-benefits, synergies, and tradeoffs exist
between mitigation and adaptation and among different
adaptation responses; interactions occur both within and
across regions. Strategies and actions can be pursued
now that will move towards climate-resilient pathways for
sustainable development. The sustainable water resources
management considering climate change is able to maintain
the harmony of ecological, environmental and hydrological
effects. We must do our effort to reduce the water disaster risk
gap between developed and developing countries due to the
climate change. Appropriate technologies should be shared
and exchanged each other for preventing disasters and for
living together in this world. Also the world organizations and
developed countries should help the low income countries
from the disasters, especially, water related disaster problems.
The global weather patterns and ecosystem are changing
due to the climate change. Therefore, world’s water industry
3.3 DROUGHT MANAGEMENT IN A CHANGING CLIMATE
is also greatly affected by climate change. Water industry has
been considered in the aspects of water supply, wastewater
treatment, water reuse, and seawater desalination. However,
water related disasters might be included in water industry
area because the disasters will be more and more important
issues due to the climate change.
Drought is one of the extreme events, which is a recurring
multidimensional phenomenon associated with deficit in
available water. It can be caused by declines in precipitation,
increases in evapotranspiration, or a combination of them.
Drought is of particular interest because of its potential long-
term impacts on water resources, agricultural production,
economic activities, and ecosystems. Its most crucial aspect
is the significant decrease of streamflow and the lower
water storage in reservoirs, conventionally referred to as
hydrological drought. This may be partially attributed to
the change of climatic conditions, which is an additional
threat that puts increased pressure on hydrological systems
and water resources (Allen et al. 2011). Recently, drought
vulnerabilities has got more attention due to a series of recent
and severe droughts in regions as diverse as the United States
Central Great Plains drought (Hoerling et al. 2014), the Horn
of Africa and Sahel droughts in 2011 (Lyon and DeWitt 2012)
and the Big Dry or Millennium drought of Southeast Australia
(McGrath et al. 2012). Since the beginning of 21st century,
severe droughts affected vast areas of South Asia, including
Western India, Southern and Central Pakistan. These regions
have been among the perennially drought-prone regions of
the world. India, Pakistan, Sri Lanka and Afghanistan facing
droughts at least once in every three-year period in the past
five decades, while Bangladesh and Nepal also suffer from
drought frequently. In 2012, Pakistan declared emergency in
Tharpakrakar and Mirpur Khas districts due to severe drought
and many people had to be resettled (Miyan 2014). Recent
work further suggest that global aridity has increased in
step with observed warming trends, and that this drying will
worsen for many regions as global temperatures continue to
rise with increasing anthropogenic greenhouse gas emissions
(Cook et al. 2014).
3.3.1 Background
hard to see why so many people got so excited about it.
A merry-go-round type device is installed and connected
to a water pump. As children play on the merry-go-round,
water is pumped into a storage tank, and is then available
on demand. Frontline originally reported on the technology
in 2005, leading to a tremendous amount of excitement,
including support from Laura Bush and AOL Founder Steve
Case.
As the new Frontline story reports, however, it seems that
PlayPump hasn’t lived up to its original promise and even its
strongest backers have had to admit that the large-scale roll-
out they had originally planned was not realistic. In order to
improve this problem, type of supporting technology and
management plans should be established through joint
research with local research institutions and regional research
survey as well through Science Policy dialogue.
106
Main Focus 3. W
ater and Natural Disasters
107106 /the 7th World Water Forum 106
Main Focus 3. W
ater and Natural Disasters
107/
3.3.2 Framing the Challenges
Significant uncertainties were found in recent and projected
future drought trends, especially regarding the extent to
which these trends will be forced by changes in precipitation
versus evaporative demand (Sheffield et al., 2012). Globally,
both precipitation and evapotranspiration are expected
to increase with warming, a consequence of an intensified
hydrologic cycle in a warmer world. Regional changes in
precipitation and evapotranspiration, and the dynamics
that drive such changes, are nevertheless more uncertain,
despite the fact that these changes are perhaps of greatest
relevance to on-the-ground stakeholders (Cook et al. 2014).
Separating the total ensemble uncertainty of future drought
projections into contributions from internal variability, the
GCM formulation and Green-House Gas (GHG) concentrations
scenario uncertainty shows mostly negligible contributions
f rom the GHG concentrat ions scenar ios, but large
contributions from internal variability for the next decades,
especially for SPI. This depicts that there is only limited
potential to focus on the likelihood range of near to mid-term
meteorological drought projections.
On the other hand, the total uncertainty for Soil Moisture
Anomalies (SMA) is dominated by uncertainty from GCM
formulation already in the near future, which means that
in principle GCM improvements could substantially reduce
the spread of the projections, although the existing large
uncertainty regarding land surface processes constitutes
a huge challenge. Ongoing efforts to consolidate existing
soil moisture data from in-situ measurements and satellites
into consistent data products will enable a much better
evaluation of GCMs over the coming years. These new data
together with more realistic GCMs will allow for more reliable
analyses of soil moisture changes in both past and future.
Much of this uncertainty comes from the GCM formulation,
which can hopefully be improved once that more exhaustive
and consistent data of the land surface become available
(Orlowsky and Seneviratne 2013).
3.3.2.1 Historical Droughts, Its Spatial and Temporal Distribution
Each of the five years since 2001 is one of the six warmest
years overall in the 165 years from the available record
period, where the two warmest years on record are 1998 and
2005. Using prediction from different climate models with
different scenarios, the temperature in 2011-2030 is likely to
be 0.64 – 0.7°C higher than the temperature in 1980-1999. If
effective measures have not been taken for reducing GHG by
2100, the global surface temperature will rise between 1.8°C
and 4°C above the 1990 levels. This will be three to six times
the warming the planet has experienced since pre-industrial
times (ComEU 2007). From heat waves to cold snaps or
The recent historical record shows that there is a wide spatio-
temporal variation in the natural climate system. Due to
lack of direct observations, methodologies uncertainties
and choice and geographical inconsistencies, there is low
confidence in an observed global-scale trend in drought or
dryness (lack of rainfall) (IPCC 2013). In speaking of global
trends in drought, then, the meaningful questions are; (a)
whether the frequency, intensity, and duration of droughts
are changing in most or all of the regions historically prone
to drought, and (b) whether the total area prone to drought
is changing. Figure 3.5 summarizes some of the observed
changes in climate extremes. Overall, the most robust global
changes in climate extremes are seen in measures of daily
temperature, including to some extent, heat waves.
Precipitation extremes also appear to be increasing, but there
is large spatial variability, and observed trends in droughts
are still uncertain except in a few regions. While robust
increases have been seen in tropical cyclones (TCs) frequency
and activity in the North Atlantic since the 1970s, the reasons
for this are still being debated. The TCs variously affects soil
moisture droughts via late drought initiation, weakened
drought intensity, and early drought recovery. Assessment
of the influence of Atlantic TCs on the eastern U.S. drought
regime at regional scales was studied by Kam et al. (2012)
for the period of 1980 to 2007. From their findings, the TCs
reduced the average duration of moderately severe short-
term and long-term droughts by less than 4 (10% of average
drought duration per year) and more than 5 (15%) days yr−1,
respectively. In addition, they removed at least two short-
term and one long-term drought events over 50% of the
study region. Despite the damage inflicted directly by TCs,
they play a vital role in the alleviation and removal of drought
for some years and seasons, with important implications for
water resources and agriculture. There is limited evidence of
changes in extremes associated with other climate variables
since the mid-20th century (IPCC 2013).
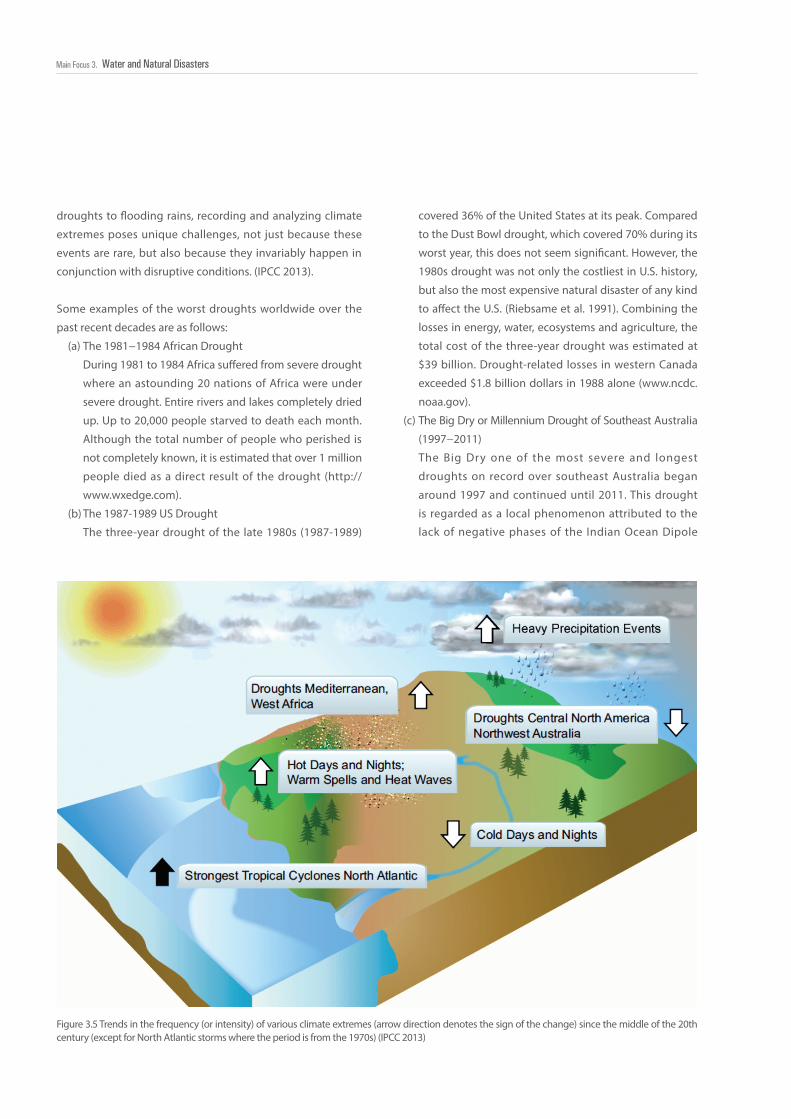
108108108Water and Natural DisastersMain Focus 3.
Figure 3.5 Trends in the frequency (or intensity) of various climate extremes (arrow direction denotes the sign of the change) since the middle of the 20th century (except for North Atlantic storms where the period is from the 1970s) (IPCC 2013)
covered 36% of the United States at its peak. Compared
to the Dust Bowl drought, which covered 70% during its
worst year, this does not seem significant. However, the
1980s drought was not only the costliest in U.S. history,
but also the most expensive natural disaster of any kind
to affect the U.S. (Riebsame et al. 1991). Combining the
losses in energy, water, ecosystems and agriculture, the
total cost of the three-year drought was estimated at
$39 billion. Drought-related losses in western Canada
exceeded $1.8 billion dollars in 1988 alone (www.ncdc.
noaa.gov).
(c) The Big Dry or Millennium Drought of Southeast Australia
(1997−2011)
The Big Dry one of the most severe and longest
droughts on record over southeast Australia began
around 1997 and continued until 2011. This drought
is regarded as a local phenomenon attributed to the
lack of negative phases of the Indian Ocean Dipole
droughts to flooding rains, recording and analyzing climate
extremes poses unique challenges, not just because these
events are rare, but also because they invariably happen in
conjunction with disruptive conditions. (IPCC 2013).
Some examples of the worst droughts worldwide over the
past recent decades are as follows:
(a) The 1981−1984 African Drought
During 1981 to 1984 Africa suffered from severe drought
where an astounding 20 nations of Africa were under
severe drought. Entire rivers and lakes completely dried
up. Up to 20,000 people starved to death each month.
Although the total number of people who perished is
not completely known, it is estimated that over 1 million
people died as a direct result of the drought (http://
www.wxedge.com).
(b) The 1987-1989 US Drought
The three-year drought of the late 1980s (1987-1989)
108
Main Focus 3. W
ater and Natural Disasters
109108 /the 7th World Water Forum 108
Main Focus 3. W
ater and Natural Disasters
109/
3.3.2.2 Short and Long Term Drought Impact on Environmental Services
Water is a strategic resource for socio-economic and
environmental development. However, water scarcity and
(IOD). The IOD is an irregular oscillation of sea surface
temperatures and atmospheric circulation in and
around the Indian Ocean, characterized by the Dipole
Mode Index (DMI). In the negative phase, with warmer
waters off northwest Australia, the atmospheric
circulation brings moisture across the continent in a
southeasterly direction. In the positive phase, southeast
Australia experiences lower rainfall (McGrath et al.
2012). With the official end of the drought declared in
2012, the Federal Government had provided $4.5 billion
in drought assistance (www.bbc.com).
(d) The 2011 East Africa drought
Between July 2011 and mid-2012, a severe drought
affected the entire East Africa region. It was declared
as the worst drought in 60 years which caused a severe
food crisis across Somalia, Djibouti, Ethiopia and Kenya
that threatened the livelihood of 9.5 million people. The
total death toll was reported as 50,000 to 260,000. Many
refugees from southern Somalia fled to neighboring
Kenya and Ethiopia, where crowded, unsanitary
conditions together with severe malnutrition led to a
large number of deaths. Other countries in East Africa,
including Sudan, South Sudan and parts of Uganda,
were also affected by a food crisis (www.wikipedia.com).
(e) The Great Plains, United States 2012 drought
The 2012 drought in the central Great Plain USA was the
most extensive drought in half a century. The absence of
processes produces rainfall over the central Great Plains
caused the drought. These include springtime low-
pressure systems and their attending warm and cold
fronts that act to lift air masses and produce widespread
rains. The deficit in rainfall in 2012 was -34.2 mm, which
was about 53% of the region’s long-term mean rainfall
(73.5 mm). This deficit broke the record of -28.4 mm
observed in 1934 and corresponds to a departure of
2.7 standard deviations. The 10 driest years (including
2012), ranked in order of their rainfall deficits, were
2012, 1934, 1936, 1901, 1976, 1913, 1988, 1953, 1911,
and 1931. Impacts from the 2012 drought emerged
swiftly and Loss was estimated more than $12 billion
(U.S. dollars) (Cook et al. 2014).
droughts pose challenges for this development, which has
been highlighted in different water policies, and in national
and regional growth initiatives. To combat water scarcity and
drought issues, The European Commission (EC) listed possible
measures to cope with water crisis and water saving. The
EC highlighted on priority basis and recommended shifting
from a risk/emergency to a planned drought management
approach and which has already proved in other regions
as United States (Estrela and Vargas 2012). From European
Environment Agency (EEA 2009) report point of view the
impacts of drought and water scarcity may be summarized
into: (a) economic impacts; (b) social impacts; and (c)
environmental impacts.
(a) Economic impacts
- Deficiency in public water supply with implications in
related sectors like tourism.
- Prices of food, energy and other products increase as
supplies are reduced.
- Hydropower production may also decrease.
- Uncertainty on crops yield and deeper abstractions
for use in agriculture.
- Higher level of risk for human and wildlife by range
fires due to extended droughts.
- Unemployment, increased credit risk for financial
institutions, capital shortfalls, and eventual loss of tax
revenue for local, state, and federal governments.
(b) Social impacts
- Public safety, health, conflicts between water users.
- Inequities in the distribution of impacts and disaster
relief
- Increase of water prices due to compensating
measures.
- Migration of water-intensive industry.
- The migrants increasing pressure on the social
infrastructure of the urban areas, leading to increased
poverty and social unrest.
(c) Environmental impacts
Drought also affects the environment in many different
ways. Like humans, plants and animals nourishment
depends on water. When a drought occurs, their food
supply can shrink and their habitat can be damaged.
Sometimes the damage is only temporary and their
habitat and food supply return to normal when the
drought is over. But sometimes drought's impact on
the environment can last a long time, maybe forever.
Examples of environmental impacts include:
110110110Water and Natural DisastersMain Focus 3.
- Damages to plant and animal species and wildlife
habitat
- Lack of food and drinking water for wild animals
- Increase in disease in wild animals, because of
reduced food and water supplies
- Migration of wildlife
- Loss of biodiversity with increased stress on
endangered species or even extinction
- Seawater intrusion due to over-pumping of
groundwater aquifers
- Lower water levels in reservoirs, lakes, and ponds
- Decrease of air and water quality.
- Loss of wetlands
- More wildfires
- Wind and water erosion of soils and threats of
desertification
- Deterioration of landscape quality
Some of these effects are short-term, conditions returning
to normal fol lowing the end of the drought. Other
environmental effects last for some time and may even
become permanent. Wildlife habitat, for example, may
be degraded through the loss of wetlands, lakes, and
vegetation. However, many species eventually recover from
this temporary aberration. The degradation of landscape
quality, including increased soil erosion, may lead to a more
permanent loss of biological productivity.
Human interac t ion with the physical environment
has increasingly transformed Earth-system processes.
Reciprocally, climate anomalies and other processes of
environmental change of natural and anthropogenic
origin have been affecting, and often disrupting, societies
throughout history. Transient impact events, despite their
brevity, can have significant long-term impact on society,
particularly if they occur in the context of ongoing, protracted
environmental change. Major climate events can affect
human activities in critical conjunctures that shape particular
trajectories of social development (http://www.pnas.org).
3.3.2.3 To Understand Importance of Shifting the Focus from Hazard Vulnerability/Resilience and Coping Capacity of Drought
The latest assessments show that due to problems with
past observing capabilities, it is difficult to make conclusive
statements about drought long-term trends (IPCC 2013).
However, regardless of droughts lasting a short or long period
of time, the droughts may have long lasting consequences
for societies. To cope with the short and long term drought
impacts, the traditional reactive approach is inadequate and
risk management approach becomes necessary particularly
to reduce water shortage in water supply systems (Rossi
and Cancelliere 2013). A few basic principles should be
adopted for effective hydrological risk management. First
of all, drought is a natural variable based on meteorological
conditions, but its severity impacts depends on the
vulnerability of water supply systems and of socio-economic
sectors as well as on the effectiveness of the adopted
mitigation measures. To reduce our vulnerability to droughts,
we need to change from passive crisis management to
proactive risk management. We must boost society’s capacity
to cope before the next drought strikes.
The reactive approach or passive crisis identifies the
mitigation measures only after the drought has begun and
which is inadequate to reduce water shortage and highly
inefficient in terms of financial resources. Conversely, the
complexity of drought impacts requires a comprehensive
preventive, anticipatory approach to risk, consisting
essentially of two different phases: drought management
plan development and implementation of the identified
measures (both before and after event begins). In first phase
of Proactive approach, an assessment of water resources
availability is carried out to meet different demands, then
different elements of water supply are analyzed to evaluate
the water shortage risk. After drought impact analysis
on different sectors, the actions are taken into account
to reduce drought vulnerability and actions to mitigate
drought impacts are defined in the planning documents. The
second phase foresees a continuous monitoring of hydro-
meteorological variables and water reserves status in order
to identify possible water crises and to apply the necessary
mitigation measures before a real water emergency occurs
(Rossi et al. 2008). To promote a proactive approach, WMO,
UNCCD, FAO and other partners are organizing a high-level
meeting on national drought Policy from time to time to
tackle this hot issue in future (Rossi et al. 2008).
Around 1.3 billion of the world’s population lives on arid,
semiarid, mountainous, or steep terrain. Such lands are
often prone to drought, which can result in environmental,
110
Main Focus 3. W
ater and Natural Disasters
111110 /the 7th World Water Forum 110
Main Focus 3. W
ater and Natural Disasters
111/
3.3.3 Framing the Solution
economic and humanitarian disasters. However, being
drought prone is not necessarily the same as being
vulnerable. Much depends on how dependent the economy
is on rain and on whether the country’s risk management
and infrastructure are adequate and appropriate for dealing
with drought. Given the potentially devastating impacts of
drought on the lives and livelihoods of the poor, drought
preparedness and adaptation to climate variability and
change are key priorities in World Bank strategies. That
the international community must respond to drought
emergencies in the short term are understood. This note,
however, concentrates on long-term measures for prediction,
management, and mitigation that are aimed at minimizing
the life-threatening and economy-weakening consequences
of drought. Since drought tends to be a systemic shock,
cutting across many sectors, it is critical that interventions
seek to deepen relevant country-level dialogue and
mechanisms for responding via macro-level frameworks
such as development policy lending, Country Environmental
Analysis, and the Comprehensive Development Framework
(Esikuri 2005).
3.3.3.1 Understanding Dominant Drought Risk Parameters
Assessments of available water resources and their temporal
and spatial distribution, as well as the analysis of flood and
drought risks are of great importance to preserve the health
of human societies and environmental systems. When looking
at global change scenarios, these types of assessments are
severely constrained by limited data availability, uncertain
model results, and incomplete scenario assumptions. As
long-term average values are generally considered the more
reliable outputs of climate and large-scale hydrological
models, many climate impact studies have focused on mean
renewable water resources and average flow conditions,
while assessments of seasonal changes and extreme flows
have been rare. Beyond the average trends, however, changes
in the frequencies of extreme events, such as floods and
droughts, may be one of the most significant consequences
of climate change. Moreover, during extreme low and
high-flow events the threats to human societies and the
environment are likely to be most critical, and the conflicts
between competing requirements to be most intense. Thus
growing attention has recently been drawn, both from a
scientific and political perspective, on understanding the risks
of extreme hydrological events with regard to global change
(Lehner et al. 2006).
Evidently, extreme flood and drought events can cause
tremendous damage to economy and ecology and, in the
worst case, bear enormous risks for life. They are phenomena
that are not constrained by watershed or international
boundaries, and they can grow to afflict large areas and
many countries simultaneously. Climate change is expected
to alter average temperature and precipitation values and
to increase the variability of precipitation events, which may
lead to even more intense and frequent floods and droughts.
As general future trends, increases in average precipitation
and its variability are expected, suggesting higher flood
risks, while less rainfall, prolonged dry spells and increased
evaporation may increase the frequency of droughts in
southern areas. Because of their large-scale character, it has
been recommended that droughts should be studied within
a regional context. This constrains regional assessments of
climate change effects, as the results of the individual case
studies may be incomparable due to the application of
different climate change scenarios, different hydrological
models, or different statistical methods. Even using the
same hydrological model in multiple basins may not solve
this problem, as small to meso-scale models are normally
developed for certain areas and conditions and often need
strong tuning or model modifications when transferred, e.g.
from cold humid to hot semiarid areas (Lehner et al. 2006).
Some of the drought risk parameters that need assessment
and evaluation to cope with future drastic situation are as
following.
(a) Climatic Factors
- Precipitation deficit (overall, during specific stages
of crop growth, by location)
- Temperature variation (mean, max, min, and
amplitude)
- Evapotranspiration
- Frost and other hazards (dry wind, sandstorms etc.)
(b) Water Resources
- Reduction in runoff, streamflow/river flow, spring
discharge, temporary rivers, snowmelt
- Water storage (% reservoirs filled)
- Ground water recharge
112112112Water and Natural DisastersMain Focus 3.
- Wells (discharge reduction, number of dried wells,
draw down)
- Water allocation/use by sector (% reduction)
(c) Economic Sectors: Agriculture
- Cropped area (changes by crop)
- Cultivation date
- Failures/delays in crop germination, plant density,
number of tillers
- Crop yield reduction (irrigated and rainfed, per unit
area, total)
- Damage to quality of produce
(d) Economic Sector: Livestock, Forests and Rangelands
- Range and pasture lands production and quality
- Reduction in livestock (deaths, sale, slaughter)
- Reduction in birth rate, death of newly born animals
- Reduction in forest products (timber, charcoal,
wood)
(e) Social Impacts
- Food insecurity - malnutrition, famine
- Unemployment
- Population migration
- Disease occurrence
- Unemployment
- Incidence of theft, racketeering, social unrest
(f ) Environmental Impacts
- Habitat and ecosystem losses (wetlands, riparian
habitat)
- Wildlife losses
- Soil and water salinization
- Soil degradation (erosion, organic matter/fertility
reduction)
- Soil and water pollution (www.drought.unl.edu)
Droughts are complex natural hazards that distress large
worldwide areas every year with serious impacts on society,
environment, and economy. Over the past 150 years, the
average global temperature has increased by 0.5–2 C° (Wang
et al. 2014). Special Report on Managing the Risks of Extreme
Events and Disasters to Advance Climate Change Adaptation
of the Intergovernmental Panel on Climate Change (IPCC)
suggests that there will be virtually certain increases in
frequency and magnitude of unusually warm days and
3.3.3.2 Scientific and Technological Basis of Drought and Coping with it Both Spatially and Temporally
nights at the global scale in the whole 21st century. Higher
temperatures will increase the potential evapotranspiration
and possibly result in an increased occurrence of drought.
Drought is one of the costliest natural disasters. Data from
the Emergency Event Database (www.em-dat.net) show that
the number of drought disasters accounts for only 5% of total
disasters, but the losses can amount to 30% of the losses
from all natural disasters. The effects of drought have recently
evoked interest beyond the scientific community (Wang et al.
2014).
Since the 1970s, characteristics of drought such as intensity,
duration and affected area of droughts are increasing. In
recent years, large scale intensive droughts have been
observed on all continents, affecting large areas in Europe,
Africa, Asia, Australia, South America, Central America, and
North America and high economic and social costs have led
to increasing attention to droughts (Mishra and Singh 2010).
The readers are encouraged to study the Mishra and Singh
(2010) comprehensive drought review about the impacts
of droughts on different continents around the globe. The
percentage of the world subjected to extreme drought
(assessed based on drought indicators) will expand from
1% to 30% in the 21st century, and the number of severe
drought events and drought duration are likely to increase.
In particular, severe drought can have devastating effects,
such as significant crop yield losses, an increased risk of
forest fires, exacerbated and intensified land degradation
and desertification, and increased competition for resources
and social violence, because of its long-lasting and wide areal
extent. In 2002, 26 states in the United States were affected
by severe and extreme drought, and total losses exceeded
$2.7 billion (Wang et al. 2014).
Some common drought vulnerability factors include; low
rainfall, increased temperature, more evapotranspiration,
low soil moisture holding capacity, absence of irrigation
facilities, livestock without adequate fodder, lack of water
storage facilities, poor water management, deforestation,
over grazing, water consuming cropping patterns, excessive
ground water draft, soil erosion, population growth and
urbanization, industrialization, and global warming etc.
Shortage of water poses a great threat to nature, quality of
life, and economy. Increasing water demands lead to conflicts
112
Main Focus 3. W
ater and Natural Disasters
113112 /the 7th World Water Forum 112
Main Focus 3. W
ater and Natural Disasters
113/
among competing water users that are most pronounced
during drought periods. The study of the climate variability
may contribute to a more correct management of such
extreme climatic occurrences. Recently, there has been debate
on the apparent increase, regarding the event frequency and
the affected area, of droughts and on the possible physical
causes of such circumstance (Santos et al. 2010). Therefore,
it is of great significance to develop a drought monitoring
model to monitor the distribution and intenseness of
droughts, which is crucial for drought warning and resisting
effectively. As the temporal and spatial changes contribute to
the diversity of drought conditions, it is necessary to perform
naturalization for these changes during the development
of the improved drought monitoring model (Liu and Xiang
2008).
The spatial-temporal analysis of drought is one of the
most important aspects of drought disaster mitigation. To
identify the world's severely drought-prone areas, given
that the corresponding ground area for a 0.5-degree grid in
different latitudes is different, Wang et al. (2014) proposed
a more precise spherical area-based statistical method. The
corresponding ground area per 0.5-degree grid was obtained
by integral calculation in latitude and longitude directions.
They analysed drought based on the global standardized
precipitation Evapotranspiration Index data set from 1902
to 2008, where global, Northern Hemisphere, Southern
Hemisphere, and major crop-planting regions from six
continents were treated as statistical units. The inter-annual
variability characteristics of the severe drought area for
each statistical unit were investigated. To study the spatial
distribution characteristics of the global frequency of severe
drought, the drought frequency was calculated based on
drought events identified by continuous drought months
on a grid level. Six major crops (wheat, maize, rice, soybean,
barley, and sorghum) were chosen to study the impact of
drought events on agriculture. From their results they found
an overall upward trend in all continents except Oceania as
shown in Fig. 3.6. They identified drought-prone areas as
those with patchy distribution and frequently drought-prone
areas (with 10–20% occurrence probability of drought) were
distributed in regions surrounding chronically drought-prone
areas (with more than 20% probability). Global chronically
drought-prone areas have increased significantly, from
16.19% in 1902–1949 to 41.09% in 1950–2008. Chronically
drought-prone areas of agriculture are located in the center
of southern Europe, some areas of the South America, and
eastern Asia. Their conclusions can provide a scientific basis
for the management of drought mitigation strategies on a
global or national scale. Identifying the drought-prone areas
can help decision-makers to take drought into account in
resource planning and help to select drought-tolerant crops
in drought-prone agricultural areas.
The European Drought Observatory web pages contain
drought-relevant information such as maps of indicators
derived from different data sources (e.g.,precipitation
measurements, satellite measurements, modelled soil
moisture content). Different tools, like Graphs and Compare
Indicators, allow for displaying and analysing the information
and irregularly published "Drought News" give an overview
of the situation in case of imminent droughts. This has
been developed in the framework of the EuroGEOSS
project considering the INSPIRE specifications and GEOSS
interoperability arrangements. The project established a
drought metadata catalog to allow access to resources for
drought monitoring. It is fully integrated with local and
national systems in Europe and international drought early
warning systems as a European contribution to a Global
Drought Early Warning System (http://www.eurogeoss.eu/).
(a) Operationalize drought monitoring system
- Diagnosing the causes of drought versus water
scarcity in regional scale
- Consistent monitoring and reporting
- Responsible agencies (environmental, water basin
agencies, …)
(b) Provide forecast and warning information
- Seasonal outlooks
- El Niño/La Niña
- Sea surface temperatures
- Economic and social trends
- Linked to drought plan “triggers”
- Developing management strategies focusing on cost
benefit analyses of agricultural evapotranspiration
vs. water conservation for alternative hydrological
uses
- Forecasting the incidence of drought events under
3.3.3.3 Striving towards Horizontal and Vertical Integration of Existing Drought Early Warning Systems
114114114Water and Natural DisastersMain Focus 3.
Drought is not only caused by insufficient total precipitation,
but also directly caused and increasingly aggravated by
a number of consecutive no-rain days within the rainy
season, usually called dry spells. Dry spell (DS) is defined
as consecutive days with the daily precipitation amount
less than a certain threshold, i.e. a dry spell is preceded
and followed by rainfall days exceeding the threshold. Dry
spell analysis helps to better recognize the dryness impact.
Research relying on the monthly precipitation can sometimes
lead to incorrect results, and consequently many researchers
all over the world have studied drought using dry spell
analysis (Huang et al. 2014). To prevent and alleviate the
potential drought damages, many cities and states in the USA
have developed their drought mitigation plans. These plans
are usually composed of three to four drought severity levels
and their respective mitigation measures. Nonetheless, for a
drought mitigation plan, defining drought indicators based
on the identification of different drought severities is critical.
Mainly, the drought indicators are established according to
streamflow, precipitation, water levels in lakes and reservoirs,
soil moisture content, and groundwater level (Chen and Chan
2007). A number of different indices have been developed
to quantify a drought, each with its own strengths and
weaknesses. They include the Palmer drought severity index
(PDSI), rainfall anomaly index (RAI), crop moisture index
(CMI), Bhalme and Mooly drought index (BMDI), surface
water supply index (SWSI), national rainfall index (NRI),
standardized precipitation index (SPI), and reclamation
drought index (RDI). The soil moisture drought index (SMDI)
and crop-specific drought index (CSDI) appeared after CMI.
Furthermore, CSDI is divided into a corn drought index (CDI)
and soybean drought index (SDI), and vegetation condition
index ( VCI). Based on the studies for drought indices,
3.3.3.4 Improving Drought Mitigation Indicators and Measures to Reduce Damage
considered: the priority of water allocation among the
various uses, the indications provided by drought monitoring
systems and the method adopted to assess drought risk. With
reference to the latter, the individualization of risk levels (i.e.
alert, alarm and emergency), associated with different groups
of interventions, could be a valuable tool for decision makers.
In nutshell, it should be pointed out that an integrated
drought management strategy is a key step toward the
reduction of the most adverse drought effects, since it makes
possible to shift from a reactive to a proactive approach,
which is widely recognized to be the more appropriate way
for a successful drought mitigation (Rossi et al. 2007).
Sechi and Sulis (2010) developed a methodology to support
the decision making process of water authorities facing
droughts in complex water systems. The methodology is
based on a full integration of optimization and simulation
tools. The exploratory power of the optimization allows
the rapid estimation of subsets of flow variables related
to forecasted demands supplies and shortages that are
used as operative indicators of the drought risk in future
hydrological scenarios. The simulation model uses these
indicators as triggers of mitigation measures in a proactive
approach to drought. In the case of an overly optimistic
forecast of the hydrological scenario, the proactive approach
does not completely eliminate the risk of shortages. In this
case, further measures have to be implemented in the water
system simulation in a reactive approach to drought. These
can include more expensive and higher impact measures
to be taken later, after the severity of the drought event has
been highlighted.
climate change scenarios
(c) Develop or modify current data and information /
communication delivery systems
- Improve system over time with experience
- Enhance delivery of information to users (i) Cellular
(ii) Webinars
- Weekly bulletins/extension
- Monthly cabinet meetings/briefings, etc.
In order to build long-term resilience to drought it is
necessary to combine traditional methods with local
knowledge, and innovative technological tools with
community-based solutions. Innovations in drought
response and resilience offer hope and the ability to predict,
withstand, and overcome future drought crises (Othowai et
al. 2012). Drought as natural disaster continues to threaten
the livelihoods of millions of people. Combating drought
is utmost necessary to achieve sustainable development
goals, including the maintenance of ecosystem services,
and improving the livelihoods of millions of people living
in drought-prone regions. The effects of climate change
heighten the risk of droughts and drought severity and
3.3.4 Accelerating Innovation
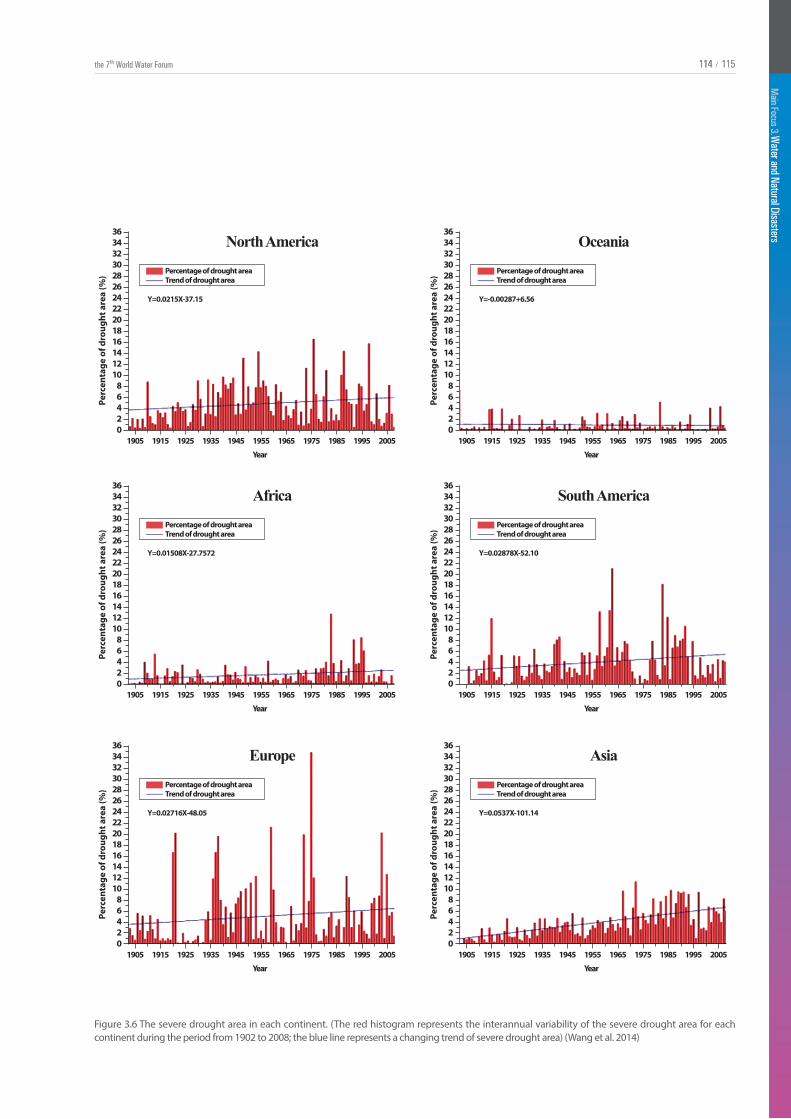
114
Main Focus 3. W
ater and Natural Disasters
115114 /the 7th World Water Forum 114
Main Focus 3. W
ater and Natural Disasters
115/
Figure 3.6 The severe drought area in each continent. (The red histogram represents the interannual variability of the severe drought area for each continent during the period from 1902 to 2008; the blue line represents a changing trend of severe drought area) (Wang et al. 2014)
3634323028262422201816141210
86420
1905 1915 1925 1935 1945 1955
Year
1965 1975 1985 1995 2005
Perc
enta
ge o
f dro
ught
are
a (%
) Percentage of drought areaTrend of drought area
Y=0.0215X-37.15
North America3634323028262422201816141210
86420
1905 1915 1925 1935 1945 1955
Year
1965 1975 1985 1995 2005Pe
rcen
tage
of d
roug
ht a
rea
(%) Percentage of drought area
Trend of drought area
Y=-0.00287+6.56
Oceania
3634323028262422201816141210
86420
1905 1915 1925 1935 1945 1955
Year
1965 1975 1985 1995 2005
Perc
enta
ge o
f dro
ught
are
a (%
) Percentage of drought areaTrend of drought area
Y=0.01508X-27.7572
Africa3634323028262422201816141210
86420
1905 1915 1925 1935 1945 1955
Year
1965 1975 1985 1995 2005
Perc
enta
ge o
f dro
ught
are
a (%
) Percentage of drought areaTrend of drought area
Y=0.02878X-52.10
South America
3634323028262422201816141210
86420
1905 1915 1925 1935 1945 1955
Year
1965 1975 1985 1995 2005
Perc
enta
ge o
f dro
ught
are
a (%
) Percentage of drought areaTrend of drought area
Y=0.02716X-48.05
Europe3634323028262422201816141210
86420
1905 1915 1925 1935 1945 1955
Year
1965 1975 1985 1995 2005
Perc
enta
ge o
f dro
ught
are
a (%
) Percentage of drought areaTrend of drought area
Y=0.0537X-101.14
Asia
116116116Water and Natural DisastersMain Focus 3.
E-learning is the study of ethical practice of facilitating
learning and improving performance by creating, using and
managing appropriate technological processes and resources.
E-Learning can play a vital role in drought monitoring and
mitigation measures. The advantages of e-learning are as
follows:
(a) Continuous up-to date information about the
forthcoming projected events.
(b) Capability to communicate and collaborate for drought
risk reduction through using chat rooms, emails,
bulletin boards etc.
(c) Acquiring knowledge from web server with consultation
of drought management experts according to the
learner own pace.
(d) Can improve the productivity and efficacy of the
concerned group.
The WATER CoRe (Water Scarcity and Droughts - Coordinated
actions in European Regions) was a project (from Jan.
2010 to Dec. 2013) funded by the EU's European Regional
Development Fund. The project provides an exchange
platform for water scarcity and drought issues at regional
and local level for all European regions (www.unece.org).
The WATER CoRe aim was to compile existing policies and
practical experiences on the management of water scarcity
and droughts and makes it accessible to all regional and
local actors in the EU and beyond in order to help countries
create their own tailor-made approaches. The WATER CoRe
(www.ativizig.hu) e-learning addresses; (i) professionals,
working for (regional) governments, (ii) water authorities,
(iii) consultants or non-governmental organizations (NGO’s),
3.3.4.1 Scaling up and Expanding the Existing E-learning Tools
which are looking for practical solutions. It may also be
valuable for students and scholars in water management,
(spatial) planning, governance and sustainable development
and policy makers on the European level.
Seven main e-learning modules related to water scarcity and
drought issues highlighted by WATER CoRe are as following:
(a) Water Scarcity and drought - an overview
It deals with the general introduction about water
scarcity and drought issues.
(b) Demand-side water management - technical issues
This module deals the par tners k now-how in
management plans, guidelines, software tools and
research programs oriented towards real and strong
solutions on water demand-side management. Main
topics under this module are; (i) alternative sources
to freshwaters, (ii) treated wastewaters recycling, (iii)
efficiency in the distribution network and leakage
reduction, (iv) water-saving equipment, (v) sustainable
irrigation, and (vi) metering and re-use.
(c) Demand-side water management - economic aspects
The main focus of this module is on the selection
of economic and financial instruments focused on
water demand side management through monetary
mechanisms.
Main drivers are; (i) taxing and pricing, and (ii) return on
investment.
(d) Handling drought periods and mitigate drought effects
This covers the communication and information to
drought events; technological and infrastructural
measures; planning, management and monitoring.
(e) Climate change effects on water management
This part discusses the existing policy frameworks on
different levels of governance, relating to different
sectors for the implementation of adaptation and
mitigation strategies.
The factsheets selected deal with four different
concepts; (i) forecasting, (ii) adaptation strategies, (iii)
mitigation strategies, and (iv) implementation and
governance.
(f ) Public awareness and participation
This part shares several experiences collected:
awareness raising and education; information and
dissemination as well as public participation programs
and stakeholder involvement tools.
increase the need for effective drought management
and disaster risk reduction. Drought must be included
as an integrated part of sustainable development cycle,
considering social, economic and environmental aspects.
Strategies for drought management, including contingency
planning should be incorporated into sustainable agricultural
practices, soil conservation, crop diversification and
integrated water resources management and combating
desertification, taking into account the legal framework and
mandate of the UNCCD and its role in mitigating the effects
of drought.
116
Main Focus 3. W
ater and Natural Disasters
117116 /the 7th World Water Forum 116
Main Focus 3. W
ater and Natural Disasters
117/
(g) Roadmap to the implementation of regional action
plans
Providing guidelines to the implementation of local
and regional plans to cope with water scarcity and
drought.
The UN-SPIDER (United Nations Platform for Space-based
Information for Disaster Management and Emergency
Response) Regional Support Office (RSO) in Iran is hosted by
Iranian Space Agency Office for Outer Space Affairs (UNOOSA).
In June 2014, the RSO started to choose E-learning consi-
dering it as a key factor in knowledge promotion at the field
of drought monitoring. The targeted objectives of RSO from
this E-learning program (www.un-spider.org) were:
(a) Increase the knowledge of participants about drought
and its impacts.
(b) Increase the knowledge of participants about role
of remote sensing in drought monitoring and risk
assessment.
(c) Fill the technical gaps between different sectors
working in the field of Space Technology and Disaster
Management.
(d) Teach a simple methodology using free of charge
archived satellite imagery for drought monitoring and
risks management.
The target groups were:
(a) Professionals with skills on the use of GIS and RS
background who requires knowledge for drought
monitoring.
(b) University students, researchers interested in the
field of geosciences, geo-information, and drought
monitoring,
(c) Staff working in the disaster management organiza-
tions and space technology.
As vulnerability to drought has increased globally, greater
attention has been directed to reducing risks associated
with its occurrence through the introduction of planning
to improve operational capabilities (i.e., climate and water
supply monitoring, building institutional capacity) and
mitigation measures that are aimed at reducing drought
impacts. This change in emphasis is long overdue. Typically,
3.3.4.2 Merging Latest Technology and Traditional Knowledge to Minimize Future Droughts
when a natural hazard event and resultant disaster has
occurred, governments and donors have followed with
impact assessment, response, recovery, and reconstruction
activities to return the region or locality to a pre-disaster
state. Historically, l ittle attention has been given to
preparedness, mitigation, and prediction/early warning
actions (i.e., risk management) that could reduce future
impacts and lessen the need for government intervention in
the future. Because of this emphasis on crisis management,
society has generally moved from one disaster to another
with little, if any, reduction in risk. This concept is expressed in
the Cycle of Disaster Management. If more emphasis is placed
on the risk reduction portions of this cycle, the impacts
associated with drought and other disasters, and thus the
need for government interventions in the form of emergency
relief measures, will be reduced (Wilhite et al. 2014).
Space-based data is a vital complement to ground-based
information in combating drought. However, there is a lack
of resources and capacity to perform such analysis in many
drought-prone developing countries. A major drawback of
operational drought forecasting systems is their inability to
make reliable predictions regarding the location, magnitude
and the kind of assistance needed in the medium to long
term, i.e. several months in advance. Yet in some situations
where predictions were made, e.g. warnings of extreme
drought conditions in the Horn of Africa during 2010/2011,
there was still insufficient response on the ground (Enenkel
et al. 2014). Moreover, the predictions of large-scale droughts
even fail in industrialized and developed countries such
as the United States (Schiermeier. 2013). This has proved
that fact that there is no commonly accepted definition of
drought (Belal et al. 2012) and climate change impacts on
global drought patterns (Trenberth et al. 2014). At the same
time the consideration of teleconnections, for instance the
impact of anomalies in the sea surface temperatures of
the Indian Ocean on drought events in the Horn of Africa
(Tierney et al. 2013) add complexity to already sophisticated
models. Finally, there are different kinds of drought (i.e.
meteorological, agricultural and hydrological) that have
different socio-economic implications so it is not possible to
have a single physically measurable “drought-parameter” for
all of these situations.
How can science play an efficient supporting role in the
decision-making process is the crucial question, which
118118118Water and Natural DisastersMain Focus 3.
multi-disciplinary approach. Figure 3.7 demonstrates this
approach and identifies the current weak connections.
needs an answer. One promising and logical solution is
the integrated combination and adaptation of existing
technologies, including different satellite-based systems.
Organizations such as NOAA (National Oceanic and
Atmospheric Administration) or EUMETSAT (the European
Organization for the Exploitation of Meteorological Satellites)
provide a vast variety of satellite-derived datasets that are
available operationally, on a near real-time basis and free of
charge (or with a minimal and low-cost receiving station). In
addition to some of the more commonly used remote sensing
products, datasets derived from microwave sensors can be
provided at a spatial resolution that is worth to complement
or replace in-situ measurements. These datasets mostly used
to compensate for weaknesses of local measurements such as
poor coverage and the lack of spatial consistency. Although
a spatial resolution of 25 kilometers (e.g. for soil moisture
derived using a radar sensor) does not allow investigations at
a field scale, such datasets can nonetheless provide an added
value, particularly in areas with incomplete or biased rainfall
measurements. Monthly weather predictions are available,
for instance from the European Centre for Medium-Range
Weather Forecasting (ECMWF). However, seasonal forecasts
are extremely complex due to uninterrupted chaotic
processes in our atmosphere (e.g., wind speed and direction,
variations in air pressure or heat transfer) and only available
to scientific users. All of these products require an in-depth
understanding of atmospheric and biophysical processes
along with the technical knowledge to deal with large
datasets–an understanding and capacity that many users do
not have (Enenkel et al. 2014).
The interaction of environmental drought-inducing key
parameters (rainfall, temperature, soil moisture, vegetation,
evapotranspiration) is fairly well understood. One major
problem is that large-scale preparations require reliable
forecasts several months in advance, which are currently not
certain enough. Another issue is that agricultural drought
constitutes just one possible root cause of food insecurity. In
many cases, famine is promoted by high levels of vulnerability
caused by interacting socio-economic issues, such as political
unrest, and increasing or unstable food prices. In fact, the
methods for monitoring environmental anomalies and their
socio-economic manifestations hardly overlap. In order to
create a holistic monitoring system it is recommended that
researchers collaborate more closely with end users in a
3.3.4.3 Improving Use of Remotely Sensed Satellite and Information Technologies for Drought Risk Reduction
There are a number of ongoing technological developments
that could support drought risk reduction. Here, three
complementary tasks are focused that could be better
integrated to improve decision-support; (a) the improvement
of agricultural drought monitoring through exploitation
of satellite-derived soil moisture, (b) gaining a better
understanding of the uncertainty of long-term weather
forecasts and how this information can be integrated with
satellite-derived soil moisture, and (c) the integration of non-
environmental information via smartphones. These three
complementary tasks are discussed in more detail below.
First, the full potential of state-of-the-art satellite-derived
soil moisture measurements from space-based microwave
sensors needs to be exploited for agricultural drought
monitoring. Soil moisture in particular is essential to close
the gap between atmospheric processes and land surface
interactions. It indicates plant water deficiencies earlier than
conventional products estimating the vegetation status
such as the Normalized Difference Vegetation Index (NDVI).
For example Zribi et al. (2010), have modeled the future
vegetation dynamics during rainy seasons in semiarid regions
using satellite-derived soil moisture only. Although the soil
penetration of space-based microwave sensors is limited to
a few centimeters, it is possible to estimate the soil moisture
conditions in the root zone (Albergel et al. 2008). Radar
measurements are carried out independent from weather
conditions and sunlight. Afterwards, they can either be used
directly as an input for drought indicators or incorporated
into advanced models via data assimilation (Enenkel
et al. 2014). Both the National Aeronautics and Space
Administration (NASA) and the European Space Agency
(ESA) are focusing on new-dedicated soil moisture sensors.
The launch of NASA's SMAP (Soil Moisture Active Passive)
mission is planned for late 2014. The first satellite of the new
European flagship mission named “Sentinel” was launched in
April 2014. Until Sentinel-1a has finished its “commissioning
phase” there is only one operational soil moisture monitoring
system.
Second, in addition to a large-scale picture of present
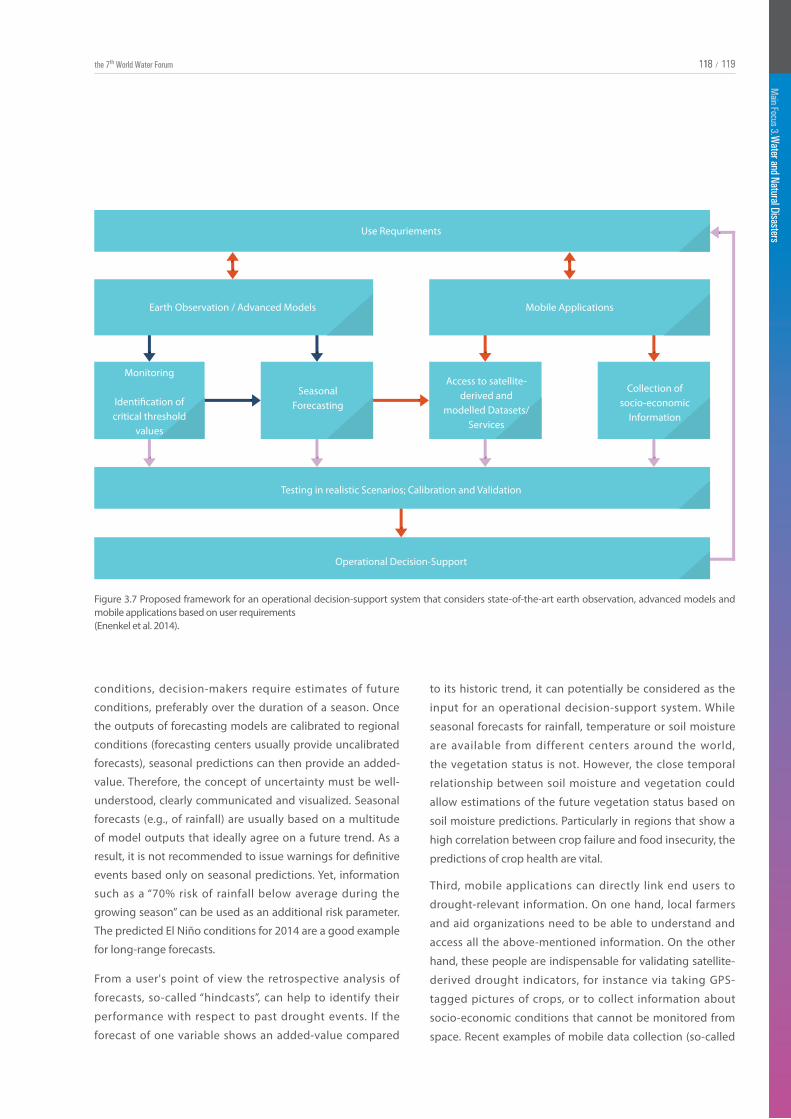
118
Main Focus 3. W
ater and Natural Disasters
119118 /the 7th World Water Forum 118
Main Focus 3. W
ater and Natural Disasters
119/
Figure 3.7 Proposed framework for an operational decision-support system that considers state-of-the-art earth observation, advanced models and mobile applications based on user requirements (Enenkel et al. 2014).
Use Requriements
Testing in realistic Scenarios; Calibration and Validation
Operational Decision-Support
Earth Observation / Advanced Models Mobile Applications
Monitoring
Identi�cation ofcritical threshold
values
SeasonalForecasting
Access to satellite-derived and
modelled Datasets/Services
Collection ofsocio-economic
Information
conditions, decision-makers require estimates of future
conditions, preferably over the duration of a season. Once
the outputs of forecasting models are calibrated to regional
conditions (forecasting centers usually provide uncalibrated
forecasts), seasonal predictions can then provide an added-
value. Therefore, the concept of uncertainty must be well-
understood, clearly communicated and visualized. Seasonal
forecasts (e.g., of rainfall) are usually based on a multitude
of model outputs that ideally agree on a future trend. As a
result, it is not recommended to issue warnings for definitive
events based only on seasonal predictions. Yet, information
such as a “70% risk of rainfall below average during the
growing season” can be used as an additional risk parameter.
The predicted El Niño conditions for 2014 are a good example
for long-range forecasts.
From a user's point of view the retrospective analysis of
forecasts, so-called “hindcasts”, can help to identify their
performance with respect to past drought events. If the
forecast of one variable shows an added-value compared
to its historic trend, it can potentially be considered as the
input for an operational decision-support system. While
seasonal forecasts for rainfall, temperature or soil moisture
are available from different centers around the world,
the vegetation status is not. However, the close temporal
relationship between soil moisture and vegetation could
allow estimations of the future vegetation status based on
soil moisture predictions. Particularly in regions that show a
high correlation between crop failure and food insecurity, the
predictions of crop health are vital.
Third, mobile applications can directly link end users to
drought-relevant information. On one hand, local farmers
and aid organizations need to be able to understand and
access all the above-mentioned information. On the other
hand, these people are indispensable for validating satellite-
derived drought indicators, for instance via taking GPS-
tagged pictures of crops, or to collect information about
socio-economic conditions that cannot be monitored from
space. Recent examples of mobile data collection (so-called
120120120Water and Natural DisastersMain Focus 3.
crowdsourcing) include the activities of the Humanitarian
OpenStreetMap Team (HOT) during the aftermath of typhoon
Haiyan that struck the Philippines on 8 November 2013 or
during the civil unrest in South Sudan in early 2014. In both
cases the HOT was activated to provide geographic baseline
data for humanitarian response.
Finally, the objective of all new initiatives must be to support
disaster risk reduction via individual short-term solutions –
also after the media attention is gone. The above-mentioned
approaches and technologies are not the ultimate solution,
but they can complement the existing knowledge base for
decision-support (Enenkel et al. 2014).
The 2014 United Nations/Germany Expert Meeting (UN/
GEM 2014) on the Use of Space-based information for flood
and drought risk reduction focused on the use of space
technologies to improve disaster risk reduction. Floods
and droughts served as examples for hazard types that
have recently affected countries around the globe. Recent
examples are the UK floods in February 2014, floods in Central
Europe in June 2013, the floods following super typhoon
Haiyan in the Philippines in November 2013, or the droughts
in Eastern Africa 2011 and droughts in Bolivia in 2013 (http://
www.un-spider.org).
Effective disaster-risk management aims to prevent that
events such as floods and droughts become disasters.
Space technologies, especially Earth observation and global
navigation satellite systems, provide data which can be used
for risk assessment. However, the potential contribution of
space-based information to disaster-risk management is
not yet fully exploited – technical solutions are not tailored
enough to the needs on the ground, and space-based
information is rarely easily accessible to disaster managers.
The United Nations/Germany Expert Meeting on the use of
space-based Information for flood and drought-risk reduction
focused on the use of space technologies to contribute to
disaster-risk reduction.
(a) The outcomes related to this Expert Meeting included:
- The exchange of information on the most up-to-date
satellites and Earth observation methodologies to
improve flood and drought risk assessment;
- The elaboration of recommendations to improve
flood and drought-risk management through the use
of space-based information;
- The identification of elements to contribute to the
Post 2015 Framework for Disaster Risk Reduction
(HFA-2) and to the upcoming World Conference on
Disaster-risk reduction to take place in Sendai, Japan,
in March 2015.
(b) The Bonn meeting included drought risk reduction
related objectives as following:
- To gather lessons learned from on the use of Earth
observation in past droughts;
- To identify ways how to enhance the use of the UN-
SPIDER Knowledge Portal to support drought risk
assessment; and
- To come up with recommendations regarding how
drought-risk management can be improved through
the use of space-based information.
(c) Tackling the issues like availability accessibility and
usefulness of satellite data during recent droughts as
well as the suitability of different indices. On the issue
of novel satellite sensors, the following conclusions
were derived:
- TRMM is an example of an operational satellite-based
data source for precipitation monitoring. The Global
Precipitation Monitoring (GPM) Core Observatory will
ensure data continuity for precipitation monitoring.
All GPM products will be released to the public from
September 2014. EUMETSAT was also mentioned as a
data provider for satellite‐based precipitation data;
- The Soils Moisture and Ocean Salinity application
(SMOS) is a scientific and experimental sensor
which could be used for soil moisture and could
complement efforts to predict crop productivity.
- The thermal bands 10 and 11 of Landsat8 resolution
were also identified as suitable for soil moisture
estimation. With 100m resolution they provide a
much higher spatial resolution than SMOS data
(35 km), which could be useful for applications in
agriculture.
(d) Regarding applications of Earth observation products,
the followings were discussed:
- The Famine Early Warning System (FEWSnet)
developed by the United States and implemented
worldwide with support from the United States
Agency for International Development (USAID)
is as an operational service that makes use of
120
Main Focus 3. W
ater and Natural Disasters
121120 /the 7th World Water Forum 120
Main Focus 3. W
ater and Natural Disasters
121/
3.3.5 Research and Development Agenda
3.3.5.1 Current Leading Edge Development in the Field of Drought Risk Reduction
To reduce the threat of drought around the world, an
increasing number of national, regional, and international
entities have begun to take action. Drought risk reduction
is also connected with another important international
convention, the United Nations Framework Convention on
Climate Change (UNFCCC). According to UNFCCC, there are
at least two areas where activities related to drought can
be undertaken: (a) adaptation to the impacts of climate
change, and (b) research and systematic observation. Parties
of the convention have committed to close cooperation in
responding to drought, desertification, and flood disasters
(UNISDR 2007). In 2003, the secretariat of the UNISDR
facilitated the creation of an Ad Hoc Discussion Group on
drought at the request of the United Nations Inter-Agency
Task Force on Disaster Reduction. The endeavor brought
together prominent scientists and practitioners from a variety
of institutes and UN agencies to propose new paradigms and
actions required to reduce global drought risk. The initiative
resulted in an integrated approach to reducing social
vulnerability to drought, which has been used to promote
vegetation indices (NDVI, EVI), rainfall estimations,
evapotranspiration, crop soil water index and
other ground‐based data to monitor droughts and
their effect on food security. Such a system could
complement existing efforts to track droughts
through standard precipitat ion and weather
measurements carried out by Meteorological
Departments. Mexico and Nigeria have used FEWSnet
and recommend it as a useful information source for
drought monitoring;
- Famers could benefit from the use of precision
agriculture, where space‐based information is used
to optimize agricultural practices. Such practices are
used in several countries including the Netherlands;
- A pilot project is being conducted in Pakistan with
the objective of providing decision makers near-real-
time crop yield forecasting information and a crop‐
reporting service including statistics on different
crops, drought conditions and information on losses
due to droughts.
drought resilient nations and communities around the world
(http://www.unisdr.org/droughts-doc).
The drought risk reduction framework proposes the following
main elements for consideration, namely:
(a) Drought policies and governance,
(b) Drought risk identification, impact assessment, and
early warning,
(c) Drought awareness and knowledge management,
(d) Reducing underlying risk factors, and
(e) Effective drought mitigation and preparedness
measures.
The National Drought Mitigation Center (NDMC), established
at the University of Nebraska-Lincoln in 1995, providing
technical assistance to communities and institutions to
develop and implement measures to reduce societal
vulnerability to drought, stressing preparedness and risk
management rather than crisis management. The NDMC
collaborates with many federal, state, and international
agencies. A ten-step drought mitigation planning process
was developed by the NDMC as below:
(a) Appoint a drought task force or committee
(b) State the purpose and objectives of the drought
mitigation plan
(c) Seek stakeholder input and resolve conflicts
(d) Inventory resources and identify groups at risk
(e) Prepare and write the drought mitigation plan
(f ) Identify research needs and fill institutional gaps
(g) Integrate science and policy
(h) Publicize the drought mitigation plan and build
awareness and consensus
(i) Develop education programs
(j) Evaluate and revise drought mitigation plans
Based on a review of drought related World Bank projects,
a number of important design elements summarized as
following (Esikuri 2005):
(a) Nonstructural measures such as management of water
and other natural resources
(b) Structural hydraulic infrastructure that increases
buffering capacity through capture and storage and
through inter-basin transfers
(c) Appropriate infrastructure (access roads, crop storage
and processing) and technologies, such as drought-
122122122Water and Natural DisastersMain Focus 3.
resistant crops and efficient irrigation
(d) Market mechanisms such as drought insurance,
destocking in advance of droughts, buying from
producers at competitive rates, and establishment of
food reserves
(e) Early warning and information systems; community
awareness campaigns
(f ) Appropriate land use and agriculture policies and
institutions and responsive drought disaster
(g) governance systems.
A special issue on drought risk reduction; “Africa Informs”
(UNISDR 2012) outlined the following drought risk reduction
framework guiding principles:
(a) Political commitment, high-level engagement, strong
institutional setting, clear responsibilities both at
central and local levels and appropriate governance
are essential for integrating drought risk issues into a
sustainable development and disaster risk reduction
process.
(b) A bottom-up approach with effective decentralization
and active community participation for drought
risk management in planning, decision making and
implementation, is essential to move from policy to
practice.
(c) Capacity building and knowledge development are
usually required to help build political commitment,
competent institutions and an informed constituency.
(d) Drought risk reduction policies should establish a clear
set of principles or operating guidelines to govern the
management of drought and its impacts, including the
development of a preparedness plan that lays out a
strategy to achieve these objectives.
(e) Drought-related policies and plans should emphasize
risk reduction (prevention, mitigation and preparedness)
rather than relying solely on drought (often turned into
famine) relief.
(f ) Drought monitoring, risk assessment and other ap-
propriate risk reduction measures are principal
components of drought policies and plans.
(g) Institutional mechanisms (policy, legislative and
organizational) should be developed and enforced
to ensure that drought risk reduction strategies are
carried out.
(h) Sound development of long-term investment in
risk reduction measures (prevention, mitigation and
preparedness) is essential to reduce the effects of
drought.
3.3.6 RecommendationsFor effective drought management to ensure sustainable
water resources and to face hydrological drought risk
successfully, shifting from a reactive (emergency manage-
ment and drought relief ) to a proactive and comprehensive
approach (prediction, preparedness and mitigation) is
necessary. However, change of this paradigm in drought
management requires the support of several methods and
techniques that can find application both for planning
mitigation actions as well as for implementing the measures.
As a mitigation tool, water shortage risk should be included
as one of the criteria along with economic, environmental
or social based ones, within a more general procedure for
selection of the best mix of strategic and tactical mitigation
measures. Some specific recommendations are as follows:
(a) Drought should be recognized a recurring phenomenon
rather than an isolated event.
(b) Developing composite drought indices by including
different parameters (e.g., precipitation, evaporation,
stream flow, soil moisture, and vegetation etc.) can assess
the drought regimes more suitably than assessing with
a single parameter like using Standardized Precipitation
Index (SPI), which depends only on one parameter.
(c) As a complex natural hazard drought is best charac-
terized by multiple climatological and hydrological
parameters. Improving our understanding of the
relationships between these parameters is necessary to
develop measures to reduce the impacts of droughts.
(d) Prepare national drought management plans and/or
risk reduction strategies and invite donors to assist
developing countries in their efforts to integrate issues
related to drought into national, regional and global
sustainable development strategies and plans. The
water-related issues should be integrated into sectoral
policies to successfully address water scarcity and
droughts and to ensure a sustainable water allocation.
(e) Support more proactive drought risk-management
approaches.
(f ) National drought policies should include integrated
drought and water scarcity risk management, disaster
preparedness, emergency relief, and recovery and
rehabilitation planning. They must also take into
122
Main Focus 3. W
ater and Natural Disasters
123122 /the 7th World Water Forum 122
Main Focus 3. W
ater and Natural Disasters
123/
account water availability and ecosystem protection
and restoration while preserving ecosystems and
tackling climate change.
(g) The policies must be based on the best available
knowledge and science relevant to the local, national
and regional conditions and circumstances.
(h) Invest in research and development, robust data
collection, including through remote sensing, and
information to assess and identify risk and to predict,
plan for and manage droughts across time scales
from seasonal to multi-year events, including short-,
medium- and long-term events, taking into account
traditional knowledge.
(i) Cross-sectoral coordination in the design and imple-
mentation of mitigation measures, particularly in the
infrastructure, water resources, and agriculture sectors,
should be encouraged and promoted.
( j) Resource managers, educators, health department,
civil society and non-governmental organizations,
the private sector and others should be engaged
in developing and implementing policies. This will
ensure that risk management, resource stewardship,
environmental protection, and public education are
fully integrated into drought preparedness.
(k) There is a need for advanced assessment of economic,
environmental and social impacts of droughts and of
the effects of alternative drought mitigation policies in
reducing such impacts, based on multi-criteria tools.
(l) Public awareness is a key condition for any change of
behavior. Specific campaigns need to be promoted.
(m) Mobilize and enhance funding and support research
and development on the underlying causes and
effects of drought, including social, economic and
environmental perspectives, as well as for improved
techniques and practices that can improve food
security and reduce human vulnerability.
(n) Promote the exchange of information, experiences and
lessons learned in relation to drought risk management
and reduction and increase public awareness about
traditional and adaptable practices.
(o) Promote innovative technical solutions and practices,
combining them with traditional knowledge, for
drought forecasting, impact assessment and early
warning information systems and sustainable
integrated water management.
(p) Prepare national drought management plans and/or
risk reduction strategies and invite donors to assist
developing countries in their efforts to integrate issues
related to drought into national, regional and global
sustainable development strategies and plans
(q) Invite the Conference of the Parties to the UNCCD to
continue to include drought risk reduction strategies
and drought management plans in its work.
Urban flooding is a growing issue for developed and
developing countr ies and damages with di f ferent
perspectives and recently become more serious than ever
before due to climate change and fast urban development.
Currently a number of technical solutions and management
solutions have been developed such as (a) for technical
solutions: flood defense system such as flood gates, doors,
and barriers as well as flood forecasting and observation
technologies and (b) for management solutions: the
integrated flood management system and the flood warning
system. Since major developments for the solutions of urban
flood mitigation are presented, it will be useful for the water
managers and policy makers as well as general citizen in
order to build the basic knowledge of urban flooding and
obtaining the information about the state of the arts about
the problems and solutions of flooding.
3.4 URBAN FLOOD MITIGATION THROUGH INNOVATIVE TECHNOLOGY AND MANAGEMENT 3.4.1 Background
A flood occurs from the combination of extreme cases for
meteorological, hydrological, and human factors. Critical
meteorological factors for floods are heavy rainfall, cyclone
storms, and intense convective storms while the hydrological
components are wet soil moisture and high groundwater
levels prior to storm. The human factors that intensify floods
are mainly land-use from dense population and flood plain
occupation.
Therefore, flood is a growing issue of concern for both
developed and developing nations. In the past twenty years,
the number of reported flood events has been increasing
3.4.2 Framing the Challenges3.4.2.1 Historical Flood Spatial and Temporal Distribution

124124124Water and Natural DisastersMain Focus 3.
Figure 3.8 Flood Events 1970-2011 (EM-DAT)
3.4.2.2 Short/Long Term Flood Impact on Environment
significantly. Figure 3.8 illustrate spatial distribution of the
number of historical flood events. The flood events in Asia
and America are over 60 cases and its casualties and damages
are higher in developing nations such as Bangladesh.
A research illustrates that trend of flood events exponentially
increases over a 30 year period and this may top $1trillion a
year by 2050. The numbers of people affected by floods and
financial, economic and insured damages have all increased
too. In 2010 alone, 178 million people were affected by floods
(Jha et al. 2012). The death toll from flood accounted for 20
percent of total deaths and 33 percent of the total economic
losses from natural disasters.
The impacts of urban floods can be social, physical, and
economic. While in rural areas the damages from floods are
mostly direct in terms of loss of agricultural production, the
damages in urban context are, however, more complex. Table
3.2 summarizes flood impacts in urban areas for both short
and long time scales. The larger water depth and flow velocity
of a flood damages greater on people and property.
Floods impact on people and environment including
infrastructure and assets directly and indirectly. According
to Emergency Events Database (EM-DAT), more than one
hundred million people have been influenced by floods over
the last three decades. The impact on people from flood
is diverse such as death, injuries, and trauma. While direct
deaths from flooding may be declining over time, flood
deaths in developed countries are still caused generally by
water-borne diseases such as malaria and dengue aftermath
of flooding. For example, outbreaks of West Nile fever were
reported after the flood in Romania 1996-1997, Czech
Republic 1997, and Italy 1998 (WHO, 2006)
Floods impact environment such as buildings, animals and
crops. The impact of flooding on building such as basement,
subways, and utility facilities is often overwhelming. Many
buildings may survive the flood but will be suffered long
period of time and they require substantial repairs and
refurbishment. Floods very often cause deaths and injuries
to livestock as well as damage crops. Loss of agricultural
production will affect the food supply chain where the
population of urban areas are highly dependent.
124
Main Focus 3. W
ater and Natural Disasters
125124 /the 7th World Water Forum 124
Main Focus 3. W
ater and Natural Disasters
125/
3.4.2.3 To Understand Importance of Shifting the Focus from Hazard to Vulnerability/Resilience and Coping Capacity (regarding flood)
Vulnerability can be defined as the degree to which a
system is not able to cope with the adverse effects of natural
disasters (Barroca et al., 2006). In order to assess vulnerability
at different scales, a number of variables must be studied
including physical, social, economic, and political conditions
of the target area. For developing countries, there are more
components that increase vulnerability such as poverty, lack
of preparedness and flood management, and limitations
in early warning systems. Assessment of vulnerability is
necessary to locate the most vulnerable area and prioritize
the assistance. Vulnerability mapping can provide a basis for
the development of flood risk management plans and help
the policy makers and managers to identify which areas has
the flood impact. In Figure 3.9, an example of inundation
vulnerability map is illustrated in Jinju City in Korea. The map
was developed from geomorphic characteristics of the area.
In addition to vulnerability, resilience is a critical measure
for flood management, which refers to the ability to cope
with flooding and to recover from flooding (Liao, 2012). The
measures of resilience involve methods and techniques
that reduce flood risks such as elevation, relocation, wet-
flood proofing, and infrastructure protection. Maintaining
those resilience measures in good order is important for the
constant and effective performance of the measures.
3.4.3 Framing the Solution3.4.3.1 Better Understanding of Dominant Flood Risk ParametersFloods are categorized as local, river, coastal, flash floods
(APFM 2008b). A local flood is caused by very high rainfall
under impervious area due to urbanization which leads
decrease of infiltration rate and increase of surface runoff,
and in some hydrogeological conditions (karst aquifers) due
to additional groundwater contribution (Fleury et al. 2013).
A river flood occurs when the volume of river runoff exceeds
the capacity or when flood control system is badly operated.
A coastal flood is caused by high tides and storm surges from
tropical cyclones in urban areas particularly at estuaries. A
flash flood, a rapid flooding of geomorphic low-lying areas,
is resulted from the rapid accumulation and release of runoff
from upstream and the discharge quickly reach a maximum
following diminishing rapidly. Those different types of floods
damage urban areas with different areal extent and time
periods.
Flood observation and alert system has been widely
developed in recent years. Heavy rains or drainage failure
are common causes of flood in urban areas, especially a
basement flood. To detect a basement flood, Flood Alarm
device (Rialco 2014), which is a self-contained electronic
device, could be employed. Its water sensor is placed
contacting or almost contacting the floor near the lowest
drain in basement. Then, the alarm sounds when water
caused by flood touches the sensor. Furthermore, this kind
of devices (Nexsens 2014, YSI 2014) could be employed
to monitor automatically water levels or discharge,
precipitation, humidity, and many other parameters used for
flood assessment. Radar-based flood alert system (Bedient et
al. 2002) can clearly provide information to decision makers
before flooding. This system incorporates real time radar
data into a GIS grid for a basin. The HEC-1 computer model
is employed to predict a hydrograph converted radar rainfall
and its duration to peak flows in channel at the point of
interest on a basin. Furthermore, this system is automatically
delivered through internet to a flood management office.
Then, decision makers could determine the necessary step to
minimize damage.
In order to integrate those existing early warning system,
all the collected information must be interchangeable
through web browser of FTP. The data obtained from multi-
sensors (radar and satellite images) can be calibrated with
a dense network of conventional rain gauges in terrestrial
measurements. This combination of the multi-sensor data
and classical precipitation data can provide a high spatial
and temporal resolution. Employing the combined data,
GIS based distributed rainfall-runoff simulation can predict
possible flood area. This prediction results can be enhanced
with the warning system such as alarm devices.
3.4.3.2 Striving towards Horizontal and Vertical Integration of the Existing Flood Early Warning Systems (working together)

126126126Water and Natural DisastersMain Focus 3.
Figure 3.9 Inundation vulnerability map for Jinju City, South Korea(Kim et al., 2013)
Inundated Farmlands1999
2006
2012
0 1.5 3 6 9 12Kilometers
Extremely Vulnerable
Highly Vulerable
Vulerable
Less Vulnerable or Resilient
Inundated Vulnerability Index
similar levels of protection to permanent defences, but with
the advantage of being fully removable when not required.
Glass barriers employ high strength structural glass, frames,
and structural anchoring system as well as water tight and
impact resisting sealing. It requires no operational input and
visual intrusion is minimized. Flip-up (or drop-down) barriers
are fully recessed into the ground (or on the roof ) when not
in use in order to provide unrestricted access to pedestrian
and vehicle entrances.
Flood gates are designed for dependable flood protection
with maximum access ability and operates on a dead level
threshold allowing unrestricted vehicles and pedestrians.
Three types of gates are popularly employed as lift-hinged,
swing-hinged, and pivot flood gates. Flood doors can be
clad with a diverse finishes to suit existing finishes and
become part of the building aesthetic. Three major types
In order to build efficient flood control, related technologies
have been developed as (a) f lood defence system
technologies; (b) flood forecasting and observation
technologies; (b) integrated flood management technologies.
Flood defence system technologies include the structures
such as flood barriers, flood gates, and flood doors (Flood
Control International, 2014). The flood barrier design varies
from a simple modular 'stop-log' water barrier to automatic
barriers that operate only when required. There are four types
of flood barriers in the field as demountable, glass, and filp-
up or drop-down flood barriers.
Demountable flood barriers are manufactured to provide
3.4.4.1 Merging Latest Technology and Traditional Knowledge to MinimiseFuture Flood Risk
3.4.4 Accelerating Innovation
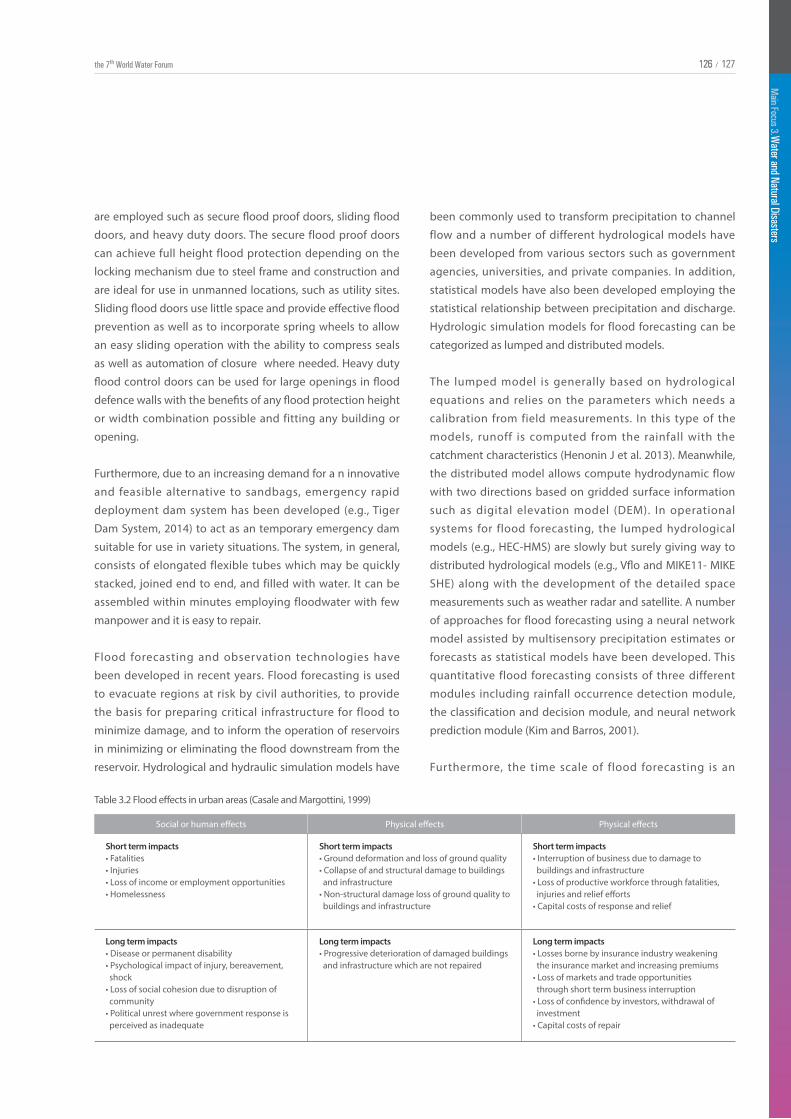
126
Main Focus 3. W
ater and Natural Disasters
127126 /the 7th World Water Forum 126
Main Focus 3. W
ater and Natural Disasters
127/
Table 3.2 Flood effects in urban areas (Casale and Margottini, 1999)
Social or human effects Physical effects Physical effects
Short term impacts• Fatalities• Injuries• Loss of income or employment opportunities• Homelessness
Short term impacts• Ground deformation and loss of ground quality• Collapse of and structural damage to buildings and infrastructure
• Non-structural damage loss of ground quality to buildings and infrastructure
Short term impacts• Interruption of business due to damage to buildings and infrastructure
• Loss of productive workforce through fatalities, injuries and relief efforts
• Capital costs of response and relief
Long term impacts• Disease or permanent disability• Psychological impact of injury, bereavement, shock
• Loss of social cohesion due to disruption of community
• Political unrest where government response is perceived as inadequate
Long term impacts• Progressive deterioration of damaged buildings and infrastructure which are not repaired
Long term impacts• Losses borne by insurance industry weakening the insurance market and increasing premiums
• Loss of markets and trade opportunities through short term business interruption
• Loss of confidence by investors, withdrawal of investment
• Capital costs of repair
are employed such as secure flood proof doors, sliding flood
doors, and heavy duty doors. The secure flood proof doors
can achieve full height flood protection depending on the
locking mechanism due to steel frame and construction and
are ideal for use in unmanned locations, such as utility sites.
Sliding flood doors use little space and provide effective flood
prevention as well as to incorporate spring wheels to allow
an easy sliding operation with the ability to compress seals
as well as automation of closure where needed. Heavy duty
flood control doors can be used for large openings in flood
defence walls with the benefits of any flood protection height
or width combination possible and fitting any building or
opening.
Furthermore, due to an increasing demand for a n innovative
and feasible alternative to sandbags, emergency rapid
deployment dam system has been developed (e.g., Tiger
Dam System, 2014) to act as an temporary emergency dam
suitable for use in variety situations. The system, in general,
consists of elongated flexible tubes which may be quickly
stacked, joined end to end, and filled with water. It can be
assembled within minutes employing floodwater with few
manpower and it is easy to repair.
Flood forecasting and observation technologies have
been developed in recent years. Flood forecasting is used
to evacuate regions at risk by civil authorities, to provide
the basis for preparing critical infrastructure for flood to
minimize damage, and to inform the operation of reservoirs
in minimizing or eliminating the flood downstream from the
reservoir. Hydrological and hydraulic simulation models have
been commonly used to transform precipitation to channel
flow and a number of different hydrological models have
been developed from various sectors such as government
agencies, universities, and private companies. In addition,
statistical models have also been developed employing the
statistical relationship between precipitation and discharge.
Hydrologic simulation models for flood forecasting can be
categorized as lumped and distributed models.
The lumped model is generally based on hydrological
equations and relies on the parameters which needs a
calibration from field measurements. In this type of the
models, runoff is computed from the rainfall with the
catchment characteristics (Henonin J et al. 2013). Meanwhile,
the distributed model allows compute hydrodynamic flow
with two directions based on gridded surface information
such as digital elevation model (DEM). In operational
systems for flood forecasting, the lumped hydrological
models (e.g., HEC-HMS) are slowly but surely giving way to
distributed hydrological models (e.g., Vflo and MIKE11- MIKE
SHE) along with the development of the detailed space
measurements such as weather radar and satellite. A number
of approaches for flood forecasting using a neural network
model assisted by multisensory precipitation estimates or
forecasts as statistical models have been developed. This
quantitative flood forecasting consists of three different
modules including rainfall occurrence detection module,
the classification and decision module, and neural network
prediction module (Kim and Barros, 2001).
Furthermore, the time scale of flood forecasting is an

128128128Water and Natural DisastersMain Focus 3.
Figure 3.10 Flood defense system(http://www.floodcontrolinternational.com/)
FLOOD BARRIERS
Demountable Glass Drop-Down or (Flip up)
FLOOD DOORS
Secure Flood Proof Sliding Heavy Duty
FLOOD GATES
Lift-Hinged Swing-Hinged Pivot
important issue, which changes along the distance where
the rainfall occurs. The case is quite different when intensive
rains occur in the lower part of basins, or when one wishes
to make forecasts in upper part of basins. The lead time of
the basin to the rainfall may be short (say 5 hours), then the
flood will have propagate on a shorter distance toward the
place where the forecast is to be done (say 7 more hours). In
this case, only 12 hours is available between the intensive
rainfall and the flood occurrence at the considered point
to forecast. However, the response time and routing time
to the downstream for a large basin (e.g., Colorado River
or Mississippi River) might take several days or weeks. In
such a case, different forecasting techniques are required
including the extensive integration of the current condition
of reservoirs and rivers.
Flood risk management aims to reduce the human and
social-economic losses caused by flooding while at the
same time taking into account the social, economic, and
ecological benefits from floods and the use of flood plains
or coastal zones (UNESCO 2014). Flood risk management
plans shall address all aspects of flood risk management
focusing on prevention, protection, preparedness, including
flood forecasts and early warning systems and taking into
account the characteristics of the particular river basin or
sub-basin. Flood risk management plans may also include the
promotion of sustainable land use practices, improvement of
water retention as well as the controlled flooding of certain
areas in the case of a flood event. Therefore, to construct a
flood risk management system, following process is needed
(Wallingford 2014).
(a) Evaluating hazards and consequences
(b) Developing sustainable spatial planning and flood
prevention strategies
(c) Developing preparedness and emergency response
action plans
(d) Protecting assets and ensure resilience under climate
change and future economic development scenarios
The concept of integral flood management (IFM) all lay
emphasis on appropriate use of land for various purposes,
particularly those which adversely impact the objectives
of development, prosperity and well-being. This leads to
calls for a closer integration or coordination between flood
management plans and land use plans. Even though varying
in emphasis in different locations such plans would usually
contain elements on community infrastructure (schools,
hospitals, civil defense, etc.), transportation, housing and
location of neighborhood development; protection of cultural
heritage, environmental assets and conservation sites, and
economic development. All of them do have a specific
component on flood hazards and risks. The regulations and
by-laws concerned with land use planning should consider
the flood risks that are likely to be faced by various uses and
efforts should be made to minimize them. The planning
process should involve local disaster management authorities
(APFM 2008b).
Such a combination of approaches and measures may lead
to secondary benefits, i.e. measures whose function consists
not only in flood risk management but also in supporting
water supply, groundwater recharge, providing space for
recreational activities etc. In this sense, the application
of IFM concept is also meant to be a contribution to the
general improvement of urban living conditions. However,
many countries are struggling to devise appropriate policies
and administrative mechanisms that would facilitate the
integration. A number of fundamental considerations are
presented elsewhere (APFM 2008a) those provide insight into
the complexity of the issue of integration and harmonization.
128
Main Focus 3. W
ater and Natural Disasters
129128 /the 7th World Water Forum 128
Main Focus 3. W
ater and Natural Disasters
129/
Recently, an innovative flood reduction program, Flood
Control 2015 (Flood Control 2015, 2014), was executed by a
consortium of 9 participants including institutes, engineering
consultants, and industry as part of the Dutch governmental
subsidy for the object of a substantial improvement in
operational flood protection worldwide with cohesive
development and application of new knowledge and tools
to limit the probability and impacts of floods. Flood Control
2015 integrates three aspects of dikes, decision-maker, and
their environment in advanced forecasting systems and
decision supporting systems with help of innovative sensors.
It starts with information of monitoring waves and water
levels in dikes including sensor networks providing real-time
information as well as satellite that permanently monitor the
flooding in large areas. Based on the collected information,
Flood control 2015 integrates all the information into a
single whole by means of smart link and this leads a reliable
forecasting system. To act and mitigate flood, dashboards
that relevant information is presented in a clear way and
decision-supporting tools that ensure right decisions can be
taken at the right time. In order to transport and process data
as well as to present them to various stakeholders, modular
systems are developed.
Furthermore, the CORFU project (http://www.corfu-fp7.eu/),
Collaborative Research on Flood Resilience in Urban areas, is
a major project involving 17 European and Asian institutions,
funded by a grant from the European Commission, Seventh
Framework Programme. The project is aiming to enable
European and Asian partners to learn from each other
through joint investigation, development, implementation
and dissemination of short to medium term strategies that
will enable more scientifically sound management of the
consequences of urban flooding in the future. CORFU has
brought novel methodologies and models into a unique
frame work, called DPSIR as Drivers-Pressures-States-Impacts
Response, which were implemented for seven cities –
Barcelona in Spain, Beijing in China, Dhaka in Bangladesh,
Hamburg in Germany, Mumbai in India, Nice in France and
Taipei in Taiwan. Application in the case studies illustrated
3.4.5 Research and Development Technologies 3.4.5.1 Current Leading-edge Development in the Field of Flood Risk Reduction and Bringing Closer Scientist and Decision Makers in the Field of Flood Risk Reduction
variations in focus and level of detail, according to specific
flooding problems, data availability and development
scenarios. The results from the project provide a sound basis
for flood damage analysis and the evaluation of mitigation
measures (CORFU Consortium, 2014).
After flooding in southern Alberta in June 2012, Insurance
Bureau asked what actions the Government of Alberta could
take to reduce the risk of flood damage (Kovacs and Sandink,
2013). According to the results, it was revealed that most
disaster damage can be prevented through the application
of existing and emerging knowledge about building
disaster resilient communities. They presented the following
recommendations as prohibiting new development in the
flood ways with developing structural developments in
flood defense, creating a provincial flood damage reduction
strategy on the existing stormwater management guidance.
The report conclude that achieving flood risk reduction
should include a comprehensive flood management strategy
such as risk mapping, flood forecasting, land use planning,
defensive infrastructure, and public awareness.
Kuala Lumpur, the capital of Malaysia, is situated in the mid-
upper reaches of the 120 kilometer long Klang River which
drains a catchment of some 1,288 square kilometers. In
the 1970s, a flood mitigation master plan was developed
incorporating a number of engineering options, including
upstream storage, poldering, pumped drainage, and
improvement of the drainage capacity of the Klang River and
its major tributaries (Wilson 2005).
The Stormwater Management and Road Tunnel (SMART)
project was designed both to divert stormwater and to re-
route traffic away from the inner city. The scheme consists
of a 9.7 kilometer long tunnel, nearly 12 meters in diameter,
which runs to the east of the city center of Kuala Lumpur.
During moderate storms, the bottom section of the tunnel
channels excess water without stopping the traffic flow. In
case of severe storms, all traffic is evacuated and automatic
watertight gates opened to allow floodwater flow. The tunnel
has combined storage capacity of three million cubic meters
(Krause et al. 2005). A diagram of the SMART system is shown
in Figure 3.11.
The construction cost of the SMART Tunnel project was
approximately US$515 million. As it was recognized that as
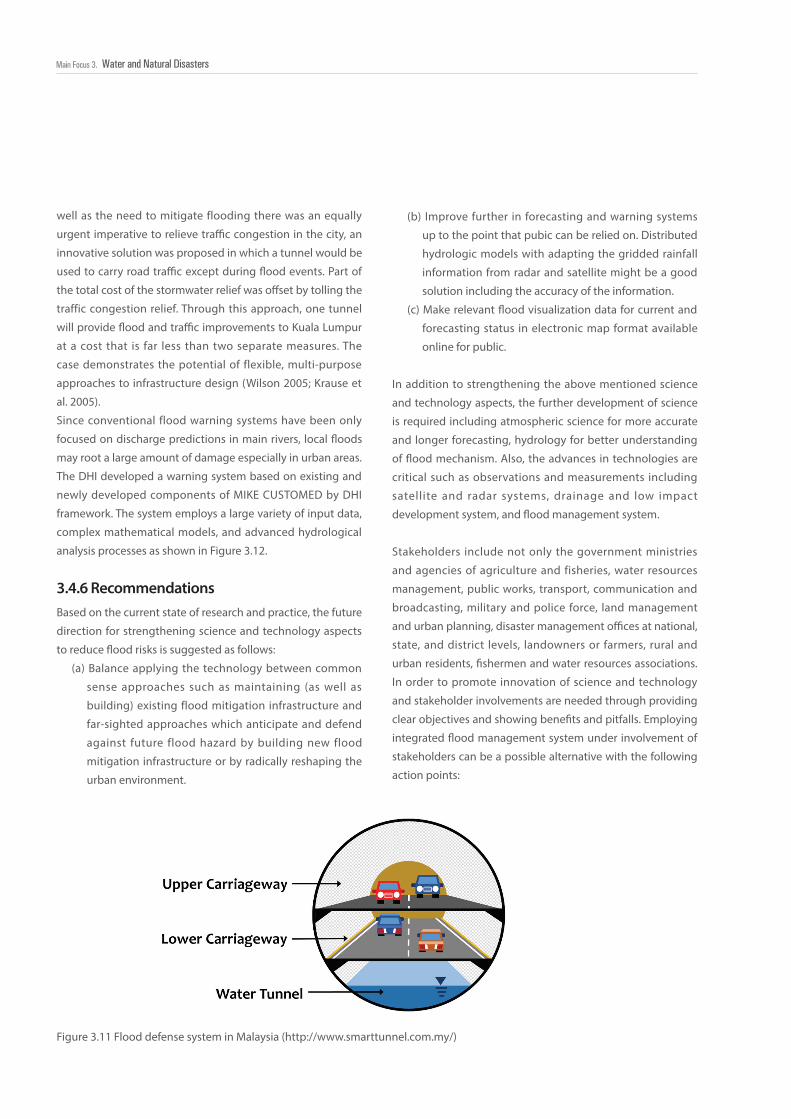
130130130Water and Natural DisastersMain Focus 3.
well as the need to mitigate flooding there was an equally
urgent imperative to relieve traffic congestion in the city, an
innovative solution was proposed in which a tunnel would be
used to carry road traffic except during flood events. Part of
the total cost of the stormwater relief was offset by tolling the
traffic congestion relief. Through this approach, one tunnel
will provide flood and traffic improvements to Kuala Lumpur
at a cost that is far less than two separate measures. The
case demonstrates the potential of flexible, multi-purpose
approaches to infrastructure design (Wilson 2005; Krause et
al. 2005).
Since conventional flood warning systems have been only
focused on discharge predictions in main rivers, local floods
may root a large amount of damage especially in urban areas.
The DHI developed a warning system based on existing and
newly developed components of MIKE CUSTOMED by DHI
framework. The system employs a large variety of input data,
complex mathematical models, and advanced hydrological
analysis processes as shown in Figure 3.12.
Figure 3.11 Flood defense system in Malaysia (http://www.smarttunnel.com.my/)
3.4.6 RecommendationsBased on the current state of research and practice, the future
direction for strengthening science and technology aspects
to reduce flood risks is suggested as follows:
(a) Balance applying the technology between common
sense approaches such as maintaining (as well as
building) existing flood mitigation infrastructure and
far-sighted approaches which anticipate and defend
against future flood hazard by building new flood
mitigation infrastructure or by radically reshaping the
urban environment.
(b) Improve further in forecasting and warning systems
up to the point that pubic can be relied on. Distributed
hydrologic models with adapting the gridded rainfall
information from radar and satellite might be a good
solution including the accuracy of the information.
(c) Make relevant flood visualization data for current and
forecasting status in electronic map format available
online for public.
In addition to strengthening the above mentioned science
and technology aspects, the further development of science
is required including atmospheric science for more accurate
and longer forecasting, hydrology for better understanding
of flood mechanism. Also, the advances in technologies are
critical such as observations and measurements including
satellite and radar systems, drainage and low impact
development system, and flood management system.
Stakeholders include not only the government ministries
and agencies of agriculture and fisheries, water resources
management, public works, transport, communication and
broadcasting, military and police force, land management
and urban planning, disaster management offices at national,
state, and district levels, landowners or farmers, rural and
urban residents, fishermen and water resources associations.
In order to promote innovation of science and technology
and stakeholder involvements are needed through providing
clear objectives and showing benefits and pitfalls. Employing
integrated flood management system under involvement of
stakeholders can be a possible alternative with the following
action points:
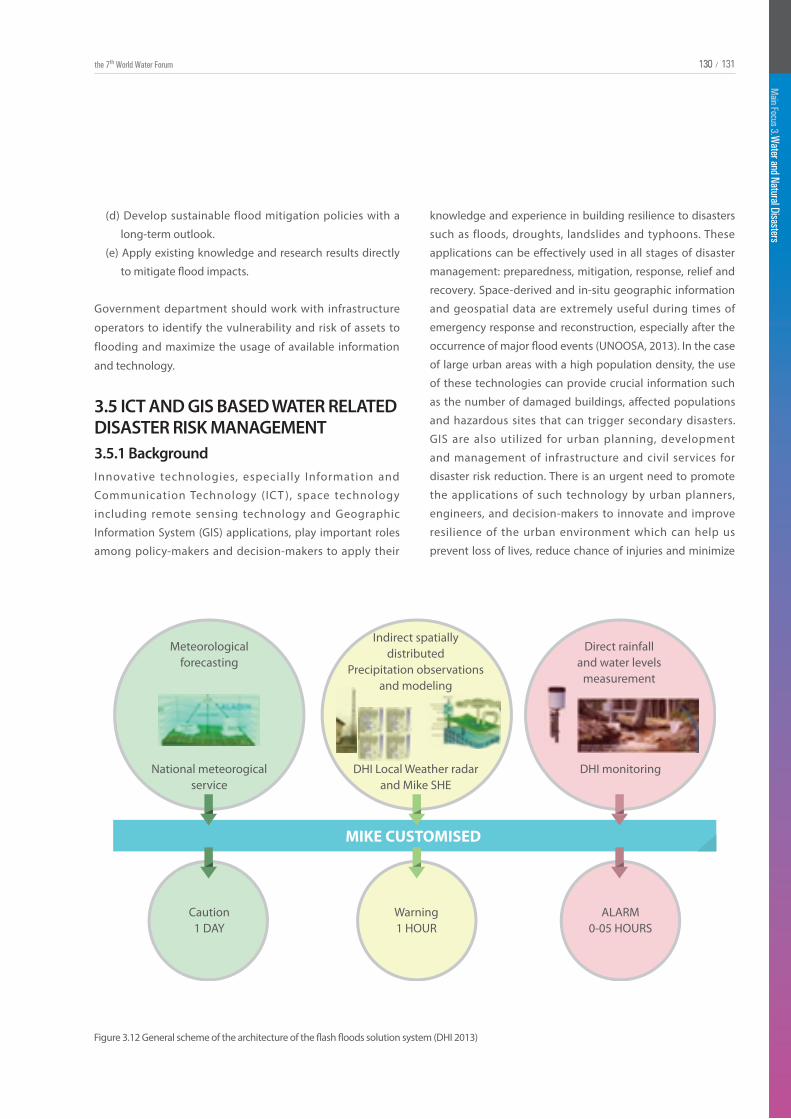
130
Main Focus 3. W
ater and Natural Disasters
131130 /the 7th World Water Forum 130
Main Focus 3. W
ater and Natural Disasters
131/
Figure 3.12 General scheme of the architecture of the flash floods solution system (DHI 2013)
Meteorologicalforecasting
Caution1 DAY
Warning1 HOUR
ALARM0-05 HOURS
Direct rainfalland water levels
measurement
National meteorogicalservice
DHI monitoring
Indirect spatiallydistributed
Precipitation observationsand modeling
DHI Local Weather radarand Mike SHE
MIKE CUSTOMISED
(d) Develop sustainable flood mitigation policies with a
long-term outlook.
(e) Apply existing knowledge and research results directly
to mitigate flood impacts.
Government department should work with infrastructure
operators to identify the vulnerability and risk of assets to
flooding and maximize the usage of available information
and technology.
3.5 ICT AND GIS BASED WATER RELATED DISASTER RISK MANAGEMENT3.5.1 BackgroundInnovative technologies, especially Information and
Communication Technology (ICT ), space technology
including remote sensing technology and Geographic
Information System (GIS) applications, play important roles
among policy-makers and decision-makers to apply their
knowledge and experience in building resilience to disasters
such as floods, droughts, landslides and typhoons. These
applications can be effectively used in all stages of disaster
management: preparedness, mitigation, response, relief and
recovery. Space-derived and in-situ geographic information
and geospatial data are extremely useful during times of
emergency response and reconstruction, especially after the
occurrence of major flood events (UNOOSA, 2013). In the case
of large urban areas with a high population density, the use
of these technologies can provide crucial information such
as the number of damaged buildings, affected populations
and hazardous sites that can trigger secondary disasters.
GIS are also utilized for urban planning, development
and management of infrastructure and civil services for
disaster risk reduction. There is an urgent need to promote
the applications of such technology by urban planners,
engineers, and decision-makers to innovate and improve
resilience of the urban environment which can help us
prevent loss of lives, reduce chance of injuries and minimize
132132132Water and Natural DisastersMain Focus 3.
3.5.2 Framing the Challenges In the disaster risk management process, the ICT such as
radio, satellite radio, subscription radio, amateur radio,
television, telephones, electronic bulletin boards, Short
Message Service (SMS), Internet, e-mail, instant messages
airmail and sirens are widely used to share information and
create Early Warning Systems (EWS). The EWS may be used in
more than one ICT media in parallel and these can be either
traditional (radio, television, telephone) or modern (SMS,
cell broadcasting, Internet). The only possible drawback
of radio and television media is that their effectiveness
is significantly reduced at night, when they are normally
turned off. Telephone penetration in many areas is still not
satisfactory – particularly in rural and coastal areas which are
at high risk. The other problem is the congestion of phone
lines that usually occurs immediately before and during a
disaster, resulting in many phone calls in that vital period
that cannot be completed. While the internet can play a
prominent role in a developed country, where nearly half of
all homes and almost all offices have internet connections,
this is not the case in the developing countries. In many
developing countries, less than 5 percent of the population
uses the internet and even those who are users do not use it
on a regular basis. In such a situation, it is difficult to expect
internet and email to play any significant role. In spite of
that drawback, many disaster-related activities are already
underway within the internet community. For example, a new
proposal for using the Internet to quickly warn large numbers
of people of impending emergencies is currently being
drafted by the Internet Engineering Task Force. The strengths
of each information and communication technology and the
challenges in using them are summarized in Table 3.3.
There are number of GIS and space-based information
technology implementation barriers at local administrative
levels, where a strong disaster management initiative is
required. These barriers include, but are not limited to: (a)
a lack of financial resources, (b) a lack of spatial data, (c)
political/institutional instability and iv) a lack of local GIS
and space-based information technology knowledge/
expertise. The financial aspect is especially significant from
a GIS and space-based information technology perspective,
since the former and the latter are expensive and therefore
becomes an implementation barrier. Developing countries
and the least developed countries, small islands developing
states and landlocked developing countries and Africa
require predictable, adequate, sustainable and coordinated
international assistance, through bilateral and multilateral
channels for the development and strengthening of their
capacities, including financial and technical assistance, as
well as technology transfer on mutually agreed terms.
property and economical losses.
D e s p i te t re m e n d o u s te c h n o l o gi c a l a d v a n ce s a n d
infrastructure development, we are not well prepared for
devastating events such as 2011 Tohoku earthquake and
tsunami and the nuclear accident triggered by the said
events and also for disasters such as Joplin MO tornado,
Virginia earthquake and Seoul city flood in Korea. Over the
past few decades, ICT, space technology and GIS applications
have become indispensible parts of the traditional disaster
management. Advanced weather radars and warning
systems enable accurate predictions of paths and severities of
tornados and hence deliver warnings in a matter of minutes
(SSRC and Coulter and Phillips, 2011). Accurate monitoring by
remote sensing technology including satellite, CCTV, etc. and
GIS-based DB system and information analyzing technologies
enables fast estimation for disaster risk and assessment of
damages and losses.
This section may help engineers to develop the new
technology on ICT, space technology and GIS regarding
disaster risk management. A better understanding for these
technological trends and challenges will surely help in the
improvement of managing big and complex disasters caused
by climate and social structural diversities. This will also
help the decision-makers to understand the technology on
disaster risk management and select the key technologies
that can be used for each disaster management phase such
as prevention, preparedness, response and recovery.
Considered as the most traditional electronic media used for
disaster warning, radio and television have a valid use. The
effectiveness of these two media is high because even in
developing countries and rural environments where the tele-
density is relatively low, they can be used to spread a warning
quickly to a broad population. After the Indian Ocean
tsunami in 2004, many radio manufacturers considered
introducing new digital radio alert systems that react even if
3.5.3 Framing the Solutions 3.5.3.1 Radio and Television
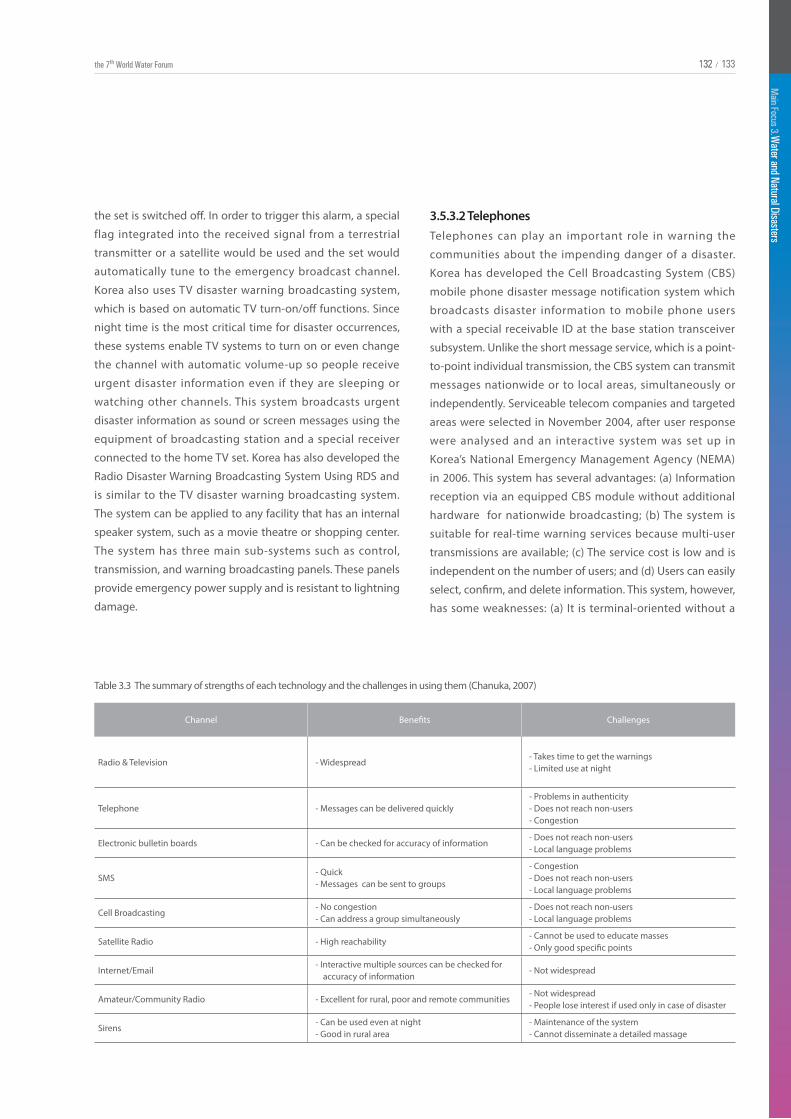
132
Main Focus 3. W
ater and Natural Disasters
133132 /the 7th World Water Forum 132
Main Focus 3. W
ater and Natural Disasters
133/
Table 3.3 The summary of strengths of each technology and the challenges in using them (Chanuka, 2007)
Channel Benefits Challenges
Radio & Television - Widespread- Takes time to get the warnings- Limited use at night
Telephone - Messages can be delivered quickly- Problems in authenticity- Does not reach non-users- Congestion
Electronic bulletin boards - Can be checked for accuracy of information- Does not reach non-users- Local language problems
SMS- Quick- Messages can be sent to groups
- Congestion- Does not reach non-users- Local language problems
Cell Broadcasting- No congestion - Can address a group simultaneously
- Does not reach non-users- Local language problems
Satellite Radio - High reachability- Cannot be used to educate masses- Only good specific points
Internet/Email- Interactive multiple sources can be checked for
accuracy of information- Not widespread
Amateur/Community Radio - Excellent for rural, poor and remote communities- Not widespread- People lose interest if used only in case of disaster
Sirens- Can be used even at night- Good in rural area
- Maintenance of the system- Cannot disseminate a detailed massage
the set is switched off. In order to trigger this alarm, a special
flag integrated into the received signal from a terrestrial
transmitter or a satellite would be used and the set would
automatically tune to the emergency broadcast channel.
Korea also uses TV disaster warning broadcasting system,
which is based on automatic TV turn-on/off functions. Since
night time is the most critical time for disaster occurrences,
these systems enable TV systems to turn on or even change
the channel with automatic volume-up so people receive
urgent disaster information even if they are sleeping or
watching other channels. This system broadcasts urgent
disaster information as sound or screen messages using the
equipment of broadcasting station and a special receiver
connected to the home TV set. Korea has also developed the
Radio Disaster Warning Broadcasting System Using RDS and
is similar to the TV disaster warning broadcasting system.
The system can be applied to any facility that has an internal
speaker system, such as a movie theatre or shopping center.
The system has three main sub-systems such as control,
transmission, and warning broadcasting panels. These panels
provide emergency power supply and is resistant to lightning
damage.
Telephones can play an important role in warning the
communities about the impending danger of a disaster.
Korea has developed the Cell Broadcasting System (CBS)
mobile phone disaster message notification system which
broadcasts disaster information to mobile phone users
with a special receivable ID at the base station transceiver
subsystem. Unlike the short message service, which is a point-
to-point individual transmission, the CBS system can transmit
messages nationwide or to local areas, simultaneously or
independently. Serviceable telecom companies and targeted
areas were selected in November 2004, after user response
were analysed and an interactive system was set up in
Korea’s National Emergency Management Agency (NEMA)
in 2006. This system has several advantages: (a) Information
reception via an equipped CBS module without additional
hardware for nationwide broadcasting; (b) The system is
suitable for real-time warning services because multi-user
transmissions are available; (c) The service cost is low and is
independent on the number of users; and (d) Users can easily
select, confirm, and delete information. This system, however,
has some weaknesses: (a) It is terminal-oriented without a
3.5.3.2 Telephones
134134134Water and Natural DisastersMain Focus 3.
3.5.3.3 Short Message Service
mobile terminal or CBS module therefore information cannot
be received; (b) If the terminal is turned off, no information
is available even with a CBS module; and (c) The disaster
information is not available in radio-dark areas and there is
no automatic confirmation method to check whether or not
the users have received disaster information.
Short Message Service (SMS) is a service available on most
digital mobile phones that permits the sending of short
messages, images and movies between mobile phones
or other handheld devices and even landline telephones.
During the 2005 Hurricane Katrina disaster in the US, many
residents of affected coastal areas were unable to make
contact with relatives and friends using traditional landline
phones. However, they could communicate with each other
via SMS more easily when the network was functional. This
is because SMS works on a different band and can send or
receive even when phone lines are congested. SMS also has
another advantage over voice calls for example, the use of
group messages. Most of today's wireless systems support a
feature called cell broadcasting. A public warning message
in text can be sent to the screens of all mobile devices with
such capability in any group of cells of any size, ranging from
one single cell (about 8 km across) up to the whole country if
necessary. CDMA, D-AMPS, GSM and UMTS phones have this
capability. Federal Emergency Management Agency (FEMA)
of USA developed the Integrated Public Alert & Warning
System for public safety officials to alert communities in the
event of natural or man-made disasters. This system also
offers emergency alert notifications through mobile phones.
The National Disaster Management Institute (NDMI) of
Korea has started a project, Smart Big Board (SBB) that will
make an effective monitoring and warning system for multi-
complex disaster situations by maximizing the utilization
of real-time field-oriented information and crowd sourcing
from text, photos and movies via SMS etc. The only possible
disadvantage to cell broadcasting is that not every user may
be able to read a text message when they receive it. In many
Asia-Pacific countries, majority of phone users cannot read or
understand a message sent in English. Thus, it is essential to
send warning messages in local languages. However, these
messages would still be inaccessible to those who cannot
read, even in their own language. The Dutch Government
plans to start using cell broadcasting for emergency
3.5.3.4 Internet
3.5.3.5 Sirens
warnings. The infrastructure is already in operation with the
operators KPN, Telfort and Vodafone. It will to be the first
multi-operator warning system in the world, based on cell
broadcasting with government use.
The role of internet, e-mail and instant messages in disaster
warning entirely depends on their penetration within a
community as well as the way it was used by the professionals
such as first responders, coordinating bodies, etc. Without
direct communication among the decision-makers and
without a free flow of reliable information among all persons
involved, the effective contingency planning and emergency
response are at risk (Putnam, 2002). The Internet has a drastic
increase in the access of spatial data, as numerous websites
now offer free access to a wide range of data. However,
there has been little attention paid to the aspects of quality,
including newness, lineage, regional accuracy, completeness,
and overall usefulness (Engler & Hall 2007, p. 345). This is
unfortunate, because the quality of spatial data is particularly
important when it is used for disaster management,
especially when lives are at stake.
Though not necessarily an ICT-based solution, sirens
can be used in tandem with other ICT media for final,
localized delivery. Korea has developed the automatic voice
notification equipment which is situated in the local disaster
management headquarters which issue warnings using fixed
or mobile telephones, village broadcast amplifiers and any
available communication tools when inundation and other
disasters are imminent. When precipitation, river level, or
any emergency data in a specific area are analysed, persons
to be informed are chosen and a disaster warning is issued
using 32 exclusive emergency communication networks.
The system database covers more than 550,000 people such
as emergency managers and local residents in 234 central
and regional districts in Korea. For an effective response,
call sequencing has been set up. The first call goes to the
village amplifier in a disaster-prone area so that people in the
vicinity can obtain general information about the imminent
disaster situation. A second call goes to the village chief, who
can personally deliver the information and encourage people
to evacuate to a safer place. The final call goes to the related
public organizations and officers in the targeted area.
134
Main Focus 3. W
ater and Natural Disasters
135134 /the 7th World Water Forum 134
Main Focus 3. W
ater and Natural Disasters
135/
3.5.3.6 Geographic Information System
3.5.3.7 Remote Sensing
GIS can be used for scientific investigations, resource
management and development planning. A GIS is a key
component of any effective and comprehensive disaster
management strategy, and can be used to display, integrate,
map, analyse, and model data and the information derived
from satellites, and other spatial data sources (Kumar et al.,
1999). Perhaps, the greatest strength of GIS is its ability to
integrate a wide range of data types, including geographic,
social, economic, and political data into a single system.
However, utilizing GIS requires not only the software, but
also the hardware, the data and the trained personnel. As
disaster management works usually involve a large number
of different agencies working in different areas, the need
for detailed geographical information in order to make
critical decisions is high. By utilizing GIS, agencies involved
in the response can share information through databases
on computer-generated maps in one location. Without this
capability, disaster management workers have to access a
number of department managers, their unique maps and
their unique data. Most disasters do not allow time to gather
these resources. GIS thus provides a mechanism to centralize
and visually display critical information during an emergency.
There is an obvious advantage to using a map with remote
sensing or GIS inputs instead of a static geographical map.
On the other hand, a vulnerability map with GIS provides
dynamic information with cause and effect relationship.
The potential of remote sensing (RS) to provide critical
earth observation information for disaster management
(e.g., hazard assessment, disaster mitigation, preparedness,
response and recovery) has repeatedly been emphasized
(Becking, 2004; Chen et al., 2005; Jayaraman et al., 1997;
Mansor et al., 2004; Rivereau, 1995). Showalter (1999)
provided that the RS technique is i) primarily used to detect,
identify, map, survey and monitor existing hazards and/
or their effects; ii) secondary goals of RS focus on damage
assessment, improved planning, or the provision of data
for disaster management functions. Also, space-based
information and products are effectively being used for early
warning and monitoring of slow onset disasters as well as
rapid onset disasters.
3.5.3.8 Digital Elevation Model
Remotely sensed digital elevation data often termed digital
elevation model (DEM) is a digital representation of surface
topography and are frequently used in the study of natural
hazards. DEMs are critical data input for assessing landslide
susceptibility (Guinau et al., 2005), delineating flood risk
potential (Dewan, Kabir et al., 2007), flood hazard mapping
(Dewan, Islam et al., 2007; Sanyal & Lu, 2003) and for a
variety of coastal hazard and disaster assessment purposes.
DEMs are also commonly used to derive new data that are
required for specific types of disaster management-related
analysis or visualization. The types of new datasets that can
be generated include, but are not limited to: slope, aspect,
contour lines, flow direction, flow accumulation, watersheds,
and many others. The most important factors that deter-
mine the suitability of a DEM for any particular disaster
management-related application are the spatial resolution
and vertical accuracy.
3.5.4 Accelerating Innovation3.5.4.1 Proactive Step
GIS has much to offer in the pre-disaster management
phases of prevention and preparedness which analyse the
developments in the immediate aftermath of a disaster,
evaluating the damage and determining what facilities
are required to be reinforced for construction or relocation
purposes. To effectively prevent and prepare for a disaster
requires not only a detailed knowledge and information
about the expected frequency, characteristics, and magnitude
of hazardous events in an area, but also the vulnerability of
the people, buildings, infrastructure and economic activities
(Van Westen & Hofstee, 2001). GIS allows the synthesis and
analysis of such data information to help determine risk
levels, assess vulnerability, model scenarios, plan evacuation
routes, determine resource requirements, and create a
variety of useful information to aid in the decision-making.
For example, if we collect data such as land use of the parcel
(residential, industrial, commercial, etc.), building material,
building age, number of floors and damage occurrence
and make GIS database combined with historical data on
previous disasters, such as flood depth, those can be used
to generate a variety of vulnerability and risk maps. Guinau
et al. (2005) used a GIS to create a hazard susceptibility map
to help mitigate landslide risk. They digitized present and

136136136Water and Natural DisastersMain Focus 3.
past landslides from aerial photographs to create a landslide
inventory, which was then overlaid on terrain data, such as
lithology, slope, soil characteristics and land use analysis
of terrain conditions in areas affected by landslides. These
helped determine the zones with similar characteristics and
through further analysis the delineation of low, medium and
high susceptibility zones.
Dewan, Islam, et al. (2007) integrated GIS and remote
sensing techniques to analyse the flood hazard and risk
levels in Dhaka, Bangladesh. A major impediment was the
unavailability of digital geospatial data, and as a result, a
number of the required data layers had to be created. Flood-
affected frequency and flood depth were estimated from
multi-date Synthetic Aperture Radar (SAR) data (Dewan et
al., 2007a, p. 1602) which were based from previous flood
events. Uncontrolled and informal housing development
is a recurring problem in cities in developing countries
(Thomson & Hardin, 2000), and such development practices
contribute to increasing natural hazard vulnerability. To
address this problem, Thomson and Hardin (2000) used GIS
and satellite imagery (LANDSAT TM) to identify potential low
income housing sites in the eastern portion of the Bangkok
Metropolitan Area, where flood risk was a concern. The
National Remote Sensing Centre (NRSC) of Mongolia has
been developing local capability for drought monitoring by
using modern space science and remote sensing technology.
The National Remote Sensing Center has scientific agreement
with NASA on 1km Advanced Ver y High Resolution
Radiometer (AVHRR) data archive. The remote sensing data
are being used successfully for the Drought Assessment and
Monitoring System by combining satellite and ground data
collected over the past 10 years in Mongolia. In the coming
years the NRSC will also develop new products for drought
monitoring such as MODIS drought map and develop new
indices such as crop moisture index and aridity index (NEMA,
2010). With the help of ESCAP’S Regional Cooperative
Mechanism for Drought Disaster Monitoring and Early
Warning, Mongolia is now working towards developing the
methodology in using the moderate resolution imaging
spectro-radiometer (MODIS) for making drought maps which
will include an increased number of parameters such as
vegetation health, soil moisture content, and precipitation.
Mongolia has also established a prototype Geo-portal with
the help of ESCAP’s training and capacity building program.
Based on the information provided by GIS, it is also possible
to estimate the quantity of food supplies, bed space,
clothes and medicine that will be required for each shelter
based on the number of expected evacuees. In addition,
GIS can display real-time monitoring for emergency early
warning. Remote weather stations can provide current
weather indexes based on location and surrounding areas.
Wind direction, temperature and relative humidity can be
displayed by the reporting weather station. Wind information
is vital in predicting the movement of a chemical cloud
release or anticipating the direction of wildfire spread upon
early report. The WEB GIS-Based Typhoon Committee Disaster
Information System (WGTCDIS) was developed by National
Disaster Management Institute (NDMI) of Korea utilizing
the information from the members of 14 Working Group
on Disaster Risk Reduction of Typhoon Committee. In the
WGTCDIS, the nearest neighbour method was used to find
similar typhoon trajectory and the kernel density function
was used to estimate the damages caused by typhoons.
The Cambodian Red Cross and the American Red Cross
developed early warning system in Cambodia. Floods affect
parts of the country every year. The project aims to reduce
the risk of vulnerable communities to floods that are greater
than normal through improved flood warnings. Flood
forecasts and warnings from the Mekong River Commission
and Cambodian government’s Department of Hydrology
and Rural Water Supply are circulated to communities, which
sends back information about water levels to forecasters.
Communities identify flood alarm stages and work together
to develop response mechanisms (IFRC, 2001). The Automatic
Rainfall Warning System shown in Figure 3.13 developed
by NEMA of Korea can be considered as one of the most
directly connected early warning system with ‘now casting’
concept. This system is for localized rainfall warning. After a
one night flash flood which killed 95 campers and hikers in
the Jiri National Park in Korea in 1998, the local observatory
system need to be expanded to monitor local torrential
rains which cannot be easily observed at regional level. The
automatic rainfall warning system can measure rainfall in the
upper stream, analyse discharge and velocity of river flow in
a specific basin and calculate the water level downstream.
When the water level exceeds a certain criteria, early
warnings and evacuation orders can be issued. When rainfall
is actually measured in the observation station in the upper
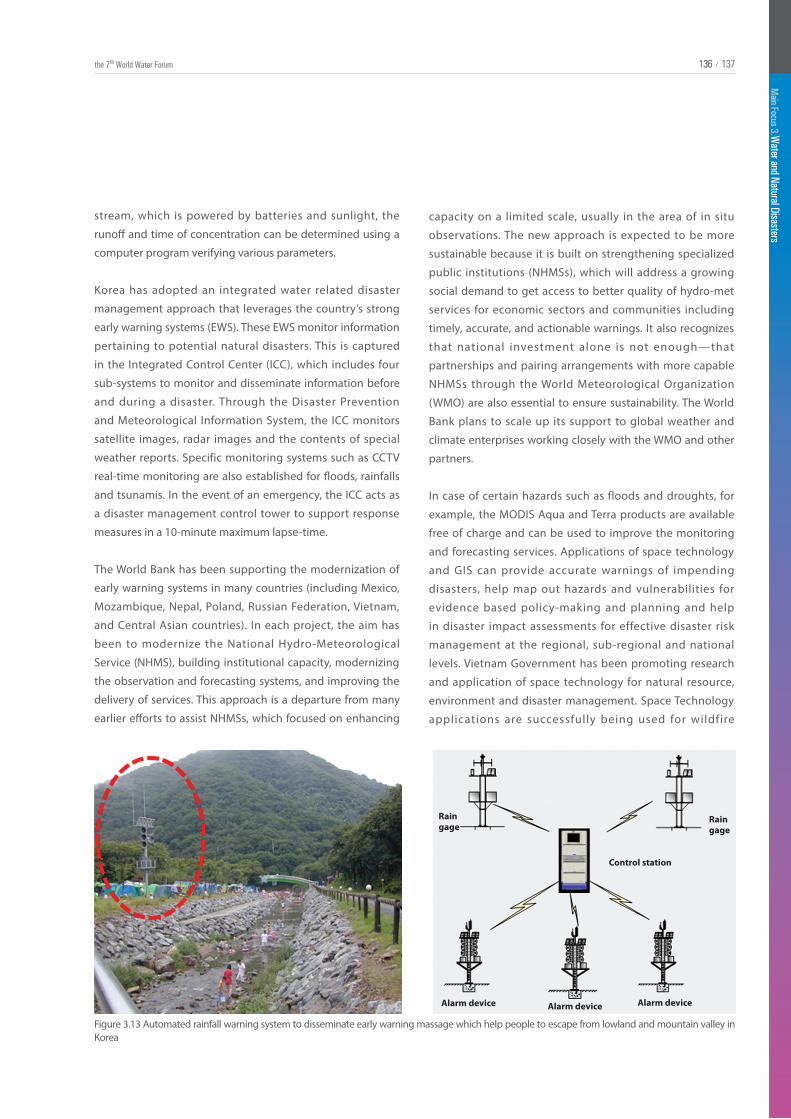
136
Main Focus 3. W
ater and Natural Disasters
137136 /the 7th World Water Forum 136
Main Focus 3. W
ater and Natural Disasters
137/
stream, which is powered by batteries and sunlight, the
runoff and time of concentration can be determined using a
computer program verifying various parameters.
Figure 3.13 Automated rainfall warning system to disseminate early warning massage which help people to escape from lowland and mountain valley in Korea
Raingage
Raingage
Control station
Alarm device Alarm device Alarm device
Korea has adopted an integrated water related disaster
management approach that leverages the country’s strong
early warning systems (EWS). These EWS monitor information
pertaining to potential natural disasters. This is captured
in the Integrated Control Center (ICC), which includes four
sub-systems to monitor and disseminate information before
and during a disaster. Through the Disaster Prevention
and Meteorological Information System, the ICC monitors
satellite images, radar images and the contents of special
weather reports. Specific monitoring systems such as CCTV
real-time monitoring are also established for floods, rainfalls
and tsunamis. In the event of an emergency, the ICC acts as
a disaster management control tower to support response
measures in a 10-minute maximum lapse-time.
The World Bank has been supporting the modernization of
early warning systems in many countries (including Mexico,
Mozambique, Nepal, Poland, Russian Federation, Vietnam,
and Central Asian countries). In each project, the aim has
been to modernize the National Hydro-Meteorological
Service (NHMS), building institutional capacity, modernizing
the observation and forecasting systems, and improving the
delivery of services. This approach is a departure from many
earlier efforts to assist NHMSs, which focused on enhancing
capacity on a limited scale, usually in the area of in situ
observations. The new approach is expected to be more
sustainable because it is built on strengthening specialized
public institutions (NHMSs), which will address a growing
social demand to get access to better quality of hydro-met
services for economic sectors and communities including
timely, accurate, and actionable warnings. It also recognizes
that national investment alone is not enough—that
partnerships and pairing arrangements with more capable
NHMSs through the World Meteorological Organization
(WMO) are also essential to ensure sustainability. The World
Bank plans to scale up its support to global weather and
climate enterprises working closely with the WMO and other
partners.
In case of certain hazards such as floods and droughts, for
example, the MODIS Aqua and Terra products are available
free of charge and can be used to improve the monitoring
and forecasting services. Applications of space technology
and GIS can provide accurate warnings of impending
disasters, help map out hazards and vulnerabilities for
evidence based policy-making and planning and help
in disaster impact assessments for effective disaster risk
management at the regional, sub-regional and national
levels. Vietnam Government has been promoting research
and application of space technology for natural resource,
environment and disaster management. Space Technology
applications are successfully being used for wildfire
138138138Water and Natural DisastersMain Focus 3.
detection, soil erosion, natural resource management and
disaster monitoring such as floods. The VNREDSat-1 project,
one of VAST’s prioritized projects, is a stepping stone to form
the Vietnamese system of earth observation small satellite
systems in order to realize the “National strategy for research
and application of space technology until 2020”. The success
of VNREDSat-1 project will contribute efficiently to respond
to Vietnam’s natural disasters and global weather changes
and hence accelerate economic development in the country.
To operate the VNREDSat-1, Vietnam has built three ground
stations and sent 15 engineers to Toulouse, France, to be
trained in operating related systems (APRSAF, 2012). The
VNREDSat-1 project utilizes all the existing infrastructure
of the satellite image receiving, archiving and processing
system of the Ministry of Natural Resources and Environment,
that builds up, for the first time in Vietnam, a complete
monitoring system from the satellite to ground receiving
stations together with a processing and distributing center of
remote sensing data. Vietnam is also using EO small satellite
data (VNREDSat-1) and physical methods for water quality
research and management in Mekong River at the mouth of
Vietnam.
3.5.4.2 Reactive Step
Following the initial response period, and once the situation
has been stabilized, a GIS can be used to analyse disaster
impacts and help plan the rehabilitation process in a way that
reduces potential vulnerabilities. The following few examples
demonstrate the value and necessity of GIS during the post-
disaster management phases. Disaster impact analysis can
assist response efforts by identifying those areas that are
most in need, and can help guide reconstruction efforts in a
way that will minimize the potential for future disasters; for
example, through improved land use planning that takes
into account local hazard vulnerabilities. In conjunction
with IKONOS panchromatic images, De La Ville et al. (2002)
used GIS to evaluate the distribution of landslide erosion
scars and their effects on several urban areas situated
among six mountain catchments in Venezuela. Disaster
impact assessment system in Korea aims at fundamentally
eliminating potential causes of disasters inherent in various
development projects in advance and ultimately protecting
the life and property of the people. This program is one
good example for implementing sustainable development.
The disaster impact assessment system is implemented
when the area of targeted development is not less than
300,000 m2. With respect to small- and medium-sized
development projects (150,000 m2 to less than 300,000 m2
in size), each city and province has performed a local disaster
impact assessment system. To protect lives and properties
in downstream areas from the impact of large-scale
development, facilitating disaster prevention facilities such
as retention reservoir in the development area, the disaster
impact assessment has been introduced since 1996 and the
coverage of disaster impact assessment has been expanded
in 2001. Currently, disaster impact assessment is applicable
to 24 categories in 6 fields such as urban development,
industrial area development, tourism attraction development,
and mountain area development.
Following the Indian Ocean tsunami in 2004, and after
evoking the International Charter on Space and Major
Disasters to acquire pre- and post-disaster high resolution
satellite imagery, most country used a GIS for rapid damage
assessment. The GIS was used primarily to combine different
data types and to support a visual analysis of building
damage. QuickBird multi-spectral imagery and a 1:5000
scale vector layer of buildings obtained from the Survey
Department were overlaid in a GIS to accurately identify
construction that existed prior to the disaster. Global
Positioning System (GPS) was used in conjunction with
ground photographs to accurately record the location and
building damage, respectively. This allowed for a comparison
between the damage level in the photographs and satellite
imagery. Results indicated that heavily damaged buildings
can be easily identified, but partial damage, particularly if
the roof was still intact, was difficult to determine from the
satellite imagery alone.
Since 2007, the Netherlands National Safety and Security
Strategy has promoted a hol ist ic approach to r isk
management. It has determined five vital areas for the
country, which are territorial, physical, economic and
ecological safety, and social and political stability. The main
objective of the Netherlands National Risk Assessment (NRA)
is to define priority risks for which the Netherlands should
prepare and plan capacity development accordingly. The
NRA consists of two parts: analysis and impact assessment.
The analysis phase is managed by a network of independent
experts who operate under the leadership of the steering
138
Main Focus 3. W
ater and Natural Disasters
139138 /the 7th World Water Forum 138
Main Focus 3. W
ater and Natural Disasters
139/
committee of National Security, which is composed of
ministries, businesses and intelligence services. The NRA
method is scenario-based. Risk scenarios have assigned
scores for their likelihood and impacts according to 10 criteria
related to vital safety and security interests. The results are
given according to low and high estimates. The impact
assessment permits the Netherlands to determine which
capabilities are needed for each type of risk. In this way,
high estimates contribute to the development of resilience
capacities and preparedness. The NRA develops estimates for
a five-year period. This NRA is then used to assess capacity
gaps and identify where capabilities should be reinforced.
For the effective national disaster management, NEMA, Korea
has established the database system and the information-
based risk management systems which include a variety
of data such as GIS data, spatial information, CCTV images,
disaster risk maps, water resources, etc. To manage these
information effectively, NEMA developed the National
Disaster Management System as shown in Figure 3.14 in
which all information are integrated and systematized with
numerical models to simulate flood inundation area, estimate
flood risk and assess damages. The analysis and assessment
results are forwarded to the central government, regional
municipalities, and related agencies which can help each
of these entities to provide detailed response plans and
mitigation plan for sustainable development and disseminate
warning information to the public through ICT such as TV
and radio stations. The system also can support decision
making for quick response and emergency recovery for
the damaged facilities by advanced C4 (Command, Control,
Communication and Computer Integration) concept, data
mining using disaster cases and statistics DB, on-site analysis
using GIS/GPS information and various disaster monitoring
sensor applications. In addition, satellite or aerial photograph
information were collected to identify a disaster, and these
related information were also gathered and delivered
to the central disaster and safety measure headquarters
for analysis. This system is included in various up-to-
date telecommunication technologies to use the wireless
communication network by way of precaution against failure
of the wired network.
In other examples, GIS has been used to determine the
extent of a disaster and estimate damage (Ranyi & Nan,
2002), organize resource inventories and their geographic
distribution (Hussain et al., 2005), monitor shelter/refugee
camp status and the state of transportation infrastructures
(Gunes & Koval, 2000) and integrate disparate spatial
data sources that may be required to guide response
(Amdahl, 2001). GIS can help with search and rescue for
providing medical services, debris removal, sheltering,
and infrastructure repairs. Sahana, a free and open source
software (FOSS)-based system developed by Lanka Software
Foundation, Sri Lanka, is a suite of web-based applications
that provides solutions to the problems arising in a post-
disaster situation. One objective of Sahana is to assist victims
in connecting with their families and friends as soon as
possible. Sahana’s Missing Person Registry is an electronic
version of a bulletin board of missing and found people. It
can capture information not only on the people missing, but
also about those who seek details about the missing persons,
thus increasing their chance of reuniting. Even if the victims
or families do not have access to this information themselves,
it is quite easy for any authorized NGO or civil society group
to connect to the central portal and provide that service in
the areas they are working. Also it keeps track of all the relief
organizations and civil society groups working in the disaster
region. It captures information on both the places where they
are active and the range of services they are providing in
each area to ensure that there is no overlap.
The applicability of remote sensing for disaster management
is perhaps best exemplified in the case of flooding, and many
researchers address its use for this disaster type. Satellite
imagery can be used to assess the extent of past flood events
(Dewan, Islam et al., 2007) and aid in the development
of flood hazard potential maps. Jayaraman et al. (1997)
highlight the potential of RS technology to drastically assist
flood response and relief operations by providing inundation
mapping and damage assessment. Disasters resulting from
floods are a logical choice for RS analysis because: (a) floods
generally cover large areas, and thus occur at spatial scales
much larger than the spatial resolution of most satellite
imagery, and (b) water has a unique spectral reflection which
makes it clearly discernable from other ground features
(Showalter, 2001). In contrast, earthquakes, for example, may
cause significant damages to buildings and infrastructures,
but without high resolution imagery or change of detection
capabilities, it can be difficult or impossible to identify.

140140140Water and Natural DisastersMain Focus 3.
Figure 3.14 Design of decision support system for flood disaster management in Korea (Cheong, 2012)
Private House Price Decision Support System
DB System GUI System
SalinityTemperatureParticle TrackingWater QualityHydrodynamicsDamage EstimationEvacuation Routes
Public House Price
Population Information
Land Use Information
Land Registration Map
Building Information
Inte
grat
ed
GIS System
NumericalModel
Inundation
3.5.5 Research and Development AgendaThe Asia-Pacific region has been suffering from multiple
e x o g e n o u s s h o c k s i n t h e p a s t f e w d e c a d e s . T h e
overlapping and interlinked nature of these shocks call for
a comprehensive approach to build resilience. Regional and
sub-regional cooperation has become increasingly critical
especially in the sharing of good practices and enhancing
the capacity of member states in the active use of space-
based information, near real-time satellite imagery and
data, including scale, geographic coverage and maps, as
well as learning from good policy practices. The disaster-
prevention-related agencies must pursue the joint use of
disaster prevention information and must work to build a
system capable of integrating, acquiring, and managing
spatial data segments of the disaster prevention information
from the public sector. In addition, the deployment of a
ubiquitous-application software development environment
must be considered in light of the advances in information
technologies. On top of these, the standardization of disaster
management affairs, the continued increase in the number
3.5.6 RecommendationsSpace-based information and products and services play a
crucial role in strengthening the much needed cross-sectoral
linkages in support of disaster risk reduction, response,
recovery and long-term development planning. There are
of agencies jointly using the available disaster prevention
information, the enrichment of shared contents, the
expansion of public disaster information service contents, the
enhancement of real-time disaster information gathering, the
development of disaster-forecasting simulation capabilities,
and the enhancement of satellite- and wireless-network-
based situation reporting must be realized to come up with a
truly advanced disaster information management system. It
is important to enhance the scientific and technical work on
disaster risk reduction through the mobilization of existing
networks of scientific and research institutions at national,
regional and international levels in order to strengthen
the evidence base in support of the implementation and
monitoring of this framework.

140
Main Focus 3. W
ater and Natural Disasters
141140 /the 7th World Water Forum 140
Main Focus 3. W
ater and Natural Disasters
141/
3.6 DISCUSSION AND CONCLUSIONSClimate change is a crucial issue for our future already
affecting climate, people, and resources in this world. These
impacts are projected to increase and thereby pushing
the urgent need to address water related disasters due to
the climate change, especially, in developing countries.
Therefore, we need to mitigate negative impacts and take
advantage of possible opportunities. Also, the adaptation
strategies are crucial with recognition of both local
experiences and innovative technologies to provide decision
many good practices in the developed countries for effective
application of space technology and GIS and it is imperative
to enhance and facilitate the sharing of information and good
practices. The ability of GIS and space-based information
technology to acquire, interpret, analyze, map and
disseminate information, are essential during all phases of the
natural disaster management cycle. Since disasters are spatial
phenomenon there is a strong relationship between disaster
management capacities and decision support capabilities
offered by GIS and space-based information technology.
The United Nations Office for Outer Space Affairs has been
implementing a Space Technology and Disaster Management
Program to support developing countries in incorporating
space-based solutions in disaster management activities. It is
important to ensure real-time access to reliable data, and use
Information and Communication Technology innovations to
enhance collection, analysis and dissemination of data.
To overcome barriers for GIS and space-based information
technology level, in improving the overal l disaster
management capacity at the local level especially in the
case of the developing countries, many researchers have
highlighted the particular opportunity that free and open
source software (FOSS) provides. Attractive characteristics
of FOSS from a developing country perspective include:
costfree, freedom, accessibility, customizability, compatibility,
software and technical capacity development opportunities.
For supporting the development and strengthening of DRR
capacities of developing countries, an international platform
to share and transfer space and GIS-based information is
needed. Also further extension in cooperating with NGO and
related institutes for information sharing or developing open
platform is essential for disaster risk management.
makers with cutting edge information on the vulnerability
to climate change. However, while, we may need the
reduction of greenhouse gas emissions to manage changing
climate change and natural disasters. It is undisputed that
the devastating consequences of climate change cannot
be reversed in the short term and therefore, we need
international collaborations and cooperative action in the
long term associated with both mitigation and adaptation.
Drought that is associated with deficit in available water
is an extreme climatic event and cause potential long-
term impacts on water resources, agricultural production,
economic activities and ecosystems. The occurrence of
recent severe droughts and their respective vulnerabilities
in the context of climate change have warned communities
and governments across the globe to take initiatives for
better future planning to mitigate its impacts to the possible
extent. A better solution is to mobilize and enhance funding
and support research and development on the underlying
causes and effects of drought, including social, economic
and environmental perspectives, promote the culture of
information exchange as well as introducing innovative
techniques and practices that can improve food security and
reduce human vulnerability.
As discussed, urban flooding has been a growing concern
for developed and developing countries and flood events
may increase in the future due to climate change and land
development especially in urban areas. The vulnerability
assessment and resilience measure can help to identify
and prioritize weaker area from urban flood. Scientific and
technical solutions for mitigating the urban flooding has been
developed such as flood defense system and integral flood
management including flood observation and alert system
as hardware and software tools. We conclude that those tools
must be further developed and balanced between common
sense and far-sighted approaches to defend against future
flood hazard. In addition, improving further forecasting and
warning system up to the point public can be relied on is one
of the major goals that science and technologies must reach
as well as visualize current and forecasting flood status.
ICT and GIS applications, especially space-based information
and mechanism were introduced and their crucial roles in
strengthening the much needed cross-sectoral linkages in

142142142Water and Natural DisastersMain Focus 3.
support of disaster risk reduction, response, recovery and
long-term development planning were discussed. And it was
issued that developing countries and local communities in
the advanced countries have barriers for real-time accessing
to reliable data, and using ICT innovations to enhance
collection, analysis and dissemination of data. To solve this
problem, free and open based global platform for information
sharing and technology transferring was suggested. This
global platform extended to NGOs and related institutes
should be empowered to incorporate technology into real
practice which also can help to realize evidence-based policy
making on disaster risk reduction to be practiced globally.
Albergel, C., Rüdiger, C., Pellarin, T., Calvet, J.C., Fritz, N., Froissard, F., Suquia, D., Petitpa, A., Piguet, B. and Martin, E. (2008) From near-surface to root-zone soil moisture using an exponential filter: an assessment of the method based on in-situ observations and model simulations. Hydrology and Earth System Sciences, 12, 1323–1337.
Allen, P.M., Harmel, R.D., Dunbar, J.A. and Arnold, J.G. (2011) Upland contribution of sediment and runoff during extreme drought: a study of the 1947–1956 drought in the Blackland Prairie, Texas. Journal of Hydrology, 407, 1-11.
Almer. A. (2008). “Information services to support disaster and risk management in alpine areas”, Proceedings of the 11th AGILE Conference, Girona, Spain, 5-8 May, 2008.
Amdahl, G. (2001). “Disaster response: GIS for public safety”. Redlands, CA: ESRI.
APFM (2008a). “Land Use Planning for IFM in Flood Management Tools Series”, APFM, http://www.apfm.info/publications/tools/Tool_07_The_Role_of_Land_Use_Planning_in_FM.pdf
APFM (2008b). “Urban Flood Risk Management-A Tool for Integrated Flood Management”, APFM, http://www.apfm.info/publications/tools/Tool_06_Urban_Flood_Risk_Management.pdf
APRSAF. (2012). “Space Technology development of Vietnam in 2011-2012”, Country Report.
Barroca, B., Bernardara, P., Mouchel, J.M., and Hubert, G. (2006). “Indicators for identification of urban flooding vulnerability” Natural Hazards and Earth System Sciences, 6(4), 553-561.
Bates, B., Kundzewicz, Z. W., Wu, S., & Palutikof, J. (2008). “Climate change and water” IPCC Secretariat, 210 pp
Becking, I. (2004). “How space can better support emergency management and critical infrastructure protection”. Envisat & ERS Symposium, Salzburg, Austria.
Bedient, P., Holder, A., and Vieux, B. (2002). “A Radar-Based Flood Alert System (FAS) Designed for Houston, Texas” Global Solutions for Urban Drainage, ASCE, 1-10.
Belal, A.A., El-Ramady, H.R., Mohamed, E.S. and Saleh, A.M. (2014) Drought risk assessment using remote sensing and GIS techniques. Arabian Journal of Geosciences, 7, 35-53.
Casale, R. and Margottini, C. (1999). “Floods and Landslides: Integrated Risk Assessment”, Springer.
Chanuka, W. (2007). “ICT for Disaster Management/ICT for Disaster Prevention”. Mitigation and Preparedness, Wikibooks.
REFERENCES

142
Main Focus 3. W
ater and Natural Disasters
143142 /the 7th World Water Forum 142
Main Focus 3. W
ater and Natural Disasters
143/
Chen, J. and Chan, F.P. (2007) A preliminary drought mitigation plan for Hong Kong. Water and Environmental Management: Integrated Systems for Sustainability, Honk Kong, 1492-1498.
Chen, P., S. C. Liew, L. K. Kwoh (2005). “Tsunami damage assessment using high resolution satellite imagery: A case study of Aceh, Indonesia”. IEEE International Symposium on Geoscience and Remote Sensing, Vol. 2, pp. 1405-1408.
Cheong, T.S. (2012). “Development of Decision Support System for Flood Disaster Risk Management”. Journal of Tropical Cyclone Research and Review, 1, 198-206.
COAG (2009). “National Strategy for Disaster Resilience: Building our Nation's Resilience to Disasters”. Council of Australian Governments.
Collins, W. D., Bitz, C. M., Blackmon, M. L., Bonan, G. B., Bretherton, C. S., Carton, J. A., ... & Smith, R. D. (2006) “The community climate system model version 3 (CCSM3)” Journal of Climate, 19(11), 2122-2143.
ComEC (2007) Communication from the commission to the European parliament and the council: addressing the challenge of water scarcity and droughts in the European Union. Commission of the European communities Brussels.
Commonwealth of Australia (2011). “Coastal Communities Bui ld ing R es i l ience to C l imate Change” Canber ra : Commonwealth of Australia, Department of Climate Change and Energy Efficiency
Cook, B.I., Smerdon, J.E., Seager, R. and Coats, S. (2014) Global warming and 21st century drying. Climate Dynamics, 43, 2607-2627.
CORFU Consortium (2014). “Collaborative research on flood resilience in urban areas”, University of Exeter, United Kingdom.
Coulter, D., T. Phillips (2011). “New GOES-R to give more tornado warning time”. http://ephemeris.sjaa.net/1108/d.html
Cross, M. S., Zavaleta, E. S., Bachelet, D., Brooks, M. L., Enquist, C. A., Fleishman, E., ... & Tabor, G. M. (2012). “The Adaptation for Conservation Targets (ACT) framework: a tool for incorporating climate change into natural resource management” Environmental Management, 50(3), 341-351.
De La Ville, N., A. C. Diaz, D. Ramirez (2002). “Remote sensing and GIS technologies as tools to support sustainable management of areas devastated by landslides”. Environment, Development and Sustainability, 4, 221–229.
Dewan, A. M., M. D. H. Kabir, M. M. Islam, T. Kumamoto, M. Nishigaki (2007). “Delineating flood risk areas in Greater Dhaka of Bangladesh using geoinformatics”. Georisk, 1, 190–201.
DHI (2013). “Local Flash Flood Warning System: An Integrated and Flexible system”, http://www.dhigroup.com/upload/publications/scribd/192187830-Local-flash-flood-warning-system-DHI-Solution.pdf.Dunnette, R. (2006). “Radio and TV Broadcasting for Disaster Relief and Public Warning”. Pacific Telecommunications Council ’06 Proceedings.
Edoho, F. M. (2009). “Appropriate Technology Transfer” Institutional Issues Involving Ethics and Justice, 2, 123-136.
EEA (2009) Towards a European Water Scarcity and Drought Network. A report on Water scarcity and drought, European Environment Agency.
EM-DAT (Emergency events database). http://www.emdat.be/
Enenkel, M., See, L., Bonifacio, R., Boken, V., Chaney, N., Vinck, P., You, L., Dutra, E. and Anderson, M. (2014) Drought and food security-Improving decision-support via new technologies and innovative collaboration. Global Food Security.
Engler, N.J., G.B. Hall (2007). “The Internet, spatial data globalization and data use: The case of Tibet”. The Information Society, 23, 345–359.
Esikuri, E.E. (2005) Mitigating drought−Long-term planning to reduce vulnerabil ity. A Discussion repor t on the environmental strategy notes from World Bank.
Estrela, T. and Vargas, E. (2012) Drought management plans in the European Union. The case of Spain. Water Resources Management, 26, 1537–1553.
European Information Society (2008). Lecture Notes in Geoinformation and Cartography, Springer.
Fleury, P., Maréchal, J.C., Ladouche B. (2013). “Karst flash-flood forecasting in the city of Nîmes (southern France)” Engineering Geology, Elsevier, 164, 26-35.
Flood Control 2015 (2012). “Five Years of Innovation in Flood Risk”, Foundation Flood Control 2015.
Flood Control International (2014). “Flood forecasting”, Water Information http://www.floodcontrolinternational.com/
Glick, P., Stein, B., & Edelson, N. A. (2010). “Scanning the conservation horizon: a guide to climate change vulnerability assessment” National Wildlife Federation, Washington DC.

144144144Water and Natural DisastersMain Focus 3.
Green Alliance (2002). “Precaution in practice: How the precautionary principle is used by government, business and NGOs” Green Alliance, London.
Groves, C. R., Game, E. T., Anderson, M. G., Cross, M., Enquist, C., Ferdana, Z., ... & Shafer, S. L. (2012). “Incorporating climate change into systematic conservation planning” Biodiversity and Conservation, 21(7), 1651-1671.
Guinau, M., R. Pallàs, J. M. Vilaplana (2005). “A feasible methodology for landslide susceptibility assessment in developing countries: A case-study of NW Nicaragua after Hurricane Mitch”. Engineering Geology, 80, 316–327.
Gunes, A. E., J. P. Koval (2000). Using GIS in emergency management operations. Journal of Urban Planning and Development, 126(3), 136–149.
Hallegatte, S. (2009). “Strategies to adapt to an uncertain climate change” Global Environmental Change, 19(2), 240-247.
Hallegatte, S., Hourcade, J. C., & Ambrosi, P. (2007). “Using climate analogues for assessing climate change economic impacts in urban areas” Climatic change, 82(1-2), 47-60.
Held, I . M. (2005). “ The gap between simulation and understanding in climate modeling” Bulletin of the American Meteorological Society, 86(11), 1609-1614.
Henonin, J., Russo, B., Mark, O. and Gourbesville, P. (2013). “Real-time urban flood forecasting and modelling - A state of the art” Journal of Hydroinformatics, IWA, 15(3), 717-736.
Hoerling, M., Eischeid, J., Kumar, A., Leung, R., Mariotti, A., Schubert, K., Mo, S. and Seager, R. (2014) Causes and Predictability of the 2012 Great Plains Drought. Bulletin of American Meteorological Society, 95, 269–282.
Huang, J., Sun, S., Xue, Y. and Zhang, J. (2014) Spatial and temporal variability of drought during 1960–2012 in Inner Mongolia, north China. Quaternary International, 355, 134-144.
Hussain, M., M. H. Arsalan, K. Siddiqi, B. Naseem, U. Rabab (2005). “Emerging geo-information technologies for natural disaster management in Pakistan: An overview”. 2nd International Conference on Recent Advances in Space Technologies.
International Federation of Red Cross and Red Crescent Societies (IFRC). (2001). “World disasters report. Geneva, Switzerland: Author”.
IPCC (2007). “Climate Change 2007: Synthesis Report” The Intergovernmental Panel on Climate Change.
IPCC (2012). “Managing the Risks of Extreme Events and Disasters to Advance Climate Change Adaptation” Cambridge University Press, Cambridge, UK, and New York, NY, USA, 582 pp.
IPCC (2013) Climate Change 2013: The Physical Science Basis. Contribution of Working Group I to the Fifth Assessment Report of the Intergovernmental Panel on Climate Change, Cambridge University Press, Cambridge, United Kingdom and New York, NY, USA.
IPCC (2013). “Climate Change 2013: The physical science basis” Cambridge University Press, Cambridge, United Kingdom and New York, NY, USA, 1535 pp.
IPCC (2014). “Climate Change 2014: Impacts, Adaptation, and Vulnerability” Cambridge University Press, Cambridge, United Kingdom and New York, NY, USA, 1132 pp.
Jayaraman, V., M. G. Chandrasekhar, U.R. Rao (1997). “Managing the natural disasters from space technology inputs”. Acta Astronautica, 40, 291–325.
Jha, A.K., Bloch, R., and Lamond, J. (2012). “Cities and flooding: a guide to integrated urban flood risk management for the 21st century” World Bank Publications.
Kam, J., Sheffield, J., Yuan, X. and Wood, E.F. (2012) The Influence of Atlantic Tropical Cyclones on drought over the Eastern United States (1980-2007). Journal of Climate, 26, 3067-3086.
Kim, G. and Barros, A. P. (2001). “Quantitative flood forecasting using multisensory data and neural networks” Journal of Hydrology, Elsevier, 246, 45-62.
Kim, S.J., Suh, K., Kim, S.M., Lee, K.D., and Jang, M.W. (2013). “Mapping of Inundation Vulnerability Using Geomorphic Characteristics of Flood-damaged Farmlands: A Case Study of Jinju City” Journal of Korean Society of Rural Planing, 6(3), pp51-59.
Klopfer, M., I. Simons (2009). “SANY - an open service architecture for sensor networks”. Edited by http://sany-ip.eu/publications/3317, 2009.
Kovacs, P. and Sandink, D. (2013). “Best practices for reducing the risk of future damage to homes from riverine flooding: A report on recovery and rebuilding in southern Alberta”, Institute for Catastrophic Loss Reduction.
Krause, R., F. Bönsch, W.E., and Waschkowski, K. (2005). “SMART-Project, Kuala Lumpur - Tunneling with Hydro-Shield - Analysis of the Logistics”, Wayss & Freytag AG., http://www.smarttunnel.com.my/construction/images/news/special/SR03.pdf

144
Main Focus 3. W
ater and Natural Disasters
145144 /the 7th World Water Forum 144
Main Focus 3. W
ater and Natural Disasters
145/
Kumar, V., A. Bugacov, M. Coutinho, R. Neches (1999). “Integrating geographic information systems, spatial digital libraries and information spaces for conducting humanitarian assistance and disaster relief operations in urban environments”. 7th ACM Symposium on Advances in Geographic Information Systems, Kansas City, MO.
Kyung, M.S (2010). “Assessment of Climate Change Effect on Standardized Precipitation Index and Frequency Based Precipitation” Inha Universty
Lawler, J. J., Tear, T. H., Pyke, C., Shaw, M. R., Gonzalez, P., Kareiva, P., & Pearsall, S. (2008). “Resource management in a changing and uncertain climate” Frontiers in Ecology and the Environment, 8(1), 35-43.
Lehner, B., Doll, P., Alcamo, J., Henrichs, T. and Kaspar, F. (2006). Estimating the impact of global change on flood and drought risks in Europe: a continental, integrated analysis. Climate Change, 75, 273-299.
Lempert, R. J., & Collins, M. T. (2007). “Managing the risk of uncertain threshold responses: comparison of robust, optimum, and precautionary approaches” Risk analysis, 27(4), 1009-1026.
Liao, K.H. (2012). “A Theory on Urban Resilience to Floods—A Basis for Alternative Planning Practices” Ecology and Society, 17(4), 48.
Liu, L. and Xiang, D. (2008) Drought monitoring for Asia-Pacific area using the cloud parameters method based on FY-2 data. The International Archives of the Photogrammetry, Remote Sensing and Spatial Information Sciences, 37(Part B8), 229-234.
Lyon, B. and DeWitt, D.G. (2012) A recent and abrupt decline in the East African long rains. Geophysical Research Letters, 39, L02, 702.
Mansor, S., M.A. Shariah, L. Billa, I. Setiawan, F. Jabar (2004). “Spatial technology for natural risk management”. Disaster Prevention and Management, 13, 364–373.
McGrath, G.S., Sadler, R., Fleming, K., Tregoning, P., Hinz, C. and Veneklaas, E.J. (2012) Tropical cyclones and the ecohydrology of Australia’s recent continental-scale drought. Geophysical Research Letters, 39, L03404.
ME (2010) “National Climate Change Adaptation Plan (2011-2015)” Ministry of Environment Republic of Korea.
Mishra, A.K. and Singh, V.P. (2010) A review of drought concepts. Journal of Hydrology, 391, 202-216.
Miyan, M.A. (2014) Droughts in Asian least developed countries: Vulnerability and sustainability. Weather and Climate Extremes.
Mutchek, M., & Williams, E. (2014). “Moving Towards Sustainable and Resilient Smart Water Grids” Challenges, 5(1), 123-137.
Nassopoulos, H., Dumas, P., & Hallegatte, S. (2012). “Adaptation to an uncertain climate change: cost benefit analysis and robust decision making for dam dimensioning” Climatic change, 114(3-4), 497-508.
National Emergency Management Agency (2010). “Regional Cooperative Mechanisms on Drought Disaster Monitoring and Early Warning”. RWG and SC meeting, Kunming, China.
NEMA (2011). “Environmental change prediction of natural disaster and design criteria of the measures for natural disaster prevention and control under climate change” National Emergency Management Agency.
Nexsens (2014). ”Flood alert system”, http://www.nexsens.com/systems/flood_alert_system.
NHDR (2007). “Human Development Report 2007/2008” UNDP, National Human Development Report.
Orlowsky, B. and Seneviratne, S.I. (2013) Elusive drought: uncertainty in observed trends and short- and long-term CMIP5 projections long-term CMIP5 projections. Hydrology and Earth System Sciences, 17, 1765-1781.
Othowai, A., Darboe, M., Balzer, N. and Pulwarty, R.S. (2012) Drought response and resilience: Innovations in the Horn of Africa and beyond. A World Bank Report.
Prasad, N., Ranghieri, F., Shah, F., Trohanis, Z., Kessler, E., & Sinha, R. (2009). “Climate resilient cities”. World Bank, Washington, DC.
Putnam, L. (2002). “By Choice or by Chance: How the Internet Is Used to Prepare for, Manage, and Share Information about Emergencies”. First Monday, 7(11).
Renyi, L., L. Nan (2002). “Flood area and damage estimation in Zhejiang, China”. Journal of Environmental Management, 66, 1–8.
Rialco (2014). “Flood Alarm device”, http://www.backwater-valves.com/flood-alarm.asp
Riebsame, W.E., Changnon, S.A. and Karl, T.R. (1992) Drought and natural resources management in the United States: impacts and implications of the 1987-89 drought. Journal of Natural and Social Sciences, 2(2), 11-92.
Rivereau, J.C. (1995). “Spot data applied to disaster prevention and damage assessment”. Acta Astronautica, 35, 467–470.
146146146Water and Natural DisastersMain Focus 3.
Rossi, G. and Cancelliere, A. (2013) Managing drought risk in water supply systems in Europe: a review. International Journal of Water Resources Development, 29, 272-289.
Rossi, G., Nicolosi, V. and Cancelliere, A. (2008) Recent methods and techniques for managing hydrological droughts. Food and Agriculture Organization of the United Nations, Options méditerranéennes. Série A: séminaires méditerranéens, 80, 251– 265.
Rossi, G., Vega, T. and Bonaccorso, B. (2007) Methods and tools for drought analysis and management. Water Science and Technology Library, 62.
Santos, J.F., Pulido-Calvo, I. and Portela, M.M. (2010) Spatial and temporal variability of droughts in Portugal. Water Resources Research, 46(3).
Schiermeier, Q. (2013) Climate models fail to predict US droughts. Nature, 496, 284–284.
Sechi, G.M. and Sulis, A. (2010) Drought mitigation using operative indicators in complex water systems. Physics and Chemistry of Earth, Parts A/B/C, 35(3-5), 195-203.
SensorNet, 2004. Nationwide detection of chemical, biological, radiological, nuclear and explosive threats, http://computing.ornl.gov/cse_home/datasystems/sensornet.pdf
Severe Storm Research Center (SSRC). (2011). “Case study on developing new technologies to increase tornado warning time.” Georgia Tech, Severe Storms Research Center.
Sheffield, J., Wood, E.F. and Roderick, M.L. (2012) Little change in global drought over the past 60 years. Nature, 491, 435–438.
Showalter, P.S. (1999). “Remote sensing’s use in disaster research: A review”. Disaster Prevention and Management, 10, 21–29.
Thomson, C.N., P. Hardin (2000). “Remote sensing/GIS integration to identify potential low-income housing sites”. Cities (London, England), 17, 97–109.
Tierney, J.E., Smerdon, J.E., Anchukaitis, K.J. and Seager, R. (2013) Multidecadal variability in East African hydroclimate controlled by the Indian Ocean. Nature, 493, 389–392.
Tiger Dam System (2014). http://usfloodcontrol.com/tiger-dam-products/
Trenberth, K.E., Dai, A., van der Schrier, G., Jones, P.D., Barichivich, J., Briffa, K.R. and Sheffield, J. (2013) Global warming and changes in drought. Nature Climate Change, 4, 17–22.
UN/GEM (2014) Spaced-based information for flood and drought risk reduction. A report from the United Nations/Germany Expert Meeting on 5-6 June 2014, Bonn, Germany.
UNESCO (2014) “Erasmus Mundus Programme in Flood Risk Management”, UNESCO, http://www .floodriskmaster.org/
UNISDR (2007) Drought, Desertification and Water Scarcity. United Nations International Strategy for Disaster Reduction.
UNISDR (2008). “Climate Change and Disaster Risk Reduction” United Nations International Strategy for Disaster.
UNISDR (2012) Disaster reduction in Africa, UNISDR Informs. United Nations International Strategy for Disaster Reduction Regional Office for Africa, Gigiri, Nairobi, Kenya.
UNOOSA (2013). “Statement at the ISDR platform 2013”. UNISDR.
Van Westen, C.J., P. Hofstee (2001). “The role of remote sensing and GIS in risk mapping and damage assessment for disasters in urban areas”. Enschede, The Netherlands: International Institute for Aerospace Survey and Earth Sciences (ITC).
Wallingford, H.R. (2014) “Flood risk management”, http://www.hrwallingford.com/expertise/flood-risk-management
Wang, Q., Wu, J., Lei, T., He, B., Wu, Z., Liu, M., Mo, X., Geng, G., Li, X., Zhou, H., Liu, D. (2014) Temporal-spatial characteristics of severe drought events and their impact on agriculture on a global scale. Quaternary International, 349, 10-21.
WCDRR (2014). “First Preparatory Committee For The 3rd World Conference For DRR : Water Brief on Disaster Risk” World Conference on Disaster Risk Reduction.
WHO (2006). “Risk Assessment and Preventive measures”. Flooding and Communicable Diseases Fact Sheet, The World Health Organization, http://www.who.int/hac/techguidance/ems/flood_cds/en/
Wilhite, D.A., Sivakumar, M.V.K. and Pulwarty, R. (2014) Managing drought risk in a changing climate: The role of national drought policy. Weather and Climate Extremes, 3, 4-13.
Willows, R., Reynard, N., Meadowcroft, I., & Connell, R. (2003) “Climate adaptation: Risk, uncertainty and decision-making” UKCIP Technical Report. UK Climate Impacts Programme.
Wilson, R. (2005). “Design of the SMART Project, Kuala Lumpur, Malaysia – a unique holistic concept”, Mott MacDonald.
WWAP (2009). “The United Nations World Water Development Report 3: Water in a Changing World” World Water Assessment Programme.

146
Main Focus 3. W
ater and Natural Disasters
147146 /the 7th World Water Forum 146
Main Focus 3. W
ater and Natural Disasters
147/
WWAP (2012). “The United Nations World Water Development Report 4: Managing Water under Uncertainty and Risk” World Water Assessment Programme.
YSI (2014). ”Flood alert system”, http://www.ysi.com/media/pdfs/E99-Flood-Alert-Monitoring-brochure.pdf
Zargar, A., Sadiq, R., Naser, B. and Khan, F.I. (2011) A review of drought indices. Environmental Reviews, 19, 333–349.
Zimmerman, R. (2002). “Global Climate Change and Transportation Infrastructure: Lessons from the New York Area” The Potential Impacts of Climate Change on Transportation, 11(A17), 91.
Zribi, M., Anguela, P., Duchemin, B., Lili, Z., Wagner, W., Hasenauer, S. and Chehbouni, A. (2010) Relationship between soil moisture and vegetation in the Kairouan plain region of Tunisia using low spatial resolution satellite data. Water Resources Research, 46, W06508.
(1) http://gt2030.com/2012/07/18/urbanization-and-the-global-climate-dilemma
(2) http://www.ativizig.hu
(3) http://www.bbc.com
(4) http://www.corfu-fp7.eu/
(5) http://www.drought.unl.edu
(6) http://www.em-dat.net
(7) http://www.eurogeoss.eu
(8) http://www.floodcontrolinternational.com/
(9) http://www.ncdc.noaa.gov
(10) http://www.pnas.org
(11) http://www.smarttunnel.com.my/
(12) http://www.un-spider.org
(13) http://www.unece.org
(14) http://www.unescap.org/our-work/ict-disaster-risk-reduction
(15) http://www.unisdr.org/droughts-doc
(16) http://www.waterjpi.eu
(17) http://www.wikipedia.com
(18) http://www.wxedge.com
(19) http://yale.databasin.org/pages/coping-uncertainty
(20) https://agenda.weforum.org/2013/01/the-importance-of-urban-resilience
WEBSITES

Smart Technology
Main Focus 4
Smart Technology for Water
Smart Water Management is a next-generation water management process using
intelligent-integrated technologies and water information generated in the process
of the whole water cycle. It can maximize the efficiency of water management in
terms of water resource management, treatment & distribution system control,
and energy consumption management.
Smar
t Tec
hnol
ogy
for W
ater
Main Focus 4 150
4.1 INTRODUCTION
Smart technologies are considered to be intelligent in
that they enable quick and accurate responses to changes
and may predict and optimize for future events to provide
improved outcomes. Smart water management (SWM)
refers to the systematic and pervasive collection and use
of data generated from water systems using information
and communication technologies (ICT ), which enables
greater internal and external integration and provides
enhanced system control. It can be considered to contain
three components: technology, integration, and modelling.
Arguably, the key feature is integration or interconnection, as
people, systems, and objects interact and communicate with
each other in new ways (IBM, 2010).
SWM is a rapidly evolving approach to improving whole
system management by exploiting performance data
gathered from water systems at various scales. The data can
come from many sources including users, infrastructure,
meterology/hydrology, and the environment. When
processed, the data can be used for automated real-time
control or as part of a decision support system (Figure
4.1). The potential benefits are many and include greater
operational efficiency, reduced costs, and enhanced system
resilience and sustainability. The potential is so great that
SWM can be reasonably described as an emerging paradigm
shift in the water sector, with applications throughout the
water cycle.
SWM can be applied to different parts of the water cycle,
such as urban water and water resources, and at different
scales. Within urban water management, for example, smart
technologies can be implemented independently in each
sub-system (e.g., wastewater treatment, urban drainage
and water distribution systems), but it is also possible to
utilize data from multiple sources in an integrated manner
to provide intelligent operation and smart decision-making
through the use of smart grids. The term “smart” can also
be applied to technologies providing greater integration
with external systems, such as energy, to provide further
all-round benefits. Applications of SWM are widespread
and developing continuously. In the urban environment,
topics addressed include water conservation and efficiency,
leakage detection and control, energy consumption, and
water quality improvements. At river basin scale, applications
include approaches to ensure the efficient production,
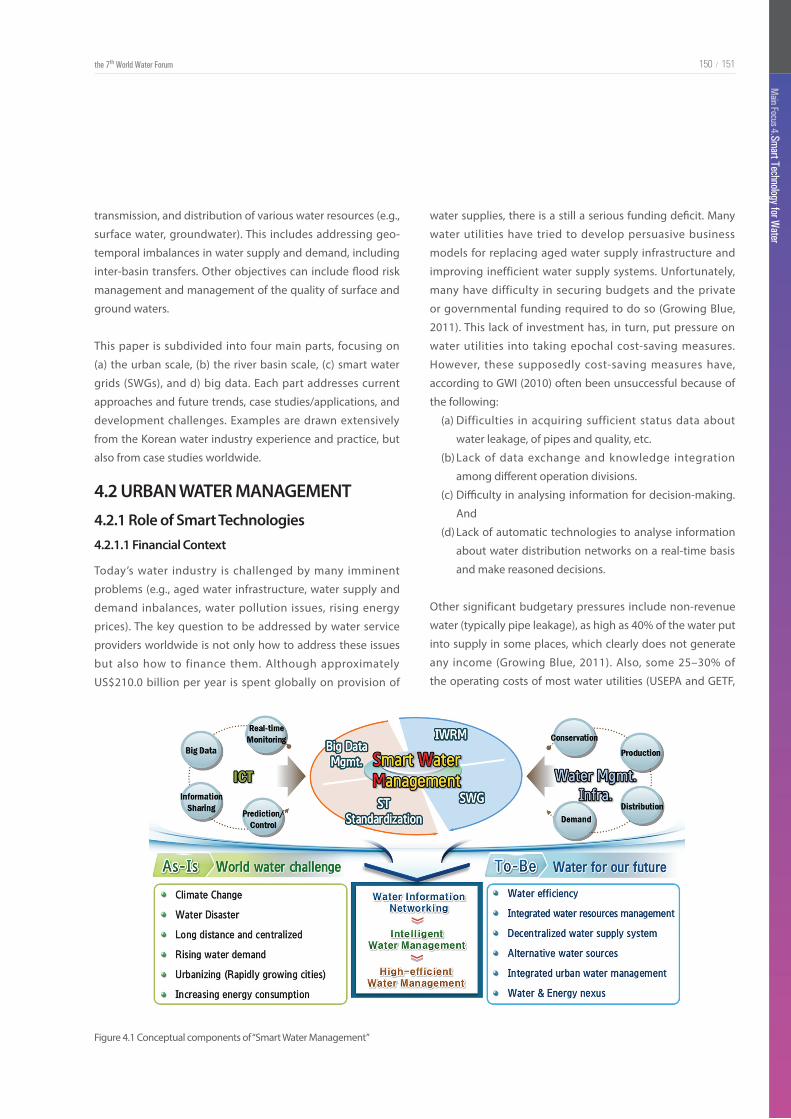
Main Focus 4. Smart Technology for W
ater
151150 /the 7th World Water Forum
Figure 4.1 Conceptual components of “Smart Water Management”
transmission, and distribution of various water resources (e.g.,
surface water, groundwater). This includes addressing geo-
temporal imbalances in water supply and demand, including
inter-basin transfers. Other objectives can include flood risk
management and management of the quality of surface and
ground waters.
This paper is subdivided into four main parts, focusing on
(a) the urban scale, (b) the river basin scale, (c) smart water
grids (SWGs), and d) big data. Each part addresses current
approaches and future trends, case studies/applications, and
development challenges. Examples are drawn extensively
from the Korean water industry experience and practice, but
also from case studies worldwide.
4.2 URBAN WATER MANAGEMENT4.2.1 Role of Smart Technologies4.2.1.1 Financial Context
Today’s water industry is challenged by many imminent
problems (e.g., aged water infrastructure, water supply and
demand inbalances, water pollution issues, rising energy
prices). The key question to be addressed by water service
providers worldwide is not only how to address these issues
but also how to finance them. Although approximately
US$210.0 billion per year is spent globally on provision of
water supplies, there is a still a serious funding deficit. Many
water utilities have tried to develop persuasive business
models for replacing aged water supply infrastructure and
improving inefficient water supply systems. Unfortunately,
many have difficulty in securing budgets and the private
or governmental funding required to do so (Growing Blue,
2011). This lack of investment has, in turn, put pressure on
water utilities into taking epochal cost-saving measures.
However, these supposedly cost-saving measures have,
according to GWI (2010) often been unsuccessful because of
the following:
(a) Difficulties in acquiring sufficient status data about
water leakage, of pipes and quality, etc.
(b) Lack of data exchange and knowledge integration
among different operation divisions.
(c) Difficulty in analysing information for decision-making.
And
(d) Lack of automatic technologies to analyse information
about water distribution networks on a real-time basis
and make reasoned decisions.
Other significant budgetary pressures include non-revenue
water (typically pipe leakage), as high as 40% of the water put
into supply in some places, which clearly does not generate
any income (Growing Blue, 2011). Also, some 25–30% of
the operating costs of most water utilities (USEPA and GETF,
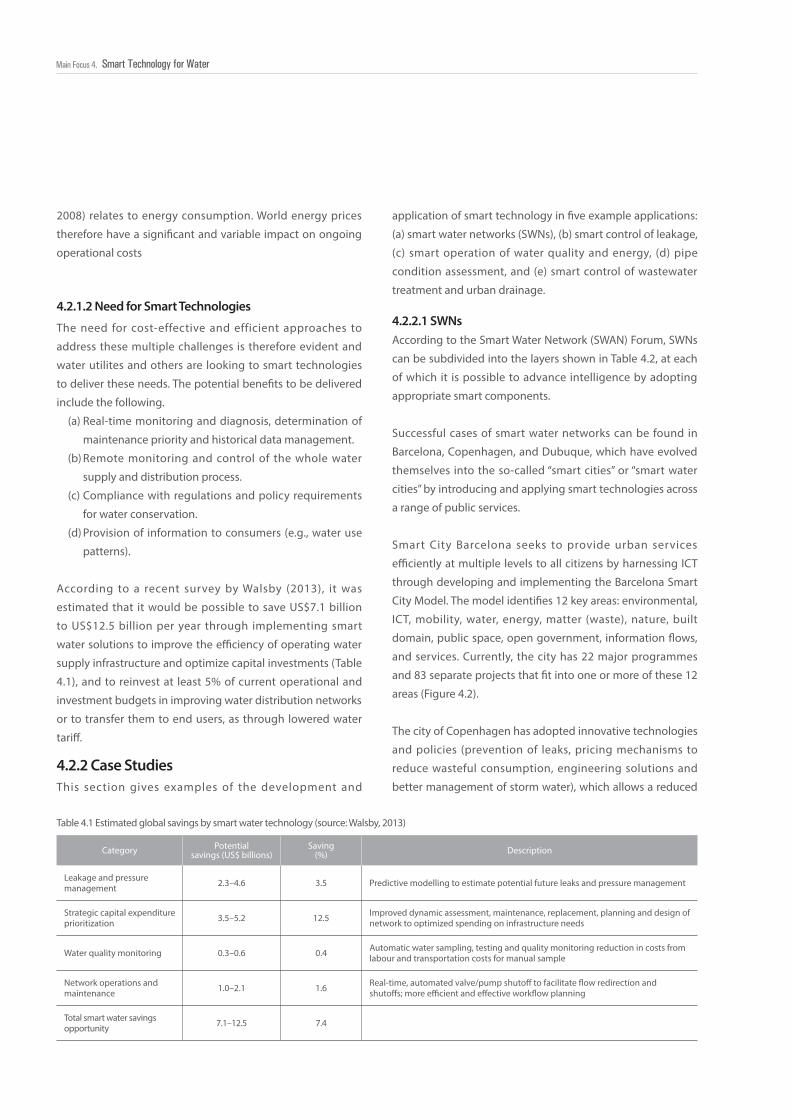
152152152Main Focus 4. Smart Technology for Water
4.2.1.2 Need for Smart Technologies
The need for cost-effective and efficient approaches to
address these multiple challenges is therefore evident and
water utilites and others are looking to smart technologies
to deliver these needs. The potential benefits to be delivered
include the following.
(a) Real-time monitoring and diagnosis, determination of
maintenance priority and historical data management.
(b) Remote monitoring and control of the whole water
supply and distribution process.
(c) Compliance with regulations and policy requirements
for water conservation.
(d) Provision of information to consumers (e.g., water use
patterns).
According to a recent survey by Walsby (2013), it was
estimated that it would be possible to save US$7.1 billion
to US$12.5 billion per year through implementing smart
water solutions to improve the efficiency of operating water
supply infrastructure and optimize capital investments (Table
4.1), and to reinvest at least 5% of current operational and
investment budgets in improving water distribution networks
or to transfer them to end users, as through lowered water
tariff.
2008) relates to energy consumption. World energy prices
therefore have a significant and variable impact on ongoing
operational costs
This section gives examples of the development and
Table 4.1 Estimated global savings by smart water technology (source: Walsby, 2013)
According to the Smart Water Network (SWAN) Forum, SWNs
can be subdivided into the layers shown in Table 4.2, at each
of which it is possible to advance intelligence by adopting
appropriate smart components.
Successful cases of smart water networks can be found in
Barcelona, Copenhagen, and Dubuque, which have evolved
themselves into the so-called “smart cities” or “smart water
cities” by introducing and applying smart technologies across
a range of public services.
Smart City Barcelona seeks to provide urban services
efficiently at multiple levels to all citizens by harnessing ICT
through developing and implementing the Barcelona Smart
City Model. The model identifies 12 key areas: environmental,
ICT, mobility, water, energy, matter (waste), nature, built
domain, public space, open government, information flows,
and services. Currently, the city has 22 major programmes
and 83 separate projects that fit into one or more of these 12
areas (Figure 4.2).
The city of Copenhagen has adopted innovative technologies
and policies (prevention of leaks, pricing mechanisms to
reduce wasteful consumption, engineering solutions and
better management of storm water), which allows a reduced
4.2.2 Case Studies
4.2.2.1 SWNs
Category Potential savings (US$ billions)
Saving (%) Description
Leakage and pressure management 2.3–4.6 3.5 Predictive modelling to estimate potential future leaks and pressure management
Strategic capital expenditure prioritization 3.5–5.2 12.5 Improved dynamic assessment, maintenance, replacement, planning and design of
network to optimized spending on infrastructure needs
Water quality monitoring 0.3–0.6 0.4 Automatic water sampling, testing and quality monitoring reduction in costs from labour and transportation costs for manual sample
Network operations and maintenance 1.0–2.1 1.6 Real-time, automated valve/pump shutoff to facilitate flow redirection and
shutoffs; more efficient and effective workflow planning
Total smart water savings opportunity 7.1–12.5 7.4
application of smart technology in five example applications:
(a) smart water networks (SWNs), (b) smart control of leakage,
(c) smart operation of water quality and energy, (d) pipe
condition assessment, and (e) smart control of wastewater
treatment and urban drainage.
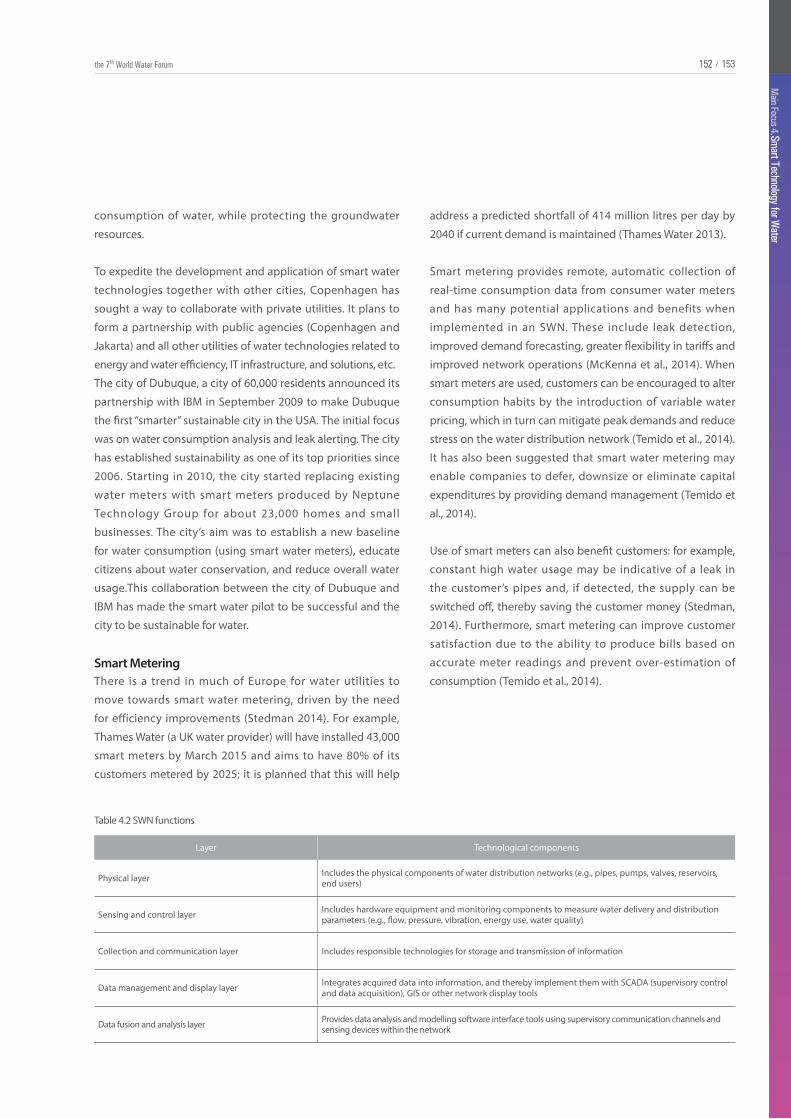
152
Main Focus 4. Smart Technology for W
ater
153152 /the 7th World Water Forum 152
Main Focus 4. Smart Technology for W
ater
153/
Table 4.2 SWN functions
Layer Technological components
Physical layer Includes the physical components of water distribution networks (e.g., pipes, pumps, valves, reservoirs, end users)
Sensing and control layer Includes hardware equipment and monitoring components to measure water delivery and distribution parameters (e.g., flow, pressure, vibration, energy use, water quality)
Collection and communication layer Includes responsible technologies for storage and transmission of information
Data management and display layer Integrates acquired data into information, and thereby implement them with SCADA (supervisory control and data acquisition), GIS or other network display tools
Data fusion and analysis layer Provides data analysis and modelling software interface tools using supervisory communication channels and sensing devices within the network
consumption of water, while protecting the groundwater
resources.
To expedite the development and application of smart water
technologies together with other cities, Copenhagen has
sought a way to collaborate with private utilities. It plans to
form a partnership with public agencies (Copenhagen and
Jakarta) and all other utilities of water technologies related to
energy and water efficiency, IT infrastructure, and solutions, etc.
The city of Dubuque, a city of 60,000 residents announced its
partnership with IBM in September 2009 to make Dubuque
the first “smarter” sustainable city in the USA. The initial focus
was on water consumption analysis and leak alerting. The city
has established sustainability as one of its top priorities since
2006. Starting in 2010, the city started replacing existing
water meters with smart meters produced by Neptune
Technology Group for about 23,000 homes and small
businesses. The city’s aim was to establish a new baseline
for water consumption (using smart water meters), educate
citizens about water conservation, and reduce overall water
usage.This collaboration between the city of Dubuque and
IBM has made the smart water pilot to be successful and the
city to be sustainable for water.
Smart MeteringThere is a trend in much of Europe for water utilities to
move towards smart water metering, driven by the need
for efficiency improvements (Stedman 2014). For example,
Thames Water (a UK water provider) will have installed 43,000
smart meters by March 2015 and aims to have 80% of its
customers metered by 2025; it is planned that this will help
address a predicted shortfall of 414 million litres per day by
2040 if current demand is maintained (Thames Water 2013).
Smart metering provides remote, automatic collection of
real-time consumption data from consumer water meters
and has many potential applications and benefits when
implemented in an SWN. These include leak detection,
improved demand forecasting, greater flexibility in tariffs and
improved network operations (McKenna et al., 2014). When
smart meters are used, customers can be encouraged to alter
consumption habits by the introduction of variable water
pricing, which in turn can mitigate peak demands and reduce
stress on the water distribution network (Temido et al., 2014).
It has also been suggested that smart water metering may
enable companies to defer, downsize or eliminate capital
expenditures by providing demand management (Temido et
al., 2014).
Use of smart meters can also benefit customers: for example,
constant high water usage may be indicative of a leak in
the customer’s pipes and, if detected, the supply can be
switched off, thereby saving the customer money (Stedman,
2014). Furthermore, smart metering can improve customer
satisfaction due to the ability to produce bills based on
accurate meter readings and prevent over-estimation of
consumption (Temido et al., 2014).
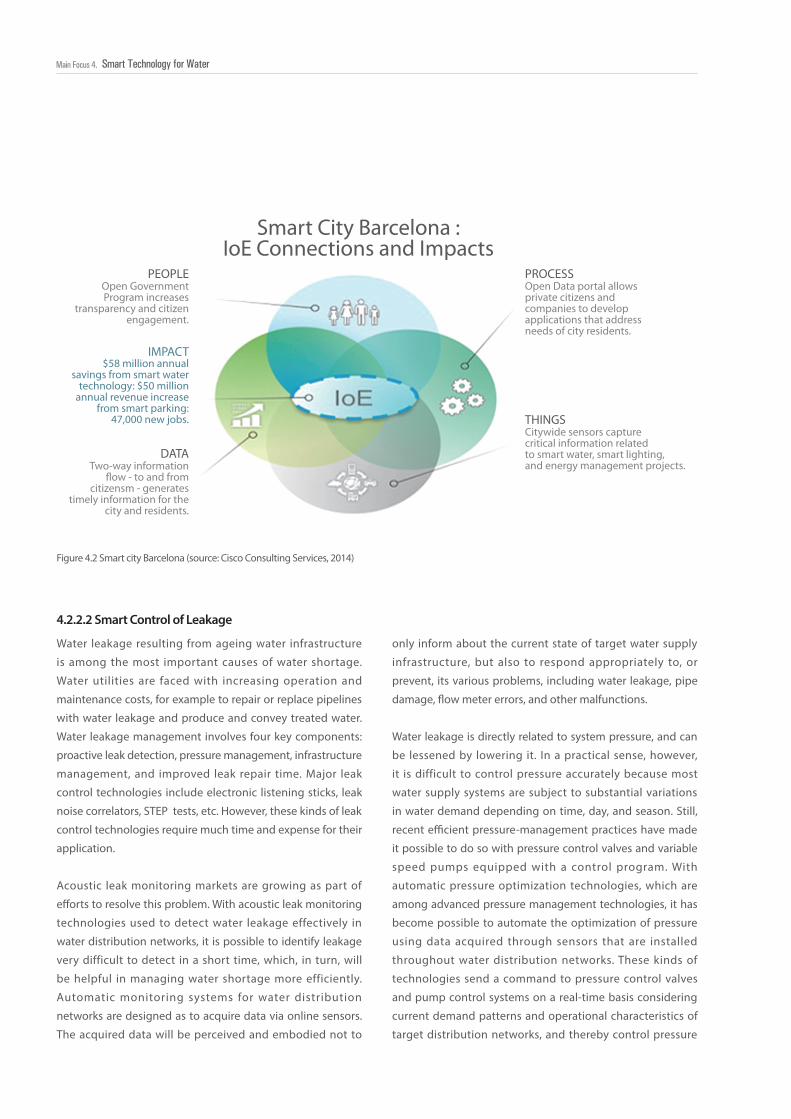
154154154Main Focus 4. Smart Technology for Water
Figure 4.2 Smart city Barcelona (source: Cisco Consulting Services, 2014)
4.2.2.2 Smart Control of Leakage
Water leakage resulting from ageing water infrastructure
is among the most important causes of water shortage.
Water utilities are faced with increasing operation and
maintenance costs, for example to repair or replace pipelines
with water leakage and produce and convey treated water.
Water leakage management involves four key components:
proactive leak detection, pressure management, infrastructure
management, and improved leak repair time. Major leak
control technologies include electronic listening sticks, leak
noise correlators, STEP tests, etc. However, these kinds of leak
control technologies require much time and expense for their
application.
Acoustic leak monitoring markets are growing as part of
efforts to resolve this problem. With acoustic leak monitoring
technologies used to detect water leakage effectively in
water distribution networks, it is possible to identify leakage
very difficult to detect in a short time, which, in turn, will
be helpful in managing water shortage more efficiently.
Automatic monitoring systems for water distribution
networks are designed as to acquire data via online sensors.
The acquired data will be perceived and embodied not to
Smart City Barcelona :
PEOPLEOpen GovernmentProgram increases
transparency and citizenengagement.
PROCESSOpen Data portal allows private citizens and companies to develop applications that address needs of city residents.
THINGSCitywide sensors capture critical information related to smart water, smart lighting, and energy management projects.
DATATwo-way information
�ow - to and fromcitizensm - generates
timely information for thecity and residents.
IMPACT$58 million annual
savings from smart watertechnology: $50 million
annual revenue increasefrom smart parking:
47,000 new jobs.
IoE Connections and Impacts
only inform about the current state of target water supply
infrastructure, but also to respond appropriately to, or
prevent, its various problems, including water leakage, pipe
damage, flow meter errors, and other malfunctions.
Water leakage is directly related to system pressure, and can
be lessened by lowering it. In a practical sense, however,
it is difficult to control pressure accurately because most
water supply systems are subject to substantial variations
in water demand depending on time, day, and season. Still,
recent efficient pressure-management practices have made
it possible to do so with pressure control valves and variable
speed pumps equipped with a control program. With
automatic pressure optimization technologies, which are
among advanced pressure management technologies, it has
become possible to automate the optimization of pressure
using data acquired through sensors that are installed
throughout water distribution networks. These kinds of
technologies send a command to pressure control valves
and pump control systems on a real-time basis considering
current demand patterns and operational characteristics of
target distribution networks, and thereby control pressure
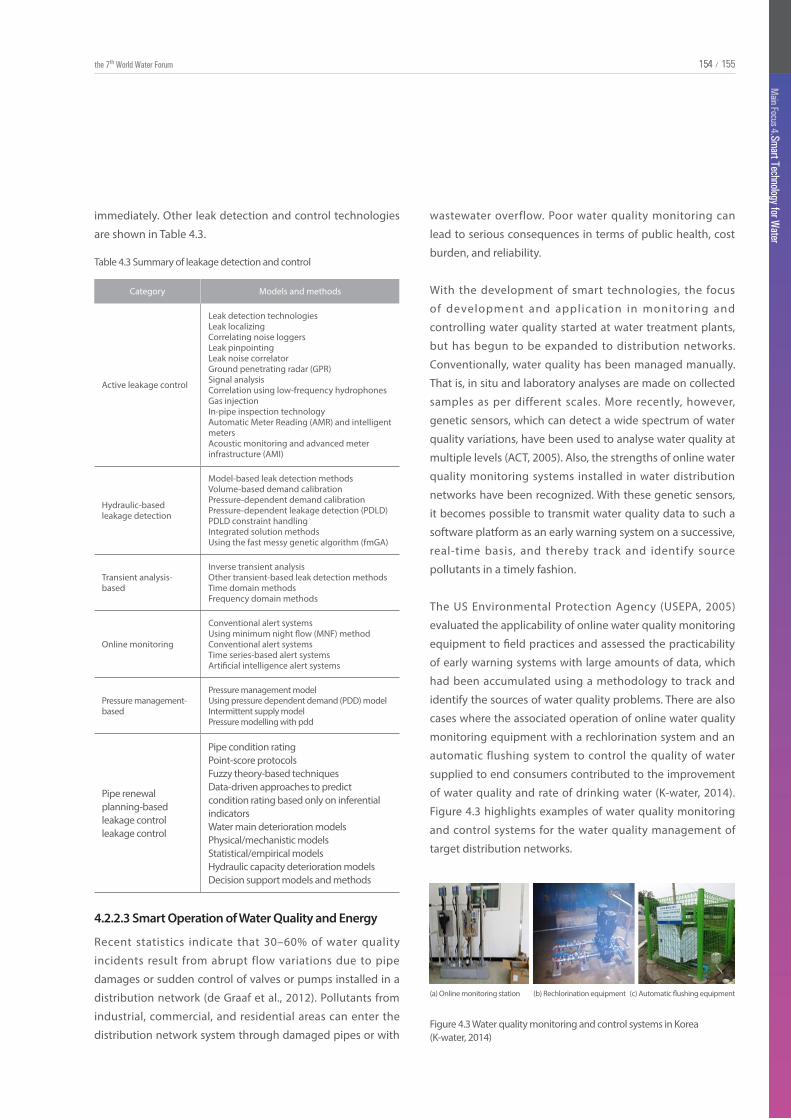
154
Main Focus 4. Smart Technology for W
ater
155154 /the 7th World Water Forum 154
Main Focus 4. Smart Technology for W
ater
155/
immediately. Other leak detection and control technologies
are shown in Table 4.3.
Table 4.3 Summary of leakage detection and control
Category Models and methods
Active leakage control
Leak detection technologiesLeak localizingCorrelating noise loggersLeak pinpointingLeak noise correlatorGround penetrating radar (GPR)Signal analysisCorrelation using low-frequency hydrophonesGas injectionIn-pipe inspection technologyAutomatic Meter Reading (AMR) and intelligent metersAcoustic monitoring and advanced meter infrastructure (AMI)
Hydraulic-basedleakage detection
Model-based leak detection methodsVolume-based demand calibrationPressure-dependent demand calibrationPressure-dependent leakage detection (PDLD)PDLD constraint handlingIntegrated solution methodsUsing the fast messy genetic algorithm (fmGA)
Transient analysis-based
Inverse transient analysisOther transient-based leak detection methodsTime domain methodsFrequency domain methods
Online monitoring
Conventional alert systemsUsing minimum night flow (MNF) methodConventional alert systemsTime series-based alert systemsArtificial intelligence alert systems
Pressure management-based
Pressure management modelUsing pressure dependent demand (PDD) modelIntermittent supply modelPressure modelling with pdd
Pipe renewal planning-based leakage controlleakage control
Pipe condition ratingPoint-score protocolsFuzzy theory-based techniquesData-driven approaches to predict condition rating based only on inferential indicatorsWater main deterioration modelsPhysical/mechanistic modelsStatistical/empirical modelsHydraulic capacity deterioration modelsDecision support models and methods
4.2.2.3 Smart Operation of Water Quality and Energy
Recent statistics indicate that 30–60% of water quality
incidents result from abrupt flow variations due to pipe
damages or sudden control of valves or pumps installed in a
distribution network (de Graaf et al., 2012). Pollutants from
industrial, commercial, and residential areas can enter the
distribution network system through damaged pipes or with
wastewater overflow. Poor water quality monitoring can
lead to serious consequences in terms of public health, cost
burden, and reliability.
With the development of smart technologies, the focus
of development and application in monitoring and
controlling water quality started at water treatment plants,
but has begun to be expanded to distribution networks.
Conventionally, water quality has been managed manually.
That is, in situ and laboratory analyses are made on collected
samples as per different scales. More recently, however,
genetic sensors, which can detect a wide spectrum of water
quality variations, have been used to analyse water quality at
multiple levels (ACT, 2005). Also, the strengths of online water
quality monitoring systems installed in water distribution
networks have been recognized. With these genetic sensors,
it becomes possible to transmit water quality data to such a
software platform as an early warning system on a successive,
real-time basis, and thereby track and identify source
pollutants in a timely fashion.
The US Environmental Protection Agency (USEPA, 2005)
evaluated the applicability of online water quality monitoring
equipment to field practices and assessed the practicability
of early warning systems with large amounts of data, which
had been accumulated using a methodology to track and
identify the sources of water quality problems. There are also
cases where the associated operation of online water quality
monitoring equipment with a rechlorination system and an
automatic flushing system to control the quality of water
supplied to end consumers contributed to the improvement
of water quality and rate of drinking water (K-water, 2014).
Figure 4.3 highlights examples of water quality monitoring
and control systems for the water quality management of
target distribution networks.
(a) Online monitoring station (b) Rechlorination equipment
Figure 4.3 Water quality monitoring and control systems in Korea (K-water, 2014)
(c) Automatic flushing equipment
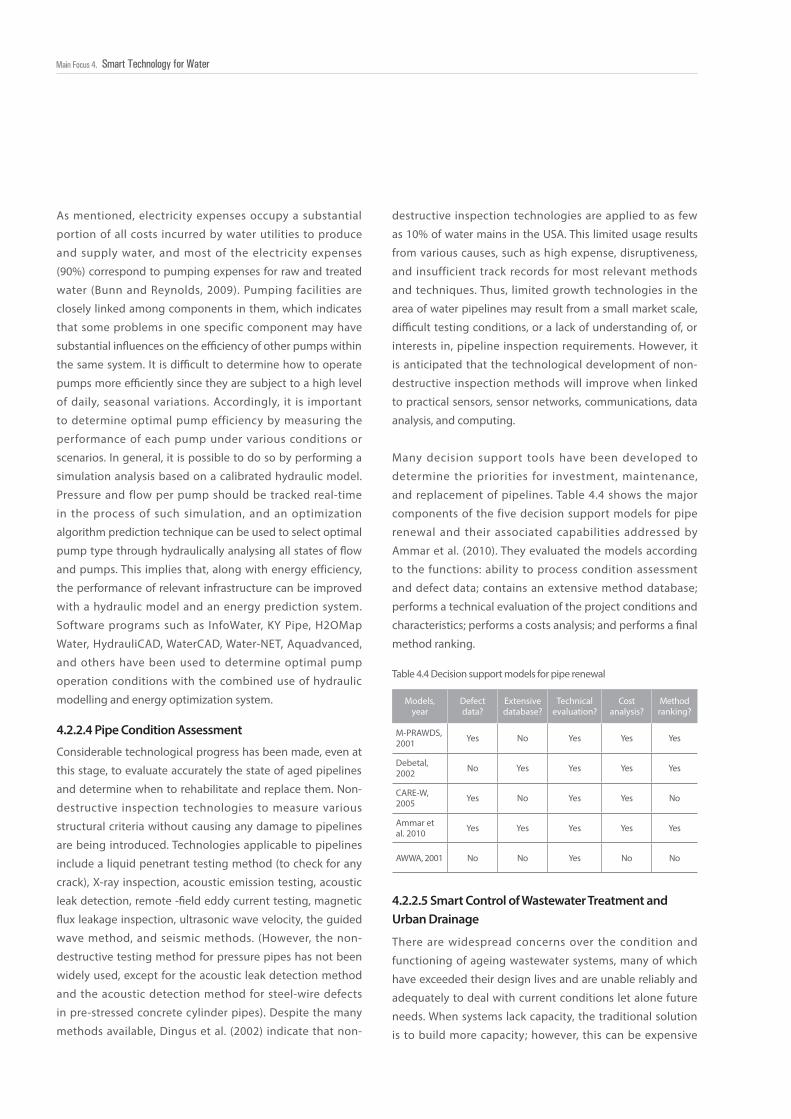
156156156Main Focus 4. Smart Technology for Water
4.2.2.4 Pipe Condition Assessment
Considerable technological progress has been made, even at
this stage, to evaluate accurately the state of aged pipelines
and determine when to rehabilitate and replace them. Non-
destructive inspection technologies to measure various
structural criteria without causing any damage to pipelines
are being introduced. Technologies applicable to pipelines
include a liquid penetrant testing method (to check for any
crack), X-ray inspection, acoustic emission testing, acoustic
leak detection, remote -field eddy current testing, magnetic
flux leakage inspection, ultrasonic wave velocity, the guided
wave method, and seismic methods. (However, the non-
destructive testing method for pressure pipes has not been
widely used, except for the acoustic leak detection method
and the acoustic detection method for steel-wire defects
in pre-stressed concrete cylinder pipes). Despite the many
methods available, Dingus et al. (2002) indicate that non-
As mentioned, electricity expenses occupy a substantial
portion of all costs incurred by water utilities to produce
and supply water, and most of the electricity expenses
(90%) correspond to pumping expenses for raw and treated
water (Bunn and Reynolds, 2009). Pumping facilities are
closely linked among components in them, which indicates
that some problems in one specific component may have
substantial influences on the efficiency of other pumps within
the same system. It is difficult to determine how to operate
pumps more efficiently since they are subject to a high level
of daily, seasonal variations. Accordingly, it is important
to determine optimal pump efficiency by measuring the
performance of each pump under various conditions or
scenarios. In general, it is possible to do so by performing a
simulation analysis based on a calibrated hydraulic model.
Pressure and flow per pump should be tracked real-time
in the process of such simulation, and an optimization
algorithm prediction technique can be used to select optimal
pump type through hydraulically analysing all states of flow
and pumps. This implies that, along with energy efficiency,
the performance of relevant infrastructure can be improved
with a hydraulic model and an energy prediction system.
Software programs such as InfoWater, KY Pipe, H2OMap
Water, HydrauliCAD, WaterCAD, Water-NET, Aquadvanced,
and others have been used to determine optimal pump
operation conditions with the combined use of hydraulic
modelling and energy optimization system.
destructive inspection technologies are applied to as few
as 10% of water mains in the USA. This limited usage results
from various causes, such as high expense, disruptiveness,
and insufficient track records for most relevant methods
and techniques. Thus, limited growth technologies in the
area of water pipelines may result from a small market scale,
difficult testing conditions, or a lack of understanding of, or
interests in, pipeline inspection requirements. However, it
is anticipated that the technological development of non-
destructive inspection methods will improve when linked
to practical sensors, sensor networks, communications, data
analysis, and computing.
Many decision support tools have been developed to
determine the priorities for investment, maintenance,
and replacement of pipelines. Table 4.4 shows the major
components of the five decision support models for pipe
renewal and their associated capabilities addressed by
Ammar et al. (2010). They evaluated the models according
to the functions: ability to process condition assessment
and defect data; contains an extensive method database;
performs a technical evaluation of the project conditions and
characteristics; performs a costs analysis; and performs a final
method ranking.
Table 4.4 Decision support models for pipe renewal
Models, year
Defectdata?
Extensivedatabase?
Technicalevaluation?
Costanalysis?
Methodranking?
M-PRAWDS, 2001 Yes No Yes Yes Yes
Debetal, 2002 No Yes Yes Yes Yes
CARE-W, 2005 Yes No Yes Yes No
Ammar et al. 2010 Yes Yes Yes Yes Yes
AWWA, 2001 No No Yes No No
4.2.2.5 Smart Control of Wastewater Treatment and Urban Drainage
There are widespread concerns over the condition and
functioning of ageing wastewater systems, many of which
have exceeded their design lives and are unable reliably and
adequately to deal with current conditions let alone future
needs. When systems lack capacity, the traditional solution
is to build more capacity; however, this can be expensive
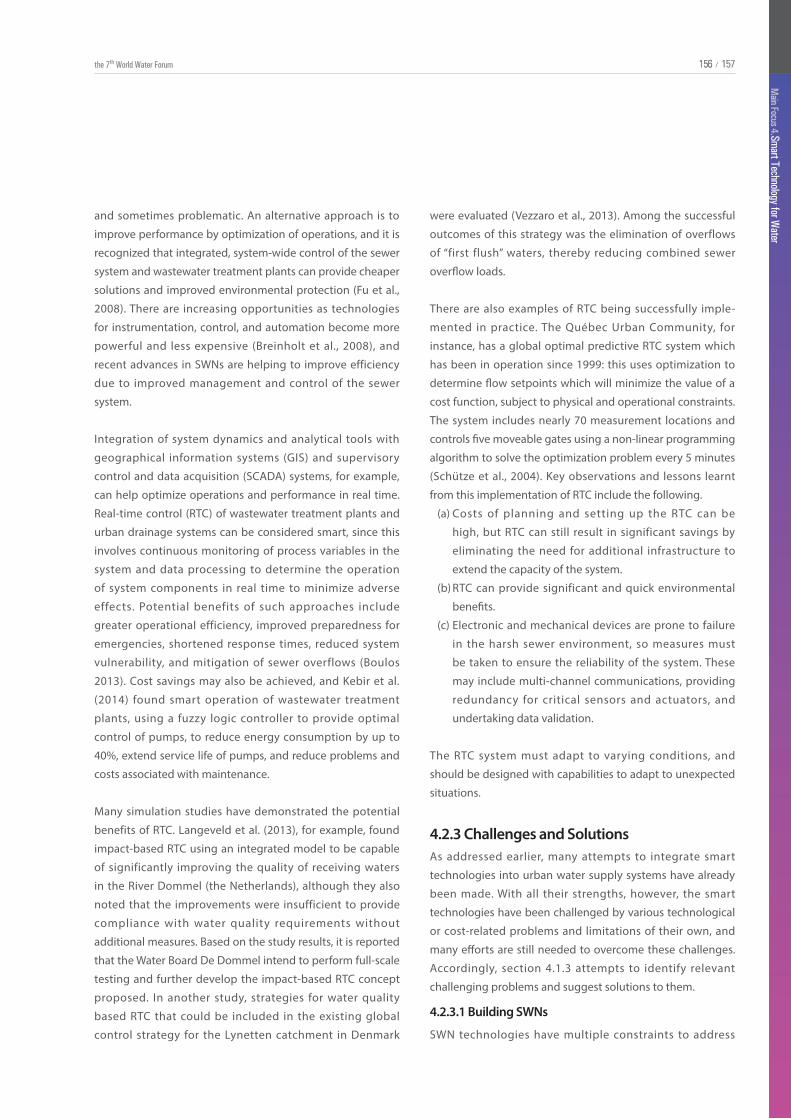
156
Main Focus 4. Smart Technology for W
ater
157156 /the 7th World Water Forum 156
Main Focus 4. Smart Technology for W
ater
157/
and sometimes problematic. An alternative approach is to
improve performance by optimization of operations, and it is
recognized that integrated, system-wide control of the sewer
system and wastewater treatment plants can provide cheaper
solutions and improved environmental protection (Fu et al.,
2008). There are increasing opportunities as technologies
for instrumentation, control, and automation become more
powerful and less expensive (Breinholt et al., 2008), and
recent advances in SWNs are helping to improve efficiency
due to improved management and control of the sewer
system.
Integration of system dynamics and analytical tools with
geographical information systems (GIS) and supervisory
control and data acquisition (SCADA) systems, for example,
can help optimize operations and performance in real time.
Real-time control (RTC) of wastewater treatment plants and
urban drainage systems can be considered smart, since this
involves continuous monitoring of process variables in the
system and data processing to determine the operation
of system components in real time to minimize adverse
effects. Potential benefits of such approaches include
greater operational efficiency, improved preparedness for
emergencies, shortened response times, reduced system
vulnerability, and mitigation of sewer overflows (Boulos
2013). Cost savings may also be achieved, and Kebir et al.
(2014) found smart operation of wastewater treatment
plants, using a fuzzy logic controller to provide optimal
control of pumps, to reduce energy consumption by up to
40%, extend service life of pumps, and reduce problems and
costs associated with maintenance.
Many simulation studies have demonstrated the potential
benefits of RTC. Langeveld et al. (2013), for example, found
impact-based RTC using an integrated model to be capable
of significantly improving the quality of receiving waters
in the River Dommel (the Netherlands), although they also
noted that the improvements were insufficient to provide
compliance with water quality requirements without
additional measures. Based on the study results, it is reported
that the Water Board De Dommel intend to perform full-scale
testing and further develop the impact-based RTC concept
proposed. In another study, strategies for water quality
based RTC that could be included in the existing global
control strategy for the Lynetten catchment in Denmark
were evaluated (Vezzaro et al., 2013). Among the successful
outcomes of this strategy was the elimination of overflows
of “first flush” waters, thereby reducing combined sewer
overflow loads.
There are also examples of RTC being successfully imple-
mented in practice. The Québec Urban Community, for
instance, has a global optimal predictive RTC system which
has been in operation since 1999: this uses optimization to
determine flow setpoints which will minimize the value of a
cost function, subject to physical and operational constraints.
The system includes nearly 70 measurement locations and
controls five moveable gates using a non-linear programming
algorithm to solve the optimization problem every 5 minutes
(Schütze et al., 2004). Key observations and lessons learnt
from this implementation of RTC include the following.
(a) Costs of planning and setting up the RTC can be
high, but RTC can still result in significant savings by
eliminating the need for additional infrastructure to
extend the capacity of the system.
(b) RTC can provide significant and quick environmental
benefits.
(c) Electronic and mechanical devices are prone to failure
in the harsh sewer environment, so measures must
be taken to ensure the reliability of the system. These
may include multi-channel communications, providing
redundancy for critical sensors and actuators, and
undertaking data validation.
The RTC system must adapt to varying conditions, and
should be designed with capabilities to adapt to unexpected
situations.
4.2.3 Challenges and SolutionsAs addressed earlier, many attempts to integrate smart
technologies into urban water supply systems have already
been made. With all their strengths, however, the smart
technologies have been challenged by various technological
or cost-related problems and limitations of their own, and
many efforts are still needed to overcome these challenges.
Accordingly, section 4.1.3 attempts to identify relevant
challenging problems and suggest solutions to them.
4.2.3.1 Building SWNs
SWN technologies have multiple constraints to address
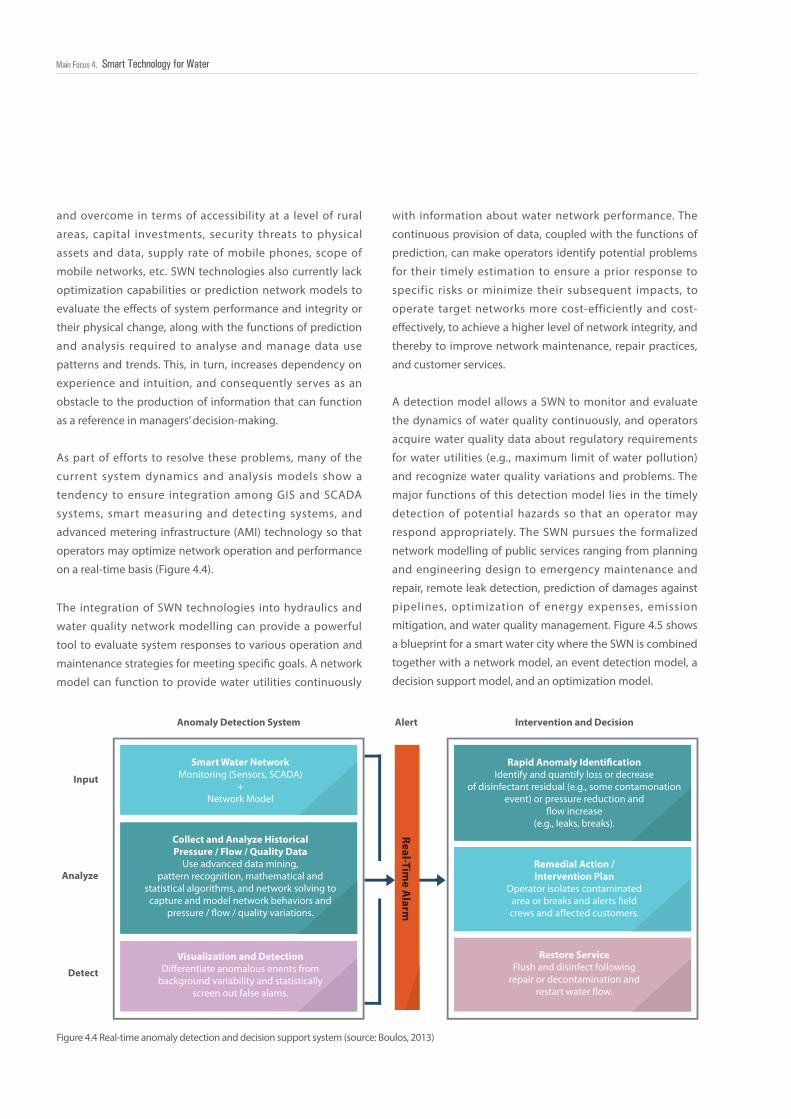
158158158Main Focus 4. Smart Technology for Water
Figure 4.4 Real-time anomaly detection and decision support system (source: Boulos, 2013)
The integration of SWN technologies into hydraulics and
water quality network modelling can provide a powerful
tool to evaluate system responses to various operation and
maintenance strategies for meeting specific goals. A network
model can function to provide water utilities continuously
Smart Water NetworkMonitoring (Sensors, SCADA)
+Network Model
Visualization and DetectionDi�erentiate anomalous enents from
background variability and statisticallyscreen out false alams.
Collect and Analyze HistoricalPressure / Flow / Quality Data
Use advanced data mining,pattern recognition, mathematical and
statistical algorithms, and network solving tocapture and model network behaviors and
pressure / �ow / quality variations.
Remedial Action /Intervention Plan
Operator isolates contaminatedarea or breaks and alerts �eldcrews and a�ected customers.
Restore ServiceFlush and disinfect following
repair or decontamination andrestart water �ow.
Rapid Anomaly Identi�cationIdentify and quantify loss or decrease
of disinfectant residual (e.g., some contamonationevent) or pressure reduction and
�ow increase(e.g., leaks, breaks).
Input
Anomaly Detection System Alert
Real-Time A
larm
Intervention and Decision
Analyze
Detect
and overcome in terms of accessibility at a level of rural
areas, capital investments, security threats to physical
assets and data, supply rate of mobile phones, scope of
mobile networks, etc. SWN technologies also currently lack
optimization capabilities or prediction network models to
evaluate the effects of system performance and integrity or
their physical change, along with the functions of prediction
and analysis required to analyse and manage data use
patterns and trends. This, in turn, increases dependency on
experience and intuition, and consequently serves as an
obstacle to the production of information that can function
as a reference in managers’ decision-making.
As part of efforts to resolve these problems, many of the
current system dynamics and analysis models show a
tendency to ensure integration among GIS and SCADA
systems, smart measuring and detecting systems, and
advanced metering infrastructure (AMI) technology so that
operators may optimize network operation and performance
on a real-time basis (Figure 4.4).
with information about water network performance. The
continuous provision of data, coupled with the functions of
prediction, can make operators identify potential problems
for their timely estimation to ensure a prior response to
specific risks or minimize their subsequent impacts, to
operate target networks more cost-efficiently and cost-
effectively, to achieve a higher level of network integrity, and
thereby to improve network maintenance, repair practices,
and customer services.
A detection model allows a SWN to monitor and evaluate
the dynamics of water quality continuously, and operators
acquire water quality data about regulatory requirements
for water utilities (e.g., maximum limit of water pollution)
and recognize water quality variations and problems. The
major functions of this detection model lies in the timely
detection of potential hazards so that an operator may
respond appropriately. The SWN pursues the formalized
network modelling of public services ranging from planning
and engineering design to emergency maintenance and
repair, remote leak detection, prediction of damages against
pipelines, optimization of energy expenses, emission
mitigation, and water quality management. Figure 4.5 shows
a blueprint for a smart water city where the SWN is combined
together with a network model, an event detection model, a
decision support model, and an optimization model.
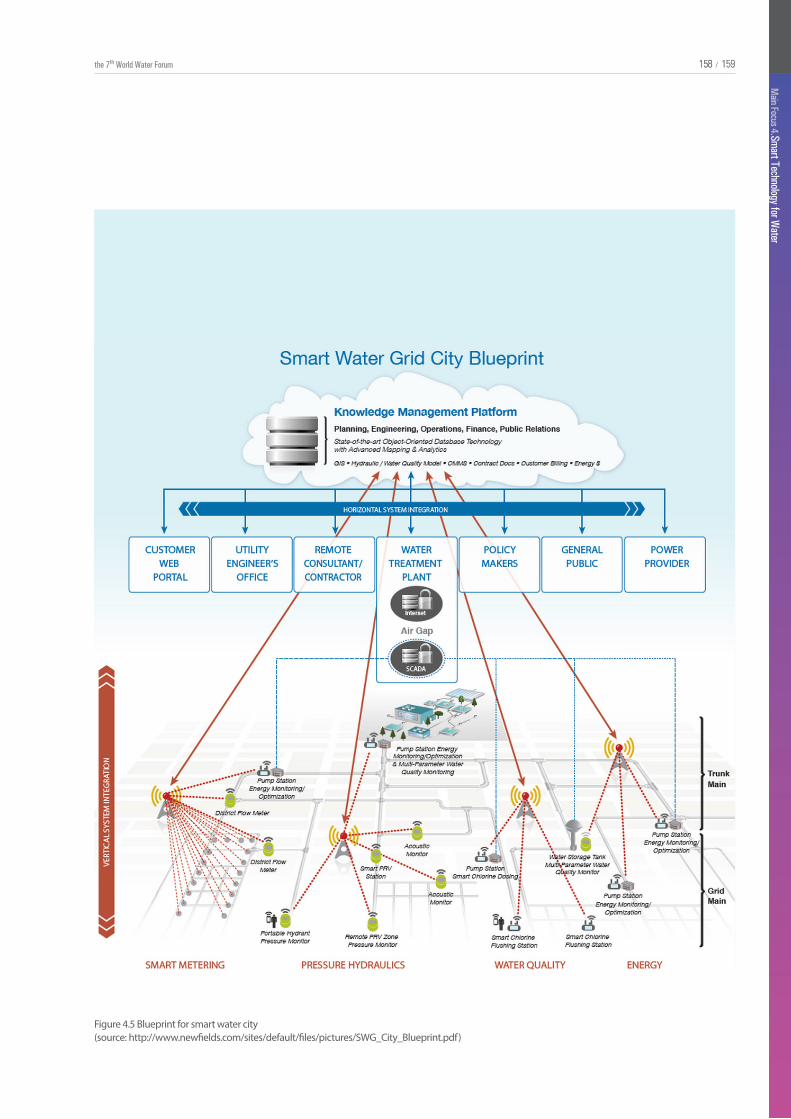
158
Main Focus 4. Smart Technology for W
ater
159158 /the 7th World Water Forum 158
Main Focus 4. Smart Technology for W
ater
159/
Figure 4.5 Blueprint for smart water city (source: http://www.newfields.com/sites/default/files/pictures/SWG_City_Blueprint.pdf)
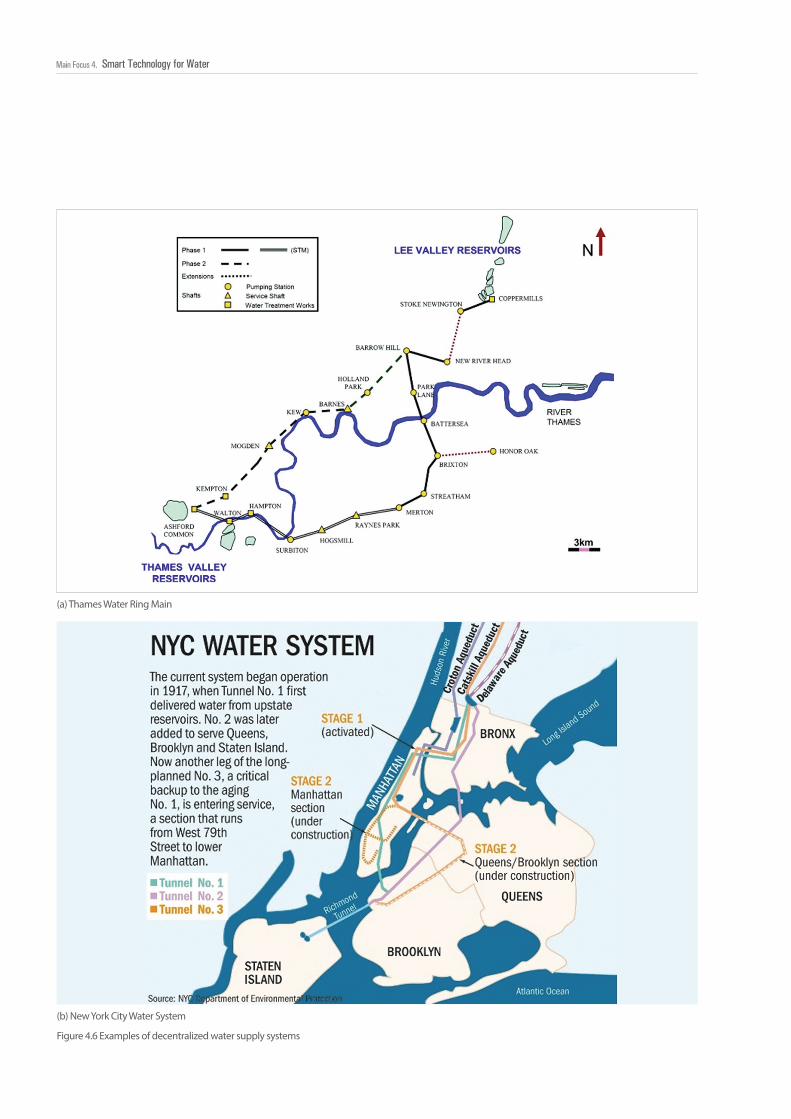
160160160Main Focus 4. Smart Technology for Water
(a) Thames Water Ring Main
Figure 4.6 Examples of decentralized water supply systems
(b) New York City Water System
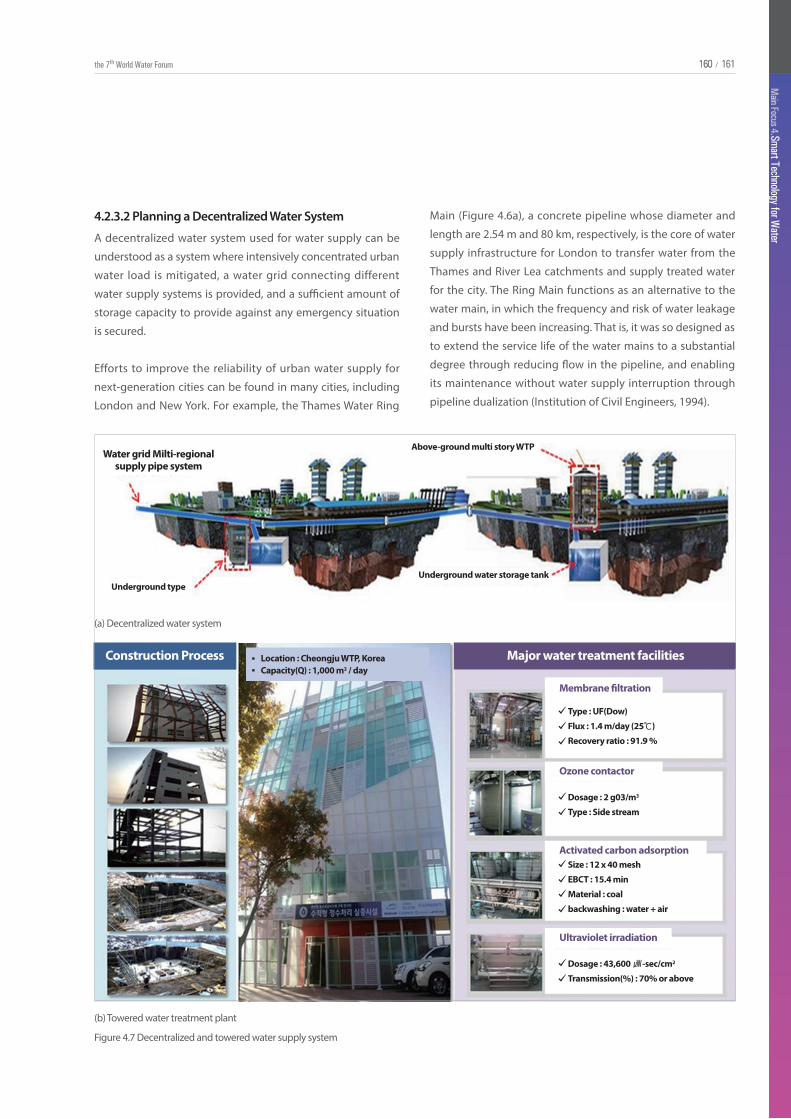
160
Main Focus 4. Smart Technology for W
ater
161160 /the 7th World Water Forum 160
Main Focus 4. Smart Technology for W
ater
161/
A decentralized water system used for water supply can be
understood as a system where intensively concentrated urban
water load is mitigated, a water grid connecting different
water supply systems is provided, and a sufficient amount of
storage capacity to provide against any emergency situation
is secured.
Efforts to improve the reliability of urban water supply for
next-generation cities can be found in many cities, including
London and New York. For example, the Thames Water Ring
4.2.3.2 Planning a Decentralized Water System Main (Figure 4.6a), a concrete pipeline whose diameter and
length are 2.54 m and 80 km, respectively, is the core of water
supply infrastructure for London to transfer water from the
Thames and River Lea catchments and supply treated water
for the city. The Ring Main functions as an alternative to the
water main, in which the frequency and risk of water leakage
and bursts have been increasing. That is, it was so designed as
to extend the service life of the water mains to a substantial
degree through reducing flow in the pipeline, and enabling
its maintenance without water supply interruption through
pipeline dualization (Institution of Civil Engineers, 1994).
(b) Towered water treatment plant
Figure 4.7 Decentralized and towered water supply system
Water grid Milti-regionalsupply pipe system
Underground type
Above-ground multi story WTP
Underground water storage tank
Construction Process Major water treatment facilitiesLocation : Cheongju WTP, KoreaCapacity(Q) : 1,000 m3 / day
Type : UF(Dow)
Flux : 1.4 m/day (25 )
Recovery ratio : 91.9 %
℃
Membrane �ltration
Dosage : 2 g03/m3
Type : Side stream
Ozone contactor
Dosage : 43,600 -sec/cm2
Transmission(%) : 70% or above
Ultraviolet irradiation
Size : 12 x 40 mesh
EBCT : 15.4 min
Material : coal
backwashing : water + air
Activated carbon adsorption
㎼
(a) Decentralized water system

162162162Main Focus 4. Smart Technology for Water
(h) the relationship between outcomes and costs
With the significant advance of capabilities to provide
information required for condition assessment, many
innovative, effective assessment technologies have been
developed. One example is fixed or portable hydrophones
for water leak detection, which are inserted into a target
pipeline and moved forwards or backwards by the pressure.
One of their strengths is that they can be used to detect even
very small water leaks. Another example is the broad-banded
electromagnetic (BEM) method to inspect iron-contained
pipelines. In this method, eddy current is induced in flow
most closely approaching a transmitter. One of the strengths
of this method is that it is possible to inspect the pipe body
without damaging its lining and coating. Other examples
include the magnetic flux leakage (MFL) method to inspect
the external condition of small- and medium-sized steel
pipelines, and the linear polarization resistance (LPR) method
in which a supersonic wave is used. Table 4.5, which is
summarized in tabular form from the description of Thomson
and Wang (2009), shows major condition assessment
technologies for water mains.
Thanks to a progress in sensor and electronic technologies
and information science, electrical and computer engineering
is giving birth to new high-tech assessment technologies
applicable to the condition assessment of buried water
supply pipes. Also, the development of sensor networks
and multi-sensor technologies has enabled the real-time
acquisition and monitoring of data about the state of the
water supply pipes. Recently developed sensor technologies
include corrosion sensors, sensor networks, magnetic strain
sensors, flexible ultrasonic transducers, damage sensors,
microwave back scattering sensors, optimal fiber sensors
for corrosion monitoring, optimal fiber acoustic monitoring
networks, wireless sensor networks for pipe monitoring,
multi-sensors, smart pipelines, etc. More details of emerging
sensor technologies and sensor networks can be found in Liu
et al. (2012)
Although smart water infrastructure may be the future of
urban water systems, its implementation is a considerable
challenge. Still, its strengths and potential have sufficiently
been demonstrated, and its technological development
4.2.4 Recommendations
4.2.3.3 Assessing Water Infrastructure
According to the technical review of Thomson and Wang
(2009), current barriers to the condition assessment of water-
related infrastructure are related to:
(a) database quality
(b) regional variations
(c) inspection data requirements
(d) current condition assessment methodologies
(e) current inspection technologies
(f ) physical difficulty and cost of inspection
(g) gap between required information and present
inspection techniques and
Another example is the New York City Water System (Figure
4.6b), which is one of the largest water supply systems in the
world. This system was designed to meet its routine water
demands in harmony with relevant tunnels, channels, and
reservoirs in the city. One of strengths in this system is that
95% of total water supply comes from gravity flow, but its
remaining 5% used to increase when reservoirs comes to stay
below their ordinary level in the dry seasons (Galusha, 1999).
In Korea, for example, studies are ongoing to meet end
users’ various needs for water consumption through
securing storage capacity, which is among the strengths of
the conventional decentralized water supply system, and
installing a towered water treatment plant near end users
(K-water, 2014). Aiming at building a water supply system
to improve the qualitative, quantitative reliability of water
supply and developing core element technologies and
demonstrative test facilities to save energy requirement for
producing and supplying water, this study has the following
goals.
(a) To improve the rate of drinking water supply through
securing the reliability of water quality
(b) To secure emergency water and improve water security
to reduce water supply incidents to a zero degree
(c) To develop engineering design techniques for towered
and decentralized WTPs with 20,000–30,000 m3/day in
installed capacity
(d) To secure technologies for the water quality incident
and disaster system And
(e) To develop new and renewable energy technologies
for increasing the efficiency of consumed energy in the
water supply system to at least 30% (Figure 4.7)
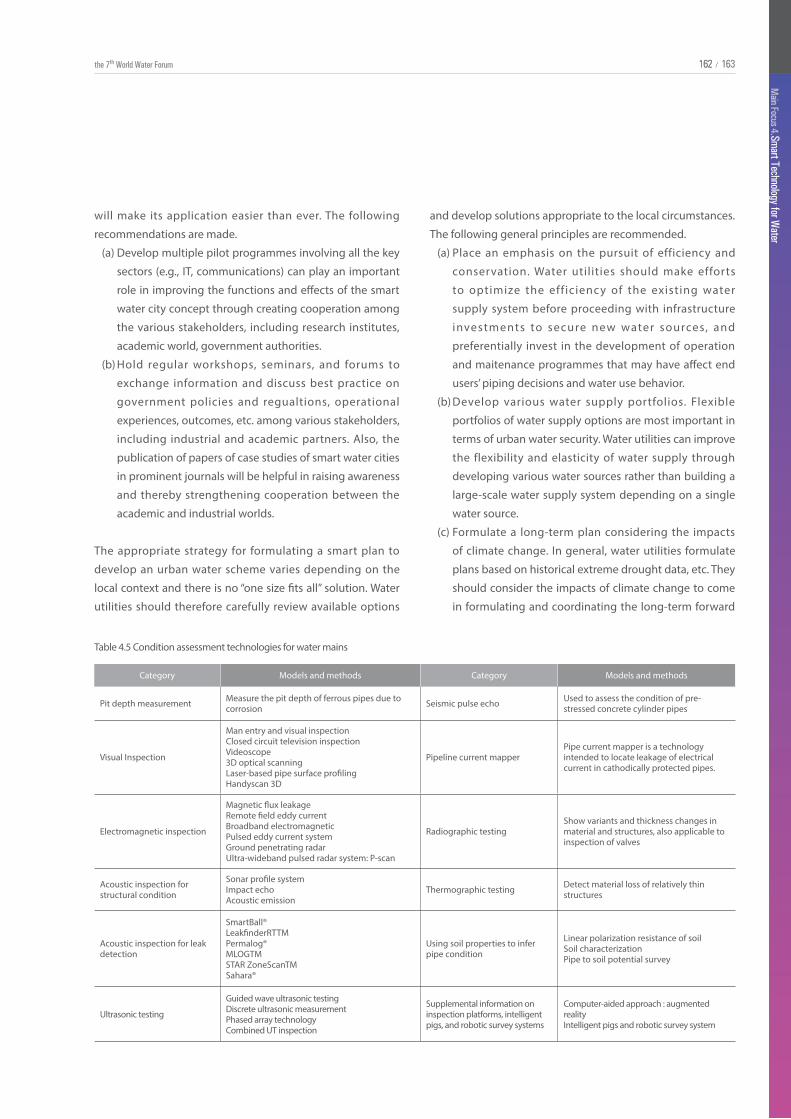
162
Main Focus 4. Smart Technology for W
ater
163162 /the 7th World Water Forum 162
Main Focus 4. Smart Technology for W
ater
163/
Category Models and methods Category Models and methods
Pit depth measurement Measure the pit depth of ferrous pipes due to corrosion Seismic pulse echo Used to assess the condition of pre-
stressed concrete cylinder pipes
Visual Inspection
Man entry and visual inspectionClosed circuit television inspectionVideoscope3D optical scanningLaser-based pipe surface profilingHandyscan 3D
Pipeline current mapperPipe current mapper is a technology intended to locate leakage of electrical current in cathodically protected pipes.
Electromagnetic inspection
Magnetic flux leakageRemote field eddy currentBroadband electromagneticPulsed eddy current systemGround penetrating radarUltra-wideband pulsed radar system: P-scan
Radiographic testingShow variants and thickness changes in material and structures, also applicable to inspection of valves
Acoustic inspection for structural condition
Sonar profile systemImpact echoAcoustic emission
Thermographic testing Detect material loss of relatively thin structures
Acoustic inspection for leak detection
SmartBall®LeakfinderRTTMPermalog®MLOGTMSTAR ZoneScanTMSahara®
Using soil properties to infer pipe condition
Linear polarization resistance of soilSoil characterizationPipe to soil potential survey
Ultrasonic testing
Guided wave ultrasonic testingDiscrete ultrasonic measurementPhased array technologyCombined UT inspection
Supplemental information on inspection platforms, intelligent pigs, and robotic survey systems
Computer-aided approach : augmented realityIntelligent pigs and robotic survey system
Table 4.5 Condition assessment technologies for water mains
will make its application easier than ever. The following
recommendations are made.
(a) Develop multiple pilot programmes involving all the key
sectors (e.g., IT, communications) can play an important
role in improving the functions and effects of the smart
water city concept through creating cooperation among
the various stakeholders, including research institutes,
academic world, government authorities.
(b) Hold regular workshops, seminars, and forums to
exchange information and discuss best practice on
government policies and regualtions, operational
experiences, outcomes, etc. among various stakeholders,
including industrial and academic partners. Also, the
publication of papers of case studies of smart water cities
in prominent journals will be helpful in raising awareness
and thereby strengthening cooperation between the
academic and industrial worlds.
The appropriate strategy for formulating a smart plan to
develop an urban water scheme varies depending on the
local context and there is no “one size fits all” solution. Water
utilities should therefore carefully review available options
and develop solutions appropriate to the local circumstances.
The following general principles are recommended.
(a) Place an emphasis on the pursuit of efficiency and
conservation. Water utilities should make efforts
to optimize the efficiency of the existing water
supply system before proceeding with infrastructure
investments to secure new water sources, and
preferentially invest in the development of operation
and maitenance programmes that may have affect end
users’ piping decisions and water use behavior.
(b) Develop various water supply portfolios. Flexible
portfolios of water supply options are most important in
terms of urban water security. Water utilities can improve
the flexibility and elasticity of water supply through
developing various water sources rather than building a
large-scale water supply system depending on a single
water source.
(c) Formulate a long-term plan considering the impacts
of climate change. In general, water utilities formulate
plans based on historical extreme drought data, etc. They
should consider the impacts of climate change to come
in formulating and coordinating the long-term forward
164164164Main Focus 4. Smart Technology for Water
4.3 RIVER BASIN MANAGEMENT 4.3.2 Smart IWRM4.3.2.1 Data Acquisition and Processing4.3.1 River Basin Management and Smart
TechnologyIntegrated water resource management (IWRM) is a process
to ensure the most efficient use and conservation of limited
water resources while meeting various requirements of
water uses. Hence, IWRM will have different objectives and
approaches depending on relevant factors, including water
quantity and quality or other water-related issues faced by
a country or a river basin, reliability of relevant institutions,
relative superiority between the public and private sectors
and their respective characteristics, and cultural background
(Global Water Partnership, 2000). Smart technology has an
important and developing role to play in IWRM. Several
opportunities present themselves.
(a) Smart technology enables the systematic management
of basin-wide water managment information and data
that are currently independently collected for different
purposes (e.g., reliable water demand and supply,
disaster prevention, water quality management). This
can be used to support diverse stakeholder needs and
address potential conflicts.
(b) Comprehensive, accurate basin-wide data make it
possible to identify vulnerabilities present somewhere in
the water cycle system, and thereby stabilize the water
cycle and manage a river basin in an integrated manner
in which such factors as water quantity, quality, and
ecosystem are considered.
(c) Smart technology (e.g., intelligent sensors, wireless
communications, code-division multiple access (CDMA),
satellite images) can be employed to maximize the
efficiency of water use and manage water resources
considering such complex factors as water quantity
and quality, sediment and flooding, contributing to the
efficient use of limited water resources.
(d) Rapidly available and highly accurate data enables
the equitable distribution of available water and the
minimization of geographical discrepancies in water
supply through ensuring interbasin river diversion and
distributing water supply among different hydraulic
structures in an appropriate way.
Further detail of the application of smart technology is given
in IWRM is given section 4.3.2.
Variations in hydrological conditions due to the impacts
of global warming and climate change have made it even
more difficult to have IWRM in place. One of the most
important countermeasures is to acquire high-quality data
on hydrological conditions continuously to understand and
support the management of floods and drought events, and
efficiently manage water resources as a whole. A system to
monitor, acquire, and process data on water level, rainfall, and
water quality on a real-time basis can help support rapid and
effective decisions. Data acquisition and processing systems
have evolved from conventional PC- or UNIX-based data
monitoring systems into real-time data processing systems
based on client/server networks. These systems have been
becoming more sophisticated to acquire more reliable data
on hydrological conditions and to manage the data more
efficiently by taking advantage of relational databases or
web-based systems. The features of a smart data processing
system are the following.
(a) Real-time data processing system with client/server
network.
(b) Communication network configured with dual-network
satellite, VHF, CDMA, etc.
plans, thereby ensuring the sustainability of water supply
services.
(d) Make investments in the development of provincial
water sources. Next-generation urban water supply
systems should aim to target local water sources under
the control of local communities. Also, water utilities
should try to ensure the balanced distribution of water
demand for providing against possible water shortage,
so that they may reliably supply not only municipal
water for service areas, but also municipal and industrial
water and instream flow for other cities beyond the
service areas.
(e) Have interests in decentralized water supply systems. The
integration of the decentralized and multi-regional water
supply systems provides new opportunities to improvef
urban water security and quality. Decentralized supply
opens up the possibility to supply water differentially,
depending on water uses, spatial scale, and serviced
population.
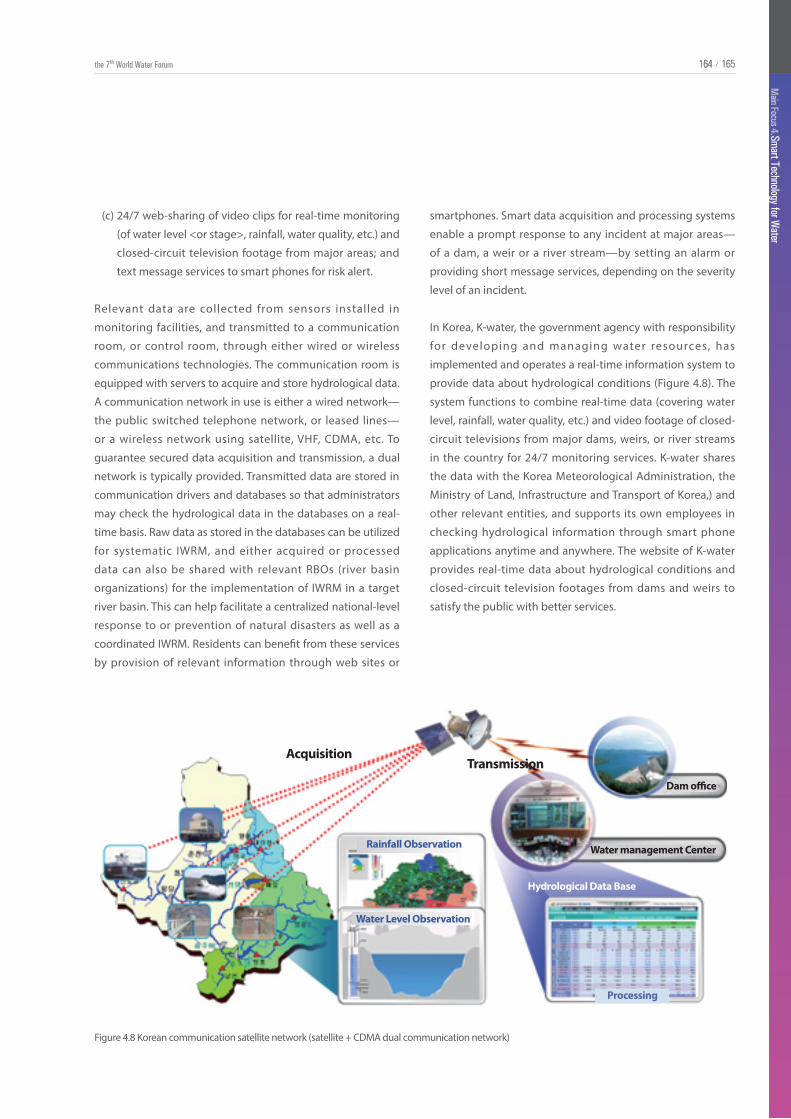
164
Main Focus 4. Smart Technology for W
ater
165164 /the 7th World Water Forum 164
Main Focus 4. Smart Technology for W
ater
165/
Figure 4.8 Korean communication satellite network (satellite + CDMA dual communication network)
AcquisitionTransmission
Dam o�ce
Water management Center
Hydrological Data Base
Processing
Rainfall Observation
Water Level Observation
(c) 24/7 web-sharing of video clips for real-time monitoring
(of water level <or stage>, rainfall, water quality, etc.) and
closed-circuit television footage from major areas; and
text message services to smart phones for risk alert.
Relevant data are collected from sensors installed in
monitoring facilities, and transmitted to a communication
room, or control room, through either wired or wireless
communications technologies. The communication room is
equipped with servers to acquire and store hydrological data.
A communication network in use is either a wired network—
the public switched telephone network, or leased lines—
or a wireless network using satellite, VHF, CDMA, etc. To
guarantee secured data acquisition and transmission, a dual
network is typically provided. Transmitted data are stored in
communication drivers and databases so that administrators
may check the hydrological data in the databases on a real-
time basis. Raw data as stored in the databases can be utilized
for systematic IWRM, and either acquired or processed
data can also be shared with relevant RBOs (river basin
organizations) for the implementation of IWRM in a target
river basin. This can help facilitate a centralized national-level
response to or prevention of natural disasters as well as a
coordinated IWRM. Residents can benefit from these services
by provision of relevant information through web sites or
smartphones. Smart data acquisition and processing systems
enable a prompt response to any incident at major areas—
of a dam, a weir or a river stream—by setting an alarm or
providing short message services, depending on the severity
level of an incident.
In Korea, K-water, the government agency with responsibility
for developing and managing water resources, has
implemented and operates a real-time information system to
provide data about hydrological conditions (Figure 4.8). The
system functions to combine real-time data (covering water
level, rainfall, water quality, etc.) and video footage of closed-
circuit televisions from major dams, weirs, or river streams
in the country for 24/7 monitoring services. K-water shares
the data with the Korea Meteorological Administration, the
Ministry of Land, Infrastructure and Transport of Korea,) and
other relevant entities, and supports its own employees in
checking hydrological information through smart phone
applications anytime and anywhere. The website of K-water
provides real-time data about hydrological conditions and
closed-circuit television footages from dams and weirs to
satisfy the public with better services.
166166166Main Focus 4. Smart Technology for Water
The successful planning and integrated management of
water resources depends on the efficient use of mid- and
long-term meteorological forecasts, including observed
meteorological data. Smart technologies play an important
part in generating and utilizing accurate meteorological
and hydrological data and coupling them together to
proactively predict and respond to water-related disasters
and meteorological hazards. More specifically, the key roles
for smart technologies include supporting:
(a) collection and acquisition of meteorological data
inc luding the shar ing of data among re levant
organizations;
(b) the management of data quality;
(c) a reliable analysis and forecasting system;
(d) a decision support system that combines all the above
elements including wider datasets.
Satellites and the data they produce currently do play and
will increasingly play an important role. The use of video
footages from satellites, which can be acquired periodically
and repetitively, enables the fast observation of wide-
ranging regions. Satellite video data are particularly useful in
analysing large-scale flood or drought damage occurring over
a wide area. In Korea, for example, extensive use has been
made of the Chullian satellite for precipitation prediction,
their Satellites-2 and -3 to collect data covering the Korean
peninsula, and more recently Satellite-5 to monitor flood-
affected areas without the interference of cloud by utilizing
X-band synthetic aperture radar (SAR) videos.
Radar is also widely used for for weather forecasting and
increasingly as a tool to forecast flood conditions. It can
be utilized to assess the risk level of possible water-related
disasters and other natural disasters in advance, take mid- and
long-term countermeasures against such natural disasters
(e.g., master plan to mitigate flood damages, purchase
of disaster insurance), and design investment projects to
develop hydraulic structures. If the concept of potential flood
damages consisting of potential factors (e.g., hydrological,
social, and economic factors) risk factors is applied, it would
be possible to understand the water control characteristics of
each mid- and large-scale zoned area, prioritize investment
projects, and identify the level of natural disaster hazards in
advance.
4.3.2.2 Linking Hydrological and Meteorological Data An example of how meterological data from various sources
can be combined and used is K-water ’s Precipitation
Prediction Model (K-PPM), which was developed to make
an objective, precise forecast of precipitation in target dam
watersheds. A supercomputer with a capacity of 400 central
processing units and 100 terabytes was introduced and
dedicated to meteorological forecasts to provide customized
5-day-per-week forecasts for better water resource
management in 30 dams, 16 weirs in the four major rivers,
and 58 different watersheds around the country. K-PPM was
designed to provide a high resolution of 3 km grid spacing.
To enhance accuracy, an “ensemble method” was introduced
to use ten different models in combination to minimize dam
operation risks attendant with inevitable uncertainties (Figure
4.9).
Telemetering and control systems are widely used in water
resources management for remote monitoing and control
of, for example, hydraulic structures. A system is typically
configured with communication lines to connect equipment
to equipment so that a central control unit (i.e., master) may
communicate with a remote unit (i.e., slave). Communication
lines can be subdivided into web-based line type, leased
line type, private leased circuit (PLC) line type, wireless
communication type, and satellite communication type. With
this type of system, it is possible to monitor remotely any
unauthorized access to onsite facilities or their operational
status. The system can turn generators on or off during the
night-time when there are no staff on duty or when it is not
possible to have access to generators because of natural
disaster. The system also enables the acquisition of basic
data to inspect or check remotely for any failure or response
without the need for onsite visits, thus ensuring more reliable
operation and maintenance.
Newer developments include synchronization through a
smartphone application allowing the monitoring of onsite
facilities anytime and anywhere; and operations staff in
charge can monitor onsite facilities without any contact
from a field staff member on duty, which, in turn, will reduce
human error and enable prompt, effective responses in
any emergency situation. Water gates, when controlled in
the field, often require frequent manipulations to ensure
accurate discharge. With the telemetering and control
4.3.2.3 Telemetering and Control Systems
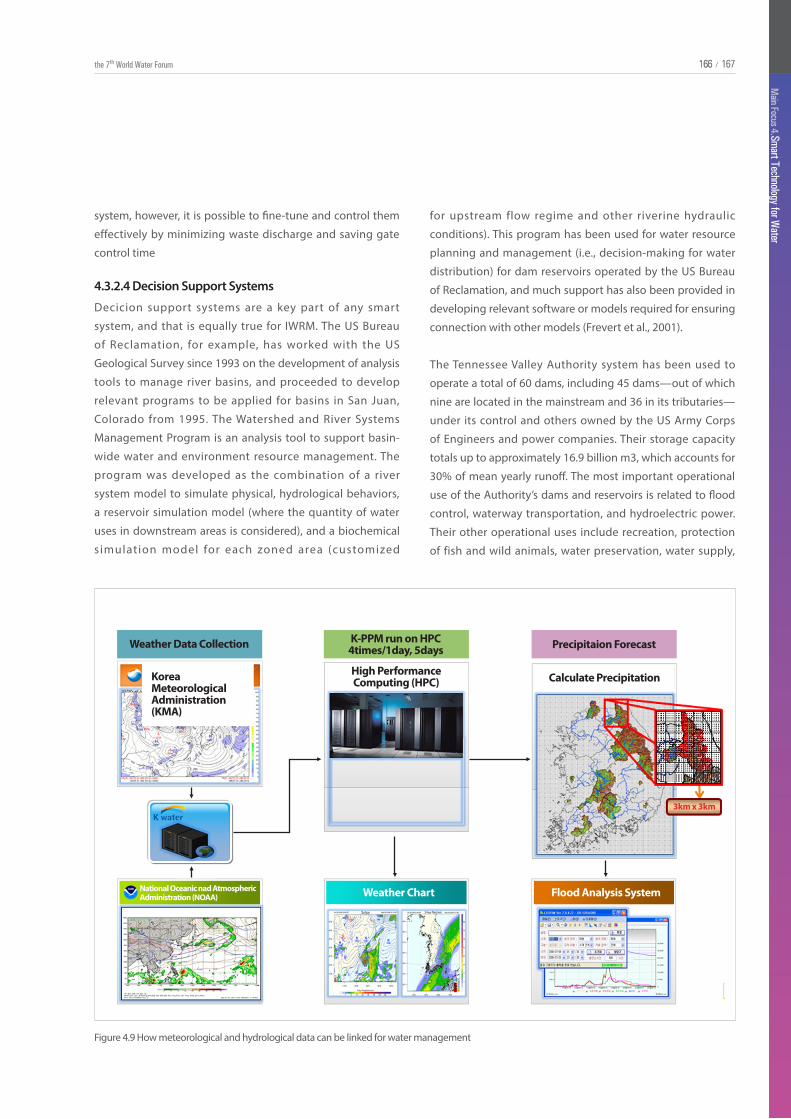
166
Main Focus 4. Smart Technology for W
ater
167166 /the 7th World Water Forum 166
Main Focus 4. Smart Technology for W
ater
167/
Decicion support systems are a key part of any smart
system, and that is equally true for IWRM. The US Bureau
of Reclamation, for example, has worked with the US
Geological Survey since 1993 on the development of analysis
tools to manage river basins, and proceeded to develop
relevant programs to be applied for basins in San Juan,
Colorado from 1995. The Watershed and River Systems
Management Program is an analysis tool to support basin-
wide water and environment resource management. The
program was developed as the combination of a river
system model to simulate physical, hydrological behaviors,
a reservoir simulation model (where the quantity of water
uses in downstream areas is considered), and a biochemical
s imulation model for each zoned area (customized
KoreaMeteorologicalAdministration(KMA)
Calculate Precipitation
3km x 3km
Flood Analysis SystemWeather ChartNational Oceanic nad AtmosphericAdministration (NOAA)
High PerformanceComputing (HPC)
Weather Data Collection K-PPM run on HPC4times/1day, 5days Precipitaion Forecast
Figure 4.9 How meteorological and hydrological data can be linked for water management
4.3.2.4 Decision Support Systems
system, however, it is possible to fine-tune and control them
effectively by minimizing waste discharge and saving gate
control time
for upstream flow regime and other riverine hydraulic
conditions). This program has been used for water resource
planning and management (i.e., decision-making for water
distribution) for dam reservoirs operated by the US Bureau
of Reclamation, and much support has also been provided in
developing relevant software or models required for ensuring
connection with other models (Frevert et al., 2001).
The Tennessee Valley Authority system has been used to
operate a total of 60 dams, including 45 dams—out of which
nine are located in the mainstream and 36 in its tributaries—
under its control and others owned by the US Army Corps
of Engineers and power companies. Their storage capacity
totals up to approximately 16.9 billion m3, which accounts for
30% of mean yearly runoff. The most important operational
use of the Authority’s dams and reservoirs is related to flood
control, waterway transportation, and hydroelectric power.
Their other operational uses include recreation, protection
of fish and wild animals, water preservation, water supply,
168168168Main Focus 4. Smart Technology for Water
In this section, one specific area of challenge is used as an
example. The particular challenge is that of controlling and
managing flood disasters. The specific context is that of how
Korean municipal governments can be helped to enhance
their capabilities in an integrated and effective manner aided
by smart technologies. The particular need is that over 98%
of all flood damage in Korea originates in provincial or small-
scale rivers.
The mitigation of this flood damage requires the integrated
collection and analysis of hydrological data (covering rainfall,
4.3.3 Challenges and SolutionsAs we have seen, IWRM is an approach to maximize the
benefits of water management in which not only factors
interconnected under each of the same categories (e.g.,
hydraulics, hydrology, water quality and ecosystem;
re lat ionships bet ween upstream and downstream
stakeholders; water managers and consumers; and laws
and regulations, institutions and governance) but also
connectivity among different categories are considered. To
this end, there is a need to ensure that water information
can be readily shared, ideally at a national level, probably
requiring reforming governance. Technical development is
4.3.4 Recommendations
and containment of insect breeding subject to water level
(or stage) conditions. The Tennessee Valley Authority system
consists of WaterView, RiverWare, and Terra, all of which are
interconnected. WaterView is a SCADA system for water
management, and RiverWare is a decision support model to
ensure the better operation of target reservoirs and rivers.
Terra plays a role as a water management web portal to share
water management information via the Intranet (Zagona,
2013).
Waterware is the product of the EUREKA European Union 487
Project, which had been implemented for 5 years from 1992
jointly by experts from the UK, Italy, Ireland, and Austria. It
was so designed as to support a combination of GIS, database
technologies, modelling techniques, optimization techniques,
and expert systems. With Waterware, modelling techniques
such as simulation models are used to predict the results of
various alternative analyses, and intelligent techniques such
as the combination of optimization techniques and expert
systems help select an optimal alternative (ESS GmbH, 2015).
In Korea, K-water’s Hydro Intelligent Toolkit (K-HIT) has
been operated on a real-time basis. This IWRM system
accommodates a wide range of water management
technologies to provide rainfall forecasts and real-time
hydrological data, facilitate decision-making for flood
control and water supply and enable the remote control
of hydroelectric power plants. This system platform also
provides guidelines to identify nationwide water status on
a real-time basis and make relevant decisions, and integrate
functions into which flood control, reliable water supply,
water quality and dam management are embodied.
water level, dam discharge, etc.) from many relevant river
basin organizations and municipal governments connected
together along the relevant river system, which should be
followed by timely decision-making. In most cases, however,
the municipal governments have difficulty in managing rivers
and basins under their respective jurisdictions for various
reasons such as the absence of reliable data transmission
systems to ensure the sharing of hydrological data, a lack
of trained personnel involved in disaster prevention, and
ageing hydraulic structures. There are also frequent conflicts
between municipal governments or residents in upstream
and downstream areas over water supply and the causes
of the flood damage related to the operation of hydraulic
structures at issue.
A particular issue in this case is that each river basin
organization and/or municipal government has its own
independent data transmission system, making it difficult
to share data among themselves on a real-time basis. Thus
an approach is needed to standardize their different data
transmission systems. The SmartTM program has been
developed as a standardized real-time water management
data sharing system with which it is now possible to acquire
data, which, in turn, are stored in a database and analysed
on a single platform with no separate communications
drive. The system can function to analyse and monitor on a
real-time basis expected rainfall or maximum water level in
downstream areas after dam discharge. This will also make
possible more cost-efficient and cost-effectively responses to
flood disasters by minimizing evaluation and response times,
thus minimizing flood disruption, property damage, and loss
of life.
168
Main Focus 4. Smart Technology for W
ater
169168 /the 7th World Water Forum 168
Main Focus 4. Smart Technology for W
ater
169/
4.4 DESIGN AND IMPLEMENTATION OF A SMART WATER GRID
4.4.1 Technology Development OverviewA smart water grid (SWG) is a next-generation water mana-
gement system that manages real-time data from water
resources and supply/sewerage systems using state-of-
the-art ICT. Although the concept of smart grids is well
established in the energy sector, they are less mature and
still needed to sort, analyse, and provide optimal data specific
to water management delivered by real-time monitoring
technologies and big data produced by various institutions.
A standardized water management (data) platform should be
developed to generate, process, provide, and share big data
for practical applications, especially where stakeholders are
involved in different areas and fields of water management.
This would make it possible to more methodologically collect
and understand data coming from the entire water cycle, and
thereby make an optimal decision about water management
in terms of time and cost. Each player participating in water
management typically already has their own system to
monitor, acquire, and provide those data, so this leads to the
need to develop an information system that can function
to integrate databases from these individual systems into
a single one. Further, to do this requires tehnologies to be
developed to enable the production and acquisition of
reliable and standardized data across the entire water cycle,
which encompass hydraulics and hydrology, water quality,
and ecosystems.
The challenge of climate change is calling for a new approach
to water management. As part of preventive initiatives, smart
technologies should be developed to utilize limited water
resources efficiently and to respond to hydrological variations
or disasters proactively and flexibly, thereby maximizing
people’s water welfare. To this end, the development of
monitoring and prediction technologies to understand
the entire water cycle system more methodologically, and
technologies to minimize uncertainties inherent in nature,
should be pursued. This, in turn, should be backed up by
building research and development infrastructure so that
fundamental knowledge and new technologies may be
developed and applied.
have only recently started to gain popularity in the field of
water management (Mencarelli et al., 2012). The ultimate
purpose is to minimize water consumption, ensure high
water quality, provide consistent operation of the system, and
maintain and operate the system as efficiently as possible,
using an increased level of intelligence and enhanced
integration of information, sensors, communication, and
control technologies throughout the entire system (Olsson,
2011).
The potential benefits are numerous, and can include
i m p r o v e d r e g u l a t o r y c o m p l i a n c e a n d e n h a n c e d
contamination warning (Thompson and Kadiyala, 2014).
Components of an SWG include the following (Hill and
Symmonds, 2013):
(a) AMI;
(b) customer information systems;
(c) SCADA systems;
(d) computerized maintenance management systems;
(e) GIS;
(f ) analytics engines.
Systemized and intelligent systems are implemented in areas
including water resource management, water production
and delivery, as well as the processing and recycling of
used water. Targets and scopes of technologies range from
interactive water use management at a household level to
national management of water resources (Figure 4.10). In
addition, the SWG concept embodies a wide range of topics,
including the following:
(a) efficiency improvement;
(b) cost and energy saving for water production and
processing;
(c) utilization of multiple water qualities;
(d) systematic and preventive facility management;
(e) water resource management;
(f ) solution of regional imbalance and achievement of water
security.
The industrial development and application of SWGs in
the USA has been led by IBM but water companies such as
Siemens and Suez have growing interest in the field. IBM is
promoting SWG as part of its “Smarter Planet” campaign,
which consists of three SWG characteristics: instrumented,
interconnected, and intelligent. SWG in the USA typically
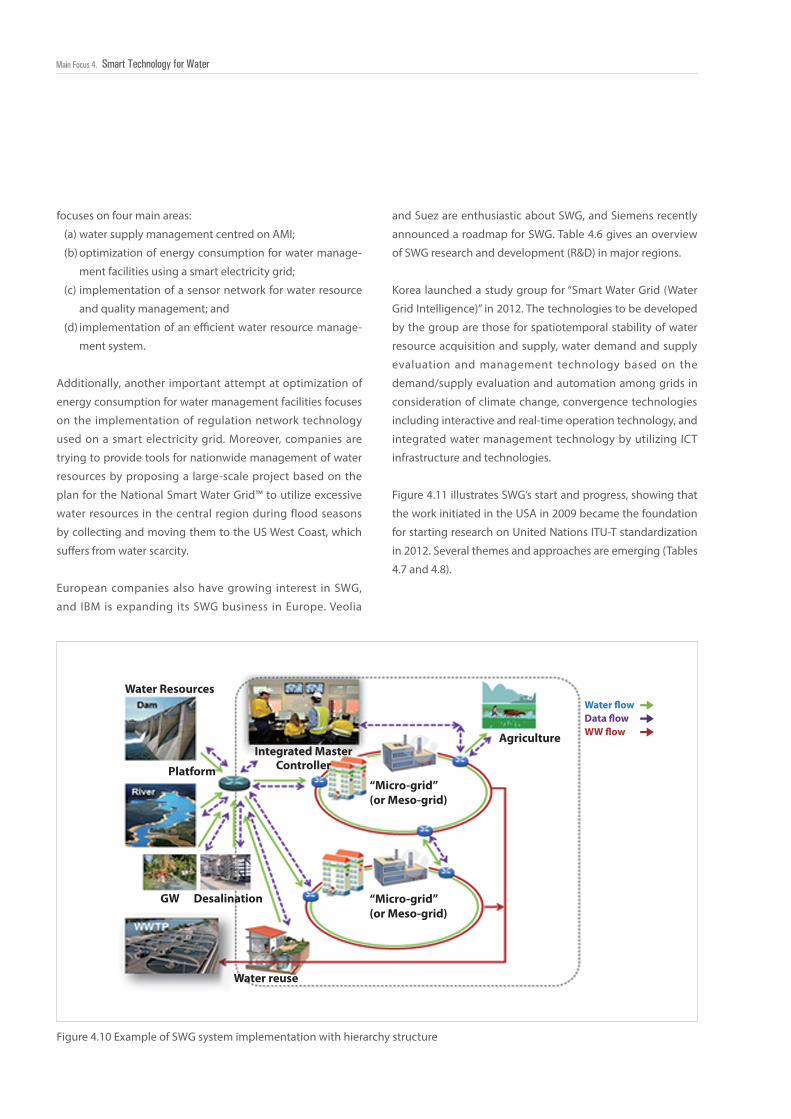
170170170Main Focus 4. Smart Technology for Water
Figure 4.10 Example of SWG system implementation with hierarchy structure
Water Resources
Platform
GW Desalination
Water reuse
Integrated MasterController
Agriculture
Water �owData �owWW �ow
“Micro-grid”(or Meso-grid)
“Micro-grid”(or Meso-grid)
focuses on four main areas:
(a) water supply management centred on AMI;
(b) optimization of energy consumption for water manage-
ment facilities using a smart electricity grid;
(c) implementation of a sensor network for water resource
and quality management; and
(d) implementation of an efficient water resource manage-
ment system.
Additionally, another important attempt at optimization of
energy consumption for water management facilities focuses
on the implementation of regulation network technology
used on a smart electricity grid. Moreover, companies are
trying to provide tools for nationwide management of water
resources by proposing a large-scale project based on the
plan for the National Smart Water Grid™ to utilize excessive
water resources in the central region during flood seasons
by collecting and moving them to the US West Coast, which
suffers from water scarcity.
European companies also have growing interest in SWG,
and IBM is expanding its SWG business in Europe. Veolia
and Suez are enthusiastic about SWG, and Siemens recently
announced a roadmap for SWG. Table 4.6 gives an overview
of SWG research and development (R&D) in major regions.
Korea launched a study group for “Smart Water Grid (Water
Grid Intelligence)” in 2012. The technologies to be developed
by the group are those for spatiotemporal stability of water
resource acquisition and supply, water demand and supply
evaluation and management technology based on the
demand/supply evaluation and automation among grids in
consideration of climate change, convergence technologies
including interactive and real-time operation technology, and
integrated water management technology by utilizing ICT
infrastructure and technologies.
Figure 4.11 illustrates SWG’s start and progress, showing that
the work initiated in the USA in 2009 became the foundation
for starting research on United Nations ITU-T standardization
in 2012. Several themes and approaches are emerging (Tables
4.7 and 4.8).
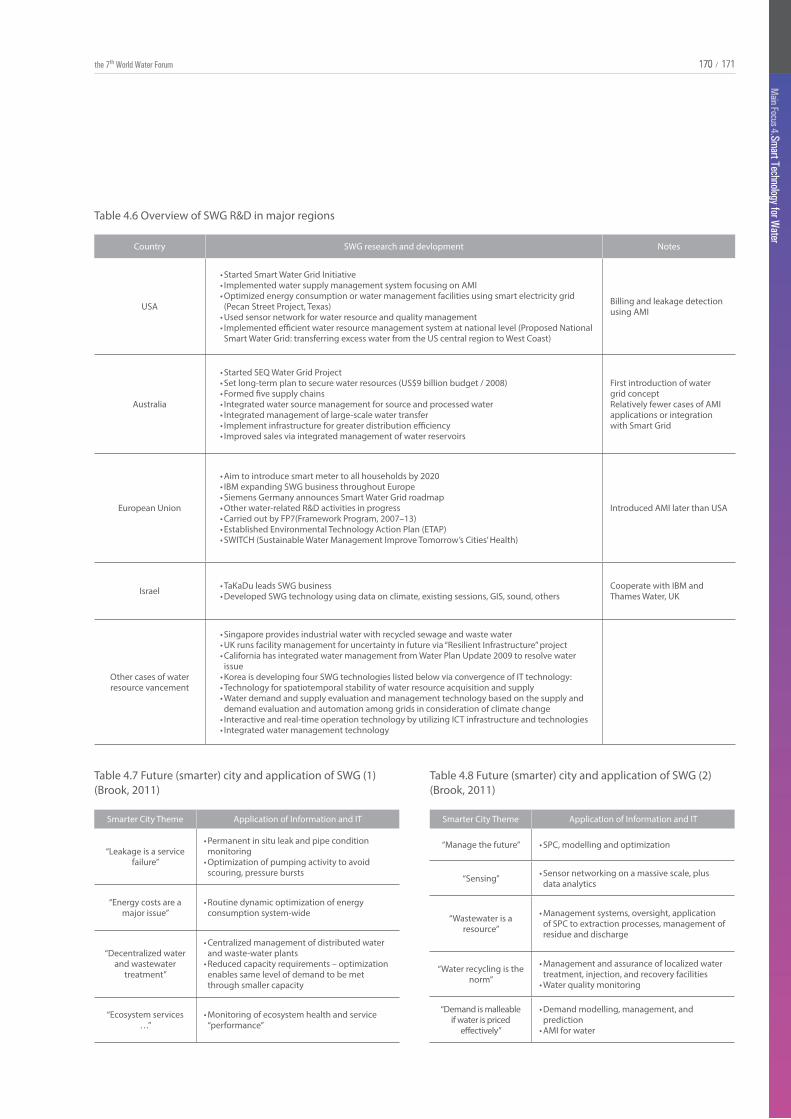
170
Main Focus 4. Smart Technology for W
ater
171170 /the 7th World Water Forum 170
Main Focus 4. Smart Technology for W
ater
171/
Table 4.6 Overview of SWG R&D in major regions
Table 4.7 Future (smarter) city and application of SWG (1) (Brook, 2011)
Table 4.8 Future (smarter) city and application of SWG (2) (Brook, 2011)
Country SWG research and devlopment Notes
USA
• Started Smart Water Grid Initiative• Implemented water supply management system focusing on AMI• Optimized energy consumption or water management facilities using smart electricity grid (Pecan Street Project, Texas)
• Used sensor network for water resource and quality management• Implemented efficient water resource management system at national level (Proposed National Smart Water Grid: transferring excess water from the US central region to West Coast)
Billing and leakage detection using AMI
Australia
• Started SEQ Water Grid Project• Set long-term plan to secure water resources (US$9 billion budget / 2008)• Formed five supply chains• Integrated water source management for source and processed water• Integrated management of large-scale water transfer• Implement infrastructure for greater distribution efficiency• Improved sales via integrated management of water reservoirs
First introduction of water grid conceptRelatively fewer cases of AMI applications or integration with Smart Grid
European Union
• Aim to introduce smart meter to all households by 2020• IBM expanding SWG business throughout Europe• Siemens Germany announces Smart Water Grid roadmap• Other water-related R&D activities in progress• Carried out by FP7(Framework Program, 2007–13)• Established Environmental Technology Action Plan (ETAP)• SWITCH (Sustainable Water Management Improve Tomorrow’s Cities’ Health)
Introduced AMI later than USA
Israel • TaKaDu leads SWG business• Developed SWG technology using data on climate, existing sessions, GIS, sound, others
Cooperate with IBM and Thames Water, UK
Other cases of water resource vancement
• Singapore provides industrial water with recycled sewage and waste water• UK runs facility management for uncertainty in future via “Resilient Infrastructure” project• California has integrated water management from Water Plan Update 2009 to resolve water issue
• Korea is developing four SWG technologies listed below via convergence of IT technology:• Technology for spatiotemporal stability of water resource acquisition and supply• Water demand and supply evaluation and management technology based on the supply and demand evaluation and automation among grids in consideration of climate change
• Interactive and real-time operation technology by utilizing ICT infrastructure and technologies• Integrated water management technology
Smarter City Theme Application of Information and IT
“Leakage is a service failure”
• Permanent in situ leak and pipe condition monitoring
• Optimization of pumping activity to avoid scouring, pressure bursts
“Energy costs are a major issue”
• Routine dynamic optimization of energy consumption system-wide
“Decentralized water and wastewater
treatment”
• Centralized management of distributed water and waste-water plants
• Reduced capacity requirements – optimization enables same level of demand to be met through smaller capacity
“Ecosystem services …”
• Monitoring of ecosystem health and service “performance”
Smarter City Theme Application of Information and IT
“Manage the future” • SPC, modelling and optimization
“Sensing” • Sensor networking on a massive scale, plus data analytics
“Wastewater is a resource”
• Management systems, oversight, application of SPC to extraction processes, management of residue and discharge
“Water recycling is thenorm”
• Management and assurance of localized water treatment, injection, and recovery facilities
• Water quality monitoring
“Demand is malleable if water is priced
effectively”
• Demand modelling, management, and prediction
• AMI for water
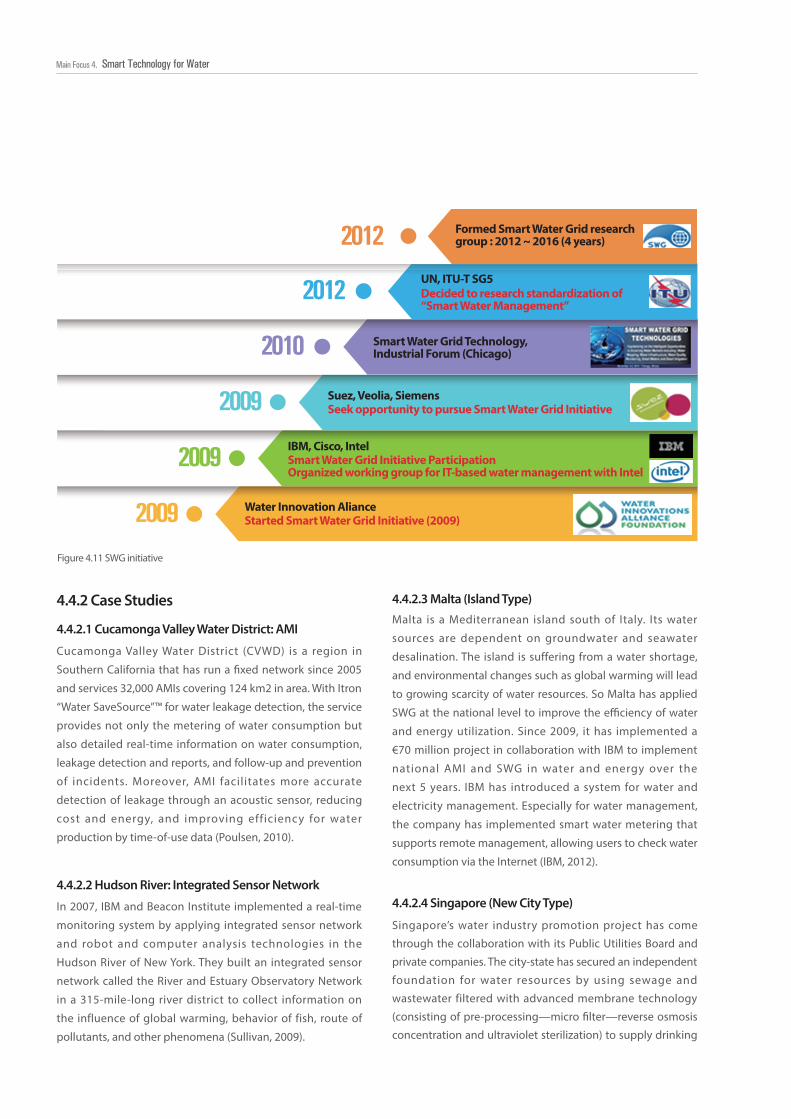
172172172Main Focus 4. Smart Technology for Water
Cucamonga Valley Water District (CVWD) is a region in
Southern California that has run a fi xed network since 2005
and services 32,000 AMIs covering 124 km2 in area. With Itron
“Water SaveSource”™ for water leakage detection, the service
provides not only the metering of water consumption but
also detailed real-time information on water consumption,
leakage detection and reports, and follow-up and prevention
of incidents. Moreover, AMI facilitates more accurate
detection of leakage through an acoustic sensor, reducing
cost and energy, and improving efficiency for water
production by time-of-use data (Poulsen, 2010).
In 2007, IBM and Beacon Institute implemented a real-time
monitoring system by applying integrated sensor network
and robot and computer analysis technologies in the
Hudson River of New York. They built an integrated sensor
network called the River and Estuary Observatory Network
in a 315-mile-long river district to collect information on
the influence of global warming, behavior of fish, route of
pollutants, and other phenomena (Sullivan, 2009).
Malta is a Mediterranean island south of Italy. Its water
sources are dependent on groundwater and seawater
desalination. The island is suffering from a water shortage,
and environmental changes such as global warming will lead
to growing scarcity of water resources. So Malta has applied
SWG at the national level to improve the effi ciency of water
and energy utilization. Since 2009, it has implemented a
€70 million project in collaboration with IBM to implement
national AMI and SWG in water and energy over the
next 5 years. IBM has introduced a system for water and
electricity management. Especially for water management,
the company has implemented smart water metering that
supports remote management, allowing users to check water
consumption via the Internet (IBM, 2012).
Singapore’s water industry promotion project has come
through the collaboration with its Public Utilities Board and
private companies. The city-state has secured an independent
foundation for water resources by using sewage and
wastewater filtered with advanced membrane technology
(consisting of pre-processing—micro fi lter—reverse osmosis
concentration and ultraviolet sterilization) to supply drinking
4.4.2 Case Studies
4.4.2.1 Cucamonga Valley Water District: AMI
4.4.2.2 Hudson River: Integrated Sensor Network
4.4.2.3 Malta (Island Type)
4.4.2.4 Singapore (New City Type)
Figure 4.11 SWG initiative
2009
2009
2009
2010
Formed Smart Water Grid research group : 2012 ~ 2016 (4 years)2012
2012 UN, ITU-T SG5Decided to research standardization of“Smart Water Management”
Smart Water Grid Technology,Industrial Forum (Chicago)
Suez, Veolia, SiemensSeek opportunity to pursue Smart Water Grid Initiative
IBM, Cisco, IntelSmart Water Grid Initiative ParticipationOrganized working group for IT-based water management with Intel
Water Innovation AlianceStarted Smart Water Grid Initiative (2009)

172
Main Focus 4. Smart Technology for W
ater
173172 /the 7th World Water Forum 172
Main Focus 4. Smart Technology for W
ater
173/
Pecan Street in Texas is the site of a project for implementing
a demonstration complex for smart electricity grid and SWG
for 4,900 households over 2.8 km2 in area, and applying
AMI, sewage recycling technology, and smart irrigation for
gardening (McCracken et. al., 2010).
4.4.2.5 Pecan Street Project: AMI (MICRO-WATER GRID)
and industrial water. Singapore is trying to build independent
water resources via the so-called NEWater system to miminize
water imports from its neighbour Malaysia. The Singaporean
government has promoted SWG to secure a stable water
supply to predict and respond to rapid changes in the global
water situation. Despite high rainfall in the region, Singapore
has experienced a water shortage given lack of enough
land to store rain, and has tried to resolve this problem
through large-scale projects for long-term securement and a
stable water supply. Singapore, as part of a national project,
established an R&D center for water processing technology
in 2004 to collaborate with top universities across the world,
and is fostering international and domestic water companies
to become the world’s leading water hub.
Singapore’s development of its water business is being
done through strategic collaboration with think-tanks and
companies. For instance, about SGD300 billion has been
invested in R&D for water processing technology since 2007,
and the Singaporean company Hyflux has invested SGD50
million on the R&D centre. The key project, the NEWater
system, purifies half of the city-state’s sewage and produces
cleaner water than general drinking water. Four factories
produce 29 million litres of water daily, which covers 15%
of Singapore’s demand. All consumed water is recycled and
reused as industrial and gardening water through intensive
sewage processing using advanced membrane technology
consisting of pre-processing - microfilter - reverse osmosis
concentration, and ultraviolet ray sterilization. About SGD1
trillion has been spent on the facility over the past 8 years,
and 29 global companies, including GE and Siemens, and
about 300 partner vendors have participated in the project.
Based on the success of this government-led promotion of
the water industry, Singapore has established the third phase
of its SWG R&D project plan to obtain optimum solutions for
water resource management: it has completed its own SWG
roadmap to implement infrastructure for water supply and
sewage, and an IT-based interactive network for supply and
demand of water resources (Allen et al., 2012).
This SWG project in Australia has been implemented in
South East Queensland (SEQ). The state was affected by
serious drought between 2004 and 2007, which led to strong
demand to restructure its water resource management
system. As a result, the SEQ Water Grid project for long-term
securement of water resources started in 2008. The key goal
of the project is implementation of a pipeline network (535
km) to transfer water to areas with water shortage from
water-rich regions with a budget of about AU$9 billion (about
KRW10 trillion). Water processing plants and a large-capacity
transfer network have been implemented in sources of water
supplies, and organizations such as Seqwater, WaterSecure,
LinkWater, and SEQ Water Grid Manager are sharing roles. SEQ
Water Grid operates the project for resolving water imbalance
and stable water supply in the territory at minimum cost.
In case of growing water scarcity in a specific region, SEQ
will increase water supply from sewage treatment plants or
seawater desalination and move water to the region needing
it. In addition to SEQ, Queensland has classified regions by
characteristics to agriculture, mining, and tourism regions
to apply a phased strategy of water supply based on each
region’s attributes (Figure 4.12).
4.4.2.6 SEQ Water Grid (MACRO-WATERGRID)
Most important in the application of SWG is political
feasibility. Several government organizations and private
or semi-private companies are involved in the process
from water intake to production and supply, and many
other organizations perform information sharing and
communication as well. An urgent requirement is to
establish related regulations and policies for integrated SWG
management before application of technologies. The political
atmosphere for water management might be different
in each country and conflict could arise between grids.
Therefore, clearly identifying the issues of each country and
conducting advanced research in considering future forecasts
are crucial.
The next step is to work out the standardization issue
for management, and sharing information and materials
produced by participating organizations. Each organization
or company that provides data creates and manages
information in favour of their needs, and duplicated
investment and different decision-making often result
4.4.3 Challenges and Solutions
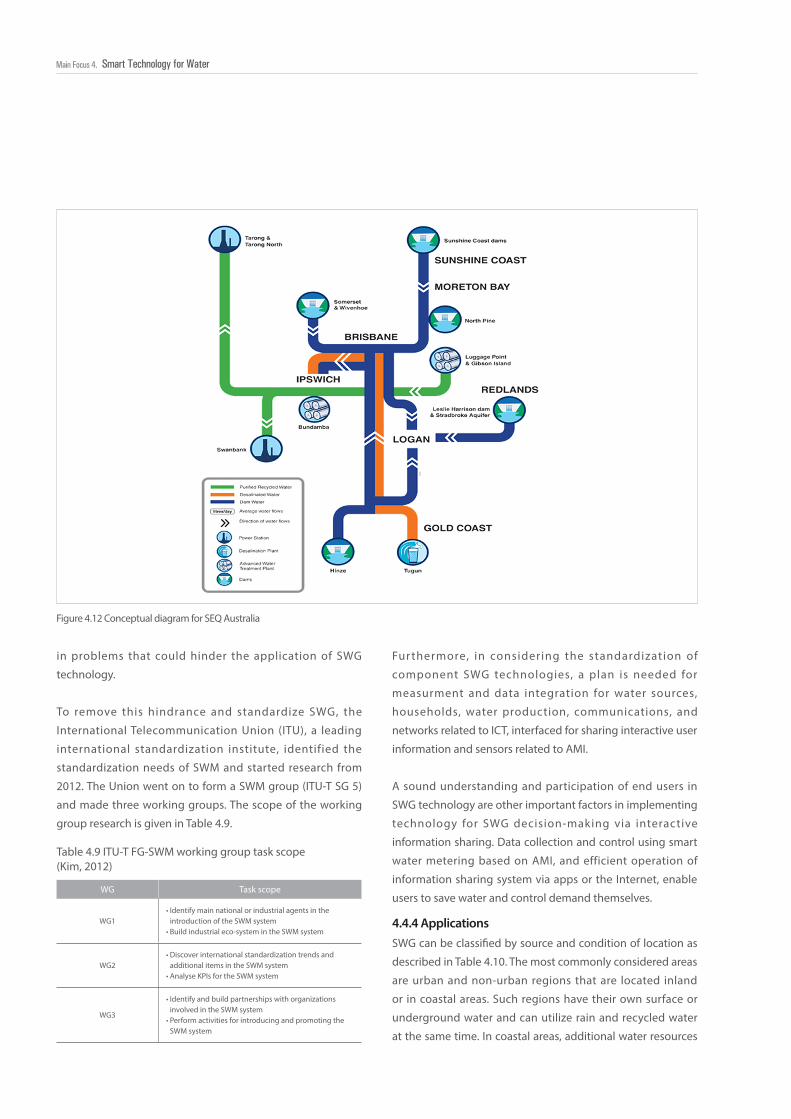
174174174Main Focus 4. Smart Technology for Water
Figure 4.12 Conceptual diagram for SEQ Australia
Table 4.9 ITU-T FG-SWM working group task scope (Kim, 2012)
WG Task scope
WG1• Identify main national or industrial agents in the
introduction of the SWM system• Build industrial eco-system in the SWM system
WG2• Discover international standardization trends and
additional items in the SWM system• Analyse KPIs for the SWM system
WG3
• Identify and build partnerships with organizations involved in the SWM system
• Perform activities for introducing and promoting the SWM system
in problems that could hinder the application of SWG
technology.
To remove this hindrance and standardize SWG, the
International Telecommunication Union (ITU), a leading
international standardization institute, identified the
standardization needs of SWM and started research from
2012. The Union went on to form a SWM group (ITU-T SG 5)
and made three working groups. The scope of the working
group research is given in Table 4.9.
Fur thermore, in considering the standardization of
component SWG technologies, a plan is needed for
measurment and data integration for water sources,
households, water production, communications, and
networks related to ICT, interfaced for sharing interactive user
information and sensors related to AMI.
A sound understanding and participation of end users in
SWG technology are other important factors in implementing
technology for SWG decision-making via interactive
information sharing. Data collection and control using smart
water metering based on AMI, and efficient operation of
information sharing system via apps or the Internet, enable
users to save water and control demand themselves.
SWG can be classified by source and condition of location as
described in Table 4.10. The most commonly considered areas
are urban and non-urban regions that are located inland
or in coastal areas. Such regions have their own surface or
underground water and can utilize rain and recycled water
at the same time. In coastal areas, additional water resources
4.4.4 Applications
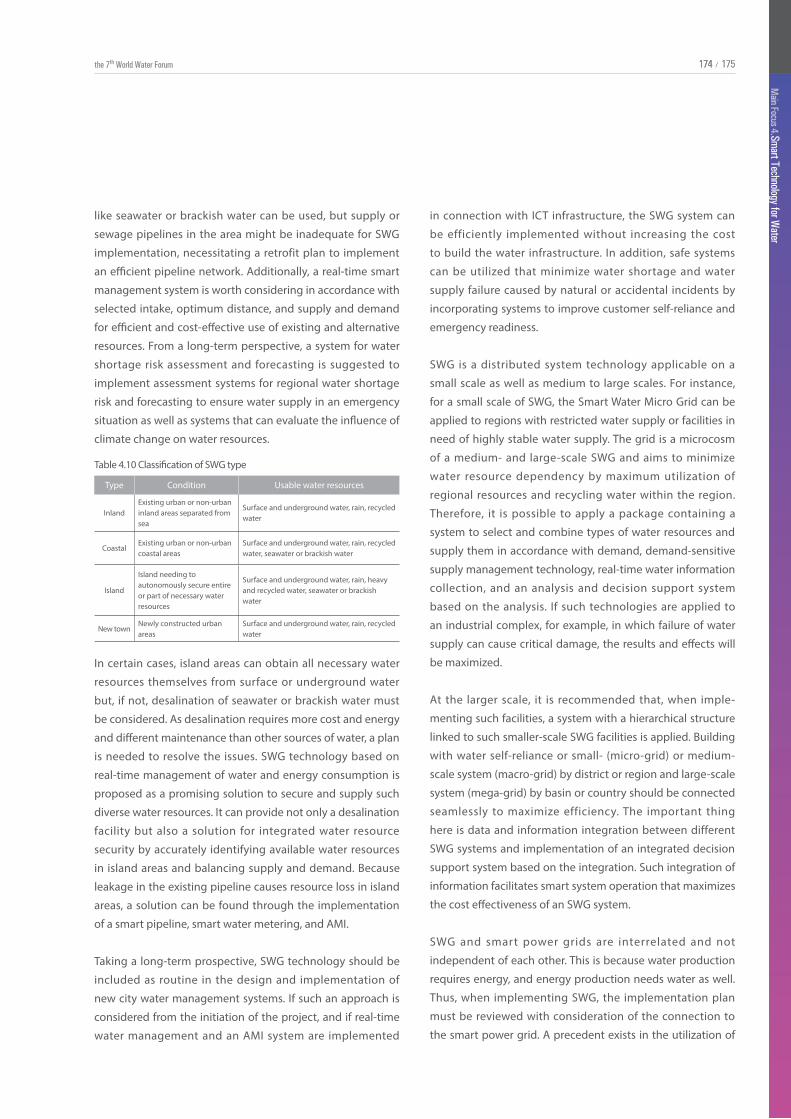
174
Main Focus 4. Smart Technology for W
ater
175174 /the 7th World Water Forum 174
Main Focus 4. Smart Technology for W
ater
175/
like seawater or brackish water can be used, but supply or
sewage pipelines in the area might be inadequate for SWG
implementation, necessitating a retrofit plan to implement
an efficient pipeline network. Additionally, a real-time smart
management system is worth considering in accordance with
selected intake, optimum distance, and supply and demand
for efficient and cost-effective use of existing and alternative
resources. From a long-term perspective, a system for water
shortage risk assessment and forecasting is suggested to
implement assessment systems for regional water shortage
risk and forecasting to ensure water supply in an emergency
situation as well as systems that can evaluate the influence of
climate change on water resources.
Table 4.10 Classification of SWG type
Type Condition Usable water resources
InlandExisting urban or non-urban inland areas separated from sea
Surface and underground water, rain, recycled water
CoastalExisting urban or non-urban coastal areas
Surface and underground water, rain, recycled water, seawater or brackish water
Island
Island needing to autonomously secure entire or part of necessary water resources
Surface and underground water, rain, heavy and recycled water, seawater or brackish water
New townNewly constructed urban areas
Surface and underground water, rain, recycled water
In certain cases, island areas can obtain all necessary water
resources themselves from surface or underground water
but, if not, desalination of seawater or brackish water must
be considered. As desalination requires more cost and energy
and different maintenance than other sources of water, a plan
is needed to resolve the issues. SWG technology based on
real-time management of water and energy consumption is
proposed as a promising solution to secure and supply such
diverse water resources. It can provide not only a desalination
facility but also a solution for integrated water resource
security by accurately identifying available water resources
in island areas and balancing supply and demand. Because
leakage in the existing pipeline causes resource loss in island
areas, a solution can be found through the implementation
of a smart pipeline, smart water metering, and AMI.
Taking a long-term prospective, SWG technology should be
included as routine in the design and implementation of
new city water management systems. If such an approach is
considered from the initiation of the project, and if real-time
water management and an AMI system are implemented
in connection with ICT infrastructure, the SWG system can
be efficiently implemented without increasing the cost
to build the water infrastructure. In addition, safe systems
can be utilized that minimize water shortage and water
supply failure caused by natural or accidental incidents by
incorporating systems to improve customer self-reliance and
emergency readiness.
SWG is a distributed system technology applicable on a
small scale as well as medium to large scales. For instance,
for a small scale of SWG, the Smart Water Micro Grid can be
applied to regions with restricted water supply or facilities in
need of highly stable water supply. The grid is a microcosm
of a medium- and large-scale SWG and aims to minimize
water resource dependency by maximum utilization of
regional resources and recycling water within the region.
Therefore, it is possible to apply a package containing a
system to select and combine types of water resources and
supply them in accordance with demand, demand-sensitive
supply management technology, real-time water information
collection, and an analysis and decision support system
based on the analysis. If such technologies are applied to
an industrial complex, for example, in which failure of water
supply can cause critical damage, the results and effects will
be maximized.
At the larger scale, it is recommended that, when imple-
menting such facilities, a system with a hierarchical structure
linked to such smaller-scale SWG facilities is applied. Building
with water self-reliance or small- (micro-grid) or medium-
scale system (macro-grid) by district or region and large-scale
system (mega-grid) by basin or country should be connected
seamlessly to maximize efficiency. The important thing
here is data and information integration between different
SWG systems and implementation of an integrated decision
support system based on the integration. Such integration of
information facilitates smart system operation that maximizes
the cost effectiveness of an SWG system.
SWG and smart power grids are interrelated and not
independent of each other. This is because water production
requires energy, and energy production needs water as well.
Thus, when implementing SWG, the implementation plan
must be reviewed with consideration of the connection to
the smart power grid. A precedent exists in the utilization of
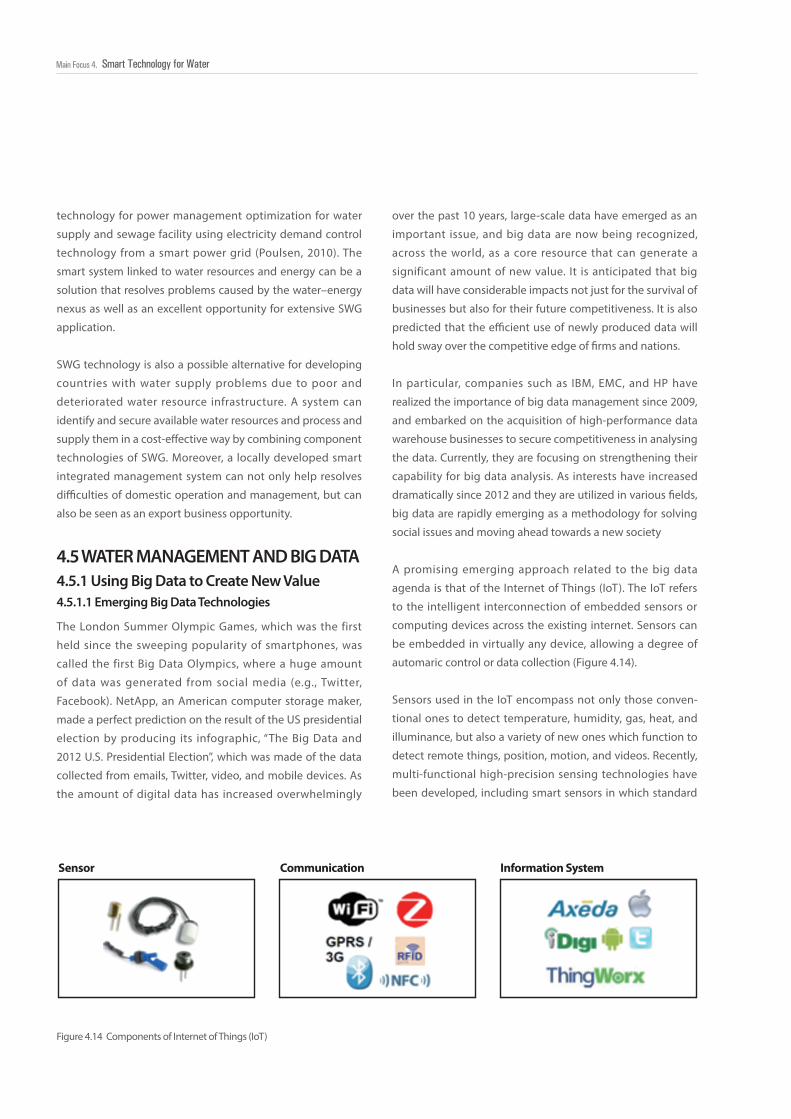
176176176Main Focus 4. Smart Technology for Water
4.5 WATER MANAGEMENT AND BIG DATA4.5.1 Using Big Data to Create New Value4.5.1.1 Emerging Big Data Technologies
Figure 4.14 Components of Internet of Things (IoT)
The London Summer Olympic Games, which was the first
held since the sweeping popularity of smartphones, was
called the first Big Data Olympics, where a huge amount
of data was generated from social media (e.g., Twitter,
Facebook). NetApp, an American computer storage maker,
made a perfect prediction on the result of the US presidential
election by producing its infographic, “The Big Data and
2012 U.S. Presidential Election”, which was made of the data
collected from emails, Twitter, video, and mobile devices. As
the amount of digital data has increased overwhelmingly
over the past 10 years, large-scale data have emerged as an
important issue, and big data are now being recognized,
across the world, as a core resource that can generate a
significant amount of new value. It is anticipated that big
data will have considerable impacts not just for the survival of
businesses but also for their future competitiveness. It is also
predicted that the efficient use of newly produced data will
hold sway over the competitive edge of firms and nations.
In particular, companies such as IBM, EMC, and HP have
realized the importance of big data management since 2009,
and embarked on the acquisition of high-performance data
warehouse businesses to secure competitiveness in analysing
the data. Currently, they are focusing on strengthening their
capability for big data analysis. As interests have increased
dramatically since 2012 and they are utilized in various fields,
big data are rapidly emerging as a methodology for solving
social issues and moving ahead towards a new society
A promising emerging approach related to the big data
agenda is that of the Internet of Things (IoT). The IoT refers
to the intelligent interconnection of embedded sensors or
computing devices across the existing internet. Sensors can
be embedded in virtually any device, allowing a degree of
automaric control or data collection (Figure 4.14).
Sensors used in the IoT encompass not only those conven-
tional ones to detect temperature, humidity, gas, heat, and
illuminance, but also a variety of new ones which function to
detect remote things, position, motion, and videos. Recently,
multi-functional high-precision sensing technologies have
been developed, including smart sensors in which standard
Sensor Communication Information System
technology for power management optimization for water
supply and sewage facility using electricity demand control
technology from a smart power grid (Poulsen, 2010). The
smart system linked to water resources and energy can be a
solution that resolves problems caused by the water–energy
nexus as well as an excellent opportunity for extensive SWG
application.
SWG technology is also a possible alternative for developing
countries with water supply problems due to poor and
deteriorated water resource infrastructure. A system can
identify and secure available water resources and process and
supply them in a cost-effective way by combining component
technologies of SWG. Moreover, a locally developed smart
integrated management system can not only help resolves
difficulties of domestic operation and management, but can
also be seen as an export business opportunity.
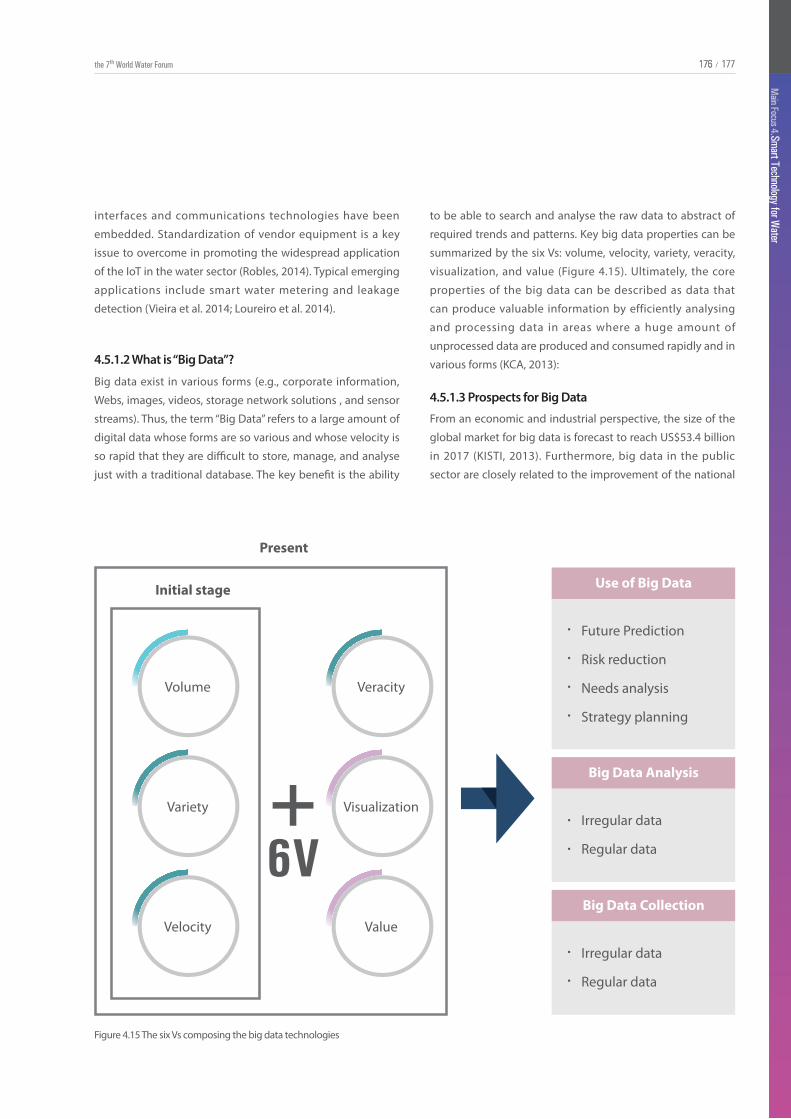
176
Main Focus 4. Smart Technology for W
ater
177176 /the 7th World Water Forum 176
Main Focus 4. Smart Technology for W
ater
177/
interfaces and communications technologies have been
embedded. Standardization of vendor equipment is a key
issue to overcome in promoting the widespread application
of the IoT in the water sector (Robles, 2014). Typical emerging
applications include smart water metering and leakage
detection (Vieira et al. 2014; Loureiro et al. 2014).
Big data exist in various forms (e.g., corporate information,
Webs, images, videos, storage network solutions , and sensor
streams). Thus, the term “Big Data” refers to a large amount of
digital data whose forms are so various and whose velocity is
so rapid that they are difficult to store, manage, and analyse
just with a traditional database. The key benefit is the ability
4.5.1.2 What is “Big Data”?
Figure 4.15 The six Vs composing the big data technologies
Use of Big DataInitial stage
Present
Volume
Future Prediction
Risk reduction
Needs analysis
Strategy planning
ㆍ
ㆍ
ㆍ
ㆍ
Big Data Analysis
Irregular data
Regular data
Big Data Collection
Irregular data
Regular data
Variety +6V
Velocity
Veracity
Visualization
Value
ㆍ
ㆍ
ㆍ
ㆍ
From an economic and industrial perspective, the size of the
global market for big data is forecast to reach US$53.4 billion
in 2017 (KISTI, 2013). Furthermore, big data in the public
sector are closely related to the improvement of the national
4.5.1.3 Prospects for Big Data
to be able to search and analyse the raw data to abstract of
required trends and patterns. Key big data properties can be
summarized by the six Vs: volume, velocity, variety, veracity,
visualization, and value (Figure 4.15). Ultimately, the core
properties of the big data can be described as data that
can produce valuable information by efficiently analysing
and processing data in areas where a huge amount of
unprocessed data are produced and consumed rapidly and in
various forms (KCA, 2013):
178178178Main Focus 4. Smart Technology for Water
4.5.2 Big-Data-Based Water Management Practices
competitiveness, because it has been shown that they can
be used to increase the work efficiency of the private sector,
unearth new industries, and achieve the optimization of
decision-making. Hence, the use of big data in the public
sector has constituted worldwide trends, along with the so-
called “open data” in the socio-cultural sector. The European
Union and the USA have already realized the value and
importance of information from the public sector and, to
enable the common sharing and use of information, they are
implementing policies based on such data platforms as CKAN
and Socrata.
In the USA, if big data are utilized in such sectors as the
medical industry, public administration, retail, manufacturing,
and personal information, it is possible to add 1% to
productivity, and each sector can see economic benefits
varying from US$100 billion to US$700 billion. In particular,
it is anticipated that the economic benefits of the medical
industry will amount to US$330 billion dollars, and the retail
industry is expected to enjoy a 60% increase in its profits
(McKinsey Global Institute, 2011). In the case of the UK, it
is reported that the introduction of big data would bring
some GBP216 billion of economic benefits across the whole
economy by 2017 (Center for Economics and Business
Research, 2012), and they would also help the public sector
save cost of GBP16 billion to GBP33 billion (NIA, 2012).
Compared with other industries, the use of big data in the
water management sector shows relatively slow progress.
However, there are some case study examples to consider.
IBM’s SWM
IBM has developed a water management system built for
the efficient supply and monitoring of water in metropolitan
areas run by the Bangalore Water Supply and Sewerage
Board based on the exploitation of big data sets. This
system provides not only the functions of GIS-based real-
time monitoring based on information (collected with
flow meters), but also key performance indices, including
recent flow, total mean flow for the past 7 days, total flow,
geographical location, time, etc. It is composed of solutions
based on IBM’s Intelligent Operations Centers (IOC), and it
enables users to evaluate the current state of water supply
in the city, predict the amount of future water supply, and
control it on a real-time basis.
It also helps minimize unaccounted-for water loss. The IOC
monitors water flow by connecting 284 flow meters (out
of 784 large-scale flow meters) within the metropolitan
area. It also provides a monolithic view on flow indicated
in each of the individual flow meters, flow supplied from
each distribution system, and water level in tanks at each
water supply station. Data provided by each flow meter is
reported on a single executive dashboard. Users can operate
control valves remotely and obtain real-time feedback on
variations in a previously set amount of water supply. The IOC
ultimately enables its users to ensure the efficient control of
water supply, and obtain relevant information timely through
a real-time alarm system and take necessary measures when
pre-set target water supply has not been met.
Water Supply Management of the HydroPoint Data System
The HydroPoint Data System (HDS), a water management
system developed by the California-based HydroPoint,
provides its users with an automated system that functions
to prevent and monitor water waste and damage caused
by leaks or run-off. To this end, it uses real-time two-way
wireless communication technologies based on the AT&T’s
M2M (Machine-to-Machine) network, and big data and
cloud technologies. The HydroPoint platform connects its
integrated management framework with data from various
sources including onsite water systems, spring coolers,
master valves, flow sensors, historical water tariff, water
supply plans, and location-specific meteorological data. It
helped its 25,000-strong customers cut US$137 million in
expenses by saving 20 billion US gallons of water and 7,700
kilowatt-hours of electrical energy in 2013 alone (HydroPoint
Data System Inc., 2015).
K-water’s Data Management for Water Resource Management
Korea’s K-water has created and managed a large amount
of data with its own database system, including measured
and observed hydrological data and other data about the
operation of relevant structures and facilities. In the field
of water resources, various data have been produced and
managed to ensure IWRM, and various decision support
systems based on those data have been developed and
operated. Accumulated data are stored in the RHDAPS

178
Main Focus 4. Smart Technology for W
ater
179178 /the 7th World Water Forum 178
Main Focus 4. Smart Technology for W
ater
179/
(Real time Hydrological Data Acquisition and Processing
System) database first, and then used for various IWRM
practices, including real-time water management analyses.
Furthermore, the RHDAPS database is used for managing
various facilities through its nationwide network with 887
gauging stations, flood and disaster monitoring systems, dam
integration, and earthquake monitoring systems.
K-water also operates its own flood decision support system.
It is an integrated system which uses data, as mentioned
above, along with data about meteorological conditions,
water supply, flood control, and water quality. The system
provides support for decision-making by clients and
operators as well as information sharing services. The flood
decision support system consists of three modules dealing
with meteorological conditions, water supply, flood control,
and water quality. Its services are provided through the
integrated database and a server dedicated to numerical
analyses.
SURIAN (SUpercom based RIver Analysis Network), an
integrated water quality prediction system, functions to
collect data from independently operating models for such
factors as meteorological conditions, drainage basins, rivers
and reservoirs, conduct an integrated simulation on each
drainage basin, and provide applicable operators with data
to support their decision-making. In the system, databases
are constructed with data covering hourly meteorological
parameters (e.g., rainfall, temperature, solar radiation), flow
and water quality (in each sub-basin), point and non-point
pollution sources, real-time flow and water quality (of each
river system), topographical parameters (corresponding
to each of target dams and river systems), etc. All of these
are used for various analyses, including water quality
analysis, two-dimensional cover flow analysis, and three-
dimensional animation analysis, and the values of forecasts
on each of target dams and river systems are paired with
each corresponding river basin. In the case of the water
utility sector, the nation is divided into seven regions, with
an integrated operation centre set up in each region. The
operation centres are responsible for carrying out the remote
monitoring and control of 40 water treatment plants, 24
intake stations, and 82 pump stations. Measured data are
sent to database servers in the seven regional headquarters.
They are processed and sent through the Real-time Water
4.5.3 Challenges and Solutions
4.5.3.1 Hurdles
In this sub-section, hurdles and problems in introducing big-
data-based water managment systems will be addressed
with suggested solutions. A plan to introduce the system will
also be described by showing some relevant examples.
Unification of Diversified Water Information Management
Systems
This hurdle or challenge is similar to the one already
identified earlier. Water management systems produce a
vast amount of data about meteorological conditions, water
quality, water availability, and so on, but they not currently
integrated systematically. Most water-related data are
individually created and managed by independent agencies
with their own different goals. Furthermore, relevant data
also exist in different formats such as databases, Web pages,
or documents, and the cycle of data acquisition varies,
ranging from minutes and hours to months or years.
Accordingly, data shar ing and cooperat ion among
information management organizations is essential for the
efficient integration and management of water-related
data, which are sporadically and interruptedly created by
different, independent agencies . To this end, it is necessary
to establish a data hub or a control tower for their integrated
management.
Improvement of Data Reliability
Most data related to water management, which is created
on a real-time basis through such automatic measurement
tools as sensors, are used as they are or go through further
processing. However, the creation of data with 100% reliability
is not possible because of numerous mis-measurements,
which, in turn, are attributable to the malfunctions of sensors,
operators’ negligence, and flaws in communication systems.
Accordingly, a solution for improving data reliability should
be found.
To this end, it is necessary to build a redundant communications
network, and thereby ensure the stable transmission of
relevant data. A real-time monitoring system is also needed
Information System (RWIS) to 18 systems in and out of
K-water.
180180180Main Focus 4. Smart Technology for Water
4.5.3.2 Plan
K-water’s road map for introducing a Big-Data-based IWRM
system
K-water is working on the development of a management
for the management of data quality. In some cases, the
construction of an automated platform should be considered
if necessary.
Improving data protection and security
As with other cyber environments, the dysfunction of big
data lies in the fact that they are highly likely to infringe on
personal information and privacy. Accordingly, measures
to tighten cyber security should be arranged before
introducing big data technologies. Damages and losses are
irrevocable if information is destroyed or spilled out due to
lax management or cyber-attacks. Although no cyber fields
are free from security problems, cyber security measures in
the area of big data technologies are all the more important
because their use has been increasing dramatically.
The most important security challenge faced by the big data
technologies is about how to protect personal information.
It is likely that some information related to water supply
contains confidential information. Accordingly, so-called
privacy-preserving data processing technologies (e.g., data
encryption) are necessary to protect information in the big
data system. According to the Korea Internet and Security
Agency, the following technologies are required to improve
big data security: technology for obtaining a consent at
a phase of data acquisition, technology for denying data
collection, technology for encrypting data at a phase of
data storage, technology for controlling access to data,
technology for data anonymity at a phase of data processing,
and technology for data deletion. Still, care should be taken
to address all of these technologies which are inevitably
required in terms of data security.
When deciding what data should be shared, a priority should
be placed on their industrial importance (in terms of their
usefulness and commercial values) and ease of use (in terms
of accuracy and openness). Data to be shared are selected by
adding up all points of each evaluation item with different
weights. Then data sharing should proceed on a step-by-step
basis and according to the given priority.
system that secures the systematic flow of data in and out
of the organization, a data quality management system to
improve data reliability, and a standardized platform enabling
the integrated analysis and operation of the big data. For
efficient sharing of water data, the method, frequency,
and measuring unit of data acquisition are coordinated
depending on specific needs. K-water has a plan to conclude
a memorandum of understanding with relevant organizations
to facilitate data sharing with them. In addition, it is also
planning to facilitate data distribution through disclosing (i.e.,
sharing) the water data, and building a cooperation system
with other relevant organizations by asking them to create
necessary but unavailable data.
A single data hub is built in which not only existing data
collected as described above but also new data acquired
through a status analysis are all managed together, and a
quality management system is developed to ensure the
efficient management of data quality and reliability by
adopting tools based on statistical methods. Also, a tool for
analysing standardized and non-standardized big data is
developed so that their systematic, integrated analysis may
lead to the meaningful creation of valuable outputs, and
thereby support decision-making.
The integrated water information platform based on the
big data consists of a data platform, analysis platform, and
service platform. The data platform functions to sort out
standardized data collected in and out of K-water and non-
standardized data collected from the private sector, and
manage their quality. The analysis platform analyses the
big data on an on-site, real-time basis. The service platform
ensures the sharing of customized information. That is to say,
the big data collected at the data platform proceed to the
analysis platform where they are stored and analysed. Then,
they are finally expressed at the smart water board or smart
water portal of the service platform.
The analysis platform supports decision-making by acquiring
meaningful outputs from methodologically analysing
standardized and non-standardized big data in an integrated
way. Tools continuously developed to analyse the big data
and support decision-making within the analysis platform
create a new growth engine. The service platform is built
for the standardization of data shared in and out of the
180
Main Focus 4. Smart Technology for W
ater
181180 /the 7th World Water Forum 180
Main Focus 4. Smart Technology for W
ater
181/
4.5.4 Recommendations
4.6 CONCLUSIONS
Under the IoT-based water management system, data are
collected through sensors and networks. The sensors should
have such features as low price, low electricity, high precision,
diversity, and reliability, while the networks should have
redundancy. The associated data management platform
should meet such requirements as two-way data sharing,
and standardization and unification of overlapping systems.
The big data should include status of facilities, operational
information, space information, risk information, and
information about water tariff, civil complaints, and so on.
In addition to hardware needs, a model for maximizing the
efficiency and reliability of water resource management
is required. From the aspect of water managment in river
basins, multiple implementation among meteorological
forecasts, basin-wide runoff, reservoir operation, and river
management is to be realized.
Further, the successful construction of the system requires
real-time monitoring of information on water cycles in river
basins; the building of information-sharing governance
by national water management agencies; the collection of
information on water cycles and its provision to the public,
where relevant; and the upgrading of water management
technologies through ensuring timely, precise predictions.
The following prerequisites are needed to achieve this:
analyse convergence data for making policies on water
supply; construct a one-stop analysis system by converging
data about meteorological conditions, water quantity, quality,
etc.; cope with disasters through ensuring the proactive
associated operation of dams and weirs; and introduce a
decision support system for water sectors based on the big
data collected through IoT.
We have seen in this paper the significant potential for smart
water technologies and smart water management (SWM). Not
until recently has it been possible to exploit the opportunities
derived from being able to interconnect water users, water
objects or things, sensors, and systems together with
intelligent data analysis in a myriad of applications. Benefits
include cost savings and operational efficiencies, improved
performance, additional flexibility and the possibility to
“sweat” existing assets. Despite a late start in the water sector,
the pace of change is rapid and is set to increase with interest
and involvement of large multinational companies.
However, use of smart technology and SWM is not an
automatic “fix” and will need to be considered in conjunction
with other strategies such as building increased capacity or
greater use of blue-green infrastructure. There is no “one size
fits all” solution, and available options in each case must be
reviewed to identify the best for each situation.
There are still barriers to overcome before SWM can be used
more widely, including a lack of reliable data about existing
water system infrastructure and its upgradability, the need
for standardization of protocols and equipment, long-term
operational experience, and updating of the regulatory
system. Generation of data and reliance on it can also cause
potential issues which still need to be addressed, including
the need for cyber security. It also has to be realized that
data cannot be generated with complete reliability: sensors
will fail, inaccurate measurements may be made, and
communication flaws will occur. It is important, therefore, that
redundancy is provided and that data quality management is
properly addressed.
It is no exaggeration to say that SWM will have a major role to
play in addressing the global challenges of climate change,
population growth and rapid urbanization, natural disasters,
and environmental degradation. As a result, we can see major
shifts taking place in the structure of the water industry, with
a need for new ways of working, new skills, and new water
management policies. All this points towards a bright future
for the smart water sector and the ushering in of a new water
paradigm, with applications and potential throughout the
urban water cycle.
integrated database.
182182182Main Focus 4. Smart Technology for Water
ACT (2005). “Genetic Sensors for Environmental Water Quality”, Report on a Workshop of Developers, Deliverers and Users of Technologies for Moitoring Coastal Environments, St. Petersburg, Florida, USA.
Ammar, M., O. Moselhi and T. Zayed (2010). “Decision support model for selection of rehabilitation methods for waer mains” Structure and Infrastructure Engineering: Maintenance, Management, Life-Cycle Design and Performance, 8(9), 847-855.
Boulos, P.F. and A.N. Wiley (2013). “Can we make water systems smarter?” Opflow, AWWA, 39(3), 20-22.
Boulos, P. F. (2013). Making Wastewater Systems Smarter. Opflow 39(6), 22-24.
Breinholt, A., Santacoloma, P., Mikkelsen, P., Madsen, H., Grum, M. and Nielsen, M. (2008). Evaluation framework for control of integrated urban drainage systems, Proc. 11th Intl. Conf. on Urban Drainage, Edinburgh, September, 2008.
Brewster McCracken (2010), A5, “Pecan Street Project” - Presentation to EPA, <https://www.smartgrid.gov/project/pecan_street_project_inc_energy_internet_demonstration>.
Brook, C. (2011) “Smarter Water Management: Using information technology and analytic tools to deploy a Smart Water Grid”, The 1st International Workshop on Smart Water Grid, March 23-25, Korea.
Bunn, S.M. and L. Reynolds (2009). “The energy-efficiency benefits of pump-scheduling optimization for potable water supplies” IBM Journal of Research and Development, AWWA, 53(5).
Cahn, A. (2014). “An overview of smart water networks” Journal AWWA, AWWA, 106(7), 68-74.
Cisco Consulting Services (2014). IoE-driven smart city Barcelona initiative cuts water bills, boosts parking revenues, creates jobs & more. http://internetofeverything.cisco.com/sites/default/files/pdfs/ Barcelona_Jurisdiction_Profile_final.pdf
De Graaf, B.R., F. Williamson, M.K. Koerkamp, J.W. Verhoef, R. Wuestman, B. Bajema, E. Trietsch and W. van Delft (2012). “Implementation of an innovative sensor technology for effective online water quality monitoring in the distribution network” Water Practice & Technology, IWA Publishing, 7(4).
Dingus, M., J. Haven and R. Austin (2002). Nondestructive, noninvasive assessment of underground pipelines. AWWA Research Foundation. Dever, CO.
ESS GmbH (2015). “Environmental Technology, Research & Development”http://www.ess.co.at/WATERWARE
Frevert, D., Lins, H., Fulp, T., Leavesley, G., and Zagona, E. (2001). “The Watershed and River Systems Management Programme: An Overview of Capabilities.” Proceedings of Watershed Management and Operations Management 2000 Conference, 1-4.
Fu, G., Butler, D. & Khu, S-T. (2008). „Multiple objective optimal control of integrated urban wastewater systems.” Environmental Modelling and Software, 23, 225-234.
Galusha D. (1999). Liquid assets: A history of New York City’s water system. Purple Mountain Press, Fleischmanns, NY.
Growing Blue (2011). Growing Blue: Water. Economics. Life.http://growingblue.com/wp-content/uploads/2011/04/Growing-Blue.pdf
GWI (Global Water Intelligence) (2010). Global Water Market 2011—Meeting the World’s Water and Wastewater Needs Until 2016. http://www.globalwaterintel.com/publication-guide/marketintelligence-reports/global-watermarket-2011.
Hill, T. and Symmonds, G. (2013). The Smart Grid for Water, Advantage, South Carolina, USA.HydroPoint Data System Inc. (2015) “Hydropoint press”, http://www.hydropoint.com
IBM (2010) Smart Systems for Planetary Water Management.https://sdm.mit.edu/conf09/presentations/sharon_nunes.pdf
IBM, (2012) “Enemalta and Water Services Corporations, Case Study Report” Document No. EUC03008USEN.Institution of Civil Engineers (1994). “Thames water ring main” Proceeding of the Institution of Civil Engineers, 102 (Special Issue 2), London Telford.
KCA (2013), Introduction of core technologies depending on application level of big data. Korea Communications Agency (KCA). Naju-si, Jeonnam, Republic of Korea.
KISTI (2013), “Perspective of big data industry”, KISTI Maket Report. Korea Institute of Science and Technology Information (KISTI). Daejeon, Republic of Korea.
Kim, Y.w. (2012) Personal communication.
K-water (2014). Pilot project for builing smart water city. Korea Water Resources Corporation (K-water). Daejeon, Republic of Korea.
Langeveld, J., Benedetti, L., Klein, J., Nopens, I., Amerlinck, Y., Nieuwenhuijzen, A., Flameling, T., Zanten, O. and Weijers, S. Impact-based integrated real-time control for improvement of the Dommel River water quality. Urban Water Journal, 10(5), 312-329.
REFERENCES

182
Main Focus 4. Smart Technology for W
ater
183182 /the 7th World Water Forum 182
Main Focus 4. Smart Technology for W
ater
183/
Sullivan, M. (2009) “Let’s Build a Smarter Planet: Smarter Water Management”, 5th National Drinking Water Symposium, Oct. 13.
SWAN (2013) Introduction to Smart Water Networks.http://www.swan-forum.com/uploads/5/7/4/3/5743901/__swan_what_are_smart_water_networks.pdf
Temido, J., Sousa, J. and Malheiro, R. (2014) SCADA and Smart Metering systems in water companies. A perspective based on the value creation analysis. 12th International Conference on Computing and Control for the Water Industry, CCWI2013 70, 1629-1638.
Thames Water (2013) UK’s first ‘smart’ water meters being installed.http://www.thameswater.co.uk/media/press-releases/17391.htm.
Thomson, J. and L. Wang (2009). State of techonology review report on condition assessment of ferrous water transmission and distribution systems. EPA 600-R-09-055, U.S. EPA. Cincinnati, OH.
Thompson, K. and Kadiyala, R. (2014) Protecting water quality and public health using a smart grid. 12th International Conference on Computing and Control for the Water Industry, CCWI2013 70, 1649-1658.
USEPA (2005). Water sentinel online water quality monitoring as an indicator of drinking water contamination. EPA 817-D-05-002, U.S. EPA. Washington DC.
U S E PA & G E T F (G l o b a l E nv i ro n m e n t & Te c h n o l o g y Foundation) (2008). Ensuring a Sustainable Future: An Energy Management Guidebook for Wastewater and Water Utilities. EPA 832-R-08-002, U.S. EPA, Washington DC.
Vezzaro, L., Christensen, M., Thirsing, C., Grum, M. and Mikkelsen, P. Water quality-based real time control of integrated urban drainage systems: a preliminary case study from Copenhagen, Denmark. 12th International Conference on Computing and Control for the Water Industry, CCWI2013. 2-4 Sept 2013, Perugia, Italy.
Vieira, P., Dália Loureiro, José Barateiro, Rita Ribeiro, Margarida Rebelo and Sérgio Teixeira Coelho (2014). Innovative smart metering based applications for water utilities, Water Utility Management International 9.4, 16.
Walsby, C. (2013). “The power of smart water networks” Journal AWWA, AWWA, 105(3), 72-77.
Zagona, E. (2013). “RiverWare: river basin modelling for today and tomorrow” Center for Advanced Decision Support for Water and Environmental Systems, http://www.riverware.org
Liu, Z., Y. Kleiner, B. Rajani, L. Wang and W.C. Battelle (2012). Condition Assessment Technologies for Water Transmission and Distribution Systems. EPA/600/R-12/017, U.S. EPA. Cincinnati, OH.
Loureiro, D., H. Alegre, S. T. Coelho, A. Martins and A. Mamade (2014). A new approach to improve water loss control using smart metering data, Water Science & Technology: Water Supply Vol 14 No 4 pp 618–625.
Mencarelli, M., Pizzichini, M., Gabrielli, L., Spinsante, S., Squartini, S. (2012). Self-powered sensor networks for water grids: Challenges and Preliminary Evaluations”, Journal of Selected Areas in Telecommunications, October 2012, 1-8.
McKenna, S.A., Fusco, F. and Eck, B.J. (2014) Water demand pattern classi f icat ion from smar t meter data. 12th International Conference on Computing and Control for the Water Industry, CCWI2013 70, 1121-1130.
McKinsey Global Institute (2011), Big Data: The next frontier for innovation, competition, and productivity. McKinsey & company.
NIA (2012), Study on strategy in major contries to produce new values using big dat. National Information Society Agency (NIA). Seoul, Republic of Korea.
Novotny, V., Capodaglio, A. and Jones, H. (1992) Real-time Control of Waste-water Treatment Operations. Water Science and Technology 25(4-5), 89-101.
Olsson, G. (2011) Smart Water & Power Grids - drivers, opportunities and challenges. 1st Int. Workshop on Smart Water Grids, March 23-25, 2011, Seoul, Republic of Korea.
Poulsen, D. (2010) “Uncovering Hidden Benefits of Water AMI (Advanced Metering Infrastructure)”, Smart Water Grid Technologies Conference, Nov.4-5, Chicago, U.S.A.
Robles, T., Alcarria, R., Martin, D., Morales, A., Navarro, M. , Calero, R., Iglesias, S. and Lopez, M. (2014). An Internet of Things-Based Model for Smart Water Management, In Proc. 28th International Conference on Advanced Information Networking and Applications Workshops (WAINA), May, Victoria, BC, Canada.
Schütze, M., Campisano, A., Colas, H., Schilling, W. and Vanrolleghem, P. (2004). Real t ime control of urban wastewater systems - where do we stand today? Journal of Hydrology, 14(3-4), 335-348.
Sensus (2012) Water 20/20: Bringing Smart Water Networks into Focus, Ludwigshafen, Germany.
Stedman, L. (2014) Smart control and integration: a new age of network management. Water21 (16.5), 34-35.

Ecosystem Services
Main Focus 5
Understanding and Managing Ecosystem Services for Water
It is time to fully realize that our societies and economies are integral parts
of the biosphere, and to start accounting for and governing natural capital.
Poverty alleviation and future human development cannot take place without
such a wider recognition of nature’s contribution to human livelihoods, health,
security and culture.
Smar
t Tec
hnol
ogy
for W
ater
Main Focus 4 186
Unde
rsta
ndin
g an
d M
anag
ing
Man
agin
g Ec
osys
tem
Ser
vice
s for
Wat
er
Main Focus 5 186
5.1 INTRODUCTION
Ecosystem services are defined as various benefits that
ecosystems provide for humans. Lately, deterioration of
water quality and quantity has caused significant damage
to freshwater ecosystems, resulting negative impacts in
the provision of ecosystem services. This study examines
three aspects of managing freshwater ecosystem services:
(a) the conceptual linkage between economic valuation
and ecosystem services, (b) technology of low-impact
development (LID) and green infrastructure (GI), and (c) the
resilience of ecosystem services.
For the conservation and sustainable use of biodiversity/
ecosystem services in the policy arena, the measurement
of biodiversity/ecosystem services, in monetary terms
in particular, is crucial for policy implementation and
assessment. In this paper, starting with introducing the
concept and classification of freshwater ecosystems , the
linkages between classification of ecosystem services, total
economic value (TEV), which is a well-recognized typology
of economic valuation exercises, and relevant economic
valuation methods are examined to assist communication
among various stakeholders.
Urbanization distorts natural water circulation systems by
causing changes of land use in watersheds, and affects
water quality and aquatic ecosystems by discharging
various pollutants. Therefore, it is necessary to reduce the
hydrological and environmental impacts of urbanization to
secure healthy water resources and aquatic ecosystems. The
proposed alternative is to apply low impact development
(LID) and green infrastructure (GI). LID/GI is a method of
analysing environmental impacts that may occur from the
planning to the operation stages, and minimizing those
impacts. It refers to establishing a land use plan wherein it
secures green spaces that could imitate the natural water
circulation, reducing impervious surface, preserving low
lands with water as much as possible, and maintaining
natural water circulation functions. GI may establish natural
water circulation systems, prevent floods, provide biological
habitats, purify pollutants included in stormwater runoff, and
may preserve and recover vegetation such as trees.
The resilience and transformation to cope with the challenge
of balancing water for humans and for nature are important.
Resilience includes delivery of ecosystem services in the
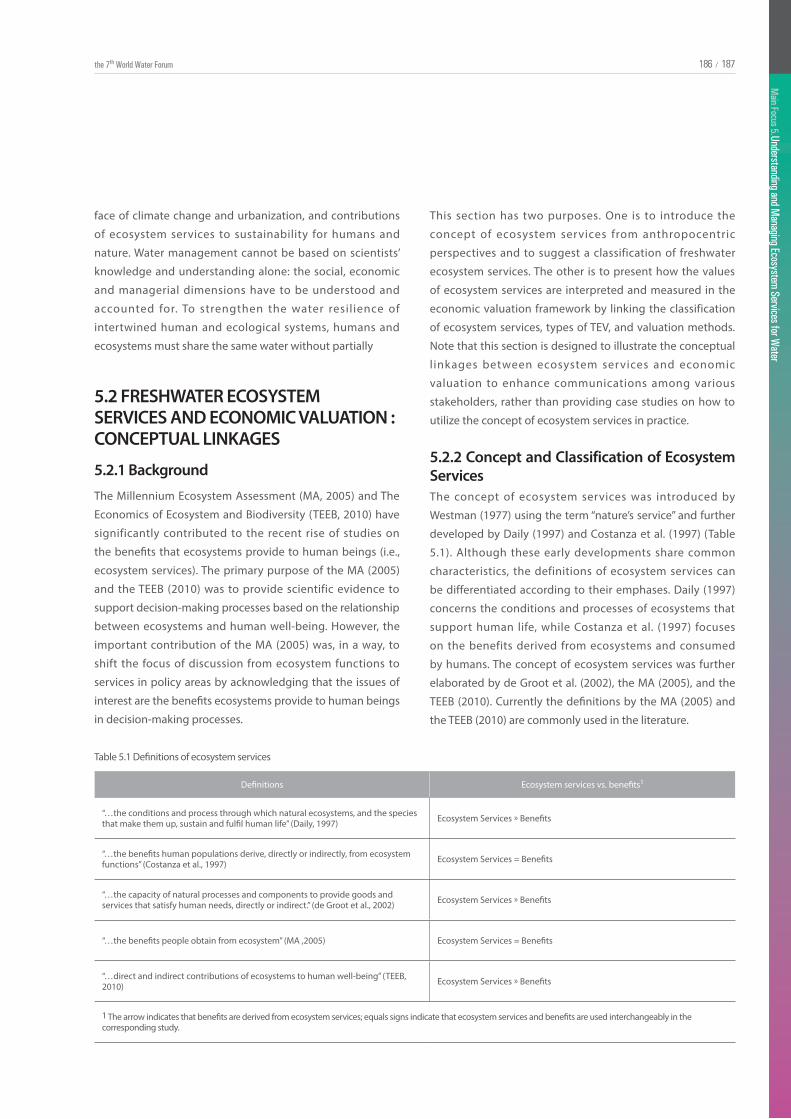
Main Focus 4. Smart Technology for W
ater
187186 /the 7th World Water Forum
Main Focus 5. Understanding and M
anaging Ecosystem Services for Water
187186 /
5.2 FRESHWATER ECOSYSTEM SERVICES AND ECONOMIC VALUATION : CONCEPTUAL LINKAGES
face of climate change and urbanization, and contributions
of ecosystem services to sustainability for humans and
nature. Water management cannot be based on scientists’
knowledge and understanding alone: the social, economic
and managerial dimensions have to be understood and
accounted for. To strengthen the water resilience of
intertwined human and ecological systems, humans and
ecosystems must share the same water without partially
The Millennium Ecosystem Assessment (MA, 2005) and The
Economics of Ecosystem and Biodiversity (TEEB, 2010) have
significantly contributed to the recent rise of studies on
the benefits that ecosystems provide to human beings (i.e.,
ecosystem services). The primary purpose of the MA (2005)
and the TEEB (2010) was to provide scientific evidence to
support decision-making processes based on the relationship
between ecosystems and human well-being. However, the
important contribution of the MA (2005) was, in a way, to
shift the focus of discussion from ecosystem functions to
services in policy areas by acknowledging that the issues of
interest are the benefits ecosystems provide to human beings
in decision-making processes.
5.2.1 Background
Table 5.1 Definitions of ecosystem services
5.2.2 Concept and Classification of Ecosystem ServicesThe concept of ecosystem services was introduced by
Westman (1977) using the term “nature’s service” and further
developed by Daily (1997) and Costanza et al. (1997) (Table
5.1). Although these early developments share common
characteristics, the definitions of ecosystem services can
be differentiated according to their emphases. Daily (1997)
concerns the conditions and processes of ecosystems that
support human life, while Costanza et al. (1997) focuses
on the benefits derived from ecosystems and consumed
by humans. The concept of ecosystem services was further
elaborated by de Groot et al. (2002), the MA (2005), and the
TEEB (2010). Currently the definitions by the MA (2005) and
the TEEB (2010) are commonly used in the literature.
Definitions Ecosystem services vs. benefits1
“…the conditions and process through which natural ecosystems, and the species that make them up, sustain and fulfil human life” (Daily, 1997) Ecosystem Services » Benefits
“…the benefits human populations derive, directly or indirectly, from ecosystem functions” (Costanza et al., 1997) Ecosystem Services = Benefits
“…the capacity of natural processes and components to provide goods and services that satisfy human needs, directly or indirect.” (de Groot et al., 2002) Ecosystem Services » Benefits
“…the benefits people obtain from ecosystem” (MA ,2005) Ecosystem Services = Benefits
“…direct and indirect contributions of ecosystems to human well-being” (TEEB, 2010) Ecosystem Services » Benefits
1 The arrow indicates that benefits are derived from ecosystem services; equals signs indicate that ecosystem services and benefits are used interchangeably in the corresponding study.
This section has two purposes. One is to introduce the
concept of ecosystem services from anthropocentric
perspectives and to suggest a classification of freshwater
ecosystem services. The other is to present how the values
of ecosystem services are interpreted and measured in the
economic valuation framework by linking the classification
of ecosystem services, types of TEV, and valuation methods.
Note that this section is designed to illustrate the conceptual
l inkages between ecosystem services and economic
valuation to enhance communications among various
stakeholders, rather than providing case studies on how to
utilize the concept of ecosystem services in practice.
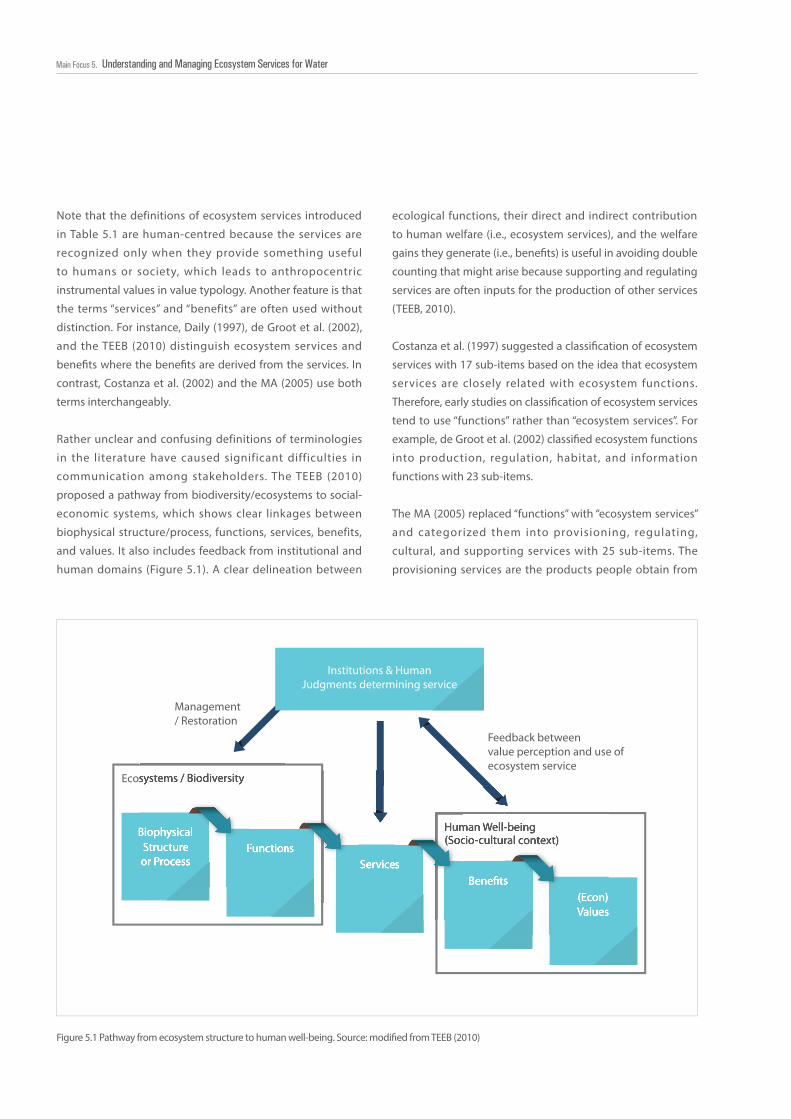
188188188188Main Focus 5. Understanding and Managing Ecosystem Services for Water
Figure 5.1 Pathway from ecosystem structure to human well-being. Source: modifi ed from TEEB (2010)
Ecosystems / Biodiversity
Management/ Restoration
Feedback betweenvalue perception and use ofecosystem service
Institutions & HumanJudgments determining service
BiophysicalStructureor Process
FunctionsServices
Ecosystems / Biodiversity
BiophysicalStructureor Process
Functions
Human Well-being(Socio-cultural context)
Bene�ts(Econ)Values
Human Well-being(Socio-cultural context)
Bene�ts(Econ)Values
FunctionsFunctionsServices
Human Well-being(Socio-cultural context)Human Well-being(Socio-cultural context)
Bene�tsServices
Note that the definitions of ecosystem services introduced
in Table 5.1 are human-centred because the services are
recognized only when they provide something useful
to humans or society, which leads to anthropocentric
instrumental values in value typology. Another feature is that
the terms “services” and “benefits” are often used without
distinction. For instance, Daily (1997), de Groot et al. (2002),
and the TEEB (2010) distinguish ecosystem services and
benefi ts where the benefi ts are derived from the services. In
contrast, Costanza et al. (2002) and the MA (2005) use both
terms interchangeably.
Rather unclear and confusing definitions of terminologies
in the literature have caused significant difficulties in
communication among stakeholders. The TEEB (2010)
proposed a pathway from biodiversity/ecosystems to social-
economic systems, which shows clear linkages between
biophysical structure/process, functions, services, benefits,
and values. It also includes feedback from institutional and
human domains (Figure 5.1). A clear delineation between
ecological functions, their direct and indirect contribution
to human welfare (i.e., ecosystem services), and the welfare
gains they generate (i.e., benefi ts) is useful in avoiding double
counting that might arise because supporting and regulating
services are often inputs for the production of other services
(TEEB, 2010).
Costanza et al. (1997) suggested a classifi cation of ecosystem
services with 17 sub-items based on the idea that ecosystem
services are closely related with ecosystem functions.
Therefore, early studies on classifi cation of ecosystem services
tend to use “functions” rather than “ecosystem services”. For
example, de Groot et al. (2002) classifi ed ecosystem functions
into production, regulation, habitat, and information
functions with 23 sub-items.
The MA (2005) replaced “functions” with “ecosystem services”
and categorized them into provisioning, regulating,
cultural, and supporting services with 25 sub-items. The
provisioning services are the products people obtain from
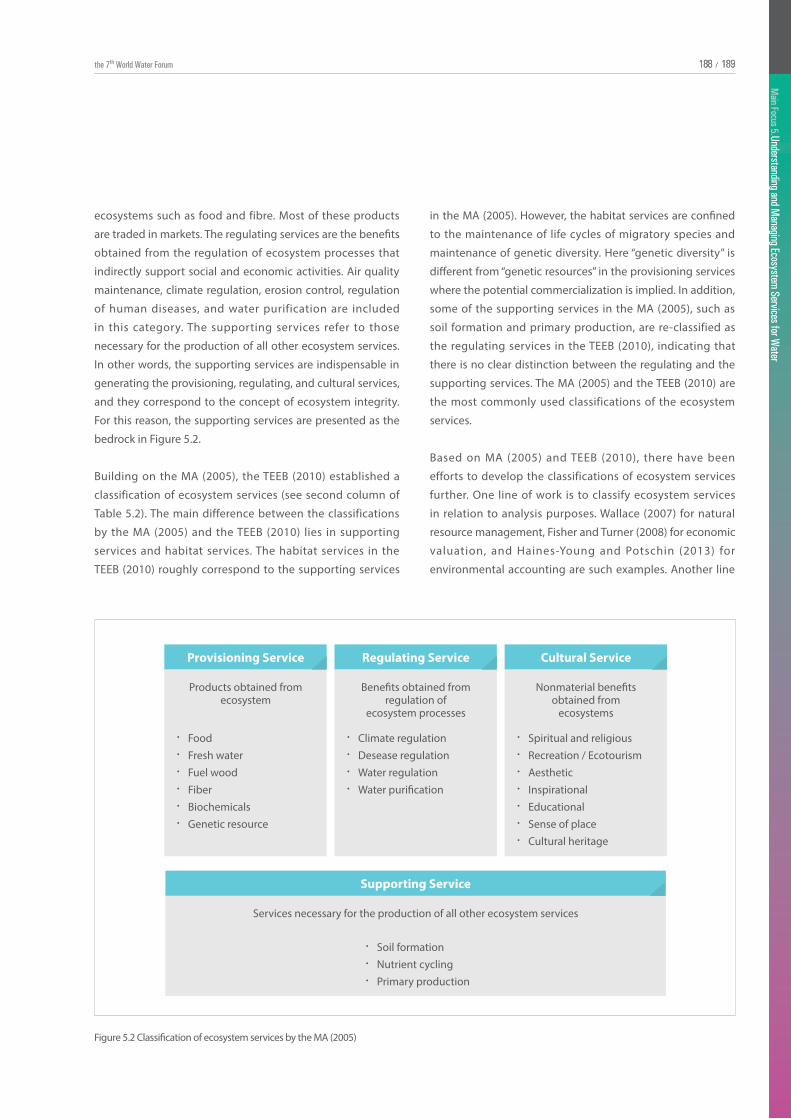
Main Focus 4. Smart Technology for W
ater
189188 /the 7th World Water Forum 188
Main Focus 5. Understanding and M
anaging Ecosystem Services for Water
189188 /188
Main Focus 5. Understanding and M
anaging Ecosystem Services for Water
189/
Figure 5.2 Classification of ecosystem services by the MA (2005)
Provisioning Service
FoodFresh waterFuel woodFiberBiochemicalsGenetic resource
Products obtained fromecosystem
ㆍㆍㆍㆍㆍㆍ
Supporting Service
Soil formationNutrient cyclingPrimary production
Services necessary for the production of all other ecosystem services
ㆍㆍㆍ
Regulating Service
Climate regulationDesease regulationWater regulationWater puri�cation
Bene�ts obtained fromregulation of
ecosystem processes
ㆍㆍㆍㆍ
Cultural Service
Spiritual and religiousRecreation / EcotourismAestheticInspirationalEducationalSense of placeCultural heritage
Nonmaterial bene�tsobtained from
ecosystems
ㆍㆍㆍㆍㆍㆍㆍ
ecosystems such as food and fibre. Most of these products
are traded in markets. The regulating services are the benefits
obtained from the regulation of ecosystem processes that
indirectly support social and economic activities. Air quality
maintenance, climate regulation, erosion control, regulation
of human diseases, and water purification are included
in this category. The supporting services refer to those
necessary for the production of all other ecosystem services.
In other words, the supporting services are indispensable in
generating the provisioning, regulating, and cultural services,
and they correspond to the concept of ecosystem integrity.
For this reason, the supporting services are presented as the
bedrock in Figure 5.2.
Building on the MA (2005), the TEEB (2010) established a
classification of ecosystem services (see second column of
Table 5.2). The main difference between the classifications
by the MA (2005) and the TEEB (2010) lies in supporting
services and habitat services. The habitat services in the
TEEB (2010) roughly correspond to the supporting services
in the MA (2005). However, the habitat services are confined
to the maintenance of life cycles of migratory species and
maintenance of genetic diversity. Here “genetic diversity” is
different from “genetic resources” in the provisioning services
where the potential commercialization is implied. In addition,
some of the supporting services in the MA (2005), such as
soil formation and primary production, are re-classified as
the regulating services in the TEEB (2010), indicating that
there is no clear distinction between the regulating and the
supporting services. The MA (2005) and the TEEB (2010) are
the most commonly used classifications of the ecosystem
services.
Based on MA (2005) and TEEB (2010), there have been
efforts to develop the classifications of ecosystem services
further. One line of work is to classify ecosystem services
in relation to analysis purposes. Wallace (2007) for natural
resource management, Fisher and Turner (2008) for economic
valuation, and Haines-Young and Potschin (2013) for
environmental accounting are such examples. Another line
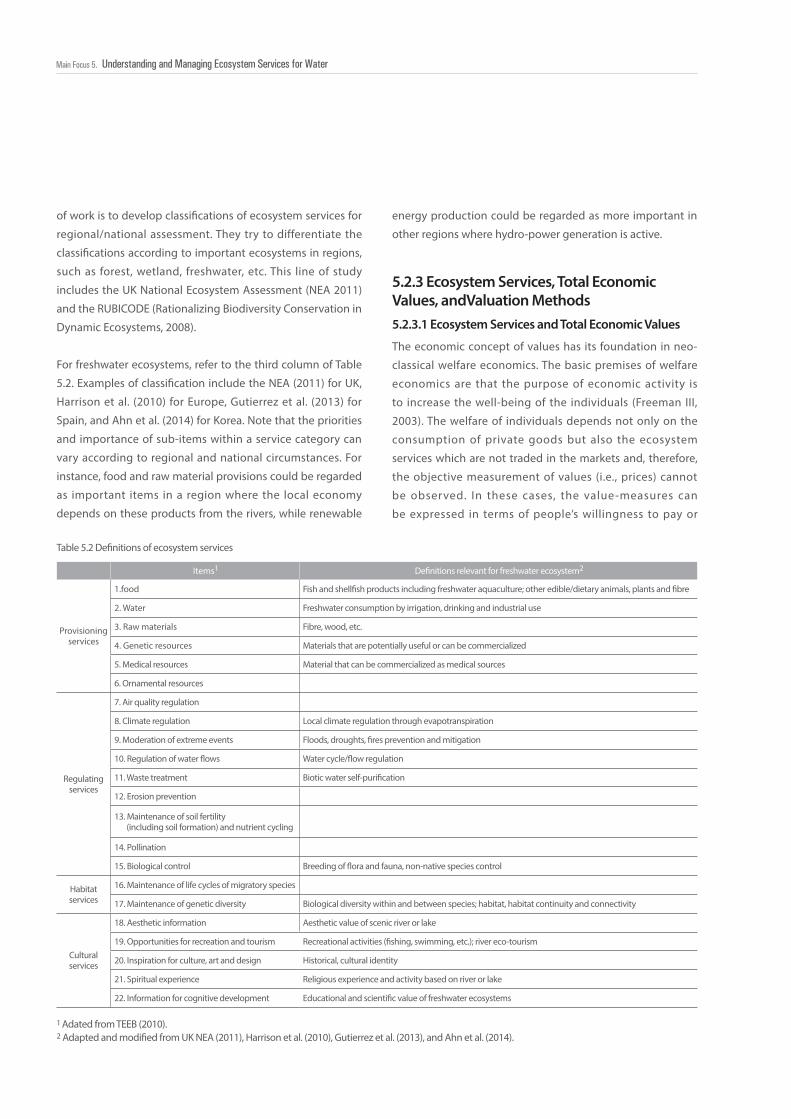
190190190190Main Focus 5. Understanding and Managing Ecosystem Services for Water
Table 5.2 Definitions of ecosystem services
5.2.3 Ecosystem Services, Total Economic Values, andValuation Methods5.2.3.1 Ecosystem Services and Total Economic Values
The economic concept of values has its foundation in neo-
classical welfare economics. The basic premises of welfare
economics are that the purpose of economic activity is
to increase the well-being of the individuals (Freeman III,
2003). The welfare of individuals depends not only on the
consumption of private goods but also the ecosystem
services which are not traded in the markets and, therefore,
the objective measurement of values (i.e., prices) cannot
be observed. In these cases, the value-measures can
be expressed in terms of people’s willingness to pay or
1 Adated from TEEB (2010).2 Adapted and modified from UK NEA (2011), Harrison et al. (2010), Gutierrez et al. (2013), and Ahn et al. (2014).
Items1 Definitions relevant for freshwater ecosystem2
Provisioning services
1.food Fish and shellfish products including freshwater aquaculture; other edible/dietary animals, plants and fibre
2. Water Freshwater consumption by irrigation, drinking and industrial use
3. Raw materials Fibre, wood, etc.
4. Genetic resources Materials that are potentially useful or can be commercialized
5. Medical resources Material that can be commercialized as medical sources
6. Ornamental resources
Regulating services
7. Air quality regulation
8. Climate regulation Local climate regulation through evapotranspiration
9. Moderation of extreme events Floods, droughts, fires prevention and mitigation
10. Regulation of water flows Water cycle/flow regulation
11. Waste treatment Biotic water self-purification
12. Erosion prevention
13. Maintenance of soil fertility (including soil formation) and nutrient cycling
14. Pollination
15. Biological control Breeding of flora and fauna, non-native species control
Habitat services
16. Maintenance of life cycles of migratory species
17. Maintenance of genetic diversity Biological diversity within and between species; habitat, habitat continuity and connectivity
Cultural services
18. Aesthetic information Aesthetic value of scenic river or lake
19. Opportunities for recreation and tourism Recreational activities (fishing, swimming, etc.); river eco-tourism
20. Inspiration for culture, art and design Historical, cultural identity
21. Spiritual experience Religious experience and activity based on river or lake
22. Information for cognitive development Educational and scientific value of freshwater ecosystems
of work is to develop classifications of ecosystem services for
regional/national assessment. They try to differentiate the
classifications according to important ecosystems in regions,
such as forest, wetland, freshwater, etc. This line of study
includes the UK National Ecosystem Assessment (NEA 2011)
and the RUBICODE (Rationalizing Biodiversity Conservation in
Dynamic Ecosystems, 2008).
For freshwater ecosystems, refer to the third column of Table
5.2. Examples of classification include the NEA (2011) for UK,
Harrison et al. (2010) for Europe, Gutierrez et al. (2013) for
Spain, and Ahn et al. (2014) for Korea. Note that the priorities
and importance of sub-items within a service category can
vary according to regional and national circumstances. For
instance, food and raw material provisions could be regarded
as important items in a region where the local economy
depends on these products from the rivers, while renewable
energy production could be regarded as more important in
other regions where hydro-power generation is active.
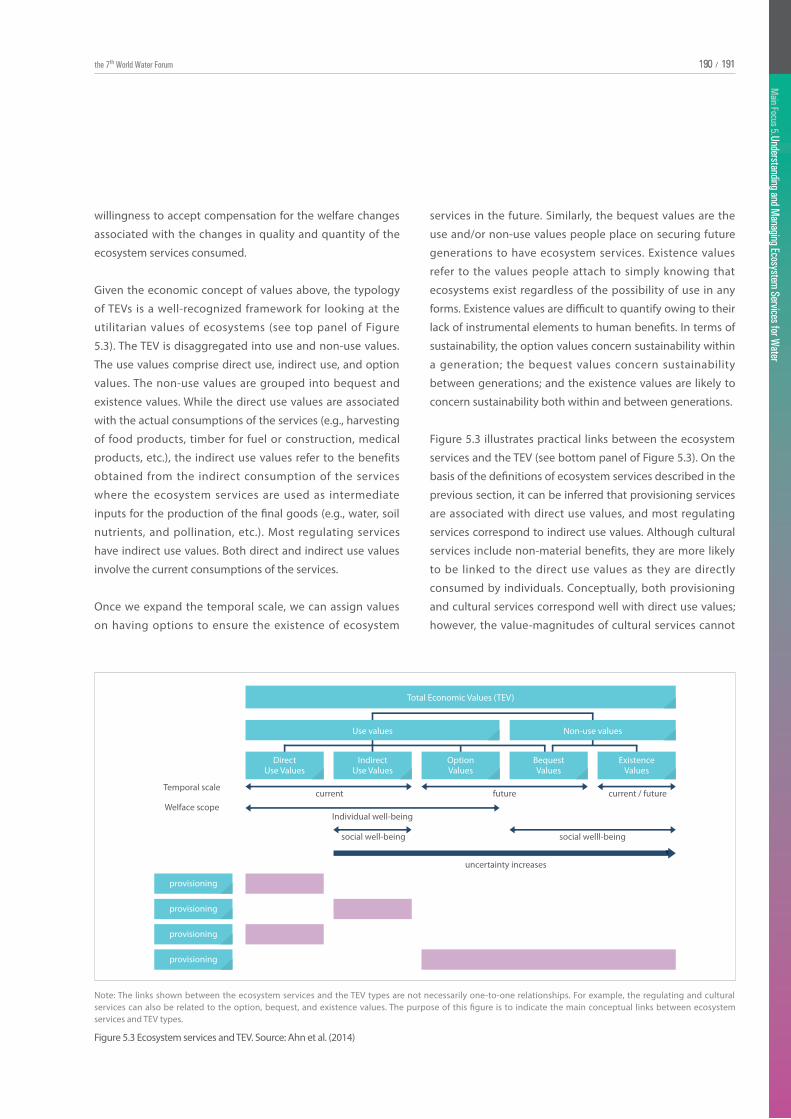
Main Focus 4. Smart Technology for W
ater
191190 /the 7th World Water Forum 190
Main Focus 5. Understanding and M
anaging Ecosystem Services for Water
191190 /190
Main Focus 5. Understanding and M
anaging Ecosystem Services for Water
191/
willingness to accept compensation for the welfare changes
associated with the changes in quality and quantity of the
ecosystem services consumed.
Given the economic concept of values above, the typology
of TEVs is a well-recognized framework for looking at the
utilitarian values of ecosystems (see top panel of Figure
5.3). The TEV is disaggregated into use and non-use values.
The use values comprise direct use, indirect use, and option
values. The non-use values are grouped into bequest and
existence values. While the direct use values are associated
with the actual consumptions of the services (e.g., harvesting
of food products, timber for fuel or construction, medical
products, etc.), the indirect use values refer to the benefits
obtained from the indirect consumption of the services
where the ecosystem services are used as intermediate
inputs for the production of the final goods (e.g., water, soil
nutrients, and pollination, etc.). Most regulating services
have indirect use values. Both direct and indirect use values
involve the current consumptions of the services.
Once we expand the temporal scale, we can assign values
on having options to ensure the existence of ecosystem
Temporal scale
Note : The links shown between the ecosystem services and the TEV types are not necessarily one-to-one relationships. For example, the regulating and cultural services can also be related to the option, bequest, and existence values. The purpose of this �gure is to indicate the main conceptual links between ecosystem services and TEV types.
current
Individual well-being
future current / futureWelface scope
provisioning
Use values Non-use values
DirectUse Values
IndirectUse Values
OptionValues
BequestValues
ExistenceValues
provisioning
provisioning
provisioning
Total Economic Values (TEV)
social well-being social welll-being
uncertainty increases
Note: The links shown between the ecosystem services and the TEV types are not necessarily one-to-one relationships. For example, the regulating and cultural services can also be related to the option, bequest, and existence values. The purpose of this figure is to indicate the main conceptual links between ecosystem services and TEV types.
Figure 5.3 Ecosystem services and TEV. Source: Ahn et al. (2014)
services in the future. Similarly, the bequest values are the
use and/or non-use values people place on securing future
generations to have ecosystem services. Existence values
refer to the values people attach to simply knowing that
ecosystems exist regardless of the possibility of use in any
forms. Existence values are difficult to quantify owing to their
lack of instrumental elements to human benefits. In terms of
sustainability, the option values concern sustainability within
a generation; the bequest values concern sustainability
between generations; and the existence values are likely to
concern sustainability both within and between generations.
Figure 5.3 illustrates practical links between the ecosystem
services and the TEV (see bottom panel of Figure 5.3). On the
basis of the definitions of ecosystem services described in the
previous section, it can be inferred that provisioning services
are associated with direct use values, and most regulating
services correspond to indirect use values. Although cultural
services include non-material benefits, they are more likely
to be linked to the direct use values as they are directly
consumed by individuals. Conceptually, both provisioning
and cultural services correspond well with direct use values;
however, the value-magnitudes of cultural services cannot
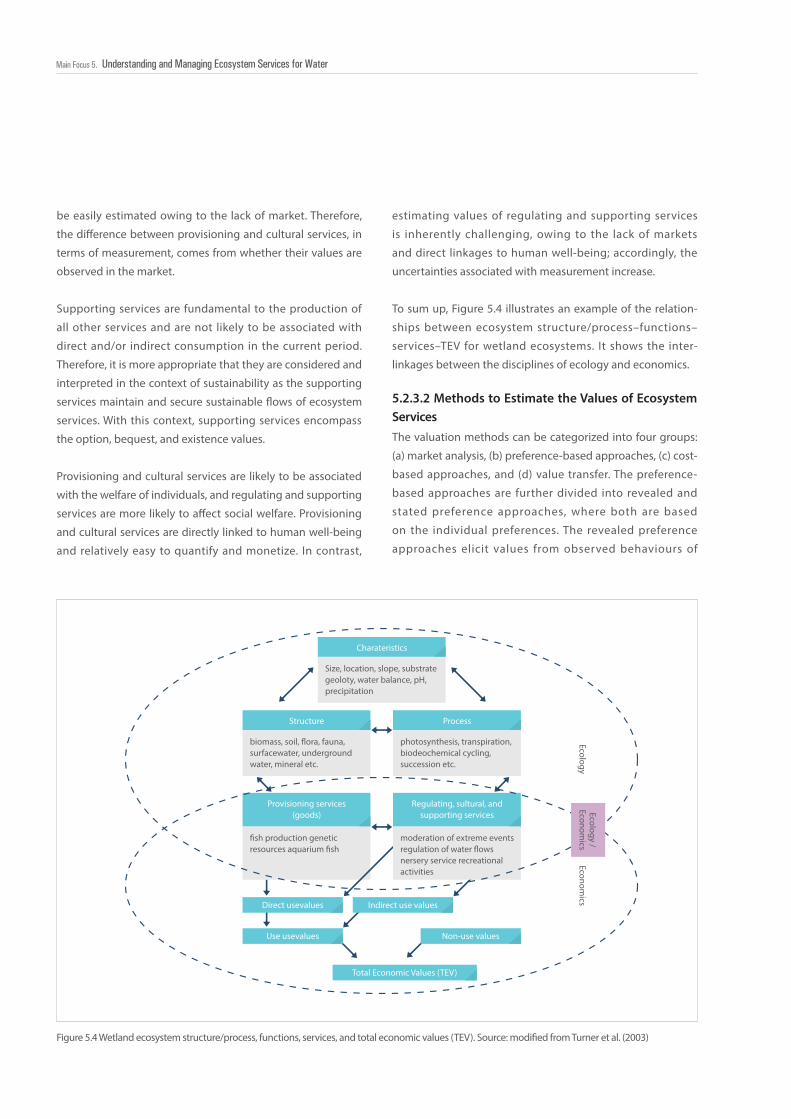
192192192192Main Focus 5. Understanding and Managing Ecosystem Services for Water
Figure 5.4 Wetland ecosystem structure/process, functions, services, and total economic values (TEV). Source: modified from Turner et al. (2003)
The valuation methods can be categorized into four groups:
(a) market analysis, (b) preference-based approaches, (c) cost-
based approaches, and (d) value transfer. The preference-
based approaches are further divided into revealed and
stated preference approaches, where both are based
on the individual preferences. The revealed preference
approaches elicit values from observed behaviours of
5.2.3.2 Methods to Estimate the Values of Ecosystem Services
EcologyEconom
ics
Direct usevalues
Use usevalues Non-use values
Indirect use values
Charateristics
ProcessStructure
Regulating, sultural, andsupporting services
Provisioning services(goods)
�sh production geneticresources aquarium �sh
photosynthesis, transpiration,biodeochemical cycling,succession etc.
biomass, soil, �ora, fauna,surfacewater, underground water, mineral etc.
Size, location, slope, substrategeoloty, water balance, pH,precipitation
Total Economic Values (TEV)
moderation of extreme eventsregulation of water �owsnersery service recreationalactivities
Ecology /Econom
icsbe easily estimated owing to the lack of market. Therefore,
the difference between provisioning and cultural services, in
terms of measurement, comes from whether their values are
observed in the market.
Supporting services are fundamental to the production of
all other services and are not likely to be associated with
direct and/or indirect consumption in the current period.
Therefore, it is more appropriate that they are considered and
interpreted in the context of sustainability as the supporting
services maintain and secure sustainable flows of ecosystem
services. With this context, supporting services encompass
the option, bequest, and existence values.
Provisioning and cultural services are likely to be associated
with the welfare of individuals, and regulating and supporting
services are more likely to affect social welfare. Provisioning
and cultural services are directly linked to human well-being
and relatively easy to quantify and monetize. In contrast,
estimating values of regulating and supporting services
is inherently challenging, owing to the lack of markets
and direct linkages to human well-being; accordingly, the
uncertainties associated with measurement increase.
To sum up, Figure 5.4 illustrates an example of the relation-
ships between ecosystem structure/process–functions–
services–TEV for wetland ecosystems. It shows the inter-
linkages between the disciplines of ecology and economics.
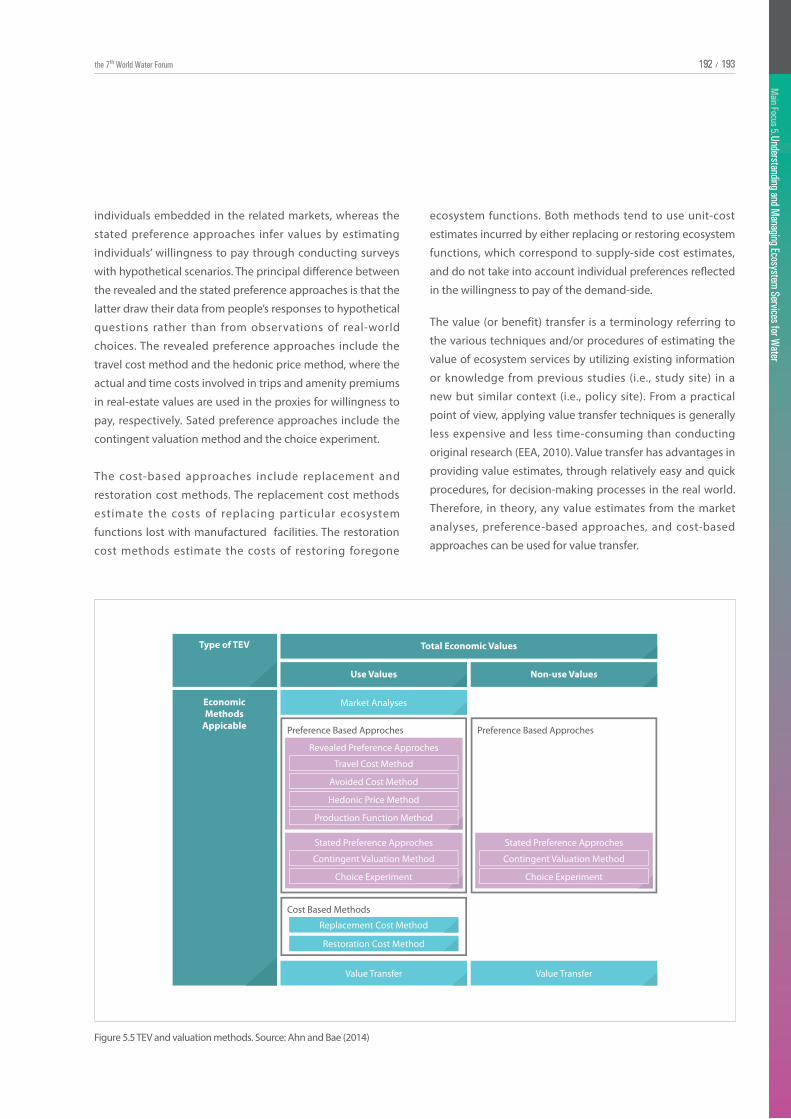
Main Focus 4. Smart Technology for W
ater
193192 /the 7th World Water Forum 192
Main Focus 5. Understanding and M
anaging Ecosystem Services for Water
193192 /192
Main Focus 5. Understanding and M
anaging Ecosystem Services for Water
193/
Figure 5.5 TEV and valuation methods. Source: Ahn and Bae (2014)
individuals embedded in the related markets, whereas the
stated preference approaches infer values by estimating
individuals’ willingness to pay through conducting surveys
with hypothetical scenarios. The principal difference between
the revealed and the stated preference approaches is that the
latter draw their data from people’s responses to hypothetical
questions rather than from observations of real-world
choices. The revealed preference approaches include the
travel cost method and the hedonic price method, where the
actual and time costs involved in trips and amenity premiums
in real-estate values are used in the proxies for willingness to
pay, respectively. Sated preference approaches include the
contingent valuation method and the choice experiment.
The cost-based approaches include replacement and
restoration cost methods. The replacement cost methods
estimate the costs of replacing particular ecosystem
functions lost with manufactured facilities. The restoration
cost methods estimate the costs of restoring foregone
ecosystem functions. Both methods tend to use unit-cost
estimates incurred by either replacing or restoring ecosystem
functions, which correspond to supply-side cost estimates,
and do not take into account individual preferences reflected
in the willingness to pay of the demand-side.
The value (or benefit) transfer is a terminology referring to
the various techniques and/or procedures of estimating the
value of ecosystem services by utilizing existing information
or knowledge from previous studies (i.e., study site) in a
new but similar context (i.e., policy site). From a practical
point of view, applying value transfer techniques is generally
less expensive and less time-consuming than conducting
original research (EEA, 2010). Value transfer has advantages in
providing value estimates, through relatively easy and quick
procedures, for decision-making processes in the real world.
Therefore, in theory, any value estimates from the market
analyses, preference-based approaches, and cost-based
approaches can be used for value transfer.
Type of TEV
EconomicMethods
Appicable
Total Economic Values
Preference Based Approches
Cost Based Methods
Use Values
Market Analyses
Value Transfer Value Transfer
Replacement Cost Method
Restoration Cost Method
Non-use Values
Travel Cost Method
Avoided Cost Method
Hedonic Price Method
Production Function Method
Revealed Preference Approches
Contingent Valuation Method
Choice Experiment
Stated Preference Approches
Preference Based Approches
Contingent Valuation Method
Choice Experiment
Stated Preference Approches
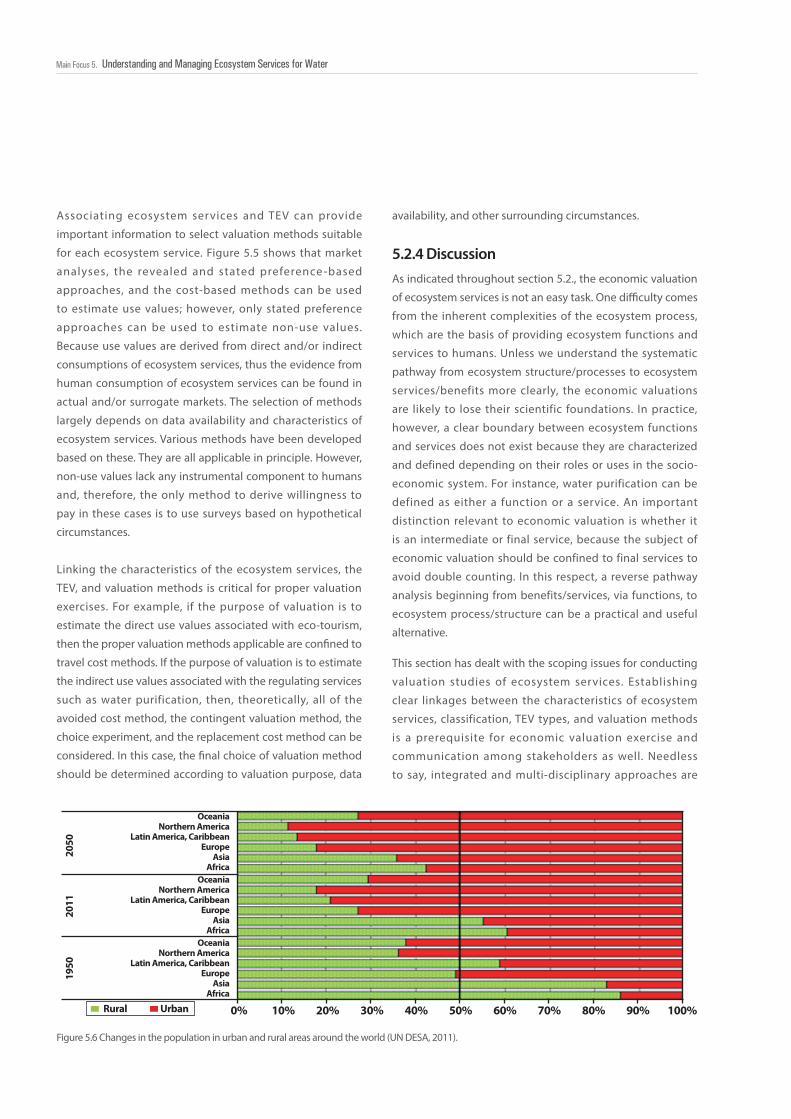
194194194194Main Focus 5. Understanding and Managing Ecosystem Services for Water
Associating ecosystem services and TEV can provide
important information to select valuation methods suitable
for each ecosystem service. Figure 5.5 shows that market
analyses, the revealed and stated preference -based
approaches, and the cost-based methods can be used
to estimate use values; however, only stated preference
approaches can be used to estimate non-use values.
Because use values are derived from direct and/or indirect
consumptions of ecosystem services, thus the evidence from
human consumption of ecosystem services can be found in
actual and/or surrogate markets. The selection of methods
largely depends on data availability and characteristics of
ecosystem services. Various methods have been developed
based on these. They are all applicable in principle. However,
non-use values lack any instrumental component to humans
and, therefore, the only method to derive willingness to
pay in these cases is to use surveys based on hypothetical
circumstances.
Linking the characteristics of the ecosystem services, the
TEV, and valuation methods is critical for proper valuation
exercises. For example, if the purpose of valuation is to
estimate the direct use values associated with eco-tourism,
then the proper valuation methods applicable are confined to
travel cost methods. If the purpose of valuation is to estimate
the indirect use values associated with the regulating services
such as water purification, then, theoretically, all of the
avoided cost method, the contingent valuation method, the
choice experiment, and the replacement cost method can be
considered. In this case, the final choice of valuation method
should be determined according to valuation purpose, data
As indicated throughout section 5.2., the economic valuation
of ecosystem services is not an easy task. One difficulty comes
from the inherent complexities of the ecosystem process,
which are the basis of providing ecosystem functions and
services to humans. Unless we understand the systematic
pathway from ecosystem structure/processes to ecosystem
services/benefits more clearly, the economic valuations
are likely to lose their scientific foundations. In practice,
however, a clear boundary between ecosystem functions
and services does not exist because they are characterized
and defined depending on their roles or uses in the socio-
economic system. For instance, water purification can be
defined as either a function or a service. An important
distinction relevant to economic valuation is whether it
is an intermediate or final service, because the subject of
economic valuation should be confined to final services to
avoid double counting. In this respect, a reverse pathway
analysis beginning from benefits/services, via functions, to
ecosystem process/structure can be a practical and useful
alternative.
This section has dealt with the scoping issues for conducting
valuation studies of ecosystem services. Establishing
clear linkages between the characteristics of ecosystem
services, classification, TEV types, and valuation methods
is a prerequisite for economic valuation exercise and
communication among stakeholders as well. Needless
to say, integrated and multi-disciplinary approaches are
5.2.4 Discussion
Figure 5.6 Changes in the population in urban and rural areas around the world (UN DESA, 2011).
0%
2050
OceaniaNorthern America
Latin America, CaribbeanEurope
AsiaAfrica
Rural Urban
OceaniaNorthern America
Latin America, CaribbeanEurope
AsiaAfrica
OceaniaNorthern America
Latin America, CaribbeanEurope
AsiaAfrica
2011
1950
10% 20% 30% 40% 50% 60% 70% 80% 90% 100%
availability, and other surrounding circumstances.
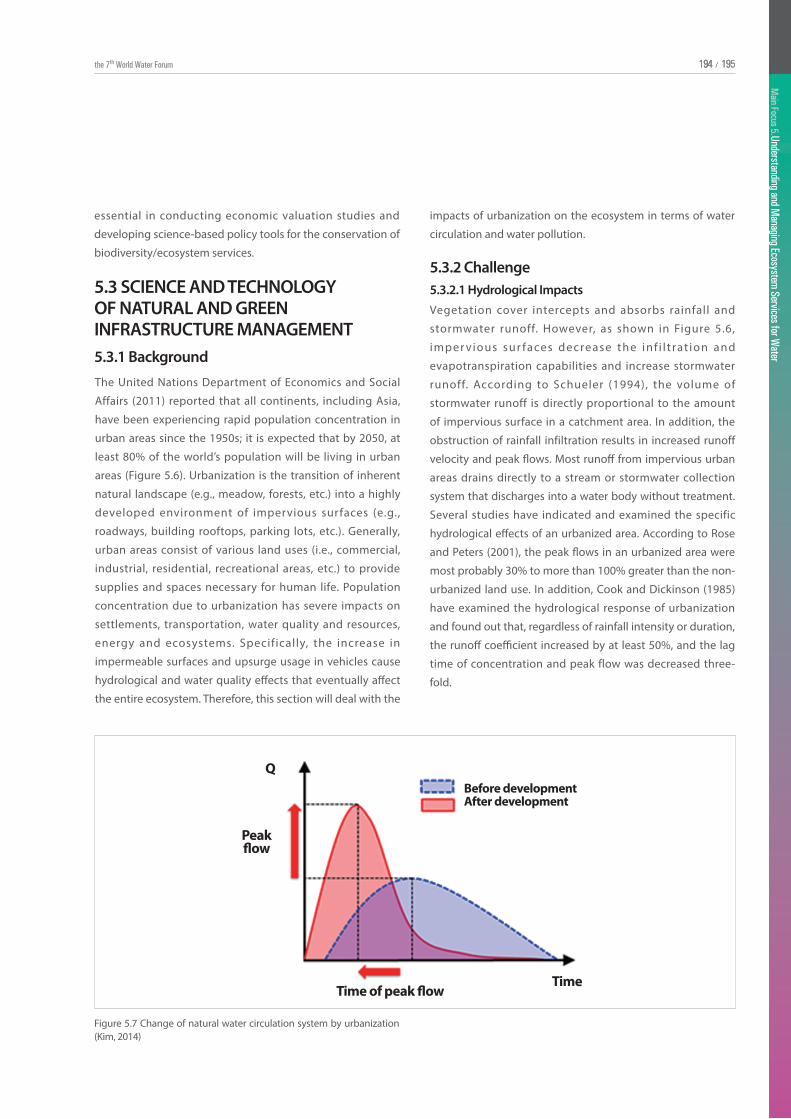
Main Focus 4. Smart Technology for W
ater
195194 /the 7th World Water Forum 194
Main Focus 5. Understanding and M
anaging Ecosystem Services for Water
195194 /194
Main Focus 5. Understanding and M
anaging Ecosystem Services for Water
195/
5.3.1 Background
5.3 SCIENCE AND TECHNOLOGY OF NATURAL AND GREEN INFRASTRUCTURE MANAGEMENT
The United Nations Department of Economics and Social
Affairs (2011) reported that all continents, including Asia,
have been experiencing rapid population concentration in
urban areas since the 1950s; it is expected that by 2050, at
least 80% of the world’s population will be living in urban
areas (Figure 5.6). Urbanization is the transition of inherent
natural landscape (e.g., meadow, forests, etc.) into a highly
developed environment of impervious surfaces (e.g.,
roadways, building rooftops, parking lots, etc.). Generally,
urban areas consist of various land uses (i.e., commercial,
industrial, residential, recreational areas, etc.) to provide
supplies and spaces necessary for human life. Population
concentration due to urbanization has severe impacts on
settlements, transportation, water quality and resources,
energy and ecosystems. Specifically, the increase in
impermeable surfaces and upsurge usage in vehicles cause
hydrological and water quality effects that eventually affect
the entire ecosystem. Therefore, this section will deal with the
5.3.2 Challenge5.3.2.1 Hydrological ImpactsVegetation cover intercepts and absorbs rainfall and
stormwater runoff. However, as shown in Figure 5.6,
imper vious sur faces decrease the inf i l t rat ion and
evapotranspiration capabilities and increase stormwater
runoff. According to Schueler (1994), the volume of
stormwater runoff is directly proportional to the amount
of impervious surface in a catchment area. In addition, the
obstruction of rainfall infiltration results in increased runoff
velocity and peak flows. Most runoff from impervious urban
areas drains directly to a stream or stormwater collection
system that discharges into a water body without treatment.
Several studies have indicated and examined the specific
hydrological effects of an urbanized area. According to Rose
and Peters (2001), the peak flows in an urbanized area were
most probably 30% to more than 100% greater than the non-
urbanized land use. In addition, Cook and Dickinson (1985)
have examined the hydrological response of urbanization
and found out that, regardless of rainfall intensity or duration,
the runoff coefficient increased by at least 50%, and the lag
time of concentration and peak flow was decreased three-
fold.
Figure 5.7 Change of natural water circulation system by urbanization (Kim, 2014)
Q
Peak�ow
Time of peak �owTime
Before developmentAfter development
essential in conducting economic valuation studies and
developing science-based policy tools for the conservation of
biodiversity/ecosystem services.
impacts of urbanization on the ecosystem in terms of water
circulation and water pollution.
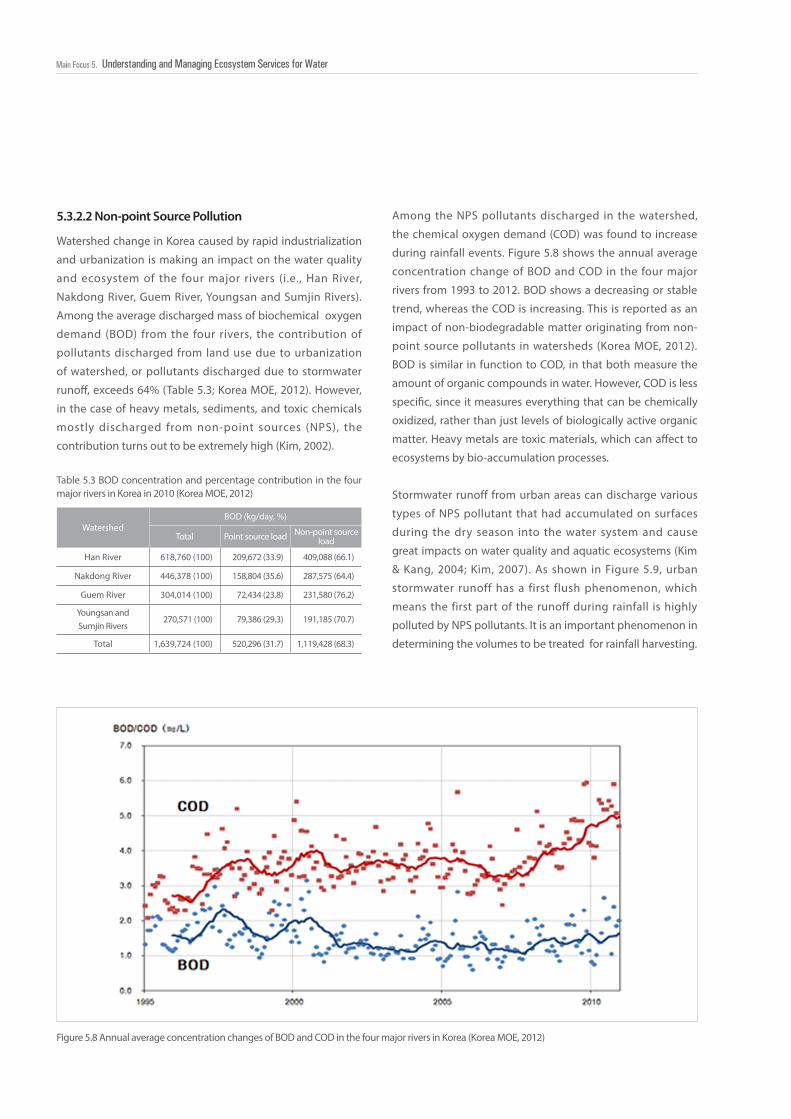
196196196196Main Focus 5. Understanding and Managing Ecosystem Services for Water
Figure 5.8 Annual average concentration changes of BOD and COD in the four major rivers in Korea (Korea MOE, 2012)
Table 5.3 BOD concentration and percentage contribution in the four major rivers in Korea in 2010 (Korea MOE, 2012)
5.3.2.2 Non-point Source Pollution
Watershed change in Korea caused by rapid industrialization
and urbanization is making an impact on the water quality
and ecosystem of the four major rivers (i.e., Han River,
Nakdong River, Guem River, Youngsan and Sumjin Rivers).
Among the average discharged mass of biochemical oxygen
demand (BOD) from the four rivers, the contribution of
pollutants discharged from land use due to urbanization
of watershed, or pollutants discharged due to stormwater
runoff, exceeds 64% (Table 5.3; Korea MOE, 2012). However,
in the case of heavy metals, sediments, and toxic chemicals
mostly discharged from non-point sources (NPS), the
contribution turns out to be extremely high (Kim, 2002).
Among the NPS pollutants discharged in the watershed,
the chemical oxygen demand (COD) was found to increase
during rainfall events. Figure 5.8 shows the annual average
concentration change of BOD and COD in the four major
rivers from 1993 to 2012. BOD shows a decreasing or stable
trend, whereas the COD is increasing. This is reported as an
impact of non-biodegradable matter originating from non-
point source pollutants in watersheds (Korea MOE, 2012).
BOD is similar in function to COD, in that both measure the
amount of organic compounds in water. However, COD is less
specific, since it measures everything that can be chemically
oxidized, rather than just levels of biologically active organic
matter. Heavy metals are toxic materials, which can affect to
ecosystems by bio-accumulation processes.
Stormwater runoff from urban areas can discharge various
types of NPS pollutant that had accumulated on surfaces
during the dry season into the water system and cause
great impacts on water quality and aquatic ecosystems (Kim
& Kang, 2004; Kim, 2007). As shown in Figure 5.9, urban
stormwater runoff has a first flush phenomenon, which
means the first part of the runoff during rainfall is highly
polluted by NPS pollutants. It is an important phenomenon in
determining the volumes to be treated for rainfall harvesting.
WatershedBOD (kg/day, %)
Total Point source load Non-point source load
Han River 618,760 (100) 209,672 (33.9) 409,088 (66.1)
Nakdong River 446,378 (100) 158,804 (35.6) 287,575 (64.4)
Guem River 304,014 (100) 72,434 (23.8) 231,580 (76.2)
Youngsan and Sumjin Rivers
270,571 (100) 79,386 (29.3) 191,185 (70.7)
Total 1,639,724 (100) 520,296 (31.7) 1,119,428 (68.3)
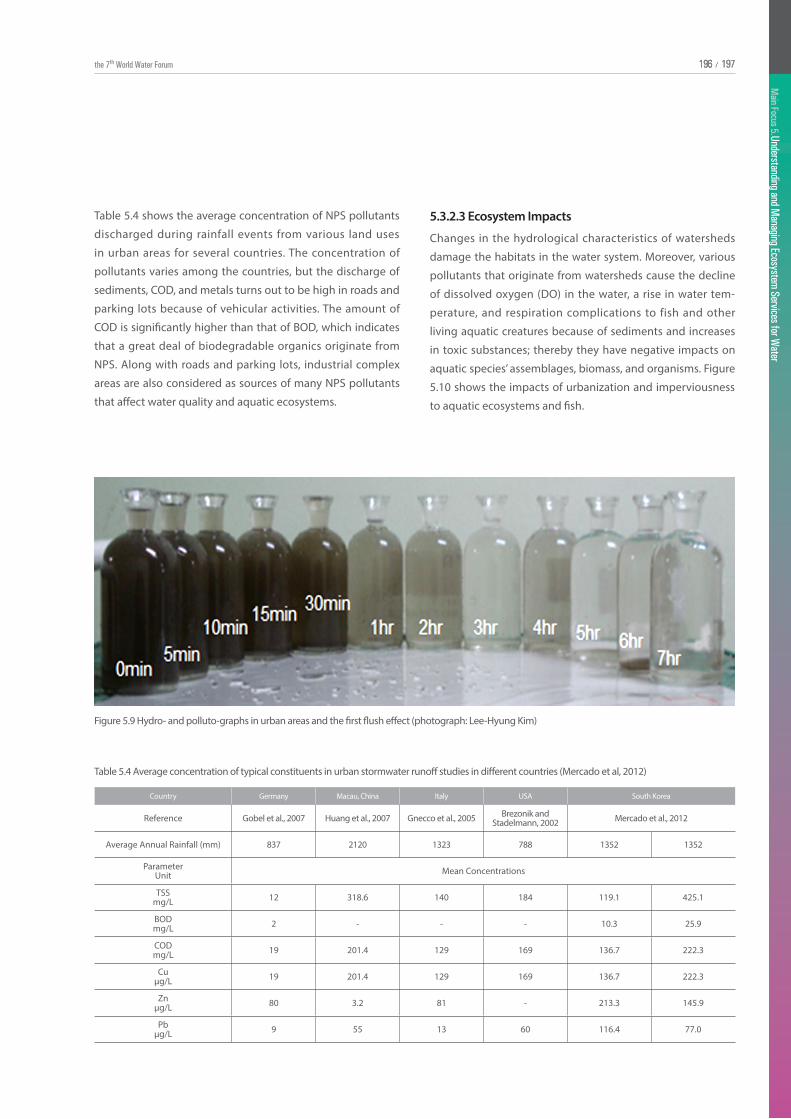
Main Focus 4. Smart Technology for W
ater
197196 /the 7th World Water Forum 196
Main Focus 5. Understanding and M
anaging Ecosystem Services for Water
197196 /196
Main Focus 5. Understanding and M
anaging Ecosystem Services for Water
197/
Figure 5.9 Hydro- and polluto-graphs in urban areas and the first flush effect (photograph: Lee-Hyung Kim)
Table 5.4 shows the average concentration of NPS pollutants
discharged during rainfall events from various land uses
in urban areas for several countries. The concentration of
pollutants varies among the countries, but the discharge of
sediments, COD, and metals turns out to be high in roads and
parking lots because of vehicular activities. The amount of
COD is significantly higher than that of BOD, which indicates
that a great deal of biodegradable organics originate from
NPS. Along with roads and parking lots, industrial complex
areas are also considered as sources of many NPS pollutants
that affect water quality and aquatic ecosystems.
Table 5.4 Average concentration of typical constituents in urban stormwater runoff studies in different countries (Mercado et al, 2012)
Country Germany Macau, China Italy USA South Korea
Reference Gobel et al., 2007 Huang et al., 2007 Gnecco et al., 2005 Brezonik and Stadelmann, 2002 Mercado et al., 2012
Average Annual Rainfall (mm) 837 2120 1323 788 1352 1352
ParameterUnit Mean Concentrations
TSS mg/L 12 318.6 140 184 119.1 425.1
BOD mg/L 2 - - - 10.3 25.9
COD mg/L 19 201.4 129 169 136.7 222.3
Cu µg/L 19 201.4 129 169 136.7 222.3
Znµg/L 80 3.2 81 - 213.3 145.9
Pbµg/L 9 55 13 60 116.4 77.0
Changes in the hydrological characteristics of watersheds
damage the habitats in the water system. Moreover, various
pollutants that originate from watersheds cause the decline
of dissolved oxygen (DO) in the water, a rise in water tem-
perature, and respiration complications to fish and other
living aquatic creatures because of sediments and increases
in toxic substances; thereby they have negative impacts on
aquatic species’ assemblages, biomass, and organisms. Figure
5.10 shows the impacts of urbanization and imperviousness
to aquatic ecosystems and fish.
5.3.2.3 Ecosystem Impacts
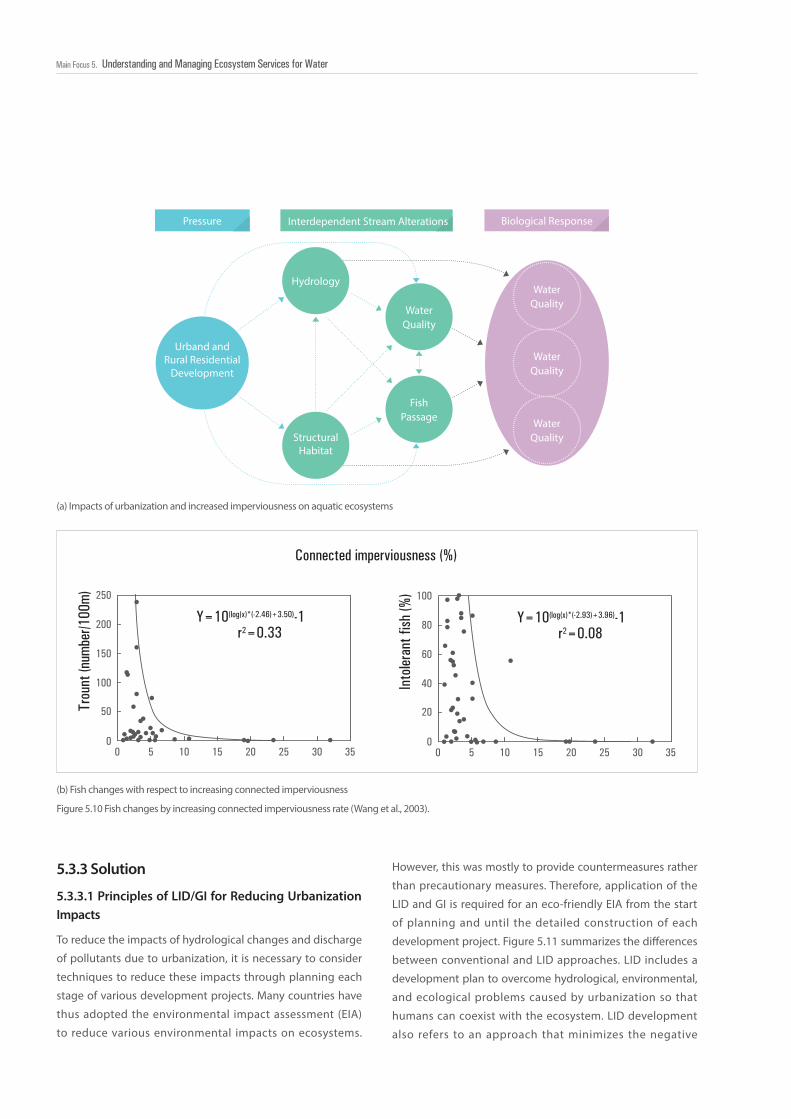
198198198198Main Focus 5. Understanding and Managing Ecosystem Services for Water
To reduce the impacts of hydrological changes and discharge
of pollutants due to urbanization, it is necessary to consider
techniques to reduce these impacts through planning each
stage of various development projects. Many countries have
thus adopted the environmental impact assessment (EIA)
to reduce various environmental impacts on ecosystems.
(a) Impacts of urbanization and increased imperviousness on aquatic ecosystems
(b) Fish changes with respect to increasing connected imperviousness
5.3.3 Solution
5.3.3.1 Principles of LID/GI for Reducing Urbanization Impacts
Figure 5.10 Fish changes by increasing connected imperviousness rate (Wang et al., 2003).
Pressure Biological Response
Urband andRural Residential
Development
WaterQuality
WaterQuality
WaterQuality
WaterQuality
FishPassage
Hydrology
StructuralHabitat
Interdependent Stream Alterations
Connected imperviousness (%)
10500
50
100
150
200
250
Y=10(log(x)*(-2.46)+3.50)-1
Trou
nt (n
umbe
r/100
m)
r2=0.33
15 20 25 30 35
Into
leran
t fish
(%)
10500
20
40
60
80
100
Y=10(log(x)*(-2.93)+3.96)-1r2=0.08
15 20 25 30 35
However, this was mostly to provide countermeasures rather
than precautionary measures. Therefore, application of the
LID and GI is required for an eco-friendly EIA from the start
of planning and until the detailed construction of each
development project. Figure 5.11 summarizes the differences
between conventional and LID approaches. LID includes a
development plan to overcome hydrological, environmental,
and ecological problems caused by urbanization so that
humans can coexist with the ecosystem. LID development
also refers to an approach that minimizes the negative
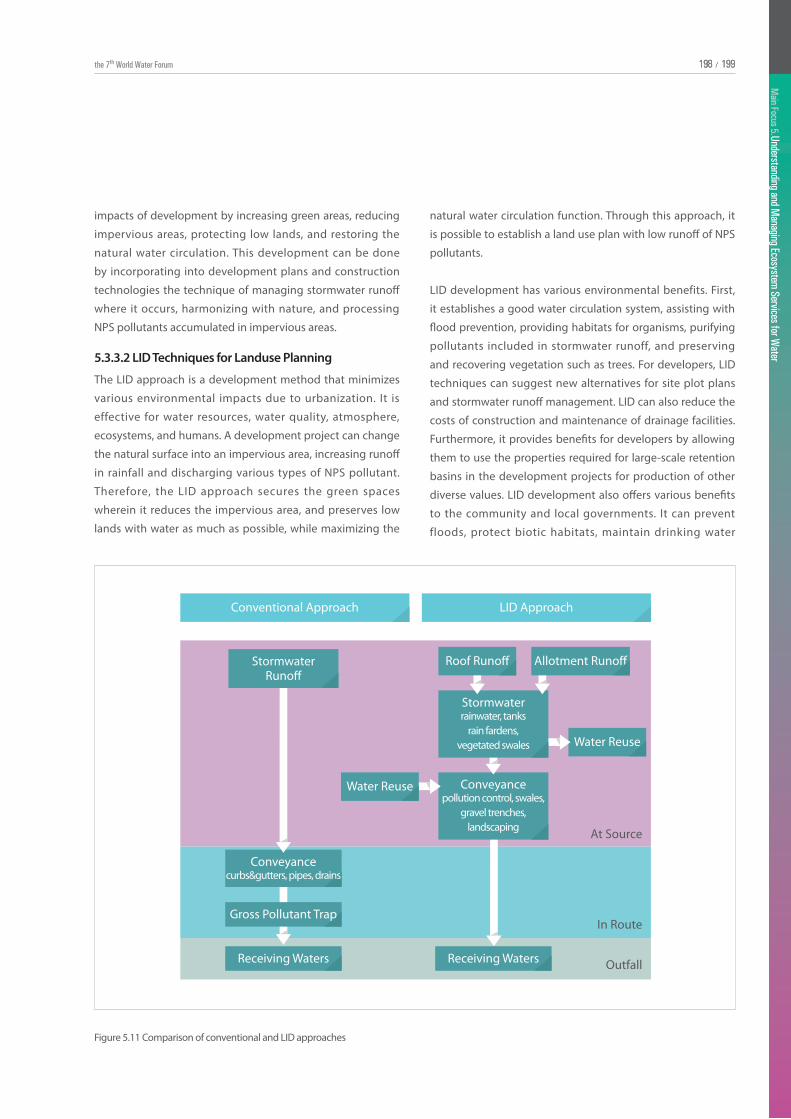
Main Focus 4. Smart Technology for W
ater
199198 /the 7th World Water Forum 198
Main Focus 5. Understanding and M
anaging Ecosystem Services for Water
199198 /198
Main Focus 5. Understanding and M
anaging Ecosystem Services for Water
199/
Figure 5.11 Comparison of conventional and LID approaches
Water Reuse
At Source
In Route
Outfall
Conventional Approach LID Approach
Stormwaterrainwater, tanks
rain fardens,vegetated swales
Conveyancepollution control, swales,
gravel trenches,landscaping
StormwaterRuno�
Roof Runo� Allotment Runo�
Water Reuse
Conveyance
Gross Pollutant Trap
Receiving Waters Receiving Waters
curbs&gutters, pipes, drains
5.3.3.2 LID Techniques for Landuse Planning
The LID approach is a development method that minimizes
various environmental impacts due to urbanization. It is
effective for water resources, water quality, atmosphere,
ecosystems, and humans. A development project can change
the natural surface into an impervious area, increasing runoff
in rainfall and discharging various types of NPS pollutant.
Therefore, the LID approach secures the green spaces
wherein it reduces the impervious area, and preserves low
lands with water as much as possible, while maximizing the
impacts of development by increasing green areas, reducing
impervious areas, protecting low lands, and restoring the
natural water circulation. This development can be done
by incorporating into development plans and construction
technologies the technique of managing stormwater runoff
where it occurs, harmonizing with nature, and processing
NPS pollutants accumulated in impervious areas.
natural water circulation function. Through this approach, it
is possible to establish a land use plan with low runoff of NPS
pollutants.
LID development has various environmental benefits. First,
it establishes a good water circulation system, assisting with
flood prevention, providing habitats for organisms, purifying
pollutants included in stormwater runoff, and preserving
and recovering vegetation such as trees. For developers, LID
techniques can suggest new alternatives for site plot plans
and stormwater runoff management. LID can also reduce the
costs of construction and maintenance of drainage facilities.
Furthermore, it provides benefits for developers by allowing
them to use the properties required for large-scale retention
basins in the development projects for production of other
diverse values. LID development also offers various benefits
to the community and local governments. It can prevent
floods, protect biotic habitats, maintain drinking water
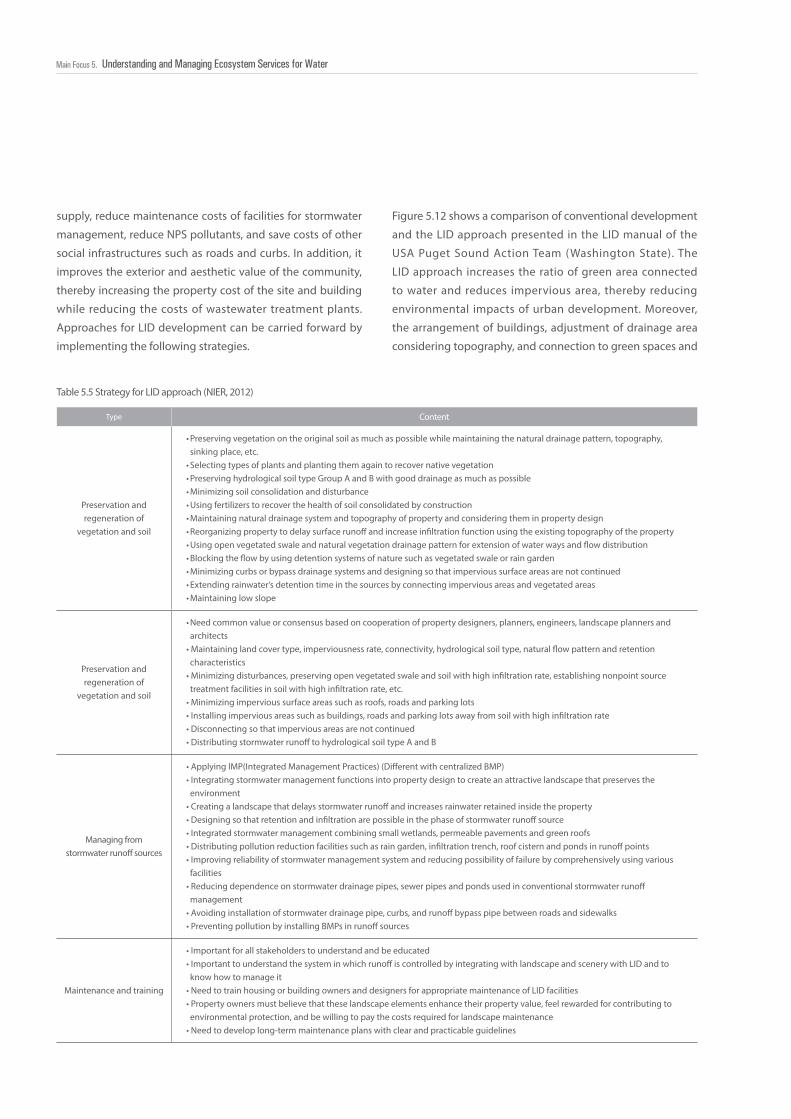
200200200200Main Focus 5. Understanding and Managing Ecosystem Services for Water
Table 5.5 Strategy for LID approach (NIER, 2012)
Type Content
Preservation and regeneration of
vegetation and soil
• Preserving vegetation on the original soil as much as possible while maintaining the natural drainage pattern, topography, sinking place, etc.
• Selecting types of plants and planting them again to recover native vegetation• Preserving hydrological soil type Group A and B with good drainage as much as possible• Minimizing soil consolidation and disturbance• Using fertilizers to recover the health of soil consolidated by construction• Maintaining natural drainage system and topography of property and considering them in property design• Reorganizing property to delay surface runoff and increase infiltration function using the existing topography of the property• Using open vegetated swale and natural vegetation drainage pattern for extension of water ways and flow distribution• Blocking the flow by using detention systems of nature such as vegetated swale or rain garden• Minimizing curbs or bypass drainage systems and designing so that impervious surface areas are not continued• Extending rainwater’s detention time in the sources by connecting impervious areas and vegetated areas• Maintaining low slope
Preservation and regeneration of
vegetation and soil
• Need common value or consensus based on cooperation of property designers, planners, engineers, landscape planners and architects
• Maintaining land cover type, imperviousness rate, connectivity, hydrological soil type, natural flow pattern and retention characteristics
• Minimizing disturbances, preserving open vegetated swale and soil with high infiltration rate, establishing nonpoint source treatment facilities in soil with high infiltration rate, etc.
• Minimizing impervious surface areas such as roofs, roads and parking lots• Installing impervious areas such as buildings, roads and parking lots away from soil with high infiltration rate• Disconnecting so that impervious areas are not continued• Distributing stormwater runoff to hydrological soil type A and B
Managing from stormwater runoff sources
• Applying IMP(Integrated Management Practices) (Different with centralized BMP)• Integrating stormwater management functions into property design to create an attractive landscape that preserves the environment
• Creating a landscape that delays stormwater runoff and increases rainwater retained inside the property• Designing so that retention and infiltration are possible in the phase of stormwater runoff source• Integrated stormwater management combining small wetlands, permeable pavements and green roofs• Distributing pollution reduction facilities such as rain garden, infiltration trench, roof cistern and ponds in runoff points• Improving reliability of stormwater management system and reducing possibility of failure by comprehensively using various facilities
• Reducing dependence on stormwater drainage pipes, sewer pipes and ponds used in conventional stormwater runoff management
• Avoiding installation of stormwater drainage pipe, curbs, and runoff bypass pipe between roads and sidewalks• Preventing pollution by installing BMPs in runoff sources
Maintenance and training
• Important for all stakeholders to understand and be educated• Important to understand the system in which runoff is controlled by integrating with landscape and scenery with LID and to know how to manage it
• Need to train housing or building owners and designers for appropriate maintenance of LID facilities• Property owners must believe that these landscape elements enhance their property value, feel rewarded for contributing to environmental protection, and be willing to pay the costs required for landscape maintenance
• Need to develop long-term maintenance plans with clear and practicable guidelines
supply, reduce maintenance costs of facilities for stormwater
management, reduce NPS pollutants, and save costs of other
social infrastructures such as roads and curbs. In addition, it
improves the exterior and aesthetic value of the community,
thereby increasing the property cost of the site and building
while reducing the costs of wastewater treatment plants.
Approaches for LID development can be carried forward by
implementing the following strategies.
Figure 5.12 shows a comparison of conventional development
and the LID approach presented in the LID manual of the
USA Puget Sound Action Team (Washington State). The
LID approach increases the ratio of green area connected
to water and reduces impervious area, thereby reducing
environmental impacts of urban development. Moreover,
the arrangement of buildings, adjustment of drainage area
considering topography, and connection to green spaces and
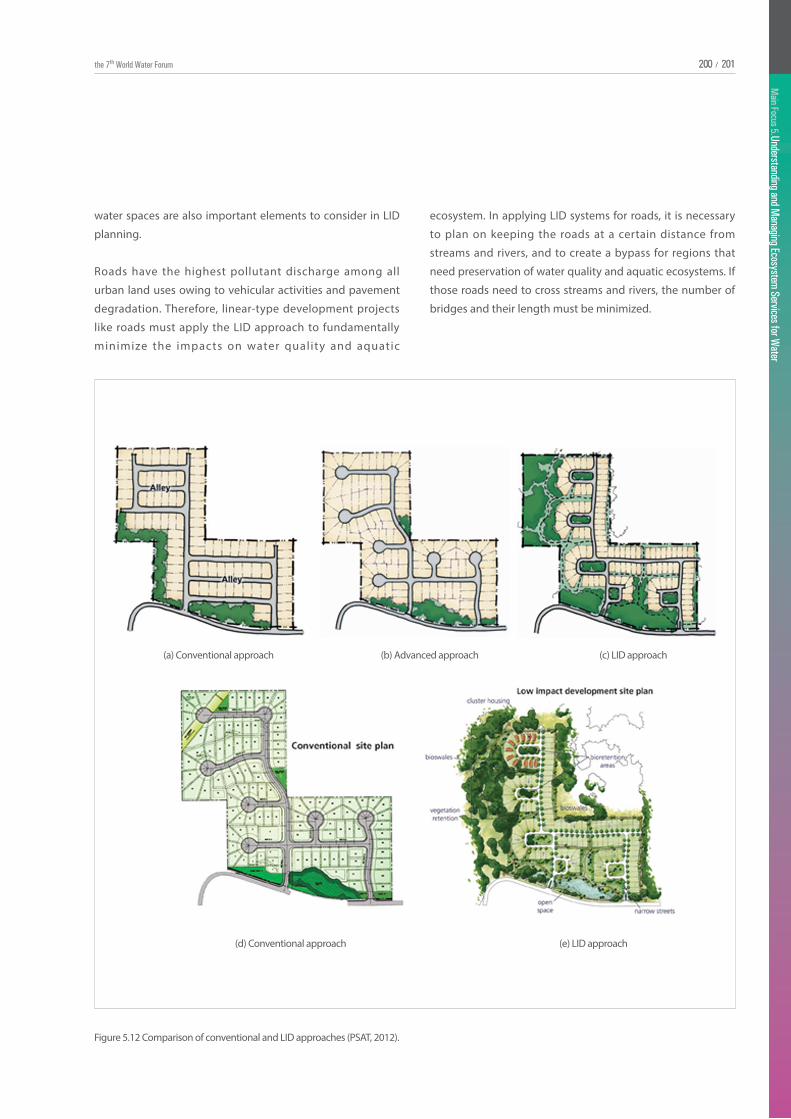
Main Focus 4. Smart Technology for W
ater
201200 /the 7th World Water Forum 200
Main Focus 5. Understanding and M
anaging Ecosystem Services for Water
201200 /200
Main Focus 5. Understanding and M
anaging Ecosystem Services for Water
201/
Figure 5.12 Comparison of conventional and LID approaches (PSAT, 2012).
water spaces are also important elements to consider in LID
planning.
Roads have the highest pollutant discharge among all
urban land uses owing to vehicular activities and pavement
degradation. Therefore, linear-type development projects
like roads must apply the LID approach to fundamentally
minimize the impacts on water quality and aquatic
ecosystem. In applying LID systems for roads, it is necessary
to plan on keeping the roads at a certain distance from
streams and rivers, and to create a bypass for regions that
need preservation of water quality and aquatic ecosystems. If
those roads need to cross streams and rivers, the number of
bridges and their length must be minimized.
(a) Conventional approach
(d) Conventional approach (e) LID approach
(b) Advanced approach (c) LID approach

202202202202Main Focus 5. Understanding and Managing Ecosystem Services for Water
5.3.3.3 Ecological and Environmental Mechanisms of LID and GI Technology
LID is a small-scale, decentralized-type technique that
establishes natural water circulation with integrated
retention and infiltration. These technologies also treat
and manage the urban stormwater runoff while promoting
water pollution reduction, groundwater recharge, and water
reuse. Stormwater runoff management using LID refers to
managing the pollutants through infiltration and retention
from overland flow or drainage systems, not through end-
of-pipe structures. Meanwhile, GI technology refers to
the facilities and techniques that link the natural features
(e.g., green areas, parks, wetlands, etc.) to each other and
provides ecological services that are helpful for humans.
However, it is perceived as a similar concept to LID. LID/GI
has the function of recovering natural water circulation and
reducing water pollutants by using the physico-chemical and
Figure 5.13 Net structure of rhizospheric interactions between microorganisms and plants (Zhuang et al., 2013)
biological principles of soil and plants. Complex biological
and ecological processes occur in the rhizosphere through
ecosystem-level interactions among roots, microorganisms,
and soil fauna. The contribution of the rhizosphere
effect generated by microbes and roots appears in the
improvement of soil nutrient acquisition and bioabsorbable
and biotransformation efficiency (Figure 5.13).
Particulate matter included in stormwater runoff is reduced
by sedimentation and filtration of the soil. Organics change
their form through biodegradation by the microorganisms
within the soil. Among all the nutrients, nitrogen is reduced
by microorganism synthesis, nitrification and de-nitrification
processes, and plant uptake. Meanwhile, phosphorus is
reduced by microorganism synthesis and absorption as
well as plant uptake. Heavy metals are reduced by means
of physico-chemical filtration and absorption of soil. Plants
Microorganisms(nutrien cycling /
suppressing e�ect to hazards)
Soil quality(nutrient/toxic
substances)
Plants
Roots
Aerial parts
Higher crop yields
Colonization and growth /microbial communityintegration / quorumsensing / chemotaxis
Communications
Microbial decomposition,immobilization,mineralization
Plant secretion
Bio-availability promotion in soil
(C/N/P/micronutrientsacquisition; sumbiosis;virulence; biocontrol)
“Rhizospheree�ect”
Bioactive moleculespolysaccharidesantiboticssognal moleculesionsorganic acidspheromonesantimicrobialpeptides

Main Focus 4. Smart Technology for W
ater
203202 /the 7th World Water Forum 202
Main Focus 5. Understanding and M
anaging Ecosystem Services for Water
203202 /202
Main Focus 5. Understanding and M
anaging Ecosystem Services for Water
203/
and soil microorganisms are considered one of the effective
maintenance mechanisms in reducing various pollutants
such as organics and nutrients through photosynthesis and
respiration. In other words, applying LID/GI approaches
indicates that maintenance costs can be reduced more than
by applying regular reduction facilities.
Using plants in LID/GI approaches may lead to a reduction
in NPS pollutants through photosynthesis and respiration,
as well improving water retention and infiltration by the
roots of plants. In general, approximately 70% of water
exists up to 50% of root depth. In LID/GI elements, increased
infiltration and retention quantity by establishing water
circulation contribute significantly to the reducing NPS
pollutants. Therefore, the types of soil used are important
in the application of LID/GI. Sand has high infiltration and
retention but lacks pollutant absorption ability, whereas
clay has outstanding pollutant absorption ability but
does not contribute to water circulation. Owing to these
characteristics, sand and clay cannot contribute greatly to
the growth of plants, and thus it is desirable to combine sand
with humus soil that has high cation exchange capacity.
Moreover, since LID/GI handles stormwater runoff from the
pavement, it is necessary to apply plants that can resist the
high water content and salt.
LID/GI technology is classified into infiltration, vegetation,
retention, and constructed wetlands ( Table 5.6). This
technology can be applied to landscapes, green areas,
parks and flowerbeds in urban areas, and is determined
by the available space, amount of stormwater runoff, and
pollutants that occur. Furthermore, it can be applied in
various forms, from small scale to large scale, depending
on the amount of stormwater runoff and available space.
Table 5.6 Classification of LID/GI technology
5.3.4.1 Effects of LID Application
LID application in urban areas plays the role of recovering
natural water circulation and reducing pollutants discharged
from pavements. Recovery of natural water circulation can
be done by increasing the infiltration ability of soil and
the evapotranspiration of plants. Recovering natural water
circulation through LID installations is possible by delaying
the runoff time after or during rainfall, reducing runoff
volume and peak flow, and delaying peak flow occurrence
time. Reduction of stormwater runoff volume through
LID applications may reduce the outflow of pollutants.
Also, pollutants are reduced through physical reduction
mechanisms (such as biochemical reduction mechanisms),
filtration, and absorption by microorganisms and plants
inside the soil (Figure 5.14).
Of the LID/GI technologies, bioretention (e.g., rain garden) is
one that is diversely applied in the USA, Germany, and Korea.
LID can reduce the peak flow by retention and infiltration.
The infiltrated outflow is supplied as ecological water for the
ecosystems of streams and rivers in the dry season by being
sent to underground water, thereby using it to improve water
quality and ecosystems. Peak flow reduction and delay to
occurrence time have the effect of improving water quality
and aquatic ecosystems by supplying ecological water to
streams and rivers, while also reducing flooding of urban
areas. Developed countries including the USA and Korea have
5.3.4 Research and Development
Type Content Types
InfiltrationFacility infiltrating stormwater to the ground, which is removing the pollutants with filtration and adsorption
Infiltration trench, Infiltration basin, Permeable pavement
VegetationFacility providing green spaces and habitats, which is removing the pollutant with filtration and adsorption in soil and vegetation uptake
Vegetated swale, Vegetated strip, Bioretention, Tree box filter, Planter
RetentionFacility retaining stormwater, which is removing the pollutants by sedimentation and others
Retention basin, Underground retention tank
Constructed wetlandsFacility retaining stormwater and treating with plants, microorganisms and media
Free water surface constructed wetland (FWS), Subsurface flow constructed wetland (SSF), Hybrid constructed wetland
To secure the maintenance of all these facilities and their
respective continuous efficiency, it is necessary to include a
sedimentation deposit in the design to remove particulate
matter that occurs early in stormwater runoff.
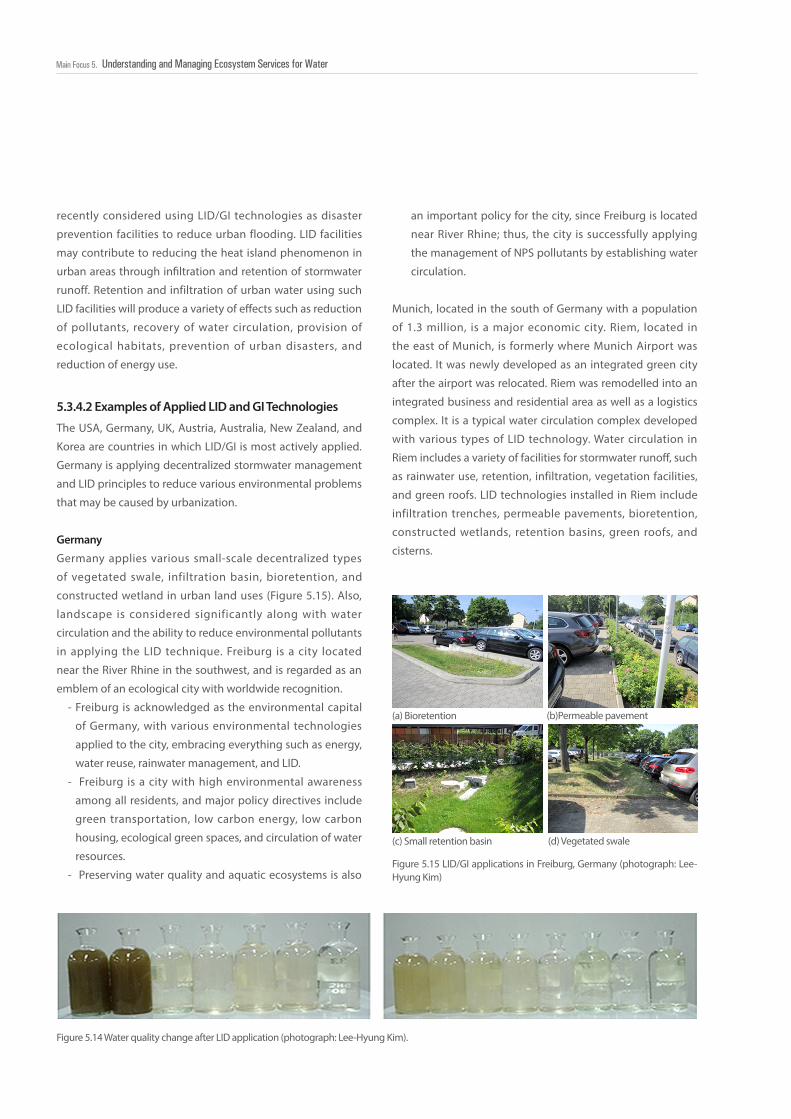
204204204204Main Focus 5. Understanding and Managing Ecosystem Services for Water
5.3.4.2 Examples of Applied LID and GI Technologies
The USA, Germany, UK, Austria, Australia, New Zealand, and
Korea are countries in which LID/GI is most actively applied.
Germany is applying decentralized stormwater management
and LID principles to reduce various environmental problems
that may be caused by urbanization.
Germany
Germany applies various small-scale decentralized types
of vegetated swale, infiltration basin, bioretention, and
constructed wetland in urban land uses (Figure 5.15). Also,
landscape is considered significantly along with water
circulation and the ability to reduce environmental pollutants
in applying the LID technique. Freiburg is a city located
near the River Rhine in the southwest, and is regarded as an
emblem of an ecological city with worldwide recognition.
- Freiburg is acknowledged as the environmental capital
of Germany, with various environmental technologies
applied to the city, embracing everything such as energy,
water reuse, rainwater management, and LID.
- Freiburg is a city with high environmental awareness
among all residents, and major policy directives include
green transportation, low carbon energy, low carbon
housing, ecological green spaces, and circulation of water
resources.
- Preserving water quality and aquatic ecosystems is also
(c) Small retention basin
Figure 5.15 LID/GI applications in Freiburg, Germany (photograph: Lee-Hyung Kim)
(d) Vegetated swale
Figure 5.14 Water quality change after LID application (photograph: Lee-Hyung Kim).
recently considered using LID/GI technologies as disaster
prevention facilities to reduce urban flooding. LID facilities
may contribute to reducing the heat island phenomenon in
urban areas through infiltration and retention of stormwater
runoff. Retention and infiltration of urban water using such
LID facilities will produce a variety of effects such as reduction
of pollutants, recovery of water circulation, provision of
ecological habitats, prevention of urban disasters, and
reduction of energy use.
an important policy for the city, since Freiburg is located
near River Rhine; thus, the city is successfully applying
the management of NPS pollutants by establishing water
circulation.
Munich, located in the south of Germany with a population
of 1.3 million, is a major economic city. Riem, located in
the east of Munich, is formerly where Munich Airport was
located. It was newly developed as an integrated green city
after the airport was relocated. Riem was remodelled into an
integrated business and residential area as well as a logistics
complex. It is a typical water circulation complex developed
with various types of LID technology. Water circulation in
Riem includes a variety of facilities for stormwater runoff, such
as rainwater use, retention, infiltration, vegetation facilities,
and green roofs. LID technologies installed in Riem include
infiltration trenches, permeable pavements, bioretention,
constructed wetlands, retention basins, green roofs, and
cisterns.
(a) Bioretention (b)Permeable pavement
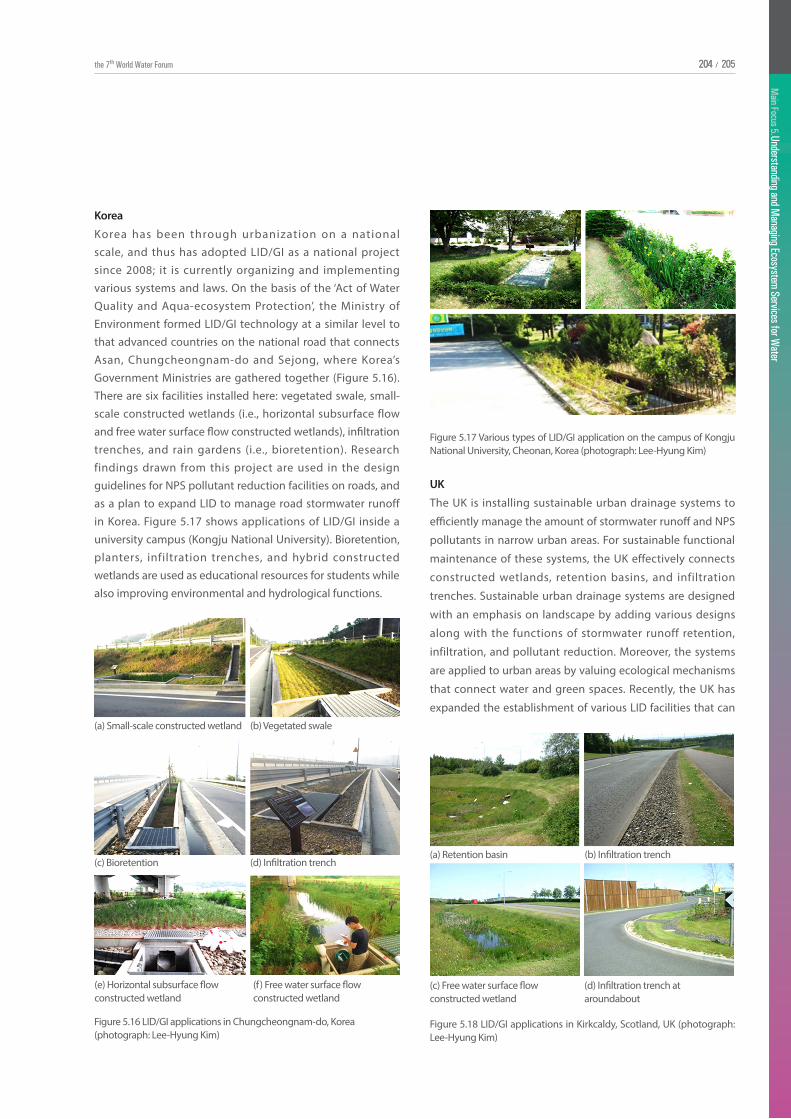
Main Focus 4. Smart Technology for W
ater
205204 /the 7th World Water Forum 204
Main Focus 5. Understanding and M
anaging Ecosystem Services for Water
205204 /204
Main Focus 5. Understanding and M
anaging Ecosystem Services for Water
205/
(e) Horizontal subsurface flow constructed wetland
Figure 5.17 Various types of LID/GI application on the campus of Kongju National University, Cheonan, Korea (photograph: Lee-Hyung Kim)
Figure 5.16 LID/GI applications in Chungcheongnam-do, Korea (photograph: Lee-Hyung Kim)
(f) Free water surface flow constructed wetland
Korea
Korea has been through urbanization on a national scale, and thus has adopted LID/GI as a national project since 2008; it is currently organizing and implementing various systems and laws. On the basis of the ‘Act of Water Quality and Aqua-ecosystem Protection’, the Ministry of Environment formed LID/GI technology at a similar level to that advanced countries on the national road that connects Asan, Chungcheongnam-do and Sejong, where Korea’s Government Ministries are gathered together (Figure 5.16). There are six facilities installed here: vegetated swale, small-scale constructed wetlands (i.e., horizontal subsurface flow and free water surface flow constructed wetlands), infiltration trenches, and rain gardens (i.e., bioretention). Research findings drawn from this project are used in the design guidelines for NPS pollutant reduction facilities on roads, and as a plan to expand LID to manage road stormwater runoff in Korea. Figure 5.17 shows applications of LID/GI inside a university campus (Kongju National University). Bioretention, planters, infiltration trenches, and hybrid constructed wetlands are used as educational resources for students while also improving environmental and hydrological functions.
(a) Small-scale constructed wetland (b) Vegetated swale
(c) Bioretention (d) Infiltration trench
UK
The UK is installing sustainable urban drainage systems to
efficiently manage the amount of stormwater runoff and NPS
pollutants in narrow urban areas. For sustainable functional
maintenance of these systems, the UK effectively connects
constructed wetlands, retention basins, and infiltration
trenches. Sustainable urban drainage systems are designed
with an emphasis on landscape by adding various designs
along with the functions of stormwater runoff retention,
infiltration, and pollutant reduction. Moreover, the systems
are applied to urban areas by valuing ecological mechanisms
that connect water and green spaces. Recently, the UK has
expanded the establishment of various LID facilities that can
(c) Free water surface flow constructed wetland
Figure 5.18 LID/GI applications in Kirkcaldy, Scotland, UK (photograph: Lee-Hyung Kim)
(d) Infiltration trench at aroundabout
(a) Retention basin (b) Infiltration trench
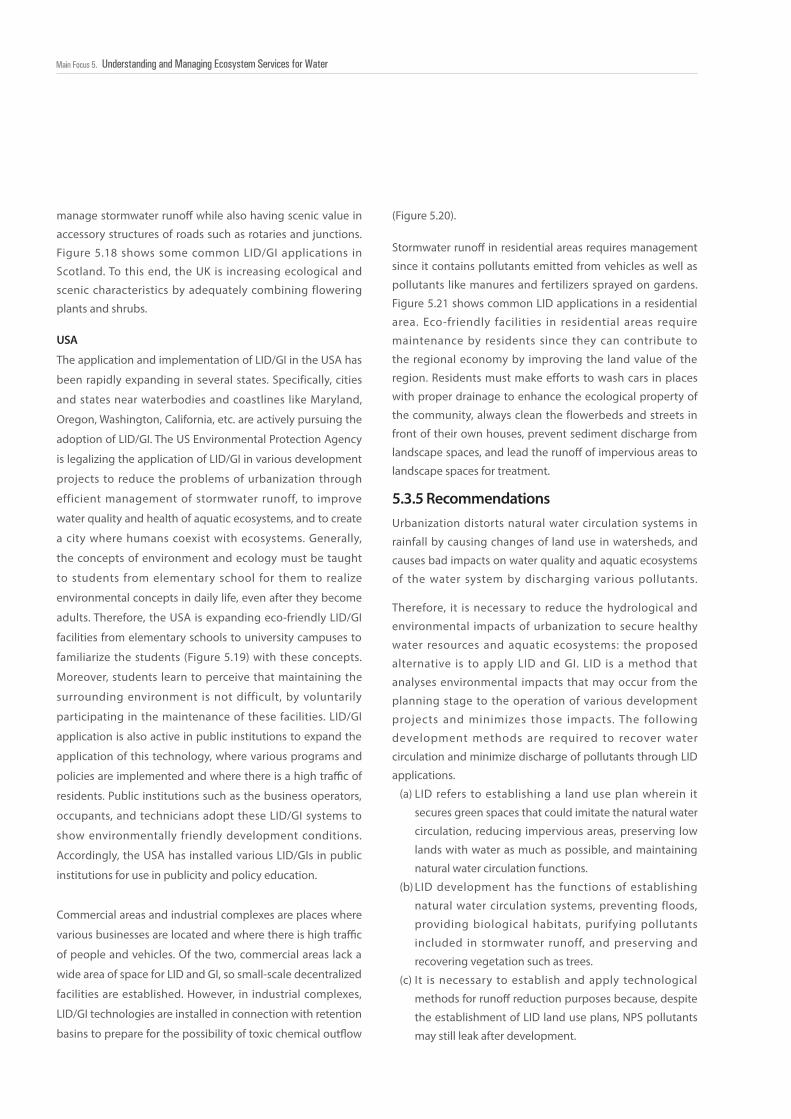
206206206206Main Focus 5. Understanding and Managing Ecosystem Services for Water
USA
The application and implementation of LID/GI in the USA has
been rapidly expanding in several states. Specifically, cities
and states near waterbodies and coastlines like Maryland,
Oregon, Washington, California, etc. are actively pursuing the
adoption of LID/GI. The US Environmental Protection Agency
is legalizing the application of LID/GI in various development
projects to reduce the problems of urbanization through
efficient management of stormwater runoff, to improve
water quality and health of aquatic ecosystems, and to create
a city where humans coexist with ecosystems. Generally,
the concepts of environment and ecology must be taught
to students from elementary school for them to realize
environmental concepts in daily life, even after they become
adults. Therefore, the USA is expanding eco-friendly LID/GI
facilities from elementary schools to university campuses to
familiarize the students (Figure 5.19) with these concepts.
Moreover, students learn to perceive that maintaining the
surrounding environment is not difficult, by voluntarily
participating in the maintenance of these facilities. LID/GI
application is also active in public institutions to expand the
application of this technology, where various programs and
policies are implemented and where there is a high traffic of
residents. Public institutions such as the business operators,
occupants, and technicians adopt these LID/GI systems to
show environmentally friendly development conditions.
Accordingly, the USA has installed various LID/GIs in public
institutions for use in publicity and policy education.
Commercial areas and industrial complexes are places where
various businesses are located and where there is high traffic
of people and vehicles. Of the two, commercial areas lack a
wide area of space for LID and GI, so small-scale decentralized
facilities are established. However, in industrial complexes,
LID/GI technologies are installed in connection with retention
basins to prepare for the possibility of toxic chemical outflow
5.3.5 RecommendationsUrbanization distorts natural water circulation systems in
rainfall by causing changes of land use in watersheds, and
causes bad impacts on water quality and aquatic ecosystems
of the water system by discharging various pollutants.
Therefore, it is necessary to reduce the hydrological and
environmental impacts of urbanization to secure healthy
water resources and aquatic ecosystems: the proposed
alternative is to apply LID and GI. LID is a method that
analyses environmental impacts that may occur from the
planning stage to the operation of various development
projects and minimizes those impacts. The following
development methods are required to recover water
circulation and minimize discharge of pollutants through LID
applications.
(a) LID refers to establishing a land use plan wherein it
secures green spaces that could imitate the natural water
circulation, reducing impervious areas, preserving low
lands with water as much as possible, and maintaining
natural water circulation functions.
(b) LID development has the functions of establishing
natural water circulation systems, preventing floods,
providing biological habitats, purifying pollutants
included in stormwater runoff, and preserving and
recovering vegetation such as trees.
(c) It is necessary to establish and apply technological
methods for runoff reduction purposes because, despite
the establishment of LID land use plans, NPS pollutants
may still leak after development.
manage stormwater runoff while also having scenic value in
accessory structures of roads such as rotaries and junctions.
Figure 5.18 shows some common LID/GI applications in
Scotland. To this end, the UK is increasing ecological and
scenic characteristics by adequately combining flowering
plants and shrubs.
(Figure 5.20).
Stormwater runoff in residential areas requires management
since it contains pollutants emitted from vehicles as well as
pollutants like manures and fertilizers sprayed on gardens.
Figure 5.21 shows common LID applications in a residential
area. Eco-friendly facilities in residential areas require
maintenance by residents since they can contribute to
the regional economy by improving the land value of the
region. Residents must make efforts to wash cars in places
with proper drainage to enhance the ecological property of
the community, always clean the flowerbeds and streets in
front of their own houses, prevent sediment discharge from
landscape spaces, and lead the runoff of impervious areas to
landscape spaces for treatment.
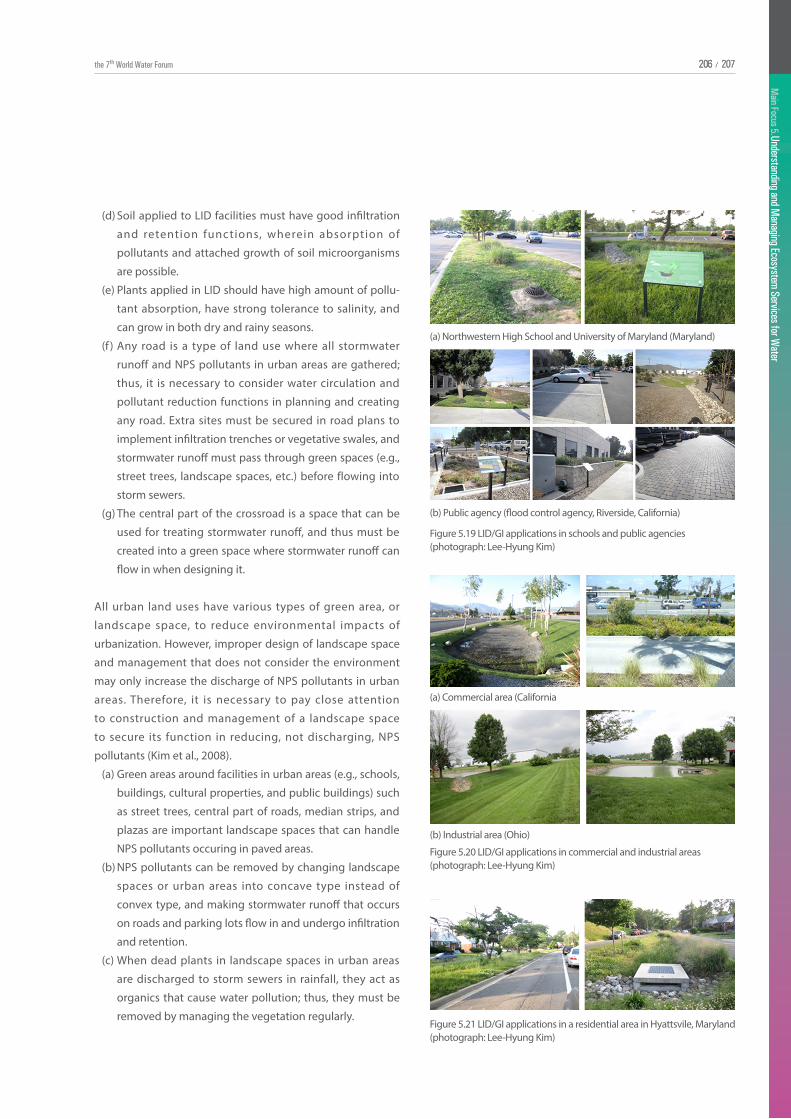
Main Focus 4. Smart Technology for W
ater
207206 /the 7th World Water Forum 206
Main Focus 5. Understanding and M
anaging Ecosystem Services for Water
207206 /206
Main Focus 5. Understanding and M
anaging Ecosystem Services for Water
207/
(a) Northwestern High School and University of Maryland (Maryland)
(b) Public agency (flood control agency, Riverside, California)
(b) Industrial area (Ohio)
Figure 5.21 LID/GI applications in a residential area in Hyattsvile, Maryland (photograph: Lee-Hyung Kim)
Figure 5.20 LID/GI applications in commercial and industrial areas (photograph: Lee-Hyung Kim)
Figure 5.19 LID/GI applications in schools and public agencies (photograph: Lee-Hyung Kim)
(d) Soil applied to LID facilities must have good infiltration
and retention functions, wherein absorption of
pollutants and attached growth of soil microorganisms
are possible.
(e) Plants applied in LID should have high amount of pollu-
tant absorption, have strong tolerance to salinity, and
can grow in both dry and rainy seasons.
(f ) Any road is a type of land use where all stormwater
runoff and NPS pollutants in urban areas are gathered;
thus, it is necessary to consider water circulation and
pollutant reduction functions in planning and creating
any road. Extra sites must be secured in road plans to
implement infiltration trenches or vegetative swales, and
stormwater runoff must pass through green spaces (e.g.,
street trees, landscape spaces, etc.) before flowing into
storm sewers.
(g) The central part of the crossroad is a space that can be
used for treating stormwater runoff, and thus must be
created into a green space where stormwater runoff can
flow in when designing it.
All urban land uses have various types of green area, or
landscape space, to reduce environmental impacts of
urbanization. However, improper design of landscape space
and management that does not consider the environment
may only increase the discharge of NPS pollutants in urban
areas. Therefore, it is necessary to pay close attention
to construction and management of a landscape space
to secure its function in reducing, not discharging, NPS
pollutants (Kim et al., 2008).
(a) Green areas around facilities in urban areas (e.g., schools,
buildings, cultural properties, and public buildings) such
as street trees, central part of roads, median strips, and
plazas are important landscape spaces that can handle
NPS pollutants occuring in paved areas.
(b) NPS pollutants can be removed by changing landscape
spaces or urban areas into concave type instead of
convex type, and making stormwater runoff that occurs
on roads and parking lots flow in and undergo infiltration
and retention.
(c) When dead plants in landscape spaces in urban areas
are discharged to storm sewers in rainfall, they act as
organics that cause water pollution; thus, they must be
removed by managing the vegetation regularly.
(a) Commercial area (California
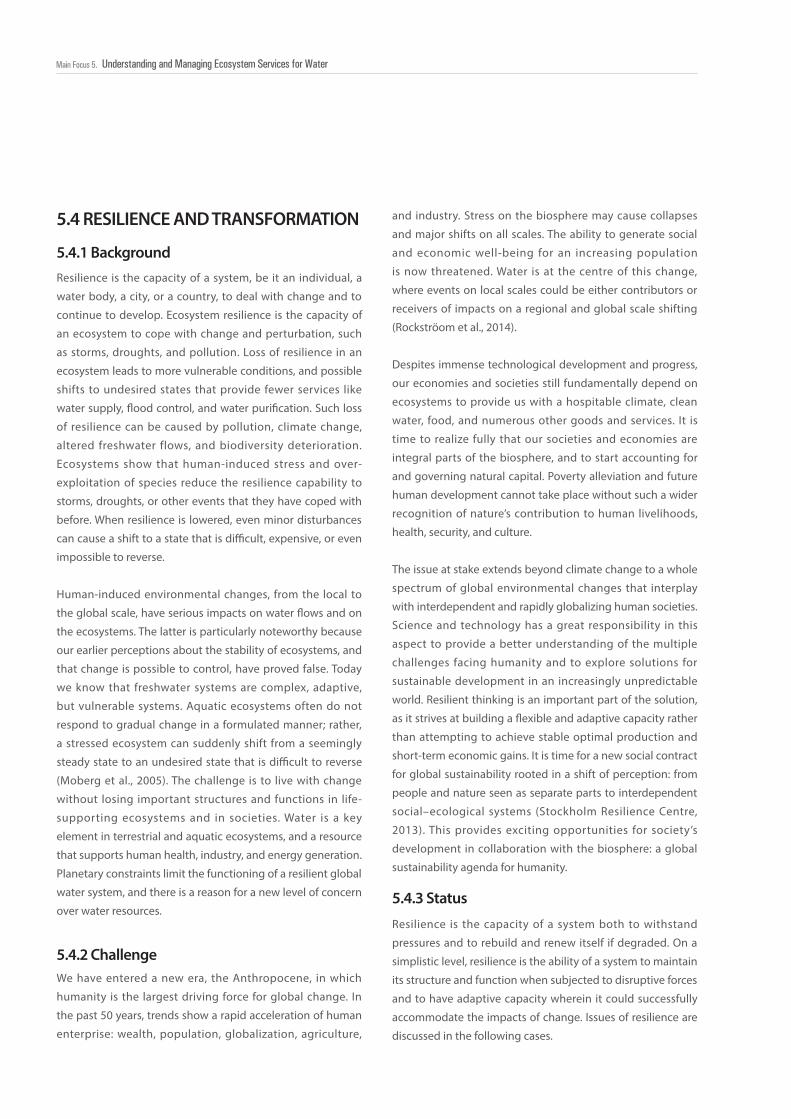
208208208208Main Focus 5. Understanding and Managing Ecosystem Services for Water
5.4 RESILIENCE AND TRANSFORMATION
5.4.1 Background
5.4.2 Challenge
Resilience is the capacity of a system, be it an individual, a
water body, a city, or a country, to deal with change and to
continue to develop. Ecosystem resilience is the capacity of
an ecosystem to cope with change and perturbation, such
as storms, droughts, and pollution. Loss of resilience in an
ecosystem leads to more vulnerable conditions, and possible
shifts to undesired states that provide fewer services like
water supply, flood control, and water purification. Such loss
of resilience can be caused by pollution, climate change,
altered freshwater flows, and biodiversity deterioration.
Ecosystems show that human-induced stress and over-
exploitation of species reduce the resilience capability to
storms, droughts, or other events that they have coped with
before. When resilience is lowered, even minor disturbances
can cause a shift to a state that is difficult, expensive, or even
impossible to reverse.
Human-induced environmental changes, from the local to
the global scale, have serious impacts on water flows and on
the ecosystems. The latter is particularly noteworthy because
our earlier perceptions about the stability of ecosystems, and
that change is possible to control, have proved false. Today
we know that freshwater systems are complex, adaptive,
but vulnerable systems. Aquatic ecosystems often do not
respond to gradual change in a formulated manner; rather,
a stressed ecosystem can suddenly shift from a seemingly
steady state to an undesired state that is difficult to reverse
(Moberg et al., 2005). The challenge is to live with change
without losing important structures and functions in life-
supporting ecosystems and in societies. Water is a key
element in terrestrial and aquatic ecosystems, and a resource
that supports human health, industry, and energy generation.
Planetary constraints limit the functioning of a resilient global
water system, and there is a reason for a new level of concern
over water resources.
We have entered a new era, the Anthropocene, in which
humanity is the largest driving force for global change. In
the past 50 years, trends show a rapid acceleration of human
enterprise: wealth, population, globalization, agriculture,
5.4.3 Status
Resilience is the capacity of a system both to withstand
pressures and to rebuild and renew itself if degraded. On a
simplistic level, resilience is the ability of a system to maintain
its structure and function when subjected to disruptive forces
and to have adaptive capacity wherein it could successfully
accommodate the impacts of change. Issues of resilience are
discussed in the following cases.
and industry. Stress on the biosphere may cause collapses
and major shifts on all scales. The ability to generate social
and economic well-being for an increasing population
is now threatened. Water is at the centre of this change,
where events on local scales could be either contributors or
receivers of impacts on a regional and global scale shifting
(Rockströom et al., 2014).
Despites immense technological development and progress,
our economies and societies still fundamentally depend on
ecosystems to provide us with a hospitable climate, clean
water, food, and numerous other goods and services. It is
time to realize fully that our societies and economies are
integral parts of the biosphere, and to start accounting for
and governing natural capital. Poverty alleviation and future
human development cannot take place without such a wider
recognition of nature’s contribution to human livelihoods,
health, security, and culture.
The issue at stake extends beyond climate change to a whole
spectrum of global environmental changes that interplay
with interdependent and rapidly globalizing human societies.
Science and technology has a great responsibility in this
aspect to provide a better understanding of the multiple
challenges facing humanity and to explore solutions for
sustainable development in an increasingly unpredictable
world. Resilient thinking is an important part of the solution,
as it strives at building a flexible and adaptive capacity rather
than attempting to achieve stable optimal production and
short-term economic gains. It is time for a new social contract
for global sustainability rooted in a shift of perception: from
people and nature seen as separate parts to interdependent
social–ecological systems (Stockholm Resilience Centre,
2013). This provides exciting opportunities for society’s
development in collaboration with the biosphere: a global
sustainability agenda for humanity.

Main Focus 4. Smart Technology for W
ater
209208 /the 7th World Water Forum 208
Main Focus 5. Understanding and M
anaging Ecosystem Services for Water
209208 /208
Main Focus 5. Understanding and M
anaging Ecosystem Services for Water
209/
Case 1 : Small-scale Water Innovations Break Dry Land Poverty
Traps in Tanzania (Stockholm Resilience Centre, 2013)
Improved water management in rain-fed agriculture can build
resilience to cope with water-related risks and uncertainties.
Conventional solutions have been developed into large-scale
irrigation systems, but recent studies in Makanya, Tanzania,
have shown that small-scale innovations (e.g., rainwater
harvesting, conservation tillage, etc.) have enormous
potential for increasing on-farm productivity and ecosystem
service output in areas where people live in poverty and are
vulnerable to climate change.
Case 2 : Natural Capital Investments in China (Stockholm
Resilience Centre, 2013)
Ecosystem service investments in China today are remarkable
in their goals, scale, duration, and innovation. Following
severe droughts in 1997 and massive flooding in 1998, China
implemented several national forestry and conservation
initiatives, exceeding US$100 billion over the current
decade. Targeted investments aim to secure natural capital
and alleviate poverty through wealth transfer from coastal
provinces to inland regions, where many ecosystem services
originate. Over 120 million farmers are directly involved in
programmes with the intention of reducing the loss of soil,
reducing desertification, and protecting biodiversity and
ecosystems, for example flood control, more productive
agriculture, and ecotourism.
Case 3 : Northern Ireland Countryside Management Scheme
(NICMS) (NIDARD, 2010)
The NICMS is an agricultural–environmental scheme that
began last 2008 under the European Agriculture Fund
for Rural Development. It is a voluntary programme that
provides financial support to farmers and landowners for
adopting farming practices that enhance the countryside to
improve biodiversity; improve water quality; climate change
mitigation; improve soil quality; and enhance the landscape.
Annual payments vary according to farm size and specific
natural attributes of farms. The programme aimed to have
50% of agricultural lands under enhancement agreements
by 2010. A total of GB£219 million was allocated to this
programme for 2008–2013.
Case 4 : The Netherlands Farming for Nature Pilot Program
(Voor Natuur, 2010).
This pilot programme is based on the precept that in rural
areas there are several ways to unite agriculture, nature,
and landscapes. One of those is that farmers who are
compensated for managing their land for the benefit of
ecosystem services and the natural landscape. One online
document reported in October 2008 that water quality was
noted as one of the objectives of the pilot project, although
it is not clear if this programme would evolve into a fully
functioning payment for watershed services programme. As
of the publication of this report, there were two operational
sites with efforts to bring together the researchers, farmers,
civil servants, local residents, and regional planning experts.
Case 5 : The WWF’s Danube PES Project (Tracy et al., 2010)
The WWF’s Danube–Carpathian Programme has been at
the forefront of efforts to promote payment for ecosystem
services (PES) as a river basin management policy framework
in Europe linked directly with the European Union’s Water
Framework Directive . Starting in about 2002, WWF began
building its capacity in the Danube and using PES as one tool
to conserve rural environments and improve rural livelihoods
in the Danube Basin, with a focus on the lower Danube and
the Danube Delta (Bulgaria, Moldova, Romania, and Ukraine).
After a multi-year and multi-stakeholder process, the project’s
activities began in 2007. The programme is being closely
watched by researchers and decision-makers for lessons on
how to bring PES programmes to scale such that they deliver
actual conservation benefits and economic improvements to
the stewards of the region’s invaluable ecosystem services.
Case 6 : Korea’s “Four Major River Restoration Project”
The “Four Major River Restoration Project” has been initiated
to cope with climate change and water security in Korea. The
project is prepared to achieve the following five core tasks:
a) securing water supply, b) flood control, c) water quality
improvement and ecosystem restoration, d) development
of spaces for cultural and leisure activities, and e) regional
development around four major rivers. After the “Four Major
River Restoration Project”, the flood management capacity
against climate change increased by 920 million tonnes.
The expanded water-flow and water-storage areas and
reinforced levees make it possible to withstand a 200-year
frequency flood. Rivers and streams can have environmental
flow (maintenance water) during dry periods of the year by
secured water resource. The ecological environment will be

210210210210Main Focus 5. Understanding and Managing Ecosystem Services for Water
An ecosystem with low resilience often seems unaffected
by human-induced stress and environmental change, until
a disturbance causes it to exceed a critical threshold. Such a
shift to a less productive state tends to be difficult, expensive,
or even impossible to reverse. Water management should be
based on the resilience of intertwined human and ecological
systems. Humans and ecosystems have to share the same
water, so we have to build a society that resiliently adapts to
climate change and to develop adaptive co-management.
Water is a key resource for social, economic, and cultural
development. When discussing the looming water crisis,
people often focus on the amount of liquid water drawn
from lakes, rivers, or groundwater aquifers. However, the
water cycle is not only affected by this increased demand
for water. Changes in land-cover and climate also affect
the amount of water available for drinking, irrigation, and
industrial uses (provisioning services), as well as recreation
(cultural services), flood control (regulating services), and
maintenance of healthy ecosystems (supporting services). As
human activities and ecosystems depend on the same water,
trade-offs are inevitable. For example, upstream consumption
patterns and pollution loads affect aquatic ecosystems and
people downstream.
The role of water in global sustainability is a key part
and is analysed both in terms of securing water for local
development and for the impact of water on tipping points
in the earth system. New multi-level, polycentric governance
structures and systems are needed to put this perspective
into practice. Water needs to be further integrated into
human development by including the “ecosystem”
component in new water governance. To this end, sharing
the water between humans and ecosystems should be
strengthened further.
The climate will continue to change in the future. No
5.4.4 Solution
5.4.4.1 Humans and Ecosystems Sharing the Same Water
5.4.4.2 Building a System That Resiliently Adapts to Climate Change
Water quality and ecosystems are the most common
natural disturbances affecting human development in
recent years. Their effect has been greatly exacerbated by
human-induced changes of water flows and ecosystems,
as well as by development in vulnerable areas. Moreover,
the climate advisory body of the United Nations (the
Intergovernmental Panel on Climate Change) has warned
that global environmental change will entail increasing
climate variability and increasing occurrence of extreme
weather events. Instead, new water management strategies
are needed that minimize the undesirable effects of climate
change and enhance the resilience of vulnerable social and
ecological systems.
Movement of freshwater in the landscape, water availability
in soils, moisture recycling from forests, and recharging of
groundwater are fundamental for the resilience of terrestrial
and aquatic ecosystems. Most ecosystems develop around
freshwater flows in a process that generates natural resources
and ecosystem services in a complex, ever-changing, and
5.4.4.3 Developing an Adaptive Co-management
improved by eco-river restoration and riparian eco-belts. The
project will serve as a guide for the river systems to cope with
climate change and to enhance their resilience.
projection of cl imate change will ever be free from
uncertainty. It is essential to build a resilient system that can
sustainably adapt to such a changing and uncertain climate.
Climate change will have complex and multidimensional
implications for the water cycle, water use, and floods.
Comprehensive and integrated actions are required, with
attention given to all water-related subsectors, including
flood management, water use, and water environments;
and stakeholders at all levels, including central and
local governments, the private sector, non-govermental
organizations, and local communities. Such action should
be reviewed as appropriate to cope better with a changing
climate.
A society’s vulnerability will depend not only on a changing
climate but also on what type of development is pursued.
It is essential to pursue environmental conservation and
development in tandem, and put into action the principle of
sustainable development that meets the needs of the present
without compromising the ability of future generations to
meet their own needs. In other words, what is required is
long-term sustainable water management that incorporates
adaptation to climate change.
Main Focus 4. Smart Technology for W
ater
211210 /the 7th World Water Forum 210
Main Focus 5. Understanding and M
anaging Ecosystem Services for Water
211210 /210
Main Focus 5. Understanding and M
anaging Ecosystem Services for Water
211/
The human imprint on the planet’s environment is now so
vast that the current geological period should be labelled
the ‘Anthropocene’—the age of man (Stockholm Resilience
Centre, 2013). Human pressure has reached a scale where
the possibility of abrupt or irreversible global change can
no longer be excluded. We are the first generation with the
knowledge of how our activities influence the Earth as a
system, and thus the first generation with the power and the
responsibility to change our relationship with it. Formulation
of new sustainable water management goals can be guided
by the ‘planetary boundaries’ concept, which aims to create
a scientifically defined safe water environment within which
humanity can continue to evolve and develop.
In the next two to three decades, the world will have to feed
another billion people. This will require enormous amounts
of water to produce food for an acceptable nutritional
level. Clearly, the challenge is to balance water for food and
5.4.5 Recommendations
unpredictable manner. The realization that this inherent
change and uncertainty in nature exists calls for more flexible
governance with the ability to respond to environmental
feedbacks. That is, we must learn to live with change through
an active, adaptive management approach that is diversified
and open for renewal.
To develop adaptive co-management, the following factors
should be considered. (a) Scope of management widened
from a particular issue (floods) to a broad set of issues related
to freshwater flows and ecological processes across scales.
(b) Management expanded from individual actors to groups
of actors. (c) Organizational and institutional structures
evolved as a response to deal with the broader set of water
and ecosystem issues. (d) Knowledge of ecosystem dynamics
developed as a collaborative effort and became part of the
organizational and institutional structures. (e) Social networks
developed to connect institutions and organizations and
to facilitate information flows, identify knowledge gaps,
and create nodes of expertise of significance for adaptive
co-management within the catchment. (f ) Social networks
mobilized for knowledge management, which complements
and refines local practice and improves the capacity to deal
with future uncertainties and surprises (Moberg et al., 2005).
water for nature. Hence, ecosystems must be included in
water practice and water included in ecosystems practice
to reach sustainable development (Moberg et al., 2005). The
overall challenge is to actively strengthen the resilience of
ecosystems and local communities – namely their capacity
to cope with disturbances and global environmental change
– and explicitly recognize the role of freshwater. The key
recommendations to enhance water ecosystem resilience are
as follows.
(a) Freshwater policy and management should be based on
recognition that water systems are complex and adaptive
wherein the changes should be in a formulated manner,
rather than sudden shifts to both irreversible and less
productive states.
(b) Freshwater policy-makers should promote cross-sectoral
water management that shifts the focus from human
uses of water as a technical issue to the role of water in
catchments for the generation of ecosystem and societal
services.
(c) Policies should provide incentives for stakeholder
participation and incorporate their local ecological
knowledge into institutional structures in a multi-level
governance system.
(d) Social networks with a wide scope of actors should
be developed, aiming to connect institutions and
organizations across scales to build trust, facilitate
information flows, identify knowledge gaps, and create
nodes of expertise for resilient water management.
Human activities have caused the significant deterioration of
natural assets, resulting in negative impacts on the status of
biodiversity/ecosystems and in the provision of ecosystem
services. The Global Biodiversity Outlook 4 (CBD, 2014)
and OECD Environmental Outlook to 2050 (OECD, 2012)
concluded that biodiversity at the global level is declining
and will decline with the “business-as-usual” scenario.
Decision-makers demand ever-more information on the
economic implications of losing biodiversity/ecosystem
services to develop policies and strategies to conserve those
services at local, national, regional, and global perspectives.
Section 5.2 has tried to establish a classification of freshwater
ecosystem services, capture the conceptual links between
5.5 DISCUSSION AND CONCLUSIONS
212212212212Main Focus 5. Understanding and Managing Ecosystem Services for Water
the different types of total economic value ( TEV ) and
ecosystem services, and examine applicable economic
valuation methods. This could provide information for
practitioners to understand the conceptual linkages between
ecosystem services and economic valuation, and assist in
forming common bases for communication among various
stakeholders.
Population concentration due to urbanization has severe
impacts on settlements, transportation, water quality and
resources, energy, and ecosystems. Urbanization distorts
natural water circulation systems in rainfall by causing
changes of land use in watersheds, and causes high impacts
on water quality and aquatic ecosystems by discharging
various pollutants. In particular, changes in the hydrological
characteristics of watersheds by urbanization damage
habitats in the water system. To secure healthy water
resources and aquatic ecosystems, it is necessary to reduce
the hydrological and environmental impacts of urbanization.
The proposed alternative for solving these problems is to
apply low-impact development (LID) and green infrastructure
(GI). LID is a method that analyses environmental impacts that
may occur from the planning stage to operation of various
development projects and minimizes them. It refers to
establishing a land use plan wherein it secures green spaces
that could imitate the natural water circulation, reducing
impervious areas, preserving low lands with water as much as
possible, and maintaining natural water circulation functions.
LID development has the function of establishing natural
water circulation systems, preventing floods, providing
biological habitats, purifying pollutants included in
stormwater runoff, and preser ving and recover ing
vegetation such as trees. It is necessary to establish and
apply technological methods for runoff reduction because,
despite the establishment of LID land use plans, non-point
source (NPS) pollutants may still leak after development.
Soil applied to LID facilities must have good infiltration
and retention functions, wherein absorption of pollutants
and attached growth of soil microorganisms are possible.
Plants applied in LID should have high amount of pollutant
absorption, have strong tolerance to salinity, and be able to
grow both in dry and in rainy seasons. LID development has
various environmental benefits. It establishes a healthy water
circulation system, assisting with flood prevention, providing
habitats for organisms, purifying pollutants included in
stormwater runoff, and preserving and recovering vegetation
such as trees. It also can reduce the costs of construction
and maintenance of drainage facilities. Furthermore, it can
prevent floods, protect biotic habitats, maintain drinking
water supply, reduce maintenance costs of facilities for
stormwater management, reduce NPS pollutants, and save
costs of other social infrastructures such as roads and curbs. It
improves the exterior and aesthetic value of the community,
thereby increasing the property cost of the site and building
while reducing the value of wastewater treatment plants.
Main Focus 4. Smart Technology for W
ater
213212 /the 7th World Water Forum 212
Main Focus 5. Understanding and M
anaging Ecosystem Services for Water
213212 /212
Main Focus 5. Understanding and M
anaging Ecosystem Services for Water
213/
Ahn, S. and D. Bae (2014). “Economic values of ecosystem services for freshwater ecosystem in Korea”. Journal of Environmental Policy and Administration. 22(4):3-16.
Ahn, S., J. Kim, D. Chun, Y. Kwon, and P. Loh (2014). Develop-ment and application of integrated measurement system to assess freshwater ecosystem services in Korea (I). Research publication. Korea Environment Institute.
Boeren voor Natuur. (2010). Boeren Voor Natuur website.http://www.boerenvoornatuur.nl/;
Brezonik , P. and Stadelmann,T. (2002). Analysis and predictive models of stormwater runoff volumes, load and pollutant concentrations from watersheds in the Twin Cities metropolitan area, Minnesota USA, Water Research, 36, 1743-1757.
CBD. 2014. Global Biodiversity Outlook 4. Montreal.
Cook, D. J. and Dickinson, W. T., The Impact of Urbanization on the Hydrologic Response of the Speedvale Experimental Basin, Ontario- A case study, in Proceedings,1985 International Symposium on Urban hydrology, hydraulic infrastructures and water quality control, 1985.
Costanza, R. et al. (1997). "The value of the world's ecosystem services and natural capital". Nature, 387: 253-260.
Daily, G.C. (Ed). (1997). Nature's services: societal dependence on natural ecosystems. Washington D.C.: Island Press.
De Groot, R.S., M.A. Wilson., and R.M.J Boumans (2002). "A typology for the classification, description and valuation of ecosystem functions, goods and services". Ecological Economics, 41: 393-408.
De Groot, R.S. et al. (2010). "Challenges in integrating the concept of ecosystem services and values in landscape planning, management and decision making". Ecological Complexity, 7:260-272.
EEA (2010). Scaling up ecosystem benefits: A contribution to the economics of ecosystem and biodiversity(TEEB) study. Copenhagen.
Fisher, B., and R.K. Turner (2008). "Ecosystem services: classification for valuation". Biological Conservation, 141: 1167-1169.
Freeman, A. M (2003). The measurement of environmental and resource values theory and methods. Washington D.C.: RFF Press.
Gnecco I., Beretta, C., Lanza, L. G. and La Barbera, P. (2005). Stormwater pollution in urban environment of Genoa, Italy, Atomspheric Research, 77, 60-73.
Gobel, P., Dierkes, C. and Coldewey, W. G. (2007). Stormwater runoff concentration matrix for urban areas, Journal of Contaminant Hydrology, 91, 26-42.
Gutiérrez, M.R., and M.L. Suarez Alonso (2013). "Which are, what is their status and what can we expect from ecosystem services provided by Spanish rivers and riparian areas?". Biodiversity and Conservation, 22:2469-2503.
Haines-Young, R. , and M. Potschin (2013). Common International Classification of Ecosystem Services(CICES): Consultation on Version 4, August-December 2012.
Harrison, P.A. et al. (2010). "Identifying and prioritising services in European Terrestrial and freshwater ecosystems". Biodiversity and Conservation, 19:2791-2821.
Huang, J., Du, P., Ao, C., Lei, M., Zhao, D., Ho, M. and Wang, Z. (2007). Characterization of surface runoff from a subtropics urban catchment, Journal of Environmental Science, 19, 148-152.
Japan International Cooperation Agency. March 2010. Global Environment Department. Handbook on Climate Change Adaptation in the Water Sector.
Johan Rockströom, Malin Falkenmark, Carl Folke, Mats Lanner-stad, Jennie Barron, Elin Enfors, Line Gordon, Jens Heinke, Holger Hoff, Claudia Pahl-Wostl. 2014. Water Resilience for Human Prosperity, cambridge.org/9781107024199.
Kandziora, M., B. Burkhard., and F. Muller (2013). "Indicators of ecosystem properties, ecosystem integrity and ecosystem service Indicators: a theoretical matrix exercise." Ecological Indicators, 28: 54-78.
Kim, L. H. (2002). Monitoring and Modeling of Pollutant Mass in Urban Runoff: Washoff, Buildup and Litter, Ph.D dissertation of UCLA.
Korea MOE (Ministry of Environment) (2012). The 2nd Comprehensive Measures of Nonpoint Source Management, Ministry of Environment.
Layke, C. et al. (2012). "Indicators from the global and sub-global Millennium Ecosystem Assessments: An analysis and the next steps". Ecological Indicators, 17:77-87.
MA (2005). Millennium Ecosystem Assessment: ecosystems and human well-being: synthesis. Washington, D.C.: Island Press.
Maniquiz-Redillas, M. C. and Kim, L. H. (2014). Policy and management tool of stormwater runoff from an industrial area in korea. The 3rd International Conference on Environ-mental Engineering, Science and Management, Thailand.
REFERENCES
214214214214Main Focus 5. Understanding and Managing Ecosystem Services for Water
Mercado, J. M. R., Geronimo, F. K. F., Choi, J. Y., Song, Y. S. and Kim, L. H. (2012). Characteristics of stormwater runoff from urbanized areas. Korean Society of Wetlands, 14(2), 159-168.
M oberg, F. , G alaz , V. Res i l ience. 2005. G oing f rom Conventional to Adaptive Freshwater Management for Human and Ecosystem Compatibility. Swedish Water House Policy Brief Nr. 3. SIWI.
Moench, M. 2005. Water, Climatic Variability and Livelihood Resilience: Concepts, Field Insights and Policy Implications. ISET(Institute for Social and Environmental Transition.
NIDARD(Northern Ireland Department of Agriculture and Rural Development). (2010). What is NICMS?h t t p : / / w w w. r u r a l n i . g o v. u k / i n d e x / e n v i r o n m e n t /countrysidemanagement/ schemes/nicms.htm
OECD (2012) OECD environmental outlook to 2050: The consequences of Inaction. OECD Publishing.
PSAT(Puget Sound Action Team) (2012). Low impact development: technical guidance manual for Puget Sound.
Rose, S. and Peters, N. E. (2001). Effects of Urbanization on Streamflow in the Atlanta Area (Georgia, USA): A Comparative Hydrological Approach, Hydrological Processes, 15: 1441-1457.
Schueler, T. R. (1994). The importance of imperviousness. Watershed Protection Techniques, 1(3), 100-111.
Stockholm Resilience Centre, 2013. What is rerilience? An introduction to social-ecological research. Stockholm University, www.stockholmresilience.su.se.
Stortelder, A.H.F., M.I. van den Top & R.A.M. Schrijver. (2003). Farming for Nature. Brochure Alterra.http://www.alterra.wur.nl/NR/rdonlyres/9307612D-749A-422E-8899-F6C049B7F796/32136 /FarmingforNaturelong1.pdf
Tracy, Echavarria Marta, Hamilton Katherine, and Ott Caroline. 2010. State of Watershed Payments: An Emerging Marketplace. Ecosystem Marketplace.http://www.foresttrends. org/documents/files/doc_2438.pdf
TEEB. (2010). The Economics of Ecosystems and Biodiversity Ecological and Economic Foundations. Pushpam Kumar(Ed), London and Washington: Earthscan.
Turner, R. K, J. C. J. M van den Bergh, and R. Brower (2003). Managing Wetlands: An Ecological Economics Approach. Cheltenhan, UK: Edward Elgar Publishing.UK National Ecosystem Assessment (2011). The UK National Ecosystem Assessment: technical report. Cambridge: UNEP-WCMC.
UN DESA (Dept. of Economics and Social Affairs) (2011). World Urbanization Prospects: The 2011 Revision (Highlights), United Nations.
Wallace, K.J. (2007). "Classification of ecosystem services: problems and solutions". Biological Conservation, 139: 235-246.
Wang, L, Lyons, J, and Kanehl, P (2003). Impact of urban land cover on trout streams in Wisconsin and Minnesota, Transactions of the American Fisheries Society, 132, pp. 825-839.
Westman, W. (1977). "How much are nature's services worth". Science, 197: 960-964.
Zhuang, X., Gao, J., Ma, A., Fu, S., and Zhuang, G. (2013). Bioactive molecules in soil ecosystems: masters of the underground, Int. J. Mol. Sci., 14(5), pp. 8841-8868.

Main Focus 4. Smart Technology for W
ater
215214 /the 7th World Water Forum 214
Main Focus 5. Understanding and M
anaging Ecosystem Services for Water
215214 /214
Main Focus 5. Understanding and M
anaging Ecosystem Services for Water
215/

w w w . w o r l d w a t e r f o r u m 7 . o r g