Water in the world - Oxford University Press
26
2 Source 1 Hindus in India believe that bathing in the holy waters of the Ganges River gives them spiritual blessings. 2A How is water an environmental resource? 1 Which environmental resources do we need to survive? 2 How are the people in the photograph using the Ganges River as a resource? 2B How does water connect and affect places? 1 How do you think the Ganges River connects places in India? 2 List three ways that water from the Ganges River might be used. 2C 2D How much water do we have? 1 Water covers about 70 per cent of the Earth’s surface. Why, then, do we have a shortage of water to drink and to wash in? 2 Where do you think the wettest and driest places in Australia might be found? How do we manage water? 1 Why do you think the Ganges River is difficult to manage? 2 Make a list of strategies that you personally would put in place to use less water? chapter Water in the world A resource is anything we use to satisfy a need or a want. Resources we use from the natural world are called environmental resources. All life on Earth depends on these environmental resources to survive. The water we drink, the Sun we depend on for light and warmth, the soil we use to grow our crops, and the trees we rely on to produce the oxygen we breathe are all environmental resources. As the world’s population grows, we continue to place more and more pressure on these resources. The availability of many of these environmental resources (including oil, forests, and of course, fresh water) is becoming increasingly uncertain. Unit 1 Water in the world 40 oxford big ideas humanities and social sciences 7 western australian curriculum 41 chapter 2 water in the world DRAFT
-
Upload
khangminh22 -
Category
Documents
-
view
1 -
download
0
Transcript of Water in the world - Oxford University Press

2Source 1 Hindus in India believe that bathing in the holy waters of the Ganges River gives them spiritual blessings.
2A How is water an environmental resource?1 Which environmental resources do we need to
survive?
2 How are the people in the photograph using the Ganges River as a resource?
2B How does water connect and affect places?1 How do you think the Ganges River connects
places in India?
2 List three ways that water from the Ganges River might be used.
2C 2D How much water do we have?1 Water covers about 70 per cent of the Earth’s
surface. Why, then, do we have a shortage of water to drink and to wash in?
2 Where do you think the wettest and driest places in Australia might be found?
How do we manage water?1 Why do you think the Ganges River is difficult to
manage?
2 Make a list of strategies that you personally would put in place to use less water?
chapter
Water in the worldA resource is anything we use to satisfy a need or a want. Resources we use from the natural world are called environmental resources. All life on Earth depends on these environmental resources to survive. The water we drink, the Sun we depend on for light and warmth, the soil we use to grow our crops, and the trees we rely on to produce the oxygen we breathe are all environmental resources. As the world’s population grows, we continue to place more and more pressure on these resources. The availability of many of these environmental resources (including oil, forests, and of course, fresh water) is becoming increasingly uncertain.
Unit 1 Water in the world
40 oxford big ideas humanities and social sciences 7 western australian curriculum 41chapter 2 water in the world
DRAFT

2.1 Environmental resources: an overview
Remember and understand1 What are the three main types of
resources? Give two examples of each type.
2 Why is it important to look after renewable resources, such as fresh water?
3 Describe how you may have used a non-renewable resource in the last hour.
4 What problems might societies around the world face if people continue to rely heavily on non-renewable resources?
Apply and analyse5 Collect pictures of continuous resources,
non-renewable resources and renewable resources from newspapers, magazines or the Internet. Sort these pictures into groups and describe how each resource is used by humans.
Evaluate and create6 What do you think is the most important
resource shown in Source 1? Give some reasons for your answer and be prepared to discuss this with a partner and with the class.
Check your learning 2.1
Over thousands of years, humans have developed ways of life that depend on almost all environmental resources found on Earth. Water from rainfall, minerals from rocks, and food from the forests and oceans have allowed us to build homes, farms, cities and highways all over the world. We have found and used resources in almost every corner of the Earth. Oil is drilled from beneath polar ice caps and water is drilled from far below barren deserts. Deep in the rainforests we have found plants that can cure illnesses and we have even worked out how to generate electricity from the waters fl owing in our rivers.
Types of environmental resourcesGeographers divide all of the environmental resources on Earth into three types.
Renewable resourcesThe fi rst type – renewable resources – will replenish themselves naturally over time if we do not use them too quickly. The trees in a forest are a good example of a renewable resource. We can cut them down for wood, but they will grow back in time. We just need to manage them carefully. In countries such as Australia, fresh water is considered a renewable resource but it needs to be carefully managed to ensure that enough is available for everybody.
Non-renewable resourcesThe second type – non-renewable resources – are only
available in limited (fi nite) amounts. If we overuse them, they will one day run out. Minerals such as coal, oil, diamonds and uranium are good examples of non-renewable resources.
Continuous resourcesThe third type – continuous resources – are available in
unlimited (infi nite) amounts. No matter how much or how often we use them, they will never run out. Energy from the Sun and wind are both examples of continuous resources.
Source 1 An overview of the many types of environmental resources.
The Sun provides the energy for plants and animals to grow and forms the basis of everything we eat. It also evaporates water, setting the water cycle in motion.
Wind is used to power ships and windmills and to produce electricity.
Ocean waves are resources for surfers and holiday-makers. They can also be used to generate electricity and may be a valuable natural resource in the future.
In some parts of the world, electricity is generated from heat within the Earth. This is known as geothermal energy.
Even gravity is a resource. Without gravity, seeds from trees and plants would never fall to the ground and grow into plants. There would also be no rain to help them survive.
The amount of oxygen in our atmosphere stays about the same because it is constantly recycled through plants, animals and oceans.
Fresh water is vital for all life forms on Earth, including plants, animals and humans.
Forests are a renewable resource that is under serious threat. Most of the world’s natural forest cover has been cleared or logged.
Oil is the world’s most commonly used source of energy. It is also used to make many important goods, such as plastics, petrol and fertiliser for farms.
Most of Australia’s electricity comes from the burning of coal. Coal is an important energy resource in many countries.
Minerals are used as a resource in many ways. Uranium is just one of thousands of minerals mined around the world. It is being used at this nuclear power station to produce electricity.
Plants, animals and human beings are renewable resources. Humans, however, are unique in that our use of the Earth’s resources is disrupting the Earth’s natural systems.
Soil is formed when rocks break down. We use soil to grow the crops we eat. The animals we farm for food also rely on the soil for the grass they eat.
Plants are renewable resources because they produce seeds in order to reproduce themselves.
Renewable resources
Non-renewable resources
Continuous resources
Types of environmental resources:
2A How is water an environmental resource?
42 oxford big ideas humanities and social sciences 7 western australian curriculum 43chapter 2 water in the world
DRAFT

2.2 The importance of waterWater is a natural resource, which means it is not made by humans, but rather found in nature. Since the beginning of human history, we have relied on water. We drink it in order to survive; we wash, cook and clean with it; and we use it to grow our food and produce electricity. In this way, water is arguably our most precious resource. Life on Earth without it would be impossible. One of the challenges facing Australia today is that we use too much of this natural resource.
Only 12 per cent of the water consumed in Australia is used in our homes and gardens, whereas 70 per cent is used to irrigate farms. This irrigation provides us with much of the food we eat, so it must be included when we think about how much water each of us personally consumes. When you add this water to the amount used to make other products we use every day, such as shampoo and toothpaste, every Australian is responsible for using over 1 million litres of water per year! Source 1 outlines the various ways in which we all use water.
Source 1 In Australia we use large amounts of water in many different ways.
Irrigation of crops and pastures
Irrigation accounts for most of the world’s water use. In some arid areas, including many parts of Australia, irrigation is used to grow crops. So water provides us with our food as well as our drink.
Irrigation of parks, gardens and sporting grounds
Many parks, gardens and sporting grounds, including football ovals, rely heavily on water in order to survive. In dry areas, water is often taken from drinking storages to keep them green and healthy.
Fishing
Commercial and recreational fi shing depends on clean oceans, rivers and lakes.
Environmental needs
As well as being used for human consumption, fresh water is a vital part of the natural environment. Taking too much water from a river can cause many environmental problems, such as weed growth, fi sh deaths and salt build-up.
Recreational activities
Recreational activities (such as water-skiing and swimming) generally have little impact on the quantity and quality of fresh water. Pollutants in the water from industry upstream can affect water quality and make the water unsuitable for recreation.
Mining
The mining industry relies heavily on water to cool machinery, enable drilling and process minerals and iron ore taken from the ground.
Navigation and trade
Large rivers (such as the Nile in Egypt, the Rhine in Europe and the Yangtze in China) have been used for centuries for trade, as they provide a fast method of transporting goods between regions and countries.
Construction and industry
The construction industry relies heavily on water in order to make concrete and many building supplies, such as bricks. Many industrial processes use large quantities of water for cooling and cleaning.
Power generation: hydroelectric power
Electricity can be generated from the energy of moving water. Usually, to do this a dam must be constructed across a river and a lake formed behind it. This allows the river’s fl ow to be controlled and released through the dam to produce electricity.
Power generation: coal-fi red and nuclear power
Virtually all power stations use large quantities of water. Coal-fi red power stations heat water to produce steam that turns turbines to create electricity. Water is also used to cool the station. Nuclear power plants operate in much the same way.
Snow-making
Artifi cial snow-making is important in countries such as Australia where natural snowfalls can be infrequent. However, many countries with more regular snowfalls now also use snow-making machines in order to improve conditions and attract more tourists.
Domestic uses
The average Australian household uses over 350 litres of water a day for drinking, preparing food, washing, cleaning, fl ushing toilets, cleaning cars, and watering lawns and gardens. Toilets and bathrooms account for about 40 per cent of this domestic water use.
Firefi ghting
Firefi ghters around the world rely heavily on a constant supply of water in order to carry out their work.
Remember and understand1 What activity uses the most water in Australia?
How much of our water does it use?
2 How can water be used to help create electricity?
3 Using Source 1, categorise each water use shown as either an off-stream use (in which water is removed from its source, either by pumping or diversion) or an in-stream use (in which water remains in place).
4 What other water uses can you think of?
Apply and analyse5 Using Source 1, identify two water uses that
compete with one another and so cannot easily exist beside one another.
Check your learning 2.2
Spiritual uses
Water holds a special signifi cance for almost all world religions. It often plays a key part in religious ceremonies.
2A How is water an environmental resource?
44 oxford big ideas humanities and social sciences 7 western australian curriculum 45chapter 2 water in the world
DRAFT

Clouds and water vapour
LakesRivers
OceanGround run-off
Underground water
Water evaporates from oceans, land, forests, farms, lakes, rivers, swamps
Precipitation as rain, snow, hail, sleet
Water stored as ice and snow
Forest
2.3 Where water comes fromWater is one of our most precious environmental resources. Without it, nothing can survive. It is an essential, renewable resource that occurs naturally on Earth. It can exist as a solid (such as ice in a glacier), a liquid (such as water in a river) or a gas (such as steam). Fresh water is an available resource when in liquid form and a potential resource as a gas or a solid. Liquid water is constantly being recycled through the atmosphere, rivers and oceans in a natural system known as the water cycle (see Source 2).
In the water cycle, water from the oceans and lakes is heated and evaporated by the Sun. The evaporated water vapour, which is like steam, then rises until it reaches the cooler parts of the atmosphere. Cold air cannot hold as much moisture as warm air, so the water vapour turns back into liquid water in a process known as condensation. These drops of water then form into clouds, which may be carried on to land by winds and forced to rise. The colder air can no longer hold the condensed droplets and they fall as rain. The rainwater fi nds its way back to the world’s lakes and oceans through rivers and streams and the process begins again.
As you can see in Source 2, rain falls when wet air masses are forced to rise. There are three reasons that air masses rise. Each of these will produce different types of rainfall at different places on the Earth’s surface.
The water cycleThe water cycle links together large areas of the natural environment (see Source 2). The world’s oceans, mountains, rivers and atmosphere are all important parts of this cycle. The water cycle links together the natural and human environments because water is so central to all human activities. The presence of water is key when settling new farms and cities. For more information on the key concept of interconnection, refer to page XX of ‘The geography toolkit’.
keyconcept: Interconnection
Source 2 The stages of the water cycle
Source 1 Different types of rainfall
Orographic rainfallAir is forced to rise due to the height of landmasses, such as mountains. As the air cools, condensation forms, producing rain. As the air begins to fall from the high land, it warms up, creating dry regions.
Frontal rainfallTwo air masses meet and the cooler air mass wedges itself under the warmer air mass. This forces the warm air to rise and cool, causing condensation and rain along a distinct line.
Convectional rainfallTemperatures during the day warm the ground causing warm air to rise rapidly and condense at high altitude. This produces heavy rain and thunderstorms.
Remember and understand1 What is the water cycle?
2 What causes water to fall as rain?
3 List these words in the correct order within the water cycle: precipitation, condensation and evaporation. Now write a defi nition for each in your own words.
Apply and analyse4 What is the difference between frontal rainfall and
orographic rainfall? How are they similar?
5 Why do you think the wettest place in Australia is near Tully on the eastern slopes of the Great Dividing Range in Queensland? You might like to fi nd Tully in an atlas to help with your answer.
6 The water cycle helps us to understand how water moves in our world but it can also help us understand how rivers change the landscape. How do you think the rivers shown in Source 2 have changed this landscape?
7 What type of rainfall do you receive most often in the place where you live? Why will the answer differ for students who live in other parts of Australia?
8 Salt water in oceans cannot be used to drink or water crops. Is salt water an available or potential resource?
Evaluate and create9 Imagine that you are a water droplet in a cloud.
Describe your journey through the water cycle in language that a young child would fi nd interesting. Here is a start: ‘Floating along with billions of my closest friends, I thought nothing would ever change …’
Check your learning 2.3
Rain falls
Warm air expands and rises
Air forced to rise cools and clouds form
Rain falls
Dry air falls resulting in a low chance of rain
Cold air sinksWarm air rises and cools forming clouds and condensation
Mountains
The water cycle
Clouds form and heavy rain falls
2A How is water an environmental resource?
46 oxford big ideas humanities and social sciences 7 western australian curriculum 47chapter 2 water in the world
DRAFT

Africa Oceania
South America
North AmericaAsia
Europe
1001000
Available freshwater resources(cubic kilometres per year)
L E G E N D
PACIFICOCEAN
ATLANTICOCEAN
ATLANTICOCEAN
INDIANOCEAN
Total water 100%
Fresh water 2.5%
freshwater lakes 67.4%
permafrost (frozen rock or soil) 0.8%
wetlands (saturated land e.g. swamp) 8.5%
groundwater 30.1%
oceans 97.5%
glaciers 68.7%
Surface water 0.4%
plants and animals 0.8%
rivers 1.6%
soil moisture 12.2%
atmosphere 9.5%
Source 1 Distribution of the world’s water
Although the surface of the Earth is covered with water, only a tiny per centage of that water is fresh and available for consumption. Typically this is found in surface water, such as lakes and rivers. Source 1 shows the breakdown and availability of this water. As populations grow and more water is used, people are also using groundwater locked away in underground aquifers. This water supports every man, woman, child, animal and plant on Earth. This makes water our most precious resource.
To further complicate matters, the available fresh water is not evenly distributed across the planet. Some areas of the world have much more than they need, while other areas do not have enough.
Countries with large rivers, such as the Amazon River in Brazil, and those with high rainfall, such as Indonesia and Papua New Guinea, can be thought of as being ‘water rich’. Other countries, including Australia, can be considered to be ‘water poor’.
GroundwaterWhen it rains, water seeps into the soil to provide moisture for plants to survive. As water passes through the spaces between soil and rock it becomes groundwater. In the saturated zone, all the spaces between soil and rock particles are fi lled with water. The top of this zone is referred to as the water table (see Source 2).
Using the PQE method to describe mapsThe PQE method is used by geographers to identify trends and patterns in data and draw conclusions. For more information on the PQE method refer to section 1B of ‘The geography toolkit’. There are three steps to follow when using the PQE (pattern, quantify, exceptions) method to describe maps:
Step 1 Pattern: Give a general overview of the pattern, referring to particular places. Which areas seem to have common features? (For example, ‘The map of the world’s freshwater resources shows that countries throughout South America have lots of fresh water’).
Step 2 Quantify: Quantify your general overview using data for specifi c regions or countries. (For example, ‘Brazil has more than 5000 km3 of fresh water a year.’)
Step 3 Exceptions: Point out any exceptions to the pattern you have described. (For example, ‘Madagascar, the island off Africa, appears to have abundant water supplies, whereas the rest of the African continent does not.’)
Apply the skill1 Use the PQE method to describe the world’s freshwater
resources. Be sure to describe areas that are water rich and those that are water poor. The world map on the inside back cover will be useful.
skilldrill
Groundwater is fed by surface water from rainfall and rivers and naturally comes to the surface at springs or at oases in dry areas. Groundwater is also drawn to the surface by bores drilled into the ground. Most of Perth’s water is drawn from an underground aquifer, a layer of permeable rock that stores water.
The world’s freshwater resourcesSource 3 is a map of the world as you have never seen it before. While each country is shown in its correct location, its size shows the proportion of the world’s freshwater resources found there. Countries that appear fat are water rich; those that appear thin are water poor. Comparing the size and shape of countries in Source 3 with the same countries on a standard world map (like the one provided at the back of this book) will clearly show which are water rich (larger than normal) and which are water poor (smaller than normal).
Source 2 Groundwater from aquifers is pumped to the surface via bores for use by humans. In this example, water is pumped through a bore using a windmill.
WORLD: FRESHWATER RESOURCES
Source 3 Source: Oxford University Press
Remember and understand1 How much of the world’s water is
fresh water, available for our use?
2 Is Australia water rich or water poor? What does this mean?
3 Study Source 3.a Which countries would you
consider to be the most water rich? Which are the most water poor?
b Compare the freshwater resources of Australia, New Zealand and Papua New Guinea.
Apply and analyse4 What can countries that are water
poor do to access more fresh water? Brainstorm this as a class. Think fi rst of those methods that you already know about, perhaps those used in your local area, and then expand these into other possibilities.
Check your learning 2.4
2.4 Accessing water resources
windmill
water table saturated zone unsaturated zone
rainfallriver
water
2A How is water an environmental resource?
48 oxford big ideas humanities and social sciences 7 western australian curriculum 49chapter 2 water in the world
DRAFT

Antarctic Circle
80°W
100°W
160°W180°140°E 160°E
120°E
100°E
80°E
40°E 20°E 0° 20°W 40°W
60°W60°E
80°S
60°S
Ross IceShelf
RonneIce Shelf
LarsenIce Shelf
R O S S S E A
D A V I S
S E A
AMUNDSEN SEA
HAAKON VII SEA
WEDDELL SEA
SCOTIA SEA
BELLINGSHAUSEN SEA
Lambert Glacier
S O U T H E R N OC
EA
N
S O U T H E R N O C E A N
P A C I F I CO C E A N
A T L A N T I CO C E A N
I N D I A NO C E A N
Cape GoodenoughCape Mose
Cape Ann
Cape Norvegia
Cape HornCape Boothby
Cape Flying Fish
CHILE
ARGENTINA
AntarcticPeninsula
G r e a t e r
( E a s t e r n )
A n t a r c t i c a
L e s s e r
( W e s t e r n )
A n t a r c t i c a
P o l a r
P l a t e a u
Vinson Massif5140 m
Mt Erebus 3795 m
TR
AN
SA
NT
AR
CT
I C M
OU
NTA
I NS
South Pole
Vostok (Russia)
South Magnetic Pole
Casey (Australia)
Scott Base(New Zealand)
Mawson (Australia)
0 500 1000kilometres
kilometres
–2000–1000
010002000300040005000 Vinson Massif
5140 mCasey(Australia)
Scott Base (New Zealand)ice sheet ice sheet
bedrock
Height(metres) Greater Antarctica
Lesser Antarctica Antarctic Peninsula
Ross Ice ShelfSea level
TRANSANTARCTICMOUNTAINS
0 500 1000 1500 2000 2500 3000 3500 4000 4500 5000 5500 6000 6500
A
A
B
B
C
C
Permanent sea ice
Mountains
LEGEND
Ice sheet
Ice shelf
Winter sea ice
The water cycle is the movement of water through the Earth, but most of the fresh water on Earth is in storage. Fresh water can be stored for days or weeks in a lake or for thousands of years underground or in an ice cap, such as the one that covers much of Greenland. About 97.5 per cent of the Earth’s water is found in the oceans and is too salty to drink. Much of the remaining 2.5 per cent, which is safe for us to drink, is locked in the polar ice caps and in fl owing rivers of ice, known as glaciers.
Antarctica contains nearly 70 per cent of the world’s fresh water as ice in an ice sheet that covers large sections of bedrock (solid ground) in Antarctica. The ice sheet has an average thickness of 2500 metres and scientists have found places where the ice is thought to be twice this thickness. If this ice were to melt, sea levels around the world would rise by up to 60 metres. Because the temperature in the interior of Antarctica remains below freezing, any snow that has fallen there in the last few million years has never melted and has gradually formed into a great dome of ice. The ice is gradually moving towards the sea away from the centre of the continent. As it reaches the sea, the ice breaks off into gigantic icebergs.
Remember and understand1 List three places where ice is stored.
2 Where is most of the world’s fresh water stored?
3 Why doesn’t the ice in Antarctica melt?
Apply and analyse4 Look carefully at the map in Source 2.
a What happens to the sea surrounding Antarctica in winter?
b What is the difference between an ice sheet and an ice shelf?
5 Look carefully at the cross-section of Antarctica in Source 2. This shows a view of Antarctica from the side as if it had been cut along the A–B–C line on the map. a Over which part of Antarctica is the ice sheet
the thickest?b Describe what Antarctica would look like
without its ice sheet.c Why is this cross-section a better way of
showing the thickness of ice in Antarctica than the map?
6 What would happen if all the ice in Antarctica were to melt? What conditions might cause this to happen?
Check your learning 2.5
Source 1 The ice of Antarctica stores most of the world’s fresh water.
Source 2 Source: Oxford University Press
ANTARCTICA: LANDFORMS
2.5 Stored water2A How is water an environmental resource?
50 51chapter 2 water in the world oxford big ideas humanities and social sciences 7 western australian curriculum
DRAFT
52 oxford big ideas geography history 7: australian curriculum
Arctic Circle
Equator
Tropic of Capricorn
Tropic of Cancer
ARCTIC OCEAN
PACIFIC OCEAN
ATLANTIC
OCEAN
INDIAN OCEAN
ATLANTICOCEAN
EUROPE ASIA
AFRICA
AUSTRALIA
NORTHAMERICA
SOUTHAMERICA
0 1500 3000 km
Percentage of populationwith access to safedrinking water
LEGEND
10090 to 9970 to 8950 to 69Under 50
No data available
United Kingdom149 litres
Mozambique4 litres
China86 litres
Australia493 litres
USA575 litres
Peru173 litres
Serah’s storySerah and her six children live in Ethiopia in Africa. The scarcest resource in her region is water. Before dawn, she makes her fi rst journey to the village pump. Once there were three wells, but the 8-metre well has dried up. The 9-metre well has a little salty water at the bottom. The fl ow from the pump of the 25-metre well has slowed to a painful trickle. There is just barely enough for everyone to drink.
While it takes her 25 minutes to walk down the hill to the pump, it will take her 40 minutes to make the return journey with the 10-litre jar balanced on her head. She makes this trip at least twice a day. She tends not to drink as much as the others as she believes she should look after her children before herself. This means that she cannot produce enough milk for her baby, so he is often ill. The water contains parasites that make her other children sick, but Serah has little choice.
For more information on the key concept of environment, refer to page XX of ‘The geography toolkit’.
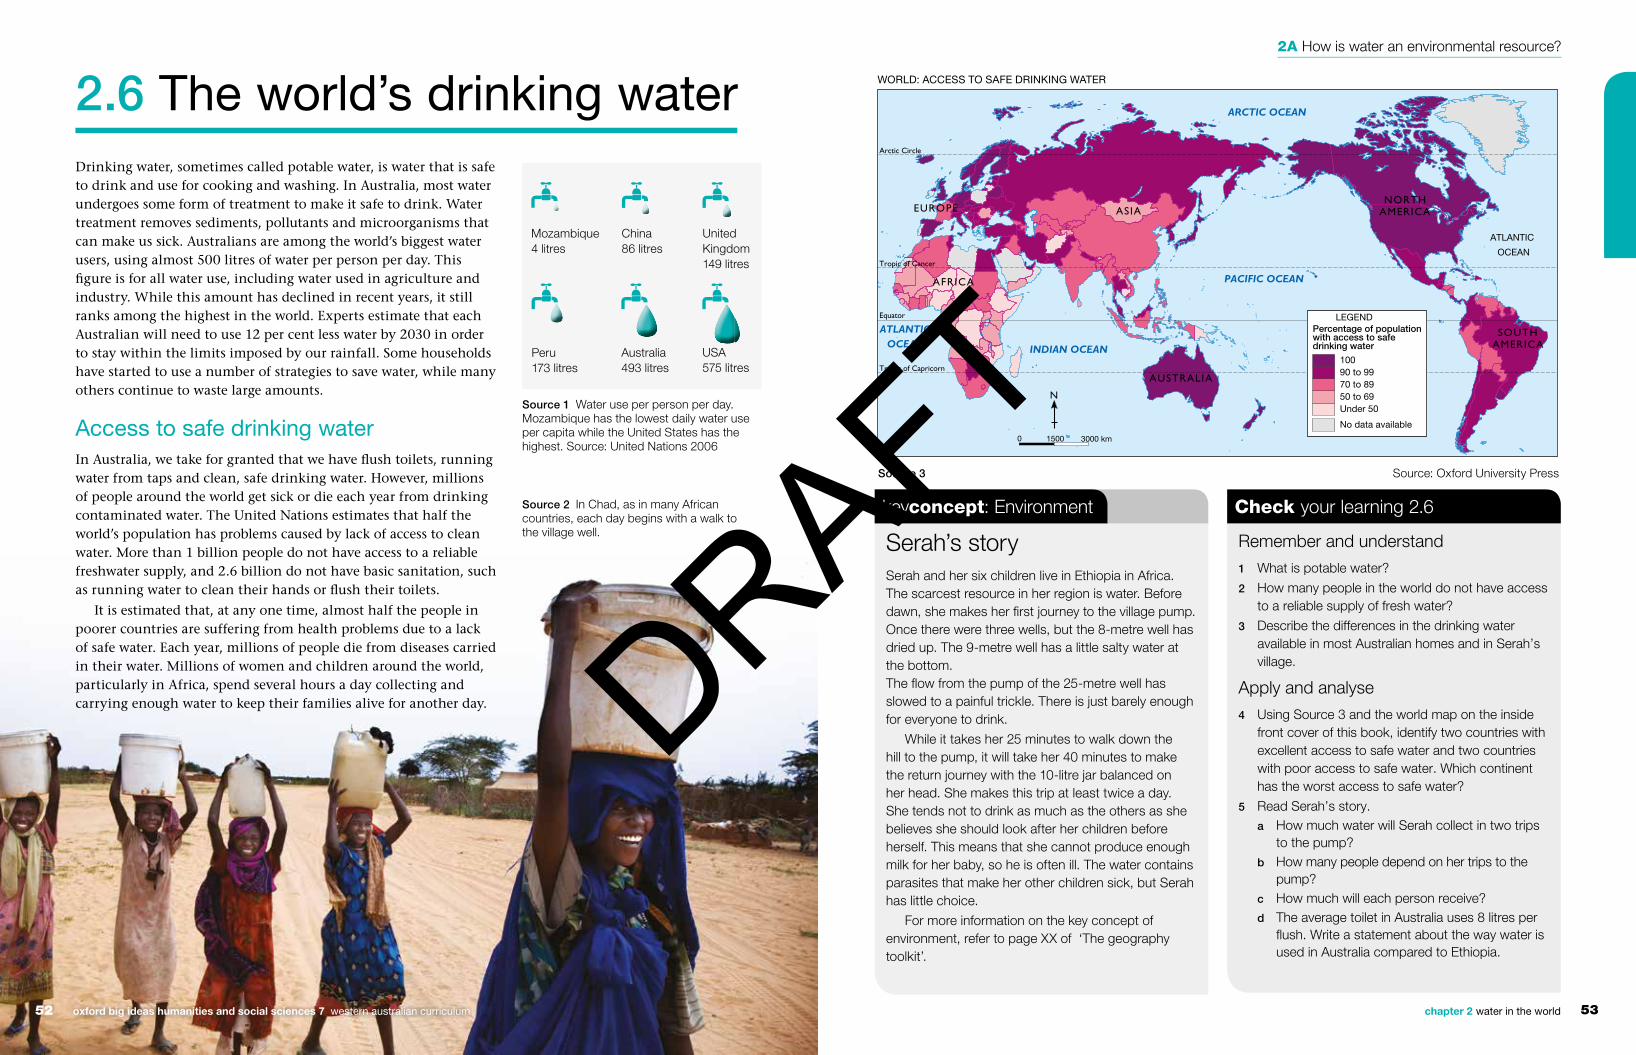
2.6 The world’s drinking water
Source 3 Source: Oxford University Press
keyconcept: Environment
Remember and understand1 What is potable water?
2 How many people in the world do not have access to a reliable supply of fresh water?
3 Describe the differences in the drinking water available in most Australian homes and in Serah’s village.
Apply and analyse4 Using Source 3 and the world map on the inside
front cover of this book, identify two countries with excellent access to safe water and two countries with poor access to safe water. Which continent has the worst access to safe water?
5 Read Serah’s story.a How much water will Serah collect in two trips
to the pump?b How many people depend on her trips to the
pump?c How much will each person receive?d The average toilet in Australia uses 8 litres per
fl ush. Write a statement about the way water is used in Australia compared to Ethiopia.
Check your learning 2.6
Drinking water, sometimes called potable water, is water that is safe to drink and use for cooking and washing. In Australia, most water undergoes some form of treatment to make it safe to drink. Water treatment removes sediments, pollutants and microorganisms that can make us sick. Australians are among the world’s biggest water users, using almost 500 litres of water per person per day. This fi gure is for all water use, including water used in agriculture and industry. While this amount has declined in recent years, it still ranks among the highest in the world. Experts estimate that each Australian will need to use 12 per cent less water by 2030 in order to stay within the limits imposed by our rainfall. Some households have started to use a number of strategies to save water, while many others continue to waste large amounts.
Access to safe drinking waterIn Australia, we take for granted that we have fl ush toilets, running water from taps and clean, safe drinking water. However, millions of people around the world get sick or die each year from drinking contaminated water. The United Nations estimates that half the world’s population has problems caused by lack of access to clean water. More than 1 billion people do not have access to a reliable freshwater supply, and 2.6 billion do not have basic sanitation, such as running water to clean their hands or fl ush their toilets.
It is estimated that, at any one time, almost half the people in poorer countries are suffering from health problems due to a lack of safe water. Each year, millions of people die from diseases carried in their water. Millions of women and children around the world, particularly in Africa, spend several hours a day collecting and carrying enough water to keep their families alive for another day.
Source 2 In Chad, as in many African countries, each day begins with a walk to the village well.
Source 1 Water use per person per day. Mozambique has the lowest daily water use per capita while the United States has the highest. Source: United Nations 2006
WORLD: ACCESS TO SAFE DRINKING WATER
2A How is water an environmental resource?
53chapter 2 water in the world 52 oxford big ideas humanities and social sciences 7 western australian curriculum
DRAFT

200
100
0
300
600
400
500
To
tal a
nnua
l in�
ow
s in
to P
erth
dam
s (g
igal
itres
*)
700
800
900
1000
1941
1943
1945
1947
1949
1951
1953
1955
1957
1959
1961
1963
1965
1967
1969
1971
1973
1975
1977
1979
1981
1983
1985
1987
1989
1991
1993
1995
1997
1999
2001
2003
2005
2007
2009
2011
Year*1 gigalitre = 1 000 000 000 litres
Neerabup WannerooLexia
Mirrabooka
Mundaring
Canning
VictoriaChurchman Brook
Wungong
Serpentine
NorthDandalup
South Dandalup
Sampson Brook
Stirling
Gwelup
PerthSeawater
SouthernSeawater
Jandakot
CBD
Mandurah
BunburyCollie
Northam
N
0 20 40 km
Groundwatertreatment plantWater reservoiror damDesalination plant
Water pipelinePerth metropolitanarea
Town
L E G E N D
River
Area of map
Source 1 One of Perth’s desalination plants. The Perth Seawater Plant removes the salt from sea water to produce fresh water.
Perth’s water supplyLike many Australian cities and towns, Perth faces many challenges in supplying its population with enough fresh water. A decline in its rainfall over the last 100 years has meant that the people of this rapidly growing city can no longer rely on rivers, lakes and dams to supply all their water needs. About half of Perth’s water now comes out of the ground. North of the city are large aquifers which have collected rainwater for thousands of years and stored it within sand or limestone layers. Wells are dug to access the water which is treated, mixed with rainwater and used by Perth residents in their homes, farms and gardens. Up to 20 per cent of Perth’s water comes from two large desalination plants. The city was one of the fi rst in Australia to use desalination plants to provide fresh water. The Western Australian state government hopes that expansion of these plants will help to ‘drought-proof’ Perth.
2A rich task
skilldrill
Using a map legendIn order to show the features on maps clearly, various symbols and colours are used. To help us unlock the information on the map these symbols are explained in a legend (or key). There are three main types of map symbols:
• Point symbols – show features in one particular place (such as a railway station or desalination plant)
• Line symbols – show features that connect places on the map (such as roads and rivers)
• Area symbols – use colours or patterns to represent large areas (such as lakes and cities).
Apply the skill1 Study Source 2.
a What symbol has been used for desalination plants on this map?
b Give an example of an area symbol used on this map.
c How many groundwater treatment plants supply water to Perth?
d What do you notice about the location of the dams on this map?
Source 3 Water fl owing in to Perth’s dams 1941–2011
Extend your understanding
1 Look carefully at Source 3.a Compare the annual fl ow of water into Perth’s
dams before and after 1975. What difference can you see?
b List the four years with the smallest annual infl ows of water. What do you notice from this pattern?
c Why do you think the annual infl ow of water changes so greatly between years?
2 What two other sources of water does Perth use to access water other than dams fed by rain?
3 Do you think it is possible to drought-proof a city? Give some reasons for your answer.
4 What do you think will happen to the water in an aquifer if water continues to be pumped out of it for use in a city such as Perth?
5 Why does Perth need more water now than it did 100 years ago?
6 What are some of the strategies being tried to address water problems in other parts of Australia?
PERTH: WATER RESOURCES
Source 2 Source: Oxford University Press
54 oxford big ideas humanities and social sciences 7 western australian curriculum 55chapter 2 water in the world
2A How is water an environmental resource?2A How is water an environmental resource?
DRAFT
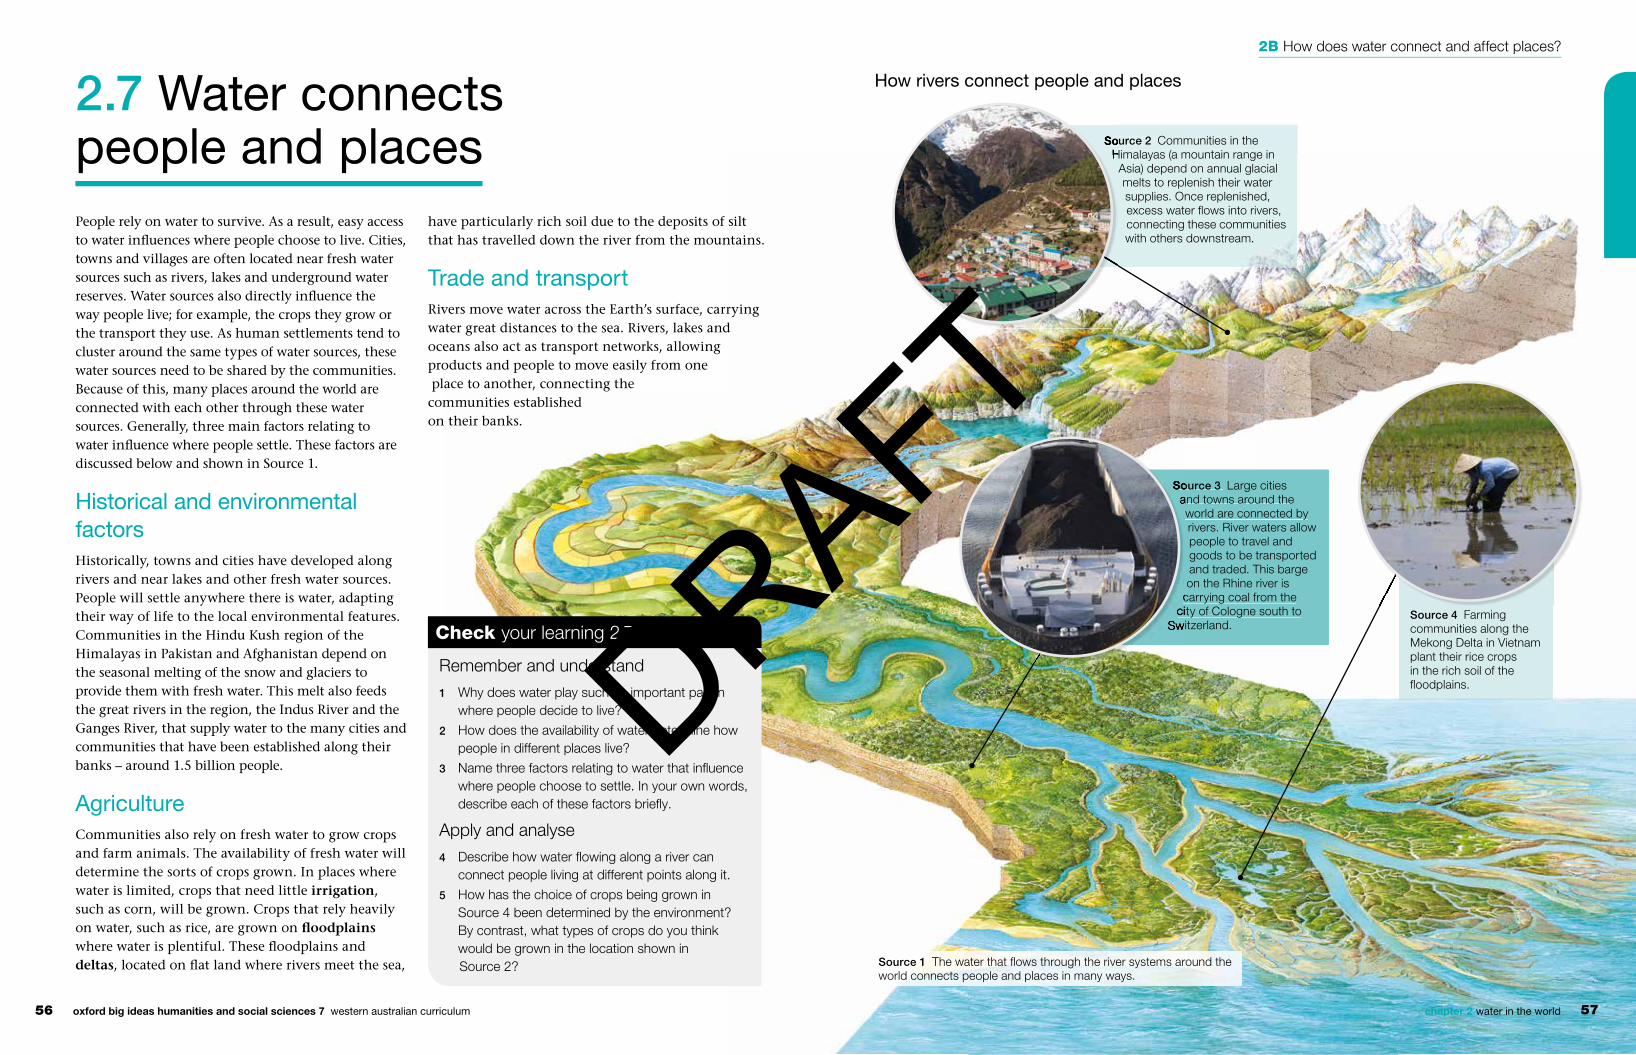
How rivers connect people and places
Source 3 Large cities and towns around the world are connected by rivers. River waters allow people to travel and goods to be transported and traded. This barge on the Rhine river is
carrying coal from the city of Cologne south to
Switzerland.Source 4 Farming communities along the Mekong Delta in Vietnam plant their rice crops in the rich soil of the fl oodplains.
Source 2 Communities in the Himalayas (a mountain range in
Asia) depend on annual glacial melts to replenish their water supplies. Once replenished, excess water fl ows into rivers, connecting these communities with others downstream.
Source 3 and towns around the
carrying coal from the city of Cologne south to
Switzerland.
Source 2 Himalayas (a mountain range in Himalayas (a mountain range in
2.7 Water connects people and placesPeople rely on water to survive. As a result, easy access to water infl uences where people choose to live. Cities, towns and villages are often located near fresh water sources such as rivers, lakes and underground water reserves. Water sources also directly infl uence the way people live; for example, the crops they grow or the transport they use. As human settlements tend to cluster around the same types of water sources, these water sources need to be shared by the communities. Because of this, many places around the world are connected with each other through these water sources. Generally, three main factors relating to water infl uence where people settle. These factors are discussed below and shown in Source 1.
Historical and environmental factors Historically, towns and cities have developed along rivers and near lakes and other fresh water sources. People will settle anywhere there is water, adapting their way of life to the local environmental features. Communities in the Hindu Kush region of the Himalayas in Pakistan and Afghanistan depend on the seasonal melting of the snow and glaciers to provide them with fresh water. This melt also feeds the great rivers in the region, the Indus River and the Ganges River, that supply water to the many cities and communities that have been established along their banks – around 1.5 billion people.
Agriculture Communities also rely on fresh water to grow crops and farm animals. The availability of fresh water will determine the sorts of crops grown. In places where water is limited, crops that need little irrigation, such as corn, will be grown. Crops that rely heavily on water, such as rice, are grown on fl oodplains where water is plentiful. These fl oodplains and deltas, located on fl at land where rivers meet the sea,
have particularly rich soil due to the deposits of silt that has travelled down the river from the mountains.
Trade and transportRivers move water across the Earth’s surface, carrying water great distances to the sea. Rivers, lakes and oceans also act as transport networks, allowing products and people to move easily from one place to another, connecting the communities established on their banks.
Source 1 The water that fl ows through the river systems around the world connects people and places in many ways.
Remember and understand1 Why does water play such an important part in
where people decide to live?
2 How does the availability of water determine how people in different places live?
3 Name three factors relating to water that infl uence where people choose to settle. In your own words, describe each of these factors briefl y.
Apply and analyse4 Describe how water fl owing along a river can
connect people living at different points along it.
5 How has the choice of crops being grown in Source 4 been determined by the environment? By contrast, what types of crops do you think would be grown in the location shown in Source 2?
Check your learning 2.7
2B How does water connect and affect places?
56 oxford big ideas humanities and social sciences 7 western australian curriculum 57chapter 2 water in the world
DRAFT

Phanat Nikhom
Samut Sakhon Bang Pakong
SamutPrakan
Baen
ChachoengsaoThon Buri
Bang Khla
Prachin Buri
Nakhon Nayok
Ban Na
Sara BuriKaeng Khoi
Phra Phutthabet
Doem Bang
Khok Samrong
Ban Lam NaraiChainat
Wat SingTa Khli
Uthai Thani
Wichian Buri
Nakhon Sawan
Khlong Khlung
Phetchabun
Phran Kratai
Bang RakamLom Sak
PhitsanulokLom Kao
Kong Krailat
Sukhothai
Dan Sai WangSaphung
Sawankhalok
Ban KaengBan NongUttaradit
Nakhon Thai
Gulf of Thailand
LAOS
THA I LAND
Doem Bang
Khok Samrong
ChainatChainat
Chao P
Chao P
ver
Khlong KhlungKhlong Khlung
Phran KrataiPhran KrataiPhran KrataiPhran KrataiPhran KrataiPhran Kratai
Khlong KhlungKhlong KhlungKhlong KhlungRiver
River
Pa Sak JolasidDam
Mae Klong
Mae Klong
River
River
Mae Klong
Mae Klong
Mae Klong
Mae Klong
Mae Klong
Mae Klong
Mae Klong
Mae Klong
Mae Klong
Mae Klong
Mae Klong
Mae Klong
Mae Klong
Mae Klong
Mae Klong
Mae Klong
Mae Klong
Mae Klong
Mae Klong
Mae Klong
Mae Klong
Mae Klong
Mae Klong
Mae KlongRiverRiver
L E G E N D
14–15 November 2011
Flooded area
mid-October 2011mid-September 2011mid-August 2011
Urban area
Major riverWatercourse/canal
Thailand
Areaof map
0 25 50 km
2.8 Water affects placesAs well as connecting different people and places, water can also affect them – in both positive and negative ways. On the positive side, water from the rain and rivers is used to irrigate the crops and farm the livestock that we eat. This water has a positive effect on the places in which we live. Without it, no life could exist. On the negative side, water in all its states – whether as a liquid (water), a solid (snow and ice) or a gas (fog) – can cause serious problems and damage in different places. Snow storms can shut down cities for days, heavy fog can disrupt air travel and cripple airports, and heavy rainfalls can cause widespread fl ooding.
A good way of understanding how water affects places is to look at some case studies relating to rivers. Rivers are interesting to study because if there is a problem upstream (such as a fl ood or pollution) this problem will quickly travel downstream, affecting the people who live there. Flooded rivers can affect many settlements along their banks, collecting and carrying rubbish or even trees and cars, as they go. If pollution or toxic chemicals enter the water at one location on the river, they quickly affect other parts of the river downstream, as well as the people who use it.
Case study: Tisza River pollution, 2000In 2000, a storage pond used by a gold mine in Romania burst its banks. Around 100 000 cubic metres of water containing poisonous cyanide spilt into a local river that fl owed into the Tisza River in nearby Hungary.
The cyanide spill killed much of the fi sh and plant life for several 100 kilometres downstream. Drinking water was polluted in four different countries: Romania, Hungary, Serbia and Bulgaria.
Remember and understand1 Give examples to show how water
affects places in its gas, liquid and solid states.
2 What problems did the gold mine in Romania cause downstream?
Apply and analyse3 Look carefully at Source 3.
a When did fl oodwaters reach Bangkok?
b How far had some of the fl oodwater travelled? (Use the scale provided to calculate the distance.)
4 Decide whether each of the following facts makes fl ooding in Bangkok more likely or more dangerous. Justify your answer for each one.a Between June and October
Thailand experiences its wet season with heavy monsoon rains.
b Bangkok has been built on the Chao Phraya River delta.
c Between 1985 and 2010 Thailand’s population increased by more than 10 million people.
d The land on which Bangkok is built is sinking by 30 millimetres a year.
Check your learning 2.8
Case study: Thailand fl oods, 2011In 2011, the people of Thailand experienced some of the worst fl ooding they had seen for decades. Areas of Thailand are prone to fl ooding as the annual monsoon brings heavy rain, particularly in the north of Thailand. In early 2011, a tropical cyclone combined with the monsoon to more than triple the amount of rain falling on northern Thailand. As heavy rains continued for several months, rivers burst their banks in the mountainous north, resulting in fl ash fl ooding and at least 13 deaths.
Flooding continued downstream in many large towns built beside rivers. Soon the country’s capital, Bangkok, became the area of greatest concern. Located on a low fl oodplain at the mouth of the Chao Phraya and Tha Chin Rivers, Bangkok is very prone to fl ooding and, despite an intricate system of fl ood walls and canals, much of the city fl ooded. By the time the fl oodwaters receded, they left more than 500 people dead and a damage bill of more than US$45 billion.
Source 2 Floodwaters in the main street of Ayutthaya during the fl oods in Thailand in 2011 shut down the city and resulted in many deaths
Source 1 A Hungarian fi sherman pulls out toxic fi sh from Lake Tisza on the Tisza River 12 days after a serious chemical spill upstream in Romania on 30 January 2000.
THAILAND: TIME LAPSE MAP SHOWING THE SPREAD OF FLOODWATERS, MID-AUGUST 2011 TO 15 NOVEMBER 2011
Source 3 Source: Oxford University Press
2B How does water connect and affect places?
58 oxford big ideas humanities and social sciences 7 western australian curriculum 59chapter 2 water in the world
DRAFT

Source 1 Water requirements to produce typical breakfast foods
Crop
Wat
er (m
egal
itres
*)10
12
8
6
4
2
0RiceSugarCotton GrapesFruitVegetables Grains/
pasture/livestock
*A megalitre is 1 million litres
Lake Hume
High rainfall grazing
Summer rainfall grazing
Irrigation areas
Wheat/sheep belt
Rangelands
L E G E N D
River
Darling R
iver
Murray
0 200 400 km
Murray–DarlingBasin
Rice Bubbles
Rice Bubbles are made from 89 per cent whole white rice, which is grown in the Murrumbidgee Irrigation Area (part of the Murray–Darling Basin). Much of the rice industry is centred around Deniliquin in southern New South Wales.
Estimated water needed to produce 1 kilogram of rice: 1550 litres
Milk and butter
More than 60 per cent of Australia’s milk and milk products comes from Victoria. Western Australia produces only 4 per cent of Australia’s milk.
Estimated water needed to produce 1 glass of milk: 200 litresEstimated water needed to produce 1 kilogram of butter: 18 070 litres
2.9 Water for foodFarmers are by far the biggest users of water in Australia. About 70 per cent of the fresh water used each year in Australia is used in agriculture. This water is used to produce an enormous range of products, many of which you consume every day (see Source 2).
You may not realise it, but a lot of water was needed to produce your breakfast. Many everyday products use even more water. For example, it takes up to 50 000 litres of water to produce 1 kilogram of beef, and 685 000 litres to produce enough wool to make one suit. The amount of water needed to produce an item of food, such as a steak, or a piece of clothing, such as a suit, is known as virtual water.
In Australia, many crops are grown in the Murray–Darling Basin in south-eastern Australia (see Source 4). While a lot of the water used in this region falls on the farms as rain, much of it is taken from the rivers. Movement and control of water has a large economic impact in this region.
In the past, the rivers in this region had a normal cycle of fl ood and drought. Farmers needed a more reliable fl ow of water and so a system of dams and weirs was built along the river. These collect water during wet times and release it gradually during dry times, thereby controlling the fl ow of the river.
Farmers are allowed to use a certain amount of water each year and are charged for the amount of water they use. Because they have to pay for their water, farmers in this region use it very carefully. Another reason for farmers to use water as effi ciently as possible is the scarcity of water in many parts of Australia. In the early years of the twenty-fi rst century, a widespread and severe drought turned the Darling River and many others into a series of pools separated by kilometres of dry river bed. Because of these factors, many farmers and farming industries have developed more water-effi cient methods of farming.
Murray River irrigation Lake Hume is an artifi cial lake formed by the Hume Weir near Albury–Wodonga on the Murray River. Completed in 1936, it is one of a series of dams and weirs built to control the fl ow of water in the Murray River. Its main purpose is to trap water during periods when there is a large amount of water in the Murray River and release it gradually to keep the fl ow of the river relatively constant.
A network of irrigation pipes and open channels carries the water from the Murray River hundreds of kilometres to individual farms. Open channels are generally less effi cient than pipes as water is lost to evaporation and water seeping into the soil. However, they are much cheaper to build than pipes.
When the water reaches the farms it fl ows through gravity or is pumped onto the crops or pastures. A common method of irrigation is the use of a pivot spray. A giant arm with sprayers attached moves around a central pivot point, creating distinctive circles of green.
Raspberry jam
The main ingredient in raspberry jam is sugar. Virtually all of Australia’s sugar is grown in Queensland. Raspberries grown in the Goulburn Valley make up 40 per cent of the jam.
Estimated water needed to produce 1 kilogram of sugar: 173 litres Estimated amount of water needed to produce 1 kilogram of raspberries:
713 litres
The main ingredient
Raspberry jam
Bread
The main ingredient in bread is wheat. Western Australia produces 50 per cent of wheat in Australia, across 4000 farms.
Estimated water needed to produce 1 kilogram of wheat: 750 litres
Apricots
Apricots are mainly grown and processed in northern Victoria and southern New South Wales. Western Australia grows about 3 per cent of Australia’s apricots.
Estimated water needed to produce 1 kilogram of apricots: 1391 litres
Rice BubblesRice BubblesRice Bubbles
Source 2 Water used per hectare (10 000 square metres) to grow selected crops
Source 4 Source: Oxford University Press
Source 3 An irrigation channel in the Murray–Darling Basin
Source 5 Pivot spray irrigation
Remember and understand1 How much of Australia’s fresh water is used on
farms?
2 How does water for irrigation of crops and pastures reach the farms?
3 Rank the breakfast foods shown in Source 1 in order from greatest water need to least water need.
Apply and analyse4 Can farmers use as much water as they want?
5 Look at Source 2. a Which crop uses the most water?b Which crop uses the least water?
6 Why do you think it takes so much water to produce 1 kilogram of rice?
7 In what ways is the Murray–Darling Basin one of Australia’s most important resources?
8 Look closely at the map (Source 4).a What relationship do you notice between
irrigation areas and rivers?b Explain the nature of this relationship.
Evaluate and create 9 Draw a labelled diagram to clearly show how
pivot spray irrigation works. Use Source 5 to help you.
Check your learning 2.9
MURRAY–DARLING BASIN: LAND USE
2B How does water connect and affect places?
60 oxford big ideas humanities and social sciences 7 western australian curriculum 61chapter 2 water in the world
DRAFT

Source 4 Source: Oxford University Press
CHINA: THREE GORGES DAM
hydro63%
other 1%geothermal 3%
wind 5%
bioenergy21%
solar 7%
800
800
800
600
600
600
600
400
400
400
400
400
400
400
400
200
200
200
200
200
412
731
890
728
523
948
806
701
438
363
770
206
618
563
222
721
Three Gorges Dam
Locks
Sandouping
Zhang Jia Po
Zhou Jia Ao
Shi Jia Po
Wai He Wan
Qiao Jia Ping
Jin Gang Cheng
Pan Jia Wan
Yang Gui Dian
Bai Shi Xi
Yang Jia Wan
Li Jia Wan
Yan Zhu Yuan
Shuang Shi Ling
Sha Ping
Wu Xiang Miao
Long Tan Ping
Da Yan Tou
Ying Zi Zui
San Duo Ping
Long Hu Shan
Tai Ping Xi Zhen
Hei Yan Zi
Xi Zhou
Shui Ping
Bai Miao Zi
Zhang
YANGTZE
RIVER
00 01 02 03 04 05 069998979606
07
08
09
10
11
12
13
14
15
16
17
18
30° 50’ N
111° E
L E G E N DMain road
Other road
Track
Dam wall
Contour with value (interval 200 metres)
Spot height (metres)657
800
Mostly forested
Large river/reservoir
Built-up area
Open area
Watercourse
Village
Buildings
0 1 3 42 5
kilometres
Scale 1:100 000
kilometres
800
800
800
600
600
600
600
400
400
400
400
400
400
400
400
200
200
200
200
200
412
731
890
728
523
948
806
701
438
363
770
206
618
563
222
721
Three Gorges Dam
Locks
Sandouping
Zhang Jia Po
Zhou Jia Ao
Shi Jia Po
Wai He Wan
Qiao Jia Ping
Jin Gang Cheng
Pan Jia Wan
Yang Gui Dian
Bai Shi Xi
Yang Jia Wan
Li Jia Wan
Yan Zhu Yuan
Shuang Shi Ling
Sha Ping
Wu Xiang Miao
Long Tan Ping
Da Yan Tou
Ying Zi Zui
San Duo Ping
Long Hu Shan
Tai Ping Xi Zhen
Hei Yan Zi
Xi Zhou
Shui Ping
Bai Miao Zi
Zhang
YANGTZE
RIVER
00 01 02 03 04 05 069998979606
07
08
09
10
11
12
13
14
15
16
17
18
30° 50’ N
111° E
L E G E N DMain road
Other road
Track
Dam wall
Contour with value (interval 200 metres)
Spot height (metres)657
800
Mostly forested
Large river/reservoir
Built-up area
Open area
Watercourse
Village
Buildings
0 1 3 42 5
kilometres
Scale 1:100 000
kilometres
intake
powerhouse
long-distance power lines
turbine
generator
reservoir
river
Source 1 How a hydroelectric power station works
Moving water has been used as a source of energy since ancient Greek and Roman times, with the invention of the water-driven wheel. Watermills built by the Romans used the force of the fl owing water to drive the blades of a large wooden wheel. This, in turn, rotated an axle to drive the machinery inside the mill to grind grains like wheat and corn.
HydroelectricityToday electricity is generated following the same basic concept used in Roman watermills. A dam is built across a river, creating a large reservoir of water. This water is then released through turbines, causing them to turn. The spinning turbines rotate giant magnets around a huge coil of copper wire to create electricity. The faster the water fl ows, the more electricity is created. This type of electricity is known as hydroelectricity.
Australia’s largest plant is the Snowy Mountains Hydroelectric Scheme. More than 100 000 people from over thirty countries constructed the huge tunnels, dams and power stations. Electricity generated by the scheme is used in the Australian Capital Territory, New South Wales and Victoria. Source 3 An oblique aerial view of the
Three Gorges Dam on the Yangtze River in China. Water fl ows through the open sluice gates. The hydroelectric power station is to the left of the sluice gates.
Source 2 Energy from renewable and continuous sources. Hydroelectric power accounts for most of the total energy produced from these sources around the world.
Remember and understand1 How is water used to create electricity?
2 What is the main source of renewable energy in the world?
3 What advantages and disadvantages does the building of dams bring?
4 How can you stop a river fl owing to enable a dam wall to be built?
Apply and analyse5 Look carefully at Source 3. Oblique aerial images are
taken from an angle and show a foreground and a background. Is the dam wall in the foreground or the background?
6 Draw a sketch of the oblique aerial image (Source 3) and label the following:• Three Gorges Dam• Yangtze River• hydroelectricity plant
Check your learning 2.10
Hydroelectricity is the largest source of renewable, non-polluting energy in the world. The main negative impact of building a hydroelectric plant is that the natural fl ow of the river is stopped and the land behind the dam is fl ooded. The fl ooding of valleys behind the dam can destroy natural habitats and human features, such as houses, fences and roads.
Case study: Three Gorges Dam, China China’s Three Gorges Dam is not only the world’s largest dam, it is also the largest power station ever built. More than 2 kilometres long and 180 metres high, the dam has turned the Yangtze River into a lake 660 kilometre long. As well as producing electricity, the dam has increased the Yangtze River’s shipping capacity, and has reduced the fl ooding hazard downstream. The building of the Three Gorges Dam stirred protests around the world, as it involved displacing 1.25 million people and fl ooding more than 600 square kilometres of land; that is about 30 000 times the size of the Melbourne Cricket Ground.
2.10 Water for energy2B How does water connect and affect places?
62 oxford big ideas humanities and social sciences 7 western australian curriculum 63chapter 2 water in the world
DRAFT

Source 1 Ok Tedi mine in Papua New Guinea
0 1 2 km
Ok Tedi mine
Ok Tedi River
Sulphide Creek
Ok Mani River
Tabubil
0 1 2 km
Ok Tedi mine
Ok Tedi River
Sulphide Creek
Ok Mani River
Tabubil
skilldrill
The Ok Tedi mineThe Ok Tedi copper and gold mine is located on the Ok Tedi River, in Papua New Guinea. During mining operations large amounts of chemicals are used to separate the precious gold and copper minerals from other rocks. These chemicals, along with ground up rocks and ore (known as tailings), need to be disposed of. In order to do this, the mine owners (BHP Billiton) built a dam known as the tailings dam. The tailings dam allowed heavy metals and solid waste from the mine to settle. Cleaner water would then be released into the river system.
Unfortunately, an earthquake in 1984 collapsed the tailings dam. BHP Billiton argued it was too expensive to rebuild it.
2B rich task
Source 2 Satellite image of Ok Tedi mine, 5 June 1990 Source 3 Satellite image of Ok Tedi mine, 26 May 2004
Identifying change over timeBy carefully examining photographs, satellite images or maps from different times we can see the changes that occur at a location. When studying the same area at two different times:
Step 1 Find a key feature, such as a river or main road, as a reference point on both sources.
Step 2 Note the areas of the image where there has been little or no change.
Step 3 List the differences in the later image where there has been change.
Step 4 Look for other information on the image that shows what might have contributed to the change.
Step 5 Describe the type of change – permanent change or seasonal change (such as different stages of crop production or plant growth).
Apply the skill1 Study Sources 2 and 3.
a In what two years were the satellite images taken?
b Were the images taken at different times of the year?
c What changes to the rivers occurred between the two years when these images were taken?
d Why did these changes occur?
e Are these changes permanent or seasonal?
f Draw a sketch map of the area in 2004, using a key and labels to outline the changes that have occurred since 1990.
Extend your understanding
1 What competing uses were there for the Ok Tedi and Ok Mani Rivers?
2 What problem did BHP Billiton have managing the polluted water in their tailings dam?
3 What environmental impact did the tailings have on the rest of the river?
4 What social impact did the actions of BHP Billiton at the Ok Tedi mine have on the Indigenous users of the river?
5 Give another example where change in water use in one part of a river has impacted on water users downstream.
Since 1984 the mine has discharged 70 million tonnes of tailings into the river system each year. Chemicals from these tailings destroyed wildlife in the river, particularly fi sh. The materials dumped into the river changed a deep and slow river into a shallow river with rapids. Transport up and down the river became more diffi cult. The change in the river bed led to frequent fl oods that spread contaminated mud onto 1300 square kilometres of farms along the Ok Tedi River. The discharge from the Ok Tedi mine caused great harm to the 50 000 Indigenous people who live in the 120 villages downstream of the mine. Millions of dollars in compensation was paid to those affected by the misuse of the river system.
64 oxford big ideas humanities and social sciences 7 western australian curriculum 65chapter 2 water in the world
2B How does water connect and affect places?
DRAFT

Tropic of Capricorn
Brisbane
Sydney
Melbourne
Hobart
Adelaide
Perth
Darwin
Tully
Alice Springs
Canberra
Lake Eyre
Over 2400
Average annual rainfall(millimetres)
1600 to 24001200 to 1600600 to 1200200 to 600Under 200
Great ArtesianBasin
L E G E N D
0 400 800 km
New S outh
Wales
Vic tor ia
Western
Austra l ia
Queensland
South
Austra l ia
AC T
Tasmania
Nor thern
Terr i tor y
400
500
300
200
100
0
Ave
rag
e ra
infa
ll (m
m)
Ave
rag
e te
mp
erat
ure
(°C
)
40
50
30
20
10
0
Month
J F MAM J J A S O N D
mm°C
0
RainfallAverage temperature
Month
400
300
200
100
350
250
150
50
Rai
nfal
l (m
m)
Tem
per
atur
e (°
C)
40
45045
35
30
25
15
5
20
10
0J F MAM J J A S O N D
Darwin
0
RainfallAverage temperature
Month
400
300
200
100
350
250
150
50
Rai
nfal
l (m
m)
Tem
per
atur
e (°
C)
40
45045
35
30
25
15
5
20
10
0J F MAM J J A S O N D
Alice Springs
0
RainfallAverage temperature
Month
400
300
200
100
350
250
150
50
Rai
nfal
l (m
m)
Tem
per
atur
e (°
C)
40
45045
35
30
25
15
5
20
10
0J F MAM J J A S O N D
Sydney
AUSTRALIA: AVERAGE ANNUAL RAINFALL (CLIMATE GRAPHS FOR SELECTED LOCATIONS)
2.11 Water in Australia
Being such a large country, Australia has a great deal of variation in rainfall. It is common for one part of the country to have fl oods while another has a long drought. The wettest place in Australia is Tully, near Innisfail in north Queensland, which averages 4204 millimetres of rainfall a year. Tully receives so much rain because of its location within the tropics on the north-eastern facing slopes of the Great Dividing Range.
The driest place in Australia is on the shores of Kati Thanda (Lake Eyre) in South Australia, which receives little more than 100 millimetres per year. Kati Thanda receives so little rain because it lies far from any supply of moisture. Air masses reaching the interior of the country have generally dropped their rain on to the south-eastern corner of Western Australia, and so they are dry by the time they arrive at Kati Thanda.
Many communities in the interior of Australia rely on underground water as well as the little rain that falls. Lying beneath much of eastern Australia is the world’s largest underground water supply, the Great Artesian Basin (see Source 1). It is over 1.7 million square kilometres in size and covers approximately 22 per cent of Australia. The water is trapped underground in a sandstone layer covered by sedimentary rock, creating a aquifer. Farmers and communities access this water by drilling a well and pumping water to the surface with a windmill.
Australia’s river resourcesRivers are a vital source of fresh water for many people. Australia, though, has the lowest volume of water in rivers of any inhabited continent on Earth. On average, just 12 per cent of Australia’s rainfall is collected in rivers; this is referred to as the river discharge. The remaining 88 per cent of rainfall is used by plants, held in natural water storages (such as lakes, wetlands and aquifers) or returned to the atmosphere through evaporation. The Darling River, part of Australia’s largest river basin (the Murray–Darling Basin), loses enough water every year through evaporation to fi ll Sydney Harbour four times.
Rainfall distribution in AustraliaMuch of the Australian continent is dry. It is only the northern, eastern and south-western coastal regions that receive good annual rainfall. The climate of the eastern half of Australia is infl uenced by the Great Dividing Range. It extends 3500 kilometres from the northern tip of Cape York to southern Victoria. Moisture-rich winds from the south-east push warm, moist air over the land. Forced to rise and cool, the water droplets fall onto the east coast as rain, but as the air descends to the west, it becomes warmer and drier.
Source 1 Source: Oxford University Press
Source 2 Australia’s heaviest rainfall makes Tully the white-water rafting capital of Australia.
Remember and understand1 Why do many Australians live on the southern and
eastern coast?
2 Where are the wettest regions of Australia? Where are the driest regions of Australia?
3 How do many farmers and communities in inland Australia access more water?
4 Use the map in Source 1 to estimate how much rainfall is received every year on average where you live.
Apply and analyse5 Use the PQE method explained in the skilldrill on
page XX to describe the distribution of Australia’s rainfall.
6 Four climate graphs are shown in Source 1. Each of these gives us two important pieces of information about the climate at a particular place. Rainfall is shown as a series of blue bars while average temperatures are shown with a red line. The trickiest part of reading a climate graph is reading the correct scales. Temperature is shown on the left-hand side, rainfall is shown on the right-hand side, and months along the bottom. For more information on reading a climate graph refer to page XX of ‘The geography toolkit’.a Which is the most water poor of the four places
shown? Why is this?b Which has the most even or reliable rainfall
throughout the year? Why is this?c Which has the most seasonal rainfall?
Check your learning 2.11
Australia has the lowest volume of water in rivers and the smallest number of permanent wetlands of any continent except Antarctica. Australia’s water supplies are not evenly distributed. The northern third of the continent lies in the tropics and receives heavy rainfall with monsoons in the summer. It is a water-rich area. By comparison, vast areas of the interior receive very little rain.
Virtually all of Australia’s large cities and towns are positioned on the coast, especially in the east and south-east. This is because reliable rainfall in these regions has made them more liveable than drier parts of the country. Yet pressure from a large number of water users has put great strain on water resources in these areas.
2C How much water do we have?
66 oxford big ideas humanities and social sciences 7 western australian curriculum 67chapter 2 water in the world
DRAFT

Cobar
Tilpa
Louth
Bourke
0 25 50 km
Cobar
Tilpa
Louth
Bourke
0 25 50 km
Tropic of Capricorn50.040.030.020.015.010.05.00.0–5.0–10.0–15.0–20.0–30.0–40.0–50.0
L E G E N DTrend in annualrainfall, 1970–2011(millimetres per10 years)
Hobart
Melbourne
AdelaideCanberra
Sydney
Brisbane
Darwin
Perth
0 400 800 km
Source 4 Source: Oxford University Press
AUSTRALIA: RAINFALL TRENDS, 1970–2011
Source 3 The Darling River
2.12 Water quality and quanitity in AustraliaWater is particularly diffi cult to manage in Australia, the driest inhabited continent on Earth. Australia has the lowest amount of water in rivers and the smallest areas of permanent wetlands in the world. Australia’s water supplies are not evenly distributed. The northern third of the continent is water rich, while vast areas of the interior receive very little rain. Variable rainfall patterns make it quite common for one part of the country to experience major fl ooding while others experience extended periods of drought.
The Darling River The Darling is Australia’s third-longest river, fl owing 1390 kilometres from Brewarrina until it joins the Murray River at the town of Wentworth. The Murray and Darling are the main rivers in the Murray–Darling River Basin, where 40 per cent of Australia’s food is produced.
Remember and understand1 Which part of Australia is the most water poor?
2 Read the poem ‘My Country’ in Source 2.a Decide if you think the poem accurately describes the part
of Australia you live in.b Which line in the poem best sums up Australia’s variable
water supply?
3 Why might a warmer future lead to less water being available in Australia?
4 Look at Source 1. How and why did the fl ow of water along the Darling River change between 2011 and March 2012?
Apply and analyse5 Look carefully at Source 4.
a Between 1970 and 2011, which parts of Australia experienced signifi cant decreases in annual rainfall?
b Which capital cities have been most affected?c How has the Murray–Darling River Basin been affected?
Check your learning 2.12
The fl ow of water in the Darling River varies greatly due to drought and water that is taken to supply farms for irrigation. The Darling can be a small trickle or a raging torrent – it can even dry up completely. The Darling River stopped fl owing at the town of Menindee, near Broken Hill in New South Wales, 48 times between 1885 and 1960.
Climate changeAustralians have come to see drought as part of the natural cycle of rainfall patterns, but a new threat now faces us – and it is one we do not fully understand. For years scientists have been warning us about the possibility that our climate is changing. While the vast majority of the world’s scientifi c community now accepts that the planet is warming due to the effects of greenhouse gases, these experts are much less sure how this will affect specifi c places and specifi c climates.
It appears that climate change will mean less water for many Australians in the future, putting even greater pressure on our current supplies. Much of Australia’s fresh water comes from water collected in rivers, lakes and dams. This water will evaporate more quickly in the future, meaning that there will be less available for use in cities and rural areas. Source 4 shows the trends in annual rainfall over the last four decades. The green areas have had an increase in rainfall while the yellow and brown areas have had a decrease.
Source 2 Part of the poem ‘My Country’by Dorothea Mackellar (1908)
I love a sunburnt country,A land of sweeping plains,Of ragged mountain ranges,Of droughts and fl ooding rains,I love her far horizons,I love her jewel-sea,Her beauty and her terror –The wide brown land for me! …
Core of my heart, my country!Her pitiless blue sky,When sick at heart, around us,We see the cattle die –But then the grey clouds gather,And we can bless againThe drumming of an army,The steady, soaking rain…
Source 1 These satellite images of the Darling River show the river affected by drought in 2011 (left), and fl ooded in March 2012 (right). These images use a photographic technique to help geographers distinguish between water and land. The colours used in the image are blue for water, bright green for vegetation, and an earth-tone for bare ground.
2C How much water do we have?
68 oxford big ideas humanities and social sciences 7 western australian curriculum 69chapter 2 water in the world
DRAFT

Tropic of Cancer
Arctic Circle
Equator
Tropic of Capricorn
L E G E N DSeverely polluted air
Severely polluted city
INDIAN
OCEAN
PACIFIC OCEAN
ATLANTIC
OCEAN
ARCTIC OCEAN
ATLANTIC
OCEAN
ASIA
AFRICA
EUROPE
NORTHAMERICA
SOUTHAMERICA
AUSTRALIA
Cairo New Delhi
KolkataKanpur Lucknow
Tianjin
ChongqingZhengzhou
Shenyang
Jakarta
0 1500 3000 km
Australia andOceania
65%
35%
55%
45%
Asia
80%
20%
Africa
65%
35%
Europe
57%
43%
South America
55%
45%
North America
7 080 km3
32 200 km3
22 300 km3
8 290 km3
28 400km3
18 300 km3
LEGEND
Rainfall (km3)
Evaporation (%)
Runoff (%)
Source 2 Some of Australia’s driest regions are in the desert.Source 3 Fresh water is found in ponds, lakes and rivers, such as this river in the Kimberley.
2.13 Water in the worldIn an average year, 577 000 km3 of rain falls on Earth. Of this, 458 000 km3 fall, on the oceans and 119 000 km3 on land.
When water falls to earth as rain, most of it evaporates back into the atmosphere. Of the annual rainfall that falls on land 74 000 km3 (or 62 per cent) evaporates. In Australia, around 65 per cent of our total rainfall each year evaporates. The remaining 35 per cent runs off the land, and of this, only about 12 per cent ends up in our rivers. Only Africa has a higher evaporation rate than Australia.
Remember and understand1 Use Source 1 to rank the six inhabited
continents from the continent with the most runoff to the continent with the least.
2 Which river carries the most water and how does it compare to other rivers?
Apply and analyse3 Look carefully at Source 4.
a Which region of the world is the wettest? Why do you think this is the case?
b Which part of Africa experiences the lowest rainfall? What type of landscape would you expect to fi nd here?
c Which part of Asia is the wettest? What are some of the advantages and disadvantages of high rainfall?
d Does the region north of the Arctic Circle have low or high rainfall? How might much of the water in this region be stored?
Check your learning 2.13
The amount of water in Australian rivers is the smallest of all inhabited continents, with South America experiencing the highest volumes of water in its rivers. For example, the Amazon River (the second-longest river in the world) carries more water than any other river on Earth with an average discharge (volume of water fl owing through it) greater than the next seven largest rivers combined. Nearly 20 per cent of all the fresh water entering the oceans comes from the Amazon River.
Source 4 Source: Oxford University Press
Source 1 Average volume of yearly rainfall (km3), evaporation and runoff by world region Source: FAO Aquastat
Source 5 South America’s high rainfall has contributed to the creation of the Iguazu Falls, which is 80 metres high and 3 kilometres wide.
WORLD: ANNUAL RAINFALL
2C How much water do we have?
70 oxford big ideas humanities and social sciences 7 western australian curriculum 71chapter 2 water in the world
DRAFT

72 oxford big ideas humanities 7 victorian curriculum
2.14 New ways of thinking about water
Countries where people eat lots of beef and rice and buy many manufactured goods use more water than countries where people eat mainly vegetables and have few personal goods.
Australians are one of the world’s biggest water users. It is estimated that Australia’s population will increase to about 35 million by 2056 and this will place a great strain on an already stressed water-supply network. Experts believe that Australia’s capital cities, for example, will need 76 per cent more water by 2056 than is currently supplied.
The good news is that Australians have embraced new water-saving measures. Despite the population of Australia increasing by 7.7 per cent between 2003 and 2009, the amount of water used by households actually fell by 12 per cent. This is due largely to water restrictions in many capital cities and the use of new technologies, such as dual-flush toilets and water-saving showerheads.
As global pressure on water resources increases, water experts are beginning to think of water in new ways. New terms for describing types of water and usage have been devised, including virtual water, and blue and green water. This new thinking is designed to promote a better understanding of the ways in which people use water and will help to make water usage more sustainable.
Virtual waterThe amount of water used to produce a good or service is called virtual water. This includes the water used to grow crops or raise animals as well as the water needed in processing these crops and animals into products. Experts coined the term virtual water because we cannot actually see how much water went into producing the goods and services we consume every day. For example, 15 000 litres of water are needed to produce just 1 kilogram of beef. This 15 000 litres of water is known as virtual water.
It is often impossible to move real water between water-rich countries and water-poor countries. It is, however, relatively simple to transport virtual water in the form of goods, such as meat and wheat. This helps to support water-poor countries with their water needs.
Source 2 A poster from the United Nations that uses the idea of virtual water to communicate a message
Remember and understand1 What is virtual water?
2 What is the difference between blue water and green water?
3 Why is it important to understand virtual water when working out your water footprint?
4 How can an understanding of virtual water help water-rich countries to decide what to produce and export?
Apply and analyse5 Source 2 states that the world is thirsty because it
is hungry. a What does this mean?b What evidence is presented to support this
idea?
6 Look carefully at the image of the Chinese farmer working in his rice fields (Source 1). a How is he using water as a resource? b How is he able to control the flow on water in
his fields? c Explain how this makes his use of water more
sustainable.
Check your learning 2.14
Blue water and green waterHistorically, water suppliers have focused on the capture and supply of blue water (that is, water in storages, such as lakes, rivers and acquifers) over green water (that is, rainwater stored in the soil as soil moisture). Green water is the water that remains in the soil to be used by plants. Farmers in dry regions, such as the interior of Australia, need to understand how to manage both their blue water resources and their green water resources. Installing a rainwater tank to collect and store water for later use is an example of blue water management. Adding a layer of mulch to slow the evaporation of water from the soil is an example of green water management.
Water footprintsThe total amount of water you consume each year is known as your water footprint. This includes the real water you consume (by drinking, bathing and cleaning) and the virtual water you use through your consumption of goods and services. The total volume of water used by everyone who lives in a country, including the water used to produce exported goods, is the national water footprint.
The size of a country’s water footprint is largely determined by the country’s:
• climate, especially the amount of rainfall and evaporation
• farming methods, especially how efficiently water is used
• production and consumption of crops
• general consumption and production patterns.
Source 1 One kilogram of rice contains 1500 litres of virtual water, making it one of the world’s thirstiest crops.
2C How much water do we have?
72 oxford big ideas humanities and social sciences 7 western australian curriculum 73chapter 2 water in the world
DRAFT

skilldrill
Cu
bango River
OkavangoDelta
MakgadikgadiPan
EtoshaPan
Cunene River
Cuito River
Cuando River
Zam
bezi River
Orange Rive
r
Fish
Ri v
er
Windhoek
Rundu
Grootfontein
BOTSWANA
ZAMBIA
SOUTHAFRICA
NAMIBIA
ANGOLA
Under 100100 to 200200 to 300300 to 400400 to 500Over 500
L E G E N DAverage annual rainfall(millimetres)
Proposed pipeline
Temporary riverPermanent river
Country border
Existing canal
0 150 300 km
Namibia
skilldrill
2C rich task
Windhoek, NamibiaNamibia is the driest country in Africa south of the Sahara Desert. Its capital, Windhoek, receives about 360 millimetres of rainfall a year and its 250 000 people rely on three dams for most of their water. These dams, however, are built on rivers that do not always fl ow and are therefore unreliable for city water use.
skilldrill
1 Describe the annual pattern of rainfall in Windhoek.
2 Explain how this annual pattern makes dams and reservoirs an unreliable water resource.
3 Describe the annual pattern of temperature and explain the impact of these temperatures on the evaporation of water held in dams.
4 Compare the climates of Windhoek and Alice Springs (Source 1 on page XX).
5 Examine the map of Namibia. Identify three water resources on this map.
6 a What have the people of Windhoek done to make their water supply more sustainable and safe?
b What problems does lack of access to safe water cause?
7 Use the information on the map (Source 3) to explain why a pipeline is proposed to be built from the Cubango River to Grootfontein.
8 Why would the people of Botswana be concerned about this proposed pipeline?
Source 1 Water is a scarce and precious resource in Namibia. These women walk for hours a day to get water.
Drawing climate graphsClimate graphs combine column graphs and line graphs to help us interpret the climate in a specifi c location. In order to draw a climate graph, geographers gather climate data – the monthly average rainfall and temperature – for the location they are investigating.
Step 1 Look carefully at the climate data to fi nd the lowest and highest temperature fi gures that you will need to show on your graph. In this example, Windhoek’s temperature varies from 20 to 30 degrees Celsius. Decide on a scale that shows this range of data, then place it on the left-hand axis of your climate graph.
Step 2 Using graph paper, plot the temperature data on your graph by placing a small, neat dot in the centre of each month at the correct height. Join the dots with a smooth red line and continue the line to the edges of the graph.
Step 3 Look carefully at the climate data to fi nd the lowest and highest rainfall fi gures that you will need to show on your graph. In this example, Windhoek’s rainfall varies from 0 to 79 millimetres a month. Decide on a scale that shows this range of data, then place it on the right-hand axis of your climate graph.
Step 4 Plot the rainfall on your graph by drawing a blue column to the correct height for each month. You may like to very lightly shade the bars with a blue pencil.
Step 5 Complete your graph with a suitable title and a label for each of the three axes.
Apply the skill1 Using the steps shown above and the
data in Source 2 and referring to the Alice Springs climate graph (Source 1 on page XX), construct a climate graph for Windhoek.Source 2 Climate data: Windhoek, monthly averages
Months Jan. Feb. Mar. Apr. May Jun. Jul. Aug. Sep. Oct. Nov. Dec.
Rainfall (mm) 76 74 79 41 8 0 0 0 3 10 23 48
Temperature (°C) 29 28 27 25 22 20 20 23 25 29 29 30
Source 3 Source: Oxford University Press
Extend your understandingNAMIBIA: AVERAGE ANNUAL RAINFALL
Source 4 Many Namibian rivers (like the one shown below) are only temporary, meaning they are dry for most of the year.
In 1969 the government decided to mix water from traditional sources, such as dams and wells, with recycled water from the city’s sewage-treatment plant in order to supplement Windhoek’s fresh water. As the city’s population continued to grow rapidly, in the 1990s it was decided to build another treatment plant to convert sewage into drinking water. This was completed in 2002. Now more than one-third of Windhoek’s drinking water comes from this unlikely source, making the city the world leader in turning waste-water into drinking water.
74 oxford big ideas humanities and social sciences 7 western australian curriculum 75chapter 2 water in the world
2C How much water do we have?
DRAFT

I N D I A
Ajmer
Kotah
RourkelaIndore
Jabalpur
Nagpur Bhilai
Aurangabad
Bhopal Ranchi
Raipur
Bhubaneswar
N
Dhaka
Naypyidaw
H
I
M
AL
A Y
TAINS
DECCAN PLATEAU
YamunaRiver
River
G anges De l t a
Ganges
L E G E N D
Country capital city
Over 5 000 000 people
Country borderRiver
Land relief1 000 000 to 5 000 000 people500 000 to 1 000 000 people100 000 to 500 000 peopleUnder 100 000 people
Cropland
0 200 400 km
2.15 The challenges of managing waterWater is an essential environmental resource that is important for the health of humans and the health of the environment. Different values are often placed on water; for example, water used for economic purposes can also have great spiritual and cultural importance for a community. Competition for water use needs careful management. It is often not easy to come up with solutions. Water management is diffi cult because:
• it is an essential resource needed by every person on the planet
• it moves through the environment quickly so it is diffi cult to capture and store
• its availability is not constant – it changes over time and in different locations
• it is a shared resource with many competing uses.
Over the past 50 years the world’s population has doubled, and the output from farms and industries has surged to meet increasing demands. The growth in demand and competition for water has put a much greater strain on global water supplies. We need to make good decisions to fairly share the use of water and minimise the impact our water use has on the natural environment.
Case study: Ganges River, IndiaThe Ganges River begins high in the Himalayan mountains, and travels across India before fl owing east into Bangladesh and into the Bay of Bengal. In total, the river is 2525 kilometres long. The Ganges is worshipped by Hindus, who believe bathing and praying in the river purifi es them. This sacred river is also used by millions of Indians who live along its banks and depend on it for their daily needs.
In the last 30 years, India’s population has grown to nearly 1.2 billion people; one-third of these people live along the banks of the Ganges. Huge increases in the size of cities, factories and agriculture have put enormous pressure on the river. Irrigation canals siphon off large amounts of water to grow food for the country’s increasing population. Untreated waste-water is dumped into the river from cities and towns that lack proper sewage-treatment facilities. Around 25 per cent of India’s population work in manufacturing and industry. The waste-water and effl uent from these industries often contain hazardous chemicals. The Ganges is now one of the most polluted rivers in the world.
Overuse and lack of management have meant that India’s most sacred river is gradually dying. In Varanasi, a city on the banks of the Ganges in north-eastern India, the bacterial count in the water is 3000 times higher than the safe levels established by the World Health Organization. Polluted water is the main cause of skin problems, disabilities and infant deaths, but many Hindus refuse to accept that the Ganges (or Mother Ganga as they call her) is the source of these problems. ‘People have so much faith in this water that when they bathe in it or sip it, they believe it is the nectar of God [and] they will go to heaven,’ says a scientist at the Central Pollution Control Board in India.
In 2011, Indian offi cials signed an agreement with the World Bank for a $1 billion loan to fi nance a government project that aims to stop the fl ow of untreated waste-water into the Ganges by 2020.
Source 3 Tens of thousands of Hindu devotees gather on the banks of the holy Ganges River to bathe and offer prayers during Karthik Purnima festival in Patna, India.
Source 1 Sewage spills into the Ganges River in the city of Varanasi
Source 2 Source: Oxford University Press
Remember and understand1 Why is water diffi cult to
manage?
2 List three reasons why water resources are under threat.
3 Look carefully at Source 3.a Why have all of these
people gathered at the Ganges River?
b What dangers do they face?
4 List as many competing uses of the Ganges as you can.
5 Why is the Ganges River so diffi cult to manage?
Apply and analyse6 Look at Source 2. Why is
the pollution of the Ganges a much greater problem in Kolkata than in Kanpur in northern India?
7 How do you think the pollution of the Ganges affects the natural environment around the river?
Check your learning 2.15
COURSE OF GANGES RIVER
2D How do we manage water?
76 oxford big ideas humanities and social sciences 7 western australian curriculum chapter 2 water and the world 77
DRAFT

2.16 Water and Indigenous AustraliansWater is a vital resource valued by both Indigenous and non-Indigenous Australians. Non-Indigenous Australians generally consider water as a natural resource with great economic and aesthetic value. Indigenous Australians on the other hand generally value water for cultural and spiritual reasons. They regard the rivers and waterholes as an inseparable part of their land. Land and water management is a key part of the culture of Aboriginal and Torres Strait Islander peoples.
A spiritual connection with waterPrior to European settlement, most Aboriginal peoples lived in the well-watered coastal areas and along the rivers of the Murray–Darling Basin. Aboriginal people in the arid areas of Australia studied the habits of wildlife to detect water supplies. They mapped the location of water in their artwork. In these maps, spirals identifi ed the location of pools and wells while wavy lines showed the location of running water (see Source 2).
Indigenous water managementTraditionally, Aboriginal peoples in drier areas of Australia depended on their knowledge of water sources to survive. They accessed water trapped in waterholes, rocks and tree hollows. They watched the fl ight paths of birds, such as the zebra fi nch, to help uncover wells and springs. The long roots of eucalypt trees were followed to fi nd underground water, and water was collected from the morning dew on plants. Indigenous Australians would also enlarge rock holes and chip channels through rocks to divert water into specifi c holes to increase their access to water. To catch fi sh, dams were built across narrow creeks using rocks or woven branches (see Source 3).
In modern Australian society, Indigenous Australians have been largely left out of the decision-making process when it comes to managing their traditional water sources. In some remote areas of Australia, many traditional water sources have become unreliable or unusable because station owners have given their cattle access to these important areas without consulting the Aboriginal peoples.
Remember and understand1 Where did most Aboriginal peoples live in Australia
before Europeans arrived in 1788?
2 Give examples of traditional and modern Aboriginal water management.
3 How are Indigenous and non-Indigenous views of water resources different?
4 Both Aboriginal peoples and Europeans built dams along the Murray River. What impact did each have?
Apply and analyse5 Look carefully at Source 4.
a What is the spiritual value of this place to the local Indigenous people?
b What value might this site have to a tourist?
6 Look carefully at Source 2.a Sketch the symbols you think represent water
holes and running water.b Why were maps such as these important to
Aboriginal communities?c Why do you think maps like these are still being
produced by Indigenous Australians?
Check your learning 2.16
Urlampe in the Northern Territory, 1330 kilometres south-southeast of Darwin, is home to one of Australia’s most remote Aboriginal communities. Allan Rankine of the Urlampe Aboriginal Corporation is responsible for managing the water supply for the community. Allan decides what water the community pumps from the bore and how it will be distributed. Traditionally, Aboriginal land and water management plans are clearly defi ned and everyone understands and respects them.
However, Allan and the traditional owners of the area do not have control over all important water resources in the region. The permanent spring that Allan visited as a child has been polluted by cattle. This once valuable water resource is now undrinkable.
Aboriginal people also passed on their knowledge of water resources through stories. The Worrorra people live in the Prince Regent River region of the Kimberley. Their Dreaming (or Lalai) stories tell of the formation of the Prince Regent River.
The stories tell of how the Wunggurr snake (a creator) dug a path where the Prince Regent River now fl ows by travelling from far inland to the sea. Other creator beings called Wandjina then took the animal forms of Rock Cod and Melo (a large sea snail), and created Malandum (the Prince Regent River) by swimming upstream along this path. At what is now called King Cascade Falls, Rock Cod was forced to stop abruptly by the Lalai Bowerbird and thrust herself against the soft mud, where she created a step-like cliff. Today, a waterfall fl ows over these rocks from the stream above where the Bowerbird lives (see Source 4).
Source 1 Aboriginal links to water in the Kimberley region of Western Australia go back thousands of years. These scenes were created by the Worrorra people on a cave ceiling about 8000 years ago. The scene is said to depict a ‘great fi sh chase’, showing fi gures representing both Rock Cod and Dugong and their Wandjina captors.
Source 3 An Aboriginal dam made of woven branches designed to catch fi sh.
Source 4 King Cascade on the Prince Regent River is now a popular tourist destination.
Source 2 In the past, Indigenous Australians communicated the location of water resources through symbols on maps (like this one) and through spoken instructions and stories.
2D How do we manage water?
78 oxford big ideas humanities and social sciences 7 western australian curriculum 79chapter 2 water in the world
DRAFT

Edithburgh
MoontaWallaroo
Iron Knob
Port Augusta
Whyalla
Port Pirie
Meningie
Tailem Bend
Goolwa
Waikerie
Morgan
Blanchetown
Swan Reach
Mannum
Murray Bridge
Keith
Adelaide
Port PiriePort PiriePort PirieMorgan–
Morgan–
Morgan–Whyalla
Waikerie
Morgan
WaikerieWaikerie
MorganMorgan
Morgan–
PipelineMoonta
Wallaroo
Morgan–
Morgan–
Morgan–
Morgan–
Swan Reach
Waikerie
PipelinePipeline
Morgan–
Morgan–Whyalla
Whyalla
Pipelinewaan Reachh Pipeline
Tailem Bend
GoolwaGoolwaGoolwa
AdelaideAdelaideMurray Bridge
Pipeline
WaikerieWaikerieWaikerie
Blanchetown
WaikerieWaikerie
BlanchetownBlanchetownBlanchetownBlanchetownBlanchetown
line
MannumAdelaide
Swan ReachSwan Reach
Adelaide
Swan Reach
MannumMannum
Tailem BendTailem Bend
Murray BridgeMurray BridgeMurray BridgeMurray BridgeMurray BridgeMurray BridgePipelinePipeline
Murray BridgePipeline
Murray BridgeMurray BridgePipeline
Murray Bridge
Mannum Pipeline
MeningieMeningieMeningieMeningie
KeithKeith
MeningieMeningieMeningieMeningie
ailemBend
Murray BridgeTailem BendTailem Bend
Murray BridgeMurray Bridge
TTTaTaT ile
Murray Bridge
–KeithPipeline
MurrayMouth
LakeAlexandrina
Mur
ray River
0 50 100 km
Urban area
Pipeline
L E G E N D
Weir
Area of map
2.17 Competition for water suppliesFresh water from rivers is used by people in cities, farms and factories. Competition for this precious economic resource has seen the introduction of dams all over the world to store the water fl owing down rivers and ensure a constant supply of water to the people nearby. Because people living along the entire length of rivers depend on them for water, competition also exists between upstream and downstream users. The fl ow and quality of water available to downstream users depends on how the river is used upstream.
Case study: the Murray RiverThe Murray River provides an excellent example of what happens when demand for river water threatens to outpace supply. Water from the Murray River has many competing uses, including irrigation, domestic urban water supply, industrial water supply, maintaining the natural environment, recreation, navigation, hydroelectricity and water storage. There are three major water storage dams on the Murray River. There are also 10 weirs (another type of dam) built across the river to slow the river fl ow and allow towns to access the water. Locks have been built where the water level can be raised and lowered to allow boats to travel from one side of the weir to the other.
A series of pumps and pipes carries some of the water from the Murray River to water users in towns, cities and farms many kilometres from the river (see Source 1). One of these pipes carries water from the town of Mannum to Adelaide, 60 kilometres away. The amount of water pumped from the river to Adelaide varies from year to year but can be as high as 90 per cent of Adelaide’s water needs in some years.
The agriculture sector is by far the largest user of water from the Murray River. On average, 3780 gigalitres (3780 billion litres) is diverted each year to irrigate farmland to grow crops and raise livestock. Clearing of native vegetation in the river valley has
Source 1 Source: Oxford University Press
Source 2 Oblique aerial photograph of the Murray River at Mannum, South Australia
MURRAY RIVER AND SOUTH AUSTRALIAN WATER PIPELINES
The changing scales of water managementThe water in the Murray River is one of Australia’s most precious resources but is very diffi cult to manage. This is mainly because there is so much competition for the water. The water is used by thousands of farmers to produce food and other products for millions of people. Many towns and cities in three different states use the river to supply residents with water for their homes and businesses.
In the past, many upstream water users have only considered their own water needs when taking water from the river. They have not considered how this would impact on people and places downstream. We now know that this local-scale approach to water use damages the health of the river. Water must be managed at the regional scale, considering the needs of all water users and the environment in the entire river basin. For more information on the key concept of scale, refer to page XX of ‘The geography toolkit’.
keyconcept: Scale
Source 3 This image was taken in 1981 when the mouth of the Murray River completely closed, creating changed conditions for wildlife and plants in the region.
Remember and understand1 What competition is there for Murray River water?
2 What are the two major uses of Murray River water?
3 How have the competing water uses of boating and water storage in weirs been catered for along the Murray?
4 What problems have been caused downstream by upstream usage of the Murray River water?
Apply and analyse5 Why is it diffi cult to manage the water resources of
the Murray River?
6 In the foreground on the left of the Mannum oblique aerial photograph (Source 2) you can see a small
marina and a residential development. Are these developments at a local or regional scale?
7 Examine Source 1.a How many pipelines are shown that access water
from the river?b Use the scale to estimate the distance water
travels from Swan Reach to Edithburgh.
Evaluate and create8 Draw a map of Source 2. Use a legend to show
the following features: the Murray River, irrigated farmland, irrigated golf course and sporting ground, a marina for houseboats and the town of Mannum.
Check your learning 2.17
enabled irrigated crops and pastures to be grown, but also forced salty groundwater to the surface and into the river. Along with pesticides and fertilisers, the salty water causes problems for users downstream. Near the South Australian town of Waikerie a system of pumps intercepts some of the salty water before it reaches the Murray River. It is carried in pipes to a 400-hectare lake. It is estimated that this scheme prevents more than 100 tonnes of salt a day reaching the river. Most of the water not used for irrigation is diverted to homes and industries throughout South Australia through six major pipelines (see Source 1). The average amount of water that fl ows from the Murray River into the ocean near Adelaide is now just 25 per cent of the total natural fl ow. This is because around 75 per cent of this water is taken out of the river upstream.
2D How do we manage water?
80 81chapter 2 water in the world oxford big ideas humanities and social sciences 7 western australian curriculum
DRAFT

Arctic Circle
Equator
Tropic of Capricorn
Tropic of Cancer
ARCTIC OCEAN
PACIFIC OCEAN
ATLANTICOCEAN
INDIAN OCEAN
ATLANTICOCEAN
EUROPE ASIA
AFRICA
AUSTRALIA
NORTHAMERICA
SOUTHAMERICA
0 1500 3000 km
Freshwater availability(cubic metres per person per year)
L E G E N D
Over 70 00015 000 to 70 0006000 to 15 0002500 to 60001700 to 2500 (vulnerable)1000 to 1700 (stressed)0 to 1000 (scarce)
No data available
2.18 Managing water scarcity
Source 3 Source: Oxford University Press
WORLD: FRESHWATER AVAILABILITY PER PERSON PER YEAR, 2007
Remember and understand1 What is water scarcity?
2 Why is water scarcity such a problem in Africa?
3 What problems does water scarcity cause, especially for women and young children?
Apply and analyse4 Look carefully at Source 3.
a Describe the area of Africa that suffers most from water scarcity.
b Australia is the driest inhabited continent on Earth. Does it have a water scarcity problem? Why or why not?
c Compare freshwater availability in Australia and New Zealand. Which country has access to more fresh water? Why do you think this might be the case?
Evaluate and create5 Create a poster or PowerPoint presentation highlighting
the problems of water scarcity in Africa and how it affects people’s lives.
Check your learning 2.18
Source 1 A young girl in Guinea-Bissau enjoys clean water from a new well that has been sponsored by the World Vision aid agency.
Source 2 This woman in Zambia is collecting water from a dried-up river bed half a kilometre from her house. She uses a saucepan to fi ll the large container, which she will carry on her head or shoulder back to her home.
Source 4 A woman fi lls a water container from a well in the desert in Niger. In most African societies, women are the collectors and managers of the family water supply. African women can spend up to 60 per cent of their day collecting water, especially where water sources are far from the village.
Water is most diffi cult to manage when there is not enough to go around. Water becomes scarce when the demand for clean water exceeds the available supply. It is one of the biggest issues facing Africa, the second driest inhabited continent in the world after Australia. Whereas all Australians have access to clean water, millions of Africans face water shortages. Of the 800 million people who live in Africa, more than 300 million live in water-scarce areas.
The causeThe main reasons for water scarcity in Africa are:
• a large and fast-growing population
• large areas with low and variable rainfall
• poor water quality
• lack of water infrastructure, such as pipelines.
The problemWater scarcity contributes to the deaths of many African children. Local water sources may contain harmful bacteria that cause diseases, such as typhoid and dysentery. These diseases are spread by drinking and washing in contaminated water.
The solutionThe most common solution to water scarcity in African villages is digging a well. A water well is created by digging or boring into the ground in order to reach groundwater in underground aquifers. Clean water from a well stops people catching any water-borne diseases. Providing clean and drinkable water for communities across Africa is a high priority for many of its developing countries and international relief agencies, such as World Vision and AusAID.
2D How do we manage water?
82 oxford big ideas humanities and social sciences 7 western australian curriculum 83chapter 2 water in the world
DRAFT

2.19 Managing water in Australia’s biggest cities
Ensuring reliable water supplies in Australian citiesOver 60 per cent of Australia’s population lives in one of our fi ve largest cities – Adelaide, Brisbane, Melbourne, Perth and Sydney – all of which are home to more than a million people. The sites of these cities were chosen in large part because of their reliable rainfall and access to fresh water from neighbouring rivers. However, all of these cities have now outgrown their original water supplies. Large dams have been built to provide a permanent water supply for large towns and cities, but population growth and drought have put enormous pressure on these reserves. As a result, many Australian cities are now looking at a number of strategies to reduce their water usage and ensure they have access to reliable supplies into the future. Some of these options are discussed here.
Option 1: Build more damsAcross Australia, governments are thinking about building more dams to create a reliable water supply for our growing population. Dams can also be used to create hydroelectric power when water let through the dam wall turns a turbine to create electricity.
In order to ensure that reliable supplies of safe water are available for use now and into the future, we all need to use water more sustainably. Careful management of our existing supplies and reductions in our consumption will help to achieve this. We also need to remember that people are not the only living creatures on the planet. The interests of all living organisms need to be considered if the natural environment is to be protected for the future.
Option 2: Use underground water reservesDrilling water bores is a common method used on Australian farms for supplying water for irrigation and animals. Many Australian cities have started to use this method to add to their freshwater supplies. Deep holes, called bores, are drilled down into a layer of rock under the ground that holds water. This layer of rock is called an aquifer. The water is then pumped to the surface (see Source 2). It is also possible to replace the water in the aquifers during wet periods by pumping the water back underground. In this way, aquifers operate as underground dams. In Western Australia scientists are trialling a method of treating storm water (rainwater that falls on the hard surfaces of a city, such as roofs and roads) and using it to recharge the aquifers that supply much of Perth’s water.
There are large aquifers in many areas of Australia, including beneath Melbourne. Often this water has a high mineral content and must be treated before it can be used for drinking and other household uses. This water could be used for industrial purposes, such as to clean machinery and irrigate crops. This would allow drinking water, currently used for these other purposes, to be added to the city’s water supplies. This idea of using lower-quality water for non-domestic purposes has been considered in many Australian cities.
Source 1 The Warragamba Dam near Sydney is one of the largest domestic water supply dams in the world. It supplies 80 per cent of Sydney’s water.
Source 2 Water from rainfall soaks into permeable rock. This water-bearing rock is known as an aquifer. The water cannot penetrate the impermeable rock below. Wells (or bores) are drilled into the aquifer to pump water to the surface.
aquifer
Layer of impermeable rock
Direction of water movement
Water soaks into the permeable layer (aquifer)
Water re-enters the aquifer
Layer of permeable rock
bores
2D How do we manage water?
84 85chapter 2 water in the world oxford big ideas humanities and social sciences 7 western australia
DRAFT

Option 3: Build desalination plantsDesalination plants treat sea water to remove from it the salt and other impurities (see Source 3). This process, known as reverse osmosis, turns sea water into fresh water for drinking. As Australia has easy access to a vast supply of sea water, desalination plants are an attractive option for many cities.
There are three main reasons why there are not more of them already:
• Desalination plants cost a lot of money, making the water they produce expensive. The Perth desalination plant, opened in 2006, cost $387 million to build and adds about $44 a year to every consumer’s water bills.
• Desalination plants use a lot of electricity and can damage the environment. It has been estimated that the Sydney desalination plant uses as much electricity as 120 000 households. A new power plant had to be built to run it, adding to the cost.
• Desalination plants can damage the environment. They release highly concentrated salt water (brine) back into the ocean, which can harm marine animals.
Option 4: Build water pipelinesPerhaps the simplest method of ensuring a reliable water supply is to move water from areas that have a surplus. This already happens in most Australian cities. Rainwater is collected in catchments in the hills and forests close to cities and piped to treatment plants and then to water users.
One proposal currently involves piping water not just hundreds of kilometres but thousands. For many years, there has been an idea to pipe water from the Fitzroy River in the Kimberley region in north-western Western Australia to the city of Perth. This pipeline would need to be 3700 kilometres long. The cost of transporting water this far through steel pipes is much greater than other options, such as desalination plants, and so this method is unlikely to be used in the near future. It will also cause environmental problems at the source of the water and would require large amounts of energy to build and operate.
Option 6: Recycle and treat wastewater and sewageWater that leaves our homes is generally unsuitable to be used again. In using the water to clean clothes, dishes and ourselves and to fl ush toilets we have polluted the water. This water (known as wastewater or sewage) is usually piped to a treatment plant where it is cleaned and purifi ed and then released back into rivers and bays. In some places, notably Singapore and Windhoek (see 2C Rich task) in Namibia, this water is added to rainwater and piped back into homes and to other water users.
Source 3 How a desalination plant works
Source 4 Huge pipes carry water beneath our city streets. Here, pipes are being laid in Brisbane. Source 5 At this plant in Singapore, waste water (sewerage) is
processed and then used in industry or blended with rainwater for use in homes.
In trying to use our resources sustainably, we sometimes have to change our attitudes and behaviours. While many Australians believe that we should use less water or use water from different sources, it can be diffi cult to convince people to change.
In 2012 the Western Australian government successfully completed a trial of the Groundwater Replenishment Scheme and set a goal to deliver the project offi cially by the end of 2016. This scheme involves treating wastewater using a number of methods so that it meets drinking water standards. It is then injected as groundwater where it continues to be cleansed naturally. The water is removed later and treated again before it is used as drinking water.
The project has the capacity to recharge 14 billion litres of water into groundwater supplies
One of the great benefi ts of storing drinking water as groundwater, is that groundwater supplies are not affected by changes in climate the same way dams or rivers might be. As Australia continues to experience a dryer climate, increased groundwater supplies could help Western Australians by reducing the need for rainfall for drinking water, and by sustainably recycling water rather than wasting it.
While some people might not like the idea of drinking wastewater, recycled water is an important addition to our water supply and is actually very clean once it has been treated. For more information on the key concept of sustainability, refer to section 1A of ‘The geography toolkit”.
keyconcept: SustainabilityRemember and understand1 In your own words, describe what a sustainable
resource is.
2 List fi ve different ways that governments might investigate to fi nd extra water resources for growing cities.
3 When a new dam is built across a river, what problems are caused for people and wildlife upstream from the dam?
4 How can aquifers be used to provide and to store water?
5 What are the advantages and disadvantages of desalination?
6 Where does the water that you use at home come from? Where does it go when you are fi nished using it?
Apply and analyse7 What plan for recycling did Toowoomba residents
oppose? Do you think the recycling plan was a good idea?
8 Why doesn’t Perth pipe water from wet places in Western Australia?
Evaluate and create9 For the capital city in your state, complete the
following activities:a Research the city’s current water supply.
Which of the water supply methods described here does it currently use?
b Which of these methods do you believe should be used to add to this water supply?
c What impacts would these new methods of water supply have on the natural environment and the cost of water?
Check your learning 2.19
Brine (very salty water) is pumped back into the sea.
Desalinated water is pumped into the water supply.
Storage tank for the desalinated water
Sea water intake
Filters remove salt from the water.
Option 5: Capture and store storm waterStorm water is collected in pipes and gutters and discharged in the sea or rivers. Rainwater tanks capture this fresh water but cities have not been designed to collect this water on a large scale.
In Adelaide, there is a plan to capture this water through existing pipes and treat it in the current water-treatment facilities. In this way, it could be added relatively easily to the city’s drinking water.
2D How do we manage water?
86 oxford big ideas humanities and social sciences 7 western australian curriculum 87chapter 2 water in the world
DRAFT

Outdoor 33%
Toilet 20%
Shower 20%
Rest of bathroom 6%
Laundry 16%
Kitchen 5%
2.20 Managing water at homeThe easiest way for us to become involved in water management is to understand how we can be more water wise at home. A resource management plan takes into account the range of uses of the resource, the amount of the resource required and the impact of resource use on the environment. Decisions are then made about what is the best and most sustainable way to use the resource. Sustainability is an important concept in geography. In order for a resource to be used sustainably there must not be so much used that it affects the ability of the resource to replace itself naturally. Domestic users of water are under more pressure than ever before to manage their water use properly as our water resources become more stressed.
As you have learned, Australians are among the highest users of water in the world. Nearly half of the domestic water usage occurs in the bathroom. To improve water management in the home we need to select water-saving appliances, capture and recycle water and attempt to use less water. To ensure we have a sustainable supply of water into the future, think about some of the water-saving ideas shown in Source 1.
Outside
Don’t use the hose to clean hard surfaces outside; use a broom. Install a plastic pool cover to reduce water lost to evaporation. Install a rainwater tank to use the water that falls on your roof. It can be used to fl ush toilets, wash clothes and water the garden. Top up the pool with water from the tank.
Laundry
Only use the washing machine when you have a full load. Redirect the waste water from the washing machine into a collection bin and use it on the garden, but make sure you use detergents that will not kill your plants.
Bathroom
Take shorter showers and install new water-effi cient showerheads that use no more than 9 litres of water per minute (compared with old-style showerheads that use 20 litres per minute). This can save up to 20 000 litres of water per person per year.
Kitchen
Don’t rinse dishes under a running tap. Ensure the dishwasher is full before turning it on.
Garden
Plant native gardens using local plants that are accustomed to the climate and soil conditions in your area. Use drippers to deliver water directly to the base of the plants where they need it. Avoid sprinklers, which allow water to be blown away and evaporated.
Source 1 A range of simple water-saving ideas
Source 3 This cartoon was fi rst published in 2007 during a period of severe drought.
Source 2 Water use in the home
The air showerDespite living in one of the world’s driest places, Australians are among the world’s biggest water users. Many scientists believe that our use of water is not sustainable and have looked for ways to increase our water supply or decrease the amount of water we use.
AIR SHOWER SET TO CUT WATER USE BY 30 PER CENT
As Australians become increasingly alert to the importance of using water wisely in the home, CSIRO researchers have found a way to use a third less water when you shower – by adding air.
The scientists have developed a simple ‘air shower’ device which, when fi tted into existing showerheads, fi lls the water droplets with a tiny bubble of air. The result is the shower feels just as wet and just as strong as before, but now uses much less water.
The researchers, from CSIRO Manufacturing Materials Technology in Melbourne, say the device increases the volume of the shower stream while reducing the amount of water used by about 30 per cent.
Given the average Australian household uses about 200 000 litres of water a year, and showers account for nearly a third of this, the ‘air shower’ could help the average household save about 15 000–20 000 litres a year. If you extend this across the population, that is an annual saving of more than 45 000 Olympic-sized swimming pools …
CSIRO website
For more information on the key concept of sustainability, refer to page XX of ‘The geography toolkit’.
keyconcept: Sustainability
Remember and understand1 What does a management plan need to take into account?
2 Which room in the house uses the most water?
3 What is the easiest way of reducing the amount of water and energy used in the shower?
4 Suggest three ways that water can be gathered and reused around the home.
5 Give two examples of how technology can be used to help save water.
Apply and analyse6 Look carefully at the news article.
a What have researchers at CSIRO developed to help save water in the home?
b What water savings do they hope to make?c Apply your understanding of the air shower to develop a
new water-saving product idea to clean dishes.
7 Look carefully at Source 3. a What is the cartoonist suggesting about our management
of water in the future?b When was the cartoon drawn and what infl uence might this
have had on the cartoonist?
Evaluate and create8 Create your own water-saving reminder for display in one of
the rooms of your house.
Check your learning 2.20
2D How do we manage water?
88 oxford big ideas humanities and social sciences 7 western australian curriculum 89chapter 2 water in the world
DRAFT

Source 4 Young men of the Wodaabe tribe
Nguigmi
N I G E R
N I G E R I A
CHAD
CHADNIGER
NIGERIA
CAMEROON
Former extentof Lake Chad
Current extentof Lake Chad
Niger
Area of map
0 15 30 km
Komadougou Yobe
Former extent of Lake Chad
(most recent)
Komadougou Yobe river bed
Sand dunes, valleys
Sandy plateaus and valleys,sand dunes
Clay plains with low elevation
Clay plains
L E G E N DLandscapes
Seasonal migrations of nomads andlivestock
Former Lake Chad (currently nowater in Nigerien territory)
Former banks of the lake
Returning to the clay plains (earlyJuly to mid September)
Leaving the clay plains at the start of the rainy season (May/June)
Spreading out on the clay plains(September to May)
RoadRiverCountry border
2D rich taskskilldrill
The Wodaabe nomadsCommunities in extreme environments develop ways of life that allow them to survive and thrive. In the south-eastern part of Niger, in Africa, live the Wodaabe people. They live in a desert region where water is often scarce and feed for their cattle is in short supply. In response to these conditions they have become nomads and rarely stay in one place for more than 10 days. They follow the seasonal rains across the desert as rain brings grass for the cattle; this takes them on a route they have followed for hundreds of years.
The seasonal migrations of the Wodaabe take them from the clay plains near Lake Chad to the sandy soils away from the lake. Over the last few decades the lake has become smaller as other communities in the area have used its water for irrigation. This has meant that the Wodaabe’s have had to change annual migration routes. The reduction in the size of the lake has meant that more grass is able to grow on land that was once covered in water, but it has also meant that freshwater supplies have become less reliable.
Source 2 Climate data: Nguigmi, Niger
Months Jan Feb Mar Apr May Jun Jul Aug Sep Oct Nov Dec
Rainfall (mm) 0 0 0 1 5 11 55 100 15 1 0 0
Temperature (°C) 21 24 28 31 33 33 31 30 30 29 25 22
Understanding fl ow mapsFlow maps show the movement of things from one place to another (for example, people or goods). Flow maps can be simple or complex. They can show the movement of one group of people around a small area or compare the movement of many different goods around the world. Depending on what they are showing, fl ow maps use arrows of different colours and sizes. These arrows help the person making the map show different things moving around and the numbers of these things. Here are some steps that will help you understand fl ow maps:
Step 1 Read the title of the map carefully, as this will tell you exactly what is being shown.
Step 2 Look at the legend on the map. This will tell you what the different coloured arrows on the map are showing and provide you extra information that you may need (like the time of year this movement happens).
Step 3 Look for patterns in the movements shown on the map. Are the movements related to changes in the weather, to the time of year, to political or economic factors or all of these things?
Step 4 Once you have identifi ed the pattern being shown, try to explain the reasons for it.
Apply the skill1 Describe the movement of the Wodaabe
during the months of May and June.
2 Where do the Wodaabe travel to from the beginning of July to mid September?
3 In your own words, explain the pattern being shown in Source 3.
Source 3 Source: Oxford University Press
SOUTH-EASTERN NIGER: NATURAL ENVIRONMENTS AND SEASONAL MIGRATION ROUTES OF THE WODAABE
Source 1 Packing up the homestead to follow the rains
1 Clay plains with low elevation are the best areas for the Wodaabe to graze their cattle in the dry season. Why? Describe the location of the clay plains with low elevation.
2 Construct a climate graph for Nguigmi in Niger using climate data provided in Source 2.
a When is the rainy season?
b When is the dry season?
3 Would you describe the Wodaabe as voluntary migrants?
4 Source 1 shows a Wodaabe family packing their belongings, to follow the rains. Describe their possessions. How many donkeys would your family need to move?
Extend your understanding
90 oxford big ideas humanities and social sciences 7 western australian curriculum 91chapter 2 water in the world
2D How do we manage water?
DRAFT


![Contested Monarchy: Integrating the Roman Empire in the Fourth Century AD, ed. Johannes Wienand, Oxford/New York: Oxford University Press 2015 [Oxford Studies in Late Antiquity]; ISBN](https://static.fdokumen.com/doc/165x107/631f7db1d10f1687490fd2fe/contested-monarchy-integrating-the-roman-empire-in-the-fourth-century-ad-ed-johannes.jpg)