Redalyc.Conceptual metaphor types in oncology: Cognitive ...
Upload
khangminh22Category
view
1download
0
Neuro-Oncology Advances2(S4), iv3–iv14, 2020 | doi:10.1093/noajnl/vdaa148
iv3
This is an Open Access article distributed under the terms of the Creative Commons Attribution Non-Commercial License (http://creativecommons.org/licenses/by-nc/4.0/), which permits non-commercial re-use, distribution, and reproduction in any medium, provided the original work is properly cited. For commercial re-use, please contact [email protected]
© The Author(s) 2020. Published by Oxford University Press, the Society for Neuro-Oncology and the European Association of Neuro-Oncology.
Niha Beig , Kaustav Bera, and Pallavi Tiwari
Department of Biomedical Engineering, Case Western Reserve University, Cleveland, Ohio, USA (N.B., K.B., P.T.)
Corresponding Author: Pallavi Tiwari, PhD, Department of Biomedical Engineering, Case Western Reserve University, Iris S. & Bert L. Wolstein Research Building, 2103 Cornell Road, Room 6131, Cleveland, OH 44106, USA ([email protected]).
AbstractNeuro-oncology largely consists of malignancies of the brain and central nervous system including both primary as well as metastatic tumors. Currently, a significant clinical challenge in neuro-oncology is to tailor therapies for patients based on a priori knowledge of their survival outcome or treatment response to conventional or experi-mental therapies. Radiomics or the quantitative extraction of subvisual data from conventional radiographic im-aging has recently emerged as a powerful data-driven approach to offer insights into clinically relevant questions related to diagnosis, prediction, prognosis, as well as assessing treatment response. Furthermore, radiogenomic approaches provide a mechanism to establish statistical correlations of radiomic features with point mutations and next-generation sequencing data to further leverage the potential of routine MRI scans to serve as “virtual biopsy” maps. In this review, we provide an introduction to radiomic and radiogenomic approaches in neuro-oncology, including a brief description of the workflow involving preprocessing, tumor segmentation, and ex-traction of “hand-crafted” features from the segmented region of interest, as well as identifying radiogenomic associations that could ultimately lead to the development of reliable prognostic and predictive models in neuro-oncology applications. Lastly, we discuss the promise of radiomics and radiogenomic approaches in personalizing treatment decisions in neuro-oncology, as well as the challenges with clinical adoption, which will rely heavily on their demonstrated resilience to nonstandardization in imaging protocols across sites and scanners, as well as in their ability to demonstrate reproducibility across large multi-institutional cohorts.
Key Points
1. Radiomics has recently emerged as a powerful data-driven approach that can offer insights into clinically relevant questions related to diagnosis, prediction, prognosis, as well as assessing treatment response.
2. Using radiomics and radiogenomic approaches to personalize treatment decisions in neuro-oncology will rely heavily on resilience to nonstandardization in imaging protocols across sites and scanners, as well as in their ability to demonstrate reproducibility across large multi-institutional cohorts.
The field of neuro-oncology encompasses primary and meta-static malignant tumors of the central nervous system (CNS) including the brain and spinal cord. While the incidence of brain tumors is rare (lifetime likelihood of less than 1%), their mortality and morbidity rate is unusually high. In 2020, around 23 890 cases of malignant brain tumors and 18 020 brain cancer-related deaths are estimated in adults across the globe.1,2 Among the malignant tumors, brainstem gliomas, glioblastomas (GBMs), and anaplastic astrocytomas have the
worst outcome.3,4 While the survival rate for patients with a malignant brain or CNS tumor is poor with only 36% living beyond 5 years following diagnosis, it is particularly abysmal in GBM patients (age group of 55–64 years) who have a 5-year survival of 6%. Unfortunately, at this time, there are no widely recommended tests to screen for brain and spinal cord tumors.
Diagnosis, and treatment response assessment, in neuro-oncology is currently investigated using multi-parametric
Introduction to radiomics and radiogenomics in neuro-oncology: implications and challenges
applyparastyle "fig//caption/p[1]" parastyle "FigCapt"applyparastyle "fig" parastyle "Figure"
Dow
nloaded from https://academ
ic.oup.com/noa/article/2/Supplem
ent_4/iv3/6117784 by guest on 11 July 2022

iv4 Beig et al. Introduction to radiomics and radiogenomics
magnetic resonance imaging (MRI) such as T1-weighted imaging both before (T1w) and after administration of gadolinium-based contrast agent (Gd-T1w), T2-weighted imaging (T2w), and T2w-Fluid attenuation recovery (FLAIR) sequences. For instance, Response Assessment in Neuro-Oncology group (RANO criteria) utilizes the increase/decrease in the product of perpendicular diameter on routine MRI to identify patient’s response to treatment. On routine multi-parametric scans, Gd-T1w MRI is useful for elucidating a brain tumor, with large portions of the tumor region (or the entire tumor) typically enhancing in comparison to the brain parenchyma. Meanwhile, T2w and T2w-FLAIR MRI scans are often used to identify het-erogeneously enhancing tumors like gliomas especially GBMs which often have peri-tumoral edema or inflam-mation, in order to differentiate these regions from the enhancing tumor.
In addition to qualitative/semiquantitative assess-ment of these imaging modalities by trained neuro-radiologists, radiologic imaging also harbors massive amounts of interpretable quantitative information which may not be appreciable via visual inspection or 2-di-mensional assessment of a single measure (ie, tumor diameter).5 Recent advances in the high-throughput computational techniques and rapid algorithm devel-opments have facilitated the extraction of meaningful information from radiologic imaging via “Radiomics.” Radiomics is defined as the extraction of “hand-crafted” features from routine radiological scans (X-rays, CT, MRI, and PET) that quantitatively capture the textural and morphological characteristics of a given tumor. For instance, radiomics attempts to comprehensively characterize the pixel-wise tumor characteristics in-cluding (1) semantic or qualitative features that include radiologist-derived assessments of the tumor including spiculations, size of the tumor along several axes, (2) shape-based features that quantitatively measure reg-ular or irregular tumor boundary changes based on their 3D topology,6 (3) intratumoral heterogeneity measures including gray-level features, which investigate pixel-level textural differences to characterize how heteroge-neous a tumor is,7,8 as well as (4) deformation features that capture the impact of tumor-related mass effect in the tumor micro-environment.9 These various radiomics-based approaches have been widely employed across multiple cancers including brain,10–14 lung,15–18 colo-rectal,19–21 breast,22–24 and prostate25,26 among others for diagnosis, prognosis, treatment response prediction, as well as measuring early treatment effects. Specifically, in the context of neuro-oncology, these approaches have shown tremendous promise in the development of non-invasive radiomic prognostic and predictive markers, as well as for distinguishing treatment effects from tumor recurrence, using routine MRI scans.10,27–29
In addition to advances in multi-parametric imaging, next-generation sequencing technology, which allows for the high-throughput sequencing of multiple genes, has been a significant propeller of tailoring personalized treatments in neuro-oncology.30,31 Recent investigative studies have identified several driver mutations and chro-mosomal anomalies as specific targets for personalizing treatment and improving prognosis32,33 in neuro-oncology.
A few of these driver mutations have been reported to have prognostic (eg, isocitrate dehydrogenase [IDH], O6-methylguanine-DNA methyltransferase [MGMT] pro-moter methylation, and epidermal growth factor receptor [EGFR]) and predictive (eg, MGMT) implications in GBM tumors.34,35 However, molecular profiling involves tissue extraction often from stereotactic/needle biopsies that are inherently prone to sampling bias based on the site of bi-opsy and thus may not capture the spatial heterogeneity extant within the tumor (specifically in highly heteroge-neous tumors such as GBM).36
Interestingly, the field of “radiogenomics” has pro-vided a mechanism for establishing statistical associ-ations of tumoral radiomic features with the underlying genetic profile of the tumor, including point mutations, signaling, and pathways of biological significance. By providing an imaging phenotype for the tumor corre-sponding to a particular genotype, radiogenomics may allow for circumventing the challenges with biopsy sam-pling. For example, radiogenomic approaches have been used to create “virtual-biopsy” maps to predict specific prognostic point mutations as well as chromosomal al-terations37 based on the 2016 update on the WHO clas-sification of diffuse gliomas in neuro-oncology.13,38,39 Identifying such radiogenomics associations may im-prove our understanding of how the changes in biolog-ical processes at the molecular level affect changes at a radiologic scale40 and may ultimately aid in personalizing treatment decisions.
Overview of Radiomic and Radiogenomics Pipeline
One of the primary advantages of developing and implementing a radiomic/radiogenomics pipeline is that, ideally, by leveraging routine MRI scans, the analysis does not significantly disrupt the existing clinical workflow. A typical pipeline of a radiomic/radiogenomics-based ap-proach consists of the conversion of radiographic images into mineable data and involves the following steps: (1) image acquisition and registration, (2) segmentation of region of interest, (3) preprocessing, (4) feature extrac-tion, (5) feature selection and building machine learning models for predictive and prognostic applications, and lastly (6) radiogenomic associations to either predict a genotype or identify the biological processes that drive the tumor biology. Figure 1 shows the complete radiomic/radiogenomics pipeline.
Image Acquisition, Tumor Segmentation, and Preprocessing
Preprocessing is a key step prior to radiomic feature extraction and involves multi-protocol registration to account for patient movement during image acqui-sition, as well as accounting for image variations in MRI scans across different manufacturers and multiple participating sites. Next, the region of interest is iden-tified and segmented, either manually or automatically.
Dow
nloaded from https://academ
ic.oup.com/noa/article/2/Supplem
ent_4/iv3/6117784 by guest on 11 July 2022

iv5Beig et al. Introduction to radiomics and radiogenomicsN
euro-O
ncolog
y A
dvan
ces
On Gd-T1w images, necrosis is relatively represented as hypo-intense regions that are commonly located in the central region of the tumor and occasionally have a ring enhancement. Similarly, hyper-intense T2w-FLAIR signals correlate with greater interstitial leakage and low cellular density, reflecting edema. Therefore, T2w and T2w-FLAIR scans are typically used to identify
edema and necrosis and enhancing tumor is delineated based on Gd-T1w MRI. The “tumor habitat” consisting of the 3 segmented tumor subcompartments, necrotic core, enhancing, and peri-tumoral edema, can then be interrogated by extracting radiomic features from each of the tumor subcompartments across different MRI protocols. Figure 2 illustrates the tumor habitat
1. DATA ACQUISITION & REGISTRATION 2. IDENTIFICATION & SEGMENTATION OF REGION OF INTEREST (ROI)
1. TISSUE EXTRACTION4. FEATURE EXTRACTION
6. PROGNOSIS & PREDICTION
3. SKULL STRIPPING, DE-NOISINGAND INTENSITY STANDARDIZATION
Gd-T1w T2w
Skull stripping
FLAIR
5. FEATURE SELECTION &MODEL BUILDING
Example: Ranksum test
Example: Random forest
Class A Class A Class A
Majority voting
Class B
60Haralick Shape
radiomic features
Shape featuresGabor filter bank
Training n = 83Validation n = 42
p-value = .0353 p-value = .0382
Mantel-Haenszel Hazard ratio: 1.747395% confidence interval: 1.0699 = 2.8535
Mantel-Haenszel Hazard ratio: 0.461195% confidence interval: 0.2345 = 0.9064
Intensitystandardization
0
00
0.0
0.0
0.2
0.4
0.6
Y
0.8
1.0
0.2 0.4 0.6X
0.8 1.0
0.2
0.4
0.6
0.8RespondersNon responders
1.0
1.2
200 400 600 800Time
Est
imat
ed s
urvi
val f
unct
ions
0
0.2
0.4
0.6
0.8
1.0
1.2
Est
imat
ed s
urvi
val f
unct
ions
1000 1200 1400 0 200 400 600 800
Time
1000 1200 1400
0 500 1000 1500 2000 2500 3000 3500 4000 4500
0.1
0.2
0.3
0.4
0.5
0.6
0.7
0.8
0.9
1
Gabor
80100120140160
X
Diagonal x Diagonal Y
Y
Inte
nsity
bas
ed fe
atur
es
Har
alic
k fe
atur
es
TC
GA
-DU
-B16
8
IDHmut-codel
DNA data
RNA data
Radiomic features
Radiomic features
Radiogenomic correlative analysis
Genom
ic data
IDHmut-non codel
TC
GA
-HT-
B56
3
Prediction of tumor mutational status
Analysis of underlying biological processes
2. GENE SEQUENCING
Enhancingtumor
Edema
Tumor habitat
Nec
rosi
s
A. RADIOMIC PIPELINE B. RADIOGENOMIC PIPELINE
Standard atlas
f
FLA
IRT
2wG
d-T
1w)
FLA
IRT
2wG
d-T
1w) Gd-T1w) T2w FLAIR
Figure 1. Overall workflow of radiomic and radiogenomic pipeline.
Identify individual tumor sub-compartments
Gd-T1w T2w-FLAIR Necrosis Edema
Enhancing tumor
Tum
or h
abita
t
Multi-parametric MRI scans
T2w
Necrosis
Edema
Enhancing tumor
Tumor habitat on multi-parametric MRI
Figure 2. Using multi-parametric MRI scans to identify the entire tumor habitat of glioblastoma as delineated by an expert radiologist. Necrotic core (as marked in green) and enhancing tumor (as marked in blue) can be identified on post-contrast T1w MRI scans. Similarly, the peri-tumoral edema (as marked in yellow) can be identified on the T2w/T2w-FLAIR MRI scans.
Dow
nloaded from https://academ
ic.oup.com/noa/article/2/Supplem
ent_4/iv3/6117784 by guest on 11 July 2022

iv6 Beig et al. Introduction to radiomics and radiogenomics
in GBM as delineated by an expert radiologist using routine MRI protocols. Currently, manual segmenta-tions are considered the gold standard for radiomic analysis as they ensure high accuracy. However, there exist several automated segmentation approaches using deep learning (DL) architectures including U-Net, Conv-Net, Transfer Learning, and Deep Hourglass ap-proaches as well as semiautomatic seeding-based algorithms that have gained popularity.41–43 These au-tomated tools have shown promise in annotating the tumor subcompartments including enhancement, nonenhancement, necrosis, as well as peri-tumoral edema from the immediate periphery of the tumor.
Further preprocessing techniques such as skull stripping and intensity standardization are executed to account for varying magnetic strengths, and slice thicknesses in the curated dataset.44–47 Intensity standardization algorithms are implemented across multi-parametric MRI protocols to correct for intensity nonstandardness, which refers to the issue of MRI “intensity drift” across different imaging acquisitions. The intensity nonstandardness results in MRI intensities lacking tissue-specific numeric meaning within the same MRI protocol, for the same body region, or for images of the same patient obtained on the same scanner. Therefore, it is important that the radiomic pipelines in neuro-oncology implement the necessary preprocessing techniques to ensure consistency in the dataset and reproducibility of results.48
Radiomic Feature Extraction
Following preprocessing and lesion segmentation, quantita-tive features are extracted for radiomic analysis, via algorithms that capture tumor heterogeneity across local pixel neighbor-hoods within a given radiologic image. Common radiomic fea-tures are currently divided into the following classes: semantic, shape, texture/gradient-based, deformation, and wavelet. Figure 3 illustrates an example of a few radiomic features ex-tracted from the multi-parametric MRI scans from across the GBM tumor habitat. The specifics of different feature families are discussed in the subsequent subsections.
“Hand-crafted” radiomic descriptors
Semantic features—In a large National Cancer Institute’s The Cancer Genomic Atlas (TCGA)-based effort, brain tumors (GBMs) were examined by experienced neuro-radiologists to define “semantic” features that capture the visual phenotypic characterization of the tumors. These unique semantic features were based on the 4 commonly analyzed tumor subcompartments (nonenhanced tumor, enhancing tumor, necrosis, and edema) and included fea-tures such as location of the lesion, morphology, major axis length, minor axis length margin, and lesion vicinity. This comprehensively characterized feature set by ex-pert radiologists is now known as Visually AcceSAble Rembrandt Images (VASARI) features.49 Multiple studies
Tum
or c
ore,
Gd-
T1w
Sur
roun
ding
tiss
ue,
FLA
IR
Segmentations Tumor habitat
Enhancing tumor
Necrosis
Edema
Haralick entropy feature Haralick IDM featureHeterogeneity
Homogeneity
21.5
10.50
–3–2.5–2
–1.5
–1–0.5
CoLIAGe featuresCoLIAGe gradientsDeformation features
1
0
Figure 3. (Top Row) Multi-parametric MRI is used to annotate the tumor subcompartments in GBM patients. The GBM tumor habitat consists of (1) necrotic core, (2) enhancing tumor, and (3) edema. Haralick features such as entropy and IDM are extracted from the GBM tumor habitat. (Bottom Row) Deformation features are calculated from the brain around tumor region. CoLlAGe gradients detect the homogeneous and heterogeneous regions based on the local intensity patterns on MRI scans.
Dow
nloaded from https://academ
ic.oup.com/noa/article/2/Supplem
ent_4/iv3/6117784 by guest on 11 July 2022

iv7Beig et al. Introduction to radiomics and radiogenomicsN
euro-O
ncolog
y A
dvan
ces
have demonstrated that prognostic imaging attributes, such as percent of necrosis and edema, can be correl-ated with VASARI features (ρ = 0.67 [P < .001] and ρ = 0.41 [P < .001]) in GBM tumors.50,51 Another study found a sig-nificant correlation between overall survival (OS) in GBMs and VASARI features. These studies have established that VASARI features (such as degree of contrast enhancement as well as the length of the major axis of the lesion) may provide additional prognostic value on top of standard clinical variables (such as Karnofsky Performance Score [KPS]).52 Several radiogenomic-based studies have sim-ilarly demonstrated that genetic expression or RNA sequencing of GBMs may be correlated with the VASARI features.53–55 For instance, Diehn et al.55 have presented an extensive study that seemed to suggest that GBM tumor contrast enhancement may be associated with activation of specific hypoxia gene expression.
Shape-based features—Irregular and aggressive tumor infiltration may prompt surface and shape changes in the tumor and peri-tumoral regions. A larger surface-area-to-volume ratio, for example, has been found to be indicative of a more spiculated tumor, with more malignant poten-tial in comparison to a round mass with a smaller ratio.56 Driven by this intuition, shape features may be informative of tumor malignancy. These features are broadly classified into 2 categories—local and global features. Local surface features capture characteristics such as curvature that identifies flat areas of surface from highly curved ones, sharpness that measures how sharp the curvature is, with highly curved masses exhibiting sharper curvatures, as well as shape index that characterizes the shape topology of the tumor.15 Whereas some of the global shape features include the major and minor axis, and elongation (ratio between major and minor axes of the region of interest). Several studies have shown that shape-based features of the tumor subcompartments in GBMs may be used to pre-dict OS.8,57–60 Gevaert et al.51 have shown that high irregu-larity of enhancing lesion shape (ie, degree of spiculation) was associated with a lower OS. In a radiogenomic setting, Itakura et al.61 have reported that shape-driven features can classify GBMs into 3 distinct clusters, where each cluster is mapped to a unique set of molecular signaling pathways and differential probabilities of survival. For instance, they reported that cluster 2 (characterized by spherical tumors with regular edges and small volumes) was associated with downregulation of VEGFR signaling pathway. Apart from this, shape features have also been shown to be better in evaluating treatment response. Ismail et al.6 have demonstrated that 2 local features (total curvature of the enhancing lesion and curvedness of the T2w/T2w-FLAIR hyper-intense peri-tumoral edema) may be able to differentiate between pseudo-progression and tumor progression in GBMs.
Texture/gradient-based features—The most commonly used texture features include (1) gray-level co-occurrence matrix (GLCM) or Haralick features that capture the varia-tions in gray-level image characteristics via second-order intensity statistics (eg, entropy, inverse differential mo-ment [IDM], angular second moment, contrast, and differ-ential entropy).62 Haralick features potentially capture the
structural heterogeneity within the region of interest. For instance, IDM is a reflection of the presence or absence of uniformity and hence is a measure of local regions of homogeneity. (2) Gray-level run length matrix (GLRLM), which in comparison with GLCM features, investigates the pixel runs instead of pairs of pixels. A pixel run includes the number of pixels of a specific gray value that are in a right direction, in the right sequence. While the rows of the matrix still represent gray levels, the columns represent run lengths. (3) Laws features that define various texture parameters including spot, edge, ripple, and level sur-faces present within the tumor63 and (4) Co-occurrence of Local Anisotropic Gradient Orientations (CoLlAGe), which captures local anisotropic differences that exist in micro-structures by measuring entropy (a mathematical con-struct to measure disorder) of co-occurrences of pixel/voxel-level gradient orientations computed within a local neighborhood.64
Haralick features have been used extensively in the con-text of neuro-oncology to predict survival.7,12 Kickingereder et al.65 have shown that Haralick features extracted from the T2w-FLAIR MRI sequences can predict survival and stratify patients with newly diagnosed GBM. In 2 inde-pendent studies, it has been demonstrated that GLRLM features, extracted from multi-parametric MRI scans, are also prognostic of OS in GBMs.66,67 GLRLM features ex-tracted from 18F-FDG-PET have also shown to distinguish primary CNS lymphoma from GBMs.68 In a cohort of 42 patients, CoLlAGe has been shown to differentiate radia-tion necrosis, a benign yet confounding effect of radiation treatment, from recurrent tumors, with an accuracy of 83.79% in primary cases, and 88.52% in metastatic brain tumors.64,69
Deformation-based features—Deformation features seek to measure the extent of tissue deformation in the brain pa-renchyma (ie, brain around tumor [BAT]) due to the mass effect in brain tumors. MRI scans are nonrigidly registered to equivalent healthy, age-matched, and/or gender-matched imaging atlases. Then, the resulting deformation field (rep-resented as a displacement vector at every voxel location) is obtained through a combination of forward as well as inverse mapping between the patient’s 3D volume and the reference atlas. The per-voxel deformation measurements from the BAT region are then used as radiomic features for analysis. Prasanna et al.70 hypothesized that larger varia-tions in deformation within functional areas of the contra-lateral hemisphere are likely related to decreased survival in GBMs. They demonstrated that decreased OS was found to be associated with increased deformation in areas of language comprehension, visual perception, cognitive, and motor-control functions, particularly in the memory areas in the left hemisphere. In another study, they also showed that combining textural-based radiomic features with deformation values may result in improved prediction of survival in GBMs, for identifying short-term survivors (OS <240 days) from long-term survivors (OS >540 days).9 In a radiogenomic setting, Iyer et al.71 have shown that deformation-based radiomic features can also be used to differentiate the molecular subtypes of medulloblastomas (Sonic Hedgehog [SHH], Wingless [WNT], Group 3, Group 4) in pediatric brain tumors.
Dow
nloaded from https://academ
ic.oup.com/noa/article/2/Supplem
ent_4/iv3/6117784 by guest on 11 July 2022
iv8 Beig et al. Introduction to radiomics and radiogenomics
Wavelet-based features—Wavelet features utilize different wavelengths, amplitudes, and frequencies to recognize textural attributes across a wide range of scales within the image. For instance, Gabor wavelet features are the steer-able class of gradients that attempts to match localized fre-quency characteristics.72 A Gabor filter can be defined as the modulation of a complex sinusoid by a Gaussian function. Each descriptor quantifies response to a given Gabor filter at a specific frequency (f = 0, 4, or 16) and orientation (µ = 45°, 90°, 135°, 180°) and attempts to capture the prominent di-rection in which intensity changes occur. Tixier et al.73 have reported that GBM patients with large negative skewness of Gabor wavelets had a significantly longer median OS of 22.7 months (P = .004). In another study, a wavelet scattering-based noise robust radiomic method was implemented to predict the gliomas grade in brain tumors.74
Feature Selection and Building Prognostic and Predictive Models
Building radiomic-based machine learning classifiers in-volves reducing the high-dimensional radiomic feature set by selecting the most discriminative features using a feature selection scheme, in order to reduce the curse of dimensionality.75 Feature selection can either be using univariate or multivariate statistical models. Univariate methods (also known as filter methods) only depend on feature association, while ignoring redundancy, whereas multivariate methods (wrapper methods) inspect inter-actions within different features and account for both as-sociation and redundancy. Fisher score, Chi-squared test, and Wilcoxon are the most common filter methods that are used for feature selection.16 Wrapper models are computa-tionally expensive as their objective is to find a subset of features that result in the best performing model. Notable examples for wrapper methods include forward feature se-lection, backward feature elimination, exhaustive feature selection (greedy algorithm), or bidirectional search.16,76
After identifying a subset of features following feature se-lection, machine learning models are developed by categor-izing and classifying various datasets according to defined labels (ie, GBM vs low-grade glioma [LGG], poor survival vs improved survival, radiation effects vs tumor recurrence). Generally, classifiers can be divided into supervised and unsupervised approaches. While supervised methods uti-lize a predefined set of known labels to identify features that best represent the outcomes of interest on the radiologic images, an unsupervised approach (such as clustering) can be employed when the target labels are unknown. A range of classifiers including random forest, support vector ma-chines (SVMs), and generalized linear models have been used for diagnosis and treatment response evaluation appli-cations.6,12,76 For instance, previous studies have used SVM classifier to predict the histopathological grade (LGGs vs GBMs) of a given primary brain tumor using MRI scans.76–78 Research groups have employed least absolute shrinkage and selection operator (LASSO) logistic regression and SVM models79,80 to differentiate pseudo-progression from early tumor progression in GBM patients. Prasanna et al.7 have shown that radiomic features extracted from the peri-tumoral edema on multi-parametric MRI were able to distinguish
short-term survivors (OS <7 months) and long-term survivors (OS >18 months) in 65 GBMs studies. Recently, DL-based architectures such as convolutional neural networks and auto-encoders have also been used to extract features from the radiologic imaging data.27,81 While DL is capable of appre-hending more abstract and higher-dimensional relationships between imaging features and the clinical end point, these approaches are still largely considered black-box.82
Survival Analysis
In most of the survival-based (ie, prognostic) radiomic/radiogenomic studies, Cox proportional hazards model are used, where the event of disease diagnosis is chosen as the time of origin. The commonly used end points for survival analysis are either OS (time from disease diagnosis to death due to the cancer in question) or time duration from a given treatment to response or outcome (progression-free sur-vival [PFS]).83 In a Cox proportional hazard regression model, hazard rate (HR) quantifies the effect of individual feature on survival and measures the risk of failure (ie, the risk or proba-bility of suffering the event of interest), given that the patient has survived up to a specific time. Risk parameters yielding negative regression coefficients (ie, low feature values correl-ated with long-term survival) produce a HR between 0 and 1; features yielding positive regression coefficients (ie, low fea-ture values correlated with short-term survival) produce a HR between 1 and infinity.40,84,85
Kaplan–Meier (KM) curves, a nonparametric survival anal-ysis method, have also been well accepted for evaluation of the “time-to-event” data.86 KM curves evaluate the prob-ability of survival over time (dependent variable), under different conditions (independent variable), where the hori-zontal axis represents the time and the vertical axis shows the probability of survival. After the KM curves have been plotted, the log-rank test is used to compare the 2 curves (high risk vs low risk). The log-rank test calculates the chi-square (χ 2) for each event time across all groups and sums up the results. χ 2 from the log-rank test concludes whether 2 curves from the groups are statistically different.87
Radiogenomic Studies
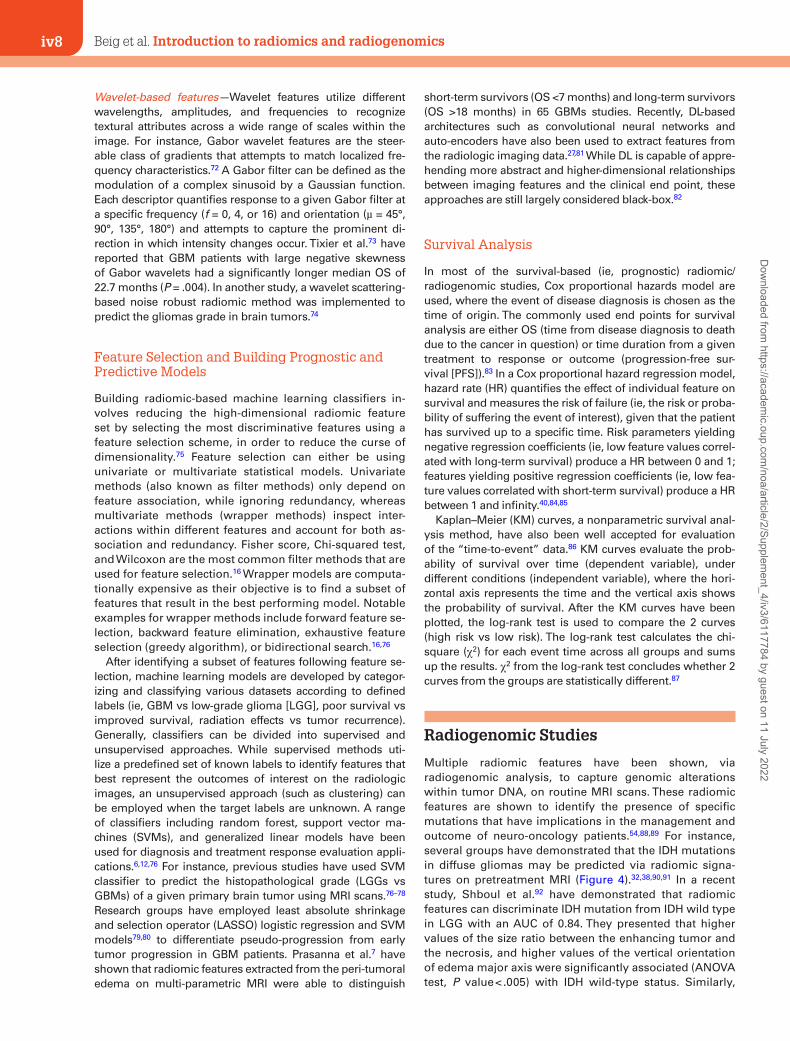
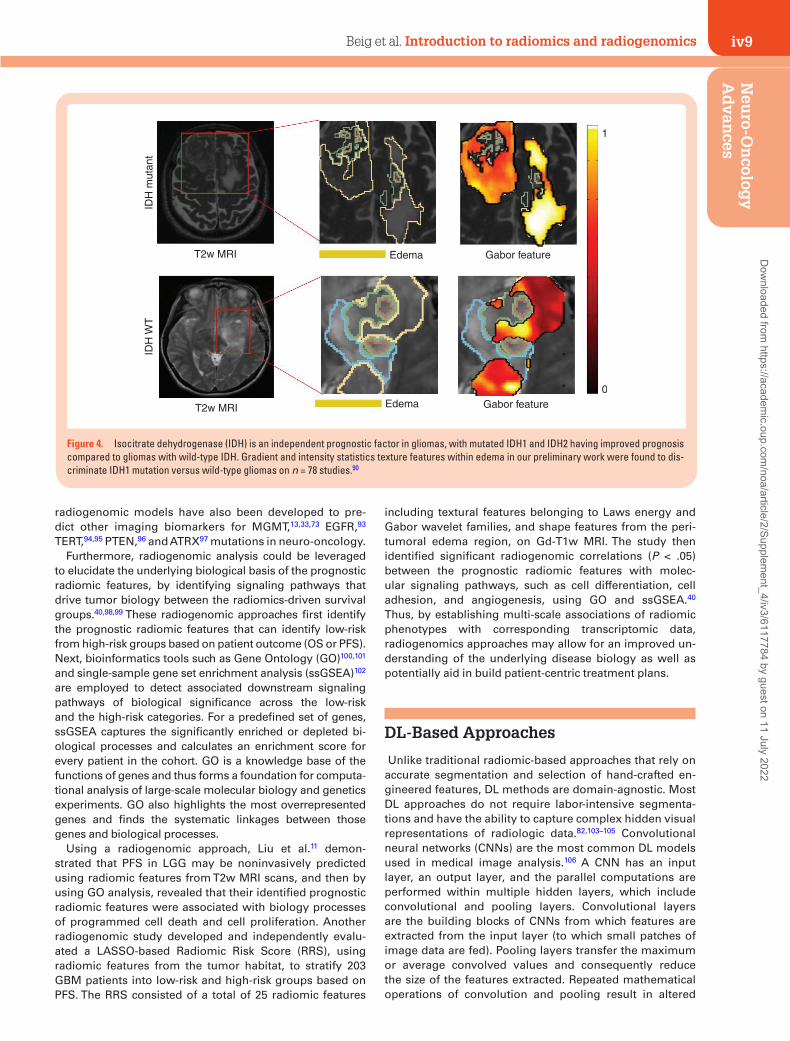
Multiple radiomic features have been shown, via radiogenomic analysis, to capture genomic alterations within tumor DNA, on routine MRI scans. These radiomic features are shown to identify the presence of specific mutations that have implications in the management and outcome of neuro-oncology patients.54,88,89 For instance, several groups have demonstrated that the IDH mutations in diffuse gliomas may be predicted via radiomic signa-tures on pretreatment MRI (Figure 4).32,38,90,91 In a recent study, Shboul et al.92 have demonstrated that radiomic features can discriminate IDH mutation from IDH wild type in LGG with an AUC of 0.84. They presented that higher values of the size ratio between the enhancing tumor and the necrosis, and higher values of the vertical orientation of edema major axis were significantly associated (ANOVA test, P value < .005) with IDH wild-type status. Similarly,
Dow
nloaded from https://academ
ic.oup.com/noa/article/2/Supplem
ent_4/iv3/6117784 by guest on 11 July 2022
iv9Beig et al. Introduction to radiomics and radiogenomicsN
euro-O
ncolog
y A
dvan
ces
radiogenomic models have also been developed to pre-dict other imaging biomarkers for MGMT,13,33,73 EGFR,93 TERT,94,95 PTEN,96 and ATRX97 mutations in neuro-oncology.
Furthermore, radiogenomic analysis could be leveraged to elucidate the underlying biological basis of the prognostic radiomic features, by identifying signaling pathways that drive tumor biology between the radiomics-driven survival groups.40,98,99 These radiogenomic approaches first identify the prognostic radiomic features that can identify low-risk from high-risk groups based on patient outcome (OS or PFS). Next, bioinformatics tools such as Gene Ontology (GO)100,101 and single-sample gene set enrichment analysis (ssGSEA)102 are employed to detect associated downstream signaling pathways of biological significance across the low-risk and the high-risk categories. For a predefined set of genes, ssGSEA captures the significantly enriched or depleted bi-ological processes and calculates an enrichment score for every patient in the cohort. GO is a knowledge base of the functions of genes and thus forms a foundation for computa-tional analysis of large-scale molecular biology and genetics experiments. GO also highlights the most overrepresented genes and finds the systematic linkages between those genes and biological processes.
Using a radiogenomic approach, Liu et al.11 demon-strated that PFS in LGG may be noninvasively predicted using radiomic features from T2w MRI scans, and then by using GO analysis, revealed that their identified prognostic radiomic features were associated with biology processes of programmed cell death and cell proliferation. Another radiogenomic study developed and independently evalu-ated a LASSO-based Radiomic Risk Score (RRS), using radiomic features from the tumor habitat, to stratify 203 GBM patients into low-risk and high-risk groups based on PFS. The RRS consisted of a total of 25 radiomic features
including textural features belonging to Laws energy and Gabor wavelet families, and shape features from the peri-tumoral edema region, on Gd-T1w MRI. The study then identified significant radiogenomic correlations (P < .05) between the prognostic radiomic features with molec-ular signaling pathways, such as cell differentiation, cell adhesion, and angiogenesis, using GO and ssGSEA.40 Thus, by establishing multi-scale associations of radiomic phenotypes with corresponding transcriptomic data, radiogenomics approaches may allow for an improved un-derstanding of the underlying disease biology as well as potentially aid in build patient-centric treatment plans.
DL-Based Approaches
Unlike traditional radiomic-based approaches that rely on accurate segmentation and selection of hand-crafted en-gineered features, DL methods are domain-agnostic. Most DL approaches do not require labor-intensive segmenta-tions and have the ability to capture complex hidden visual representations of radiologic data.82,103–105 Convolutional neural networks (CNNs) are the most common DL models used in medical image analysis.106 A CNN has an input layer, an output layer, and the parallel computations are performed within multiple hidden layers, which include convolutional and pooling layers. Convolutional layers are the building blocks of CNNs from which features are extracted from the input layer (to which small patches of image data are fed). Pooling layers transfer the maximum or average convolved values and consequently reduce the size of the features extracted. Repeated mathematical operations of convolution and pooling result in altered
IDH
mut
ant
IDH
WT
T2w MRI
T2w MRI Edema
Edema Gabor feature
Gabor feature
0
1
Figure 4. Isocitrate dehydrogenase (IDH) is an independent prognostic factor in gliomas, with mutated IDH1 and IDH2 having improved prognosis compared to gliomas with wild-type IDH. Gradient and intensity statistics texture features within edema in our preliminary work were found to dis-criminate IDH1 mutation versus wild-type gliomas on n = 78 studies.90
Dow
nloaded from https://academ
ic.oup.com/noa/article/2/Supplem
ent_4/iv3/6117784 by guest on 11 July 2022

iv10 Beig et al. Introduction to radiomics and radiogenomics
representations of the imaging data and capture several features including (but not limited to) edge detection, color variations, sharpening, blurring, and focusing. During the training phase, guided by a loss function (which estimates the difference between the labels and predictions), the CNN determines the weights of these convolution filters in recognizing subtle visual signatures hidden in images.
In the context of brain tumors, Lao et al.81 developed a DL-based radiomics model using Gd-T1, T2w, T2w-FLAIR MRI protocols and clinical data (age and KPS) from 112 GBM patients and obtained a C-index of 0.71 in predicting OS. In a recent study, Bae et al.107 demonstrated that a deep neural nets can distinguish GBMs from metastasis with an accuracy of 0.95 (95% CI, 0.92–0.99). In another study by Han et al.,108 a bi-directional recurrent CNN on 260 TCGA-GBM patients was developed to obtain an accuracy of 62% in predicting MGMT gene status on an independent test data using multi-parametric MRI.
Limitations
While highly promising, a key challenge in enabling clin-ical utility of radiomic/radiogenomic approaches is to demonstrate their generalizability to variations in image acquisition protocols across scanners and sites. Sources of variations in MRI acquisition often include differences in image contrast, voxel resolutions, slice thicknesses, image reconstruction methods, magnetic field strengths, echo times, and repetition times. This issue of reproducibility of radiomic features has become even more pertinent in retrospective studies that involve publicly available reposi-tories such as TCGA-GBM and Ivy GAP, where image scans are pooled-in from different institutions.
Several efforts are currently underway to fill these tech-nical gaps, including attempting to standardize the image acquisition, preprocessing, segmentation guidelines, and radiomic features extraction pipelines across mul-tiple sites.109 Most recently, the image biomarker stand-ardization initiative has provided best-practice guidelines for standardizing feature extraction pipelines from MRI
scans from different sites and scanners.110 Additionally, open-source software platforms such as Cancer Imaging Phenomics Toolkit, which is specifically developed for neuro-oncology applications111 as well as a more gener-alized Pyradiomics112 platform, also aim to provide the medical community with standardized set of pipeline for radiomic feature analysis. Additionally, a few recent studies113–115 have explored the issue of repeatability, which refers to the variability in radiomic features across scans obtained at 2 different times on the same scanner, as well as reproducibility, which is defined as the variations in radiomic features on account of differences in image acquisition across sites and scanners. These repeatability and reproducibility radiomic studies have been conducted by leveraging test–retest datasets or phantom studies with varying imaging acquisition protocols. However, rigorous analysis is warranted to improve the generalizability of radiomic features, in terms of repeatability, reproducibility as well as efficacy, across large multi-site cohorts (prefer-ably using retrospective clinical trial datasets). Another im-portant aspect of the radiomic pipeline is the segmentation of the tumor habitat. Manual tumor segmentation is not only labor intensive, but is also affected by inter-observer variability.5,16 While some radiomic studies use automatic and semiautomatic methods for segmentation, the ex-isting segmentation algorithms are not consistent among different research groups, and may further have an impact on the radiomic analysis as well as downstream prognostic and predictive analysis.
Similarly, while the advent of DL networks has opened new avenues of research in GBM analysis, it comes with its own set of limitations. Unlike the radiomic features that often provide at least some degree of interpretability, DL features are considered more of a “black-box”.116 These deep features are limited in their explanatory capacity with nei-ther a set of diagnostic rules nor an insight into the results. Additionally, DL models are limited by the relative sparsity of training samples, which is even more relevant in rare can-cers such as GBMs, where obtaining very large data cohorts may not be feasible. Table 1 briefly contrasts the advantages and disadvantages of expert-based, radiomics and DL-based approaches in the context of brain tumor characterization.
Table 1. Comparison of Radiomics and Deep Learning-Based Approaches
Expert-Based Evaluation Radiomics Deep Learning
Advantages Limitations Advantages Limitations Advantages Limitations
Observation-driven
Qualitative/semiquantitative
Hand-crafted engineered features
Impacted by variance in image acquisition param-eters introduced across sites and scanners
Domain agnostic data-driven
Known as “black-box” due to limited biological interpret-ability offered the deep featuresExperience-
drivenLabor intensive Often dependent on seg-
mentation of the tumor habitat
Low computa-tional costs
Intra- and inter-observer variability
Hand-crafted engineered features
Often used for small retro-spective data and may not be generalizable
Does not re-quire segmen-tation of tumor habitat
Limited by relative sparsity of training samples, not always suited for applica-tions with limited availability of well-curated samples
Abundant histor-ical literature
Poor reproducibility
Dow
nloaded from https://academ
ic.oup.com/noa/article/2/Supplem
ent_4/iv3/6117784 by guest on 11 July 2022

iv11Beig et al. Introduction to radiomics and radiogenomicsN
euro-O
ncolog
y A
dvan
ces
Conclusion and Future Scope
Radiomic, radiogenomic, and DL studies have made notable progress in the last few years and have dem-onstrated potential in the field of neuro-oncology, in-cluding aiding in diagnosis, outcome prediction, as well as evaluating response to both conventional and experimental treatments.80,89,97 However, for clinical deployment of these approaches, a few important con-siderations need to be accounted for. First, it may be im-portant to establish causal inference of the radiogenomic associations between radiomic features and the under-lying tumor biology, either through controlled preclin-ical models or spatially co-localized imaging and -omics datasets.117 Second, rigorous repeatability, reproduc-ibility, and efficacy analysis of these approaches will need to be conducted across large multi-site retrospec-tive cohorts. These large multi-institutional retrospec-tive studies could then pave the way for prospective randomized trials to evaluate the efficacy of radiomic and radiogenomic markers in predicting response to treatment and guiding treatment decisions. Lastly, for translation of radiomic/radiogenomic/DL models as decision support in a clinical setting, careful planning will be needed in order to integrate the human and machine interpretations together and improve diag-nostic and prognostic reads. Hence, unified efforts from all stakeholders including neuro-radiologists, neuro-oncologists, neuro-surgeons, along with data scientists, and machine learning researchers will be required to-ward development of these models from conception to deployment. Such cross-disciplinary collaboration will ensure that the tools being developed are tailored and aligned to benefit the patient in a variety of clinical settings including cancer screening, diagnosis, predic-tion of prognosis, and evaluating treatment response in neuro-oncology.
Keywords
glioblastoma | machine learning | radiogenomics | radiomics
Funding
Research reported in this publication was supported by the National Cancer Institute of the National Institutes of Health under award number NCI 1U01CA248226-01, the DOD Peer Reviewed Cancer Research Program W81XWH-18-1-0404, Dana Foundation David Mahoney Neuroimaging Program, the V Foundation Translational Research Award, the Ohio Third Frontier Technology Validation Fund, and the Wallace H. Coulter Foundation Program in the Department of Biomedical Engineering.
Conflict of interest statement. N.B. is an employee of Tempus Labs, Inc. K.B. is a resident at Maimonides Medical Center, Brooklyn, New York. No potential conflicts of interest were dis-closed by the other authors.
References
1. Ostrom QT, Gittleman H, Liao P, et al. CBTRUS statistical report: primary brain and other central nervous system tumors diagnosed in the United States in 2010–2014. Neuro Oncol. 2017;19(suppl 5):v1–v88.
2. American Cancer Society. Cancer Facts & Figures 2020. Atlanta: American Cancer Society; 2020.
3. Fisher JL, Schwartzbaum JA, Wrensch M, Wiemels JL. Epidemiology of brain tumors. Neurol Clin. 2007;25(4):867–890, vii.
4. DeAngelis LM. Brain tumors. N Engl J Med. 2001;344(2):114–123.5. Gillies RJ, Kinahan PE, Hricak H. Radiomics: images are more than pic-
tures, they are data. Radiology. 2016;278(2):563–577.6. Ismail M, Hill V, Statsevych V, et al. Shape features of the lesion hab-
itat to differentiate brain tumor progression from pseudoprogression on routine multiparametric MRI: a multisite study. AJNR Am J Neuroradiol. 2018;39(12):2187–2193.
7. Prasanna P, Patel J, Partovi S, Madabhushi A, Tiwari P. Radiomic fea-tures from the peritumoral brain parenchyma on treatment-naïve multi-parametric MR imaging predict long versus short-term sur-vival in glioblastoma multiforme: preliminary findings. Eur Radiol. 2017;27(10):4188–4197.
8. Rathore S, Akbari H, Doshi J, et al. Radiomic signature of infiltration in peritumoral edema predicts subsequent recurrence in glioblastoma: implications for personalized radiotherapy planning. J Med Imaging (Bellingham). 2018;5(2):021219.
9. Prasanna P, Mitra J, Beig N, et al. Radiographic-deformation and tex-tural heterogeneity (r-DepTH): an integrated descriptor for brain tumor prognosis. In: Descoteaux M, Maier-Hein L, Franz A, Jannin P, Collins DL, Duchesne S, eds. Medical Image Computing and Computer-Assisted Intervention − MICCAI 2017. Quebec City, QC, Canada: Springer International Publishing; 2017:459–467.
10. Zhou M, Scott J, Chaudhury B, et al. Radiomics in brain tumor: image assessment, quantitative feature descriptors, and machine-learning ap-proaches. AJNR Am J Neuroradiol. 2018;39(2):208–216.
11. Liu X, Li Y, Qian Z, et al. A radiomic signature as a non-invasive pre-dictor of progression-free survival in patients with lower-grade gliomas. Neuroimage Clin. 2018;20:1070–1077.
12. Beig N, Patel J, Prasanna P, et al. Radiogenomic analysis of hypoxia pathway is predictive of overall survival in Glioblastoma. Sci Rep. 2018;8(1):7.
13. Xi Y, Guo F, Xu Z, et al. Radiomics signature: a potential biomarker for the prediction of MGMT promoter methylation in glioblastoma: GBM radiomics features reflect MGMT. J Magn Reson Imaging. 2018;47(5):1380–1387.
14. Bakas S, Shukla G, Akbari H, et al. Overall survival prediction in glioblastoma patients using structural magnetic resonance im-aging (MRI): advanced radiomic features may compensate for lack of advanced MRI modalities. J Med Imaging (Bellingham). 2020;7(3):031505.
Dow
nloaded from https://academ
ic.oup.com/noa/article/2/Supplem
ent_4/iv3/6117784 by guest on 11 July 2022

iv12 Beig et al. Introduction to radiomics and radiogenomics
15. Orooji M, Alilou M, Rakshit S, et al. Combination of computer extracted shape and texture features enables discrimination of granulomas from adenocarcinoma on chest computed tomography. J Med Imaging (Bellingham). 2018;5(2):024501.
16. Thawani R, McLane M, Beig N, et al. Radiomics and radiogenomics in lung cancer: a review for the clinician. Lung Cancer. 2018;115:34–41.
17. Kalpathy-Cramer J, Mamomov A, Zhao B, et al. Radiomics of lung nodules: a multi-institutional study of robustness and agreement of quantitative imaging features. Tomography. 2016;2(4):430–437.
18. Wilson R, Devaraj A. Radiomics of pulmonary nodules and lung cancer. Transl Lung Cancer Res. 2017;6(1):86–91.
19. Antunes JT, Ofshteyn A, Bera K, et al. Radiomic features of primary rectal cancers on baseline T2‐weighted MRI are associated with patho-logic complete response to neoadjuvant chemoradiation: a multisite study. J Magn Reson Imaging. 2020;52:1531–1541.
20. Horvat N, Veeraraghavan H, Khan M, et al. MR Imaging of rectal cancer: radiomics analysis to assess treatment response after neoadjuvant therapy. Radiology. 2018;287(3):833–843.
21. Ma X, Shen F, Jia Y, Xia Y, Li Q, Lu J. MRI-based radiomics of rectal cancer: preoperative assessment of the pathological features. BMC Med Imaging. 2019;19(1):86.
22. Braman NM, Etesami M, Prasanna P, et al. Intratumoral and peritumoral radiomics for the pretreatment prediction of pathological complete re-sponse to neoadjuvant chemotherapy based on breast DCE-MRI. Breast Cancer Res. 2017;19:57.
23. Perou CM, Fan C, Morris E, et al. Quantitative MRI radiomics in the prediction of molecular classifications of breast cancer subtypes in the TCGA/TCIA data set. NPJ Breast Cancer. 2016;2:16012.
24. Zhu Y, Li H, Guo W, et al. Deciphering genomic underpinnings of quanti-tative MRI-based radiomic phenotypes of invasive breast Carcinoma. Sci Rep. 2015;5:17787.
25. Shiradkar R, Ghose S, Jambor I, et al. Radiomic features from pretreat-ment biparametric MRI predict prostate cancer biochemical recurrence: preliminary findings. J Magn Reson Imaging. 2018;48(6):1626–1636.
26. Penzias G, Singanamalli A, Elliott R, et al. Identifying the morpho-logic basis for radiomic features in distinguishing different Gleason grades of prostate cancer on MRI: preliminary findings. PLoS One. 2018;13(8):e0200730.
27. Park JE, Kickingereder P, Kim HS. Radiomics and deep learning from re-search to clinical workflow: neuro-oncologic imaging. Korean J Radiol. 2020;21(10):1126–1137.
28. Kickingereder P, Isensee F, Tursunova I, et al. Automated quantitative tumour re-sponse assessment of MRI in neuro-oncology with artificial neural networks: a multicentre, retrospective study. Lancet Oncol. 2019;20(5):728–740.
29. Lohmann P, Kocher M, Ruge MI, et al. PET/MRI Radiomics in patients with brain metastases. Front Neurol. 2020;11:1.
30. Cancer Genome Atlas Research Network, Brat DJ, Verhaak RGW, Aldape KD, et al. Comprehensive, integrative genomic analysis of dif-fuse lower-grade gliomas. N Engl J Med. 2015;372(26):2481–2498.
31. Comprehensive genomic characterization defines human glioblastoma genes and core pathways. Nature. 2008;455(7216):1061–1068.
32. Lai A, Kharbanda S, Pope WB, et al. Evidence for sequenced molecular evolution of IDH1 mutant glioblastoma from a distinct cell of origin. J Clin Oncol. 2011;29(34):4482–4490.
33. Butler M, Pongor L, Su YT, et al. MGMT Status as a clinical biomarker in Glioblastoma. Trends Cancer. 2020;6(5):380–391.
34. Westphal M, Maire CL, Lamszus K. EGFR as a target for glioblastoma treatment: an unfulfilled promise. CNS Drugs. 2017;31(9):723–735.
35. Taghizadeh H, Müllauer L, Furtner J, et al. Applied precision cancer med-icine in neuro-oncology. Sci Rep. 2019;9(1):20139.
36. Sottoriva A, Spiteri I, Piccirillo SG, et al. Intratumor heterogeneity in human glioblastoma reflects cancer evolutionary dynamics. Proc Natl Acad Sci U S A. 2013;110(10):4009–4014.
37. Louis DN, Perry A, Reifenberger G, et al. The 2016 world health organi-zation classification of tumors of the central nervous system: a summary. Acta Neuropathol. 2016;131(6):803–820.
38. Park YW, Han K, Ahn SS, et al. Prediction of IDH1-mutation and 1p/19q-codeletion status using preoperative MR imaging phenotypes in lower grade Gliomas. AJNR Am J Neuroradiol. 2018;39(1):37–42.
39. Rivera AL, Pelloski CE, Gilbert MR, et al. MGMT promoter methylation is predictive of response to radiotherapy and prognostic in the absence of adjuvant alkylating chemotherapy for glioblastoma. Neuro Oncol. 2010;12(2):116–121.
40. Beig N, Bera K, Prasanna P, et al. Radiogenomic-based survival risk stratification of tumor habitat on Gd-T1w MRI is associated with bi-ological processes in Glioblastoma. Clin Cancer Res. 2020;26(8): 1866–1876.
41. Bakas S, Zeng K, Sotiras A, et al. GLISTRboost: combining multimodal MRI segmentation, registration, and biophysical tumor growth modeling with gradient boosting machines for glioma segmentation. Brainlesion (2015). 2016;9556:144–155.
42. Hesamian MH, Jia W, He X, Kennedy P. Deep learning techniques for medical image segmentation: achievements and challenges. J Digit Imaging. 2019;32(4):582–596.
43. Malathi M, Sinthia P. Brain tumour segmentation using convolu-tional neural network with tensor flow. Asian Pac J Cancer Prev. 2019;20(7):2095–2101.
44. Tao X, Chang M-C. A skull stripping method using deformable sur-face and tissue classification. In: Dawant BM, Haynor DR, eds. San Diego, CA; 2010 [cited 2018 Oct 24]. p. 76233L. http://proceedings.spiedigitallibrary.org/proceeding.aspx?
45. Madabhushi A, Udupa JK. New methods of MR image intensity stand-ardization via generalized scale. In: Fitzpatrick JM, Reinhardt JM, eds. San Diego, CA; 2005 [cited 2018 Dec 25]. p. 1143. http://proceedings.spiedigitallibrary.org/proceeding.aspx?
46. Smith SM, Brady JM. SUSAN—a new approach to low level image processing. Int J Comput Vis. 1997;23(1):45–78.
47. Bakas S, Akbari H, Sotiras A, et al. Advancing the cancer genome atlas glioma MRI collections with expert segmentation labels and radiomic features. Sci Data. 2017;4:170117.
48. Um H, Tixier F, Bermudez D, Deasy JO, Young RJ, Veeraraghavan H. Impact of image preprocessing on the scanner dependence of multi-parametric MRI radiomic features and covariate shift in multi-institutional glioblas-toma datasets. Phys Med Biol. 2019;64(16):165011.
49. VASARI Research Project—The Cancer Imaging Archive (TCIA) Public Access—Cancer Imaging Archive Wiki [Internet]. [cited 2020 Sep 5]. https://wiki.cancerimagingarchive.net/display/Public/VASARI+Research+Project
50. Rios Velazquez E, Meier R, Dunn WD Jr, et al. Fully automatic GBM seg-mentation in the TCGA-GBM dataset: prognosis and correlation with VASARI features. Sci Rep. 2015;5:16822.
51. Gevaert O, Mitchell LA, Achrol AS, et al. Glioblastoma multiforme: ex-ploratory radiogenomic analysis by using quantitative image features. Radiology. 2014;273(1):168–174.
52. Gutman DA, Cooper LA, Hwang SN, et al. MR imaging predictors of mo-lecular profile and survival: multi-institutional study of the TCGA glio-blastoma data set. Radiology. 2013;267(2):560–569.
Dow
nloaded from https://academ
ic.oup.com/noa/article/2/Supplem
ent_4/iv3/6117784 by guest on 11 July 2022

iv13Beig et al. Introduction to radiomics and radiogenomicsN
euro-O
ncolog
y A
dvan
ces
53. Colen R, Foster I, Gatenby R, et al. NCI Workshop report: clinical and computational requirements for correlating imaging phenotypes with genomics signatures. Transl Oncol. 2014;7(5):556–569.
54. Jamshidi N, Diehn M, Bredel M, Kuo MD. Illuminating radiogenomic characteristics of glioblastoma multiforme through integration of MR imaging, messenger RNA expression, and DNA copy number variation. Radiology. 2014;270(1):1–2.
55. Diehn M, Nardini C, Wang DS, et al. Identification of noninvasive im-aging surrogates for brain tumor gene-expression modules. Proc Natl Acad Sci U S A. 2008;105(13):5213–5218.
56. Lee G, Lee HY, Park H, et al. Radiomics and its emerging role in lung cancer research, imaging biomarkers and clinical management: state of the art. Eur J Radiol. 2017;86:297–307.
57. Chaddad A, Desrosiers C, Hassan L, Tanougast C. A quantitative study of shape descriptors from glioblastoma multiforme phenotypes for predicting survival outcome. Br J Radiol. 2016;89(1068):20160575.
58. Henker C, Kriesen T, Glass Ä, Schneider B, Piek J. Volumetric quantifi-cation of glioblastoma: experiences with different measurement tech-niques and impact on survival. J Neurooncol. 2017;135(2):391–402.
59. Sanghani P, Ti AB, Kam King NK, Ren H. Evaluation of tumor shape fea-tures for overall survival prognosis in glioblastoma multiforme patients. Surg Oncol. 2019;29:178–183.
60. Czarnek N, Clark K, Peters KB, Mazurowski MA. Algorithmic three-di-mensional analysis of tumor shape in MRI improves prognosis of survival in glioblastoma: a multi-institutional study. J Neurooncol. 2017;132(1):55–62.
61. Itakura H, Achrol AS, Mitchell LA, et al. Magnetic resonance image fea-tures identify glioblastoma phenotypic subtypes with distinct molecular pathway activities. Sci Transl Med. 2015;7(303):303ra138.
62. Haralick RM, Shanmugam K, Dinstein I. Textural features for image clas-sification. IEEE Trans Syst Man Cybern. 1973;3(6):610–621.
63. Laws KI. Textured Image Segmentation. University of Southern California Los Angeles Image Processing Inst, University of Southern California Los Angeles Image Processing Inst; 1980 Jan. Report No.: USCIPI-940. http://www.dtic.mil/docs/citations/ADA083283
64. Prasanna P, Tiwari P, Madabhushi A. Co-occurrence of Local Anisotropic Gradient Orientations (CoLlAGe): a new radiomics descriptor. Sci Rep. 2016;6:37241.
65. Kickingereder P, Burth S, Wick A, et al. Radiomic profiling of glioblas-toma: identifying an imaging predictor of patient survival with improved performance over established clinical and radiologic risk models. Radiology. 2016;280(3):880–889.
66. Bae S, Choi YS, Ahn SS, et al. Radiomic MRI phenotyping of glio-blastoma: improving survival prediction. Radiology. 2018;289(3): 797–806.
67. Li Q, Bai H, Chen Y, et al. A fully-automatic multiparametric radiomics model: towards reproducible and prognostic imaging signature for prediction of overall survival in glioblastoma multiforme. Sci Rep. 2017;7(1):14331.
68. Kong Z, Jiang C, Zhu R, et al. 18F-FDG-PET-based radiomics features to distinguish primary central nervous system lymphoma from glioblas-toma. Neuroimage Clin. 2019;23:101912.
69. Prasanna P, Rogers L, Lam TC, et al. Disorder in pixel-level edge direc-tions on T1WI is associated with the degree of radiation necrosis in primary and metastatic brain tumors: preliminary findings. AJNR Am J Neuroradiol. 2019;40(3):412–417.
70. Prasanna P, Mitra J, Beig N, et al. Mass effect deformation heteroge-neity (MEDH) on gadolinium-contrast T1-weighted MRI is associated with decreased survival in patients with right cerebral hemisphere gli-oblastoma: a feasibility study. Sci Rep. 2019;9(1):1145.
71. Iyer S, Ismail M, Tamrazi B, et al. Deformation heterogeneity radiomics to predict molecular subtypes of pediatric medulloblastoma on routine
MRI. Medical Imaging 2019: Computer-Aided Diagnosis. International Society for Optics and Photonics; 2019 [cited 2020 Sep 5]. p. 109501E. https://www.spiedigitallibrary.org/conference-proceedings-of-spie/10950/109501E/Deformation-heterogeneity-radiomics-to-predict--molecular-subtypes-of-pediatric/10.1117/12.2513567.short
72. Jain AK, Farrokhnia F. Unsupervised texture segmentation using Gabor filters. 1990 IEEE International Conference on Systems, Man, and Cybernetics Conference Proceedings; 1990:14–19.
73. Tixier F, Um H, Bermudez D, et al. Preoperative MRI-radiomics features improve prediction of survival in glioblastoma patients over MGMT methylation status alone. Oncotarget. 2019;10(6):660–672.
74. Chen Q, Wang L, Wang L, Deng Z, Zhang J, Zhu Y. Glioma grade pre-diction using wavelet scattering-based radiomics. IEEE Access. 2020;8:106564–106575.
75. Friedman JH. On bias, variance, 0/1—loss, and the curse-of-dimensionality. Data Min Knowl Discov. 1997;1(1):55–77.
76. Lohmann P, Galldiks N, Kocher M, et al. Radiomics in neuro-oncology: basics, workflow, and applications. Methods. 2020:S1046–2023(19)30317-2.
77. Tian Q, Yan LF, Zhang X, et al. Radiomics strategy for glioma grading using texture features from multiparametric MRI. J Magn Reson Imaging. 2018;48(6):1518–1528.
78. Vamvakas A, Williams SC, Theodorou K, et al. Imaging biomarker anal-ysis of advanced multiparametric MRI for glioma grading. Phys Med. 2019;60:188–198.
79. Kim JY, Park JE, Jo Y, et al. Incorporating diffusion- and perfusion-weighted MRI into a radiomics model improves diagnostic perfor-mance for pseudoprogression in glioblastoma patients. Neuro Oncol. 2019;21(3):404–414.
80. Akbari H, Rathore S, Bakas S, et al. Histopathology-validated machine learning radiographic biomarker for noninvasive discrimination between true progression and pseudo-progression in glioblastoma. Cancer. 2020;126(11):2625–2636.
81. Lao J, Chen Y, Li ZC, et al. A deep learning-based radiomics model for pre-diction of survival in glioblastoma multiforme. Sci Rep. 2017;7(1):10353.
82. Shen D, Wu G, Suk H-I. Deep learning in medical image analysis. Annu Rev Biomed Eng. 2017;19:221–248.
83. Cox DR. Regression models and life‐tables. J R Stat Soc Ser B (Methodological). 1972;34:187–202.
84. McGarry SD, Hurrell SL, Kaczmarowski AL, et al. Magnetic reso-nance imaging-based radiomic profiles predict patient prognosis in newly diagnosed glioblastoma before therapy. Tomography. 2016;2(3):223–228.
85. Weninger L, Haarburger C, Merhof D. Robustness of radiomics for sur-vival prediction of brain tumor patients depending on resection status. Front Comput Neurosci. 2019;13:73.
86. Kaplan EL, Meier P. Nonparametric estimation from incomplete observa-tions. J Am Stat Assoc. 1958;53(282):457–481.
87. Goel MK, Khanna P, Kishore J. Understanding survival analysis: Kaplan-Meier estimate. Int J Ayurveda Res. 2010;1(4):274–278.
88. Tejada Neyra MA, Neuberger U, Reinhardt A, et al. Voxel-wise radiogenomic mapping of tumor location with key molecular alterations in patients with glioma. Neuro Oncol. 2018;20(11):1517–1524.
89. Ellingson BM. Radiogenomics and imaging phenotypes in glioblastoma: novel observations and correlation with molecular characteristics. Curr Neurol Neurosci Rep. 2015;15(1):506.
90. Beig N, Ramon C, Prateek P, et al. Predicting IDH mutation status on rou-tine treatment-naïve MRI using radiogenomic features from peritumoral brain parenchyma. Neuro Oncol. 2016;18:124.
91. Jakola AS, Zhang YH, Skjulsvik AJ, et al. Quantitative texture anal-ysis in the prediction of IDH status in low-grade gliomas. Clin Neurol Neurosurg. 2018;164:114–120.
Dow
nloaded from https://academ
ic.oup.com/noa/article/2/Supplem
ent_4/iv3/6117784 by guest on 11 July 2022

iv14 Beig et al. Introduction to radiomics and radiogenomics
92. Shboul ZA, Chen J, M Iftekharuddin K. Prediction of molecular muta-tions in diffuse low-grade gliomas using MR imaging features. Sci Rep. 2020;10(1):3711.
93. Bakas S, Akbari H, Pisapia J, et al. In vivo detection of EGFRvIII in gli-oblastoma via perfusion magnetic resonance imaging signature con-sistent with deep peritumoral infiltration: the φ-Index. Clin Cancer Res. 2017;23(16):4724–4734.
94. Fukuma R, Yanagisawa T, Kinoshita M, et al. Prediction of IDH and TERT promoter mutations in low-grade glioma from magnetic res-onance images using a convolutional neural network. Sci Rep. 2019;9(1):20311.
95. Ivanidze J, Lum M, Pisapia D, et al. MRI features associated with TERT promoter mutation status in Glioblastoma. J Neuroimaging. 2019;29(3):357–363.
96. McCann SM, Jiang Y, Fan X, et al. Quantitative multiparametric MRI features and PTEN expression of peripheral zone pros-tate cancer: a pilot study. AJR Am J Roentgenol. 2016;206(3): 559–565.
97. Hong EK, Choi SH, Shin DJ, et al. Radiogenomics correlation between MR imaging features and major genetic profiles in glioblastoma. Eur Radiol. 2018;28(10):4350–4361.
98. Colen RR, Wang J, Singh SK, Gutman DA, Zinn PO. Glioblastoma: im-aging genomic mapping reveals sex-specific oncogenic associations of cell death. Radiology. 2015;275(1):215–227.
99. Zinn PO, Mahajan B, Majadan B, et al. Radiogenomic mapping of edema/cellular invasion MRI-phenotypes in glioblastoma multiforme. PLoS One. 2011;6(10):e25451.
100. Ashburner M, Ball CA, Blake JA, et al. Gene ontology: tool for the unification of biology. the gene ontology consortium. Nat Genet. 2000;25(1):25–29.
101. The Gene Ontology Consortium. Expansion of the gene on-tology knowledgebase and resources. Nucleic Acids Res. 2017;45(D1):D331–D338.
102. Subramanian A, Tamayo P, Mootha VK, et al. Gene set enrich-ment analysis: a knowledge-based approach for interpreting genome-wide expression profiles. Proc Natl Acad Sci U S A. 2005;102(43):15545–15550.
103. Pinho MC, Bera K, Beig N, Tiwari P. MRI Morphometry in brain tumors: challenges and opportunities in expert, radiomic, and deep-learning-based analyses. In: Seano G, ed. Brain Tumors. New York, NY: Springer US; 2021 [cited 2020 Sep 24]. p. 323–368.
104. Lundervold AS, Lundervold A. An overview of deep learning in medical imaging focusing on MRI. Z Med Phys. 2019;29(2):102–127.
105. Choy G, Khalilzadeh O, Michalski M, et al. Current applications and future impact of machine learning in radiology. Radiology. 2018;288(2):318–328.
106. LeCun Y, Boser BE, Denker JS, et al. Handwritten digit recognition with a back-propagation network. In: Touretzky DS, ed. Advances in Neural Information Processing Systems 2. Morgan-Kaufmann; 1990 [cited 2020 Sep 24]. p. 396–404. http://papers.nips.cc/paper/293-handwritten-digit-recognition-with-a-back-propagation-network.pdf
107. Bae S, An C, Ahn SS, et al. Robust performance of deep learning for distinguishing glioblastoma from single brain metastasis using radiomic features: model development and validation. Sci Rep. 2020;10(1):12110.
108. Han L, Kamdar MR. MRI to MGMT: predicting methylation status in gli-oblastoma patients using convolutional recurrent neural networks. Pac Symp Biocomput. 2018;23:331–342.
109. Davatzikos C, Barnholtz-Sloan JS, Bakas S, et al. AI-based prognostic imaging biomarkers for precision neuro-oncology: the ReSPOND con-sortium. Neuro Oncol. 2020;22(6):886–888.
110. Zwanenburg A, Vallières M, Abdalah MA, et al. The image bi-omarker standardization initiative: standardized quantitative radiomics for high-throughput image-based phenotyping. Radiology. 2020;295(2):328–338.
111. Davatzikos C, Rathore S, Bakas S, et al. Cancer imaging phenomics toolkit: quantitative imaging analytics for precision diagnostics and predictive modeling of clinical outcome. J Med Imaging (Bellingham). 2018;5(1):011018.
112. van Griethuysen JJM, Fedorov A, Parmar C, et al. Computational radiomics system to decode the radiographic phenotype. Cancer Res. 2017;77(21):e104–e107.
113. Chirra P, Leo P, Yim M, et al. Empirical evaluation of cross-site re-producibility in radiomic features for characterizing prostate MRI. Medical Imaging 2018: Computer-Aided Diagnosis. International Society for Optics and Photonics; 2018 [cited 2018 Oct 24]. p. 105750B. https://www.spiedigitallibrary.org/conference-proceedings-of-spie/10575/105750B/Empirical-evaluation-of-cross-site-reproducibility-in-radiomic-features-for/10.1117/12.2293992.short
114. Traverso A, Wee L, Dekker A, Gillies R. Repeatability and reproduci-bility of radiomic features: a systematic review. Int J Radiat Oncol Biol Phys. 2018;102(4):1143–1158.
115. Baeßler B, Weiss K, Pinto Dos Santos D. Robustness and reproduci-bility of radiomics in magnetic resonance imaging: a phantom study. Invest Radiol. 2019;54(4):221–228.
116. Zlochower A, Chow DS, Chang P, Khatri D, Boockvar JA, Filippi CG. Deep learning AI applications in the imaging of Glioma. Top Magn Reson Imaging. 2020;29(2):115–110.
117. Zinn PO, Singh SK, Kotrotsou A, et al. A coclinical radiogenomic vali-dation study: conserved magnetic resonance radiomic appearance of periostin-expressing glioblastoma in patients and xenograft models. Clin Cancer Res. 2018;24(24):6288–6299.
Dow
nloaded from https://academ
ic.oup.com/noa/article/2/Supplem
ent_4/iv3/6117784 by guest on 11 July 2022
Copyright © 2022 FDOKUMEN