The Western Boundary Current of the Seasonal Subtropical Gyre in the Bay of Bengal
10
JOURNAL OF GEOPHYSICAL RESEARCH, VOL. 98, NO. C1, PAGES 945-954, JANUARY 15, 1993 The Western Boundary Current of the Seasonal Subtropical Gyre in the Bay of Bengal S. R. SHETYE, A.D. GOUVEIA, S. S.C. SHENOI, D. SUNDAR, G. S. MICHAEL AND G. NAMPOOTHIRI Physical Oceanography Division, National Institute of Oceanography, Dona-Paula, Goa,India Hydrographic data collected during March-April 1991show thepresence of a poleward current along the westem boundary ofthe Bay ofBengal north of about 10 ø N carrying warmer waters ofsouthem origin. The inshore side of the current wasmarked by cooler, moresaline waters brought to the surface dueto the presence of the current which transported approximately 10 x 106 m3/s. The hydrography is suggestive of many of the features that have been associated withthe western boundary currents of thesubtropical gyres of theworld oceans: a recirculation zone, waves,eddies, etc. Thesefeatures, however,were not satisfactorily resolved in the data. Using available elimatologies of monthly mean ship drifts, seasonal hydrography, and monthly mean wind stress, we propose that the poleward current is thewestem boundary current of a seasonal anticyclonic subtropical gyrewhich forms in the Bay during January, is best developed during March-April, anddecays by June. The gyreandthe westem boundary current areunique because of their seasonal character. The pattern of circulation leading to formation and decay of thegyre is reproduced reasonably wellin thecomputation of themonthly mean barotropic transport induced by the cuff of wind stress, whichhasa well-defined annual cycle dueto the monsoons and which is conducive to the formationof an anticyclonic gyre only during the monthsof January-May.The pattem of circulation dueto baroclinic transport induced by the wind stress curl,however, is notknown at present, andthis makes it difficult to conclude unequivocally that thewindstress cuffover thebay is thesole mechanism to force thegyre. 1. INTRODUCTION A feature common to themajorbasins of theworld oceans is the semipermanent anticyclonic subtropical gyre (STG), located ap- proximately between latitudes of 10 øand 40 ø , with a slow equator- ward drift over mostof its area and a rapid poleward flow, the western boundary current (WBC), along its western edge. Though therearemany aspects of the equatorward drift and thepoleward WBC that need further study [see, forexample, Huang, 1991 ], there is general agreement that to a good approximation, (1) theequator- ward drift is a consequence of theSverdrup flow driven by thecurl of wind stress over thebasin, and(2) thepoleward WBC arises to compensate for the equatorward drift. The North Indian Oceanis unique because of theabsence of such a semipermanent STG. This peculiarity in the behavior of the North Indian Ocean is linked to the wind field. The low-level atmospheric circulation over the other basins isdominated throughout the year by the presence of (1) thesubtropical high-pressure belt approximately at thelatitude of 30 ø , (2) the high-latitude "low," and (3) the narrow belt of low pressure, the Intertropical Convergence Zone (ITCZ) closeto the equator. The atmospheric conditions over the North Indian Ocean during the southwest monsoon (approximately May-September) are in striking contrast to the pattern of sealevel pressure described above. Duringthisseason the ITCZ overthe IndianOcean fluctuates between 10øS and 25øN [Gadgil and Srinivasan, 1990]. Conse- quenfiy themeansea level pressure shows an intense "low" located at about 30øN over India [0ort, 1983]. An ocean gyre, the monsoon mdaoieui Sea t. omni ut the North IndianOcean[Schott, 1983]. However, thereare striking differences between thisgyre andtheSTGes elsewhere. The mon- soon gyre crosses the equator whereas the STGes lie poleward of the Copyfight 1993 bythe American Geophysical Union. Paper number 92JC02070. 0148-0227/93/92JC-02070505.00 latitude of about 10 ø.Also, there areindications thatthemonsoon gyre is strongly influenced by forcing mechanisms otherthanthe curl of wind stress over the open basin [McCreary and Kundu, 1985]. The basinwide circulation in theBay of Bengal, theother basin of the North Indian Ocean, during the southwest monsoon is not known. However, there are indications that along the western bound- ary of the Bay, the conditions are more akin to an eastern bound- arylikelocallywind-driven flow [Shetye et al., 1991] thanto the WBC of a STG. Themean sea level pressure over the North Indian Ocean during the northeast monsoon (approximatelyNovember-January) is similarto thatobserved over theother ocean basins, with a "high" over the Asian continent [0ort, 1983]. Thispattern continues during February-April, though the high is located at a somewhat more southem latitude of about 15øN [Hastenrath and Lamb, 1979]. It should then be expected thattheNorth IndianOcean wouldat this time exhibit a subtropical gyre. From what is known about surface circulation in theArabian SeaandtheBay of Bengal, for example, fromcharts of climatology of ship drift [CutlerandSwallow, 1984], there areno indications of an anticyclonic gyrein either of thetwo basins during November- January. However, thesame data suggest thatin theBay of Bengal, circulation resembling such a gyre does begin to formduring lateJanuary. Otherdata are consistent with this finding. On the basis of a hydrographic survey in 1977along latitude 13øN off Madras, India, Shcherbinin et al. [1979] reported that a WBC was present and that itscore was located between 81øE and 82øE. The current extended toa depth of 200 m.Legeckis [1987] used color infrared imagesof sea surface temperature during February 1985 to showthe existence of bands of warm water that suggest thepresence of a western boundary current alongthe east coasts of Indiaand Sri Lanka. However, Legeckis' search for similar signatures during the winters of 1986 and 1987 ended in failure,but thismay havebeenbecause of interference from cloudcover.One must therefore takeinto account thepossibility thatwinds overthe Bay setup a seasonal anticyclonic gyre during the northern hemi- sphere winter. 945
-
Upload
independent -
Category
Documents
-
view
3 -
download
0
Transcript of The Western Boundary Current of the Seasonal Subtropical Gyre in the Bay of Bengal
JOURNAL OF GEOPHYSICAL RESEARCH, VOL. 98, NO. C1, PAGES 945-954, JANUARY 15, 1993
The Western Boundary Current of the Seasonal Subtropical Gyre in the Bay of Bengal
S. R. SHETYE, A.D. GOUVEIA, S. S.C. SHENOI, D. SUNDAR, G. S. MICHAEL AND G. NAMPOOTHIRI
Physical Oceanography Division, National Institute of Oceanography, Dona-Paula, Goa, India
Hydrographic data collected during March-April 1991 show the presence of a poleward current along the westem boundary of the Bay of Bengal north of about 10 ø N carrying warmer waters of southem origin. The inshore side of the current was marked by cooler, more saline waters brought to the surface due to the presence of the current which transported approximately 10 x 106 m3/s. The hydrography is suggestive of many of the features that have been associated with the western boundary currents of the subtropical gyres of the world oceans: a recirculation zone, waves, eddies, etc. These features, however, were not satisfactorily resolved in the data. Using available elimatologies of monthly mean ship drifts, seasonal hydrography, and monthly mean wind stress, we propose that the poleward current is the westem boundary current of a seasonal anticyclonic subtropical gyre which forms in the Bay during January, is best developed during March-April, and decays by June. The gyre and the westem boundary current are unique because of their seasonal character. The pattern of circulation leading to formation and decay of the gyre is reproduced reasonably well in the computation of the monthly mean barotropic transport induced by the cuff of wind stress, which has a well-defined annual cycle due to the monsoons and which is conducive to the formation of an anticyclonic gyre only during the months of January-May. The pattem of circulation due to baroclinic transport induced by the wind stress curl, however, is not known at present, and this makes it difficult to conclude unequivocally that the wind stress cuff over the bay is the sole mechanism to force the gyre.
1. INTRODUCTION
A feature common to the major basins of the world oceans is the semipermanent anticyclonic subtropical gyre (STG), located ap- proximately between latitudes of 10 ø and 40 ø , with a slow equator- ward drift over most of its area and a rapid poleward flow, the western boundary current (WBC), along its western edge. Though there are many aspects of the equatorward drift and the poleward WBC that need further study [see, for example, Huang, 1991 ], there is general agreement that to a good approximation, (1) the equator- ward drift is a consequence of the Sverdrup flow driven by the curl of wind stress over the basin, and (2) the poleward WBC arises to compensate for the equatorward drift. The North Indian Ocean is unique because of the absence of such a semipermanent STG.
This peculiarity in the behavior of the North Indian Ocean is linked to the wind field. The low-level atmospheric circulation over the other basins is dominated throughout the year by the presence of (1) the subtropical high-pressure belt approximately at the latitude of 30 ø , (2) the high-latitude "low," and (3) the narrow belt of low pressure, the Intertropical Convergence Zone (ITCZ) close to the equator. The atmospheric conditions over the North Indian Ocean during the southwest monsoon (approximately May-September) are in striking contrast to the pattern of sea level pressure described above. During this season the ITCZ over the Indian Ocean fluctuates between 10øS and 25øN [Gadgil and Srinivasan, 1990]. Conse- quenfiy the mean sea level pressure shows an intense "low" located at about 30øN over India [0ort, 1983]. An ocean gyre, the monsoon
md aoieui Sea t. omni ut the
North Indian Ocean [Schott, 1983]. However, there are striking differences between this gyre and the STGes elsewhere. The mon- soon gyre crosses the equator whereas the STGes lie poleward of the
Copyfight 1993 by the American Geophysical Union.
Paper number 92JC02070. 0148-0227/93/92JC-02070505.00
latitude of about 10 ø. Also, there are indications that the monsoon gyre is strongly influenced by forcing mechanisms other than the curl of wind stress over the open basin [McCreary and Kundu, 1985]. The basinwide circulation in the Bay of Bengal, the other basin of the North Indian Ocean, during the southwest monsoon is not known. However, there are indications that along the western bound- ary of the Bay, the conditions are more akin to an eastern bound- arylike locally wind-driven flow [Shetye et al., 1991] than to the WBC of a STG.
The mean sea level pressure over the North Indian Ocean during the northeast monsoon (approximately November-January) is similar to that observed over the other ocean basins, with a "high" over the Asian continent [0ort, 1983]. This pattern continues during February-April, though the high is located at a somewhat more southem latitude of about 15øN [Hastenrath and Lamb, 1979]. It should then be expected that the North Indian Ocean would at this time exhibit a subtropical gyre. From what is known about surface circulation in the Arabian Sea and the Bay of Bengal, for example, from charts of climatology of ship drift [Cutler andSwallow, 1984], there are no indications of an anticyclonic gyre in either of the two basins during November- January. However, the same data suggest that in the Bay of Bengal, circulation resembling such a gyre does begin to form during late January. Other data are consistent with this finding. On the basis of a hydrographic survey in 1977 along latitude 13øN off Madras, India, Shcherbinin et al. [1979] reported that a WBC was present and that its core was located between 81øE and 82øE. The current extended to a depth of 200 m. Legeckis [1987] used color infrared images of sea surface temperature during February 1985 to show the existence of bands of warm water that suggest the presence of a western boundary current along the east coasts of India and Sri Lanka. However, Legeckis' search for similar signatures during the winters of 1986 and 1987 ended in failure, but this may have been because of interference from cloud cover. One must therefore take into account the possibility that winds over the Bay set up a seasonal anticyclonic gyre during the northern hemi- sphere winter.
945
946 S•mTYE ET AL.: WESTERN BOUNDARY CURRENT OF BAY OF BF•OAL
Recent theoretical studies on circulation of the Bay of Bengal have provided additional interest in the study of the Bay of Bengal during January-June. Potemra et al. [1991] simulated the annual cycle of circulation in the North Indian Ocean using a multilayer numerical model of the upper Indian Ocean driven by climatological monthly mean winds. A significant feature seen in their results is a large anticyclonic gyre in the Bay of Bengal surface waters during the northem hemisphere winter. The gyre decayed in spring. The authors have highlighted the following mechanism to generate this gyre. Coastal Kelvin waves propagating northward along the eastern boundary of the Bay excite westward propagating Rossby waves into the interior of the Bay. These waves lead to the formation of the gyre. This line of thought was pursued in the numerical experiments by Yu et al. [ 1991] using a simple reduced gravity model of the North Indian Ocean. They suggested that the northward propagating coas- tal Kelvin waves are excited by the reflection of equatorial Kelvin waves at the eastern boundary of the basin. In the numerical experi- ments the equatorial Kelvin waves were excited by the annual cycle of winds along the equator. A significant implication of this result is that an anticyclonic gyre in the Bay during the northern hemisphere winter can be forced remotely by the annual cycle of winds over the equatorial belt. Numerical experiments with a 2.5 -layer model by J. McCreary et al (personal communication 1992)confirm that remote forcing by the winds over the equatorial belt is important in genera- tion of the STG and suggest that there is yet another mechanism for driving a poleward current along the east coast of India during March- April. Upwelling favorable alongshore coastal winds in the northeastern corner of the Bay during the northeast monsoon can excite Kelvin waves, which after travelling along the northem boundary of the Bay and on reaching the east coast of India in March generate a poleward current.
We thus have three hypotheses conceming the conditions in the Bay after the withdrawal of the northeast monsoon and before the
onset of the southwest monsoon. The first states that an anticyclonic gyre should be forming due to local forcing by the winds over the Bay. The second proposes that the gyre is forced remotely by the winds over the equatorial belt. The third states that though a remotely forced gyre will form, arrival of Kelvin waves (generated elsewhere along the boundary of the Bay of Bengal) at the east coast of India will significantly enhance a poleward current there.
Field observations are needed to examine the applicability of these hypotheses. A major problem in understanding the Bay has, in fact, been lack of data sets to describe the seasonal circulation. It is with this in mind that a hydrographic survey was carried out during March-April 1991 in the western boundary region of the Bay north of about 10øN. The observations complement those made during similar cruises during the southwest monsoon 1989 [Shetye et al., 1991 ] and the northeast monsoon 1991-1992. The M arch-April 1991 data described in the next section confirm the presence of a poleward current. We then bring together available climatological data sets to show that this current is the WBC of a STG that occurs over the Bay during approximately February-May and examine the likely causes for formation of the gyre.
2. OBSERVATIONS
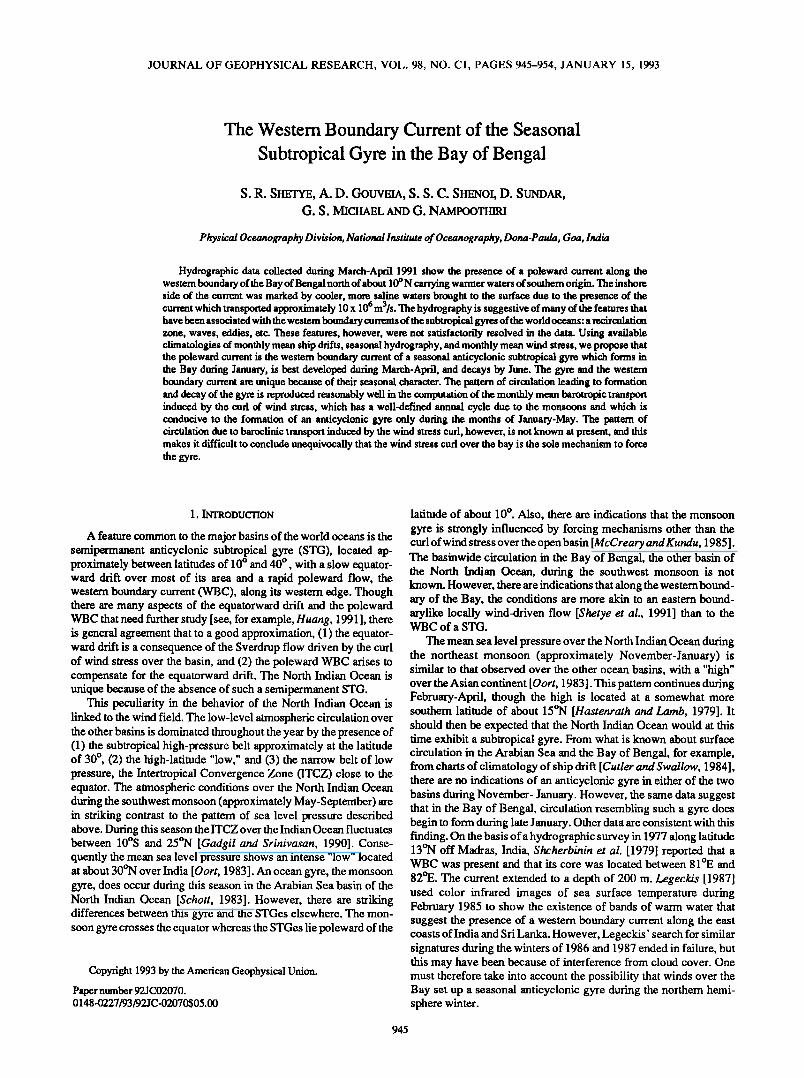
The hydrographic data described here were collected from March 14 to April 7 1991, onboard ORV Sagar Kanya. Vertical profiles of temperature and salinity were measured using a SeaBird conduc- tivity, temperature and depth (CTD)profiler SBE 9 at 91 stations stretched along eight legs, each of which ran approximately normal to the coast near its inshore edge (Figure 1). The conductivity sensor used during the cruise was calibrated on April 3, 1990, and on June 7, 1991. The temperature sensor was calibrated on April 20, 1990 and on August 7, 1991. The instruments were calibrated at the Northwest Regional Calibration Center, Bellevue, Washington.
ø 5ø 075 8 85 ø 9 I00 25 N R. Ganges putra R. N
..
20 o 105 R
** * •1 Vishakha * *G
Irawaddy R.
R. KriShna *F o
15 15ø
Madras ß ß ß ß C
R.Cauve
I(• s.5o
,.• ø 5 ø 75ø 80 85 9 IO0øE
Fig. 1. The Bay of Bengal. The bottom topography contours are in meters. The hydrographic stations, shown by dots, were divided into eight legs (A-H). The circled station in leg E concerns Figure 2.
SHETYE ET AL.: WESTERN BOUNDARY CURRENT OF BAY OF B•Gxt, 947
Using these data the calibration drift of the conductivity and temperature sensors was computed and corrected. During the cruise, salinities were also measured regularly at deep locations (ap- proximately 2000 m) using bottle samples and an onboard salinometer (AUTOSAL model 8400A). The mean and standard deviation of the difference between the AUTOSAL salinities and those measured by the CTD at these locations were 0.0002 ppt and 0.005 ppt, respectively. We surmise that the errors in the CTD salinity and temperature measurements were less than 0.01 ppt and 0.01 øC, respectiv ely.
2.1. Hydrography
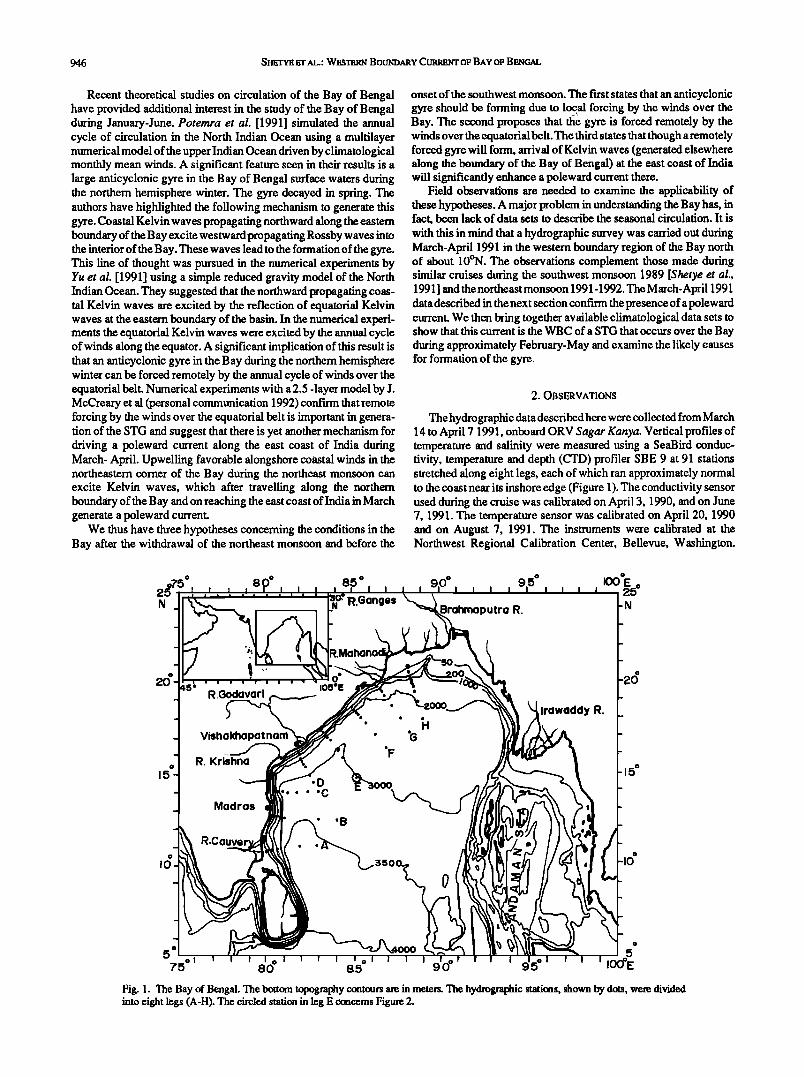
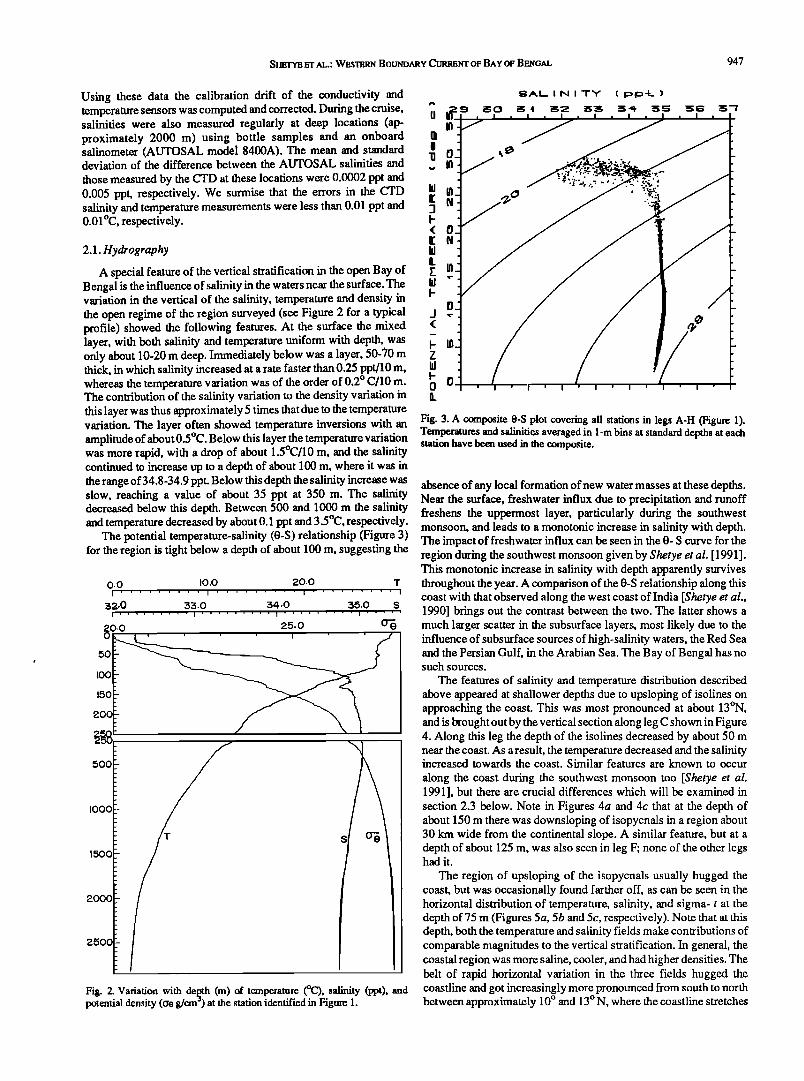
A special feature of the vertical stratification in the open Bay of Bengal is the influence of salinity in the waters near the surface. The variation in the vertical of the salinity, temperature and density in the open regime of the region surveyed (see Figure 2 for a typical profile) showed the following features. At the surface the mixed layer, with both salinity and temperature uniform with depth, was only about 10-20 m deep. Immediately below was a layer, 50-70 m thick, in which salinity increased at a rate faster than 0.25 ppt/10 m, whereas the temperature variation was of the order of 0.2 ø C/10 m. The contribution of the salinity variation to the density variation in this layer was thus approximately 5 times that due to the temperature variation. The layer often showed temperature inversions with an Fig. 3. A composite 0-S plot covering all stations in legs A-H (Figure 1). Temperatures and salinities averaged in 1-m bins at standard depths at each amplitude of about 0.5øC. Below this layer the temperature variation station have been used in the composite. was more rapid, with a drop of about 1.5øC/10 m, and the salinity continued to increase up to a depth of about 100 m, where it was in
the range of 34.8-34.9 ppt. Below this depth the salinity increase was absence of any local formation of new water masses at these depths. slow, reaching a value of about 35 ppt at 350 m. The salinity Near the surface, freshwater influx due to precipitation and runoff decreased below this depth. Between 500 and 1000 m the salinity freshens the uppermost layer, particularly during the southwest and temperature decreased by about 0.1 ppt and 3.5øC, respectively. monsoon, and leads to a monotonic increase in salinity with depth.
The potential temperature-salinity (0-S) relationship (Figure 3) The impact of freshwater influx can be seen in the 0- S curve for the for the region is tight below a depth of about 100 m, suggesting the
o.o IO.O 2o.o T I ......... I ......... I ......... I
32.0 •.0 34-O 35.0 S
:o.o 25.0
500
IOOO
15OO
2•O.
2500
Fig. 2. Variation with de•.th (m) of temperature (øC), salinity (ppt), and potential density (o0 g/cm ) at the station identified in Figure 1.
region during the southwest monsoon given by Sherye et al. [1991]. This monotonic increase in salinity with depth apparently survives throughout the year. A comparison of the 0-S relationship along this coast with that observed along the west coast of India [Sherye et al., 1990] brings out the contrast between the two. The latter shows a much larger scatter in the subsurface layers, most likely due to the influence of subsurface sources of high-salinity waters, the Red Sea and the Persian Gull in the Arabian Sea. The Bay of Bengal has no such sources.
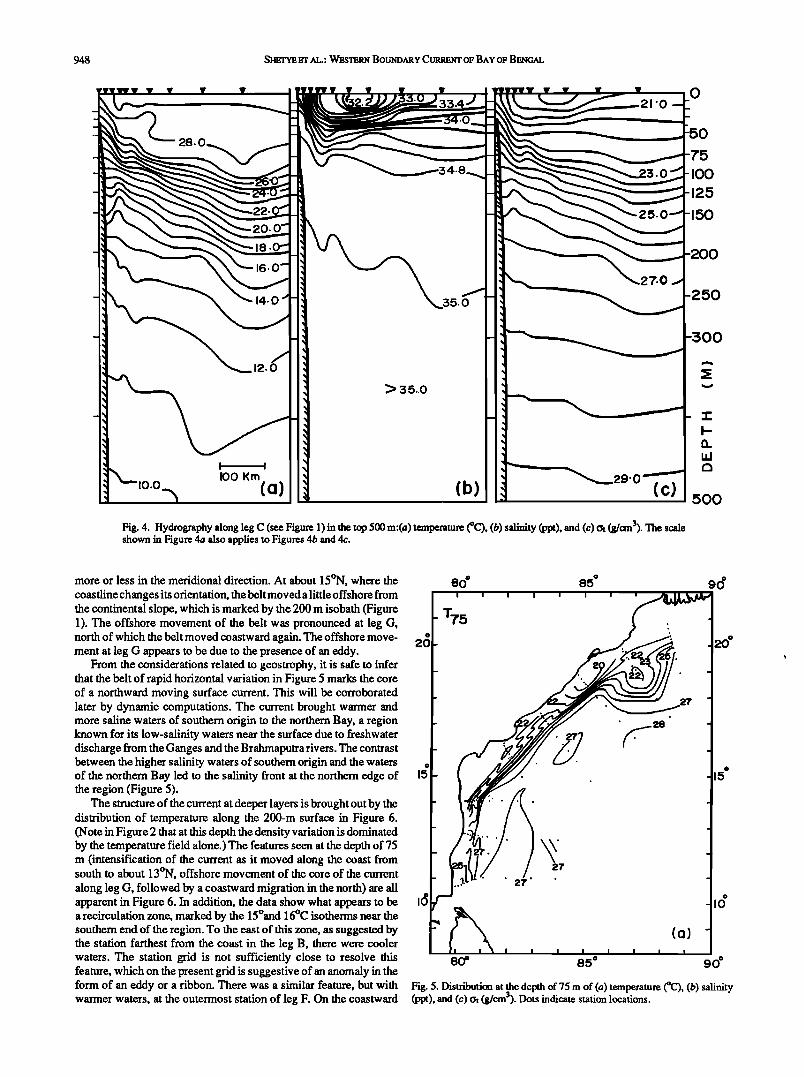
The features of salinity and temperature distribution described above appeared at shallower depths due to upsloping of isolines on approaching the coast. This was most pronounced at about 13øN, and is brought out by the vertical section along leg C shown in Figure 4. Along this leg the depth of the isolines decreased by about 50 m near the coast. As aresult, the temperature decreased and the salinity increased towards the coast. Similar features are known to occur
along the coast during the southwest monsoon too [Shetye et al. 1991], but there are crucial differences which will be examined in section 2.3 below. Note in Figures 4a and 4c that at the depth of about 150 m there was downsloping of isopycnals in a region about 30 km wide from the continental slope. A similar feature, but at a depth of about 125 m, was also seen in leg F; none of the other legs had it.
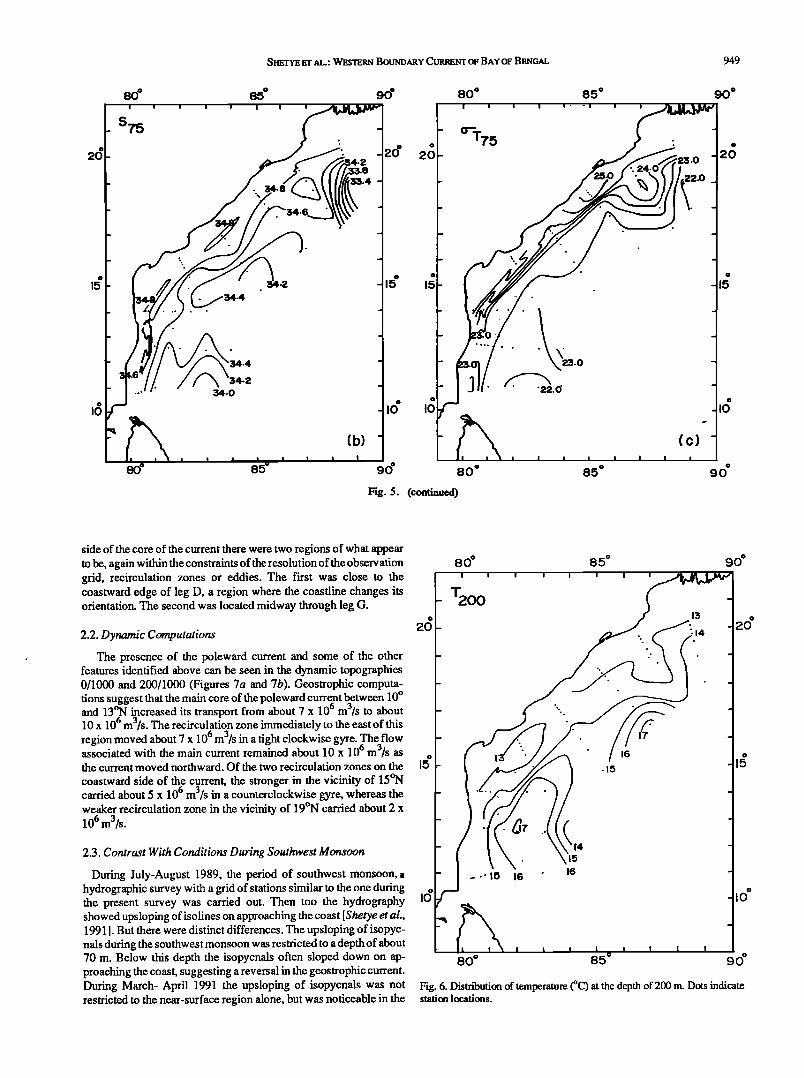
The region of upsloping of the isopycnals usually hugged the coast, but was occasionally found farther off, as can be seen in the horizontal distribution of temperature, salinity, and sigma- t at the depth of 75 m (Figures 5a, 5b and 5c, respectively). Note that at this depth, both the temperature and salinity fields make contributions of comparable magnitudes to the vertical stratification. In general, the coastal region was more saline, cooler, and had higher densities. The belt of rapid horizontal variation in the three fields hugged the coastline and got increasingly more pronounced from south to north between approximately 10 ø and 13 ø N, where the coastline stretches
948 SI•TY• ET AL.: WESTERN BOUNDARY CURRENT OF BAY OF B•OAL
I'0 o
28.
.
25.0
IOO
125
16.
14.0 0
27.0
12.0
35.,0
I I I00 Km
,o.o, (a) (b)
Fig. 4. Hydrography along leg C (see Figure 1) in the top 500 m:(a) temperature (øC), (b) salinity (ppt), and (c) ot (g/cm3). The scale shown in Figure 4a also applies to Figures 4b and 4c.
50O
more or less in the meridional direction. At about 15øN, where the $O ø coastline changes its orientation, the belt moved a little offshore from the continental slope, which is marked by the 200 m isobath (Figure 1). The offshore movement of the belt was pronounced at leg G,
north of which the belt moved coastward again. The offshore move- 2(• ment at leg G appears to be due to the presence of an eddy.
From the considerations related to geostrophy, it is safe to infer that the belt of rapid horizontal variation in Figure 5 marks the core of a northward moving surface current. This will be corroborated later by dynamic computations. The current brought warmer and more saline waters of southern origin to the northern Bay, a region known for its low-salinity waters near the surface due to freshwater discharge from the Ganges and the Brahmaputra rivers. The contrast between the higher salinity waters of southern origin and the waters of the northern Bay led to the salinity front at the northern edge of Iõ the region (Figure 5).
The structure of the current at deeper layers is brought out by the distribution of temperature along the 200-m surface in Figure 6. (Note in Figure 2 that at this depth the density variation is dominated by the temperature field alone.) The features seen at the depth of 75 m (intensification of the current as it moved along the coast from south to about 13øN, offshore movement of the core of the current along leg G, followed by a coastward migration in the north) are all " apparent in Figure 6. In addition, the data show what appears to be I(•
a recirculation zone, marked by the 15øand 16øC isotherms near the southern end of the region. To the east of this zone, as suggested by the station farthest from the coast in the leg B, there were cooler waters. The station grid is not sufficiently close to resolve this feature, which on the present grid is suggestive of an anomaly in the form of an eddy or a ribbon. There was a similar feature, but with warmer waters, at the outermost station of leg F. On the coastward
T75
85 ø
zo
I i I I i I i i
80" 85 • 90 •
Fig. 5. Distribution at the depth of 75 m of (a) temperature (øC), (b) salinity (ppt), and (c) ot (g/cm3). Dots indicate station locations.
SHETYE ET AL.: WESTERN BOUNDARY CURRENT OF BAY OF B•.N6AL 949
so-
S75
90 ø 80 ø I •
I,.• 15
•4-2
34.0
80 ø 90 ø
0-•5
85 ø
'22.0
80 ø 85 ø
Fig. 5. (continued)
90 ø
(c,) i
90'
side of the core of the current there were two regions of what appear to be, again within the constraints of the resolution of the observation grid, recirculation zones or eddies. The first was close to the coastward edge of leg D, a region where the coastline changes its orientation. The second was located midway through leg G.
2.2. Dynamic Computations
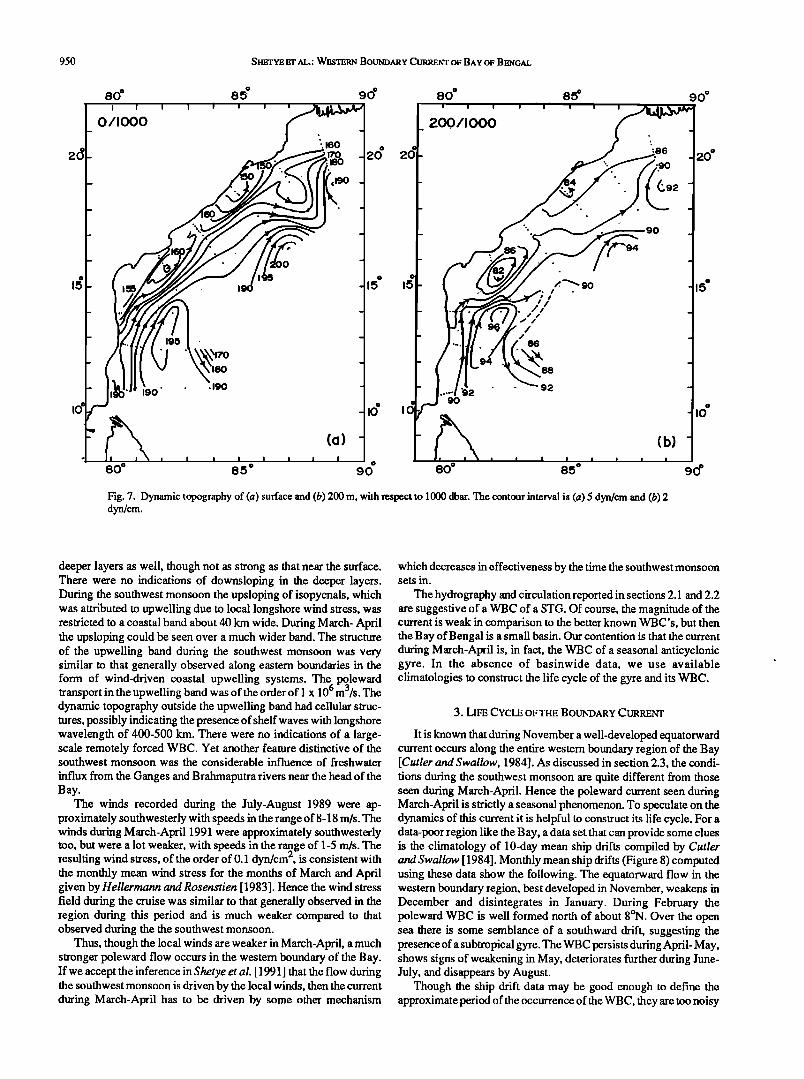
The presence of the poleward current and some of the other features identified above can be seen in the dynamic topographies 0/1000 and 200/1000 (Figures 7a and 7b). Geostrophic computa- tions suggest that the main core of the poleward current between 10 ø and 13øN increased its transport from about 7 x 10⁶ m3/s to about 10 x 106 m3/s. The recirculation zone immediately to the east of this region moved about 7 x 10⁶ m3/s in a tight clockwise gyre. The flow associated with the main current remained about 10 x 106 m3/s as the current moved northward. Of the two recirculation zones on the coastward side of the current, the stronger in the vicinity of 15øN carried about 5 x 10⁶ m3/s in a counterclockwise gyre, whereas the weaker recirculation zone in the vicinity of 19øN carried about 2 x 10 6 m3/s.
2.3. Contrast With Conditions During Southwest Monsoon
During July-August 1989, the period of southwest monsoon, a hydrographic survey with a grid of stations similar to the one during the present survey was carried out. Then too the hydrography showed upsloping of isolines on approaching the coast [Shetye et al., 1991]. But there were distinct differences. The upsloping of isopyc- nals during the southwest monsoon was restricted to a depth of about 70 m. Below this depth the isopycnals often sloped down on ap- proaching the coast, suggesting a reversal in the geostrophic current. During March- April 1991 the upsloping of isopycnals was not restricted to the near-surface region alone, but was noticeable in the
8O' 85 ø i i [ I I
.15
13
14
ß
90 ø
....' 15 16
1'4
t5
16
i i I i I I I
85 ø
Fig. 6. Distribution of temperature (øC) at the depth of 200 m. Dots indicate station locations.
950 SHETYE ET AL.: WESTERN BOUNDARY CURRENT OF BAY OF BENOAL
8O ø
0/!000
190
195
190
I I I I I I
85 ø
'.160
(a) I
90 ø 80 ø 85"
t ! I I I ' I' I I 2.00/1000
o • 86 "' , .,. • 90 15 • 15
90 80' 85"
90 ø
20 ø
,o o
Fig. 7. Dynamic topography of (a) surface and (b) 200 m, with respect to 1000 dbar. The contour interval is (a) 5 dyn/cm and (b) 2 dyn/cm.
deeper layers as well, though not as strong as that near the surface. There were no indications of downsloping in the deeper layers. During the southwest monsoon the upsloping of isopycnals, which was attributed to upwelling due to local longshore wind stress, was restricted to a coastal band about 40 km wide. During March- April the upsloping could be seen over a much wider band. The structure of the upwelling band during the southwest monsoon was very similar to that generally observed along eastern boundaries in the form of wind-driven coastal upwelling systems. The poleward transport in the upwelling band was of the order of 1 x 10⁶ m3/s. The dynamic topography outside the upwelling band had cellular struc- tures, possibly indicating the presence of shelf waves with longshore wavelength of 400-500 km. There were no indications of a large- scale remotely forced WBC. Yet another feature distinctive of the southwest monsoon was the considerable influence of freshwater
influx from the Ganges and Brahmaputra rivers near the head of the Bay.
The winds recorded during the July-August 1989 were ap- proximately southwesterly with speeds in the range of 8-18 m/s. The winds during March-April 1991 were approximately southwesterly too, but were a lot weaker, with speeds in the range of 1-5 m/s. The
2 resulting wind stress, of the order of 0.1 dyn/cm , is consistent with the monthly mean wind stress for the months of March and April given by Hellermann and Rosenstien [ 1983]. Hence the wind stress field during the cruise was similar to that generally observed in the region during this period and is much weaker compared to that observed during .the the southwest monsoon.
Thus, though the local winds are weaker in March-April, a much stronger poleward flow occurs in the western boundary of the Bay. If we accept the inference inShetye et al. [1991] that the flow during the southwest monsoon is driven by the local winds, then the current during March-April has to be driven by some other mechanism
which decreases in effectiveness by the time the southwest monsoon sets in.
The hydrography and circulation reported in sections 2.1 and 2.2 are suggestive of a WBC of a STG. Of course, the magnitude of the current is weak in comparison to the better known WBC's, but then the Bay of Bengal is a small basin. Our contention is that the current during March-April is, in fact, the WBC of a seasonal anticyclonic gyre. In the absence of basinwide data, we use available climatologies to construct the life cycle of the gyre and its WBC.
3. LIFE CYCLE OF THE BOUNDARY CURRENT
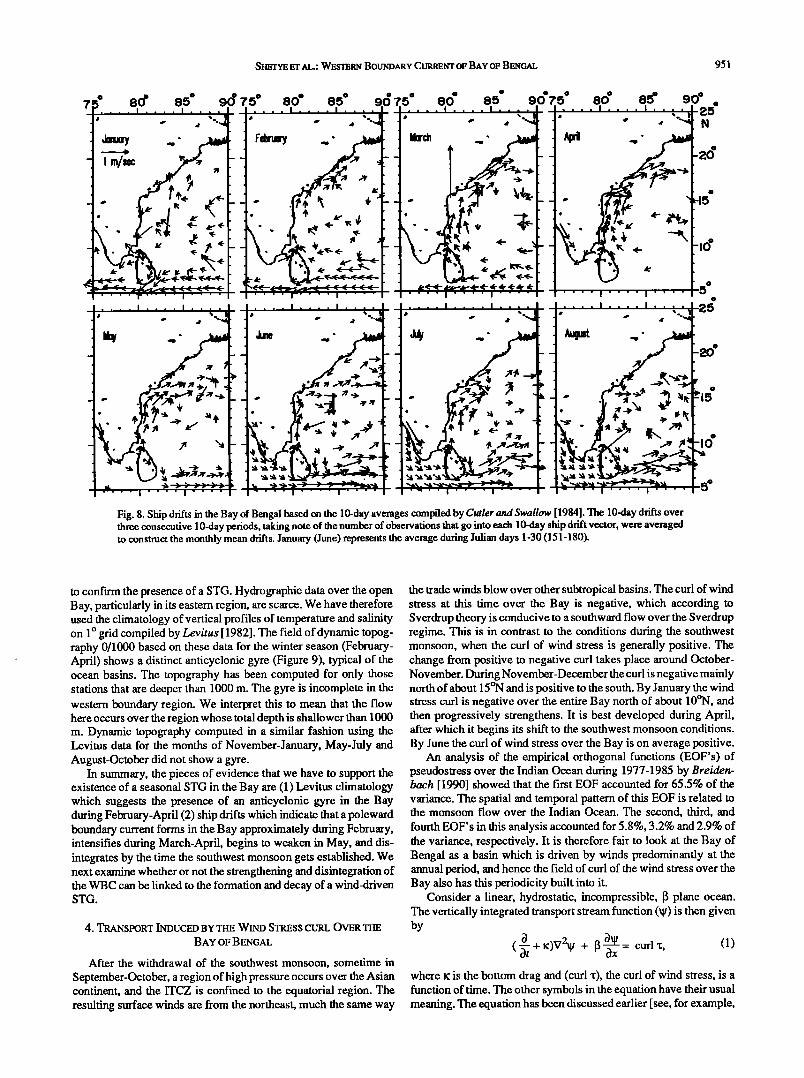
It is known that during November a well-developed equatorward current occurs along the entire western boundary region of the Bay [Cutler and Swallow, 1984]. As discussed in section 2.3, the condi- tions during the southwest monsoon are quite different from those seen during March-April. Hence the poleward current seen during March-April is strictly a seasonal phenomenon. To speculate on the dynamics of this current it is helpful to construct its life cycle. For a data-poor region like the Bay, a data set that can provide some clues is the climatology of 10-day mean ship drifts compiled by Cutler and Swallow [ 1984]. Monthly mean ship drifts (Figure 8) computed using these data show the following. The equatorward flow in the western boundary region, best developed in November, weakens in December and disintegrates in January. During February the poleward WBC is well formed north of about 8øN. Over the open sea there is some semblance of a southward drift, suggesting the presence of a subtropical gyre. The WBC persists during April- May, shows signs of weakening in May, deteriorates further during June- July, and disappears by August.
Though the ship drift data may be good enough to define the approximate period of the occurrence of the WBC, they are too noisy
SHETYE ET AL.: WESTERN BOUNDARY CURRENT OF BAY OF BEN6AL 951
Fig. 8. Ship drifts in the Bay of Bengal based on the 10-day averages compiled by Cutler and Swallow [1984]. The 10-day drifts over three consecutive 1 O-day periods, taking note of the number of observations that go into each 1 O-day ship drift vector, were averaged to construct the monthly mean drifts. January (June) represents the average during Julian days 1-30 (151-180).
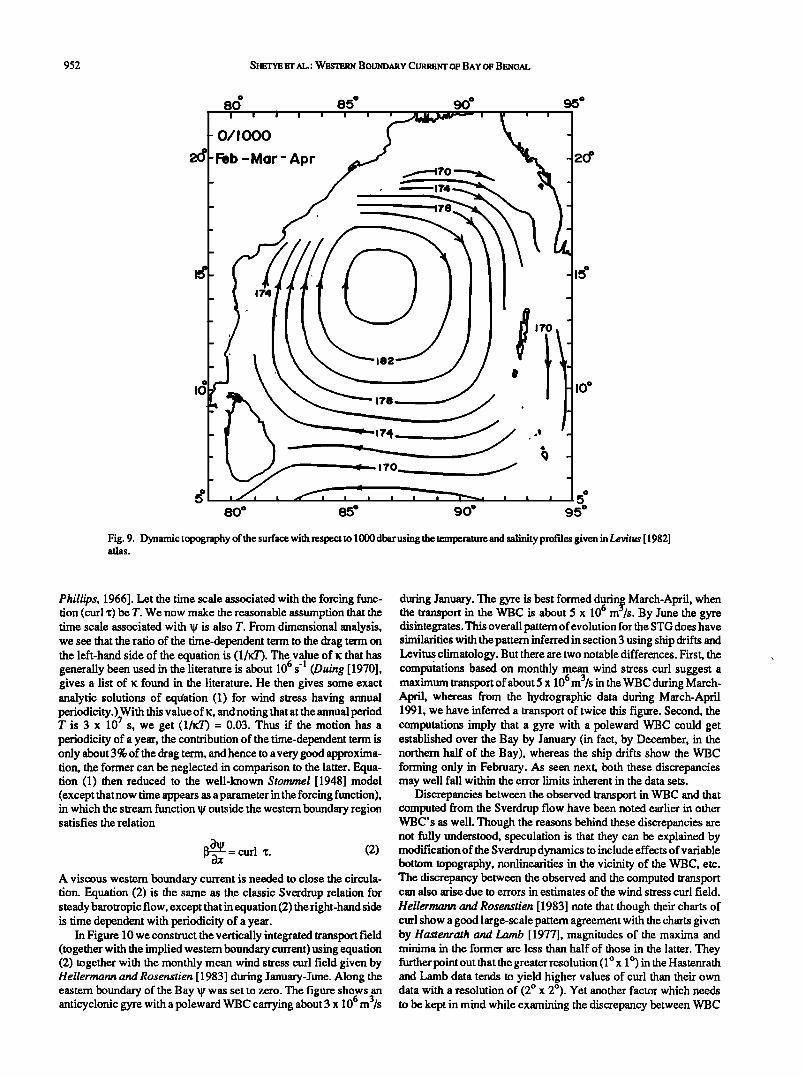
to confirm the presence of a STG. Hydrographic data over the open Bay, particularly in its eastern region, are scarce. We have therefore used the climatology of vertical profiles of temperature and salinity on 1 ø grid compiled by Levitus [ 1982]. The field of dynamic topog- raphy 0/1000 based on these data for the winter season (February- April) shows a distinct anticyclonic gyre (Figure 9), typical of the ocean basins. The topography has been computed for only those stations that are deeper than 1000 m. The gyre is incomplete in the western boundary region. We interpret this to mean that the flow here occurs over the region whose total depth is shallower than 1000 m. Dynamic topography computed in a similar fashion using the Levitus data for the months of November-January, May-July and August-October did not show a gyre.
In summary, the pieces of evidence that we have to support the existence of a seasonal STG in the Bay are (1) Levims climatology which suggests the presence of an anticyclonic gyre in the Bay during February-April (2) ship drifts which indicate that a poleward boundary current forms in the Bay approximately during February, intensifies during March-April, begins to weaken in May, and dis- integrates by the time the southwest monsoon gets established. We next examine whether or not the strengthening and disintegration of the WBC can be linked to the formation and decay of a wind-driven STG.
4. TRANSPORT INDUCED BY THE WIND STRESS CURL OVER THE BAY OF BENGAL
After the withdrawal of the southwest monsoon, sometime in September-October, a region of high pressure occurs over the Asian continent, and the ITCZ is confined to the equatorial region. The resulting surface winds are from the northeast, much the same way
the trade winds blow over other subtropical basins. The curl of wind stress at this time over the Bay is negative, which according to Sverdrup theory is conducive to a southward flow over the Sverdrup regime. This is in contrast to the conditions during the southwest monsoon, when the curl of wind stress is generally positive. The change from positive to negative curl takes place around October- November. During November-December the curl is negative mainly north of about 15øN and is positive to the south. By January the wind stress curl is negative over the entire Bay north of about 10øN, and then progressively strengthens. It is best developed during April, after which it begins its shift to the southwest monsoon conditions. By June the curl of wind stress over the Bay is on average positive.
An analysis of the empirical orthogonal functions (EOF's) of pseudostress over the Indian Ocean during 1977-1985 by Breiden- bach [1990] showed that the first EOF accounted for 65.5% of the variance. The spatial and temporal pattern of this EOF is related to the monsoon flow over the Indian Ocean. The second, third, and fourth EOF's in this analysis accounted for 5.8%, 3.2% and 2.9% of the variance, respectively. It is therefore fair to look at the Bay of Bengal as a basin which is driven by winds predominantly at the annual period, and hence the field of curl of the wind stress over the Bay also has this periodicity built into it.
Consider a linear, hydrostatic, incompressible, [• plane ocean. The vertically integrated transport stream function (•) is then given by
3 K:)V2xF + [•33---•x curl x, (1) (7/+ = where •: is the bottom drag and (curl x), the curl of wind stress, is a function of time. The other symbols in the equation have their usual meaning. The equation has been discussed earlier [see, for example,
952 SH•TY• Er AL.: WESTERN BOUNDARY CURRE• OF BAY OF B•'•AL
o! I ooo
Feb -Mar- Apr
,d
182
178
5 5 80 ø 85 • 90" 95 e
Fig. 9. Dynamic topography of the surface with respect to 1000 dbar using the temperature and salinity profiles given inLevitus [ 1982] atlas.
Phillips, 1966]. Let the time scale associated with the forcing func- tion (curl x) be T. We now make the reasonable assumption that the time scale associated with •t is also T. From dimensional analysis, we see that the ratio of the time-dependent term to the drag term on the left-hand side of the equation is (1/r,T). The value of •c that has generally been used in the literature is about 106 s '1 (Duing [1970], gives a list of •c found in the literature. He then gives some exact analytic solutions of eqt/ation (1) for wind stress having annual periodicity.)_With this value o f }c, and noting that at the annual period
7 T is 3 x 10 s, we get (1/•cT) = 0.03. Thus if the motion has a periodicity of a year, the contribution of the time-dependent term is only about 3% of the drag term, and hence to a very good approxima- tion, the former can be neglected in comparison to the latter. Equa- tion (1) then reduced to the well-known Stommel [1948] model (except thatnow time appears as a parameter in the forcing function), in which the stream function •t outside the western boundary region satisfies the relation
[•'•x'x = curl X. (2) A viscous western boundary current is needed to close the circula- tion. Equation (2) is the same as the classic Sverdrup relation for steady barotropic flow, except that in equation (2) the right-hand side is time dependent with periodicity of a year.
In Figure 10 we construct the vertically integrated transport field (together with the implied western boundary current) using equation (2) together with the monthly mean wind stress curl field given by Hellermann and Rosenstien [ 1983] during January-June. Along the eastern boundary of the Bay W was set to zero. The figure shows an anticyclonic gyre with a poleward WBC carrying about 3 x 10⁶ m3/s
during January. The gyre is best formed during March-April, when the transport in the WBC is about 5 x 10⁶ m3'/s. By June the gyre disintegrates. This overall pattern of evolution for the STG does have similarities with the pattern inferred in section 3 using ship drifts and Levitus• climatology. But there are two notable differences. First, the computations based on monthly mean wind stress curl suggest a maximum transport of about 5 x 10⁶ m3/s in the WBC during March- April, whereas from the hydrographic data during March-April 1991, we have inferred a transport of twice this figure. Second, the computations imply that a gyre with a poleward WBC could get established over the Bay by January (in fact, by December, in the northem half of the Bay), whereas the ship drifts show the WBC forming only in February. As seen next, both these discrepancies may well fall within the error limits inherent in the data sets.
Discrepancies between the observed transport in WBC and that computed from the Sverdrup flow have been noted earlier in other WBC's as well. Though the reasons behind these discrepancies are not fully understood, speculation is that they can be explained by modification of the Sverdrup dynamics to include effects of variable bottom topography, nonlinearities in the vicinity of the WBC, etc. The discrepancy between the observed and the computed transport can also arise due to errors in estimates of the wind stress curl field.
Hellermann and Rosenstien [1983] note that though their charts of curl show a good large-scale pattern agreement with the charts given by Hastenrath and Lamb [1977], magnitudes of the maxima and minima in the former are less than half of those in the latter. They further point out that the greater resolution (1 øx 1 o) in the Hastenrath and Lamb data tends to yield higher values of curl than their own data with a resolution of (2 ø x 2ø). Yet another factor which needs to be kept in mind while examining the discrepancy between WBC
SHETYE ET AL.: WESTERN BOUNDARY CURRENT OF BAY OF BE.•OAL 953
0 0 • 0 0 0 • • • 0080 f P i • 91o i IOO
i
80 ø 9
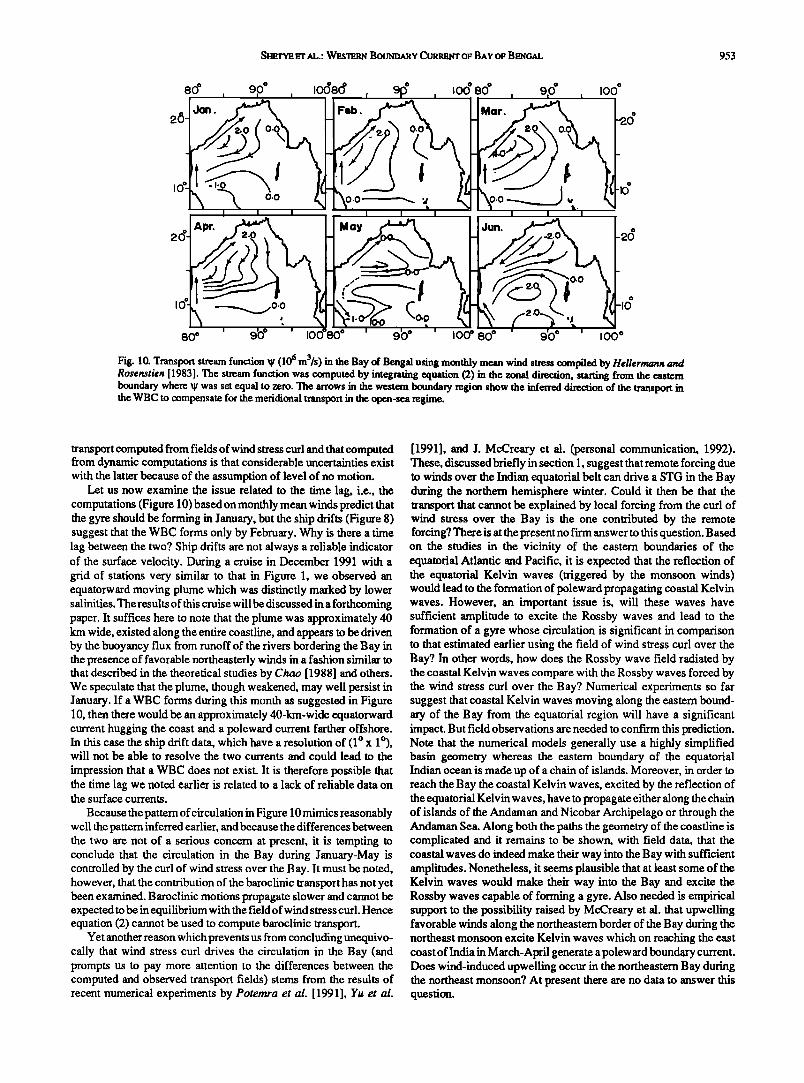
Fig. 10. Transport stream function W (106 ma/s) in the Bay of Bengal using monthly mean wind stress compiled by Hellermann and Rosenstien [1983]. The stream function was computed by integrating equation (2) in the zonal direction, starting from the eastern boundary where W was set equal to zero. The arrows in the western boundary region show the inferred direction of the transport in the WBC to compensate for the mefidional transport in the open-sea regime.
transport computed from fields of wind stress curl and that computed from dynamic computations is that considerable uncertainties exist with the latter because of the assumption of level of no motion.
Let us now examine the issue related to the time lag, i.e., the computations (Figure 10) based on monthly mean winds predict that the gyre should be forming in January, but the ship drifts (Figure 8) suggest that the WBC forms only by February. Why is there a time lag between the two? Ship drifts are not always a reliable indicator of the surface velocity. During a cruise in December 1991 with a grid of stations very similar to that in Figure 1, we observed an equatorward moving plume which was distinctly marked by lower salinities. The results of this cruise will be discussed in a forthcoming paper. It suffices here to note that the plume was approximately 40 km wide, existed along the entire coastline, and appears to be driven by the buoyancy flux from runoff of the rivers bordering the Bay in the presence of favorable northeasterly winds in a fashion similar to that described in the theoretical studies by Chao [1988] and others. We speculate that the plume, though weakened, may well persist in January. If a WBC forms during this month as suggested in Figure 10, then there would be an approximately 40-km-wide equatorward current hugging the coast and a poleward current farther offshore. In this case the ship drift data, which have a resolution of (1 ø x 1ø), will not be able to resolve the two currents and could lead to the
impression that a WBC does not exist. It is therefore possible that the time lag we noted earlier is related to a lack of reliable data on the surface currents.
Because the pattem of circulation in Figure 10 mimics reasonably well the pattem inferred earlier, and because the differences between the two are not of a serious concern at present, it is tempting to conclude that the circulation in the Bay during January-May is controlled by the curl of wind stress over the Bay. It must be noted, however, that the contribution of the baroclinic transport has not yet been examined. Baroclinic motions propagate slower and cannot be expected to be in equilibrium with the field of wind stress curl. Hence equation (2) cannot be used to compute baroclinic transport.
Yet another reason which prevents us from concluding unequivo- cally that wind stress curl drives the circulation in the Bay (and prompts us to pay more attention to the differences between the computed and observed transport fields) stems from the results of recent numerical experiments by Potemra et al. [1991], Yu et al.
[1991], and J. McCreary et al. (personal communication, 1992). These, discussed briefly in section 1, suggest that remote forcing due to winds over the Indian equatorial belt can drive a STG in the Bay during the northem hemisphere winter. Could it then be that the transport that cannot be explained by local forcing from the curl of wind stress over the Bay is the one contributed by the remote forcing? There is at the present no firm answer to this question. Based on the studies in the vicinity of the eastern boundaries of the equatorial Atlantic and Pacific, it is expected that the reflection of the equatorial Kelvin waves (triggered by the monsoon winds) would lead to the formation of poleward propagating coastal Kelvin waves. However, an important issue is, will these waves have sufficient amplitude to excite the Rossby waves and lead to the formation of a gyre whose circulation is significant in comparison to that estimated earlier using the field of wind stress curl over the Bay? In other words, how does the Rossby wave field radiated by the coastal Kelvin waves compare with the Rossby waves forced by the wind stress curl over the Bay? Numerical experiments so far suggest that coastal Kelvin waves moving along the eastem bound- ary of the Bay from the equatorial region will have a significant impact. But field observations are needed to confirrn this prediction. Note that the numerical models generally use a highly simplified basin geometry whereas the eastern boundary of the equatorial Indian ocean is made up of a chain of islands. Moreover, in order to reach the Bay the coastal Kelvin waves, excited by the reflection of the equatorial Kelvin waves, have to propagate either along the chain of islands of the Andaman and Nicobar Archipelago or through the Andaman Sea. Along both the paths the geometry of the coastline is complicated and it remains to be shown, with field data, that the coastal waves do indeed make their way into the Bay with sufficient amplitudes. Nonetheless, it seems plausible that at least some of the Kelvin waves would make their way into the Bay and excite the Rossby waves capable of forming a gyre. Also needed is empirical support to the possibility raised by McCreary et al. that upwelling favorable winds along the northeastem border of the Bay during the northeas't monsoon excite Kelvin waves which on reaching the east coast of India in March-April generate a polew ard boundary current. Does wind-induced upwelling occur in the northeastem Bay during the northeast monsoon? At present there are no data to answer this question.
954 SH•TYE ET AL.: WESTERN BOtn•DARY CURRE•rr OV BAY OV BENGAL
5. SUMMARY
There are impressive similarities between the pattern of barotropic circulation computed using curl of wind stress (Figure 10) and the pattern we have put together from the observations during March-April 1991 together with the available climatologies. The transport in the WBC computed using the theory that the circulation in the Bay is forced by the curl of wind stress is of the same order of magnitude as that estimated from the dynamic computations based on our March-April 1991 data. Whatever discrepancies that are seen may well be a result of imperfections either in the observations (transport estimated using dynamic computations and the assump- tion of level of no motion, inadequate spatial resolution in ship drift data, uncertainties in estimates of wind stress curl, etc.) or in the theory (bottom topography and nonlinearities have not been taken into accoun0. At this stage, though it is tempting to conclude that the Bay is driven mainly locally by wind stress curl, we note that the baroclinic transport field due to this driving has not yet been com- puted. This will need to be done and compared with observations before a definitive statement can be made regarding the role of local driving (by wind stress curl) vis-a-vis the role of remote driving proposed by the recent studies of Potemra et al. [1991], Yu et al. [1991], and J. McCreary et al. Also, these studies need to be put on timer footing by demonstrating through field observations the presence of sufficiently large amplitude coastal Kelvin waves along the rim of the Bay.
The main contribution of this paper is the synthesis of empirical evidence to show that a seasonal STG begins to form over the Bay during the northeast monsoon. The gyre occupies the region of the Bay north of about 10 ø N by January, it is best developed during February-April and decays by June.
Our data during March-April 1991 showed the characteristics of the WBC of this gyre. The current usually hugged the coast but occasionally moved offshore. Though not adequately resolved, the data suggested the presence of features often associated with WBC's: a recirculation zone, eddies, and waves. The transport in the WBC, about 10 x 106 m3/s, is much less than that of the larger gyres found in the North Pacific and the North Atlantic oceans, probably a consequence of the small size of the Bay. The gyre is unique because of its seasonal character, which in turn is a response to the characteristics of the atmospheric circulation over the North Indian Ocean.
Acknowledgments. P.N. Vinaychandran helped in the analysis. J. Mc- Creary carefully examined earlier versions of this manuscript and made many useful suggestions. Comments from S. Godfrey and J. Swallow were also helpful. The British Oceanographic Data Centre, Proudman Oceanographic Laboratory, Bidston, made available the Curer and Swallow (1984) atlas in digital form. A.Y. Mahale prepared the manuscript for publication. We are grateful for all the help.
REFERENCES
Breidenbach, J., EOFs of pseudo-stress over the Indian Ocean (1977-85), Bull. Am. Meteorol. Soc., 13, 1443-1454, 1990.
Chao, S. Y., Wind-driven motion of estuadne plumes, J. Phys. Oceanogr., 18, 1144-1166, 1988.
Cutler, A. N., and J.C. Swallow, Surface currents of the Indian Ocean (to 25 ø S, 100ø E): Compiled from historical data archived by the Meteorological Office, Braeknell, UK, Rep. 187, 36 charts, 8 pp., Inst. of Oceanogr. Sci., WormIcy, England, 1984.
Duing, W., The monsoon regime of the currents in the Indian Ocean, contrib. 330, 68 pp., Hawaii Inst. of Geophys., Univ. of Hawaii, East-West Center Press, Honolulu, 1970.
Gadgil, S., and J. Srinivasan, Low-frequency variation of tropical conver- gence zones, Meteorol. Atmos. Phys., 44, 119-132, 1990.
Hastenrath, S., and P. J. Lamb, Climatic Atlas of the Tropical Atlantic and Eastern Pacific Ocean, University of Wisconsin Press, Madison, 1977.
Hastenrath, S., and P. J. Lamb, Climatic Atlas of the Indian Ocean, Part I: Surface Climate and Atmospheric Circulation, 97 charts, 19 pp., Wiscon- sin University Press, Madison, 1979.
Hellermann, S., and M. Rosenstien, Normal wind stress over the world ocean with error estimates, J. Phys. Oceanogr., 13, 1093-1104, 1983.
Huang, R.X., The three-dimensional structure of wind-driven gyres: Ventila- tion and subduction, Rev. Geophys., 29, suppl., 590-609, 1991.
Legeckis, R., Satellite observations of a western boundary current in the Bay of Bengal, J. Geophys. Res., 92, 12,974-12,978, 1987.
Levitus, S., Climatological atlas of the world ocean, NOAA Prof. Pap. 13, 173 pp., U.S. Dep. of Commer., Washington, D.C., 1982.
McCreary, J., and P. K. Kundu, Westem boundary circulation driven by an alongshore wind: With application to the Somali current system, J. Mar. Res., 43,493-516, 1985.
Oort, A. H., Global atmospheric circulation statistics, 1958- 73,NOAA Prof. Pap. 14, 180 pp. U.S. Dep. of Cornmet., Washington, D.C., 1983.
Phillips, N., Large-scale eddy motions in the westem Ariantic, J. Geophys. Res., 71, 3883-3891, 1966.
Potemra, J.T., M. E. Luther, and J. J. O'Brien, The seasonal circulation of the upper ocean in the Bay of Bengal, J. Geophys. Res., 96, 12,667- 12,683.
Schott, F., Monsoon response of the Somali current and associated upwelling, Progr. Oceanogr., 12,357,381, 1983.
Shcherbinin, A.D., V. S. Arsen'yev, and Yu. A. Gol'din, The western boundary current of the Bay of Bengal, DoM. Acad. Sci. USSR, Earth Sci. Sect., Engl. Transl., 244, 167- 168.
Shetye, S. R., A.D. Gouveia, S.S. C. Shenoi, D. Sundar, G. S. Michael,_ A. M. Almeida, and K. Santanam, Hydrography and circulation off the west coast of India during the southwest monsoon 1987, J. Mar. Res., 48, 359-378, 1990.
Shetye S. R., S.S. C. Shenoi, A.D. Gouveia, G. S. Michael, D. Sundar, and G. Nampoothiri, Wind-driven coastal upwelling along the westem boundary of the Bay of Bengal during the southwest monsoon, Continen- tal ShelfRes., 11, 1397-1408, 1991.
Stommel, H., The western intensification of wind-driven ocean currents,Eos Trans. AGU, 29,202-206, 1948.
Yu, L., J. J. O'Brien, and J. Yang, On the remote forcing of the circulation in the Bay of Bengal, J. Geophys. Res., 96, 20, 449-20,454, 1991.
A.D. Gouveia, G. S. Michael, G. Nampoothiri, S.S. C. Shenoi, S. R. SheWe, and D. Sundar, Physical Oceanography Division, National Institute of Oceanography, Dona-Paula, Goa 403004, India.
(Received December 12 1991; revised June 22, 1992;
accepted June 24 1992.)