statistical handbook west bengal 2014
274
-
Upload
khangminh22 -
Category
Documents
-
view
1 -
download
0
Transcript of statistical handbook west bengal 2014


STATISTICAL
HANDBOOK
WEST BENGAL 2014
Bureau of Applied Economics & Statistics
Department of Statistics & Programme Implementation
Government of West Bengal
PREFACE
Statistical Handbook, West Bengal provides information on salient features of various socio-economic aspects of the State. The data furnished in its previous issue have been updated to the extent possible so that continuity in the time-series data can be maintained.
I would like to thank various State & Central Govt. Departments and organizations for active co-operation received from their end in timely supply of required information.
The officers and staff of the Reference Technical Section of the Bureau also deserve my thanks for their sincere effort in bringing out this publication.
It is hoped that this issue would be useful to planners, policy makers and researchers.
Suggestions for improvements of this publication are most welcome.
Tapas Kr. Debnath
Joint Administrative Building, Director
Salt Lake, Kolkata. Bureau of Applied Economics & Statistics
30th December, 2015 Government of West Bengal

Table No. Page
1.0 11.1
21.2
31.3
41.4
6
1.5 7
1.5(a) 81.5(b)
workers to total population in West Bengal, 2001 & 2011 91.6 10-251.7
26-631.8 641.9 65
1.10 661.11 67
2.068
2.0(a)69
2.1 702.2 722.3 73
3.0 743.0(a)
753.1 763.2
773.3
783.4
Institutions in West Bengal 79
Ranking of Districts on the basis of percentage of main
I. Area and Population
Population of CD Blocks in West Bengal by District (As Per Census 2011)
Density of Population, Sex Ratio and Percentage Share of Urban Population in West Bengal by DistrictPopulation, Literacy rate by Sex and Density, Decennial Growth rate in West Bengal by District (Census 2011)
Administrative Units in West Bengal - 2014Villages, Towns and Households in West Bengal,
Districtwise Population by Sex in West Bengal, Census 2011
III. Education
Birth and Death Rates based on Three-Year Average for West Bengal
CONTENTS
West Bengal
Population of Cities, Towns and Urban Outgrowths in West Bengal by District, Census 2011
II. Medical and Public HealthBirth (live), Death and Infant Mortality Rates for
Number of Workers and Non-workers in West Bengal, 2011Work Participation Rate (main + marginal) in West Bengal, 2001
Census 2011
Annual Estimates of Population of West BengalDistribution of Population by Religious communities in West BengalDistrictwise Educational Facilities in West Bengal, Census 2011Districtwise Medical Facilities in West Bengal, Census 2011
Registered Medical Practitioners in West BengalMedical Facilities in West Bengal
Districtwise Status of Rural Water Supply Coverage
Literacy Rate in West Bengal by DistrictLiteracy Rate among Scheduled Castes and Scheduled Tribes in West Bengal by District, Census, 2011Number of Schools in West BengalNumber of Schools in West Bengal under Anglo- Indian School CategoryEnrolment in General Educational Institutions by Stage in West BengalNumber of Teachers in General Educational
i

4.0 80
5.0 815.1 82-835.2 84-855.3
Cropping Intensity in West Bengal 865.4 87-895.5 Districtwise Area and Production of Principal Crops
in West Bengal 90-995.6 Yield Rates of Principal Crops in West Bengal 1005.7 Area and Production of Fruits and Vegetables in 101-102
West Bengal5.8 Area and Production of Flowers in West Bengal 1035.9 Index Number of Agricultural Area under Selected Crops
in West Bengal (Base : Triennium ending crop year 1981-82 = 100) 1045.10 Index Number of Agricultural Production of selected
Crops in West Bengal (Base : Triennium ending 105crop year 1981-82 = 100)
5.11 Index Number of Agricultural Productivity of selectedCrops in West Bengal (Base : Triennium endingcrop year 1981-82 = 100) 106
5.12 Index Number of Agricultural Area, Production,Productivity, Cropping Pattern, Cropping Intensity,Productivity per hectare of Net Area Sown of Selected Crops and Net Area Sown in West Bengal (Base : Triennium ending crop year 1981-82 = 100) 107
6.0 Classification of Forest Area by Status in West Bengal 108
6.1 Out-turn of Timber and Firewood from Forest in West Bengal 109
6.2 Out-turn of Minor Forest Produce in Forest Areas ofWest Bengal 110
7.0 Livestock in West Bengal 1117.1 Estimated Production of Milk and Eggs in
West Bengal 1127.2 Production of Fish and Fishseed in West Bengal 1137.3 Estimated Production of Meat in West Bengal 114
8.0 Categorywise Number of Veterinary Institutions and the Number of Animals Treated in West Bengal 115
8.1 Different Categories of Veterinary Institutions in West Bengal 116
VI. Forest
VII. Livestock and Fisheries
V. Agriculture
IV. ClimateAnnual Rainfall in West Bengal
Classification of Area in West BengalUtilisation of Land in West Bengal by District Area under Principal Crops in West BengalNet Cropped Area, Gross Cropped Area and
Production of Principal Crops in West Bengal
VIII. Veterinary
ii
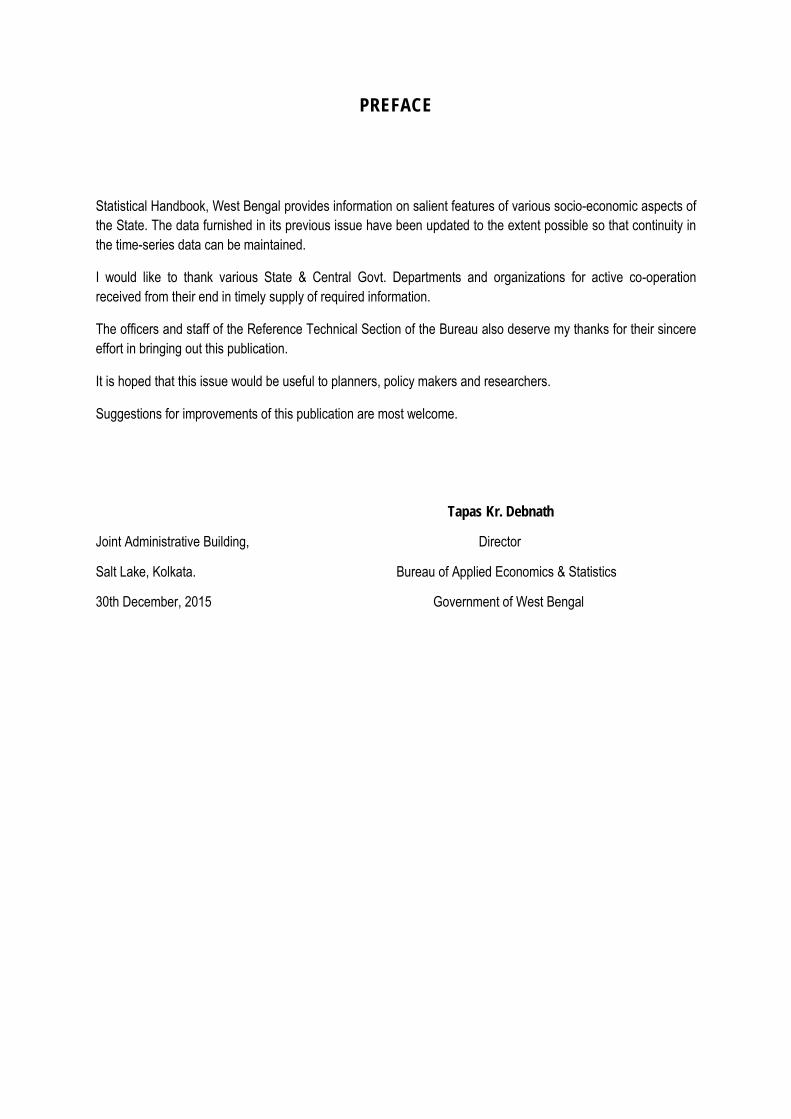
(i) Electricity9.0 Installed Electricity Generating Capacity(derated) in
West Bengal (excluding N.T.P.C.) 1179.0(a) Gross Generation of Electricity in West Bengal
(excluding N.T.P.C.) 1189.1 Sales of Electricity in West Bengal 1199.2 Districtwise No. of Villages Electrified in
West Bengal 120(ii) Mineral Production
9.3 Production and Value of Minerals of West Bengal 1219.4 Coal and Coke Products Supplied to Different
Industries in West Bengal 122
10.0 Number of Major Industries in West Bengal 12310.1 Economic Structure of Factories under Annual
Survey of Industries in West Bengal (Census andNon- Census Sectors) 124
10.2
Small Scale enterprises in West Bengal by District 12510.3 Industrial Production in West Bengal 12610.4 Index of Industrial Production of West Bengal by Sector
(Base : 2004-05 = 100) 12710.4(a) Index of Industrial Production of West Bengal by Use
Based Classes of Goods(Base : 2004-05 = 100 ) 12810.4(b) Monthly Index of Industrial Production of West Bengal
by Sector (Base : 2004-05 = 100) 129
11.0 Estimated Employment in Public and Private Sectorsin West Bengal 130
11.1 Number of Workers Employed in Major Industries in West Bengal 132
11.2 Average Number of Persons Employed Daily in and about the Coal Mines in West Bengal 133
11.3 Average Number of Persons Employed Daily in Plantations (Tea) in West Bengal 134
11.4 Estimated Average Daily Employment in Shops, Commercial Establishments, Cinemas etc. in West Bengal 135
11.5 Employment in the Small Scale Industrial unit Filed
13611.6 Employment through Employment Exchanges in
West Bengal 13711.7 Industrial Disputes in West Bengal 138
12.0 Incidence of Major Cognizable Crimes (IPC) under differentCrime Heads in Kolkata and Suburbs 139
IX. Mines and Power
X. Industry
XI. Employment and Labour
XII. Crimes
Entrepreneur Memorandum to the Directorate of Micro and Number of Small Scale Industrial Units Filed
Entrepreneur Memorandum to the Directorate of Micro and Small Scale enterprises in West Bengal by Districts
iii

13.0 Sanctioned Strength of Civil Police in West Bengal and Expenditure thereof 140
13.1 Expenditure on Civil Defence, Home Guards,N.C.C. and N.V.F. in West Bengal 141
13.2 Number of Stations, Staff Strength and Expenditure on Fire Services in West Bengal 142
14.0 Number, Income and Expenditure of different Local Bodies in West Bengal 143-144
15.0 Length of Roads under the control of Public Works and Public Works (Roads) Departments in West Bengal 145
15.0(a) Length of Roads Maintained by Public Works Department andPublic Works Department(Roads) according to Category in West Bengal 146
15.1 Length of Roads Maintained by Municipalities andMunicipal Corporations in West Bengal 147
15.1(a) Estimated Districtwise Length of Roads Maintained by ZillaParishads, Panchayat Samities and Gram Panchayats in West Bengal 148-151
15.2 Post Offices, Telegraph Offices and Telephone Facilities in West Bengal 15215.3 Estimated Number of Registered Motor Vehicles in West Bengal 153
15.3(a) Estimated Number of Registered Motor Vehicles in Kolkata 15415.4 Important Activities of State Transport Undertakings
in West Bengal 155-15815.5 Summary of the Important Activities of West Bengal
Surface Transport Corporation (Launch Service) 15915.6 Activities of the Calcutta Tramways Company Limited 160
16.0 Foreign Trade at Kolkata Port (Sea & Air) 16116.1 Inflow of Goods to West Bengal from
other States by Rail & River 16216.2 Outflow of Goods from West Bengal to other
States by Rail & River 163
17.0 Status of Banking Operation in West Bengal 16417.0(a) Deposits and Advances of Scheduled Commercial Banks 165
18.0 Life Insurance Business in West Bengal in Different years 167
XV. Transport and Communication
XVI. Trade
XVII. Banking
XVIII. Insurance
XIII. Police, Civil Defence and Fire Service
XIV. Local Bodies
iv
19.0 Joint Stock Companies at Work in West Bengal 16819.1 Joint Stock Companies Registered and Gone into Liquidation
or Struck Off from the Register in West Bengal in Different years 169
20.0 Number, Membership and Financial Position of Co-operativeSocieties of West Bengal in Different years 170
21.0 Index Number of Wholesale Prices of Agricultural Commodities in Kolkata (Base : 1980-81 = 100) 171-173
21.1 Index Numbers of Wholesale Prices of Agricultural Commodities in Kolkata (Base : 2000-2001 = 100) 174
21.2 Consumer Price Index Numbers for Rural, Urban & Combined(Base : 2010 =100) 175-178
21.3 Consumer Price Index Numbers of different Articles in Kolkata (Base : 2006-07 = 100) 179-182
21.4 Consumer Price Index Numbers in Kolkata by monthlyfamily expenditure level (Base : 2006-07 = 100) 183
21.5 Consumer Price Index Numbers for Industrial workers ofdifferent Centres in West Bengal(Base : 1982 = 100) 184
21.6 Consumer Price Index Numbers for Industrial workers ofdifferent Centres in West Bengal(Base : 2001 = 100) 185
21.7 Consumer Price Index numbers for Agricultural Labourers, Centres inWest Bengal (Base: 1986-87 = 100) 187
22.0 Budgetary Position (Actual) of the Government of West Bengal 189
22.1 Estimates of Net State Domestic Product of West Bengal by Industry of Origin at Current Prices (2004-05) 190
22.2 Estimates of Net State Domestic Product of West Bengal by Industry of Origin at Constant Prices(2004-05) 191
22.3 Estimates of Gross State Domestic Product of West Bengalby Industry of origin at Current Prices (Base 2004-05) 192
22.4 Estimates of Gross State Domestic Product of West Bengalby Industry of origin at Constant Prices (Base 2004-05) 193
22.5 Estimates of Gross District Domestic Product of West Bengal by Industry of origin at Current (Base 2004-05)Prices 194-195
22.6 Estimates of Gross District Domestic Product of West Bengal by Industry of origin at Constant (Base 2004-05) Prices 196-197
22.7 Net Collection from Small Savings in West Bengal and India 198
XX. Co-operative Societies
XXI. Prices
XIX. Joint Stock Companies
XXII. Finance
v

23.0 Outlay and Expenditure under the 10th Five-YearPlan (2002-07) by Major Heads of Development in West Bengal 199
23.1 Outlay and Expenditure under the 11th Five-Year Plan (2007-12) by Major Heads of Development inWest Bengal 200
23.2 Outlay and Expenditure under the 11th Five-Year Plan (2007-12) by Major Heads of Development in West Bengal 201-202
23.3 Outlay and Expenditure under the 12th Five-YearPlan (2012-17) in West Bengal 203-204
23.4 Movement in (Per Capita) Plan Expenditure in West Bengal 205
24.0 Districtwise Important Tourist Spots with Distance from Kolkata and Number of Beds in different types of LodgesMaintained by different Govt. Departments 206-213
24.0(a) Number of Beds in Different Types of Lodges Maintained by Different Govt. Departments of West Bengal in Other States of India 214
24.1 Countrywise Foreign Tourist Arrivals in West Bengal 215
25.0 Number of Newspapers and Periodicals by types in West Bengal 21625.1 Number of Radio Stations and T.V. Transmitting
Centres in West Bengal 21725.2 Libraries, Reading Rooms and Total Library Centres
in West Bengal 218
XXIII. Five-Year Plans
XXIV Tourism
XXV. Miscellaneous
vi

I. Distribution of Population, Sex Ratio, Density and DecadalGrowth Rate of Population, 2001 219
IA. Distribution of Population, Sex Ratio, Density and DecadalGrowth Rate of Population,2011 220
II. Literacy Rates in Major States and All India 221 IIA. Literacy Rates by Sex in Major States and All India 222III. Total Population, Main Workers, Marginal Workers
by Major States in India, Census 2011 223IIIA. Percentage distribution of Workers to total Population
by Major States in India, Census 2011 224IV. Percentage distribution of total Workers by broad
Industrial Categories for Major States in India, Census 2011 225V. Distribution of Migrants per 1000 Population by reason for
migration for Major States 226-227VI. Average Monthly Per Capita Expenditure on Broad
Groups of Items by Major States (NSS 68th Round) 228-229VII. Percentage Distribution of Average Monthly Per Capita
Expenditure(MPCE) on Broad Groups of Items of Consumption by Major States(NSS 68th Round) 230-231
VIII. Total Cropped Area, Net Area Sown and Cropping Intensity in Major States of India 232
IX. Production of Foodgrains by Major States of India 233X. Percentage Distribution of Owner Households and
Area Owned over Five Broad Size Classes of Holding in Major States and All India 234-235
XI. Changes in Percentage Distribution of Operational Holdings and Area Operated by Size Classes of Operational Holdings in Major States and All India 236-237
XII. Registered Factories Covered by Annual Survey of Industries for Major State (Factory Sector) in India 238
XIII. Value of Minerals and Ores Produced in Major States of India 239
XIV. Student Enrolment in Educational Indstitution in Major States of India, 2011-12 240
XV. Educational Institutions in Major states of India, 2011-12 241XVI. Dropout Rates in Major States of India, 2011-12 242XVII. Pupil Teacher Ratio by Stages of Education in Major
States of India 243
APPENDICES
vii

XVIII. Average annual expenditure per student of age 5-29 yearspursuing education by type and level of education in majorstates of India(NSS 64th Round) 244
XIX. Gross Enrolment Ratio (GER) in Major States of India 245XX. Installed Capacity, Gross Energy Generated, Energy
Sold and Per Capita Consumption of Energy in Major States of India 246
XXI. Percentage of Villages Electrified in Major States of India 247
XXII. Small Savings Collections by Major States 248XXIII. Plan and Non-Plan Expenditure in Major States
of India 249XXIV. State Tax Revenue and Share in Centrally Levied Taxes
in some Major States of India 250XXV. Developmental Expenditure in Major States of India 251XXVI. Estimated Number of Manufacturing Enterprises
in India (NSS 67th Round). 252XXVI. (Contd.) Unorganised Manufacturing Enterprises in India (NSS 62nd Round). 253
XXVII. Estimated Number of Trading Enterprises in India (NSS 67th Round). 254
XXVIII. Estimated Number of 'Other Service' Enterprises in India (NSS 67th Round). 255
XXIX. Estimated Number of workers in Manufacturing Sector in India (NSS 67th Round). 256
XXX. Estimated Number of workers in Trading Sector in India (NSS 67th Round). 257
XXXI. Estimated Number of workers in 'Other Services' Sector in India (NSS 67th Round). 258
XXXII.259
XXXIII. Access to Safe Drinking Water: Status of Households in India by Majore States. 260
Figure 1 Density of Population in West Bengal 5Figure 2 Population Served per Doctor in West Bengal 71Figure 3 Total Foodgrains productions in West Bengal 88 Figure 4 Estimated Employment in Private and Public Sectors in West Bengal 131Figure 5 166
Figure 6 186
Figure 7 188
GRAPH
Deposits and Advances of Scheduled and Commercial Banks in West Bengal
Consumer Price Index Numbers for Industrial Workers in West Bengal(Base 2000-01=100)Consumer Price Index Numbers for Agricultural Labours in West Bengal(Base 1986-87=100)
Estimated Domestic and Foriegn Tourist Arrivals in States and UT's of India.
viii

.. = Not available
– = Negligible or nil
P = Provisional
I = Incomplete in coverage
R = Revised
Sum of individual breakups may not tally with total due to rounding off problem.
SYMBOLS – The following symbols have been used in this
publication
ix

Subdivision Police Station # Development Blocks
Panchayat Samiti
Gram Panchayat Villages Municipalities MC
(2) (3) (4) (5) (6) (7) (8) (9)66 487(20) 341 333 3349 40218 121 627 182 (10) 164 164 1524 25009 46 36 35(2) 31 31 277 2502 9 23 23(1) 19 19 167 2458 6 -3 24(1) 22 22 190 3823 3 -4 23(1) 25 25 223 2998 5 -4 30(2) 29 29 290 8695 8 -4 25(2) 18 18 207 1866 12 13 22(1) 20 20 170 2667 3 -
21 227(6) 108 108 1108 7697 53 25 45(2) 22 22 200 1528 27 -5 36(2) 29 29 310 2044 7 -- 78 - - - - - 12 19(1) 14 14 157 650 2 14 22(1) 17 17 187 1308 10 -5 27 26 26 254 2167 7 -
18 78 (4) 69 61 717 7512 22 12 9 9 9 98 1494 4 -2 8 8 8 65 1631 2 -2 12(1) 15 15 146 1772 2 -3 18(1) 13 13 146 733 4 -4 20(2) 12 4 134 688 4 15 11 12 12 128 1194 6 -
# 20 Women Police Stations are mentioned in parenthesis but excludes 43 G.R.P. of Sealdah, Howrah, Kharagpur & Siliguri
Purba Mednipur
TABLE-1.0Administrative Units in West Bengal-2014
NumberDivision and District
(1)West BengalBurdwan DivisionBurdwan BirbhumBankura
Uttar Dinajpur
Paschim MednipurHooglyPuruliaPresidency DivisionNorth 24- ParganasSouth 24-ParganasKolkataHowrahNadiaMurshidabadJalpaiguri Division
(3) Directorate of Police, Govt of West Bengal
Dakshin DinajpurMaldaJalpaiguriDarjeelingCooch Behar
Sources: :(1) Directorate of Panchayat & Rural Development, Govt of West Bengal (2) Primary Census Abstract, 2011
State Statistical Handbook 2014 1

(Number)
Municipal Non-Municipal
(1) (2) (3) (4) (5)West Bengal 37469 20380118 127 785Burdwan Division 23075 7586758 49 231Burdwan 2418 1730927 11(a) 88Birbhum 2242 817899 6 14Bankura 3585 766905 3 9Purba Medinipur 2929 1114170 5 20Paschim Medinipur 7600 1301610 8 11Hooghly 1842 1287423 13(a) 64Purulia 2459 567824 3 25Presidency Division 7258 9019009 55 446North 24-Parganas 1518 2348483 27 80(c)South 24-Parganas 1994 1781221 7 111Kolkata - 1024928 17 -Howrah 644 1061336 3(a) 135Nadia 1216 1232282 10 55(b)Murshidabad 1886 1570759 7 65Jalpaiguri 7136 3774351 23 108Uttar Dinajpur 1475 605674 4 5Dakshin Dinajpur 1582 396406 2 5Malda 1613 846991 2 27Jalpaiguri 718 868326 4 35Darjeeling 616 391234 5(a) 24(b)Cooch Behar 1132 665720 6 12(a) Includes Municipal Corpn.
(b) Includes Notified Area.
(c) Includes one Cantonment Board & ITS
Source : Primary Census Abstract 2011
TABLE-1.1Villages, Towns and Households in West Bengal
Census 2011
Division and District
Inhabited Villages
2011
Households 2011
Towns (Census 2011)
State Statistical Handbook 2014 2

(Number)
Male Female Total Rural Urban(1) (2) (3) (4) (5) (6) (7)
West Bengal 88752 46809027 44467088 91276115 62183113 29093002Burdwan 7024 3966889 3750674 7717563 4639264 3078299Birbhum 4545 1790920 1711484 3502404 3052956 449448Bankura 6882 1838095 1758579 3596674 3296901 299773Purba Medinipur 4713 2629834 2466041 5095875 4503161 592714Paschim Medinipur 9368 3007885 2905572 5913457 5190771 722686Hooghly 3149 2814653 2704492 5519145 3390646 2128499Purulia 6259 1496996 1433119 2930115 2556801 373314North 24-Parganas 4094 5119389 4890392 10009781 4277619 5732162South 24-Parganas 9960 4173778 3988183 8161961 6074188 2087773Kolkata 185 2356766 2139928 4496694 - 4496694Howrah 1467 2500819 2349210 4850029 1775885 3074144Nadia 3927 2653768 2513832 5167600 3728727 1438873Murshidabad 5324 3627564 3476243 7103807 5703115 1400692Uttar Dinajpur 3140 1551066 1456068 3007134 2644906 362228Dakshin Dinajpur 2219 857199 819077 1676276 1439981 236295Malda 3733 2051541 1937304 3988845 3447185 541660Jalpaiguri 6227 1983064 1889782 3872846 2812495 1060351Darjeeling 3149 937259 909564 1846823 1118860 727963Cooch Behar 3387 1451542 1367544 2819086 2529652 289434
TABLE-1.2Districtwise Population by Sex in West Bengal, Census 2011
DistrictPopulation
Source : Primary Census Abstract, 2011.
Area in Sq. Km.(P)
State Statistical Handbook 2014 3

2001 2011 2001 2011 2001 2011(1) (2) (3) (4) (5) (6) (7)
West Bengal 903 1028 934 950 27.97 31.87Burdwan 982 1099 922 945 36.94 39.89Birbhum 663 771 950 956 8.57 12.83Bankura 464 523 952 957 7.37 8.33Purba Medinipur 1081 938 11.63Paschim Medinipur 631 966 12.22Hooghly 1601 1753 947 961 33.47 38.57Purulia 405 468 954 957 10.07 12.74North 24-Parganas 2182 2445 926 955 54.30 57.27South 24-Parganas 693 819 937 956 15.73 25.58Kolkata 24718 24306 829 908 100.00 100.00Howrah 2913 3306 906 939 50.36 63.38Nadia 1173 1316 946 947 21.27 27.84Murshidabad 1102 1334 952 958 12.49 19.72Uttar Dinajpur 778 958 938 939 12.06 12.05Dakshin Dinajpur 677 755 951 956 13.10 14.10Malda 881 1069 948 944 7.32 13.58Jalpaiguri 546 622 942 953 17.84 27.38Darjeeling 511 586 937 970 32.34 39.42Cooch Behar 732 832 949 942 9.10 10.27
Sources : Primary Census Abstract 2011.
TABLE-1.3Density of Population, Sex Ratio and Percentage Share of Urban Population in West Bengal by District
Division/DistrictSex Ratio
( Females per 1000 Males)Percentage Share of
Urban Population
592 955 10.24
Density per Square Kilometre
State Statistical Handbook 2014 4

2001 2011Burdwan 982 1099Birbhum 663 771Bankura 464 523Purba Medinipur 1028 1076Paschim Medinipur 531 633Hooghly 1601 1753North 24-Parganas 2182 2445South 24-Parganas 693 819Kolkata 24718 24306Howrah 2913 3306Nadia 1173 1316Murshidabad 1102 1334Uttar Dinajpur 778 958Dakshin Dinajpur 677 755Malda 881 1069Jalpaiguri 546 622Darjeeling 511 586Cooch Behar 732 832Purulia 405 468
0
5000
10000
15000
20000
25000
2001 2011
Figure 1 : Density of population in West Bengal
(Pop
ulat
ion
perS
quar
e Km
.)
State Statistical Handbook 2014 5
Male Female Total Male Female Total(1) (2) (3) (4) (5) (6) (7) (8)
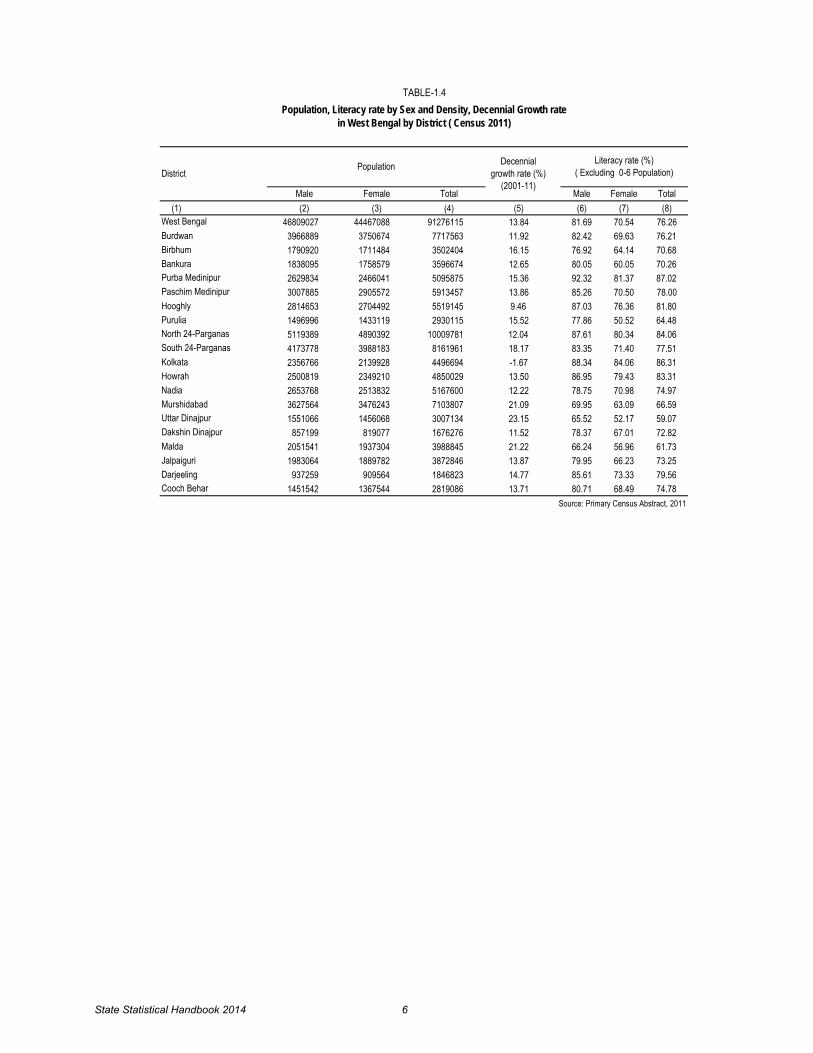
West Bengal 46809027 44467088 91276115 13.84 81.69 70.54 76.26Burdwan 3966889 3750674 7717563 11.92 82.42 69.63 76.21Birbhum 1790920 1711484 3502404 16.15 76.92 64.14 70.68Bankura 1838095 1758579 3596674 12.65 80.05 60.05 70.26Purba Medinipur 2629834 2466041 5095875 15.36 92.32 81.37 87.02Paschim Medinipur 3007885 2905572 5913457 13.86 85.26 70.50 78.00Hooghly 2814653 2704492 5519145 9.46 87.03 76.36 81.80Purulia 1496996 1433119 2930115 15.52 77.86 50.52 64.48North 24-Parganas 5119389 4890392 10009781 12.04 87.61 80.34 84.06South 24-Parganas 4173778 3988183 8161961 18.17 83.35 71.40 77.51Kolkata 2356766 2139928 4496694 -1.67 88.34 84.06 86.31Howrah 2500819 2349210 4850029 13.50 86.95 79.43 83.31Nadia 2653768 2513832 5167600 12.22 78.75 70.98 74.97Murshidabad 3627564 3476243 7103807 21.09 69.95 63.09 66.59Uttar Dinajpur 1551066 1456068 3007134 23.15 65.52 52.17 59.07Dakshin Dinajpur 857199 819077 1676276 11.52 78.37 67.01 72.82Malda 2051541 1937304 3988845 21.22 66.24 56.96 61.73Jalpaiguri 1983064 1889782 3872846 13.87 79.95 66.23 73.25Darjeeling 937259 909564 1846823 14.77 85.61 73.33 79.56Cooch Behar 1451542 1367544 2819086 13.71 80.71 68.49 74.78
TABLE-1.4
DistrictPopulation Literacy rate (%)
( Excluding 0-6 Population)
Source: Primary Census Abstract, 2011
Population, Literacy rate by Sex and Density, Decennial Growth rate in West Bengal by District ( Census 2011)
Decennial growth rate (%)
(2001-11)
State Statistical Handbook 2014 6

(In thousand)
(1) (2) (3) (4)1. Main workers 21678(46.31) 4009(9.01) 25687(28.14)(i) Cultivators 3941(8.42) 263(0.59) 4204(4.61)(ii) Agricultural Labourers 4943(10.56) 926(2.08) 5869(1.66)(iii) Household Industry workers 869(1.86) 649(1.46) 1518(1.66)(iv)Other workers 11926(25.48) 2169(4.88) 14095(15.44)2. Marginal workers 5039(10.76) 4032(9.06) 9071(9.94)(i) Cultivators 560(1.20) 353(0.79) 913(1.00)(ii) Agricultural Labourers 2510(5.36) 1810(4.07) 4320(4.73)(iii) Household Industry workers 246(0.52) 700(1.57) 946(1.04)(iv)Other workers 1723(3.68) 1169(2.63) 2892(3.17)3. Total workers 26717(57.07) 8041(18.07) 34758(38.08)(i) Cultivators 4501(9.62) 616(1.38) 5117(5.61)(ii) Agricultural Labourers 7453(15.92) 2736(6.15) 10189(6.39)(iii) Household Industry workers 1115(2.38) 1349(3.03) 2464(2.70)(iv)Other workers 13649(29.16) 3338(7.51) 16987(18.61)4. Non-workers 20093(42.93) 36427(81.92) 56520(61.92)Note: The figures in parentheses indicate percentage to
total population of the respective category.Source: Primary Census Abstract, 2011
TABLE 1.5Number of Workers and Non-workers in West Bengal, 2011
Industrial Categories Male Female Total
State Statistical Handbook 2014 7

Total General Scheduled Caste
Scheduled Tribes
(1) (2) (3) (4) (5)West Bengal 36.8 35.2 38.8 48.8Burdwan 35.5 32.8 39.3 48.8Birbhum 37.4 33.3 42.7 53.2Bankura 44.7 40.2 50.0 53.9Midnapore 39.0 37.4 39.8 51.8Hooghly 36.9 34.9 40.1 52.7Purulia 44.5 42.9 42.4 51.8North 24 Parganas 33.4 32.9 34.6 42.2South 24 Parganas 32.5 31.6 33.9 43.0Kolkata 37.6 37.5 37.8 38.3Howrah 33.7 33.5 34.3 48.0Nadia 35.1 34.8 34.9 44.8Murshidabad 34.2 33.8 35.8 46.6Uttar Dinajpur 38.3 35.7 17.0 49.5Dakshin Dinajpur 40.8 36.1 42.7 53.1Malda 40.7 39.7 41.5 50.7Jalpaiguri 38.3 35.8 39.6 41.6Darjeeling 35.4 34.6 34.6 40.9Cooch Behar 39.0 36.9 41.0 42.4
TABLE-1.5 (a)Work Participation Rate (main + marginal) in West Bengal, 2001
State/DistrictWork Participation Rate
Source: Census of India
State Statistical Handbook 2014 8

Work Participation
Rate
Work Participation
Rate2011 2001
(1) (2) (3) (4) (5)1 Kolkata 35.06 Kolkata 35.51 12 Cooch Behar 31.44 Dakshin Dinajpur 31.35 23 Dakshin Dinajpur 31.41 Nadia 30.53 34 Hooghly 31.07 Cooch Behar 30.43 45 Nadia 30.88 Hooghly 30.31 56 Howrah 30.85 Jalpaiguri 30.15 67 North 24 Parganas 30.53 Darjeeling 29.76 78 Jalpaiguri 29.79 Bankura 29.57 89 Darjeeling 28.85 Malda 29.39 910 Murshidabad 28.46 North 24 Parganas 29.36 1011 Burdwan 28.08 Uttar Dinajpur 29.34 1112 Uttar Dinajpur 27.41 Howrah 28.67 1213 Maldah 26.35 Murshidabad 28.51 1314 Birbhum 26.06 Burdwan 27.59 1415 Paschim Medinipur 25.54 Birbhum 27.58 1516 Bankura 25.48 Midnapore 17.00 1617 South 24 Parganas 24.55 Purulia 25.45 1718 Purba Medinipur 22.12 South 24 Parganas 24.30 1819 Purulia 20.93
West Bengal 28.14 West Bengal 28.72Source: Primary Census Abstract, 2011
TABLE-1.5 (b)Ranking of Districts on the basis of Percentage of Main Workers
to Total Population in West Bengal, 2001 & 2011
Rank in 2011 District District
Rank in 2001
State Statistical Handbook 2014 9
Rural
Male Female Total(1) (2) (3) (4) (5) (6) (7)
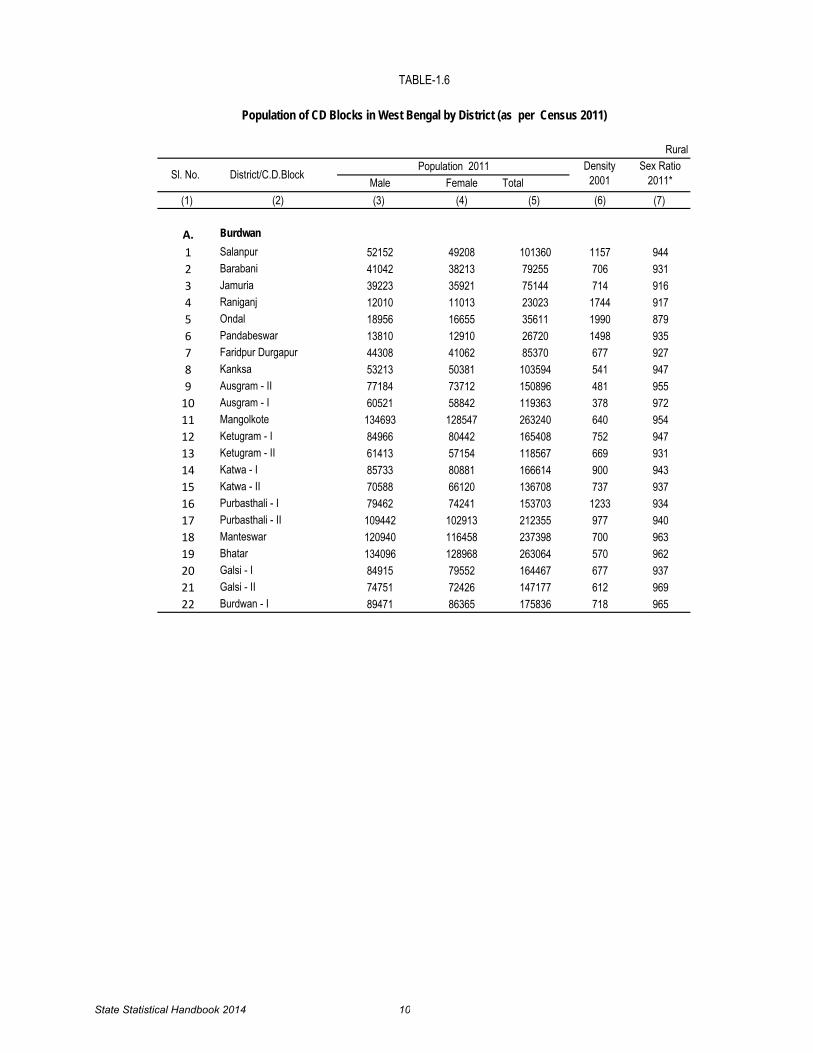
A. Burdwan1 Salanpur 52152 49208 101360 1157 9442 Barabani 41042 38213 79255 706 9313 Jamuria 39223 35921 75144 714 9164 Raniganj 12010 11013 23023 1744 9175 Ondal 18956 16655 35611 1990 8796 Pandabeswar 13810 12910 26720 1498 9357 Faridpur Durgapur 44308 41062 85370 677 9278 Kanksa 53213 50381 103594 541 9479 Ausgram - II 77184 73712 150896 481 955
10 Ausgram - I 60521 58842 119363 378 97211 Mangolkote 134693 128547 263240 640 95412 Ketugram - I 84966 80442 165408 752 94713 Ketugram - II 61413 57154 118567 669 93114 Katwa - I 85733 80881 166614 900 94315 Katwa - II 70588 66120 136708 737 93716 Purbasthali - I 79462 74241 153703 1233 93417 Purbasthali - II 109442 102913 212355 977 94018 Manteswar 120940 116458 237398 700 96319 Bhatar 134096 128968 263064 570 96220 Galsi - I 84915 79552 164467 677 93721 Galsi - II 74751 72426 147177 612 96922 Burdwan - I 89471 86365 175836 718 965
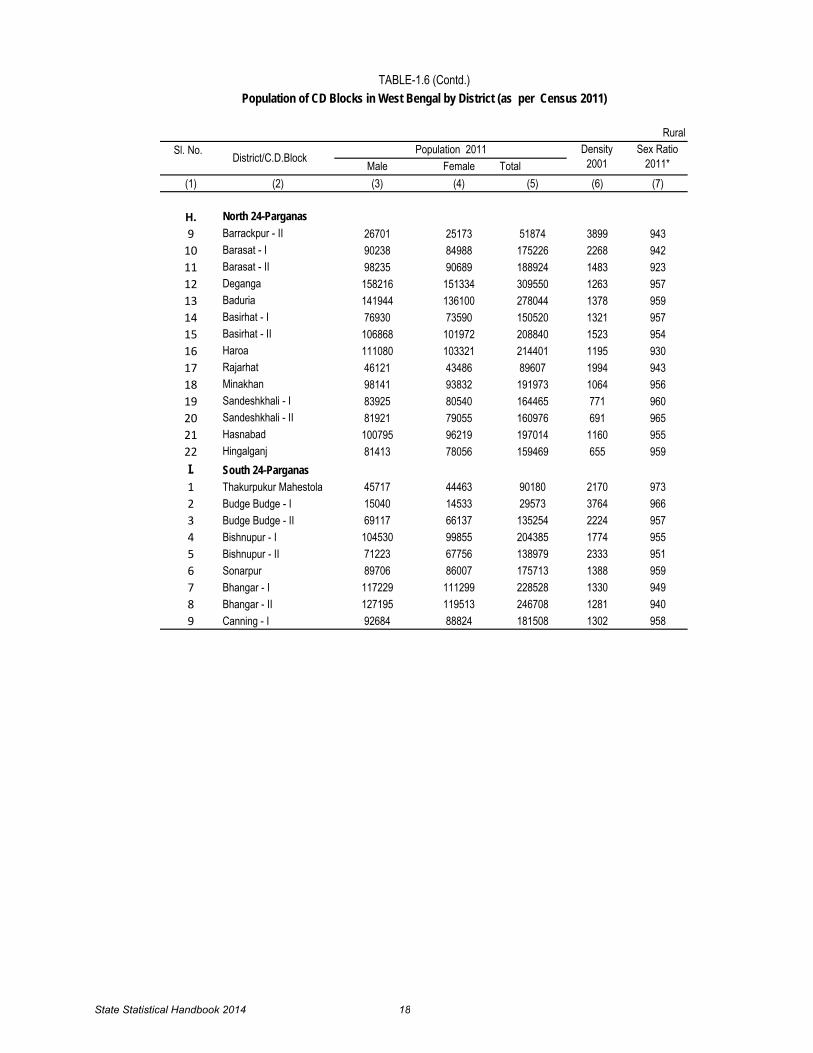
TABLE-1.6
Population of CD Blocks in West Bengal by District (as per Census 2011)
Sl. No. District/C.D.BlockPopulation 2011 Density
2001Sex Ratio
2011*
State Statistical Handbook 2014 10
Rural
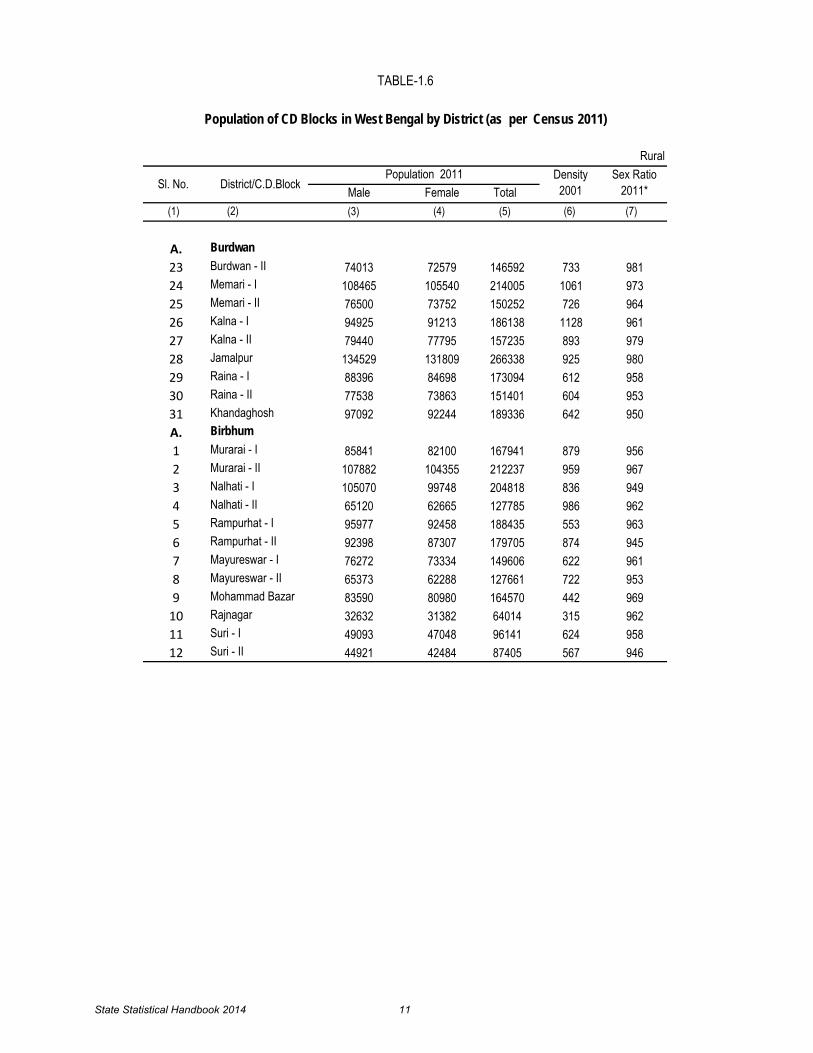
Male Female Total
A. Burdwan23 Burdwan - II 74013 72579 146592 733 98124 Memari - I 108465 105540 214005 1061 97325 Memari - II 76500 73752 150252 726 96426 Kalna - I 94925 91213 186138 1128 96127 Kalna - II 79440 77795 157235 893 97928 Jamalpur 134529 131809 266338 925 98029 Raina - I 88396 84698 173094 612 95830 Raina - II 77538 73863 151401 604 95331 Khandaghosh 97092 92244 189336 642 950A. Birbhum1 Murarai - I 85841 82100 167941 879 9562 Murarai - II 107882 104355 212237 959 9673 Nalhati - I 105070 99748 204818 836 9494 Nalhati - II 65120 62665 127785 986 9625 Rampurhat - I 95977 92458 188435 553 9636 Rampurhat - II 92398 87307 179705 874 9457 Mayureswar - I 76272 73334 149606 622 9618 Mayureswar - II 65373 62288 127661 722 9539 Mohammad Bazar 83590 80980 164570 442 969
10 Rajnagar 32632 31382 64014 315 96211 Suri - I 49093 47048 96141 624 95812 Suri - II 44921 42484 87405 567 946
TABLE-1.6
Population of CD Blocks in West Bengal by District (as per Census 2011)
Sl. No. District/C.D.BlockPopulation 2011 Density
2001Sex Ratio
2011*(1) (2) (7)(3) (4) (5) (6)
State Statistical Handbook 2014 11

Rural
Male Female Total
B. Birbhum13 Sainthia 95444 90663 186107 577 95014 Labpur 101015 95467 196482 660 94515 Nanoor 109495 103892 213387 621 94916 Bolpur Sriniketan 96723 93670 190393 532 96817 Illambazar 83056 78528 161584 555 94518 Dubrajpur 92956 88481 181437 461 95219 Khoyrasol 79118 74130 153248 496 937C. Bankura1 Saltora 69732 66248 135980 389 9502 Mejhia 44575 41613 86188 467 9343 Gangajalghati 93252 87722 180974 442 9414 Chhatna 96797 92915 189712 378 9605 Indpur 80556 75966 156522 455 9436 Bankura - I 55079 52606 107685 560 9557 Bankura - II 72302 68562 140864 559 9488 Barjora 90624 85639 176263 455 9459 Sonamukhi 81610 77087 158697 376 945
10 Patrasayer 93614 90456 184070 509 96611 Indus 86697 83086 169783 599 95812 Kotulpur 92114 88178 180292 669 95713 Jaypur 80138 76782 156920 536 95814 Vishnupur 79941 76881 156822 439 96215 Onda 129248 123736 252984 368 95716 Taldangra 74999 72894 147893 368 972
TABLE-1.6 (Contd.)Population of CD Blocks in West Bengal by District (as per Census 2011)
Sl. No. District/C.D.BlockPopulation 2011 Density
2001Sex Ratio
2011*
(1) (2) (7)(3) (4) (5) (6)
State Statistical Handbook 2014 12

Rural
Male Female Total(2) (6)
C. Bankura17 Simlapal 69315 66517 135832 411 96018 Khatra 53702 50890 104592 442 94819 Hirbandh 42917 40917 83834 380 95320 Ranibundh 60290 58799 119089 243 97521 Raipur 84107 80990 165097 409 96322 Sarenga 54168 52640 106808 425 972D. Purba Medinipur1 Panskura 145563 137740 283303 1207 9462 Kolaghat 124283 115363 239646 1737 9283 Tamluk 106904 100160 207064 1655 9374 Sahid Matangini 95352 88635 183987 1802 9305 Nanda Kumar 135720 127278 262998 1385 9386 Mahisadal 103023 96590 199613 1244 9387 Moyna 114551 105779 220330 1246 9238 Potashpur - I 86280 80697 166977 880 9359 Potashpur - II 90319 84737 175056 785 938
10 Bhagawanpur - II 99060 93102 192162 930 94011 Bhagawanpur - I 115228 107449 222677 1142 93212 Chandipur 91342 85362 176704 1162 93513 Sutahata 60892 57737 118629 1337 94814 Haldia 50531 47461 97992 1247 93915 Nandigram - I 103880 98152 202032 961 94516 Nandigram - II 60601 57344 117945 990 94617 Khejuri - I 68494 64498 132992 878 942
TABLE-1.6 (Contd.)Population of CD Blocks in West Bengal by District (as per Census 2011)
Sl. No. District/C.D.BlockPopulation 2011 Density
2001Sex Ratio
2011*
(1) (7)(3) (4) (5)
State Statistical Handbook 2014 13

Rural
Male Female Total(2) (4) (6)
D. Purba Medinipur18 Khejuri - II 71294 68169 139463 854 95619 Contai - I 88105 82789 170894 977 94020 Deshopran 88094 82844 170938 899 94021 Contai - III 81143 76650 157793 856 94522 Egra - I 86458 80705 167163 733 93323 Egra - II 92578 86185 178763 847 93124 Ramnagar - I 82494 79492 161986 1043 96425 Ramnagar - II 80373 75681 156054 841 942E. Paschim Medinipur1 Binpur - II 79793 79005 158798 250 9902 Binpur - I 78929 77224 156153 389 9783 Garbeta - II 75165 73245 148410 334 9744 Garbeta - I 111379 106860 218239 554 9595 Garbeta - III 75562 73247 148809 467 9696 Chandrakona - I 69820 66186 136006 610 9487 Chandrakona - II 63180 60089 123269 710 9518 Ghatal 113199 106356 219555 883 9409 Daspur - I 103757 100230 203987 1044 966
10 Daspur - II 121742 116787 238529 1246 95911 Keshpur 173504 165744 339248 597 95512 Salbani 95195 93458 188653 299 98213 Midnapore 97490 94215 191705 488 96614 Jhargram 85970 84127 170097 298 97915 Jamboni 57607 55590 113197 320 965
TABLE-1.6 (Contd.)Population of CD Blocks in West Bengal by District (as per Census 2011)
Sl. No. District/C.D.BlockPopulation 2011 Density
2001Sex Ratio
2011*(1) (3) (5) (7)
State Statistical Handbook 2014 14

Rural
Male Female Total(2) (4) (6)
E. Paschim Medinipur16 Gopiballavpur - II 53459 51537 104996 486 96417 Gopiballavpur - I 55475 52779 108254 344 95118 Nayagram 71537 70662 142199 247 98819 Sankrail 58240 57178 115418 371 98220 Kharagpur - I 84489 81472 165961 757 96421 Kharagpur - II 92546 90894 183440 609 98222 Debra 138824 136011 274835 745 98023 Pingla 99988 94821 194809 762 94824 Sabang 138924 131568 270492 783 94725 Narayangarh 148779 144834 293613 534 97326 Keshiary 75601 73659 149260 452 97427 Dantan - I 84466 81455 165921 589 96428 Dantan - II 79543 75474 155017 724 94929 Mohanpur 57558 54343 111901 701 944F. Hooghly1 Goghat - I 71804 68226 140030 672 9502 Goghat - II 82262 78323 160585 754 9523 Arambag 146041 139166 285207 942 9534 Pursura 88908 84529 173437 1557 9515 Tarakeswar 91534 87614 179148 1354 9576 Dhaniakhali 160789 159745 320534 1064 9947 Pandua 133824 132039 265863 1028 9878 Balagarh 102488 98322 200810 1062 9599 Chinsurah - Magra 44235 42557 86792 2578 962
TABLE-1.6 (Contd.)Population of CD Blocks in West Bengal by District (as per Census 2011)
Sl. No. District/C.D.BlockPopulation 2011 Density
2001Sex Ratio
2011*(1) (3) (5) (7)
State Statistical Handbook 2014 15

Rural
Male Female Total(2) (4) (6)
F. Hooghly10 Polba - Dadpur 133678 129877 263555 838 97211 Haripal 129407 127100 256507 1277 98212 Singur 113561 110390 223951 1582 97213 Serampur Uttarpara 18640 17749 36389 2821 95214 Chanditala - I 52612 52065 104677 1775 99015 Chanditala - II 24559 24335 48894 3035 99116 Jangipara 103912 101187 205099 1224 97417 Khanakul - I 130712 123722 254434 1291 94718 Khanakul - II 93979 90755 184734 1321 966G. Purulia1 Jaipur 63633 59457 123090 485 9342 Purulia - II 80492 77370 157862 460 9613 Para 86423 81574 167997 559 9444 Raghunathpur - II 55463 52364 107827 502 9445 Raghunathpur - I 49762 46726 96488 514 9396 Neturia 42707 40430 83137 445 9477 Santuri 36995 35591 72586 387 9628 Kashipur 88738 85587 174325 414 9649 Hura 72867 70708 143575 333 970
10 Purulia - I 74873 70621 145494 445 94311 Puncha 62676 61179 123855 328 97612 Arsha 78398 76338 154736 344 97413 Jhalda - I 65247 62512 127759 367 95814 Jhalda - II 69141 66673 135814 482 964
TABLE-1.6 (Contd.)Population of CD Blocks in West Bengal by District (as per Census 2011)
Sl. No. District/C.D.BlockPopulation 2011 Density
2001Sex Ratio
2011*(1) (3) (5) (7)
State Statistical Handbook 2014 16

Rural
Male Female Total(2) (4) (6)
G. Purulia10 Polba - Dadpur 133678 129877 263555 838 97211 Haripal 129407 127100 256507 1277 98212 Singur 113561 110390 223951 1582 97213 Serampur Uttarpara 18640 17749 36389 2821 95214 Chanditala - I 52612 52065 104677 1775 99015 Chanditala - II 24559 24335 48894 3035 99116 Jangipara 103912 101187 205099 1224 97417 Khanakul - I 130712 123722 254434 1291 94718 Khanakul - II 93979 90755 184734 1321 96615 Bagmundi 69520 66059 135579 263 95016 Balarampur 58314 55205 113519 393 94717 Barabazar 82158 80350 162508 351 97818 Manbazar - I 73172 71378 144550 335 97519 Manbazar - II 48943 48221 97164 298 98520 Bundwan 44686 44250 88936 238 990H. North 24-Parganas1 Bagda 125270 117704 242974 942 9402 Bongaon 196487 184416 380903 1022 9393 Gaighata 136500 129026 265526 1235 9454 Swarupnagar 129255 122460 251715 1053 9475 Habra - I 90735 84916 175651 1603 9366 Habra - II 72210 68465 140675 1330 9487 Amdanga 95215 89799 185014 1190 9438 Barrackpur - I 48354 45924 94278 1985 950
TABLE-1.6 (Contd.)Population of CD Blocks in West Bengal by District (as per Census 2011)
Sl. No. District/C.D.BlockPopulation 2011 Density
2001Sex Ratio
2011*(1) (3) (5) (7)
State Statistical Handbook 2014 17
RuralSl. No.
Male Female Total(1) (2) (3) (4) (5) (6) (7)
H. North 24-Parganas9 Barrackpur - II 26701 25173 51874 3899 943
10 Barasat - I 90238 84988 175226 2268 94211 Barasat - II 98235 90689 188924 1483 92312 Deganga 158216 151334 309550 1263 95713 Baduria 141944 136100 278044 1378 95914 Basirhat - I 76930 73590 150520 1321 95715 Basirhat - II 106868 101972 208840 1523 95416 Haroa 111080 103321 214401 1195 93017 Rajarhat 46121 43486 89607 1994 94318 Minakhan 98141 93832 191973 1064 95619 Sandeshkhali - I 83925 80540 164465 771 96020 Sandeshkhali - II 81921 79055 160976 691 96521 Hasnabad 100795 96219 197014 1160 95522 Hingalganj 81413 78056 159469 655 959I. South 24-Parganas1 Thakurpukur Mahestola 45717 44463 90180 2170 9732 Budge Budge - I 15040 14533 29573 3764 9663 Budge Budge - II 69117 66137 135254 2224 9574 Bishnupur - I 104530 99855 204385 1774 9555 Bishnupur - II 71223 67756 138979 2333 9516 Sonarpur 89706 86007 175713 1388 9597 Bhangar - I 117229 111299 228528 1330 9498 Bhangar - II 127195 119513 246708 1281 9409 Canning - I 92684 88824 181508 1302 958
TABLE-1.6 (Contd.)Population of CD Blocks in West Bengal by District (as per Census 2011)
District/C.D.BlockPopulation 2011 Density
2001Sex Ratio
2011*
State Statistical Handbook 2014 18

Rural
Male Female Total
I. South 24-Parganas10 Canning - II 122787 118544 241331 912 96511 Baruipur 161643 154164 315807 1554 95412 Magrahat - II 112441 106063 218504 1914 94313 Magrahat - I 104329 99508 203837 1918 95414 Falta 115725 110437 226162 1696 95415 Diamond Harbour - I 69031 66129 135160 1949 95816 Diamond Harbour - II 95134 90674 185808 1729 95317 Kulpi 136359 130286 266645 1151 95518 Mandirbazar 97208 91787 188995 1551 94419 Mathurapur - I 86713 82550 169263 1118 95220 Jaynagar - I 111367 105462 216829 1672 94721 Jaynagar - II 122545 117239 239784 1123 95722 Kultali 117562 111491 229053 614 94823 Basanti 167832 162260 330092 689 96724 Gosaba 125910 120688 246598 751 95925 Mathurapur - II 113831 107008 220839 872 94026 Kakdwip 144120 137843 281963 947 95627 Sagar 109468 102569 212037 658 93728 Namkhana 93351 89479 182830 433 95929 Patharpratima 169422 162401 331823 595 959J. Howrah1 Udaynarayanpur 97735 92451 190186 1569 9462 Amta - II 98887 93411 192298 1377 9453 Amta - I 82709 78484 161193 1689 949
TABLE-1.6 (Contd.)Population of CD Blocks in West Bengal by District (as per Census 2011)
Sl. No. District/C.D.BlockPopulation 2011 Density
2001Sex Ratio
2011*(2) (4) (6)(1) (3) (5) (7)
State Statistical Handbook 2014 19

Rural
Male Female Total
J. Howrah4 Jagatballavpur 95602 91096 186698 1758 9535 Domjur 37416 37094 74510 3204 9916 Bally Jagachha 4734 4566 9300 5275 9657 Sankrail 18017 17178 35195 4875 9538 Panchla 22147 20940 43087 3011 9469 Uluberia - II 41288 39505 80793 2297 957
10 Uluberia - I 94250 90531 184781 1881 96111 Bagnan - I 72270 67846 140116 2398 93912 Bagnan - II 61419 57614 119033 1929 93813 Shyampur - I 93192 90028 183220 1559 96614 Shyampur - II 89853 85622 175475 1688 953K. Nadia1 Karimpur - I 83014 77881 160895 773 9382 Karimpur - II 111488 105648 217136 855 9483 Tehatta - I 125875 118447 244322 872 9414 Tehatta - II 77299 73932 151231 778 9565 Kaliganj 157234 148963 306197 909 9476 Nakashipara 180990 171201 352191 928 9467 Chapra 152575 143954 296529 890 9438 Krishnagar - II 68826 65206 134032 998 9479 Nabadwip 39515 36726 76241 1251 929
10 Krishnagar - I 147239 138646 285885 1026 94211 Krishnaganj 75573 71132 146705 880 94112 Hanskhali 127576 118323 245899 1060 927
TABLE-1.6 (Contd.)Population of CD Blocks in West Bengal by District (as per Census 2011)
Sl. No. District/C.D.BlockPopulation 2011 Density
2001Sex Ratio
2011*(2) (4) (6) (7)(1) (3) (5)
State Statistical Handbook 2014 20
Rural
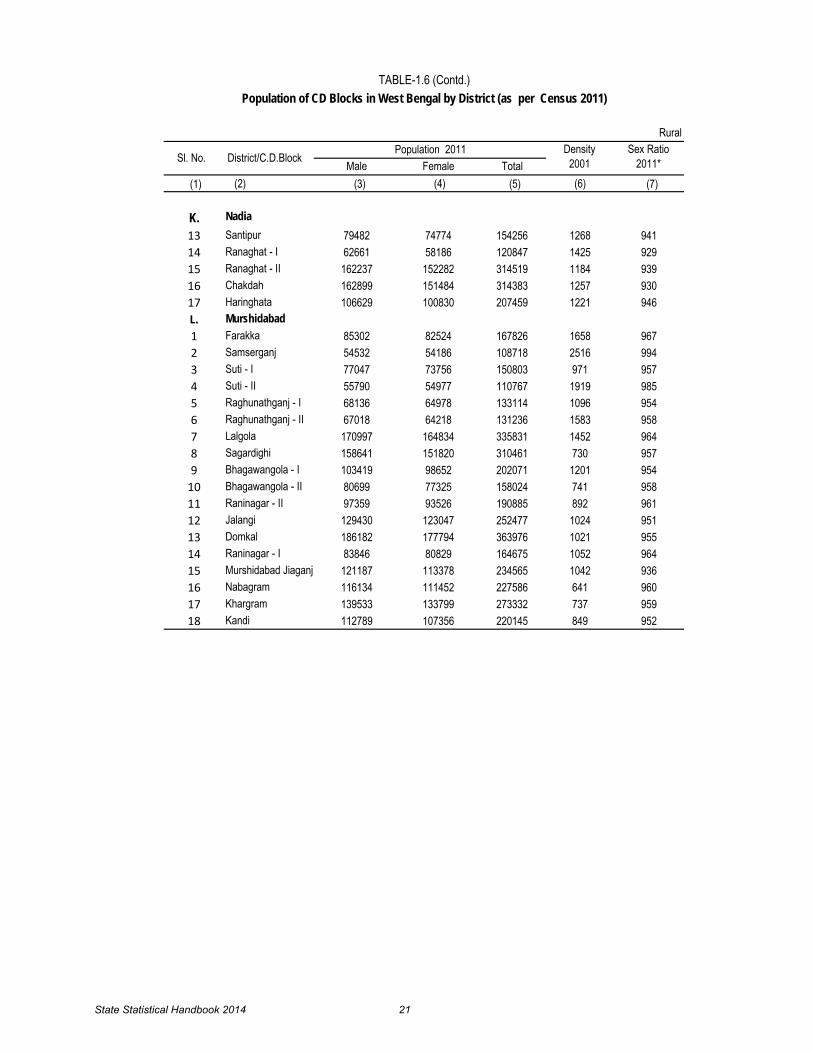
Male Female Total
K. Nadia13 Santipur 79482 74774 154256 1268 94114 Ranaghat - I 62661 58186 120847 1425 92915 Ranaghat - II 162237 152282 314519 1184 93916 Chakdah 162899 151484 314383 1257 93017 Haringhata 106629 100830 207459 1221 946L. Murshidabad1 Farakka 85302 82524 167826 1658 9672 Samserganj 54532 54186 108718 2516 9943 Suti - I 77047 73756 150803 971 9574 Suti - II 55790 54977 110767 1919 9855 Raghunathganj - I 68136 64978 133114 1096 9546 Raghunathganj - II 67018 64218 131236 1583 9587 Lalgola 170997 164834 335831 1452 9648 Sagardighi 158641 151820 310461 730 9579 Bhagawangola - I 103419 98652 202071 1201 954
10 Bhagawangola - II 80699 77325 158024 741 95811 Raninagar - II 97359 93526 190885 892 96112 Jalangi 129430 123047 252477 1024 95113 Domkal 186182 177794 363976 1021 95514 Raninagar - I 83846 80829 164675 1052 96415 Murshidabad Jiaganj 121187 113378 234565 1042 93616 Nabagram 116134 111452 227586 641 96017 Khargram 139533 133799 273332 737 95918 Kandi 112789 107356 220145 849 952
TABLE-1.6 (Contd.)Population of CD Blocks in West Bengal by District (as per Census 2011)
Sl. No. District/C.D.BlockPopulation 2011 Density
2001Sex Ratio
2011*(2) (4) (6) (7)(1) (3) (5)
State Statistical Handbook 2014 21

Rural
Male Female Total(1) (2) (3) (4) (5) (6) (7)
L. Murshidabad19 Berhampore 173129 164494 337623 1206 95020 Hariharpara 131634 125937 257571 876 95721 Nawda 116341 110518 226859 848 95022 Beldanga - I 159626 150844 310470 1536 94523 Beldanga - II 129144 121314 250458 1011 93924 Bharatpur - II 78380 75094 153474 821 95825 Bharatpur - I 89088 83614 172702 947 93926 Burwan 132439 125027 257466 749 944M. UttarDinajpur1 Chopra 144076 134550 278626 586 9342 Islampur 158933 149585 308518 734 9413 Goalpokhar - I 166889 153292 320181 691 9194 Goalpokhar - II 150125 141127 291252 758 9405 Karandighi 188572 179760 368332 817 9536 Raiganj 213393 200750 414143 767 9417 Hemtabad 72624 69432 142056 619 9568 Kaliaganj 115104 109038 224142 629 9479 Itahar 152753 144903 297656 689 949N. Dakshin Dinajpur1 Kushmundi 100317 98435 198752 564 9812 Gangarampur 119358 111254 230612 655 9323 Kumarganj 87098 82004 169102 534 9424 Hilli 42981 40773 83754 851 9495 Balurghat 120867 113272 234139 619 937
TABLE-1.6 (Contd.)Population of CD Blocks in West Bengal by District (as per Census 2011)
Sl. No. District/C.D.BlockPopulation 2011 Density
2001Sex Ratio
2011*
State Statistical Handbook 2014 22
Rural
Male Female Total(1) (2) (3) (4) (5) (6) (7)
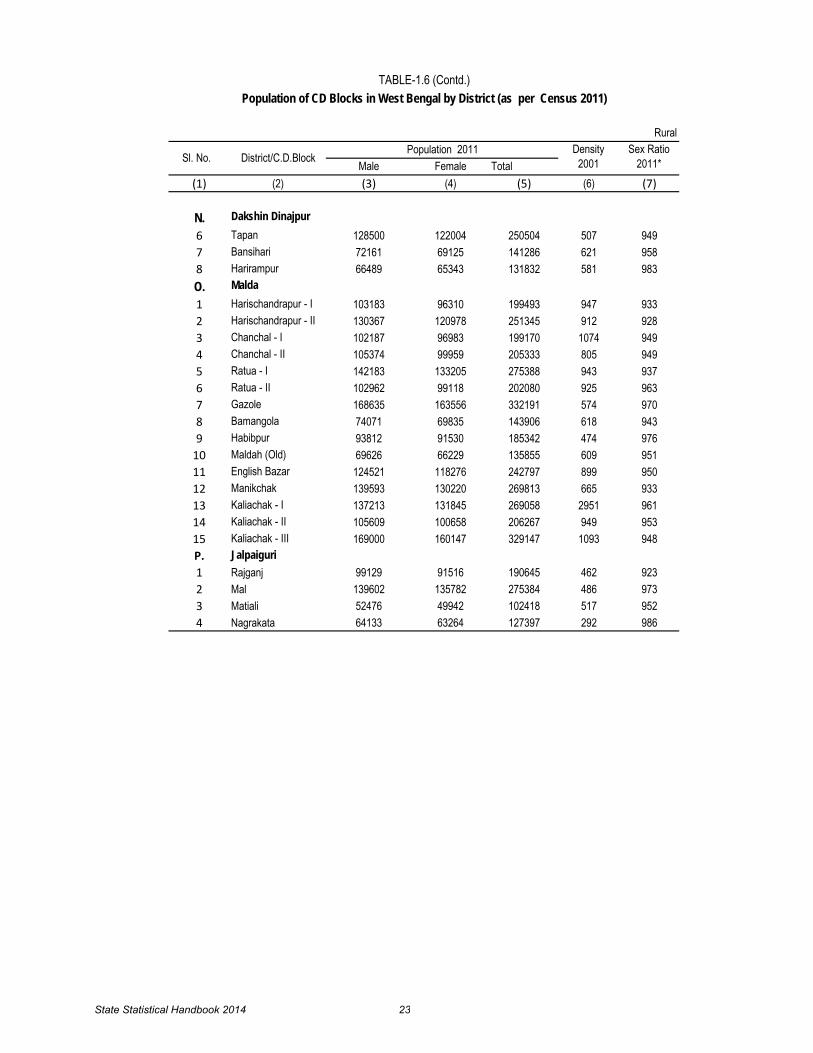
N. Dakshin Dinajpur6 Tapan 128500 122004 250504 507 9497 Bansihari 72161 69125 141286 621 9588 Harirampur 66489 65343 131832 581 983O. Malda1 Harischandrapur - I 103183 96310 199493 947 9332 Harischandrapur - II 130367 120978 251345 912 9283 Chanchal - I 102187 96983 199170 1074 9494 Chanchal - II 105374 99959 205333 805 9495 Ratua - I 142183 133205 275388 943 9376 Ratua - II 102962 99118 202080 925 9637 Gazole 168635 163556 332191 574 9708 Bamangola 74071 69835 143906 618 9439 Habibpur 93812 91530 185342 474 976
10 Maldah (Old) 69626 66229 135855 609 95111 English Bazar 124521 118276 242797 899 95012 Manikchak 139593 130220 269813 665 93313 Kaliachak - I 137213 131845 269058 2951 96114 Kaliachak - II 105609 100658 206267 949 95315 Kaliachak - III 169000 160147 329147 1093 948P. Jalpaiguri1 Rajganj 99129 91516 190645 462 9232 Mal 139602 135782 275384 486 9733 Matiali 52476 49942 102418 517 9524 Nagrakata 64133 63264 127397 292 986
TABLE-1.6 (Contd.)Population of CD Blocks in West Bengal by District (as per Census 2011)
Sl. No. District/C.D.BlockPopulation 2011 Density
2001Sex Ratio
2011*
State Statistical Handbook 2014 23

Rural
Male Female Total(1) (2) (3) (4) (5) (6) (7)
P. Jalpaiguri5 Madarihat 94531 93734 188265 492 9926 Kalchini 105633 106175 211808 355 10057 Kumargram 89456 84602 174058 344 9468 Alipurduar - I 82878 77882 160760 521 9409 Alipurduar - II 105403 99249 204652 618 942
10 Falakata 125691 118470 244161 718 94311 Dhupguri 193071 187019 380090 741 96912 Maynaguri 150757 140316 291073 531 93113 Jalpaiguri 134526 127258 261784 561 946Q. Darjeeling1 Darjeeling Pulbazar 53078 52072 105150 276 9812 Rangli Rangliot 35025 35100 70125 236 10023 Kalimpong -I 34474 33483 67957 188 9714 Kalimpong - II 34546 32284 66830 250 9355 Gorubathan 31054 29609 60663 123 9536 Jorebunglow Sukiapokhri 42969 43668 86637 453 10167 Mirik 23394 22980 46374 354 9828 Kurseong 39914 39989 79903 231 10029 Matigara 69884 65699 135583 904 940
10 Naxalbari 49281 48436 97717 797 98311 Phansidewa 103719 100803 204522 549 97212 Kharibari 49627 47772 97399 609 963R. Cooch Behar 1304916 1224736 2529652 732 9391 Haldibari 52851 51118 103969 616 967
TABLE-1.6 (Contd.)Population of CD Blocks in West Bengal by District (as per Census 2011)
Sl. No. District/C.D.BlockPopulation 2011 Density
2001Sex Ratio
2011*
State Statistical Handbook 2014 24

Rural
Male Female Total(1) (2) (3) (4) (5) (6) (7)
R. Cooch Behar2 Mekliganj 77801 72966 150767 441 9383 Mathabhanga - I 112497 105694 218191 584 9404 Mathabhanga - II 117100 110297 227397 633 9425 Cooch Behar - I 151337 141930 293267 788 9386 Cooch Behar - II 151946 137971 289917 773 9087 Tufanganj - I 125672 117584 243256 704 9368 Tufanganj - II 93431 87815 181246 630 9409 Dinhata - I 145325 136565 281890 911 940
10 Dinhata - II 126663 117403 244066 832 92711 Sitai 56016 54317 110333 599 97012 Sitalkuchi 94277 91076 185353 624 966
* Sex Ratio= Females per 1000 male
TABLE-1.6 (Contd.)
Source : Primary Census Abstract, 2011.
Population of CD Blocks in West Bengal by District (as per Census 2011)
Sl. No. District/C.D.BlockPopulation 2011 Density
2001Sex Ratio
2011*
State Statistical Handbook 2014 25

Urban
Male Female Total(1) (2) (3) (4) (5) (6)A. Burdwan1 Chittaranjan (CT) 20089 19009 390982 Hindusthan Cables Town (CT) 11555 11044 225993 Panuria (CT) 4236 4163 83994 Domohani (CT) 6413 6067 124805 Bhanowara (CT) 4627 4228 88556 Majiara (CT) 2813 2631 54447 Pangachhiya (CT) 4819 4346 91658 Kunustara (CT) 2720 2407 51279 Topsi (CT) 2249 2080 432910 Nimsa (CT) 1813 1646 345911 Chinchuria (CT) 3458 3159 661712 Kenda (CT) 8360 7371 1573113 Parasia (CT) 4794 4100 889414 Kendra Khottamdi (Part) (CT) 1961 1914 387515 Ratibati (CT) 2348 2160 450816 Chapui (CT) 2873 2485 535817 Jemari (J.K. Nagar Township) (CT) 7026 6153 1317918 Banshra (CT) 3001 2702 570319 Belebathan (CT) 2302 2157 445920 Chelad (CT) 3888 3583 747121 Murgathaul (CT) 3920 3451 737122 Amkula (CT) 2928 2517 544523 Baktarnagar (CT) 2643 2469 511224 Egara (CT) 3918 3705 762325 Sahebganj (CT) 2430 2285 4715
TABLE-1.7Population of Cities, Towns and Urban Outgrowths in
West Bengal by District, Census 2011
Sl. No.
District/City/Town/Outgrowth Status Population
State Statistical Handbook 2014 26

Urban
Male Female Total(1) (2) (3) (4) (5) (6)A. Burdwan26 Raghunathchak (CT) 3149 2857 600627 Ballavpur (CT) 3399 3069 646828 Siduli (CT) 4693 4268 896129 Khandra (CT) 8096 7287 1538330 Chak Bankola (Part) (CT) 1010 955 196531 Ukhra (CT) 12500 11604 2410432 Mahira (CT) 2238 1950 418833 Dakshin Khanda (CT) 4344 4105 844934 Parashkol (Part) (CT) 480 365 84535 Kajora (CT) 14444 12831 2727536 Harishpur (CT) 4744 4236 898037 Palashban (CT) 2531 2280 481138 Dignala (CT) 7170 6463 1363339 Andal(Gram) (CT) 3160 3017 617740 Ondal (CT) 10321 9603 1992441 Baska (CT) 3462 3147 660942 Chak Bankola (Part) (CT) 6120 5407 1152743 Parashkol (Part) (CT) 5483 4884 1036744 Kendra Khottamdi (Part) (CT) 3571 3304 687545 Bilpahari (CT) 4519 4046 856546 Ramnagar (CT) 2800 2646 544647 Dalurband (CT) 7978 7129 1510748 Baidyanathpur (CT) 8132 7572 1570449 Mahal (CT) 2510 2331 484150 Konardihi (CT) 4470 4018 8488
TABLE-1.7 (Contd.)Population of Cities, Towns and Urban Outgrowths in
West Bengal by District, Census 2011
Sl. No.
District/City/Town/Outgrowth Status Population
State Statistical Handbook 2014 27

Urban
Male Female Total(1) (2) (3) (4) (5) (6)A. Burdwan51 Nabgram (CT) 2431 2195 462652 Sankarpur (CT) 3317 3082 639953 Haripur (CT) 3107 2803 591054 Chhora (CT) 7308 6498 1380655 Bahula (CT) 9095 8415 1751056 Mandarbani (CT) 2441 2151 459257 Banagram (CT) 2938 2697 563558 Sirsha (CT) 2436 2164 460059 Nabaghanapur (CT) 2931 2452 538360 Sarpi (CT) 2941 2608 554961 Ichhapur (CT) 2483 2312 479562 Arra (CT) 3953 3855 780863 Gopalpur (CT) 8126 7841 1596764 Bamunara (CT) 3399 3266 666565 Amlajora (CT) 2935 2921 585666 Kanksa (CT) 12406 11383 2378967 Debipur (CT) 5064 4903 996768 Prayagpur (CT) 2254 2225 447969 Panuhat (CT) 3354 3119 647370 Srirampur (CT) 10181 9649 1983071 Hatsimla (CT) 3727 3414 714172 Jaluidanga (CT) 2411 2160 457173 Gopinathpur (CT) 2498 2190 468874 Nasaratpur (CT) 8743 8301 1704475 Raipur (CT) 2775 2695 5470
TABLE-1.7 (Contd.)Population of Cities, Towns and Urban Outgrowths in
West Bengal by District, Census 2011
Sl. No.
District/City/Town/Outgrowth Status Population
State Statistical Handbook 2014 28

Urban
Male Female Total(1) (2) (3) (4) (5) (6)A. Burdwan76 Sukdal (CT) 6731 6362 1309377 Budbud (CT) 2334 2224 455878 Goda (P) (CT) 3294 3189 648379 Bahir Sarbamangala (P) (CT) 6527 6292 1281980 Mirzapur (CT) 3915 3818 773381 Nari (P) (CT) 6634 6438 1307282 Gangpur (CT) 3263 3084 634783 Alipur (CT) 2247 2173 442084 Dhatrigram (CT) 5137 4814 995185 Piarinagar (CT) 1917 1761 367886 Uttar Goara (CT) 3717 3461 717887 Sashpur (P) (CT) 5240 4860 1010088 Sehara (CT) 3996 3862 785889 Kulti (M) 163193 150616 31380990 Asansol (M Corp.) 292387 271530 56391791 Jamuria (OG) 1962 1982 394492 Jamuria (M) 75417 69859 14527693 Raniganj (M) 67578 61863 12944194 Durgapur (M Corp.) 294255 272262 56651795 Katwa (M) 41350 40265 8161596 Dainhat (M) 12487 11910 2439797 Guskara (M) 18073 17315 3538898 Barddhaman (M) 159936 154329 31426599 Kalna (M) 28793 27929 56722
100 Memari (M) 20957 20494 41451
TABLE-1.7 (Contd.)Population of Cities, Towns and Urban Outgrowths in
West Bengal by District, Census 2011
Sl. No.
District/City/Town/Outgrowth Status Population
State Statistical Handbook 2014 29

Urban
Male Female Total(1) (2) (3) (4) (5) (6)B. Birbhum1 Barua Gopalpur (CT) 3393 3221 66142 Ambhua (CT) 5300 5177 104773 Murarai (CT) 2976 2794 57704 Kashimnagar (CT) 5105 4691 97965 Bishnupur (CT) 4134 3984 81186 Fatehpur (CT) 5193 4983 101767 Rajnagar (CT) 7173 6792 139658 Karidhya (CT) 5325 5141 104669 Kalipur (CT) 2434 2336 4770
10 Ahmadpur (CT) 4697 4545 924211 Labhpur (CT) 2762 2657 541912 Parota (CT) 2690 2577 526713 Surul (CT) 5999 6161 1216014 Ilambazar (CT) 3632 3493 712515 Nalhati (M) 21275 20259 4153416 Rampurhat (M) 29611 28222 5783317 Suri (M) 34579 33285 6786418 Sainthia (M) 22856 21745 4460119 Dubrajpur (M) 19342 18699 3804120 Bolpur (M) 40468 39742 80210C. Bankura 152318 147455 2997731 Jhanti Pahari (CT) 2726 2600 53262 Ghutgarya (CT) 2693 2618 53113 Barjora (CT) 7203 6809 140124 Beliatore (CT) 3249 3214 6463
TABLE-1.7 (Contd.)Population of Cities, Towns and Urban Outgrowths in
West Bengal by District, Census 2011
Sl. No.
District/City/Town/Outgrowth Status Population
State Statistical Handbook 2014 30
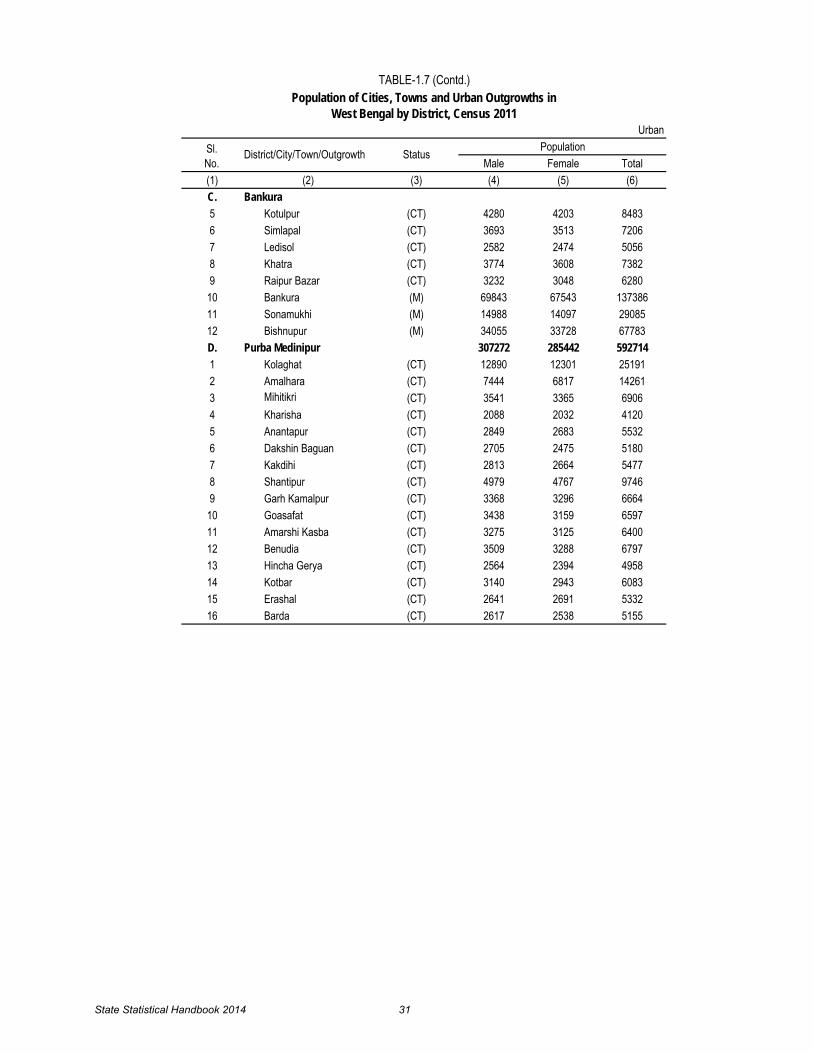
Urban
Male Female Total(1) (2) (3) (4) (5) (6)C. Bankura5 Kotulpur (CT) 4280 4203 84836 Simlapal (CT) 3693 3513 72067 Ledisol (CT) 2582 2474 50568 Khatra (CT) 3774 3608 73829 Raipur Bazar (CT) 3232 3048 6280
10 Bankura (M) 69843 67543 13738611 Sonamukhi (M) 14988 14097 2908512 Bishnupur (M) 34055 33728 67783D. Purba Medinipur 307272 285442 5927141 Kolaghat (CT) 12890 12301 251912 Amalhara (CT) 7444 6817 142613 Mihitikri (CT) 3541 3365 69064 Kharisha (CT) 2088 2032 41205 Anantapur (CT) 2849 2683 55326 Dakshin Baguan (CT) 2705 2475 51807 Kakdihi (CT) 2813 2664 54778 Shantipur (CT) 4979 4767 97469 Garh Kamalpur (CT) 3368 3296 6664
10 Goasafat (CT) 3438 3159 659711 Amarshi Kasba (CT) 3275 3125 640012 Benudia (CT) 3509 3288 679713 Hincha Gerya (CT) 2564 2394 495814 Kotbar (CT) 3140 2943 608315 Erashal (CT) 2641 2691 533216 Barda (CT) 2617 2538 5155
TABLE-1.7 (Contd.)Population of Cities, Towns and Urban Outgrowths in
West Bengal by District, Census 2011
Sl. No.
District/City/Town/Outgrowth Status Population
State Statistical Handbook 2014 31

Urban
Male Female Total(1) (2) (3) (4) (5) (6)D. Purba Medinipur17 Nandigram (CT) 2947 2856 580318 Ashadtalya (CT) 2722 2552 527419 Basantia (CT) 2843 2612 545520 Khadalgobra (CT) 2736 2608 534421 Panskura (M) 29740 28192 5793222 Tamluk (M) 33260 32046 6530623 Haldia (M) 104841 95986 20082724 Egra (M) 15291 14857 3014825 Contai (M) 49031 43195 92226E. Paschim Medinipur 366164 356522 7226861 Shilda (CT) 2861 2863 57242 Amlagora (CT) 2665 2500 51653 Garbeta (CT) 2576 2533 51094 Durllabhganj (CT) 3436 3360 67965 Dwari Geria (CT) 3932 3822 77546 Naba Kola (CT) 3093 3076 61697 Kharagpur Rly. Settlemen (CT) 41388 41347 827358 Kalaikunda (CT) 5196 4148 93449 Balichak (CT) 6735 7049 13784
10 Deuli (CT) 4468 4539 900711 Chaulia (CT) 3135 3051 618612 Ramjibanpur (M) 10030 9581 1961113 Kshirpai (M) 8254 8130 1638414 Chandrakona (M) 11977 11652 2362915 Kharar (M) 6124 5994 12118
TABLE-1.7 (Contd.)Population of Cities, Towns and Urban Outgrowths in
West Bengal by District, Census 2011
Sl. No.
District/City/Town/Outgrowth Status Population
State Statistical Handbook 2014 32

Urban
Male Female Total(1) (2) (3) (4) (5) (6)E. Paschim Medinipur16 Ghatal (M) 27882 26709 5459117 Medinipur (M) 84977 84287 16926418 Jhargram (M) 30876 30836 6171219 Kharagpur (M) 106559 101045 207604F. Hooghly 1091708 1036791 21284991 Batika (CT) 4422 4295 87172 Pandua (CT) 15597 15103 307003 Purusottampur (CT) 1855 1810 36654 Namajgram (CT) 3625 3627 72525 Badhagachhi (CT) 2595 2457 50526 Mirdhanga (CT) 4325 4157 84827 Sripur (CT) 3596 3628 72248 Jirat (CT) 3824 3606 74309 Kola (CT) 3642 3629 7271
10 Hansghara (CT) 3936 3729 766511 Raghunathpur (PS-Magra) (CT) 7733 7186 1491912 Madhusudanpur (CT) 3419 3266 668513 Amodghata (CT) 3909 4001 791014 Alikhoja (CT) 2278 2335 461315 Shankhanagar (CT) 4483 4118 860116 Chak Banshberia (CT) 5353 5004 1035717 Manushpur (CT) 4130 4018 814818 Keota (P) (CT) 9800 9075 1887519 Kodalia (CT) 4536 4458 899420 Naldanga (CT) 6784 6356 13140
TABLE-1.7 (Contd.)Population of Cities, Towns and Urban Outgrowths in
West Bengal by District, Census 2011
Sl. No.
District/City/Town/Outgrowth Status Population
State Statistical Handbook 2014 33

Urban
Male Female Total(1) (2) (3) (4) (5) (6)F. Hooghly21 Kulihanda (CT) 8244 7725 1596922 Dharmapur (CT) 4265 4191 845623 Simla (CT) 7941 8047 1598824 Bargachhia (CT) 2350 2216 456625 Balarambati (CT) 2558 2510 506826 Singur (CT) 10825 10557 2138227 Nasibpur (CT) 3908 3609 751728 Jagatnagar (CT) 2675 2567 524229 Baruipara (CT) 3486 3245 673130 Borai (CT) 3321 3201 652231 Belumilki (CT) 5491 5507 1099832 Dakshin Rajyadharpur (CT) 5739 5515 1125433 Rishra (CT) 8492 8011 1650334 Bamunari (CT) 3227 3039 626635 Nawapara (CT) 3725 3537 726236 Nabagram Colony (CT) 9083 9275 1835837 Basai (CT) 4511 4261 877238 Kanaipur (CT) 13914 12900 2681439 Raghunathpur (PS-Dankuni) (CT) 4903 4747 965040 Masat (CT) 4033 3974 800741 Jangalpara (CT) 3752 3726 747842 Gangadharpur (CT) 3973 3889 786243 Manirampur (CT) 3706 3722 742844 Dudhkalmi (CT) 2628 2930 555845 Nababpur (CT) 6309 6419 12728
TABLE-1.7 (Contd.)Population of Cities, Towns and Urban Outgrowths in
West Bengal by District, Census 2011
Sl. No.
District/City/Town/Outgrowth Status Population
State Statistical Handbook 2014 34

Urban
Male Female Total(1) (2) (3) (4) (5) (6)F. Hooghly46 Kumirmora (CT) 6063 6145 1220847 Ramanathpur (CT) 3370 3441 681148 Bhagabatipur (CT) 3586 3482 706849 Kharsarai (CT) 3145 3102 624750 Tisa (CT) 2496 2386 488251 Kapashanria (CT) 2543 2605 514852 Jaykrishnapur (CT) 2629 2551 518053 Purbba Tajpur (CT) 3487 3548 703554 Begampur (CT) 5405 5082 1048755 Baksa (CT) 3196 3236 643256 Panchghara (CT) 4168 4260 842857 Chikrand (CT) 5311 5064 1037558 Janai (CT) 6423 6414 1283759 Pairagachha (CT) 2350 2353 470360 Naiti (CT) 3565 3431 699661 Barijhati (CT) 3679 3457 713662 Garalgachha (CT) 2760 2651 541163 Krishnapur (CT) 4115 4090 820564 Rajbalhat (CT) 8405 8074 1647965 Bansberia (M) 53760 50160 10392066 Hugli-Chinsurah (OG) 1373 1299 267267 Hugli-Chinsurah (M) 88844 88415 17725968 Chandannagar (M Corp) 84009 82858 16686769 Tarakeswar (M) 16049 14898 3094770 Arambag (M) 33443 32732 66175
TABLE-1.7 (Contd.)Population of Cities, Towns and Urban Outgrowths in
West Bengal by District, Census 2011
Sl. No.
District/City/Town/Outgrowth Status Population
State Statistical Handbook 2014 35

Urban
Male Female Total(1) (2) (3) (4) (5) (6)F. Hooghly71 Bhadreswar (M) 53330 48147 10147772 Champdani (M) 59350 51901 11125173 Baidyabati (M) 62485 58625 12111074 Serampore (M) 93694 88148 18184275 Rishra (M) 66606 57971 12457776 Konnagar (M) 38653 37519 7617277 Dankuni (M) 49105 45831 9493678 Uttarpara Kotrung (M) 81410 77737 159147G. Purulia 192788 180526 3733141 Jaypur (CT) 5344 4915 102592 Raghabpur (P) (CT) 3003 2745 57483 Hutmura (CT) 2967 2911 5878
4Santaldih Thermal Power Project-Town (CT) 1371 1136 2507
5 Kanki (P) (CT) 3530 3354 68846 Dubra (CT) 2866 2640 55067 Chapari (CT) 3381 3175 65568 Shankara (CT) 5735 5436 111719 Nabagram (CT) 3105 2858 5963
10 Arra (CT) 11135 10137 2127211 Saltor (CT) 2543 2551 509412 Hijuli (CT) 4277 3640 791713 Par Beliya (CT) 2783 2496 527914 Murulia (CT) 3090 2839 592915 Kantaranguri (P) (CT) 2736 2699 543516 Adra (CT) 7596 7360 14956
TABLE-1.7 (Contd.)Population of Cities, Towns and Urban Outgrowths in
West Bengal by District, Census 2011
Sl. No.
District/City/Town/Outgrowth Status Population
State Statistical Handbook 2014 36

Urban
Male Female Total(1) (2) (3) (4) (5) (6)G. Purulia17 Lapara (CT) 2731 2636 536718 Lagda (CT) 2985 2709 569419 Jhalda (P) (CT) 4848 4536 938420 Chekya (CT) 3070 2925 599521 Begun Kodar (CT) 3242 3105 634722 Balarampur (CT) 12681 11750 2443123 Barabazar (CT) 4195 3861 805624 Manbazar (CT) 4867 4654 952125 Bandoan (CT) 3112 2881 599326 Jhalda (M) 10050 9494 1954427 Raghunathpur (M) 13194 12367 2556128 Puruliya (M) 62351 58716 121067H. North 24-Parganas 2922835 2809327 57321621 Chandpara (CT) 3655 3458 71132 Chhekati (CT) 2576 2419 49953 Sonatikiri (CT) 3500 3419 69194 Dhakuria (CT) 5054 5111 101655 Chikanpara (CT) 4784 4810 95946 Shimulpur (CT) 10504 10299 208037 Bara (CT) 2643 2529 51728 Deora (CT) 2255 2105 43609 Nokpul (CT) 4030 3707 7737
10 Maslandapur (CT) 5519 5271 1079011 Sadpur (CT) 3946 3827 777312 Betpuli (CT) 4777 4627 9404
TABLE-1.7 (Contd.)Population of Cities, Towns and Urban Outgrowths in
West Bengal by District, Census 2011
Sl. No.
District/City/Town/Outgrowth Status Population
State Statistical Handbook 2014 37

Urban
Male Female Total(1) (2) (3) (4) (5) (6)H. North 24-Parganas13 Anarbaria (CT) 2973 2922 589514 Purbba Narayanpur (CT) 4047 3903 795015 Guma (CT) 6089 5936 1202516 Bara Bamonia (CT) 3683 3510 719317 Khorddabamonia (CT) 3013 2843 585618 Bira (CT) 5471 5270 1074119 Dhania (CT) 3403 3256 665920 Palladaha (CT) 3052 2942 599421 Palashi (CT) 3461 3287 674822 Nagdaha (CT) 4167 4025 819223 Jetia (CT) 3246 3103 634924 Balibhara (CT) 4376 4145 852125 Dogachhia (CT) 2957 2748 570526 Garshyamnagar (CT) 3840 3771 761127 Noapara (P) (CT) 5524 5295 1081928 Kaugachhi (CT) 8612 8389 1700129 Paltapara (CT) 3293 3115 640830 Ichhapur Defence Estate (CT) 2700 2519 521931 Babanpur (P) (CT) 4555 4387 894232 Jafarpur (CT) 9724 9338 1906233 Mohanpur (CT) 4646 4450 909634 Teleni Para (CT) 9124 8657 1778135 Chak Kanthalia (CT) 5704 5404 1110836 Ruiya (CT) 9149 8512 1766137 Patulia (CT) 8627 8352 16979
TABLE-1.7 (Contd.)Population of Cities, Towns and Urban Outgrowths in
West Bengal by District, Census 2011
Sl. No.
District/City/Town/Outgrowth Status Population
State Statistical Handbook 2014 38

Urban
Male Female Total(1) (2) (3) (4) (5) (6)H. North 24-Parganas38 Bandipur (CT) 4188 3927 811539 Talbandha (CT) 9033 8769 1780240 Bilkanda (CT) 3156 2925 608141 Muragachha (CT) 6758 6491 1324942 Teghari (CT) 4324 4167 849143 Chandpur (CT) 5593 5337 1093044 Kokapur (CT) 3248 3069 631745 Shibalaya (CT) 3003 2827 583046 Gangapur (CT) 3211 3090 630147 Chandrapur (CT) 2574 2473 504748 Nebadhai Duttapukur (CT) 12902 12655 2555749 Chatta Baria (CT) 6410 6127 1253750 Joypul (CT) 8286 7848 1613451 Digha (CT) 4162 3997 815952 Kulberia (CT) 3543 3450 699353 Bamangachhi (CT) 3468 3356 682454 Chak Barbaria (CT) 4085 4003 808855 Koyra (CT) 5789 5826 1161556 Deara (CT) 6018 5976 1199457 Deulia (CT) 4938 4725 966358 Dakshin Chatra (CT) 3697 3578 727559 Itinda (CT) 4467 4212 867960 Dandirhat (P) (CT) 3248 3139 638761 Uttar Bagundi (CT) 3072 2955 602762 Dhanyakuria (CT) 2640 2508 5148
TABLE-1.7 (Contd.)Population of Cities, Towns and Urban Outgrowths in
West Bengal by District, Census 2011
Sl. No.
District/City/Town/Outgrowth Status Population
State Statistical Handbook 2014 39

Urban
Male Female Total(1) (2) (3) (4) (5) (6)H. North 24-Parganas63 Mathurapur (CT) 3474 3329 680364 Raghunathpur (P) (CT) 2753 2586 533965 Raigachhi (CT) 4196 4049 824566 Rekjuani (CT) 8417 8136 1655367 Bhatenda (CT) 3231 3118 634968 Basina (CT) 2772 2641 541369 Bishnupur (CT) 6473 6187 1266070 Chandapur Champagachh (CT) 3260 3171 643171 Jatragachhi (CT) 3557 3333 689072 Ghuni (CT) 12618 11631 2424973 Sulanggari (CT) 6978 6518 1349674 Minakhan (CT) 1796 1678 347475 Balihati (CT) 1890 1747 363776 Sadigachhi (CT) 3224 3024 624877 Hingalganj (CT) 4129 4050 817978 Bankra (CT) 3395 3502 689779 Bongaon (M) 55382 53482 10886480 Halisahar (M) 65467 59472 12493981 Kanchrapara (OG) 4729 4502 923182 Kanchrapara (M) 60707 59638 12034583 Naihati (M) 109849 108051 21790084 Bhatpara (OG) 1123 1134 225785 Bhatpara (M) 203416 180346 38376286 Gobardanga (M) 23025 22352 4537787 Habra (M) 74592 72629 147221
TABLE-1.7 (Contd.)Population of Cities, Towns and Urban Outgrowths in
West Bengal by District, Census 2011
Sl. No.
District/City/Town/Outgrowth Status Population
State Statistical Handbook 2014 40

Urban
Male Female Total(1) (2) (3) (4) (5) (6)H. North 24-Parganas88 Ashokenagar Kalyangarh (M) 61236 60356 12159289 Garulia (M) 44825 40511 8533690 North Barrackpore (M) 66924 65882 13280691 Barrackpur Cantonment (CB) 8872 8508 1738092 Barrackpore (M) 78349 74434 15278393 Titagarh (M) 62735 53806 11654194 Khardah (M) 54879 53617 10849695 Panihati (M) 189446 187901 37734796 Baduria (M) 26799 25694 5249397 Barasat (M) 140822 137613 27843598 Madhyamgram (M) 98864 97263 19612799 New Barrackpore (M) 38239 38607 76846100 North DumDum (M) 126279 122863 249142101 Kamarhati (M) 170293 159918 330211102 Baranagar (M) 126187 119026 245213103 Dum Dum (M) 58566 56220 114786104 South DumDum (M) 202214 201102 403316105 Rajarhat Gopalpur (M) 203911 198933 402844106 Bidhannagar (M) 109014 106500 215514107 Nabadiganta Industrial Township (ITS) 651 444 1095108 Basirhat (M) 63223 62031 125254109 Taki (M) 19562 18701 38263I. South 24-Parganas 1064559 1023214 20877731 Joka (CT) 4645 4657 93022 Chata Kalikapur (CT) 12709 12276 24985
TABLE-1.7 (Contd.)Population of Cities, Towns and Urban Outgrowths in
West Bengal by District, Census 2011
Sl. No.
District/City/Town/Outgrowth Status Population
State Statistical Handbook 2014 41

Urban
Male Female Total(1) (2) (3) (4) (5) (6)I. South 24-Parganas3 Ganye Gangadharpur (CT) 2677 2533 52104 Rameswarpur (CT) 3738 3462 72005 Asuti (CT) 3242 3030 62726 Hanspukuria (CT) 1888 1999 38877 Kalua (CT) 7715 8020 157358 Ramchandrapur (CT) 3191 3061 62529 Samali (CT) 3630 3550 718010 Uttar Raypur (CT) 11762 11322 2308411 Balarampur (CT) 2689 2562 525112 Buita (CT) 8486 8278 1676413 Benjanhari Acharial (P) (CT) 2609 2578 518714 Abhirampur (CT) 2303 2315 461815 Nischintapur (CT) 3231 3122 635316 Birlapur (CT) 11542 10536 2207817 Chak Kashipur (CT) 6373 5662 1203518 Chak Alampur (CT) 5662 5482 1114419 Bowali (CT) 5709 5259 1096820 Dakshin Raypur (CT) 7245 6831 1407621 Poali (CT) 4464 4193 865722 Daulatpur (CT) 3239 3329 656823 Bhasa (CT) 2888 2671 555924 Bishnupur (CT) 2561 2469 503025 Kanyanagar (CT) 5499 5324 1082326 Nahazari (CT) 8809 8613 1742227 Nadabhanga (CT) 3000 2927 5927
TABLE-1.7 (Contd.)Population of Cities, Towns and Urban Outgrowths in
West Bengal by District, Census 2011
Sl. No.
District/City/Town/Outgrowth Status Population
State Statistical Handbook 2014 42

Urban
Male Female Total(1) (2) (3) (4) (5) (6)I. South 24-Parganas28 Kanganbaria (CT) 3347 3310 665729 Bora Gagangohalia (CT) 2692 2582 527430 Chanddandaha (CT) 2896 2760 565631 Barkalikapur (CT) 2322 2328 465032 Patharberia (CT) 2459 2239 469833 Ramkrishnapur (CT) 3013 2958 597134 Amtala (CT) 4416 4349 876535 Kriparampur (CT) 1935 1843 377836 Chak Enayetnagar (CT) 3491 3263 675437 Radhanagar (CT) 3375 3300 667538 Danga (CT) 3503 3263 676639 Ramchandrapur (CT) 4188 4008 819640 Bidyadharpur (CT) 2327 2303 463041 Kalikapur (CT) 2977 2883 586042 Chak Baria (CT) 2520 2394 491443 Sahebpur (CT) 3642 3467 710944 Maricha (CT) 2456 2386 484245 Bhangar Raghunathpur (CT) 3025 3012 603746 Gobindapur (CT) 4992 4771 976347 Kalaria (CT) 5079 4996 1007548 Gaur Daha (CT) 2708 2552 526049 Banshra (CT) 14814 14707 2952150 Rajapur (CT) 4983 4771 975451 Taldi (CT) 6285 6174 1245952 Bayarsing (CT) 4219 4127 8346
TABLE-1.7 (Contd.)Population of Cities, Towns and Urban Outgrowths in
West Bengal by District, Census 2011
Sl. No.
District/City/Town/Outgrowth Status Population
State Statistical Handbook 2014 43

Urban
Male Female Total(1) (2) (3) (4) (5) (6)I. South 24-Parganas53 Matla (CT) 16248 15672 3192054 Dighirpar (CT) 8106 7775 1588155 Makhal Tala (CT) 5651 5541 1119256 Petua (CT) 4896 4700 959657 Garia (CT) 2410 2395 480558 Panchghara (CT) 3230 3110 634059 Mallikpur (CT) 9754 9366 1912060 Hariharpur (CT) 6038 5989 1202761 Champahati (CT) 6052 6059 1211162 Solgohalia (CT) 4724 4649 937363 Naridana (CT) 2151 2126 427764 Baruipur (P) (CT) 11396 11034 2243065 Salipur (P) (CT) 2594 2497 509166 Khodar Bazar (CT) 3325 3035 636067 Komarhat (CT) 2987 2795 578268 Dhamua (CT) 5166 4889 1005569 Shyampur (CT) 11415 10609 2202470 Nainan (CT) 3533 3239 677271 Uttar Kalas (CT) 3382 3092 647472 Dihi Kalas (CT) 5906 5588 1149473 Swangrampur (CT) 2918 2781 569974 Bilandapur (CT) 3164 3166 633075 Magrahat (CT) 8643 8749 1739276 Ajodhyanagar (CT) 2173 2236 440977 Sirakol (CT) 5184 5066 10250
TABLE-1.7 (Contd.)Population of Cities, Towns and Urban Outgrowths in
West Bengal by District, Census 2011
Sl. No.
District/City/Town/Outgrowth Status Population
State Statistical Handbook 2014 44

Urban
Male Female Total(1) (2) (3) (4) (5) (6)I. South 24-Parganas78 Uttar Bishnupur (CT) 2450 2253 470379 Ghola Noapara (CT) 3252 2958 621080 Usthi (CT) 3173 3057 623081 Barijpur (CT) 2941 2595 553682 Uttar Kusum (CT) 5580 5136 1071683 Kalikapota (CT) 6736 6350 1308684 Bamna (CT) 2334 2183 451785 Hasimnagar (CT) 2689 2578 526786 Baneshwarpur (CT) 2423 2318 474187 Chandpala Anantapathpur (CT) 2711 2575 528688 Fatepur (CT) 4117 3988 810589 Masat (CT) 2984 2855 583990 Sangrampur (CT) 2896 2768 566491 Mohanpur (CT) 2502 2343 484592 Durganagar (CT) 2403 2255 465893 Patdaha (CT) 2552 2441 499394 Berandari Bagaria (CT) 5462 5286 1074895 Dhola (CT) 2952 2852 580496 Chandpur (CT) 3533 3244 677797 Bangsidharpur (P) (CT) 2704 2514 521898 Purba Bishnupur (CT) 6660 6400 1306099 Purba Ranaghat (CT) 2705 2502 5207
100 Lalpur (CT) 2436 2255 4691101 Krishna Chandrapur (CT) 4269 3877 8146102 Mathurapur (CT) 3970 3827 7797
TABLE-1.7 (Contd.)Population of Cities, Towns and Urban Outgrowths in
West Bengal by District, Census 2011
Sl. No.
District/City/Town/Outgrowth Status Population
State Statistical Handbook 2014 45

Urban
Male Female Total(1) (2) (3) (4) (5) (6)I. South 24-Parganas
103 Raynagar (CT) 2811 2782 5593104 Kalikapur Barasat (CT) 3103 3001 6104105 Baharu (CT) 8319 7836 16155106 Uttarparanij (CT) 3491 3319 6810107 Alipur (CT) 2938 2999 5937108 Uttar Durgapur (CT) 2937 2786 5723109 Nimpith (CT) 4069 3945 8014110 Tulshighata (CT) 2244 2122 4366111 Basanti (CT) 3447 3178 6625112 Maheshtala (M) 229693 218624 448317113 Budge Budge (M) 39510 37327 76837114 Pujali (M) 18940 18107 37047115 Rajpur Sonarpur (M) 215405 208963 424368116 Baruipur (M) 26718 26410 53128117 Diamond Harbour (M) 21050 20752 41802118 Jaynagar Mazilpur (M) 13234 12688 25922J. Howrah 1591300 1482844 30741441 Ghoraberia (CT) 2367 2245 46122 Paschim Gazipur (CT) 2812 2597 54093 Pashchim Khalna (CT) 3017 2796 58134 Kanpur (CT) 3093 2976 60695 Basantapur (CT) 6791 6392 131836 Deora (CT) 3477 3238 67157 Amta (CT) 8454 8245 166998 Chandrapur (CT) 3325 3131 6456
TABLE-1.7 (Contd.)Population of Cities, Towns and Urban Outgrowths in
West Bengal by District, Census 2011
Sl. No.
District/City/Town/Outgrowth Status Population
State Statistical Handbook 2014 46

Urban
Male Female Total(1) (2) (3) (4) (5) (6)J. Howrah9 Bhandar Gachha (CT) 3145 3011 615610 Udang (CT) 3493 3254 674711 Jagatballavpur (CT) 3636 3477 711312 Kamalapur (CT) 1706 1642 334813 Bankul (CT) 3512 3267 677914 Mansinhapur (CT) 3109 2895 600415 Bargachhia (CT) 2486 2386 487216 Dakshin Santoshpur (CT) 5439 5161 1060017 Patihal (CT) 6906 6667 1357318 Anantabati (CT) 4760 4411 917119 Chong Ghurali (CT) 2416 2180 459620 Ekabbarpur (CT) 2608 2579 518721 Uttar Jhapardaha (CT) 4177 4248 842522 Dafarpur (CT) 2678 2783 546123 Baluhati (CT) 2189 2174 436324 Domjur (CT) 9040 9393 1843325 Dakshin Jhapardaha (CT) 6892 6812 1370426 Rudrapur (CT) 3469 3341 681027 Khantora (CT) 3331 3216 654728 Bhandardaha (CT) 2873 2794 566729 Makardaha (CT) 4428 4285 871330 Kantlia (CT) 4879 4688 956731 Tentulkuli (CT) 3685 3518 720332 Salap (CT) 7826 7345 1517133 Bankra (CT) 33079 30878 63957
TABLE-1.7 (Contd.)Population of Cities, Towns and Urban Outgrowths in
West Bengal by District, Census 2011
Sl. No.
District/City/Town/Outgrowth Status Population
State Statistical Handbook 2014 47

Urban
Male Female Total(1) (2) (3) (4) (5) (6)J. Howrah34 Nibra (CT) 14388 13430 2781835 Ankurhati (CT) 5750 5380 1113036 Bipra Noapara (CT) 4743 4665 940837 Begari (CT) 2848 2657 550538 Kesabpur (CT) 6130 5943 1207339 Oadipur (CT) 2589 2413 500240 Natibpur (CT) 3663 3549 721241 Kalara (CT) 14102 13108 2721042 Baniara (CT) 2815 2661 547643 Mahiari (CT) 9209 9014 1822344 Jagadishpur (CT) 8337 7922 1625945 Jaypur Bil (CT) 4891 4707 959846 Bally (CT) 58530 54847 11337747 Chakapara (CT) 18352 16930 3528248 Chamrail (CT) 6083 5840 1192349 Eksara (CT) 3834 3666 750050 Khalia (CT) 3165 3100 626551 Dhulagari (CT) 12304 11436 2374052 Mirjapur (CT) 2634 2480 511453 Argari (CT) 5555 5160 1071554 Andul (CT) 3182 3120 630255 Dhuilya (CT) 10569 10393 2096256 Kamranga (CT) 2373 2212 458557 Jhorhat (CT) 8655 8285 1694058 Masila (CT) 6260 5979 12239
TABLE-1.7 (Contd.)
Population of Cities, Towns and Urban Outgrowths in West Bengal by District, Census 2011
Sl. No.
District/City/Town/Outgrowth Status Population
State Statistical Handbook 2014 48

Urban
Male Female Total(1) (2) (3) (4) (5) (6)J. Howrah59 Kendua (CT) 3250 3088 633860 Nabghara (CT) 2990 2885 587561 Ramchandrapur (CT) 5284 5028 1031262 Hatgachha (CT) 3086 2894 598063 Panchpara (CT) 9976 9307 1928364 Podara (CT) 11220 10369 2158965 Banupur (CT) 5210 4416 962666 Sankrail (CT) 14919 14195 2911467 Sankrailjala (CT) 4489 4323 881268 Osmanpur (CT) 2649 2640 528969 Manikpur (CT) 10392 9412 1980470 Sarenga (CT) 12798 12402 2520071 Ula (CT) 3433 3305 673872 Nalpur (CT) 3470 3441 691173 Raghudebbati (CT) 7215 6950 1416574 Kuldanga (CT) 3974 3768 774275 Gondalpara (CT) 2275 2199 447476 Khasjalalsi (CT) 2622 2489 511177 Deulpur (CT) 6464 6154 1261878 Kusadanga (CT) 2792 2642 543479 Gangadharpur (CT) 3858 3675 753380 Jujarsaha (CT) 11012 10808 2182081 Shuvararah (CT) 7347 6983 1433082 Mallik Bagan (CT) 4568 4301 886983 Jaynagar (CT) 3581 3396 6977
TABLE-1.7 (Contd.)Population of Cities, Towns and Urban Outgrowths in
West Bengal by District, Census 2011
Sl. No.
District/City/Town/Outgrowth Status Population
State Statistical Handbook 2014 49

Urban
Male Female Total(1) (2) (3) (4) (5) (6)J. Howrah84 Jala Kendua (CT) 3375 3283 665885 Beldubi (CT) 5568 5303 1087186 Paniara (CT) 3961 3826 778787 Bikihakola (CT) 7517 7023 1454088 Gabberia (CT) 2988 2835 582389 Dhunki (CT) 5075 4709 978490 Ban Harishpur (CT) 8237 7830 1606791 Paschim Panchla (CT) 3551 3400 695192 Panchla (CT) 13573 12859 2643293 Sahapur (CT) 4675 4347 902294 Baniban Jagadishpur (CT) 3771 3631 740295 Kantaberia (CT) 5882 5625 1150796 Tehatta (CT) 6426 6344 1277097 Basudebpur (CT) 6657 6434 1309198 Raghudebpur (CT) 3622 3459 708199 Santoshpur (CT) 3879 3816 7695
100 Ghosal Chak (CT) 2936 2745 5681101 Balarampota (CT) 2853 2691 5544102 Khalisani (CT) 6631 6339 12970103 Brindabanpur (CT) 6415 6168 12583104 Uttar Pirpur (CT) 3049 2819 5868105 Baniban (CT) 3383 3214 6597106 Mahishrekha (CT) 1052 965 2017107 Chandipur (CT) 3328 3160 6488108 Kaijuri (CT) 3007 2925 5932
TABLE-1.7 (Contd.)Population of Cities, Towns and Urban Outgrowths in
West Bengal by District, Census 2011
Sl. No.
District/City/Town/Outgrowth Status Population
State Statistical Handbook 2014 50

Urban
Male Female Total(1) (2) (3) (4) (5) (6)J. Howrah
109 Alipukur (CT) 2860 2692 5552110 Dhulasimla (CT) 2734 2728 5462111 Hirapur (CT) 3630 3547 7177112 Deulgram (CT) 3369 3148 6517113 Karia (CT) 2424 2313 4737114 Paschim Bainan (CT) 6326 6079 12405115 Kalyanpur (CT) 4616 4298 8914116 Khajutti (CT) 3836 3544 7380117 Bangalpur (CT) 3475 3285 6760118 Chandrapur (CT) 2436 2306 4742119 Khadinan (CT) 4717 4580 9297120 Bagnan (CT) 5536 5460 10996121 Khalor (CT) 4864 4772 9636122 Naupala (CT) 4035 3821 7856123 Barunda (CT) 3841 3693 7534124 Kulitapara (CT) 3013 2882 5895125 Kanaipur (CT) 2438 2344 4782126 Batul (CT) 2360 2347 4707127 Mugkalyan (CT) 4060 3901 7961128 Halyan (CT) 3373 3264 6637129 Shyampur (CT) 3730 3624 7354130 Dinga Khola (CT) 2703 2568 5271131 Radhapur (CT) 2331 2292 4623132 Jallabad (CT) 2759 2622 5381133 Naul (CT) 2992 2873 5865
TABLE-1.7 (Contd.)Population of Cities, Towns and Urban Outgrowths in
West Bengal by District, Census 2011
Sl. No.
District/City/Town/Outgrowth Status Population
State Statistical Handbook 2014 51

Urban
Male Female Total(1) (2) (3) (4) (5) (6)J. Howrah
134 Shashati (CT) 3545 3369 6914135 Dihimandalghat (CT) 4081 3829 7910136 Bally (M) 156911 136462 293373137 Haora (M Corp) 561220 515855 1077075138 Uluberia (OG) 6818 6287 13105139 Uluberia (M) 113923 108317 222240K. Nadia 732656 706217 14388731 Karimpur (CT) 4930 4731 96612 Uttampur (CT) 6627 6373 130003 Mira (CT) 7346 7045 143914 Matiari (CT) 7332 6961 142935 Jagadanandapur (CT) 12098 11724 238226 Kshidirpur (CT) 5429 5127 105567 Chapra (CT) 7161 6962 141238 Harindanga (CT) 2788 2652 54409 Bamanpukur (CT) 4656 4481 9137
10 Tiorkhali (CT) 5663 5485 1114811 Bablari Dewanganj (CT) 3431 3375 680612 Gadigachha (CT) 7237 6848 1408513 Majdia (CT) 4009 3822 783114 Char Maijdia (CT) 2599 2414 501315 Char Brahmanagar (CT) 2586 2467 505316 Sonda (P) (CT) 2316 2195 451117 Baruihuda (CT) 5864 5610 1147418 Paschimbhatjangla (CT) 6667 6296 12963
TABLE-1.7 (Contd.)Population of Cities, Towns and Urban Outgrowths in
West Bengal by District, Census 2011
Sl. No.
District/City/Town/Outgrowth Status Population
State Statistical Handbook 2014 52

Urban
Male Female Total(1) (2) (3) (4) (5) (6)K. Nadia19 Bagula (CT) 11631 11018 2264920 Badkulla (CT) 9140 8911 1805121 Patuli (CT) 3298 3143 644122 Nrisinghapur (CT) 5891 5445 1133623 Harinadibhastsala (CT) 2543 2440 498324 Ghoralia (CT) 2776 2492 526825 Beharia (CT) 5013 4571 958426 Phulia (CT) 28695 26958 5565327 Gangni (CT) 2780 2752 553228 Kamgachhi (CT) 10285 9713 1999829 Raghabpur (CT) 5153 5127 1028030 Panpara (CT) 2677 2672 534931 Aistala (CT) 10701 9961 2066232 Satigachha (CT) 4994 4853 984733 Anulia (CT) 2650 2570 522034 Gopalpur (CT) 3920 3898 781835 Parbbatipur (CT) 4855 4729 958436 Halalpur Krishnapur (CT) 2676 2526 520237 Hijuli (CT) 7174 6795 1396938 Ranaghat (CT) 1985 1997 398239 Nasra (CT) 5399 5308 1070740 Gangnapur (CT) 5102 5066 1016841 Belgharia (CT) 3042 2816 585842 Punglia (CT) 3461 3396 685743 Darappur (CT) 4307 3968 8275
TABLE-1.7 (Contd.)Population of Cities, Towns and Urban Outgrowths in
West Bengal by District, Census 2011
Sl. No.
District/City/Town/Outgrowth Status Population
State Statistical Handbook 2014 53

Urban
Male Female Total(1) (2) (3) (4) (5) (6)K. Nadia44 Lalpur (P) (CT) 4241 4295 853645 Chanduria (CT) 6453 6247 1270046 Simurali (CT) 2509 2518 502747 Priyanagar (CT) 2848 2915 576348 Jangal (CT) 2651 2455 510649 Madanpur (CT) 6993 6682 1367550 Saguna (P) (CT) 7717 7274 1499151 Kulia (P) (CT) 5434 4972 1040652 Haringhata Farm (CT) 1971 2018 398953 Simhat (CT) 3754 3191 694554 Subarnapur (CT) 2899 2860 575955 Digha (CT) 3456 3460 691656 Nabadwip (M) 65415 60128 12554357 Krishnanagar (M) 77146 75916 15306258 Santipur (M) 77011 74766 15177759 Taherpur (OG) 8768 8377 1714560 Taherpur (NA) 10642 10252 2089461 Birnagar (M) 15658 15141 3079962 Ranaghat (M) 37948 37417 7536563 Cooper's Camp (OG) 2091 2185 427664 Cooper's Camp (NA) 9579 9264 1884365 Chakdaha (M) 48047 47156 9520366 Kalyani (M) 50727 49848 10057567 Gayespur (M) 29811 29187 58998
TABLE-1.7 (Contd.)Population of Cities, Towns and Urban Outgrowths in
West Bengal by District, Census 2011
Sl. No.
District/City/Town/Outgrowth Status Population
State Statistical Handbook 2014 54

Urban
Male Female Total(1) (2) (3) (4) (5) (6)L. Murshidabad 709742 690950 14006921 Farakka Barrage Township (CT) 10430 9696 201262 Srimantapur (P) (CT) 2253 2121 43743 Benia Gram (CT) 7721 7325 150464 Arjunpur (CT) 3076 2966 60425 Sibnagar (CT) 3445 3367 68126 Mamrejpur (CT) 4961 4890 98517 Paranpara (CT) 11181 11116 222978 Mahadeb Nagar (CT) 10857 10880 217379 Anup Nagar (CT) 6425 6515 12940
10 Jafrabad (CT) 14253 14079 2833211 Kankuria (CT) 18157 18768 3692512 Uttar Mahammadpur (CT) 4100 4164 826413 Chachanda (CT) 7194 7050 1424414 Dhusaripara (CT) 8822 8978 1780015 Serpur (CT) 4452 4448 890016 Kohetpur (CT) 2714 2665 537917 Bhasaipaikar (CT) 11589 11552 2314118 Jaykrishnapur (CT) 6299 6300 1259919 Basudebpur (CT) 3497 3333 683020 Madna (CT) 3143 3169 631221 Ramakantapur (CT) 3213 3134 634722 Nayabahadurpur (CT) 4787 4452 923923 Fatellapur (CT) 3715 3492 720724 Jagtaj (CT) 5621 5640 1126125 Debipur (CT) 3307 3199 6506
TABLE-1.7 (Contd.)Population of Cities, Towns and Urban Outgrowths in
West Bengal by District, Census 2011
Sl. No.
District/City/Town/Outgrowth Status Population
State Statistical Handbook 2014 55

Urban
Male Female Total(1) (2) (3) (4) (5) (6)L. Murshidabad26 Aurangabad (CT) 19474 19787 3926127 Mahendrapur (CT) 3482 3497 697928 Hafania (CT) 4150 4021 817129 Dafahat (CT) 7817 7871 1568830 Paschim Punropara (CT) 20232 20451 4068331 Ichhlampur (CT) 3013 3002 601532 Chakmeghoan (CT) 2718 2642 536033 Kakramari (CT) 4787 4636 942334 Khanpur (CT) 2733 2777 551035 Khidirpur (CT) 2777 2749 552636 Bhabki (CT) 4094 3678 777237 Ghorsala (CT) 4077 3760 783738 Srikantabati (CT) 7267 6760 1402739 Charka (CT) 4319 4132 845140 Dafarpur (CT) 8470 8117 1658741 Ramnagar (CT) 4906 4622 952842 Mirzapur (CT) 3120 2963 608343 Giria (CT) 8805 8326 1713144 Mithipur (CT) 7847 7413 1526045 Jot Kamal (CT) 3976 3709 768546 Osmanpur (CT) 5432 5080 1051247 Sahajadpur (CT) 11966 11314 2328048 Khodarampur (CT) 3739 3538 727749 Donalia (CT) 3043 3038 608150 Teghari (CT) 12767 12291 25058
TABLE-1.7 (Contd.)Population of Cities, Towns and Urban Outgrowths in
West Bengal by District, Census 2011
Sl. No.
District/City/Town/Outgrowth Status Population
State Statistical Handbook 2014 56

Urban
Male Female Total(1) (2) (3) (4) (5) (6)L. Murshidabad51 Krishna Sali (CT) 5466 5276 1074252 Bara Jumla (CT) 5664 5410 1107453 Islampur (CT) 7655 7364 1501954 Harharia Chak (CT) 4747 4664 941155 Goaljan (CT) 2446 2404 485056 Kasim Bazar (CT) 5978 5746 1172457 Banjetia (CT) 5340 5060 1040058 Sibdanga Badarpur (CT) 6516 6313 1282959 Gopjan (CT) 11924 11491 2341560 Gora Bazar (CT) 2643 2557 520061 Ajodhya Nagar (P) (CT) 4472 4411 888362 Chaltia (CT) 12803 12533 2533663 Haridasmati (CT) 3399 3228 662764 Barua (P) (CT) 4521 4331 885265 Salar (CT) 11651 11243 2289466 Dhulian (M) 47635 48071 9570667 Jangipur (M) 44949 43216 8816568 Jiaganj-Azimganj (M) 26150 25640 5179069 Murshidabad (M) 22177 21842 4401970 Kandi (M) 28442 27190 5563271 Berhampore (M) 100247 94976 19522372 Beldanga (M) 14694 14511 29205M. Uttar Dinajpur 188597 173631 3622281 Chopra (CT) 2997 2780 57772 Hanskunda (CT) 3065 2874 5939
TABLE-1.7 (Contd.)Population of Cities, Towns and Urban Outgrowths in
West Bengal by District, Census 2011
Sl. No.
District/City/Town/Outgrowth Status Population
State Statistical Handbook 2014 57
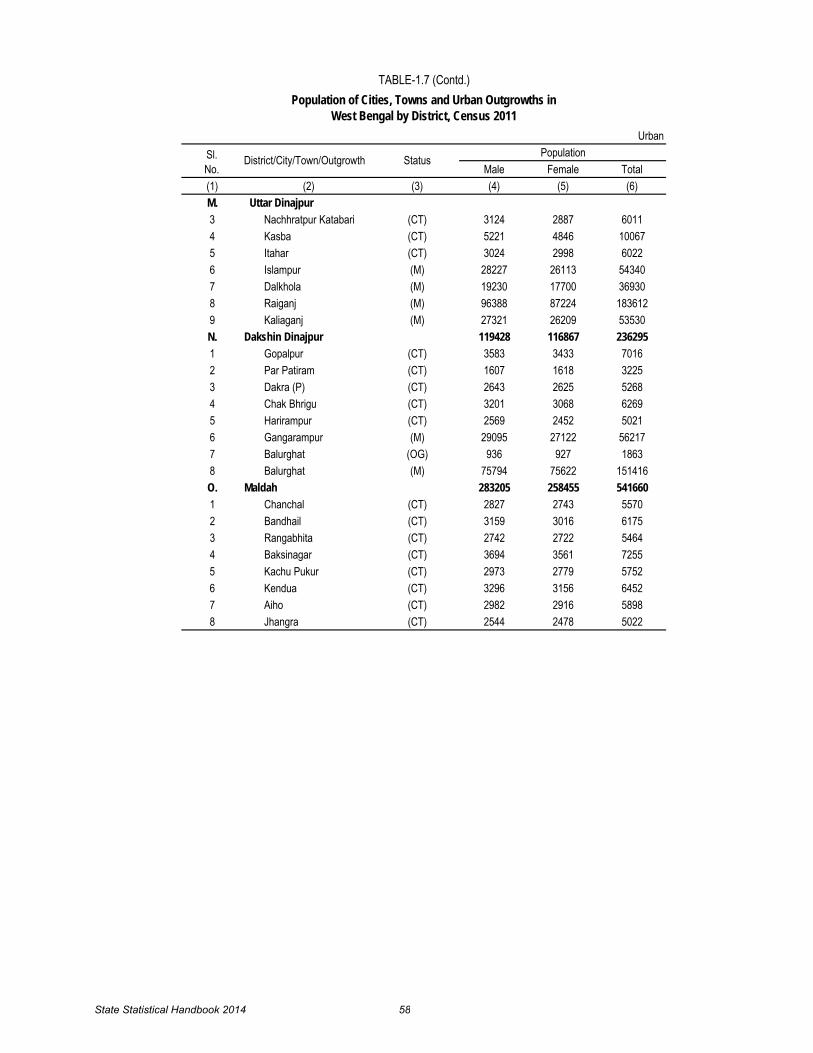
Urban
Male Female Total(1) (2) (3) (4) (5) (6)M. Uttar Dinajpur3 Nachhratpur Katabari (CT) 3124 2887 60114 Kasba (CT) 5221 4846 100675 Itahar (CT) 3024 2998 60226 Islampur (M) 28227 26113 543407 Dalkhola (M) 19230 17700 369308 Raiganj (M) 96388 87224 1836129 Kaliaganj (M) 27321 26209 53530N. Dakshin Dinajpur 119428 116867 2362951 Gopalpur (CT) 3583 3433 70162 Par Patiram (CT) 1607 1618 32253 Dakra (P) (CT) 2643 2625 52684 Chak Bhrigu (CT) 3201 3068 62695 Harirampur (CT) 2569 2452 50216 Gangarampur (M) 29095 27122 562177 Balurghat (OG) 936 927 18638 Balurghat (M) 75794 75622 151416O. Maldah 283205 258455 5416601 Chanchal (CT) 2827 2743 55702 Bandhail (CT) 3159 3016 61753 Rangabhita (CT) 2742 2722 54644 Baksinagar (CT) 3694 3561 72555 Kachu Pukur (CT) 2973 2779 57526 Kendua (CT) 3296 3156 64527 Aiho (CT) 2982 2916 58988 Jhangra (CT) 2544 2478 5022
TABLE-1.7 (Contd.)Population of Cities, Towns and Urban Outgrowths in
West Bengal by District, Census 2011
Sl. No.
District/City/Town/Outgrowth Status Population
State Statistical Handbook 2014 58

Urban
Male Female Total(1) (2) (3) (4) (5) (6)O. Maldah 9 Chhatianmor (CT) 2856 2726 5582
10 Sahapur (CT) 5082 4824 990611 Milki (CT) 6528 6053 1258112 Sonatala (CT) 5309 5280 1058913 Bagbari (CT) 4574 4086 866014 Chhota Suzapur (CT) 5808 5408 1121615 Nazirpur (CT) 4528 4250 877816 Bara Suzapur (CT) 8129 7679 1580817 Chaspara (CT) 3963 3768 773118 Jalalpur (CT) 2831 2629 546019 Bamangram (CT) 6905 6645 1355020 Jadupur (CT) 3918 3667 758521 Silampur (CT) 6404 6260 1266422 Baliadanga (CT) 6340 6039 1237923 Alipur (CT) 8841 8506 1734724 Karari Chandpur (CT) 5571 5370 1094125 Birodhi (CT) 1944 1894 383826 Jagannathpur (CT) 6843 6611 1345427 Krishnapur (CT) 8370 8100 1647028 Old Malda (M) 47420 36592 8401229 English Bazar (M) 106824 98697 205521P. Jalpaiguri 545778 514573 10603511 Dabgram (CT) 61078 57962 1190402 Binnaguri (CT) 30258 28582 588403 Chakiabhita (CT) 2720 2531 5251
TABLE-1.7 (Contd.)
Population of Cities, Towns and Urban Outgrowths in West Bengal by District, Census 2011
Sl. No.
District/City/Town/Outgrowth Status Population
State Statistical Handbook 2014 59
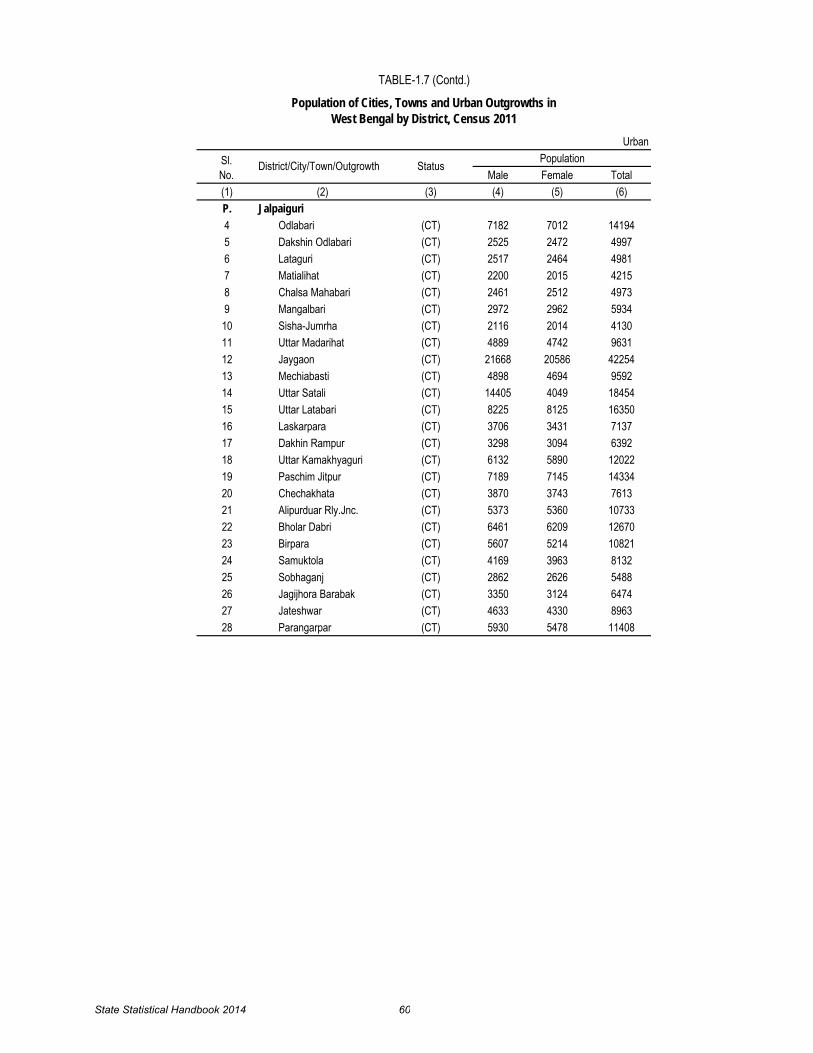
Urban
Male Female Total(1) (2) (3) (4) (5) (6)P. Jalpaiguri4 Odlabari (CT) 7182 7012 141945 Dakshin Odlabari (CT) 2525 2472 49976 Lataguri (CT) 2517 2464 49817 Matialihat (CT) 2200 2015 42158 Chalsa Mahabari (CT) 2461 2512 49739 Mangalbari (CT) 2972 2962 593410 Sisha-Jumrha (CT) 2116 2014 413011 Uttar Madarihat (CT) 4889 4742 963112 Jaygaon (CT) 21668 20586 4225413 Mechiabasti (CT) 4898 4694 959214 Uttar Satali (CT) 14405 4049 1845415 Uttar Latabari (CT) 8225 8125 1635016 Laskarpara (CT) 3706 3431 713717 Dakhin Rampur (CT) 3298 3094 639218 Uttar Kamakhyaguri (CT) 6132 5890 1202219 Paschim Jitpur (CT) 7189 7145 1433420 Chechakhata (CT) 3870 3743 761321 Alipurduar Rly.Jnc. (CT) 5373 5360 1073322 Bholar Dabri (CT) 6461 6209 1267023 Birpara (CT) 5607 5214 1082124 Samuktola (CT) 4169 3963 813225 Sobhaganj (CT) 2862 2626 548826 Jagijhora Barabak (CT) 3350 3124 647427 Jateshwar (CT) 4633 4330 896328 Parangarpar (CT) 5930 5478 11408
TABLE-1.7 (Contd.)
Population of Cities, Towns and Urban Outgrowths in West Bengal by District, Census 2011
Sl. No.
District/City/Town/Outgrowth Status Population
State Statistical Handbook 2014 60

Urban
Male Female Total(1) (2) (3) (4) (5) (6)P. Jalpaiguri29 Falakata (CT) 10022 9694 1971630 Banarhat Tea Garden (CT) 7965 7687 1565231 Telipara Tea Garden (D) (CT) 5708 5827 1153532 Gairkata (CT) 3827 3750 757733 Mainaguri (CT) 15487 15003 3049034 Dakshin Khagrabari (CT) 3786 3683 746935 Kharia (P) (CT) 31510 30151 6166136 Siliguri (P) (M Corp.) 112167 106551 21871837 Mal (M) 12814 12404 2521838 Jalpaiguri (M) 53708 53633 10734139 Dhupguri (M) 22953 21766 4471940 Alipurduar (M) 33137 32095 65232Q. Darjeeling 370294 357669 7279631 Badamtam Tea Garden (CT) 2987 3115 61022 Ging Tea Garden (CT) 2037 2052 40893 Chongtong Tea Garden (CT) 2876 2926 58024 Singtam Tea Garden (CT) 2850 2942 57925 Dungra Khasmahal (CT) 3276 3513 67896 Sukhiapokhri (CT) 2184 2266 44507 Sonada Khasmahal (CT) 5793 5842 116358 Rongmook Ceder Tea Gard (CT) 2528 2622 51509 Mangarjung Tea Garden (Na (CT) 2758 2886 5644
10 Cart Road (CT) 7116 7328 1444411 Kalkut (CT) 4765 4419 918412 Tari (CT) 7335 7223 14558
TABLE-1.7 (Contd.)Population of Cities, Towns and Urban Outgrowths in
West Bengal by District, Census 2011
Sl. No.
District/City/Town/Outgrowth Status Population
State Statistical Handbook 2014 61

Urban
Male Female Total(1) (2) (3) (4) (5) (6)Q. Darjeeling13 Bairatisal (CT) 2452 2464 491614 Jitu (CT) 2886 3006 589215 Mathapari (CT) 5903 5626 1152916 Bara Mohansingh (CT) 7798 7818 1561617 Dumriguri (CT) 6951 6465 1341618 Uttar Bagdogra (CT) 13781 11263 2504419 Geni (CT) 4459 4288 874720 Bhimram (CT) 5691 5367 1105821 Lalman (CT) 3590 3304 689422 Dakshin Bagdogra (CT) 1301 1346 264723 Shyamdhan (CT) 2655 2537 519224 Kharibari (CT) 3389 3271 666025 Darjiling (M) 59187 59618 11880526 Kalimpong (M) 25100 24303 4940327 Mirik (NA) 5688 5825 1151328 Kurseong (M) 21423 21023 4244629 Siliguri (Part) (M. Corp.) 151535 143011 294546R. Cooch Behar 146626 142808 2894341 Nagar Changrabandha (CT) 2251 2232 44832 Kharimala Khagrabari (CT) 3936 3908 78443 Guriahati (CT) 10647 10417 210644 Dhaliabari (CT) 2265 2118 43835 Baneswar (CT) 2534 2307 48416 Khagrabari (CT) 11733 11389 231227 Baisguri (CT) 2577 2444 5021
TABLE-1.7 (Contd.)Population of Cities, Towns and Urban Outgrowths in
West Bengal by District, Census 2011
Sl. No.
District/City/Town/Outgrowth Status Population
State Statistical Handbook 2014 62

Urban
Male Female Total(1) (2) (3) (4) (5) (6)R. Cooch Behar8 Chakchaka (CT) 4426 4156 85829 Takagach (CT) 6375 6043 1241810 Kamat Phulbari (P) (CT) 2743 2596 533911 Chhota Laukuthi (CT) 2791 2689 548012 Bhangri Pratham Khanda (CT) 2277 2102 437913 Haldibari (M) 7306 7098 1440414 Mekliganj (M) 4664 4463 912715 Mathabhanga (M) 12059 11831 2389016 Koch Bihar (M) 39014 38921 7793517 Tufanganj (M) 10684 10314 2099818 Dinhata (M) 18344 17780 36124
M. Corp.= Municipal CorporationM = MunicipalityCT = Census TownCB = Cantonment BoardNA = Notified AreaOG = OutgrowthITS = Industrial Township
Source: Primary Census Abstract, 2011
TABLE-1.7 (Contd.)Population of Cities, Towns and Urban Outgrowths in
West Bengal by District, Census 2011
Sl. No.
District/City/Town/Outgrowth Status Population
State Statistical Handbook 2014 63
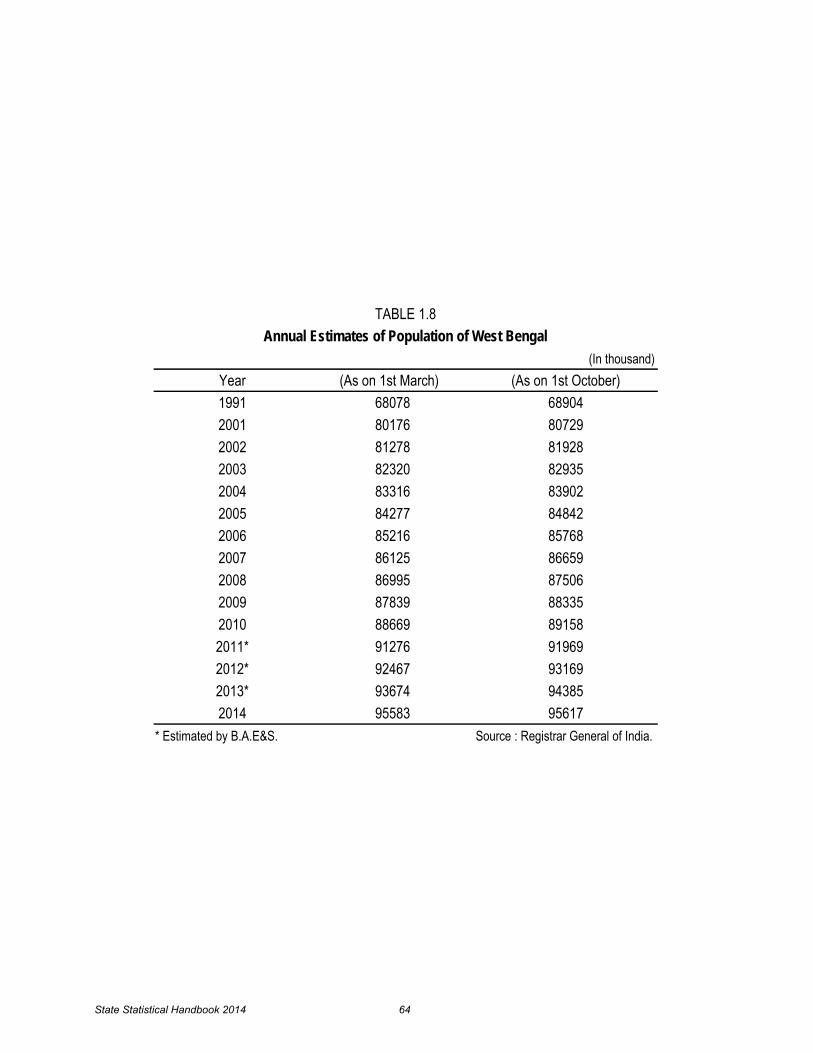
(In thousand)(As on 1st March) (As on 1st October)
68078 6890480176 8072981278 8192882320 8293583316 8390284277 8484285216 8576886125 8665986995 8750687839 8833588669 8915891276 9196992467 9316993674 9438595583 95617
* Estimated by B.A.E&S. Source : Registrar General of India.
TABLE 1.8Annual Estimates of Population of West Bengal
Year1991200120022003200420052006
2012*2013*2014
20072008200920102011*
State Statistical Handbook 2014 64
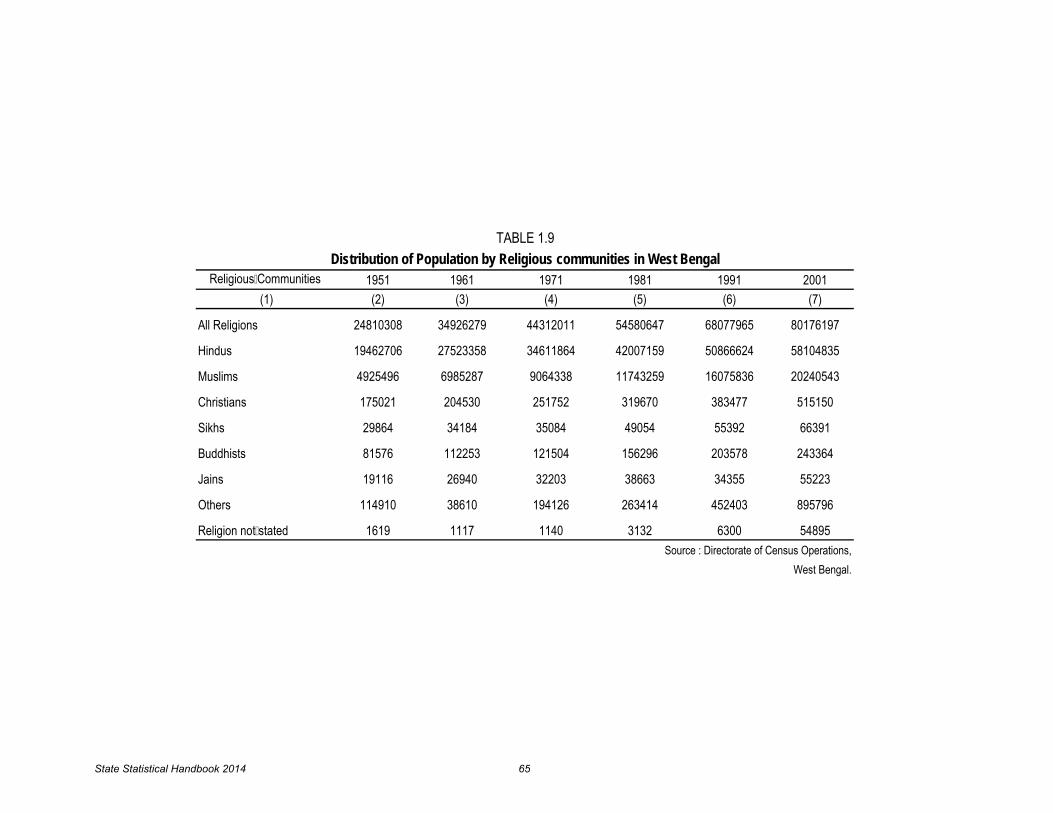
Religious Communities 1951 1961 1971 1981 1991 2001(1) (2) (3) (4) (5) (6) (7)
All Religions 24810308 34926279 44312011 54580647 68077965 80176197
Hindus 19462706 27523358 34611864 42007159 50866624 58104835
Muslims 4925496 6985287 9064338 11743259 16075836 20240543
Christians 175021 204530 251752 319670 383477 515150
Sikhs 29864 34184 35084 49054 55392 66391
Buddhists 81576 112253 121504 156296 203578 243364
Jains 19116 26940 32203 38663 34355 55223
Others 114910 38610 194126 263414 452403 895796
Religion not stated 1619 1117 1140 3132 6300 54895
TABLE 1.9Distribution of Population by Religious communities in West Bengal
West Bengal.Source : Directorate of Census Operations,
State Statistical Handbook 2014 65

Primary School
Middle School
Secondary School
Senior Secondary School
College (Arts & Science
Engineering College
Medicine College
(1) (2) (3) (4) (5) (6) (7) (8)West Bengal 32128 10135 6407 3685 276 63 71Burdwan 2309 764 569 302 34 2 20Birbhum 2021 644 371 181 9 2 1Bankura 3042 831 444 268 25 5 4Purba Midnapore 2602 850 546 323 12 3 5Paschim Midnapore 5224 1037 696 297 34 7 13Howrah 632 261 195 132 5 - -Hooghly 1697 537 387 213 13 3 1Purulia 2250 592 328 179 39 17 10North 24 Parganas 1460 602 439 302 9 1 -South 24 Parganas 1888 785 550 327 30 12 7Nadia 1153 489 287 217 9 2 -Murshidabad 1742 780 431 266 17 2 3Uttar Dinajpore 1329 333 171 123 3 - 1Dakshin Dinajpore 1191 246 172 88 8 5 5Malda 1344 496 297 179 3 - -Jalpaiguri 698 330 190 100 14 1 -Darjeerling 534 198 118 52 6 1 1Cooch Behar 1012 360 216 136 6 - -
Source: DCHB Village Data, Census 2011
Number of Villages having Educational facilities within villagesDistrict
Table 1.10
Districtwise Educational Facilities in West Bengal, Census 2011
State Statistical Handbook 2014 66
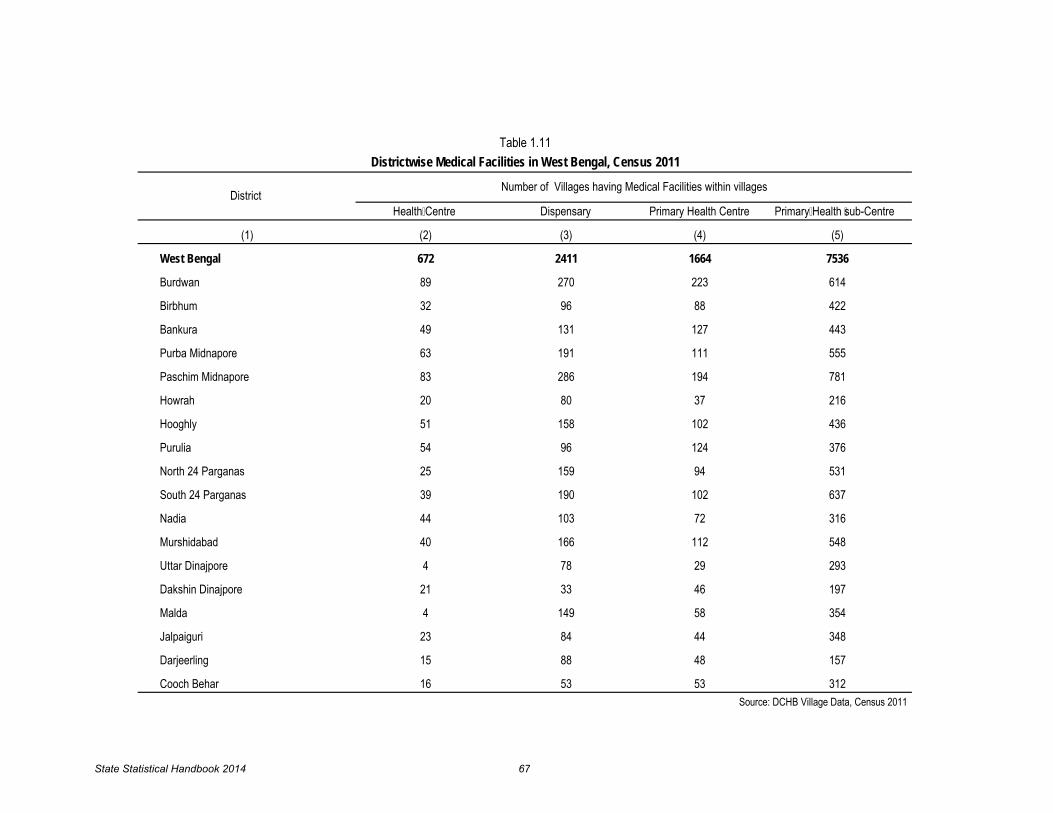
Health Centre Dispensary Primary Health Centre Primary Health sub-Centre
(1) (2) (3) (4) (5)
West Bengal 672 2411 1664 7536
Burdwan 89 270 223 614
Birbhum 32 96 88 422
Bankura 49 131 127 443
Purba Midnapore 63 191 111 555
Paschim Midnapore 83 286 194 781
Howrah 20 80 37 216
Hooghly 51 158 102 436
Purulia 54 96 124 376
North 24 Parganas 25 159 94 531
South 24 Parganas 39 190 102 637
Nadia 44 103 72 316
Murshidabad 40 166 112 548
Uttar Dinajpore 4 78 29 293
Dakshin Dinajpore 21 33 46 197
Malda 4 149 58 354
Jalpaiguri 23 84 44 348
Darjeerling 15 88 48 157
Cooch Behar 16 53 53 312Source: DCHB Village Data, Census 2011
District
Table 1.11Districtwise Medical Facilities in West Bengal, Census 2011
Number of Villages having Medical Facilities within villages
State Statistical Handbook 2014 67

Number
Particulars 1991 2001 2008 2009 2010 2011 2012 2013
(1) (2) (3) (4) (5) (6) (7) (8) (9)
1. Birth rates(per thousand population)
Rural 30.3 22.9 19.4 19.1 18.6 18.1 17.8 17.7
Urban 18.5 13.8 12.4 12.1 11.9 11.5 11.5 11.4
Combined 27.0 20.6 17.5 17.2 16.8 16.3 16.1 16.0
2. Death rates (per thousand population)
Rural 8.9 7.2 6.1 6.1 6.0 6.1 6.3 6.3
Urban 6.7 6.4 6.6 6.4 6.3 6.5 6.6 6.6
Combined 8.3 7.0 6.2 6.2 6.0 6.2 6.3 6.4
3. Infant mortality rates(per thousand live birth)
Rural 76 54 37 34 32 33 33 32
Urban 47 37 29 27 25 26 26 26
Combined 71 51 35 33 31 32 32 31 Source : Sample Registration System,
Registrar General of India.
Birth (live), Death and Infant Mortality Rates for West BengalTABLE 2.0
State Statistical Handbook 2014 68

Year Rural Urban Combined Rural Urban Combined(1) (2) (3) (4) (5) (6) (7)
1990-92 30.1 17.8 26.6 9.0 6.8 8.41991-93 29.0 17.7 25.8 8.8 5.9 8.01992-94 28.2 17.4 25.2 8.8 6.0 8.01993-95 27.6 17.5 24.8 8.5 6.2 7.91994-96 26.5 16.8 23.9 8.3 7.2 8.01995-97 25.4 16.2 22.9 8.0 7.2 7.81996-98 24.5 15.7 22.2 7.9 7.2 7.71997-99 23.7 15.1 21.5 7.6 7.0 7.41998-00 23.1 14.5 20.9 7.4 6.9 7.21999-01 22.9 14.1 20.6 7.2 6.6 7.02000-02 22.8 14.0 20.6 7.1 6.5 6.92001-03 22.6 14.0 20.5 7.0 6.3 6.82002-04 22.3 13.7 20.0 6.7 6.2 6.52003-05 21.8 13.2 19.5 6.5 6.3 6.42004-06 21.2 12.6 18.8 6.3 6.3 6.32005-07 20.6 12.5 18.4 6.3 6.4 6.32006-08 20.0 12.5 17.9 6.2 6.4 6.22007-09 19.4 12.4 17.5 6.2 6.5 6.22008-10 19.0 12.1 17.2 6.1 6.4 6.12009-11 18.6 11.8 16.8 6.1 6.4 6.12010-12 18.2 11.6 16.4 6.1 6.5 6.22011-13 17.9 11.4 16.1 6.2 6.6 6.3
Source :Sample Registration System, Registrar General of India.
Table 2.0(a)Birth and Death rates based on Three-Year Average for
West Bengal
Birth rate Death rate Per thousand of population
State Statistical Handbook 2014 69

Number
Particulas 2006 2007 2008 2009 2010 2011 2012 2013( as on 31.07.2013)
2014 (as on31.12.2014)
(1) (2) (3) (4) (5) (6) (7) (8) (9) (10)
Medical Institutions*
( 1) Hospitals including NGO/Pvt., Local Bodies,
Govt. Undertaking & Rural Hospital
(2) Health Centres** 1175 1173 1177 1177 988 988 988 988 988
(3) Sub-Centres 10356 10356 10356 10356 10356 10356 10356 10356 10357
Total Institutions 13640 13706 13919 13919 13924 13924 13924 13924 13924
(1) Rural 11624 11625 11629 11628 11613 11613 11612 11612 11613
(2) Urban 2016 2081 2290 2291 2311 2311 2312 2312 2311
Total Beds 92315 96081 100019 101832 104641 107346 107061 108962 109566
(1) Rural 13364 13921 15191 16931 16548 16498 16468 16862 17004
(2) Urban 78951 82160 84828 84901 88093 90848(R) 90593 92100 92562** Health Centres include Block Primary Source : State Bureau of Health Intelligence Health Centre and Primary Health Centre Govt. of West Bengal
* Exclude Clinics, Dispensaries.
Table 2.1Medical Facilities in West Bengal ( as on 31st March)
25792109 2177 2386 2386 2580 2581 2580 2580
State Statistical Handbook 2014 70

1000
1020
1040
1060
1080
1100
2008 2009 2010 2011 2012 2013 2014 (Upto March 2014)
Popu
latio
n
Year
Figure 2 : Population Served per Doctor in West Bengal
State Statistical Handbook 2014 71

Number
Particulars 1991 2001 2008 2009 2010 2011 2012 20132014
(Upto March 2014)
(1) (2) (3) (4) (5) (6) (7) (8) (9) (10)
1. Registered Medical Practitioners
a) Allopath 36312 44471 51651 52685 53896 55156 56413 57728(R) 59386
b) Homoeopath* 17597 24076 27417 27980 28739 29405 29909 30506 30588
c) Ayurvedic Medical Practitioners 2631 3014 3362 3458 3462(R) 3645 3727 3804 3854
Note : Figure represent persons who are " in the active list" Sources : (1) Paschimbanga Ayurved Parishad
* = The figures relate to those who are instituitionally qualified (2) West Bengal Medical Council.
(3) Council of Homoeopathic Medicine,Wes
( on the register at the end of the year)Registered Medical Practitioners in West Bengal
TABLE 2.2
State Statistical Handbook 2014 72

Total no. of Population covered
inhabited Partially Fully under water supply
habitants covered covered schemes
(1) (2) (4) (5) (6)
Burdwan 5221 4470 750 5490309
Birbhum 4009 2486 1421 3617402
Bankura 6600 3716 2546 3770841
Purba Medinipur 5516 3479 1876 5055717
Paschim Medinipur 16220 12958 3223 5780125
Howrah 1847 232 1615 2945004
Hooghly 11256 9525 1496 4192610
24-Parganas (N ) 6876 2220 4488 5324130
24-Parganas (S) 8445 1980 6443 7668471
Nadia 3935 2442 1252 4946868
Murshidabad 2969 16 2802 7384094
Uttar Dinajpur 3684 677 2978 3382156
Dakshin Dinajpur 4778 3703 1039 1860081
Malda 4205 608 3533 4586347
Jalpaiguri 4119 3400 567 4500138
Darjeeling( Plains) 984 111 871 722101
Darjeeling( GTA) 1085 123 960 796219
Cooch Behar 2246 1054 765 2774443
Purulia 4125 2827 1244 2863296
Total 98120 56027 39869 77660352 G.T.A.= Gorkha Territorial Administration. Source: Public Healh Engineering Directorate, Note : Identification of Habitations and their coverage Status Government of West Bengal
is based on Habitation Survey 2003 and subsequent coverage under various programme upto 2007-08.
Norms for full coverage of habitation :1) One spot source for 250 persons2) In case of piped water supply 40 litres per capita per day/one public stand post for 250 persons.
TABLE 2.3Districtwise Status of Rural Water Supply Coverage
(As on 1.4.2014 )( Under the project of P.H.E., Govt. of West Bengal )
No. of HabitationsName of District
State Statistical Handbook 2014 73

( Percent )
2001 2011 2001 2011 2001 2011(1) (2) (3) (4) (5) (6) (7)
West Bengal 68.64 76.26 77.02 81.69 59.61 70.54
Burdwan 70.18 76.21 78.63 82.42 60.95 69.63
Birbhum 61.48 70.68 70.89 76.92 51.55 64.14
Bankura 63.44 70.26 76.76 80.05 49.43 60.05
Purba Medinipur 87.02 92.32 81.37
Paschim Medinipur 78 .00 85.26 70.50
Howrah 77.01 83.31 83.22 86.95 70.11 79.43
Hooghly 75.11 81.80 82.59 87.03 67.21 76.36
24-Parganas (N ) 78.07 84.06 83.92 87.60 71.72 80.34
24-Parganas (S) 69.45 77.51 79.19 83.35 59.01 71.40
Kolkata 80.86 86.31 83.79 88.34 77.30 84.06
Nadia 66.14 74.97 72.31 78.75 59.58 70.98
Murshidabad 54.35 66.59 60.71 69.95 47.63 63.09
Uttar Dinajpur 47.89 59.07 58.48 65.52 36.51 52.17
Dakshin Dinajpur 63.59 72.82 72.43 78.37 54.28 67.01
Malda 50.28 61.73 58.80 66.24 41.25 56.96
Jalpaiguri 62.85 73.25 72.83 79.95 52.21 66.23
Darjeeling 71.79 79.56 80.05 85.61 62.94 73.33
Cooch Behar 66.30 74.78 75.93 80.71 56.12 68.49
Purulia 55.57 64.48 73.72 77.86 36.50 50.52Note : 1) Percentage of Literates has been calculated on the basis of population aged 7 years and above.
Source : Directorate of Census Operation, West Bengal
74.90 84.91 64.42
TABLE 3.0Literacy Rate in West Bengal by District
DistrictLiteracy rate
Person Male Female
State Statistical Handbook 2014 74

Percent
Male Female Total Rural Urban Male Female Total Rural Urban
(1) (2) (3) (4) (5) (6) (7) (8) (9) (10) (11)West Bengal 77.22 61.23 69.43 67.53 76.72 68.17 47.71 57.93 56.68 71.22Burdwan 71.50 53.60 62.74 60.60 68.22 65.41 44.22 54.74 54.28 56.34Birbhum 67.98 50.42 59.42 58.59 67.06 57.57 37.67 47.48 47.40 49.48Bankura 65.74 42.10 54.03 53.30 65.42 72.93 46.01 59.37 59.18 78.86Purba Medinipur 89.17 75.01 82.31 82.18 83.56 74.72 54.40 64.73 61.88 81.41Paschim Medinipur 78.58 59.50 69.14 68.60 74.86 71.04 48.13 59.56 59.25 69.30Howrah 77.29 65.12 71.33 68.41 75.11 77.08 64.23 70.86 53.81 76.80Hooghly 76.29 60.24 68.36 65.74 77.70 71.39 50.29 60.67 60.24 65.81North 24-Parganas 85.37 73.69 79.70 76.86 83.52 72.90 56.40 64.78 59.51 79.49South 24-Parganas 84.38 67.76 76.31 75.26 81.58 69.03 50.17 59.72 58.63 73.17Kolkata 85.02 72.85 79.31 0.00 79.31 86.81 76.57 82.06 0.00 82.06Nadia 79.01 67.29 73.34 71.61 78.17 65.35 49.98 57.75 55.84 68.85Murshidabad 68.45 55.68 62.23 60.37 70.08 59.15 43.32 51.34 50.05 72.56Uttar Dinajpur 70.87 53.31 62.41 61.45 72.95 51.96 35.48 43.76 43.26 61.11Dakshin Dinajpur 73.82 58.24 66.26 65.17 77.30 65.54 48.50 57.02 56.39 78.85Malda 68.58 52.91 61.04 59.98 72.93 55.83 37.86 46.86 46.49 64.52Jalpaiguri 80.11 65.54 73.04 72.67 74.48 67.93 49.51 58.70 58.23 66.57Darjeeling 80.59 65.00 72.94 70.61 78.48 81.50 67.16 74.26 70.57 88.58Cooch Behar 80.67 66.01 73.57 73.15 82.23 74.82 58.35 66.89 65.51 85.10Purulia 69.82 41.63 56.07 55.42 60.11 67.84 39.77 53.86 53.68 64.37
Note : Percentage of literates has been calculated on the basis of population aged 7 yrs and above.
Source : Directorate of Census Operation, West Bengal.
TABLE 3.0 (a)Literacy Rate among Scheduled Castes and Scheduled Tribes in
West Bengal by District, Census 2011
Scheduled Castes Scheduled TribesDistrict
State Statistical Handbook 2014 75

Number
Year Primary, Junior Basic
SSK &
SSP
Total col.(2) + col.(3)
JuniorHigh MSK Total
col.(5) + col.(6)
Total High & Higher
Secondary
( 1) (2) (3) (4) (5) (6) (7) (8)2007-08 50965 16303 67268 1063 1828 2891 88542008-09 51025 16371 67396 939 1897 2836 91702009-10 50938 16377 67315 1298 1919 3217 93312010-11 51070 16371 67441 1584 1917 3501 94672011-12 51539 16378 67917 2900 1923 4823 95992012-13(R)** 51034 16105 67139 3991 1819 5910 91022013-14** 51028 16103 67131 4203 1918 6121 9190
** = Figures include only Govt., Govt. aided and Govt. Sponsored schools. Source: (i) Department of School Education Government of West Bengal. (For the year 2012-13 & 2013-14) (ii) District Statistical Handbook, Bureau of Applied Economics and Statistics, Govt. of West Bengal. (For the year 2007-08 to 2011-12)
TABLE 3.1Number of Schools in West Bengal
State Statistical Handbook 2014 76

District ICSECBSE
( Kendriya Vidyalayas& Army Schools )
(1) (2) (3)Burdwan 23 27Birbhum - 2Bankura - 5Purba Medinipur 4 2Paschim Medinipur 8 12Howrah 26 4Hooghly 16 324-Parganas (N ) 43 2624-Parganas (S) 12 1Kolkata 80 22Nadia 5 4Murshidabad 3 5Uttar Dinajpur 2 4Dakshin Dinajpur - 2Malda 4 2Jalpaiguri 20 10Darjeeling 56 26Cooch Behar 1 4Purulia 2 5West Bengal 305 166
Notes : Source : Department of School Education. i) ICSE : Indian Council of School-Certificate Examination. (Anglo Indian Section ) ii) CBSE : Central Board of Secondary Education. Government of West Bengal
TABLE 3.2Number of Schools in West Bengal
Under Anglo-Indian School Category(2013)
State Statistical Handbook 2014 77

Number
YearPrimary,
Junior Basic Junior High High and Higher Secondary
(1) (2) (3) (4)
2007-08 8621967 3848654 2464710
2008-09 8315923 4010035 2694371
2009-10 7875506 4104555 3048343
2010-11* 6050119 5932571 3524568
2011-12 6353603 6045611 3423041
2012-13(R)** 7248376 4270456 3830541
2013-14*** 6267120 4363719 4001686* Figures include SSK for primary, Junior Basic and Sources : 1 ) Paschim Banga Sarva Siksha Mission, DISE. figures include MSK for Junior High Government of West Bengal.** Fugures excludes SSK/MSK 2 ) Directorate of School Education, SEMIS.*** Figures excludes SSKs/MSKs & Private Schools Government of West Bengal.
3 ) Department of School Education, Government of West Bengal.
TABLE 3.3Enrolment in General Educational Institutions by stage in
West Bengal
State Statistical Handbook 2014 78

Number
Year Primary Junior Basic & High andHigher Secondary
(1) (2) (3)
2007-08 153107 172902
2008-09 145735 155786
2009-10 139503 172328
2010-11 168932 184866
2011-12 188521 188827
2012-13(R) * 168515 175167
2013-14** 189704 202685* Figures excludes SSK/MSK** Figures excludes SSK/MSK & Private Schools
Government of West Bengal. 3 ) Department of School Education,
TABLE 3.4Number of Teachers in General Educational Institutions
in West Bengal
Sources : 1 ) Paschim Banga Sarva Siksha Mission, DISE.
2 ) Directorate of School Education, SEMIS. Government of West Bengal.
Government of West Bengal.
State Statistical Handbook 2014 79

in millimetre
District Normal 1990 2009 2010 2011 2012 2013 2014
(1) (2) (3) (4) (5) (6) (7) (8) (8)
Burdwan 1271 1557 1229 856 1322 1030 1216 1045
Birbhum 1234 1542 1278 985 1482 976 1319 1130
Bankura 1271 1640 1231 917(R) 1740 1269 1809 1028
Purba Medinipur 1301 1244 1538 1342 2078 1728
Paschim Medinipur 1191 1055 1656 1222 1977 1119
Howrah 1676 1953 1352 1219 1502 1138 2179 1189
Hooghly 1516 1571 1263 1044 1556 1152 1494 1188
North 24-Parganas 1410 1180 1669 1208 1658 1321
South 24-Parganas 1415 1227 1535 1420 1701 1413
Kolkata(Alipur) 1605 2077 1583 1536 1583 1656 2355 1381
Nadia 1401 1685(R) 1209 940 1488 1039 1245 1129
Murshidabad 1338 1538(R) 1180 989 1526 1001 1143 1126
Uttar Dinajpur 1521 1588 1785 1163 1580 1328
Dakshin Dinajpur 1256 1683 1479 1244 1428 1327
Malda 1498 1526(R) 1204 1129 1440 955 1265 1293
Jalpaiguri 4136 3434 3155 3882 3146 3787 3506 3047
Darjeeling 3212 3810 3341 4018 3415 2845 3254 3186
Cooch Behar 3193 3157 2438 3673 2669 3354 2431 2552
Purulia 1365 1811 1024 798 1557 1396 1560 1023Source : i) Agricultural Meteorologist, Directorate of Agriculture,
Govt. of West Bengal. (Other than District Kolkata)ii)Meteorological Department, Govt. of India
(Only for kolkata )
TABLE 4.0Annual Rainfall in West Bengal
2377(R)
1579
1802
2208(R)
1428 2152
State Statistical Handbook 2014 80

Classification Area Percentage Area Percentage Area Percentage(1) (2) (3) (4) (5) (6) (7)
(i) Net Area Sown 5198 59.9 5205 59.9 5233 60.3(ii) Current fallows 399 4.6 379 4.4 349 4.0(iii) Forests 1174 13.5 1174 13.5 1174 13.5(iv) Area not available for cultivation(v) Other uncultivated land excluding current fallows Total reporting area* 8684 100.0 6758 100.0 8684 100.0Note : *Excluding Kolkata Metropolitan District.
1846 21.3
104 1.2 92(R) 1.2
1809 20.8 1834(R) 21.0
Source: Directorate of Agriculture (Evaluation Wing), Govt. of West Bengal
82 0.9
TABLE 5.0Classification of Area in West Bengal
(in thousand hectares)2013-142011-12 2012-13
State Statistical Handbook 2014 81

Area Area Other Area Current Net areaaccording not uncultivated under fallows sownto village available land forestpapers for excluding
cultivation current** fallows***
(1) (2) (3) (4) (5) (6) (7)Burdwan 698762 214341 6675 21165 3702 452879
Birbhum 451118 100887 3901 15853 4461 326016
Bankura 687998 160170 5499 148930 42208 331191
Purba Medinipur 396594 103076 2227 899 1160 289232
Paschim Medinipur 928581 159870 10436 171935 73642 512698
Howrah 138676 50621 1205 - 4035 82815
Hooghly 313379 97120 2973 530 667 212089
North 24 Parganas 386524 125332 4800 426300+ 25127 231265
South 24 Parganas 948710 144715 4020 - 13101 360574
Nadia 390655 89052 3403 1216 3434 293550Murshidabad 532499 132597 2521 771 495 396115Uttar Dinajpur 312466 31351 3666 580 144 276725Dakshin Dinajpur 221909 32566 1863 932 10 186538Malda 370862 80816 3325 1679 53964 231078Jalpaiguri 622700 93810 4856 179000 9526 335508Darjeeling 325469 41548 7329 124575 16552 135465Cooch Behar 331565 64916 8981 4256 847 252565Purulia 625646 111537 14099 75048 126363 298599West Bengal* 8684113 1834325 91779 1173669 379438 5204902
TABLE 5.1
(2012-13)(in hectare)
Utilisation of Land in West Bengal by District
District
State Statistical Handbook 2014 82

Area Area Other Area Current Net areaaccording not uncultivated under fallows sownto village available land forestpapers for excluding
cultivation current** fallows***
(1) (2) (3) (4) (5) (6) (7)Burdwan 698762 214621 5876 21165 3310 453790
Birbhum 451118 101451 3208 15853 3593 327013
Bankura 687998 163181 4903 148930 34638 336346
Purba Medinipur 396594 103407 2189 899 947 289152
Paschim Medinipur 928581 161021 9620 171935 69640 516365
Howrah 138676 50770 1197 - 3507 83202
Hooghly 313379 97205 2393 530 676 212575
North 24 Parganas 386524 126191 4504 426300+ 23026 232803
South 24 Parganas 948710 145030 3986 - 11849 361545
Nadia 390655 89182 3015 1216 2941 294301Murshidabad 532499 132862 2052 771 835 395979Uttar Dinajpur 312466 31524 3316 580 258 276788Dakshin Dinajpur 221909 32651 1692 932 39 186595Malda 370862 81253 3356 1679 52418 232156Jalpaiguri 622700 93713 4957 179000 9006 336024Darjeeling 325469 41691 7251 124575 15260 136692Cooch Behar 331565 65325 7899 4256 829 253256Purulia 625646 114692 10231 75048 116531 309144West Bengal* 8684113 1845770 81645 1173669 349303 5233726+ Including Forest Area under South 24 Parganas* Excluding Kolkata Metropolitan District
included in net area sown, culturable waste lands, fallow lands other than current fallows
Source: Directorate of Agriculture(Evaluation Wing) Government of West Bengal
District
TABLE 5.1 (Contd)Utilisation of Land in West Bengal by District
(2013-14)(in hectare)
** area under non-agricultural uses, barren and unculturable land.*** Area under permanent pastures & and other grazing lands, land under misc.tree groves not
State Statistical Handbook 2014 83

Crops 1990-91 2000-01 2011-12 2012-13 2013-14
(1) (2) (3) (4) (5) (6)I. Foodgrains:
(i) CerealsRice 5813 5435 5434 5444 5514Aus 610 394 213 205 210Aman 4307 3639 4000 4011 4017Boro 896 1402 1221 1228 1287Wheat 269 426 316 322 331Barley 10 4 2 2 2Maize 65 35 98 123 144Ragi 13 13 8 10 10Small Millets 10 4 2 2 1Other Cereals 2 1 - - 1Total Cereals 6182 5918 5860 5903 6003(ii) Pulses:Gram 26 55 24(R) 25 25Arhar(Tur) 6 9 1 1 1Mung 15 11 20 23 24Musur 74 76 59 64 65Khesari 45 41 26 29(R) 31Other Pulses 148 83 69 76 87Total Pulses 314 275 199 218 233Total Foodgrains 6496 6193 6059 6121 6237II Non-Foodgrains(i)OilseedsRapeseed &MustardLineseed 8 12 4 4 4Sesame (Til) 99 107 182 196 213Other Oilseeds 28 44 73 81 79Total Oilseeds 513 599 679 728 745
TABLE 5.2Area under Principal Crops in West Bengal
(in thousand hectares)
378 436 420 447 449
State Statistical Handbook 2014 84

Crops 1990-91 2000-01 2011-12 2012-13 2013-14
(1) (2) (3) (4) (5) (6)(ii) Fibres:Jute 500 613 599 577 566Mesta 9 11 5 7 8Other Fibres 2 3 1 1 1Total Fibre 511 627 605 585 575(iii) PlantationCrops:Tea+ 101 108 115 140 140(iv) SpicesChillies 49 62 64 64 64Ginger 5 9 12 12 12Total Spices 54 71 76 76 76(v) Vegetables& Misc.Crops:Potato 195 300 379 389 412Sugarcane 12 22 16 16 17Tobacco 13 11 18 12 13 +=Figures relate to calendar year
e.g. 1990-91 means 1990 and so onSources: (1) Directorate of Agriculture
(Evaluation Wing). Govt. of West Bengal
(2) Tea Board (3) Directorate of Horticulture
TABLE 5.2 (Contd)Area under Principal Crops in West Bengal
(in thousand hectares)
State Statistical Handbook 2014 85

Net Cropped Area Gross Cropped Area Cropping (in hectare) (in hectare) intensity
(in percent)(1) (2) (3) (4)
1990-91 5463424 8662286 159
1995-96 5461925 8972544 164
2000-01 5417382 9116597 168
2001-02 5521576 9778815 177
2002-03. 5354196 9510423 178
2003-04 5427672 9661325 178
2004-05 5374704 9522930 177
2005-06 5294702 9532607 180
2006-07 5296005 9634535 182
2007-08 5295773 9751508 184
2008-09 5294040 9801516 185
2009-10 5255807 9530276 181
2010-11 4991222 8832348 177
2011-12 5198146 9352952 180
2012-13 5204902 9458675 182
2013-14 5233726 9618451 184
Source : Directorate of Agriculture (Evaluation Wing) Govt. of West Bengal
TABLE 5.3Net Cropped Area,Gross Cropped Areaand Cropping Intensity in West Bengal
Year
State Statistical Handbook 2014 86
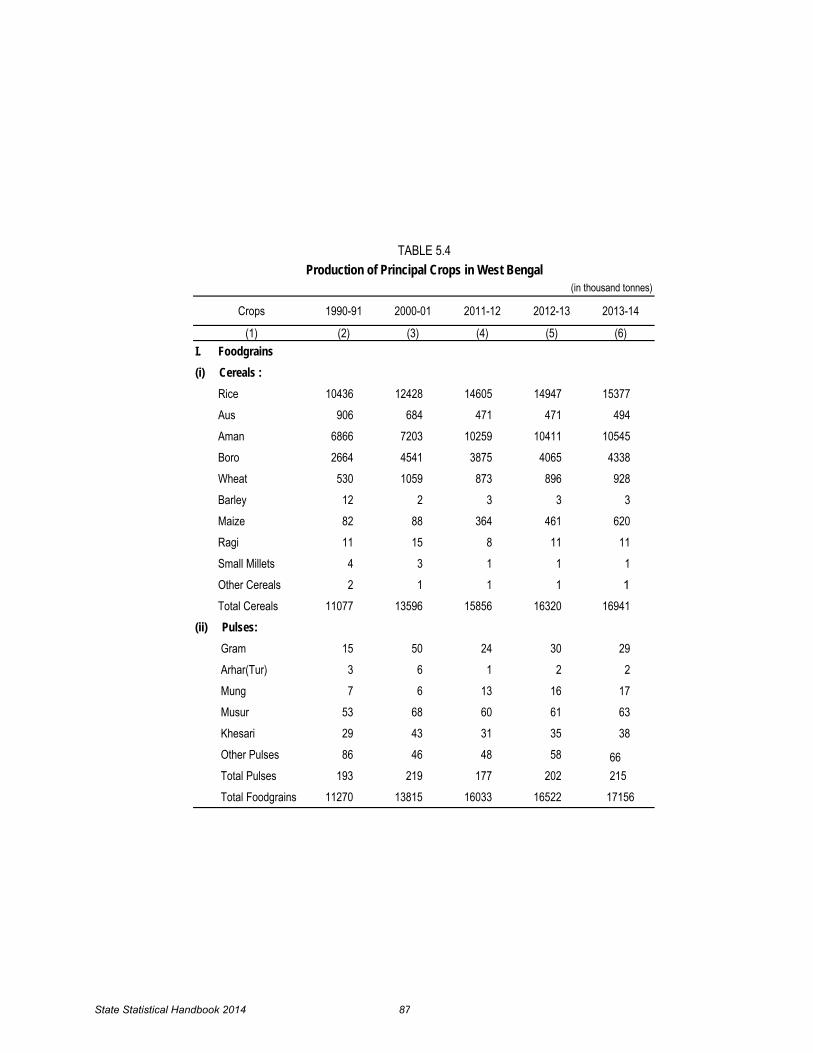
Crops 1990-91 2000-01 2011-12 2012-13 2013-14
(1) (2) (3) (4) (5) (6)I. Foodgrains(i) Cereals : Rice 10436 12428 14605 14947 15377 Aus 906 684 471 471 494 Aman 6866 7203 10259 10411 10545 Boro 2664 4541 3875 4065 4338 Wheat 530 1059 873 896 928 Barley 12 2 3 3 3 Maize 82 88 364 461 620 Ragi 11 15 8 11 11 Small Millets 4 3 1 1 1 Other Cereals 2 1 1 1 1
Total Cereals 11077 13596 15856 16320 16941(ii) Pulses: Gram 15 50 24 30 29 Arhar(Tur) 3 6 1 2 2 Mung 7 6 13 16 17 Musur 53 68 60 61 63 Khesari 29 43 31 35 38 Other Pulses 86 46 48 58 66 Total Pulses 193 219 177 202 215 Total Foodgrains 11270 13815 16033 16522 17156
TABLE 5.4Production of Principal Crops in West Bengal
(in thousand tonnes)
State Statistical Handbook 2014 87

10000
11000
12000
13000
14000
15000
16000
17000
18000
19000
20000
1900-01 2000-01 2010-11 2011-12 2012-13 2013-14
in T
hous
and
Tonn
es
Year
Figure 3: Total Foodgrains Production in West Bengal
State Statistical Handbook 2014 88
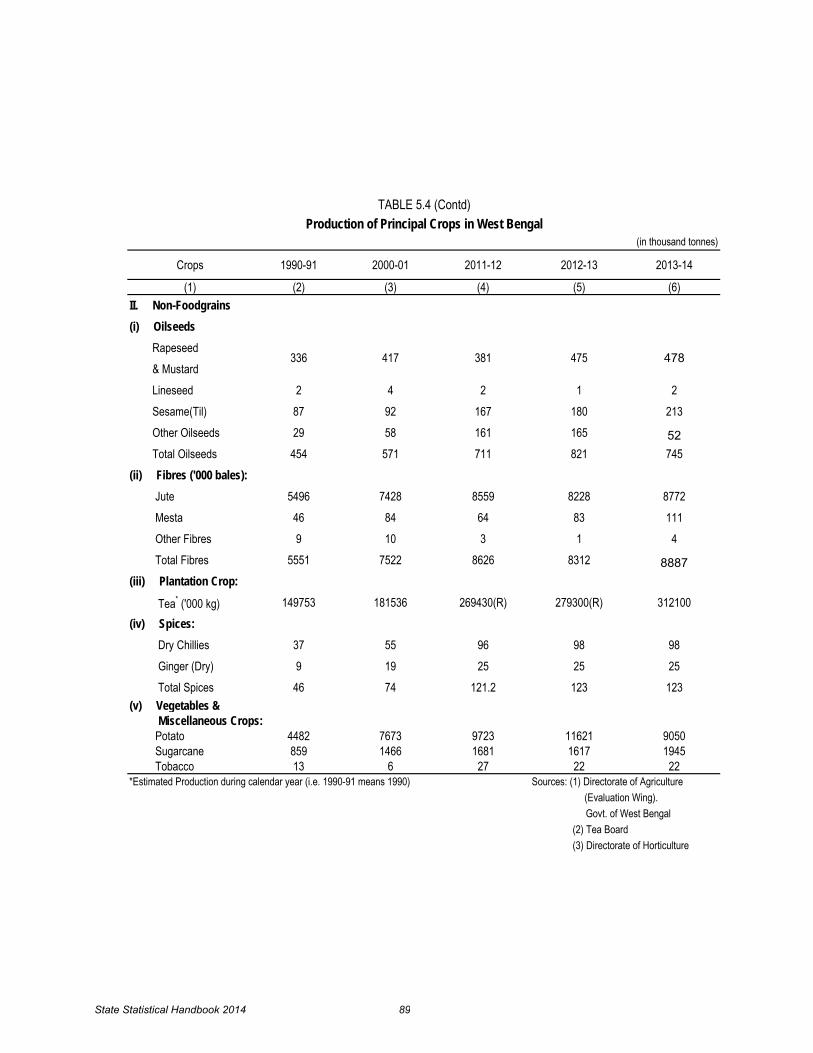
Crops 1990-91 2000-01 2011-12 2012-13 2013-14
(1) (2) (3) (4) (5) (6)II. Non-Foodgrains(i) Oilseeds Rapeseed & Mustard Lineseed 2 4 2 1 2 Sesame(Til) 87 92 167 180 213 Other Oilseeds 29 58 161 165 52 Total Oilseeds 454 571 711 821 745(ii) Fibres ('000 bales): Jute 5496 7428 8559 8228 8772 Mesta 46 84 64 83 111 Other Fibres 9 10 3 1 4 Total Fibres 5551 7522 8626 8312 8887(iii) Plantation Crop:
Tea* ('000 kg) 149753 181536 269430(R) 279300(R) 312100(iv) Spices: Dry Chillies 37 55 96 98 98 Ginger (Dry) 9 19 25 25 25 Total Spices 46 74 121.2 123 123(v) Vegetables & Miscellaneous Crops: Potato 4482 7673 9723 11621 9050 Sugarcane 859 1466 1681 1617 1945 Tobacco 13 6 27 22 22*Estimated Production during calendar year (i.e. 1990-91 means 1990) Sources: (1) Directorate of Agriculture
(Evaluation Wing). Govt. of West Bengal
(2) Tea Board (3) Directorate of Horticulture
417 381
TABLE 5.4 (Contd)Production of Principal Crops in West Bengal
(in thousand tonnes)
475336 478
State Statistical Handbook 2014 89

Area Production Area Production Area Production Area Production Area Production(1) (2) (3) (4) (5) (6) (7) (8) (9) (10) (11)
Burdwan :Rice 560.6 1420.4 582.7 1571.4 592.8 1749.3 593.4 1922.4 604.2 2016.6Wheat 2.7 5.7 6.3 15.3 2.7 6.6 2.0 5.7 1.8 4.9Other Cereals (a) (b) 0.1 0.2 0.5 1.1 0.6 1.2 4.2 1.2Total Cereals 563.3 1426.1 589.1 1589.9 596.0 1756.9 596.0 1929.4 606.6 2022.7Pulses 2.8 1.4 5.4 6.0 2.8 3.1 2.5 2.5 2.8 2.7Total Foodgrains 566.1 1427.5 594.5 1592.9 598.9 1760.0 598.5 1931.9 609.4 2025.5Oilseeds 64.9 53.6 56.2 38.4 36.3 34.7 36.1 42.0 41.1 43.1Jute (C) 13.7 188.8 10.5 190.4 12.8 234.0 9.0 139.1 11.5 244.6Potato 38.0 1017.0 42.1 1115.0 49.0 1356.7 56.9 1854.2 57.8 1291.5Bankura :Rice 434.8 843.8 395.6 993.4 377.0 1119.5 376.3 1033.7 377.6 1045.4Wheat 7.8 12.3 8.8 21.1 2.7 6.5 2.7 6.1 3.5 6.9Other Cereals 3.3 9.1 1.2 1.3 0.4 0.7 0.5 1.2 0.3 0.6Total Cereals 445.9 865.2 405.6 1015.8 380.1 1126.6 379.5 1041.0 381.4 1052.9Pulses 2.7 1.4 1.3 0.9 0.3 0.2 0.2 0.1 0.3 0.2Total Foodgrains 448.6 866.6 406.9 1016.7 380.4 1126.7 379.6 1041.2 381.7 1053.1Oilseeds 38.3 33.6 27.5 21.2 30.8 26.0 32.1 30.4 30.9 25.1Jute (C) 0.4 5.6 0.4 6.9 (a) 0.4 - - (a) (b)Potato 19.4 510.5 21.5 571.3 29.5 900.6 26.3 691.9 29.7 479
2000-01 2011-12 2012-131990-91 2013-14
TABLE 5.5Districtwise Area and Production of Principal Crops in
West Bengal
(Production in thousand tonnes)
Crops
State Statistical Handbook 2014 90

Area Production Area Production Area Production Area Production Area Production(1) (2) (3) (4) (5) (6) (7) (8) (9) (10) (11)
HowrahRice 133.1 232.5 113.3 224.2 107.1 225.3 111.2 286.8 108.7 275.1Wheat 0.1 0.2 1.0 2.1 0.1 0.1 0.1 0.3 0.1 0.2Other Cereals - - - - 0.1 0.1 0.1 0.1 (a) 0.1Total Cereals 133.2 232.7 114.3 226.3 107.2 225.3 111.4 287.2 108.8 275.4Pulses 4.5 2.2 1.4 0.4 1.3 1.3 1.6 1.6 1.9 2.1Total Foodgrains 137.7 234.9 114.7 226.7 108.5 226.8 113.0 288.8 110.7 277.5Oilseeds 3.8 2.3 5.3 4.3 9.4 15.1 7.9 18.0 8.3 18.8Jute (C) 3.5 46.6 6.8 101.3 5.0 85.6 2.4 43.2 1.9 40.8Potato 3.6 101.6 9.2 246.9 8.1 178.1 7.8 247.9 7.6 247.424-Parganas(N)Rice 287.4 646.9 273.9 641.0 221.5 597.5 217.5 649.1 219.1 668.4Wheat 8.9 18.7 13.6 33.8 7.2 20.3 7.2 19.9 7.8 22.1Other Cereals (a) (b) - - 0.2 0.5 0.2 0.5 0.2 0.4Total Cereals 296.3 665.6 287.5 674.8 228.8 618.3 224.9 669.5 227.1 690.9Pulses 15.6 8.6 12.9 10.4 9.6 9.4 12.0 9.6 12.9 11.3Total Foodgrains 311.9 674.2 300.4 685.2 238.4 627.7 236.9 679.1 240.0 702.2Oilseeds 34.8 35.1 48.5 45.7 50.9 55.0 57.2 77.7 59.9 87.1Jute (C) 37.3 436.0 55.8 776.9 56.7 1019.5 47.4 754.3 48.9 910.7Potato 3.4 58.8 8.5 189.0 7.0 205.6 6.4 205.2 8.7 278.0
1990-91 2000-01 2011-12 2012-13 2013-14
TABLE 5.5 (Contd.)Districtwise Area and Production of Principal Crops in
West Bengal Area in thousand hectares
Production in thousand tonnes
Crops
State Statistical Handbook 2014 91
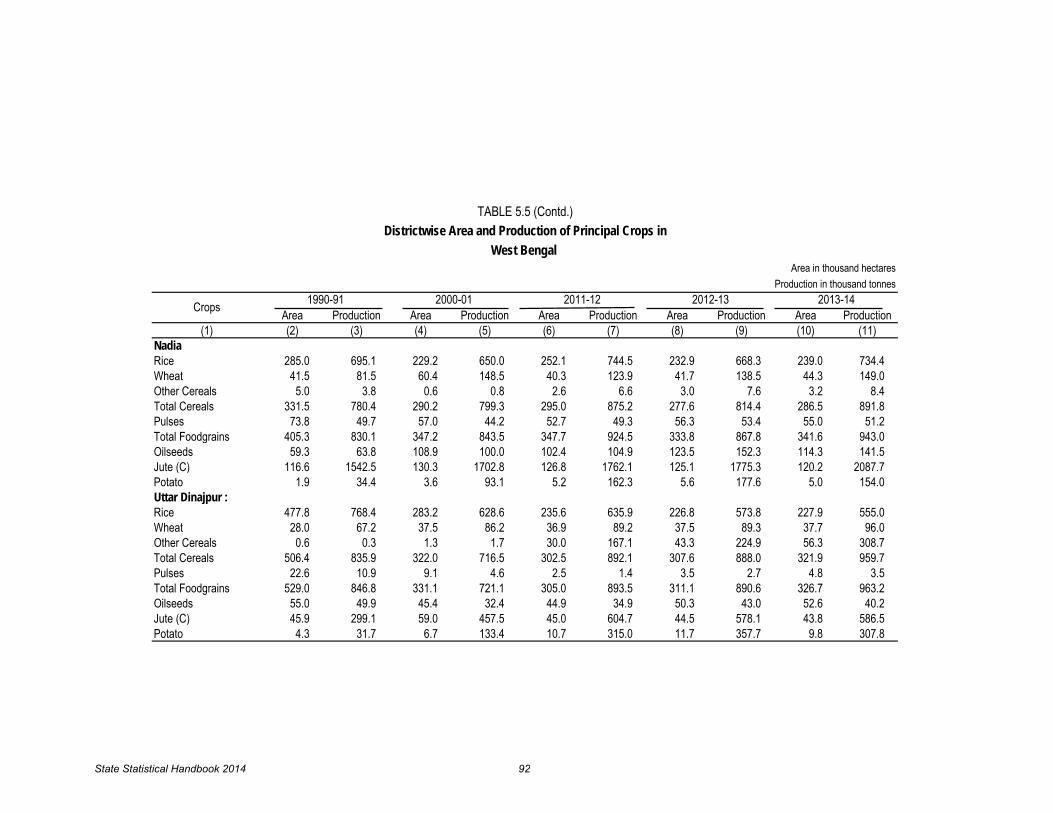
Area Production Area Production Area Production Area Production Area Production(1) (2) (3) (4) (5) (6) (7) (8) (9) (10) (11)
NadiaRice 285.0 695.1 229.2 650.0 252.1 744.5 232.9 668.3 239.0 734.4Wheat 41.5 81.5 60.4 148.5 40.3 123.9 41.7 138.5 44.3 149.0Other Cereals 5.0 3.8 0.6 0.8 2.6 6.6 3.0 7.6 3.2 8.4Total Cereals 331.5 780.4 290.2 799.3 295.0 875.2 277.6 814.4 286.5 891.8Pulses 73.8 49.7 57.0 44.2 52.7 49.3 56.3 53.4 55.0 51.2Total Foodgrains 405.3 830.1 347.2 843.5 347.7 924.5 333.8 867.8 341.6 943.0Oilseeds 59.3 63.8 108.9 100.0 102.4 104.9 123.5 152.3 114.3 141.5Jute (C) 116.6 1542.5 130.3 1702.8 126.8 1762.1 125.1 1775.3 120.2 2087.7Potato 1.9 34.4 3.6 93.1 5.2 162.3 5.6 177.6 5.0 154.0Uttar Dinajpur :Rice 477.8 768.4 283.2 628.6 235.6 635.9 226.8 573.8 227.9 555.0Wheat 28.0 67.2 37.5 86.2 36.9 89.2 37.5 89.3 37.7 96.0Other Cereals 0.6 0.3 1.3 1.7 30.0 167.1 43.3 224.9 56.3 308.7Total Cereals 506.4 835.9 322.0 716.5 302.5 892.1 307.6 888.0 321.9 959.7Pulses 22.6 10.9 9.1 4.6 2.5 1.4 3.5 2.7 4.8 3.5Total Foodgrains 529.0 846.8 331.1 721.1 305.0 893.5 311.1 890.6 326.7 963.2Oilseeds 55.0 49.9 45.4 32.4 44.9 34.9 50.3 43.0 52.6 40.2Jute (C) 45.9 299.1 59.0 457.5 45.0 604.7 44.5 578.1 43.8 586.5Potato 4.3 31.7 6.7 133.4 10.7 315.0 11.7 357.7 9.8 307.8
TABLE 5.5 (Contd.)Districtwise Area and Production of Principal Crops in
West Bengal Area in thousand hectares
Production in thousand tonnes
Crops 1990-91 2000-01 2011-12 2012-13 2013-14
State Statistical Handbook 2014 92

Area Production Area Production Area Production Area Production Area Production(1) (2) (3) (4) (5) (6) (7) (8) (9) (10) (11)
MaldaRice 263.8 492.3 221.7 523.1 204.9 612.0 207.6 644.6 198.8 704.4Wheat 37.6 88.5 49.4 124.0 43.5 131.8 45.0 125.1 44.7 131.7Other Cereals 13.5 13.9 6.5 12.0 14.9 31.3 21.8 42.3 17.6 44.6Total Cereals 314.9 594.7 277.6 659.1 263.3 775.1 274.3 812.0 261.1 880.7Pulses 59.2 38.5 36.1 29.6 19.2 18.1 21.0 22.8 21.7 21.5Total Foodgrains 374.1 633.2 313.7 688.7 282.5 793.2 295.3 834.7 282.7 902.2Oilseeds 28.7 21.7 35.7 38.1 32.9 36.9 34.3 36.3 36.2 39.0Jute (C) 27.5 218.7 24.0 248.1 21.5 313.2 23.8 394.6 24.6 396.1Potato 1.5 20.4 2.4 42.8 3.9 146.9 4.9 176.8 5.1 164.7Darjeeling :Rice 55.3 64.6 34.1 52.9 32.3 71.3 32.4 67.6 32.2 72.3Wheat 3.7 3.8 3.3 6.3 2.0 4.2 2.0 2.3 2.0 2.8Other Cereals 45.1 52.1 24.7 54.2 25.0 47.0 26.7 49.8 28.0 53.8Total Cereals 104.1 120.5 62.1 113.4 59.3 122.5 61.1 119.7 62.2 128.9Pulses 1.0 0.6 1.9 1.2 1.3 0.9 1.2 0.9 1.6 1.1Total Foodgrains 105.1 121.1 64.0 114.6 60.6 123.4 62.4 120.6 63.7 130.2Oilseeds 1.8 1.3 0.4 0.2 0.6 0.3 0.6 0.4 0.7 0.4Jute (C) 3.7 22.4 2.2 18.1 3.0 33.7 3.0 36.9 2.9 37.9Potato 4.2 39.7 7.1 97.2 7.4 116.4 7.4 119.3 7.4 122.0
1990-91 2000-01 2011-12 2012-13 2013-14
TABLE 5.5 (Contd.)Districtwise Area and Production of Principal Crops in
West Bengal Area in thousand hectares
Production in thousand tonnes
Crops
State Statistical Handbook 2014 93

Area Production Area Production Area Production Area Production Area Production(1) (2) (3) (4) (5) (6) (7) (8) (9) (10) (11)
Birbhum :Rice 376.7 813.1 318.2 796.5 386.9 1126.8 372.1 1084.2 384.6 1274.1Wheat 14.2 25.1 26.9 77.7 33.0 86.2 32.4 91.7 34.6 99.4Other Cereals 1.0 0.5 0.6 1.1 0.2 0.4 0.2 0.3 0.1 0.2Total Cereals 391.9 838.7 345.7 875.3 420.1 1213.4 404.7 1176.2 419.3 1373.7Pulses 8.6 5.4 20.2 16.8 16.4 15.6 16.7 18.6 16.6 19.9Total Foodgrains 400.5 844.1 365.9 892.1 436.5 1229.1 421.4 1194.9 435.9 1393.6Oilseeds 50.3 39.4 37.4 42.1 37.9 32.8 36.7 33.2 39.0 38.5Jute (C) 0.2 2.7 0.1 2.0 0.3 5.5 0.3 6.1 0.9 17.0Potato 8.1 171.9 12.8 266.6 17.9 537.8 17.9 551.8 18.2 445.1Purba Medinipur :Rice 1024.9 1529.3 528.3 1240.2 399.7 1010.2 402.4 1060.3 388.7 876.4Wheat 5.6 8.8 0.7 1.8 0.5 1.2 0.5 1.3 0.5 1.3Other Cereals 1.5 1.5 (a) (b) 0.1 0.2 0.1 0.1 0.1 0.2Total Cereals 1032.0 1539.6 529.0 1242.0 400.3 1011.6 403.0 1061.7 389.3 877.9Pulses 22.2 19.1 9.3 11.3 7.1 9.4 7.1 11.8 8.3 11.9Total Foodgrains 1054.2 1558.7 538.3 1253.3 407.4 1021.0 410.1 1073.5 397.6 889.7Oilseeds 52.0 44.9 24.9 30.2 27.4 78.8 19.3 39.2 18.9 39.2Jute (C) 10.0 140.1 4.8 93.0 0.5 9.8 0.5 7.6 0.4 4.9Potato 33.6 763.6 20.6 441.7 4.4 111.7 4.3 108.8 3.8 112.4
2000-01Crops 2013-14
TABLE 5.5 (Contd.)Districtwise Area and Production of Principal Crops in
West Bengal Area in thousand hectares
Production in thousand tonnes2011-12 2012-131990-91
State Statistical Handbook 2014 94

Area Production Area Production Area Production Area Production Area Production(1) (2) (3) (4) (5) (6) (7) (8) (9) (10) (11)
Hooghly :Rice 275.3 610.7 199.3 503.7 277.2 806.8 273.4 793.0 286.0 807.7Wheat 0.8 1.5 1.6 3.7 0.2 0.4 0.1 0.3 0.1 0.2Other Cereals (a) (b) (a) (b) 0.3 0.5 0.2 0.4 0.3 0.5Total Cereals 276.1 612.2 200.9 507.4 277.6 807.7 273.8 793.7 286.4 808.4Pulses 0.8 0.5 1.5 1.0 0.2 0.2 0.3 0.3 0.4 0.5Total Foodgrains 276.9 612.7 202.4 508.4 277.8 807.9 274.1 794.0 286.8 808.9Oilseeds 34.3 34.1 33.6 31.5 51.2 60.0 56.1 71.1 59.6 74.0Jute (C) 31.4 447.8 29.9 532.0 26.9 444.5 26.7 526.4 20.0 421.9Potato 58.3 1486.1 80.6 2337.7 94.4 2439.9 100.2 3246.4 99.8 2077.524-Parganas(S)Rice 417.9 509.7 425.9 866.9 388.9 903.1 378.4 904.3 393.8 990.4Wheat 0.6 1.0 3.2 5.7 2.5 7.6 3.4 9.9 3.5 9.9Other Cereals - - - - 0.2 0.3 0.2 0.5 0.2 0.5Total Cereals 418.5 510.7 429.1 872.6 391.6 910.9 381.9 914.7 397.5 1000.8Pulses 12.1 3.2 8.7 6.9 19.2 15.5 23.2 18.8 24.2 19.8Total Foodgrains 430.6 513.9 437.8 879.5 410.7 926.4 405.1 933.5 421.7 1020.6Oilseeds 4.2 4.9 5.7 4.0 12.8 11.0 13.1 17.0 11.9 15.9Jute (C) 1.7 20.9 1.8 18.1 3.3 42.4 2.6 49.4 1.5 31.6Potato 1.1 15.6 3.8 78.6 8.0 188.8 3.3 80.0 2.9 85.5
2012-13Crops 2013-14
TABLE 5.5 (Contd.)Districtwise Area and Production of Principal Crops in
West Bengal Area in thousand hectares
Production in thousand tonnes1990-91 2000-01 2011-12
State Statistical Handbook 2014 95

Area Production Area Production Area Production Area Production Area Production(1) (2) (3) (4) (5) (6) (7) (8) (9) (10) (11)
Murshidabad :Rice 353.9 785.3 224.1 548.2 351.0 957.3 352.4 973.7 350.7 1116.7Wheat 92.2 174.9 135.5 373.5 97.1 275.7 99.2 285.3 104.3 288.3Other Cereals 4.8 5.2 2.0 1.8 4.2 18.1 5.3 19.8 215.1 27.6Total Cereals 450.9 965.4 361.6 923.5 452.4 1251.1 456.9 1278.8 461.5 1432.6Pulses 53.0 29.6 59.3 56.3 40.4 38.5 44.8 42.9 52.3 53.6Total Foodgrains 503.9 995.0 420.9 979.8 492.8 1289.5 501.7 1321.8 513.8 1486.3Oilseeds 55.6 60.4 71.1 72.1 97.6 96.8 106.4 109.4 106.6 114.8Jute (C) 105.8 1379.5 141.0 1901.5 157.6 2195.5 159.5 2176.8 154.6 2286.2Potato 6.3 107.6 8.9 213.7 11.1 291.7 13.1 364.7 13.2 299.0Dakshin DinajpurRice ** ** 210.7 467.4 182.5 469.5 181.4 510.7 179.9 514.7Wheat ** ** 10.2 25.2 12.6 39.4 12.3 41.0 12.3 38.3Other Cereals ** ** 0.1 (b) 0.4 1.7 0.6 2.3 2.2 10.8Total Cereals ** ** 221.0 492.6 195.5 510.5 194.3 554.0 194.4 563.8Pulses ** ** 4.1 2.4 0.9 0.3 1.0 0.6 1.0 0.8Total Foodgrains ** ** 225.1 495.0 196.4 510.9 195.3 554.6 195.5 564.7Oilseeds ** ** 22.6 21.0 21.9 19.6 25.1 29.3 24.6 26.6Jute (C) ** ** 15.1 146.1 21.1 294.0 18.3 272.8 19.7 299.9Potato ** ** 4.8 87.8 5.9 154.9 5.6 163.0 5.0 123.0** combined figures of Uttar and Dakshin Dinajpur
2013-14
TABLE 5.5 (contd.)Districtwise Area and Production of Principal Crops in
West Bengal Area in thousand hectares
Production in thousand tonnes2012-13Crops
are incorporated in Uttar Dinajpur
1990-91 2000-01 2011-12
State Statistical Handbook 2014 96
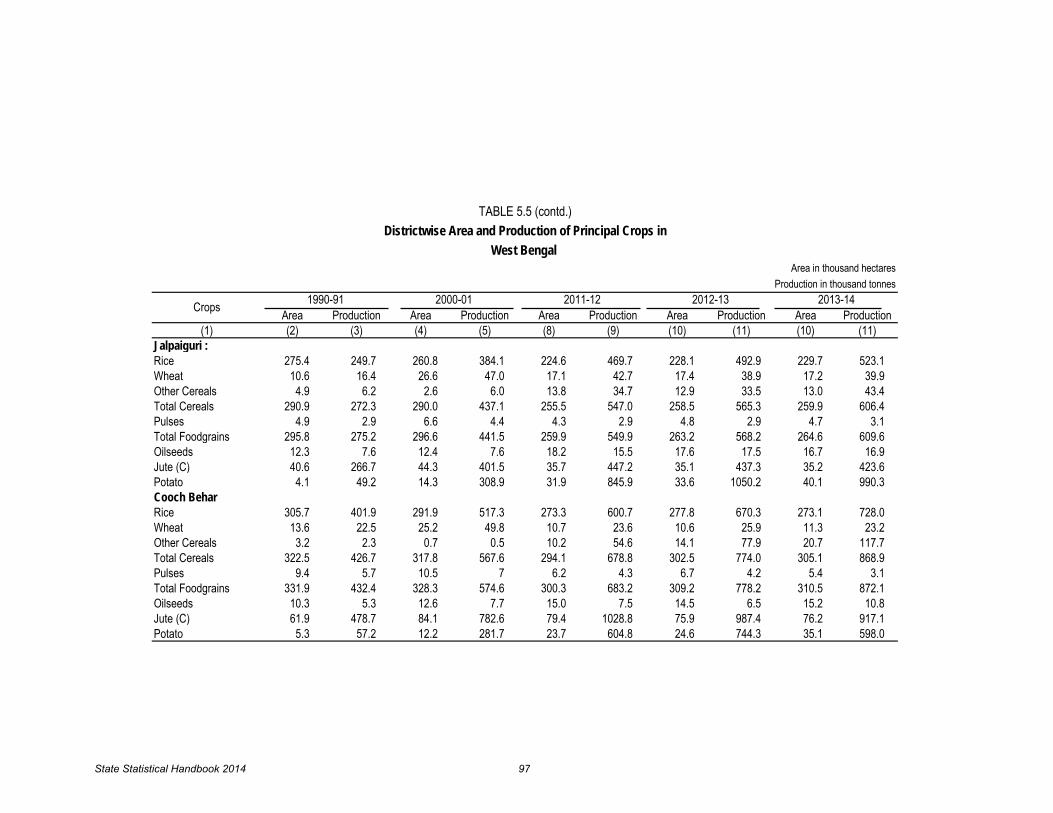
Area Production Area Production Area Production Area Production Area Production(1) (2) (3) (4) (5) (8) (9) (10) (11) (10) (11)
Jalpaiguri :Rice 275.4 249.7 260.8 384.1 224.6 469.7 228.1 492.9 229.7 523.1Wheat 10.6 16.4 26.6 47.0 17.1 42.7 17.4 38.9 17.2 39.9Other Cereals 4.9 6.2 2.6 6.0 13.8 34.7 12.9 33.5 13.0 43.4Total Cereals 290.9 272.3 290.0 437.1 255.5 547.0 258.5 565.3 259.9 606.4Pulses 4.9 2.9 6.6 4.4 4.3 2.9 4.8 2.9 4.7 3.1Total Foodgrains 295.8 275.2 296.6 441.5 259.9 549.9 263.2 568.2 264.6 609.6Oilseeds 12.3 7.6 12.4 7.6 18.2 15.5 17.6 17.5 16.7 16.9Jute (C) 40.6 266.7 44.3 401.5 35.7 447.2 35.1 437.3 35.2 423.6Potato 4.1 49.2 14.3 308.9 31.9 845.9 33.6 1050.2 40.1 990.3Cooch BeharRice 305.7 401.9 291.9 517.3 273.3 600.7 277.8 670.3 273.1 728.0Wheat 13.6 22.5 25.2 49.8 10.7 23.6 10.6 25.9 11.3 23.2Other Cereals 3.2 2.3 0.7 0.5 10.2 54.6 14.1 77.9 20.7 117.7Total Cereals 322.5 426.7 317.8 567.6 294.1 678.8 302.5 774.0 305.1 868.9Pulses 9.4 5.7 10.5 7 6.2 4.3 6.7 4.2 5.4 3.1Total Foodgrains 331.9 432.4 328.3 574.6 300.3 683.2 309.2 778.2 310.5 872.1Oilseeds 10.3 5.3 12.6 7.7 15.0 7.5 14.5 6.5 15.2 10.8Jute (C) 61.9 478.7 84.1 782.6 79.4 1028.8 75.9 987.4 76.2 917.1Potato 5.3 57.2 12.2 281.7 23.7 604.8 24.6 744.3 35.1 598.0
2012-13Crops 2013-14
TABLE 5.5 (contd.)Districtwise Area and Production of Principal Crops in
West Bengal Area in thousand hectares
Production in thousand tonnes1990-91 2000-01 2011-12
State Statistical Handbook 2014 97

Area Production Area Production Area Production Area Production Area Production(1) (2) (3) (4) (5) (6) (7) (8) (9) (10) (11)
PuruliaRice 285.3 372.8 262.2 474.9 270.6 732.3 289.1 730.7 302.9 731.5Wheat 1.2 2.1 2.9 7.5 1.9 4.2 1.6 3.3 1.2 2.7Other Cereals 16.9 15.1 15.0 26.5 6.2 9.9 6.3 12.2 6.8 11.3Total Cereals 303.4 390.0 280.1 508.9 278.7 746.4 297.1 746.2 310.9 745.5Pulses 20.8 13.7 18.7 7.3 10.4 3.7 10.9 4.1 14.7 4.1Total Foodgrains 324.2 403.7 298.8 516.2 289.1 750.1 308.0 750.3 325.6 749.7Oilseeds 7.6 5.6 2.8 1.5 2.8 1.8 2.8 1.9 5.2 4.5Jute (C) - - - - - - - - (a) 0.2Potato 1.4 16.5 0.9 12.8 1.1 17.4 0.9 17.2 1.7 43.7Paschim Medinipur :Rice * * 580.2 1344.2 655.7 1774.0 691.1 1880.2 716.8 1742.6Wheat * * 12.9 29.4 4.7 9.4 5.9 11.1 4.6 10.9Other Cereals * * 1.7 3.0 1.0 2.6 1.1 3.0 1.9 6.4Total Cereals * * 594.8 1376.6 661.4 1785.8 698.1 1894.2 723.3 1759.9Pulses * * 11.5 8.8 4.2 3.0 4.3 3.7 4.8 4.5Total Foodgrains * * 606.3 1385.4 665.7 1788.9 702.4 1897.9 728.1 1764.4Oilseeds * * 47.6 52.7 85.8 78.9 93.9 95.7 103.7 104.1Jute (C) * * 2.9 49.6 3.5 37.8 2.7 42.7 4.1 64.7Potato * * 39.8 1154.9 60.0 1148.6 58.6 1463.6 61.3 1224.1* combined figures of Paschim and Purba Medinipur
are incorporated in Purba Medinipur
Production in thousand tonnes2011-12 2012-131990-91 2000-01 2013-14Crops
TABLE 5.5 (contd.)Districtwise Area and Production of Principal Crops in
West Bengal Area in thousand hectares
State Statistical Handbook 2014 98

Area Production Area Production Area Production Area Production Area Production(1) (2) (3) (4) (5) (6) (7) (8) (9) (10) (11)
West BengalRice 5812.9 10436.5 5435.3 12428.0 5433.7 14605.8 5444.3 14946.7 5513.7 15376.8Wheat 269.1 530.2 426.0 1058.6 315.7 872.9 321.6 895.9 331.5 927.7Other Cereals 99.8 110.0 97.1 109.1 110.2 377.2 137.2 477.5 158.0 636.4Total Cereals 6181.8 11076.7 5918.4 13595.7 5859.5 15855.8 5903.1 16320.2 6003.2 16940.9Pulses 314.0 193.4 274.5 219.5 199.0 177.1 218.0 201.6 233.4 214.9Total Foodgrains 6495.8 11270.1 6192.9 13815.2 6058.5 16032.9 6121.1 16521.8 6236.6 17156.5Oilseeds 513.2 453.3 598.6 570.7 678.8 710.5 727.7 821.0 745.4 840.4Jute (C) 500.2 5496.3 613.0 7428.4 599.0 8558.6 576.7 8228.2 566.4 8771.4Potato 194.5 4481.8 299.7 7673.1 379.2 9723.0 389.1 11620.7 412.2 9043.0(a) = Less than 50 hectares.(b) = Less than 50 tonnes.(c) = In thousand bales of 180 Kgs. each.(P) = Provisional.
2011-12 2012-13
Source : (1) Directorate of Agriculture ( Evaluation Wings ) Govt. of West Bengal.
2013-14
(2) Tea Board.
TABLE 5.5(Contd) Districtwise Area and Production of Principal Crops in
West Bengal Area in thousand hectares
Production in thousand tonnes1990-91 2000-01Crops
State Statistical Handbook 2014 99

Crops 1990-91 2000-01 2011-12 2012-13 2013-14
(1) (2) (3) (4) (5) (6)I. Foodgrains:(i) Cereals -
Rice 1795 2287 2688 2745 2789
Aus 1485 1736 2213 2297 2350
Aman 1594 1979 2565 2596 2625
Boro 2973 3240 3174 3310 3371
Wheat 1970 2485 2765 2786 2799
Barley 1129 524 1445 1481 1438
Maize 1263 2503 3722 3751 4312
Ragi 827 1205 979 1096 1095
Small Millets 494 675 917 933 918
Other Cereals 1102 1911 3424 3481 4027
Total Cereals 1792 2297 2706 2765 2822
(ii) Pulses -Gram 584 917 1049 1176 1175
Arhar(Tur) 498 669 435 1431 1432
Other Pulses 480 775 872(R) 885 908
II. Non-Foodgrains(i) Oilseeds -
Rapeseed & Mustard
Lineseed 215 334 359 350 360
Sesame(Til) 875 861 918 919 927
Other Oilseeds 1051 1319 2203(R) 2037 2060(ii) Fibres : Jute 1978 2182 2572 2569 2788 Mesta 911 1382 2136 2223 2360 Sunhemp 817 837 672 774 774 Cotton 360 391 512 632 615(iii) Plantation Crop: Tea + 1480 1689 1934(R) 1989(R) 2222(iv) Spices Dry Chillies 764 894 1504 1516 1521 Ginger(Dry) 1696 2026 2165 2160 2164(v) Vegetables & Miscellaneous Crops: Potato+ 23046 25606 25641(R) 29869 21955 Sugarcane 70689 67821 104587 100461 114273 Tobacco 1011 545 1541 1772 1773+ = Figures related to calendar Source : (1) Directorate of Agriculture ( Evaluation wing ),
year e.g. 1990-91 means 1990 and so on. (2) Tea Board.
Govt. of West Bengal.
1066
TABLE 5.6Yeild Rates of Principal Crops in West Bengal
(in Kgs. per hectare)
1062889 956 908
State Statistical Handbook 2014 100

2010-11 2011-12 2012-13 2013-14(1) (2) (3) (4) (5) (6)A. FRUITS1. Mango 89.54 90.94 92.50 93.502. Banana 42.03 43.73 44.70 45.503. Pineapple 9.93 10.13 10.50 10.704. Papaya 11.13 11.23 11.30 11.405. Guava 13.57 14.07 14.20 14.356. Jackfruit 11.32 11.41 11.45 11.477. Litchi 8.63 8.93 9.18 9.308. Mandarin Orange 3.76 3.84 3.86 3.889. Other Citrus 7.52 7.65 7.86 8.0010. Sapota 4.00 4.10 4.15 4.2011. Others 10.21 10.62 10.90 11.20
Total 211.64 216.64 220.60 223.50B. VEGETABLES1. Tomato 54.14 55.23 56.00 56.502. Cabbage 75.28 76.78 77.80 78.203. Cauliflower 70.04 71.44 73.00 73.604. Peas 21.44 21.65 21.80 21.905. Brinjal 158.44 160.02 161.00 161.506. Onion 21.25 21.68 22.00 23.507. Cucurbits 167.39 169.06 170.00 170.608. Ladies' Finger 74.00 74.38 74.60 75.009. Radish 40.29 40.49 40.60 40.7010. Others 261.05 263.46 264.55 266.55
Total 943.32 954.19 961.35 968.05
TABLE 5.7Area and Production of Fruits and Vegetables in West Bengal
Area (in thousand hectares)Sl No Names of Fruits/Vegetables
State Statistical Handbook 2014 101

2010-11 2011-12 2012-13 2013-14(1) (2) (3) (4) (5) (6)A. FRUITS1. Mango 620.17 661.53 735.00 430.71
2. Banana 1010.15 1053.99 1077.80 1097.50
3. Pineapple 303.66 309.86 310.00 316.00
4. Papaya 324.23 327.83 331.00 335.00
5. Guava 178.85 179.78 184.00 186.00
6. Jackfruit 191.86 191.98 193.50 194.50
7 Litchi 85.12 85.27 90.00 93.90
8 Mandarin Orange 37.00 38.05 38.29 38.60
9 Other Citrus 64.77 69.20 71.11 72.40
10 Sapota 43.58 43.61 44.80 45.40
11 Others 93.43 94.36 97.00 99.70
Total 2952.82 3055.44 3172.50 2909.71
B. VEGETABLES1 Tomato 1063.65 1104.50 1125.60 1141.50
2 Cabbage 2087.84 2149.91 2179.20 2197.40
3 Cauliflower 1777.21 1821.66 1863.00 1879.00
4 Peas 129.36 131.00 132.11 133.50
5 Brinjal 2870.60 2945.73 2965.60 2977.00
6 Onion 297.98 304.56 309.10 342.85
7 Cucurbits 2131.16 2164.01 2177.70 2187.00
8 Ladies' Finger 862.12 863.50 869.10 877.00
9 Radish 491.76 494.79 496.20 498.50
10. Others 1622.60 1742.70 1757.90 1781.20
Total 13334.29 13722.36 13875.51 14014.95
TABLE 5.7 (Contd)Area and Production of Fruits and Vegetables in West Bengal
Source : Directorate of Horticulture, Govt. of West Bengal.
Production ( in thousand tonnes)Sl No, Names of Fruits/
Vegetables
State Statistical Handbook 2014 102

2010-11 2011-12 2012-13 2013-14 Unit 2010-11 2011-12 2012-13 2013-14(1) (2) (3) (4) (5) (6) (7) (8) (9) (10) (11)1. Rose 1.67 1.69 1.72 1.73 Crore Spikes 76.92 77.65 79.36 81.70
2. Tube Rose 4.81 4.98 5.17 5.30 ,, 111.47 118.16 121.87 125.08
3. Gladiolus 2.51 2.61 2.65 2.71 ,, 37.42 39.17 39.70 40.65
4. Chrysanthemum 0.51 0.52 0.50 0.51 ,, 13.47 14.04 13.36 13.92
5. Marigold 5.77 6.17 6.33 6.50 000 M.T. 47.87 52.07 53.42 54.86
6. Jasmine 0.46 0.47 0.46 0.46 ,, 0.64 0.65 0.63 0.63
7. Seasonal flowers 4.61 4.69 4.75 4.75 ,, 7.55 7.84 7.83 7.71
8. Others 2.73 2.77 2.83 2.89 ,, 3.19 3.35 3.36 3.29
Total 23.07 23.90 24.41 24.85
TABLE 5.8Area and Production of Flowers in West Bengal
Source : Directorate of Horticulture Govt. of West Bengal.
Sl. No. Names of Flowers ProductionArea (in thousand hectare)
State Statistical Handbook 2014 103

Crops 1990-91 2000-01 2009-10 2010-11 2011-12 2012-13 2013-14
(1) (2) (3) (4) (5) (6) (7) (8)I. Foodgrains 107.4 102.4 103.2 92.0 100.2 101.2 103.1A. Cereals 111.6 106.8 109.4 96.8 105.7 106.5 108.31. Rice 114.0 106.6 110.5 97.0 106.6 106.8 108.2 (i)Aus 94.5 61.0 33.1 32.8 33.0 31.8 32.5 (ii)Aman 103.7 87.7 96.0 81.0 96.4 96.6 96.8 (iii)Boro 299.0 467.8 477.0 457.1 407.4 409.8 429.42. Wheat 80.5 127.4 94.5 94.8 94.4 96.2 99.23. Barley 31.4 10.6 5.3 6.2 7.0 7.3 7.24. Maize 128.4 70.1 194.3 176.2 194.5 244.6 286.15. Ragi 84.5 81.6 76.0 75.5 54.3 65.1 65.26. Small Millets 100.0 40.6 16.0 13.6 14.2 14.8 14.07. Other Cereals 91.7 110.0 127.5 8.3 6.8 7.0 14.1B. Pulses 61.9 54.1 36.0 38.9 39.2 43.0 46.01. Gram 29.0 61.9 24.6 25.1 26.3 28.4 28.22. Arhar (Tur) 25.4 38.9 3.3 6.8 5.5 6.3 6.53. Mung 44.5 32.3 48.2 50.7 57.6 66.7 70.24. Masur 79.1 81.5 55.4 61.6 63.6 68.6 70.25. Mashkalai 96.4 51.2 36.5 41.5 39.2 44.0 51.16. Other Pulses 46.9 41.0 31.6 31.6 31.6 33.6 36.0II.Non-Foodgrains 122.1 151.6 166.7 163.9 165.0 170.1 173.0A. Oilseeds 172.7 201.4 229.5 225.7 228.4 244.9 250.8
2.Linseed 14.5 20.3 8.1 7.0 7.0 6.6 7.4 3.Sesame(Til) 103.9 112.1 194.4 191.2 190.5 205.4 223.1 4.Other oilseed 426.6 680.2 1266.7 1141.3 1141.7 1259.5 1238.4B. Fibres 87.9 107.7 106.8 99.0 104.0 100.4 99.0 1. Jute 92.6 113.5 113.7 105.2 110.9 106.8 104.92. Mesta 22.8 27.2 13.4 15.6 13.6 16.7 21.13. Sunhemp 118.8 95.0 52.2 44.6 43.9 47.7 48.94. Cotton 50.0 595.0 664.5 313.5 71.5 209.0 182.0C. Plantation Crop1. Tea 109.1 115.8 124.00 124.00 124.00 151.3 151.3D. Spices 215.5 285.2 303.5 305.7 308.3 310.1 311.81. Dry chillies 205.0 258.4 266.6 267.3 269.0 270.2 271.22. Ginger dry 189.3 333.2 400.8 407.4 410.9 414.3 417.93. Turmeric 330.0 462.7 515.5 526.0 534.3 540.0 545.0E. Vegetables and Miscellaneou Crops 144.2 218.0 272.5 287.9 271.2 274.4 290.3
1. Potato 169.4 261.0 337.0 356.1 330.3 338.9 359.1 2. Sugarcane 55.0 97.3 61.9 67.6 72.4 72.5 76.7 3.Tobacco 83.6 68.8 93.2 94.2 114.9 81.9 82.7
All combined 109.8 110.3 113.4 103.5 110.5 112.2 114.3Source: Evaluation Wing, Directorate of Agriculture,
Compiled by : Bureau of Applied Economics & Statistics, Govt. of West Bengal.
Govt. of West Bengal.
1.Rapeseed and Mustard
TABLE 5.9Index Number of Agricultural Area under Selected Crops in West Bengal
(Base : Triennium ending crop year 1981-82 = 100)
276.6 318.9 300.2 300.5 306.9 326.9 328.2
State Statistical Handbook 2014 104

Crops 1990-91 2000-01 2009-10 2010-11 2011-12 2012-13 2013-14(1) (2) (3) (4) (5) (6) (7) (8)
I. Foodgrains 157.1 191.5 218.9 205.9 222.7 229.3 237.9 A Cereals 160.4 195.9 225.4 211.5 229.0 235.5 244.2 1. Rice 164.3 196.9 226.6 212.0 230.5 235.9 242.8
(i) Aus 153.3 115.7 78.9 76.7 79.7 79.7 83.5 (ii) Aman 136.3 143.0 190.6 167.4 203.7 206.7 209.4 (iii) Boro 347.1 591.7 557.1 587.2 504.9 529.6 565.2
2. Wheat 97.6 194.4 155.8 160.9 160.6 164.8 170.7 3. Barley 39.6 6.2 8.0 9.5 11.4 12.1 11.6 4. Maize 144.0 155.7 679.8 621.7 642.5 814.2 1094.9 5. Ragi 114.7 160.4 146.3 145.6 86.8 116.5 116.5 6. Small Millets 71.5 40.4 25.2 18.6 19.2 20.3 18.9 7. Other Cereals 87.5 97.5 82.5 5.0 3.8 3.8 6.1 B. Pulses 75.2 82.9 57.1 66.4 66.6 75.9 81.1 1. Gram 26.4 88.2 42.5 41.6 42.9 52.0 51.5 2. Arhar(Tur) 13.4 27.9 2.7 10.4 2.6 9.7 10.0 3. Mung 38.8 34.6 49.2 64.6 68.8 83.8 90.3 4. Masur 146.6 188.7 129.8 147.0 166.2 168.3 172.9 5. Mashkalai 118.9 56.2 54.7 60.0 53.6 64.7 74.9 6. Other Pulses 62.5 86.3 56.1 76.6 73.2 84.9 92.1II. Non- Foodgrains 179.4 265.2 409.7 395.3 340.4 382.4 346.4A. Oilseeds 315.6 393.5 490.6 476.7 473.3 550.9 564.91. Rapeseed & Mustard 443.6 550.4 584.6 553.8 502.7 626.7 631.0
2. Linseed 11.5 25.4 8.9 9.3 9.5 8.6 10.03. Sesame(Til) 183.7 195.1 323.9 356.5 353.5 381.6 418.04. Other Oilseeds 700.0 1400.2 3150.7 2771.0 3924.9 4009.5 3982.8B. Fibres 125.4 169.8 212.4 185.6 194.6 187.6 200.31. Jute 129.9 175.6 220.4 192.3 202.3 194.5 207.32. Mesta 20.2 36.9 33.1 33.9 28.4 36.5 48.83. Sunhemp 123.4 99.0 65.8 57.3 36.8 46.0 47.14. Cotton 55.6 716.7 906.1 905.6 119.7 432.2 366.1C. Plantation Crop1. Tea 118.4 143.5 175.4 179.3 211.6 225.7 245.1D. Spices 226.7 337.5 566.1 572.2 574.2 581.1 585.71. Dry Chillies 215.6 317.7 553.6 556.2 556.7 563.6 567.62. Ginger dry 207.9 436.5 557.2 568.3 574.0 578.7 584.83. Turmeric 359.1 433.2 702.5 739.4 751.9 760.6 770.2E. Vegetables & Miscellaneous crops1. Potato 225.9 386.8 697.6 676.6 490.2 585.8 456.22. Sugarcane 69.4 118.3 80.8 91.6 135.8 130.6 157.13. Tobacco 91.7 40.5 148.7 151.3 191.3 156.7 158.4All combined 162.7 210.2 267.3 253.9 250.5 268.1 265.4
Source: Evaluation Wing, Directorate of Agriculture, Govt. of West Bengal.
Compiled by : Bureau of Applied Economics & Statistics, Govt. of West Bengal.
TABLE 5.10Index Number of Agricultural Production of Selected Crops in West Bengal
(Base : Triennium ending crop year 1981-82 = 100)
203.2 342.5 607.2 590.6 438.9 518.0 410.9
State Statistical Handbook 2014 105

Crops 1990-91 2000-01 2009-10 2010-11 2011-12 2012-13 2013-14
(1) (2) (3) (4) (5) (6) (7) (8)I. Foodgrains 146.3 187.0 212.1 223.8 222.3 226.6 230.7 A. Cereals 143.7 183.4 206.1 218.5 216.7 221.1 225.4 1. Rice 144.1 184.7 205.1 218.6 216.2 220.9 224.5 (i) Aus 162.2 189.7 238.4 233.8 241.5 250.9 256.8 (ii) Aman 131.4 163.1 198.5 206.7 211.3 214.0 216.4 (iii) Boro 116.1 126.5 116.8 128.5 123.9 129.2 131.6 2. Wheat 121.2 152.6 164.9 169.7 170.1 171.4 172.2 3. Barley 126.1 58.5 150.9 153.2 161.9 165.8 161.0 4. Maize 112.1 222.1 349.9 352.8 330.3 332.9 382.7 5. Ragi 135.7 196.6 192.5 192.8 159.9 178.8 178.7 6. Small Millets 71.5 92.5 157.5 136.8 135.2 137.3 135.1 7. Other Cereals 95.4 88.6 64.7 60.2 56.7 53.6 43.5 B. Pulses 121.5 153.2 158.6 170.7 169.9 176.6 176.1 1. Gram 91.0 142.5 172.8 165.7 163.1 182.8 182.7 2. Arhar(Tur) 52.8 71.7 81.8 152.9 47.3 153.4 153.7 3. Mung 87.2 107.1 102.1 127.4 119.4 125.7 128.6 4. Masur 185.3 231.5 234.3 238.6 261.3 245.4 246.4 5. Mashkalai 123.3 109.8 149.9 144.6 136.7 147.1 146.4 6. Other pulses 133.3 210.5 177.5 242.4 231.6 252.4 255.7 II. Non-Foodgrains 146.9 174.9 245.8 241.2 206.4 224.8 200.3A. Oilseeds 182.7 195.4 213.8 211.2 207.2 225.0 225.2
2. Linseed 79.3 125.1 109.9 132.9 135.7 131.2 135.03. Sesame(Til) 176.8 174.0 166.6 186.5 185.6 185.8 187.44. Other oilseeds 164.1 205.9 248.7 242.8 343.8 318.3 321.6B. Fibres 142.7 157.7 198.9 187.5 187.1 186.7 202.41. Jute 140.3 154.7 193.8 182.8 182.4 182.1 197.72. Mesta 88.6 135.7 247.0 217.3 208.8 217.8 231.23. Sunhemp 103.9 104.2 126.1 128.5 83.8 96.4 96.44. Cotton 111.2 120.5 136.4 288.9 167.4 206.8 201.2C. Plantation Crop 1. Tea 108.5 123.9 141.5 144.6 170.6 149.1 162.0D. Spices 105.2 118.3 186.5 187.2 186.2 187.4 187.91. Dry chillies 105.2 122.9 207.7 208.1 207.0 208.6 209.32. Ginger dry 109.8 131.0 139.0 139.5 139.7 139.7 139.93. Turmeric 108.8 93.6 136.3 140.6 140.7 140.9 141.3
1. Potato 133.4 148.2 207.0 190.0 148.4 172.9 127.12. Sugarcane 126.2 121.6 130.5 135.5 187.6 180.1 204.83. Tobacco 109.7 58.9 159.5 160.6 166.5 191.5 191.5
All Combined 148.2 190.6 235.7 245.3 228.4 238.9 232.2
Govt. of West Bengal.Compiled by : Bureau of Applied Economics & Statistics,
Govt. of West Bengal.
191.7 192.3
141.6
Source: Evaluation Wing, Directorate of Agriculture,
140.9 157.1 222.8 205.1 161.8 188.8
1. Rapeseed & Mustard
E. Vegetables and Miscellaneous Crops
TABLE 5.11Index Number of Agricultural Productivity of Selected Crops in West Bengal
(Base : Triennium ending crop year 1981- 82 =100)
160.4 172.6 194.7 184.3 163.8
State Statistical Handbook 2014 106

(1) (2) (3) (4) (5) (6) (7) (8)1990-91 109.8 162.7 148.2 114.2 111.8 165.7 98.2 2000-01 110.3 210.2 190.6 128.8 113.4 216.0 97.3 2005-06 114.5 232.9 203.4 130.7 120.4 244.9 95.1 2006-07 115.3 227.0 196.9 133.8 121.2 238.7 95.1 2007-08 115.7 251.9 217.7 134.7 121.7 264.9 95.1 2008-09 117.4 225.8 192.3 134.1 123.4 237.4 95.1 2009-10 113.4 267.3 235.7 134.1 120.1 283.1 94.4 2010-11 103.5 253.9 245.3 138.7 115.4 283.1 89.7 2011-12 110.5 252.5 228.4 131.9 118.4 270.4 93.4 2012-13 112.2 268.1 238.9 132.5 120.0 286.7 93.5 2013-14 114.3 265.4 232.2 136.2 121.6 282.3 94.0
∑Cij Yio Pio x 100 ∑Cio Yio Pio
aio
∑ aio
aij
∑aij
Yio =Yield per hectare of the i-th Crop in the base period.Pio =Price per unit of the i-th Crop in the base period.
Productivity Croppingpattern
Source: Evaluation Wing, Directorate of Agriculture, Govt. of West Bengal.
Compiled by : Bureau of Applied Economics & Statistics,
CroppingIntensity
Netareasown
(ii) Index of Cropping Intensity =Index of area under crops
x 100Index of net area sown
Govt. of West Bengal.
(i) Index of Cropping pattern in the j-th year =
Where Cio = = Proportion of area under the i-th Crop in the base period
Cij = = Proportion of area under the i-th Crop in the j-th year.
Year
(Base : Triennium ending crop year 1981- 82 =100)
TABLE 5.12Index Number of Agricultural Area, Production, Productivity,
Cropping Pattern, Cropping Intensity, Productivity per hectare ofNet Area Sown of Selected Crops and Net Area sown in West Bengal
Productivityper hectareof net area
sown
Area Production
State Statistical Handbook 2014 107

Particulars 1990-91 2000-01 2010-11 2011-12 2012-13 2013-14
(1) (2) (3) (4) (5) (6) (7)
Total 1188 1188 1188 1188 1188 1188
Status:
(i) Reserved Forests 706 706 706 706 706 706
(ii) Protected Forests 377 377 377 377 377 377
Source: Chief Conservator of Forest, Govt. of West Bengal
TABLE 6.0Classification of Forest Area by Status in West Bengal
(In thousand hectares)
105105 105 105 105 105 (iii) Unclassed state forest and others
State Statistical Handbook 2014 108

(In cubic metre)
Year Firewood**
(1) (3)
1990-91 210692
2000-01 250399
2005-06 324092
2006-07 387094
2007-08 262023
2008-09 314740(R)
2009-10 207625
2010-11 155854
2011-12 103250(R)
2012-13 103039
2013-14 149640
Source: - Annual Report, Directorate of Forests, Govt. of West Bengal
# = Data has been revised as per source of Pricipal Chief Conservator of Forest. Govt. of W.B.
183401
58086
95612(R)
**=Firewood includes quantity of firewood
required for production of charcoal, other
firewood and pulp wood.
149150
*= Timber includes plywood, match wood, other timber and poles.
(2)
TABLE 6.1Out-turn of Timber and Firewood from Forest in West Bengal #
Timber*
88252
132733
88160
85993
114589
231578
151123
State Statistical Handbook 2014 109

Honey Wax Sal Seeds Kendu leaves Lac Citronnella Grass
( Quintals ) ( Quintals ) ( Tonnes ) ( Tonnes ) ( Tonnes ) ( Quintals )(1) (2) (3) (4) (5) (6) (7)
1990-91 148 9 345 2080 - -
2000-01 494 7 1848 362 - 2137
2005-06 306 16 118 1165 - 8613
2006-07 382 14 121 1164 - 7101
2007-08 251 14 1408 849 - 3227
2008-09 246 9 76 803 - 2094
2009-10 258 0.4 418 907 - 3548
2010-11 200 6 - 7189 - 3273(R)
2011-12 278 15 2361 21151 - -
2012-13 334 - 4139 4440 - -
2013-14 392 - - 6029 - 709
TABLE 6.2
Out-turn of Minor Forest Produce in Forest Areas of West Bengal
Year
Minor forest produce
Source: Directorate of Forest, Govt. of West Bengal
State Statistical Handbook 2014 110
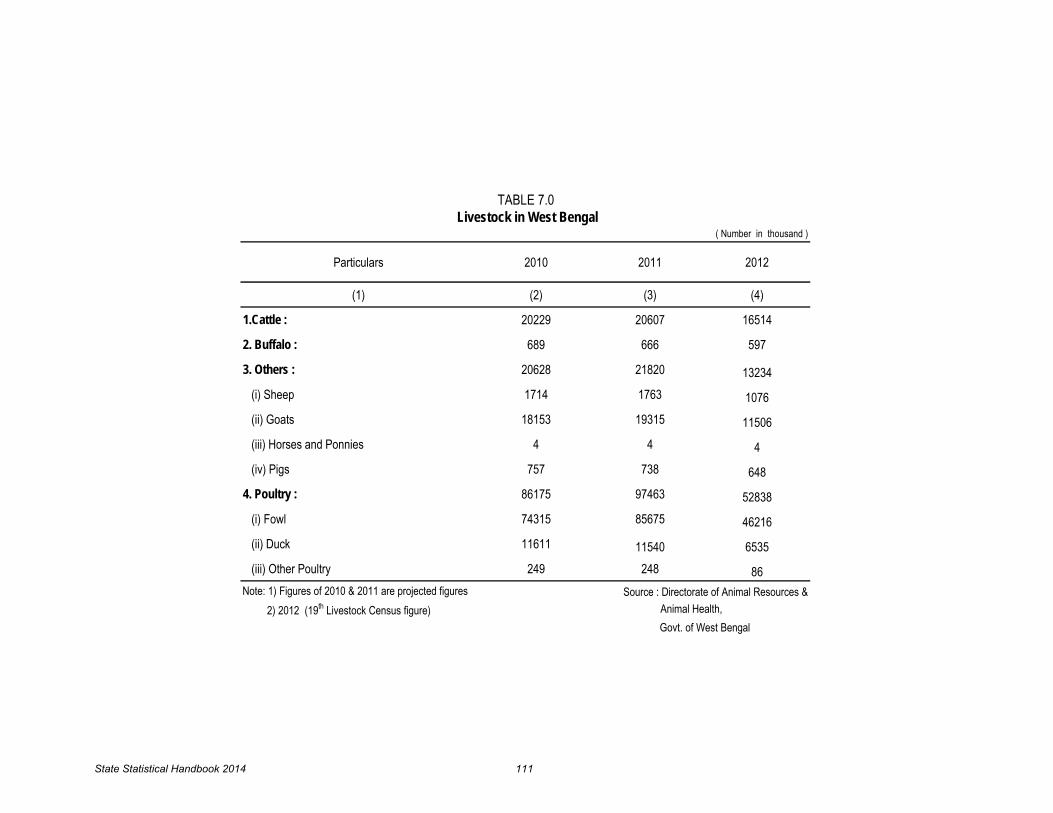
Particulars 2010 2011 2012
(1) (2) (3) (4)
1.Cattle : 20229 20607 16514
2. Buffalo : 689 666 597
3. Others : 20628 21820 13234 (i) Sheep 1714 1763 1076 (ii) Goats 18153 19315 11506 (iii) Horses and Ponnies 4 4 4 (iv) Pigs 757 738 6484. Poultry : 86175 97463 52838 (i) Fowl 74315 85675 46216 (ii) Duck 11611 11540 6535 (iii) Other Poultry 249 248 86Note: 1) Figures of 2010 & 2011 are projected figures 2) 2012 (19th Livestock Census figure)
TABLE 7.0 Livestock in West Bengal
( Number in thousand )
Source : Directorate of Animal Resources &
Govt. of West Bengal Animal Health,
State Statistical Handbook 2014 111
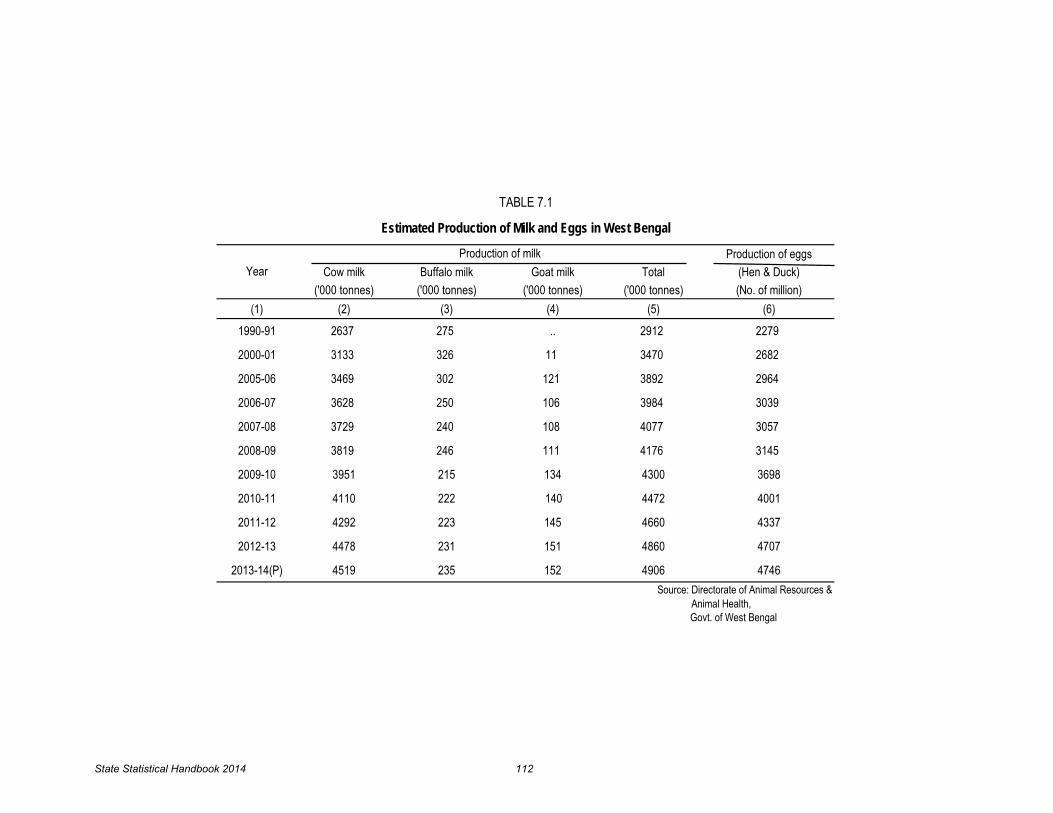
Production of eggsCow milk Buffalo milk Goat milk Total (Hen & Duck)
('000 tonnes) ('000 tonnes) ('000 tonnes) ('000 tonnes) (No. of million)(1) (2) (3) (4) (5) (6)
1990-91 2637 275 .. 2912 2279
2000-01 3133 326 11 3470 2682
2005-06 3469 302 121 3892 2964
2006-07 3628 250 106 3984 3039
2007-08 3729 240 108 4077 3057
2008-09 3819 246 111 4176 3145
2009-10 3951 215 134 4300 3698
2010-11 4110 222 140 4472 4001
2011-12 4292 223 145 4660 4337
2012-13 4478 231 151 4860 4707
2013-14(P) 4519 235 152 4906 4746
Govt. of West Bengal Animal Health,
TABLE 7.1
Estimated Production of Milk and Eggs in West Bengal
YearProduction of milk
Source: Directorate of Animal Resources &
State Statistical Handbook 2014 112

Particulars 1990-91 2000-01 2011-12(R) 2012-13 2013-14
(1) (2) (3) (4) (5) (6)
1. Production of Fish (in thousand tonnes)
(a) Inland 555 879 1290 1338 1392
(b) Marine 125 181 182 152 188
Total 680 1060 1472 1490 1580
2. Production of Fishseed (number in million) 7552 8850 13846 15002 15890
R = Revised
TABLE 7.2Production of Fish and Fishseed in West Bengal
Source:Directorate of Fisheries Govt of West Bengal
State Statistical Handbook 2014 113
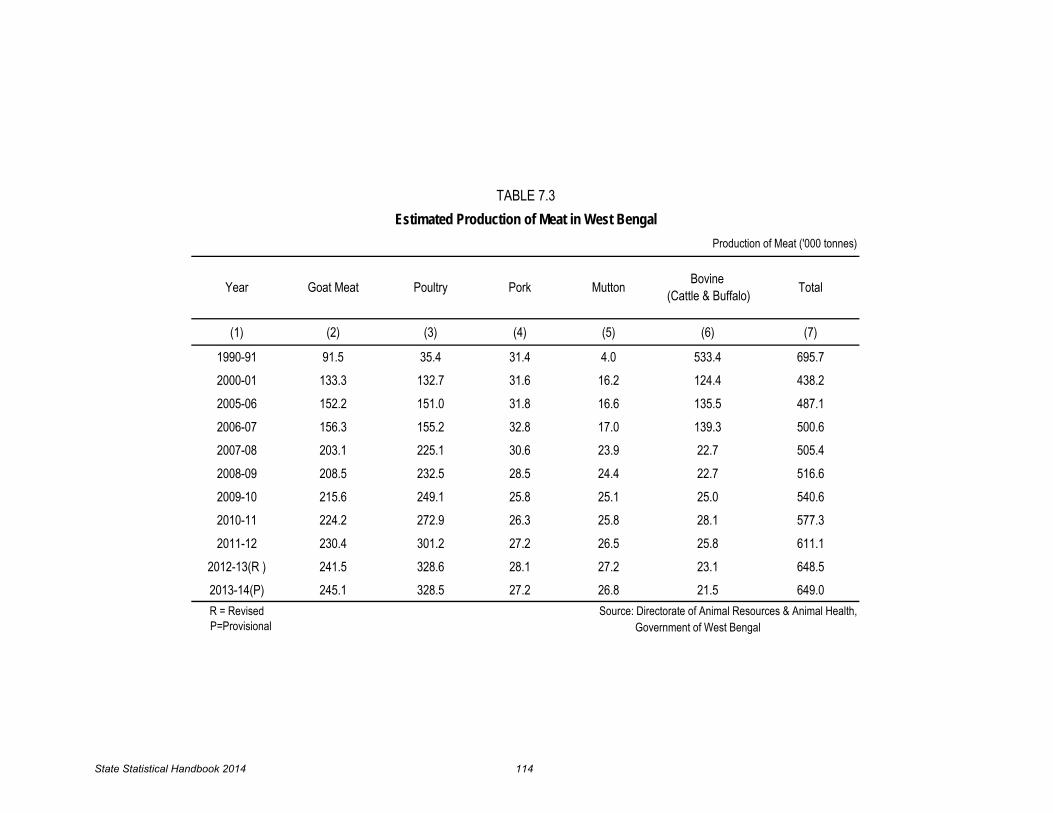
(1) (2) (3) (4) (5) (6) (7)
1990-91 91.5 35.4 31.4 4.0 533.4 695.72000-01 133.3 132.7 31.6 16.2 124.4 438.22005-06 152.2 151.0 31.8 16.6 135.5 487.12006-07 156.3 155.2 32.8 17.0 139.3 500.62007-08 203.1 225.1 30.6 23.9 22.7 505.42008-09 208.5 232.5 28.5 24.4 22.7 516.62009-10 215.6 249.1 25.8 25.1 25.0 540.62010-11 224.2 272.9 26.3 25.8 28.1 577.32011-12 230.4 301.2 27.2 26.5 25.8 611.1
2012-13(R ) 241.5 328.6 28.1 27.2 23.1 648.52013-14(P) 245.1 328.5 27.2 26.8 21.5 649.0R = RevisedP=Provisional Government of West Bengal
TABLE 7.3Estimated Production of Meat in West Bengal
Production of Meat ('000 tonnes)
Source: Directorate of Animal Resources & Animal Health,
Year Goat Meat Poultry Pork Mutton TotalBovine (Cattle & Buffalo)
State Statistical Handbook 2014 114

Particulars 1990-91 2000-01 2011-12 2012-13 2013-14
(1) (2) (3) (4) (5) (6)1. Hospitals I. State Animal Health Centre (S.A.H.C.) II. District Veterinary Hospital2. Dispensaries
3. Additional Dispensaries I. Additional Block Animal
Health Centre (A.B.A.H.C.)
4. Animal treated 5958694 11683285 12134000 13059836 15799164
341
Govt, of West Bengal opened one
341
Note: To enhance veterinary facilities,
341 341 341 I. Block Animal Health Centre (B.A.H.C.)
TABLE 8.0Category-wise Number of Veterinary Institutions and the Number of Animals
Treated in West Bengal(In Number)
11091 91 91 91
19 19 19 19
A,D.A.C. at each Gram Panchyat from 31.3.99.
270 271 271
Source: Directorate of Animal Resources and Animal Health,
271 271
620 3247 3248 3248 3248 II. Animal Development Aid Centre (A.D.A.C.)
Govt. of West Bengal
State Statistical Handbook 2014 115
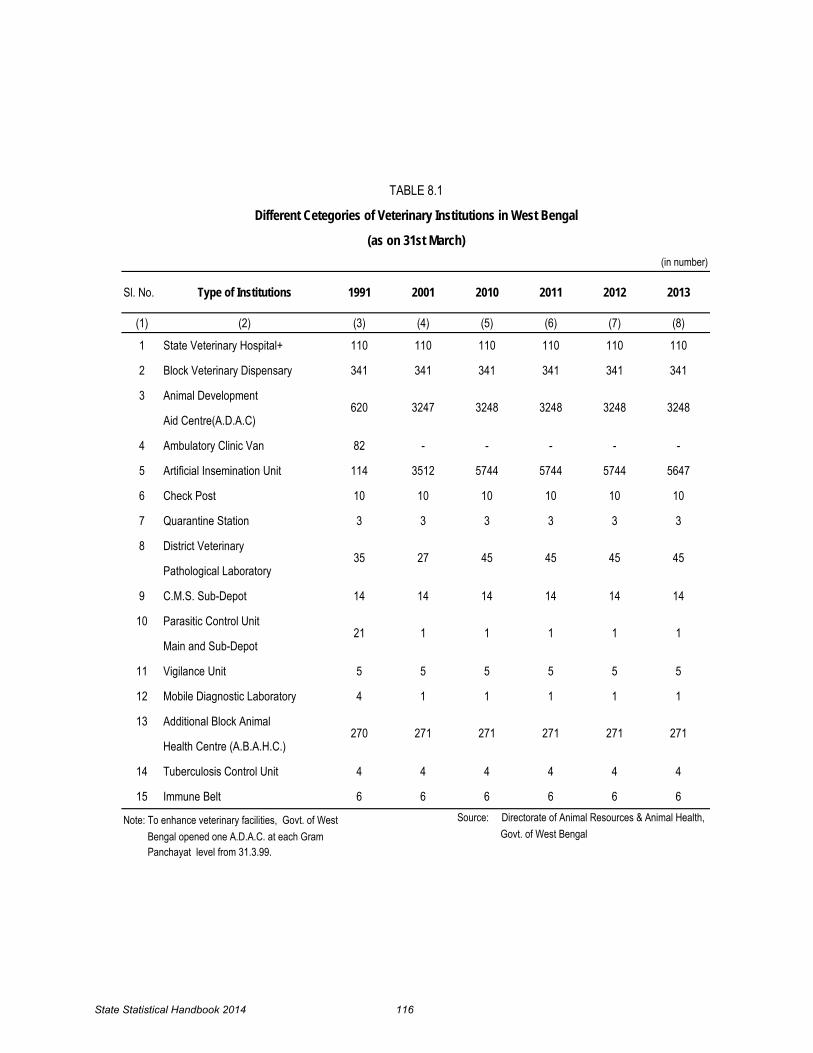
Sl. No. Type of Institutions 1991 2001 2010 2011 2012 2013
(1) (2) (3) (4) (5) (6) (7) (8)
1 State Veterinary Hospital+ 110 110 110 110 110 110
2 Block Veterinary Dispensary 341 341 341 341 341 341
3 Animal Development
Aid Centre(A.D.A.C)
4 Ambulatory Clinic Van 82 - - - - -
5 Artificial Insemination Unit 114 3512 5744 5744 5744 5647
6 Check Post 10 10 10 10 10 10
7 Quarantine Station 3 3 3 3 3 3
8 District Veterinary
Pathological Laboratory
9 C.M.S. Sub-Depot 14 14 14 14 14 14
10 Parasitic Control Unit
Main and Sub-Depot
11 Vigilance Unit 5 5 5 5 5 5
12 Mobile Diagnostic Laboratory 4 1 1 1 1 1
13 Additional Block Animal
Health Centre (A.B.A.H.C.)
14 Tuberculosis Control Unit 4 4 4 4 4 4
15 Immune Belt 6 6 6 6 6 6
Panchayat level from 31.3.99.
Source: Directorate of Animal Resources & Animal Health,
271
21 1 1 1 1 1
270 271 271 271 271
45 45
Note: To enhance veterinary facilities, Govt. of West Bengal opened one A.D.A.C. at each Gram Govt. of West Bengal
45
TABLE 8.1
Different Cetegories of Veterinary Institutions in West Bengal
(as on 31st March)(in number)
620 3247 3248 3248 3248 3248
35 27 45
State Statistical Handbook 2014 116

In M.W.
Particulars 1990-91 2000-01 2010-11 2011-12 2012-13 2013-14
(1) (2) (3) (4) (5) (6) (7)
1. Hydel 105.03 224.70 242.81 242.81( R) 239.75( R) 239.75
2. Thermal 3021.00 5265.00 7226.00( R) 7966.40( R) 9428.00( R) 9428.00
3. Diesel and Wind 17.97 18.00 0.82 2.82(R) 2.82(R) 2.82(R)
4. Gas 100.00 100.00 .. .. .. ..
5.Solar PV .. .. .. .. 2.00 2.00
6. Pump Storage .. .. 900.00 900.00 900.00 900.00
Total 3244.00 5607.70 8126.82( R). 9110.03( R) 10572.57( R) 10572.57
R= Revised Source : Department of Power and Non Conventional Energy Sources
Installed Electricity Generating Capacity (derated) in West Bengal (excluding N.T.P.C.)TABLE 9.0
Government of West Bengal.
State Statistical Handbook 2014 117

1990-91 2000-01 2011-12 2012-13 2013-14
(2) (3) (4) (5) (6)
346.96 444.83 549.45( R) 555.87( R) 646.68
9933.15 21995.28* 46644.32( R) 50877.95( R) 50944.61
0.52 0.50 0.47( R) 0.29( R) 0.47(R)
23.56 6.30 .. .. ..
.. .. .. 1.54 0.73
.. .. 766.41 797.50 784.71
10304.19 22446.91* 47960.65 ( R) 52233.15( R) 52376.73
R = Rivised
Gross Generation
* Excluding Bakreswar Thermal Power Station.
TABLE 9.0(a)Gross Generation of Electricity in West Bengal
(excluding N.T.P.C.)In MKWH.
Particulars
(1)
Energy Sources ,Government of West Bengal.
1. Hydel
2. Thermal
3. Diesel and Wind
4. Gas
6. Pump Storage
Total Source : Department of Power and Non Conventional
5.Solar Pv
State Statistical Handbook 2014 118

Sl.No. Type of Use 1990-91 2000-01 2010-11 2011-12 2012-13(R) 2013-14(R)
(1) (2) (3) (4) (5) (6) (7) (8)
1 Domestic 1790.68(R ) 4374.25 8880.13 9690.73 11077.44 11268.38
2 Commercial 1033.51(R ) 1910.51 4156.46( R) 4428.70( R) 4874.74 4967.52
3 Industrial 4311.74(R ) 6870.80 15104.51( R) 16277.99( R) 17151.18 17254.75
4 Public Lighting 69.99 ( R) 146.02 337.61 385.27 408.16 393.51
5 Traction 579.39(R ) 808.87(R) 1199.94( R) 1256.79( R) 1314.53 1348.18
6 Agriculture 264.75(R ) 997.20 1803.85( R) 1295.75( R) 1245.50 1183.14
7 Public Water Works and sewerage pumping 232.67( R) 365.09 555.05( R) 586.24( R) 609.31 646.34
8 Miscellaneous 89.25( R) .. 1015.597( R) 961.83( R) 1033.76 968.10
Total 8371.98( R) 15472.74 52914.64( R) 56039.51( R) 58694.62 56551.10
Note: 1) The sales include D.V.C.'s sale to ultimate consumers in West Bengal2) Total sale of P D C L is included in the row ' Total' from 2010-11 onwards
In 2010-11: 19861.87 , In 2011-12: 21206.13, In 2012-13: 20979.94 MKWHR = Revised
TABLE 9.1 Sales of Electricity in West Bengal
In MKWH
Source: Department of Power and Non Conventional Energy Sources, Government of West Bengal.
State Statistical Handbook 2014 119

No. P.C. No. P.C. No. P.C. No. P.C. No. P.C.(1) (2) (3) (4) (5) (6) (7) (8) (9) (10) (11)
Burdwan 2387 95.9 2380 95.7 2438 100.0 2438 100.0 2438 100.0
Birbhum 2213 99.1 2217 99.3 2256 100.0 2256 100.0 2259 100.0
Bankura 2027 56.9 2470 69.3 3577 100.0 3577 100.0 3578 100.0
Purba medinipur 2964 100.0 2964 100.0
Paschim Medinipur 7559 99.7 7580 100.0
Howrah 749 100.0 734 100.0 727 100.0 727 100.0 728 100.0
Hooghly 1865 98.3 1897 100.0 1886 100.0 1886 100.0 1886 100.0
North 24 Parganas 1479 92.4 1506 94.1 1571 100.0 1571 100.0 1572 100.0
South 24 Parganas 1698 80.1 1808 85.3 2086 100.0 2086 100.0 2088 100.0
Nadia 1254 100.0 1248 100.0 1250 100.0 1250 100.0 1251 100.0
Murshidabad 1760 91.8 1794 93.5 1924 99.9 1924 99.9 1924 99.9
Uttar Dinajpur 1250 82.7 1471 99.6 1477 100.0 1477 100.0
Dakshin Dinajpur 1154 75.0 1579 100.0 1579 100.0 1579 100.0
Malda 1595 97.2 1597 97.3 1639 99.9 1639 99.9 1642 100.0
Jalpaiguri 724 98.6 732 99.7 742 100.0 742 100.0 742 100.0
Darjeeling 488 78.7 539 86.9 640 100.0 640 100.0 640 100.0
Cooch Behar 1117 98.1 1121 98.4 1138 100.0 1138 100.0 1138 100.0
Purulia 1343 54.7 1577 64.2 2457 99.6 2467 99.9 2467 99.9West Bengal 27584 72.8 29596 78.1 37904 99.9 37941 99.9 37958 99.9Note: No. of Inhabited villages as per 1991 Census has been used to calculate percentagesfor the year1991 & 2001. No. of Inhabited villages as per 2001 Census has been used to calculate percentages for the year 2012 W B S E D C L No. of inhabited villages as per Department of P & RD. has been used to calculated percentages for the year 2013 & 2014
TABLE 9.2Districtwise No. of Villages Electrified in
West Bengal( as on 31st March)
1991 2001 2012 2013 2014District
2327 76.4
Source: Chief Engineer(Dist. Constn.) RE.
4558 43.5 5572 53.2 10549 100.0
State Statistical Handbook 2014 120

Production Value Production Value Production Value Production Value
(1) (2) (3) (4) (5) (6) (7) (8) (9) (10)
Coal '000 tonnes 23133 45807600 21659 28164100 2423080662100 26467 108398800
Natural Gas million cubic metre 38 142213 41 262441 84537684 107 684907
Apatite tonnes 2110 3699 1261 2211 136295 .. ..
Felspar tonnes 3050 1464 2702 1321 50311947 13560 2462
Fire Clay tonnes 46179 4614 36868 4716 824237974 93733 14105
Kaolin tonnes 99439 42979 89845 37937 9214837249 95607 53175
Quartz tonnes 15823 3384 16906 4194 160845000 30258 9495
Silica Sand tonnes .. .. 55000 22000 51130 21730 71772 30911
Sulphur tonnes 15511 .. 25292 .. 31749 .. 36382 ..
2011-12(R) 2012 -13(P)UnitItems
P :Provisional Source: i) I B M ,Indian Mineral Year Book, 2013
TABLE 9.3Production and Value of Minerals of West Bengal
(Value in Rs. '000)
2009-10 2010-11
State Statistical Handbook 2014 121
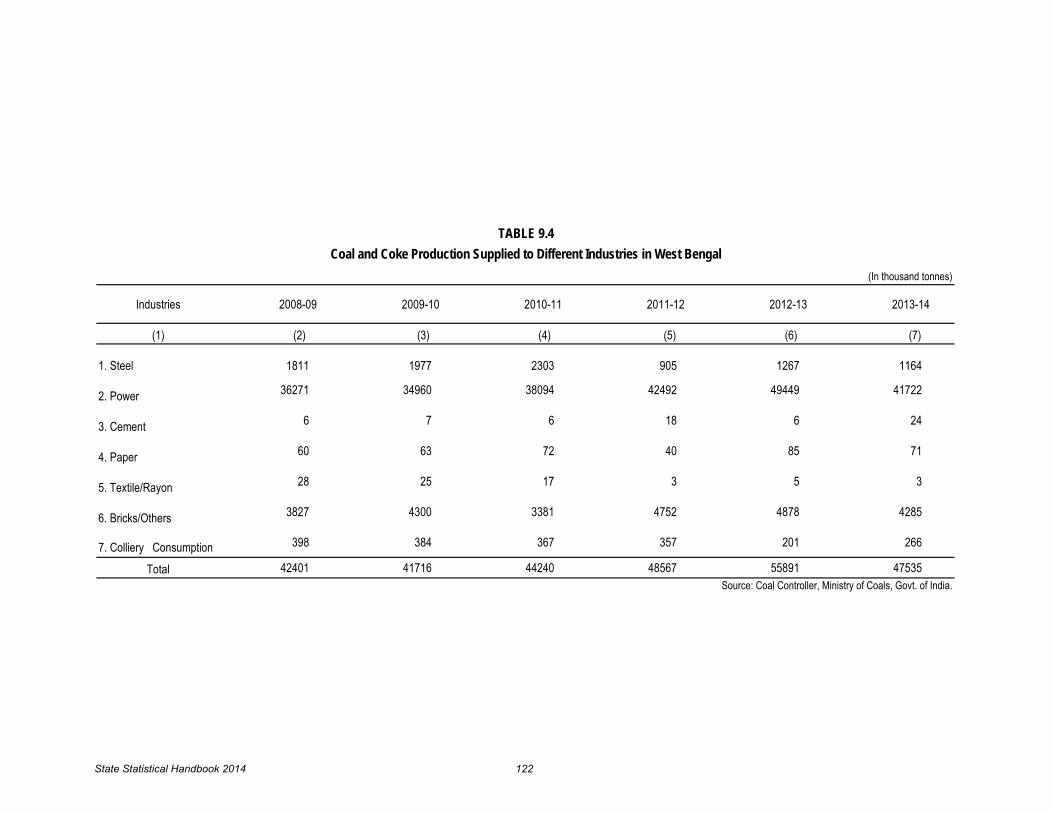
Industries 2008-09 2009-10 2010-11 2011-12 2012-13 2013-14
(1) (2) (3) (4) (5) (6) (7)
1. Steel 1811 1977 2303 905 1267 1164
2. Power 36271 34960 38094 42492 49449 41722
3. Cement 6 7 6 18 6 24
4. Paper 60 63 72 40 85 71
5. Textile/Rayon 28 25 17 3 5 3
6. Bricks/Others 3827 4300 3381 4752 4878 4285
7. Colliery Consumption 398 384 367 357 201 266
Total 42401 41716 44240 48567 55891 47535
Coal and Coke Production Supplied to Different Industries in West BengalTABLE 9.4
Source: Coal Controller, Ministry of Coals, Govt. of India.
(In thousand tonnes)
State Statistical Handbook 2014 122

Sl No. Industry 1991 2001 2010 2011 2012 2013 (R)
(1) (2) (3) (4) (5) (6) (7) (8)1 Rice Mills 426 577 822 837 852 907
2 Tea Factories 278 323 364 373 376 403
3 Cotton Textiles 312 344 400 411 416 427
4 Jute Mills 78 96 109 111 112 112
5 Leather & Leather Products * .. .. 529 530 534 547
6 Paper & Paper Products 197 244 293 304 311 341
7 Printing & Allied Industries 356 405 459 469 503 570
8 Rubber & Rubber Products 330 328 376 380 413 434
9 Chemical & Chemical Products 554 747 885 895 911 959
10 Glass & Glass Products 61 76 99 100 112 112
11 Engineering 4252 5181 6005 6103 6152 6298
12 Ship Building & Repairs 32 34 42 47 48 45
13 Electricity 78 83 91** 92** 95** 94**
14 Coal Mines 114 99 105 104(R) 100 (P) ..Sources :
.. = Not available.
TABLE -10.0Number of Major Industries in West Bengal
( Registered under Chief Inspector of Factories )
** Including Sub - stations.
(1) Chief Inspector of Factories, West Bengal.(2) Directorate General of Mines Safety,
Ministry of Labour & Employment, Govt. of India.
P = Provisional.
R = Revised.* Introduced from 2005.
State Statistical Handbook 2014 123

Sl No. Particulars Unit 1990-91 2000-01 2009-10 2010-11 2011-12 2012-13
(1) (2) (3) (4) (5) (6) (7) (8) (9)
1 Number of Factories Number 5606 6091 6818 8232 8402 8607
2 Fixed Capital ` In lakhs 848988 1725304 5967266 5932796 7169937 8206693
3 Invested Capital " 1251767 2522097 8496909 9329431 10925703 12295536
4 Productive Capital " 1052847 2005480 7226736 8262260 9327339 10280208
5 Number of Workers Number 578651 455812 466191 513975 534838 537284
6 Number of Employees Number 740980 569838 571994 635626 654276 656123
7 Wages to Workers ` In lakhs 134492 256127 333916 455432 513141 593411
8 Total Emoluments " 202882 385608 718640 997631 1051404 957597
9 Fuels consumed " 131266 259979 719133 855012 1084216 1210385
10 Material consumed " 1023504 2417002 9439192 12841686 15623049 16238167
11 Total inputs " 1265652 3206795 13420119 18097837 20715685 22009272
12 Products " 1529122 3434695 12545454 16325180 19370900 20173921
13 Gross output " 1628735 3918267 15704706 20611103 23320091 24718679
14 Net Value added " 319842 569917 1931961 2085971 2055832 2228051
All departmental undertakings such as Railway Workshops etc. have also been kept outside from 1999-2000. C.S.O., Government of India
TABLE -10.1
Note : All Electricity Undertakings other than captive units are kept outside the purview of ASI from 1988-89.
Economic Structure of Factories under Annual Survey of Industries in West Bengal ( Census and Non-Census Sectors)
Source : Annual Survey of Industries ,
State Statistical Handbook 2014 124

Number
Proposed (EM-I) Established (EM-II) Proposed
(EM-I) Established (EM-II) Proposed (EM-I) Established (EM-II)
(2) (3) (4) (5) (6) (7)
915 981 731 763 490 951
224 280 224 329 531 255
392 422 422 415 354 235
670 530 454 296 560 603
881 1174 1073 768 768 473
890 1418 1215 1083 1137 1117
335 516 345 333 381 630
921 1722 943 1595 579 1342
737 1056 671 963 418 905
479 1527 497 1348 584 1578
508 714 643 768 671 861
1065 721 797 244 197 347
233 130 372 152 255 196
160 67 136 65 106 153
338 153 422 184 358 366
728 1126 351 294 476 649
125 200 178 191 184 155
409 370 502 388 298 248
419 352 360 152 304 316
10429 13459 10336 10331 8651 11380Note : Source :
Malda
Jalpaiguri
Darjeeling *
Cooch Behar
Purulia
(1)
Nadia
Murshidabad
Uttar Dinajpur
Dakshin Dinajpur
Howrah
Hooghly
24-Parganas (N)
24-Parganas (S)
Kolkata
Burdwan *
Birbhum
Bankura
Midnapore (E)
Midnapore (W)
Directorate of Micro & Small Scale Enterprises, Government of West Bengal
* These districts have one sub-DIC each.
After the introduction of the Micro, Small & Medium Enterprises Develpoment Act in October ,2006 the registration system has been abolished. The Micro and small entrepreneurs will have to file Entrepreneur Memorandum (EM), Proposed units relate to EM-I and the established units relate to EM-II.
Total
TABLE-10.2
2011-12 2012-13 2013-14
Number of Small Scale Industrial Units Filed Entrepreneur Memorandum to the Directorate of Micro and Small Scale Enterprises in West Bengal by District
District
State Statistical Handbook 2014 125

Sl.No. Item 2001 2011 2012 2013
(1) (2) (4) (5) (6) (7)
1 Jute Textiles
Total 1392.7 1402.1 1450.0 1463.3
Hessian 277.6 244.7 223.6 196.5
Sacking 901.9 1012.7 1081.2 1125.1
Other 213.2 144.7 145.2 141.7
2 Cotton Textilies : Mill Made -
Yarn 39189 30598 27207 27500(R)
Cloth(Blended only) 1724 5649 5980 7892(R)
Handloom Cloth 650.00 902.78 884.02 839.82
3 Iron and Steel
Semi- Finished Steel 1030.1 5258*
6041*
8617*
(R)
Finished Steel 1554.9 3774*
3379 *
3339*
(R)
4 Tea 190689 271587 279300 312880(R)
* = Figures relate to Financial Year i.e. 2011 means 2011-12 and so on.
4) Joint Director (Handloom),Govt. of WB 5) Joint Plant Committee, Govt. of India.
Sources :1) Jute Commissioner,Govt. of India 2) Textile Commissioner,Govt. of India
3) Tea Board,Govt. of India.R = Revised.
TABLE -10.3
Industrial Production in West Bengal
Unit
(3)
`000 tonnes
`000 tonnes
`000 tonnes
`000 tonnes
`000 tonnes
`000 tonnes
`000 Kgs.
`000 Kgs.
`000 Sq. metres
Million metres
State Statistical Handbook 2014 126

Sector (Weight)
(1) (2) (3) (4) (5)
2004-05 100.0 100.0 100.0 100.0
2005-06 103.8 108.8 109.7 108.2
2006-07 105.8 110.6 111.6 110.1
2007-08 95.3 120.6 115.8 115.7
2008-09 97.1 136.3 121.2 127.3
2009-10 98.2 140.6 128.0 131.5
2010-11 92.2 159.6 136.2 144.6
2011-12 103.4 161.1 138.4 147.7
2012-13 112.3 168.7 132.2 152.9
2013-14 120.7 171.4 161.4 161.5
Govt. of West BengalSource : Bureau of Applied Economics & Statistics,
TABLE-10.4
Index of Industrial Production of West Bengal by Sector
(Base : 2004-05 = 100 )
Year Mining(155.52)
Manufacturing (650.56)
Electricity (193.92)
General(1000.00)
State Statistical Handbook 2014 127

(1) (2) (3 (4) (5) (6) (7)
2004-05 100.0 100.0 100.0 100.0 100.0 100.0
2005-06 107.5 153.0 112.8 104.9 103.4 108.2
2006-07 108.1 135.4 122.1 113.9 108.9 110.1
2007-08 107.6 148.9 164.1 136.8 122.6 115.7
2008-09 120.8 158.3 165.5 145.6 130.1 127.3
2009-10 130.3 162.1 242.2 110.7 118.8 131.5
2010-11 137.2 288.7 513.5 138.8 125.0 144.6
2011-12 131.3 316.6 368.8 169.1 149.0 147.7
2012-13 134.3 295.1 387.5 187.5 157.5 152.9
2013-14 158.0 201.3 324.4 170.0 148.9 161.5
Source: Bureau of Applied Economics & Statistics,
(Base : 2004-05 = 100 )
Govt. of West Bengal
Type of Goods (Weight)
Index of Industrial Production of West Bengal by Use Based Classes of Goods
TABLE -10.4 (a)
YearBasic
(677.80)Capital (34.40)
Consumer Durables
(9.60)
Consumer Non-Durables (139.90)
Intermediate (138.30)
General (1000.00)
State Statistical Handbook 2014 128
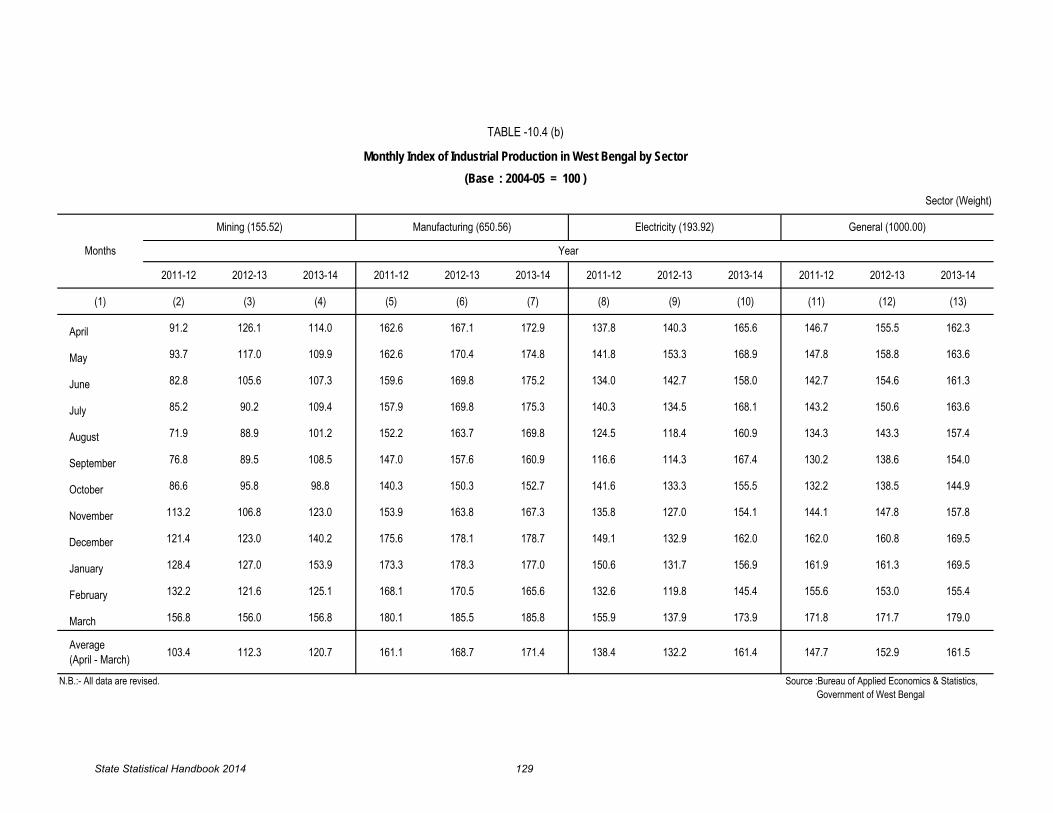
2011-12 2012-13 2013-14 2011-12 2012-13 2013-14 2011-12 2012-13 2013-14 2011-12 2012-13 2013-14
(1) (2) (3) (4) (5) (6) (7) (8) (9) (10) (11) (12) (13)
April 91.2 126.1 114.0 162.6 167.1 172.9 137.8 140.3 165.6 146.7 155.5 162.3
May 93.7 117.0 109.9 162.6 170.4 174.8 141.8 153.3 168.9 147.8 158.8 163.6
June 82.8 105.6 107.3 159.6 169.8 175.2 134.0 142.7 158.0 142.7 154.6 161.3
July 85.2 90.2 109.4 157.9 169.8 175.3 140.3 134.5 168.1 143.2 150.6 163.6
August 71.9 88.9 101.2 152.2 163.7 169.8 124.5 118.4 160.9 134.3 143.3 157.4
September 76.8 89.5 108.5 147.0 157.6 160.9 116.6 114.3 167.4 130.2 138.6 154.0
October 86.6 95.8 98.8 140.3 150.3 152.7 141.6 133.3 155.5 132.2 138.5 144.9
November 113.2 106.8 123.0 153.9 163.8 167.3 135.8 127.0 154.1 144.1 147.8 157.8
December 121.4 123.0 140.2 175.6 178.1 178.7 149.1 132.9 162.0 162.0 160.8 169.5
January 128.4 127.0 153.9 173.3 178.3 177.0 150.6 131.7 156.9 161.9 161.3 169.5
February 132.2 121.6 125.1 168.1 170.5 165.6 132.6 119.8 145.4 155.6 153.0 155.4
March 156.8 156.0 156.8 180.1 185.5 185.8 155.9 137.9 173.9 171.8 171.7 179.0
Average (April - March) 103.4 112.3 120.7 161.1 168.7 171.4 138.4 132.2 161.4 147.7 152.9 161.5
Electricity (193.92) General (1000.00)
TABLE -10.4 (b)
Monthly Index of Industrial Production in West Bengal by Sector(Base : 2004-05 = 100 )
Mining (155.52) Manufacturing (650.56)
Months
Sector (Weight)
Year
Source :Bureau of Applied Economics & Statistics, Government of West Bengal
N.B.:- All data are revised.
State Statistical Handbook 2014 129

Central Govt. State Govt. Quasi Govt. Local Bodies Total(1) (2) (3) (4) (5) (6) (7) (8)
1991 421.6 428.9 703.1 144.5 1698.1 888.0 2586.12001 400.1 442.5 + 629.5 181.5 1653.6 750.0 2403.62005 350.6 395.2 482.2 152.0 1380.0 759.0 2139.02006 347.4 382.9 455.5 153.1 1338.9 769.0 2107.92007 340.2 364.4 463.5 140.9 1309.1 750.0 2059.12008 378.3 356.2 461.8 144.4 1340.7 734.0 2074.72009 271.5 355.6 446.1 127.3 1200.5 719.0 1919.52010 274.4 347.9(P) 457.8 153.8 1233.9 720.0 1953.92011 273.2 346.5(P) 453.1 152.7 1225.5 711.0 1936.52012 272.1 277.9 450.2 152.6 1152.8 700.4 1853.22013 (R) 271.7 277.8 450.1 152.7 1152.3 702.9 1855.2
Public Sector Organised Private Sector
Total =Col.(6) + Col. (7)
Table-11.0Estimated Employment in Public and Private Sector in West Bengal
(Number in thousand)Year ended in
December
2) Quasi Govt. implies Organisation under Government ,i.e., Government Undertakings. 3) Quasi govt. Includes H.S., Secondary and Primary Teachers
P = Provisonal
Sources : (1) Directorate of Employment ,Govt. of West Bengal (2) Bureau of Applied Economics & Statistics, Govt. of West Bengal.
R = Revised.
+ = Relates to 30th April.
Note :1) State Government Employees as on 31st. March.
State Statistical Handbook 2014 130

OrganisedPrivate Sector
38%
Central Govt. 15%
State Govt. 15%
Quasi Govt. 24%
Local Bodies 8%
Public Sector62%
Figure 4 : Estimated Employment in Private and Public Sectors in West Bengal during 2013
State Statistical Handbook 2014 131

Sl. No. Industry 1991 2001 2010 2011 2012 2013(R)
(1) (2) (3) (4) (5) (6) (7) (8)1 Rice Mills 10841 14289 20237 20773 21093 230882 Tea Factories 24977 27760 29441 30251 30401 319713 Cotton Textiles 47257 47263 47448 49332 49431 497414 Jute Mills 227254 212685 214714 214834 215204 2152045 Leather & Leather Products* .. .. 17122 17144 17473 181656 Paper & Paper Products 13234 12475 14518 14980 15270 154987 Printing & Allied Industries 15266 15712 17385 18272 19836 223368 Rubber & Rubber Products 15932 13041 13889 13932 14923 171749 Chemical & Chemical Products 34493 39181 40732 41092 42430 44347
10 Glass & Glass Products 8578 8406 9352 9364 2116 211611 Engineering 359773 318146 358601 365996 367588 37398112 Ship Building & Repairs 8576 7617 7411 8083 8133 764013 Electricity 15424 19623 19560 19660 21433 2079214 Coal Mines 109191 79454 58838 56235 53174 ..
Note :Data relate to the factories registered under Chief Inspector of Factories, Govt of West Bengal. * Introduced from 2005.
R = Revised.
(In Numbers)
Table-11.1Number of Workers Employed in Major Industries in West Bengal
Safety, Government of India 2)Directorate General of Mines
Government of West Bengal Source : 1)Chief Inspector of Factories,
State Statistical Handbook 2014 132
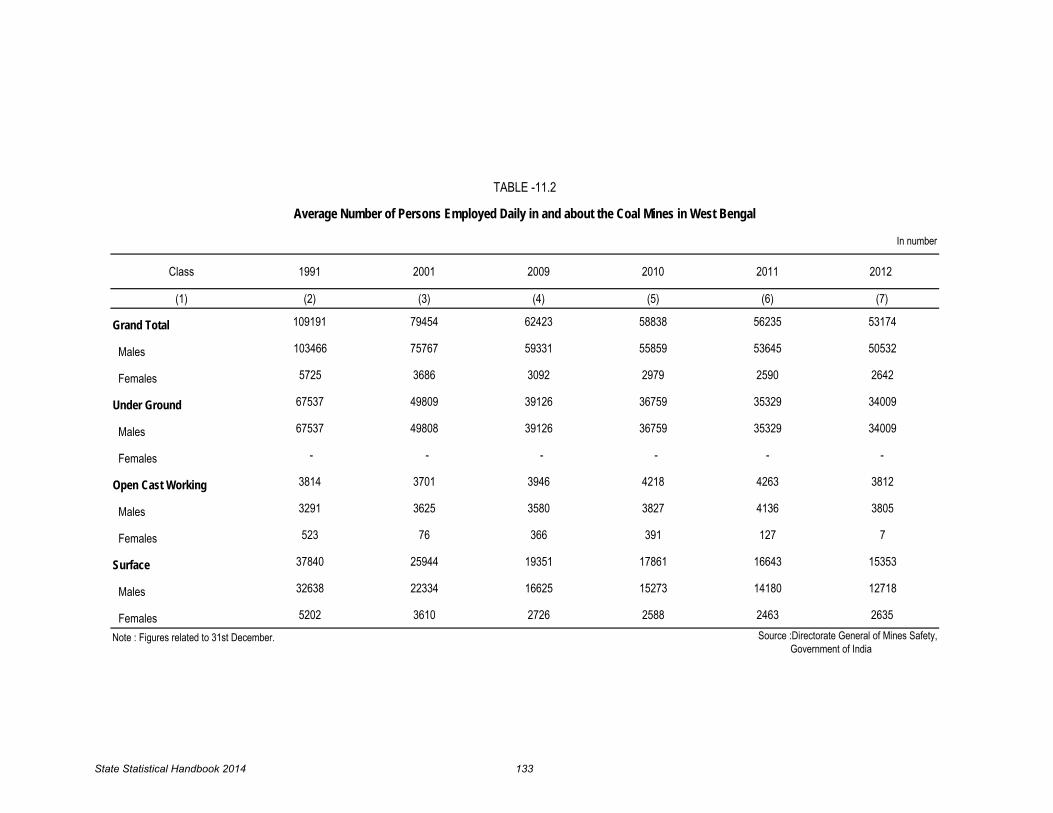
In number
Class 1991 2001 2009 2010 2011 2012
(1) (2) (3) (4) (5) (6) (7)
Grand Total 109191 79454 62423 58838 56235 53174
Males 103466 75767 59331 55859 53645 50532
Females 5725 3686 3092 2979 2590 2642
Under Ground 67537 49809 39126 36759 35329 34009
Males 67537 49808 39126 36759 35329 34009
Females - - - - - -
Open Cast Working 3814 3701 3946 4218 4263 3812
Males 3291 3625 3580 3827 4136 3805
Females 523 76 366 391 127 7
Surface 37840 25944 19351 17861 16643 15353
Males 32638 22334 16625 15273 14180 12718
Females 5202 3610 2726 2588 2463 2635
Note : Figures related to 31st December.
TABLE -11.2
Average Number of Persons Employed Daily in and about the Coal Mines in West Bengal
Source :Directorate General of Mines Safety, Government of India
State Statistical Handbook 2014 133

Year Average daily Workers
(1) (2)
1991 253
1995 258
2001 256
2002 259
2003 260
2004 263
2005 263
2006 262
2007 262
2008 265
2009 265
2010 301
2011 327
2012 327
2013 327 (P) P = Provisional Source : Tea Statistics , Tea Board.
Average Number of Persons Employed Daily in Plantations (Tea) in West BengalTABLE -11.3
(Number in thousand)
State Statistical Handbook 2014 134

Sl. No. Particulars 1991 2001 2010 2011 2012 2013 2014
(1) (2) (3) (4) (5) (6) (7) (8) (9)
1 Number of
( i ) Shops 379351 459323 569899 578003 584441 595271 604656
( ii ) Commercial establishments 26677 72227 90981 92311 94887 99913 102594
( iii) Cinemas and Theatres 373 386 403 403 403 403 403(iv) Other Establishments for public entertainment 32783 36642 41342 41627 41888 42058 43399
TOTAL 439184 568578 702625 712344 721619 737645 751052
2 Average Daily Employment in
( i ) Shops 333908 365589 435577 450493 468287 487264 505049
( ii ) Commercial establishments 109491 154597 251708 264637 276589 298617 301960
( iii) Cinemas and Theatres 7803 8206 8409 8409 8409 8409 8409(iv) Other Establishments for public entertainment 76347 84439 95001 96581 98883 99878 104157
TOTAL 527549 612831 790695 820120 852168 894168 919575Notes :
TABLE -11.4
Estimated Average Daily Employment in Shops, Commercial Estiblishments , Cinemas etc. in West Bengal (as on 31st. March)
Source : Chief Inspector, Shop & Establishments Directorate,
2) Employees exclude self-employed and unpaid family workers.
establishments in places notified as per Bengal Shop and Establishments Act,1963.
Govt. of West Bengal 1) Figures relate to only registered shops and
State Statistical Handbook 2014 135

In number
Proposed (EM-I) Empl.
Established (EM-II) Empl.
Proposed (EM-I) Empl.
Established (EM-II) Empl.
Proposed (EM-I) Empl.
Established (EM-II) Empl.
(2) (3) (4) (5) (6) (7)8292 11756 7270 9252 5306 91252549 5346 2499 6339 3571 48852877 3561 3578 2829 3219 17194891 4940 3575 2588 4064 44755734 4665 5666 4108 3754 29855501 5842 3832 4573 4199 50222797 2519 2770 1559 2150 11707307 19583 8627 13682 5532 13338
11836 13745 6393 11493 4812 107794994 16076 5028 15273 5365 207877356 13758 7598 8182 8814 123583141 4871 5623 5349 4783 63116448 4028 5074 2259 1635 23211495 936 2573 932 1658 907
903 521 857 332 622 7222229 1230 2854 1973 1969 16784240 3703 2542 1476 5758 15051215 1442 1347 1435 1576 11481481 1924 1957 1639 1301 1567
85286 120446 79663 95273 70088 102802Note : After the introduction of the Micro, Small & Medium Enterprises Develpoment Act in
October ,2006 the registration system has been abolished. The Micro and small entrepreneurs will have to file Entrepreneur Memorandum (EM), Proposed units relate to EM-I and the established units relate to EM-II.
Total
Dakshin DinajpurMaldaJalpaiguriDarjeeling *Cooch Behar
KolkataHowrahNadiaMurshidabadUttar Dinajpur
Paschim MedinipurHooghlyPuruliaNorth-24 ParganasSouth-24 Parganas
*These districts have one sub-DIC each.
TABLE-11.5
2013-14 2011-12 2012-13
Employment in the Small Scale Industrial Units Filed Entrepreneur Memorandum to the Directorate of Micro and Small Scale Enterprises in West Bengal by District
Source: Directorate of Micro & Small Scale Enterprises Govt. of West Bengal
District
(1)Burdwan *BirbhumBankuraPurba Medinipur
State Statistical Handbook 2014 136
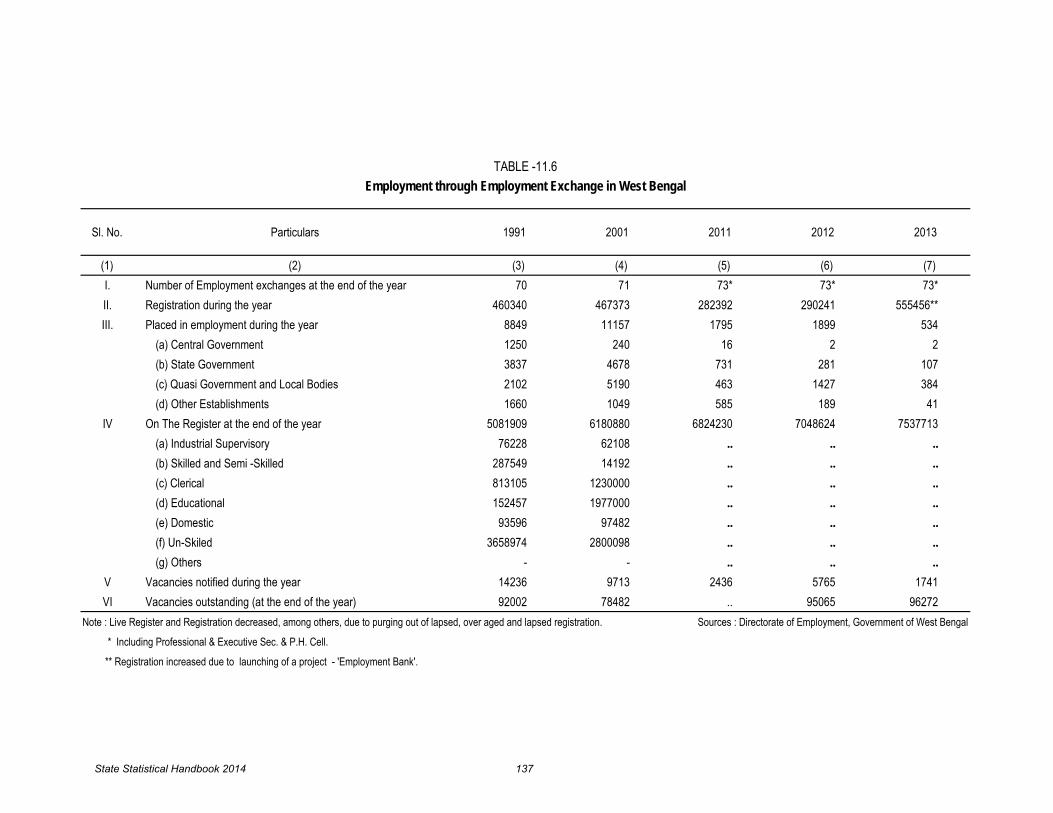
Sl. No. Particulars 1991 2001 2011 2012 2013
(1) (2) (3) (4) (5) (6) (7)I. Number of Employment exchanges at the end of the year 70 71 73* 73* 73*II. Registration during the year 460340 467373 282392 290241 555456**III. Placed in employment during the year 8849 11157 1795 1899 534
(a) Central Government 1250 240 16 2 2(b) State Government 3837 4678 731 281 107(c) Quasi Government and Local Bodies 2102 5190 463 1427 384(d) Other Establishments 1660 1049 585 189 41
IV On The Register at the end of the year 5081909 6180880 6824230 7048624 7537713(a) Industrial Supervisory 76228 62108 .. .. ..(b) Skilled and Semi -Skilled 287549 14192 .. .. ..(c) Clerical 813105 1230000 .. .. ..(d) Educational 152457 1977000 .. .. ..(e) Domestic 93596 97482 .. .. ..(f) Un-Skiled 3658974 2800098 .. .. ..(g) Others - - .. .. ..
V Vacancies notified during the year 14236 9713 2436 5765 1741VI Vacancies outstanding (at the end of the year) 92002 78482 .. 95065 96272
Note : Live Register and Registration decreased, among others, due to purging out of lapsed, over aged and lapsed registration.
TABLE -11.6Employment through Employment Exchange in West Bengal
* Including Professional & Executive Sec. & P.H. Cell.
** Registration increased due to launching of a project - 'Employment Bank'.
Sources : Directorate of Employment, Government of West Bengal
State Statistical Handbook 2014 137

(1) (2) (3)
Number of Cases
Strikes 1 0
Lockouts 294 297
Total 295 297
Men involved (In '000)
Strikes 0.03 0.00
Lockouts 90.75 93.09
Total 90.78 93.09
Mandays Lost ( In Lakhs)
Strikes 0.05 0.00
Lockouts 157.00 150.30
Tot al 157.05 150.30Notes :1) Lockout includes Strike followed by Lockout. P = Provisional
Industrial Disputes in West Bengal
TABLE -11.7
Source : Labour Commissioner, West Bengal
Particulars 2012-13 2013-14(P)
State Statistical Handbook 2014 138

Number
Sl. No. Particulars 1991 2001 2010 2011 2012 2013 2014
(1) (2) (3) (4) (5) (6) (7) (8) (9)
1 Note forgery .. 54 73 63 26 28 24
2 Murder 92 65 49 54 85 90 83
3 Culpable homicide .. 8 43 28 29 39 27
4 Dacoity 21 26 - 1 8 4 4
5 Robbery 159 149 18 34 44 44 33
6 Burglary 350 148 66 63 96 90 66
7 Theft (Total) 6899 * 4040 * 3118 3532 4301 5021 3864
8 Auto Theft – – 506 539 659 688 759
9 Swindling .. 863 1271 1625 2100 2184 2027
10 Riot 617 275 282 336 397 368 316
11 Dowry death .. 6 12 11 19 15 12
12 Rape .. 19 32 46 121 151 154
13 Kidnapping & Abduction – – 125 148 284 301 441
* = Total theft including Auto Theft.
TABLE 12.0
Incidence of Major Cognizable Crimes (IPC) under different Crime Heads in Kolkata and Suburbs
Source: Criminal Records Section, Detective Department,
Lalbazar, Kolkata
State Statistical Handbook 2014 139

Particulars 1991 2001 2010 2011 2012 2013-14
(1) (2) (3) (4) (5) (6) (7)
West Bengal (excluding Kolkata):
Kolkata
year, i.e., figures for 1991 relate to 1991-92 and so on. Strength for 1991 relates to strength as on 31st December,1991. (a) = as on 30.04.2012
and Eastern Frontier Rifle Battalions have
Sources : (1) Director General of Police, West Bengal. (2) Inspector General of Police, West Bengal.
(3) Commissioner of Police, Kolkata.
90950.21
Strength (Number)*
Cost ( in Lakh)*
Strength (Number)* (Armed & Unarmed)
Cost ( in Lakh)* 9395.40 24359.00 72492.00 90778.18 115448.37(a)
280052.80 279466.00(R)
21746 26201 30452 32164 31912(a) 34487(R)
Sanctioned Strength of Civil Police in West Bengaland Expenditure thereof
TABLE 13.0
* The Telecom Personnel
been included from the year, 2002.
Note: Cost Figures relate to financial
58818 60308 75899 87418 97469 99137(R)
23271.00 79605.79 157927.40 231889.18
State Statistical Handbook 2014 140
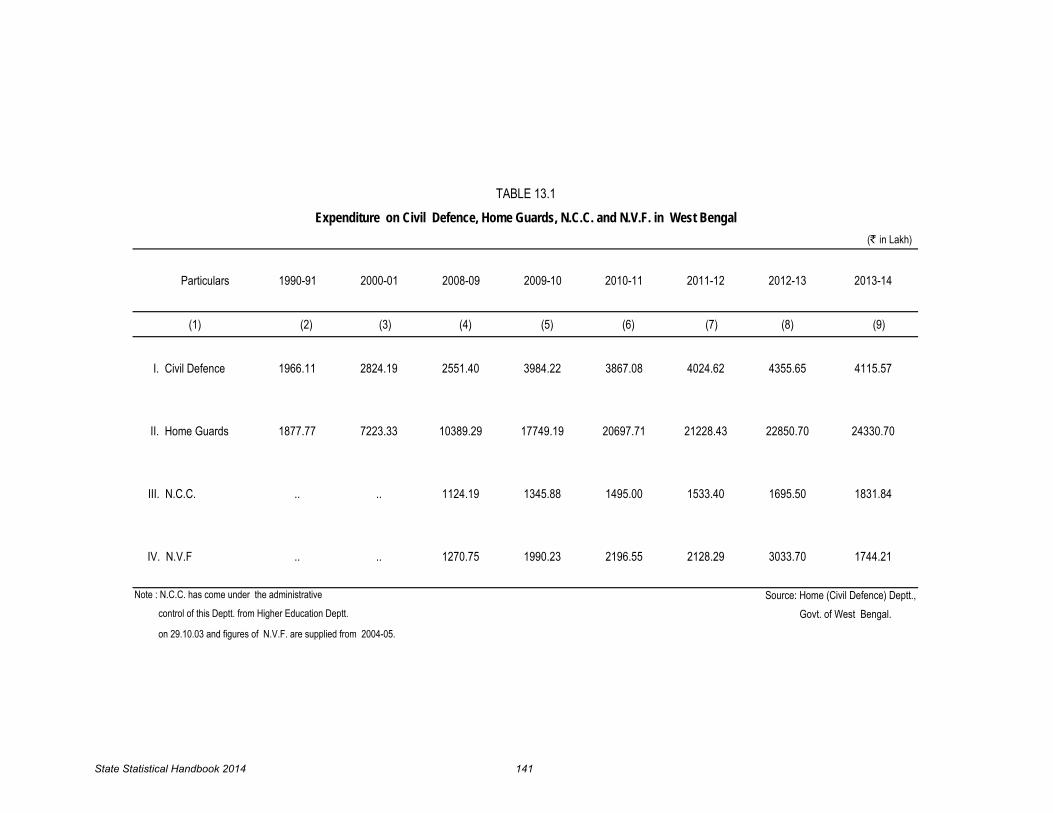
(` in Lakh)
Particulars 1990-91 2000-01 2008-09 2009-10 2010-11 2011-12 2012-13 2013-14
(1) (2) (3) (4) (5) (6) (7) (8) (9)
I. Civil Defence 1966.11 2824.19 2551.40 3984.22 3867.08 4024.62 4355.65 4115.57
II. Home Guards 1877.77 7223.33 10389.29 17749.19 20697.71 21228.43 22850.70 24330.70
III. N.C.C. .. .. 1124.19 1345.88 1495.00 1533.40 1695.50 1831.84
IV. N.V.F .. .. 1270.75 1990.23 2196.55 2128.29 3033.70 1744.21
Expenditure on Civil Defence, Home Guards, N.C.C. and N.V.F. in West Bengal
TABLE 13.1
on 29.10.03 and figures of N.V.F. are supplied from 2004-05.
Source: Home (Civil Defence) Deptt., Govt. of West Bengal.
Note : N.C.C. has come under the administrative
control of this Deptt. from Higher Education Deptt.
State Statistical Handbook 2014 141
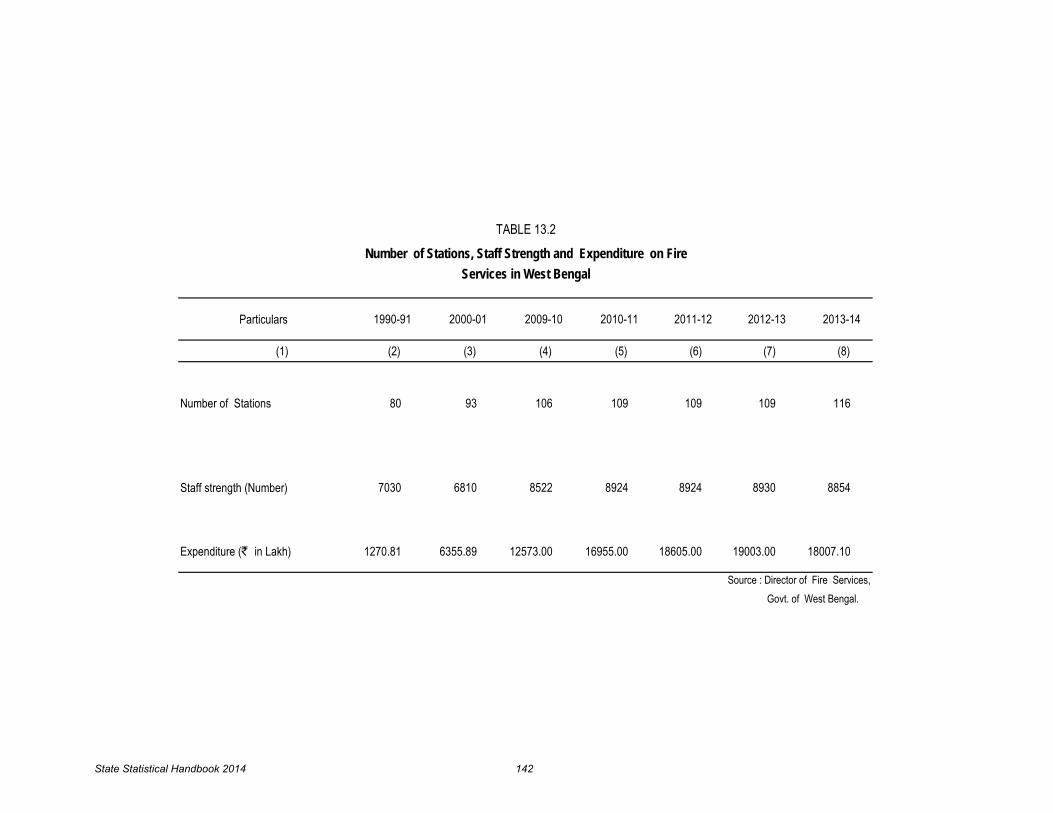
Particulars 1990-91 2000-01 2009-10 2010-11 2011-12 2012-13 2013-14
(1) (2) (3) (4) (5) (6) (7) (8)
Expenditure (` in Lakh) 1270.81 6355.89 12573.00 16955.00 18605.00 19003.00 18007.10
8924 8924 8930 8854
Source : Director of Fire Services,
TABLE 13.2
Number of Stations, Staff Strength and Expenditure on FireServices in West Bengal
Govt. of West Bengal.
Number of Stations 80 93 106 109 109 109 116
Staff strength (Number) 7030 6810 8522
State Statistical Handbook 2014 142

Local Bodies 1980-81 1990-91 2000-01 2007-08 2008-09
(1) (2) (3) (4) (5) (6)I. Municipal Corporations (i) Number (Total) 2 3 6 6 6 (ii) No. Reporting 2 3 6 6 6 (iii) Income (` in Lakh) 3792.10 19492.50 69904.97 179411.60 181064.60 (iv) Expenditure (` in Lakh) 4043.50 22466.30 75604.62 153315.30 184500.45II. Municipalities (i) Number (Total) 96 104 117 120 121 (ii) No. Reporting 96 104 116 120 116* (iii) Income (` in Lakh) 2938.65 13433.00 65912.95 134644.22 170535.93 (iv) Expenditure (` in Lakh) 2667.78 13703.20 53380.84 113899.95 151155.56III. Kolkata Improvement Trust (i) Number (Total) 1 1 1 1 1 (ii) No. Reporting 1 1 1 1 1 (iii) Income (` in Lakh) 720.79 1095.50 3480.75 6865.57 8021.17 (iv) Expenditure (` in Lakh) 578.05 1659.16 3128.31 2978.58 2737.10IV. Kolkata Port Trust (i) Number (Total) 1 1 1 1 1 (ii) No. Reporting 1 1 1 1 1 (iii) Income (` in Lakh) 101.65 269.02 859.10 1366.23 1382.16 (iv) Expenditure (` in Lakh) 98.38 269.02 549.53 753.22 864.14
TABLE 14.0Number, Income and Expenditure
of different Local Bodies in West Bengal
State Statistical Handbook 2014 143
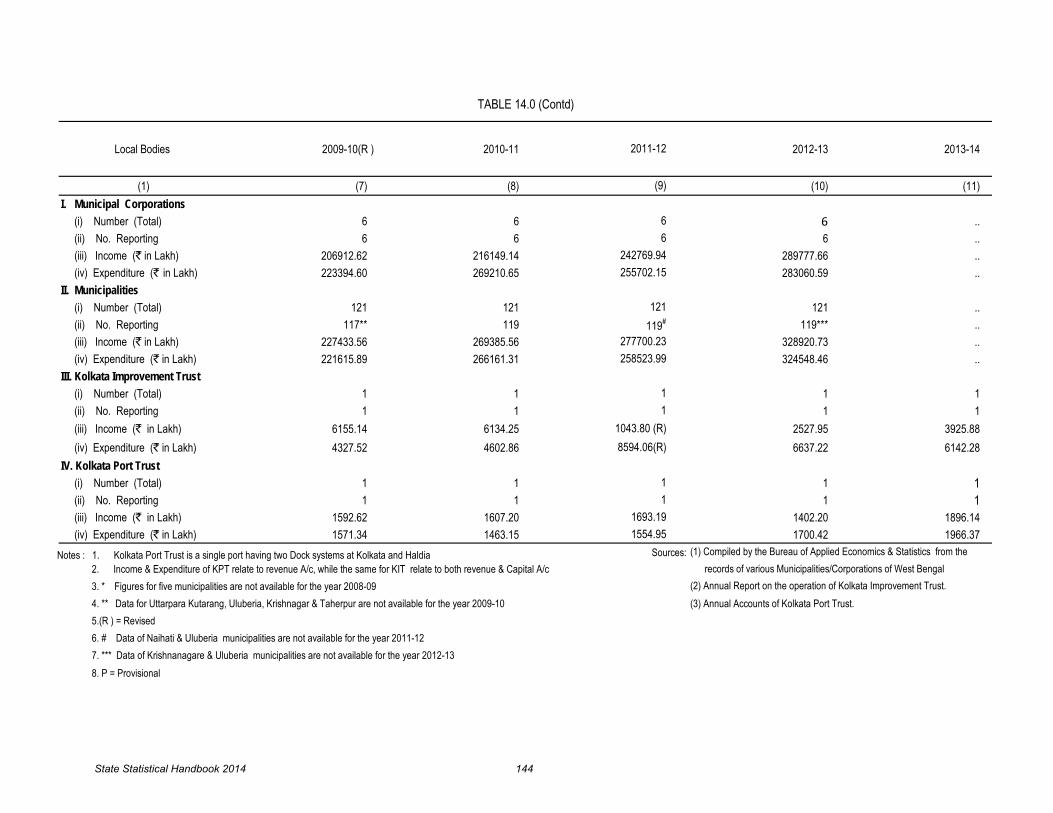
Local Bodies 2009-10(R ) 2010-11 2012-13 2013-14
(1) (7) (8) (10) (11)I. Municipal Corporations (i) Number (Total) 6 6 6 .. (ii) No. Reporting 6 6 6 .. (iii) Income (` in Lakh) 206912.62 216149.14 289777.66 .. (iv) Expenditure (` in Lakh) 223394.60 269210.65 283060.59 ..II. Municipalities (i) Number (Total) 121 121 121 .. (ii) No. Reporting 117** 119 119*** .. (iii) Income (` in Lakh) 227433.56 269385.56 328920.73 .. (iv) Expenditure (` in Lakh) 221615.89 266161.31 324548.46 ..III. Kolkata Improvement Trust (i) Number (Total) 1 1 1 1 (ii) No. Reporting 1 1 1 1 (iii) Income (` in Lakh) 6155.14 6134.25 2527.95 3925.88 (iv) Expenditure (` in Lakh) 4327.52 4602.86 6637.22 6142.28IV. Kolkata Port Trust (i) Number (Total) 1 1 1 1 (ii) No. Reporting 1 1 1 1 (iii) Income (` in Lakh) 1592.62 1607.20 1402.20 1896.14 (iv) Expenditure (` in Lakh) 1571.34 1463.15 1700.42 1966.37
Notes : 1. Kolkata Port Trust is a single port having two Dock systems at Kolkata and Haldia Sources: 2. Income & Expenditure of KPT relate to revenue A/c, while the same for KIT relate to both revenue & Capital A/c 3. * Figures for five municipalities are not available for the year 2008-09 4. ** Data for Uttarpara Kutarang, Uluberia, Krishnagar & Taherpur are not available for the year 2009-10 (3) Annual Accounts of Kolkata Port Trust. 5.(R ) = Revised 6. # Data of Naihati & Uluberia municipalities are not available for the year 2011-12 7. *** Data of Krishnanagare & Uluberia municipalities are not available for the year 2012-13 8. P = Provisional
records of various Municipalities/Corporations of West Bengal
11
1693.191554.95
277700.23258523.99
11
1043.80 (R)8594.06(R)
6242769.94255702.15
121119#
TABLE 14.0 (Contd)
(2) Annual Report on the operation of Kolkata Improvement Trust.
(1) Compiled by the Bureau of Applied Economics & Statistics from the
2011-12
(9)
6
State Statistical Handbook 2014 144

(In Kilometre)
Particulars 1991 2001 2009 2010 2011 2012 2013(P) 2014(P)
(1) (2) (3) (4) (5) (6) (7) (8) (9)
A.Surfaced 17202 16770 18338 18403 18450 18442 .. ..
(i) Black Top 16539 16335 18007 18054 18450 18442 .. ..
(ii) Waterbound
Macadam 663 435 331 349 -- – - -
B. Unsurfaced 569 651 179 203 -- – - -
Total (A+B) 17771 17421 18517 18606 18450 18442 .. ..Notes:i) figures for Black Top category include cement concrete type. Source: Public Works (Roads) Department ii)The decline in length of roads is due to transfer of authority of maintainence to other agencies. Government of West Bengal
TABLE 15.0Length of Roads under the control of Public Works and Public Works (Roads)
Departments in West Bengal (as on 31st March)
State Statistical Handbook 2014 145

(In Kilometre)
Category of Roads 1991 2001 2009 2010 2011 2012 2013 2014
(1) (2) (3) (4) (5) (6) (7) (8) (9)
1.National Highway 1710 1898 2334 2334 2556 2487 .. ..
2.State Highway 3248 3235 3352 3357 3805 4226 .. ..
3.District Roads 5340 5833 6399 6434 7334 7374 .. ..
4.Rural Roads 7473 6455 6432 6481 4755 4755 .. ..
Total 17771 17421 18517 18606 18450 18442 .. ..Note :The decline in length of roads is due to the transfer of Source: Public Works (Roads) Department,
authority of maintenance to other agencies. Govt. of West Bengal.
Length of Roads Maintained by P.W.D. and P.W.D. (Roads) according to Category in West Bengal (as on 31st March)
TABLE 15.0(a)
State Statistical Handbook 2014 146

(In Kilometers)
Particulars 1991 2001 2009 2010 2011 2012 2013( R ) 2014
(1) (2) (3) (4) (5) (6) (7) (8) (9)Municipalities :
Surfaced 6045 13255 14898 14898 14898 24910 - 21488.81Unsurfaced 3316 6178 5372 5372 5372 8050 - 15103.72
Municipal Corporations :Kolkata
Surfaced 1450 1560 1659 1667 1670 1740 1674 1685Unsurfaced 275 270 232 237 239 610 254 262
HowrahSurfaced 162 176 281 282 282 284 285 293.75
Unsurfaced 3 - 29 28 28 27 25 16.25Chandannagar
Surfaced 111 167 209 219 225 245 265 270Unsurfaced 28 332 356 346 340 320 300 295
DurgapurSurfaced - 191 322 354 403 474 481.5 ..
Unsurfaced - 101 196 186 187 193 188.5 ..Asansol
Surfaced - 70 170 196 212 232 250.73 798.2Unsurfaced - 90 142 153 161 153 148.38 164.2
SiliguriSurfaced - 350 583 641 782 782.39 901.55 869
Unsurfaced - 270 168 185 176 175.85 76.68 30Source: i) Bureau of Applied Economics & Statistics,
ii) Municipal Corporations iii) *Municipal Affairs Department for the year 2014
TABLE 15.1Length of Roads Maintained by Municipalities and Municipal Corporations in
West Bengal (as on 31st March)
Government Of West Bengal
State Statistical Handbook 2014 147
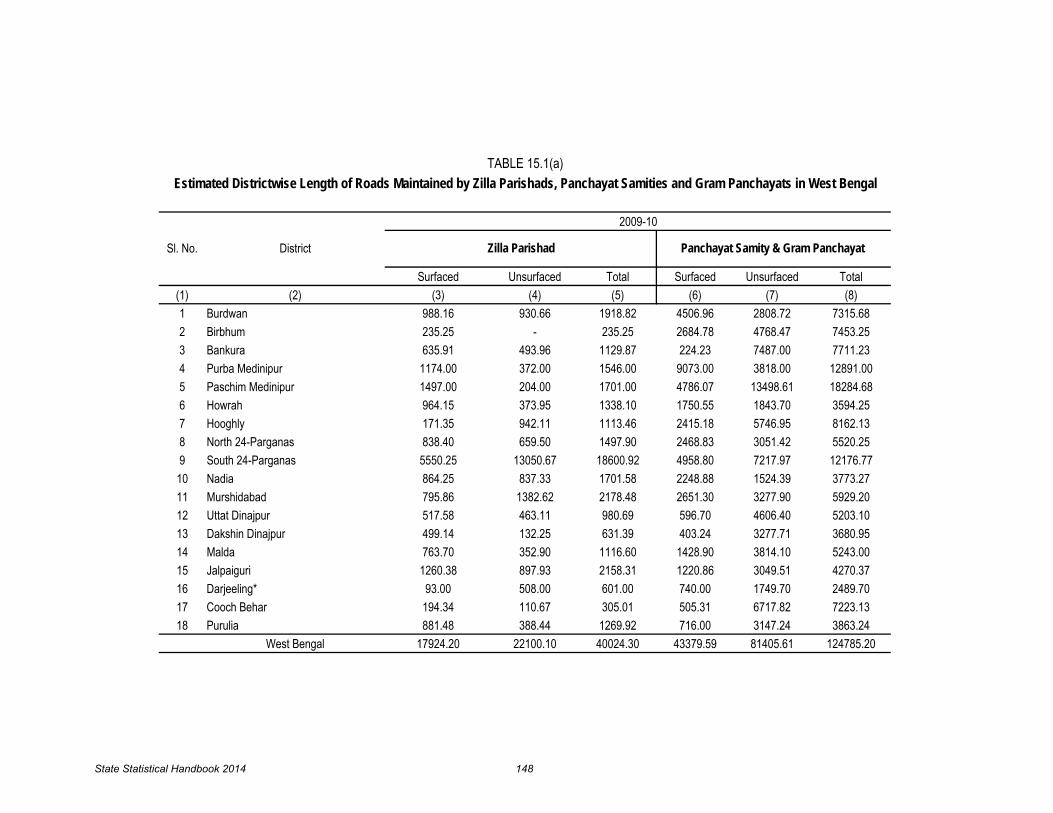
Surfaced Unsurfaced Total Surfaced Unsurfaced Total(1) (2) (3) (4) (5) (6) (7) (8)1 Burdwan 988.16 930.66 1918.82 4506.96 2808.72 7315.682 Birbhum 235.25 - 235.25 2684.78 4768.47 7453.253 Bankura 635.91 493.96 1129.87 224.23 7487.00 7711.234 Purba Medinipur 1174.00 372.00 1546.00 9073.00 3818.00 12891.005 Paschim Medinipur 1497.00 204.00 1701.00 4786.07 13498.61 18284.686 Howrah 964.15 373.95 1338.10 1750.55 1843.70 3594.257 Hooghly 171.35 942.11 1113.46 2415.18 5746.95 8162.138 North 24-Parganas 838.40 659.50 1497.90 2468.83 3051.42 5520.259 South 24-Parganas 5550.25 13050.67 18600.92 4958.80 7217.97 12176.7710 Nadia 864.25 837.33 1701.58 2248.88 1524.39 3773.2711 Murshidabad 795.86 1382.62 2178.48 2651.30 3277.90 5929.2012 Uttat Dinajpur 517.58 463.11 980.69 596.70 4606.40 5203.1013 Dakshin Dinajpur 499.14 132.25 631.39 403.24 3277.71 3680.9514 Malda 763.70 352.90 1116.60 1428.90 3814.10 5243.0015 Jalpaiguri 1260.38 897.93 2158.31 1220.86 3049.51 4270.3716 Darjeeling* 93.00 508.00 601.00 740.00 1749.70 2489.7017 Cooch Behar 194.34 110.67 305.01 505.31 6717.82 7223.1318 Purulia 881.48 388.44 1269.92 716.00 3147.24 3863.24
West Bengal 17924.20 22100.10 40024.30 43379.59 81405.61 124785.20
2009-10
Estimated Districtwise Length of Roads Maintained by Zilla Parishads, Panchayat Samities and Gram Panchayats in West BengalTABLE 15.1(a)
Sl. No. District Zilla Parishad Panchayat Samity & Gram Panchayat
State Statistical Handbook 2014 148
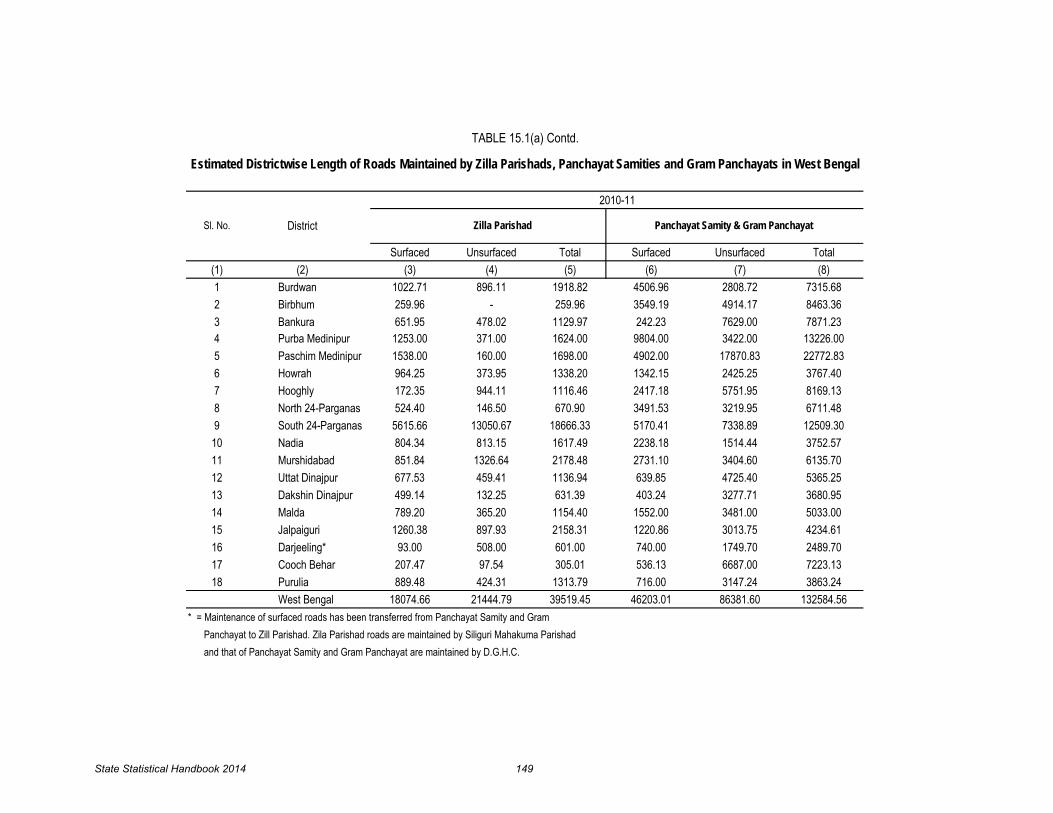
Surfaced Unsurfaced Total Surfaced Unsurfaced Total(1) (2) (3) (4) (5) (6) (7) (8)1 Burdwan 1022.71 896.11 1918.82 4506.96 2808.72 7315.682 Birbhum 259.96 - 259.96 3549.19 4914.17 8463.363 Bankura 651.95 478.02 1129.97 242.23 7629.00 7871.234 Purba Medinipur 1253.00 371.00 1624.00 9804.00 3422.00 13226.005 Paschim Medinipur 1538.00 160.00 1698.00 4902.00 17870.83 22772.836 Howrah 964.25 373.95 1338.20 1342.15 2425.25 3767.407 Hooghly 172.35 944.11 1116.46 2417.18 5751.95 8169.138 North 24-Parganas 524.40 146.50 670.90 3491.53 3219.95 6711.489 South 24-Parganas 5615.66 13050.67 18666.33 5170.41 7338.89 12509.3010 Nadia 804.34 813.15 1617.49 2238.18 1514.44 3752.5711 Murshidabad 851.84 1326.64 2178.48 2731.10 3404.60 6135.7012 Uttat Dinajpur 677.53 459.41 1136.94 639.85 4725.40 5365.2513 Dakshin Dinajpur 499.14 132.25 631.39 403.24 3277.71 3680.9514 Malda 789.20 365.20 1154.40 1552.00 3481.00 5033.0015 Jalpaiguri 1260.38 897.93 2158.31 1220.86 3013.75 4234.6116 Darjeeling* 93.00 508.00 601.00 740.00 1749.70 2489.7017 Cooch Behar 207.47 97.54 305.01 536.13 6687.00 7223.1318 Purulia 889.48 424.31 1313.79 716.00 3147.24 3863.24
West Bengal 18074.66 21444.79 39519.45 46203.01 86381.60 132584.56* = Maintenance of surfaced roads has been transferred from Panchayat Samity and Gram
Panchayat to Zill Parishad. Zila Parishad roads are maintained by Siliguri Mahakuma Parishad and that of Panchayat Samity and Gram Panchayat are maintained by D.G.H.C.
2010-11
TABLE 15.1(a) Contd.
Sl. No. Zilla Parishad Panchayat Samity & Gram Panchayat District
Estimated Districtwise Length of Roads Maintained by Zilla Parishads, Panchayat Samities and Gram Panchayats in West Bengal
State Statistical Handbook 2014 149
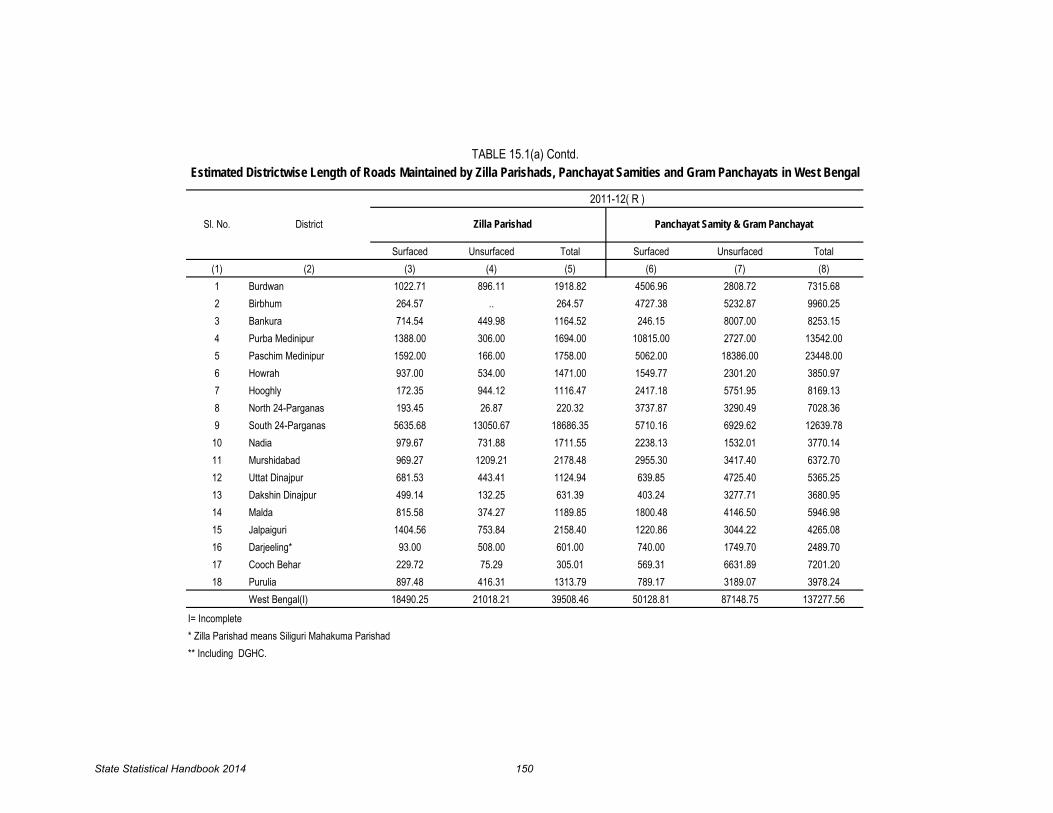
Surfaced Unsurfaced Total Surfaced Unsurfaced Total(1) (2) (3) (4) (5) (6) (7) (8)1 Burdwan 1022.71 896.11 1918.82 4506.96 2808.72 7315.682 Birbhum 264.57 .. 264.57 4727.38 5232.87 9960.253 Bankura 714.54 449.98 1164.52 246.15 8007.00 8253.154 Purba Medinipur 1388.00 306.00 1694.00 10815.00 2727.00 13542.005 Paschim Medinipur 1592.00 166.00 1758.00 5062.00 18386.00 23448.006 Howrah 937.00 534.00 1471.00 1549.77 2301.20 3850.977 Hooghly 172.35 944.12 1116.47 2417.18 5751.95 8169.138 North 24-Parganas 193.45 26.87 220.32 3737.87 3290.49 7028.369 South 24-Parganas 5635.68 13050.67 18686.35 5710.16 6929.62 12639.78
10 Nadia 979.67 731.88 1711.55 2238.13 1532.01 3770.1411 Murshidabad 969.27 1209.21 2178.48 2955.30 3417.40 6372.7012 Uttat Dinajpur 681.53 443.41 1124.94 639.85 4725.40 5365.2513 Dakshin Dinajpur 499.14 132.25 631.39 403.24 3277.71 3680.9514 Malda 815.58 374.27 1189.85 1800.48 4146.50 5946.9815 Jalpaiguri 1404.56 753.84 2158.40 1220.86 3044.22 4265.0816 Darjeeling* 93.00 508.00 601.00 740.00 1749.70 2489.7017 Cooch Behar 229.72 75.29 305.01 569.31 6631.89 7201.2018 Purulia 897.48 416.31 1313.79 789.17 3189.07 3978.24
West Bengal(I) 18490.25 21018.21 39508.46 50128.81 87148.75 137277.56
I= Incomplete* Zilla Parishad means Siliguri Mahakuma Parishad** Including DGHC.
Panchayat Samity & Gram Panchayat
TABLE 15.1(a) Contd.Estimated Districtwise Length of Roads Maintained by Zilla Parishads, Panchayat Samities and Gram Panchayats in West Bengal
Zilla Parishad DistrictSl. No.
2011-12( R )
State Statistical Handbook 2014 150

Surfaced Unsurfaced Total Surfaced Unsurfaced Total(1) (2) (3) (4) (5) (6) (7) (8)1 Burdwan 1022.71 896.11 1918.82 4506.96 2808.72 7315.682 Birbhum 284.77 - 284.77 4969.23 5582.94 10552.173 Bankura 719.23 398.02 1117.25 267.95 8250.00 8517.954 Purba Medinipur 1551.00 217.00 1768.00 10815.00 2727.00 13542.005 Paschim Medinipur 1631.00 367.00 1998.00 5098.00 19368.00 24466.006 Howrah 937.00 534.00 1471.00 2063.57 2024.90 4088.477 Hooghly 176.44 940.12 1116.56 2417.18 5751.95 8169.138 North 24-Parganas 271.35 90.84 362.19 3901.90 3374.75 7276.659 South 24-Parganas 5693.28 13050.77 18744.05 6316.62 6283.31 12599.93
10 Nadia 1003.07 - 1003.07 2779.01 1793.45 4572.4611 Murshidabad 986.20 1192.30 2178.50 3124.60 3474.00 6599.6012 Uttat Dinajpur 681.53 443.41 1124.94 666.85 4698.40 5365.2513 Dakshin Dinajpur 499.14 132.25 631.39 403.24 3277.71 3680.9514 Malda 833.26 356.97 1190.23 1804.55 4153.00 5957.5515 Jalpaiguri 1404.56 753.84 2158.40 1261.98 2981.62 4243.6016 Darjeeling* 93.00 508.00 601.00 740.00 1749.70 2489.7017 Cooch Behar 250.90 54.11 305.01 606.04 6595.16 7201.2018 Purulia 897.48 416.31 1313.79 1065.79 3929.55 4995.34
West Bengal(I) 18935.92 20351.05 39286.97 52808.47 88824.16 141633.63I= Incomplete* Zilla Parishad means Siliguri Mahakuma Parishad** Including DGHC.
TABLE 15.1(a)-Contd.
2012-13(P)
District
Estimated Districtwise Length of Roads Maintained by Zilla Parishads, Panchayat Samities and Gram Panchayats in West Bengal
Source : District Statistical Hand Book, Bureau of Applied Economics & Statistics, Govt. of West Bengal.
Zilla Parishad Panchayat Samity & Gram Panchayat Sl. No.
State Statistical Handbook 2014 151

Particulars 1991 2001 2009 2010 2011 2012 2013 2014
(1) (2) (3) (4) (5) (6) (7) (8) (9)Kolkata Telephones*
1. Number of Telephone Exchanges calls effective only (in lakh)2. Number of Telephones 331564 1307332 1374422 1270929 1199651 975123 930944 8472543. Number of Trunk Telephone calls booked (in lakh)4. Number of Trunk Telephone 10.350 4.200 0.100 0.030 0.020 0.110 0.170 0.1005. Number of Public Call Offices (a) Local 21072 33331 29723 26751 32179 31819 27405(b) STD/Pay Phone 13871 29350 27305 25768 .. .. ..
West Bengal Telecom (excluding Kolkata)1. Number of Telephone Exchanges2.Number of Telephones 68131 742905 1028542 883961 734167 656505 528094 4863803.Number of Trunk Telephone calls booked only (in'000)4.Number of Trunk Telephone calls effective only (in'000)5.Number of Public Call Offices (a) Local 1019 6027 8957 8205 6223 5339 3994 4246(b) Long distance 898 32199++ 51224 44370 34748 27850 22564 22722
Number of Post Offices1.Rural 7258 7553 7639 7666 7666 7666 7699 76702.Urban 1093 1112 1108 1086 1086 1087 1087 10873.Total 8351 8665 8747 8752 8752 8753 8756 8757
Number of Departmental Telegraph Offices1.Rural2.Urban 3.Total
Number of combined Post and Telegraph Offices
1.Rural2.Urban
3.Total 950 649 472 - - - - -
* Including Howrah and Other Suburban Exchanges Sources : (1) Office of the General Manager** Including one WLL and one GSM Mobile Switch West Bengal Telecom Circle.
++Figures for long distance Public Call (2) General Manager,
Offices include Panchayat, National Highway, Calcutta Telephones.
Village Public Telephones & S.T.D. (3) Office of the Postmaster General,
- - -
- - - - -
- - - - -
860 233 287 - -
- - -
36 42 36
TABLE 15.2Post Offices, Telegraph Offices and Telephone Facilities in West Bengal (as on 31st March)
West Bengal.
2602
68 221 544** 534** 526** 526** 512* 508**
18.240 6.060 0.060 0.030 0.020 0.120 N.A. 0.110
448 1116 1385 1384 1380 1379 1365 1366
6613469 0.19 0.21 0.24 0.214 0.31 0.272
0.272 0.2722483 553 0.11 0.2 0.219 0.198
State Statistical Handbook 2014 152

Particulars 1991 2001 2010 2011 2012 2013 2014*
(1) (2) (3) (4) (5) (6) (7) (8)
1. Goods Vehicles 109026 198911 258074 285733 318573 344816 350565
2. Motor Cars/Jeeps 232911 404443 483684 537866 618542 700740 727350
3. Motorcycle,Scooter etc. 487087 1108191 2221484 2607055 3051851 3553253 3701028
4. Taxi/Contract Carriages 36237 51876 65751 72352 76921 90329 102128
5. Minibuses – 5524 7105 7336 7438 7573 6610
6.Stage Carriages (Bus) 19332 23898 30924 32854 34130 35521 32674
7. Auto-Rickshaws 9971 29324 52597 62579 68152 69653 69491
8. Tractors/Trailors 16243 38184 64971 77024 90176 103989 97179
9. Others 7961 28688 21188 25081 27753 30040 33193
Total 918768 1889039 3205778 3707880 4293536 4935914 5120218
Note: Figures relate to those vehicles for which road tax was paid
*Figures indicate Live Registered Motor Vehicles
TABLE 15.3
Estimated Number of Registered Motor Vehicles in West Bengal (as on 31st March)
Source:i)Transport Department,Government of West Bengal
ii) RTO"s and ARTO's
State Statistical Handbook 2014 153

Particulars 1991 2001 2010 2011 2012(R) 2013 2014*
(1) (2) (3) (4) (5) (6) (7) (8)
1.Goods Vehicles 48674 64787 14210 13773 15229 18169 20408
2.Motor Cars/Jeeps 182161 280631 180644 194178 222061 250241 273929
5.Mini Buses 6827 1183 724 704 715 741 789
6.Auto-Rickshaws 5705 13156 17740 18808 18864 19692 20106
7.Stage Carriages(Bus) 5772 8105 3285 3545 4166 3743 3951
8.Tractors/Trailers 4458 4784 81 46 46 56 60
9.Others 5267 20786 628 737 808 895(R) 968
Total 476745 762924 411025 444718 496008 557087 587730
Note: Figures relate to those Source: Transport Department, vehicles for which road tax was paid
Government of West Bengal *Figures indicate Live Registered Motor Vehicles
TABLE 15.3 (a)
Estimated Number of Registered Motor Vehicles in Kolkata (as on 31st March)
37682
182087 228876
2791433015 31815
3364773.Motorcycle/ Scooters etc 165799 253894198846
4.Taxi/Contract Carriage/Luxury Taxi 3467419035
202604
30840
State Statistical Handbook 2014 154
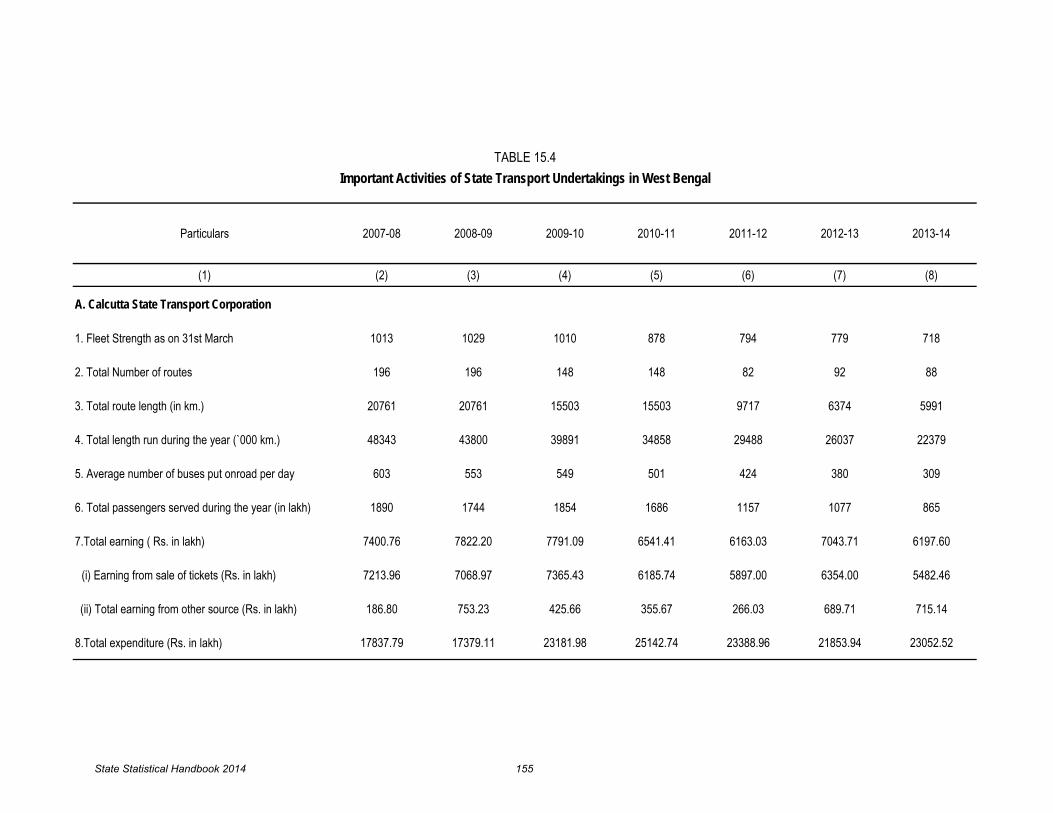
Particulars 2007-08 2008-09 2009-10 2010-11 2011-12 2012-13 2013-14
(1) (2) (3) (4) (5) (6) (7) (8)
A. Calcutta State Transport Corporation
1. Fleet Strength as on 31st March 1013 1029 1010 878 794 779 718
2. Total Number of routes 196 196 148 148 82 92 88
3. Total route length (in km.) 20761 20761 15503 15503 9717 6374 5991
4. Total length run during the year (`000 km.) 48343 43800 39891 34858 29488 26037 22379
5. Average number of buses put onroad per day 603 553 549 501 424 380 309
6. Total passengers served during the year (in lakh) 1890 1744 1854 1686 1157 1077 865
7.Total earning ( Rs. in lakh) 7400.76 7822.20 7791.09 6541.41 6163.03 7043.71 6197.60
(i) Earning from sale of tickets (Rs. in lakh) 7213.96 7068.97 7365.43 6185.74 5897.00 6354.00 5482.46
(ii) Total earning from other source (Rs. in lakh) 186.80 753.23 425.66 355.67 266.03 689.71 715.14
8.Total expenditure (Rs. in lakh) 17837.79 17379.11 23181.98 25142.74 23388.96 21853.94 23052.52
Important Activities of State Transport Undertakings in West BengalTABLE 15.4
State Statistical Handbook 2014 155

Particulars 2008-09 2009-10 2010-11 2011-12 2012-13 2013-14
(1) (2) (3) (4) (5) (6) (7)
B.North Bengal State Transport Corporation
1. Fleet Strength as on 31st March 796 816 704 704 720 688
2.Total Number of routes 440 251 207 207 207 207
3.Total route length (in km.) 162500 108000 93000 149000 149000 149000
4.Total length run during the year (`000 km.) 44264 44480 40218 38435 40429 36191
5.Average number of buses put on road per day 536 544 458 479 438 455
6.Total passengers served during the year (in lakh) 1031.67 805.31 575.45 588.98 672.38 645
7. Total earning ( Rs. in lakh) 6326.72 6832.14 6524.70 6472.32 7511.84 7255.45
(i) Earning from sale of tickets (Rs. in lakh) 6190.06 6688.05 6395.57 6228.44 7257.84 7097.96
(ii) Total earning from other sources (Rs. in lakh) 136.66 144.09 129.13 243.88 254.00 157.49
8. Total expenditure ( Rs. in lakh) 16811.57** 18063.71** 18665.72** 16180.74 15955.34 16994.49
*Excluding the amount of subsidy received from the State Govt.
** Including depreciation and interest.
TABLE 15.4-Contd.Important Activities of State Transport Undertakings in West Bengal
State Statistical Handbook 2014 156
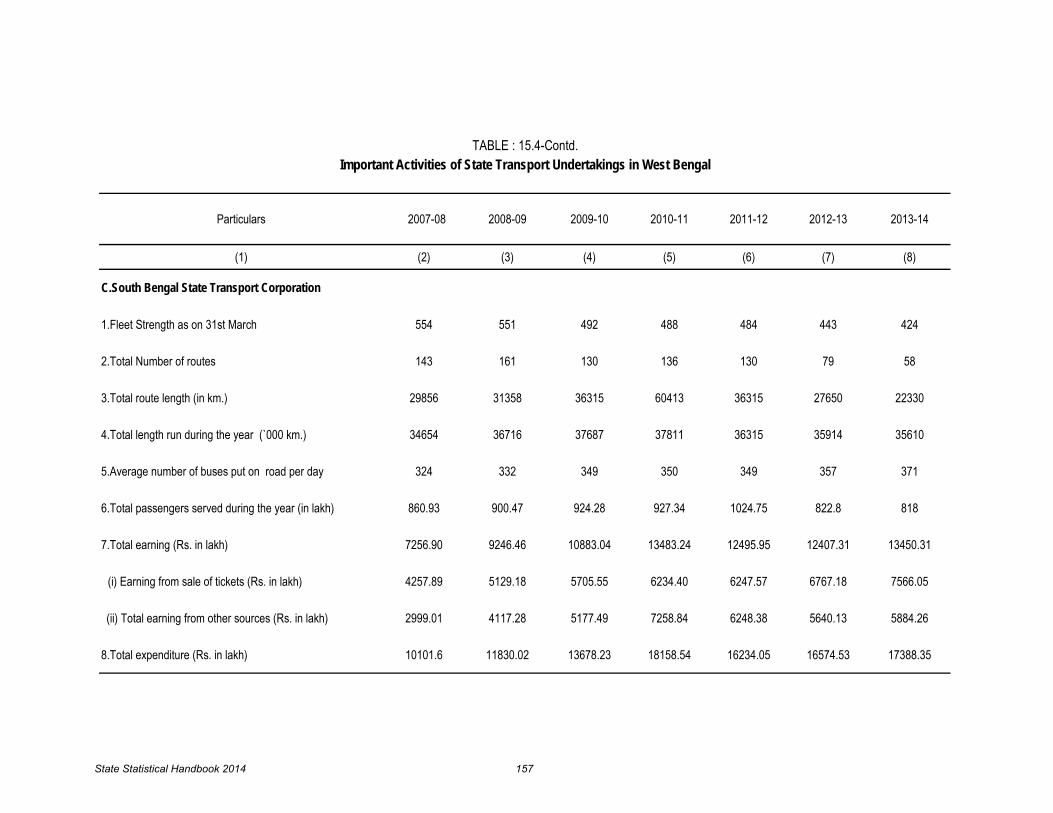
Particulars 2007-08 2008-09 2009-10 2010-11 2011-12 2012-13 2013-14
(1) (2) (3) (4) (5) (6) (7) (8)
C.South Bengal State Transport Corporation
1.Fleet Strength as on 31st March 554 551 492 488 484 443 424
2.Total Number of routes 143 161 130 136 130 79 58
3.Total route length (in km.) 29856 31358 36315 60413 36315 27650 22330
4.Total length run during the year (`000 km.) 34654 36716 37687 37811 36315 35914 35610
5.Average number of buses put on road per day 324 332 349 350 349 357 371
6.Total passengers served during the year (in lakh) 860.93 900.47 924.28 927.34 1024.75 822.8 818
7.Total earning (Rs. in lakh) 7256.90 9246.46 10883.04 13483.24 12495.95 12407.31 13450.31
(i) Earning from sale of tickets (Rs. in lakh) 4257.89 5129.18 5705.55 6234.40 6247.57 6767.18 7566.05
(ii) Total earning from other sources (Rs. in lakh) 2999.01 4117.28 5177.49 7258.84 6248.38 5640.13 5884.26
8.Total expenditure (Rs. in lakh) 10101.6 11830.02 13678.23 18158.54 16234.05 16574.53 17388.35
TABLE : 15.4-Contd.Important Activities of State Transport Undertakings in West Bengal
State Statistical Handbook 2014 157
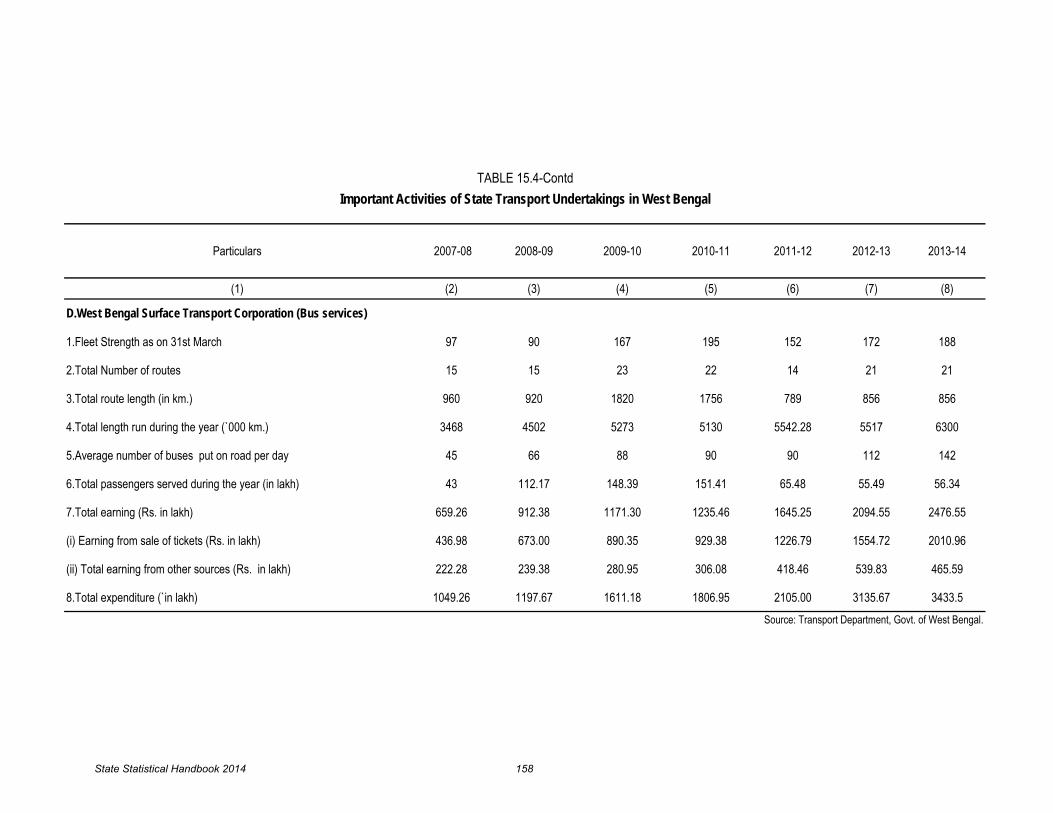
Particulars 2007-08 2008-09 2009-10 2010-11 2011-12 2012-13 2013-14
(1) (2) (3) (4) (5) (6) (7) (8)
D.West Bengal Surface Transport Corporation (Bus services)
1.Fleet Strength as on 31st March 97 90 167 195 152 172 188
2.Total Number of routes 15 15 23 22 14 21 21
3.Total route length (in km.) 960 920 1820 1756 789 856 856
4.Total length run during the year (`000 km.) 3468 4502 5273 5130 5542.28 5517 6300
5.Average number of buses put on road per day 45 66 88 90 90 112 142
6.Total passengers served during the year (in lakh) 43 112.17 148.39 151.41 65.48 55.49 56.34
7.Total earning (Rs. in lakh) 659.26 912.38 1171.30 1235.46 1645.25 2094.55 2476.55
(i) Earning from sale of tickets (Rs. in lakh) 436.98 673.00 890.35 929.38 1226.79 1554.72 2010.96
(ii) Total earning from other sources (Rs. in lakh) 222.28 239.38 280.95 306.08 418.46 539.83 465.59
8.Total expenditure (`in lakh) 1049.26 1197.67 1611.18 1806.95 2105.00 3135.67 3433.5Source: Transport Department, Govt. of West Bengal.
TABLE 15.4-ContdImportant Activities of State Transport Undertakings in West Bengal
State Statistical Handbook 2014 158

Particulars 2007-08 2008-09 2009-10 2010-11 2011-12 2012-13(R) 2013-14(1) (2) (3) (4) (5) (6) (7) (8)
1.Fleet Strength as on31st March 23 41 41 41 41 45 412.Total number of routes 6 6 6 6 6 7 93.Total route length (in km.) 60 65 65 60 60 21.5 25.54.Total length run during the year (in km.) .. .. .. .. .. .. ..5.Average number of launch vehicles
put on river per day 19 17 17 17 17 22 206.Total passengers served
during the year ('000) 16300 6600 6810 7283 8141 7806 81437.Total earnings (Rs. in lakh) 615.10 452.87 525.33 572.83 579.44 733.59 902.12
(i) Earning from sale of tickets (Rs. in lakh) 380.10 392.58 453.69 466.31 465.29 571.70 592.41
(ii)Earning from other sources (Rs. in lakh) 235.00 60.29 71.65 106.52 114.15 161.89 309.71
8.Total expenditure (Rs. in lakh) 810.00 484.19 618.08 715.30 665.00 808.21 1043.61Source:Transport Department, Govt. of West Bengal.
Summary of the Important Activities of West Bengal Surface Transport Corporation (Launch Service)
TABLE 15.5
State Statistical Handbook 2014 159

Particulars 2007-08 2008-09 2009-10 2010-11 2011-12 2012-13 2013-14(E)
(1) (2) (3) (4) (5) (6) (7) (8)
1.Total number of cars (a)Tram 319 269 265 265 269 269 269(b)Bus 329 343 340 380 380 380 380
2.Total number of routes (a)Tram 11 12 12 12 12 13 13(b)Bus 37 37 37 37 37 37 37
3.Total route length (a)Tram 131 131 131 125 119 119 119(in Km. double track)(b)Bus 1177 1177 1177 1177 1177 1177 1177
4.Average number of vehicles (a)Tram 99 95 93 86 101 106 100put on road per day (b)Bus 221 226 226 232 205 211 191
5.Total length of run (a)Tram 2270 2200 2607 2607 2310 2201 2250(in thousand km.)(b)Bus 20375 22300 18578 20014 19083 18002 16168
6.Total passengers served (a)Tram 283 307 498 343 310 398 395(in lakh)(b)Bus 500 509 503 552 515 543 524
7.Average number of persons (a)Tram 4798 4652 4452 4426 4206 4165 3965employed per day (b)Bus 2214 2164 2216 2217 2145 1922 1900
8.Total earnings (a)Tram 1106 1220 1547 1379 1189 1511 1600(` in lakh)(b)Bus 3157 3323 3429 3652 3399 3645 3827
(i) Earning from sale of (a)Tram 650 707 864 790 725 925 971 tickets ( ` in lakh)(b)Bus 3106 3308 3211 3572 3334 3642 3775
(ii) Earning from other (a)Tram 456 513 683 589 464 586 629sources (` in Lakh)(b)Bus 51 15 218 80 65 3 52
9.Total expenditure (a)Tram 13179 17523 21671 42474 16233 24552 25780(` in lakh)(b)Bus 4161 5071 5739 8634 8058 8373 8252
E=Estimated Source:Transport Deptt.,Govt. of West Bengal. Note:Bus services are being operated by Calcutta
Tramways Company Limited from 04.11.92.
TABLE 15.6Activities of the Calcutta Tramways Company Limited
State Statistical Handbook 2014 160

(` in Lakh)Year Import Export
(1) (2) (3)
1990-91 321992 198757
1995-96 662891 367214
2000-01 646505 708415
2001-02 763199 553681
2002-03 1148883 771550
2003-04 1556100 1182319
2004-05 1850966 1712625
2005-06 2679988 1674622
2006-07 6200344 1802347
2007-08 6366194 1976834
2008-09 8453137 2644405
2009-10 7356256 1901851
2010-11 8165418 3159435
2011-12 10840785 3790248
2012-13 11410264 4292671
2013-14 12134699 8507218
TABLE 16.0Foreign Trade at Kolkata Port (Sea & Air)
Source: Office of the Directorate General of Commercial Intelligence and Statistics, Govt. of India.
State Statistical Handbook 2014 161
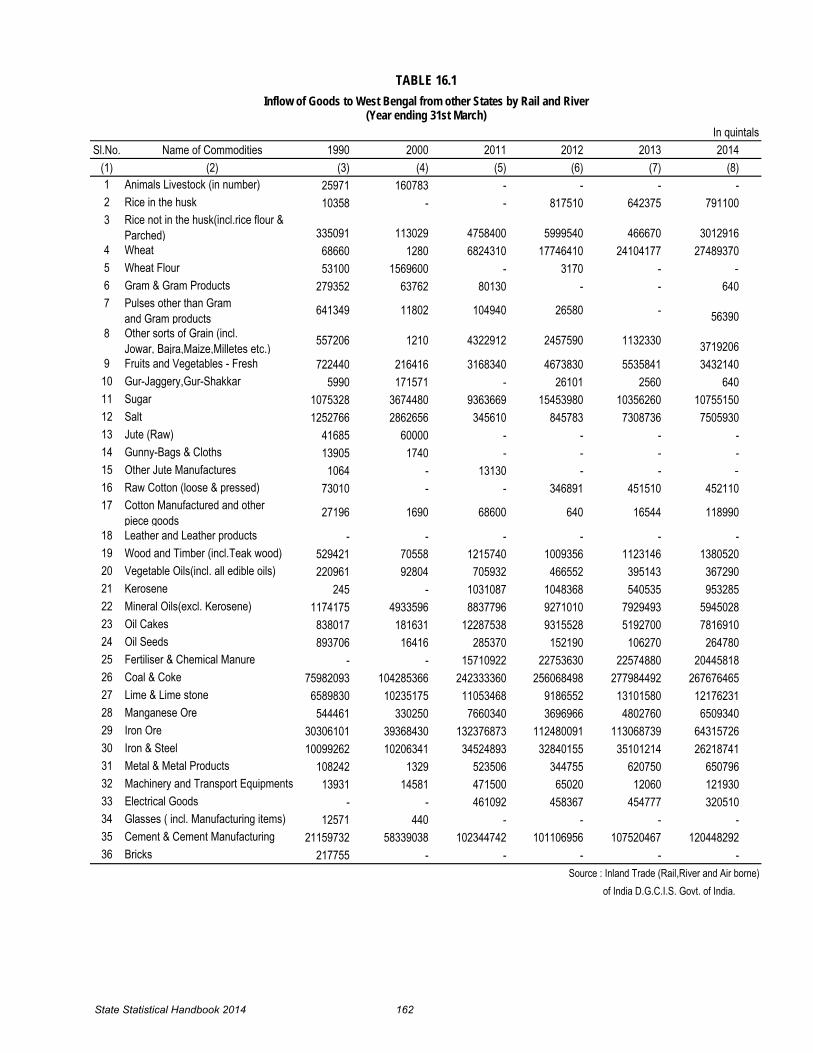
Sl.No. Name of Commodities 1990 2000 2011 2012 2013 2014(1) (2) (3) (4) (5) (6) (7) (8)1 Animals Livestock (in number) 25971 160783 - - - -2 Rice in the husk 10358 - - 817510 642375 7911003 Rice not in the husk(incl.rice flour &
Parched) 335091 113029 4758400 5999540 466670 30129164 Wheat 68660 1280 6824310 17746410 24104177 274893705 Wheat Flour 53100 1569600 - 3170 - -6 Gram & Gram Products 279352 63762 80130 - - 6407 Pulses other than Gram
and Gram products 641349 11802 104940 26580 - 563908 Other sorts of Grain (incl.
Jowar, Bajra,Maize,Milletes etc.) 557206 1210 4322912 2457590 1132330 37192069 Fruits and Vegetables - Fresh 722440 216416 3168340 4673830 5535841 343214010 Gur-Jaggery,Gur-Shakkar 5990 171571 - 26101 2560 64011 Sugar 1075328 3674480 9363669 15453980 10356260 1075515012 Salt 1252766 2862656 345610 845783 7308736 750593013 Jute (Raw) 41685 60000 - - - -14 Gunny-Bags & Cloths 13905 1740 - - - -15 Other Jute Manufactures 1064 - 13130 - - -16 Raw Cotton (loose & pressed) 73010 - - 346891 451510 45211017 Cotton Manufactured and other
piece goods 27196 1690 68600 640 16544 118990
18 Leather and Leather products - - - - - -19 Wood and Timber (incl.Teak wood) 529421 70558 1215740 1009356 1123146 138052020 Vegetable Oils(incl. all edible oils) 220961 92804 705932 466552 395143 36729021 Kerosene 245 - 1031087 1048368 540535 95328522 Mineral Oils(excl. Kerosene) 1174175 4933596 8837796 9271010 7929493 594502823 Oil Cakes 838017 181631 12287538 9315528 5192700 781691024 Oil Seeds 893706 16416 285370 152190 106270 26478025 Fertiliser & Chemical Manure - - 15710922 22753630 22574880 2044581826 Coal & Coke 75982093 104285366 242333360 256068498 277984492 26767646527 Lime & Lime stone 6589830 10235175 11053468 9186552 13101580 1217623128 Manganese Ore 544461 330250 7660340 3696966 4802760 650934029 Iron Ore 30306101 39368430 132376873 112480091 113068739 6431572630 Iron & Steel 10099262 10206341 34524893 32840155 35101214 2621874131 Metal & Metal Products 108242 1329 523506 344755 620750 65079632 Machinery and Transport Equipments 13931 14581 471500 65020 12060 12193033 Electrical Goods - - 461092 458367 454777 32051034 Glasses ( incl. Manufacturing items) 12571 440 - - - -35 Cement & Cement Manufacturing 21159732 58339038 102344742 101106956 107520467 12044829236 Bricks 217755 - - - - -
of India D.G.C.I.S. Govt. of India.
In quintals
Inflow of Goods to West Bengal from other States by Rail and RiverTABLE 16.1
(Year ending 31st March)
Source : Inland Trade (Rail,River and Air borne)
State Statistical Handbook 2014 162

Sl.No. Name of Commodities 1990 2000 2011 2012 2013 2014
(1) (2) (3) (4) (5) (6) (7) (8)
1 Animals Livestock (in number) 1064 - - - - -2 Rice in the husk 460 5980 25620 - 4420 -3 Rice not in the husk(incl.rice flour & Parched) 182590 155450 986670 100870 1132160 5741204 Wheat 52840 30470 166659 264920 57520 79791
5 Wheat Flour 7972 18160 - - - -
6 Gram & Gram Products 28029 9885 256270 - - -
7 Pulses other than Gram and Gram products 83350 44710 59110 49200 50400 49640
8 Other sorts of Grain (incl.Jowar, Bajra,Maize,Milletes etc.) 25640 - 1045770 571230 1938310 1912660
9 Fruits and Vegetables - Fresh 1134 26430 3303520 2060060 1101300 1697500
10 Gur-Jaggery,Gur-Shakkar 1217 - - - - -
11 Sugar 1052 2086475 1077240 1053460 25800 -
12 Salt - 4786 - - - -
13 Jute (Raw) 49242 70597 - - - -
14 Gunny-Bags & Cloths 1728938 1629062 - - - -
15 Other Jute Manufactures 56870 860 5176160 4759965 6773280 6420150
16 Raw Cotton (loose & pressed) 440 - 276770 - - -17 Cotton Manufactured and other
piece goods 5670 - - - - -
18 Leather and Leather products - - - - - -
19 Wood and Timber (incl.Teak wood) 116137 60837 1394830 756800 315430 388590
20 Vegetable Oils(incl. all edible oils) 10477 30060 5544320 4217290 4890950 4925790
21 Kerosene 1119268 23390 4221008 4067119 2634852 3133402
22 Mineral Oils(excl. Kerosene) 6999058 19116519 29618186 33700017 29317209 26776188
23 Oil Cakes 44704 31850 3092480 - - -
24 Oil Seeds 3905 731320 316990 156000 312830 186310
25 Fertiliser & Chemical Manure - - 2760020 3076070 3253760 1997080
26 Coal & Coke 83893142 73244420 112896480 104657570 103826081 129940310
27 Lime & Lime stone 30 3317569 12937070 11145282 17484840 16957654
28 Manganese Ore 4244 - 67350 499170 1158640 1210570
29 Iron Ore 4426 - 219180 24090 - 19810
30 Iron & Steel 11887460 9301340 20163350 18590100 17740710 17788590
31 Metal & Metal Products 28684 2680 - - - -
32 Machinery and Transport Equipments 66420 300 787930 - - 2480
33 Electrical Goods - - 1150 - 76370 8990
34 Glasses ( incl. Manufacturing items) 44708 390 - - - -
35 Cement & Cement Manufacturing 669242 798892 12908420 10700700 11706610 11680380
36 Bricks 177320 2830 - - - -
TABLE 16.2Outflow of Goods from West Bengal to Other States by Rail and River
(Year ending 31st March) In Quintals
Source : Inland Trade (Rail,River and Air borne)of India D.G.C.I.S.Govt. of India.
State Statistical Handbook 2014 163

Particulars 1991 2001 2011 2012 2013 2014
(1) (2) (3) (4) (5) (6) (7)
Bank Offices (Number) 4216 4430 5673 6066 6486 6960
Deposits(` Lakh) 1995605 7310710 36346600 40548921(R) 46574117 52378010
Bank Credit(`Lakh) 1029985 3212883 21914300 24873551(R) 27769512 29524270
Credit Deposit Ratio(%) 51.6 43.9 60.3 61.3 59.6 56.4
Note: Deposits and Advances relate to reporting offices only. R=Revised
Source: Reserve Bank of India (www.dbie.rbi.org.in/DBIE/dbie.rbi?sie = publication) (Downloaded on 03.11.2015)
TABLE 17.0Status of Banking Operation in West Bengal
(As on the last Friday of December)
State Statistical Handbook 2014 164

2001 2012 2013 2014 2001 2012 2013 2014(1) (2) (4) (5) (6) (7) (9) (10) (11)
Rural:-Number of Offices 2277 2584 2738 2964 32496 37159 41624 46985Deposits 1150931 5688511(R) 6863198 8236510 14952256 62584646(R) 73075427 84654070Advances 258961 1932299(R) 2107116 2200850 6113950 42618740 49742870 56071170Percentage of Adv. toDeposits 22.5 34.0 30.7 26.7 40.9 68.1 68.1 66.2
Semi-Urban:-Number of Offices 563 868 989 1059 14632 26920 29909 32739Deposits 911985 4004734 4784392 5776520 20124119 92305986(R) 106856674 121825240Advances 155846 885003(R) 1021745 1126140 6701254 50861881(R) 60918665 70048610Percentage of Adv. toDeposits 17.1 22.1 21.4 19.5 33.3 55.1 57.0 57.5
Urban-Metropolitan:-Number of Offices 1590 2614 2759 2937 19133 37488 40245 43460Deposits 5247794 30855677(R) 34926527 38364980 67036595 491741098(R) 566369094 620878690Advances 2798075 22056249(R) 24640651 26197280 45599725 409007752(R) 463199815 505676100Percentage of Adv. toDeposits 53.3 71.5 70.5 68.3 68.0 83.2 81.8 81.4
Total:-Number of Offices 4430 6066 6486 6960 66261 101567 111778 123184Deposits 7310710 40548922(R) 46574117 52378010 102112970 646631730 746301195 827358000Advances 3212883 24873551(R) 27769512 29524270 58414930 502488373(R) 573861350 631795880Percentage of Adv. toDeposits 43.9 61.3 59.6 56.4 57.2 77.7 76.9 76.4
(Downloaded on 03.11.2015)
(` In Lakh)
Particulars
Source: Reserve Bank of India.(www.dbie.rbi.org.in/DBIE/dbie.rbi?site = publication)
TABLE 17.0(a)Deposits and Advances of Scheduled Commercial Banks
(as on last Friday of December)
West Bengal All India
State Statistical Handbook 2014 165

0
100000
200000
300000
400000
500000
600000
2001 2013 2014
Deposit
Advance
Figure 5 : Deposits and Advances of Scheduled Commercial Banks in West Bengal
Year
Rs. i
nCr
ore
State Statistical Handbook 2014 166

Particulars 1990-91 2000-01 2009-10 2010-11 2011-12 2012-13 2013-14
(1) (2) (3) (4) (5) (6) (7) (8)
Number of Policies 731780 2039908 3736077 3975297 3344791 3193317 2866173
Sum assured(` in Lakh)
208199 1085263 3844837 4297363 3927436 3721097 4191864
First YearPremium Income(` in lakh)
10715 58329 207052 221633 246573 283037 199742
*Yearly renewalPremium Income(` in lakh)
36024 189122 822415 895923 889698 871633 917776
TABLE 18.0
*Only renewal premium income for ordinary policies have been taken into account.
Source: Life Insurance Corporation of India.
Life Insurance Business in West Bengal in different years
State Statistical Handbook 2014 167

Year Public Private Total
(1) (2) (3) (4)
1991 6443 24619 31062
1996 8782 49489 58271
2001 9589 62461 72050
2007 8507 62369 70876
2008 8840 71719 80559
2009 8019 77274 85293
2010 9599 89054 98653
2011 8264 95731 103995
2012 15765 144244 160009
2013 9656 113721 123377
2014 11192 125655 136847
Govt. of India.
TABLE 19.0Joint Stock Companies at Work in West Bengal
(as on 31st March) Number
Source: Registrar of Companies,
State Statistical Handbook 2014 168

Particulars 1990-91 2000-01 2010-11 2011-12 2012-13 2013-14
(1) (2) (3) (4) (5) (6) (7)
1. Registeredduring the year( Number )
2. Authorised Capital('Rs, in lakh )
3. Ceased to workeither by liquidationor struck off duringthe period (Number )
TABLE 19.1Joint Stock Companies Registered and Gone into Liquidation or
Stuck off from the Register in West Bengal in different years
Source : Registrar of Companies, Govt. of India.
39022
2545 1502 16498 17660 12394 9939
54163 591594 404893 188199 220734
42 85 7022 2873 3879 1752
State Statistical Handbook 2014 169
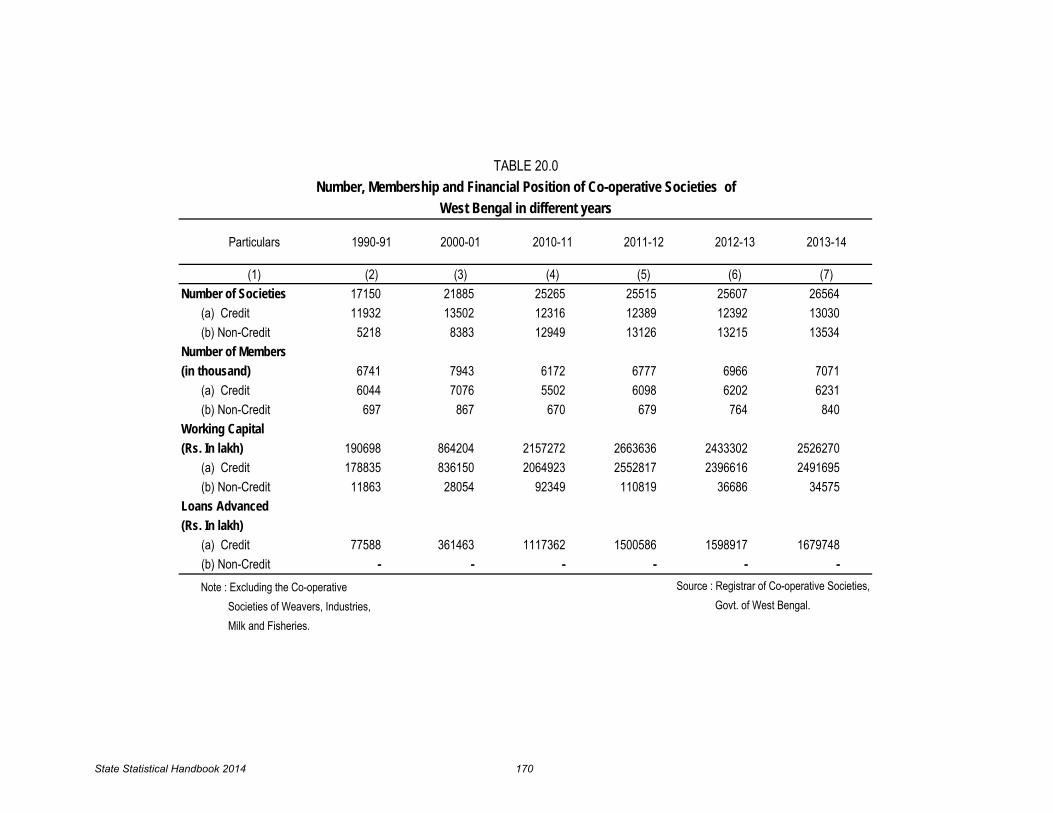
Particulars 1990-91 2000-01 2010-11 2011-12 2012-13 2013-14
(1) (2) (3) (4) (5) (6) (7)Number of Societies 17150 21885 25265 25515 25607 26564
(a) Credit 11932 13502 12316 12389 12392 13030(b) Non-Credit 5218 8383 12949 13126 13215 13534
Number of Members(in thousand) 6741 7943 6172 6777 6966 7071
(a) Credit 6044 7076 5502 6098 6202 6231(b) Non-Credit 697 867 670 679 764 840
Working Capital(Rs. In lakh) 190698 864204 2157272 2663636 2433302 2526270
(a) Credit 178835 836150 2064923 2552817 2396616 2491695(b) Non-Credit 11863 28054 92349 110819 36686 34575
Loans Advanced(Rs. In lakh)
(a) Credit 77588 361463 1117362 1500586 1598917 1679748(b) Non-Credit - - - - - -Note : Excluding the Co-operative Societies of Weavers, Industries, Milk and Fisheries.
TABLE 20.0Number, Membership and Financial Position of Co-operative Societies of
West Bengal in different years
Source : Registrar of Co-operative Societies, Govt. of West Bengal.
State Statistical Handbook 2014 170

Year FoodArticles Foodgrains Cereals Pulses
Fruitsand
VegetablesSpices
Misce-llaneous
food
Non-foodarticles Fibres Oilseeds
Othernon-food
Allcombined
(1) (2) (3) (4) (5) (6) (7) (8) (9) (10) (11) (12) (13)
1991 308.4 202.0 194.2 244.6 485.9 395.8 327.9 288.6 255.6 213.9 464.1 304.6
1996 496.9 346.6 328.4 446.3 863.8 446.8 392.2 498.6 587.4 281.6 548.5 497.2
2001 633.8 447.4 430.9 537.4 993.6 902.1 490.4 473.6 516.4 290.2 596.5 602.6
2002 712.6 413.2 387.0 556.4 1399.4 844.5 444.1 461.8 443.6 311.0 695.5 663.7
2003 638.7 416.0 391.6 548.9 1105.0 762.8 516.9 434.5 371.6 383.0 655.4 598.9
2004 672.6 417.3 391.8 556.9 1221.1 717.4 565.6 439.6 418.1 385.4 560.6 627.2
2005 721.7 420.6 390.2 586.9 1417.8 660.8 564.7 547.0 609.5 387.2 591.1 687.6
2006 725.7 453.2 394.5 774.0 1254.0 972.4 604.8 574.1 638.5 411.2 617.2 696.2
2007 797.5 473.1 394.9 900.5 1398.6 1254.6 606.4 548.3 519.9 502.2 676.5 748.9
2008 756.3 465.4 374.3 963.3 1297.6 1022.8 673.2 638.4 623.1 543.4 795.0 733.3
2009 905.5 443.3 315.8 1139.9 1732.3 1271.9 880.3 886.6 1003.1 554.3 1011.6 901.8
2010 945.3 458.6 320.7 1212.8 1624.4 1826.4 1004.8 1082.0 1356.2 571.3 1037.4 972.0
2011 1022.8 448.9 314.0 1186.4 1872.2 1914.9 1084.9 1000.8 1204.5 577.5 1022.2 1018.5
2012 1190.3 481.5 315.8 1386.9 2508.7 1526.4 1190.5 953.1 1106.8 708.5 875.9 1144.12013 1149.2 479.8 311.2 1402.1 2294.7 1643.3 1250.9 1068.6 1222.6 687.3 1161.7 1133.52014* 1075.9 499.4 309.7 1536.5 1939.5 1865.4 1184.8 1072.1 1280.0 631.8 1104.3 1075.1
TABLE 21.0
Index Number of Wholesale Prices of Agricultural Commodities in Kolkata
(Base : 1980-81 = 100)
* = 3 months average
State Statistical Handbook 2014 171

(1) (2) (3) (4) (5) (6) (7) (8) (9) (10) (11) (12) (13)2013 :-
January 1092.7 494.6 310.2 1502.8 2119.5 1469.8 1213.7 1049.0 1122.8 780.4 1200.9 1084.2February 1125.9 483.1 309.9 1430.1 2297.3 1497.0 1134.0 1089.5 1217.1 729.3 1221.7 1118.8March 1217.5 469.3 308.6 1347.7 2630.7 1559.8 1237.4 1125.4 1315.9 660.6 1231.9 1199.6April 1209.5 474.2 308.3 1380.9 2439.7 1697.0 1411.4 1103.4 1311.7 634.8 1170.0 1188.9May 1216.1 472.4 309.0 1365.7 2522.9 1700.8 1292.7 1092.1 1277.2 660.3 1170.6 1191.9June 1237.7 495.0 332.5 1383.8 2584.7 1655.8 1268.0 1043.5 1178.3 672.8 1171.3 1199.9July 1129.7 471.9 309.5 1359.8 2256.0 1660.2 1194.2 1052.8 1199.8 654.6 1184.5 1114.7August 1089.4 471.9 309.1 1361.9 2092.4 1647.6 1226.3 1025.0 1152.5 657.4 1167.2 1076.9September 1095.0 478.7 309.1 1405.5 2103.2 1640.3 1223.9 1032.8 1177.2 688.8 1103.1 1082.8October 1107.5 479.6 309.2 1411.3 2151.5 1632.6 1223.0 1048.2 1202.7 693.9 1106.3 1095.9November 1112.7 479.6 309.2 1411.3 2151.5 1632.6 1264.4 1049.8 1205.6 693.9 1106.3 1100.4December 1157.1 487.8 309.2 1464.2 2186.8 1925.7 1321.9 1112.0 1310.3 721.2 1106.5 1148.3
2012 :-January 1332.0 466.6 315.9 1290.9 3046.9 1682.4 1147.5 915.3 982.7 628.0 1106.5 1250.8February 1340.2 464.7 316.2 1276.8 3112.5 1640.3 1109.7 955.6 1060.5 628.7 1102.9 1265.2March 1268.9 466.0 316.6 1283.2 2873.7 1563.7 1088.1 992.9 1090.3 650.5 1178.2 1215.1April 1381.8 460.1 315.7 1249.7 3104.6 1580.2 1517.4 907.6 1074.4 678.2 778.7 1289.4May 1156.2 468.4 316.3 1300.1 2385.8 1517.3 1238.5 901.5 1049.1 680.5 809.9 1106.5June 1213.6 472.5 317.2 1321.4 2574.0 1450.1 1325.5 934.2 1119.7 675.6 795.0 1159.1July 1066.4 491.1 321.3 1419.6 2066.1 1442.7 1148.4 989.4 1212.9 697.5 797.3 1051.4August 1050.3 511.3 330.1 1501.7 1950.9 1502.7 1138.9 1018.4 1226.9 784.5 791.2 1044.0September 1137.7 494.6 310.1 1503.1 2349.8 1479.3 1080.0 990.8 1185.5 761.9 791.7 1109.0October 1148.1 492.8 310.3 1490.4 2372.8 1503.1 1107.1 946.5 1123.6 726.2 780.4 1108.8November 1108.0 494.2 310.6 1498.2 2181.6 1486.5 1195.3 942.3 1086.2 788.1 776.7 1075.7December 1080.8 495.1 309.8 1508.2 2085.2 1467.9 1189.8 942.6 1069.3 802.5 802.0 1053.8
Allcombined
TABLE 21.0 (Contd.)Index Number of Wholesale Prices of Agricultural Commodities in Kolkata
(Base : 1980-81 = 100)
Year/Month FoodArticles Foodgrains Cereals Pulses
Fruitsand
VegetablesSpices
Misce-llaneous
food articles
Non-foodarticles Fibres Oilseeds
Othernon-foodarticles
State Statistical Handbook 2014 172

(1) (2) (3) (4) (5) (6) (7) (8) (9) (10) (11) (12) (13)2014* :-
January 1163.4 494.4 308.8 1509.0 2249.5 1845.5 1263.0 1096.0 1295.7 692.2 1103.4 1150.3
February 1054.2 500.3 309.8 1541.8 1825.8 1826.7 1273.4 1058.1 1268.4 601.7 1104.5 1055.0
March 1010.0 503.5 310.5 1558.6 1743.1 1923.8 1018.0 1062.1 1275.9 601.7 1105.0 1020.2
Allcombined
Source : Bureau of Applied Economics & Statistics, Govt. of West Bengal.
TABLE 21.0 (Contd.)Index Number of Wholesale Prices of Agricultural Commodities in Kolkata
(Base : 1980-81 = 100)
Year/Month FoodArticles Foodgrains Cereals Pulses
Fruitsand
VegetablesSpices
Misce-llaneous
food articles
Non-foodarticles Fibres Oilseeds
Othernon-foodarticles
State Statistical Handbook 2014 173
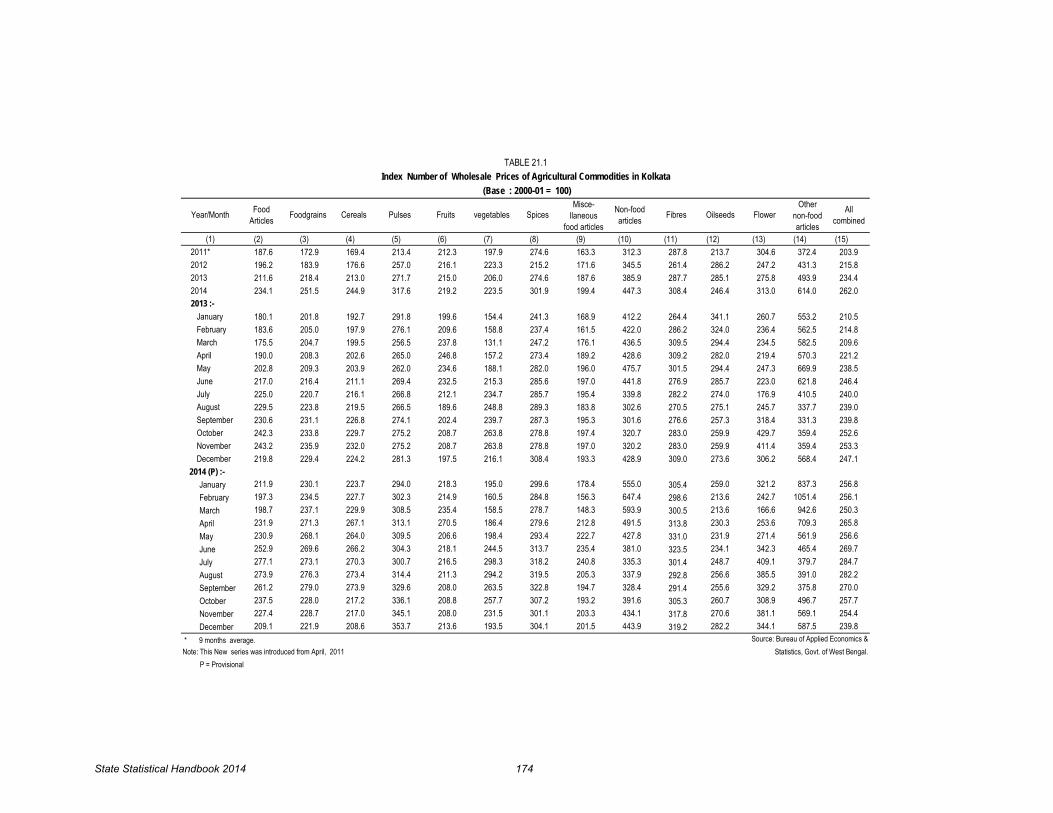
(1) (2) (3) (4) (5) (6) (7) (8) (9) (10) (11) (12) (13) (14) (15)2011* 187.6 172.9 169.4 213.4 212.3 197.9 274.6 163.3 312.3 287.8 213.7 304.6 372.4 203.9 2012 196.2 183.9 176.6 257.0 216.1 223.3 215.2 171.6 345.5 261.4 286.2 247.2 431.3 215.8 2013 211.6 218.4 213.0 271.7 215.0 206.0 274.6 187.6 385.9 287.7 285.1 275.8 493.9 234.4 2014 234.1 251.5 244.9 317.6 219.2 223.5 301.9 199.4 447.3 308.4 246.4 313.0 614.0 262.0 2013 :-
January 180.1 201.8 192.7 291.8 199.6 154.4 241.3 168.9 412.2 264.4 341.1 260.7 553.2 210.5 February 183.6 205.0 197.9 276.1 209.6 158.8 237.4 161.5 422.0 286.2 324.0 236.4 562.5 214.8 March 175.5 204.7 199.5 256.5 237.8 131.1 247.2 176.1 436.5 309.5 294.4 234.5 582.5 209.6 April 190.0 208.3 202.6 265.0 246.8 157.2 273.4 189.2 428.6 309.2 282.0 219.4 570.3 221.2 May 202.8 209.3 203.9 262.0 234.6 188.1 282.0 196.0 475.7 301.5 294.4 247.3 669.9 238.5 June 217.0 216.4 211.1 269.4 232.5 215.3 285.6 197.0 441.8 276.9 285.7 223.0 621.8 246.4 July 225.0 220.7 216.1 266.8 212.1 234.7 285.7 195.4 339.8 282.2 274.0 176.9 410.5 240.0 August 229.5 223.8 219.5 266.5 189.6 248.8 289.3 183.8 302.6 270.5 275.1 245.7 337.7 239.0 September 230.6 231.1 226.8 274.1 202.4 239.7 287.3 195.3 301.6 276.6 257.3 318.4 331.3 239.8 October 242.3 233.8 229.7 275.2 208.7 263.8 278.8 197.4 320.7 283.0 259.9 429.7 359.4 252.6 November 243.2 235.9 232.0 275.2 208.7 263.8 278.8 197.0 320.2 283.0 259.9 411.4 359.4 253.3 December 219.8 229.4 224.2 281.3 197.5 216.1 308.4 193.3 428.9 309.0 273.6 306.2 568.4 247.1
2014 (P) :-January 211.9 230.1 223.7 294.0 218.3 195.0 299.6 178.4 555.0 305.4 259.0 321.2 837.3 256.8February 197.3 234.5 227.7 302.3 214.9 160.5 284.8 156.3 647.4 298.6 213.6 242.7 1051.4 256.1March 198.7 237.1 229.9 308.5 235.4 158.5 278.7 148.3 593.9 300.5 213.6 166.6 942.6 250.3April 231.9 271.3 267.1 313.1 270.5 186.4 279.6 212.8 491.5 313.8 230.3 253.6 709.3 265.8May 230.9 268.1 264.0 309.5 206.6 198.4 293.4 222.7 427.8 331.0 231.9 271.4 561.9 256.6June 252.9 269.6 266.2 304.3 218.1 244.5 313.7 235.4 381.0 323.5 234.1 342.3 465.4 269.7July 277.1 273.1 270.3 300.7 216.5 298.3 318.2 240.8 335.3 301.4 248.7 409.1 379.7 284.7August 273.9 276.3 273.4 314.4 211.3 294.2 319.5 205.3 337.9 292.8 256.6 385.5 391.0 282.2September 261.2 279.0 273.9 329.6 208.0 263.5 322.8 194.7 328.4 291.4 255.6 329.2 375.8 270.0October 237.5 228.0 217.2 336.1 208.8 257.7 307.2 193.2 391.6 305.3 260.7 308.9 496.7 257.7November 227.4 228.7 217.0 345.1 208.0 231.5 301.1 203.3 434.1 317.8 270.6 381.1 569.1 254.4December 209.1 221.9 208.6 353.7 213.6 193.5 304.1 201.5 443.9 319.2 282.2 344.1 587.5 239.8
Note: This New series was introduced from April, 2011P = Provisional
* 9 months average.
TABLE 21.1Index Number of Wholesale Prices of Agricultural Commodities in Kolkata
(Base : 2000-01 = 100)
Year/Month Food Articles Foodgrains Cereals Pulses Fruits vegetables Spices Fibres Oilseeds Flower
Source: Bureau of Applied Economics &
Misce-llaneous
food articles
Non-food articles
Other non-food articles
All combined
Statistics, Govt. of West Bengal.
State Statistical Handbook 2014 174

Rural Urban Combined Rural Urban Combined(1) (2) (3) (4) (5) (6) (7)
2011 111 108 110 114 107 1112012 122 119 120 125 118 1222013 134 131 132 137 131 1352014 144 140 142 148 140 1452013 :-
January 127 125 126 131 125 128February 128 126 127 131 126 129March 128 127 128 131 126 129April 129 127 128 132 127 130May 130 128 129 132 128 130June 132 131 131 135 130 133July 134 132 133 136 131 134August 135 134 135 138 133 136September 138 134 136 142 134 138October 140 135 138 145 136 141November 142 136 139 149 138 144December 140 135 138 147 137 143
2014 :-January 139 135 137 146 137 142February 139 135 137 144 137 141March 140 136 138 145 137 142April 141 137 139 146 138 143May 141 138 140 147 139 144June 143 139 141 148 140 145July 145 142 144 150 142 146August 147 143 145 151 143 147September 147 143 145 152 143 148October 147 143 145 152 143 148November 148 143 146 152 143 148December 147 142 144 147 143 145
Consumer Price Index Number of Some Selected States of IndiaTABLE 21.2
(Base : 2010 = 100)All India West Bengal
Year/Month
State Statistical Handbook 2014 175

Rural Urban Combined Rural Urban Combined(1) (8) (9) (10) (11) (12) (13)
2011 110 107 109 111 108 109 2012 120 119 120 121 118 119 2013 133 133 133 132 129 1302014 141 141 141 141 137 1382013 :-
January 127 126 126 127 124 125 February 127 128 127 128 125 126 March 127 128 127 127 125 126 April 128 129 128 128 126 127 May 129 131 130 129 127 128 June 132 134 133 131 130 130 July 134 134 134 133 131 131 August 135 136 136 134 132 133 September 138 136 137 136 132 134 October 138 136 137 137 133 135 November 139 138 139 138 134 135 December 139 137 138 137 132 134
2014 :-January 137 137 137 136 132 134 February 137 137 137 136 133 134 March 138 137 137 137 134 135 April 138 138 138 138 135 136 May 139 139 139 139 136 137 June 140 141 140 140 137 138 July 142 144 143 143 139 140 August 143 145 144 143 140 141 September 143 144 143 144 139 141 October 143 144 143 144 140 141 November 143 144 144 144 140 142 December 146 143 145 146 140 142
TABLE 21.2-Contd.
Andhra Pradesh Maharashtra
Consumer Price Index Number of Some Selected States of India(Base : 2010 = 100)
Year/Month
State Statistical Handbook 2014 176

Rural Urban Combined Rural Urban Combined
(1) (14) (15) (16) (17) (18) (19)2011 113 111 112 108 108 1082012 120 121 121 117 118 1172013 133 135 133 127 128 1282014 144 147 145 136 136 1362013 :-
January 127 129 128 122 123 123February 128 130 129 123 124 123March 128 130 129 123 125 124April 129 131 129 124 125 125May 129 132 130 124 126 125June 132 135 133 125 128 126July 134 136 134 126 130 128August 135 137 136 128 131 130September 137 138 137 131 132 131October 137 139 138 132 132 132November 139 140 139 134 133 134December 138 141 139 131 132 131
2014 :-January 138 141 139 131 132 131February 139 141 140 131 132 132March 140 142 140 132 133 133April 141 144 142 133 134 133May 143 145 144 133 134 134June 143 147 145 134 135 135July 146 149 147 137 138 138August 148 152 149 139 139 139September 148 151 149 140 140 140October 148 151 149 140 139 140November 148 152 150 140 139 139December 148 146 147 145 140 143
PunjabKerala
TABLE 21.2-Contd.
Year/Month
Consumer Price Index Number of Some Selected States of India(Base : 2010 = 100)
State Statistical Handbook 2014 177

Rural Urban Combined Rural Urban Combined(1) (20) (21) (22) (23) (24) (25)
2011 110 108 110 111 108 1092012 122 119 121 123 121 1222013 134 131 133 136 135 1352014 144 141 143 144 143 1442013 :-
January 128 124 126 131 129 130February 128 125 127 132 130 131March 129 126 128 132 131 131April 129 127 128 132 132 132May 130 128 129 134 134 134June 132 129 131 136 136 136July 134 132 133 137 136 137August 136 134 135 138 137 137September 138 134 137 139 137 138October 139 136 138 141 138 139November 142 138 141 141 139 140December 141 136 139 141 139 140
2014 :-January 139 135 138 139 138 139February 139 136 138 140 139 139March 140 137 139 140 139 140April 141 138 140 141 141 141May 142 139 141 142 143 142June 143 140 142 143 143 143July 145 143 144 146 145 146August 147 144 146 147 146 147September 148 144 147 147 145 146October 149 144 147 147 146 146November 149 144 147 148 148 148December 146 142 144 147 145 146
Source: Ministry of Statistics & Programme Implementation,Government of India
TABLE 21.2-contd
Uttar Pradesh Tamil Nadu
Consumer Price Index Number of Some Selected States of India(Base : 2010 = 100)
Year/Month
State Statistical Handbook 2014 178
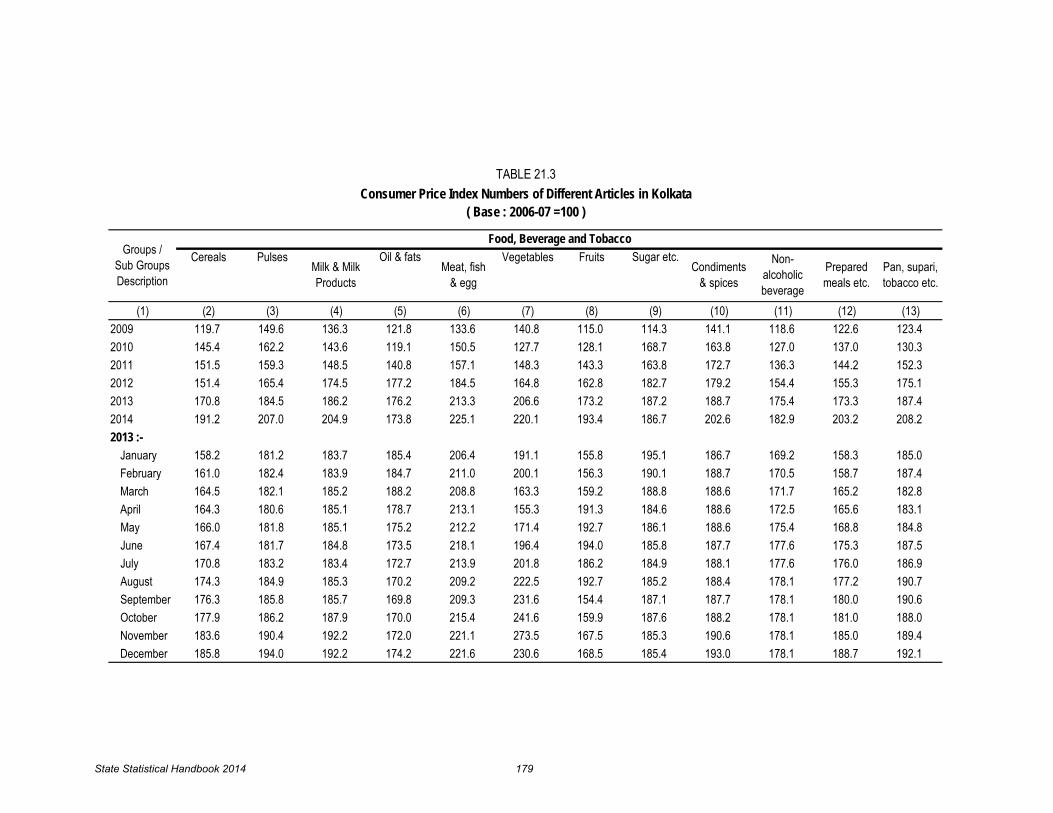
(1) (2) (3) (4) (5) (6) (7) (8) (9) (10) (11) (12) (13)2009 119.7 149.6 136.3 121.8 133.6 140.8 115.0 114.3 141.1 118.6 122.6 123.42010 145.4 162.2 143.6 119.1 150.5 127.7 128.1 168.7 163.8 127.0 137.0 130.32011 151.5 159.3 148.5 140.8 157.1 148.3 143.3 163.8 172.7 136.3 144.2 152.32012 151.4 165.4 174.5 177.2 184.5 164.8 162.8 182.7 179.2 154.4 155.3 175.12013 170.8 184.5 186.2 176.2 213.3 206.6 173.2 187.2 188.7 175.4 173.3 187.42014 191.2 207.0 204.9 173.8 225.1 220.1 193.4 186.7 202.6 182.9 203.2 208.22013 :-
January 158.2 181.2 183.7 185.4 206.4 191.1 155.8 195.1 186.7 169.2 158.3 185.0February 161.0 182.4 183.9 184.7 211.0 200.1 156.3 190.1 188.7 170.5 158.7 187.4March 164.5 182.1 185.2 188.2 208.8 163.3 159.2 188.8 188.6 171.7 165.2 182.8April 164.3 180.6 185.1 178.7 213.1 155.3 191.3 184.6 188.6 172.5 165.6 183.1May 166.0 181.8 185.1 175.2 212.2 171.4 192.7 186.1 188.6 175.4 168.8 184.8June 167.4 181.7 184.8 173.5 218.1 196.4 194.0 185.8 187.7 177.6 175.3 187.5July 170.8 183.2 183.4 172.7 213.9 201.8 186.2 184.9 188.1 177.6 176.0 186.9August 174.3 184.9 185.3 170.2 209.2 222.5 192.7 185.2 188.4 178.1 177.2 190.7September 176.3 185.8 185.7 169.8 209.3 231.6 154.4 187.1 187.7 178.1 180.0 190.6October 177.9 186.2 187.9 170.0 215.4 241.6 159.9 187.6 188.2 178.1 181.0 188.0November 183.6 190.4 192.2 172.0 221.1 273.5 167.5 185.3 190.6 178.1 185.0 189.4December 185.8 194.0 192.2 174.2 221.6 230.6 168.5 185.4 193.0 178.1 188.7 192.1
TABLE 21.3Consumer Price Index Numbers of Different Articles in Kolkata
( Base : 2006-07 =100 )
Food, Beverage and Tobacco
Meat, fish & egg
Milk & Milk Products
Sugar etc.Condiments
& spices
Non-alcoholic beverage
Prepared meals etc.
Pan, supari, tobacco etc.
FruitsGroups / Sub Groups Description
Cereals Pulses Oil & fats Vegetables
State Statistical Handbook 2014 179

(1) (14) (15) (16) (17) (18) (19)2009 129.6 110.0 115.7 148.1 114.8 123.02010 141.0 121.8 127.4 174.8 120.8 133.82011 150.3 136.6 141.8 181.8 129.0 143.12012 167.5 153.4 149.2 191.0 137.1 155.52013 187.4 160.3 161.6 195.7 148.8 169.02014 203.0 168.0 172.5 203.4 158.3 180.42013 :-
January 179.9 159.2 155.9 192.7 143.9 163.7February 182.6 160.2 156.5 192.7 144.1 164.9March 178.9 160.2 158.6 192.7 145.4 164.2April 178.9 160.2 159.2 192.7 145.4 164.2May 181.5 160.2 158.9 192.7 145.5 165.1June 186.6 160.2 163.2 197.6 150.2 169.6July 186.9 160.2 163.5 197.6 150.5 169.8August 190.2 160.6 163.6 197.6 151.0 171.2September 190.7 160.6 164.4 197.6 151.5 171.7October 193.8 160.6 164.9 197.6 151.6 172.9November 201.6 160.6 164.9 197.6 152.1 175.9December 197.4 160.9 165.2 199.1 153.9 175.2
Groups / Sub Groups Description
TABLE 21.3-contd.Consumer Price Index Numbers of Different Articles in Kolkata
( Base : 2006-07 =100 )Total Food Beverage &
TobaccoFuel & Light Total Clothing,
Bedding & FootwearHousing Miscellaneous All
Combined
State Statistical Handbook 2014 180

(1) (2) (3) (4) (5) (6) (7) (8) (9) (10) (11) (12) (13)2014 :-
January 185.3 196.8 203.0 175.2 221.4 227.9 171.6 184.6 192.8 177.3 189.3 196.5February 187.0 203.7 201.1 174.3 219.6 214.3 177.9 183.9 192.5 185.6 193.4 195.6March 188.3 206.3 194.1 174.3 228.7 190.2 177.2 180.9 192.1 178.3 195.2 190.6April 188.8 206.1 195.2 174.8 225.9 189.1 182.5 184.0 193.5 179.5 193.4 188.8May 188.6 205.1 196.5 174.7 229.5 201.0 234.5 187.5 198.6 177.5 196.4 188.3June 189.2 204.0 199.4 174.5 230.3 215.4 232.3 189.3 203.9 182.0 209.0 193.9July 190.2 204.4 200.0 173.5 227.1 242.7 235.9 188.4 206.2 182.1 206.3 216.5August 194.0 204.8 200.7 172.7 222.1 246.0 198.9 186.6 207.2 184.9 213.1 217.2September 194.5 204.9 209.4 173.0 222.7 245.6 194.3 187.5 209.1 188.5 211.5 217.0October 195.8 209.0 217.4 172.7 223.4 238.8 170.1 186.6 208.6 184.4 206.7 219.3November 195.7 218.5 220.8 171.8 223.5 221.6 172.6 194.5 209.8 187.3 208.0 234.0December 196.7 220.9 221.1 174.2 226.6 209.1 172.4 186.1 216.9 187.3 215.5 240.9
Table 21.3-contd.Consumer Price Index Numbers of Different Articles in Kolkata
( Base : 2006-07 =100 )
Food, Beverage and TobaccoCereals Pulses
Milk & milk Pro-fucts
Oil & fats Non-alcoholic beverage
Prepared meals etc.
Pan, supari, tobacco etc.
Groups / Sub Groups Description
Meat, fish & egg
Vegetables Fruits Sugar etc.Condiments
& spices
State Statistical Handbook 2014 181
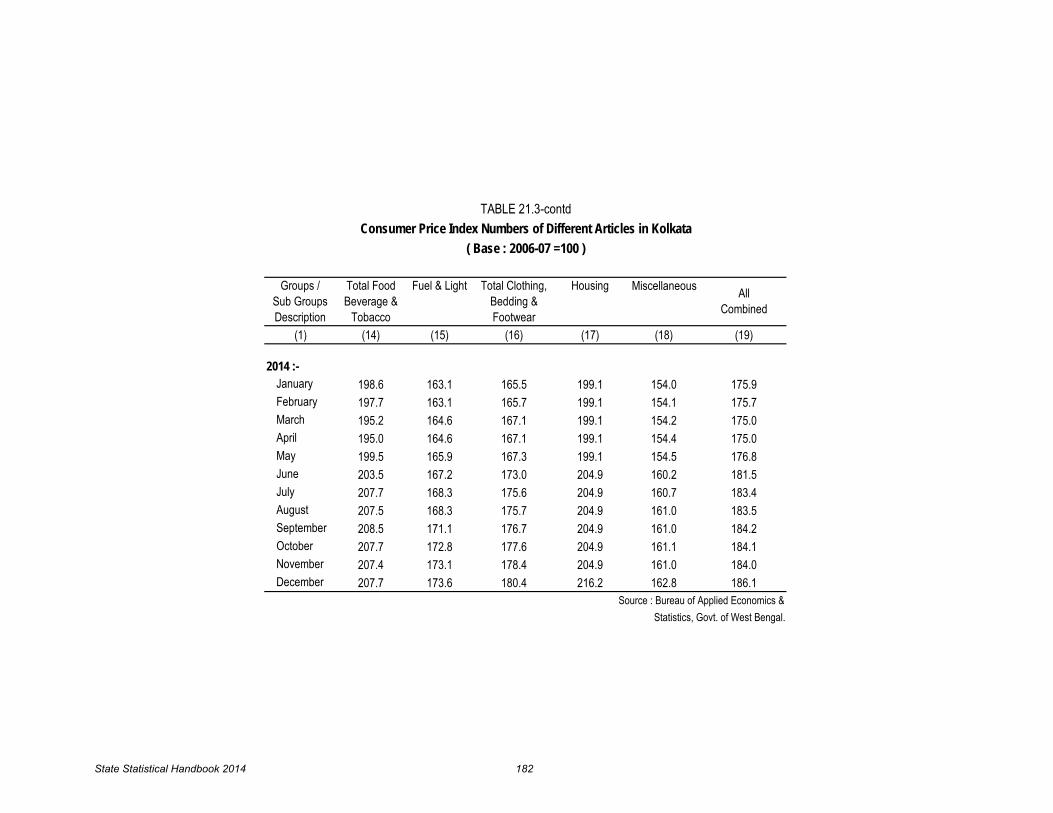
(1) (14) (15) (16) (17) (18) (19)
2014 :-January 198.6 163.1 165.5 199.1 154.0 175.9 February 197.7 163.1 165.7 199.1 154.1 175.7 March 195.2 164.6 167.1 199.1 154.2 175.0 April 195.0 164.6 167.1 199.1 154.4 175.0 May 199.5 165.9 167.3 199.1 154.5 176.8 June 203.5 167.2 173.0 204.9 160.2 181.5 July 207.7 168.3 175.6 204.9 160.7 183.4 August 207.5 168.3 175.7 204.9 161.0 183.5 September 208.5 171.1 176.7 204.9 161.0 184.2 October 207.7 172.8 177.6 204.9 161.1 184.1 November 207.4 173.1 178.4 204.9 161.0 184.0 December 207.7 173.6 180.4 216.2 162.8 186.1
AllCombined
TABLE 21.3-contdConsumer Price Index Numbers of Different Articles in Kolkata
( Base : 2006-07 =100 )
Source : Bureau of Applied Economics & Statistics, Govt. of West Bengal.
Groups / Sub Groups Description
Total Food Beverage &
Tobacco
Fuel & Light Total Clothing, Bedding & Footwear
Housing Miscellaneous
State Statistical Handbook 2014 182

Sub stratum I Sub stratum II Sub stratum III Sub stratum IV(`1 to 600) (`601 to 1000) (`1001 to 1800) (`1801 & above)
(1) (2) (3) (4) (5) (6)2008 111.2 110.7 110.8 110.1 110.62009 124.0 125.2 123.0 121.5 123.02010 135.6 137.1 133.5 131.6 133.82011 145.1 146.2 142.6 141.2 143.12012 158.6 159.6 154.7 152.8 155.52013 173.9 173.6 168.3 165.5 169.02014 185.9 185.9 179.9 176.2 180.42013 :-
January 168.5 168.0 163.0 160.3 163.7February 170.4 169.4 164.2 161.1 164.9March 168.2 168.4 163.3 161.2 164.2April 168.0 168.3 163.4 161.3 164.2May 169.3 169.5 164.5 162.0 165.1June 173.7 173.8 168.7 166.5 169.6July 173.7 174.0 168.9 166.9 169.8August 176.4 176.0 170.5 167.6 171.2Septembe 176.7 176.4 170.8 168.1 171.7October 178.4 177.9 172.2 168.9 172.9November 182.7 181.5 175.4 171.0 175.9December 180.9 180.6 174.6 171.0 175.2
2014 :-January 181.9 181.3 175.3 171.6 175.9February 181.8 180.8 174.9 171.6 175.7March 180.1 180.1 174.2 171.3 175.0April 179.5 180.1 174.3 171.4 175.0May 182.3 182.3 176.3 172.6 176.8June 186.4 186.8 181.1 177.4 181.5July 189.1 188.7 183.0 179.1 183.4August 189.3 188.9 183.1 179.0 183.5Septembe 190.1 189.9 183.9 179.5 184.2October 189.5 189.9 183.8 179.6 184.1November 189.2 189.7 183.7 179.7 184.0December 191.5 192.2 185.4 181.7 186.1
Source : Bureau of Applied Economics & Statistics, Govermment of West Bengal.
TABLE 21.4Consumer Price Index Numbers in Kolkata by Monthly Family
Expenditure Level (Base : 2006-07 = 100)
Monthly Family expenditure levelsAll
Combined
Year/ Month
State Statistical Handbook 2014 183
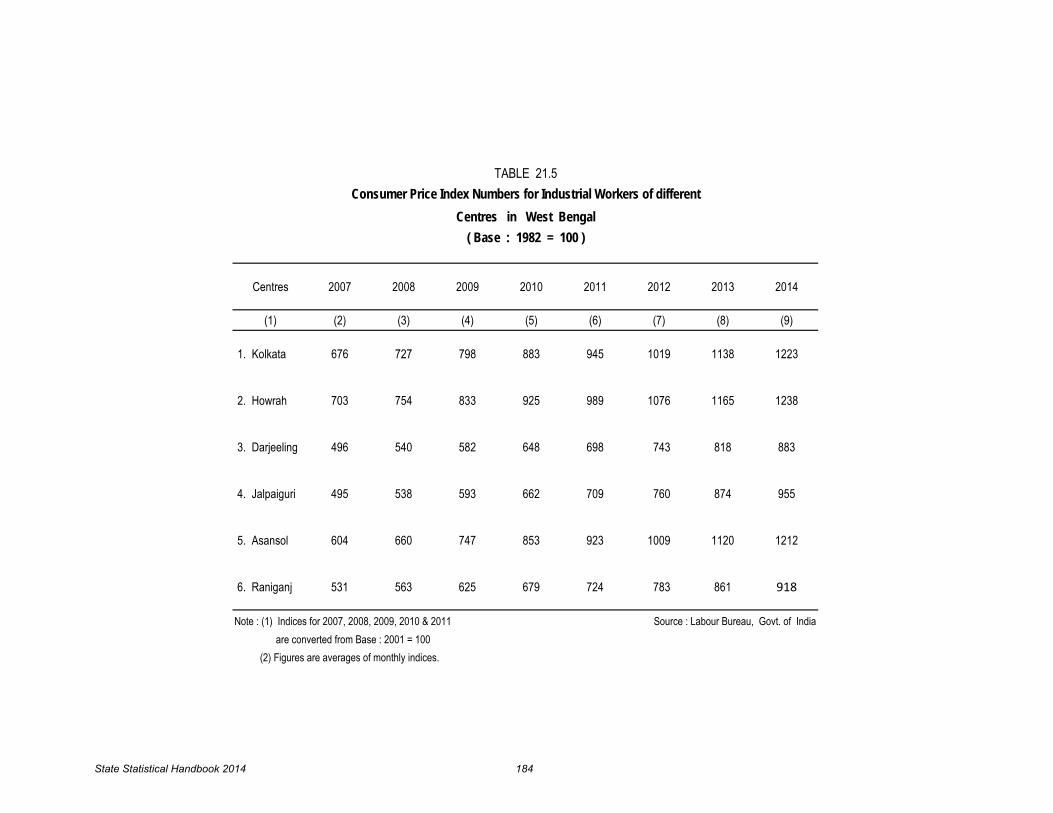
Centres 2007 2008 2009 2010 2011 2012 2013 2014
(1) (2) (3) (4) (5) (6) (7) (8) (9)
1. Kolkata 676 727 798 883 945 1019 1138 1223
2. Howrah 703 754 833 925 989 1076 1165 1238
3. Darjeeling 496 540 582 648 698 743 818 883
4. Jalpaiguri 495 538 593 662 709 760 874 955
5. Asansol 604 660 747 853 923 1009 1120 1212
6. Raniganj 531 563 625 679 724 783 861 918
Note : (1) Indices for 2007, 2008, 2009, 2010 & 2011 are converted from Base : 2001 = 100
(2) Figures are averages of monthly indices.
TABLE 21.5Consumer Price Index Numbers for Industrial Workers of different
Centres in West Bengal( Base : 1982 = 100 )
Source : Labour Bureau, Govt. of India
State Statistical Handbook 2014 184

Centres 2007 2008 2009 2010 2011 2012 2013 2014
(1) (2) (3) (4) (5) (6) (7) (8) (9)
1. Kolkata 132 142 156 172 185 199 222 239
2. Howrah 130 139 154 171 182 199 215 228
3. Darjeeling 130 142 153 170 184 196 215 232
4. Jalpaiguri 125 136 150 167 179 192 221 241
5. Asansol 138 151 171 195 211 231 256 277
6. Raniganj 132 140 156 169 180 195 214 228
TABLE 21.6Consumer Price Index Numbers for Industrial Workers of different
Centres in West Bengal( Base : 2001 = 100 )
(2) Figures are averages of monthly indices.
replaces the CPI-IW(1982=100) series with efffect from January 2006.
Note : (1) The CPI-IW(2001=100) series Source : Labour Bureau, Govt. of India
State Statistical Handbook 2014 185

0
100
200
300
2007 2008 2009 2010 2011 2012 2013 2014
1. Kolkata
2. Howrah
3. Darjeeling
4. Jalpaiguri
5. Asansol
6. Raniganj
Figure 6: Consumer Price Index Numbers for Industrial Workers of Different Centres in West Bengal (Base 2001=100)
Year
Inde
x
State Statistical Handbook 2014 186

Groups 2007 2008 2009 2010 2011 2012 2013 2014
(1) (2) (3) (4) (5) (6) (7) (8) (9)
Food 358 402 446 530 533 572 653 701
General 377 415 460 540 579 616 697 751
Note : (1) Figures for 1991 are converted from Base 1960-61 = 100
(2) Figures are averages of monthly indices
Source : Labour Bureau, Govt. of India
TABLE 21.7
Consumer Price Index Numbers for Agricultural Labourers,Centres in West Bengal( Base : 1986-87 = 100 )
State Statistical Handbook 2014 187

0
100
200
300
400
500
600
700
800
2007 2008 2009 2010 2011 2012 2013 2014
Food
General
Figure 7 : Consumer Price Index Numbers for Agricultural Labours in West Bengal (Base: 1986-87 = 100)
Year
Inde
x
State Statistical Handbook 2014 188

( ` in lakh )
Particulars 1990-91 2000-01 2010-11 2011-12 2012-13 2013-14
(1) (2) (3) (4) (5) (6) (7)I. Revenue Account :(a) Revenue Tax Revenue 317773 1015316 3708369 4352597 5403476 5900558 Other than tax Revenue 93151 436902 1018051 1522907 1426100 1387621
Total 410924 1452218 4726420 5875504 6829576 7288179(b) Expenditure : Civil Expenditure (i) Developmental (Social Services+Economic Services) 345637 1216999 3543359 4053289 4625451 5034524
(ii) Non-Developmental 167175 993346 2910457 3279348 3585637 4145203Total 512812 2210345 6453816 7332637 8211088 9179727
(c) Surplus (+)/ Deficit (-) (-)101888 (-)758127 (-) 1727396 (-)1457133 (-)1381512 (-)1891549
II. Capital Account :(a) Receipts (i) Permanent Debt* (6003) 40595 2061827 4282274 4471731 3998871 4654473 (ii) Other Debt (6004) 112680 153877 29588 44284 148933 72902
Total 153275 2215704 4311862 4516015 4147804 4727376(b) Disbursement : (i) Capital Expenditure outside the Revenue Account 36862 132280 222575 276375 454730 692694 (ii) Redemption of Permanent Debt (6003) 23041 1152934 2461954 2737098 2269652 2847323 (iii) Loans and Advances (6004) 23626 90798 54472 53331 63197 67024
Total 83529 1376012 2739001 3066804 2787579 3607041(c) Surplus (+)/ Deficit (-) (+) 69746 (+) 839692 (+) 1572861 (+) 1725586 (+) 1814956 (+) 1120335
III. Miscellaneous ( Net ) (+)43013 (-)78299 (+) 161480 (+)1637435 (+)1955925 (+) 20484909
IV. Cash Balance Position (a) Opening Balance (-)9327 (+)3596 (+) 10159 (+)16924 (-) 79149 (+) 40532 (b) Closing Balance (+)1544 (+)6862 (+) 16924 (-)79149 (+) 40532 (-) 2275 Net increase(+) or decrease(-) (+)10871 (+)3266 (+) 6765 (-)96073 (+) 119681 (-) 38257*Internal Debt of the State Government.
Government of West Bengal.
TABLE 22.0Budgetory Position ( Actual ) of the Government of West Bengal
Source : Annual Financial Statements of the
State Statistical Handbook 2014 189

(` in Lakh)
Sector 2004-05 2009-10 2010-11 2011-12 2012-13(P) 2013-14 (Q)
(2) (3) (4) (5) (6) (7) (8)1 Agriculture 3853049 7329484 8258387 9048057 10609517 126896582 Forestry & logging 234424 421049 439156 633195 656685 9051643 Fishing 660547 1183406 1287410 1448131 1670652 20967594 Mining & quarrying 235168 236866 192917 606635 644401 693682
A. Sub Total of Primary 4983188 9170805 10177870 11736018 13581255 163852635 Manufacturing 1774449 3049511 3571970 3642717 3817305 4266157
5.1 Manu-Registered 864897 1452072 1765074 1647639 1668974 17457575.2 Manu-Unregistered 909552 1597439 1806896 1995078 2148331 2520400
6 Construction 1427273 2309267 2762621 2948999 3026981 32489117 Electricity,gas and Water supply 234965 415845 460308 511713 593648 847193
B. Sub Total of Secondary 3436687 5774623 6794899 7103429 7437934 83622618 Transport,storage & communication 1662070 2737604 3162530 3723756 4020592 4660490
8.1 Railways 239300 531515 528492 614666 699060 7766558.2 Transport by other means & Storage 1148278 1772259 2225401 2683393 2841076 33389898.3 Communication 274492 433830 408637 425697 480456 544846
9 Trade,hotels and restaurants 3220448 6211629 7612634 8290724 9287321 1037115210 Banking & Insurance 1277501 2176163 2595120 3349497 3768173 418644011 Real estate,ownership of dwellings
and business services 1362438 3167806 3467896 4100756 5034898 6042781
12 Public administration 927202 2010361 2072065 2279748 2473293 278341813 Other services 2133354 5002683 6240117 7453656 9166654 11377682
C. Sub Total of Tertiary 10583013 21306246 25150362 29198137 33750931 3942196314 Total 19002888 36251674 42123131 48037584 54770120 6416948715 State Per Capita Income (Rs.) 22649 41039 47245 53383 60318 70059
P=ProvisionalQ=Quick Estimates As on 1.03.2015
Sl. No.
Source : Bureau of Applied Economics & Statistics,Government of West Bengal.
Estimates of Net State Domestic Product of West Bengal by Industry of Origin at Current Prices( Base Year : 2004-05 )
TABLE 22.1
(1)
State Statistical Handbook 2014 190

(` in Lakh)
Sector 2004-2005 2009-10 2010-11 2011-12 2012-13(P) 2013-14(Q)
(2) (3) (4) (5) (6) (7) (8)1 Agriculture 3853049 4354913 4228835 4233007 4368769 44313952 Forestry & logging 234424 264313 256916 265968 276915 3401963 Fishing 660547 779830 760032 764720 773130 8104424 Mining & quarrying 235168 210218 218132 182465 183767 196613
A. Sub Total of Primary 4983188 5609274 5463915 5446160 5602581 57786465 Manufacturing 1774449 2353585 2594587 2391394 2383853 2621547
5.1 Manu-Registered 864897 1108058 1269850 1048135 1011095 10270085.2 Manu-Unregistered 909552 1245527 1324737 1343259 1372758 1594539
6 Construction 1427273 1702648 1806259 1724614 2161991 22296597 Electricity,gas and Water supply 234965 271188 288934 234759 267354 278062
B. Sub Total of Secondary 3436687 4327421 4689780 4350767 4813198 51292688 Transport,storage & communication 1662070 2516712 2755943 3110090 3154996 3328131
8.1 Railways 239300 405945 450614 517601 513116 5655568.2 Transport by other means 1148278 1245993 1400480 1590999 1590737 16541458.3 Communication 274492 864774 904849 1001490 1051143 1108430
9 Trade,hotels and restaurants 3220448 4653924 5310881 5063480 5495210 578350110 Banking & Insurance 1277501 2330259 2578590 3202768 3531841 4007227
11Real estate,ownership of dwellings and business services 1362438 2074991 2007228 2207343 2430315 2665052
12 Public administration 927202 1399892 1305531 1335507 1310393 133209713 Other services 2133354 3410514 3807227 4227051 4695257 5218594
C. Sub Total of Tertiary 10583013 16386292 17765400 19146239 20618012 2233460214 Total 19002888 26322987 27919095 28943166 31033791 3324251615 State Per Capita Income (Rs.) 22649 29799 31314 32164 34177 36293
P=ProvisionalQ=Quick Estimates as on 01.03.2015
Estimates of Net State Domestic Product of West Bengal by Industry of Origin at Constant PricesTABLE 22.2
( Base Year : 2004-05 )
Source : Bureau of Applied Economics & Statistics,Government of West Bengal.
(1)
Sl. No.
State Statistical Handbook 2014 191

(` in Lakh)
Industry 2004-05 2009-10 2010-11 2011-12 2012-13(P) 2013-14(Q)
(2) (3) (4) (5) (6) (7) (8)1 Agriculture 4002017 7624138 8625434 9446215 11088402 132624352 Forestry 237530 426514 444452 639582 663595 9146893 Fishery 754005 1392680 1509551 1720950 1971363 24741684 Mining & quarrying 284921 308251 240541 755760 832304 895955
A. Sub-Total : Primary Sector 5278473 9751583 10819978 12562507 14555664 175472475 Manufacturing 2326158 4115393 4634805 4867283 5249741 5804235
5.1 Manu-Registered 1275643 2269891 2558090 2574332 2788941 29172495.2 Manu-Unregistered 1050515 1845502 2076715 2292951 2460800 2886986
6 Construction 1493996 2431780 2903357 3111584 3211014 34464377 Electricity,gas and Water supply 414370 746760 828076 1009511 1154367 1647393
B. Sub Total of Secondary 4234524 7293933 8366238 8988378 9615122 108980658 Transport,storage & communication 1858294 3094702 3561344 4242066 4621337 5345296
8.1 Railways 307088 648704 686719 816721 924012 10265778.2 Transport by other means & Storage 1223008 1902952 2357053 2852383 3048549 35829958.3 Communication 328198 543046 517572 572962 648776 735724
9 Trade,hotels and restaurants 3273915 6337985 7774500 8498352 9541111 1065455910 Banking & Insurance 1300304 2210891 2633190 3395669 3820359 424441911 Real estate,ownership of dwellings
and business services 1570769 3622234 4006989 4707281 5737116 6885569
12 Public administration 1147854 2386114 2466788 2712355 2952203 330425613 Other services 2201503 5190596 6466867 7724966 9488141 11776713
C. Sub Total of Tertiary 11352639 22842522 26909678 31280689 36160267 4221081214 Total 20865636 39888038 46095894 52831574 60331053 70656124
P=ProvisionalQ=Quick Estimates as on 01.03.2015
Sl. No.
Source : Bureau of Applied Economics & Statistics,Government of West Bengal.
Estimates of Gross State Domestic Product of West Bengal by Industry of Origin at Current PricesTABLE 22.3
( Base Year : 2004-05 )
(1)
State Statistical Handbook 2014 192

(` in Lakh)
Industry 2004-05 2009-10 2010-11 2011-12 2012-13(P) 2013-14(Q)
(2) (3) (4) (5) (6) (7) (8)1 Agriculture 4002017 4565890 4470212 4479178 4642724 47092772 Forestry & logging 237530 268096 260255 269695 280601 3447243 Fishing 754005 947462 929856 957116 972744 10196894 Mining & quarrying 284921 266835 253659 287317 308987 330587
A. Sub Total of Primary 5278473 6048283 5913982 5993306 6205056 64042775 Manufacturing 2326158 3242074 3447911 3336228 3449397 3736959
5.1 Manu-Registered 1275643 1793112 1911360 1769123 1849658 18787685.2 Manu-Unregistered 1050515 1448962 1536551 1567105 1599739 1858191
6 Construction 1493996 1804375 1918634 1849270 2297526 23694367 Electricity,gas and Water supply 414370 530593 563803 588207 647536 673470
B. Sub Total of Secondary 4234524 5577042 5930348 5773705 6394459 67798658 Transport,storage & communication 1858294 2809086 3065403 3495732 3584735 3786633
8.1 Railways 307088 501839 572350 663782 668845 7372018.2 Transport by other means & Storage 1223008 1355768 1507390 1723230 1746769 18165948.3 Communication 328198 951479 985663 1108720 1169121 1232838
9 Trade,hotels and restaurants 3273915 4751684 5429283 5205976 5658897 595577510 Banking & Insurance 1300304 2359006 2608818 3238011 3570200 405074911 Real estate,ownership of dwellings
and business services 1570769 2405569 2372701 2589887 2843440 3118079
12 Public administration 1147854 1683777 1582676 1621172 1603440 161890013 Other services 2201503 3561049 3980494 4423909 4917156 5465226
C. Sub Total of Tertiary 11352639 17570171 19039375 20574687 22177868 2399536214 Total 20865636 29195496 30883705 32341698 34777383 37179504
as on 01.03.2015Q=Quick Estimates
Sl. No.
Source : Bureau of Applied Economics & Statistics,Government of West Bengal.
Estimates of Gross State Domestic Product of West Bengal by Industry of Origin at Constant PricesTABLE 22.4
( Base Year : 2004-05 )
(1)
P=Provisional
State Statistical Handbook 2014 193

(` in Lakh)
Registerd Unregistered
(1) (2) (3) (4) (5) (6) (7) (8) (8)Burdwan 945369 34476 170467 821784 671421 153834 293449 164961Birbhum 489192 27335 82124 1579 7158 67368 105891 40824Bankura 525923 27237 76041 777 70990 70864 95694 39764Purba Midnapore 734164 37535 340764 272 595062 94042 140576 48232Paschim Midnapore 1004011 57256 67141 164 100519 135722 144436 43257Howrah 282438 23098 53007 50 412517 234693 150779 51027Hooghly 671309 32883 103878 153 221023 179984 197261 9042924-Parganas(N) 703743 46006 279646 141 336456 307934 442795 18811924-Parganas(S) 678346 77331 292117 176 303944 177977 271925 60954Kolkata 17778 0 0 71 43250 112314 325573 117610Nadia 935024 41529 110366 24 16703 175249 158805 39978Murshidabad 1070401 46079 99309 204 21775 302672 295119 62173Uttar Dinajpur 409921 22571 44263 17 3579 43877 63380 12753Dakshin Dinajpur 278085 13297 68273 9 6860 30290 32420 7003Malda 586488 34552 72685 148 1491 162377 143323 34427Jalpaiguri 640520 55896 25933 270 65024 96399 163077 35813Darjeeling 292077 32027 2100 531 36091 22894 119804 36419Cooch Behar 534159 26937 27542 16 8053 38963 68224 12403Purulia 324471 27543 55707 619 60849 54759 72469 40364West Bengal 11123419 663588 1971363 827005 2982765 2462212 3285000 1126510
Q : Quick Estimates as on 01.03.2015
Electricity, Gas And
Water Supply
Source : Bureau of Applied Economics & Statistics,Government of West Bengal.
Table 22.5Estimates of Gross District Domestic Product of West Bengal by Industry of Origin at Current Prices
Year : 2012-13(Q)
District Agriculture Forestry Fishery Mining Manufacturing
Construction
State Statistical Handbook 2014 194

(` in Lakh)
(1) (9) (10) (11) (12) (13) (14) (15) (16) (17)Burdwan 111914 293725 15372 49612 1339767 334860 397576 227074 755199Birbhum 16564 34818 2368 9811 209226 139471 130130 74553 314869Bankura 11300 65040 4305 9095 362575 125974 138940 109139 318182Midnapore East 72774 197611 14365 16401 1329618 153611 201304 99256 562198Midnapore West 65262 125694 6249 14716 532173 215313 220067 174550 504180Howrah 114705 145810 8712 46731 824493 196031 377963 132697 532503Hooghly 81903 208477 8995 52093 684823 219169 388433 117067 64072124-Parganas(N) 136742 670215 9320 153538 1037765 408773 981250 272611 147247024-Parganas(S) 33619 367300 10379 52672 823333 228810 461583 183695 775815Kolkata 65366 519562 4026 125624 300222 831688 872387 810516 978987Nadia 32937 88438 4371 22880 434839 158753 268309 119412 506418Murshidabad 20913 94707 5305 17944 519144 190889 251801 115788 396469Uttar Dinajpur 3638 66368 1715 7035 158720 66201 99144 52059 183743Dakshin Dinajpur 322 28298 993 4833 114502 51418 68568 36599 162961Malda 21942 67331 2750 8616 288081 108621 134622 61749 291845Jalpaiguri 45602 54160 3483 22326 311111 114405 320964 97319 332538Darjeeling 20017 331060 1557 22525 145675 107335 216450 119404 270149Cooch Behar 6611 38136 1759 7287 167820 86125 109518 63411 198049Purulia 61881 46199 2257 5037 191205 82912 99555 87020 218986West Bengal 924012 3442949 108281 648776 9775092 3820359 5738564 2953919 9416282Q: Quick Estimates as on 01.03.2015 Source : Bureau of Applied Economics & Statistics,Government of West Bengal.
Table 22.5 (Contd.)Estimates of Gross District Domestic Product of West Bengal by Industry of Origin at Current Prices.
Year : 2012-13(Q)
District
Transport, Storage And CommunicationTrade Hotels
& Restaurants
Banking &
Insurance
Real Estate ownership of
Dwellings And
Business Service
Public Administration
Other ServicesRailways
Transport by
other means.storage comunications
State Statistical Handbook 2014 195

(` in Lakh)
Registered Un-Registered
(1) (2) (3) (4) (5) (6) (7) (8) (9)Burdwan 375417 15034 69101 308627 439729 99896 162048 94867Birbhum 201367 11416 33246 1225 4688 43747 58413 23478Bankura 221391 13537 30766 475 46492 46017 52822 22868Purba Midnapore 250844 15401 190993 162 389718 61068 77622 27738Paschim Midnapore 370506 24878 27173 133 65832 88135 79739 24876Howrah 94067 9149 21836 41 270165 152404 83562 29345Hooghly 316022 13296 42142 124 144752 116877 109076 5200524-Parganas(N) 296898 18241 189159 115 220351 199964 244915 10818524-Parganas(S) 267332 36306 163295 84 199059 115573 150094 35054Kolkata 1583 0 0 58 28325 72933 179508 67636Nadia 414472 16568 44773 20 10939 113802 87850 22991Murshidabad 494531 19382 40274 165 14260 196548 162513 35755Uttar Dinajpur 172485 9332 17909 13 2344 28492 35097 7334Dakshin Dinajpur 120541 5456 27634 7 4493 19670 17992 4027Malda 269439 13898 29418 120 977 105443 78951 19799Jalpaiguri 269985 23050 10493 219 42585 62599 89910 20595Darjeeling 128870 13025 850 431 23637 14867 65943 20944Cooch Behar 252720 10564 11143 12 5274 25302 37778 7133Purulia 133827 12065 22539 502 39851 35559 40008 23213West Bengal 4652297 280598 972744 312533 1953471 1598896 1813841 647843Q : Quick Estimates as on 01.03.2015
Electricity,Gas &
Water Supply
Table 22.6Estimates of Gross District Domestic Product of West Bengal by Industry of Origin at Constant (2004-05) Prices
Year : 2012-13(Q)
District Agriculture Forestry FisheryMining
& Quarrying
ManufacturingConstruction
State Statistical Handbook 2014 196

(` in Lakh)
(1) (10) (11) (12) (13) (14) (15) (16) (17) (18)Burdwan 81008 156069 12235 90760 744287 312933 194808 123370 390918Birbhum 11990 18932 1848 17635 108196 130339 62109 40464 162969Bankura 8180 34544 3521 16566 203941 117725 66743 59249 164669Purba Midnapore 52677 106329 11609 29600 783256 143553 97280 53946 290987Paschim Midnapore 47240 67311 4888 26555 283976 201214 105231 94794 260958Howrah 83029 82753 7294 82268 493490 183195 189377 72098 275658Hooghly 59286 114854 7845 93486 400615 204818 192700 63578 33166824-Parganas(N) 98981 406532 7738 279431 613510 382007 493912 148179 76244724-Parganas(S) 24335 197258 8904 93420 474912 213828 227556 99805 401560Kolkata 47315 299837 3932 222815 177783 777226 449344 440417 506763Nadia 23842 47935 3379 42185 233472 148358 129923 64822 262168Murshidabad 15138 51374 4175 32842 287865 178390 119574 62874 205224Uttar Dinajpur 2633 35098 1308 12964 80989 61866 46841 28257 95121Dakshin Dinajpur 233 14529 676 8871 58613 48051 32499 19865 84362Malda 15883 36240 2106 15779 158852 101508 63796 33511 151066Jalpaiguri 33009 30946 2788 40805 166671 106914 161014 52817 172141Darjeeling 14489 178016 1250 40873 78984 100307 110009 64811 139876Cooch Behar 4785 20430 1335 13278 87649 80486 52139 34429 102519Purulia 44792 25018 1823 8988 103965 77482 47804 47235 113301
West Bengal 668845 1924005 88654 1169121 5541026 3570200 2842659 1604521 4874375Q: QuickAs on 01.03.2015
Source : Bureau of Applied Economics & Statistics,Government of West Bengal.
Table 22.6 (Contd.)Estimates of Gross District Domestic Product of West Bengal by Industry of Origin at Constant (2004-05) Prices
Year : 2012-13(Q)
District
Transport, Storage And CommunicationTrade Hotels
& Restaurants
Banking &
Insurance
Real Estate ownership of
Dwellings And Business Service
Public Administration
Other ServicesRailways
Transport by
other means.storage communications
State Statistical Handbook 2014 197

(` in Crore)
West Bengal India
(1) (2) (3)2006-07 6238.93 36761.24
2007-08 490.64 (-) 10437.95
2008-09 1133.10 (-) 8539.69
2009-10 8985.38 37915.20
2010-11 8409.45 36118.77
2011-12 (-) 987.22 (-) 13339.68
2012-13 55.23 (-)2650.56
2013-14 2399.22 15476.85* Post Office Savings only
(2) National Savings Commision, Govt. of India, Nagpur (3) Ministry of Finance, Deptt. Of Economic Affairs, Govt. of India
TABLE 22.7Net Collection from Small Savings in West Bengal and India
YearNet Collection *
Source: (1) Directorate of Small Savings, West Bengal
State Statistical Handbook 2014 198

(Rs.in Crore)Outlay Total Percentage
10th Plan Expenditure* to Total(2002-2007) (2002-2007) Expenditure
(2) (3) (4)I. Agriculture and Allied
Activities 72739.62 50660.07 2.31II. Rural Development 361962.13 193155.35 8.81
III. Special Areas Progr-amme 106974.01 145420.56 6.63
IV Irrigation and Flood Control 189865.79 97033.09 4.43
V. Energy 785831.98 615231.40 28.07VI. Industry and Minerals 154150.65 118408.43 5.40
VII. Transport 238072.66 173115.68 7.90VIII. Science, Technology
and Environment 25789.32 9165.83 0.42IX General Economic
Services 25867.91 15157.74 0.69X. Social Services 810873.93 724688.38 33.06
XI. General Services 91972.00 49901.60 2.28Grand Total 2864100.00 2191938.13 100.00
Source :Finance (Budget) Department,
(1)
TABLE 23.0
Outlay and Expenditure under the 10th Five-Year Plan (2002-2007) by Major Heads of Development in West Bengal
Major Heads of Development
Government of West Bengal.* Including both Normal Plan and Supplement Plan
State Statistical Handbook 2014 199
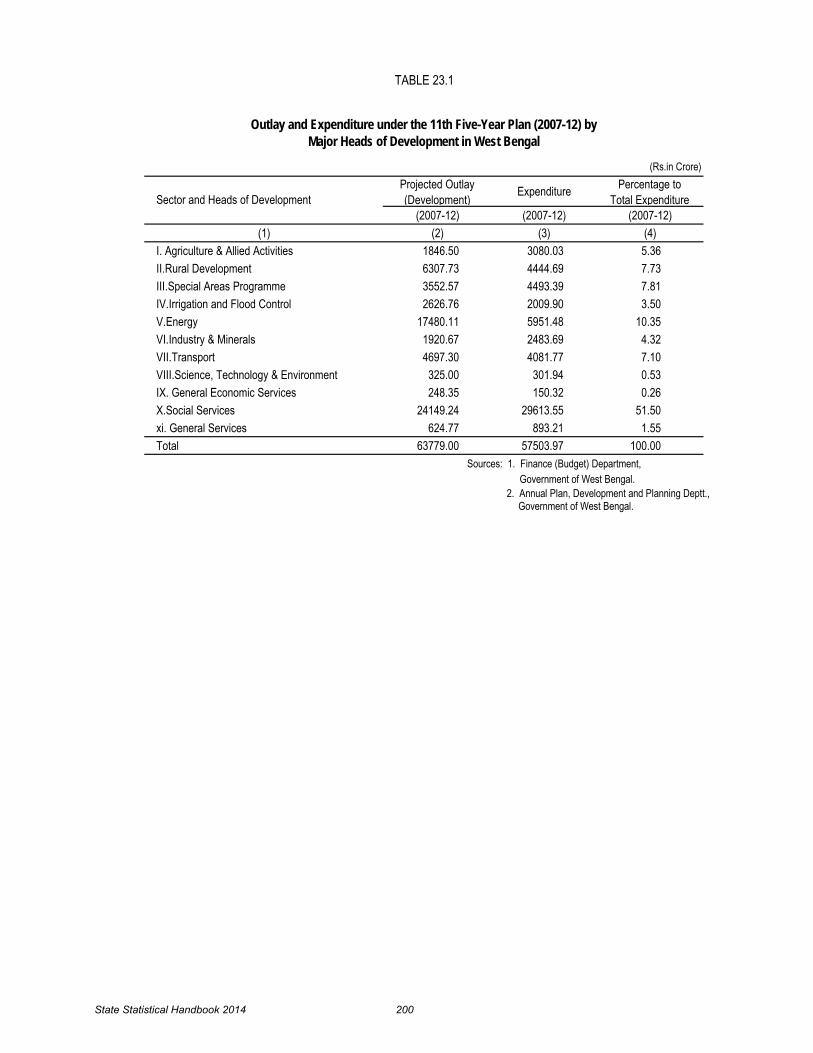
(Rs.in Crore)Projected Outlay (Development) Expenditure Percentage to
Total Expenditure(2007-12) (2007-12) (2007-12)
(1) (2) (3) (4)I. Agriculture & Allied Activities 1846.50 3080.03 5.36II.Rural Development 6307.73 4444.69 7.73III.Special Areas Programme 3552.57 4493.39 7.81IV.Irrigation and Flood Control 2626.76 2009.90 3.50V.Energy 17480.11 5951.48 10.35VI.Industry & Minerals 1920.67 2483.69 4.32VII.Transport 4697.30 4081.77 7.10VIII.Science, Technology & Environment 325.00 301.94 0.53IX. General Economic Services 248.35 150.32 0.26X.Social Services 24149.24 29613.55 51.50xi. General Services 624.77 893.21 1.55Total 63779.00 57503.97 100.00
2. Annual Plan, Development and Planning Deptt., Government of West Bengal.
TABLE 23.1
Outlay and Expenditure under the 11th Five-Year Plan (2007-12) by Major Heads of Development in West Bengal
Sector and Heads of Development
Sources: 1. Finance (Budget) Department, Government of West Bengal.
State Statistical Handbook 2014 200

(Rs.in crore)
ProjectedOutlay-11th Plan 2007-08 2008-09 2009-10 2010-11 2011-12
( 2007 - 12 ) ( Actual ) ( Actual ) ( Actual ) (Actual) (Actual)(1) (2) (3) (3) (4) (5) (6)
Economic Services( I-IX) 39004.99 5247.64 5214.63 5983.25 4808.79 5705.01 Agriculture & Allied Activities 1846.50 393.84 561.46 647.23 746.75 730.75
Crop Husbandry 477.14 178.55 141.59 348.02 284.36 285.65Soil & Water Conservation 30.16 0.88 10.40 1.20 10.07 6.43Animal Husbandry 220.87 58.53 30.19 25.77 79.30 67.00Dairy Development 67.92 1.97 2.04 4.12 2.72 10.96Fisheries 271.78 47.07 60.34 87.40 105.72 116.39Forestry & Wild Life 220.00 29.42 52.38 61.96 86.76 66.78Food, Storage & Warehousing 20.72 21.28 12.82 6.63 6.56 10.34Agricultural Research & Education 39.77 7.06 7.26 6.41 5.96 5.69Agricultural Financial Institutions 74.00 19.93 30.58 - 0.00 0.00Co-operation 205.14 23.48 43.39 56.54 92.10 56.80Others 219.00 5.67 170.47 49.18 73.20 104.71
II Rural Development 6307.73 748.75 602.12 984.47 1071.40 1037.95Special Programmes for Rural Development
145.15 5.67 11.81 59.92 12.73 11.15
Rural Employment 1222.99 222.17 156.28 390.10 445.93 420.93Land Reforms 165.35 17.07 18.35 16.67 6.52 2.02Other Rural Development Programmes
4774.24 503.84 415.68 517.78 606.22 603.85
III Special Areas Programme 3552.57 726.99 667.42 908.01 914.40 1276.57
IV Irrigation and Flood Control 2626.76 319.28 405.64 504.47 307.34 473.17Major and Medium Irrigation 450.00 111.83 118.22 75.00 38.33 58.05Minor Irrigation 552.90 65.23 132.42 116.34 75.20 55.45Command Area Development Programme
731.55 5.63 13.23 12.54 11.89 15.52
Flood Control 892.31 136.59 141.77 300.59 181.92 344.15
V Energy 17480.11 1853.05 1594.33 1483.11 398.24 622.64Power 17422.12 1843.93 1584.12 1471.73 391.32 612.01Non Conventional Sources of Energy 57.99 9.12 10.21 11.38 6.92 10.63
VI Industry & Minerals 1920.67 539.01 581.39 386.79 473.43 503.07Villages & Small Industries 527.10 60.97 100.08 99.57 143.81 209.69Industries(other than Village & Small Industries) 1384.57 477.92 481.17 287.17 329.42 291.39Mining 9.00 0.12 0.14 0.05 0.20 1.99
TABLE 23.2Outlay and Expenditure under the 11th Five-Year Plan( 2007-12 ) by Major Heads of Development in West Bengal
ExpenditureDifferent Heads
I
State Statistical Handbook 2014 201

(Rs.in Crore)
Projected
Different Heads Outlay-11th Plan 2007-08 2008-09 2009-10 2010-11 2011-12
( 2007 - 12 ) ( Actual ) ( Actual ) ( Actual ) (Actual) (Actual)(1) (2) (3) (3) (4) (5) (6)
VII Transport 4697.30 611.90 702.12 946.24 840.21 981.30
Roads & Bridges 3940.45 485.14 501.73 690.79 663.36 813.50
Road Transport 700.00 117.85 84.07 142.84 114.30 84.30
Inland Water Transport 30.00 6.10 5.36 5.00 5.29 6.82
Other Transport 26.85 2.81 110.96 107.61 57.26 76.68
VIII Science,Technology & Environment 325.00 54.82 69.02 95.24 40.29 42.57
IX General Economic Services 248.35 37.78 31.13 27.69 16.73 36.99
Secretariat Economic Services 15.60 1.13 1.18 0.68 0.69 0.64
Tourism 110.50 10.65 23.68 21.64 11.57 29.85
Surveys & Statistics 1.25 0.14 0.11 0.17 0.05 0.00
District Planning 78.50 20.19 0.29 0.16 0.73 2.68
Other General Economic Services 42.50 5.67 5.87 5.04 3.69 3.82
X Social Services 24149.24 3671.42 4989.82 4856.40 6886.64 8196.25
General Education 3713.87 832.02 835.55 75.00 1515.87 1671.88
Technical Education 614.45 89.62 129.18 186.63 158.69 157.53
Sports & Youth Services 212.65 28.16 43.44 40.46 31.37 63.12
Art & Culture 117.10 20.76 24.83 22.31 7.58 7.73
Medical & Public Health(incl.ESI,Family Welfare) 3883.00 324.14 432.55 562.56 478.22 769.39
Water Supply & Sanitation 2038.09 271.44 415.99 391.58 303.44 468.89
Housing(including Police Housing) 810.70 105.54 159.60 320.44 325.46 335.71
Urban Development(incl.State Capital Projects) 6346.01 1168.77 1789.81 1580.90 1887.42 2096.50
Information & Publicity 20.14 3.46 3.64 3.76 1.89 3.10
Welfare of SC,ST & OBC 656.71 129.17 173.37 220.17 247.47 264.51
Labour & Employment 243.34 10.65 26.49 47.86 51.91 55.92
Social Security & Welfare 2980.52 517.54 741.72 966.56 729.85 957.27
Nutrition 1436.19 124.61 154.05 337.83 558.78 610.31
Other Social Services 1076.47 45.54 59.60 100.34 588.69 734.39
XI General Services 624.77 116.06 192.42 234.37 180.49 173.24GRAND TOTAL (Total of I-XI) 63779.00 9035.12 10396.87 11074.02 11875.92 14074.50
86659.00 87506.00 88335.00 89158.00 91348.00
1042.61 1188.13 1253.64 1332.01 1540.76Sources: 1) Finance(Budget) Deptt.
Government of West Bengal 2) Annual Plan, Development & planning Department,
Government of West Bengal.
TABLE 23.2-Contd.Outlay and Expenditure under the 11th Five-Year Plan( 2007-12 ) by Major Heads of Development in West Bengal
Expenditure
Mid-Year Population(In thousand)
Per Capita Plan Expenditure(In Rs.)
State Statistical Handbook 2014 202
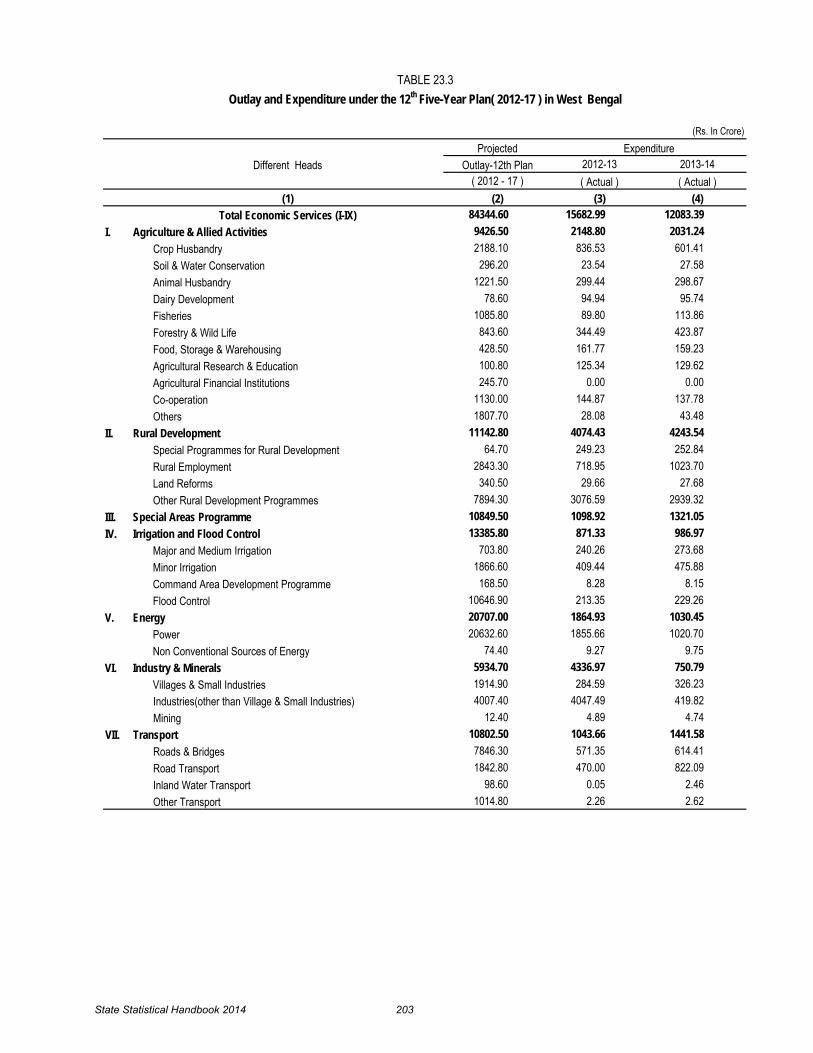
(Rs. In Crore)Projected
Different Heads Outlay-12th Plan 2012-13 2013-14( 2012 - 17 ) ( Actual ) ( Actual )
(1) (2) (3) (4)Total Economic Services (I-IX) 84344.60 15682.99 12083.39
I. Agriculture & Allied Activities 9426.50 2148.80 2031.24Crop Husbandry 2188.10 836.53 601.41Soil & Water Conservation 296.20 23.54 27.58Animal Husbandry 1221.50 299.44 298.67Dairy Development 78.60 94.94 95.74Fisheries 1085.80 89.80 113.86Forestry & Wild Life 843.60 344.49 423.87Food, Storage & Warehousing 428.50 161.77 159.23Agricultural Research & Education 100.80 125.34 129.62Agricultural Financial Institutions 245.70 0.00 0.00Co-operation 1130.00 144.87 137.78Others 1807.70 28.08 43.48
II. Rural Development 11142.80 4074.43 4243.54Special Programmes for Rural Development 64.70 249.23 252.84Rural Employment 2843.30 718.95 1023.70Land Reforms 340.50 29.66 27.68Other Rural Development Programmes 7894.30 3076.59 2939.32
III. Special Areas Programme 10849.50 1098.92 1321.05IV. Irrigation and Flood Control 13385.80 871.33 986.97
Major and Medium Irrigation 703.80 240.26 273.68Minor Irrigation 1866.60 409.44 475.88Command Area Development Programme 168.50 8.28 8.15Flood Control 10646.90 213.35 229.26
V. Energy 20707.00 1864.93 1030.45Power 20632.60 1855.66 1020.70Non Conventional Sources of Energy 74.40 9.27 9.75
VI. Industry & Minerals 5934.70 4336.97 750.79Villages & Small Industries 1914.90 284.59 326.23Industries(other than Village & Small Industries) 4007.40 4047.49 419.82Mining 12.40 4.89 4.74
VII. Transport 10802.50 1043.66 1441.58Roads & Bridges 7846.30 571.35 614.41Road Transport 1842.80 470.00 822.09Inland Water Transport 98.60 0.05 2.46Other Transport 1014.80 2.26 2.62
TABLE 23.3Outlay and Expenditure under the 12th Five-Year Plan( 2012-17 ) in West Bengal
Expenditure
State Statistical Handbook 2014 203

ProjectedDifferent Heads Outlay-12th Plan 2012-13 2013-14
( 2012 - 17 ) ( Actual ) ( Actual )(1) (2) (3) (4)
VIII. Science, Technology & Environment 1016.20 30.44 29.80IX. General Economic Services 1079.60 213.51 247.97
Secretariat Economic Services 35.10 82.95 83.57Tourism 575.70 28.81 40.70Surveys & Statistics 314.40 43.00 57.13District Planning 7.00 0.00 0.00Other General Economic Services 147.40 58.75 66.57
X. Social Services 78442.40 34112.54 38261.85General Education 17200.30 16274.06 17214.14Technical Education 3262.00 342.84 397.83Sports & Youth Services 1370.00 315.64 419.80Art & Culture 521.30 56.36 65.27Medical & Public Health(incl. ESI, Family Welfare) 6925.80 3809.86 4276.42Water Supply & Sanitation 5183.00 777.82 1051.29Housing (including Police Housing) 5534.40 266.64 208.36Urban Development(incl. State Capital Projects) 20425.40 3711.39 4137.75Information & Publicity 244.60 73.82 67.59Welfare of SC, ST & OBC 2460.60 828.72 828.29Labour & Employment 897.60 193.09 140.44Social Security & Welfare 670.20 6092.69 7853.29Nutrition 4851.90 733.41 856.87Other Social Services 8895.30 636.20 744.51
XI. General Services 3257.40 35325.09 40833.88G R A N D T O T A L (I-XI) 166044.40 85120.62 91179.12
Mid-year Population( In thousand ) 86659 87506Per Capita Plan Expenditure ( In Rs. ) 978.4 1036.13
Sources: 1) Finance(Budget) Deptt. Government of West Bengal 2) Annual Plan, Development & planning Department, Government of West Bengal.
Outlay and Expenditure under the12th Five-Year Plan ( 2007-12 ) in West Bengal
Expenditure
TABLE 23.3
State Statistical Handbook 2014 204

State Plan Per Capita Plan Index of Per CapitaExpenditure Population Expenditure Plan Expenditure
(Rs. in Crore) (Thousand) ( Rs. ) (Base: 1970-71=100)(Rs. 12.41)
(1) (2) (3) (4)=Col(2)*10000/Col(3) (5)
2007-08 9073.09 86659 1046.99 8436.66
2008-09 10396.87 87506 1188.13 9573.97
2009-10 12121.54 88335 1372.22 11057.37
2010-11 11837.85 89158 1327.74 10698.95
2011-12 14074.52 89987* 1564.06 12603.22
2012-13 18994.11 90802* 2091.82 16855.92
2013-14 24207.10 91594* 2642.87 21296.29* Mid Year Population is based on 2001 Census Data
TABLE 23.4Movement in ( Per Capita ) Plan Expenditure in West Bengal
Year
Source: Finance Department,Govt.of West Bengal.
State Statistical Handbook 2014 205

District Important tourist spots RouteDistance from Kolkata
(Km)Location of Lodges
*W.B. Tourism
Development
Corporation
W.B.Youth
Services
W.B.Forest
Development
Corporation
W.B.Benfish DGHC
(1) (2) (3) (4) (5) (6) (7) (8) (9) (10)
South 24 Parganas Bakkhali via Namkhana 131 Bakkhali 36 – – – –
Fraserganj via Namkhana 129 Fraserganj – – – 50 –
Gangasagar via Namkhana 140 Gangasagar – 78 – – –
Diamond Harbour via Amtala 48 Diamond Harbour 60 – – 39 –
Sajnekhali via Basanti 130 Kakdwip 69 – – 18 –
Kakdwip via Diamond Harbour 96 Sunderban(Gosaba) 36 – – – –
Sunderban via Canning 102
TABLE 24.0
Districtwise Important Tourist Spots with Distance from Kolkata and Number of Beds in different types of Lodges Maintained by Different Govt. Departments
( 2013-14)
TOURIST SPOTS
Lodges maintained by different government Departments
No. of beds maintained by
State Statistical Handbook 2014 206
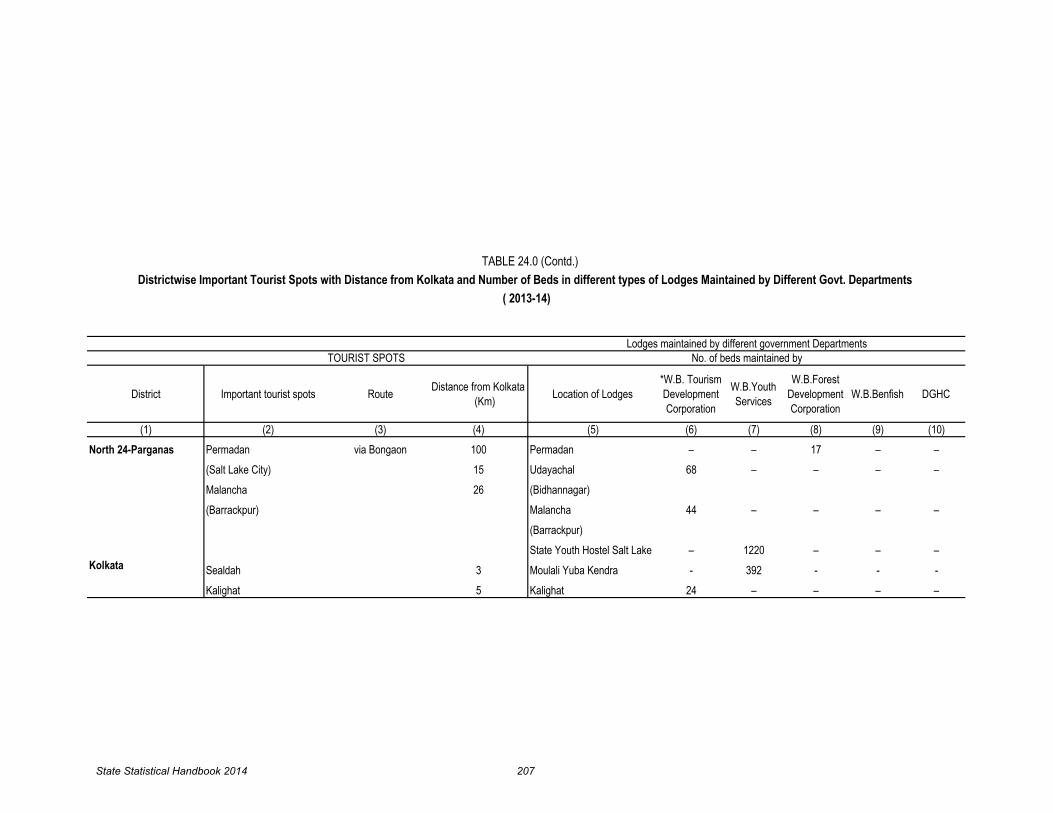
District Important tourist spots RouteDistance from Kolkata
(Km)Location of Lodges
*W.B. Tourism
Development
Corporation
W.B.Youth
Services
W.B.Forest
Development
Corporation
W.B.Benfish DGHC
(1) (2) (3) (4) (5) (6) (7) (8) (9) (10)
North 24-Parganas Permadan via Bongaon 100 Permadan – – 17 – –
(Salt Lake City) 15 Udayachal 68 – – – –
Malancha 26 (Bidhannagar)
(Barrackpur) Malancha 44 – – – –
(Barrackpur)
State Youth Hostel Salt Lake – 1220 – – –
Kolkata Sealdah 3 Moulali Yuba Kendra - 392 - - -
Kalighat 5 Kalighat 24 – – – –
TABLE 24.0 (Contd.)
Districtwise Important Tourist Spots with Distance from Kolkata and Number of Beds in different types of Lodges Maintained by Different Govt. Departments
( 2013-14)
Lodges maintained by different government Departments
TOURIST SPOTS No. of beds maintained by
State Statistical Handbook 2014 207

District Important tourist spots RouteDistance from Kolkata
(Km)
Location of
Lodges
*W.B. Tourism
Development
Corporation
W.B.Youth
Services
W.B.Forest
Development
Corporation
W.B.Benfish DGHC
(1) (2) (3) (4) (5) (6) (7) (8) (9) (10)
Midnapore Digha via Norghat 181 Digha 72 80 – 39 –
Sankarpur via Norghat 181
Digha 2nd
Tourist lodge
(Including Tent) 60 – – 16 –
Jhargram via Kharagpur .. Sankarpur – – – 45 –
Nayachar via Haldia Island 135 Jhargram – – 12 – –
Kankrajhore via Jhargram & Belpahari 225
Ranishiramani
Paryatak Abas 24 – – – –
Hatibari via Jhargram 216 Haldia – – – 22 –
Haldia via Kolkaghat ..
TABLE 24.0 (Contd.)
Districtwise Important Tourist Spots with Distance from Kolkata and Number of Beds in different types of Lodges Maintained by Different Govt. Departments
( 2013-14)
Lodges maintained by different government Departments
TOURIST SPOTS No. of beds maintained by
State Statistical Handbook 2014 208

District Important tourist spots RouteDistance from Kolkata
(Km)
Location of
Lodges
*W.B.
Tourism
Development
Corporation
W.B.Youth
Services
W.B.Forest
Development
Corporation
W.B.Benfish DGHC
(1) (2) (3) (4) (5) (6) (7) (8) (9) (10)
Howrah Gadiara via Bagnan or Nurpur Gadiara 68 – – – –
Howrah 4.7 Howrah – 24 – – –
Hooghly Tarakeswar via Sheoraphuli Tarakeswar 47 – – – –
Bankura Bankura via Bishnupur 173 Bankura – 38 – – –
Jairambati via Arambagh Mukutmonipur – 41 32 – –
Mukutmonipur via Kolaghat 255 Bishnupur 54 - – – –
Bishnupur via Arambagh 132 Susunia – 46 – - -
Susunia via Bankura 198
Burdwan Burdwan 117 Burdwan - 36 - - -
Durgapur via Burdwan .. Durgapur 52 - – – –
Maithon via Burdwan .. Maithon 22 – – – –
Churulia via Asansol 217 Churulia – 50 – – –
TABLE 24.0 (Contd.)
Districtwise Important Tourist Spots with Distance from Kolkata and Number of Beds in different types of Lodges Maintained by Different Govt. Departments
( 2013-14)
TOURIST SPOTS
Lodges maintained by different government Departments
No. of beds maintained by
State Statistical Handbook 2014 209
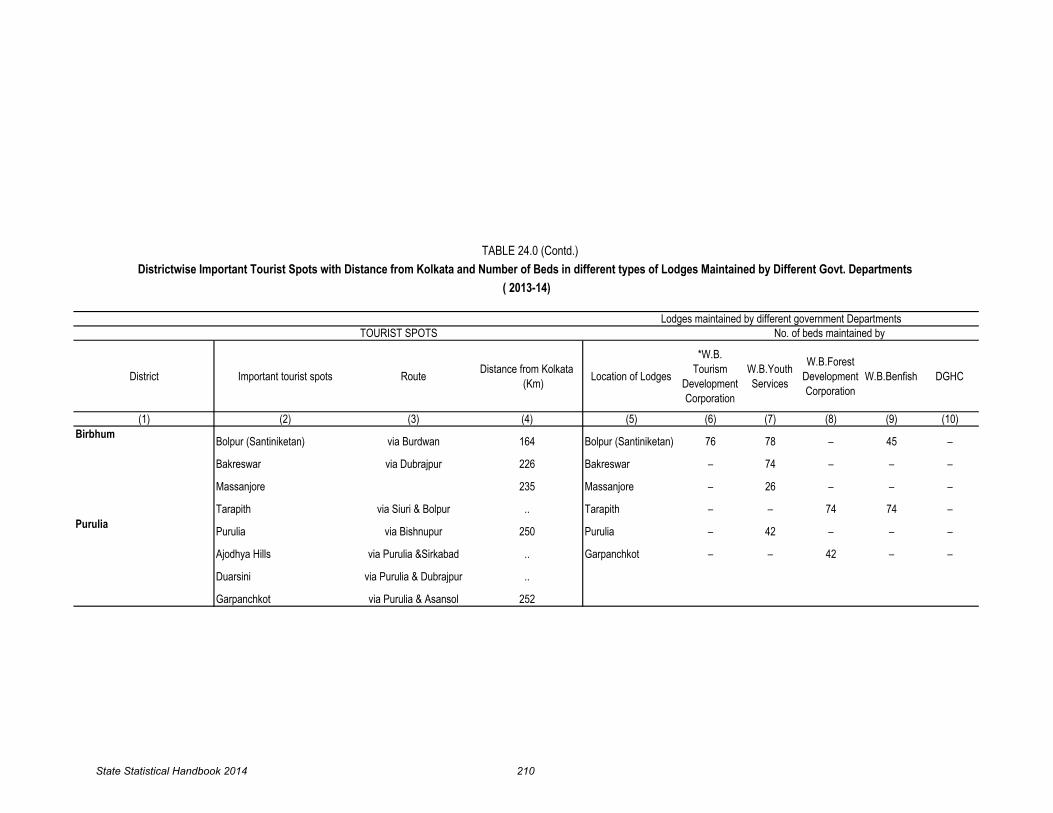
District Important tourist spots RouteDistance from Kolkata
(Km)Location of Lodges
*W.B.
Tourism
Development
Corporation
W.B.Youth
Services
W.B.Forest
Development
Corporation
W.B.Benfish DGHC
(1) (2) (3) (4) (5) (6) (7) (8) (9) (10)
BirbhumBolpur (Santiniketan) via Burdwan 164 Bolpur (Santiniketan) 76 78 – 45 –
Bakreswar via Dubrajpur 226 Bakreswar – 74 – – –
Massanjore 235 Massanjore – 26 – – –
Tarapith via Siuri & Bolpur .. Tarapith – – 74 74 –
PuruliaPurulia via Bishnupur 250 Purulia – 42 – – –
Ajodhya Hills via Purulia &Sirkabad .. Garpanchkot – – 42 – –
Duarsini via Purulia & Dubrajpur ..
Garpanchkot via Purulia & Asansol 252
TABLE 24.0 (Contd.)
Districtwise Important Tourist Spots with Distance from Kolkata and Number of Beds in different types of Lodges Maintained by Different Govt. Departments
( 2013-14)
No. of beds maintained by
Lodges maintained by different government Departments
TOURIST SPOTS
State Statistical Handbook 2014 210
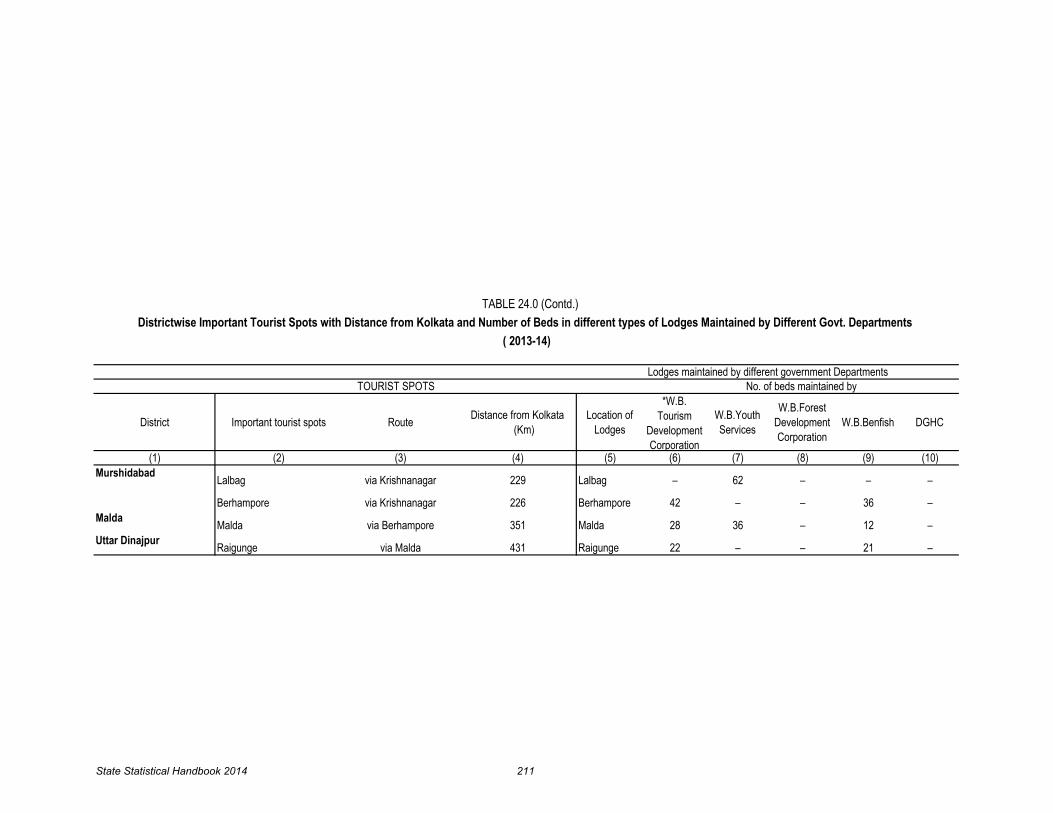
District Important tourist spots RouteDistance from Kolkata
(Km)
Location of
Lodges
*W.B.
Tourism
Development
Corporation
W.B.Youth
Services
W.B.Forest
Development
Corporation
W.B.Benfish DGHC
(1) (2) (3) (4) (5) (6) (7) (8) (9) (10)
MurshidabadLalbag via Krishnanagar 229 Lalbag – 62 – – –
Berhampore via Krishnanagar 226 Berhampore 42 – – 36 –
MaldaMalda via Berhampore 351 Malda 28 36 – 12 –
Uttar DinajpurRaigunge via Malda 431 Raigunge 22 – – 21 –
TABLE 24.0 (Contd.)
Districtwise Important Tourist Spots with Distance from Kolkata and Number of Beds in different types of Lodges Maintained by Different Govt. Departments
( 2013-14)
No. of beds maintained by
Lodges maintained by different government Departments
TOURIST SPOTS
State Statistical Handbook 2014 211

District Important tourist spots Route
Distance
from Kolkata
(Km)
Location of Lodges
*W.B.
Tourism
Development
Corporation
W.B.Youth
Services
W.B.Forest
Development
Corporation
W.B.Benfish DGHC
(1) (2) (3) (4) (5) (6) (7) (8) (9) (10)
Jalpaiguri Rajabhat Khawa - - 47 - -
Jalpaiguri via Siliguri 650 Jalpaiguri – – – – –
Murti Banani via Siliguri 724 Murti Banani – – 24 – –
Barodabry via Siliguri 813 Barodabry – – 22 – –
Malbazar via Siliguri 630 Malbazar 28 – – 16 –
Teesta Paryatack .. Teesta Paryatack 32 – – – –
Madarihat (Jaldapara) via Siliguri 685 Madarihat (Jaldapara) – 30 – 16 –
Jaldapara via Siliguri Jaldapara 48 30 – – –
Holong via Siliguri 702 Holong – – 8 – –
Jaldhaka(Jhalong) via Siliguri 776 Jaldhaka(Jhalong) – – 4 – 10
Garubathan via Silliguri 678 Garubathan – – 4 – –
Paren via Jaldhaka 789 Paren – – 8 – –
via Siliguri 692 Dhupjara 52 – 32 – –
Murti via Siliguri 746
Darjeeling Siliguri via Berhampur 589 Siliguri 96 40 – – –
Darjeeling via Siliguri .. Darjeeling 89 52 – 21 30
Kalimpong via Siliguri 674 Kalimpong 59 – 12 18 34
Jhalong & Jaldapara via Siliguri .. Jhalong & Jaldapara – – 18 – –
River Camp via Siliguri 776 River Camp – – 10 – –
TABLE 24.0 (Contd.)
Districtwise Important Tourist Spots with Distance from Kolkata and Number of Beds in different types of Lodges Maintained by Different Govt. Departments
( 2013-14)
TOURIST SPOTS No. of beds maintained by
Lodges maintained by different government Departments
State Statistical Handbook 2014 212

District Important tourist spots Route
Distance from
Kolkata
(Km)
Location of
Lodges
*W.B. Tourism
Development
Corporation
W.B.Youth
Services
W.B.Forest
Development
Corporation
W.B.Benfish DGHC
(1) (2) (3) (4) (5) (6) (7) (8) (9) (10)
Darjeeling Mongpoo via Siliguri 705 Mongpoo – – 8 – –
Lepchaghat via Siliguri 692 Lepchaghat – – 14 – –
Suntale Khola via Siliguri 758 Suntale Khola – – 20 – –
Mirik via Siliguri 664
Suntale Khola
River Camp – – 8 – –
Kurseong via Siliguri .. Mirik – – – – 46
Sandakphu via Siliguri 727 Kurseong 32 – – – 35
Phulut via Siliguri 748 Sandakphu – – – – 20
Lava via Siliguri 707 Phulut – – – – 8
Dabgram via Berhampore 585 Lava – – 56 – –
Lalegeon via Siliguri 731 Dabgram – 40 – – –
Sangalila Range .. Lalegeon – – 6 – 20
Sangalila Range – – – – 164
Coochbehar Coochbehar via New Jalpaiguri 737 Coochbehar – – – 28 –
Rashik Bill via Coochbehar 896 Rashik Bill – – 20 – –
Source:
Notes: 1) At present tourist lodges are being Run by Tourism Deptt., Government of West Bengal. All the tourist lodges are operated by WBTDC.
2)* operated by Management Contract.
TABLE 24.0 (Contd.)
Districtwise Important Tourist Spots with Distance from Kolkata and Number of Beds in different types of Lodges Maintained by Different Govt. Departments
( 2013-14)
Lodges maintained by different government Departments
1) Directorate of Youth Services,Govt. of West
Bengal.
2) West Bengal Forest Development Corpn. Ltd.
3) Benfish, Govt. of West Bengal.
4) Darjeeling Gorkha Hill Council.
No. of beds maintained byTOURIST SPOTS
State Statistical Handbook 2014 213

State Important tourist spots Route
Distance
from Kolkata
(Km)
Location of
Lodges
*W.B. Tourism
Development
Corporation
W.B.Youth
Services
W.B.Forest
Development
Corporation
W.B.Benfish DGHC
(1) (2) (3) (4) (5) (6) (7) (8) (9) (10)
Orrisa Puri via Kharagpur 518 Puri - - - 62 -
Bihar Rajgir via Bakirpur 498 Rajgir - - - 18 -
Notes: 1) At present tourist lodges are being Run by Tourism Deptt., Government of West Bengal. All the tourist lodges are operated by WBTDC. 2)* operated by Management Contract. Source: Benfish, Govt. of West Bengal.
TOURIST SPOTS No. of beds maintained by
TABLE 24.0(a)
Number of Beds in Different Types of Lodges Maintained by Different Govt. Departments of West Bengal in Other States of India
( 2013-14)
State Statistical Handbook 2014 214

Number
Sl. No. Country of Origin 2008 2009 2010 2011 2012 2013
(1) (2) (3) (4) (5) (6) (7) (8)
1 United Kingdom 45223 47080 47551 48026 49225 50210
2 U.S.A. 37437 38979 39370 39765 40709 41525
3 Sri Lanka 16635 17320 17493 17668 18110 18475
4 France 23182 24137 24378 24622 25262 25770
5 Germany 29497 30712 31020 31335 32113 32755
6 Japan 54101 56330 56893 57465 58870 60000
7 Italy 17080 17784 17962 18144 18595 19000
8 Malaysia 10122 10539 10644 10750 11020 11250
9 Saudi Arabia 3607 3756 3794 3834 3926 4000
10 Canada 21560 22448 22672 22896 23461 23950
11 Australia 23418 24383 24626 24866 25502 26010
12 Singapore 18354 19110 19301 19494 19982 20380
13 U.A.E. 3110 3238 3270 3303 3384 3450
14 Switzerland 6599 6870 6938 7006 7181 7332
15 Iran 1880 1957 1976 1995 2045 2100
16 Bangladesh 448056 466515 471180 475892 477930 487500
17 Nepal 4729 4924 4973 5023 5161 5265
18 Thailand 6392 6655 6721 6786 6965 7100
19 Burma 4262 4437 4481 4526 4638 4730
20 Sweden 1274 1326 1339 1352 1390 1420
21 China 2628 2736 2763 2790 2861 2920
22 Korea 3611 3759 3796 3832 3938 4020
23 Netherlands 1513 1575 1590 1604 1648 1680
24 Spain 2634 2742 2770 2800 2868 2925
25 Bhutan 3910 4071 4112 4153 4248 4330
26 Israel 571 594 600 606 623 635
27 Ireland 939 977 987 997 1080 1100
28 New Zealand 1179 1227 1240 1254 1290 1315
29 Russia 1839 1914 1933 1955 2015 2055
30 Others 338329 352323 355846 361507 362300 372000
Total 1133671 1180418 1192219 1206246 1218340 1245202
U.A.E. = United Arab Emirates. Source : Directorate of Tourism,
Government of West Bengal.
Countrywise Foreign Tourist Arrivals in West Bengal
TABLE 24.1
State Statistical Handbook 2014 215

Year Dailies Weeklies Fortnightlies Monthlies Quarterlies Others Annual Total
(1) (2) (4) (5) (6) (7) (8) (9) (10)
2007-08 201 835 827 1289 806 358 50 4375
2008-09 208 848 849 1329 820 369 53 4485
2009-10 213 862 877 1367 839 384 54 4605
2010-11 226 886 908 1418 854 391 59 4751
2011-12 233 904 924 1443 865 399 59 4836
2012-13 254 925 954 1485 878 414 59 4979
2013-14 273 942 972 1519 888 424 60 5089
Source : Registrar of Newspapers for India, Ministry of
( as per " Press in india " for the respective years )Information & Broadcasting, Government of India.
TABLE 25.0Number of Newspaper and Periodicals by types in West Bengal
Tri/Bi Weeklies
(3)
9
9
9
9
11
9
10
State Statistical Handbook 2014 216

Particulars Unit 2008 2009 2010 2011 2012 2013 2014
(1) (2) (3) (4) (5) (6) (7) (8) (9) (10)
1 (a) Radio Stations No. 7 7 7 7 7 11 * 11
(b) Population Covered Percent 99.0 99.0 99.0 99.0 99.0 99.0 99.0
(c) Area Covered Percent 99.0 99.0 99.0 99.0 99.0 99.0 99.0
2 T.V. Transmitting Centre No. 36 36 36 36 36 36 36
* Four 100 W FM Transmitters were commissioned in West Bengal during 2013 at Purulia,Medinipur, . Farakka and Krishnanagar
TABLE 25.1Number of Radio Stations and T.V. Transmitting Centres in West Bengal
Sources : 1.Doordarsan Kendra, Kolkata. 2. Audience Research unit,
All India Radio, Kolkata.
State Statistical Handbook 2014 217

Sl. No. Particulars 2001-02 2008-09 2009-10 2010-11 2011-12 2012-13 2013-14
(1) (2) (3) (4) (5) (6) (7) (8) (9)
1 Public Libraries 2468 2475 2482 2479 2479 2479 2479
2 Free reading Rooms 2468 2475 2482 2479 2479 2479 2479
3 Total Literacy Centres* - - - 962 87731 136382 168693
(i) Nodal Continuing Education Centre 2301 3135 - - - - -
(ii) Continuing Education Centre 18106 29403 - - - - -
4 Total no. of Centres Under Project for Residual Illiteracy - 69738 - - - - -
5 Total no. of Adult Education Centres - - - 1038 1346 1354 1360 Sources : 1) Directorate of Library Services, Govt. of West Bengal.
2 ) Directorate of Mass Education Extension, Govt.of West Bengal.
TABLE 25.2Libraries,Reading Rooms and Total Library Centres in West Bengal
( as on 31st March )
* Excluding KolkataNote: It may be noted that under the Literacy Programmem styled Saakshar Bharat which is now under implementation in 9 Districts, there are no Nodal Continuing Education center & Continuing Education Centre . Also , the project residual Literacy is not in vogue.
State Statistical Handbook 2014 218

(1) (2) (3) (4) (5) (6) (7) (8)
India 3287240 *1028737 532223 496514 933 325 21.54
Andhra Pradesh 275045 76210 38527 37683 978 277 14.59
Assam 78438 26656 13778 12878 935 340 18.92
Bihar 94163 82999 43244 39755 919 881 28.62
Gujarat 196024 50671 26386 24285 920 258 22.66
Haryana 44212 21145 11364 9781 861 478 28.43
Karnataka 191791 52851 26899 25952 965 276 17.51
Kerala 38863 31841 15468 16373 1058 819 9.43
Madhya Pradesh 308245 60348 31444 28904 919 196 24.26
Maharashtra 307713 96879 50401 46478 922 315 22.73
Orissa 155707 36805 18661 18144 972 236 16.25
Punjab 50362 24359 12985 11374 876 484 20.10
Rajasthan 342239 56507 29420 27087 921 165 28.41
Tamil Nadu 130058 62406 31401 31005 987 480 11.72
Uttar Pradesh 240928 166198 87565 78633 898 690 25.85
West Bengal 88752 80176 41466 38710 934 903 17.77* Includes estimated population of Paomata,MaoMaram and Purul
Sub-divisions of Senapati district of Manipur,2001.Source: Census, 2001.
(Population in thousand)
Distribution of Population, Sex Ratio, Density and Decadal Growth Rate of Population, 2001 Appendix - I
Total population
Person Male FemaleArea in sq.km.
India / Major States
Sex ratio (females per 1000 males)
Density (per sq. km.)
Decadal growth rate
%
State Statistical Handbook 2014 219

(1) (2) (3) (4) (5) (6) (7) (8)
India 3287469 1210569573 623121843 587447730 943 368 17.68
Andhra Pradesh 275045 84580777 42442146 42138631 993 308 10.98
Assam 78438 31205576 15939443 15266133 958 398 17.07
Bihar 94163 104099452 54278157 49821295 918 1106 25.42
Gujarat 196244 60439692 31491260 28948432 919 308 19.28
Haryana 44212 25351462 13494734 11856728 879 573 19.90
Karnataka 191791 61095297 30966657 30128640 973 319 15.60
Kerala 38852 33406061 16027412 17378649 1084 860 4.91
Madhya Pradesh 308252 72626809 37612306 35014503 931 236 20.35
Maharashtra 307713 112374333 58243056 54131277 929 365 15.99
Orissa 155707 41974218 21212136 20762082 979 270 14.05
Punjab 50362 27743338 14639465 13103873 895 551 13.89
Rajasthan 342239 68548437 35550997 32997440 928 200 21.31
Tamil Nadu 130060 72147030 36137975 36009055 996 555 15.61
Uttar Pradesh 240928 199812341 104480510 95331831 912 829 20.24
West Bengal 88752 91276115 46809027 44467088 950 1028 13.84
Appendix - IA
Distribution of Population, Sex Ratio, Density and Decadal Growth Rate of Population, 2011( In number )
Total population
Source: Union Primary Census Abstract, Table- A-5, Census of India,2011.
India / Major States Area in sq.km. Person Male Female
Density (per sq. km.)
Decadal growth rate %
Sex ratio (females per 1000 males)
State Statistical Handbook 2014 220

2001 2011 2001 2011 2001 2011
(1) (2) (3) (4) (5) (6) (7)
Andhra Pradesh 54.5 60.4 76.1 80.1 60.5 67.0
Assam 59.7 69.3 85.3 88.5 63.3 72.2
Bihar 43.9 59.8 71.9 76.9 47.0 61.8
Gujarat 61.3 71.7 81.8 86.3 69.1 78.0
Haryana 63.2 71.4 79.2 83.1 67.9 75.6
Karnataka 59.3 68.7 80.6 85.8 66.6 75.4
Kerala 90.0 93.0 93.2 95.1 90.9 94.0
Madhya Pradesh 57.8 63.9 79.4 82.8 63.7 69.3
Maharashtra 70.4 77.0 85.5 88.7 76.9 82.3
Orissa 59.8 70.2 80.8 85.7 63.1 72.9
Punjab 64.7 71.4 79.1 83.2 69.7 75.8
Rajasthan 55.3 61.4 76.2 79.7 60.4 66.1
Tamil Nadu 66.2 73.5 82.5 87.0 73.5 80.1
Uttar Pradesh 52.5 65.5 69.8 75.1 56.3 67.7
West Bengal 63.4 72.1 81.3 84.8 68.6 76.3
All India 58.7 67.8 79.9 84.1 64.8 73.0* Literacy rate relates to population aged
seven years and above. Source:http://www.censusindia.gov.in/2011census/PCA/PCA_Highlights/pca_highlights_file/India/Chapter-3.pdf
Appendix - II
Literacy Rates in Major States and All India
Literacy rate *
Rural Urban Total State
State Statistical Handbook 2014 221
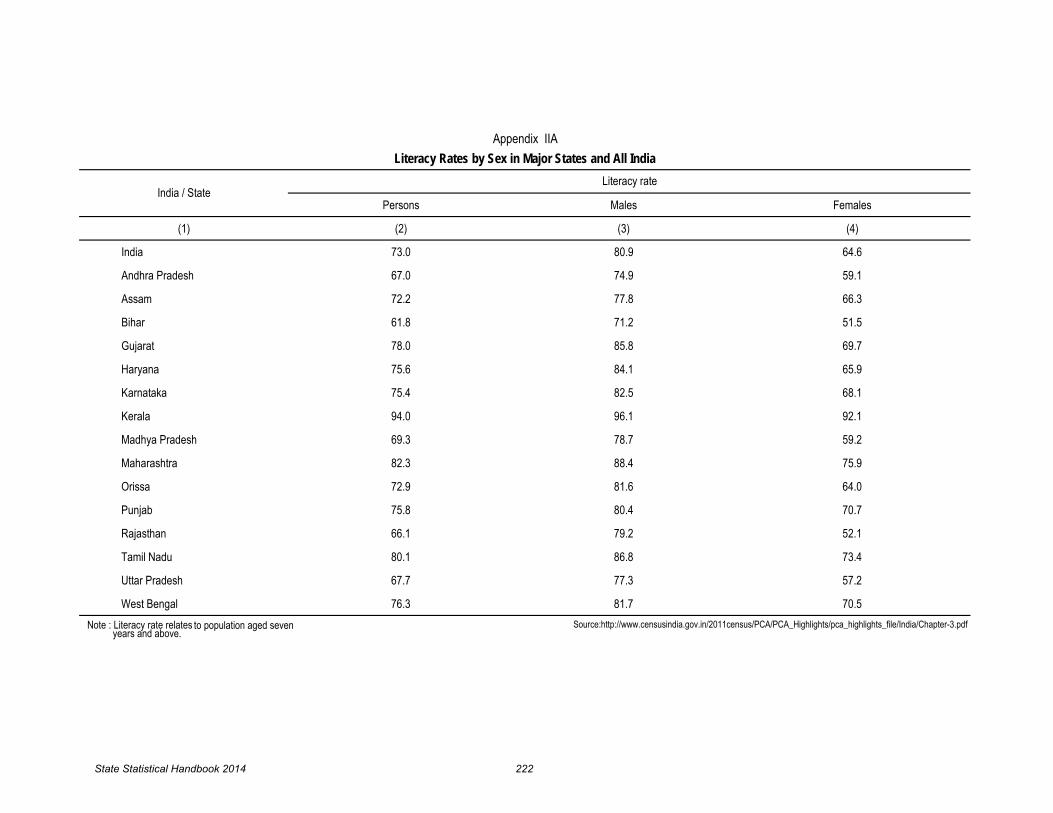
Persons Males Females
(1) (2) (3) (4)
India 73.0 80.9 64.6
Andhra Pradesh 67.0 74.9 59.1
Assam 72.2 77.8 66.3
Bihar 61.8 71.2 51.5
Gujarat 78.0 85.8 69.7
Haryana 75.6 84.1 65.9
Karnataka 75.4 82.5 68.1
Kerala 94.0 96.1 92.1
Madhya Pradesh 69.3 78.7 59.2
Maharashtra 82.3 88.4 75.9
Orissa 72.9 81.6 64.0
Punjab 75.8 80.4 70.7
Rajasthan 66.1 79.2 52.1
Tamil Nadu 80.1 86.8 73.4
Uttar Pradesh 67.7 77.3 57.2
West Bengal 76.3 81.7 70.5Note : Literacy rate relates Source:http://www.censusindia.gov.in/2011census/PCA/PCA_Highlights/pca_highlights_file/India/Chapter-3.pdf to population aged seven years and above.
Appendix IIALiteracy Rates by Sex in Major States and All India
Literacy rateIndia / State
State Statistical Handbook 2014 222

Total Rural Urban Total Rural Urban Total Rural Urban
(1) (2) (3) (4) (5) (6) (7) (8) (9) (10)
Andhra Pradesh 84580777 56361702 28219075 33037378 24142968 8894410 6385528 4909339 1476189
Assam 31205576 26807034 4398542 8687123 7311015 1376108 3282567 3057268 225299
Bihar 104099452 92341436 11758016 21359611 18723966 2635645 13365376 12635801 729575
Gujarat 60439692 34694609 25745083 20365374 11878120 8487254 4402373 3691972 710401
Haryana 25351462 16509359 8842103 7015283 4435805 2579478 1901225 1567307 333918
Karnataka 61095297 37469335 23625962 23397181 15060905 8336276 4475416 3441325 1034091
Kerala 33406061 17471135 15934926 9329747 4930191 4399556 2289316 1411766 877550
Madhya Pradesh 72626809 52557404 20069405 22702119 16729558 5972561 8872014 7985640 886374
Maharashtra 112374333 61556074 50818259 43762890 26510066 17252824 5664988 4140805 1524183
Orissa 41974218 34970562 7003656 10707543 8623947 2083596 6834046 6479767 354279
Punjab 27743338 17344192 10399146 8450936 5107024 3343912 1446426 1072175 374251
Rajasthan 68548437 51500352 17048085 21057968 16173343 4884625 8828287 8211890 616397
Tamil Nadu 72147030 37229590 34917440 27942181 15339116 12603065 4942500 3522214 1420286
Uttar Pradesh 199812341 155317278 44495063 44635492 33538817 11096675 21179223 18412163 2767060
West Bengal 91276115 62183113 29093002 25686630 16489485 9197145 9069725 7592996 1476729
India 1210569573 833463448 377106125 362446420 245749270 116697150 119296891 102848265 16448626
Total population: TABLE-A-5, 2011, Census of India.
Source: Primary Census Abstract
Appendix III
Total Population, Main Workers, Marginal Workers by Major States in India, 2011
Marginal WorkersMain WorkersTotal PopulationState
State Statistical Handbook 2014 223

Total Rural Urban Total Rural Urban
(1) (2) (3) (4) (5) (6) (7)
Andhra Pradesh 39.06 42.84 31.52 7.55 8.71 5.23
Assam 27.84 27.27 31.29 10.52 11.40 5.12
Bihar 20.52 20.28 22.42 12.84 13.68 6.20
Gujarat 33.70 34.24 32.97 7.28 10.64 2.76
Haryana 27.67 26.87 29.17 7.50 9.49 3.78
Karnataka 38.30 40.20 35.28 7.33 9.18 4.38
Kerala 27.93 28.22 27.61 6.85 8.08 5.51
Madhya Pradesh 31.26 31.83 29.76 12.22 15.19 4.42
Maharashtra 38.94 43.07 33.95 5.04 6.73 3.00
Orissa 25.51 24.66 29.75 16.28 18.53 5.06
Punjab 30.46 29.45 32.16 5.21 6.18 3.60
Rajasthan 30.72 31.40 28.65 12.88 15.95 3.62
Tamil Nadu 38.73 41.20 36.09 6.85 9.46 4.07
Uttar Pradesh 22.34 21.59 24.94 10.60 11.85 6.22
West Bengal 28.14 26.52 31.61 9.94 12.21 5.08
India 29.94 29.49 30.95 9.85 12.34 4.36Source: Primary Census Abstract,
Total Population TABLE A-5, Census of India, 2011.
Appendix IIIA
Percentage distribution of Workers to total Population by Major States in India, Census 2011
Main Workers Marginal WorkersState
State Statistical Handbook 2014 224

Total Rural Urban Total Rural Urban Total Rural Urban Total Rural Urban
(1) (2) (3) (4) (5) (6) (7) (8) (9) (10) (11) (12) (13)
Andhra Pradesh 16.5 21.6 2.2 43.0 55.4 8.3 3.7 3.1 5.1 36.8 19.9 84.4
Assam 33.9 38.8 2.7 15.4 17.5 2.0 4.1 4.2 3.6 46.5 39.6 91.8
Bihar 20.7 22.3 5.6 52.8 56.9 15.3 4.1 3.8 6.5 22.4 17.0 72.7
Gujarat 22.0 33.7 2.1 27.6 41.6 3.9 1.4 1.1 1.9 49.0 23.6 92.1
Haryana 27.8 40.0 2.8 17.1 23.4 4.2 2.9 2.2 4.4 52.1 34.4 88.6
Karnataka 23.6 34.3 2.6 25.7 36.4 4.5 3.3 2.8 4.2 47.4 26.5 88.8
Kerala 5.8 9.3 1.6 11.4 17.1 4.5 2.3 2.4 2.3 80.5 71.3 91.6
Madhya Pradesh 31.2 38.3 5.4 38.6 47.3 7.3 3.0 2.4 5.3 27.2 12.0 82.0
Maharashtra 25.4 39.9 1.9 27.3 41.5 4.1 2.5 1.9 3.4 44.8 16.7 90.6
Orissa 23.4 26.7 3.0 38.4 43.8 5.0 4.5 4.4 5.1 33.7 25.1 86.9
Punjab 19.5 29.8 2.5 16.0 23.9 3.1 3.9 3.8 4.1 60.5 42.5 90.3
Rajasthan 45.6 54.8 4.7 16.5 19.4 3.7 2.4 1.8 5.0 35.5 24.0 86.5
Tamil Nadu 12.9 20.6 2.6 29.2 44.6 8.5 4.2 3.7 4.7 53.7 31.1 84.1
Uttar Pradesh 29.0 35.6 4.0 30.3 36.4 7.4 5.9 5.2 8.7 34.8 22.8 79.8
West Bengal 14.7 20.6 1.5 29.3 40.9 3.2 7.1 6.7 8.0 48.9 31.9 87.2
All India 24.6 33.0 2.8 30.0 39.3 5.5 3.8 3.4 4.8 41.6 24.3 86.9
Appendix IVPercentage distribution of Total Workers by broad Industrial Categories for Major States in India, 2011
Source: Census of India,2011
Cultivators Agricultural Labourers Household Industries Workers Other Workers
Category
State
State Statistical Handbook 2014 225

Rural
(1) (2) (3) (4) (5) (6) (7) (8)
Andhra Pradesh 60 42 2 722 112 58 1000
Assam 23 4 66 781 61 34 1000
Bihar 4 1 5 948 6 26 1000
Gujarat 50 13 7 849 57 23 1000
Haryana 21 9 3 892 41 28 1000
Karnataka 32 49 8 778 86 46 1000
Kerala 57 9 2 539 172 217 1000
Madhya Pradesh 26 9 4 900 34 19 1000
Maharashtra 72 33 8 741 102 41 1000
Orissa 19 28 4 883 25 36 1000
Punjab 50 8 12 823 65 35 1000
Rajasthan 31 9 6 873 41 37 1000
Tamil Nadu 57 22 7 693 146 71 1000
Uttar Pradesh 14 3 5 922 23 30 1000
West Bengal 17 8 18 850 54 47 1000All India 36 16 8 825 63 47 1000
Appendix VDistribution of Migrants per 1000 Population by reason for migration for Major States
(July 2007 - June 2008)
Reason for Migration
State Employment related reasons Studies Forced migration Marriage Movement of parent/
earning member Others All (incl. n.r.)
State Statistical Handbook 2014 226

Urban
(1) (2) (3) (4) (5) (6) (7) (8)
Andhra Pradesh 266 50 15 260 361 45 1000
Assam 319 47 39 285 199 95 1000
Bihar 130 101 32 431 263 29 1000
Gujarat 265 28 4 345 341 16 1000
Haryana 215 10 13 402 304 54 1000
Karnataka 280 61 0 347 251 58 1000
Kerala 149 32 6 418 218 178 1000
Madhya Pradesh 120 42 1 574 219 32 1000
Maharashtra 291 37 3 308 283 74 1000
Orissa 236 49 7 396 263 47 1000
Punjab 228 13 21 524 170 36 1000
Rajasthan 201 38 7 449 278 25 1000
Tamil Nadu 203 34 6 411 250 95 1000
Uttar Pradesh 136 48 1 539 233 37 1000
West Bengal 181 22 14 445 228 108 1000
All India 228 40 7 383 278 59 1000 Source : NSS Report No. 533 :Migration in India: July,07 - June',08.
Appendix V (Contd.)Distribution of Migrants per 1000 Population by reason for migration for Major States
(July 2007 - June 2008)
Reason for Migration
Employment related reasons Studies
StateForced migration Marriage
Movement of parent/ earning
memberOthers All (incl. n.r.)
State Statistical Handbook 2014 227

Rural
(1) (2) (3) (4) (5) (6) (7) (8) (9)
Andhra Pradesh 717.10 112.12 119.12 61.04 133.15 63.22 357.46 1563.21
Assam 597.50 103.59 79.51 20.96 29.05 53.80 172.57 1056.98
Bihar 524.98 100.07 84.80 25.76 53.91 41.72 139.17 970.41
Gujarat 713.67 137.88 98.21 33.89 85.24 80.97 280.26 1430.12
Haryana 960.12 155.98 175.37 129.47 93.02 79.47 332.53 1925.96
Karnataka 634.98 110.39 103.55 41.60 90.65 102.72 311.21 1395.10
Kerala 889.11 124.43 155.23 94.67 242.89 356.71 492.49 2355.53
Madhya Pradesh 498.24 116.79 80.00 26.36 65.97 49.53 187.25 1024.14
Maharashtra 671.13 133.30 118.91 47.52 124.79 51.54 298.70 1445.89
Orissa 470.30 110.27 74.87 22.25 59.61 41.10 126.38 904.78
Punjab 894.22 234.19 170.65 133.46 197.71 103.73 402.43 2136.39
Rajasthan 689.68 150.60 116.98 64.81 91.15 46.65 285.87 1445.74
Tamil Nadu 693.77 103.80 100.30 88.61 125.37 93.15 365.61 1570.61
Uttar Pradesh 530.52 102.95 85.82 47.70 104.51 42.82 158.61 1072.93
West Bengal 639.92 117.67 84.40 48.57 93.49 33.49 152.57 1170.11
All India 621.96 118.26 101.48 50.69 94.83 64.03 235.92 1287.17
Appendix VIAverage Monthly Per Capita Expenditure on Broad Groups of Items by Major States
(N.S.S 68th Round, July 2011 to June 2012)
Average monthly per capita expenditure (`)
StateFood total Fuel and light Clothing and
footwear Education Total Medical Durable goods Others Total consumer expenditure
State Statistical Handbook 2014 228
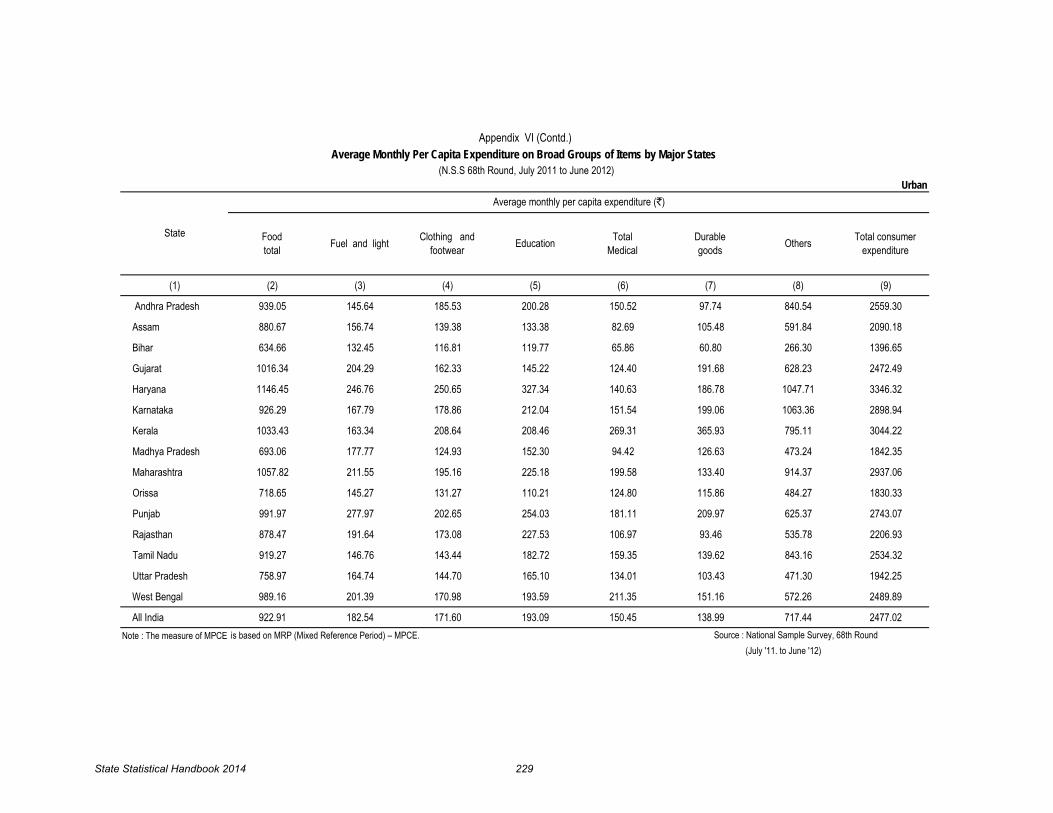
Urban
(1) (2) (3) (4) (5) (6) (7) (8) (9)
Andhra Pradesh 939.05 145.64 185.53 200.28 150.52 97.74 840.54 2559.30
Assam 880.67 156.74 139.38 133.38 82.69 105.48 591.84 2090.18
Bihar 634.66 132.45 116.81 119.77 65.86 60.80 266.30 1396.65
Gujarat 1016.34 204.29 162.33 145.22 124.40 191.68 628.23 2472.49
Haryana 1146.45 246.76 250.65 327.34 140.63 186.78 1047.71 3346.32
Karnataka 926.29 167.79 178.86 212.04 151.54 199.06 1063.36 2898.94
Kerala 1033.43 163.34 208.64 208.46 269.31 365.93 795.11 3044.22
Madhya Pradesh 693.06 177.77 124.93 152.30 94.42 126.63 473.24 1842.35
Maharashtra 1057.82 211.55 195.16 225.18 199.58 133.40 914.37 2937.06
Orissa 718.65 145.27 131.27 110.21 124.80 115.86 484.27 1830.33
Punjab 991.97 277.97 202.65 254.03 181.11 209.97 625.37 2743.07
Rajasthan 878.47 191.64 173.08 227.53 106.97 93.46 535.78 2206.93
Tamil Nadu 919.27 146.76 143.44 182.72 159.35 139.62 843.16 2534.32
Uttar Pradesh 758.97 164.74 144.70 165.10 134.01 103.43 471.30 1942.25
West Bengal 989.16 201.39 170.98 193.59 211.35 151.16 572.26 2489.89
All India 922.91 182.54 171.60 193.09 150.45 138.99 717.44 2477.02Note : The measure of MPCE is based on MRP (Mixed Reference Period) – MPCE.
Appendix VI (Contd.)Average Monthly Per Capita Expenditure on Broad Groups of Items by Major States
(N.S.S 68th Round, July 2011 to June 2012)
Average monthly per capita expenditure (`)
State Food total Fuel and light Clothing and
footwear Education Total Medical
Durable goods Others Total consumer
expenditure
Source : National Sample Survey, 68th Round (July '11. to June '12)
State Statistical Handbook 2014 229
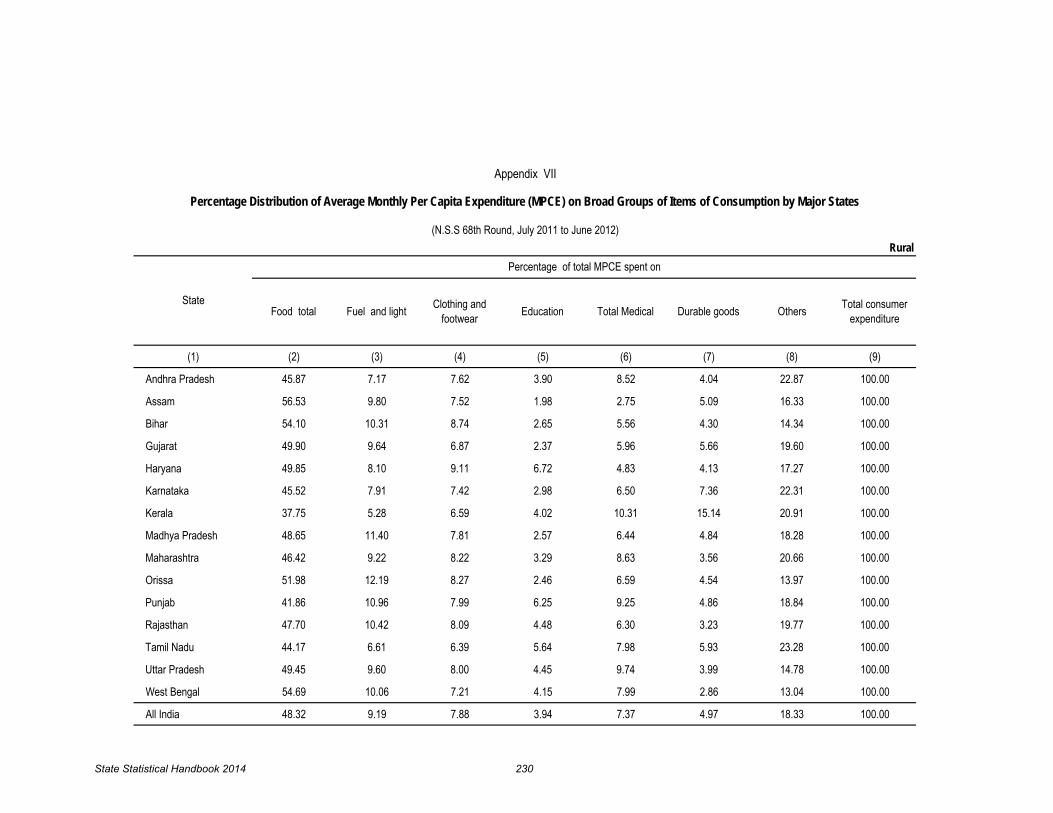
Rural
(1) (2) (3) (4) (5) (6) (7) (8) (9)
Andhra Pradesh 45.87 7.17 7.62 3.90 8.52 4.04 22.87 100.00
Assam 56.53 9.80 7.52 1.98 2.75 5.09 16.33 100.00
Bihar 54.10 10.31 8.74 2.65 5.56 4.30 14.34 100.00
Gujarat 49.90 9.64 6.87 2.37 5.96 5.66 19.60 100.00
Haryana 49.85 8.10 9.11 6.72 4.83 4.13 17.27 100.00
Karnataka 45.52 7.91 7.42 2.98 6.50 7.36 22.31 100.00
Kerala 37.75 5.28 6.59 4.02 10.31 15.14 20.91 100.00
Madhya Pradesh 48.65 11.40 7.81 2.57 6.44 4.84 18.28 100.00
Maharashtra 46.42 9.22 8.22 3.29 8.63 3.56 20.66 100.00
Orissa 51.98 12.19 8.27 2.46 6.59 4.54 13.97 100.00
Punjab 41.86 10.96 7.99 6.25 9.25 4.86 18.84 100.00
Rajasthan 47.70 10.42 8.09 4.48 6.30 3.23 19.77 100.00
Tamil Nadu 44.17 6.61 6.39 5.64 7.98 5.93 23.28 100.00
Uttar Pradesh 49.45 9.60 8.00 4.45 9.74 3.99 14.78 100.00
West Bengal 54.69 10.06 7.21 4.15 7.99 2.86 13.04 100.00
All India 48.32 9.19 7.88 3.94 7.37 4.97 18.33 100.00
Appendix VII
Percentage Distribution of Average Monthly Per Capita Expenditure (MPCE) on Broad Groups of Items of Consumption by Major States
(N.S.S 68th Round, July 2011 to June 2012)
Percentage of total MPCE spent on
StateFood total Fuel and light Clothing and
footwear Education Total Medical Durable goods Others Total consumer expenditure
State Statistical Handbook 2014 230

Urban
(1) (2) (3) (4) (5) (6) (7) (8) (9)
Andhra Pradesh 36.69 5.69 7.25 7.83 5.88 3.82 32.84 100.00
Assam 42.13 7.50 6.67 6.38 3.96 5.05 28.32 100.00
Bihar 45.44 9.48 8.36 8.58 4.72 4.35 19.07 100.00
Gujarat 41.11 8.26 6.57 5.87 5.03 7.75 25.41 100.00
Haryana 34.26 7.37 7.49 9.78 4.20 5.58 31.31 100.00
Karnataka 31.95 5.79 6.17 7.31 5.23 6.87 36.68 100.00
Kerala 33.95 5.37 6.85 6.85 8.85 12.02 26.12 100.00
Madhya Pradesh 37.62 9.65 6.78 8.27 5.12 6.87 25.69 100.00
Maharashtra 36.02 7.20 6.64 7.67 6.80 4.54 31.13 100.00
Orissa 39.26 7.94 7.17 6.02 6.82 6.33 26.46 100.00
Punjab 36.16 10.13 7.39 9.26 6.60 7.65 22.80 100.00
Rajasthan 39.81 8.68 7.84 10.31 4.85 4.23 24.28 100.00
Tamil Nadu 36.27 5.79 5.66 7.21 6.29 5.51 33.27 100.00
Uttar Pradesh 39.08 8.48 7.45 8.50 6.90 5.33 24.27 100.00
West Bengal 39.73 8.09 6.87 7.78 8.49 6.07 22.98 100.00
All India 37.26 7.37 6.93 7.80 6.07 5.61 28.96 100.00Source: National Sample Survey, 68th Round
(July 2011 to June 2012).
Appendix VII (Contd.)
Percentage Distribution of Average Monthly Per Capita Expenditure (MPCE) on Broad Groups of Items of Consumption by Major States
(N.S.S 68th Round, July 2011 to June 2012)
Percentage of total MPCE spent on
StateFood total Fuel & light Clothin and
footwear Education Total Medical Durable goods OthersTotal
consumer expenditure
State Statistical Handbook 2014 231

2008-09 2009-10 2010-11 2011-12 2012-13 2008-09 2009-10 2010-11 2011-12 2012-13 2008-09 2009-10 2010-11 2011-12 2012-13
(1) (2) (3) (4) (5) (6) (7) (8) (9) (10) (11) (12) (13) (14) (15) (16)
Andhra Pradesh 13830 12560 14512 13759 13650 10868 9991 11186 11161 11117 127 126 130 123 123
Assam 3999 4099 4160 4174 4197 2810 2811 2811 2811 2811 142 146 148 148 149
Bihar 7671 7296 7194 7647 7778 5554 5332 5259 5396 5402 138 137 137 142 144
Gujarat 11637( R) 11085 12247 13093 12600 10302 10302 10302 10302 10302 113 108 119 127 122
Haryana 6484 6351 6505 6489 6376 3576 3550 3518 3513 3513 181 179 185 185 182
Karnataka 12368 12873 13062 12059 11748 10174 10404 10523 9941 9793 122 124 124 121 120
Kerala 2695 2669 2647 2662 2592 2089 2079 2072 2040 2048 129 128 128 130 127
Madhya Pradesh 20657 21411 22046 22516 23130 14941 14972 15119 15237 15352 138 143 146 148 151
Maharashtra 22454 22612 23175( R) 21915 21874 17422 17401 17406 17386 17344 129 130 133( R) 126 126
Orissa 9071 5510 5429 4964 5069 5604 4761 4682 4394 4386 162 116 116 113 116
Punjab 7912 7875 7883 7905 7870 4169 4158 4158 4134 4150 190 189 190 191 190
Rajasthan 22771 21745 26002 24505 23954 17551 16974 18349 18034 17479 130 128 142 136 137
Tamil Nadu 5824 5572 5753 5890 5140 5043 4892 4954 4986 4544 115# 114 116 118 113
Uttar Pradesh 25471 25440 25368* 25809* 25821 16562 16589 16593 16623 16564 154 153 153 155 156
West Bengal 9802 9530 8832(R ) 9353 9459 5294 5256 4991 5198 5205 185 181 177( R) 180 182
All-India 195314( R) 188992( R) 197323( R) 195246 194399 141899( R) 139173( R) 141559( R) 140801 139,932 138( R) 136 139( R) 139 139R = Revised Sources 1) Directorate of Economics and Statistics,* = area under crops as the case may be, are taken from latest Agriculture Census or are estimated based on latest available year data received from the States respectively. Ministry of Agriculture, Govt. of India. NB: Figure of West Bengal supplied by Directorate of Agriculture (Evaluation Wing), Government of West Bengal. (for States other than West Bengal)
Government of West Bengal. (for West Bengal)3)www.eands.dacnet.nic.in (for 2013-13 as on 17.07.2015)
Appendix VIII
2) Directorate of Agriculture (Evaluation Wing),
Total Cropped Area, Net Area Sown and Cropping Intensity in Major States of India
StatesTotal Cropped Area ('000 hectare) Net Area Sown ('000 hectare) Cropping Intensity (in percent)
State Statistical Handbook 2014 232

2012-13 2013-14* 2012-13 2013-14* 2012-13 2013-14* 2012-13 2013-14*
(1) (2) (3) (4) (5) (6) (7) (8) (9)
Andhra Pradesh 11510.0 13027.1 17039.5 18546.1 1623.0 1552.0 18662.5 20098.1
(10.94) (12.23) (7.14) (7.55) (8.85) (8.05) (7.26) (7.59)
Assam 5128.5 4778.0 5196.2 4829.0 84.4 110.0 5280.6 4939.0
(4.87) (4.48) (2.18) (1.97) (0.46) (0.57) (2.05) (1.87)
Bihar 7529.3 5507.9 15396.8 12638.4 542.8 515.0 15939.6 13153.5
(7.15) (5.17) (6.45) (5.15) (2.96) (2.67) (6.20) (4.97)
Gujarat 1541.0 1616.0 6484.0 7475.4 572.2 739.0 7056.2 8214.4
(1.46) (1.52) (2.72) (3.04) (3.12) (3.84) (2.74) (3.10)
Haryana 3976.0 3998.0 16096.0 16849.0 130.4 125.0 16226.4 16974.0
(3.78) (3.75) (6.74) (6.86) (0.71) (0.65) (6.31) (6.41)
Karnataka 3364.0 3758.0 9604.0 10708.0 1259.3 1465.0 10863.3 12173.0
(3.20) (3.53) (4.02) (4.36) (6.87) (7.60) (4.22) (4.60)
Kerala 508.3 509.2 508.6 509.5 3.2 4.0 511.8 513.5
(0.48) (0.48) (0.21) (0.21) (0.02) (0.02) (0.20) (0.19)
Madhya Pradesh 2775.0 2780.7 18524.6 19141.8 5165.9 5093.6 23690.4 24235.4
(2.64) (2.61) (7.76) (7.80) (28.16) (26.43) (9.21) (9.15)
Maharashtra 3057.0 2946.0 8667.3 10796.2 2306.0 3120.0 10973.3 13916.2
(2.91) (2.77) (3.63) (4.40) (12.57) (16.19) (4.27) (5.26)
Orissa 7295.5 7583.6 7584.4 7910.5 424.4 423.7 8008.8 8334.2
(6.93) (7.12) (3.18) (3.22) (2.31) (2.20) (3.11) (3.15)
Punjab 11374.0 11267.0 28490.0 28861.1 53.0 40.9 28543.0 28902.0
(10.81) (10.58) (11.93) (11.76) (0.29) (0.21) (11.10) (10.92)
Rajasthan 222.5 312.6 16410.9 15834.8 1956.8 2467.7 18367.7 18302.4
(0.21) (0.29) (6.87) (6.45) (10.67) (12.81) (7.14) (6.91)
Tamil Nadu 4049.9 5536.9 5382.9 8058.9 209.9 435.3 5592.8 8494.2
(3.85) (5.20) (2.25) (3.28) (1.14) (2.26) (2.18) (3.21)
Uttar Pradesh 14416.0 14628.0 48413.4 48338.7 2332.0 1708.4 50745.4 50047.1
(13.70) (13.73) (20.28) (19.69) (12.71) (8.87) (19.74) (18.90)
West Bengal 14946.7 15376.9 16320.2 16941.1 201.6 215.2 16521.8 17156.3
(14.20) (14.43) (6.83) (6.90) (1.10) (1.12) (6.42) (6.48)
All India 105231.6 106539.9 238782.2 245501.7 18342.5 19269.4 257124.7 264771.1* 4th Advance Estimates Sources:1) Department of Agriculture &
Co-operation, Ministry of Agriculture, Govt. of India. (except West Bengal)
2) Directorate of Agriculture,Evaluation Wing, Govt. ofWest Bengal. (for West Bengal)
Appendix IXProduction of Foodgrains by Major States of India
(In thousand tonnes)Rice Total Cereals Total Pulses Total Foodgrains
States
State Statistical Handbook 2014 233

Rural
(1) (2) (3) (4) (5) (6) (7) (8)
Andhra Pradesh 2003 82.70 9.10 5.30 2.60 0.50 100.00
1992 76.41 12.35 7.46 3.38 0.39 100.00
1982 67.49 14.03 10.01 6.69 1.78 100.00
1971-72 65.30 13.65 11.22 7.57 2.26 100.00
Bihar 2003 89.40 7.10 2.70 0.70 0.10 100.00
1992 80.56 11.10 6.00 2.14 0.20 100.00
1982 76.65 12.42 7.79 2.82 0.31 100.00
1971-72 71.71 15.11 9.15 3.66 0.37 100.00
Gujarat 2003 73.30 11.90 7.20 6.50 1.00 100.00
1992 63.33 15.18 12.19 7.62 1.67 100.00
1982 57.25 13.61 14.98 11.45 2.70 100.00
1971-72 52.25 15.24 13.63 13.80 5.08 100.00
Haryana 2003 77.20 9.80 7.70 4.90 0.40 100.00
1992 59.04 13.49 18.19 8.53 0.77 100.00
1982 56.84 15.49 13.31 12.48 1.88 100.00
1971-72 63.90 8.95 11.67 13.00 2.48 100.00
Kerala 2003 95.30 3.50 0.90 0.30 0.00 100.00
1992 92.66 5.32 1.66 0.34 0.02 100.00
1982 90.67 6.07 2.52 0.69 0.05 100.00
1971-72 88.69 7.32 3.00 0.91 0.08 100.00
Madhya Pradesh 2003 61.70 18.00 12.10 7.10 1.10 100.00
1992 52.38 19.19 16.20 10.34 1.88 100.00
1982 48.77 16.24 18.24 13.76 2.99 100.00
1971-72 40.26 16.96 20.72 17.20 4.86 100.00
Orissa 2003 85.50 9.70 3.70 0.90 0.10 100.00
1992 75.71 14.42 7.34 2.40 0.12 100.00
1982 66.06 20.84 9.31 3.42 0.37 100.00
1971-72 68.94 18.08 9.04 3.52 0.42 100.00
Punjab 2003 76.30 9.50 7.90 5.10 1.00 100.00
1992 69.63 9.98 12.21 7.11 1.08 100.00
1982 66.87 10.08 11.61 9.94 1.47 100.00
1971-72 67.50 8.37 12.71 9.19 2.23 100.00
West Bengal 2003 92.06 5.70 1.40 0.20 0.00 100.00
1992 85.88 9.48 3.94 0.71 0.00 100.00
1982 81.60 11.50 5.54 1.28 0.08 100.00
1971-72 77.62 12.64 7.30 2.39 0.05 100.00
All India 2003 79.60 10.80 6.00 3.00 0.60 100.00
1992 71.88 13.42 9.28 4.54 0.88 100.00
1982 66.64 14.70 10.78 6.45 1.42 100.00
1971-72 62.62 15.49 11.94 7.83 2.12 100.00
Appendix X Percentage Distribution of Owner Households and Area Owned over Five Broad Size Classes of Holding
in Major States and All India
Percentage distribution of owner households
StatesYear Marginal Small Semi-medium Medium Large All
State Statistical Handbook 2014 234
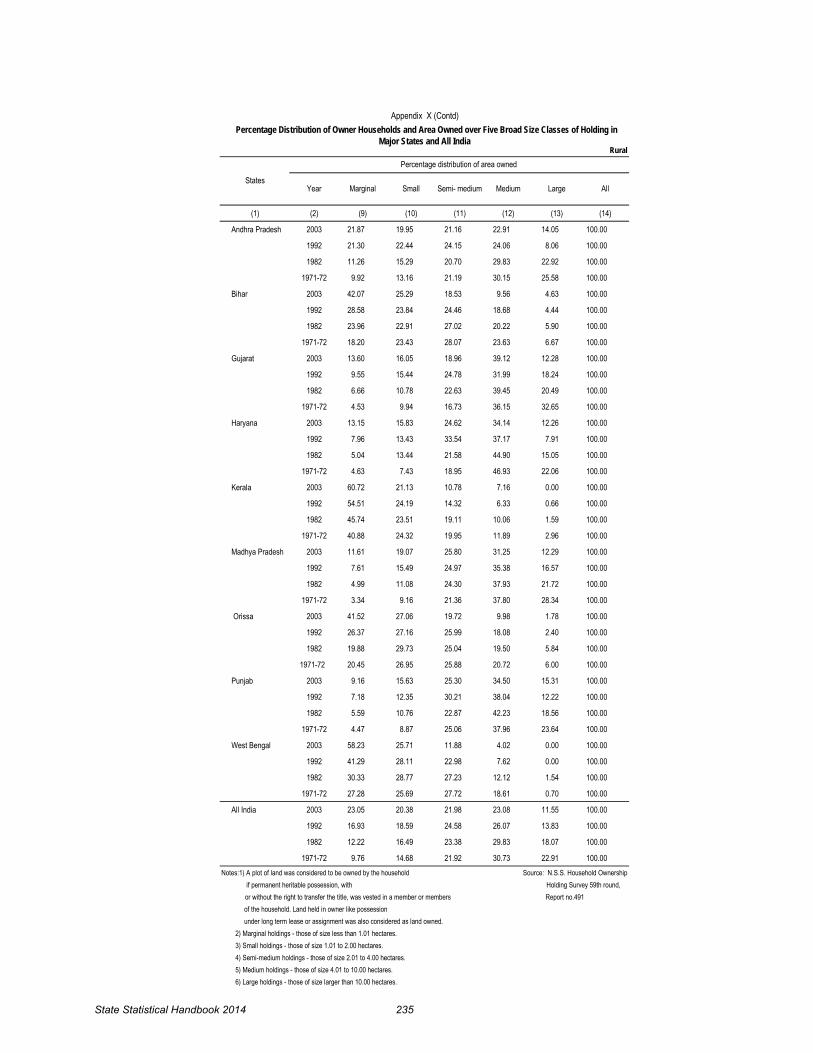
Rural
(1) (2) (9) (10) (11) (12) (13) (14)
Andhra Pradesh 2003 21.87 19.95 21.16 22.91 14.05 100.00
1992 21.30 22.44 24.15 24.06 8.06 100.00
1982 11.26 15.29 20.70 29.83 22.92 100.00
1971-72 9.92 13.16 21.19 30.15 25.58 100.00
Bihar 2003 42.07 25.29 18.53 9.56 4.63 100.00
1992 28.58 23.84 24.46 18.68 4.44 100.00
1982 23.96 22.91 27.02 20.22 5.90 100.00
1971-72 18.20 23.43 28.07 23.63 6.67 100.00
Gujarat 2003 13.60 16.05 18.96 39.12 12.28 100.00
1992 9.55 15.44 24.78 31.99 18.24 100.00
1982 6.66 10.78 22.63 39.45 20.49 100.00
1971-72 4.53 9.94 16.73 36.15 32.65 100.00
Haryana 2003 13.15 15.83 24.62 34.14 12.26 100.00
1992 7.96 13.43 33.54 37.17 7.91 100.00
1982 5.04 13.44 21.58 44.90 15.05 100.00
1971-72 4.63 7.43 18.95 46.93 22.06 100.00
Kerala 2003 60.72 21.13 10.78 7.16 0.00 100.00
1992 54.51 24.19 14.32 6.33 0.66 100.00
1982 45.74 23.51 19.11 10.06 1.59 100.00
1971-72 40.88 24.32 19.95 11.89 2.96 100.00
Madhya Pradesh 2003 11.61 19.07 25.80 31.25 12.29 100.00
1992 7.61 15.49 24.97 35.38 16.57 100.00
1982 4.99 11.08 24.30 37.93 21.72 100.00
1971-72 3.34 9.16 21.36 37.80 28.34 100.00
Orissa 2003 41.52 27.06 19.72 9.98 1.78 100.00
1992 26.37 27.16 25.99 18.08 2.40 100.00
1982 19.88 29.73 25.04 19.50 5.84 100.00
1971-72 20.45 26.95 25.88 20.72 6.00 100.00
Punjab 2003 9.16 15.63 25.30 34.50 15.31 100.00
1992 7.18 12.35 30.21 38.04 12.22 100.00
1982 5.59 10.76 22.87 42.23 18.56 100.00
1971-72 4.47 8.87 25.06 37.96 23.64 100.00
West Bengal 2003 58.23 25.71 11.88 4.02 0.00 100.00
1992 41.29 28.11 22.98 7.62 0.00 100.00
1982 30.33 28.77 27.23 12.12 1.54 100.00
1971-72 27.28 25.69 27.72 18.61 0.70 100.00
All India 2003 23.05 20.38 21.98 23.08 11.55 100.00
1992 16.93 18.59 24.58 26.07 13.83 100.00
1982 12.22 16.49 23.38 29.83 18.07 100.00
1971-72 9.76 14.68 21.92 30.73 22.91 100.00Notes:1) A plot of land was considered to be owned by the household
of the household. Land held in owner like possession under long term lease or assignment was also considered as land owned.
2) Marginal holdings - those of size less than 1.01 hectares. 3) Small holdings - those of size 1.01 to 2.00 hectares. 4) Semi-medium holdings - those of size 2.01 to 4.00 hectares. 5) Medium holdings - those of size 4.01 to 10.00 hectares. 6) Large holdings - those of size larger than 10.00 hectares.
Source: N.S.S. Household Ownership Holding Survey 59th round,
Report no.491 if permanent heritable possession, with or without the right to transfer the title, was vested in a member or members
Percentage Distribution of Owner Households and Area Owned over Five Broad Size Classes of Holding in Major States and All India
Percentage distribution of area owned
Appendix X (Contd)
StatesYear Marginal Small Medium Large AllSemi- medium
State Statistical Handbook 2014 235

Rural
(1) (2) (3) (4) (5) (6) (7)
Andhra Pradesh 2002-03 60.7 20.7 12.0 5.5 1.1
1991-92 59.3 21.3 13.2 5.4 0.8
1981-82 48.6 22.1 15.5 10.8 2.9
1970-71 47.3 19.1 18.2 11.9 3.5
Bihar 2002-03 82.6 12.2 4.0 1.0 0.2
1991-92 76.8 13.7 6.9 2.5 0.2
1981-82 68.7 17.6 9.9 3.4 0.4
1970-71 58.9 23.3 12.9 4.5 0.5
Gujarat 2002-03 60.0 17.3 11.1 9.8 1.8
1991-92 47.9 19.9 17.7 12.1 2.5
1981-82 38.6 20.4 21.3 15.8 3.9
1970-71 27.2 20.7 22.2 21.6 8.2
Haryana 2002-03 66.3 12.8 12.3 7.8 0.9
1991-92 50.7 13.5 20.3 11.5 4.0
1981-82 42.2 12.7 22.9 18.8 3.4
1970-71 17.5 14.5 28.3 31.1 5.6
Kerala 2002-03 91.8 6.2 1.5 0.5 0.0
1991-92 91.6 5.9 2.0 0.5 0.0
1981-82 88.9 7.3 2.9 0.8 0.1
1970-71 86.2 8.9 3.7 1.1 0.1
Madhya Pradesh 2002-03 51.2 23.3 16.7 7.7 1.2
1991-92 38.7 24.4 20.9 13.5 2.5
1981-82 32.9 22.5 23.1 17.9 3.6
1970-71 26.1 20.3 25.8 21.6 6.2
Orissa 2002-03 78.4 15.2 5.2 1.1 0.1
1991-92 60.0 24.3 12.0 3.4 0.3
1981-82 54.5 26.1 14.1 4.6 0.7
1970-71 54.5 25.7 13.9 5.3 0.6
Punjab 2002-03 66.3 11.2 12.9 7.8 1.9
1991-92 63.2 11.4 13.9 9.8 1.7
1981-82 59.0 10.4 14.0 14.2 2.5
1970-71 11.7 19.1 32.7 30.5 6.0
West Bengal 2002-03 88.8 8.9 2.1 0.2 0.0
1991-92 80.7 13.4 5.0 0.9 0.0
1981-82 74.3 15.8 8.1 1.7 0.1
1970-71 61.2 22.8 12.9 3.0 0.1
All India 2002-03 69.8 16.2 9.0 4.2 0.8
1991-92 62.8 17.8 12.0 6.1 1.3
1981-82 56.0 19.3 14.2 8.6 1.9
1970-71 45.8 22.4 17.7 11.1 3.1Source : N.S.S Household Ownership Holdings Survey, 59th round, Report no. 491
Appendix XI Changes in Percentage Distribution of Operational Holdings and Area Operated by Size
Classes of Operational Holdings in Major States and All India
Percentage distribution of operational holdingsStates
Year Marginal Small Medium LargeSemi- medium
State Statistical Handbook 2014 236
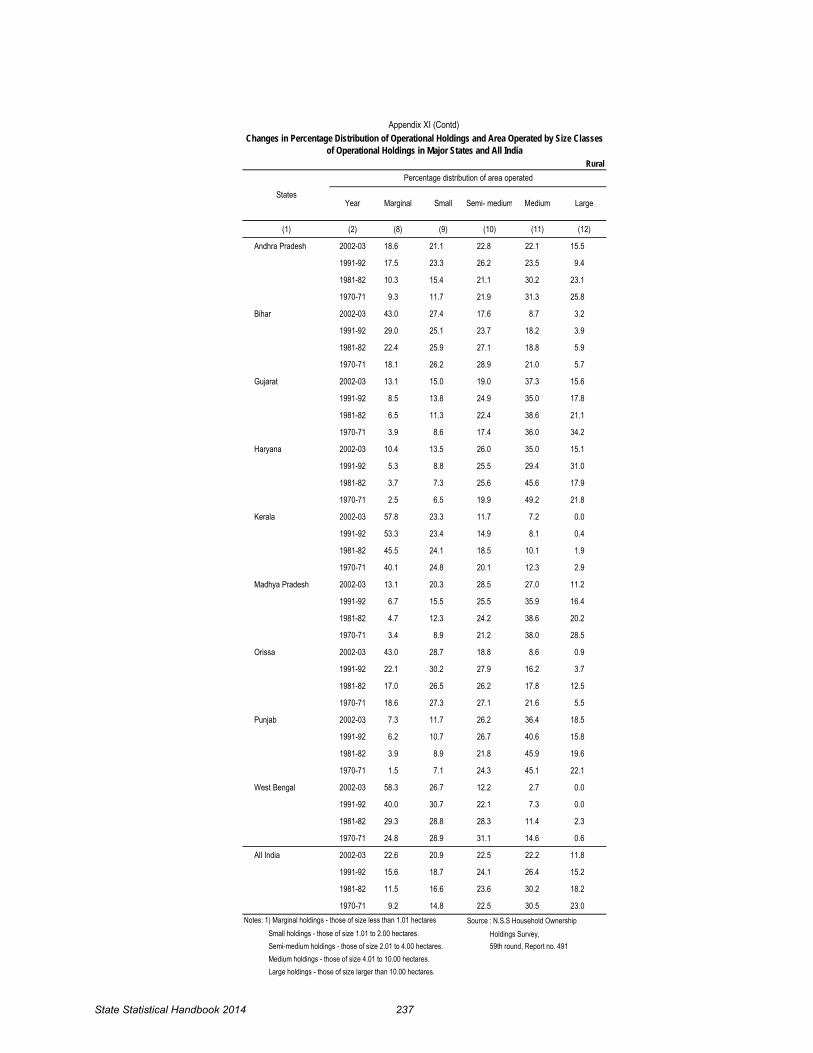
Rural
(1) (2) (8) (9) (10) (11) (12)
Andhra Pradesh 2002-03 18.6 21.1 22.8 22.1 15.5
1991-92 17.5 23.3 26.2 23.5 9.4
1981-82 10.3 15.4 21.1 30.2 23.1
1970-71 9.3 11.7 21.9 31.3 25.8
Bihar 2002-03 43.0 27.4 17.6 8.7 3.2
1991-92 29.0 25.1 23.7 18.2 3.9
1981-82 22.4 25.9 27.1 18.8 5.9
1970-71 18.1 26.2 28.9 21.0 5.7
Gujarat 2002-03 13.1 15.0 19.0 37.3 15.6
1991-92 8.5 13.8 24.9 35.0 17.8
1981-82 6.5 11.3 22.4 38.6 21.1
1970-71 3.9 8.6 17.4 36.0 34.2
Haryana 2002-03 10.4 13.5 26.0 35.0 15.1
1991-92 5.3 8.8 25.5 29.4 31.0
1981-82 3.7 7.3 25.6 45.6 17.9
1970-71 2.5 6.5 19.9 49.2 21.8
Kerala 2002-03 57.8 23.3 11.7 7.2 0.0
1991-92 53.3 23.4 14.9 8.1 0.4
1981-82 45.5 24.1 18.5 10.1 1.9
1970-71 40.1 24.8 20.1 12.3 2.9
Madhya Pradesh 2002-03 13.1 20.3 28.5 27.0 11.2
1991-92 6.7 15.5 25.5 35.9 16.4
1981-82 4.7 12.3 24.2 38.6 20.2
1970-71 3.4 8.9 21.2 38.0 28.5
Orissa 2002-03 43.0 28.7 18.8 8.6 0.9
1991-92 22.1 30.2 27.9 16.2 3.7
1981-82 17.0 26.5 26.2 17.8 12.5
1970-71 18.6 27.3 27.1 21.6 5.5
Punjab 2002-03 7.3 11.7 26.2 36.4 18.5
1991-92 6.2 10.7 26.7 40.6 15.8
1981-82 3.9 8.9 21.8 45.9 19.6
1970-71 1.5 7.1 24.3 45.1 22.1
West Bengal 2002-03 58.3 26.7 12.2 2.7 0.0
1991-92 40.0 30.7 22.1 7.3 0.0
1981-82 29.3 28.8 28.3 11.4 2.3
1970-71 24.8 28.9 31.1 14.6 0.6
All India 2002-03 22.6 20.9 22.5 22.2 11.8
1991-92 15.6 18.7 24.1 26.4 15.2
1981-82 11.5 16.6 23.6 30.2 18.2
1970-71 9.2 14.8 22.5 30.5 23.0Source : N.S.S Household Ownership
Small holdings - those of size 1.01 to 2.00 hectares. Holdings Survey, Semi-medium holdings - those of size 2.01 to 4.00 hectares. 59th round, Report no. 491 Medium holdings - those of size 4.01 to 10.00 hectares. Large holdings - those of size larger than 10.00 hectares.
Appendix XI (Contd)
Percentage distribution of area operated
Notes: 1) Marginal holdings - those of size less than 1.01 hectares
Changes in Percentage Distribution of Operational Holdings and Area Operated by Size Classes of Operational Holdings in Major States and All India
StatesYear Marginal Small Semi- medium Medium Large
State Statistical Handbook 2014 237

(1) (2) (3) (4) (5) (6) (7)
India 217554 577602354 83670291 222120 602594536 85194869
Andhra Pradesh 27708 39093376 6705275 15358 20712819 2382242
Assam 3019 5292766 654789 3303 4985210 629229
Bihar 3231 6016746 564392 3345 5168030 130356
Gujarat 22220 99841317 8769124 22587 111639522 11887604
Haryana 6142 24395636 2985298 6163 27807701 3883175
Karnataka 11460 39484010 10316487 11753 39950881 5347936
Kerala 7031 11158670 926623 7129 12179092 1171460
Madhya Pradesh 4286 15658407 1895071 4206 16392982 2146115
Maharashtra 28215 100537793 15676558 28949 102203201 17872932
Orissa 2678 11541915 1820476 2854 11369603 1805725
Punjab 12593 17811875 3293945 12427 17103386 1984470
Rajasthan 8444 19045480 3926264 8782 19938133 3013961
Tamil Nadu 36996 60963540 7695571 36869 61952533 9136446
Uttar Pradesh 14090 33265470 3714441 14440 36132854 4111251
West Bengal 8402 23320091 2055832 8607 24718679 2228051
Union Territories and other States 21039 70175262 12670145 35348 90339910 17463916Note : All electricity undertakings Source : Annual Survey of Industries, 2012-13 other than captive units and
& 2011-12(Summary Results for factory all departmental undertakings
sector), Govt. of India, CSO.
like railway workshops are kept outside the purview of ASI.
Appendix XIIRegistered Factories Covered By Annual Survey of Industries for Major States in India
(Factory Sector)
2011-12 2012-13
States/ Union Territories Number of Factories
Value of output (` in lakh)
Net value added by manufacture
(` in lakh)
Number of Factories
Value of output (` in lakh)
Net value added by manufacture
(` in lakh)
State Statistical Handbook 2014 238

2010-11 2011-12 2012-13(P) 2010-11 2011-12 2012-13(P) 2010-11 2011-12 2012-13(P)
(1) (2) (3) (4) (5) (6) (7) (8) (9) (10)
India 3961417 3835703 3322674 6202104 7017191 7471866 6880413 6954541 6912912
Andhra Pradesh 4782 6917 5980 811061 900081 916958 55687 55687 53862
Assam – – – 40726 39880 35912 861969 917474 887895
Bihar – – – – – – – – –
Jharkhand 169072 209686 211870 1857162 1398876 1756654 – – –
Gujarat – – – – – – 1078146 1055323 973344
Goa 749123 699488 224240 – – – – – –
Haryana – – – – – – – – –
Karnataka 790981 319853 358116 – – – – – –
Madhya Pradesh 7853 8016 8531 936736 833055 937397 – – –
Chhattishgarh 717121 987425 876742 582562 707403 907507 – – –
Maharashtra 13326 15717 11861 536288 531126 623568 – – –
Orissa 1509077 1588530 1623354 735453 963990 472568 – – –
Rajasthan 82 80 1980 – – – 940114 1196276 1568925
Tamil Nadu – – – – – – 42542 45098 43454
Meghalaya – – – 257968 477398 373650 – – –
Uttar Pradesh – – – 151223 343695 358442 – – –
West Bengal – – – 281641 806621 1083988 – – –
Arunachal Pradesh – – – 11060 14641 4836 21179 21545 22092
Jammu & Kashmir – – – 224 425 404 – – –
P- Provisional Source: Indian Minerals YearBook 2013, Vol - III
Appendix - XIIIValue of Minerals and Ores Produced in Major States of India
(` in Lakh)Iron PetroliumCoal
States/ Area
State Statistical Handbook 2014 239

Primary Middle School Secondary
Stage Stage Stage
(1) (2) (3) (4)
Andhra Pradesh 7085 3735 2139
Assam 2923 1352 761
Bihar 15651 5055 2245
Gujarat 6582 2862 1430
Haryana 2284 1250 7450
Karnataka 5520 3075 1720
Kerala 2290 1629 1090
Madhya Pradesh 10657 4764 2199
Maharashtra 10337 5849 3117
Orissa 4438 1928 1001
Punjab 2588 1401 840
Rajasthan 8657 3740 2103
Tamil Nadu 6668 3858 1874
Uttar Pradesh 28993 10828 6831
West Bengal 9834 4662 2346
All India 139870 63006 34053
Appendix XIV
Student Enrolment in Educational Institution in Major States of India, 2011-12
No. of Students enrolled ('000)
Source: (i) Statistics of School Education 2011-12, Ministry of Human Resource Development,Govt. of India.
(As on 30.09.2011)
State
State Statistical Handbook 2014 240
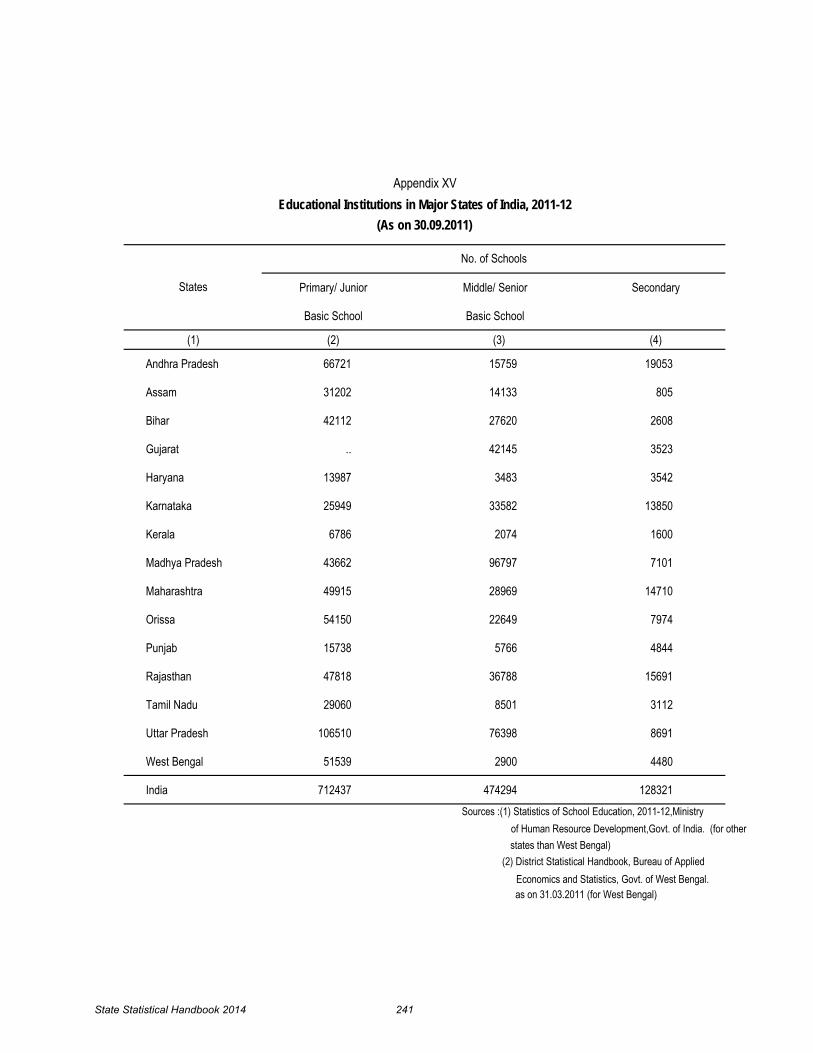
Primary/ Junior Middle/ Senior Secondary
Basic School Basic School
(1) (2) (3) (4)
Andhra Pradesh 66721 15759 19053
Assam 31202 14133 805
Bihar 42112 27620 2608
Gujarat .. 42145 3523
Haryana 13987 3483 3542
Karnataka 25949 33582 13850
Kerala 6786 2074 1600
Madhya Pradesh 43662 96797 7101
Maharashtra 49915 28969 14710
Orissa 54150 22649 7974
Punjab 15738 5766 4844
Rajasthan 47818 36788 15691
Tamil Nadu 29060 8501 3112
Uttar Pradesh 106510 76398 8691
West Bengal 51539 2900 4480
India 712437 474294 128321
Economics and Statistics, Govt. of West Bengal. as on 31.03.2011 (for West Bengal)
No. of Schools
Appendix XVEducational Institutions in Major States of India, 2011-12
Sources :(1) Statistics of School Education, 2011-12,Ministry
(2) District Statistical Handbook, Bureau of Applied
(As on 30.09.2011)
States
of Human Resource Development,Govt. of India. (for other states than West Bengal)
State Statistical Handbook 2014 241

Boys Girls Total Boys Girls Total Boys Girls Total
(1) (2) (3) (4) (5) (6) (7) (8) (9) (10)
Andhra Pradesh 15.9 15.3 15.6 28.6 27.7 28.2 45.5 46.3 45.9
Assam 35.6 28.7 32.2 46.4 54.1 50.2 74.1 70.7 72.4
Bihar 38.0 30.7 34.8 58.6 51.1 55.5 70.8 71.9 71.3
Gujarat 38.1 8.3 27.1 50.2 40.8 46.7 49.5 59.3 54.1
Haryana 7.2 7.0 7.1 2.5 - 1.2 23.6 18.5 21.3
Karnataka 4.3 4.2 4.3 13.0 13.8 13.4 37.9 36.6 37.3
Kerala - - - - - - - - -
Madhya Pradesh 31.2 23.1 27.4 46.4 43.3 44.9 32.0 53.7 42.3
Maharashtra 9.0 10.2 9.5 24.3 29.0 26.5 35.9 38.8 37.3
Orissa 17.4 13.5 15.5 55.8 58.3 57.0 62.3 61.6 61.9
Punjab - 7.0 - - - - - 2.2 -
Rajasthan 43.2 43.4 43.3 55.3 58.5 56.7 54.3 69.4 61.7
Tamil Nadu - - - - - - 41.0 35.0 38.1
Uttar Pradesh 15.3 22.2 18.6 49.2 51.3 50.2 44.2 50.7 47.2
West Bengal 27.6 20.8 24.3 46.2 37.8 42.1 62.6 58.5 60.6
India 23.4 21.0 22.3 41.5 40.0 40.8 48.6 52.2 50.3
Source: Statistics of School Education, 2011-12,
Ministry of Human Resource Development,
Govt of India.
Class I-V Class I-VIII Class I-X
Appendix XVI
Dropout Rates in Major States of India 2011-12 (As on 30.09.2011)
States
State Statistical Handbook 2014 242

2009-10 2010-112011-12(As on
30.09.2011)2009-10 2010-11 2011-12
(As on 30.09.2011)
(1) (2) (3) (4) (5) (6) (7)
Andhra Pradesh 32 31 30 29 25 22
Assam 28 28 28 22 17 17
Bihar 80 76 82 59 51 47
Gujarat 30 - .. 29 35 36
Haryana 52 51 51 26 38 38
Karnataka 18 17 17 24 27 27
Kerala 30 23 22 27 25 25
Madhya Pradesh 41 38 38 32 39 39
Maharashtra 33 29 29 34 32 31
Orissa 33 33 32 22 26 26
Punjab 35 26 33 29 15 28
Rajasthan 44 46 48 22 26 25
Tamil Nadu 43 27 26 38 32 26
Uttar Pradesh 67 79 73 57 69 43
West Bengal 34 36 30 51 70 255
India 42 43 41 30 33 34
Human Resource Development. Govt. of India.
Appendix XVIIPupil Teacher Ratio by Stages of Education in Major States of India
Primary Level Upper Primary Level
Source: Statistics of School Education, Ministry of
States
State Statistical Handbook 2014 243
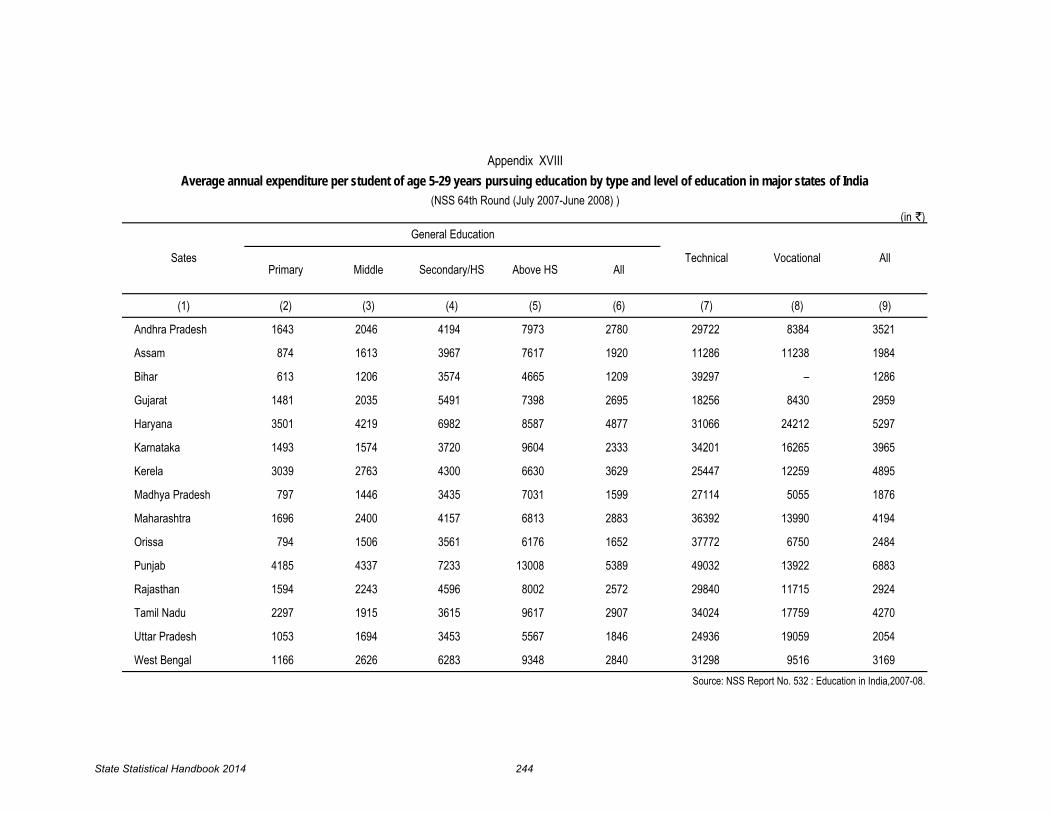
(in `)
(1) (2) (3) (4) (5) (6) (7) (8) (9)
Andhra Pradesh 1643 2046 4194 7973 2780 29722 8384 3521
Assam 874 1613 3967 7617 1920 11286 11238 1984
Bihar 613 1206 3574 4665 1209 39297 – 1286
Gujarat 1481 2035 5491 7398 2695 18256 8430 2959
Haryana 3501 4219 6982 8587 4877 31066 24212 5297
Karnataka 1493 1574 3720 9604 2333 34201 16265 3965
Kerela 3039 2763 4300 6630 3629 25447 12259 4895
Madhya Pradesh 797 1446 3435 7031 1599 27114 5055 1876
Maharashtra 1696 2400 4157 6813 2883 36392 13990 4194
Orissa 794 1506 3561 6176 1652 37772 6750 2484
Punjab 4185 4337 7233 13008 5389 49032 13922 6883
Rajasthan 1594 2243 4596 8002 2572 29840 11715 2924
Tamil Nadu 2297 1915 3615 9617 2907 34024 17759 4270
Uttar Pradesh 1053 1694 3453 5567 1846 24936 19059 2054
West Bengal 1166 2626 6283 9348 2840 31298 9516 3169
Appendix XVIIIAverage annual expenditure per student of age 5-29 years pursuing education by type and level of education in major states of India
(NSS 64th Round (July 2007-June 2008) )
General Education
Source: NSS Report No. 532 : Education in India,2007-08.
SatesPrimary Middle
Technical Vocational AllAllAbove HSSecondary/HS
State Statistical Handbook 2014 244

Class VI-VIII
Boys Girls Total Boys Girls Total Boys Girls Total
(1) (2) (3) (4) (5) (6) (7) (8) (9) (10)
Andhra Pradesh 92.2 93.6 92.8 76.5 78.5 77.5 86.1 87.7 86.9
Assam 79.9 83.2 81.5 64.3 67.1 65.7 74.2 77.3 75.7
Bihar 100.1 97.7 99.0 66.4 63.8 65.2 88.9 86.6 87.8
Gujarat 110.1 110.8 110.4 80.7 75.2 78.2 98.9 97.2 98.1
Haryana 85.9 93.9 89.5 76.7 83.6 79.8 82.4 90.0 85.8
Karnataka 103.8 101.4 102.6 91.9 90.2 91.1 99.2 97.1 98.2
Kerala 87.4 87.2 87.3 97.8 95.2 96.5 91.4 90.4 90.9
Madhya Pradesh 121.6 127.1 124.3 93.3 97.8 95.5 111.2 116.3 117.7
Maharashtra 102.5 101.6 102.1 93.5 90.9 92.3 99.0 97.5 98.3
Orissa 107.6 105.8 106.7 75.2 73.3 74.3 95.2 93.2 94.2
Punjab 106.7 106.6 106.6 92.8 91.9 92.4 101.3 101.0 101.2
Rajasthan 104.6 103.8 104.2 80.7 73.2 77.2 95.8 92.5 94.3
Tamil Nadu 114.8 116.7 115.7 104.9 105.9 105.4 110.9 112.5 111.7
Uttar Pradesh 109.1 112.9 110.9 77.2 71.2 74.4 97.7 98.0 97.8
West Bengal 113.7 116.9 115.3 81.9 92.3 87.0 101.4 107.4 104.4
All India 105.8 107.1 106.5 82.5 81.4 82.0 97.2 97.6 97.4Source: Statistics of School Education,2011-12,
Ministry of Human Resource Development. Govt. of India.
Categories of Students
Appendix XIXGross Enrolment Ratio (GER) in Major States of India 2011-12
Class I-V Class I-VIII
(As on 30.09.2011)
States
State Statistical Handbook 2014 245

2011-12 2012-13 2013-14 2011-12 2012-13 2013-14 2011-12 2012-13 2013-14 2011-12 2012-13 2013-14
(1) (2) (3) (4) (5) (6) (7) (8) (9) (10) (11) (12) (13)
Andhra Pradesh 12998 13792 17495 60409 53691 50997 .. .. .. .. .. ..
Assam 513 513 1140 1799 1762 1845 .. .. .. .. .. ..
Bihar 510 544 2198 167 .. .. .. .. .. .. .. ..
Gujarat 18999 22782 27420 67315 81141 90735 .. .. .. .. .. ..
Haryana 4856 5817 8279 18557 17934 19260 .. .. .. .. .. ..
Karnataka 11797 12126 13978 38373 38504 42650 .. .. .. .. .. ..
Kerala 2475 2487 3892 8147 5319 8281 .. .. .. .. .. ..
Madhya Pradesh 4988 6325 13562 18884 20358 25139 .. .. .. .. .. ..
Maharashtra 20350 23727 34006 71958 77170 82488 .. .. .. .. .. ..
Orissa 4379 5329 7722 14689 16338 20049 .. .. .. .. .. ..
Punjab 5239 5633 8354 23695 21938 20731 .. .. .. .. .. ..
Rajasthan 7952 9864 14124 29041 31343 33215 .. .. .. .. .. ..
Tamil Nadu 14118 15603 21063 33756 31463 37648 .. .. .. .. .. ..
Uttar Pradesh 8328 9361 14394 28092 37157 44715 .. .. .. .. .. ..
West Bengal 7622 7572 8959 35692 35195 32605 .. .. .. .. .. ..
All India 139944 157984 243029 512882 536086 582245 .. .. .. .. .. ..
: Source: 1) Website of Centre for Monitoring Indian Economy Pvt. Ltd. (CMIE).
2) Central Electric Authority
(Million KWH)
State annual per capita consumption
(Utilities and Non-utilities only )
(KWH)
Appendix XX
Installed Capacity, Gross Energy Generated, Energy Sold and Per Capita Consumption of Energy in Major States of India
Gross energy generated (Utilities only)
(Million KWH)
Installed capacity (Utilities only)
(1000 KW)
Total energy sold to ultimate consumers
(Utilities/ Non-utilities only)States
State Statistical Handbook 2014 246

States 1995 2000 2009 2010 2011 2012 2013
(1) (2) (3) (4) (5) (6) (7) (8)
Andhra Pradesh 100.0 100.0 100.0 100.0 100.0 100.0 100.0
Bihar 70.7 70.9 61.3 61.3 77.5 89.9 94.7
Gujarat 100.0 100.0 99.7 99.8 99.8 99.8 100.0
Haryana 100.0 100.0 100.0 100.0 100.0 100.0 100.0
Karnataka 100.0 98.6 99.9 99.9 99.9 100.0 99.9
Kerala 100.0 100.0 100.0 100.0 100.0 100.0 100.0
Madhya Pradesh 94.2 95.6 96.4 96.4 97.1 97.2 97.0
Maharashtra 100.0 100.0 88.3 89.1 99.8 99.9 99.9
Orissa 71.2 74.9 62.6 62.6 76.5 78.9 91.8
Punjab 100.0 100.0 100.0 100.0 100.0 100.0 100.0
Rajasthan 85.6 93.6 69.2 71.1 95.0 96.2 90.2
Tamil Nadu 100.0 100.0 100.0 100.0 100.0 100.0 100.0
Uttar Pradesh 75.8 79.0 88.3 88.3 88.3 88.3 98.7
West Bengal 76.6 78.0 97.3 99.5 99.5 99.9 99.9
All India 86.0 86.3 83.7 84.4 92.1 93.8 96.5Notes: Sources: 1) Central Electricity Authority.1. As per latest definition of village
2) Centre for Monitoringelectrification notified by Govt. of India Indian Economy in 1997, there has been a downward revisionfrom earlier figures for village electrification. As a result, the percentages had declined in some states.
2. From 2005 onwards percentage is calculated considering no. of inhabited villages of 2001, Census of India.
3. From 2013 onwards percentage is calculated considering no. of inhabited villages of 2011, Census of India.
Appendix XXIPercentage of Villages Electrified in Major States of India
(As on 31st March)
State Statistical Handbook 2014 247

(` in Crore)
2008-09 2009-10 2010-11 2011-12 2012-13 2013-14(upto Feb 2014)
(1) (2) (3) (4) (5) (6) (7)
Andhra Pradesh (-)678.15 2283.34 1893.17 (-)1569.00 (-)1376.15 (-)958.1
Bihar 1033.1 2075.97 1964.44 814.97 828.60 1668.49
Gujarat (-)1173.83 3780.34 1852.66 (-)2593.98 (-)1304.82 365.84
Haryana (-)561.81 1107.48 834.88 (-)456.48 (-)142.63 437.69
Karnataka (-)1096.39 894.61 1169.02 (-)1871.96 (-)698.54 237.67
Kerala (-)921.78 (-)188.77 199.4 (-)579.17 161.85 220.49
Madhya Pradesh (-)353.63 963.1 1290.84 157.76 1203.23 1617.24
Maharashtra (-)1207.85 3063.98 3969.95 (-)2748.02 (-)1643.14 (-)46.14
Orissa 161.82 1011.4 1127.79 68.11 408.89 1007.7
Punjab (-)506.09 1731.56 560.1 (-)1011.51 295.97 1013.49
Rajasthan (-)1952.11 (-)931.39 (-)16.10 (-)1606.03 (-)833.15 (-)35.86
Tamil Nadu (-)841.93 2016.94 799.63 (-)1897.94 (-)1191.94 (-)446.01
Uttar Pradesh 427.47 4976.9 3988.14 656.06 1786.87 3487.74
West Bengal* 1115.1 8985.38 8409.45 (-)987.22 125.71 2399.22
All India (-)8539.69 37915.2 36118.79 (-)13323.17(R) (-)570.99 15476.85* Post Office Savings only. Sources: 1) Directorate of Small Savings,
West Bengal.2) Ministry of Finance, Department of
Economic Affairs,Government of India, New Delhi.
3) National Savings Commissioner
Net Savings*States
Appendix XXIISmall Savings Collections by Major States
State Statistical Handbook 2014 248
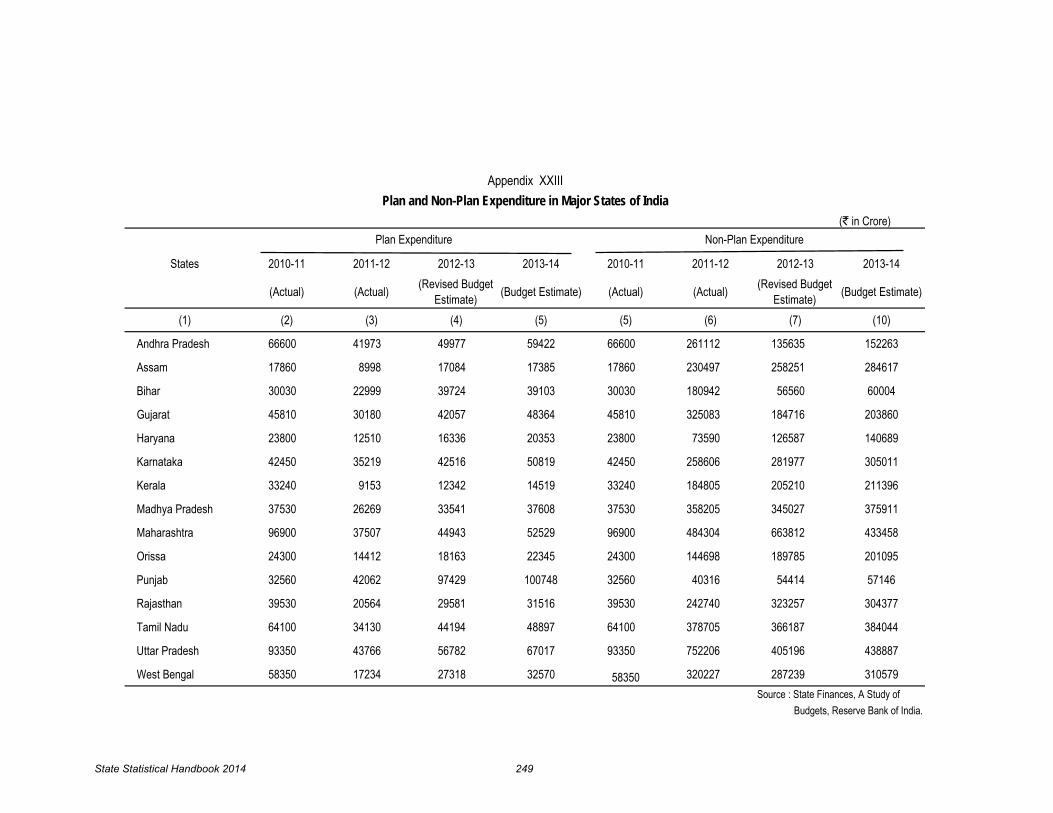
(` in Crore)
States 2010-11 2011-12 2012-13 2013-14 2010-11 2011-12 2012-13 2013-14
(Actual) (Actual) (Revised Budget Estimate) (Budget Estimate) (Actual) (Actual) (Revised Budget
Estimate) (Budget Estimate)
(1) (2) (3) (4) (5) (5) (6) (7) (10)
Andhra Pradesh 66600 41973 49977 59422 66600 261112 135635 152263
Assam 17860 8998 17084 17385 17860 230497 258251 284617
Bihar 30030 22999 39724 39103 30030 180942 56560 60004
Gujarat 45810 30180 42057 48364 45810 325083 184716 203860
Haryana 23800 12510 16336 20353 23800 73590 126587 140689
Karnataka 42450 35219 42516 50819 42450 258606 281977 305011
Kerala 33240 9153 12342 14519 33240 184805 205210 211396
Madhya Pradesh 37530 26269 33541 37608 37530 358205 345027 375911
Maharashtra 96900 37507 44943 52529 96900 484304 663812 433458
Orissa 24300 14412 18163 22345 24300 144698 189785 201095
Punjab 32560 42062 97429 100748 32560 40316 54414 57146
Rajasthan 39530 20564 29581 31516 39530 242740 323257 304377
Tamil Nadu 64100 34130 44194 48897 64100 378705 366187 384044
Uttar Pradesh 93350 43766 56782 67017 93350 752206 405196 438887
West Bengal 58350 17234 27318 32570 58350 320227 287239 310579
Budgets, Reserve Bank of India.
Plan and Non-Plan Expenditure in Major States of India
Plan Expenditure Non-Plan Expenditure
Appendix XXIII
Source : State Finances, A Study of
State Statistical Handbook 2014 249

(` in Crore)
2011-12 2012-13 2013-14 2011-12 2012-13 2013-14
(Actual) (Revised Budget Estimate) (Budget Estimate) (Actual) (Revised Budget
Estimate) (Budget Estimate)
(1) (2) (3) (4) (5) (6) (7)
Andhra Pradesh 53283 62573 72444 17751 20270 24131
Assam 7638 8250 8984 12612 16455 20963
Bihar 12612 16455 20963 27935 33027 37981
Gujarat 44252 52549 60208 7780 9200 10120
Haryana 20400 24290 28784 2682 3170 3484
Karnataka 46476 53493 62464 11075 12500 15056
Kerala 25719 31702 38771 5990 6841 8144
Madhya Pradesh 26973 29571 33382 18219 21540 23694
Maharashtra 87608 100561 107260 13343 15214 18112
Orissa 13443 15310 17605 12229 13481 15904
Punjab 18841 24318 28524 3554 4034 4832
Rajasthan 25377 30206 34053 14977 17103 20361
Tamil Nadu 59517 73560 86065 12715 14520 17286
Uttar Pradesh 52613 60472 72193 50351 59528 68458
West Bengal 24938 32405 39784 18588 21226 25270 Source : State Finances, A Study of
Budgets, Reserve Bank of India.
States
Appendix XXIVState Tax Revenue and Share in Centrally Levied Taxes in some Major States of India
State Tax Revenue Share in Centrally Levied Taxes
State Statistical Handbook 2014 250

(` in Crore)
(1) (2) (3) (4)Andhra Pradesh 60326 73788 86215
Assam 14375 22722 23238
Bihar 28767 45105 47784
Gujarat 38064 46460 50065
Haryana 21696 28487 31563
Karnataka 44326 57803 65693
Kerala 22356 26276 31023
Madhya Pradesh 33262 42319 47566
Maharashtra 79681 94070 98543
Orissa 23071 27127 30395
Punjab 15511 24436 24628
Rajasthan 34672 46340 52680
Tamil Nadu 47404 60099 67156
Uttar Pradesh 65683 82721 91772
West Bengal 40533 49873 53487Source : State Finances,
A Study of Budgets,Reserve Bank of India.
States
Developmental Expenditure
Appendix XXVDevelopmental Expenditure in Major States of India
2011-12 (Actual) 2012-13 (Revised Budget Estimate)
2013-14 (Budget Estimate)
State Statistical Handbook 2014 251

Rural Urban Total
(1) (2) (3) (4) (5)
West Bengal 2161748 602306 2764054 16.06
Uttar Pradesh 1449010 892130 2341139 13.60
Tamil Nadu 681150 971091 1652241 9.60
Andhra Pradesh 998732 621600 1620332 9.41
Gujarat 268817 1147838 1416655 8.23
Maharashtra 629288 755955 1385243 8.05
Madhya Pradesh 543932 340130 884062 5.14
Karnataka 536734 324103 860837 5.00
Rajasthan 314633 312725 627358 3.65
Odisha 548062 67116 615179 3.57
Kerala 334231 167849 502080 2.92
Bihar 375751 72328 448080 2.60
Punjab 161633 225688 387320 2.25
Assam 189919 28640 218559 1.27
Haryana 80874 108788 189662 1.10
Other States & Union Territories 840568 456901 1297468 7.55
All India 10115082 7095188 17210269 100.00Source: NSS Report No. 549: Economic Characteristics of Unincorporated
Non-agricultural Enterprises (Excluding Construction) in India.
Appendix XXVIEstimated number of manufacturing enterprises in India
(NSS 67th Round, July 2010-June 2011)
Number of enterprisesState / UT % share to total
State Statistical Handbook 2014 252

Rural Urban Total
(1) (2) (3) (4) (5)West Bengal 22238 5290 27528 16.13Uttar Pradesh 17045 6549 23594 13.82Andhra Pradesh 10852 4480 15332 8.98Tamil Nadu 8503 6316 14819 8.68Maharashtra 5562 5703 11265 6.60Karnataka 6632 2986 9618 5.63Orissa 8709 863 9572 5.61Madhya Pradesh 5645 2901 8546 5.01Bihar 6634 1090 7724 4.52Kerala 4928 1659 6587 3.86Gujarat 3008 3536 6544 3.83Rajasthan 4009 2356 6365 3.73Assam 3330 378 3708 2.17Punjab 1502 1430 2932 1.72Haryana 1197 1104 2301 1.35Other States & Union Territories 11489 2784 14273 8.36All India 121283 49425 170708 100.00
Note :Major States excluding other States & UTs are listed in descending order of number of enterprises.
Source: NSS Report No. 524: Operational Characteristics of Unorganised Manufacturing Enterprises In India
Appendix XXVI (Contd.)Unorganised Manufacturing Enterprises in India
(NSS 62nd Round, July 2005 - June 2006)
States/UTs
Number of enterprises (in hundred)
% share of total
State Statistical Handbook 2014 253

Rural Urban Total
(1) (2) (3) (4) (5)
Uttar Pradesh 1890852 1524926 3415778 16.46
West Bengal 1239538 1023434 2262971 10.91
Maharashtra 629289 1239499 1868788 9.01
Andhra Pradesh 847715 753680 1601395 7.72
Tamil Nadu 428028 843304 1271332 6.13
Gujarat 364548 811783 1176331 5.67
Odisha 864985 208718 1073703 5.17
Madhya Pradesh 473158 517343 990501 4.77
Karnataka 418944 559714 978659 4.72
Bihar 723839 231185 955025 4.60
Rajasthan 402876 376338 779214 3.76
Kerala 357051 220873 577924 2.79
Punjab 185337 373314 558651 2.69
Assam 431787 126532 558318 2.69
Haryana 196703 263465 460168 2.22
Other States & Union Territories 1109968 1111978 2221946 10.69
All India 10564618 10186086 20750704 100.00
Non-agricultural Enterprises (Excluding Construction) in India.
Source: N.S.S. 67th Round, 2010-11. N.S.S Report No. 549: Economic Characteristics of Unincorporated
Appendix XXVIIEstimated number of trading enterprises in India
(NSS 67th Round, July 2010-June 2011)
State / UTNumber of enterprises
% share to total
State Statistical Handbook 2014 254

Rural Urban Total
(1) (2) (3) (4) (5)
Uttar Pradesh 1385363 1241189 2626552 13.32
Andhra Pradesh 1446643 931841 2378484 12.07
West Bengal 1314838 946138 2260976 11.47
Maharasthra 667358 1235090 1902448 9.65
Tamil Nadu 564515 978936 1543451 7.83
Gujarat 295430 746675 1042105 5.29
Karnataka 455969 515782 971751 4.93
Bihar 715698 189804 905503 4.59
Kerala 492122 290160 782282 3.97
Odisha 573237 182699 755936 3.83
Rajasthan 382493 353370 735863 3.73
Madhya Pradesh 311985 407852 719837 3.65
Punjab 214813 282247 497059 2.52
Haryana 158477 248425 406902 2.06
Assam 303290 70898 374188 1.90
Other States & Union Territo 929163 879833 1808995 9.19
All India 10211394 9500939 19712332 100.00 Source: N.S.S. 67th Round, 2010-11. NSS Report No. 549: Economic Characteristics of Unincorporated Non-agricultural Enterprises (Excluding Construction) in India.
Appendix XXVIIIEstimated number of 'other service' enterprises in India
(NSS 67th Round, July 2010-June 2011)
State / UTNumber of enterprises
% share to total
State Statistical Handbook 2014 255

Rural Urban Total
(1) (2) (3) (4) (5)
Uttar Pradesh 3056567 2169363 5225929 14.98
West Bengal 3680703 1325558 5006261 14.35
Tamil Nadu 1276930 2236997 3513927 10.07
Maharashtra 1113997 2104883 3218880 9.23
Gujarat 654639 2560346 3214985 9.22
Andhra Pradesh 1854827 1249274 3104102 8.90
Madhya Pradesh 918811 616052 1534863 4.40
Karnataka 831946 677060 1509006 4.33
Odisha 1122502 143512 1266014 3.63
Rajasthan 524764 694957 1219722 3.50
Kerala 608811 369090 977902 2.80
Punjab 240429 533325 773754 2.22
Bihar 594291 156973 751265 2.15
Haryana 215321 252452 467773 1.34
Assam 344013 78012 422025 1.21
Other States & Union Territories 1471800 1210229 2682026 7.67
All India 18510351 16378083 34888434 100.00 Source: N.S.S. 67th Round, 2010-11. NSS Report No. 549: Economic Characteristics of Unincorporated Non-agricultural Enterprises (Excluding Construction) in India.
Appendix XXIXEstimated number of workers in manufacturing sector in India
(NSS 67th Round, July 2010-June 2011)
Number of workersStates/UTs % share to total
State Statistical Handbook 2014 256
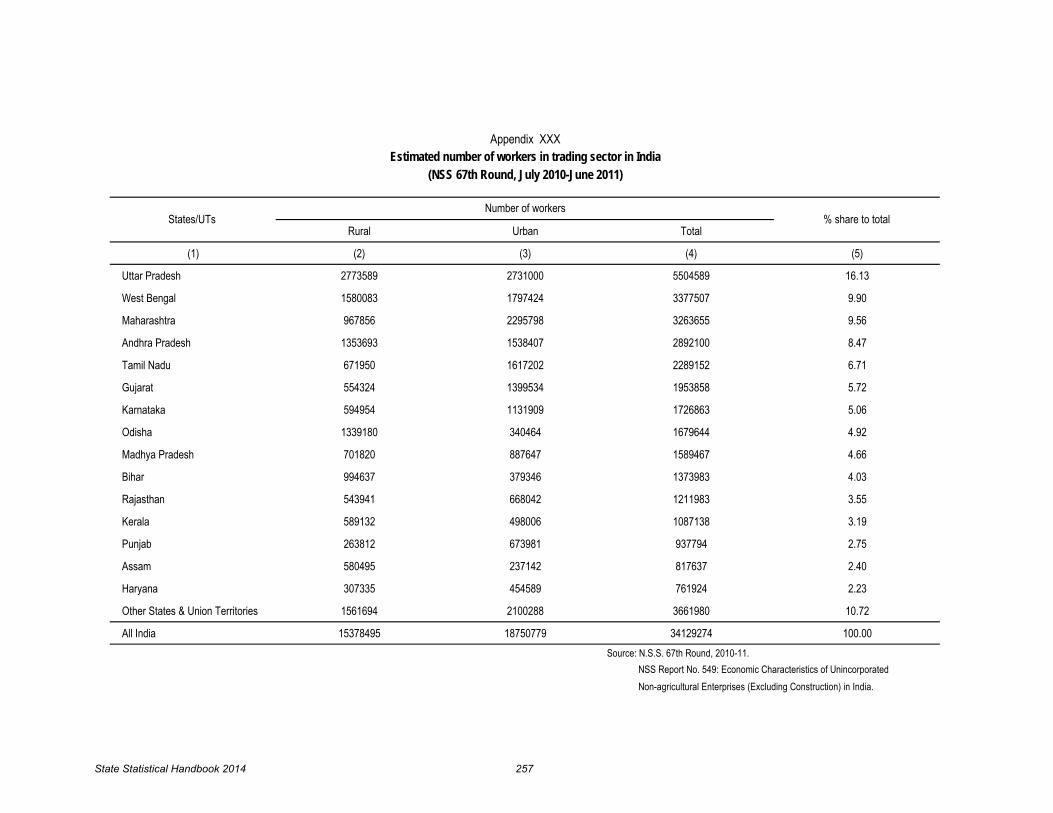
Rural Urban Total
(1) (2) (3) (4) (5)
Uttar Pradesh 2773589 2731000 5504589 16.13
West Bengal 1580083 1797424 3377507 9.90
Maharashtra 967856 2295798 3263655 9.56
Andhra Pradesh 1353693 1538407 2892100 8.47
Tamil Nadu 671950 1617202 2289152 6.71
Gujarat 554324 1399534 1953858 5.72
Karnataka 594954 1131909 1726863 5.06
Odisha 1339180 340464 1679644 4.92
Madhya Pradesh 701820 887647 1589467 4.66
Bihar 994637 379346 1373983 4.03
Rajasthan 543941 668042 1211983 3.55
Kerala 589132 498006 1087138 3.19
Punjab 263812 673981 937794 2.75
Assam 580495 237142 817637 2.40
Haryana 307335 454589 761924 2.23
Other States & Union Territories 1561694 2100288 3661980 10.72
All India 15378495 18750779 34129274 100.00Source: N.S.S. 67th Round, 2010-11. NSS Report No. 549: Economic Characteristics of Unincorporated Non-agricultural Enterprises (Excluding Construction) in India.
Appendix XXXEstimated number of workers in trading sector in India
(NSS 67th Round, July 2010-June 2011)
States/UTs Number of workers
% share to total
State Statistical Handbook 2014 257

Rural Urban Total
(1) (2) (3) (4) (5)
Andhra Pradesh 4126264 2089656 6215920 15.95
Uttar Pradesh 2431609 2616423 5048032 12.96
Maharashtra 1303229 2351457 3654686 9.38
West Bengal 1742664 1733226 3475890 8.92
Tamil Nadu 1105243 2156396 3261639 8.37
Karnataka 783960 1369741 2153701 5.53
Odisha 1565143 421546 1986689 5.10
Gujarat 456237 1345077 1801314 4.62
Kerala 1023768 715033 1738801 4.46
Rajasthan 653279 696771 1350051 3.47
Madhya Pradesh 523435 793480 1316915 3.38
Bihar 941933 369428 1311361 3.37
Punjab 355517 480451 835968 2.15
Haryana 245880 426759 672639 1.73
Assam 473485 131419 604904 1.55
Other States & Union Territories 1561812 1970845 3532657 9.06
All India 19293458 19667708 38961167 100.00Source: N.S.S. 67th Round, 2010-11. NSS Report No. 549: Economic Characteristics of Unincorporated Non-agricultural Enterprises (Excluding Construction) in India.
Appendix XXXIEstimated number of workers in 'other services' sector in India
(NSS 67th Round, July 2010-June 2011)
States/UTs Number of workers
% share to total
State Statistical Handbook 2014 258

Domestic Foreign Domestic Foreign Domestic Foreign Domestic Foreign
(1) (2) (3) (4) (5) (6) (7) (8) (9)
Andhra Pradesh 1557.896 3.228 1531.198 2.646 2072.179 2.928 1521.022 2.235
Arunachal Pradesh 2.279 0.034 2.332 0.048 1.322 0.051 1.255 0.108
Assam 40.509 0.152 43.395 0.164 45.114 0.175 46.845 0.176
Bihar 184.918 6.357 183.975 9.725 214.471 10.969 215.883 7.658
Goa 22.018 4.411 22.250 4.459 23.375 4.505 26.292 4.923
Gujarat 188.613 1.307 210.175 1.660 243.790 1.742 274.125 1.988
Haryana 69.153 1.064 59.881 1.304 67.992 2.330 7.128 2.228
Himachal Pradesh 128.120 4.536 146.049 4.845 156.460 5.003 147.156 4.142
Jammu & Kashmir 99.732 0.481 130.715 0.716 124.271 0.788 136.424 0.608
Karnataka 382.021 3.810 841.074 5.740 940.527 5.954 980.101 6.364
Kerala 85.951 6.593 93.815 7.330 100.769 7.937 108.578 8.581
Madhya Pradesh 380.796 2.504 441.198 2.696 531.972 2.759 631.107 2.803
Maharashtra * 484.655 50.831 553.335 48.154 748.161 26.519 827.006 41.563
Manipur 1.141 0.004 1.345 0.006 1.345 0.007 140.673 0.191
Meghalaya 6.528 0.042 6.675 0.048 6.803 0.053 6.913 0.068
Mizoram 0.573 0.007 0.622 0.007 0.642 0.007 0.634 0.008
Nagaland 0.211 0.011 0.254 0.021 0.359 0.025 0.356 0.033
Orissa 75.916 0.504 82.713 0.607 90.529 0.647 98.001 0.667
Punjab 105.835 1.371 164.166 1.510 190.561 1.438 213.409 2.041
Rajasthan 255.439 12.785 271.373 13.520 286.118 14.514 302.982 14.372
Sikkim 7.000 0.208 5.525 0.236 5.585 0.265 5.768 0.317
Tamil Nadu 1191.882 28.045 1375.130 33.739 1841.368 35.617 2442.325 39.905
Tripura 3.423 0.052 3.595 0.060 3.618 0.078 3.596 0.119
Uttar Pradesh 1447.550 17.327 1554.304 18.871 1683.813 19.945 2265.310 20.544
West Bengal 210.723 11.922 222.570 12.133 227.302 12.196 255.473 12.452
Andaman & Nicobar Islands 1.808 0.146 2.022 0.158 2.387 0.175 2.437 0.147
Chandigarh* 9.055 0.393 9.099 0.372 9.246 0.341 9.369 0.401
Daman & Diu 7.742 0.051 8.329 0.045 8.040 0.046 8.199 0.481
Delhi ** 135.584 18.937 154.289 21.599 184.951 23.460 202.152 23.014
Dadra & Nagar Haveli 4.956 0.017 4.223 0.014 4.692 0.012 4.816 0.016
Lakshadweep 0.077 0.015 0.094 0.006 0.044 0.006 0.048 0.004
Pondichery 8.359 0.510 8.979 0.523 9.817 0.529 10.003 0.426
Uttarkhand 302.060 1.273 259.463 1.247 268.273 1.246 199.411 0.977
Jharkhand 68.853 0.157 107.963 0.725 204.210 0.319 205.112 0.460
Chattisgarh* 5.663 0.016 6.444 0.017 150.365 0.042 9.369 0.401
All-India 7477.034 179.102 8508.566 194.949 10450.475 207.315 11309.278 200.421* Estimated, using all India growth** Estimated, using tourist visits figures of sample hotels furnished of Delhi Government
Source :http://www.indiatourism.gov.in
Estimated Domestic and Foreign Tourist Arrivals in States and UTs of IndiaAppendix XXXII
State/Uts
(Figures in Lakhs)
2010 2011 2012 2013
State Statistical Handbook 2014 259
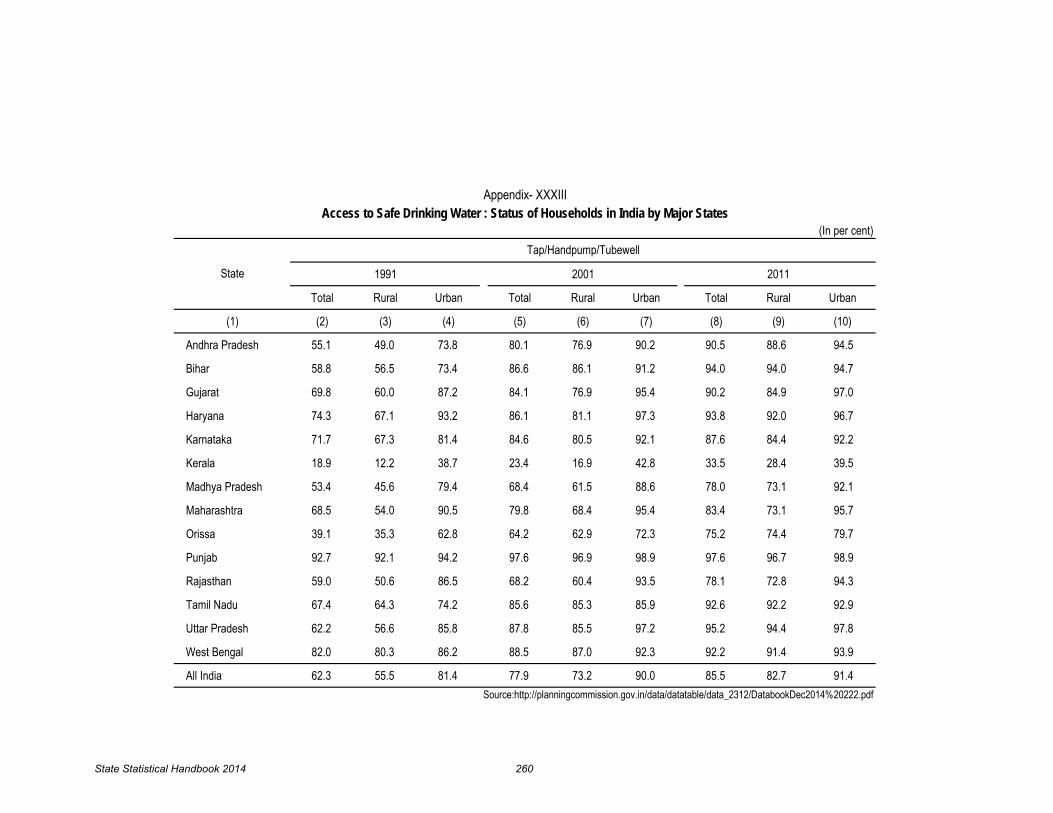
1991 2001 2011
Total Rural Urban Total Rural Urban Total Rural Urban
(1) (2) (3) (4) (5) (6) (7) (8) (9) (10)
Andhra Pradesh 55.1 49.0 73.8 80.1 76.9 90.2 90.5 88.6 94.5
Bihar 58.8 56.5 73.4 86.6 86.1 91.2 94.0 94.0 94.7
Gujarat 69.8 60.0 87.2 84.1 76.9 95.4 90.2 84.9 97.0
Haryana 74.3 67.1 93.2 86.1 81.1 97.3 93.8 92.0 96.7
Karnataka 71.7 67.3 81.4 84.6 80.5 92.1 87.6 84.4 92.2
Kerala 18.9 12.2 38.7 23.4 16.9 42.8 33.5 28.4 39.5
Madhya Pradesh 53.4 45.6 79.4 68.4 61.5 88.6 78.0 73.1 92.1
Maharashtra 68.5 54.0 90.5 79.8 68.4 95.4 83.4 73.1 95.7
Orissa 39.1 35.3 62.8 64.2 62.9 72.3 75.2 74.4 79.7
Punjab 92.7 92.1 94.2 97.6 96.9 98.9 97.6 96.7 98.9
Rajasthan 59.0 50.6 86.5 68.2 60.4 93.5 78.1 72.8 94.3
Tamil Nadu 67.4 64.3 74.2 85.6 85.3 85.9 92.6 92.2 92.9
Uttar Pradesh 62.2 56.6 85.8 87.8 85.5 97.2 95.2 94.4 97.8
West Bengal 82.0 80.3 86.2 88.5 87.0 92.3 92.2 91.4 93.9
All India 62.3 55.5 81.4 77.9 73.2 90.0 85.5 82.7 91.4Source:http://planningcommission.gov.in/data/datatable/data_2312/DatabookDec2014%20222.pdf
Appendix- XXXIIIAccess to Safe Drinking Water : Status of Households in India by Major States
(In per cent)Tap/Handpump/Tubewell
State
State Statistical Handbook 2014 260

1 Grain = 0.065 Gram1 Ounce = 28.35 Grams1 Pound = 0.4535924 Kilogram 1 Cwt = 50.802 Kilograms 1 Ton = 1016.05 Kilograms
= 1.01605 Tonnes1 Tola = 11.664 Grams1 Chattak = 58.32 Grams1 Seer = 0.9331 Kilogram 1 Maund = 37.3242 Kilograms
100 Kilograms = 1 Quintal10 Quintals = 1 Tonne
1 Foot = 0.3048 Metre1 Inch = 0.0254 Metre1 Yard = 0.9144 Metre1 Mile = 1.609344 Kilometres1 Imperial gallon = 4.54596 Litres
1 Acre = 0.404686 Hectare1 Sq. mile = 2.58999 Sq. Kilometres
= 258.999 Hectares
III. Standard of area
Conversion Table The Metric System
I. Standard of weights
II. Standard of length and capacity
State Statistical Handbook 2014 261
acer
Typewritten Text
acer
Sticky Note
Completed set by acer
acer
Sticky Note
Accepted set by acer

1 Gram = 15.432 Grains1 Gram = 0.03527 Ounce1 Kilogram = 2.2046 Pounds1 Kilogram = 0.01968 Cwt1 Kilogram = 0.0009842 Ton1 Tonne = 0.9842 Ton(Long)1 Gram = 0.08573 Tola1 Gram = 0.017147 Chattak1 Kilogram = 1.0717 Seer1 Kilogram = 0.02679 Maund
1 Metre = 3.2808 Feet1 Metre = 39.37008 Inches1 Metre = 1.0936 Yards1 Kilometre = 0.6214 Mile1 Litre = 0.21998 Gallon(Imp.)1 Litre = 0.26418 Gallon(U.S.)
1 Hectare = 2.4711 Acres1 Sq. Kilometre = 0.3861 Sq. mile1 Hectare = 0.003861 Sq. mile
II. Standard of length and capacity
III. Standard of area
Conversion Coefficientsto
The Metric System
I. Standard of weights
State Statistical Handbook 2014 262