The WEBT BL Lacertae Campaign 2001 and its extension. Optical light curves and colour analysis...
16
arXiv:astro-ph/0404155v1 7 Apr 2004 1 Astronomy & Astrophysics manuscript no. (will be inserted by hand later) The WEBT BL Lacertae Campaign 2001 and its extension Optical light curves and colour analysis 1994–2002 M. Villata 1 , C. M. Raiteri 1 , O. M. Kurtanidze 2,3,4 , M. G. Nikolashvili 2 , M. A. Ibrahimov 5 , I. E. Papadakis 6,7 , G. Tosti 8 , F. Hroch 9 , L. O. Takalo 10 , A. Sillanp¨a¨ a 10 , V. A. Hagen-Thorn 11,12 , V. M. Larionov 11,12 , R. D. Schwartz 13 , J. Basler 13 , L. F. Brown 14 , T. J. Balonek 15 , E. Ben´ ıtez 16 , A. Ram´ ırez 16 , A. C. Sadun 17 , P. Boltwood 18 , M. T. Carini 19 , D. Barnaby 19 , J. M. Coloma 20 , J. A. Ros 20 , B. Z. Dai 21,22,23 , G. Z. Xie 21,22,23 , J. R. Mattox 24 , D. Rodriguez 25 , I. M. Asfandiyarov 5 , A. Atkerson 19 , J. L. Beem 14 , S. D. Bloom 26 , S. M. Chanturiya 2 , S. Ciprini 8 , S. Crapanzano 1 , J. A. de Diego 16 , N. V. Efimova 11 , D. Gardiol 1,27 , J. C. Guerra 27 , B. B. Kahharov 5 , B. Z. Kapanadze 2 , H. Karttunen 10 , T. Kato 28 , G. N. Kimeridze 2 , N. A. Kudryavtseva 11 , M. Lainela 10 , L. Lanteri 1 , E. G. Larionova 11 , M. Maesano 29 , N. Marchili 8 , G. Massone 1 , T. Monroe 19 , F. Montagni 30 , R. Nesci 31 , K. Nilsson 10 , J. C. Noble 32 , G. Nucciarelli 8 , L. Ostorero 4,33 , J. Papamastorakis 7,6 , M. Pasanen 10 , C. S. Peters 14 , T. Pursimo 34 , P. Reig 35,6 , W. Ryle 19 , S. Sclavi 31 , L. A. Sigua 2 , M. Uemura 28 , and W. Wills 19 1 Istituto Nazionale di Astrofisica (INAF), Osservatorio Astronomico di Torino, Via Osservatorio 20, 10025 Pino Torinese (TO), Italy 2 Abastumani Astrophysical Observatory, 383762 Abastumani, Georgia 3 Astrophysikalisches Institut Potsdam, An der Sternwarte 16, 14482 Potsdam, Germany 4 Landessternwarte Heidelberg-K¨onigstuhl, K¨onigstuhl 12, 69117 Heidelberg, Germany 5 Ulugh Beg Astronomical Institute, Academy of Sciences of Uzbekistan, 33 Astronomical Str., Tashkent 700052, Uzbekistan 6 IESL, FORTH, 711 10 Heraklion, Crete, Greece 7 Physics Department, University of Crete, PO Box 2208, 710 03 Heraklion, Crete, Greece 8 Dipartimento di Fisica, Universit`a di Perugia, Via A. Pascoli, 06123 Perugia, Italy 9 Instituteof Theoretical Physics and Astrophysics, Faculty of Science, Masaryk University, Kotl´aˇ rsk´a 2, 611 37 Brno, Czech Republic 10 Tuorla Observatory, 21500 Piikki¨o, Finland 11 Astronomical Institute, St.-Petersburg State University, Universitetsky Pr. 28, Petrodvoretz, 198504 St.- Petersburg, Russia 12 Isaac Newton Institute of Chile, St.-Petersburg Branch 13 Department of Physics and Astronomy, University of Missouri-St. Louis, 8001 Natural Bridge Road, St. Louis, MO 63121, USA 14 Department of Physics, Astronomy and Geophysics, Connecticut College, New London, CT 06320, USA 15 Foggy Bottom Observatory, Colgate University, 13 Oak Drive, Hamilton, NY 13346, USA 16 Instituto de Astronom´ ıa, UNAM, Apdo. Postal 70-264, 04510 M´ exico DF, Mexico 17 Department of Physics, University of Colorado at Denver, PO Box 173364, Denver, CO 80217-3364, USA 18 Boltwood Observatory, 1655 Main Street, Stittsville, Ontario K2S 1N6, Canada 19 Department of Physics and Astronomy, Western Kentucky University, 1 Big Red Way, Bowling Green, KY 42104, USA 20 Agrupaci´o Astron`omica de Sabadell, PO Box 50, 08200 Sabadell, Spain 21 Yunnan Observatory, National Astronomical Observatories, Chinese Academy of Sciences, PO Box 110, Kunming 650011, China 22 United Laboratory of Optical Astronomy, Chinese Academy of Sciences, Beijing, China 23 Yunnan Astrophysics Center, Yunnan University, Kunming 650091, China 24 Department of Natural Sciences, Fayetteville State University, 1200 Murchison Road, Fayetteville, NC 28301, USA 25 Guadarrama Observatory, C/ San Pablo 5, Villalba 28409, Madrid, Spain 26 Department of Physics and Astronomy, Hampden-Sydney College, Hampden-Sydney, VA 23943, USA 27 Istituto Nazionale di Astrofisica (INAF), Telescopio Nazionale Galileo, Roque de los Muchachos Astronomical Observatory, PO Box 565, 38700 Santa Cruz de La Palma, TF, Spain 28 Department of Astronomy, Faculty of Science, Kyoto University, Kyoto, Japan 29 Stazione Astronomica Vallinfreda, Italy 30 Stazione Astronomica Greve in Chianti, Italy 31 Dipartimento di Fisica, Universit`a La Sapienza, Piazzale A. Moro 2, 00185 Roma, Italy
-
Upload
independent -
Category
Documents
-
view
1 -
download
0
Transcript of The WEBT BL Lacertae Campaign 2001 and its extension. Optical light curves and colour analysis...

arX
iv:a
stro
-ph/
0404
155v
1 7
Apr
200
4
1Astronomy & Astrophysics manuscript no.(will be inserted by hand later)
The WEBT BL Lacertae Campaign 2001 and its extension
Optical light curves and colour analysis 1994–2002
M. Villata1, C. M. Raiteri1, O. M. Kurtanidze2,3,4, M. G. Nikolashvili2, M. A. Ibrahimov5,I. E. Papadakis6,7, G. Tosti8, F. Hroch9, L. O. Takalo10, A. Sillanpaa10, V. A. Hagen-Thorn11,12,V. M. Larionov11,12, R. D. Schwartz13, J. Basler13, L. F. Brown14, T. J. Balonek15, E. Benıtez16,
A. Ramırez16, A. C. Sadun17, P. Boltwood18, M. T. Carini19, D. Barnaby19, J. M. Coloma20, J. A. Ros20,B. Z. Dai21,22,23, G. Z. Xie21,22,23, J. R. Mattox24, D. Rodriguez25, I. M. Asfandiyarov5, A. Atkerson19,
J. L. Beem14, S. D. Bloom26, S. M. Chanturiya2, S. Ciprini8, S. Crapanzano1, J. A. de Diego16,N. V. Efimova11, D. Gardiol1,27, J. C. Guerra27, B. B. Kahharov5, B. Z. Kapanadze2, H. Karttunen10,
T. Kato28, G. N. Kimeridze2, N. A. Kudryavtseva11, M. Lainela10, L. Lanteri1, E. G. Larionova11,M. Maesano29, N. Marchili8, G. Massone1, T. Monroe19, F. Montagni30, R. Nesci31, K. Nilsson10,J. C. Noble32, G. Nucciarelli8, L. Ostorero4,33, J. Papamastorakis7,6, M. Pasanen10, C. S. Peters14,
T. Pursimo34, P. Reig35,6, W. Ryle19, S. Sclavi31, L. A. Sigua2, M. Uemura28, and W. Wills19
1 Istituto Nazionale di Astrofisica (INAF), Osservatorio Astronomico di Torino, Via Osservatorio 20, 10025 PinoTorinese (TO), Italy
2 Abastumani Astrophysical Observatory, 383762 Abastumani, Georgia3 Astrophysikalisches Institut Potsdam, An der Sternwarte 16, 14482 Potsdam, Germany4 Landessternwarte Heidelberg-Konigstuhl, Konigstuhl 12, 69117 Heidelberg, Germany5 Ulugh Beg Astronomical Institute, Academy of Sciences of Uzbekistan, 33 Astronomical Str., Tashkent 700052,
Uzbekistan6 IESL, FORTH, 711 10 Heraklion, Crete, Greece7 Physics Department, University of Crete, PO Box 2208, 710 03 Heraklion, Crete, Greece8 Dipartimento di Fisica, Universita di Perugia, Via A. Pascoli, 06123 Perugia, Italy9 Institute of Theoretical Physics and Astrophysics, Faculty of Science, Masaryk University, Kotlarska 2, 611 37
Brno, Czech Republic10 Tuorla Observatory, 21500 Piikkio, Finland11 Astronomical Institute, St.-Petersburg State University, Universitetsky Pr. 28, Petrodvoretz, 198504 St.-
Petersburg, Russia12 Isaac Newton Institute of Chile, St.-Petersburg Branch13 Department of Physics and Astronomy, University of Missouri-St. Louis, 8001 Natural Bridge Road, St. Louis,
MO 63121, USA14 Department of Physics, Astronomy and Geophysics, Connecticut College, New London, CT 06320, USA15 Foggy Bottom Observatory, Colgate University, 13 Oak Drive, Hamilton, NY 13346, USA16 Instituto de Astronomıa, UNAM, Apdo. Postal 70-264, 04510 Mexico DF, Mexico17 Department of Physics, University of Colorado at Denver, PO Box 173364, Denver, CO 80217-3364, USA18 Boltwood Observatory, 1655 Main Street, Stittsville, Ontario K2S 1N6, Canada19 Department of Physics and Astronomy, Western Kentucky University, 1 Big Red Way, Bowling Green, KY
42104, USA20 Agrupacio Astronomica de Sabadell, PO Box 50, 08200 Sabadell, Spain21 Yunnan Observatory, National Astronomical Observatories, Chinese Academy of Sciences, PO Box 110,
Kunming 650011, China22 United Laboratory of Optical Astronomy, Chinese Academy of Sciences, Beijing, China23 Yunnan Astrophysics Center, Yunnan University, Kunming 650091, China24 Department of Natural Sciences, Fayetteville State University, 1200 Murchison Road, Fayetteville, NC 28301,
USA25 Guadarrama Observatory, C/ San Pablo 5, Villalba 28409, Madrid, Spain26 Department of Physics and Astronomy, Hampden-Sydney College, Hampden-Sydney, VA 23943, USA27 Istituto Nazionale di Astrofisica (INAF), Telescopio Nazionale Galileo, Roque de los Muchachos Astronomical
Observatory, PO Box 565, 38700 Santa Cruz de La Palma, TF, Spain28 Department of Astronomy, Faculty of Science, Kyoto University, Kyoto, Japan29 Stazione Astronomica Vallinfreda, Italy30 Stazione Astronomica Greve in Chianti, Italy31 Dipartimento di Fisica, Universita La Sapienza, Piazzale A. Moro 2, 00185 Roma, Italy

Send offprint requests to: M. Villata, e-mail:[email protected]

M. Villata et al.: The WEBT BL Lac Campaign 2001 and its extension 3
Abstract. BL Lacertae has been the target of four observing campaigns by the Whole Earth Blazar Telescope (WEBT)collaboration. In this paper we present UBV RI light curves obtained by the WEBT from 1994 to 2002, including thelast, extended BL Lac 2001 campaign. A total of about 7500 optical observations performed by 31 telescopes fromJapan to Mexico have been collected, to be added to the ∼ 15600 observations of the BL Lac Campaign 2000. Allthese data allow one to follow the source optical emission behaviour with unprecedented detail. The analysis of thecolour indices reveals that the flux variability can be interpreted in terms of two components: longer-term variationsoccurring on a few-day time scale appear as mildly-chromatic events, while a strong bluer-when-brighter chromatismcharacterizes very fast (intraday) flares. By decoupling the two components, we quantify the degree of chromatisminferring that longer-term flux changes imply moving along a ∼ 0.1 bluer-when-brighter slope in the B − R versus Rplane; a steeper slope of ∼ 0.4 would distinguish the shorter-term variations. This means that, when considering thelong-term trend, the B-band flux level is related to the R-band one according to a power law of index ∼ 1.1. Dopplerfactor variations on a “convex” spectrum could be the mechanism accounting for both the long-term variations andtheir slight chromatism.
1. Introduction
Blazars are a class of radio-loud active galactic nuclei(AGNs) well known for their peculiar properties, such astheir intense and extremely variable non-thermal emis-sion across all the electromagnetic spectrum from theradio band to γ-rays (sometimes up to TeV energies).Blazars are divided into two subclasses: flat-spectrum ra-dio quasars and BL Lac objects, whose main difference isthe lack or weakness of emission lines in BL Lac objects.
The commonly accepted paradigm capable of explain-ing most of the observed radio-loud AGN properties in-volves a supermassive black hole surrounded by an accre-tion disc, feeding a relativistic plasma jet emitting syn-chrotron and inverse-Compton radiation. In this scenarioblazars would be the fraction of sources with the jet ori-ented at a small angle with respect to the line of sight.
To investigate the details of the physical processes andgeometric conditions at the base of the extreme emis-sion variability, a great observing effort is needed, pos-sibly organizing multiwavelength campaigns to follow thesource emission behaviour simultaneously at different fre-quencies. For example, the Whole Earth Blazar Telescope(WEBT; http://www.to.astro.it/blazars/webt/; e.g.Villata et al. 2000, 2002) is an international collabora-tion of optical and radio observers whose aim is the inten-sive and accurate monitoring of selected blazars duringtime-limited campaigns. The distribution in longitude ofthe WEBT members makes continuous (24 hours per day)optical monitoring possible, at least in principle. Since itsinception in 1997, various BL Lac objects have been thetarget of the WEBT1; in particular, four campaigns havebeen devoted to BL Lacertae, the prototype of the abovementioned subclass.
The first two BL Lac campaigns were organized in1999 in conjunction with pointings of the X-ray satel-lites BeppoSAX (June 5–7) and ASCA (June 28–30).They lasted a few days only and involved a restrictedparticipation of the WEBT members. The results ofthe BeppoSAX-WEBT campaign have been published inRavasio et al. (2002): the shape of the X-ray spectrum
1 Targets of WEBT campaigns have been, besides BLLacertae, AO 0235+16 (Raiteri et al. 2001), Mkn 421, S50716+71 (Villata et al. 2000), Mkn 501, 3C 66A.
was concave, with a very hard component above 5–6 keV;moreover, a very fast variability event was detected at thelowest X-ray energies, with no simultaneous optical coun-terpart.
The subsequent WEBT BL Lac 2000 campaign was animpressive observing effort with a long extension in time:more than 15000 optical observations were performed by24 telescopes in 11 countries from May 2000 to January2001. The results of these observations are reported inVillata et al. (2002). The original motivation for the cam-paign was to provide the low-energy observing counter-part for a high-energy campaign organized in July–August2000, involving X-ray satellites as well as TeV detectors(Bottcher et al. 2003). In this period (the “core cam-paign”) the densest sampling was achieved, with observ-ing gaps limited to a few hours, mainly due to the lack ofobservers in the Pacific area.
After the BL Lac Campaign 2000, the WEBT collab-oration launched a new BL Lac campaign in June 2001(due to the detection of a fast brightening of the source),which lasted until the end of February 2002. In this paperwe present the optical light curves of this BL Lac 2001campaign and of its so-called “extension”, which includesthe two WEBT campaigns of 1999 and a collection of un-published data back to 1994. We also include in our anal-ysis previously published optical data from the BL LacCampaign 2000 (Villata et al. 2002) and literature datafrom 1994 to 2002. As a result, the optical light curvesthat we present in this work, based on new and previouslypublished WEBT and literature data, cover a period ofmore than 8 years (9 observing seasons). Radio and opti-cal light curves covering the period 1968–2003 will be pre-sented in a forthcoming paper (Villata et al. 2004), wheretiming and cross-correlation analyses will be performed onboth optical and radio light curves.
In Sect. 2 we report the optical observations of BLLacertae carried out by the WEBT collaboration; theUBV RI light curves from 1994 to 2002 are presented inSect. 3, and a detailed colour analysis is performed in Sect.4. Conclusions are drawn in Sect. 5.

4 M. Villata et al.: The WEBT BL Lac Campaign 2001 and its extension
Table 1. List of participating observatories by longitude: d is the telescope diameter; Nobs is the total number ofobservations done, i.e. the number of unbinned data; NU , NB, NV , NR, and NI are the numbers of data points inUBV RI remained after discarding and binning some of the original data; the numbers in brackets refer to the WEBTcampaign 2001 alone (May 2001 – February 2002).
Observatory d (cm) Nobs NU NB NV NR NI
Kyoto, Japan 25 190 (0) 0 0 0 19 (0) 0Yunnan, China 100 25 (25) 0 2 (2) 2 (2) 7 (7) 0Mt. Maidanak (T-60), Uzbekistan 60 50 (50) 15 (15) 16 (16) 16 (16) 0 0Mt. Maidanak (AZT-14), Uzbekistan 50 150 (150) 49 (49) 47 (47) 49 (49) 3 (3) 0Mt. Maidanak (AZT-22), Uzbekistan 150 418 (418) 50 (50) 87 (87) 65 (65) 108 (108) 61 (61)Abastumani, Georgia (FSU) 70 1823 (316) 0 276 (36) 232 (0) 903 (213) 150 (0)Crimean, Ukraine 70 267 (267) 0 67 (67) 67 (67) 67 (67) 66 (66)Skinakas, Crete 130 510 (239) 0 186 (119) 69 (0) 184 (118) 67 (0)Tuorla, Finland 103 80 (0) 0 0 79 (0) 0 0MonteBoo, Czech Republic 62 754 (754) 0 0 0 282 (282) 0Vallinfreda, Italy 50 98 (0) 0 0 49 (0) 0 0Perugia, Italy 40 524 (419) 0 0 112 (112) 208 (180) 166 (125)Greve, Italy 32 55 (0) 0 0 0 0 55 (0)Torino, Italy 105 487 (54) 0 104 (1) 70 (2) 271 (24) 12 (2)Sabadell, Spain 50 32 (32) 0 0 3 (3) 12 (12) 0Guadarrama, Spain 20 3 (3) 0 0 1 (1) 1 (1) 0Roque (KVA), La Palma 60 322 (0) 0 0 0 152 (0) 0Roque (KVA), La Palma 35 42 (42) 0 0 10 (10) 10 (10) 0Roque (JKT), La Palma 100 64 (64) 0 9 (9) 10 (10) 32 (32) 6 (6)Roque (NOT), La Palma 256 44 (44) 4 (4) 7 (7) 7 (7) 7 (7) 3 (3)Roque (TNG), La Palma 358 138 (0) 3 (0) 62 (0) 5 (0) 62 (0) 2 (0)Olin, Connecticut 51 400 (361) 0 0 8 (0) 78 (64) 85 (71)Hopkins, Massachusetts 60 12 (0) 0 0 0 0 11 (0)Foggy Bottom, New York 40 248 (83) 0 0 0 248 (83) 0Boltwood, Canada 40 96 (96) 0 6 (6) 6 (6) 6 (6) 5 (5)Bell, Kentucky 60 23 (23) 0 0 0 22 (22) 0St. Louis, Missouri 36 423 (340) 0 10 (4) 40 (16) 161 (137) 39 (15)Sommers-Bausch, Colorado 60 9 (9) 0 0 4 (4) 4 (4) 0Lowell, Arizona 180 36 (0) 0 0 18 (0) 0 18 (0)San Pedro Martir, Mexico 210 9 (9) 0 3 (3) 3 (3) 3 (3) 0San Pedro Martir, Mexico 150 123 (123) 4 (4) 12 (12) 11 (11) 11 (11) 4 (4)
Total 7455 (3921) 125 (122) 894 (416) 936 (384) 2861 (1394) 750 (358)
figure1.jpg
Fig. 1. UBV RI light curves of BL Lacertae from 1994 to 2002; the numbers on the left indicate the number of datapoints in the extended BL Lac Campaign 2001 (blue/dark), in the BL Lac Campaign 2000 (red/grey), and fromthe literature (light cyan/light grey); yellow (shaded) strips correspond to the periods of the 1999 and 2001 WEBTcampaigns.
2. Observations of BL Lacertae by the WEBT
collaboration
The BL Lac Campaign 2001 was started in June 2001after the detection of a fast brightening of the source.
Optical and radio monitoring was continued until the endof February 2002. However, at the time of data analysis,it was decided to collect all optical and radio data takenby the members of the WEBT collaboration dating backto 1968. The observations performed out of the proper

M. Villata et al.: The WEBT BL Lac Campaign 2001 and its extension 5
figure2.jpg
Fig. 2. Folded R-band light curve of BL Lacertae from 1997 to 2002; symbols as in Fig. 1.
campaign period (May 2001 – February 2002) constitutethe so-called “campaign extension”; they also include thestill unpublished data of the WEBT campaign of late June1999 and the partially published (Ravasio et al. 2002) dataof the early-June 1999 campaign. In this first paper, wepresent the optical data only, starting from 1994.
Table 1 shows the list of optical observatories that par-ticipated in the data collection with unpublished data ordata from the early-June 1999 campaign. The name andlocation of the observatory (Col. 1) is followed by thetelescope diameter (Col. 2), by the total number of ob-servations made (Col. 3) and the number of data pointsin UBV RI derived, sometimes after binning (Cols. 4–8).The numbers in brackets refer to the WEBT campaign2001 alone.
The observing strategy during the BL Lac Campaign2001 was nearly the same as in the BL Lac Campaign 2000(Villata et al. 2002): in general, observers with telescopeslarger than 60 cm were invited to perform BR sequencesof frames during each observing night, along with a com-plete (U)BV RI sequence at the beginning and at the end.Exposure times were chosen to obtain a good compro-mise between high precision and high temporal density.Participants with smaller-size telescopes were suggestedto carry out observations in the R band only.
In general, CCD data were collected as instrumentalmagnitudes of the source and reference stars to apply thesame analysis and calibration procedures to all datasets.Instrumental magnitudes were obtained by either stan-dard aperture photometry procedures or Gaussian fitting,in most cases by the observers themselves. A minority ofdata came from photometer observations: these data wereprovided directly as standard magnitudes.
A careful data assembly was required because of thehuge amount of data coming from many different instru-ments: details can be found in Villata et al. (2002).
3. Optical light curves
UBV RI light curves from 1994 to 2002 are shown in Fig.1. Blue (dark) dots refer to data belonging to the BL LacCampaign 2001 plus extension (see Sect. 2); red (grey)points represent the BL Lac Campaign 2000 data (Villata
et al. 2002); literature data2 are shown as light cyan (lightgrey) dots. The periods of the 1999 and 2001 WEBT cam-paigns on BL Lacertae are highlighted by yellow (shaded)strips.
Each panel in the figure covers a range of 4 magni-tudes. One can easily see that the variation amplitudeis greater at higher frequencies, which is a common be-haviour in blazars. For instance, during the well-sampled1997 outburst, the brightness excursion was 3.09 mag inthe B band, 3.06 mag in V , 2.94 mag in R, and 2.47 magin I. Hence, the variation in the B band was 5% widerthan in the R band and 25% wider than in the I band.Actually, these values of the ∆B excess have to be in-tended as underestimates, because the B-band light curveis undersampled, in particular around maxima and min-ima. In general, in this period the number of B data isonly 18% of the R one and 44% with respect to the Idata.
Another example can be derived by considering theperiod of the WEBT campaign 2001. Total magnitudevariations were ∆U = 2.63, ∆B = 2.34, ∆V = 2.32,∆R = 2.12, and ∆I = 2.07. Thus, again in spite of theirpoorer sampling (see Table 1), the UBV data show alarger total variation with respect to the R (and I) band.
From Fig. 1 one can also notice that, while the mini-mum brightness states are very different, there seems to bea well-defined brightness upper limit. Indeed, the bright-est levels detected in summer 1997, late 1999, mid 2001and early 2002 reached about the same value.
The best-sampled light curve is the R-band one (8672data points); in Fig. 2 we show the most interesting pe-riod, 1997–2002, folded in three panels. Each panel coverstwo observing seasons, starting and ending on February17 (solar conjunction). The most noticeable features arethe 1997 outburst, well covered by literature data, and
2 Literature data have been taken from Maesano et al.(1997), Fan et al. (1998; with dates taken from Fan & Lin2000), Webb et al. (1998), Bai et al. (1999), Tosti et al.(1999), Ghosh et al. (2000), Katajainen et al. (2000), Clements& Carini (2001), Fan et al. (2001), Sobrito et al. (2001),Papadakis et al. (2003), Tosti et al. (2004). Sometimes the dataused in this paper do not exactly correspond to the originalones since some correction/removal (often done in agreementwith the data owners) was needed. Moreover, some datasetswere completely re-analysed.

6 M. Villata et al.: The WEBT BL Lac Campaign 2001 and its extension
Fig. 3. Enlargements of the BL Lacertae R-band light curve corresponding to the WEBT campaigns of late June –early July 1999 (top panel) and May 2001 – February 2002 (middle and bottom panels); symbols as in Fig. 1; in thetop panel the yellow (grey) strip indicates the period of the ASCA pointing.
the other two strong outbursts occurring in mid 2001 andearly 2002, during the BL Lac 2001 WEBT campaign.Other well-sampled periods are mid 1999 (especially theWEBT campaigns) and of course the BL Lac Campaign2000. The 1997 outburst still remains the most spectac-ular event for both its magnitude excursion during the
dimming phase and the large amplitude of the short-termvariations (see e.g. Villata et al. 2002 for references).
The three panels in Fig. 3 display the details of theWEBT campaigns carried out in mid 1999 contempora-neously with the ASCA pointing (top) and in 2001–2002(middle and bottom); they correspond to the second andthird yellow (shaded) areas of Fig. 2. Details of the 1999
M. Villata et al.: The WEBT BL Lac Campaign 2001 and its extension 7
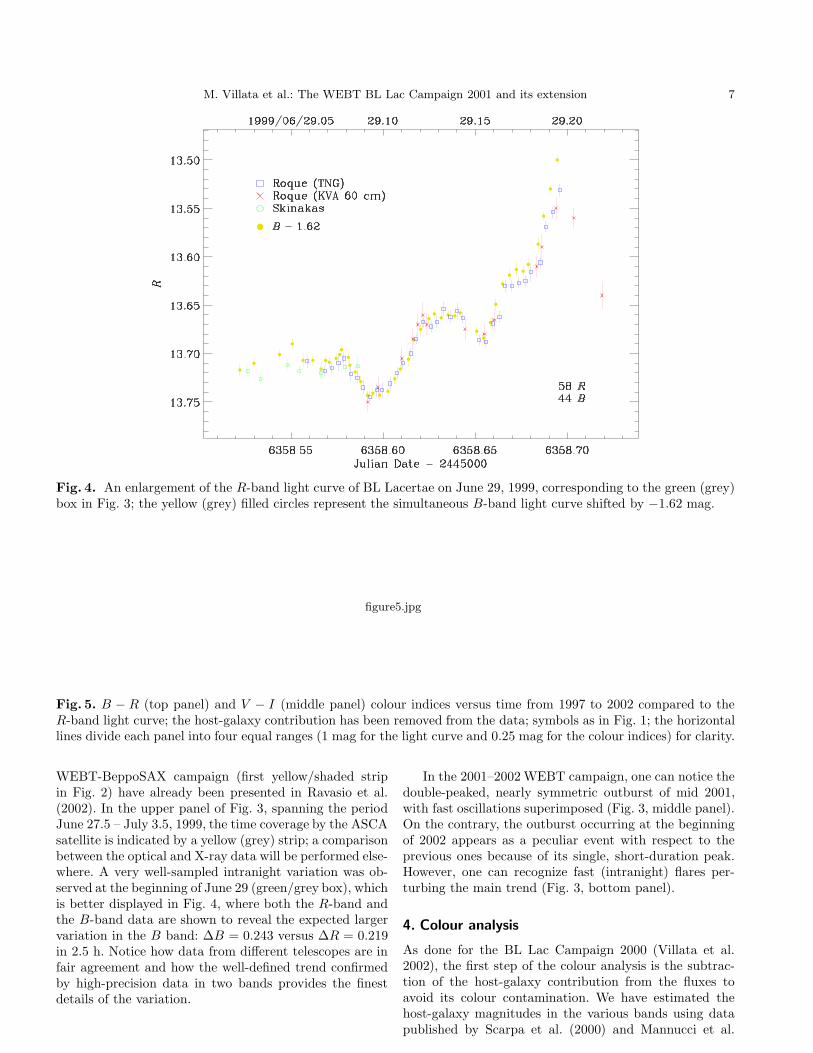
Fig. 4. An enlargement of the R-band light curve of BL Lacertae on June 29, 1999, corresponding to the green (grey)box in Fig. 3; the yellow (grey) filled circles represent the simultaneous B-band light curve shifted by −1.62 mag.
figure5.jpg
Fig. 5. B − R (top panel) and V − I (middle panel) colour indices versus time from 1997 to 2002 compared to theR-band light curve; the host-galaxy contribution has been removed from the data; symbols as in Fig. 1; the horizontallines divide each panel into four equal ranges (1 mag for the light curve and 0.25 mag for the colour indices) for clarity.
WEBT-BeppoSAX campaign (first yellow/shaded stripin Fig. 2) have already been presented in Ravasio et al.(2002). In the upper panel of Fig. 3, spanning the periodJune 27.5 – July 3.5, 1999, the time coverage by the ASCAsatellite is indicated by a yellow (grey) strip; a comparisonbetween the optical and X-ray data will be performed else-where. A very well-sampled intranight variation was ob-served at the beginning of June 29 (green/grey box), whichis better displayed in Fig. 4, where both the R-band andthe B-band data are shown to reveal the expected largervariation in the B band: ∆B = 0.243 versus ∆R = 0.219in 2.5 h. Notice how data from different telescopes are infair agreement and how the well-defined trend confirmedby high-precision data in two bands provides the finestdetails of the variation.
In the 2001–2002 WEBT campaign, one can notice thedouble-peaked, nearly symmetric outburst of mid 2001,with fast oscillations superimposed (Fig. 3, middle panel).On the contrary, the outburst occurring at the beginningof 2002 appears as a peculiar event with respect to theprevious ones because of its single, short-duration peak.However, one can recognize fast (intranight) flares per-turbing the main trend (Fig. 3, bottom panel).
4. Colour analysis
As done for the BL Lac Campaign 2000 (Villata et al.2002), the first step of the colour analysis is the subtrac-tion of the host-galaxy contribution from the fluxes toavoid its colour contamination. We have estimated thehost-galaxy magnitudes in the various bands using datapublished by Scarpa et al. (2000) and Mannucci et al.

8 M. Villata et al.: The WEBT BL Lac Campaign 2001 and its extension
Fig. 6. An enlargement of the B − R versus time curve (top panel) compared with the R-band light curve (bottompanel) during the best-sampled period of the BL Lac Campaign 2001; orange (grey) dots represent the data used forcalculating the colour indices.
(2001), obtaining Uhost = 17.65, Bhost = 17.15, Vhost =16.16, Rhost = 15.55, and Ihost = 14.92. Conversion ofmagnitudes into fluxes has been done as in Villata et al.(2002), where it was also estimated that only about 60% ofthe host-galaxy flux must be subtracted from the originaldata.
Once this procedure was performed, in BL Lac 2000the resulting colour indices showed a fairly clear be-haviour: long-term variations appeared essentially achro-matic, while fast flares exhibited a strong bluer-when-brighter trend.
In Fig. 5 we show the time evolution of the B − Rand V − I BL Lac colour indices from 1997 to 2002, com-pared with the galaxy-subtracted R-band light curve. Wehave now a dataset which is much more extended both intime and in brightness. Indeed, the outburst of BL Lac2000 appears as a modest event when compared to the1997, 2001, and 2002 outbursts. It is evident that thesemain outbursts show a chromatic behaviour, even if thecolour changes observed during the short-term flares arerelatively stronger. By looking at the 2001 outburst onecan see that the total range covered by the B−R index isabout twice the range covered during fast flares, whereasthe ratio between the corresponding magnitude variationsis about three. This situation is better displayed in Fig. 6.
The long-term achromatism found by Villata et al.(2002) in BL Lac 2000 appears to be due to a bluer-than-usual pre-outburst state, which we can now recognize asa peculiar event. Hence, from now on we will speak of“strongly chromatic” fast flares and “mildly chromatic”long-term variations.
We now investigate whether the global behaviour ofthe source can be uniformly described in terms of these
two components. We try to decouple the two componentsin a way similar to that followed by Villata et al. (2002).
In the upper panel of Fig. 7 we have plotted the B−Rcolour indices versus the galaxy-removed R magnitudes.Red (grey) dots represent the data of BL Lac 2000, litera-ture data are displayed as light cyan (light grey) dots, anddata from the BL Lac 2001 campaign plus extension areplotted with different symbols according to the observingperiod (see caption for details). One can see the differentbehaviour during the two campaigns: while B−R data ofBL Lac 2000 are located along two separated quasi-lineartrends with similar slopes and colour ranges (thus reflect-ing the quasi-achromatic long-term behaviour), the otherones are more uniformly distributed. As a whole, the in-dex dataset is mostly comprised within a parallelogramwith slopes 0.1 and 0.4.
A 0.1 slope trend means a mildly chromatic behaviourthat we have recognized to be typical of the long-term vari-ations. On the contrary, a 0.4 slope trend implies stronglychromatic variations, as found for the fast flares. The BLLac 2000 points near the upper-left corner of the paral-lelogram, which represent data from the pre-outburst, areessentially aligned with the steeper side, but their colourappears to be bluer than average. Thus, apart from thisdiscrepancy, we are presenting a scenario where fast flaresimply moving along the steeper direction in the B − Rversus R plot, the position inside the parallelogram de-pending on the source brightness state. In other words:
B − R = constant + 0.4(R − Rspl) + 0.1Rspl ,
where Rspl is the brightness level of the long-term compo-nent.

M. Villata et al.: The WEBT BL Lac Campaign 2001 and its extension 9
Fig. 7. B − R colour indices versus R magnitudes after the host-galaxy removal (upper panel): BL Lac 2000 andliterature data are represented by red (grey) and light cyan (light grey) dots, respectively, while BL Lac 2001 extendeddata are plotted with green (grey) circles (BL Lac 2001 extension), blue (dark) squares (best-sampled period of BLLac 2001, the same of Fig. 6), and cyan (grey) crosses (remaining part of BL Lac 2001); most of the data lie within aparallelogram whose sides have slopes of 0.1 and 0.4. In the bottom panel the same data have been corrected for thelong-term trend as explained in the text.
The steeper 0.4 slope has been inferred from the verywell-sampled data of the last week of the core campaign2000, where we can assume that the long-term componentdoes not change significantly. Indeed, by looking at Figs.7 and 8 of Villata et al. (2002), one can estimate d(B −
R)/dR ≈ 0.4, and a linear correlation analysis gives aslope of 0.383± 0.004.
The value of the 0.1 slope has been determined as il-lustrated in the next subsection.
4.1. Removal of the long-term trend
As done in BL Lac 2000, we performed a cubic spline in-terpolation across the binned R-band flux light curve. Tohave a good interpolation through very fast and large vari-ations, like those occurring during the 2001 and 2002 out-bursts, we adopted a 4-day binning. The resulting spline isplotted as a green (grey) line in Fig. 8, showing the folded,galaxy-subtracted flux light curve.
To remove the long-term trend from the light curve,we have rescaled each original flux by dividing it by the

10 M. Villata et al.: The WEBT BL Lac Campaign 2001 and its extension
figure8.jpg
Fig. 8. Galaxy-subtracted R-band flux light curve from 1997 to 2002 (folded, symbols as in Fig. 1); the green (grey)line represents a cubic spline interpolation through the 4-day binned light curve; the blue (dark) line, obtained bynormalizing the spline to its minimum value, represents the actual correction factor for removing the long-term trend.
figure9.jpg
Fig. 9. B −R and R-mag curves as obtained after correcting for the long-term trend (symbols as in Fig. 1, horizontallines as in Fig. 5); the green (grey) line at R = 16.061 in the bottom panel represents the minimum level of the spline(see Fig. 8) to which the light curve has been normalized.
ratio between the value of the spline at the considered timeand its minimum value, CR(t) = [Fspl(t)/Fmin]R (where Rstands for R band). This correcting factor is shown in Fig.8 as a blue (dark) line highlighted by the yellow (shaded)area.
Because of the assumption of an achromatic long-termtrend, in BL Lac 2000 the B-band flux light curve wasrescaled by the same time-dependent factor. Now, the cor-recting factor for the B fluxes must be found. Instead oftracing a cubic spline interpolation across the B fluxes,which would be affected by a different and worse sam-pling, we search for the best-fit relationship between thelong-term trends in the two bands. Then we suppose thatCB(t) is some power of CR(t). Various best-fit procedureson different data sub-samples have been applied to findthe value of the power index; this value has been foundto range between 1.08 and 1.12. We adopted 1.1 which,passing from fluxes to magnitudes, explains the 0.1 slopeof the B − R versus R plot.
Once both the R and B fluxes have been correctedfor their long-term trends, the resulting colour indices areshown in the bottom panel of Fig. 7. What we expect tosee in this plot is the signature of the fast flares alone,shifted to the minimum brightness level of the long-termtrend (R = 16.061). The final result is fairly satisfactory,but one can still see some inhomogeneous behaviour, likethe expected bluer level of the BL Lac 2000 pre-outburstdata. A further insight into this result is given by Fig.
9, where the residual R magnitudes (bottom panel) andcorresponding B − R colour indices (upper panel) havebeen plotted versus time. By comparing this figure withFig. 5, one can see that the outburst signatures have beencompletely smoothed away in the R-band light curve, asexpected, and almost completely smoothed away in theB − R plot, with the main exception of the bluer-than-average BL Lac 2000 period. Moreover, one can also noticethat the variability range of the fast flares in the bottompanel is fairly constant around 1 mag, but it seems toexceed 1.5 mag or more during the 1997 outburst. Thisrepresents another peculiarity of an outburst with respectto the others. Part of the amplitude excess may be ex-plainable by inhomogeneity of the literature datasets, butnot all of it.
5. Conclusions
We have presented UBV RI light curves of BL Lacertaefrom 1994 to 2002 composed from data taken by the mem-bers of the WEBT collaboration as well as literature data.
The colour analysis we performed on the best-sampledperiod of these light curves (1997–2002) leads to the fol-lowing results.
The variability observed in the optical light curves canbe interpreted in terms of two components: a “mildly-chromatic” longer-term component and a “strongly-chromatic” shorter-term one. The longer-term component

M. Villata et al.: The WEBT BL Lac Campaign 2001 and its extension 11
has a typical time scale of a few days, while the shorter-term one is responsible for the very fast, intraday flares,and determines a steep bluer-when-brighter slope of about0.4 in the B − R versus R plot. Moreover, our analysissuggests that, in the long-term, the B-band flux level isrelated to the R-band one according to a power law withindex 1.1. This means that long-term variations trace a0.1 slope in the B − R versus R plot. In other words, allpossible flux variations fill a parallelogram with 0.1 and0.4 slopes in the B − R versus R plane.
The analysis presented in this paper shows that, ingeneral, the BL Lac optical behaviour can be uniformlydescribed in terms of these two components fairly well,with the caution that the presented decoupling methodcan work well only during well-sampled periods, where thelight-curve binning can actually represent the long-termtrend. However, peculiar events also occurred, as in the BLLac 2000 period, and our scenario seems to be more a goodcompromise between slightly different behaviours ratherthan a definitive solution. Other factors appear to changein the source history, in one or both of the components.
Changes in the flaring component could explain thelarger amplitudes of the 1997 outburst and the bluer BLLac 2000 period, but the remaining blue residues of the1997, 2001, and 2002 outbursts suggest other possibilities.
In Villata et al. (2002) the quasi-achromatism of thelong-term variations was interpreted in terms of Dopplerfactor variations. If the intrinsic source spectrum aroundthe infrared–optical bands is well described by a power law(Fν ∝ ν−α), a Doppler factor variation does not imply acolour change. What about a mildly-chromatic behaviour?It could be due to a Doppler factor variation on a spectrumslightly deviating from a power law (convex for a bluer-when-brighter trend). If the spectrum shape changes intime, the chromatism of the outbursts also varies, and the0.1 B−R slope adopted in this paper might represent onlya mean value among different slopes. In other words, anyperiod should be treated with a proper slope. A furtherinvestigation of this is beyond the scope of this paper.
The strongly-chromatic fast flares are likely due tointrinsic phenomena, such as particle acceleration fromshock-in-jet events, widely described in the literature (seee.g. Mastichiadis & Kirk 2002 for a review). Other mod-els are also discussed in the recent paper by Bottcher &Reimer (2004).
Thus, the present extension/enrichment of the BL Lacoptical dataset partially confirms previous results leadingto a more refined scenario, but also gives rise to new in-triguing questions.
Acknowledgements. This research has made use of theNASA/IPAC Extragalactic Database (NED), which is oper-ated by the Jet Propulsion Laboratory, California Instituteof Technology, under contract with the National Aeronauticsand Space Administration. This work was partly supportedby the European Community’s Human Potential Programmeunder contract HPRN-CT-2002-00321, by the Italian SpaceAgency (ASI) under contract CNR-ASI 1/R/27/02, and bythe Italian Ministry for University and Research (MURST)
under grant Cofin 2001/028773. It is based partly on obser-vations made with the Italian Telescopio Nazionale Galileo(TNG) and the Nordic Optical Telescope, both operated onthe island of La Palma at the Spanish Observatorio del Roquede los Muchachos of the Instituto de Astrofısica de Canarias,the former by the Centro Galileo Galilei of the INAF (IstitutoNazionale di Astrofisica) and the latter jointly by Denmark,Finland, Iceland, Norway and Sweden. St.-Petersburg groupwas supported by Federal Programs “Astronomy” (grant N40.022.1.1.1001) and “Integration” (grant N B0029).
References
Bai J.M., Xie G.Z., Li K.H., Zhang X., Liu W.W., 1999, A&AS136, 455
Bottcher M., Reimer A., 2004, ApJ, submittedBottcher M., Marscher A.P., Ravasio M., et al., 2003, ApJ 596,
847Clements S.D., Carini M.T., 2001, AJ 121, 90Fan J.H., Lin R.G., 2000, ApJ 537, 101Fan J.H., Xie G.Z., Pecontal E., Pecontal A., Copin Y., 1998,
ApJ 507, 173Fan J.H., Qian B.C., Tao J., 2001, A&A 369, 758Ghosh K.K., Ramsey B.D., Sadun A.C., Soundararajaperumal
S., Wang J., 2000, ApJ 537, 638Katajainen S., Takalo L.O., Sillanpaa A., et al., 2000, A&AS
143, 357Maesano M., Montagni F., Massaro E., Nesci R., 1997, A&AS
122, 267Mannucci F., Basile F., Poggianti B.M., et al., 2001, MNRAS
326, 745Mastichiadis A., Kirk J.G., 2002, Publ. Astron. Soc. Aust. 19,
138Papadakis I.E., Boumis P., Samaritakis V., Papamastorakis J.,
2003, A&A 397, 565Raiteri C.M., Villata M., Aller H.D., et al., 2001, A&A 377,
396Ravasio M., Tagliaferri G., Ghisellini G., et al., 2002, A&A 383,
763Scarpa R., Urry C.M., Falomo R., Pesce J.E., Treves A., 2000,
ApJ 532, 740Sobrito G., Villata M., Raiteri C.M., et al., 2001, Astrophys.
Lett. Commun. 40, 141Tosti G., Luciani M., Fiorucci M., et al., 1999, Blazar Data 2,
1Tosti G., et al., 2004, in prep.Villata M., Mattox J.R., Massaro E., et al., 2000, A&A 363,
108Villata M., Raiteri C.M., Kurtanidze O.M., et al., 2002, A&A
390, 407Villata M., Raiteri C.M., Aller H.D., et al., 2004, A&A, sub-
mittedWebb J.R., Freedman I., Howard E., et al., 1998, AJ 115, 2244

This figure "figure1.jpg" is available in "jpg" format from:
http://arxiv.org/ps/astro-ph/0404155v1

This figure "figure2.jpg" is available in "jpg" format from:
http://arxiv.org/ps/astro-ph/0404155v1

This figure "figure5.jpg" is available in "jpg" format from:
http://arxiv.org/ps/astro-ph/0404155v1

This figure "figure8.jpg" is available in "jpg" format from:
http://arxiv.org/ps/astro-ph/0404155v1

This figure "figure9.jpg" is available in "jpg" format from:
http://arxiv.org/ps/astro-ph/0404155v1