Asymmetry of jets, lobe size and spectral index in radio galaxies and quasars

THE ASTROPHYSICAL JOURNAL, 556 :738È748, 2001 August 1( 2001. The American Astronomical Society. All rights reserved. Printed in U.S.A.
MULTIEPOCH VERY LONG BASELINE ARRAY OBSERVATIONS OF EGRET-DETECTED QUASARSAND BL LACERTAE OBJECTS: CONNECTION BETWEEN SUPERLUMINAL EJECTIONS AND
GAMMA-RAY FLARES IN BLAZARS
SVETLANA G. JORSTAD,1,2,3 ALAN P. MARSCHER,1 JOHN R. MATTOX,1,4 MARGO F. ALLER,5 HUGH D. ALLER,5ANN E. WEHRLE,6 AND STEVEN D. BLOOM7
Received 2001 January 26 ; accepted 2001 April 4
ABSTRACTWe examine the coincidence of times of high c-ray Ñux and ejections of superluminal components
from the core in EGRET blazars based on a Very Long Baseline Array (VLBA) monitoring program at22 and 43 GHz from 1993 November to 1997 July. In 23 cases of c-ray Ñares for which sufficient VLBAdata exist, 10 of the Ñares (in eight objects) fall within 1 p uncertainties of the extrapolated epoch of zeroseparation from the core of a superluminal radio component. In each of two sources (0528]134 and1730[130), two successive c-ray Ñares were followed by the appearance of new superluminal com-ponents. We carried out statistical simulations that show that if the number of coincidences is º10, theradio and c-ray events are associated with each other at greater than 99.999% conÐdence. Our analysisof the observed behavior, including variability of the polarized radio Ñux, of the sources before, during,and after the c-ray Ñares suggests that the c-ray events occur in the superluminal radio knots. Thisimplies that the c-ray Ñares are caused by inverse Compton scattering by relativistic electrons in theparsec-scale regions of the jet rather than closer to the central engine.Subject headings : BL Lacertae objects : general È galaxies : jets È gamma rays : observations È
quasars : general È radio continuum: galaxies
1. INTRODUCTION
We have completed a monitoring program of themilliarcsecond-scale structure of c-rayÈbright blazars (42sources) with the Very Long Baseline Array (VLBA) at 22and 43 GHz during the period 1993 November to 1997 July.The images, model Ðts, and basic statistical analysis of thisstudy are presented in Jorstad et al. (2001). Based on propermotions in 33 sources, we have found that the apparentsuperluminal motions in c-ray sources are much faster thanfor the general population of bright compact radio sources.The results strongly support the thesis that the c-ray emis-sion originates in a highly relativistic jet. A positive corre-lation (coefficient of correlation 0.45) between VLBI coreÑux and c-ray Ñux suggests that the production of the c-rayemission takes place in the most compact regions of therelativistic jet (Mattox et al. 1997a ; Jorstad et al. 2001).Comparison of radio (22 and 37 GHz) total ÑuxMetsa� hovidensity variations and EGRET c-ray observations led
Valtaoja, & Tornikoski (1999) to suggest thatLa� hteenma� ki,the radio and c-ray emission originates within the sameshocked area of the relativistic jet and that the c-rays aremost likely produced by the synchrotron self-Comptonmechanism. If this is the case, then VLBI component ejec-tions should correspond to outbursts in the c-ray lightcurves. The Ðrst case in which the ejection of a jet com-
1 Institute for Astrophysical Research, Boston University, 725 Com-monwealth Avenue, Boston, MA 02215.
2 Astronomical Institute, St. Petersburg State University, Bibliotech-naya pl. 2, Petrodvorets, St. Petersburg 198904, Russia.
3 Formerly S. G. Marchenko.4 Current address : Department of Chemistry, Physics, and Astronomy,
Francis Marion University, Florence, SC 29501-0547.5 Astronomy Department, University of Michigan, Ann Arbor, MI
48109.6 Jet Propulsion Laboratory, MS 301-486, 4800 Oak Grove Drive,
Pasadena, CA 91109.7 Hampden-Sydney College, Box 821, Hampden-Sydney, VA 23943.
ponent was contemporaneous with enhanced level of c-rayÑux was reported in the quasar 3C 279 by Wehrle, Zoock, &Unwin (1994). Several other cases were found during theEGRET mission : 3C 454.3 (Krichbaum et al. 1995), 3C 273(Krichbaum et al. 1996), 0836]710 (Otterbein et al. 1998),1611]343 (Piner & Kingham 1998), and 0528]134(Britzen et al. 1999). On the other hand, no componentsassociated with the c-ray Ñares of CTA 26, 1156]295, and1606]106 (Piner & Kingham 1998), or BL Lac (Denn,Mutel, & Marscher 2000) were detected to emerge.
The third catalog of high-energy (E[ 100 MeV) c-raysources detected by the EGRET telescope on the ComptonGamma Ray Observatory (CGRO) includes 66 high-conÐdence identiÐcations of blazars and presents c-ray lightcurves from 1991 April to 1995 October (Hartman et al.1999). Our sample of blazars observed with the VLBA con-tains 64% of these c-ray sources. We have detected morethan 80 superluminal components ejected during the periodfrom 1980 to 1996.5. The majority of (extrapolated) epochsof zero separation of components from the VLBI core fallinto the interval from 1993 to 1996, since the best samplingof our observations covers the period from 1994 October to1996 November. The components generally have highapparent speeds (the distribution of apparent velocitiespeaks at 8È9 h~1 c, where h km s~1 Mpc~1 andH0\ 100
with a lifetime of visibility of a typical componentq0\ 0.1)in the 22/43 GHz images of 1.5^ 0.5 yr. Therefore, if everyc-ray Ñare is associated with the ejection of a superluminalcomponent, then c-ray Ñares detected during the periodfrom 1993 to 1996 should correspond to VLBI componentsin our images. However, we are not able to test the inverserelationshipÈwhether every ejected superluminal com-ponent is associated with a c-ray ÑareÈowing to the sparse-ness of the c-ray light curves and uncertainties of theextrapolated epochs of zero separation of the superluminalcomponents from the core. Typical uncertainties in the timeof zero separation are D0.2 yr. The characteristic timescale
738

SUPERLUMINAL EJECTIONS AND GAMMA-RAY FLARES 739
of a c-ray outburst in blazars ranges from a week to amonth (Mattox et al. 1997b, 2001 ; McGlynn et al. 1997),about 2 times less than the uncertainty in the time of com-ponent ejection. On average, a c-ray light curve consists of16 ^ 5 measurements during 4.5 yr, half of which are onlyupper limits, usually when the sensitivity of the observationis relatively low. Despite these difficulties, we consider thatour sample suffices to determine statistically whether c-rayÑares are associated with major energetic disturbances thatpropagate down the jet.
2. GAMMA-RAY FLARES
The identiÐcation of c-ray Ñares is a key aspect of ourstatistical analysis, since if there is a one-to-one correspon-dence between c-ray Ñares and ejections of superluminalcomponents, then every c-ray Ñare detected during theperiod from 1993 to 1996 should be related to the appear-ance of a superluminal feature in our images. From theentire database of c-ray Ñuxes of blazars collected in thethird EGRET catalog (Hartman et al. 1999), we have deter-mined the average c-ray Ñux of every source as a weightedmean of all measurements, including upper limits, with
weight equal to 1/p, where p is the uncertainty of the mea-surement ; in the case of an upper limit, p is equal to thevalue of the upper limit itself. This deÐnition yields a largestandard deviation of the mean compared with the averageÑux itself. The average c-ray Ñux is considered as the baselevel of c-ray emission, although it probably exceeds theactual quiescent c-ray state (if such a quiescent c-ray stateexists in blazars). We specify that a c-ray Ñare occurredwhen a Ñux measurement exceeded the mean Ñux by afactor of 1.5 or more and the uncertainty of the measure-ment at the high state was less than the deviation of themeasurement from the mean. We make only one exceptionto these criteria : in the quasar 0528]134 we classify thec-ray activity in the Ðrst half of 1995 as a c-ray Ñare (thethird c-ray Ñare for this source) despite a ratio of themaximum measured Ñux to the average Ñux equal to 1.4. Inthis case an increase in the c-ray Ñux was observed over Ðvesuccessive measurements (with small uncertainties) suchthat the structure of the Ñare is well deÐned (see Fig. 2).Table 1 presents the results of c-ray Ñare detections for allblazars from our sample for which a high state of c-rayemission is found. The columns of Table 1 are as follows : (1)
TABLE 1
DETECTIONS OF GAMMA-RAY FLARES
SScT Contemporaneous VLBA Number ofSource (10~8 photons cm~2 s~1) fc Tc Observations? Ejections
(1) (2) (3) (4) (5) (6)
0202]149 . . . . . . 21 ^ 20 2.5 1992.315 No . . .0235]164 . . . . . . 30 ^ 20 2.2 1992.185 No . . .0336[019 . . . . . . 34 ^ 74 5.3 1995.266 Yes 20420[014 . . . . . . 27 ^ 23 1.9 1992.185 No 1
2.4 1995.622 Yes0440[003 . . . . . . 28 ^ 26 3.1 1994.632 Yes 10458[020 . . . . . . 21 ^ 21 3.2 1994.212 Yes 10528]134 . . . . . . 89 ^ 78 1.7 1991.315 No 4
3.9 1993.233 Yes1.4 1995.373 Yes
0716]714 . . . . . . 20 ^ 12 2.3 1992.197 No . . .0827]243 . . . . . . 37 ^ 36 3.0 1994.160 Yes 10836]710 . . . . . . 18 ^ 9 1.9 1992.197 Yes 10917]449 . . . . . . 21 ^ 9 1.9 1994.190 Yes 11101]384 . . . . . . 17 ^ 7 1.6 1994.367 Yes 21127[145 . . . . . . 27 ^ 17 2.3 1993.024 Yes 11156]295 . . . . . . 27 ^ 26 6.1 1993.024 No . . .1219]285 . . . . . . 21 ^ 17 1.6 1992.984 No 3
1.5 1994.367 Yes2.6 1995.334 Yes
1222]216 . . . . . . 21 ^ 14 2.3 1992.984 Yes 12.1 1993.964 Yes
1226]023 . . . . . . 22 ^ 14 2.2 1993.899 Yes 21253[055 . . . . . . 52 ^ 48 5.1 1991.474 No 3
2.0 1993.879 Yes1406[076 . . . . . . 40 ^ 36 3.2 1993.008 No1510[089 . . . . . . 31 ^ 12 1.6 1992.260 No1606]106 . . . . . . 35 ^ 16 1.8 1991.964 No1611]343 . . . . . . 36 ^ 23 1.9 1994.841 Yes 11622[253 . . . . . . 41 ^ 21 1.9 1995.460 Yes 1
2.0 1995.729 Yes1622[297 . . . . . . 68 ^ 99 4.7 1995.460 Yes 31633]382 . . . . . . 53 ^ 33 2.0 1991.707 No . . .1730[130 . . . . . . 48 ^ 30 1.7 1994.553 Yes 2
2.2 1995.510 Yes2230]114 . . . . . . 30 ^ 13 1.7 1992.647 No . . .2251]158 . . . . . . 52 ^ 29 2.2 1992.647 No . . .

740 JORSTAD ET AL. Vol. 556
source name; (2) average c-ray Ñux in units of 10~8 photonscm~2 s~1 and its standard deviation ; (3) the ratio of(SScT)the maximum c-ray Ñux during the Ñare to the averagec-ray Ñux (4) the epoch of the maximum c-ray Ñux(fc) ; (Tc) ;(5) an indication of whether the c-ray Ñare is contempora-neous with the VLBA observations (Yes/No) ; and (6) thenumber of superluminal ejections found during contempo-raneous EGRET/VLBA observations (1993È1996). Alltogether, we have identiÐed 23 c-ray Ñares (in 18 sources)that are contemporaneous with our VLBA observations.
3. COMPARISION OF EPOCHS OF GAMMA-RAY FLARES
WITH EPOCHS OF SUPERLUMINAL EJECTIONS
A comparison of epochs of c-ray Ñares with epochs of(Tc)zero separation of superluminal components from the coreseparates the sample of c-ray Ñares into three groups.8(T0)Group A includes positive detections for which o (Tc [ T0) owhere equals the 1 p uncertainty of the epoch¹ p(T0), p(T0)of zero separation. The marginal detections comprise
Group B, for which Group Co (Tc [ T0) o¹ 3p(T0).(negative detections) contains those c-ray Ñares that do notappear to be related to ejections of superluminal com-ponents according to the aforementioned criteria.
3.1. Group A: Positive DetectionsIn 10 of 23 c-ray Ñares, the epochs of zero separation
coincide, to within the 1 p uncertainty, with the time of thec-ray Ñares. The list of positive detections includes thesources 0336[019 (CTA 26), 0528]134, 0836]710,1222]216, 1226]023 (3C 273), 1622[253, 1611]343 (DA406), and 1730[130 (NRAO 530). For four of these sources(0528]134, 0836]710, 1226]023, and 1611]343), a con-nection between c-ray activity and ejections of superluminalcomponents was found previously, based on di†erent VLBIdata (Britzen et al. 1999 ; Otterbein et al. 1998 ; Krichbaumet al. 1996 ; Piner & Kingham 1998). For quasar 1222]216,we have only two epochs of VLBA observations and there-fore cannot determine the uncertainty of the epoch of zeroseparation ; we adopt an error of 0.2 yr. In each of thequasars 0528]134 and 1730[130, two detected c-ray Ñareswere accompanied by superluminal ejections (see Fig. 2). Inthe case of 1730[130, the creations of both componentsappear to have been associated with Ñares in radio lightcurves (Bower et al. 1997).
3.2. Group B: Marginal DetectionsThe list of marginal detections includes six sources :
0420[014, 0440[003 (NRAO 190), 0458[020, 1219]285(ON 231), 1253[055 (3C 279), and 1622[297. In1622[297, the ejection of a superluminal componentoccurred slightly earlier than [note that in thisTc [ 3p(T )case is smaller than usual]. However, a very high levelp(T )of c-ray Ñux was observed 1 week before the maximumc-ray emission (Mattox et al. 1997b) ; this indicates that theoutburst was prolonged and started before Tc.
3.3. Group C: Negative DetectionsThe list of negative detections consists of seven sources :
0827]243, 0917]449, 1101]384 (Mrk 421), 1127[145,
8 The ““ epoch of superluminal ejection ÏÏ is the time of coincidence of theposition of the moving feature with the core in the VLBA images, obtainedfrom a linear least-squares Ðt to a plot of component-core separation vs.time. The entire list of epochs of superluminal ejections for all componentsdetected during our monitoring is given in Table 5 of Jorstad et al. (2001).
1219]285 (ON 231), 1222]216, and 1622[253. Since weare testing the simplest hypothesis that all c-ray Ñares corre-spond to superluminal ejections, we examine whether thereis a possible explanation for each negative result in terms ofobservational uncertainties.
Each of the last three of these sources belongs to GroupA or B as well ; i.e., more than one c-ray Ñare was detected,and at least one high state of c-ray Ñux was accompanied bya superluminal ejection. In the quasar 1222]216, the c-raylight curve contains two Ñares separated by an interval of 1yr ; in our two VLBA images, we detected one componentassociated with the Ðrst c-ray outburst (see Table 1) andfound a second component with a speed signiÐcantly fasterthan that of the Ðrst knot. This second component has anextrapolated time of zero separation from the core that isabout 2 yr later than the time of the second c-ray Ñare.However, the proper motions are estimates based on onlytwo images ; hence, the uncertainties in the times of zeroseparation could be much larger than our adopted value,and the second component could be related to the secondc-ray outburst. Two of the three VLBA images of the BLLac object 1219]285, obtained at closely spaced epochs,show a signiÐcant change in the jet, but with such limiteddata we cannot identify components unambiguously acrossepochs ; hence, two di†erent interpretations of propermotions are possible (see Fig. 21b in Jorstad et al. 2001). Weadopt the lower proper motions, similar to those obtainedpreviously by Gabuzda et al. (1994). In this case we Ðnd aconnection between the c-ray Ñare and a superluminal ejec-tion that occurred in the Ðrst half of 1994 (see Fig. 2) but noassociation of a moving component with the c-ray outburstthat took place about 1 yr later. However, if we consider thehigher possible values of the proper motions, then contem-poraneous VLBA data exist only for the second c-ray Ñare,for which a component emerged from the core at1995.1^ 0.2, within 1 p uncertainty of the epoch of thesecond high state of c-ray emission. In 1622[253, theVLBA data show one moving component, while the c-raylight curve suggests two Ñares. However, the detectedmaxima of the Ñares di†er in time by less than 0.3 yr.Although there are two measurements between thesemaxima yielding upper limits to the c-ray emission similarto the average c-ray Ñux, the Ñares might be part of a single,complex, energetic event.
Three 22 GHz images of 1127[145 show a weak com-ponent merging with a bright stationary feature 4 mas fromthe core, with the moving knot appearing to decelerateduring the last two epochs. Although our estimate of thetime of zero separation is within 3 p uncertainty of theepoch of the c-ray Ñare, the apparent deceleration leads to avery large (1.4 yr) uncertainty for the former. Hence, we donot classify this case as a marginal correspondence despiteits meeting our formal criterion (see Fig. 3). In Mrk 421 thejet components contain only a few percent of the total Ñuxdensity, and the jet appears approximately the same fromone epoch to the next. It is therefore very difficult to deter-mine the apparent speed of features in the jet, and it ispossible only to suggest the most likely interpretation. Wehave identiÐed components in the way that produces appar-ent speeds D1.3È2 h~1 c (Marscher 1999), while Piner et al.(1999) interpret the data in terms of only subluminalmotion. In the latter case, our VLBA observations wouldhave taken place too early to resolve any component ejectedduring the c-ray Ñare.

No. 2, 2001 SUPERLUMINAL EJECTIONS AND GAMMA-RAY FLARES 741
FIG. 1.ÈProbability density functions of chance coincidences betweenc-ray Ñares and epochs of zero separation within 1 p (dark shading) and 3 p(light shading) uncertainties of epochs of superluminal ejections.
In the quasars 0827]243 and 0917]449, we have suffi-cient VLBA data to reveal the motion of componentspresent in the jet. However, in the case of 0827]243 thesuperluminal ejection nearest to the high state of the c-rayÑux occurred about 0.5 yr later than the c-ray Ñare, with anuncertainty in the time of zero separation of less than 0.1 yr.In 0917]449, one moving component is detected butappears to have been ejected signiÐcantly earlier than thetime of maximum c-ray Ñux. Therefore, in these two caseswe do not Ðnd any connection between the high state ofc-ray emission and jet activity.
3.4. Statistical SimulationsWe have carried out numerical simulations in order to
determine the probability of random coincidences betweenepochs of c-ray Ñares and ejection of superluminal jet com-ponents. To do this, we generated 1,000,000 samples of 18sources (the number of objects is equal to the number ofblazars with contemporaneous EGRET/VLBA data) withc-ray Ñare/superluminal ejection features identical to ourobservations. This means that for every source the numberand epochs of c-ray Ñares were set according to Table 1, andrandom epochs of superluminal ejections of VLBI com-ponents over the period of contemporaneous VLBA andc-ray observations (1993È1996) were generated in a quantitycorresponding to the number of superluminal ejectionsfound during this period of observations (see Table 1).Therefore, each sample of 1,000,000 generated ones consist-ed of 18 sources with 31 random superluminal ejections tocompare with 23 c-ray Ñares with Ðxed epochs. A coin-cidence was registered in the same manner as for Groups Aand B of c-rayÈbright blazars discussed above (1 p and 3 pcriteria). Uncertainties of generated epochs of zero separa-tions are equal to the uncertainties of epochs of observedsuperluminal ejections ; in the case of multiple ejections in asource, the uncertainty of the Ðrst generated epoch equalsthe uncertainty of the earliest superluminal ejection for the
source, the uncertainty of the second generated epoch is thesame as for the next observed ejection, and so on.
Figure 1 presents histograms of the probability densityfunctions of chance coincidences for 1 p (dark shading) and 3p (light shading) registration criteria (note that the histo-grams do not overlap). In the case of the 1 p criterion, theoccurrence of nine chance coincidences has a probabilityless than 1.5%, and in no case out of Ðve independent runsof the 1,000,000 simulation samples did chance coincidencesoccur for 10 of the sources in a sample. Therefore, ourÐnding of 10 positive detections out of 23 c-ray Ñares leadsus to conclude that high c-ray states and superluminal ejec-tions are associated at greater than 99.999% conÐdencelevel. This does not necessarily imply that all c-ray Ñaresand superluminal ejections in Group A are physicallyassociated : an average of Ðve to six such pairings isexpected by chance given the uncertainties, especially foruncertainties º0.5 yr. In the case of the 3 p criterion, thenumber of expected chance coincidences falls in the rangefrom 12 to 17 events with a probability greater than 92%;the number of chance coincidences º16 (the number ofcoincidences that we have detected for our sample of c-rayÈbright blazars with the 3 p criterion) occurs with D21%probability, too high to provide any meaningful constraints.
4. DISCUSSION
Correlations between the emergence of new VLBI com-ponents and radio Ñares have been noted by many authors(e.g., Mutel, Denn, & Dryer 1994 ; Wagner et al. 1995 ;Wehrle et al. 1998). Furthermore, polarized intensity VLBIimages of blazars reveal that superluminal knots are sub-stantially polarized (Gabuzda & Cawthorne 1996 ; Lister,Marscher, & Gear 1998 ; Marscher, & AlberdiGo� mez,1999). Therefore, one should expect a correlation betweenthe emergence of new VLBI components and Ñares in pol-arized radio Ñux and hence between high c-ray states andincreases in polarized radio Ñux if c-ray Ñares are associatedwith superluminal ejections.
The University of Michigan Radio Astronomy Observa-tory (UMRAO) database allows us to test for theseexpected correlations. Table 2 presents the parameters ofthe radio polarization for the positive and marginal c-ray/superluminal ejection associations (Part I) as well as for theother c-ray Ñares from Table 1 (negative detections orVLBA data that are not contemporaneous) for which theUMRAO database contains sufficient polarization data(Part II). The columns of Table 2 are as follows : (1) thesource name; (2) the epoch of the c-ray Ñare (3) the time(Tc) ;of zero separation of the superluminal component from thecore with 1 p uncertainty (4) the frequency of the pol-(T0) ;arized radio Ñux density data (l) ; (5) the maximum pol-arized Ñux density nearest to the time of the c-ray Ñare
(6) the epoch of the local maximum of polarized Ñux(Spmax) ;
density (7) the nearest minimum polarized Ñux(Tpmax) ;
density before the local maximum of polarized Ñux density(8) the epoch of the Ðrst minimum of polarized Ñux(S
pmin 1) ;
density (9) the nearest minimum polarized Ñux(Tpmin 1) ;
density after the local maximum of polarized Ñux densityand (10) the epoch of the second minimum of pol-(S
pmin 2) ;
arized Ñux density Figure 2 presents c-ray light(Tpmin 2).
curves and total as well as polarized radio light curves,along with indications of the epochs of the maxima in c-rayÑux and superluminal ejections for the positive and margin-al detections (Groups A and B), and Figure 3 illustrates

742 JORSTAD ET AL. Vol. 556
TABLE 2
EPOCHS OF SUPERLUMINAL EJECTIONS AND GAMMA-RAY AND POLARIZED RADIO FLUX PEAKS
lp
Spmax S
pmin 1 S
pmin 2
Source Tc T0 (GHz) (mJy) Tpmax (mJy) T
pmin 1 (mJy) T
pmin 2
(1) (2) (3) (4) (5) (6) (7) (8) (9) (10)
Part I
0336[019 . . . . . . 1995.266 1995.1^0.2 8.0 137^60 1995.361 31^16 1995.131 29^27* 1995.4150420[014 . . . . . . 1995.622 1995.3^0.1 14.5 208^18 1995.432 75^16 1994.989 94^16 1995.7600440[003 . . . . . . 1994.632 1994.2^0.2 14.5 202^101 1994.740 9^13* 1994.656 18^13* 1994.8280458[020 . . . . . . 1994.212 1994.0^0.1 14.5 89^49 1994.333 30^11 1994.033 23^13 1994.7050528]134 . . . . . . 1993.233 1993.2^1.6 4.8 29^16 1993.257 12^5 1992.721 5^7* 1993.926
1995.373 1995.5^0.1 4.8 26^11 1995.213 6^6* 1995.145 10^7 1995.7920836]710 . . . . . . 1992.197 1992.1^0.3 14.5 138^24 1992.203 117^16 1992.034 48^15 1992.2741219]285 . . . . . . 1994.367 1994.0^0.2 14.5 79^14 1994.414 24^13 1994.346 16^17 1994.7061222]216 . . . . . . 1992.984 1993.1^0.2 No data1226]023 . . . . . . 1993.899 1993.7^0.3 14.5 1810^106 1994.031 1249^108 1993.837 1379^63 1994.1651253[055 . . . . . . 1993.879 1993.5^0.2 14.5 383^56 1993.995 132^38 1993.837 272^59 1994.0311611]343 . . . . . . 1994.801 1995.3^1.4 14.5 123^21 1994.854 53^12 1994.209 34^21 1995.0731622[253 . . . . . . 1995.729 1996.0^0.3 No data1622[297 . . . . . . 1995.460 1995.1^0.1 No data1730[130 . . . . . . 1994.553 1994.6^0.2 8.0 297^27 1994.575 146^16 1994.382 161^85 1994.605
1995.510 1995.5^0.1 14.5 356^19 1995.431 264^19 1995.390 175^21 1995.742
Part II
0202]149 . . . . . . 1992.315 . . . 8.0 140^23 1992.486 29^33* 1992.399 13^18* 1992.5790235]164 . . . . . . 1992.185 . . . 14.5 51^19 1992.200 23^18 1992.104 20^27* 1992.2080716]714 . . . . . . 1992.197 . . . 14.5 50^17 1992.203 13^27* 1991.732 8^24* 1992.4921101]384 . . . . . . 1994.367 . . . 14.5 51^17 1994.367 9^16* 1994.345 4^19* 1994.5011127[145 . . . . . . 1993.024 . . . 8.0 134^27 1993.056 86^20 1992.913 89^19 1993.1601156]295 . . . . . . 1993.024 . . . 14.5 83^16 1993.026 24^17 1993.000 37^14 1993.5421510[089 . . . . . . 1992.260 . . . 14.5 130^61 1992.272 68^16 1992.231 56^16 1992.3731606]106 . . . . . . 1991.964 . . . 8.0 41^54* 1992.051 36^19 1991.834 24^23* 1992.1572230]114 . . . . . . 1992.647 . . . 14.5 78^15 1992.666 29^13 1992.573 48^18 1992.7452251]158 . . . . . . 1992.647 . . . 14.5 266^79 1992.748 151^20 1992.620 170^36 1992.805
NOTE.ÈEntries for marked with an asterisk (*) are the upper limits of polarized Ñux density detections.Sp
several examples for cases in Part II of Table 2. Althoughmany of the polarized Ñux density light curves are noisy, itis apparent that shortly after a superluminal ejection andc-ray Ñare, a local maximum in polarized radio Ñux isobserved.
In order to relate the multifrequency data, we have calcu-lated the di†erences between the epoch of each c-ray Ñareand the time of superluminal ejection as well as maximumand minimum level of polarized Ñux density (T0 [ Tc, T
pmax
We then normalized the[ Tc, Tpmin 1[ Tc, T
pmin 2[ Tc).polarized Ñux densities in terms of the local maximum level
for every case of positive and marginal associations of c-rayÑares and superluminal ejections (Groups A and B). Finally,we averaged these values over the entire sample. The resultis presented in Figure 4a, which reveals the general patternof behavior. A disturbance causes the appearance of asuperluminal component near the time of minimum pol-arized Ñux density days). A(ST
pmin 1[ T0T \ [17 ^ 68
c-ray Ñare follows 52 ^ 76 days later, occurring almostsimultaneously with the local maximum of the polarizedradio Ñux density days). During the(ST
pmax[ TcT \ 7 ^ 38
outburst the polarized Ñux density nearly doublesand returns to the initial(SS
pmin 1/S
pmaxT \ 0.42 ^ 0.23)
quiescent state 98 ^ 66 days(SSpmin 2/S
pmaxT \ 0.38^ 0.21)
after the c-ray Ñare. The entire duration of the combinedevent is 170^ 135 days.
Similar calculations were performed for cases listed inPart II of Table 2, where no connection between c-ray Ñares
and superluminal ejections could be established but varia-bility of the radio polarized Ñux density was observed (Fig.4b). The scenario of the perturbation is very similar to thatdescribed above. The duration of the event is 172^ 110days, the Ðrst minimum of polarized Ñux density occurs30 ^ 52 days before a c-ray Ñare, and the maximum pol-arized Ñux density occurs close to the time of the maximumc-ray emission, with a delay of only 15^ 20 days. The pol-arized Ñux density returns to the quiescent state 142 ^ 57days after the c-ray Ñare.
The results given in Table 2 support the idea that theradio emission and the c-rays originate within the sameshocked region of the relativistic jet and that the c-rays aremost likely produced by inverse Compton scattering by theelectrons in the jet far (typically parsecs) downstream of theputative accretion disk. The generalized diagrams (Fig. 4)lead us to propose a speculative model to explain thederived characteristics of such an event : An emerging jetcomponent is cross-polarized with respect to the polariza-tion of the VLBI core (e.g., in the quasar 3C 454.3 ; Go� mezet al. 1999) ; this results in a decrease of the total polarizedÑux density (the Ðrst minimum in polarized Ñux density)during the birth of the polarized component. Shortly afterthe local minimum of polarized Ñux density, a superluminalejection occurs. The standard model explains the VLBIcomponent as a manifestation of a shock wave propagatingthrough an underlying relativistic outÑow (e.g., Marscher &Gear 1985). The shock front orders the magnetic Ðeld ;

No. 2, 2001 SUPERLUMINAL EJECTIONS AND GAMMA-RAY FLARES 743
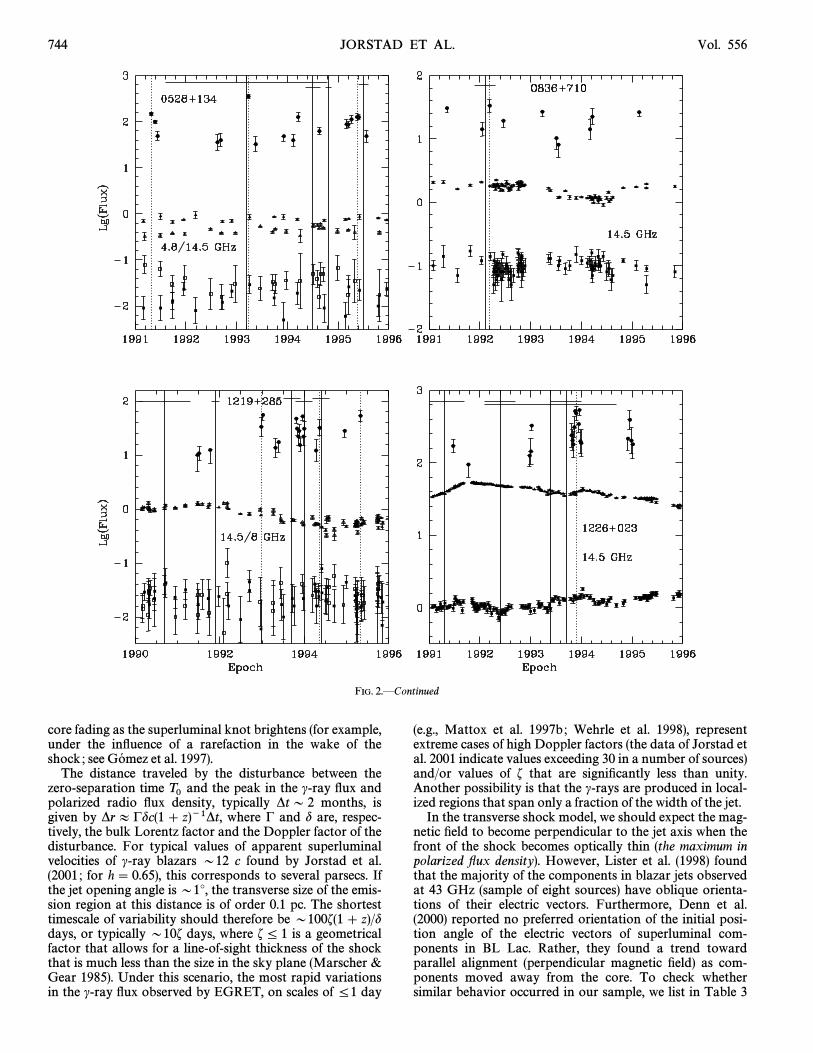
FIG. 2.ÈRadio and c-ray data for the positive or marginal coincidences between c-ray Ñares and superluminal ejections : c-ray Ñux (circles), total radioÑux density (triangles), and polarized radio Ñux density (squares) on a logarithmic scale ; solid lines indicate extrapolated times of zero separation betweenradio knots and cores with 1 p uncertainties, and dotted lines correspond to observed maxima of the c-ray emission.
hence, the polarization increases when the front Ðrstbecomes optically thin (the maximum in polarized Ñuxdensity). (Evidence for this is found in the observed increasein the fractional linear polarization of four components inBL Lac as each knot separated from the core ; Denn et al.2000.) The c-ray emission is caused by inverse Comptonscattering in the thin forward layer of the shock, whereelectrons are accelerated. This high-energy emission is Ðrstdetected somewhat downstream of the radio core.
The average delay of 52 days between the extrapolatedtime when the superluminal knot (which corresponds toT0the shocked plasma) is coincident with the radio core andthe epoch of the c-ray Ñare could correspond to the timerequired for (1) the shock to develop fully in terms of effi-ciency of accelerating electrons and compressing the mag-netic Ðeld, (2) the bulk velocity of the shock to accelerate to
its asymptotic value, (3) the Doppler factor of the shock toreach a maximum owing to the changing angle between thevelocity vector and the line of sight as it travels through abend in the jet, or (4) the synchrotron photons to travelacross the shock to the scattering electrons (synchrotronself-Compton model only ; see Marscher 2001). The largescatter in the di†erence between and indicates thatT0 Tcthere is signiÐcant variation among blazars, as one wouldexpect to be the case at least for explanations (3) and (4),which depend sensitively on the angle between the jet axisand the line of sight. The near coincidence between the peakin c-ray Ñux and polarized radio Ñux density can most easilybe accommodated by scenarios (1)È(3), since both the syn-chrotron and inverse Compton emissivities of the shockwould vary together. The absence of a clear signature in thetotal radio Ñux density light curve could be caused by the
744 JORSTAD ET AL. Vol. 556
FIG. 2.ÈContinued
core fading as the superluminal knot brightens (for example,under the inÑuence of a rarefaction in the wake of theshock ; see et al. 1997).Go� mez
The distance traveled by the disturbance between thezero-separation time and the peak in the c-ray Ñux andT0polarized radio Ñux density, typically *t D 2 months, isgiven by *r B !dc(1] z)~1*t, where ! and d are, respec-tively, the bulk Lorentz factor and the Doppler factor of thedisturbance. For typical values of apparent superluminalvelocities of c-ray blazars D12 c found by Jorstad et al.(2001 ; for h \ 0.65), this corresponds to several parsecs. Ifthe jet opening angle is D1¡, the transverse size of the emis-sion region at this distance is of order 0.1 pc. The shortesttimescale of variability should therefore be D100f(1 ] z)/ddays, or typically D10f days, where f¹ 1 is a geometricalfactor that allows for a line-of-sight thickness of the shockthat is much less than the size in the sky plane (Marscher &Gear 1985). Under this scenario, the most rapid variationsin the c-ray Ñux observed by EGRET, on scales of ¹1 day
(e.g., Mattox et al. 1997b ; Wehrle et al. 1998), representextreme cases of high Doppler factors (the data of Jorstad etal. 2001 indicate values exceeding 30 in a number of sources)and/or values of f that are signiÐcantly less than unity.Another possibility is that the c-rays are produced in local-ized regions that span only a fraction of the width of the jet.
In the transverse shock model, we should expect the mag-netic Ðeld to become perpendicular to the jet axis when thefront of the shock becomes optically thin (the maximum inpolarized Ñux density). However, Lister et al. (1998) foundthat the majority of the components in blazar jets observedat 43 GHz (sample of eight sources) have oblique orienta-tions of their electric vectors. Furthermore, Denn et al.(2000) reported no preferred orientation of the initial posi-tion angle of the electric vectors of superluminal com-ponents in BL Lac. Rather, they found a trend towardparallel alignment (perpendicular magnetic Ðeld) as com-ponents moved away from the core. To check whethersimilar behavior occurred in our sample, we list in Table 3

No. 2, 2001 SUPERLUMINAL EJECTIONS AND GAMMA-RAY FLARES 745
FIG. 2.ÈContinued
position angles of polarization for the sources from Table 2for which polarization data are available with at least 1 pdeterminations of the position angle of the electric vector.The columns of Table 3 are (1) source name; (2) positionangle (PA) of the jet on submilliarcsecond scales (3)(#jet) ;frequency of the polarization data (l) ; (4) position angle ofthe electric vector (EVPA) at the time of maximum pol-arized Ñux density (5) EVPA at the Ðrst minimum in(/
pmax) ;
polarized Ñux density (6) EVPA at the second(/pmin 1) ;
minimum polarized Ñux density and (7) orientation(/pmin 2) ;
of the magnetic Ðeld with respect to the jet direction at themaximum polarized Ñux density (o [transverse] : di†erencebetween PA of the jet and EVPA \20¡ ; p [parallel] : di†er-ence between PA of the jet and EVPA [70¡ ; and\ [oblique] : all other cases). No Faraday rotation measure(RM) corrections are applied to the observed EVPAs, sinceeven the relative large RM for quasar 0458[020 ([170 radm~2 ; Simard-Normandin, Kronberg, & Button 1981) pro-duces a small Faraday rotation (¹5¡) at 15 GHz. Therefore,
we take the orientation of the magnetic Ðeld to be essen-tially perpendicular to the observed EVPAs. Analysis of thedata in Table 3 shows that in nine out of 22 cases themagnetic Ðeld had an oblique orientation at the maximumpolarized Ñux density ; however, in the quasars 0458[020and 1510[089 the magnetic Ðeld tended toward the trans-verse direction at the maximum compared with the Ðrstminimum of polarized Ñux density (when the magnetic Ðeldwas also oblique). In Ðve of 22 cases, the magnetic Ðeld wasalmost perpendicular to the jet direction at the high state ofpolarized Ñux density, and in the quasars 0440[003 and1611]343, a signiÐcant change of EVPA between themaximum and second minimum of polarized Ñux densitywas observed. The remaining eight cases showed parallelorientation of the magnetic Ðeld at both the minima andmaximum in polarized Ñux density ; this implies a strongunderlying parallel magnetic Ðeld. These magnetic Ðeldorientations during the event are considerably morecomplex than one would expect from the transverse or

746 JORSTAD ET AL. Vol. 556
FIG. 3.ÈAs in Fig. 2, but for c-ray Ñares that are not accompanied by detected superluminal ejections
moving oblique shock models : for the latter model, Lister etal. (1998) showed by using numerical simulations that thedistribution of EVPA misalignment angles should peak atlow misalignment values. The cause of this discrepancybetween theory and observation could be the overly simplenature of the transverse shock model. Numerical hydrody-namical simulations (e.g., et al. 1997) show thatGo� mezthe structure of a relativistic shock is likely to be quite com-plex, including secondary shocks and trailing shocks andrarefactions.
5. CONCLUSION
Our study establishes a statistical association betweenthe ejection of superluminal radio knots and high states ofc-ray emission in blazars. Our analysis of the delay betweenthe time when a superluminal radio knot is coincident withthe radio core and the epoch of the maximum observed
c-ray Ñux, along with an investigation of the variability ofpolarized radio Ñux density during the c-ray Ñare, leads usto conclude that both the radio and the c-ray events orig-inate within the same shocked area of the relativistic jet.This region is near but probably downstream of the corerather than much closer to the central engine, as had beensupposed previously. Our conclusion is consistent with theÐnding of Valtaoja & (1996) that c-ray ÑaresTera� srantaoccur after the millimeter-wave Ñux starts to rise. Theplacing of the c-rayÈemitting region downstream of theradio core strongly supports inverse Compton models forthe origin of the c-rays. The electrons accelerated in theshocks (which also correspond to superluminal radio knots)scatter photons that originate either within the shockedregion or from a site external to the jet (e.g., the emission-line clouds ; Sikora, Begelman, & Rees 1994). Our results, onthe other hand, conÑict with models in which the c-rays are

No. 2, 2001 SUPERLUMINAL EJECTIONS AND GAMMA-RAY FLARES 747
Fig. 4a Fig. 4b
FIG. 4.È(a) Average temporal relationship between c-ray Ñares, superluminal ejections, and polarized radio Ñux densities. The dotted line indicates theepoch of the c-ray Ñare, the vertical solid line shows the epoch of superluminal ejection, and the horizontal solid line shows the standard deviation of thedelay with respect to the c-ray Ñare ; the dashed line connects the points of successive minima and the maximum of the polarized radio Ñux density. (b)Average temporal relationship between c-ray Ñares and polarized radio Ñux densities ; designations are as in (a).
produced in the intense radiation environment close to theputative accretion disk.
The relations between the times of radio and c-ray eventspresented here are rather rough owing to incomplete time
coverage in both the c-ray light curves and the VLBAobservations. Our statistical associations, therefore, shouldbe veriÐed through better time sampling of the c-ray lightcurves of more blazars, coupled with regular, closely spaced
TABLE 3
COMPARISON BETWEEN POSITION ANGLE OF RADIO JETS AND POSITION ANGLE OF TOTAL LINEAR
RADIO POLARIZATION
#jet lp
/pmax /
pmin 1 /
pmin 2 Orientation of
Source (deg) (GHz) (deg) (deg) (deg) Magnetic Field(1) (2) (3) (4) (5) (6) (7)
Part I
0336[019 . . . . . . 45 8.0 149^7 141^22 . . . p
0420[014 . . . . . . [160 14.5 94^3 130^7 111^5 p
0440[003 . . . . . . [123 14.5 72^12 . . . 45^16 o
0458[020 . . . . . . [7 14.5 26^15 47^13 42^14 \0528]134 . . . . . . 61 4.8 111^13 124^11 . . . \
4.8 123^9 . . . 113^17 \0836]710 . . . . . . [140 14.5 111^4 104^3 112^8 p
1219]285 . . . . . . 102 14.5 63^4 54^13 . . . \1226]023 . . . . . . [108 14.5 150^1 144^2 149^1 p
1253[055 . . . . . . [115 14.5 69^4 76^7 63^6 o
1611]343 . . . . . . 173 14.5 1^3 7^6 126^14 o
1730[130 . . . . . . 17 8.0 80^2 80^3 87^7 \14.5 93^1 103^2 84^3 p
Part II
0202]149 . . . . . . [32 8.0 74^4 . . . . . . p
0235]164 . . . . . . 0 14.5 123^11 24^22 . . . \0716]714 . . . . . . 10 14.5 24^9 . . . . . . o
1101]384 . . . . . . [25 14.5 129^9 . . . . . . \1127[145 . . . . . . 86 8.0 160^6 167^10 158^5 p
1156]295 . . . . . . 0 14.5 149^4 170^19 161^10 \1510[089 . . . . . . [32 14.5 115^13 90^7 68^8 \2230]114 . . . . . . 132 14.5 115^5 123^14 107^10 o
2251]158 . . . . . . [66 14.5 31^8 24^3 17^6 p

748 JORSTAD ET AL.
VLBA observations. The authors hope that a concertede†ort can be carried out with the VLBA when the plannedGLAST c-ray mission provides well-sampled monitoring ofthe c-ray Ñuxes of hundreds of blazars.
This work was supported in part by NASA throughCGRO Guest Investigator grants NAG5-7323 and NAG5-
2508 and by US National Science Foundation grant AST-9802941. A. E. W. and J. R. M. were supported in part bythe NASA Long Term Space Astrophysics program. TheUMRAO observations were partially supported by NSFgrant AST-9421979 and preceding grants and by the Uni-versity of Michigan. We are thankful to J. Ulvestad forsubstantial comments about the statistical simulations.
REFERENCESBower, G. C., Backer, D. C., Wright, M., & Forster, J. R. 1997, ApJ, 484,
118Britzen, S., et al. 1999, A&A, 341, 418Denn, G. R., Mutel, R. L., & Marscher, A. P. 2000, ApJS, 129, 61Gabuzda, D. C., & Cawthorne, T. V. 1996, MNRAS, 283, 759Gabuzda, D. C., Mullan C. M., Cawthorne, T. V., Wardle, J. F. C., &
Roberts, D. H. 1994, ApJ, 435, 140J. L., Marscher, A. P., & Alberdi, A. 1999, ApJ, 522, 74Go� mez,J. L., J. M., Marscher, A. P., J. M., & Alberdi, A.Go� mez, Mart•� , Iba� n8 ez,
1997, ApJ, 482, L33Hartman, R. C., et al. 1999, ApJS, 123, 79Jorstad, S. G., Marscher, A. P., Mattox, J. R., Wehrle, A. E., Bloom, S. D.,
& Yurchenko, A. V. 2001, ApJS, 134, 181Krichbaum, T. P., et al. 1995, in Quasars and Active Galactic Nuclei : High
Resolution Radio Imaging, ed. M. H. Cohen & K. I. Kellermann (Proc.Nat. Acad. Sci. 92 ; Charlottesville : NRAO), 11377
ÈÈÈ. 1996, in Proceedings of the Heidelberg Workshop on Gamma-RayEmitting AGN, ed. J. G. Kirk (Heidelberg : MPI Kernphysik), 96fu� r
A., Valtaoja, E., & Tornikoski, M. 1999, in AIP Conf. Proc.La� hteenma� ki,510, The Fifth Compton Symposium, ed. M. L. McConnell & J. M.Ryan (Melville : AIP), 372
Lister, M. L., Marscher, A. P., & Gear, W. K. 1998, ApJ, 504, 702Marscher, A. P. 1999, Astropart. Phys., 11, 19ÈÈÈ. 2001, in ASP Conf. Ser. 224, Probing the Physics of Active Galac-
tic Nuclei by Multiwavelength Monitoring, ed. B. M. Peterson, R. S.Polidan, & R. W. Pogge (San Francisco : ASP), 23
Marscher, A. P., & Gear, W. K. 1985, ApJ, 298, 114Mattox, J. R., Hallum, J. C., Marscher, A. P., Jorstad, S. G., Waltman,
E. B., H., Aller, H. D., & Aller, M. F. 2001, ApJ, 549, 906Tera� sranta,Mattox, J. R., Schachter, J., Molnar, L., Hartman, R. C., & Patnail, A. R.
1997a, ApJ, 481, 95Mattox, J. R., Wagner, S. J., Malkan, M., McGlynn, T. A., Schachter, J. F.,
Grove, J. E., Johnson, W. N., & Kurfess, J. D. 1997b, ApJ, 476, 692McGlynn, T. A., et al. 1997, ApJ, 481, 625Mutel, R. L., Denn, G. R., & Dryer, M. J. 1994, in Compact Extragalactic
Radio Sources, ed. J. A. Zensus & K. I. Kellermann (NRAO WorkshopProc. 23 ; Green Bank: NRAO), 191
Otterbein, K., et al. 1998, A&A, 334, 489Piner, B. G., Unwin, S. C., Wehrle, A. E., Edwards, P. G., Fey, A. L., &
Kingham, K. A. 1999, ApJ, 525, 176Piner, B. G., & Kingham, K. A. 1998, ApJ, 507, 706Sikora, M., Begelman, M. C., & Rees, M. J. 1994, ApJ, 421, 153Simard-Normandin, M., Kronberg, P. P., & Button, S. 1981, ApJS, 45, 97Valtaoja, E., & H. 1996, A&AS, 120, C491Tera� sranta,Wagner, S. J., et al. 1995, A&A, 298, 688Wehrle, A. E., et al. 1998, ApJ, 497, 178Wehrle, A. E., Zoock, A. C., & Unwin S. C. 1994, The Multimission Per-
spective (Napa Valley : Eureka ScientiÐc), 27
Copyright © 2022 FDOKUMEN