The Value of Using Feasibility Models in Systematic Conservation Planning to Predict Landholder...
12
Special Section The Value of Using Feasibility Models in Systematic Conservation Planning to Predict Landholder Management Uptake AYESHA I. T. TULLOCH, ∗ † VIVITSKAIA J. D. TULLOCH,‡ MEGAN C. EVANS,† AND MORENA MILLS§ ∗ National Environmental Research Program Environmental Decisions Hub, School of Geography, Planning and Environmental Management, The University of Queensland, Brisbane, QLD, 4072, Australia †Fenner School of Environment and Society, Australian National University, Canberra, ACT, 0200, Australia ‡Australian Research Council Centre of Excellence for Environmental Decisions, School of Biological Sciences, The University of Queensland, Brisbane, QLD, 4072, Australia §Global Change Institute, The University of Queensland, Brisbane, Queensland, 4072, Australia Abstract: Understanding the social dimensions of conservation opportunity is crucial for conservation planning in multiple-use landscapes. However, factors that influence the feasibility of implementing conserva- tion actions, such as the history of landscape management, and landholders’ willingness to engage are often difficult or time consuming to quantify and rarely incorporated into planning. We examined how conservation agencies could reduce costs of acquiring such data by developing predictive models of management feasibility parameterized with social and biophysical factors likely to influence landholders’ decisions to engage in management. To test the utility of our best-supported model, we developed 4 alternative investment scenarios based on different input data for conservation planning: social data only; biological data only; potential conservation opportunity derived from modeled feasibility that incurs no social data collection costs; and existing conservation opportunity derived from feasibility data that incurred collection costs. Using spatially explicit information on biodiversity values, feasibility, and management costs, we prioritized locations in southwest Australia to control an invasive predator that is detrimental to both agriculture and natural ecosystems: the red fox (Vulpes vulpes). When social data collection costs were moderate to high, the most cost- effective investment scenario resulted from a predictive model of feasibility. Combining empirical feasibility data with biological data was more cost-effective for prioritizing management when social data collection costs were low (<4% of the total budget). Calls for more data to inform conservation planning should take into account the costs and benefits of collecting and using social data to ensure that limited funding for conservation is spent in the most cost-efficient and effective manner. Keywords: conservation opportunity, critical weight range mammals, incentive mechanisms, invasive species control, species distribution model, threatened species management, willingness to engage, 1080 fox baiting El Valor de Usar Modelos de Viabilidad en la Planeaci´ on de la Conservaci´ on Sistem´ atica para Predecir la Com- prensi´ on de Manejo de los Terratenientes Resumen: Entender las dimensiones sociales de las oportunidades de conservaci´ on es importante para la planeaci´ on de la conservaci´ on en terrenos de uso m´ ultiple. Sin embargo, los factores que influyen la viabilidad de implementar acciones de conservaci´ on, como la historia del manejo del terreno y la disposici´ on de los terratenientes a comprometerse, frecuentemente son dif´ ıciles o consumen mucho tiempo para poder cuantificar y rara vez se incorporan a la planeaci´ on. Examinamos c´ omo las agencias de conservaci´ on Address for correspondence: Fenner School of Environment and Society, Australian National University, Canberra, ACT, 0200, Australia, email [email protected] Paper submitted March 30, 2014; revised manuscript accepted July 12, 2014. 1462 Conservation Biology, Volume 28, No. 6, 1462–1473 C 2014 Society for Conservation Biology DOI: 10.1111/cobi.12403
Transcript of The Value of Using Feasibility Models in Systematic Conservation Planning to Predict Landholder...

Special Section
The Value of Using Feasibility Models in SystematicConservation Planning to Predict LandholderManagement UptakeAYESHA I. T. TULLOCH,∗† VIVITSKAIA J. D. TULLOCH,‡ MEGAN C. EVANS,†AND MORENA MILLS§∗National Environmental Research Program Environmental Decisions Hub, School of Geography, Planning and EnvironmentalManagement, The University of Queensland, Brisbane, QLD, 4072, Australia†Fenner School of Environment and Society, Australian National University, Canberra, ACT, 0200, Australia‡Australian Research Council Centre of Excellence for Environmental Decisions, School of Biological Sciences, The University ofQueensland, Brisbane, QLD, 4072, Australia§Global Change Institute, The University of Queensland, Brisbane, Queensland, 4072, Australia
Abstract: Understanding the social dimensions of conservation opportunity is crucial for conservationplanning in multiple-use landscapes. However, factors that influence the feasibility of implementing conserva-tion actions, such as the history of landscape management, and landholders’ willingness to engage are oftendifficult or time consuming to quantify and rarely incorporated into planning. We examined how conservationagencies could reduce costs of acquiring such data by developing predictive models of management feasibilityparameterized with social and biophysical factors likely to influence landholders’ decisions to engage inmanagement. To test the utility of our best-supported model, we developed 4 alternative investment scenariosbased on different input data for conservation planning: social data only; biological data only; potentialconservation opportunity derived from modeled feasibility that incurs no social data collection costs; andexisting conservation opportunity derived from feasibility data that incurred collection costs. Using spatiallyexplicit information on biodiversity values, feasibility, and management costs, we prioritized locations insouthwest Australia to control an invasive predator that is detrimental to both agriculture and naturalecosystems: the red fox (Vulpes vulpes). When social data collection costs were moderate to high, the most cost-effective investment scenario resulted from a predictive model of feasibility. Combining empirical feasibilitydata with biological data was more cost-effective for prioritizing management when social data collectioncosts were low (<4% of the total budget). Calls for more data to inform conservation planning should takeinto account the costs and benefits of collecting and using social data to ensure that limited funding forconservation is spent in the most cost-efficient and effective manner.
Keywords: conservation opportunity, critical weight range mammals, incentive mechanisms, invasive speciescontrol, species distribution model, threatened species management, willingness to engage, 1080 fox baiting
El Valor de Usar Modelos de Viabilidad en la Planeacion de la Conservacion Sistematica para Predecir la Com-prension de Manejo de los Terratenientes
Resumen: Entender las dimensiones sociales de las oportunidades de conservacion es importante parala planeacion de la conservacion en terrenos de uso multiple. Sin embargo, los factores que influyen laviabilidad de implementar acciones de conservacion, como la historia del manejo del terreno y la disposicionde los terratenientes a comprometerse, frecuentemente son difıciles o consumen mucho tiempo para podercuantificar y rara vez se incorporan a la planeacion. Examinamos como las agencias de conservacion
Address for correspondence: Fenner School of Environment and Society, Australian National University, Canberra, ACT, 0200, Australia, [email protected] submitted March 30, 2014; revised manuscript accepted July 12, 2014.
1462Conservation Biology, Volume 28, No. 6, 1462–1473C© 2014 Society for Conservation BiologyDOI: 10.1111/cobi.12403
Tulloch et al. 1463
pueden reducir los costos de adquisicion de dicha informacion al desarrollar modelos pronosticadores demanejo de viabilidad con parametros de factores sociales y biofısicos que probablemente influyan sobre lasdecisiones de los terratenientes de participar en el manejo. Para probar la utilidad de nuestro modelo mejorfundamentado, desarrollamos cuatro escenarios alternativos de inversion basados en diferentes entradasde datos para la planeacion de la conservacion: solo datos sociales; solo datos biologicos; oportunidad deconservacion potencial derivada de la viabilidad modelada que no cause gastos de colecta de datos sociales;y oportunidades conservacion existentes derivados de datos de viabilidad que causaron gastos de colecta.Al usar informacion espacialmente explıcita sobre los valores de la biodiversidad, viabilidad y gastos demanejo, priorizamos ubicaciones en el suroeste de Australia para controlar a un depredador invasor quees danino para la agricultura y los ecosistemas naturales: el zorro rojo (Vulpes vulpes). El escenario deinversion mas rentable resulto de un modelo pronosticador de viabilidad. Combinar los datos de viabilidadempırica con datos biologicos fue mas rentable para priorizar el manejo cuando los gastos de colecta de datossociales fueron bajos (<4% del presupuesto total). Al querer mas datos para informar a la planeacion de laconservacion se deben considerar los gastos y beneficios de colectar y usar datos sociales para asegurar queel financiamiento limitado de la conservacion se gaste de la manera mas rentable y efectiva.
Palabras Clave: cebado de zorros 1080, control de especies invasoras, disposicion para comprometerse,mamıferos de rango de peso crıtico, manejo de especies amenazadas, mecanismos incentivos, modelo de dis-tribucion de especies, oportunidad de conservacion
Introduction
An understanding of the history of human use of alandscape and associated opportunities for implement-ing conservation actions is useful to effectively identifypriority areas for managing declining biodiversity (Knightet al. 2010). Many areas of high conservation value arewithin private land, where opportunities for conserva-tion can be uncertain (Curtis & Mendham 2011). Infor-mation on the feasibility of implementing managementthat provides conservation benefits for biodiversity canavoid misplaced effort in areas with low likelihood oflandholder engagement, or that conflict with human re-source use (Ban et al. 2013). Management feasibility, acomponent of conservation opportunity (Moon et al.2014 [this issue]), predicts the likelihood of success-fully implementing an action. Data reflecting feasibilityare increasingly collected and included in conservationpriority-setting exercises, including information on land-holder willingness to sell (e.g., Guerrero et al. 2010) andsocial or cultural values of the landscape (Whitehead et al.2014). Because funding for conservation is limited, cost-effectiveness analysis is often used to solve problems ofdeciding where to do conservation actions, by choosingthe strategy with the highest rate of conservation returnrelative to management costs (e.g., Joseph et al. 2009;Auerbach et al. 2014). Prioritization decisions usually ac-count only for the costs of actions (Hughey et al. 2003),and rarely include the costs of investing in data (Baxter &Possingham 2011). No studies have examined how sensi-tive decisions are to the costs of data collected to informthe feasibility of management implementation (but seeGrantham et al. 2008).
Data on human characteristics used to assess andmap feasibility are traditionally collected at a local-scalethrough social surveys or interviews. These provide
valuable insight into personal motivations and valuesbut, similar to fine-scale or short-term biodiversity sur-veys, can be costly, time-consuming and hard to extrap-olate outside of the study area due to spatial variabilityand data uncertainties (Lechner et al. 2014 [this issue]).This means managers face a trade-off—more resourcesspent collecting social data means fewer resources foraction, but an insufficient understanding of the plan-ning region and its socio-economic complexities due totoo few data can result in lost efficiencies and poorly-located management.
Models of management feasibility could decrease costsof obtaining social data by predicting likelihood of im-plementation (e.g., Guerrero et al. 2010), however therehave been few attempts to create such models as hu-man behavior is difficult to predict. The willingness of alandholder to conduct management activities that mightbenefit biodiversity is influenced by complex humaninteractions, relations, motivations, values, and subjec-tive perspectives, and may depend on multiple eco-nomic, social, political, and environmental objectivesand constraints (Pannell et al. 2006; Raymond & Brown2011). Important factors that influence management fea-sibility include budget constraints and profit expectations(e.g., Cary et al. 2001), property size and land use (AbadiGhadim et al. 2005), existence and strength of landhold-ers’ social networks (Sobels et al. 2001), membership oforganizations (Kington & Pannell 2003), the conserva-tion values and education of the individual landholder(Burton 2014), and perceived environmental advantage(Cary 1993). Models of feasibility would require fewerresources if they could be developed from biophysicalcharacteristics reflecting human values and land use. Con-servationists already apply sophisticated models basedon biophysical characteristics such as vegetation ex-tent and distance from key resources, to predict species
Conservation BiologyVolume 28, No. 6, 2014
1464 Management Feasibility Models
occurrences and identify areas for prioritizing conserva-tion efforts on the basis of highly uncertain biodiversitydata (Guisan et al. 2013). Yet few studies have used bio-physical characteristics to predict management feasibility(but see Guerrero et al. 2010; Mills et al. 2012) and nonehave compared the cost-effectiveness of using modeledbehavior instead of actual landholder characteristics col-lected through interviews, surveys, or standardized mon-itoring systems (e.g. Towerton et al. 2013), for informingconservation planning decisions.
Although most conservation planning studies assumea net negative impact of humans on biodiversity and planto minimize interaction between resource use and bio-diversity (Klein et al. 2008), land management practicescan also have positive impacts. These might be inten-tional conservation benefits through landscape modifica-tion (e.g., restoring habitat, erosion control, fencing-offremnant vegetation to protect from grazing) and privateland conservation policies such as covenants or ease-ments, or unintentional benefits to conservation throughactions to improve economic yield of their land use (e.g.,killing weed species or fighting wildfire) (Fitzsimonset al. 2013). Considering such practices in conservationprioritization is essential because the degree to whichactions benefit the landholder can influence whether alandholders is interested in participating in conservationactions (Pannell et al. 2006).
We considered whether geographic locations of pastmanagement actions implemented by private landholdersand benefiting biodiversity can be used to predict thefuture distribution of management effort, and whether itis possible to predict where management is most likely tobe feasible based on landscape characteristics alone. Weexplored how priorities for conservation changed whenpredictions of conservation opportunity were used inplanning relative to when no social data were used toprioritize actions (under the assumption that future land-holder engagement is spatially predictable). We aimed todiscover under what circumstances it was more cost-effective to build a model of management feasibility,rather than collect social data, to prioritize conservationmanagement within an existing incentive scheme. Ourcase study was controlling the invasive red fox (Vulpesvulpes) in the southwest Australian biodiversity hotspot,where foxes prey on livestock and native fauna. Our ob-jective was to minimize the cost of investing in manage-ment on private land in a typical multiple-use landscapewhere conservation resources are limited.
Methods
Case Study
In Australia, the invasive red fox is implicated in thedecline and extinction of native vertebrates, loss ofagricultural production due to livestock predation, and
disease transmission (Saunders et al. 2010). In responseto this ongoing threat, fox management programs havebeen implemented on public and private lands acrossAustralia, typically using poison baits containing sodium2-fluoroacetate (1080), with over AU$16 million spenton this annually (Saunders et al. 2010). Our study re-gion is the area of the Fitz-Stirling (17,000 km2) in thesouth-west Australian biodiversity hotspot, characterizedby high species endemism and high threat due to thecoincidence of agricultural production and biodiverseareas (Myers et al. 2000; Supporting Information). Untilrecently, most fox management was carried out in anad hoc manner, with little cooperation or coordinationbetween managers. However, recent work indicates thatdue to the high mobility and recolonization potential offoxes, increasing the frequency and spatial coverage offox control with participatory stakeholder managementincreases survival of lambs (McLeod et al. 2010) and na-tive animals (Western Australian Government WesternShield Program, unpublished data). Failure to strategicallytarget areas of agricultural and conservation value riskssevere losses to the agricultural industry as well as tobiodiversity.
Our scale of management was at the property level,with each privately owned land parcel representing anarea that can be managed. We divided the study areainto planning units on the basis of cadastral boundaries.Properties were considered an appropriate managementunit because the decision to conduct fox baiting is madeby the individual landholder at the scale of the property.All properties <1 km2 were merged with the neighbor-ing unit that shared the longest boundary, resulting in1337 planning parcels (area mean [SE] = 9.83 km2 [0.24];Supporting Information).
Species Distribution Data
We selected 7 species that have suffered range and pop-ulation declines over the past century (Burbidge et al.2008), and whose populations are predicted to have>50% chance of increasing under invasive predator man-agement (Tulloch et al. 2013a) (Table 1). One species, thedibbler (Parantechinus apicalis), occurs only in nationalparks, so this species was excluded from further analysesbecause we were interested in prioritizing conservationinvestment on private land. We modeled the distribu-tion of the 6 remaining species in the software Maxentversion 3.2.1 with existing species distribution data andenvironmental variables (Phillips et al. 2006; SupportingInformation).
Predicting Management Feasibility on Private Land
To inform management feasibility, data on land-holder engagement in fox management (through poisonbaiting) were obtained from the Western Australian
Conservation BiologyVolume 28, No. 6, 2014
Tulloch et al. 1465
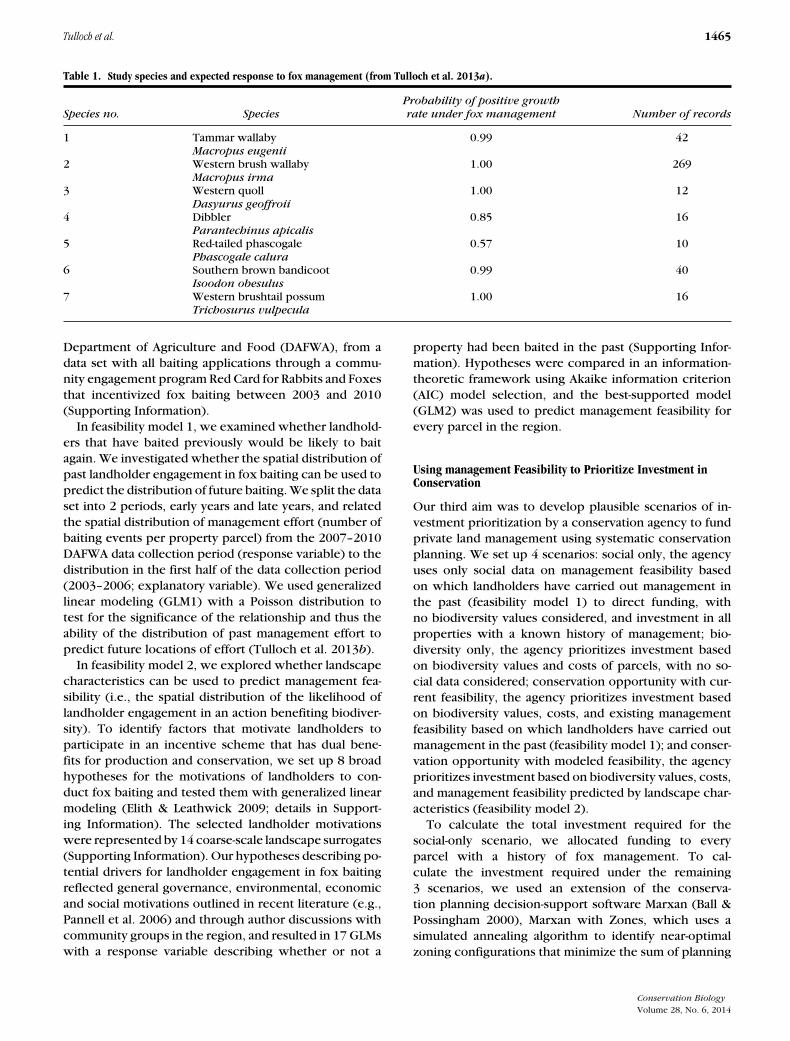
Table 1. Study species and expected response to fox management (from Tulloch et al. 2013a).
Probability of positive growthSpecies no. Species rate under fox management Number of records
1 Tammar wallaby 0.99 42Macropus eugenii
2 Western brush wallaby 1.00 269Macropus irma
3 Western quoll 1.00 12Dasyurus geoffroii
4 Dibbler 0.85 16Parantechinus apicalis
5 Red-tailed phascogale 0.57 10Phascogale calura
6 Southern brown bandicoot 0.99 40Isoodon obesulus
7 Western brushtail possum 1.00 16Trichosurus vulpecula
Department of Agriculture and Food (DAFWA), from adata set with all baiting applications through a commu-nity engagement program Red Card for Rabbits and Foxesthat incentivized fox baiting between 2003 and 2010(Supporting Information).
In feasibility model 1, we examined whether landhold-ers that have baited previously would be likely to baitagain. We investigated whether the spatial distribution ofpast landholder engagement in fox baiting can be used topredict the distribution of future baiting. We split the dataset into 2 periods, early years and late years, and relatedthe spatial distribution of management effort (number ofbaiting events per property parcel) from the 2007–2010DAFWA data collection period (response variable) to thedistribution in the first half of the data collection period(2003–2006; explanatory variable). We used generalizedlinear modeling (GLM1) with a Poisson distribution totest for the significance of the relationship and thus theability of the distribution of past management effort topredict future locations of effort (Tulloch et al. 2013b).
In feasibility model 2, we explored whether landscapecharacteristics can be used to predict management fea-sibility (i.e., the spatial distribution of the likelihood oflandholder engagement in an action benefiting biodiver-sity). To identify factors that motivate landholders toparticipate in an incentive scheme that has dual bene-fits for production and conservation, we set up 8 broadhypotheses for the motivations of landholders to con-duct fox baiting and tested them with generalized linearmodeling (Elith & Leathwick 2009; details in Support-ing Information). The selected landholder motivationswere represented by 14 coarse-scale landscape surrogates(Supporting Information). Our hypotheses describing po-tential drivers for landholder engagement in fox baitingreflected general governance, environmental, economicand social motivations outlined in recent literature (e.g.,Pannell et al. 2006) and through author discussions withcommunity groups in the region, and resulted in 17 GLMswith a response variable describing whether or not a
property had been baited in the past (Supporting Infor-mation). Hypotheses were compared in an information-theoretic framework using Akaike information criterion(AIC) model selection, and the best-supported model(GLM2) was used to predict management feasibility forevery parcel in the region.
Using management Feasibility to Prioritize Investment inConservation
Our third aim was to develop plausible scenarios of in-vestment prioritization by a conservation agency to fundprivate land management using systematic conservationplanning. We set up 4 scenarios: social only, the agencyuses only social data on management feasibility basedon which landholders have carried out management inthe past (feasibility model 1) to direct funding, withno biodiversity values considered, and investment in allproperties with a known history of management; bio-diversity only, the agency prioritizes investment basedon biodiversity values and costs of parcels, with no so-cial data considered; conservation opportunity with cur-rent feasibility, the agency prioritizes investment basedon biodiversity values, costs, and existing managementfeasibility based on which landholders have carried outmanagement in the past (feasibility model 1); and conser-vation opportunity with modeled feasibility, the agencyprioritizes investment based on biodiversity values, costs,and management feasibility predicted by landscape char-acteristics (feasibility model 2).
To calculate the total investment required for thesocial-only scenario, we allocated funding to everyparcel with a history of fox management. To cal-culate the investment required under the remaining3 scenarios, we used an extension of the conserva-tion planning decision-support software Marxan (Ball &Possingham 2000), Marxan with Zones, which uses asimulated annealing algorithm to identify near-optimalzoning configurations that minimize the sum of planning
Conservation BiologyVolume 28, No. 6, 2014
1466 Management Feasibility Models
parcel and zone boundary costs while meeting a suite ofconservation targets (Watts et al. 2009). Marxan withZones improves our ability to accommodate multiplesocio-economic and biodiversity considerations in con-servation planning, through the addition of user-definedzones and ability to specify costs and targets for eachzone. We planned for 3 management zones: no fox man-agement, low-intensity management (2 baiting events peryear), and high-intensity management (4 baiting eventsper year). The low-intensity management zone representscurrent landholder baiting practices, which are typicallyonce or twice a year and provide limited benefits to bio-diversity but satisfy needs to protect sheep during keybreeding seasons. The high-intensity management zonereflects the management practices of the State conserva-tion agency that bait statewide every 3 months in nationalparks (Armstrong 2004), where the primary objective isto provide conservation benefits to threatened species.
We considered our 6 threatened mammal species asthe biodiversity values for each scenario, and set tar-gets of 17% of their distributions to be managed. Weassumed a species was present in a planning parcel ifthe maximum probability of occurrence in any remnantpatch within the parcel was greater than 60%. The con-tribution of different land uses to species conservationvaries depending on the relative sensitivity of species tothreats and their management. We therefore developed acontribution matrix (the likely contribution of each zoneto achieve targets) based on a previous study (Tullochet al. 2013a): 90% for high-intensity management, 50% forlow-intensity management, and zero for no conservationmanagement (Supporting Information).
The costs of each parcel were calculated in 2 ways.For the social-only and biodiversity-only scenarios, wecreated a baseline management cost layer that identified3 possible costs per parcel: no, low- or high-intensitymanagement (0, 2, or 4 baiting events per year, respec-tively). The cost of high-intensity management (ci) of par-cel i was the parcel area multiplied by the annual cost ofbaiting per square kilometer of private land, estimatedat $100/km2, and reflecting the conservation agencies’average management expenditure in the region. The costper parcel was halved for low-intensity management, andwas 0 for no management.
For both conservation opportunity scenarios, we ad-justed the cost of fox baiting in each parcel (at a frequencythat would benefit threatened species) to account forpredicted management feasibility:
hiz =ciz(1 − α), (1)
where hiz is the adjusted cost of baiting parcel i underzone z, ciz is the baseline cost of baiting the parcel un-der zone z (accounting for area and baiting rate), and α
is an adjustment factor applied to each parcel parame-terized with the modeled value of management feasibil-ity (a value from 0 to 1). If the modeled management
feasibility (α) is equal to 1, this means the landholder isalready baiting to a frequency that would benefit threat-ened species and no additional funding is required tomanage this parcel for conservation. If α = 0, there isno adjustment applied to the parcel (no existing man-agement), and the cost is equal to the baseline cost.In most cases, α < 0 due to model uncertainty, whichallows a more realistic prediction of costs and ensures allproperties are candidates for investment.
In the conservation opportunity with current feasibilityscenario, α was parameterized with the response curveof GLM1 (section feasibility model 1). Costs of managingeach parcel were reduced by the existing managementfeasibility values predicted using the DAFWA data seton the history of past landholder management. In theconservation opportunity with modeled feasibility sce-nario, α was parameterized using the response curvefrom the best-supported GLM2 (section feasibility model2). Costs of managing each parcel were reduced by themanagement feasibility values that had been predictedusing landscape-level surrogates.
Calculating Cost-Effectiveness of Data and Management
Our final aim was to compare the cost-effectiveness ofdifferent investment scenarios in relation to the costsand benefits of the data used to parameterize the decisionsolutions.
Using the best solutions of our prioritizations, we firstcalculated the benefit M of managing n selected parcelsin each zone, which is the summed managed area of allspecies distributions:
M =∑n
i=1xiz · biz · ez, (2)
where x is a control variable for parcel i that takes values0 (not selected) or 1 (selected for management) for zonez, biz is the summed area of all species distributions thatfall inside planning parcel i for zone z, and ez is the pro-portional contribution of that zone’s level of managementto species conservation (“output success”: in our study,0.9 for high-intensity management, 0.5 for low-intensitymanagement, and 0 for no conservation management).The parameter e is equivalent to the probability that, ifimplemented successfully, the action would be success-ful in managing the threat.
We then adjusted the benefit for each parcel by theprobability of that parcel having been managed in thepast, to give us a total expected benefit value B thataccounted for feasibility in each parcel:
B =∑n
i=1xiz · biz · ez · pi , (3)
where pi is the probability that the action could be un-dertaken successfully (input success; Joseph et al. 2009),ranging from 0.05 (no information on implementationopportunity, adjusted from a value of 0 to account for
Conservation BiologyVolume 28, No. 6, 2014
Tulloch et al. 1467
uncertainty) to 1 (100% probability of implementation—in our study, baited every year between 2003 and 2010).The parameter p was parameterized from the responsecurve on existing management feasibility (GLM1).
The total management investment, C, was calculatedby summing the baseline (rather than adjusted) costs ofeach parcel selected for management in the best solutionfrom each scenario:
C =∑n
i=1xiz · ciz. (4)
We then derived from experts the likely investment,given the size of the study area, required to obtain 2 dif-ferent types of data, biological and social (A. Guerrero andV. Adams, personal communication). We recalculated thetotal scenario cost as the cost of management, C, plus thecost of data, D. The social-only scenario included onlysocial data costs, the biodiversity-only scenario and con-servation opportunity with modeled feasibility scenarioincluded only biological data costs, and the conservationopportunity with current feasibility scenario includedbiological and social data costs.
The total scenario cost-effectiveness (CE) was the over-all benefit divided by the sum of the investment in datacollection and management:
C E = B
(C + D). (5)
For each scenario, we explored the results of changingthe costs of social data collection, to explore thresholdsat which the most cost-effective strategy changed.
Results
Predicting Future Distribution of Baiting
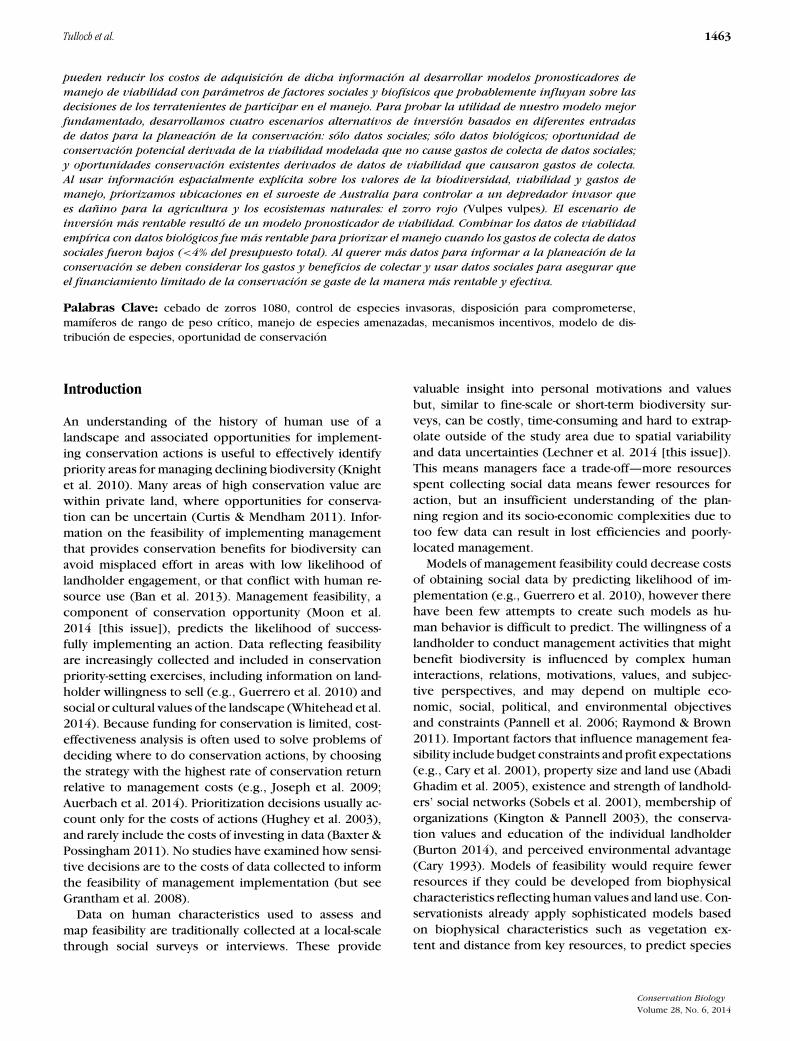
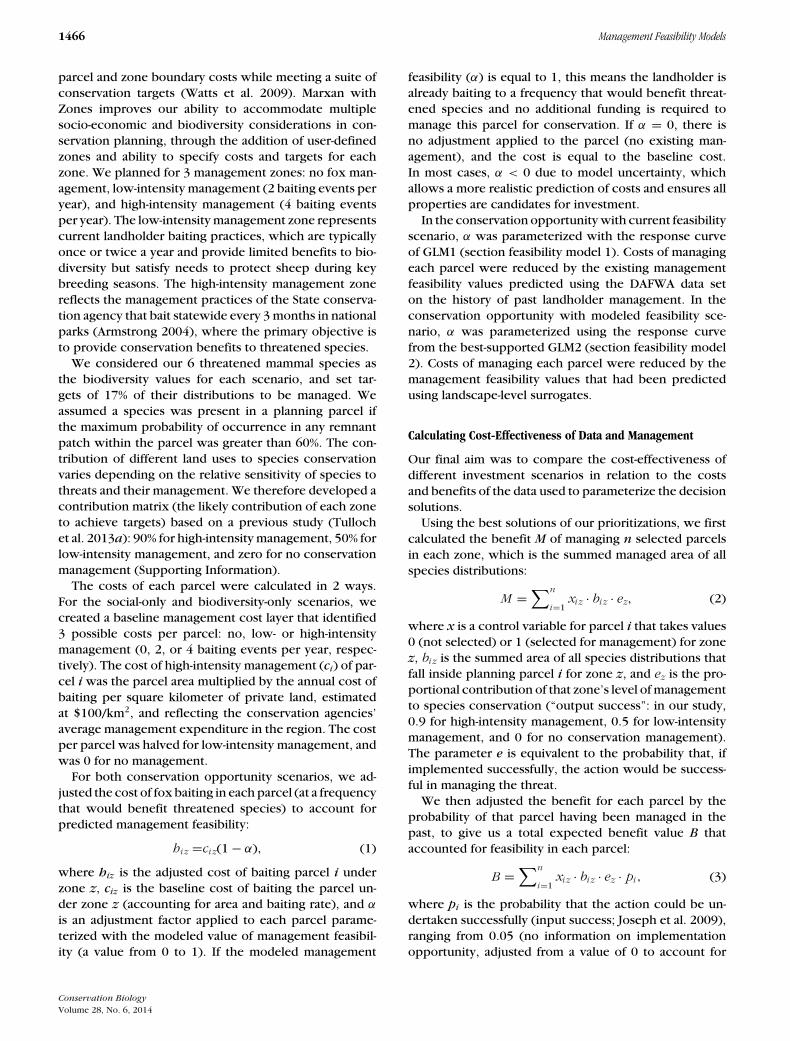
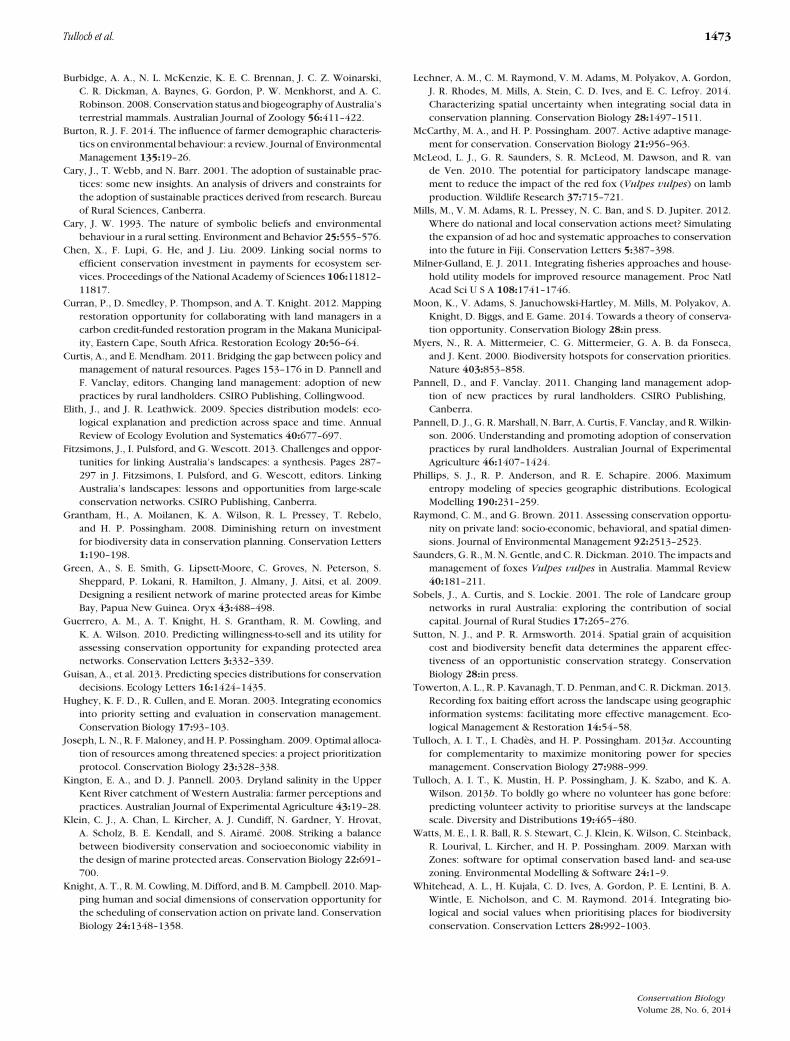
Spatial distribution of historical data on landholder en-gagement predicted future distributions of effort (GLM1,Fig. 1). The distribution of the number of baiting eventsper property parcel during 2007–2010 (response vari-able) was positively associated with the number of baitingevents recorded during the previous period of 2003–2006 (explanatory variable; deviance explained 34.5%,β = 0.26, SE 0.02; Supporting Information).
The best-supported model predicting management fea-sibility in 2003–2010 from landscape characteristics wasdriven by social-economic and environmental motivationand had an AIC weight of 1, explaining 15.5% of thedeviance (Table 2 & Supporting Information for descrip-tion of explanatory variables). Management feasibility in-creased with a property’s neighbors (β = 0.23, SE 0.15),area (β = 1.69, SE 0.16), and distance from protectedareas (β = 1.09, SE 0.14), and was higher in parcels thathad a bird survey recorded on them (β = 0.51, SE 0.15)(Supporting Information).
Spatial Conservation Priorities
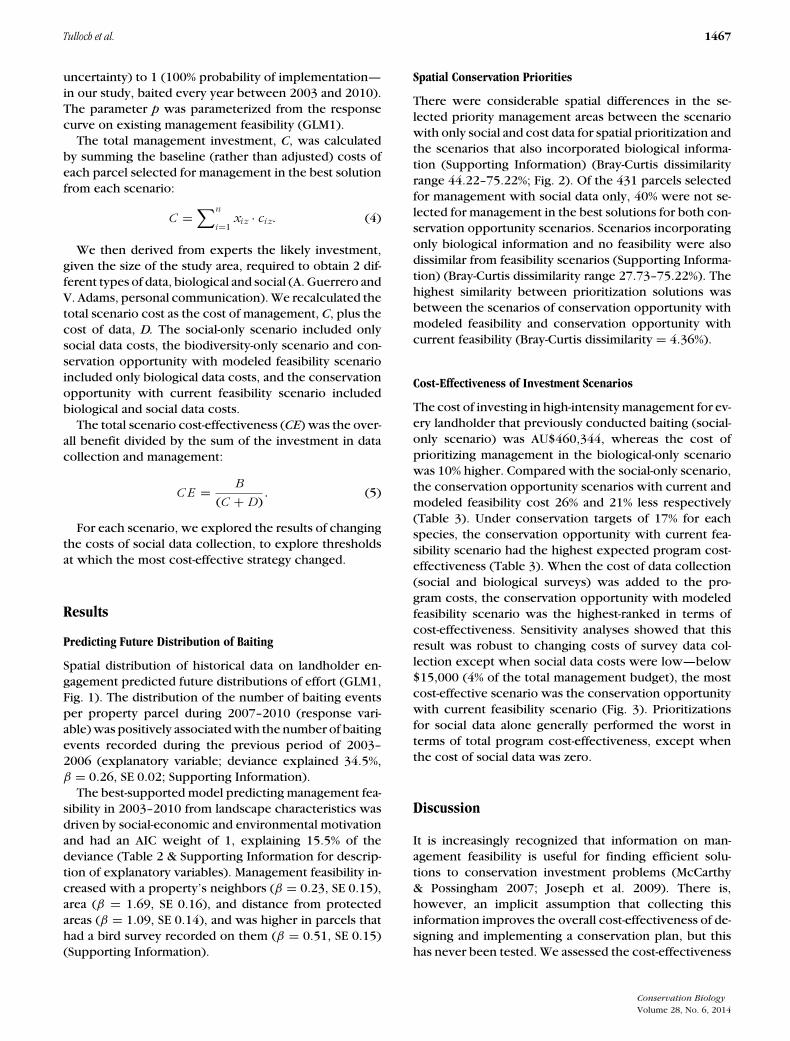
There were considerable spatial differences in the se-lected priority management areas between the scenariowith only social and cost data for spatial prioritization andthe scenarios that also incorporated biological informa-tion (Supporting Information) (Bray-Curtis dissimilarityrange 44.22–75.22%; Fig. 2). Of the 431 parcels selectedfor management with social data only, 40% were not se-lected for management in the best solutions for both con-servation opportunity scenarios. Scenarios incorporatingonly biological information and no feasibility were alsodissimilar from feasibility scenarios (Supporting Informa-tion) (Bray-Curtis dissimilarity range 27.73–75.22%). Thehighest similarity between prioritization solutions wasbetween the scenarios of conservation opportunity withmodeled feasibility and conservation opportunity withcurrent feasibility (Bray-Curtis dissimilarity = 4.36%).
Cost-Effectiveness of Investment Scenarios
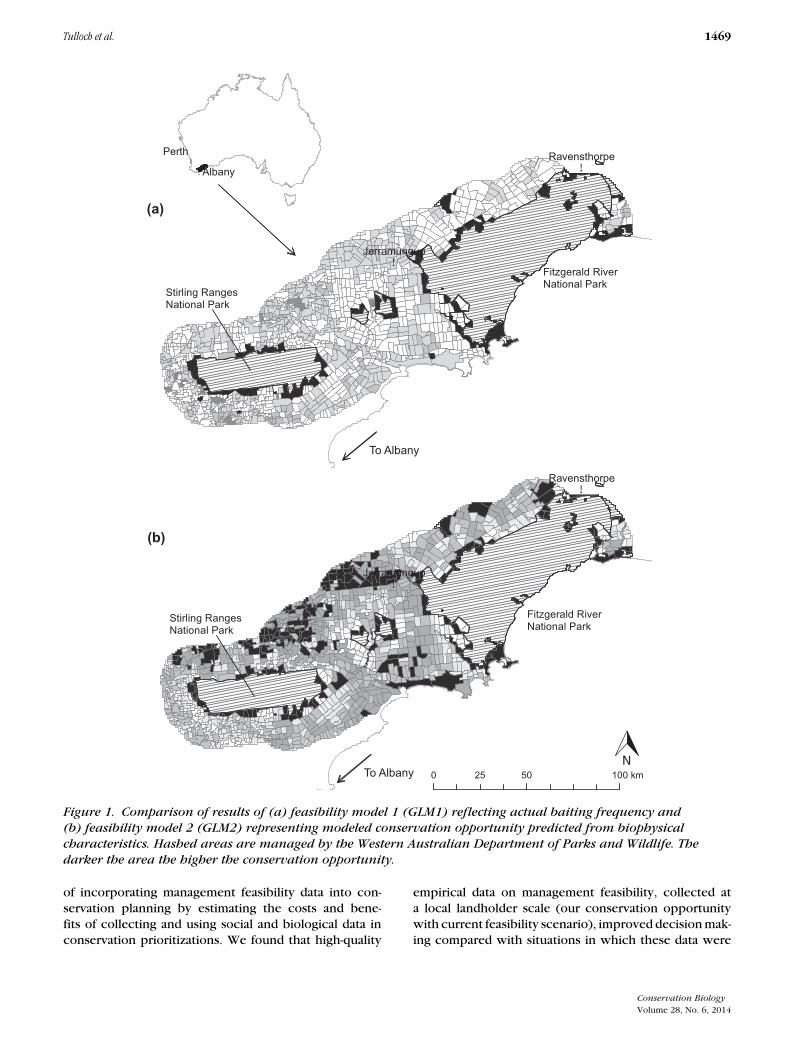
The cost of investing in high-intensity management for ev-ery landholder that previously conducted baiting (social-only scenario) was AU$460,344, whereas the cost ofprioritizing management in the biological-only scenariowas 10% higher. Compared with the social-only scenario,the conservation opportunity scenarios with current andmodeled feasibility cost 26% and 21% less respectively(Table 3). Under conservation targets of 17% for eachspecies, the conservation opportunity with current fea-sibility scenario had the highest expected program cost-effectiveness (Table 3). When the cost of data collection(social and biological surveys) was added to the pro-gram costs, the conservation opportunity with modeledfeasibility scenario was the highest-ranked in terms ofcost-effectiveness. Sensitivity analyses showed that thisresult was robust to changing costs of survey data col-lection except when social data costs were low—below$15,000 (4% of the total management budget), the mostcost-effective scenario was the conservation opportunitywith current feasibility scenario (Fig. 3). Prioritizationsfor social data alone generally performed the worst interms of total program cost-effectiveness, except whenthe cost of social data was zero.
Discussion
It is increasingly recognized that information on man-agement feasibility is useful for finding efficient solu-tions to conservation investment problems (McCarthy& Possingham 2007; Joseph et al. 2009). There is,however, an implicit assumption that collecting thisinformation improves the overall cost-effectiveness of de-signing and implementing a conservation plan, but thishas never been tested. We assessed the cost-effectiveness
Conservation BiologyVolume 28, No. 6, 2014

1468 Management Feasibility Models
Table 2. Multimodel inference table for the multivariate analysis of probability of fox baiting in 1337 land parcels of southwest Australia (GLM2).
Model Rank Ka Deviance explained (%) AICcb �AICcc Wd
Socioeconomic environmental 1 5 15.46 1271.86 0 1Economic environment 2 (production + biodiversity restoration) 2 5 14.55 1285.44 13.58 0Economic environment 1 (production + biodiversity protection) 3 5 14.42 1287.32 15.46 0Social economic (production + neighbors) 4 4 10.72 1340.68 68.82 0Production + bait store access 5 4 10.62 1342.13 70.27 0High-value production benefits 6 3 10.48 1342.19 70.33 0All production benefits 7 3 10.34 1344.21 72.35 0Social environmental 8 4 7.03 1395.72 123.87 0Global environmental 9 5 5.55 1419.75 147.9 0Conservation concern 10 3 5.13 1422.05 150.2 0Biodiversity restoration 11 3 4.88 1425.72 153.87 0Global social effects 12 3 2.74 1457.67 185.82 0Neighbor effects 13 2 1.62 1472.38 200.53 0Social group effects 14 2 1.07 1480.73 208.87 0Biodiversity interest 15 3 0.69 1488.29 216.43 0Regional incentives 16 4 0.69 1490.36 218.50 0Local incentives 17 4 0.50 1493.1 221.24 0Null model 18 1 0 1494.61 222.75 0
aNumber of model parameters.bCorrected AIC.cDifference in AIC between model and best-supported model (rank 1).dModel weight (further details in Supporting Information).
Table 3. Differences between costs and benefits of data types for conservation planning and the resulting cost-effectiveness of the conservationprioritization strategies when data costs are incorporated (most cost-effective scenario highlighted).
Quality of data or Benefit of Benefit of Expected benefits Investment Investment in ExpectedInput data model for predicting zone 1 zone 2 adjusted for in data management program cost-type conservation (Eq. (2)a) (Eq. (2)a) feasibility ($AU) ($AU) effectiveness
opportunity (Eq. (3)a) (Eq. (4)a) (Eq. (5)a)Mb Mb Bc Dd Ce CE = B/(C+D)
Social data only:high intensitymanagement
high 2027 0 408 50,000f 460,344 0.080
Social data only:low intensitymanagement
high 0 1126 226 50,000f 230,172 0.081
Biodiversity only NA 3773 987 488 3,000g 499,944 0.097Conservation
opportunitywith currentfeasibility
high 3609 602 451 53,000f,g 369,030 0.106
Conservationopportunitywith modeledfeasibility
low 3757 642 468 3,000g 397,428 0.117
aSee text for equations.bM is the benefit of managing selected parcels in each zone, equal to the summed managed area of all species distributions.cB is the total expected benefit of managing selected parcels in each zone, accounting for feasibility in each parcel.dD is the cost of acquiring data, see Supporting Information.eC is the total management investment in the best solution from each scenario, calculated by summing the baseline costs of each parcel selectedfor management.fSocial data costs based on expert elicitation of survey costs averaged across different types of surveys (face to face, online, and mail).gBiodiversity costs based on standard cost of acquiring atlas data for threatened species from state government and nongovernmental organi-zations (all conservation opportunity model data freely available).
Conservation BiologyVolume 28, No. 6, 2014
Tulloch et al. 1469
!
!
Jerramungup
Ravensthorpe
!
!
Jerramungup
Ravensthorpe
!
!
Albany
Perth
0 50 100 mk52
To Albany
To Albany
(a)
(b)
Fitzgerald RiverNational Park
Stirling RangesNational Park
Stirling RangesNational Park
Fitzgerald RiverNational Park
Figure 1. Comparison of results of (a) feasibility model 1 (GLM1) reflecting actual baiting frequency and(b) feasibility model 2 (GLM2) representing modeled conservation opportunity predicted from biophysicalcharacteristics. Hashed areas are managed by the Western Australian Department of Parks and Wildlife. Thedarker the area the higher the conservation opportunity.
of incorporating management feasibility data into con-servation planning by estimating the costs and bene-fits of collecting and using social and biological data inconservation prioritizations. We found that high-quality
empirical data on management feasibility, collected ata local landholder scale (our conservation opportunitywith current feasibility scenario), improved decision mak-ing compared with situations in which these data were
Conservation BiologyVolume 28, No. 6, 2014

1470 Management Feasibility Models
(a)
(b)
(c)
(d)
0 50 10025 km
Figure 2. Comparison of results of prioritization of spending on fox baiting informed by (a) social data only,(b) biodiversity data only, (c) conservation opportunity with modeled feasibility, and (d) conservationopportunity with existing feasibility (darker colors are high focus baiting, lighter are low focus). The nationalparks (see Figure 1) were not included in prioritization.
Conservation BiologyVolume 28, No. 6, 2014

Tulloch et al. 1471
0
0.02
0.04
0.06
0.08
0.1
0.12
0.14
0 20000 40000 60000 80000 100000
Scen
ario
cos
t-eff
ec�v
enes
s
Cost of social data ($AU)
Social data only - High intensity Social data only - Low intensityBiodiversity only Conserva�on opportunity with current feasibilityConserva�on opportunity with modeled feasibility $15,000 social data budget
Figure 3. Expected programcost-effectiveness for each of our4 scenarios and different levels ofinvestment in social data. Belowthe $15,000 social data budget(vertical dashed line), modeleddata predicting feasibility is lesscost-effective than the use ofempirical data reflecting truefeasibility.
not used (Table 3). However, incorporating these datacomes at a cost. Incorporating conservation opportu-nity through modeled feasibility provided the biggestimprovement to conservation outcomes for the smallestcost when feasibility data costs made up more than 4%of the combined management and data acquisition costs(in this study, above AU$15,000; Fig. 3).
In this study, we took the perspective of a typical con-servation agency working in a multiple-use landscape,and considered different scenarios of possible investmentto explore the value of using social data to identify con-servation investment priorities. Our social-data only sce-nario is typical of many real-life situations, where localconservation agencies distributing limited funds targetstakeholders that are more likely to participate in a par-ticular program in order to minimize costs and risk (Greenet al. 2009; Sutton & Armsworth 2014 [this issue]). Thepoor performance of the social-data only scenario is notsurprising, because indiscriminately allocating funds toall landholders with existing baiting plans selects themost secure projects with the lowest risk of failure, butfails to consider where conservation benefits could bemore efficiently delivered across the landscape (Ando &Mallory 2012).
For our case study, we considered baiting for the inva-sive red fox because there were available data on existinglandholder engagement (see also Towerton et al. 2013for similar existing datasets) that allowed us to validateour feasibility models. Our hypotheses were driven by acombination of local knowledge about the likely motiva-tions for landholder engagement and previous findingsfrom the social and conservation literature (SupportingInformation). The models we developed in this studyidentify the key predictors of landholder participation,and were easy and cheap to construct due to the re-liance on freely-available landscape data. Our modeling
approach could be used to guide investment in a rangeof other management actions with socio-economic uncer-tainty, such as ecological restoration, carbon plantings,fencing off remnants or creating covenants (Chen et al.2009; Curran et al. 2012), but some contexts will notlend themselves to the same approach. In areas wheremodels cannot be developed, or where a diversity of so-cial values and issues lead to poor predictive capacity, anadaptive approach might be required in which a combi-nation of models, stakeholder engagement, participatoryGIS, expert-elicited Bayesian networks or anthropologi-cal research are used to build maps of the feasibility ofachieving biodiversity or cultural or economic objectives,and validated through strategic social surveys.
There are a number of additional challenges to usingdata on feasibility to prioritize allocation of funding forconservation in multiple-use landscapes. Social data arecontext- and time-specific, with people’s willingness toact motivated by many extrinsic and intrinsic factors thatchange over time (Pannell & Vanclay 2011). Our conser-vation opportunity scenarios incorporated informationon historical landscape management, predicting futurelandholder participation in biodiversity management byassuming that the incentives for existing managementpractices would remain in place. We assumed that en-gaging property owners with a high feasibility of futurebaiting would be less costly than engaging property own-ers with no baiting history. However, data on willingnessto participate in an action do not always predict actualparticipation. Likewise, lack of action in the past does notrule out future participation. We set low feasibility valuesfor properties (5% likelihood of success) that were notengaged in baiting, a pessimistic approach, but futurestudies could explore thresholds of uncertainty in thisvalue. Our static models are most useful for short-termplanning in landscapes where stakeholders are driven by
Conservation BiologyVolume 28, No. 6, 2014

1472 Management Feasibility Models
common goals—in places with high property turnover,multiple objectives and changing land-use patterns in re-sponse to markets, many assumptions about landholderbehavior may not be safely predicted over medium tolong terms, and dynamic planning is required. Our mod-els and predictors were limited by data availability—someaspects of feasibility cannot be mapped as easily. For foxbaiting, this might include personal values such as ethicalconsiderations, economic influences unique to the familybusiness such as level of off-property income, historicalconstraints such trust in organizations delivering incen-tives, or market drivers. More complex broad-scale ap-proaches such as household utility modeling account formarket drivers (Milner-Gulland 2011), but always taking abroad-scale approach has the danger of simplifying issues.
Our paper focuses on social research techniques thatemphasize data collation rather than the process of com-munity engagement. Engagement processes including fo-cus groups and workshops can have additional benefitsfor conservation planning (building trust, supporting so-cial learning about complex planning issues, clarifyingpreviously hidden assumptions, and encourage partici-pation in conservation programs), which were not di-rectly assessed here. Holistic assessments of the way inwhich social research is conducted are important priorto making decisions on whether to include or discountsocial data from conservation assessments. For example,for planning situations in which there are few existingsocial data and hypotheses for landholder motivationsare difficult to derive, prior to building a model an induc-tive qualitative approach that can identify opportunitiesand constraints for engagement may initially be morecost effective than a wide scale survey. Qualitative dataabout the socio-ecological context to fox managementcould help understand variability across the landscapein what motivates land managers to participate (or not)in fox baiting programs, particularly in areas next to na-tional parks where there are boundary interface issuesto contend with (such as other invasive species, historyof government agency involvement in conservation ac-tions, or fire management). We encourage future studiesto widen the framing of the cost and benefits of includingsocial data by, for example, considering different typesof socio-economic data (both qualitative and quantitative)and different ways in which social research is conducted.
Our results support previous studies suggesting thatassessing conservation opportunity improves the cost-effectiveness and efficiency of conservation decisions,due to the ability to prioritize areas for management withhigher feasibility (Whitehead et al. 2014). However, us-ing quantitative surveys we show that it is not alwayscost-effective to collect social data. If the costs of col-lecting social data are high and incorporated into thetotal program budget, using social data can lead to lowercost-effectiveness of the decision. If low-cost social datacan be obtained, they enable targeting of management to
cheaper areas with a history of engagement, whilst ensur-ing that biodiversity targets are met, which avoids missedopportunities and minimizes costs of conservationdecisions. Our study has implications for conservation-ists and policy makers planning private land conserva-tion incentives, as we demonstrate a way to minimizeimplementation gaps across the landscape.
Acknowledgments
We thank C. Raymond, H. P. Possingham, K. A. Wilson,and I. Chades for discussions. We thank the Western Aus-tralian Department of Agriculture and Food and Depart-ment of Parks and Wildlife, Gondwana Link, A. GuererroGonzalez, V. Adams, and Red Card for Rabbits and Foxesfor sharing data and valuable insights.
Supporting Information
Details on the study region landscape and socio-economiccharacteristics (Appendix 1); species distribution model-ing methods (Appendix 2); feasibility modeling methodsand results (Appendix 3); additional information on theconservation planning method for which Marxan withZones were used (Appendix 4); and additional analysesof prioritization results are available online (Appendix5).The authors are solely responsible for the content andfunctionality of these materials. Queries (other than ab-sence of the material) should be directed to the corre-sponding author.
Literature Cited
Abadi Ghadim, A. K., D. J. Pannell, and M. P. Burton. 2005. Risk, uncer-tainty, and learning in adoption of a crop innovation. AgriculturalEconomics 33:1–9.
Ando, A. W., and M. L. Mallory. 2012. Optimal portfolio design to re-duce climate-related conservation uncertainty in the Prairie PotholeRegion. Proceedings of the National Academy of Sciences of theUnited States of America 109:6484–6489.
Armstrong, R. 2004. Baiting operations: Western Shield review – Febru-ary 2003. Conservation Science Western Australia 5:31–50.
Auerbach, N. A., A. I. T. Tulloch, and H. P. Possingham. 2014. In-formed actions: where to cost effectively manage multiple threats tospecies to maximize return on investment. Ecological Applications24:1357–1373.
Ball, I. R., and H. P. Possingham. 2000. Marxan (v. 1.8.6): marinereserve design using spatially explicit annealing. Available fromhttp://www.uq.edu.au/marxan (accessed September 10, 2014).
Ban, N. C., M. Mills, J. Tam, C. C. Hicks, S. Klain, N. Stoeckl, M. C.Bottrill, J. Levine, R. L. Pressey, T. Satterfield, et al. 2013. A social–ecological approach to conservation planning: embedding socialconsiderations. Frontiers in Ecology and the Environment 11:194–202.
Baxter, P. W. J., and H. P. Possingham. 2011. Optimizing search strate-gies for invasive pests: learn before you leap. Journal of AppliedEcology 48:86–95.
Conservation BiologyVolume 28, No. 6, 2014
Tulloch et al. 1473
Burbidge, A. A., N. L. McKenzie, K. E. C. Brennan, J. C. Z. Woinarski,C. R. Dickman, A. Baynes, G. Gordon, P. W. Menkhorst, and A. C.Robinson. 2008. Conservation status and biogeography of Australia’sterrestrial mammals. Australian Journal of Zoology 56:411–422.
Burton, R. J. F. 2014. The influence of farmer demographic characteris-tics on environmental behaviour: a review. Journal of EnvironmentalManagement 135:19–26.
Cary, J., T. Webb, and N. Barr. 2001. The adoption of sustainable prac-tices: some new insights. An analysis of drivers and constraints forthe adoption of sustainable practices derived from research. Bureauof Rural Sciences, Canberra.
Cary, J. W. 1993. The nature of symbolic beliefs and environmentalbehaviour in a rural setting. Environment and Behavior 25:555–576.
Chen, X., F. Lupi, G. He, and J. Liu. 2009. Linking social norms toefficient conservation investment in payments for ecosystem ser-vices. Proceedings of the National Academy of Sciences 106:11812–11817.
Curran, P., D. Smedley, P. Thompson, and A. T. Knight. 2012. Mappingrestoration opportunity for collaborating with land managers in acarbon credit-funded restoration program in the Makana Municipal-ity, Eastern Cape, South Africa. Restoration Ecology 20:56–64.
Curtis, A., and E. Mendham. 2011. Bridging the gap between policy andmanagement of natural resources. Pages 153–176 in D. Pannell andF. Vanclay, editors. Changing land management: adoption of newpractices by rural landholders. CSIRO Publishing, Collingwood.
Elith, J., and J. R. Leathwick. 2009. Species distribution models: eco-logical explanation and prediction across space and time. AnnualReview of Ecology Evolution and Systematics 40:677–697.
Fitzsimons, J., I. Pulsford, and G. Wescott. 2013. Challenges and oppor-tunities for linking Australia’s landscapes: a synthesis. Pages 287–297 in J. Fitzsimons, I. Pulsford, and G. Wescott, editors. LinkingAustralia’s landscapes: lessons and opportunities from large-scaleconservation networks. CSIRO Publishing, Canberra.
Grantham, H., A. Moilanen, K. A. Wilson, R. L. Pressey, T. Rebelo,and H. P. Possingham. 2008. Diminishing return on investmentfor biodiversity data in conservation planning. Conservation Letters1:190–198.
Green, A., S. E. Smith, G. Lipsett-Moore, C. Groves, N. Peterson, S.Sheppard, P. Lokani, R. Hamilton, J. Almany, J. Aitsi, et al. 2009.Designing a resilient network of marine protected areas for KimbeBay, Papua New Guinea. Oryx 43:488–498.
Guerrero, A. M., A. T. Knight, H. S. Grantham, R. M. Cowling, andK. A. Wilson. 2010. Predicting willingness-to-sell and its utility forassessing conservation opportunity for expanding protected areanetworks. Conservation Letters 3:332–339.
Guisan, A., et al. 2013. Predicting species distributions for conservationdecisions. Ecology Letters 16:1424–1435.
Hughey, K. F. D., R. Cullen, and E. Moran. 2003. Integrating economicsinto priority setting and evaluation in conservation management.Conservation Biology 17:93–103.
Joseph, L. N., R. F. Maloney, and H. P. Possingham. 2009. Optimal alloca-tion of resources among threatened species: a project prioritizationprotocol. Conservation Biology 23:328–338.
Kington, E. A., and D. J. Pannell. 2003. Dryland salinity in the UpperKent River catchment of Western Australia: farmer perceptions andpractices. Australian Journal of Experimental Agriculture 43:19–28.
Klein, C. J., A. Chan, L. Kircher, A. J. Cundiff, N. Gardner, Y. Hrovat,A. Scholz, B. E. Kendall, and S. Airame. 2008. Striking a balancebetween biodiversity conservation and socioeconomic viability inthe design of marine protected areas. Conservation Biology 22:691–700.
Knight, A. T., R. M. Cowling, M. Difford, and B. M. Campbell. 2010. Map-ping human and social dimensions of conservation opportunity forthe scheduling of conservation action on private land. ConservationBiology 24:1348–1358.
Lechner, A. M., C. M. Raymond, V. M. Adams, M. Polyakov, A. Gordon,J. R. Rhodes, M. Mills, A. Stein, C. D. Ives, and E. C. Lefroy. 2014.Characterizing spatial uncertainty when integrating social data inconservation planning. Conservation Biology 28:1497–1511.
McCarthy, M. A., and H. P. Possingham. 2007. Active adaptive manage-ment for conservation. Conservation Biology 21:956–963.
McLeod, L. J., G. R. Saunders, S. R. McLeod, M. Dawson, and R. vande Ven. 2010. The potential for participatory landscape manage-ment to reduce the impact of the red fox (Vulpes vulpes) on lambproduction. Wildlife Research 37:715–721.
Mills, M., V. M. Adams, R. L. Pressey, N. C. Ban, and S. D. Jupiter. 2012.Where do national and local conservation actions meet? Simulatingthe expansion of ad hoc and systematic approaches to conservationinto the future in Fiji. Conservation Letters 5:387–398.
Milner-Gulland, E. J. 2011. Integrating fisheries approaches and house-hold utility models for improved resource management. Proc NatlAcad Sci U S A 108:1741–1746.
Moon, K., V. Adams, S. Januchowski-Hartley, M. Mills, M. Polyakov, A.Knight, D. Biggs, and E. Game. 2014. Towards a theory of conserva-tion opportunity. Conservation Biology 28:in press.
Myers, N., R. A. Mittermeier, C. G. Mittermeier, G. A. B. da Fonseca,and J. Kent. 2000. Biodiversity hotspots for conservation priorities.Nature 403:853–858.
Pannell, D., and F. Vanclay. 2011. Changing land management adop-tion of new practices by rural landholders. CSIRO Publishing,Canberra.
Pannell, D. J., G. R. Marshall, N. Barr, A. Curtis, F. Vanclay, and R. Wilkin-son. 2006. Understanding and promoting adoption of conservationpractices by rural landholders. Australian Journal of ExperimentalAgriculture 46:1407–1424.
Phillips, S. J., R. P. Anderson, and R. E. Schapire. 2006. Maximumentropy modeling of species geographic distributions. EcologicalModelling 190:231–259.
Raymond, C. M., and G. Brown. 2011. Assessing conservation opportu-nity on private land: socio-economic, behavioral, and spatial dimen-sions. Journal of Environmental Management 92:2513–2523.
Saunders, G. R., M. N. Gentle, and C. R. Dickman. 2010. The impacts andmanagement of foxes Vulpes vulpes in Australia. Mammal Review40:181–211.
Sobels, J., A. Curtis, and S. Lockie. 2001. The role of Landcare groupnetworks in rural Australia: exploring the contribution of socialcapital. Journal of Rural Studies 17:265–276.
Sutton, N. J., and P. R. Armsworth. 2014. Spatial grain of acquisitioncost and biodiversity benefit data determines the apparent effec-tiveness of an opportunistic conservation strategy. ConservationBiology 28:in press.
Towerton, A. L., R. P. Kavanagh, T. D. Penman, and C. R. Dickman. 2013.Recording fox baiting effort across the landscape using geographicinformation systems: facilitating more effective management. Eco-logical Management & Restoration 14:54–58.
Tulloch, A. I. T., I. Chades, and H. P. Possingham. 2013a. Accountingfor complementarity to maximize monitoring power for speciesmanagement. Conservation Biology 27:988–999.
Tulloch, A. I. T., K. Mustin, H. P. Possingham, J. K. Szabo, and K. A.Wilson. 2013b. To boldly go where no volunteer has gone before:predicting volunteer activity to prioritise surveys at the landscapescale. Diversity and Distributions 19:465–480.
Watts, M. E., I. R. Ball, R. S. Stewart, C. J. Klein, K. Wilson, C. Steinback,R. Lourival, L. Kircher, and H. P. Possingham. 2009. Marxan withZones: software for optimal conservation based land- and sea-usezoning. Environmental Modelling & Software 24:1–9.
Whitehead, A. L., H. Kujala, C. D. Ives, A. Gordon, P. E. Lentini, B. A.Wintle, E. Nicholson, and C. M. Raymond. 2014. Integrating bio-logical and social values when prioritising places for biodiversityconservation. Conservation Letters 28:992–1003.
Conservation BiologyVolume 28, No. 6, 2014