The value of site-specific information and the environment: Technology adoption and pesticide use...
10
The value of site-specific information and the environment: Technology adoption and pesticide use under uncertainty Murat Isik a, * , Darren Hudson b , Keith H. Coble b a Department of Agricultural Economics and Rural Sociology, University of Idaho, 28B Ag Science Building, Moscow ID 83844, USA b Department of Agricultural Economics, Mississippi State University, Mississippi, MS, USA Received 1 March 2004; accepted 11 January 2005 Abstract Remote sensing technology offers an opportunity to significantly increase the amount of site-specific information about field characteristics such as pest populations. Coupled with variable rate application technologies, this added information has the potential to provide environmental benefits through reduced pesticide applications. However, producers face a complicated adoption decision because output prices and crop yields are uncertain. A model is developed to examine the potential value of remote sensing information to pesticide applications in an option-value framework under uncertainty. Simulations suggest that remote sensing information could decrease pesticide use, but uncertainty and irreversibility are likely to limit technological adoption by farmers. Potential cost-share subsidies are discussed. q 2005 Elsevier Ltd. All rights reserved. Keywords: Environmental policy; Green payments; Option value; Uncertainty; Pesticide regulation; Remote sensing 1. Introduction Agricultural nonpoint source pollution is the leading source of water quality impacts to rivers and lakes, and a major contributor to groundwater contamination and wet- lands degradation (US Environmental Protection Agency (EPA) and US Department of Agriculture (USDA), 1990). Increasing public concerns about water quality and food safety are drawing attention towards alternative strategies and policies to reduce agricultural runoff of nutrients and pesticides. Pesticide regulations such as banning the pesticide use or regulating the timing of pesticide applications are a possible means of reducing pesticide use, but this approach often forces a trade-off between pesticide reductions and farm profitability (Lichtenberg et al., 1993). Information technology developments may offer a means of reducing pesticide use in a manner that minimizes adverse effects or even enhances farm profitability. Recent technological advances in remote sensing and variable rate technologies (RSVT) make it possible for farmers to obtain detailed site-specific information about soil characteristics and pest population to predict problems with fertilizers, water, and pests within a field, and apply fertilizers and pesticides at a varying rate within the field. Variable rate technologies have the potential to improve yields, reduce fertilizer costs and reduce residuals of the applied inputs in the soil (Isik and Khanna, 2003; Isik et al., 2001). These technologies have been referred to as complementary technologies because they have the potential to provide both economic and environmental benefits. However, recent surveys show that adoption rates of these technologies are low. For example, only 15% of the surveyed farmers in Mississippi in 2000 adopted variable rate technologies for pesticides and for fertilizers (Hudson and Hite, 2003). RSVT may improve pesticide application efficiency by disaggregating economic threshold decisions of pesticide use into site-specific levels. 1 The concept of economic Journal of Environmental Management 76 (2005) 245–254 www.elsevier.com/locate/jenvman 0301-4797/$ - see front matter q 2005 Elsevier Ltd. All rights reserved. doi:10.1016/j.jenvman.2005.01.024 * Corresponding author. Address: Department of Agricultural Economics and Rural Sociology, University of Idaho, 28B Ag Science Building, Moscow ID 83844, USA. Tel.: C1 208 885 7214. E-mail address: [email protected] (M. Isik). 1 Economic threshold level of pest population is the level at which the pesticide application should be considered in order to prevent economic loss (Headley, 1972).
Transcript of The value of site-specific information and the environment: Technology adoption and pesticide use...

The value of site-specific information and the environment:
Technology adoption and pesticide use under uncertainty
Murat Isika,*, Darren Hudsonb, Keith H. Cobleb
aDepartment of Agricultural Economics and Rural Sociology, University of Idaho, 28B Ag Science Building, Moscow ID 83844, USAbDepartment of Agricultural Economics, Mississippi State University, Mississippi, MS, USA
Received 1 March 2004; accepted 11 January 2005
Abstract
Remote sensing technology offers an opportunity to significantly increase the amount of site-specific information about field
characteristics such as pest populations. Coupled with variable rate application technologies, this added information has the potential to
provide environmental benefits through reduced pesticide applications. However, producers face a complicated adoption decision because
output prices and crop yields are uncertain. A model is developed to examine the potential value of remote sensing information to pesticide
applications in an option-value framework under uncertainty. Simulations suggest that remote sensing information could decrease pesticide
use, but uncertainty and irreversibility are likely to limit technological adoption by farmers. Potential cost-share subsidies are discussed.
q 2005 Elsevier Ltd. All rights reserved.
Keywords: Environmental policy; Green payments; Option value; Uncertainty; Pesticide regulation; Remote sensing
1. Introduction
Agricultural nonpoint source pollution is the leading
source of water quality impacts to rivers and lakes, and a
major contributor to groundwater contamination and wet-
lands degradation (US Environmental Protection Agency
(EPA) and US Department of Agriculture (USDA), 1990).
Increasing public concerns about water quality and food
safety are drawing attention towards alternative strategies
and policies to reduce agricultural runoff of nutrients and
pesticides. Pesticide regulations such as banning the
pesticide use or regulating the timing of pesticide
applications are a possible means of reducing pesticide
use, but this approach often forces a trade-off between
pesticide reductions and farm profitability (Lichtenberg
et al., 1993). Information technology developments may
offer a means of reducing pesticide use in a manner that
0301-4797/$ - see front matter q 2005 Elsevier Ltd. All rights reserved.
doi:10.1016/j.jenvman.2005.01.024
* Corresponding author. Address: Department of Agricultural Economics
and Rural Sociology, University of Idaho, 28B Ag Science Building,
Moscow ID 83844, USA. Tel.: C1 208 885 7214.
E-mail address: [email protected] (M. Isik).
minimizes adverse effects or even enhances farm
profitability.
Recent technological advances in remote sensing and
variable rate technologies (RSVT) make it possible for
farmers to obtain detailed site-specific information about soil
characteristics and pest population to predict problems with
fertilizers, water, and pests within a field, and apply fertilizers
and pesticides at a varying rate within the field. Variable rate
technologies have the potential to improve yields, reduce
fertilizer costs and reduce residuals of the applied inputs in
the soil (Isik and Khanna, 2003; Isik et al., 2001). These
technologies have been referred to as complementary
technologies because they have the potential to provide
both economic and environmental benefits. However, recent
surveys show that adoption rates of these technologies are
low. For example, only 15% of the surveyed farmers in
Mississippi in 2000 adopted variable rate technologies for
pesticides and for fertilizers (Hudson and Hite, 2003).
RSVT may improve pesticide application efficiency by
disaggregating economic threshold decisions of pesticide
use into site-specific levels.1 The concept of economic
Journal of Environmental Management 76 (2005) 245–254
www.elsevier.com/locate/jenvman
1 Economic threshold level of pest population is the level at which the
pesticide application should be considered in order to prevent economic
loss (Headley, 1972).
M. Isik et al. / Journal of Environmental Management 76 (2005) 245–254246
thresholds for pesticide applications has been developed to
simplify pesticide application decisions by determining the
level of pest population that creates meaningful economic
damage to the crop (Headley, 1972; Lichtenberg et al.,
1993). A primary limitation of the economic threshold
concept is that it is based on the presumption that the pest
population is spatially homogeneous within the field. The
confluence of variable rate technology and remotely sensed
(spatially referenced) data may provide an opportunity to
refine the economic threshold of pesticide applications by
applying the economic threshold to smaller subunits of a
field. This process could lead to improved input efficiency
and reduced pesticide use. However, there has been no study
examining the economic and environmental benefits of
RSVT in pesticide use decisions.
Recent studies of pesticide use have emphasized the
importance of the temporal randomness in pest population
dynamics in determining the economic threshold of
pesticide use within a growing season (Saphores, 2000;
Sunding and Zivin, 2000). However, both spatial and
temporal pest population randomness impact the
economic threshold of pesticide use and the decision to
invest in RSVT by making returns from investment
in RSVT uncertain. The decision to invest in RSVT is
complicated because some components of RSVT
investment require a large sunk cost, which must be made
in the face of the well-known revenue uncertainty of
agricultural production resulting from variability in output
prices and crop yields. Investment in some components of
RSVT involves high sunk costs because RSVT is still
undergoing rapid innovation and improvement. Addition-
ally, farmers have the option to delay the investment
decisions to learn more about market conditions and the
value of RSVT. These observations are consistent with
the studies on investment under uncertainty that emphasize
the importance of uncertainty, irreversibility and flexibility
in investment timing in investment decisions (Dixit and
Pindyck, 1994).
This paper has two objectives. First, it develops an
option-value model to examine the factors that affect
farmers’ decisions to invest in RSVT for variable rate
applications of pesticides under output price and yield
uncertainty due to spatial and temporal randomness in pest
population dynamics. It combines the randomness of
the pest population through time with the randomness of
the pest population density within the field to determine the
economic threshold of pesticide use and analyze the factors
affecting the economic and environmental implications of
RSVT. Second, the paper demonstrates the potential policy
relevance of considering uncertainty and irreversibility by
examining the design of cost-share subsidies to achieve
reductions in pesticide use by accelerating adoption of
RSVT. Investment irreversibility and uncertainty often lead
to delayed investment. If adoption of RSVT leads to positive
external benefits (i.e. reduced pesticide use), delayed
investment in technology means delayed realization of
external benefits, necessitating government intervention
(National Research Council, 1997, p. 71). We examine the
magnitude of cost-share subsidies needed to induce
adoption of RSVT. Previous studies have emphasized the
use of market-based incentives to control pesticide use but
largely have ignored the application of voluntary cost-
sharing arrangements to accomplish this same goal
(Lichtenberg et al., 1993).
This paper contributes to the literature by applying the
economic threshold to smaller subunits of a field and then
combining the economic threshold of pesticide use with the
technology adoption decision using an option-value model.
In addition, previous studies of pesticide use have focused
on the randomness of the pest population in a temporal as
opposed to spatial sense. This paper combines the random-
ness of the pest population through time with the
randomness of the pest population density within the field.
It also shows the extent to which farm size and
heterogeneous field characteristics can mitigate the impacts
of uncertainty and irreversibility on investment decisions.
The paper demonstrates the potential of RSVT to address
reductions in pesticide use as opposed to regulations such as
banning the use of the pesticide in question or controlling
the timing of applications.
2. Theoretical model
We consider a profit-maximizing farmer operating a field
of A acres. Pest population varies within the field and the
spatial distribution of the pest population at time t is
represented by a probability density function, g(qt) with
mean �qt and variance s2t . Since the pest population in this
study represents multiple pests, qt converts all pests to the
‘reference pest’. This technique is also used by Swinton and
King (1994) for the case of weeds control. The pest
population within the field can be reduced with pesticide
applications xt. With the applied pesticide xt, qt(1KDt(xt))
of the pest will survive within the field, where Dt(xt)%1 is
the reduction in the pest level due to the treatments xt at time
t and D0t O0. We assume a constant returns-to-scale crop
response function and represent the yield per acre (y) at any
time (t) as a function of the pest level per acre qt and the
applied pesticide per acre xt. This function is represented by
yt ZZKZgqtð1KDtðxtÞÞ, where Z is the potential maxi-
mum cotton yield and g is a constant representing
percentage yield loss per individual pest.
We model the farmer’s choice between two technologies:
conventional practices and RSVT, denoted by superscripts
C and V, respectively. Output price Pt is assumed to be
changing over time and the farmer has expectations of these
prices in the future. Input price w is assumed to be constant.
The total cost of adoption of RSVT is K, the lifetime of the
RSVT equipment is �T years, and the discount rate is r.
M. Isik et al. / Journal of Environmental Management 76 (2005) 245–254 247
2.1. Value of RSVT
We first derive the value of RSVT and determine
conditions under which the farmer invests in RSVT. The
profit-maximizing adoption decision under the net present
value (NPV) rule requires that the farmer adopt a technology
if the difference in the present value of the quasi-rents
(revenue minus pesticides costs) with and without adoption is
greater than the costs of adoption. This decision involves
forecasting the profit-maximizing stream of expected returns
with conventional practices and with RSVT, and comparing
them to the total costs of adoption.
Under conventional practices, the farmer lacks infor-
mation about the distribution of pest population in the field
but uses a small sample of pest population to estimate the
average pest population, �qt, in the field. This approach to
determining the input application rate of conventional
practices is also referred to as the averaging approach
(Isik and Khanna, 2002). The farmer then assumes that �qt is
the pest level in the entire field (that is, s2t Z0) and chooses
a single pesticide application per acre for the whole field by
maximizing the discounted value of expected quasi-rents,
pC0 , subject to (1) as follows
pC0 Zmax
xt
ð �T
0eKrtAEPq½PtðZ KZg �qtð1KDtðx
Ct ÞÞÞ
KwxCt �dt (1)
where EPq denotes the expectations operator based on the
subjective probability distribution of future prices and pest
population distribution given the information available at
time tZ0 and A is the farm size.2 The economic threshold of
pesticide use can be obtained from the first-order conditions
of (1) to determine the optimal pesticide use in the field. The
profit-maximizing single rate of pesticide use xCt is
determined from the first-order condition, E½PtðZg �qt
D0tðx
Ct ÞÞ�Zw, as: xC
t ZD0tK1ðw=ðEP½PtZg �qt�ÞÞ which takes
into account the population dynamics. Implicit in this first-
order condition is the economic threshold above which the
farmer will apply the pesticide ð �q�t Þ. The economic
threshold ð �q�t Þ is endogenous in the model. The optimization
model determines the minimum pest density that must be
present in a field before it is worthwhile to undertake
pesticide application. Thus, xCt could be zero when �qt is
relatively low, meaning that �q�t O �qt. Note that xC
t O0 when�q�t ! �qt. Thus, our model determines whether any pesticide
should be applied, and then obtains how much pesticides
ðxCt Þ should be applied if �q
�t ! �qt.
Remote sensing technologies provide information about
the distribution of pest population within the field, g(qt),
making it possible for the farmer to apply the pesticide at a
spatially varying rate using variable rate technologies.
2 The dynamics of pest population (qt) and the output price (Pt) are
described in the empirical application.
The input application rate xVt is chosen given the pest level
qt at each point in the field to maximize the discounted
quasi-rents:
pV0 Z max
xt
ð �T
0eKrt
ðN
0AEP½PtðZ KZgqtð1 KDtðx
Vt ÞÞÞ
KwxVt �gðqtÞdq dt: (2)
The pesticides level at any point in the field xVt is
determined for each q at time t from the first-order condition
EP½PtðZgqtD0tðx
Vt ÞÞ�Zw, depending on the pest level at that
point in the field, input price, and output price as:
xVt ZD0
tK1ðw=ðEPq½PtZgqt�ÞÞ. This first-order condition
takes into account the population dynamics. The pesticide
level xVt as well as the threshold level of pest population
above which the farmer will apply the pesticide would vary
continuously across the field as qt varies. Therefore, RSVT
can provide opportunities to extend the concept of economic
thresholds for pesticide applications by determining the
level of pest population that creates meaningful economic
damage to the crop at the sub-field level. The model first
determines the minimum pest level ðq�t Þ that must be present
in a field before it is worthwhile to undertake pesticide
application for each qt. Thus, xVt could be zero for some qt
that is relatively low. In this case, the threshold pest level
would be higher than the existing pest level ðq�t OqtÞ so that
no pesticide application would be made (i.e. xVt Z0). The
first-order condition determines whether any pesticide
should be applied for each qt by obtaining q�t , and then
calculates how much pesticide should be applied for each qt
that is higher than q�t .
The input levels for each technology are obtained from
the first-order conditions of (1) and (2) to find the discounted
quasi-rents, pC�0 and pV�
0 . The present value of the quasi-
rent differential from adopting RSVT at tZ0 is denoted by
V0ðP;w; gðqÞ; �T ;AÞZpV�0 KpC�
0 , which depends on the
distribution of pest population within the field (mean,
variability, and skewness of the distribution), farm size,
lifetime of the RSVT equipment, and economic variables
such as input and output prices. The quasi-rent differential
(value of RSVT), V0, is always nonnegative as long as there
is any variability in the pest population distribution within
the field.3 This result is because input choice with RSVT is
based on more information and fewer constraints on the
application rate as compared to conventional practices. The
value of RSVT increases as the variability in the pest
population distribution increases. However, it may not
always be larger than the total costs of adoption of RSVT.
Under the NPV rule, which ignores uncertainty and
irreversibility, it would be optimal to adopt RSVT at tZ0
if V0OK.
3 If there is no variability in pest population within the field, xCt ZxV
t for
each qt, and therefore pC�0 ZpV�
0 .
4 Manual sampling is another way to acquire information about pest
population. However, it is not only less accurate in obtaining pest
population distribution, but also very expensive compared to remote
sensing technologies.
M. Isik et al. / Journal of Environmental Management 76 (2005) 245–254248
2.2. Investment under uncertainty
We now incorporate uncertainty in the value of RSVT
into the investment decision. The value of RSVT is
stochastic due to uncertainty about output prices and pest
population. In order to keep our analysis tractable, we
assume that the quasi-rent differential evolves as a
geometric Brownian motion
dV Z aV V dt CsV V dz (3)
where aV is the drift parameter; sV is the volatility in the drift
parameter; and dz is the increment of a Wiener process with
mean zero and unit variance. Eq. (3) implies that changes in
the quasi-rent differentials are lognormally distributed.
The farmer’s decision problem is to determine the
optimal time T at which to adopt RSVT. Assuming risk
neutrality, the optimal time T to invest in RSVT is obtained
by maximizing the net returns of RSVT subject to (3)
FðVÞ Z maxT
E½ðVT KKÞeKrT �: (4)
Use of dynamic programming reveals that it is optimal to
invest in RSVT at time T when the critical value of the
quasi-rent differential is (Dixit and Pindyck, 1994):
V�T Z
b
b K1
� �K where
b Z1
2K
aV
s2V
C
ffiffiffiffiffiffiffiffiffiffiffiffiffiffiffiffiffiffiffiffiffiffiffiffiffiffiffiffiffiffiffiffiffiffiffiffiaV
s2V
K1
2
� �2
C2r
s2V
sO1:
(5)
The investment rule under uncertainty requires VT to be
greater than K by a factor of b/(bK1)O1. We refer to this as
the option-value multiple for RSVT. This multiple is a
positive function of the growth rate, aV, and the volatility of
the growth rate in VT, sV, and a negative function of the
discount rate. It varies with the variation in heterogeneous
field characteristics.
A cost-share subsidy may be used to induce adoption for
environmental reasons when it is not otherwise optimal to
invest immediately. Under the NPV rule, the required cost-
share subsidy for immediate investment is the difference
between the present value of quasi-rent differential and the
cost of investment when the latter is greater than the former.
Under the option-value approach, the required subsidy S for
RSVT is: SZMaxf0;KK ððbK1Þ=bÞV0g. The subsidy
required under the option-value approach is always higher
than that under the NPV rule because of the need to
compensate for option values. These subsidy estimates vary
with the heterogeneous farm characteristics such as farm size
and pest population distributions that influence the value of
the option-value multiple. In the following section we
develop an empirical model to examine the value of RSVT
in cotton production.
3. Empirical application
The empirical analysis considers variable rate application
of pesticides to cotton production. Cotton production makes a
good subject of analysis because of its relative intensive use
of pesticides. Remote sensing technologies take multi-
spectral photographs of farm fields to assess variation in
plant growth and growing conditions within the field.4
Several studies have shown that this information can be
useful for spatially variable rate pesticide applications in
cotton (Dupont et al., 2000; Plant et al., 2000; Willers et al.,
1999; Sudbrink et al., 2003). For example, Willers et al.
(1999) have found that insect population is directly related to
the vitality of the plants growing in the field. Insect
population is higher in areas of the field where plant growth
is more vigorous. The photography can be used to identify
portions of the field where plant growth is more vigorous and
use the photographs to predict insect population distribution
within the field. Thus, the remote sensing information is
actually identifying areas of plant vigor, which has been
shown to have a direct, predictable relationship with pest
population.
The farmer obtains information about the pest population
distributions to determine the shed rate distribution within
the field. Square shed is evidence of injury to the cotton
plant from any variety of insects (Mi et al., 1998). Square is
a term used to refer to the early, immature fruit of the cotton
plant. Square shed refers to the premature dropping of fruit
as result of insect damage and other factors such as drought.
In this study we assume that square shed is caused due to
only insect damage. Given that drought is not present, pest
pressure would be the primary factor affecting shed rate, and
it is thus assumed that the pest population in the field is
perfectly positively correlated with the square shed rate of
cotton. Knowing the pest population distribution within the
field makes it possible for farmers to obtain the square shed
rate distribution, which is used to make spatially varying
pesticide applications within the field.
The levels of square shed rate vary between 0 and 100%.
The distribution of the square shed rate on a 1000-acre field is
characterized by alternative Beta distributions. These
1000 acres are first divided into 400 plots with an area of
2.5 acres each. Each 2.5-acre plot is assumed to have
homogenous pest population. Several studies support the
use of the beta distribution in modeling yields, nutrients,
and pest population distributions in the field (Caswell et al.,
1993; Goodwin and Ker, 2002). Alternative square shed rate
(pest population) distributions within the field are simulated
by changing the means and variances of the Beta distri-
butions, using the same random number seed.
Two alternative distributions of square shed rate (negatively
M. Isik et al. / Journal of Environmental Management 76 (2005) 245–254 249
skewed and positively skewed) are considered with
each having two alternative coefficients of variation (CV)
(30 and 60%).5 The mean level of the shed rate is 33.34%
with the positively skewed distribution, and 66.67% with the
negatively skewed distribution. The results from the
experiments of Sudbrink et al. (2003) imply that these
distributions represent the range of possible distributions that
are reasonable to observe in fields.
The value of g in the production function was obtained
from the study of Mi et al., which assumes that one unit
increase in the shed rate above 19% causes the cotton yield to
decrease by 0.97% and there is no yield loss if the shed rate is
less than 19%. This parameter reflects the pest damage
occurring in the Mississippi Delta. For example, during the
past 10 years, estimated annual yield losses attributed to plant
bugs in Mississippi cotton have ranged from 0.2 to 3.6%, with
losses as high as 4.7% being reported for the Mississippi Delta
(Layton, 2004). The yield response function is used in (2) to
determine the threshold level of pest population above which
the farmer will apply the pesticide at each plot within the field.
We generated an aggregate pesticides index consisting of
seven major commonly used insecticides (Temik 15G, Vydate
C-LV, Orthene 90S, Tracer, Bidrin 8L, Karate Z, and
Curacron 8E) in the Delta of Mississippi.6 Total recommended
dosage of this insecticide index is 6.38 pounds/acre and their
costs are $12.04 per acre (Mississippi Agricultural and
Forestry Experiment Station (MAFES), 2000). We postulate
the relationship between the applied pesticide and pesticide
efficacy (usefulness) as: ð1KDitjÞZeK0:361xitj (as in Saphores,
2000). Note that when x is equal to 6.38 pounds (a
recommended rate of pesticide), D is equal to 0.90. It is
assumed that the farmer makes at most four pesticide
applications during a growing season to control the pest
populations within the field, which is common in this region.7
The simulation model also examines the impact of potential
cotton yields (Z) and farm size (A) on adoption decisions. Two
alternative potential cotton yields (low with 500 pounds/acre
and high with 1000 pounds/acre) are considered.
5 The pest population distribution is positively skewed when it has a
longer tail to the right of the mean. On the other hand, it is negatively
skewed when it has a longer tail to the left of the mean. This means that
most parts of the field will have lower (higher) pests than other parts of the
field with the positively (negatively) skewed distribution. If the mean level
of the shed rate is 50%, the pest population has a symmetric distribution.6 It is assumed for simplicity that the aggregate pest population can be
controlled by the aggregate pesticides. In reality, farmers apply different
insecticides for different insects and do not necessarily apply all these
insecticides at the same time. To make empirical application transparent
while focusing on the impacts of RSVT on pesticide use and farm profits, it is
assumed that the pest populations can be controlled by the aggregate pesticides,
rather than, each pest can be controlled by a different insecticide. However, the
model developed here can be easily adapted to examine the impacts of variable
rate application of a single insecticide on the value of RSVT.7 It is important to note that the farmer will make discrete decisions to
apply pesticides. That is, at a given point in time, the farmer will examine
the pest data on the 400 plots and decide if the threshold has been reached,
and, if so, to apply the pesticide.
These potential yields represent relatively low and relatively
high productive fields in the Delta of Mississippi (MAFES,
2000). The per-acre returns of these fields reflect those of the
fields covered in the MAFES (2000) extension budgets. Three
alternative farm sizes, 1000 acres (1 field with 1000 acres),
3000 acres (3 fields with 1000 acres each), and 6000 acres
(6 fields with 1000 acres each), are considered.
The farmer is assumed to purchase a variable rate controller
along with a global positioning receiver, a yield monitor and a
computer to perform spatially variable rate pesticide appli-
cations. The per-acre annual cost of remotely sensed data
collection is $4.7 per acre, which includes four flyovers during
a growing season. The variable rate controller along with
global positioning systems, a computer, a yield monitor,
maintenance and repair of equipment, and training in the use of
equipment cost about $17,000. The costs of data collection and
equipment were provided by GPS, Inc., Inverness, Mississippi
for the typical package of RSVT in the Mississippi Delta. It is
assumed that the discount rate is 10% and the lifetime of the
equipment is 5 years. The present value of the total cost (the
annualized per-acre cost) of adopting RSVT for a 1000-, 3000-
, and 6000-acre farm is $36,598 ($7.30), $75,795 ($5.05), and
$134,590 ($4.49), respectively.
The stochastic nature of the quasi-rent differentials in (3)
is assumed to arise from uncertainty in the output prices and
uncertainty in crop yields due to the randomness in pest
population dynamics. We model the output price process as
a geometric Brownian motion represented by the following
discrete approximation (Dixit and Pindyck, 1994)
Pt Z ð1 CfÞPtK1 ClPtK1nt (6)
where f is the expected growth rate; l is the standard
deviation in the growth rate; and nt is a normally distributed
random variable with mean zero and unit variance at year t.
Using the maximum likelihood estimation, the drift
parameter is estimated as fZmC(0.5)l2, where m is the
mean of the series, ln(PtC1/Pt), and l is the standard
deviation of the series (Forsyth, 2000). Using the historical
data on real cotton prices over the period 1920–2000
(USDA, 2002), the values of f and l are found to be
K0.0029 and 0.1904, respectively. This process is used to
forecast output prices for a 25-year period.
The pest population is stochastic due in part to the
influence of random factors such as weather on reproduction
rates. The pest population growth rate is modeled as an
increasing function of the current pest population and time.
The pest population dynamic at year t and growing period j is
assumed to follow a geometric Brownian motion represented
by (as in Saphores, 2000; Sunding and Zivin, 2000)8
qtj Z ð1 CaqÞqtjK1 CqtjK1sqvtj (7)
8 Distribution of the pest population at time t is determined by applying
Ito’s lemma to (7) as: qt wLognormal½q0eaq t; q20e2aq tðes2
qt K1Þ�, where q0 is
the initial pest population, q0eaq t is the mean and q20e2aq tðes2
q t K1Þ is the
variance of the lognormal distribution.

Table 1
Impact of RSVT on quasi-rent differentials
Potential
yielda
Distribution of pest
population
Discounted
average annual
quasi-rent
under conven-
tional ($/acre)
Quasi-rent
differential
over conven-
tional with
RSVT ($/acre)b
Shape CV (%)
M. Isik et al. / Journal of Environmental Management 76 (2005) 245–254250
where aq is the growth rate of pest population; sq is the
standard deviation in the growth rate; and dz is the increment
of a Wiener process. Note that the pest dynamics also depend
on whether pesticides were previously applied. Although
pesticide use is not explicitly written as part of the pest
dynamics in (7), it implicitly impacts pest dynamics through
reduction in a given time period’s pest level if pesticides are
applied. Experimental evidence relating insect growth rates
to environmental conditions suggest that the geometric
Brownian motion is appropriate in modeling stochasticity in
pest population dynamics (Sunding and Zivin, 2000). Hurley
et al. (2004) also find empirical support for a lognormal pest
population, which confirms the geometric Brownian motion
assumption for the pest population. In the simulation model,
every year a different initial pest population distribution (qtj)
is drawn, depending on the pest population level at the end of
the previous year (qtjK1) and the random variable (vtj), then
the pest population dynamics are modeled with Eq. (7) for
that year. The initial pest population level in a year (qtj) would
not be completely random and independent of the previous
year’s pest level (qtjK1) because the extent of the pesticide
applications and the pest level at the end of the year would
influence the following year’s initial pest population level.
Temperature, initial population size, and host plant avail-
ability may be important factors to overwintering of pest
population. Although some of the pest populations, depend-
ing on the winter severity as reflected by low temperatures
and rainfall, would die during winter, the empirical analysis
considers cotton production in the Mississippi Delta where
weather conditions during winter are relatively mild
compared to other parts of the country. Most of the damaging
pests to cotton production overwinter successfully in this
region.9 Although the overwintering effect would not likely
be significant in this region, the stochastic process used here
could take into account this effect.
The simulation model developed in this paper is
consistent with that of Hurley et al. (2001) who model pest
population dynamics as a deterministic logistic growth
function. Our modeling framework extends their model by
introducing the stochasticity in pest population dynamics.
Because adequate time series and inter-seasonal data on the
distribution of pest densities are not available, we use
arbitrary but plausible values for the parameters of (7).
9 In the Mississippi Delta, the tobacco budworm, the tarnished plant bug,
and the boll weevil have historically ranked among the three most
damaging pests to cotton. In recent years the boll weevil has not ranked
among the most damaging pests due to a statewide eradication program.
Wilson et al. (1995) found that the boll weevil overwintering emergence
patterns can be predicted with considerable accuracy, depending on timing
of weevil entry into overwintering habitat, winter severity, and insulating
capacity of the overwintering habitat. Adult weevils commonly enter a state
known as diapause, which allows them to survive the winter in a non-
feeding and often dormant state. The tarnished plant bug overwinters under
bark and leaves and adults become active in the spring (Polk et al., 1995).
The tobacco budworm generally overwinters successfully only in southern
states (Capinera, 2001).
The parameters, aq and sq, are assumed to be 0.05 and 0.2887
per month. These values are consistent with those used by
Saphores (2000) and Sunding and Zivin (2000). We also
perform sensitivity analysis of the impacts of these variables
on investment decisions.
The forecasted prices and the pest population dynamics
are used in the numerical simulations to forecast the
discounted quasi-rent differential VT ðP;w; gðqÞ; �T ;AÞZpV�
T KpC�T , if RSVT is adopted at time TZ1,.,25. A series
of VT is estimated for the 25 years under each of the
alternative assumptions about the pest population distri-
butions and potential cotton yields. For each of these series
we then estimate the parameters of the geometric Brownian
motion given in Eq. (3) (aV and sV) in order to determine the
option values and the critical value of the quasi-rent
differential in Eq. (5).
4. Results
4.1. Implications of adoption of RSVT for quasi-rent
The impacts of alternative distributions of pest population
and the average crop yields on the average per-
acre discounted quasi-rent over the 5-year lifetime of the
equipment with conventional practices are summarized in
Table 1. The quasi-rent of conventional practices increases as
the average potential yields within the field increase because
that increases the final crop yields. An increase in the
variability of the pest population distribution within the field
leads to a decrease in the quasi-rent of conventional
practices. As the variability of the pest population increases,
parts of the field that receive less pesticide than the optimal
amount increase, leading to more yield losses on those parts
of the fields. It is also found that the fields with the positively
skewed distribution have higher quasi-rents than the fields
with the negatively skewed distribution. Because the mean of
Low Positively
skewed
30 226.06 2.95
60 221.05 11.48
Negatively
skewed
30 206.99 2.32
60 205.22 8.39
High Positively
skewed
30 479.50 0.67
60 476.35 7.42
Negatively
skewed
30 450.18 2.83
60 450.15 9.42
a Low potential yield indicates an average potential cotton yield of
500 pounds/acre. High potential yield indicates an average potential cotton
yield of 1000 pounds/acre.b Note that the annualized per-acre cost of adopting RSVT for a 1000-,
3000-, and 6000-acre farm is $7.30, $5.05, and $4.49, respectively.
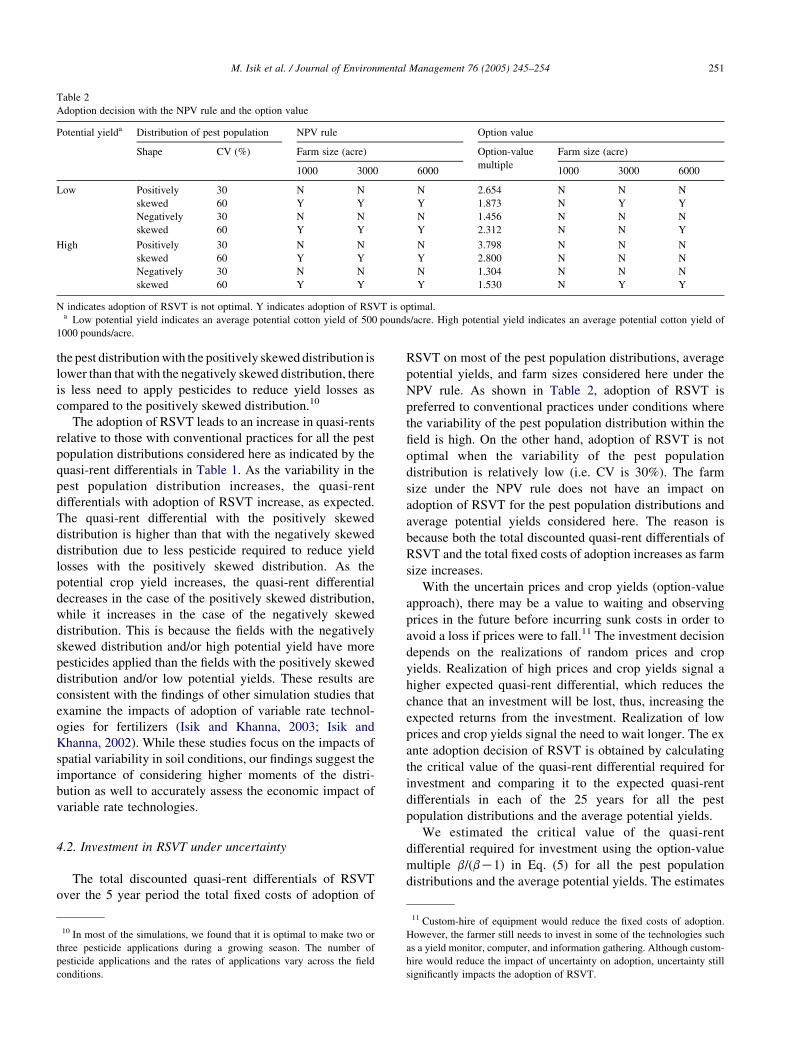
Table 2
Adoption decision with the NPV rule and the option value
Potential yielda Distribution of pest population NPV rule Option value
Shape CV (%) Farm size (acre) Option-value
multiple
Farm size (acre)
1000 3000 6000 1000 3000 6000
Low Positively
skewed
30 N N N 2.654 N N N
60 Y Y Y 1.873 N Y Y
Negatively
skewed
30 N N N 1.456 N N N
60 Y Y Y 2.312 N N Y
High Positively
skewed
30 N N N 3.798 N N N
60 Y Y Y 2.800 N N N
Negatively
skewed
30 N N N 1.304 N N N
60 Y Y Y 1.530 N Y Y
N indicates adoption of RSVT is not optimal. Y indicates adoption of RSVT is optimal.a Low potential yield indicates an average potential cotton yield of 500 pounds/acre. High potential yield indicates an average potential cotton yield of
1000 pounds/acre.
M. Isik et al. / Journal of Environmental Management 76 (2005) 245–254 251
the pest distribution with the positively skewed distribution is
lower than that with the negatively skewed distribution, there
is less need to apply pesticides to reduce yield losses as
compared to the positively skewed distribution.10
The adoption of RSVT leads to an increase in quasi-rents
relative to those with conventional practices for all the pest
population distributions considered here as indicated by the
quasi-rent differentials in Table 1. As the variability in the
pest population distribution increases, the quasi-rent
differentials with adoption of RSVT increase, as expected.
The quasi-rent differential with the positively skewed
distribution is higher than that with the negatively skewed
distribution due to less pesticide required to reduce yield
losses with the positively skewed distribution. As the
potential crop yield increases, the quasi-rent differential
decreases in the case of the positively skewed distribution,
while it increases in the case of the negatively skewed
distribution. This is because the fields with the negatively
skewed distribution and/or high potential yield have more
pesticides applied than the fields with the positively skewed
distribution and/or low potential yields. These results are
consistent with the findings of other simulation studies that
examine the impacts of adoption of variable rate technol-
ogies for fertilizers (Isik and Khanna, 2003; Isik and
Khanna, 2002). While these studies focus on the impacts of
spatial variability in soil conditions, our findings suggest the
importance of considering higher moments of the distri-
bution as well to accurately assess the economic impact of
variable rate technologies.
4.2. Investment in RSVT under uncertainty
The total discounted quasi-rent differentials of RSVT
over the 5 year period the total fixed costs of adoption of
10 In most of the simulations, we found that it is optimal to make two or
three pesticide applications during a growing season. The number of
pesticide applications and the rates of applications vary across the field
conditions.
RSVT on most of the pest population distributions, average
potential yields, and farm sizes considered here under the
NPV rule. As shown in Table 2, adoption of RSVT is
preferred to conventional practices under conditions where
the variability of the pest population distribution within the
field is high. On the other hand, adoption of RSVT is not
optimal when the variability of the pest population
distribution is relatively low (i.e. CV is 30%). The farm
size under the NPV rule does not have an impact on
adoption of RSVT for the pest population distributions and
average potential yields considered here. The reason is
because both the total discounted quasi-rent differentials of
RSVT and the total fixed costs of adoption increases as farm
size increases.
With the uncertain prices and crop yields (option-value
approach), there may be a value to waiting and observing
prices in the future before incurring sunk costs in order to
avoid a loss if prices were to fall.11 The investment decision
depends on the realizations of random prices and crop
yields. Realization of high prices and crop yields signal a
higher expected quasi-rent differential, which reduces the
chance that an investment will be lost, thus, increasing the
expected returns from the investment. Realization of low
prices and crop yields signal the need to wait longer. The ex
ante adoption decision of RSVT is obtained by calculating
the critical value of the quasi-rent differential required for
investment and comparing it to the expected quasi-rent
differentials in each of the 25 years for all the pest
population distributions and the average potential yields.
We estimated the critical value of the quasi-rent
differential required for investment using the option-value
multiple b/(bK1) in Eq. (5) for all the pest population
distributions and the average potential yields. The estimates
11 Custom-hire of equipment would reduce the fixed costs of adoption.
However, the farmer still needs to invest in some of the technologies such
as a yield monitor, computer, and information gathering. Although custom-
hire would reduce the impact of uncertainty on adoption, uncertainty still
significantly impacts the adoption of RSVT.
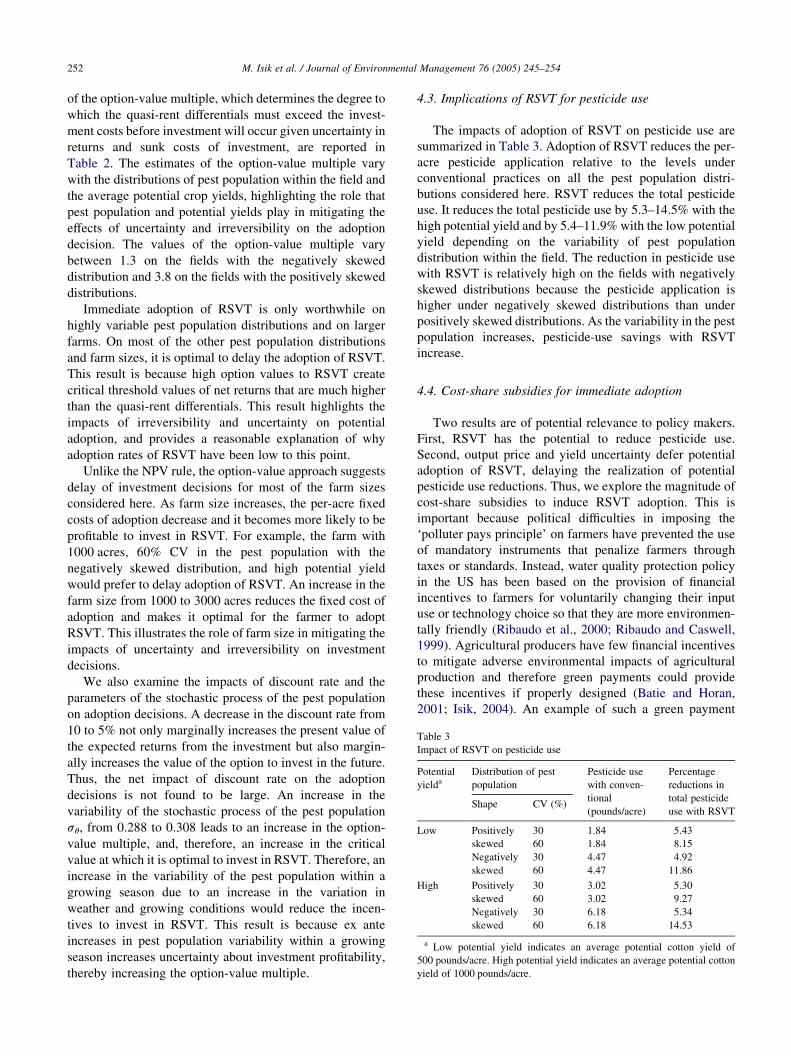
Table 3
Impact of RSVT on pesticide use
Potential
yielda
Distribution of pest
population
Pesticide use
with conven-
tional
(pounds/acre)
Percentage
reductions in
total pesticide
use with RSVTShape CV (%)
Low Positively
skewed
30 1.84 5.43
60 1.84 8.15
Negatively
skewed
30 4.47 4.92
60 4.47 11.86
High Positively
skewed
30 3.02 5.30
60 3.02 9.27
Negatively
skewed
30 6.18 5.34
60 6.18 14.53
a Low potential yield indicates an average potential cotton yield of
500 pounds/acre. High potential yield indicates an average potential cotton
yield of 1000 pounds/acre.
M. Isik et al. / Journal of Environmental Management 76 (2005) 245–254252
of the option-value multiple, which determines the degree to
which the quasi-rent differentials must exceed the invest-
ment costs before investment will occur given uncertainty in
returns and sunk costs of investment, are reported in
Table 2. The estimates of the option-value multiple vary
with the distributions of pest population within the field and
the average potential crop yields, highlighting the role that
pest population and potential yields play in mitigating the
effects of uncertainty and irreversibility on the adoption
decision. The values of the option-value multiple vary
between 1.3 on the fields with the negatively skewed
distribution and 3.8 on the fields with the positively skewed
distributions.
Immediate adoption of RSVT is only worthwhile on
highly variable pest population distributions and on larger
farms. On most of the other pest population distributions
and farm sizes, it is optimal to delay the adoption of RSVT.
This result is because high option values to RSVT create
critical threshold values of net returns that are much higher
than the quasi-rent differentials. This result highlights the
impacts of irreversibility and uncertainty on potential
adoption, and provides a reasonable explanation of why
adoption rates of RSVT have been low to this point.
Unlike the NPV rule, the option-value approach suggests
delay of investment decisions for most of the farm sizes
considered here. As farm size increases, the per-acre fixed
costs of adoption decrease and it becomes more likely to be
profitable to invest in RSVT. For example, the farm with
1000 acres, 60% CV in the pest population with the
negatively skewed distribution, and high potential yield
would prefer to delay adoption of RSVT. An increase in the
farm size from 1000 to 3000 acres reduces the fixed cost of
adoption and makes it optimal for the farmer to adopt
RSVT. This illustrates the role of farm size in mitigating the
impacts of uncertainty and irreversibility on investment
decisions.
We also examine the impacts of discount rate and the
parameters of the stochastic process of the pest population
on adoption decisions. A decrease in the discount rate from
10 to 5% not only marginally increases the present value of
the expected returns from the investment but also margin-
ally increases the value of the option to invest in the future.
Thus, the net impact of discount rate on the adoption
decisions is not found to be large. An increase in the
variability of the stochastic process of the pest population
sq, from 0.288 to 0.308 leads to an increase in the option-
value multiple, and, therefore, an increase in the critical
value at which it is optimal to invest in RSVT. Therefore, an
increase in the variability of the pest population within a
growing season due to an increase in the variation in
weather and growing conditions would reduce the incen-
tives to invest in RSVT. This result is because ex ante
increases in pest population variability within a growing
season increases uncertainty about investment profitability,
thereby increasing the option-value multiple.
4.3. Implications of RSVT for pesticide use
The impacts of adoption of RSVT on pesticide use are
summarized in Table 3. Adoption of RSVT reduces the per-
acre pesticide application relative to the levels under
conventional practices on all the pest population distri-
butions considered here. RSVT reduces the total pesticide
use. It reduces the total pesticide use by 5.3–14.5% with the
high potential yield and by 5.4–11.9% with the low potential
yield depending on the variability of pest population
distribution within the field. The reduction in pesticide use
with RSVT is relatively high on the fields with negatively
skewed distributions because the pesticide application is
higher under negatively skewed distributions than under
positively skewed distributions. As the variability in the pest
population increases, pesticide-use savings with RSVT
increase.
4.4. Cost-share subsidies for immediate adoption
Two results are of potential relevance to policy makers.
First, RSVT has the potential to reduce pesticide use.
Second, output price and yield uncertainty defer potential
adoption of RSVT, delaying the realization of potential
pesticide use reductions. Thus, we explore the magnitude of
cost-share subsidies to induce RSVT adoption. This is
important because political difficulties in imposing the
‘polluter pays principle’ on farmers have prevented the use
of mandatory instruments that penalize farmers through
taxes or standards. Instead, water quality protection policy
in the US has been based on the provision of financial
incentives to farmers for voluntarily changing their input
use or technology choice so that they are more environmen-
tally friendly (Ribaudo et al., 2000; Ribaudo and Caswell,
1999). Agricultural producers have few financial incentives
to mitigate adverse environmental impacts of agricultural
production and therefore green payments could provide
these incentives if properly designed (Batie and Horan,
2001; Isik, 2004). An example of such a green payment

Table 4
Cost-share subsidy required for immediate adoption under the NPV rule and the option value (% of the total costs of adoption)
Potential
yielda
Distribution of pest population Farm size (acre)
Shape CV (%) NPV rule Option value
1000 3000 6000 1000 3000 6000
Low Positively
skewed
30 53.8 28.3 16.8 82.6 73.0 68.7
60 0.0 0.0 0.0 3.9 0.0 0.0
Negatively
skewed
30 63.6 43.6 34.6 75.0 61.3 55.1
60 0.0 0.0 0.0 43.1 11.8 0.0
High Positively
skewed
30 89.5 83.7 81.1 97.2 95.7 95.0
60 0.0 0.0 0.0 64.1 44.3 35.3
Negatively
skewed
30 55.6 31.2 20.2 66.0 47.2 38.8
60 0.0 0.0 0.0 3.5 0.0 0.0
a Low potential yield indicates an average potential cotton yield of 500 pounds/acre. High potential yield indicates an average potential cotton yield of
1000 pounds/acre.
M. Isik et al. / Journal of Environmental Management 76 (2005) 245–254 253
program is the Environmental Quality Incentives Program.
The new Conservation Security Program of the 2002 Farm
Bill also provides incentive payments to producers who
adopt and maintain conservation practices on working
lands. The 2002 Farm Bill has provisions that are likely to
subsidize the use of remote sensing technologies.12
We estimate the cost-share subsidies required for
immediate adoption of RSVT as a percentage of the total
costs of adoption under both the NPV rule and the option-
value approach (Table 4). The cost-share subsidy required
for immediate adoption under the option value is higher
than that under the NPV rule due to the need to compensate
high option values. Ignoring uncertainty and irreversibility,
the NPV rule underestimates the required cost-share
subsides for immediate adoption of RSVT. The required
subsidy for RSVT varies depending on the farm size and
heterogeneous field characteristics represented by pest
population distribution and potential crop yields. As farm
size and/or variability in the pest population increases, the
required cost-share subsidy decreases. No subsidy is
needed to induce the adoption of RSVT on relatively
large farms with high variability in the pest population
distribution.
5. Conclusions
This paper develops an option-value model to examine
the value of spatially referenced data and the decision to
invest in RSVT under stochastic output prices and pest
population. It incorporates the decision about RSVT
adoption using the option-value approach into the economic
threshold model by combining the randomness of the pest
population through time with the randomness of the pest
population density within the field. Unlike previous studies
that examine the impact of policies such as banning
12 Additionally, public support for subsidies to induce adoption of remote
sensing and variable rate technologies has been documented (Hite et al.,
2002).
pesticide use or regulating the timing of pesticide
applications, this paper examines the potential of RSVT to
reduce pesticide use and the potential policy relevance of
uncertainty and irreversibility to achieve reductions in
pesticide use by accelerating adoption.
The results indicate that the economic and environmental
impacts of RSVT vary across heterogeneous farm charac-
teristics such as pest population distribution (variance and
skewness), potential crop yields, and farm size. Further, the
impacts of uncertainty and irreversibility also vary across
pest population distribution, potential crop yields and farm
size, and the extent to which recognition of option values
can influence forecasts about adoption of RSVT. The model
that accounts for uncertainty about output prices and pest
population using the option-value approach provides a
better explanation for the low observed rates of adoption of
RSVT than models based on the NPV rule. Adoption of
RSVT reduces the total pesticide use. However, delayed
adoption due to irreversibility and uncertainty means
delayed realization of environmental benefits. A cost-share
subsidy may be needed to encourage farmers to adopt RSVT
to reduce the side effects of pesticides. The cost-share
subsidies required vary across heterogeneous farm charac-
teristics such as pest population distributions, average crop
yields, and farm size.
This paper focused only on the decisions to switch from
conventional practices to RSVT under uncertainty about
output prices and crop yields due to randomness in pest
populations. The possibility of other technological devel-
opments such as new crop varieties that reduce the reliance
on pesticide use in the future would change the dynamics of
adoption of RSVT. In addition, the possibility of a decline in
the costs of adoption in the future would increase the
impacts of uncertainty and would further delay the
adoption of RSVT. Thus, the results presented here may
underestimate the incentives to delay adoption of RSVT
and the cost-share subsidies required to induce immediate
adoption. Future research also includes how cost-share
subsidies should be designed to achieve a given level of
reduction in total pesticide use in a region with
M. Isik et al. / Journal of Environmental Management 76 (2005) 245–254254
heterogeneous farms and how their cost effectiveness would
be improved with increased information about farmer
characteristics through remote sensing.
Acknowledgements
This research was supported by the Remote Sensing
Technology Center at Mississippi State University. The
authors thank two anonymous reviewers for their helpful
comments and suggestions.
References
Batie, S.S., Horan, R.D., 2001. Green payments policy. In: Outlaw, Joe L.,
Smith, Edward G. (Eds.), The 2002 Farm Bill: Policy Options and
Consequences Publication No. 2001-01. Farm Foundation, Oak Brook, IL.
Capinera, J.L., 2001. Handbook of Vegetable Pests. Academic Press, New
York p. 729.
Caswell, M.F., Zilberman, D., Casterline, D., 1993. The diffusion of
resource-quality-augmenting technologies: output supply and input
demand effects. Natural Resource Modeling 7, 305–329.
Dixit, A.K., Pindyck, R.S., 1994. Investment Under Uncertainty. Princeton
University Press, Princeton, NJ.
Dupont, J.K., Campanella, R., Seal, M.R., 2000. Spatially variable
insecticide applications through remote sensing. In: Proceedings of
the Beltwide Cotton Conference 1, 426–429.
Forsyth, M., 2000. On estimating the option value of preserving a
wilderness areas. Canadian Journal of Economics 33, 413–434.
Goodwin, B.K., Ker, A.P., 2002. Modeling price and yield risk. In: Just, R.E.,
Pope, R.D. (Eds.), A Comprehensive Assessment of the Role of Risk in
US Agriculture. Kluwer Academic Press, Boston, MA, pp. 289–323.
Headley, J.C., 1972. Defining the economic thresholds. In: Agricultural
Board (Ed.), Pest Control Strategies for the Futures. Agricultural Board,
Washington, DC, pp. 100–108.
Hite, D., Hudson, D., Intarapapong, W., 2002. Willingness to pay for water
quality improvements: the case of precision application technology.
Journal of Agricultural and Resource Economics 27, 433–449.
Hudson, D., Hite, D., 2003. Producer willingness to pay for precision
agriculture: implications for the government and industry. Canadian
Journal of Agricultural Economics 51, 39–53.
Hurley, T.M., Babcock, B.A., Hellmich, R.L., 2001. Bt corn and insect
resistance: an economic assessment of refuges. Journal of Agricultural
and Resource Economics 26, 176–194.
Hurley, T.M., Mitchell, P.D., Rice, M.E., 2004. Risk and the value of Bt
corn. American Journal of Agricultural Economics 86, 345–358.
Isik, M., 2004. Incentives for technology adoption under environmental
policy uncertainty: implications for green payment programs. Environ-
mental and Resource Economics 27, 247–263.
Isik, M., Khanna, M., 2002. Variable rate nitrogen application under
uncertainty: determinants of profitability and nitrogen use. Journal of
Agricultural and Resource Economics 27, 61–76.
Isik, M., Khanna, M., 2003. Stochastic technology, risk preferences and
adoption of site specific technologies. American Journal of Agricultural
Economics 85, 305–317.
Isik, M., Khanna, M., Winter-Nelson, A., 2001. Sequential investment in
site-specific crop management under output price uncertainty. Journal
of Agricultural and Resource Economics 26, 212–229.
Layton, B., 2004. Profile of cotton entomology in Mississippi. Mississippi
Agricultural and Forestry Experiment Station, Mississippi
State University (http://msucares.com/insects/cotton/, Accessed on
July 8).
Lichtenberg, E., Spears, R.C., Zilberman, D., 1993. The economics of
reentry regulation of pesticides. American Journal of Agricultural
Economics 75, 946–958.
Mi, S., Danforth, D.M., Tugwell, N.P., Cochran, M.J., 1998. Plant-based
economic injury level for assessing economic thresholds in early-season
cotton. Journal of Cotton Science 2, 35–52.
Mississippi Agricultural and Forestry Experiment Station (MAFES), 2000.
Delta 2000 Planning Budgets. Mississippi State University, Mississippi,
MS.
National Research Council, 1997. Precision Agriculture in the 21st
Century: Geospatial and Information Technologies in Crop Manage-
ment. National Academy Press, Washington, DC.
Plant, E.R., Munk, D.S., Roberts, B.R., Vargas, R.L., Rains, D.W.,
Travis, R.L., Hutmacher, R.B., 2000. Relationship between remotely
sensed reflectance data, acala cotton growth and yield. In: Proceedings
of the Beltwide Cotton Conference 1, 429–432.
Polk, D.F., Hogmire, H.W., Felland, C.M., 1995. Peach and nectarine—
direct pests. In: Mid-Atlantic Orchard Monitoring Guide. NRAES-75,
Ithaca, NY.
Ribaudo, M., Caswell, M.F., 1999. Environmental regulation in
agriculture and the adoption of environmental technology. In:
Casey, F., Schmitz, A., Swinton, S., Zilberman, D. (Eds.),
Flexible Incentives for the Adoption of Environmental Technol-
ogies in Agriculture. Kluwer Academic Publishers, Dordrecht,
MA, pp. 7–26.
Ribaudo, M.O., Horan, R.D., Smith, M.E., 2000. Economics of water
quality protection from nonpoint sources. Agricultural Economic
Report No. 782. Economic Research Service, USDA, Washington, DC.
Saphores, M.J., 2000. Economic thresholds with a stochastic pest
population: a real options approach. American Journal of Agricultural
Economics 82, 541–555.
Sudbrink, D.L., Harris, F.A., Robbins, J.T., English, P.J., Willers, J.L.,
2003. Evaluation of remote sensing to identify variability in cotton plant
growth and correlation with larval densities of beet armyworm and
Cabbage Looper (Lepidoptera:Noctuidae). Florida Entomologist 86 (3),
290–294.
Sunding, D., Zivin, J., 2000. Insect population dynamics, pesticide use, and
farmworker health. American Journal of Agricultural Economics 82,
527–540.
Swinton, S.M., King, R.P., 1994. The value of pest information in a
dynamic setting: the case of weed control. American Journal of
Agricultural Economics 76, 36–46.
US Department of Agriculture (USDA), 2002. Agricultural Statistics.
National Agricultural Statistics Service, Government Printing Office,
Washington, DC (http://www.usda.gov/nass/pubs/histdata.htm, Annual
Issues).
US Environmental Protection Agency (EPA), US Department of Agricul-
ture (USDA), 1990. National Water Quality Inventory. Report to
Congress, Washington, DC.
Willers, J.L., Seal, M.R., Luttrell, R.G., 1999. Remote sensing, line-
intercept sampling for tarnished plant bugs in mid-south cotton. Journal
of Cotton Science 3, 160–170.
Wilson, L.T., Parajulee, M.N., Bozkurt, S., Rummel, D.R., Carroll, S.C.,
Trichilo, P.J., Slosser, J.E., Fuchs, T.W., 1995. Boll Weevil Survival
and Emergence Model: A Computer Model Developed for the
Rolling and High Plains of Texas. Texas A&M University, College
Station, TX.