The value of a Brand in the Marketing of Automotve Lubricants ...
185
COPYRIGHT AND CITATION CONSIDERATIONS FOR THIS THESIS/ DISSERTATION o Attribution — You must give appropriate credit, provide a link to the license, and indicate if changes were made. You may do so in any reasonable manner, but not in any way that suggests the licensor endorses you or your use. o NonCommercial — You may not use the material for commercial purposes. o ShareAlike — If you remix, transform, or build upon the material, you must distribute your contributions under the same license as the original. How to cite this thesis Surname, Initial(s). (2012) Title of the thesis or dissertation. PhD. (Chemistry)/ M.Sc. (Physics)/ M.A. (Philosophy)/M.Com. (Finance) etc. [Unpublished]: University of Johannesburg. Retrieved from: https://ujdigispace.uj.ac.za (Accessed: Date).
-
Upload
khangminh22 -
Category
Documents
-
view
4 -
download
0
Transcript of The value of a Brand in the Marketing of Automotve Lubricants ...

COPYRIGHT AND CITATION CONSIDERATIONS FOR THIS THESIS/ DISSERTATION
o Attribution — You must give appropriate credit, provide a link to the license, and indicate if changes were made. You may do so in any reasonable manner, but not in any way that suggests the licensor endorses you or your use.
o NonCommercial — You may not use the material for commercial purposes.
o ShareAlike — If you remix, transform, or build upon the material, you must distribute your contributions under the same license as the original.
How to cite this thesis
Surname, Initial(s). (2012) Title of the thesis or dissertation. PhD. (Chemistry)/ M.Sc. (Physics)/ M.A. (Philosophy)/M.Com. (Finance) etc. [Unpublished]: University of Johannesburg. Retrieved from: https://ujdigispace.uj.ac.za (Accessed: Date).

TilE V L lJ E OF A BR ()
11
II I TII I·. IARKETII ; F T ) H)TI V E L UBlH ~A T
I BILl E "T IlIJ I E ' E IRO
II ' .' )UTII AFRICA
YDER
A r ear It r p rt . . ubmitt d 10 the \ it v t 'r. r nd T hnik n Bu.in
Ii nsc 10 tit' Uni 'r. it f \ I' . in p r i J fullilrn nt of th ' r quir nn mt: for th d r
I 1 I r of Bu in' Adrnini. Irati n

iii
DECLARATION
I declare that this research report is my own, unaided work. It is being submitted in
partial fulfilment of the requirements for the degree of Masterof'Business Administration
at the University of Wales, United Kingdom. It has not been submitted before for any
degree or examination in any other university.

DEDICATIONS
Rob Mahoney
An inspirational manager, who encouraged me
to tackle theunknown.
Joelean Snyder
For the commitment and endless refreshments
that kept me going in difficult times.
Geoff Bick
Supervisor and lecturer, who converted me tothe
Marketing discipline, and who showed meit can be fun.
iv

v
ACKNOVVLEDGEMENTS
John Vevers and the other members of the BP International Lubricants Team. For the
research you made available and your valuable input.
Group H: Duncan, Gary, Marthie and Sara. We made a great team.
Anita, for all her effort, input, hard work, and above all for all the fun we have together.
Rene deConing, BPmarketing research manager. Your input and guidance as well as the
management of theprocess is appreciated.
Justine Snider, Gerhard Smit and Peter Searll from Research International. Thank you
for your patience and professionalism whilst I continuously changed the format, the
presentation of thedata and theassistance afterwards.
All the other team members in DP who gave input, encouragement advice and help. I
could not havedoneit without you. Thank you.

ABSTRACI'
The marketing of lubricants in a business to business environment is facing some tough
challenges. Continuous advances in technology means declining volumes, as the oil lasts
longer and reduces oil drain intervals. During the guarantee/warranty period of the
vehicle, the original equipment manufacturers' specification as to what oil can be used,
plays a critical role, as using unapproved oil can lead to the warranty becoming null and
void. In the market, any number of lubricant manufacturers meet or exceed these
specifications. Once the guarantee period has expired, (OEM) specifications become less
important, and a number ofother variables start influencing the buying decision.
The market in South Africa is highly competitive, with a large number ofplayers capable
of meeting or exceeding OEM specifications. Thus quality alone can not be used as a
competitive advantage. Other variables in the marketing mix must thus be found to
create competitive advantage. In the paper we look at the traditional four P model, the
new four R model, the development of information technology and its role in creating
customer satisfaction. This research seeks to identify what variables in the marketing mix
contribute towards giving a sustainable competitive advantage, ultimately leading to a
strong, reliable and credible Brand.
The research uses the hypothesis that the Brand name plays a role when the decision
making unit has to decide what lubricants to use in their fleet. Market research, based on
the very latest marketing mix thinking investigates this hypotheses, and gives its findings
in a total unbiased, neutral report. Using conjoint analyses, Utility values obtained are
used to make recommendations on how to position the product in the market.
Lastly, based on theresearch, certain conclusions are drawn and recommendations made
on how best to utilise the power of the Orand for creating and sustaining long term
competitive advantage.

TABLE OF CONTENTS
DECLARATION iii
DEDICATIONS iv
ACKNOWLEDGEMENTS v
ABSTRACf vi
TABLE OF CONTENTS vii
LIST OF FIGURES xi
LIST OF TABLES xii
LIST OF ANNEXUR.:S xiii
vii
CHAPTER 1:OVERVIEW/INTRODUCTION
1.1 BACKGROUND
1.2 PROBLEM STATEMENT
1.30BJECfIVES
1.4 HYPOTHESES
1.5 DEFINITIONS, CONCEPTS AND CONSTRUCfS
1.5.1 Additive
1.5.2 Brand
1.6 LIMITATIONS
1.7 VALUE OF RESEARCH
1.8 METHODOLOGYIRESEARCH DESIGN
1.8.1 Research Method
1.8.2 Qualitative or Quantitative
1.8.3 Data Collrction
1.8.4 Da.a Analysis
1.91AYOUT OF RESEARCH REPORT
CHAPTER 2: Tiff; MAKING OF A BRAND
2.1 THEAIM OF CHAPTER
2.2 ADEFINITION OF BRANDING
2.3 COMPONENTS OF TilE BRAND
1
3
3
4
4
4
4
5
6
7
7
7
8
10
10
11
11
12

2.3.1 The Traditional Paradigm
2.3.2 Brand Architecture
2.3.3 Brand Soul
2.4CUSTOMER R.:LATIONSIIIP MANAGEMENT
2.4.1 The New Paradigm
2.4.2 Advertising in Brandbuilding
2.5 BRAND EQUITY
2.6 SUMMARY
CIIAPTER3:
COMMERCIAL MARKETING, LATEST PERSPECTIVES
3.1 TilE AIM OF TilE CHAPTER
3.2 PORTER'S FIVE FORCES MODEL
3.2.1 The Risk of New Entry by Potential Competitors
3.2.2 The Bargaining Power of Suppliers
3.2.3 The Buying Power ofBuyers
3.2.4 The Competitive Forte of Substitute Products
3.2.5 The Degree of Rivalry Among Established Companies
3.3 MARKETING MIX, TIlE FOUR P'S
3.3.1 Product
3.3.2 Price
3.3.3 Place
3.3.4 Promotion
3.4 RELATIONSHIP MARKETING
3.5TilE FOUR R MODEL
3.6 ORGANIZATIONAL BUYING BEHAVIOUR
3.7 ELECTRONIC REPLENISIIMENl'
3.8SUMMARY
CIIAPTER4:
TIIESOUTII AFRICAN MARKET AND ENVIRONMENT
4.1 TIlE AIM OF TilE CHAPTER
4.2 LUBRICANTS IN AFRICA
\-iii
lZ
14
17
18
18
21
22
23
25
25
26
27
28
29
29
31
32
33
33
34
35
36
38
44
45
47
47

4.3 TilE SOUTII AFRICAN LUBRICANTS INDUSTRY 48
4.3.1 Lubricants Manuradu~ 49
4.3.1 Distribution and Logistics 51
4.3.3The Automotive Lubricants Industry 51
4.3.4Comparative 1100 Brands 57
4.4 MARKET SEGMENTATION 63
4.5 EFFICIENT CONSUMER RESPONSE 64
4.6 SUMMARY 65
CIIAPTf:R 5: TilE RESEARCH DESIGN
5.1 TilE AIM OF TilE CIIAPTER 67
5.1 QUALITATIVE AND QUANTITATIVE RESEARCH PARADIGMS 67
5.3 PREVIOUS RESEARCH AND NEW RESEARCH REQUIREMENTS 69
5.4 SAMPLE DESIGN 71
5.5 RELIABILITY AND VALIDITY 74
5.6 QUESTIONNAIRE DESIGN 75
5.6.1 The Questionnaire 76
5.6.1 Conjoint Analysis 79
5.7I1YPOTHESIS TESTING 80
5.8 SUMMARY 81
CIIAPTER 6: DATA ANALYSIS AND INTERPRETATION
6.1 TilE AIM OF TilE CIIAPTER 83
6.1 SAMPLE COMPOSITION 83
6.3 BRAND AWARENESS 85
6.4 PRICE 88
6.5 PRESENTATION 90
6.6 PROMOTION 90
6.7 CUSTOMf:R Rf:I.ATIONSIIIP MANAGEMENT AND
TECHNOI.OGY 91
6.8 RANKING OF BRAND ATIRIBUTES 93
6.9 CONJOINT VALUEANALYSIS 94
6.10SUMMARY 97

CIIAPTER 7: CONCLUSIONS AND RECOMMENDATIONS
7.1 TilE AIM 0 ..' TilE CIIAPTER 99
7.2 IIYPOTIIESIS TESTING 99
7.2.1 Observed Validity 100
7.2.2 Regression Analysis 100
7.2.3 Conjoint Value Analysis Utility Ranking 101
7.2.4 The Chi-Square Goodness of Fit Test 101
7.3 RESEARCH CONSTRAINTS 104
7.4 CONCLUSIONS AND RECOMMENDATIONS ON BRAND 105
7.5 CONCLUSIONS AND RECOMMENDATIONS ON MARKETING
~U~ 1M
7.5.1 Customer Relationships and Information Technology III
7.5.2 Current Usen 112
7.5.3 Lapsed Users 113
7.5.4 Non-Users 114
7.6 TilE FUTURE 114
7.7 SUMMARY us
BIBLIOGRAPIIY 117

UST OF FIGURES
Figure 1.1: Market Overview
"'igure2.1: The Function of the Brand for Buyen and Sellen
Figure3.1: Porter's Five Forces Model
Figure3.2: Marketing Mil Model
Figure3.3: Comparative Growth of Various Communications Media
Figure4.1: Lubricants Demand in Africa
Figure4.2: Commercial Vehicle Sales
Figure4.3: Lubricants Market Share, Commercial Only
Figure4.4 : Lubricants Market Share, Including Retail
Figure4.5: Diesel Lubricants Positioning Matrix
Figure6.1: Sample Composition by Market Segment
Figure6.2: Spontaneous Brand Awareness, Fint Mention
Figure6.3: Spontaneous Brand Awareness, Total Mention
Figure6.4: Length of Relationships
Figure6.5: Brand ImageVanellus, All Respondents
Figure6.6: The Price Ladder
Figure6.7: Vanellus Price Perceptions
Figure6.8: Packaging Perceptions
Figure6.9: Advertising Awareness
Figure6.10: Current and Preferred Methods of Ordering 1100 Oil
Figure6.11: Current an Preferred Methods ofContact with Supplier
Figure 7.1: Brand Knowledge by Manufacturer
Figure7.2: Areas of Under Performance
Figure7.3: Artas of Under Performance continued
Figure7.4: Reasons for Switching Brands
Figure7.5: Methods ofSourcing Oil
1
13
16
34
44
47
51
55
55
61
84
85
85
86
87
88
89
90
90
91
91
.. 105
107
107
109
110
xi

LIST OF TABLES
Table 2.1: Architecture or Added Value
Table 3.1: Market Share or Lubricants Majors
Table 3.2: Importance or radors in making buying dtcisions
Table 3.3: Influences in the buying decision
Table 3.4: Sources used in keeping up with market trends
Table 4.1: Automotive Lubricants Sales Volumes 1994 to 1998
Table 4.2: IIDD Oils,Comparable Brands
Table S.I: Sample Breakdown, Project Shuttle
Table S.2: Market ShartlElptcted Users in Sample
Table 6.1: Sample Composition in Terms or Users
Table 6.2: Position orDecision Makers
Table 6.3: Brand Attributes Ranked in Order or Importance
Table 6.4: Utility Ranking for Total Market
Table 7.1: Observed Usen or the Brand
Table 7.2: Amended Table of Expected Frequency of Users
Table 7.3: Calculation of the Chi-Square Statistic
15
JO
41
42
42
53
58
73
81
83
84
93
97
102
102
103
xii

· jii
LI T
Turno -r lid olume I'i ur
i nne IIr
/ 1111 IIr 8 :
i 0 Po ilionin Iri
/ nil ure : T hni lOla ih
1111 ur D: lilil Ibn ill
An ne IIr ion Allal
Ann IUt 4 pl in d
ion 7 '() b
ord, indow 9. e ion 7.
QU tionnair
umm
~ () RO 1 ith Qu lionn ir lind II urv R ult
.·0 rl)oinl for indoI) ' lid . ' ho on Findin J
2) Proj hUIII .
) Proj huttl abl
) UP ' Proje t huttl
) Proj . I huttl oplin
I nn ure

CHAPTER 1
OVERVIEW/INTRODUCTION
1.1 BACKGROUND
The research is intended to have a practical application. The student is employed in
South Africa as Automotive Lubricants Marketing Manager by DP Southern
Africa, one of the major global petroleum companies. A substantial amount of
Business Process Re-engincering took place in this company in 1999, and
numerous departments were restructured, downsized and then re-focused on a
sector based approach. Very recently this company also bought the Burmah
Castrol Oil Company, oneof the leading Brands of lubricants in the world.
Prior to the acquisition of Castrol, the company was not seen to be a lubricants
focused organisation, being better known as a major player in the petroleum fuels
industry. Whether this perception is justified or not, the company is very
innovative and in 1999 launched the first application branded lubricants range in
South Africa, namely the Visco range ofautomotive oils. This range is unique, as
it takes the guesswork out of picking the right oil for the consumer's vehicle. The
container clearly shows a picture of the vehicle it is intended for. As such, one gets
on oil for older vehicles, Taxi's, 4 x 4's, Sport vehicles, Diesel vehicles and an oil
for light delivery vehicles. (See Annexure Afor a positioning matrix of this range
ofoils.)
Part of the range oflubricants supplied by BP, is a veryspecific range ofdiesel oils,
branded Vanellus. Vanellus is an oil designed for application in heavy duty diesel
(1100) vehicles, from light commercial to extra heavy transporters and off-road
vehicles.
During 1999, the company lost a substantial volume of sales on the Vanellus
range, in excess of 900 000 litrcs, at a substantial loss of contribution to the
company (Sec Annexure B for actual figures).

Th purp • of this r r h i ' th r fold: Firul , t d I rnun thi
10 's of bu in s, lookin riabl s of th III r ·tin rni appr h n
Br nd nd 1 md
nd thirdl , t u
h.th
po itionin J pi
Th pr du t. rc hi hI t hni I, hn i
sp ilk uion , a ' pr s ' rib d b numb r of t stin 1'1 iliti s, th II n n
being th urn In lustry (API) r lin (. ' 1lI1 ' , ur f n
xampl or r hni al sp .cif u ions ).
Over md abov this, th n III :.quipm III M nu f turer ( ~M ' s hay
sp cific r
list th pr dUCI in thoir b
vchicl "
t or ' ,C d in order for th m to
pprov d pr ducts that can be u. d in th ir
omp titi n is fierc , and in uth frica th r ar 7 major who d Jar th rr
figur and about a hundred mall bl nd r. and fill rs of lubricant .
rk t 0 e rv icw U Amoro
.., ' ·. Il - jl,.- --" '-..-
1,,·•• <--_ .". .
- -- ~---::---
i 1
... . - . J
b ll" I I
A, n Ill. r r m in d irtu 11
tatic
d linin
r th I I upl
dr in.
ov r 11 m r
min Ion r th qu lit f lubri nt r

3
continuously improving. A loss of substantial volume is thus of major concern to
any ofthe players in the industry.
This study shall look at the power of the Brand in the decision making process,
consumer behaviour in the commercial context as far as the Brand is concerned,
the traditional 4Pmarketing mix and its role in Brand building, the more recent 4
R marketing mil', the integrated solutions approach and the actual needs and
requirements ofthe commercial consumer ofdiesel automotive lubricants, and how
BP/Castrol can best satisfy those needs and further enhancelbuild these Brands. Of
particular interest would be a question included on a guarantee against engine
breakdown, should the prescribed oil be used, and if this will influence the
purchasing decision and further enhance the Brand.
1.2 PROBLEM STATEMENT
To determine the reason for the volume loss of Vanellus and how this can enhance
the Brand to better meet consumer's needs.
Identify ways and means to improve the Brand proposition, in order to attract
more customer loyalty, enhance its Brand equity in the process, and increase sales
and market share.
I.J OBJECTIVES
• Identify extent and cost ofvolumeand contribution loss tothe company.
• Investigate and analyse the South African commercial lubricants market.
• Determine the key drivers that influence the purchasing decision and that make
up the overall Brand image.
• Make recommendations and reposition the Brand in its optimum position, based
on the research findings.

..
1.4 IIYPOTHESIS
The hypothesis would be that Brand name is a significant criterion in the decision
making process when procuring HOD oils in the business to business environment
in South Africa.
1.5 DEFINITIONS, CONCEPTS AND CONSTRUCTS
1.5.1 Additive
• Additive: Any material added to base stock oils to change its properties,
characteristics or perfonnance.
1.5.2 Brand
• Brand: (Kapferer, 1992: 15 - 20), says the following:
A Brand is both the memory and the future of its products. A Brand
becomes credible through endurance and repetition. By creating satisfaction
and loyalty, the brand enters into avirtual contract binding it to the market.
A Brand is not a product: it is the product's source, its meaning, and its
direction. The primary capital of many businesses are their brands. Brands
are the only truly international language • a business Esperanto.
According to him, it is necessary todefine what the Brand infuses into the
product orservice, and how theBrand transforms it:
• What attributes arc embodied in the productor service ?
• What advantages does it incorporate 1
• What benefits docs it provide?
• What obsessions docs it represent?

• User; The users will be those who respect the product's values. culture.
and personality.
When an audience can visualise all six dimensions ofthe Brand, the Brand
is deep, otherwise it is shallow..
• Brand: (Koller, 1997: 443). says:
A Brand is essentially a seller's promise to consistently deliver a specific set
of features, benefits and services to the buyers. The best Brands convey a
warranty ofquality. But a Brand is even a more complex symbol. A Brand
can convey up to six levels of meaning:
• Attributes
• Benefits
• Values
• Culture
• Personality)
(• (Dickens, 1998: 11), Describes Brand as follows:
A Brand is a name, Brand equity ist~that name. Brand loyalty is
"- ----built onquality, price, image and service. all elements that constitute value.
~~~~ the value in and ~f a brand. Brands and Intellectual
Properties are intrinsically linked. Without Brands, a company is nameless,
without a name a company has no equity. without equity you can not build
customer loyalty. Nobody knows your quality; one cannot assess your
value. You have no image and can offer no service..
1.6 LIMITATIONS
BP Vanellus users are spread throughout South Africa, over a wide geographic
area as well as over a wide variety of segments. These segments include
workshops, fleet operators. construction, mining. agriculture, marine. forecourt
top-up, resellers, high street retailers, do-it-yourself mechanics and original
equipment manufacturers.

6
As set out in the research design section that follows later, the survey covered
large, medium and small fleets in thethree major geographic areas of Cape Town,
Durban and Johannesburg.
By the very nature of the complexity of the interviews, the potential sample size
and the geographic area, there were serious financial constraints.. The cost of this
survey was capped atR 120000.00
1.7 VALUE OFRESEARCH
Leedy (1997: 189), says that causal comparative research describes relationships
between something that occurred in the past and subsequent responses. The intent
isto uncover possible cause-and-effect relationships among these phenomena.
These variables, which include amongst others, quality, specifications, economy,
preventive maintenance qualities and technical performance, also include "soft"
variables like relationships between businesses, service provided, risk aversion,
references and reassurances, and realised performance.
The research has also investigated all the latest thinking in terms of commercial
marketing, investigated the available models and highlighted relevance to the study
undertaken.
By making use of the survey findings and conjoint analysis, it was possible to re
position Vanellus in its optimum marketing position.
In conjunction with all of the above, it was also possible to make very positive
recommendations to overcome existing weaknesses, to meet consumer needs and
to recapture lost sales volumes and market share.

7
Ultimately the research , survey and recommendations can be incorporated in a
fuUy fledged Marketing Plan for np Vanellus. That does, however, faU outside tho
scopeofthis research document.
1.8 METIIODOLOGV/RESEARCII DESIGN
1.8.1 Researeh Method
As this research isbased on known variables that can beapplied in different ways
in tho market place, the research can be classified as applied research. Its findings
wiU be used to manage the Brand and range of products better, to re-position the
Orand and to formulate a new marketing plan. AU of this puts it in the applied
research category, in contrast to basic research which is abstract and is used in
subjects like mathematics, chemistryand physics.
1.8.2 QUllitativeor Qu.ntUative
Quantitative research consists of thosestudies in which the data concerned can be
analysed in teons of numbers. Quantitative research is based morc din:ctJy on its
original plans and its results are more readily analysed and interpreted (Dm and
Kahn, 1989: 89·90 in Blaxteret aJ., 1996).
The questionnaire is designed in such. way that the findings can be expressed
numerically, thus making statistical analysis possible. As it is also dealing with a
Orand, an intln8lblc, some open ended questions will be included, questions that
will have to be analysed through personal judgement by experts in the panicular
field (ChisnaJl, 1981: 170).
As • whole, the research design is more quantitative than qualitative, no one-to
one discussions, group discussions, psychometric - or psychological testing wu
conducted.

8
1.8.3 Data Colltction
A personal interview was held with respondents, using a customised and pro
tested questionnalre. This primary data was then analysed and presented in figure
and table form, with conclusions drawn from it.
As far as researching the South African Market and environment is concerned,
desk research using secondary data was conducted. Books, trade journals, the
Internet, company records and internal data sources were utilised.
1.8.3.1 Population and sampling techniques.
The universe is all businesses in South Africa that operate vehicles powered by
diesel engines.
Sample sizeplanned is 2S0 respondents.
BP has comparative customer records ofall customers who purchased Vanellus for
1998 and 1999. The sample population will be 100 current customers taken from
this list, 7S lapsed users and 7S companies who do not appear on this list, that is,
fall in one of the required segments, butare not currently BP Vanellus users
The initial selection criterion for the users will be according tovolumes used.
Less than 1000 litre per annum: small user.
Between 1000 and SOOO litreper annum: medium user.
More than SOOO litre per annum: large user.
From this, thefollowing stratification ofthe population will be done:
Long distance haulien, heavy dutylJight vehicles.
Short distance haulien, heavy dutylJight vehicles
Workshops for the above.
Agricultural Co-operatives

9
Mining
Construction
The sample will beweighted to include 60010 larger customers/users. 200.10 medium
usersand 20% small companies.
Over and above mining and agriculture, that has to be sampled at geographic
locations nonnaJly outside cities. research will be concentrated around Cape Town,
Durban and Johannesburg for ease of data collection.
Chisnall (1981: III), states that stratification of population in sample design
involves stratification or division of the population to be surveyed into groups
with characteristics identified as relevant to the needs of the particular survey.
From these strata and the known non-users of the product, a quota will be
selected for interviewing.
Quota sampling is a form of judgementsampling in which the biases arising from
the nonprobability method of selection are controlled by some extent by
stratification and thesetting ofquotas for each stratum (Chisnall, 1981: 81).
1.8.3.2 Datacollection techniques
Ultimately primary data was collected through personal interviews with 233
respondents using a customised. pilot tested questionnaire. The interviews were
done by trained professionals, employed by a bona fide research company of note.
This ensured impartiality and neutrality. It also greatly enhanced the validity of the
research, as the same format and fonnula can be used again in future and it should
produce similar results. It is intended to set a benchmark through this survey as far
as brand tracking and brand recognition is concerned, so that future efforts can be
measured against this base. Telephone screening was conducted and appointments
made for the interviews with bona fide decision makersin the company.

10
1.8.4 Oata Analysis
Statistical measures were used to test the hypotheses and certain other variables.
but in the main lhe research results are more descriptive, expressed in graphs of a
comparative naiure and showing correlations between the major players in the
market. Finally, conjoint analyses is used toshow the best possible positioning for
BP Vanellus, laking all the variables into consideration.
1.9 LAYOUT OFTilE RESEARCH REPORT
Sec Index and Tables ofContent.

11
CHAPTER 2
THE MAKINGOF A BRAND
2.1 TilE AIM OF TilE CIIAPTER
This chapter, the first of the literature review section, reviews what has previously
been published about Brands. It will consider all the attributes ascribed to Brands,
objective and subjective perceptions about Branding, its various components and
the role it plays in adding value to the prOduct and the company. It is extremely--important to understand exactly all the meanings and connotations of the Branding
. _..~.~. -- -- .~ ._,--...-_., .. ~-_. _._--~.--_._- ....
concept, ifoneis to study its importancein the buying scenario......,._. - ". ~ ..,.~._ ... _.
2.2 A DEFINITION OF BRANDING
I Hankinson and Cowking (1993: I), define a Brand as a product or service made
distinctive by its positioning relative to the competition and by its personality. Its
positioning defines a Brand's point of reference with respect to the competition
whilst the Brand's personality consists of a unique combination of functional
attributes ~~s;~~~~ Collectively, the positioning and Brand--personality
are termed the Brand proposition. This constitutes the starting point for Brand
managers charged with the responsibility ofdeveloping and/or maintaining a Brand
in the marketplace.
Also see 1.5.2: 4 for more definitionsof Branding.
In developing and maintaining a Brand, you need to have a simple proposition._-_._---_._----._--------which is easy to understand. Brand propositions which are complicated or
inconsistent, will have little chance of success ( Davidson, 1987 ).
Wilson (1999:3), states that Branding and the strength of brand-person relations
may be one of the last domains of sustainable competitive advantage for firms. It is

12
hard to replicate another brand's personality and copy the traits and meaning
developed over time from a successful Brand relationship. Once a Brand
~ relationship isestablished, it is very hard totake away: if you don't believe it, try to
~0( change your grandparent's political beliefs. He continues: Trends, such as
~:'\' ~~, increasing product and service diversity, increasing global competition, accelerated
~ '\:'f' (" product life cycles, converging product quality, increased technological parity and
~)" the escalation ofbuyer power, have helped contribute towards shifting the focus
towards branding issues.
From the above it isalready clear that a Brand is a very complex issue. It is not
merely made up from a number of product attributes, a name, logo and slogan; it- '-'-----"'-
also contains "soft" elements like a personality and values, and this personality is
made up by emotional and self-expressive benefits.
2.3 COMPONENTS OF THE BRAND
N 2.3.1 The Traditional Paradigm(l\
Pitt (1998: 95), states that the quintessential function of Branding is to create-----_ ... _- .---
differences between entities with a similar potential forneed satisfaction. From this._",---- --, "-"-' - --_.- _.._._~ --,-----_._---
primary distinction a series of utilities or benefits emerge for both buyers and~._---" _._- ----_._.- ....__ . ------------._-_..._---------- -,-
sellers. He uses the figure2.1 below to summarise the benefits for both parties. For
buyers it performs the function of reduction. It reduces search costs, it reduces the~ _.- - -~ .-.. ----- -
buyers perceived risk, and interestingly, the buyer is considered to receive certain
psychological rewards by purchasing Brands which symbolise status and prestige,
thereby reducing the social and psychological risks associated with owning and
using the wrong product.
The sceptic may say that this does not apply in commercial procurement, but as
will be evident later in the research, more than sixty percent ofthe buying decision
is ultimately made by one person, and then psychological factors can come into
play

1101101nd,
- -- - ---- ..- -
l"i UN 2.1 : I"uSou 101
lSu)"Q and SelInAppra8dI U'. P
lEC
Pitt ( I ), I I that th r nd p rfonn Ih fun
t n d 10 b P rf rm d,
2 I) il fi ili t I
fimili IN I th m) , nd
n b n blin th
Dr nd It
t m r up,
rt ntl , Br nd f ilit t pr mium
r lu th
c h r nt m
ih m Dr nd i.
pri in b
pr du I r m b
parti ul rl imp rt nt in pr du t

14
buying behaviour. He sees the Brand as a symbol around which both parties can
establish a relationship.
His viewsstill hold true, but other authors expand quite considerably on this basic
paradigm. Some ofthis thinking is reflected below.
2.3.2 Brand Architecture
Architectural thinking on Branding as a core value adding process suspends
judgements onmany conventional rules ofthumb which applied when Brands were
operated as separate empires within a corporation. Architecture links Brand
identities - for example corporate Brand and product sub-brand - so that both
endorse each other, and play different leading roles in fonning stakeholder
relationships and earning customer loyalty.
2.3.2. I Business Wide Brands
Uncles (1995: I), has some very interesting insight into this. He proposes that the
number of standalone Brands must be reduced and moreequity must be invested in
business-wide Brands and less in products. "We need to re-learn what Brand
marketing is all about and we need to elevate marketing to ensure that there is
widespread participation in the process of adding value." The organisational
implications orthis are dramatic and challenging (www.b).
Table 2.1 clearly points out that Branding should no longer be product focused,
but should reach far wider, encompassing the total organisation and all its people,
with everyone focused towards a common goal, that of adding value to the total
business through service and support to the customer. Brands should also be
leveraged to maximise goodwill between linked Brands. Permanent double-branded
linkages between different levels of Brands should be developed so that over time
both Brandsgain from the other's goodwill.

T bl • _. I: r .hite ture of Add V ilu • Melnet, 6
2..2.2 Lea lJ'S of Brandin
Th ne t cone pi entail ari u league of Branding. gue of Br ndin II u
the purp whieh a particular Br nd i aiming 10 fulfil. The tru tur I c n i
of h. rt 'ring i de ign d to
wor In n the me goal . Th ide of Brand lea u
Br nd' ult in
ppo it d
• if
d
• Ih
nd I I, on 111 di nl
• th Br ndin
• th
di iplin d
(
16
2.3.2.3 Brand Architecture at Work
Aaker (1999: 3), at a Brand Summit had the following to say about Brand
architecture: "There are three mistakes that companies make when it comes to
Brand architecture.
The first is the 'Brand is an island' trap. A stand alone Brand is a wasted
opportunity. By launching sub-brands and endorsed-brands, a company increases
its presence in the market while eliminating any chances of cannibalisation". Aaker
(1993), proposes that the value entry ismade as distinct from the master Brand as
possible.
The second Brand identity trap is the external perspective trap. When a company is
intent on selling to external customers, it forgets all about creating a clear Brand
identity within the organisation. As a result, the staff are not able to identify, and
communicate, the heart of the Brand.
The third trap is the company's fixation with the product attributes. Companies
should expand the value proposition and bring emotional and self-expressive
benefits into playas well. Features can be matched by the opposition every day.
There are four ways of projecting a Brand: as product, organisation, person or
symbol. While product attributes can be matched, intangible benefits can not
(www.d).
2.3.2.4 Human Characteristics of the Brand
Americar car marketer Saturn is a Brand that derives its image from the values of
its organisation. Then there are a whole slew of Brands that come across as a ~ ..
bundle of human characteristics: Harley-Davidson (macho, male, freedom),
Anderson Consulting (competent, confident), Virgin (meteor-like, underdog, but
energetic) and many more. Turning to symbols, there is the Michelin man, the Nike
Swoosh and so on.

17
Aaker (1999), summed up byadvising the audience to look for emotional and self
expressive benefits. They make for a much stronger relationship with the customer.
Mike Lipkin, a well known South African Motivator, propagates that people make----_.
decisions on emotional grounds. then justify them withlogic.-~ ~- _..- -~--
In an unpublished paper. Prashun Dutt (1998), says that the role of familiar
Brands in reducing uncertainty may be salient with customers seeking security.
This aspect will be addressed under the new marketing variables of risk aversion
and realised performance in the next chapter.
2.3.3 Brand Soul
Wickens Tutt Southgate, a London based Brand agency. are evolving a manifesto
for a radical new approach to Brand marketing. Their approach of Brand Soul
questions whether the Brand fully realises the concerns of marketing to literate
consumers. They integrate visions. values and passions as a necessary condition in
organising campaigns for real Brands. This represents a synthesis ofmany schools
of thought about people. drawing particularly on the work of pioneers such as
Carl Jung (Man and his Symbols), Stephen R Covey (Principle Centred
Leadership), and Gary Zukav (the Seatofthe Soul) (www.cc).
The sourcesof Brand Soul arc threefold: Culture. Context and People.
• Values draw on historical company Culture
• Vision draw on future Context (Consumers, Customers, Competitors)
• Passion draws on the present-day team ofPeople
The company culture within which the Brand is managed gives a Brand its noons,
rules and paradigms, in other words, its values. The passions of the people
currently involved with the brand (all of them, not just those in the marketing
department), represent the drives and energies behind the Brand. Finally. the

IS
marketplace context (in terms of consumers, customers and competitors), give rise
to the Brand'sdrive in defining and constantly updating itsvision.
The aim is no longer to build Brands however the consumer wants them. but to
build Brandswhich truly live up to their full potential. This potential will always be
far greater than customers would ever have imagined. It involves a completely
new. and much more inspirational. set ofstrategic planning techniques (www.a).
The article continues by stating that the next step is about Brand Realisation.
Brand Realisation isconcerned with the "reality" of the Brand - with the Brand as
the customersees it, touches it. uses it and interacts with it. It is about creating and
developing the living embodiment of the Brand's Soul through the reality of
products. services, packaging. 3D environments and everything else by which the
Brand is made physically manifest. It is Brand building at its most holistic
(www.a).
This concept is gaming ground. specifically in qualitative research, where
respondents in focus groups are often asked how they perceive the product or
company as a person. often with interesting results.
2.4 CUSTOMER RELATIONSHIP MANAGEMENT
2.4.1 The New Paradigm
Two outstanding features highlighted so far are the need for emotional appeal to
the customer's own aspirations towards self-aetualisation and the absolute
necessity of impeccable service. In America service is part of the paradigm; in
South Africa it is still sadly lacking. The latest developments in information
technology can help to overcome this. as to a large extent it eliminates the people
factor, and ineffective people can seriously harm the Brand. Through electronic
data interchange and seamless just-in-time supply streams. customers can be tied in
with their suppliers. thus raising barriers to exit and cementing relationships.

19
Moore, (1996: 2- 3), quotes the following real life example:
Part of the genius of Wal-Mart's ecosystem was also its unprecedented
involvement and entanglement in the affairs of its suppliers. By 1984 Wal-Mart
began exerting heavy pressure on suppliers to keep their prices down. Moreover,
Wal-Mart compelled its suppliers to set up cross-company infonnation systems to
obtain maximum manufacturing and distribution efficiency. In 1987, Wal-Mart and
Proctor and Gamble reached an unprecedented partnership that involved extensive
electronic ordering and information sharing between the companies,
2.4.11 Just in Time Concept
Rexha (1998: 2), explains the just-in-time concept very well. Based on strong
functional links between big Brand owners and their suppliers in a system of
networked organisations, the Japanese developed highly efficient collaborative
buyer-seller relationships, highlighted by the just-in-time manufacturing system and
earlier supplier involvement in customer innovation efforts (Blenkorn and Noori,
1990~ Dion, et al, 1990; Turnbull, et al, 1992). Aiming to follow this path, Western
firms are increasingly interested in the Japanese model of buyer-seller co-operative
relationships and they make efforts to implement them in their own environment.
2.4.1.2 Information Technology
Towards this, information technology is playing an ever increasing role. McCann
(1995: 18), explains: "Brand managers spend their time studying consumers and
working with advertising agencies to find and communicate the right image for
their Brand". Since advertising is a means of establishing a strategic competitive
advantage, marketing managers make sure they understand how it works and how
they can usc it to their advantage. The target of the majority ofa Brand's budget is
usually the customer, not the consumer, When the target shifts to the
retailer/reseller, the usc of information to enhance the product becomes even more
important. But this time, the advertising agency is not the key partner in product
enhancement, it is the IT professional. Marketing programmes aimed at the

20
customer are becoming computer dependent becausethe computer is the means by
which information is attached to the product. In Computerworld (1994: 133), a
marketing manager describes how he was able to achieve Brand growth by being
tops at delivering actionable data. In the eyes of the customer, the Brand is clearly
enhanced when marketing managers can provide information on how the customer
can use the Brand to increase profits. This inevitably raises the issue of the Internet
and its roleas a channel to market and a medium to build the Brand.
2.4.1.3 The Internet
Lindstrom (2000: 3), sees the Brand as the gateway to the Internet. He says that
for many users, Brands will act as a trusted consumer guide to the Internet, a
development that will make greater demands of the online Brand. And this might
be the off-line Brand's survival kit. One of the emerging problems of today's
Internet world is the lack of trust consumers have in web sites and online Brands.
One cannot buy goodwill and trust - you earn it over time. This means that trusted
Brands have a free ticket to consumer trust on the web while the online market is
still immature. It isnot surprising that online consumers tend to visit their preferred
main Brands on the Internet within a relatively short period of time, because they
already have a positive relationship with the product in the off-line world. Creating
a Brand is now easier than it ever has been. However, committing Brand suicide is
even easier, due to the inability to adapt tothe rapidly changing technology.
2.4.1.4 Off-line Brands
Off-line Brands lack interactivity. They are passive. Off-line Brands can only
communicate one way via television, print and radio. Online Brands 'listen' to the
consumer, learn from them and react based on the consumer's needs. This new
skill - this interactivity - is an online Brand's strongest asset. It enables the Brand
owner to fonn aone-to-one relationship with the customer hum-.dd).

21
2.4.1.5 Summary
The web's power to drive awareness, interest and action, give it attributes of both
an advertising medium and a sales channel. Customers may never visit a brick-and
mortar store, talk to a company or have physical contact with a particular product,
yet Brand preferences and choices have been made. In such scenario's, the Web
experience isthe complete Brand experience.
Lou Gerstner (www.e), from IBM warned that the new dot com companies (like
Amazon. com, Netscape. com) arc fireflies before the storm· all stirred up,
throwing ofTsparks. The storm that's arriving - the real disturbance in the force - is
when thousands and thousands of institutions that exist today seize the power of
this global computing and communications infrastructure and use it to transform
themselves.
2.4.2 Advertising in Brandbuilding
Rosenshine (1999), in a debate with Freeling, sees the situation asset out below.
Branding will move beyond traditional advertising to embrace a slew of media. In
other words, customer relationship management (CRM) is the future. This is where
agencies have a crucial role to play. Creating relationships is an area where
agencies hold the edge. It will take creative people thinking about consumers'
hearts and minds to dev~~p.J!!C? Brand images. And you will not find the creative
people at the consulting companies or at the dot-corns, one will find them at the
advertising agencies.
Freeling (1999), in the same article, sees it differently.
There are four new rules of Branding.
• The first is that, increasingly. there is little functional difference between---_.,~,,_._-~-_._._~----------
products. To surmount this. companies will have to co~e on functional... __ .,.~. -- .._---~.- .._.-

22
benefits (product attributes), process benefits (ease of purchase, servicing_.~ --_.~ .•. ----------
benefits), and relationship benefits.-• Two, a company will have to deliver the key touch points - basically, identify
the mo~~nts ~~e.~ the ~u:!~~_~r _r~quires assistance, and spring into action.
• Third, surround the customer with the Brand. Take greater recourse to non-._-->_._------~.- ..._--- ~_..-._ ..-._----_._,--_.__.__ ._-----
traditional -mcdill~~ Brand building. As the media fragments, trust in
advertising falls, and the Net takes eyeballs away from television, non
traditional media will come to playan important role in Brand building.
• Finally, there is permission marketing, where companies will forsake intrusive
marketing inorder to build a dialogue with the customer.
CRM focuses the Brand image on the current customer, who is more likely to
purchase any given product tomorrow. It is only a matter of time before marketers
will create the necessary databases that will fonn the basis for their Customer
Relationship Marketing exercises.
~ • Z.5 BRAND EQUIT\'
\,j \
Brand is called an intellectual asset in the management field and called an intangible
asset in the accounting field. Brands represent a certain quality and image
acknowledged in the market. The power ofa Brand derives from the fact that. as
soon as a customer perceives a Brand, it reminds customers of its quality and
image, and this fact gives rise to loyalty to a certain Brand or company (Gale,. -- . _. --------------------
1994). The essence of a Brand can be regarded as a source of an excess return
because oftheBrand 10~a1~JOkada, 1998: 2).
Cullman, stated as far back as 1982, that in today's environment, building strong.-._-- _.• _.-._--, ------
Brands and establishing Brand equity is becoming more and more challenging.
Increased pressures to compete on price, increased competition through product---
introductions and the fragmentation of advertising and market segments arc just a

2)
5ADlDhLQfthe preuures being faced by companies in today's highly competitive"-._"~'_._-_ .._~._.~.--._----
envirC?nm~t_ (www g)
The most important asscts of any busin~~~_ ar~i!'tan~~le - including its base of
loyal customers, brands, symbols and slogans - and the Brand's underlying image,--- - - ._. ...
personality, identity, auitudes. familiarity, associations and name awareness. These
assets· along with patents, trademarks and channel relationships - comprise Brand
equity, and arcaprimary source of competitive ad~a..!1tatte an~ f~!~r~.~rnings.
At least five general approaches to asscssing the value of Brand equity have been
proposed.
• Price premium that the name can support
• Impact of the name on customer preference
• Stock market valuation (in BP's Annual Report of 1999, net auets are given as
about $44 billion, yet Market Capitalisation exceeds $ 1SO billion)
• Replacement value ofthe Brand
• Earning power of the Brand
• The set of consumer associations and behaviours that permits the Brand to earn
greater volume or margins than it could without the Brand name (www.h).
Cravens and Guilding (1999:61), states that ultimately the success of any brand
valuation method depends on the firm's ability to use the measure to help improve
financial performance. Some suggest that the measurement of intangibles such as
brand value, human capital, and innovation power should take precedence over the
measurement of profits It is these longer-lasting assets of an organisation that will
traMlate to sustainable long term profits
1.6 SUMMARY
Thi, charter point, out that a nrand is made up of • "lUI mJmber of variables.
some tangible, but even more that arc intAngible A Urand is normall)' auoaatcd
with a name, symbol or slogan, but this purely serves to identify a product

24
Companies are trying to appeal to psychological motivators to establish an
association with the Brand. a sense of belonging. This is done by positioning the
product correctly according to its attributes. but also by giving it a Brand
personality. This personality stands for the values and norms. not only of the
product. but also of the company and its people. If this image is favourable. and
compatible with the customers aspirations, the purchase of the product is made
much more readily.
Products can be differentiated. even when considered to be an everyday
commodity. bygiving it a Brand soul. This allows for a premium price to be asked.
Even when the customer believes that he/she isdealing with technical products that
are all similar. subconsciously he/she will have a preference, a Brand hclshe best
associates with. And even in business-to-business marketing. sixty percent of
decisions aretaken by one individual.
Numerous ways exist to build Brand equity. but the latest focus ison relationship
building and the role information technology will play in growing and advancing
the Brand.especially as the Web develops as a newchannel to market products.

2S
CHAPTER 3
COMMERCIAL MARKETING, LATEST PERSPECTIVES
3.1 TilE AIM OFTilE CIIAPTER
In Chapter I thecomposition of a Brand was discussed. It was clearly shown that a
Brand does not simply consist of a product or range of products with certain
attributes, a name and an icon to identify it. Ogilvie and Mather, the global
advertising agency, uses the concept of three hundred and sixty degrees branding.
This simply means that the total presentation and communication of the Brand
must be consistent and be based on the Brand print or DNA of the Brand as they
call it. It is the unique set of values, personality, perceptions and resources that
makes up the customer's perception of the overall or so called corporate or banner
Brand (Makin, 2000).
It would thus make sense to look at and analyze all the levers that make up a
Brand strategy in order tounderstand fully how far the integration process must go
and to make meaningful recommendations at the end of this study. This will be
done by looking at the accepted marketing models, reflecting the latest thoughts
on these models and adding the impact of infonnation technology. Finally, The
study looks at buying behavior in the commercial environment, asopposed to retail
consumer buying. This need to be understood, as the traditional belief is that
Brand plays a lesser role in business-to-business procurement.
2.1 PORTER'S FIVE FORCES MODEL
Ifill and Jones(1998: 123), says that the Sforces that shape the competition in an
industry influence profits of the established companies in that industry. If we refer
to Porter's model in figure 3.1, one finds that these forces are: The risk of new
entry by potential competitors, the bargaining power of suppliers, the bargaining

..pm I' () bu I' • th rnp titi f ub titut pI' du I nd th
din , th
infl u /I III rk etin in th comrn rei I lubri nt
induu in • outh fri will b an ti t d.
comp 'Iit rs i bra rd 'I' til /I wh t
KOII-r, (I 7' 229), . th I th r /I of tu I nd P t nti I
lik -I
10 b· outdo n . b it. III rgin
comp niror s
rnp -tit I' or n w t hn ie. th n b it. urr nt
The t5 ForelS Driving Comp tlon:
Thr I of oowII' 11
I TRYCOMPETlTORS
8 8
Th t ofproducts ex
Fizu 3.1'
uuv d\ nt c:
. I ncr
3.2,1 'I , R ' of l e ./11 b t nli 1 , mp til
In . t imp rt nt pI' int til III I' I
reh h uld pr
I' h it d
th I'
thi. I'
rnrn rei I lubri nt '
Th purpo.
Dr ndin in th
I' n thi

27
Kotler (1997:230), describes this as Brand Competition. i.e. offering a similar
product and services to the same customers at similar prices. Following on this
definition, existing competitors would be: Shell, Castrol, Mobil, Caltex, Engen,
Zenex, Sasol, Total, Agip and Elf These would be the Industry Competitors in
figure 3.1.
Kotler (1999), also mentions industry competition which occurs when a company
sees its competitors as all companies making the same product or class of
products. In South Africa there are almost a hundred small fillers and blenders
servicing mostly niche markets. The barriers to entry arc low, especially if the
focus is on a small niche market. The major oil companies do however have
absolute cost advantages due to their integrated supply chain, infrastructure and
economies of scale. The lubricants business, contrary to petrol, is not regulated, so
this does not create a barrier to entry.
Black Economic Empowerment poses the biggest threat to existing oil companies,
as the market has traditionally been dominated by multinational oil giants. Under
the new dispensation in South Africa. it is the Government's intent, through
employment equity and redistribution of wealth to, rectify this situation. Every
lubricants business will be well advised to remember this and include it in their
strategic plan, especially as the main stream customer of the future will be Black.
This has serious but interesting repercussions on future Brand personality.
(Source: In-house minutes, 1999).
3.2.1 The Bargaining Power of Supplien
Because the supply chains of all the majors are almost fully integrated, very few
suppliers exert any influence over the big multinationals. They all have their own
upstream and downstream resources. It is vinually only the chemical additives
companies that supply any other components to the product, and theoil industry is
their lifeblood. The result is that there is parity on this attribute of the product, and
no competitive advantage can be obtained from this (fig 3.1).

28
An anomaly exists though in that the oil companies actually supply base oil to the
small nichemarket players at prices that allen allow them to undercut the powerful
big players, inorder to maximise production at the upstream refinery and to obtain
benefits ofscale (Reynolds, 2000).
With the addition of Castrol to the fold of DP, it will be interesting to see if the
company is now going to exert its power as a supplier, 8S it now has sufficient
market share to utilize full production capacity.
3.2.3 The Buying Power of Buyen (Figure 3.1)
The main buyers of lubricants in the industrial sector are original equipment
manufacturers, factories, mining, agriculture, marine and transport fleets.
According to Hill and Jones (1998), buyers will be powerful when they are few and
large in size, suppliers are many and small, buyers purchase in large quantities, they
can switch cost-effectively between companies or they can threaten to implement
vertical integration. Of all of these, the cost effective switch between companies
creates by far thebiggest threat. The market isextremely price sensitive and highly
competitive with all suppliers adopting a pragmatic approach to gain market share
(Reynolds, 2000).
The product is also very easy to compare, as it has to show technical
specifications, approvals and endorsements of OEM's. In most instances price,
and to a lesser extent Brand and support. become the differentiators. This
highlights the need of finding a more substantial differcntiator that will provide a
sustainable competitive advantage. Only CastroI seems to have established a
significant Orand presence that allows them to charge a premium price for their
product (Source: E-mirg, 1999).

29
3.2.4 The Competitive Force or Substitute Products (Figure 3.1)
There is no threat of substitute products at this stage. It is foreseen that
hydrocarbons will be with us for the foreseeable future. Products are continuously
improved and enhanced, but there are noother products that can perform a similar
function.
3.2.5 The Degree of Rivalry Among Established Companies (Figure 3.1)
The University of Oregon (www.i) gives a very comprehensive framework of
factors to be considered here. Amongst these are : The industry competitive
structure, demand conditions, exit barriers, high fixed costs, access to distribution
channels and a number more, all of which have to some extent, been covered
above. Some of the above do merit individual discussion.
The competitive structure of the industry is such that there is no interdependence.
Each has its own very elaborate, very expensive infrastructure. There is no
collaboration or collusion, the industry operates under total free market conditions.
Each of the majors are backed by enormous multinationals with substantial
resources, andall have as their objective tocapture market share.
Exit barriers to the majors are extremely high, as huge capital investment has been
made in refineries, tanks, blending and filling plants, pipelines, transport facilities,
distribution depots and other infrastructure. The Black Economic Empowennent
companies are looking at importing as much as possible rcady made product, but
the deterioration in the value of South Africa's currency makes this a somewhat
unviable proposition. The majors, who have an integrated supply stream, benefit
from upstream operations when the price ofcrude oil is high, as they can then sell
the unrefined product at high margins. Should the price of crude drop, they benefit
in the downstream operations as margins then increase on the refined lubricants
sold to the commercial market. The more efficient the logistical supply chain of
the oil majors, the more competitive they can become. As a result of the heavy
investment in infrastructure, all the companies have high fixed costs and they all

o
hav- I ' • 10 and u . th - un - d i tribution h nn I , 11 hould be ob u th t 11
th - lubri 11I1 companic need rn nhin 'Is ' 10 ti e th nu I comp 'Iili
(Rc nol ds, 20 0)
T ibl - , I: [arket h ire Lubri 1111 ijor " our " : UP 10 omp n
Sep.99 Oet,99 Nov-99 Dec-99 Jan·oo Feb-OOBP 1U1 13.11 11.93 14.60 14.23 15.38CALTEX 18.90 18.59 19.05 18.45 19.36 19.54CASTROL 10.40 9 .95 10.06 9.20 9.55 8.48ENGEN 22,57 23.66 25.25 24.89 24.77 23.81SHELL '23.29 23.61 23.28 21 .76 21.32 21.56TOTAL 9.48 10.18 9.13 10.19 9.64 10.06ZENEX 0.94 0 .90 1.30 1.11 1.13 1.18Total Market 100.00 100.00 100.00 100.00 100 .00 100.00
Dnnand conditions arc . u h, th t d pile a . Ii ht rowth in th gro dorn Ii
product, th overall demand i d rca. ing due 10 improvement in th qu lit of
lubricants and mbsequent Ion 'r dr ining interval "
A. n b een from tabl . I, although fluctuating within a p rccnl or . 0, th r
arc n i nificant change. in mar -t harc of th major if taken over a p ri d f
time,
Th obj hould thu b to in a long term u t inabl advanta . r . ult
of thi , th r arc devclopm nt III th markcl thr I ar n I covered b r '
model. Puri I rna rgue Ih I it ill fa ll und r
camp tit rs, \ hil I oth r III
ch n
add d I nt
Ih nd III u. f I hn
r I lion. hips, i. r ut I n to obt in nd III int III
mp titiv ad nu
Thi r liz d nd n d 10 form n int rip rt of n fiuur ( r nd
n.hip mark lin nd I hnolo \ ill di. u: din m r d pth in

31
the marketing mix in the next section. A major shill in the perception of the
fundamentals of marketing is taking place. The shifl is so dramatic that it can, no
doubt, be described as a paradigm shill (Kuhn: 1962). Marketing researchers have
been passionately convinced about the paradigmatic nature of marketing mix
management and the four P model as the basic foundation for all marketing
thinking and to challenge it has been as heretic as it was for Copernicus to proclaim
that the Earth moved (Kuhn, 1970: 149-1 SO).
3.3 MARKETING MIX, TilE FOUR P'S
Marketing, the way most textbooks treat it today was introduced around 1960.
The concept of the marketing mix and the Four P's of marketing - product, price,
place and promotion - entered the marketing textbooks at that time (McCarthy,
1960). It quickly it became the unchallenged basic model of marketing, totally
overpowering previous models and approaches. Other P's have from time to time
been suggested as additions. like people, physical evidence and processes, such as
the & P's model used particularly for services marketing (Booms and Bittner,
1982), and Kotler (1999), in the context ofmegamarketing, added public relations
and politics.
Lauterbom (1990:26), suggested that place becomes convenience, price becomes
cost to user, promotion becomes communication and product becomes customer
needs and wants. Although this has widened the scope of themodel, itwas evident
in chapter two that a Brand needs more than these attributes in order to create a
distinct identity, create brand equity and give it a sustainable competitive
advantage.
This section shall cover the attributes, but also substantially expand on the whole
marketing mix concept to include a number ofnew variables believed to be crucial
in the Brand architecture in order to achieve a strategic advantage.

32
In the market survey questionnaire respondents are asked to rank the importance
ofthe product attributes of the traditional four P model as well as new variables
such as relationships, risk management, references and realized performance,
For this reason, it is important that the product attributes that can contribute
towards the perception ofthe Orand, bediscussed and understood.
3.3.1 Product
The following product attributes are included in the questionnaire:
3.3.1.1 All season application (or viscosity)
This is an attribute easily met by opposition
3.3.).2Quality
This can be subjective or objective, objective in that the product must display
technical specifications and approvals, but effective Brand building. like Castrol, do
lead to certainsubjective preferences.
3.3.1.3 Engine protection
Increased power and performance, quality base oils, prevents breakdowns, protects
against rust and fouling of injectors, reduction of friction and wear, superior
lubrication. These arc all very basic attributes ofall lubricants, but once again there
are perceptions that certain oils pcrfonn better than others, and that is why it is
included. In Brand building perception isasgood as reality.
The following attributes arc measurable and quantifiable, and as such can provide
proofof being a superior product, therefore they are included:
• Extended engine life (in kms)

33
• Fast oil circulation (kinematic viscosity)
• Fuel savings (liters per kilometers)
• Minimum oil consumption (reducing number of top-ups)
• Reduces drain intervals (more kilometers traveled between oil changes)
• OEM specified (dealer approved oilchart),
Aseparate, detailed question then deals with packaging and labeling, its look and
feel, practicality, identification and ease of use, It tests thecustomer perception on
Drand presentation, the visible expressionofwhat the Brand stands for.
3.3.2 Price
Price can either be the initial price paid for the product, or it can bederived savings
as the result of the usage of a superior product. For this reason a number of
questions have been included on price: How important is it to be the best (initial)
priced oil ? Or a1tcrnatively have long term savings through the prevention of
breakdowns, by being reasonably priced or by being good value for money ?
These questions are intended to measure the awareness of thecustomer to the long
term benefits of using a superior product, rather than a short term trade-off on
initial savings on an inferior product.
3.3.3Place
In the commercial market this plays a much smaller role than in retail marketing
where visibility and availability is critical. Goods are often ordered unseen,
especially re-order merchandise, and these goods can be supplied from virtually
anywhere in thecountry, as a lead time normally fonns part of the supply contract.
For this reason one question was included on place, and that measures how
important availability is to the customer.....

3.3.4 Promotl n
n nd dv rti in . n - n
r B nd .
pI t nn f
n b m ur d.
i bliv d t b
nd
in Iud d to m
in t which futur Br nd building ff rt
lIinon
qu
Any mar tin PI di m h uld b w 11
notion th t th firm i be t off y d ining nd dir tin it tiviti ace rdin t
One can ily rgu that th f ur P ' of th m rk tin nux are not w 11 bl t
fulfi ll th r quir m nt of th mar ting can pt . Di on and Bioi :4 ).
explain : " Inde d, it would n
with a cu tom r' int ~ t (i. . m b dy for whom om thing i don), th
implicit in the Four P approach that the cu tomer i om body to wh m
om thing i don !" Although Mc arthy (1960), r cogniz the interactiv n tur
of th P' , th model it Ifdo not includ any interactiv I m nt . Furth rm r ,
it do not indicate th natur and
" 1I~ ......
, .It , ,
. .. . .. .. . Io.h ' .. . .. H'
Fi re .2:
u : Pri W Ier
Mi. 1.
Mnn:JgJcmcnl.(1 9:I )
R fI rrin t fi ur 3. 2, it i cI
of th our P m d I, th IT
th t n in thi m d m nd upd t d r i n
till pint in on dir tion, 1m impl in

35
unilateral action taking place. This model, designed by one of the leading
consultancies in the world, implies exactly the opposite, bringing into the process
loyalty and relationship management. According to PricewaterhouseCoopers
(1999: 14 - 16): "In some mature industries, or in markets in which many
competitors operate loyalty programs, Relationship.based solutions may be the
final available pathway to sustainable competitive advantage. Customer solutions
often need to be made to fit and they usually require an extensive exchange of
information between customers and value providers. This basically supports an
automatic interest for both parties in maintaining constructive and intimate
relationships".
The right hand side of the model (figure 3.2) , focuses on value driven activities
that aim to optimize the total consumption experience. This involves the
establishment of value-adding relationships with customers and the integration of
products andservices delivered through multiple channels.
In strategic terms, the left hand side of the model is about maximizing the
companies' customer share of wallet, whereas the right-hand side focuses on
achieving maximum customer share oflife.
This serves as the introduction to a new school of thinking, namely that of
relationship marketing.
3.4 RELATIONSIllPMARKETING
The concept of relationship marketing has emerged within the field of services
marketing and industrial marketing (Jackson, 1985: 120 - 128). The phenomenon
described by this concept is strongly supported by on-going trends. Gronroos
(1990: 18), in his book defines relationship marketing as ''marketing to establish,
maintain and enhance relationships with customers and other partners, at a profit,
so that the objectives of the parties are met". This is achieved by a mutual
exchange and fulfillment ofpromises.

36
Relationship marketing is still in its infancy as a mainstream marketing concept,
although it has established itself as an underlying paradigm in modem industrial
marketing. Kotler (1992: I). concludes that companies must move from a short
tenn transaction oriented goal to a long-term relationship building goal.
3.5 TilE FOUR RMODEL
Groundbreaking work was done by the Wits Business School in South Africa by
Abratt, Spence and Bendixen (1997). indeveloping a model that can explore new
marketing frontiers. adopting the relationship based approach, but also taking it
further. They postulate that knowledge products. that is products where a lot of
infonnation is required to understand properly. is not adequately provided for by
the FourP model. They suggested a new model. namely the4P • 4R framework.
While the traditional 4P's in the marketing mix can be seen to cover the
characteristics ofgoods and services relatively thoroughly. the same is not true for
knowledge products. Instead. 4R's appear to emerge as being the relevant
variables ofthemarketing mix. Abratt et al. (1997). propose the following:
• Risk management - to overcome customer's feelings of anxiety and minimize
the consequences ofmaking a wrong choice. This is specifically focused on the
customer and does not relateto reducing risk for the seller.
• Recommendations and references - endorsements by knowledgeable persons
because of the credence qualities of a product. This tends to hold much more
sway than traditional advertising.
• Rdationships - provision of long-term support through networks, alliances and
partnerships. This essentially involves the development of trust and
interdepency between thesupplier and the client.
37
• Realization of perfonnance - to ensure and re-inforce that the product has in
fact met its purpose. The essential element here is setting. managing and
meeting the expectations oftargeted customers.
Products that arc in essence goods or services rather than knowledgc products may
display the characteristics of knowledge products over some period of time. This
results from the fact that there is a knowledge gap between provider and user, the
former having a great deal more knowledgc about the nature and use of the
product thanthe latter.
Enough support for this model exists to justifY the inclusion of these factors as
cause-and-effect variables in the market survey. Questions on the importance of
these variables have been included in the marketing mix section of the
questionnaire, and their importance will be rated against that of the traditional
attributes. The questions cover amongst others risk management and realized
performance by offering a guarantee against engine failure if the product is used
correctly. It also explores the importance of customer/supplier relationships,
including preferred way of communication and order placing, even making
provision for totally electronic relationships, where all interaction takes place via
computers, versus the traditional one-on-one selling.
Calonius (1988: 86 - 103), sees the promise concept as an integral element of the
relationship marketing approach. A finn that is preoccupied with making promises
may attract new customers and initially build relationships. However, if promises
arc not kept, the evolving relationship cannot be maintained and enhanced.
Promises should be mutually given and fulfilled. This ties in very well with the
concept of realized perfonnance above. Promised performance will either be
realized or not after a certain period of timc hu elapsed, and fulfilling promises
that have been given is equally important as means of achieving customer
satisfaction, retention of the customer base and long term profitability. It is all
about credibility, a very important requirement ofa successful Brand.

38
Another key element is trust. The resources of the seller - personnel, technology
and systems· have to be used in such a manner that the customer's trust in the
resources involved, and thus in the firm itself, is maintained and strengthened
(Gronroos, 1990: 3·12). This ties up well with the risk management aspect of the
4Rmodel.
Moorman et aI. (1993: 3), define trust as a willingness to rely on an exchange
partner in whom one has confidence. If a customer believes in his supplier and his
products, he will also believe that risk will be minimized by his supplier·s
recommendations and products.
In support of the argument of 360 degree branding and the role of relationship
marketing in building the Brand. Wilson (1995: 335 - 345),has the final say: By
reviewing available literature studying factors determining success or failures of
relationships. Wilson selected twelve constructs that have both theoretical and
empirical support as focal variables. These relationship variables are: commitment.
trust. cooperation. mutual goals. interdependence and power, performance
satisfaction. structural bonds. comparison level ofthe alternatives, adaptation. non
retrievable investments. shared technology and social bonds. The constructs have
both an active time phase where they are very influential to the relationship and a
latent phase where they are still important but not under active consideration in
relationship interaction. The five stages characterizing the buyer-seller relationship
development process are; I) partner selection. 2) defining purpose. 3) setting
relationship boundaries, 4) creating relationship value. and S) relationship
management. The logical progression from here is to look at industrial buying
behaviour.
3.6 ORGANIZATIONAL BUYING BEIIAVIOVR
Alarge body of research indicates the importance of the buying center or decision
making unit. as it isalso called. in the vendor selection decision-making process.
Since the classic studies of the 1970·5 the buying center has been a focus for

39
examining vendor selection decisions (Webster and Wind, 1972~ Speckman and
Stem, 1979). However, even the early proponents of buying center decision
making point outthat many vendor selection decisions may be made by individuals
alone (Sheth, 1977), and Webster and Wind (1992), also stated earlier on that it is
the specific individual who is the target of the marketing effort, not the abstract
organization (Webster and Wind, 1972).
The question asked in this research is if the power of the Brand plays a role in the
decision making process of the decision making unit, or of the individual who
ultimately places the order. In today's society, every person fulfills multiple roles,
and inevitably that person will be exposed to the Brand outside the work
environment. If this happens, the person is bound to have some perceptions about
the Brand, and this, even if subconsciously, may have an effect when a buying
decision has to bemade at work. If enough individuals are empowered to make a
buying decision, this can have major influence on how commercial lubricants
should be Branded and marketed in South Africa.
Patton III (1995), in a research paper sets out how he conducted research with
431 industrial buyers in the United States. He found that 65.4% of these make
decisions as individuals, 19.3% make decisions jointly with the department and
15.3% makedecisions jointly with peopleoutside the department. The proportions
in each cluster, or decision style group, substantially match the results from
previous research that suggested that approximately two-thirds ofvendor selection
decisions are made by individuals (patton et al., 1986). After refining the date, he
amended the figures so that 56.90.Ic. ofall the vendor selections involved were made
by individuals, 26,3% were made jointly with others in the procurement
department and 16.8% were made in conjunction with people outside the
department (For lubricants, these may be the technical experts, the automotive
engineers).
Patton (1995), asked the subjects in the study to indicate which of five competing
vendors they would select in a hypothetical vendor selection situation. The vendors
were classified as follows:

40
• V: Good performance, low variability
• M: Excellent performance, higher variability
• W: Bi-polar performance
• Y: Extremely low on one attribute
• H: Extremely variable performance
Nearly 62% of the industrial buyers in the sample selected vendor M, which
offered the best overall perfonnance, butalso offered more variability than did the
second best overall performer, Vendor V, who was selected by just over 300At of
the sample. Patton (1995), found that there is a statistically significant difference
(chi-square p =.034) inthe way the individual decision makers (Loners), shy away
from the variability shown by Vendor M and to select the less variable but lesser
qualified Vendor V than did their counterparts who normally make such decisions
jointly with others. The Loners also tended to spread their selection over a broader
spectrum of vendors, but the tendency to avoid variability is subtle but clear,
showing avoidance of the downside risk, by selecting the less variable of two
reasonably well qualified vendors.
This could have significant implications for lubricants marketers inSouth Afiica. as
itclearly implies the need for effectiveoverall or360 degree Branding.
The findings reported above indicate that the individual industrial buyer faced with
making vendor selection decisions on his or her own is the dominant vendor
selection situation and should be recognized as such by purchasing firms and
industrial marketers.
The style of the Loner is predominant and pervasive. Industrial marketers should
anticipate that a significant proportion of vendor selection decisions will be made
by a single individual rather than a buyinggroup (patton, 1995).
Some further research on industrial buying models were conducted by Gresham
and Gruben (1993). They conducted research amongst 135 buyers in East Texas,

d rkans n tl ir u in m of th ir findin
T bl .2 I rI indi t th t qu lit
fo llow d h n
lion in, n III I di unt
do I 10 th
provid fi r III
th thr t. f n w ntr nt ,
bottom !
hli ht
up Ii r ' I n th in u in w t d ri ht t th
Tabl .2: h Import ne of ct r in
nd . rub n I
6.5706.3786.ZJ7
Mrirnmam 'rel rB1s 6.1785.gJ)5.437
MniaiLrer's rTirinunMrE intte~
'reIlB t5 5.1254.9483.8D3.281

T bl nd .4: Influ n in th
U ed in Kc p in ' Up with M rkct Trendnd rub en ( 199 )
rch d n b P tton n individu I d i ion m in
m up th d min nt
m r t . m n nt
in hi hli ht th rin th
up t d t ith in Ih mar • i. it
tin
r intin t t
to m
m r . Th pp r t i1din
to bu . , oth r th np on I, lIin ( p h t I.. 19 3: 107 .

43
In research conducted in South Africa by van Veijeren (1994:41), on factors
influencing buyers when buying capital equipment, he rated the facton as follows:
• Possible savings as a result ofusing the equipment
• Reliability of the equipment
• Quality
• Price
•
18.1%
16.5%
14.3%
13.3%
This would support Abrau's model ofReaJizcd Performance, the item behaving the
way it has promised to(see 3.5).
Van Veijeren (1994:40), also states that the typical industrial buyer ismore human
in his or her buying than industrial marketers usually reaJize. Second, a fair
observation seems to be that to the extent that products and services become
objectively alike, the role ofsubjectiveemotional factors loom larger in the buyer's
final purchasing decision. Thus one has to accept that any marketing plan would
have to embody the fact that marketing actions are directed in the first and last
instance at individuals, and not merely at organizations.
Sheth (1997), also discuss the roles ofusers, gatekeepers, deciders and influencers.
For the purpose of this research, their relevance arc that they are also individuals in
own right, also subject to perceptions about the Brand, so the better the Brand
strength, the more likely it is to gain acceptance in the decision making unit
(www.m).
The last aspect of the organizational buying behaviour to be covered, are the
three types of buying activity: straight rebuy, modified rcbuy and new task buying
(www.m). In the industrial buying arena, for the modified re-buy and new task
buying" one-on-one personal selling and personal relationship marketing still plays
a very big role. As for straight re-buy; it isvery rapidly being replaced by electronic
replenishment· and communication systems.

I R L I II
h in • bu in processes
lion I tru tur
c rdin
mp OJ
indu I uppl
tr n fonnin
Th lnt m tin I ju I tr n f rmin
nd th w p
Tunn (2
bu in
in n ti tin onlin IIi n
nd d v lopin c nt nt.
b 200 (H
plotting tr t
"i re 3. : om ro 1h of rious ommuni ti n M
" (2000)
A can b in Ii ure .
Int m t
lin • it
r n
in futur
il i n
f th Intern
r mph iz d
Iii in

45
GE Global eXchange Services, the biggest of its kind in the world, sees it as
follows:
• Plan
Accurate demand forecasting
Real-time collaboration to drive quality improvements and lower cost
Reduce global risk andexposure
• BuyAccurate procurement process
Effective supplier management
• MakeReal-time integration withbusiness applications intralinter company
• Move
Fastercustoms clearance
Management ofinterlintra-company inventory to drive efficiencies in
planning and distribution
Timely integrated view ofproduct movement
• SellAbility to integrate with Customer's demand data
Provide Customer's easy ordering (www.o).
3.8 SUMMARY
In this chapter the emphasis was to focus on the various marlceting models, to
show how their workings and processes can impact on the creation of a Brand
strength, the perceived Equity of a Brand. In line with the much broader
perspectives discussed in chapter 2, it looked at how the 4P and 4R models fit into
the Brand architecture. Also discussed, was Porter's Five Forces Model, and how
that can affect Brand strategies. It also suggested here that Infonnation
Technology can revolutionize the way industrial marketing is taking place, and it
was briefly looked atagain at the end ofthechapter.

46
As the research is about how the buyer will react to the Brand in an industrial
purchase situation, the chapter would not have been complete without looking at
organizational buying behaviour. The traditional thinking of the Seth model was
looked at. and then it was pointed out. that due to the many roles people live out
today. they must inevitably have subjective views/perceptions of the Brand.
Research also pointed out that more decisions arc taken by individuals than what
would generally be expected. supporting the need for a powerful Brand. Key
innuencers in Industrial procurement was listed. noted and discussed.
Without all of this background. no meaningful survey canbe done. and neither can
proper. valid recommendations be madeasto the future direction that a company
must take.
This concludes the theory on how to build a strong Brand. It needs correct
positioning, creating a personality for the Brand. support through relationship
marketing strategies. use of all channels of communication possible to
communicate this Brand proposition, and 360 degree Branding, toall customers.
In the next chapter, the South African Lubricants market will be dealt with, its
players. Brands. market size and competitive activities.

7
P R4
TU o H RI R T D
4.1 Til ' 1M OF II II
III th ov rvi w in eh pt ron , it w . t t d th t thi. r . rch i to have pr ti
appli tion , n m Iy to sist RP uth frica to r w m r • thr u h th
stren th ning of th Br lid. rch w uld not b c mpl t if th
mark t in uth Afrie is 1I0t COy rd .
The form t of thi ch pt r i not ing to follow th tr dition I W
approach. It i r th r going to 1 rt with a br d v rvi w of th
mark t, th n narrow it down t th uth African m rk t, m rk t iz
har . A hort ov rvi w of ch of th major play r will b given, with r I v nt
trat gi wh r it i d m d t ting and h Ipful. Oth r nvironm nt I
influ nc will b dealt with on basi .
Th chapt r clo with a short umm
4.2 L DRI
CountryLu o m nd _ Propo on 0'I Alrtn 0 m nd
Fi re 4.I: Lu . nl mand in fri . : \ \.p

48
The African consumption of lubricants accounts for approximately five percent of
the total world demand ofabout 37 million tons per annum. While there has been a
general world-wide decline in the demand for lubricants during the 1990's, the rate
ofdecline in African demand has been somewhat slower and Africa's share of the
world market has shown marginal increase over the period (figure 4.1).
The market covers automotive, industrial, marine and aviation lubricants. The
demand for industrial lubricants is driven primarily by the major industry sectors
which include the petroleum industry, mining, agriculture and industrial
manufacturing and processing, where present. Lubricants markets are generally less
impacted by thecontrols and regulations which are often applied to fuels products
in Africa.
Africa lube oil demand is some 8 million barrels per year of which 18% is
consumed in South Africa (Figure 4.1). The sector split for Mrica is industrial
(36%), marine (4%), aviation (10/0), cars (31%) and trucks and buses (28%)
(www.p).
4.3THE SOUTH AFRICAN LUBRICANTS INDUSTRY
Mbendi (www.q), gives a very good summary and they supplied the information
used below.
The South African lubricants market demand is approximately two million barrels
per year which accounts for a fifth of the African continent's lubricants
consumption and about one percent of the world consumption. The market covers
the full spectrum of applications for lubricants and greases, including industrial
(49%), marine (7%), aviation (1%), cars (22%) and trucks and buses (21%). Also
used arc various process oils such as those which find application in printing ink
and tyre manufacture. The range of products includes mineral based lubricants, and
various combinations of synthetic lubricants, although these comprise a small
proportion ofthe overall products demand.

49
The marketers of lubricants include the local affiliates of multinational oil majors,
South African based oil companies, the synthetic fuels producers, local affiliates of
international lubricant companies, specialist lubricants ruche marketers and jobbers.
Mobil re-established a South African lube presence in 1997 and has quickly
established itselfas a force in the market, particularly with itshighly rated synthetic
lubricants. (Mobil also follows the politically correct policy ofdistributing through
joint venture partnerships with Black Economic Empowennent Groups)
(Reynolds, 2000). The oil companies which market lubricants include BP, Caltex,
Engen (whose recently acquired agency for Esso lubes could be thwarted by the
Exxon-Mobil merger), Shell, Total and Zenex.
These companies market lubricants through their service station forecourts,
through supermarkets, wholesalers, spares outlets and workshops, through
commercial channels and by direct customer sales. Sasol has more recently entered
the market, deriving part of its technology through its shareholding in the Europe
based, Carl Bechem. Smaller market share oil players include specialist CPI
Engineering, Exel (BEE), which market Mobil Lubricants on its forecourts, Agip
and Petromin. Castrol, as a specialist lubricants marketer has an important position
in the South African lubricants industry holding close to a seventh ofthe market.
Other companies include Chemica, Dimol, Fuchs, Flexilubc, Germ Lubricants,
Highveld Petroleum, Kluber Lubrication, Cera (Shell Lubricants Plus), Pennzoil
and Chemrite Lubricants (www.q).
4J.1 Lubricants Manufacture
Base oil refining is carried out at two refineries located in Durban. These are the
Samco base oil refinery which is jointly owned by BP and Shell and the Safor base
oil refinery which is owned by Engen Petroleum, Caltex and Total. The Samco
base oil refinery is one of the largest in Africa with a capacity of 175,000 mega
litres (15S thOU51U1d tonnes) per annum. Sarnco is downstream of the Sapreffuels
refinery. Safor, which is downstream of Engen's refinery, haJ a capacity of
165,000 megaIitres (145 thousand tonnes) per annum. Despite having two base oil

refineries. South Africa tends to be short ofbase oils and imports ofvarious base
oil grades are made (www.q).
Reynolds (2000), the product manager from BP. explains that UP previously
supplied Castrol as a customer with base oils. With the merger, Castrol will take up
any spare capacity BP had. with a resultant cost advantage. This will lead to
margin benefits for the new organization and put pressure on the small
independents to source base oil, as they will have to import, and with current high
international crude oil prices and the substantial deterioration of the country's
exchange rate, this is going to put them at a severe cost disadvantage. Also
imported are a range ofsynthetic base stocks, although the market demand for
these products is not as high as in Europe and elsewhere. Mobil South Africa is
one of the leaders in this high technology field.
South Africa has substantial lubricant blending capacity, with eleven blending
plants of various capacities, and with four grease plants. Engen owns a blending
plant in Durban as well as an unused facility located near Johannesburg at its
subsidiary. Chemico (www.q).
Shell and BPjointly own a blending facility, Blendcor, which is located in Durban.
Shell also owns a plant by thename of Veetech (now Unico) inDurban and a small
plant in Johannesburg, Cera, which fllls thefighting Brand.Honeylube (www.q).
Other companies with their own blending plants in Durban include CaJtex, Castrol,
Total and Fuchs. Zenex, Sasol and Agip share a blending plant which is located at
the Zenex facility in Durban. Flexilube has a blending facility in Johannesburg
(IDnM).
The available lubricant blending capacity in South Africa currently exceeds the
local market demand for lubricants (www.q).
Engen Petroleum has a grease facility with two trains located at Chemico, its
subsidiary company. near Johannesburg. Shell and BP share a grease plant in

Durban. and Dimol has asmall grease plant near Johannesburg. Caltex has a grease
blending plant and petrolatum blending facility at its site in Island View. Durban
(www.q).
4.3.2 Distribution and Logistics
In South Africa. lubricants are marketed and distributed in a range of bulk and
packaged forms. These include road tankers, bulk Iso-tainers, mini-tainers,
maxipacs, 210It. drums and numerous small pack sizes. Distribution is done either
direct to the end user or through company depot and distribution networks.
Logistics and cost control management are very neglected functions in the
lubricants supply stream, and leaves much space for improvement.
Some companies recently startedusing specialist logistics companies, like Tongaat
Food Distributors, who have superb computers and logistics support systems to
distribute to the High Street market. Unfortunately. due to outdated systems. an
integrated category management approach for this very important market segment
is not yet possible. As will be seen later, Castrol dominates this market, and
category management principles will necessarily have to follow.
Direct product profitability measures are not in place. possibly leading to incorrect
allocation of costs and hiding inefficiencies and non-profitable operations and
products. For various reasons. filling and repacking has also been outsourced to a
number of small companies. This further increases costs and complicates logistics.
as well as cost allocation and measurement. No proper use of existing distribution
channels are made to distribute related products, like detergents and car care
(Reynolds, 2000).

,3.3 'I h ulomoli e Lubri nt I du l
Fi ture 4.2: Comm ial
from l Ot
v r thi p .riod. n th
2 fi ur . Thi h, v
lubricant i d ri d
r J growth
d m nd for autom ti
hid in u
th annu I
is d
contr it t ok almo t 15
important impli tion , th
d emand, i.
t 01 int inin
n th 01 r t for nd
II th tim . it
ith th
n t
hrin rin .
in hi hl i ht th
v hi Ith P
h nd v hi I
b f ir to
h uld
c n qu n
mp n I m r t h r in hrin in
f r it pr fit bilit . p m ti ppr
m r t , it c uld h
h nd
ir
nd i
bl 4.1 h \ th utornoti m r t lum f r th I t num r

Table4.1: Aulcmotivc Lubricant Sales Volwnct 1994 to 199tl: Soum: Lubrizol Survey
SIIOI ITotll Roported I
1~ 1995 1aH '"7 18981 AUTOMOTIVE OILS
1AENGINE KiloQll.§ It.SE/CC • MULTI 166 110 1006 351 0SF/CC • MULTI 7542 6280 6068 5451 5994SF/CO • MULTI 8577 9999 9836 694 695SF/CE • MULTI 5588 4993 4934 996 727SGlCCorCD • MULTI 10954 10675 8123 10318 9314SGICE • MULTI 835 991 237 165 115SGlCF4 • MULTI 10310 13084 12873 11712 13117SHICO • MULTI 3907 5781 9396 9305 11371SJ/CF • MULTI 1906 4555CG-4 Min - MULTI 0 0 1115 5878 8138HPOO - MULTI 3927 5077 8217 8536 8510
(SHPDCD+)PART-SYNTHETIC MULTI m 964 951 540 529FULL-SYNTHETIC MULTI 133 82 95 97 172
SUBTOTAL 52716 58016 62851 55947 63237
SCICC • MONO 2645 2006 1322 1141 1057SE/CC • MONO 1542 1291 1111 1370 1151SF/CC • MONO 39258 42097 40474 40455 35029SE/CD • MONO 24 164 164 1890 2005SF/CO/CE • MONO 45027 43019 43019 32383 29735SGICc/CD • MONO 1579 1335 1335 1671 2402CD • MONO 6013 8478 6478 9503 8188HPOO -MONO 1547 651 651 479 528
(SHPOCD+)SUBTOTAL 97635 97041 94554 88892 80095
TAlTB 411 306 230 170 84
TC 450 726 766 865 912NMMATC-W 270 96 95 95 102NMMATC-W 264 308 384 432 391IINMMATC-W 0 5 5 7 153Synthetic Two- 15 17 20 24 28StrokeMotor Cyclefour ,trek. 8 1 2 8 5Other : (1) 14 15 16 11 24
(2) 78 2 87 113 2(3) 0 0 0 0 0
SUBTOTAl 1511 1476 1615 1n5 1563
1AENGINE TOTAl(kl) 151862 156333 158378 14656<4 144895OILS
JPOWOILS (Kilo l.it.,,)
GL·l 130
1
123 146 103 84

GEAR OILS 18N 1895 1He 1897 1898CONTINUEDGL·3 8 7 0 0 1GL-4 2541 3437 3679 3798 3886
GL·5 (Mono-75W.8OW.90) 3988 2240 2067 1981 1501GL·5 Multi (8) 75W90 0 0 14 22 76
(b) 80W90 5052 6635 6995 6303 5601(c) 80W140 104 17 17 9 7(d) 85W90 324 328 360 341 337(e) 85W140 1102 1393 2222 1810 1743
GL-6 3 3 2 2 1Other: (1) Borated 673 727 700 684 534
(2) Limited 64 77 118 123 121Slip (Minerai)(3) Synthetic 61 91 99 98 103(4) others 448 25 43 31 12
lBGEAR OILS TOTAL (kl) 14498 15103 16462 15305 14007
lit (KJIo Liters)TRANSMISSIONW
AUTOMATIC TRANSMISSIONFLUIDS (ATF'S)
(I) DEXRON(R)- 6106 6665 6497 6524 6714110 Type
(II) DEXRON-IIE 6 2 3 2 87(III) TYPE F&G 690 813 654 519 453
(FORD)(Iv) TYPE C3 ONLY 65 24 24 16 10
(EXCLUDING ENGINEOILS)
(v) ALLISON C-4 (EXCLUDING 9 207 224 185 0ENGINE OILS)
(vi) TYPE A 251 249 167 145 120SUFFIX A
(vii) TASA/C3 459 529 494 412 370(viII) CATT0-4 749 1937 3190 3063 3238(Ix) OTHER ATF'S 25 28 34 n 134
SUBTOTAL 8360 10454 11287 10943 11126
TRACTOR TRANSMiSSION 3221 3092 3232 3074 2704OILS (UTTO)TRACTOR UNIVERSAL OILS 10551 10716 12083 11846 11532(STOU)OTHER UNIVERSAL OILSE.G.TRACKLESS MINING 3 48 56 148 nOILSlCONSTRUCTlON PLANT OILS1C TRANSMISSION OILS TOTAL(kl) 22135 24310 26658 25809 25439
1AUTOMOTIVE OILS TOTAl (kl) 188-495 195948 201499 187678 184341
The table supports the trend indicated (figures 4.2 and 4.4), that of an overall
decline in volume. It does however, also offer opportunities for astute marketers.
The individual market share of the major players is next to be analyzed..

AJ./f'o.., m,.
-..........._---
,Iod
", d
- r-------------.::.:::.~:.....::.:.:.:.::.:.:-------------,-/
/
Ith II h d ir, in
m . h Win n
r I
trol mm \ on d min t th m r t Thi n

thinking about the High Street, or Retail Market, as it is also called. In OP,
workshops fonn part of this market segment. Together the two fonn a powerful
force, opening new avenues for penetrating this market channel, and maximizing
sales and profitability from it.
In a Market survey, undertaken by e~aRO market intelligence resource group in
July 1999, where 1990 interviews were conducted with workshops in South
Africa, the following was found:
• 46% of the workshops were linked to a branded service station
• 60.7% service between I and 10 cars a day
• Castrol emerges as the market leader with 28.6%, followed by Shell (14.8%)
and BP (13.4%)
• 83.8% of respondents were either extremely or very satisfied with their major
lubricant Brand
• Castrol owns the largest amount ofdispensing equipment in the field (37.2%)
• Alarge percentage (32%) havetheir lubricants supplied in S litre containers
• 39.3% had supply contracts, with 77.6% ofthese unlikely to look for alternative
suppliers at thecontract renewal stage
• Car washing isa standard part of the service offer for 91 %
In the summary it said that there is no doubt that inertia exists among the customer
base who seem to be happy to let their respective status quo continue. This,
according to them, creates a major opportunity for aggressive promotion and
selling approaches where the company that takes the lead, could create excitement
and take market share. Mobil is deemed to work hard to gain market share, and
their effort is felt byboth customers and the industry.
The viability of Castrol's investment in dispensing equipment merits discussion.
Rexha (1998), sees this asarequirement ofrclationship management. He says that
in order to satisfy a customer in a business-to-business situation, the supplier often

has to make significant tangible and intangible investments, defined as relationship
specific investments (RSI's). RSI's are expected to develop a close and long-term
buyer-seller relationship with the focal customer. This fonn of non-retrievable
investment, which creates exit barriers for the supplier, are intended to increase
customer trust and strengthen its commitment. The reward continually increases
the supplier's interest in adapting its offering to specific needs of the focal
customer through RSl's. Supplier RSI's also have a positive effect on customer's
satisfaction (Rexha and Miyamoto, 1997).
This strategy certainly seems to have worked for Castrol, although there seems to
be an anomaly between the amount of equipment they own and actual market
share. This could be as a result of having a lot of the smaller accounts, or
alternatively, asanindication that even the supply of equipment can sometimes not
prevent a customer from switching Brands.
Similarly, Shell also realized the need to add additional value in order to cement
relationships. They introduced the concept of Predictive Oil Analysis (www.s).
Predictive oil analysis is an accurate way of providing operators of lubricated
equipment, be it a fleet of trucks or industrial plant, with information about the
condition of machinery, giving fair warning about potential problems which may
cost time and money ifnot attended to. Oil is tested at presceduled times, and any
wear ofequipment noted, reported and repaired before actual breakdowns occur.
Initiatives like these can only add substantial value to the Brand.
4.3.4 Comparative lleavy Duty Diesel (1100) Brandl
Although this paper gives ageneral overview ofthe lubricants market. it is specific
to the hcavy duty diesel oil products. HOD oils are lubricants formulated for usc
specifically in large, diesel powered, internal combustion eegines, It is these
products that will beincluded in the market survey questionnaire. The table below
(Table 4.2) lists all the comparable to the BPVanellus Brand.

Li • to eep Y II 1 III
thr u h vc th -IiI
hi h III lit
ld ind
Ifin t 1Ill , \ ho III i rst 1I1d .
ir. 'Ih industri II br ind , in ludin
prom
m r: r h ndl d thr 1I h
1I1e1 I
ti n w
re ult. 01'
Kn -hr riven, r n,
IJl and
a. Perform n
).
mpar bl Br nd . Publi lion

nd
p
\ ith th ir Fu 1m st r
1111 i. a
rat d luti II ' . Th f t tit t the It v irtu II
in tit ff rno highw
offer, Thi fr. ud pr vention : t
BP i In th pro t bli. hin Int m I it
\ ww.bplubri nt .c 111 OP int rru J pu Ii tion
A n th n t

hi ,hIn th B nd
not h in its \ n for urt 10 III r ' I it
I tr I II lit ir f I' urt
involv'd in rn t I' port nd 11l tor
i ibilit
, 11'01 uff I' d th di dv nt
motor oil , bUI h ' an arr:n rn .nt
B us f d rnrnd, quit a numb r r lit 'I' br IfIlJ d r urt II til pr du t
fromund 'r I h unt ' f'
. n I ' I pr vid f r n r I int I' tivit n lit
III the Brand I st IOd f r: IIi h P ' I f I'm III • " PI' nnium U ilit ,
WW.I) .T 111101
If the two ultur an b mad' I fit, this will be I ' d acqui: ilion for Bl' .

eE \ ith ,
P 'I ,j" -d I be l it ' pri utters in tit lubri III III 1k 't . En ' II h , III n links
l it t th ir Oil U in 'I It hn I
OWII d b P tron IS from n
n th /ll I ) th ' /ll
II th ,j l • sit the ofler trip r li t pi IIIII I , rncr
Ii msc b
custom r.
• III ikin '0 11I' ,11' r1 t irds buildin I r I tiornhip \ ith th ir
u t III n au t 10 ull luti n d Ii tit i
particul r n d .
Engen h d
rna b
I mark ' I h r In Aut
nin th bi
how r, n t upp n th ir mm r ( r nd with tr n Ad rti. in
(OV , thin \ II \ 'ith h II
fl d ' . n-t f
h. with ut u t tr III nd u
mp n in lit w rid, th hil l n
uit J. ir I ilh th
urit h
I hnol nd dditi uppli r: in t l \ rid, nd r uppli r 10 J' ri

0' h ab th ' in , but do n
h inu '] r d Publi
upp rt th ir nun ial
do ' tur III r
mana rn mt, nd trainin and de I pm nt nd d aler ( w
in lud d, if f r n th 'r r 'on th n th ful m,
IUH!\ camp i n I min the p: c uplc th Ir
hurnorou 0
Ill, in tr
n. th gOY mm nt, nd m
important r I tn utur . uch, it h hu
nit m mm nt t nd r (\
... . .e , ~
AIt ' .
FI U
.,
Hp tn·h J

'Ihe matri: II V' indi ues Jres lit I
the \ uld lik to be in lit' future \ ith the C ist r
Br lid hould u 't them rh 'r ' \ ith I eluti '
10 ition
4.4 1Alt K ET .' .:(;1\1 1<: TATIO
Th 1II0st d . irablc III Ilk 'I s m ' Il l s. I rdinu I d urn III
prepar ' I ill , and lit -i r " limat I lume Ii ures in mill ion Iii 'r I ' f 1II1lU Ill
Ire:
Tabl 4.2: alum p r - tor. iur ' : IlP itratc urn mt, I
Secta VdllTeMnoo 45Walufa:tuioo 40R€tcil Sef\1ce 9ciioos 40rv'etals en:! Fcurlies :IJ.
25I V \Ul 1\.:)/ U.J::l
Pari ad Olerrica 20Farnm 17HahSrea 15Tra~l 15Tvresad RLtber 15
Ith II h th II lum , it rn k tit m n tiv • th
III n 11 pr id pr
r quir d indu tri r-r III ntl tit r ju t n t
lubri nt r t th intr III ti 11 0 the I thi
h uld b tiv

4.5 E......ICIENT CONSUMER RI-:SPONS.:
Efficient consumer response(ECR) is the latest development in the management of
products to market. ECR was initiated in the United States during 1992 and has
rapidly expanded into a global movement of the consumer goods industry. Today
there arc national and international ECR programs in Europe, Asia, Australia,
Canada, South America, and it has just started in South Africa
(PricewaterhouscCoopers, 1999: !2).
PriccwaterhouscCoopers (1999: 13), has conducted research in South Africa, and
the company sees the process as centering around three primary focus areas:
• Demand side, with four detailed improvement concepts: Strategies and
Capabilities, Optimize Introductions, Optimize Assortments, Optimize
Promotions
• Supply side, with six detailed improvement concepts: Integrated Suppliers,
Synchronized Production, Continuous Replenishment, Automated Ordering,
Reliable Operations and Cross Docking
• Enabling Technologies, with four detailed improvement concepts: Electronic
Data Interchange (EDt), Electronic Funds Transfer (EFT), Item Coding and
Data Base Management, and Activity Based Costing (ABC).
Individually theseconcepts are commonly known and well documented methods of
improving effectiveness and efficiency. However, when applied under ECR, they
have four distinct differences:
• an integrated approach;
• focused on customers;
• across demand and supply; and
• across the entire supply chain.

Category Management was the scientific tracking of sales through the supply
chain, maximizing returns through the best possible presentation and promotion of
a focused, sales driven range of products. ECR takes this to the next level,
offering a totally integrated solution, initiated by the final user ofthe product.
4.6 SlJMMAUV
In this chapter an overview of the lubricants market in Africa and South Africa
was given. All the major players were briefly discussed, their manufacturing and
blending capabilities pointed out and a few of their potential strengths and
weaknesses highlighted. Through the use of a comprehensive table, the size of the
automotive lubricants market and its make-up was clearly demonstrated.
Distribution and the availability of the product can severely harm the sales and
image of a Brand, and forthis reason it was covered again.
The Brand names that arc used in the survey questionnaire were shown in table
format, and a shortdescription of the major Banner Brands was given. The major
product Brands were then plotted on a positioning matrix. The market segments
with thebiggest potential were shown.
In closing, Efficient Consumer Response wasbriefly discussed. This becomes very
important when the High Street becomes a major customer, as category
management principles and an efficient supply stream, supported by the correct
technology, is vital in this market. Over and above substantial logistical savings, it
cements relationships and is a critical ingredient for the successful conduct of E
commerce.
This concludes the literature review section. In these three chapters. all the factors
that can influence a company's Brand building strategies, have becn analyzed and
discussed, particularly in the light of the latest thinking about Brand architecture
and Brand chartering. These concepts postulate that Brand image and Brand equity

are no longer dependent upon product attributes, but span a much larger field,
namely corporate values, attitudes, behaviours, customer relationship management,
realized performance, credibility and personality. In the survey, through conjoint
value analysis, the importance of each factor will be identified through the utility
score allocated to it,
67
CI-IAPTER 5
THE RESEARCH DESIGN
5.1 TilE AIM OF rue CIIAPTER
The aim of this chapter is to describe the field research methodology and how the
data was collected and analyzed.
The difference between a qualitative and quantitative research paradigm will be
discussed briefly. The findings of a previous qualitative research project will be
summarized before new research requirements are discussed. Then follows a
section on the questionnaire design, sample design and hypotheses testing.
The selected method ofresearch will then be discussed in depth.
5.2 QUALITATIVE AND QUANTITATIVE RESEARCH PARADIGMS
According to Burgess (1985: 97), at the most basic level, qualitative and
quantitative approaches are sets of different research techniques, each with their
own advantages and limitations.
Qualitative researchers nrc interested in knowing how things occur. Meanings and
interpretations arc negotiated with human data resources because it is the subject' 5
realities that the researcher tries to reconstruct. Objectivity and truthfulness are
critical because the researcher seeks credibility, which is based on coherence,
insight and instrumental utility (Creswell, 1994: 162).
The quantitative research paradigm makes usc of deductive methods where
theories and hypotheses are chosen before the study begins Quantitative studies
are carefully worked out procedures where rules for research exist. Collection and
analysis of data involves a shorter period of time than that required in qualitative

68
designs. Quantitative research is impersonal and experimental; it is therefore not
suitable to study human phenomena (Creswell, 1994: 7 - 8).
Quantitative research is a formal, objective, systematic process in which numerical
data is utilized to obtain intormation about a specified universe (Burns and Grove
cited by Cormack, 1991: 140).
Burns and Grove (1993), mention four types of quantitative research. These are :
descriptive, quasi-experimental, experimental and correlational. Experimental and
quasi-experimental studies are designed to examine cause and effect. They are
conducted to examine thedifferences in dependent variables thought to be caused
by independent variables. Descriptive and correlational studies examine variables in
their natural environments and do not include researcher imposed treatments.
A brief consideration of the major distinctions between the two types of research
ean help put quantitative research into context. Both designs are said to be
systematic. Having a system or following a process is a defining principle of
research.
Quantitative research is thought to be objective, whereas qualitative research often
involves a subjective clement. In gathering, analyzing and interpreting quantitative
data, the researcher can remain detached and objective. Often this is not possible
with qualitative research where the researcher may actually be involved in the
situation of the research. Quantitative research is inclined to be deductive, in other
words, it tests theory. This is in contrast to most qualitative research which tcnds
to be inductive, inother words, it generates theory.
Quantitative designs of research tcnd to produce results that can be generalized,
whilst qualitative studies tend to produce results that are less easy to generalize.
Feelings can change, depending on the particular sct of circumstances. Even if the
researcher encountered the same set of respondents on another day, different
results may be found ifqualitative research isused.

---------------------- - ------
69
Lastly, the most obvious difference between the two is that quantitative research
uses data that are structured in the form of numbers or that can be immediately
transported into numbers (www.y), while qualitative results cannot bequantified or
extrapolated to theuniverse under observation.
5.3 PREVIOUS Rt:St:ARCIi AND NEW IU:SEARCII REQUlRt:MENTS
In 1999 Strategic Marketing Services (Ply) Limited (SMS), conducted qualitative
research in South Africa, Tanzania and Mozambique, The objectives of the study
were:
• Toconduct a reality check on the current understanding of customer needs and
behaviours when purchasing heavy duty diesel oil.
• To check current Brand awareness levels ofVanellus (a brand ofdiesel oil) on a
qualitative basis.
• Tounderstand the brand equity of Vanellus against competitive brands.
• Totest proposed brand positioning concepts.
In South Africa, twelve in-depth interviews with important decision makers werc
conducted, six were conducted in Mozambique, and in Tanzania, one focus group
was conducted. Some of the main highlightsofthe findings are reflected below.
Price and serviceare two chiefunderlying motivators in selection of a supplier of
diesel oil. The components of 'service' comprise not only aspects such as delivery
and accessibility, but (perhaps more importantly) 'customer care' • a readiness to
assist whenever necessary, keeping customers up to date with new developments
and developing strong interpersonal relationships. Since products of the different
oil companies arc all seen to be similar (in other words, a "parity" market) and
price isalwaysopento negotiation, this aspect ofservice is the one area which can
be used to differentiate a supplier of heavy duty diesel oil and create customer
loyalty (C~fiRO :1999).

70
In contrast to diesel oil users in some other countries, South African customers did
not articulate any specific emotional needs. It was pointed out. however, that the
chief selection criteria all contribute to the ultimate efficacy of the customer's own
business, and thus the primary need is to feel secure with these aspects of service
(C~Ill((J :1999).
Customers are more aware of oil Brands within their main Brand, than within other
brands. There is little intrinsic differentiation between Brands. Brand positioning is
rather influenced by the corporate image of the supplier. South African purchasers
of diesel oil at the level of large companies are generally not able to verbalize
intrinsic associations used to position oil companies (C~URO :1999).
Two problems arose out ofthis research:
• The first one is that due to the qualitative nature and the associated small
sample, the findings arc not statistically significant.
• Secondly, it appears to contradict the reality that certain Brands docommand a
premium price in the market, and the research did not indicate exactly what
gave these Brands the competitive advantage.
It became evident that further research would have to be conducted. but this time
more 'relationship type variables' would be included in the research. TIle findings
also had to be statistically significant and allocate levels of importance to the
various attributes that would build a successful Brand.
BP has a good range of products and the Brand has very high credibility and
Brand equity globally. It is therefore important to determine the reason for this
decline in sales.
A brief to market research companies was done and four market research
companies were each asked to submit 8 research proposal. In line with our problem

71
statement in 1.2, they had to establish the strength of the Brand and its importance
to the customer and determine the reasons for the loss of volume sales of the
Vanellus Brand. The research companies had to identify ways and means to
improve the Brand proposition in order to attract more customer loyalty, enhance
its Brand equity and increase sales and market share.
Research International won the contract. They summarized the problem as foIlows:
The marketing challenges facing the Vanellus range are numerous and complex. It
is proposed that a complete marketing mix benchmark analysis be conducted for
the Vanellus range. This will incorporate product assessment, pricing comparisons,
distribution issues and promotional awareness. This marketing mix analysis will
provide detailed infonnation regarding the current state of the Brand, which can be
used both for diagnosis of the current position, as well as a benchmark
measurement that can be tracked over time. This component of the study will
identify the reasons behind the decline in volume of Vanellus.
Furthermore, the research must uncover the motivation behind the purchase of
diesel engine oil ingeneral, the role that various factors playin the decision making
process; and critically assess pricing and the factors which inhibit and contribute to
Brands being able to charge premiums.
Methodology: It was proposed that face-to-face interviews be conducted with
dccisionmakerslinOuencers to collect the required information. This would be
necessary due to the use of prompt material, particularly for the conjoint value
analysis (eVA) that would be used.
The questionnaire will take the following fonn (Sec the cn ROM in Annexure G
for the fuIl document):
Section I: Filter questions to ensure the correct respondent is selected, testing
brand and advertising awareness, brand usage, reasons for changes in brand (if
any), and the decision making process.

72
Section 2: Requirements from diesel engine oils, importance of all the attributes
and the performance ofeach Brand against these requirements.
Section 3: An image battery to identify the position that each brand holds.
Section 4: A eVA including the following elements to be traded-off against each
other:
• Brand level
• Technical Specifications
• Support and theCompany
• Price
Macro level elements like price and technical performance can be identified, but
one can also understand the ability of the specific attributes thatcan contribute to a
price premium.
• The model is constructed at the level of Brands. Different attributes will have
different utilities and various levels. A powerful tool is the ability to create a
hypothetical Brand, based on selected attributes, which determine what would
happen to its utility ifthe levels were altered.
• The output also generates a goodness of fit measure, which indicates the degree
ofinternal consistency amongst respondent's choices.
• The image analysis will provide insight into the potential positioning of
VaneUus, and in conjunction with the CVA and needs analysis, a strategic
marketing plan can be established, designed to optimize the relaunch of the
Brand (Research Proposal; Project Shuttle 2000/322).
5.4 SAMPLE nfo:SIGN
From a customer list, BP could identify current customers, lapsed customers and
customers where there has been a significant change in volumes. Bearing in mind
the purpose of the research, it was decided to design the sample 8lI follows:

7
Tabl ~ . I · ampl IIr al \\ II, I r I hUIII ur It .1 h lru mali /IJI
USERS (100) lAPSEDUSERS (76) NON·USeRS (75) TOTAL
CATEGORIES llllOe Meld Srnll q Laroe M. d Small l .arDO Me\lAREAJoI 1 7 32 5 7 18 10 10 IPrelorl:i 0 ~ 6 0 0 12 8 10Durban '} 1 ~ 1 -L. 0 9 10 ,CapoTown 0 2""'~ 1 4 ---n- 8 10 77Sf GMENTS
1-Long & . hort hlIul - - 20 26
I tnlnlPOlI -Buses " 4AgrlcUnurnJ co- ol 3OllOfllUvcaRC$Cllino - - 4Con$lructlon & 4 3mlnlllllTolal 3 12 I II 7 18 112 35 40 21lO
1Il11 'I' U. pI' ti I pI' bl Ill . \ r in urred \ h m makin up the mpl .
lnsuff i nu I I' U ' I" uld b Ii und fr III the BP ust III ' I' Ii. I, and thi lit n
off ct b mall U I' in th lion, in ord I' to III k lit
ur
ult • I lit I'
allo t d quota . A. an b . cn rr\ 'I' not I a il blc, nd \ ill b
\ ith a h rt di U ion on pI' I m in urr d and
r Ih \ h I
It i. nti U. I' I p d u r. n n-u I' 0
m nt, I it 0 I I' I,
kcv th ut 111 I th rc. I' h

74
5.5 RELIABILITY AND VALIDITY
The University of Washington Faculty for Research (www.z), describes these
concepts as follows:
• Reliability means that the test, model, or measurement is consistent. One
example of reliability is the SAT (standardized application test); one assumes it
measures each person the same way.
Fortunecity (www.y: 12-13) describes the same concept as follows:
• Reliability is concerned with the accuracy (consistency, stability and
repeatability) of a measure in representing the true score of the subject being
assessed on a particular dimension. The same results must be achieved as far as
possible, regardless of whom is doing the measuring. Reliability of measurement
reduces influence or bias on the part of the person(s) doing the measurement to
a minimum.
• Validity refers to whether a particular instrument actually measures the
construct it is designed to assess. Internal validity is the extent to which the
effects detected in a study are a true reflection of what is real. External validity
is the extent to which study findings can be generalized beyond the sample used
in the study (Burns and Grove, 1993).
• Validity also means that the test, model or measurement represent what it is
supposed to. A valid measure accurately represents the relationship between
things. For example, if SAT's are valid, then they accurately predict how
successful 0 student will bein college. Face validity is oflen used to test whether
something makes sense to us. Face validity means that on the surface,
something appears to bean appropriate measure. As this is not a rigorous way
oflooking at things, care must be taken not to sec results out ofcontext. On the
other hand, there is construct validity, that is, it reflects an actual relationship

7S
that exists statistically. This form of validity seeks to find a high correlation
between the independent variable and thedependent variable.
• Another issue to consider is generalizability, also known as external validity.
Generalizability describes how far research findings apply outside research
settings. If in theresearch, the subject is exposed to extremes of any kind, how
far can one generalize the findings?
• Validity refers to whether a particular instrument actually measures the
construct it is designed to assess. Internal validity is the extent to which the
em..xts detected in a study arc a true reflection of what is real. External validity
is the extent to which study findings can be generalized beyond thesample used
in the study (Bums and Grove, 1993).
Great care was taken in both the sample design as well as questionnaire design that
the research complied with these requirements.
5.6QUESTIONNARE m:SIGN
Rich (2000), says that research design mustcomply with four characteristics.
There must be freedom from bias, that is, thedata and the statistics computed from
them do not varyinany systematic way.
Secondly, there must befreedom from confounding. Two variables areconfounded
when the effect of one can not be separated from theem.."Ct of the other.
The third characteristic is control of extraneous variables. lie says that many
variables affect the result ofa research project, beside the independent variablc(s)
The design must evaluate potential sources of variation and design procedures to
counter their effects
76
The fourth is statistical precision for testing the hypotheses. The data must have
enough precision so that the hypotheses can be tested with confidence. Where
statistical control of variance is used. the measures used must be applied at the
appropriate times, and must be appropriate to the construct being evaluated.
Within these parameters and the original research requirements, the questionnaire
was changed numerous times to meet all these conditions.
5.6.1 Thr Questionnaire
What follows below is a brief outline of the construct of the survey questionnaire.
All the questions were done in English and Afrikaans. the two main languages
spoken in the business world in South Africa, to ensure that both interviewer and
interviewee would be very clearon the meaning ofthe question (see: 73).
Page I covers all the required corpographics needed for future reference, as well as
the breakdown and classification according to sample requirements. It includes the
very first filters to ensure that companies contacted telephonically do in fact use
diesel oil. If affirmative. they are then classified according to segment for further
filtering. If not. the call is terminated (Sec questionnaire in Annexure G).
Then follows six filter questions which accurately sort and classify respondents into
the correct and required quotas. During this process. contact was made with
numerous potential customers currently not using the DP product. With consent
from the respondents, this infonnation will be forwarded to the sales teams as leads
for future business. Once the respondent had been adequately classified, and he/she
met the requirements, an appointment was made for a personal interview.
Questions one to three arc very basic and put the respondent at ease, dealing
simply with the sizeofthe company. location and number of outlets,
Question four deals specifically with who decides on what diesel oils to use and the
amount of control exercised over procurement.

77
Questions five to eleven deal very specifically with Brand and advertising tracking.
It measures recall and recognition. both spontaneous and prompted. This section
already gave the first indication as to how important Brand names are in the
Industry. Low recall will be a possible indicator of relatively low importance.
As one of the purposes of the research is to determine reasons for loss of sales of
HI) Vanellus, question 12 is an open ended question asking for reasons (ifany) why
the customer has changed brands in the last two years. The interviewer is
instructed to probe fully into the reasons. The outcome of these questions would
be particularly interesting for the seventy five lapsed BP users. but it is quite
possible that interesting data may surface from non-DP users who also changed
Brands in the last two years.
Question 13 deals with the link between fuel supply and lubricants supply.
Petroleum companies work on a fuelsllubricants ratio. For every Xamount of fuel,
the customer should use Yamount of lubricants. Normally it would be expected
that thesame supplier will supply both fuel and lubricants. If this is not the case, it
can bean indicator that the customer prefers another Brand of lubricants and buys
thefuel only on convenience or price. This may be another instance of face validity,
butit must not be taken for granted. For that reason, questions fourteen and fifteen
probe relationships between the customer and its supplier. This isvery important in
terms ofestablishing the relationship management part ofan offer.
Question sixteen tests the preferred way of managing contact. It gives an option
from traditional personal calls right up to e-mail and electronic data interchange. It
is necessary to know this. both in terms of knowing the preferred options, but also
in order to set up suitable one-on-one marketing campaigns and improving
customer relationship marketing, as explained in chapter three. Of particular
interest would be to determine how technologically advanced the customers arc
and how this affects their preferred ways ofordering and contact.
Question seventeen is the critical question as far as the make-up of the Brand is
concerned. It lists twenty-seven attributes that can build the Brand. Using sort

78
cards, the respondent is asked to select the 10 most important considerations
when deciding which engine oil to usc. It is important to note that these attributes
include all the variables discussed under the different models in chapter two, and
the outcome should be a fairly accurate validation of the model's accuracy or not.
lt covers relationships, the 4R model as well as some of the traditional 4P
marketing mix. Other parts of the 41> mix are handled in separate questions.
The ten considerations selected arc then further refined to the three most important
attributes. These are then linked to the Brands, by asking the respondent which
Brand(s) he/she perceives to comply with all these requirements, if any. Very
interesting deductions can be made on Brand strength from this, especially if the
preferred Brands differ from the Brand currently used. These attributes were also
used in the design of the Conjoint Value Analysis.
Question eighteen deals very specifically with Brands. It lists eleven Brand
statements, and the respondent is asked to match each statement to the Brand
he/she thinks it fits best. This is very valuable to determine perceptions of Brand
image.
Question nineteen deals with product packaging and presentation and aims to
identify specific preferences.
Question twenty deals with price and price perceptions, introducing a price band
twenty percent below and above OP's wholesale list price. It is also intended to
measure perceptions about Brands that are considered cheap and Brands that are
considered expensive.
This concludes the conventional questionnaire. From the depth and scope of the
questionnaire, it can now be seen why it was so important to go into the detail
described in chapters one and two as to fnctors exerting influence over Brand
perceptions. The survey questionnaire attempts to cover virtually all angles, except
maybe intangibles like psychological triggers.

79
5.6.2Conjoint Analysis
Many applications of conjoint analysis to academic and commercial market and
marketing research projects have been observed since the late 70s. A boost in the
use of the technique has been observed since the late 80's early 90's and it
coincides with the introduction of several computerized packages for designing the
survey, collecting and analysing the conjoint data (Wittink et aI., 1994).
The main application of the technique in the marketing field is related to new
product development projects, while market segmentation and pricing studies also
represent a considerable portion ofall conjoint analysis applications both in Europe
and in the U.S. (Cattin and Wittink, 1982; Wittink et al., 1994).
Three types of conjoint analysis are available, namely Adaptive Conjoint Analysis.
Choice-Based Conjoint and Conjoint Value Analysis, each with its own advantages
and benefits (www.bb). Conjoint Value Analysis was the method chosen and a
detailed explanation as to its workings is given in Annexure G.
5.6.2.1 Conjoint Analysis
Organizations undertaking quality programs invariably require feedback from the
customer base that changes initiated by management are impacting on customers.
At the same time, there is a continuous need to monitor customer expectations.
since it has been widely reponed that the growth of a service culture in many
industries itself leads to a growth in customer expectations of service quality
(Parasuraman et al., 1984).
Customers perceptions of service quality from suppliers arc likely to change more
rapidly than their own intrinsic needs. Consequently, a continuous tracking
program can concentrate on measuring these perceptions, and only update on
measuring needs at planned intervals (Buros and Blackall, 1992)

80
Conjoint analysis has proved over the years to be a very useful and reliable
research tool to organizational management, and its application in the area of
customer satisfaction represents a major enhancement of its appeal to both
researchers and marketing people alike (Page and Rosenbaum. 1987).
5.6.2.2 Project Shuttle eVA
The computer elicitation method was used to design the questionnaire. It is a self
completion document, consisting of forty questions. These questions consist of
combinations of attributes of different levels. The respondent is asked to indicate
ona scale of I to 9 whether he strongly prefers the combination on theleft (make a
cross in block I) or strongly prefer the combination on the right (make a cross in
block 9), or to indicate his preference somewhere on the scale, either a tendency
to the left. or a tendency towards the right.
Using these choices, the computer will decompose the data and allocate utility
values to all the attributes.
These utility values will beused to model potential new versions of Vanellus diesel
oil, positioning it in such a way that it will gain maximum acceptance in the
selected market segments.
5.7I1YPOTIIESIS TESTING
The Hypothesis to be tested is the following;
110: The Brand name is a significant criterion in the purchasing decision
H,: The Brand name is not a significant criterion in the purchasing decision.
This hypotheses will be tested using the Chi-square Goodness-of-fit test at the I~~
level of significance.

lJ f an • •111\pI II f . HI' 10 1IIp:1II' 1:l\ i u
.AJW All/ l l bl)w CU-U ~.WIJ Ll 1)W ....... 'VI Iblt>JW IlJ"~If' 11 ft) l1al 144 I 11 " 141 1~ ]I 10~rx :.u1ll ~ ~ 'J.1 a .1 41 .~ IQ:J 10. ll . le .: I'U}/ 11 0( 111 , .
'" 7J ~I );
fl l 19 4 .'-f : I 1 7; ~ ~lOIAl lltl ~ 141 , QI tO l II -----l~jj}o llC Q~ Q~ Q I I 11 I ..OIlIH (1:fJl\ ~'
.....J1l ll1d I(l) 1(.1) I{l)(I I 'UJU] IOJO.' KO(lJ !lOW /.1 z'o
. 111 III Ilk 'I hIf', it
ure I. I ).I1l1l11b 'r o f u. 'rs of th I1Il 'Or HI' ind (Table
of distributi II fr III th S mpl •
13 runrun number f r r nif nt rrel ti n
d termin d.
b IIPI rt r r i t th h P Ih . It
h uld h lidit
•. 8 Hi l I nY
r, I t ' ll d I th r th d I \
III , the r II r
lU ntit ti method in \ hi h l it
rt n l it
pr po. mpl , dr wn up lin I r Ih If. l ili d quot rnodclv di 1I I

82
Conjoint Value Analysis, the main tool to analyze the data, is discussed at length
and in great detail in Annexure F, and the expected results from the conventional
questionnaire and its meaning was also covered.
Lastly, the hypotheses and ways and means oftesting it was covered.
This concludes this section. In the next section the results of the survey will be
shown.

Kl
CI-IAPTER 6
DATA ANALYSIS AND INTERPRETATION
6.1 rue AIM OF THE CHAPTER
In this, the last section of the dissertation, the results of the field survey are
presented and analyzed, conclusions are drawn, and recommendations are made.
It must be emphasized that only data relevant to the hypotheses is reflected here.
The data collected in table form are in excess of two hundred and twenty pages
and it is impossible ( and unnecessary ) to try and represent all of it here, as our
main concern is about the value of the Brand name in decision making only. For
this reason, that is the only data that will be shown and discussed. For those who
dowant to see and investigate the data further, the questionnaire plus all the tables
as well as a PowcrPoint slide presentation is contained on the CD ROM
(Annexure G)
Inorder to facilitate the easy reading and understanding of the data, themajority of
it is reflected in figure format. All figures and tables arc followed with a more
comprehensive explanation and analysis of the data.
6.1 SAMPLE COMPOSITION
Table 6.1: SampIc Composition in Terms of Users. Source: Research International
Sample Composition
Segment Sample sizeUsers 1IILapsed Users 54Non-users 68Total 233

In . ti n the prop d m -u f th mpl 'Ih'r it \ S
pr p d th t th mpl mpri II n-u r
) u to I numb er of th wi th th
I .quir nn nts, n I rh .•imple, ith refl t d III
t ble6 I II \ S f'lI tha: it \ uld n t III ike I si nili nt diff I Jl in th ut n
of th result
h Int mati n;1I
1 bl 2' P
dUI di
nd r Ii bilit .
p r nu
th
I oil, nd
n l

c,n be n fr m the t bl .2, tit
rniker inte , th
tit • actual d I. Ion III kef in thIt bu in
v lidity and r Ii bili t nd n b • n id r d
, th • mpl ha vi i I
tit lInJV r .
n
6. Hit D I' IU
• Non-users : 4% mentionedV3nollusl BP Vanellus first
• Lapsed users: 13% mentionedVanellusl BP Vanollus first
• Users: 52%mentioned VanolluslBP Vnnellu l first
vanellus-""'-29r:::...:.: - ' 17RilTlJla~7
castrOI_ 7
Diesclube~8Delo.3
5.~
Rubia ~~
~Ivac ~1zenex f
• Brand I
l '~ Company name]
o 20 40 60%
80 100
ntion.
• j II 6.3:
\I : R h lnt man 11.,1
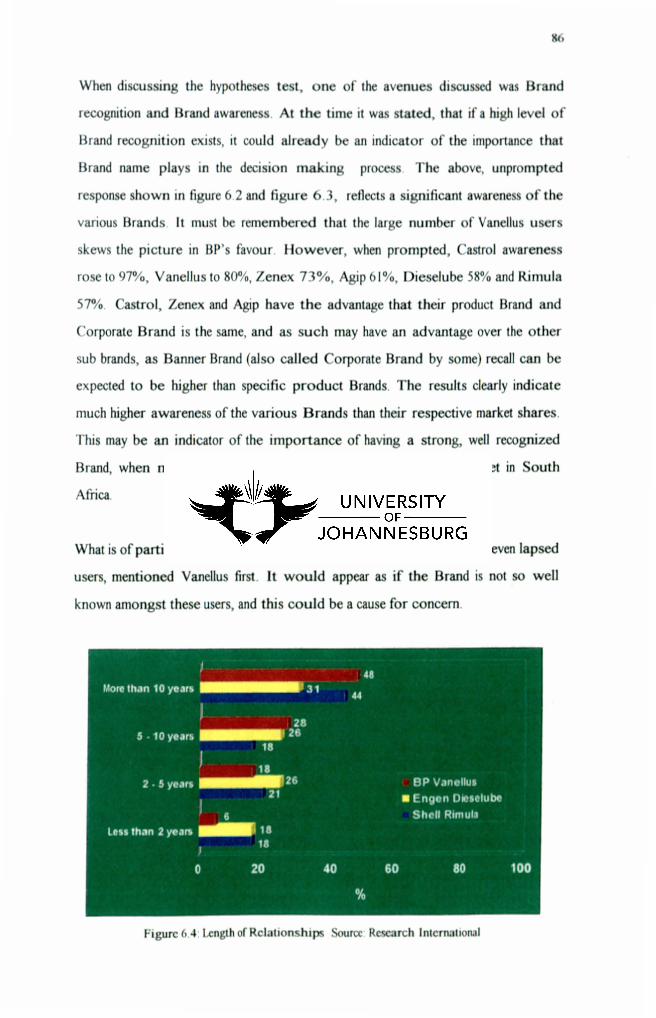
t, n f til ' v nu di u d w I r nd
t tl tim ' it wa
Brand r nition e i ts, it could ilr id b •
Br nd Il 111 pia
respons h w n in Ij ure 6.2 and fi ure
variou Brands . It must b rem rnber d
k ·w. th pictur in BP ' fav ur. IIow cvcr, wh n pr mpt d,
58% U1d Rimul
th t th ir pr du t Brand and
have an advanta e ov r th th r
ros to 97%, an 'lIus to 80%, Z ne: 7 0/0,
57%. ip h v
orporate Brand i the am , and a '
sub brand , a B nn r Orand (al
e: p ct d to b hi h r than p ifi pr
much high r awar n of the van u rand than th ir r
Thi rna b an indi tor of th imp rt n
Brand, wh n mar ting lubricant in th
Africa.
-bu in mark t in uth
hat i of particular cone m in f ur .2 i that 0 f n n-u r , and ven I p d
u ers, m nti n d an lIu fir l. It
known am n t th
uld appear if th Br nd i
. 8Morc lha n 10 year. 3 1 «
285 • 10yel1r1 26
18
182 ·5 yelu, 26
21
6Loulhan 2 yel1r1.-18, 18
0 20 40 60
%
BP V..nollu•
• Engon DIO.Cllubo
Shell RimulJ
80 100
Fi u 6. : Len nh or Rclat i n h i ur : R I h lntcrna ti nal

7
. I d 'I nd lit vtriable. ith rand I tit in I 1 'lid 'nt viri IIlI • i.
to tit illll rt Ul th Br nd n J11 , nd It 'r on
to an -lI l1s. indi uin th It it is. str n Hr nd
nn tit
It
mpl
uld
Ul
m th
pr dll t, thi m thot th I nd n tr pr rmum
pn III
R r to Ann ur I , th lid r n tin I p cd nd n n-u r. Am II I
1I r . 17% th nt. n. id r th pr du t Th

di. pp intm mt nd 0 11 'In h 'I" i th It nl 4% of th I' P ndent thin th t
an lIus ill b th m t uitabl I' th ir mpan '. n ds.
Oil- II. r. d n .% f th 6 I' P lid III
r 'pl in in th iflirmativ " I~. .pt I' r hi zh 'Ill il it II %, the pI' du Is r •
" eptionIII I w n III th oth I' bund ntl
\ ork 11 'd I ) be done amon st thes I I I two cal ' orics I' ustomer 10 r II
nd 0 dwill.
a 11'01 P I' I'm b I of all th oth 'I' I r nd , with a hi h rr lin
6.4 I'RJ E
h \I ll, '
a qu Iii Br nd.
, upp rt III' urn ti lh t
. In fi ur nl 11 %
h it i m r
'. p 11. ivc than the n ,-I Brand, nd 1m . t 20% • th h ap I . p I'

91
Apart from Castrol (Figure 6.9), who regularly advertises the generic, corporate
Orand, there is very little advertising recall. This may be attributable to the
common (but possibly incorrect) belief that relationship marketing plays a bigger
role in business-to-business marketing than Brand-building, above the line
advertising. More will besaid on this topic in the conclusion.
6.7 CUSTOMER RELATIONSHIP MANAGEMENT AND TECHNOLOGY
In 3.4 and 3.7, customer relationship management, and in particular the role of
information technology in enhancing this relationship was discussed.
In order to test the validity of this theory and to measure the readiness of the
market for Electronic commerce (E-commerce), questions were included to
measure preferred ways ofplacing orders and maintaining contact.
The results were quite astounding, especially considering the current hype around
E-commerce. The results clearly justify BP's decision to establish a Customer
Service Unit where all thesmaller customers are serviced via telephone. By far the
majority found this method totally acceptable, with a much smaller portion
preferring personal calls. These, who are mainly the big customers, arecatered for
by Key Account Managers. Only a very, very small part of the market is
technology enabled (Figure 6.10).
Despite the relatively low preference given here to personal visits (Figure 6.11), it
isworthwhile highlighting that when trying to introduce a product to a customer,
there is still no better method than personal, one-on-one calls.
Aconclusion can bedrawn that for customer acquisition or conversion, there is a
need for personal selling, whilst for customer retention and straight re-buy
purchasing, the useofthe telephone will suffice.

,82Telephono 72
1Pcrson.'ll Visit. 24
I 18
FLU8
15
JInternot 2
"'
1 Current Method
E·mall3 Preferred Method
j1
Automntcd re·ordering system 1
0 20 40 60 100
%
" 1 h lntcrnat ionnl.
J77Telephone 65
J 33Personal Visits
27J
Filx 10
Int'''ict ! 6
CurrentMethod1
E-mOlilJ 2
Preferred Method
Automated ro-ordering system )
0 40 60 100
%
nu with IIppli r
II
Th r . • r h h hi hli hI d nf rru lJt
untndrn
n. In
In lu bl
rn unt
r urn nt th I
databa • th P r. nal

')3
o BRA [) rRIB T
Table 6, • mpil d from d t bt in d in qu tion 17 f th qu stionn ir •
umm riz s th imp rtanc of II th - tt ribute that III upth nsllu Br nd .
Table . Br md ttribute R n d 111 rder of Import nc ' . our" Pr ~ t
huttI
Th qu . ti dim r nt a " Fir. tl nd nt
Ii t in ord r th rt
di I oil. ked to Ii. t the thr rt nt
con id rati n . r ult. ofth fir t qu tion ar li.t In lumn 2 nd . hil.t
th r ult f th cond qu tion ar Ii tcd in th I t column. Int r tin I . th

94
results differ substantially. In the first question, technical performance is by far the
most important, concentrating on the product aspect of the 4P model. In the
second question, the rankings come out quite differently. (the top four attributes
are now highlighted in green.) Overall quality now takes prime position, with
creating and maintaining a good business relationship third. The other aspects of
the 4R model are highlighted in red in the table. They are low on the priority list,
indicating relative low importance currently.
Price issues feature much lower than anticipated. Value for money ranks number
six, long term savings isatnumber seven, whilst reasonably priced only comes in at
number eleven. This corroborates the data represented in the pricing ladder earlier.
Price then is a lower priority than commonly suggested.
Technical approval of lubricants by the original equipment manufacturer, often in
the country of origin, is absolutely essential if a company wants to supply to a
manufacturer inSouth Africa. Yet this very important attribute for OEM's is much
less of a priority for customers in the field. This is a concern as far as factory
guarantees and warrantees are concerned, but an opportunity for lubricant
suppliers, as it substantially reduces the barriers toentry.
6.9 CONJOINT VALUE ANALYSIS
The outputs of the eVA are utility values, which indicate the strength of
preference for various offers. These are calculated at the level ofthe individual, or
micro level. Four components were measured in the trade-off exercise, namely:
Brand; Technical issues; Supplier issues and Price.
These attributes arelisted below for each eVA component:

• Brand
1. Agip
2. Vancllus
3. Dclvac
4. Castrol
S. Sasol
6. Rimula
7. Rubia
8. Zenex
9. Delo
10.Dieselube
• Technical
11. Meets orexceeds OEM specifications
12. The most advanced oil
13. Oil that reduces enginewear
14. Ensures low oil consumption
1S. A long life oil • i.e. it extends drainage intervals
16. Oil thatensures good fuel economy
17. Oil that ensures increased enginepower
18. Oil thatguarantees against engine breakdown
• Supplier
19. Purchase both fuel and lubricants from one company
20. Excellent customer service
21. Good technical support
22. Suitable payment and credit terms
23. Complete range of oil for all my needs
24. Easily available
9S

96
25. Equipment provided for workshop.
• Price
26. R 7.80per litre
27. R 8.20per litre
28. R 8.60per litre
29. R 9.00 per litre
30. R 9.40 per litre
The analysis examines both the leverage of the component (like price) and the
attractiveness of each attribute (like R 7.80 per litre).
As can be seen in table 6.4, Brand has the highest leverage across all user groups.
After Brand, technical issues have the highest leverage for lapsed users and non
users. (The utility rankings for the various user groups, can be found in the
annexures, as annexure d.) The percentage of Vanellus users in the interview
sample skew the Vanellus utilities, but the result isstill valid.
Price and supplier issues feature much lower, with price as high leverage for users,
but low for lapsed users. Supplier issues aregenerally least important.
In table 6.4 all the attributes are ranked in descending order, according to their
utility values. Conjoint Value Analysis allows one to take various attributes from
this table, and by calculating the total value, to select the attributes that will give
the product the highest chance ofsuccess.

97
Table 6.4: Utility Ranking for Total Market. Source: Project Shuttle
TOTAL MARKET Utility RankingVln.llu. 2.531105 1CI.trol 2.21134<11 2Rlmull 1.1111118 3OI••• lub. 1.5119424 4Olllhil r.duc...naln. W.I' 1.431784 5O.lvlc 1.335913 1IOlllhil aUII.nl... lalln.1 enaln. brllkdown 1.311319 7A lona 111.011 1.295397 IICom DI.I. rlna. 01 oil lor III m v n.ed. 1.2115349 8Aglp 1.2311114 10M.el. or nClid. OEM 'Plcillcitlonl 1.2311114 11Purch..1 bolh lu.l.nd lub,lclntl 'rom on. comD.nv 1.2311114 12R 7.110 plr IIlr. 1.2311114 13Good I.chnicil .UDDOrl 1.23711311 14Sllol 1.232287 15Olio 1.2111437 IIIEIIlIv Iv.Ulbl. 1.1871118 17E qulpm .nl Drovld.d lor work.hop 1.195789 18The mo.l.dvlnc.d oU 1.1l14812 18Olllh.l.n.ur.. lncr....d enalne Dow.r 1.173078 20E xc.lI.nl cu.lom.r ..rvlce 1.1511773 21011 Ihel en.ur.. Good lu.1 econom v 1.158157 22Rubll 1.155397 23Sult.bl. D.vm.nl.nd cr.dll t.rm. 1.14l1l1115 24Zen.x 1.12l104l1 25RlI.60 D.r IlIr. 1.126585 28R lI.20 D.r IIlr. 1.09311116 27En.urlslow 011 consumDllon 1.083387 28R9.00 D.r IIlr. 0.9941121 28R8.40 p.r IIlr. 0.80ll28'- 30
6.10 SUMMARY
In this chapter. therelevant data, pertainingtothe hypothesis, that Brand nameis a
significant criterion in the decision making process when procuring HDD oils in the
business to business environment in South Africa, have been presented and,analyzed. There is substantially more data available on the CD ROM (Annexure G)
in the back of the dissertation. but it would not serve the purpose to reflect all of it
here. Rather. after the conclusions and recommendations concerning the Brand. a
section will be devoted to more tactics that BP may use to recapture the lost
volumes of Vanellus diesel oil.
This chapter started offby looking at the 4P marketing mix. It looked at Brand
awareness and found high Brand recognition. Looking at product attributes. it
became evident that performance factors and technical issues arc still the major
levers that givecredibility to the Brand. Apart from customer service. very littleof

98
the 4R model featured in the results~resentation and packaging for Vanellus was
found to be acceptable, and not a reason for the decline in sales. Promotion, and
specifically advertising awareness, showed very poor results, and is a concern if the
Brand is to be promoted amongst non-users.
The readiness of the market for E-commerce initiatives was tested, and it was
found that only a very small proportion of the market is technology enabled. This is
quite surprising in terms ofthe current hype around electronic commerce.
Lastly, the results of the conjoint value analysis were shown. This shows very
clearly that Brand name has the highest utility value by far. No less than four of the
top positions inthe overall market are occupied by Brand names.
In the next chapter, conclusions will be drawn from these results, recommendations
for strengthening the Brand will be made, some tactical recommendations will be
made on recovering lost sales and the constraints of this research will be listed.

99
CHAPTER 7
CONCLUSIONS AND RECOMMENDATIONS
7.1 TilE AIM OFTilE CHAPTER
In this, the final chapter, the hypothesis testing will take place. Any constraints
relevant to this research will then be noted and discussed. Finally, conclusions will
be drawn from the research findings and recommendations made as to possible
solutions. This will be a two pronged approach. The first will refer to matters
related to the Brand, and the second, to marketing strategies and tactics that may
be deployed to recover lost sales of Vanellus. The chapter, asusual, closes with a
summary.
The researcher will remain as unbiased in this interpretation, aspossible. Dr. Henry
Nowik (1964), points out that findings should always be confined to factual
reporting, unembellished by the opinions of the researcher or by his conclusions,
however pertinent in his opinion these might be...It is essential that marketing
people should look upon and rely on research reports as unbiased findings and this
confidence can only be established when the personal opinions ofthe researcher are
not in evidence.
7.2I1YPOTIIESIS TESTING
In the dissertation proposal, the following hypothesis was put forward to accept or
reject:
The Brand name is a significant criterion in the decision making process when
procuring heavy duty diesel oils in the business-to-business environment in South
Africa.

100
Four methodologies will be used to accept this hypothesis.
7.2.1 Observed Validity
In figures 6.2 and 6.3, it clearly shows spontaneous Brand awareness exceeding
fair (relative) market share. When prompted, this increases to very high levels of
awareness. This fact, that customers have such high awareness of what is
considered a technical, business-to- business product, supports the hypothesis that
the Brand name does playa significant role.
7.2.2 Regression Analysis
As can be seen in annexure E, a regression analysis was performed, using all the
attributes listed in the conjoint value analysis.
• On page I, Attribute 2, the P (2 tail) column, shows a 100% level of
significance for Vanellus. The standard coefficient of a positive 0.636 can be
interpreted to mean that there is a 63.6% chance that the Brand name influences
the purchasing decision. Other Brands having a higher than 9()01o level of
significance, are Agip, Rimula and Rubia. As their standard coefficient is
negative, it indicates that it counts against the selection of Vanellus (Gerhard
Srnit, Research International).
• On page 3, Customer service, technical support and the supply ofequipment
are other attributes that showmeaningful levels ofsignificance.
The results of this shows significant correlation between usership and the Brand
attributes. This supports the hypothesis that Brand name does playa significant
role.

101
7.2.3 Conjoint Value Analysis Utility Ranking
In table 6.4, the utility values obtained from the conjoint value analysis. are ranked
in descending order. The first four positions are all occupied by Brand names, and
these have the highest utility values ofallattributes.
This proves conclusively that the Brand name is 8 significant criterion in the
decision making process when procuring HDD oils in the business-to-business
environment in South Africa.
7.2.4 The Chi-Square Goodness or Fit Test
The chi-square statistic can provide a measure of the goodness-of-fit between an
observed frequency distribution of a random variable and an expected frequency
distribution. These expected frequencies can be based on a particular theoretical or
empirical distribution which the random variable is hypothesized to follow
(Wegner, 1999: 257).
In table 5.2, the relevant market shares were mathematically adapted to give an
expected amount of users for the selected sample. As the actual sample
composition changed, the table had to be modified. The actual. observed
frequencies and modified tables are shown inthe table.
As can be seen from table 7.1 and 7.2, the expected frequency has been amended
from the expected sample size of 250, to the actual number of respondents
interviewed. It also accommodates the larger than expected amount of Vanellus
users included in the sample.
• The hypothesis will betested at the 5% level ofsignificance.
For a specified hypothesis that is being tested, the level of significance of the test
refers to the maximum probability with which a Type I error (reject a true
hypothesis) would be an acceptable risk. This means that there are 5 chances in

10
100 th t the h pothesis \ ould b reje ted wh 'n it should actually III b n
accepted ; in other word . the onfidcn ' level of th d i ion i 5 %
198 1: 11 5).
Table 7. 1 bs .rved 'rsof the Br nd
Dr.ud En" U\('d Cu.-n nll" IIIC'
tullnber % number %AWll l) :lY. 3 W.Vunellus 177 JoW. 116 37%Cnl tex 46 W. 22 'lY.CIL,lrul 42 KY. 30 10%Engen 71 1,1% 44 14%MoW 17 Jr. R 3r.Sllsol 7 1% I 0%Shel l 75 15% '12 13%Ruti n 2R sr. 20 6r.Zenex '" 1% 2 1%Other 39 8% 24 /w.
TOTAL 515 100'/. 3 12 100%
hi n II.
Table 7.2: mendedTable of •
• Th null nd It rnativ It p th
ers
110 : Th I r nd narn i. II ignif nt rit rion in th d i"i n m kin pro ,, \ h n
bu. in .. - t nt in .. uth fri
H.: Th Br nd nam i not i niti d ision m kin
wh n pr urin HI /) oil in th bu. in n ironm nt in outh

103
• The area of acceptance.
The number of classes in our exercise are 8 (the number of Brands). The general
rule for the goodness-of-fit degrees of freedom is (k - m-I), where k is the number
ofclasses, m is the number of population parameters that needs to be estimated
from the sample data. There are no population parameters to estimate, hence m
equals zero.
Thus the degrees offreedom are 7.
The level of significance a is given as 5% (i.e. O.OS).
From the chi-square tables, with a = 0.05 and degrees offreedom of 7, the critical
chi-square limit is 14,067.
The next step is to calculate the appropriate sample statistic x'ClIo. This is done in
table 7.3 below.
Table 7.3: Calculation ofthe Chi-Square Statistic
Product Observed Expected (fo•f.)":
fo f.2
f.(fo•f.)BP 114 111 9 0.081Caltex 13 22 81 3.681Castrol 19 13 36 2.269Engen 27 29 4 0.138Shell 24 27 9 0.333Total 11 12 1 0.083Zenex 2 1 1 1.000Other 23 18 25 1.389
X:lCALC = 8.974
Comparison of thesample statistic to the area ofacceptance.
The chi-square sample statistic (X2calc = 8.974) lies inside the area of acceptance,
i.e. less than X2 =14.067.
• Conclusion
Accept Hoat the 5% level ofsignificance.

,
104
This concludes that the Brand name is a significant criterion in the decision making
process when procuring HOD oils in the business-to-business environment in
South Africa. (Wegner, 1999: 258 - 260)
7.3 RESEARCHCONSTRAINTS
This research suffered under a number ofconstraints. They arelisted below:
• Very little is available in terms of published literature on the topic in South
Africa
• Generally sales, volumes and market share are considered confidential, and this
information was not readily available
• It was extremely difficult to find the required number of respondents of correct
size and usership, according to the original plan. In the end the sample had to be
adjusted to meet with reality.
• Certain segments, like franchised workshops are not sufficiently covered in the
survey, whilst others, like spares shops and other high street outlets are not
covered at all. Further research may be required on this, as these are
particularly susceptible to Brand influences.
• The research had more than one purpose, thus losing some focus on the main
hypothesis. It also resulted in a mass of information which made interpretation
very difficult, not to mention almost impossible to represent in the text.
• Measurement of the hypothesis statistics were problematical in the beginning,
but was overcome eventually. Longitudinal research may be needed to measure
the cumulative effects of a particular relationship construct (measured by
attitudinal scales) in customer behaviour and the ultimate market share
(measured by choice behaviour).

7.4 ON LV ION A DR 0 ME DATIO o BRA D
105
As one o f the original objective , th goal was to d t nnin th rol of th Brand
and Brand name in po itioning the product. We now look at orne factor :
In figure 6.9 , it was shown that very low advertising awarene s exi ts. This can b
a seriou damp er for the growt h of V anellus, as explained below.
In figure 7. I, the respondents were asked who manufactures Vanellus. The fact
that 56% of non-users are not aware o f who the manufacturer of Vanellus is, i a
major reason for concern. This would indicate a very low level of Brandawarene
amongst the major new business pro sp ects. This becomes even a bigger co ncern
when seen in conjunction with figure 6.4, which ee Vanellus enjoying smaller
usership with customers that have a relationship of less than 5 years. This would
indicate a severe lack of Brand awa reness. User reinforcement will also assist in
preventing the current attrition rat e s . It is necessary to reinforce the reasons for
choosing Vanellus as the right choice.
Figu re 7.1: Brand Kn wlcdzc Manufacturer. ur : Proiect huttlc

106
The Brand image is strong, but lapsed users feel that the Brand does not suit their
company's need best whilst non-users have a weak image of the Brand, reinforcing
the potential role ofadvertising.
Rossiter and Percy (1987) describe Brand awareness as being essential for the
communication process to occur as it precedes all other steps in the process.
Without Brand awareness occurring, no other communication effects can occur.
For a consumer to buy a Brand they must first be made aware ofit. Brand attitude
cannot be formed, and intention to buy can not occur unless Brand awareness has
occurred. In memory theory, Brand awareness is positioned as a vital first step in
building the bundle of associations which are attached to the Brand in memory
(Stokes, 1985).
It is therefore highly recommended that the Brand be extensively advertised and
promoted. The following media can be used: Trade magazines; Direct response;
Event marketing; Sponsorship; Public Relations; Web sites; Packaging design;
Merchandising; Point-or-sale design; Sales promotion; Consumer competitions;
Industrial theater and Exhibitions.
The pack image isquite strong, but not that attractive.
Vanellus usersarenot asprice sensitiveasusers ofother Brands.
The research reveals that attributes forming Brand personality are mainly technical,
and relationship management and information technology, apart from service
aspects, still play a very minor role in the Brand architecture. The Brand
proposition, as discussed in chapter two, where Brand soul and Brand personality
were held as essentials for a successful Brand, obviously apply less to a technical,
business to business product in SA.

107
Fi ure 7.3: rca on Un r
Fi ure 7.2 nd 7. c1earl point
r It uld tak n In f nnul ti n of lit pr du I nd ub u nt
that th d and
It i r
qu lit and
int rv I. lit m
in dv n in th B nd im
nn n , wilh I n lif oil
d n in
I nd d d an
r. lit m an
d I rmin th p I nti I f limit
r h und tit I limit d gu nt
n lIu pr duct u d ill
br d wn.
down, It uld th
An tit r
guaranI
gain t n in br

108
remains a distinctly viable way of differentiating the Brand, especially amongst
current users.
The Internet should be used to widen the scope of the Brand, but itsmain purpose
should be to determine the "touch points", that is, identify the areas where
customers need help and immediately act upon it. Another primary use would be to
use it to build up a customer database.
This concludes the section on the Brand.
It must be highlighted that throughout the research, Castrol has proved the superb
equity that the Brand possess. If the Castrol knowledge, skills, culture, advertising,
and sales promotion expertise can be successfully transplanted in the cost
conscious BP organization, tremendous benefits can be reaped from the merger. It
links two very powerful Brands that should have no problems in setting new
benchmarks in the industry. The Castrol Brand should be leveraged to its fullest
extent, possibly even considering adding the Castrol icon on the product and/or
saying that it is underwritten by Castrol (part of the Castrol family of quality
products).
7.5CONCLUSIONS AND RECOMMENDATIONS ON MARKETING
ISSUES
One objective of the research (other than Brand tracking), was to detennine the
reason for the substantial loss of sales volume for Vanellus, and to use these
findings to make recommendations. Even ifit falls somewhat outside the scope of
the hypothesis, it is justified that the reasons for this loss are highlighted and
recommendations made. Very valuable findings were made, and the avid scholar
will be able to gain more insight by lookingat the data contained in Annexure G.
Supplier relationships and product attributes would appear not tohave contributed
much towards the loss in sales volume. Very few negatives were highlighted by
the research. Figure 7.4 reflects the reasons given by lapsed users for changing

109
Brand . Pric and lor paym nt term w r th mo t fr qu nt r on giv n, with
convcnienc , product choice and qualit and customer ervice II on par.
Thre v ry d finit area of cone rn r highlighted by th r arch:
Fir tty i th fact, reflected in figur .4 , th t compared to th oppo ition, V n lIu
has ubstantially fewer u rsthan th comp titionthat u th product for I than
five year . This i a poor reflection on SP' tafT, a it means that cu tom r
lost, are not r placed by new cu tom r . Loyalty re t in long time u er , and th y
are the customer mostly tied in by long term contracts.
econdly, as figure 7.5 hows, the co mpany is extremely exposed, as a ubstantial
amount of Vanellus u ers are buying on an ad hoc ba is, without any contractual
obligations. ompared to the competitors, the situation is equally bad for short
term contracts . This leaves BP vulnerable, as the barriers for these customers to
switch are very low.
' igurc 7,..: R n for 'it h in Brands, ourcc : Pro' hurtle

110
Fi me 7.5: Meth hU1I1
Thirdl , I r nd awaren amon t n n-u cr I v I w, making it dim ult t
ualit and pric are th two con i t nt th m thr u hout the rc arch. om
eu tomer want b 'Her qualit , t nd d drain int 1 and r duced nglO w r ,
whilst oth
u t f r Ion life oil, i. il
hi h lubri it ,
nt, r ullin in I n t ITO
cu tom r • r
oil al o h
m r fu I ffi
pr duct b add d onto th rang . t th t P
lubricant n b dd d. Th
n In
ti r, nth tic - or ml -
availabl , and thi will compl
with nded dr in int rval .
r nd m in th
vm .
t th b It m f th curr nt r n
rcquir m nu , but n thin
pr duct th t m t m in tr m m r
intr du cd th
pri . Thi i
D ro 5 th trurn, it u • I
u r or n non-u r .

III
It is also proposed that aconcerted sales drive is made by the sales force to tie up
existing customers with a contract. Supply ofworkshop equipment may help them
achieve this. This thought is further supported by the previous research results
(discussed section 4.3.3), that shows that only 39.3% of workshops are
contractually bound to their lubricants supplier. The next step would be to create
above the line advertising support and below the line sales aids. Armed with this,
and qualified leads, BP"s sales staff should go on a concerted sales drive to recruit
new customers for Vanellus. The research also showed a segment of consumers
(25%) who buy their lubricants and fuels from separate suppliers. This also offers
additional business opportunities.
An incentive scheme that rewards the sales team for new business is
recommended.
7.5.1 Customer Relationships and Information Technology
The research has very clearly highlighted that the market isnotready for Electronic
commerce yet (Figures 6.10 & 6.11). This can be seen as a negative or as a huge
opportunity. In terms of improved logistics, it is vital that product sales, product
demand and product stockholding be tracked. The research shows that very few
customers havethese facilities available.
The astute marketer may now approach the supply of computer hardware and
computer software in the same light as they handle relationship specific
investments in workshop equipment. Not only does it provide the opportunity to
tie in the customer contractually, but it will vastly improve logistics and other
marketing communication and infonnation. Amongst others, it also opens channels
for direct marketing through E-mail, paperless transactions and electronic fund
transfers, and seamless customer relationships. Supplier relationship specific
investments also have a positive effect on customer satisfaction (Rexha and
Miyamoto, 1997).

112
For the retail and wholesale FMCG market in particular. ECR as discussed in
Chapter 4. section 4.5. needs to be developed rapidly.
Using the utilities obtained from the Conjoint Value Analysis. the following
recommendations can bemade:
7.5.2 Current Usen
• Price has a high leverage for users.
• Supplier issues are least important to users.
• Oil that guarantees against engine breakdown and a long life oil (extended drain
intervals) are the most important attributes for users. Oil that reduces engine
wear also has a high utility.
• Acomplete range ofoil for all needs is important too.
Regression analysis revealed that excellent customer service is the main driver for
current usership.
It is thus recommended that relationships with these customers be strengthened by
entering in transparent. fixed margin, flexible pricing. In this way both parties will
win in a market where base oil prices fluctuate wildly. It should satisfY both parties
onthe price issue. as normally customers lose out if after a price increase. input
costs come down again. This benefit is seldom passed on. Castrol's culture of
providing solution specific products should also produce solutions for the product
related matters.
It is very important toget all existing customers tied up in a supply contract.
Awell planned. guarantee programme similar to the BP fuel guarantee can assist in
increasing sales.

113
Service then becomes the other focus area, and BP will be well advised to institute
a continuous service improvement program with distinct measurables on key
performance indicators.
7.5.3 Lapsed Users
• Lapsed users are not as price sensitive as Brand users, inferring that price
perception isnot the prime motivator to lapse.
• After Brand, technical utilities have the highest leverage for lapsed users.
• Brand has lesser leverage than for Vanellus users.
• Lapsed users want oil that reduces engine wear. a long life oil and the most
advanced oil asattributes.
• Good technical support and excellent customer service have a higher utility
value for lapsed users than users.
Acampaign to recover these lost customers must be concentrated around service
and technical support. Towards this end. the technical help desk number and
website address must appear on all new product labels. Sales staff recruited must
be more ofa technical nature and be able to assist with technical problems. as well
as be able to use the computer software (OATS: Earl 4 programme) that can do
instant price surveys. cost quotes and recommendations for the correct lubricant.
Training in technical aspects is also a priority. Added to this, develop a new range
ofproduct brochures, showing the new range and include technical specifications
and detailed usage. Also make technical data sheets available to all (annexure C).
on the DP Intranet as well as on the BP lubricants Internet website, at web address
www.bplubricants.com.
As this sector is not so price or Brand driven, an own name Brand at a cost benefit
may be a consideration for them.

114
7.5.4 Non-Usen
• Non-users have a weak image of the Brand, reinforcing the potential role of
advertising.
• Vanellus users are not so price sensitive as users of other Brands, and as
Vanellus is priced at a premium, this implies that strong motivations will have to
be forwarded ifBP wants to attract customers for Vanellus.
• Technical issues arc important for non-users.
• Supplier issues are least important for non-users.
• Oil that reduces engine wear has the highest utility and oil that guarantees
against engine breakdown has the second highest utilityunder technical.
• A complete range of oils for all my needs, technical support and equipment
provided for workshop, are further requirements.
The recommendation here would be that this sector be approached with a totally
integrated offer, including all of the above, but also the complete information
technology package. All recommendations included for users and lapsed users
should also be included here, but this campaign must be supported by a strong
media campaign to create awareness, especially ifthe guarantee route is taken.
7.6 THE FUTURE
Even ifa concerted sales drive is launched, only a certainslice ofthe market can be
captured, as the rest is contractually bound. (An astute sales force will know when
these contracts are due for renewal, and will then pitch for the business). If the
research results are extrapolated to the universe, more than fifty percent of lapsed
users and more than sixty percent of non-users are contractually bound to their
current Brand. So where docs BP go from here?
Hamel and Prahalad (1994:5), argue that any company that succeeds at
restructuring and re-engineering, but fails to create the markets of the future will

115
find itself on a treadmill, trying to keep one step ahead of the steadily declining
margins and profits ofyesterday's business.
This research did not cover service station forecourts, spares shops and other
outlets that buy products for resale. In these markets there is a need to develop
category management principles. detailed annual strategic category plans.
improved supply chain performance, informed promotions and planned
presentations. From this platform, loyalty programmes, and finally. totally
integrated solutions can be developed.
Neither BP nor Castrol has proper main line truck stop facilities, and providing
facilities can substantially increase Brand exposure and create substantial goodwill.
Lastly, there is the option of marketing an existing product in new channels. In
terms of social responsibility and Black empowerment. the establishment of
franchised truck and light delivery vehicle workshops for Black entrepreneurs
comes to mind. Ultimately they will service the mainstream market, the vastly
expanding pool of previously disadvantaged Black people now acquiring motor
vehicles. and they must be brought into the fold. For BP automotive (passenger
vehicles) this may be a mobile shop in a trailer selling the range of lubricants and
car care products in convenient locations in the townships under a franchise
arrangement. This will drastically improve penetration in developing markets.
The way to go for BP is to promote the Corporate Brand, with all its values and
beliefs, rather than individual products. The Company has huge credibility, and this
should be maximized.
?7SUMMARY
In this chapter the hypothesis tests were done that proved conclusively that the
Brand name is a significant criterion in the decision making process when
procuring HOD oils in the business-to-business environment in South Africa. The

116
constraints of this research were listed, and then conclusions and
recommendations, flowing from the survey and models covered in the research,
were made. These covered the Brand as well as marketing issues that should be
addressed when relaunching/rejuvenating Vanellus. Finally, the creation of future
markets were discussed briefly, and certain proposal made.
In closing this research on the Brand, there is a final guiding quote from Hamel and
Prahalad (1994):
"The Banner Brand (in this instance BP) is directed as top level Brand, in which
corporate reputation, awareness and leadership foresight are invested. It works as
an Unique Organizing Purpose. It embodies a uniquely relevant service raison
d'etre which transforms into a feedback loop between employee pride in winning,
and consumer joy in the best. It acts as the consumer's editor of choice by
transferring high level values, such as trust and delight, across temporary product
manifestations of the Branded organization. Banner Brand impact is "glocally"
(global and locally) multipliable by linkages toother Brands, including sub-brands"
This is so relevant where Amoco, Arco and now Castrol, with all their products
must operate under the global, new BP Brand. But as they say, products may be
temporary, but theCorporation will keep onexisting.

117
BIBLIOGRAPHY
*10 Company Statistics (1999): BP Confidential In-house Publication compiled
from Marketing Intelligence.
*Aaker, D. (1999): Levering Intangibles toCreate Brands, in Business Standard,
the Strategist, 23 November, (1 - 3).
·Abratt, R., Spence, J. and Bendixen, M., (1997): Wits Business School
Publication, Johannesburg.
• Alford, B.L.,Roch, S.S. and Black, W.C., (1992): Instructors Manualfor
Multivariate Data Analysis, 3M Ed, New York: McMillan.
·Association of Marketers, Compilation, (1998): The Encyclopaedia cfBrands
andBranding illSouth Africa, Cape Town: ABC Press.
·Association of Marketers, Compilation, (1999): The Encyclopaedia ofBrands
andBranding illSouth Africa, Millennium Edition, Cape Town: ABC Press.
·Blaxter, L., Hughes, C. and Tight, M., (1996): How to Research, Buckingham,
Philadelphia: Open University Press.
·Blenkom, D.L. and Noori, A.H., (1990): What it takes to supply Japanese
arM's, International Marketing Management (19): 21-30.
·Booms, B.H., and Bitner, M. J., (1982): Marketillg StrateglesQ/IdOrgaJlI.ratloll
Stmctures For Service Firms, in Donelly, J.H., and George, W.R. (Eds),
Markettng ofServices, American MarketingAssociation, Chicago, IL. (47 - S1).

118
tBPSouthern Africa in-house publication, (1995): L"bricalllsMarkeling Strategy
2000, Cape Town.
tBurgess, R.O., (1985): StrategiesofSducauona! Research, Qualltallve Methods.
London and Philadelphia, The FaJrner Press.
·Buros,K. and Blackall, S., (1992): The Responsibilityfor Service Delivery:
Using Research 10 Generate Effective Owner:.;hip and Implementation: the USand
UK Experience, ESOMAR Congress, Madrid.
·Burton. M.L., (1975): Dissimilarity Measures/or Unconstralned Sorting Data,
Multivariate Behavioural Research, (10): 409 - 424.
·Calonius, H., (1988): ABuyi11K ProcessModel, inBlois, K., and Parkinson, S.
(Eds), Innovative Marketing - A EuropeanPerspective, proceedings from the
XVIIth Annual Conference ofthe EuropeanMarketing Academy, University of
Bradford, (86 - 103).
·Cattin. P. and Wittink, D.R., (1982): Commercial Use ofConjoint Analysis: A
Survey, Journal ofMarketing. (46): 44 - 53.
·Chisnall, P.M., (1981): Marketillg Research, Analysis and Measwemen; Second
Edition. Berkshire: McGraw-Hili Book Company (UK) Limited.
·Cravens K.S. and Guilding, C., (1999): Strategic Brand Voluauon: A Cross
Functional Perspecttve, Business Horisons/July-August.
·Cresswell. J.W., (1994): Research Desing, Qualitative andQuantitative
Approaches, Thousand Oaks, California: Sage Publications.
• Cullman, W.A., (1982): Symposium on Branding and Brand Equity.
http://www.cob.ohio-state.edul-Ieonelpptlcullman.htm. 21/04/2000.
119
-Davidson, H. (1987): Offensive Marketing, London: Penguin.
-Dion, P.A.,Banting, PM. and Hasey, L.M. (1990): 17,e impactofJITon
lndustrial Marketers, International Marketing Management (19): 4I- 46.
-Dixon, D.F. and Blois, K.J., (1983): Some Limuattons Ofthe 4P'sasaParadigm
for Marketing, Marketing Education Group Annual Conference, Cranfield Institute
ofTechnology, UK, July.
-Du Plessis, P.J., Rousseau, G.G. and Blem, N.H., (1990): Consumer Behaviour,
aSouth AfricanPerspective, Halfway House: Southern Book Publishers.
-Dutt, P., (1998): TNA Mar 02, web3.asiaJ.comltraveldata
-eMJR° Market Research Report 1146, 27 July, 1999. BP (South Africa) Workshop
Survey
-Gale, B., (1994): The Importance ofMarket-Perceived Quality, in Stobart, Paul
ed., Brand Power, HoundmiJls: The Macmillan Press, (65 - 83).
-Gerstner, L., in The Economist, 1999.
http:www.brandknowledge.com/hotdebate.htm. 21/04/2000.
-Green, P. E. and Srinivasan, Y., (1990): COlljo/"t Analysis /11 Market/llg
Research: NewDevelopments and Direct/Oils, Journal ofMarketing, (4): 3 - 19.
-Gresham, A.B. and Gruben, K., (1993): Small RetailerVelldor Select/Olio' Do
Illdustrial Buying Models Apply?
http://www.sbaer.uca.eduldocslprocccdings/9Ssbil93.txt

120
-Gronroos, C., (1990): Service Management andMarketing. Mallaging the
Moments of Truth ill Service Competition, Free PresslLexington Books,
Lexington, MA.
-Gronroos, C., (1990): Relationship Approach to the Marketing Funcuon In
Service Contexts: The Marketillg and Organtsauonat Behaviour lntetfoce, Journal
ofBusiness Research, 20(I): 3 - 12.
- Hamel, G. and Prahalad, C.K., (1994): Compettngfor the rilhlfe, Boston,
Massachusetts: Harvard Business School Press.
-Hankinson, G. & Cowking, P. (1993): Branding I" Action: Cases ami Strategies
forProfitable BrandManagement, Berkshire: McGraw-Hili Europe.
-Hill, C.W.L. and Jones, G.R., (1998): Strategic Management Theory - OIl
Integrated Approach, (411I Edition), Boston: Houghton Mifflin Company, (118
121).
-Jackson, B. B., (1985): Build Customer Relationships That Last, Harvard
Business Review, Volume 63, November-December, (120 - 128).
-Jackson, R.W., (1990): How Multidimensional Is the Purchasing Job ?, Journal
ofPurchasing and Materials Management, (26): 27 - 33.
-Kapferer, J-N., (1992): Strategic BrandManagement, London: Kogan Page
Limited.
-King. S., (1991): Brand Building In the /990's, Journal of Marketing
Management, Vol. 7, (3- 13).
-Kotler, P., (1992): It's Time for Total Marketing, Business Week ADVANCE
Executive Brief, Vol. 2.

121
·Kotler, P., (1997): Marketing Management; Analysis, Plculllillg,lmplemelltatioll
and Control, Ninth Edition, New Jersey: Prentice Hallintemational, Inc,
·Kuhn, T.S., (1962): The Structure ofScientific Revoluttons, University of
Chicago Press, Chicago, fL.
·Kuhn, T.S., (1970): Tne Structure ofScientific Revolutions, 2" Ed, University of
Chicago Press, Chicago, fL.
·Lauterborn, B., (1990): New Marketing L/lany, Four P's Passe: C - words Take
Over, Advertising Age, (61):41, October 26.
·Leedy, P.O., (1997): Practical Research, Planning and Design, New Jersey:
Merrill, a division ofPrentice Hall.
·Lester, J.D., (1996): Writing Research Papers, a Complete Guide. Eighth
Edition. (1996):New York: Harper Collins College Publishers.
·Lindstrom, M., (2000): BRANDING, Offline Versus Online Brands-The
Winners and Losers, http://www.searchz.comlArticlesl0622993.shtml.
20/04/2000.
·Lubrizol, (1998): Ready Referencefor Lubricant and Fuel Petformance,
Wickliffe, Ohio: The Lubrizol Corporation.
·Lubrizol Survey, (1999): Confidential Survey conducted by Lubrizol SA and
made available only to participating Oil Companies.
·Makin, A., (2000): Accounts Director, Ogilvie and Mather, personal interview,
Cape Town, 4 May.
·McCann, J.M., (1995) : Why Category MallagemcIII Fails? Look tothe
MISlMarkcting Gap, Brandwcck, January 16, (18).

122
·McCarthy. E,J.•(1960): BasicMarketing, Irwin. Homewood,IL.
·Melville. S. and Goddard, W.• (1996): Research Methodology, Kenwyn: Juta &
Co Ltd.
·Moore. J.•(1996): The Death ofCompetltton, p.l-p.e, IS April.
http://www.css.edulusersldswenson!web/52SARTIC/COMPET.HTM. 20/4/2000.
·Moonnan.C., Desphande, R. and Zaltrnan, G., (1993): Relationships Between
Providers andUsers ofMarket Research: the Role ofPersonal Trust, Working
Paper No. 93 - Ill, Marketing Science Institute, Cambridge, MA.
·Nel, P.A.• Radel, F.E. and Loubser, M., (1988): Researching the South African
Market, Pretoria: University ofSouth Africa Publication.
·Nowik, H.. (1964): The roleofMarket Research in a Marketing Orientated
Company, Research inMarketing. Market Research Society, London.
·Okada, E.• (1998)~ Obtaining Brands andGoodwill Through Merger and
Acquisition: Sign ofChanging BehaviourofJapanese Enterprises, APlRA98
Paper#61, Yokohama National University, Japan.
·Page, A.L. and Rosenbaum, H.F., (1987): Redesigning Product Lines With
Coojotm Analysis: How Sunbeam Does It, Journal ofProduct lmovetion
Management, Vol. 4, (120 - 137).
·Parasuraman, A., Zeithaml, A. and Berry, L" (1984): A Conceptual Model of
Servtce Quality and itslmplicationsfor Further Research, Cambridge, Marketing
Science Institute.

123
·Patton, W., Puto, C. and King, R., (1986): Which BuyingDecisions are Made by
Individuals andNot byGroups ?, Industrial Marketing Management, (15): 129
138.
·Patton, W.E., (1995): Individual andJoint Decision Making inIndustrial
Vendor Selection, Appalachian State University, Research Paper.
http://www.sbaer.uC8.edu/docs/proceedingsIU95swaI8S.htm 21/04/2000.
·Pitt, L.F., (1998): Marketing/or Managers, a Practical Approach, Kenwyn:
Juta.
·PricewaterhouseCoopers, (1999): Customer Value Management, Summary
Report, Utrecht, the Netherlands, April.
·PricewaterhouseCoopers, (1999): SouthAfrican Value Chain Analysis, Applying
Value ChainAnalysis toAssess ECR opportunuies, Management Consulting
Design Centre, Johannesburg.
·Research International, (2000): ResearchProposal, Project Shuttle 2000/322, A
Benchmark StudyforBP's Vanellus Relaunch. March 2000.
·Reynolds, P., (2000) Product Manager, base oils and waxes, BP South Africa.
Personal interview, 30April.
·Rexha, N. and Miyamoto, T., (1997): The Impact 0/Supplier's Transaction
Specific lnvestmems 011 Buyer-SellerRelationships ", Paper presented at the
International Conference "Marketing Without Border", Manchester, U.K. 8 - 10
July.
·Rexha, N., (1998): A Framework for the ldemtflcation ofa Supplier '.f Role in
Developing Close and Long-lasting Relationships with Focal Customers, Working
Paper Seriesnumber: 9808 March. School ofMarketing, Curtin Business School,
Curtin University ofTechnology, Perth, Western Australia.

TECHNIKON WITWATERSRANDLIBRARY
124
• Rich, S., Chapter 4, Research Design inQuantitative Research,
http://people.biola.edulfaculty/richsled/Chapter4/Chap4lndex.html20/05/2oo0.
·Rosenshine, A. and Freeling, A., (1999): BrandDead ?,Business Standard The
Strategist, 23 November. http://www.bsstrategist.com/99nov23/lstory.htm.
21/04/2000.
·Rossiter, J.R., Percy, L., (1987): AdvertisingandPromotton Management,
Singapore, McGraw-Hili.
·Shelley, A. and Johnson, W., Eds., (1994): Brands and Branding In South
Africa: KeySuccess Stories, Volume II, Affinity Advertising and Publishing ce,Cape Town: ABC Press.
·Sheth. J., (1977): Recent Developments inOrganizational Behaviour, in
Consumer and Industrial Buying Behaviour, Woodside, A.,Sheth, J. And Bennett,
P., Eds., Elsevier North Holland, New York.
·Snider, J., (2000): Research International, Cape Town, South Africa. Personal
Discussion and Personal Notessupplied April 2000.
·Speckman, R. and Stem, L., (1979): Environmental Uncertainty andBuying
Group Structure, Journal of Marketing, Vol. 43, (56 - 64).
·Steer, S.RJ., (1982): The Use a/Conjoint AnalysIs In Transport Research,
Planning and Transport Research & Computation, (145 - 158).
·Stokes, RC., (1985): The Effects 0/Price, Package Deslg11 and Brand
Familiarity onPerceivedQuality, in PerceivedQuality, (Jacoby, J; J. eds),
Lexington: Lexington Books.

TECHNIKON WITWATERSRANDLIBRARY
124
• Rich, S., Chapter 4, Research DesiJ.'1I illQualllilative Research,
http://people.biola.edu/faculty/richsled/Chapter4/Chap4lndex.html 20/0512000.
·Rosenshine, A. and Freeling, A., (1999): Brand Dead ?, Business Standard The
Strategist, 23 November. http://www.bsstrategist.com/99nov23/lstory.htm.
21/0412000.
·Rossiter, J.R., Percy, L., (1987): Advertistng andPromotion Management.
Singapore, McGraw-Hili.
·Shelley, A. and Johnson, W., Eds., (1994): Brands and Branding 111 South
Africa: KeySuccess Stories, Volume 11, Affinity Advertising and Publishing ce,Cape Town: ABC Press.
·Sheth. 1., (1977): Recem Developments inOrganizational Behaviour, in
Consumer and Industrial Buying Behaviour, Woodside, A., Sheth, J. And Bennett,
P., Eds., Elsevier North Holland, New York.
·Snider, 1., (2000): Research International, Cape Town, South Africa. Personal
Discussion and Personal Notes supplied April 2000.
·Speckman, R. and Stem, L., (1979): Environmental Uncertainly andBuying
Group Structure, Journal of Marketing, Vol. 43, (56 - 64).
·Steer, S.R.J., (1982): The Use ofConjoint Analysis In Transport Research,
Planning andTransport Research & Computation, (145 - 158).
·Stokes, R.C., (1985): The Effect.v 0/Price, Package Deslg71 and Brand
Familiarity 011 Perceived Quality, in PerceivedQuality, (Jacoby, J~ J. eds),
Lexington: Lexington Books.

12S
·StrategicMarketing Services (Pty) Ltd, (1999): Reporton South Afrtcan In
Depth Interviews, Job No AMR 2460.
"Iunney, J., Ecommerce Strategy ofFDX
http://www.web.bentley.edu/studentslt/tunneyjefl7 26/04/2000.
"Iumbull, P., Olivier,N. and Wilkinson, B. (1992): Buyer-supplier relattons ill the
U.K. automotive tndustry: strategic implicatiolls oftileJapanese manafactunng
model, Strategic Management Journal (13):159·168.
·Uncles, M., (1995): Previously Heinz Chair ofBrandManagement, University of
Bradford Management Centre, article on BrandArchitecture.
http://www.brad.ac.uk/acad/mancenlmelnet/lj2_II.html. 20/04/2000.
·Upah, G.D., Young and Rubicam, Inc., (1983): Product Complexity Effeas all
Itformation Source Preference by Retail Buyers, Journalof Business Research,
(II): 107.
·Van Veijeren, C.F., (1994): Industrial Marketing, Kenwyn, luta& Co.
·www. a: CampaignsforReal Brands. a debate animated byPaul Southgate.
http://www.brad.ac.uk/acad/mancenlmelnet/melolr2.htmlJuly 1996, 20/04/2000.
·www. c: Table; Architecture of Added VaJue.@1996 MELNET.
http://www.brad.ac.uk/acad/mancenlmelnetlmelaav.html. 21/04/2000.
·www.d: Brand architecture constructs, (1996)
hnp:/lwww.brad.ac.uk/acad/mancenlmclnetllj2)l/e2_11_3.html. 21/4/2000

126
·www.h: SMART Consulting Group. Author unknown. http://www.s-m-a-r
t.comlExp_brandequity.htm 21/04/2000.
·www.i: Class notes. Lundquist College ofBusiness. University ofOregon.
http://www.darkwing.uoregon.eduJ-mduncanloctober_4.htm 26/412000.
·www.j: GE Infonnation Services Creates New Business-to-Business Internet
Commerce Com.. http://www.geis.comlgeiscomltemplate.jsp?pagC...3&id-69
26/04/2000.
·www.m: Organisaliollal Buying Behaviour,
http://vanderbilt.eduleconlrcileylba2S0/outlines/8.htmI21/04/2ooo.
·www.o: General Electric Global eXchange Services
http://www.geis.comlgeiscomltemplate.jsp?page=6&id=31 06/05/2000.
·www.p: African Lubricants Industry. Mbendi, Information for Africa.
http://www.mbendLco.zaIaflu.htm 26/04/2000.
·www.q: An MBendi Profile - South African Lubricants Industry
http://www.mbendLco.zaIcysalu.htm 26/0412000:
·www.r: NAAMS~ Retail Sales Statisttcs, Commercial Vehicles.
http://www.naamsa.co.zaInaamsa1graphslcomymarket.htmlI105/2ooo.
·www.s: Predicttve OilAllalysis.
http://www.safrica.bpweb.bp.comlOar/salmarketinglrnarketitllubslsheIVpredictive.
htm 2110212000.
·www.t: All About Castrol, CompanyBrand.
http://www.castrol.comldominolcasbstr.nsf7contentlCompany Brand 11105/2000.
·www.u: Caltex Website, http://www.caltex.co.za 2210512000.

127
·www.v: Engen Website, http://www.engen.co.za 22105/2000.
·www.w: Shell Website, http://www.shell.co.za 22105/2000.
·www.x: Sasol Website, http://www.sasol.co.za 22105/2000.
·www.y: Ways ofApproaching Research: Quantitative Designs
http://www.fortunecity.com/greenfield/griuJy/432/rra2.htm 24/05/2000.
·www.z: Research inContemporary Orgamzatkmal Issues, Faculty ofResearch,
University of Washington.
http://www.faculty.washington.edu/jpurdy/465/evaluate.html 28/05/2000.
·www.bb: Conjoint Analysis Research Info, Sawtooth Software 1996,
http://www.researchinfo.com/sawtooth.htmI20/05/20oo.
·www.cc: MELNET, http://www.brad.ac.uklbrandinglbrandsouI1999.
·www.dd: Online Brands, Offline Ads, February 18, 1999.
http://www.thestandard.com/articleldisplay/O.II5I,3481,OOhtml 20/5/2000.
·Webster,F. And Wind, Y., (1972): Organtzauonal BuyingBehaviour,
Englewood Cliffs, New Jersey: Prentice Hall.
·Wegner, T., (1999): Applied Business Statistics, Method.. andApplications,
Kenwyn: Juta & Co. Ltd.
·Wilson, B., (1999): Personality PIII.f, RMIT University, p.l-p.4. January.
http://www.nnit.edu.aulAbout/hotTYPEv3/ 20/0412000.
·Wilson, D.T., (1995): An Integrated Model ofBuyer-Seller Relationships,
Journal-of-the Academy-of-Marketing-Science, 23 (4): 335 - 345.

' Wittin , .R., nes, I. And Burh mn , w.,(I ): Commercial Use 0
Conjoin t 1I11)'si.\·in 1':lIf1J/ ' : Results and Critica! Reflections, Int mati n I
Journ I f Re .arch in 1 rk ·tin , I. II , (41 · 2).
Th • nc , lobal HP Br ind

Ann ur . co Po itio In tri
,.I
.:
....o
.- ':'
i.Q -- "
-

Annexure B: Comparative Turnoverand Volume Figures
1998 1999
Vanellus VANELLUS C3 10W Sum of Ytd_VOlume_Litres_ 709623 568390 80.10%
Sum of Ytd_Contribution Net_Margin 1757350.716 1621286.~ 92.26%
VANEUUS C3 203 Sum of Ytd_VOlume_Utres_ 0 0 0Sum of Ytd Contribution Net_Margin 0 0 0
VANELLUS C3 20W Sum of Ytd_VOlume_Litres_ 410 750 182.93%Sum of Ytd Contribution Net Margin 1592.96818 2924.14822 183.57%
VANELLUS C3 30 Sum of Ytd_VOlume_Utres_ 2744145 2189368 79.78%
Sum of Ytd_Contribution NeCMargin_ 7071550.841 6367223.217 90.04%
VANEUUS C3 40 Sum of Yld_VOlume_Utres_ 514130 549950 106.97%
Sum of Ytd_Contribution NeCMargln_ 1127055.329 1415872.623 125.63%
VANEUUS C3 50 Sum of Ytd_VOlume_Utres_ 68430 57390 83.87%Sum of Ytd Contribution Net Margin 146032.5808 143760.7604 98.44%
VANELLUS C3 EXTRA 15W/40 Sum of Ytd_VOlume_Litres_ 614585 572154 93.10%Sum of Ytd Contribution Net Margin 1568770.525 1696663.717 108.15%
VANELLUS C3 EXTRA 30 Sum of Ytd_VOlume_Litres_ 38370 14020 36.54%Sum of Ytd Contribution Net Margln_ 97289.02627 34668.84504 35.63%
VANELLUS C3 MULTIGRADE Sum of Ytd_VOlume_Utres_ 3906919 3n9956 96.75%
Sum of Ytd Contribution Net Margin_ 9265134.375 10283351.92 110.99%VANELLUS DO SAE 40 Sum of Ytd_VOlume_Litres_ 26580 21880 82.32%
Sum of Ytd Contribution Net Margin 59020.91962 56715.10722 96.09%VANELLUS FE 10W/40 Sum of Ytd_VOlume_Litres_ 26190 17020 64.99%
I Sum of Ytd_Contribution_NeCMargln_ 37585.68046 35134.81629 93.48%

:!
VANELLUS M 30 Sum of Yld_VOlume_Utres_ 0 0 0Sum of Ytd Contribution Net Margin 0 -18881.3 0
VANELLUS M 40 Sum of Ytd Volume Utres 0 0 0
Sum of Ytd Contribution Net Margin -21 0 0.00%(blank) Sum of Ytd_VOlume_Utres_ 0 0 0
Sum of Ytd Contributlon Net Margin -5n246.79 -714345.93 123.75%(blank) Sum of 0 0 0Ytd Volume Utres(blank) Sum of -5n246.79 -714345.93 123.75%Yld Contribution Net Margin
Vanellus 8649382 mOS78 89.84%Sum ofYld_Volume_UtresVanellus Sum of 20554115.17 20924374.47 101.80%Ytd Contribution Net Marcin

Annuure C: Technical Data Sheet.
ApplicationsViscoBakkle 15W-40 Is a premium quality versatileengine 011 specifically designed to meet the demands ofcompact diesel engines. The edvanced formulation ofViscoBakkle uses high quality base oils combined with aperformance enhancing chemical additive system toprovide excellent engine protection.
Main Benefits• Excellent soot handling characteristics, to preventslUdge formation;• Veryhigh levels of enginecleanliness and weerprotection in high performance tUrbocharged andnaturally aspirated engines:- Superior performanceassures extended enginereliability andoperational economy;• Excellent high temperaturestability and oxidationresistance minimises the formation d lacquers anddeposits:
SpecificationsAPICH-41 CG-4 1CF-4 1SJACEAB3/AJ
StorageAll packages should be stored under cover. Whereoutsidestorage Is unavoidable drums should be laidhorizontally to 8VOId the posSible Ingress of water
Visco BakkieA tough motor 011 for the working vehicle
Visco Bakkle has been specifically formulated with highsulphated ash to su~ theappetite for the Japanese highspeed diesel engine.Visco Bakkle Is suitable for use In normally aspirated endturbochargeddieselengines (API CH-4) and It'sadvanced formulation with API SJ gasoline engineperformancemake ~ Ideally suited to mixed fleeteppllcatlons
• Advanced formulation provides excellent dispersancyend protects against low temperature sludge formation;• High levels of bothdiesel and gasoline performancemake Visco Bakklesuitable forapplication In mixedneels where productrationalisation Is required.
Mercedes-Benz Sheet 'n7.1 &'n8.1SABS 151611517
end the oblltet'lltlon d drummarkings. Products shouldnot be stored above6O'C, exposed to hot sun or freezingconditiOns.

Health, Safety and EnvironmentHealth, l8fety and environmentallntormatlon Is providedtor this product In the Materials Safety Data Sheet. Thisgives details of potential hazards, precautions and FirstAid measures, togetherwith environmental effects anddisposal of used products.
2
The British Petroleum Company p.l.c. or its subsidiarieswillnot accept liability If theproduct is used other than Inthe manner or with the precautions or for the purpose/sspecified. Beforetheproduct Isused other than asdirected, advice should be obtained from the localBPoffICe.
Visco BakkieA tough motor011 for the workingvehicle
Typical Characteristics
Te.t Methods Units Grade:
15W-40
Density at20C ASTM 01298 kgJJ 0.8836
Flashpoint (CeC) ASTM 092 C 220
Kinematic Viscosityat40·C ASTM 0445 mm2ls 104at 1OO·C ASTMD445 mm2ls 14.4
Absolute viscosity ASTM02602 cP 3310
Viscosity Index ASTM02270 141
Pour Point ASTM097 C -24
Sulphated Ash ASTM 0874 "'mass 1.59
Total Base Number ASTM 02896 mgKOHlg 13.0
calcium AA %(mlm) 0.430
llnc AA %(mlm) 0.130
Phosphorus XRF %(mlm) 0.115
'lMDIla__,",-._.~ID"'_"""_'"poII'*lf 110 .......... '.__ ......,..__ ......-.tyooCOll'iiJlllllO-"' _ .....-.- ..-...-
.....UNft~ pIOlIudI..." --~.............__ ID-..., ....-- ...,.-No___.... ........-.llIIIlIMCllI'IIIII*I•• ....--..' .....111.._01_... _ ..............,ID,.-...,..--..__.--
n. M IooMy...... -....--.t.nMy........01 ---.. ..__ ......
__~_... _tNlI .... IfrecI...,-, "' .....d .......-~-*l8P~ AIrfca IPTYl Llil..T_ ......II 8l000Ip'.a.CapeT_lOOlPO.. llOO8IloggoMM llO1:l...-.-Tal .• '11 :ll «II :lltll

Annexure D: Conjoint Value Analysu, Utility Ratings
TOTAL MARKET Utility RankingVanellus 2.537105 1Castrol 2.283441 2Rimula 1.781118 3Dleselube 1.589424 4011 that reduces enalne wear 1.431764 5Delvac 1.335913 6011 that auarantees aaainst enalne breakdown 1.311319 7A long life 011 1.295397 8Complete ranae of all for all my needs 1.285349 9Aalp 1.238114 10Meets or exceeds OEM specifications 1.238114 11Purchase both fuel and lubricants from one company 1.238114 12R7.80 per Inre 1.238114 13Good technical support 1.237638 14Sasol 1.232297 15Delo 1.218437 16Easllvavailable 1.197616 17Equipment provided for workshop 1.195769 18The most advanced 011 1.184812 19011 that ensures Increased engine power 1.173079 20Excellent customer service 1.158773 21011 that ensures good fuel economy 1.156157 22Rubia 1.155397 23Suitable payment and credit terms 1.148865 24Zenex 1.128048 25R8.60 per Inre 1.126585 26R6.20 per litre 1.093886 27Ensures lowall consumption 1.093367 28R9.00 per litre 0.994821 29R9.40 per litre 0.908284 30

USERS Utility RankVanollus 3.397284 1Castrol 2.326404 2Rimula 1.616781 3Dleselubo 1.563781 4011 that reduces enalne woar 1.369378 5011 that guarantees acalnst enolne breakdown 1.33o.c59 6Delvae 1.262358 7A long life 011 1.257488 8Complete range of all for all my needs 1.250229 9Aglp 1.246771 10Meets or exceeds OEM specifications 1.246771 11Purchaseboth fuol and lubricants from ono company 1.246771 12R7.80 per litre 1.246771 13Easily available 1.237413 14Suitable pavment and credit terms 1.235028 15011 that ensures Increased engine power 1.216882 16Excellent customor service 1.197606 17Sa501 1.186138 18Delo 1.16544 19011 that ensures cood fuel economy 1.165037 20The most advanced 011 1.156706 21Zenex 1.154385 22R8.60 per litre 1.147963 23Good technical support 1.145633 24Equipmentprovided for workshop 1.093413 25Ensures low 011 consumption 1.072789 26R8.20 per litre 1.062798 27R9.00 per litre 0.958688 28Ru~a 0.913183 29R9.40 per litre 0.835514 30
2

LAPSED USER Utility RankCastrol 2.278278 1Vanollus 1.~S37 2Rimula 1.8727llG 3OIOS4)lubo 1.718G07 4Rubfa 1.8e2148 5Oolvac 1.40&37 8011 that nlduces cmolne woar 1.383574 750501 1.3eM48 8Good lechnlcal suDClOrt 1.348~4 80010 1.341574 10ComPlete range of allfor all my neGds 1.322722 11A long life oU 1.31542& 12Excallent customer service 1.275407 13Equipment DroVldod forworkshop 1.238704 14Tho most advancod all 1.22788" 15Ensuros lowallconsumption 1.22038" 18Easily ovallable 1.215648 17AQlp 1.209852 18Moots or exceeds OEM SDOdfieatlons 1.209852 18Purchasobolh fuel and lubr1cantsfrom one comDBnv 1.209852 20R7.80 par litre 1.209852 21R9.00 par litre 1.181444 22OU that onsures aood fuol oconomy 1.1455 23R8.20 per litre 1.13537 24R8.eo per litre 1.12783 255ultabfo payment and credit terms 1.115S144 28OUthat auaramees against onalno bnlakdown 1.08075" 27R9.40 per litre 1.078852 28OU1M! ensures lnaoasod onaloo DOWOr 1.0735"3 28Zonox 1.oe~07 30
1

NON-USER Utility RankCastrol 2.216712 1Rimula 1.895727 2011 that reduces engine wear 1.574227 3Vanellus 1.571879 4Dleselube 1.5275 5011 that ouamntees against encine breakdown 1.468348 6Delvac 1.399742 7A long life all 1.341652 8Equipment provided forworkshop 1.329682 9Complete range of 011 for all my needs 1.312773 10Good technical support 1.298515 11Aglp 1.246939 12Meets or exceeds OEM specifications 1.246939 13Purchaseboth fuel and lubricants from one company 1.246939 14R7.80 per litre 1.246939 15Delo 1.205212 16SaseI 1.198606 17The most advanced oil 1.195985 18011 that ensures Increased engine power 1.182167 19011 that ensures oood fuel economy 1.150212 20Rubia 1.140803 21Zenex 1.13253 22Easily available 1.117136 23R8.20 per litre 1.111288 24R8.60 per litre 1.090424 25Suitable payment and credit tenns 1.0335 26Ensures low 011 consumption 1.023424 27Excellent customer service 0.999212 28R9.00 per litre 0.918167 29R9.40 per litre 0.888909 30

Annexure E: Regmsion Analysis Tables
UDPO - Uaer8hlp: U8er8 -I, I11P8tid and non-uae r s -0Orlver8 ot u8erehlp
MGLII>MOOEL UOPO - CONSTANTtATltAT2tAT3tAT4tAT5tAT6tAT7tATOtAT9tATI0>ESTIMATE
TUE 20/06/00 1\: 41:47 AM 1l:\DPSA-l \SIlUTTL-I\DATA\CVA\SIIUT3.SYS
OEP VAR: UDpD N: 233 MULTIPLE R: 0.581 SQUARED MULTIPLE R: 0.337AOJUSTEO SQUAREO MULTIr'LE R: .307 STANDARD F.RROR or ESTIMATE: 0.417
VARIABU: COErnCIENT 5TO ERROR STO COEr TOI.l:RANCE T 1'12 TAIL)
CONSTANT -0.125 0.247 0.000 -0.509 0.612ATI 0.397 0.204 0.119 0.819 1.949 0.053AT2 0.166 0.017 0.636 0.692 9.602 0.000AT3 -0.027 0.031 -0.060 0.500 -0.961 0.307AT4 -0.033 0.023 -0.106 0.572 -1. e61 0.146AT5 -0.031 0.029 -0.087 0.476 -1.0ge 0.275AT6 -o.ors 0.021 -0.1!>5 0.590 -2.162 0.032AT7 -0.019 0.027 -0.206 0.596 -2.991 0.004I\T8 0.039 0.030 0.086 0.669 1.271 0.205AT9 -0.013 0.031 -0.032 0.496 -0.412 0.601I\TlO -0.009 0.026 -0.025 0.511 -0.326 0.145
ANALYSI S Or VARIANCE
1
SOURCE SUM-Of-SQUARES or M£/\N-SOUARE
REGRESSION 19.216 10 1.929RESIOUAL 37. ge2 218 0.1 H
r-RATIO
11. 104
r
0.000

HODEL UOPO • COtlSTANT+ATll+AT12+AT13+AT14 +ATI 5+ATl6+AT1"'A1'18>ESTIHATE
TUE 20/06/00 11 :45:41 AM II: \BI'SA-l \SIlUTTL-I\DATA\CVA\SIlUTJ.SYS
DEl'VAR: UOPD N: 233 HlJI.TIPLE R: 0.146 SQUARED MULTIPLE R: 0.021ADJUSTED SQUARED MULTIPLE R: .000 STANDARD ERROR or ESTIMATE: 0.504
VARIABI.E COEFfICIENT STO FoRROR STD COEr TOLERANCE T 1'12 TAIL)
CONSTANT 0.243 0.306 0.000 0.792 0.429ATll 0.220 0.253 0.066 0:117 0.873 0.384ATI2 -0.012 0.053 -0.022 0.460 -0.220 0.826ATI3 -0.049 0.O4!> -0.110 O.HO -1. 090 0.2"17AT 14 -0.021 0.048 -0.046 0.401 -0.434 0.665AT15 -0. 0~2 0.050 -0.099 0.502 -1.04~ 0.297AT16 0.030 0.051 0.063 0.298 O. ~16 0.606liT11 0.066 0.061 0.17.5 0.339 1.089 0.21"1IIT19 0.011 0.043 0.039 0.483 0.402 0.698
/lNAI.YSIS O~' VARIANCE
2
SOURCE SUM-OF-SQUARES or Hf.AN-SQUARE
REGRESSION 1.220 9 0.1~3
RESIDUAL 55.898 220 0.254
r-RATIO
0.600
P
0.171

>MODEL UDPO • CQjSTANTIAT19+AT20+AT21 +AT22+AT23IAT24+AT25>F.STIHATE
TUE 20/06/00 11:16:17 AM 1l:\BPSA-l\SIlUTTL-l\OJ\TA\CVA\SIlUT3.SYS
DEP VAR: UOPD N: 233 MULTIPLE R: 0.273 SQUARED MULTIPLE R: 0.074ADJUSTED SQUARED MULTIPLE R: .045 STANDARD ERROR or ESTIMATE: 0.489
VARIABLE COF.f'FlCIENT STD ERROR STD COEr TOLERANCE T PI2 TAILI
CONSTANT 0.199 0.288 0.000 0.689 0.491AT19 0.311 0.239 0.093 0.817 1.299 0.195AT20 0.101 0.052 0.222 0.361 2.061 0.041AT21 -0.151 0.061 -0.245 0.424 -2.459 0.015AT22 0.061 0.049 0.123 0.520 1.369 0.1731'.123 -0.021 0.059 -0.046 0.426 -0.165 0.642AT24 0.029 0.061 0.045 0.455 0.169 0.640AT25 -0.102 0.045 -0.174 0.699 -2.243 0.026
ANAI.YSIS or VARIANCE
3
SOURCE SUM-or-SQUARES or MEAN-SQUARE
REGRESSION 4.251 7 0.601RESIDUAL 52.861 221 0.239
r-RATIO
2.539
P
0.016

HODEl. UDPD - cotlS'fANTtAT26tAT2HAT28 tAT29tATJO>ESTIHATE
TUE 20/06/00 11:16:51 AM 1t:\OPSA-l\SIIUTTL-l\DATA\CVA\SItUT3.SrS
OEP VAR: UOPD N: 233 MULTIPLE R: 0.181 SQUARED HULTIPLE R: 0.033ADJUSTED SQUARED HULTIPLE R: .011 STANDARD ERROR OF ESTIMATE: 0.498
VARIAB1.E COE:FFICIENT STD ERROR STO COEr TOLERANCE T Pl2 TAIL)
CONSTANT 0.150 0.292 0.000 0.516 0.607AT26 0.28" 0.246 0.086 0.801 1.110 0.243AT21 -0.120 0.011 -0.145 O. !l04 -1.561 0.119AT28 0.110 0.015 0.261 0.314 2.275 0.024AT29 -0.001 0.058 -0.002 0.393 -0.015 0.988AT30 -0.099 0.060 -0.198 0.299 -1.614 0.102
ANAI.YSIS Of' VARIANCE
4
SOURCE SUH-Of-SQUARES Dr Mf:AN-SQUFlRE
RE:GRESSION 1.865!J 0.373RE:SIDUAL 55.253 223 0.248
F-RATIO
1.506
p
0.189

CUSSIZE- customer !llze: llmall -11 medium -21 large -3
MODEL CUSSIZE - CONSTANT+AT1+AT2+AT3tAT4+AT~tAT6+ATHAT8+AT9tATIO>ESTIMATE
TUE 20/06/00 11:49:02 AM 1l:\OPSA-l\SIIUTTL'I\DATA\CVA\SIlUT3.SYS
DEP VAR: CUSSIZE N: 233 MULTIPLE R: 0.333 SQUARED MULTIPLE R: 0.111ADJUSTED SQUARED MULTIPLE R: .070 STANDARD ERROR OF ESTIMATE: 0.731
VARIABLE COEFfICIENT STD ERROR STO COEr TOLERANCE T Pl2 TAIL)
CONSTANT 0.934 0.434 0.000 2 .1~4 0.032ATl 0.647 0.357 0.128 0.818 1. 809 0.072AT2 -0.078 0.030 -0.198 0.692 -2.581 0.011liT3 0.082 0.055 0.136 0.500 1.509 0.133liT4 0.041 0.040 0.088 0.572 1.039 0.300liT5 -0.153 0.050 -0.283 0.416 -3.051 0.003liT6 0.006 0.037 0.014 0.590 0.163 0.871liT7 0.043 0.048 0.014 0.596 0.892 0.313liT8 -0.010 0.053 -0.104 0.668 -1.337 0.183liT9 -0.040 0.054 -0.066 0.496 -0.728 0.468IIT10 0.094 0.046 0.181 0.511 2.022 0.044
ANALYSIS OF VARIANCE
5
SOURCE SUM-Of-SQUIIRES or MEAN-SQUIIRE r-RATIO P
REGRESSIONRESIDUAL
14.567 10116.621 218
1. 4570.535
2.723 0.004

>HODEL CUSSIZE - CONSTANTtATlltATlZtATI3tATUtATl!>tATI6tATPtATI8>ESTIHATf:
TUE 20/06/00 11:49:38 AM II: \UPSA~ 1 \SIlUTTL-1 \llATA\CVA\SIIUT3.SYS
OEP VAR: CUSSIZE H: 233 HULTIPLE R: 0.15!> SQUARED HULTIPLE R: 0.024ADJUSTED SQUARED MULTIPLE R: .000 STANDARD ERROR or ESTIMATE: 0.763
VAR I ADU: COEffICIENT STD £RROR STD coar TOLERANCE T PI2 TAI1.I
CONSTANT 1.158 0.464 0.000 2.496 0.013ATll 0.389 0.302 0.077 0.771 1.018 0.310AT12 -0.042 0.081 -0.051 0.460 -0.521 0.603ATI3 0.020 0.060 0.041 0.440 0.410 0.682AT14 0.003 0.072 0.004 0.401 0.041 0.96'1ATI5 0.066 0.076 0.061 0.502 0.863 0.389ATI6 0.093 0.007 0.131 0.298 1.073 0.204AT 17 -0.140 0.092 -0.174 0.338 -1.516 0.131ATI0 -0.022 0.065 -0.033 0.483 -0.342 0.733
ANALYSIS 0.' VARIANCE
6
SOURCE SUH-or-SQUARES or HEAN-SQUARE
REGRESSION 3.166 8 0.396RESIDUAL 128.022 220 0.582
r-AATIO
0.680
P
0.709

MODEL CUSSIZE • CONSTANTtAT19tAT20tAT21 tAT22tAT23tAT24tAT2!i>ESTlHATE
TUE 20/06/00 11:~0:10 AM 1I:\DPSA-1\SIIUTTL~1\OATA\evA\SHUT3.SYS
DEP VAR: CUSSIZE N: 233 MULTIPLE R: 0.280 SQUARED MULTIPLE R: 0.018ADJUSTED SQUARED MULTIPLE R: .049 STANDARD ERROR or ESTIHJ\TE: 0.140
VARIABLE COEFrICIENT STO ERROR STD COEr TOLERANCE T Pl2 TAIL)
CONSTANT 1. 046 0.436 0.000 2.400 0.011AT19 O. 4~2 0.361 0.089 0.011 1.250 0.213AT20 -0.140 0.018 -0.192 0.361 -1.190 0.015AT21 0.211 0.093 0.226 0.424 2.273 0.024AT22 -0.219 0.015 -0.263 0.520 -2.940 0.004AT23 0.009 0.000 0.010 0.426 0.10~ 0.917AT24 0.069 0.093 0.012 0.45!i 0.148 0.455AT25 0.013 0.060 0.002 0.699 1.062 0.290
ANALYSIS OF VARIANCE
7
SOURCE SUM-or-SQUARES or MEAN-SQUARE
REGRESSION 10.215 1 1.468RESIDUAL 120.913 221 0.541
r-RATIO
2.683
P
0.011

>MODEI. CUSSIZE - CONSTANT+AT26+AT27+AT28+AT29IAT30>ESTIMATE
TUE 20/06/00 11 :~0:39 AM 1I:\UI'SJ\-I\SIIUTTL-I\DATA\CVA\SIlUTJ.SYS
DEP VAR: CUSSIZE N: 233 HULTIPI.E R: 0.199 SQUARED MULTIPLE R: 0.040ADJUSTED SQUARED MULTIPLE R: .018 STANDARD ERROR or ESTIMATE: 0.752
VAAIADLE COErnCIENT STD ERROR STD COEr TOLERANCE T PI2 TAIL)
CONSTANT 1.456 0.441 0.000 3.304 0.001AT26 0.124 0.371 0.024 0.801 0.334 0.739AT27 0.239 0.116 0.191 0.504 2.061 0.040I\T28 -0.216 0.113 -0.286 0.314 -2.09 0.016I\T29 -0.036 0.087 -0.043 0.393 -0.411 0.681I\T30 0.120 0.091 0.158 0.299 1.315 0.190
FlNI\I.Y:;I:; OF VARIANCE
8
SOURCE SUM-or-SQUARES or Hf:J\N-SQUI\RF.
REGRESSION 5.211 5 1.042RESIDUAL 125.917 223 0.565
r-RATIO
1. 845
p
0.105
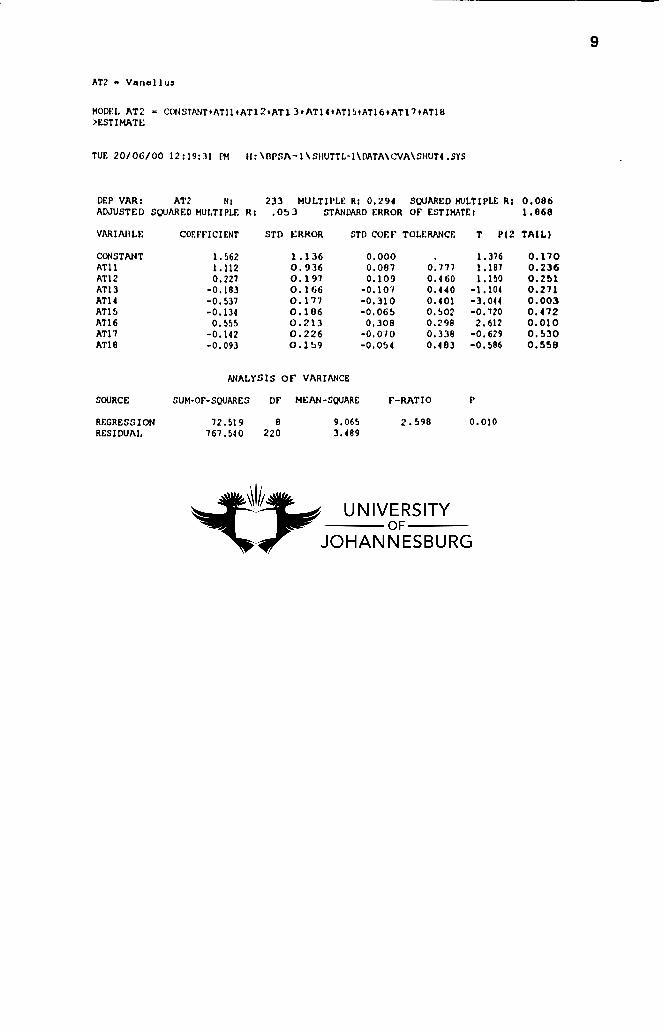
AT2 - Vanell U3
HODEL AT2 - CONSTANT t liT11tAT12tllT13tATl HilT! ~tAT16t1\T17 tllT18>ESTlMATE
TUE 20/06/00 12:19:31 PH 1I:\OPSI\-1\SIIUTTL-l\DATA\CVA\SIlUT4.SYS
DEP VAR: I\T2 N: 233 MULTIPLE R: 0.294 SQUARED MULTIPLE R: 0.086IIDJUSTED SQUIIREOMULTIPLE R: .053 STANDJIRD ERROR or ESTIMATE: 1.868
VARIAOLE COF.FrICIENT STO t:RROR STD COEr TOLERANcr. T Pl2 TAIL)
CONSTANT 1.562 1.136 0.000 1.376 0.17011TH 1.112 0.936 0.087 0.771 1.191 0.236AT12 0.227 0.197 0.109 0.460 1.150 0.2!>1IIT13 -0.183 0.166 -0.10" 0.440 -1.104 0.271AT 14 -0.531 0.177 -0.310 0.401 -3.0" 0.003IIT15 -0.134 0.106 -0.065 0.502 -0.120 0.472IIT16 0.555 0.213 0.308 0.298 2.612 0.010liT17 -0.lC2 0.226 -0.070 0.338 -0.629 0.530AT18 -0.093 0.159 -0.054 0.403 -0.586 0.5!>8
ANALYSIS of" VARIANCE
9
SOURCE SUM-OF-SQUARES Dr MEAN-SQUARE
REGRESSION 72.519 8 9.065RESIDUAl. 767.540 220 3.489
r-AATIO
2.598
p
0.010
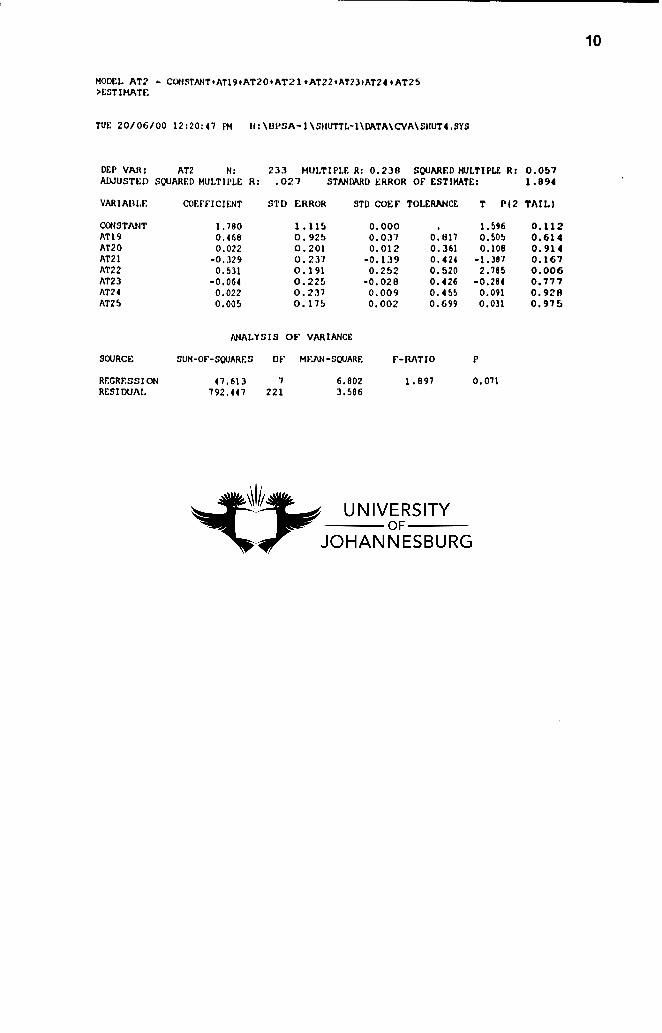
MODEl. AT2 • COOSTANTtATl9tATZOtAT21 tAT22tAT2JtATZ. tATZ!>>£STIHATr.
"UE 20/06/00 12 :20: n PH II: \OPSA-I \SIIUTTL-l \ DATA\CVA\ SIlUT4 .SYS
DEP VAR: AT2 N: 233 MULTIPLE R: 0.238 SQUARED MULTIPLE R: 0.0!>7ADJUSTED SQUARED MULTIPLE R: .027 STANDARD ERROR or ESTIMATE: 1.894
VARIAOU: COEffICIENT SrD ERROR STD COEr TOLERANCE T Pl2 TAIL)
CONSTANT 1. 780 l.ll!> 0.000 1. ~96 0.112ATl9 0.468 0.92!> 0.03"/ 0.817 O. ses 0.614AT20 0.022 0.201 0.012 0.361 0.108 0.914AT21 -0.329 0.23'1 -0. 1J 9 0.424 -1. 387 0.167AT22 0.~31 0.191 0.2!>2 0.!>20 2.7e!> 0.006AT23 -0.06. 0.225 -0.028 0.426 -0.20. 0.777An. 0.022 0.237 0.009 O. 4!>~ 0.091 0.928AT2!i 0.005 0.175 0.002 0.699 0.031 0.97 !>
ANALYSIS 0.' VARIANCE
10
SOURCE SUM-or-SQUARES Dr Mr.AN-SQUARE
Rf:GRESSION .7.613 'I 6.802RESIDUAl. 792.U1 221 3.!>86
F'-IV\TIO
1. 891
P
0.071

MODf.L AT2 - CONSTANT. AT26.AT27 t AT28. AT2 9tAT30>f.STIHATE
TUE 20/06/00 12:21:16 PH 1I:\UPSA-l\SIIUTTL-l\DATA\CVA\SIIUT4.SYS
DEP VAR: AT2 1'1: 233 MUl,TIPLE R: 0.263 SQUARED MULTIPLE R: 0.069ADJUSTED SQUARED MULTIPLE R: .049 STANDARD ERROR of ESTIMATE: 1. 872
VARIABLE COEfFICIENT STD ERROR STD COEf TOLERANCE T Pl2 TAIL)
CONSTANT 0.198 1.098 0.000 0.121 0.468AT26 1.968 0.924 0.154 0.801 2.129 0.034AT21 -0.458 0.280 -0.14!> 0.504 -1. 588 0.114AT20 -0.643 0.202 -0.263 0.314 -2.281 0.023AT29 0.430 0.211 0.204 0.393 1. 918 0.049AT30 0.111 0.227 0.0!>8 0.299 0.490 0.62!)
ANALYSIS 0.' VARIIINCE
11
SOURCr. SUM-Of-SQUARES Of MEAN-SQUARE
REGRESS I ON 58.319!> 11. 664RESIDUAL 781.141 223 3.506
f-RATIO
3.321
I'
0.006

I
Annexure F: Conjoint Analysis
1. INTRODUCTION
Many applications of conjoint analysis to academic and commercial market and
marketing research projects have been observed since the late 70s. Aboost in the
use of the technique has been observed since the late 80's early 90's and it
coincides with the introduction of several computerized packages for designing the
survey, collecting and analyzing the conjoint data (Wittink et aI., 1994).
The main application of the technique in the marketing field is related to new
product development projects, while market segmentation and pricing studies also
represent a considerable portion of all conjoint analysis applications both in Europe
and in the U.S. (Cattin and Wittink, 1982; Wittink et al., 1994).
Three types of conjoint analysis are available, namely Adaptive Conjoint Analysis,
Choice-Based Conjoint and Conjoint Value Analysis, each with its own advantages
and benefits (www.bb). Conjoint Value Analysis was chosen and a detailed
explanation as to its workings is given. Justine Snider from Research International
in Cape Towngave a substantial amount ofher own input (Snider, 2000).
1.1 Introduction to Conjoint Analysis
Acommon problem faced in research is the need to determine the pricing potential
for products that are made up of discrete additional 'extras' that carry separate
prices. Examples of this are most common in the durable goods area. where
features can beeither costed extras on a 'base' model (e.g. automobiles), or where
a range of pre-formed 'feature bundles' are determined by the manufacturer (e.g.
hi-f], cameras, washing machines) (King, 1991: 3 - 13).
The classic response to this problem hasbeen the use of Conjoint Analysis, which
measures the appeal or 'utility' of the various potential features, and can estimate
the likely appeal of a variety of bundles. Moreover, if 'price' is included as a

2
variable. the 'demand function' for each ofthe options can also be measured. This
makes it a useful tool for pricesetting.
However. there are occasions when this approach does not quite fit the problem in
hand. For example:
• where costs for the features are determined (e.g, by manufacturing). and
where the aim is tofind the best 'mix' offeatures,
• where consumers or customers have individual 'budgets' that they do not
wish to exceed.
• where the manufacturer in recognition ofthis. wishes tomarket a 'range' of
products orservices (e.g. rangingfrom 'basic' to 'luxury' models).
Clearly. some of these conditions can arise together.
By analyzing consumers' declared interestin the alternative features, together with
patterns of inclusion of features into personal ideal packages, key information is
gained not only about the appeal of specific features. but also the way in which
these interact to fonn natural bundles with other features.
Moreover. byconducting this process onan individual basis and then analyzing the
'ideal packages' across a number of respondents, the model isable toarrive at the
best specification for the product (or for a range of products) that will satisfY the
most consumers. as well as accounting for the maximum of their declared budgets
(King, 1991: 3 - 13).
2. FROM FACTORIAL TESTING TO CONJOINT ANALYSIS

Irnauin tit. t oft drink \ nted 10 kn the r I tiv pp dill' nt
cone mtrution of w etener, md lev I of
tin '. It
test ' p rim nt wher two r
arnpl 't
e amination - nam ely th tw
overall app I of tit drink f r tit two mpl , pp I
betw en tit rn could b attribut d t th different on ntration of 'we t n r - nd
we would hav determined tit m t of thi variabl .
How v r, I t u uppo e that w t n r wa not th only i ue 10 b d id d, nd
that th company wa al int re t d in level of carbonation. I rly, it w uld
po ible to repeat the sw t ncr periment, but thi tim varying th I f
carbonation. Thi would certainl mea ure thi variabl a well, but at th c t f
repeating a po sibly e pensiv arn p ling operation.
p rim nt nTlterc would al 0 bc another problem. If we conduct d th
swe tcncr and carbonation in i o lation, we would n
the e variable 'interact' with eac h th r, in th
carbonat d drink, might d p nd up n whether it wa v ry w t or th
or alternatively, that the pr f r n for a we t drin mi ht dep nd up n it I
offizzi n
A urm n th t th r w r t
nnoth w f h, ndlin thi m nuf tur th fI ur
n in t bl I.
Table 1: Combinations of V aria b l s
Variable 1 2 3 4Sweetener High Low High Low

4
____I High , Low , Low I High IlCarbonation
Ifone recruited a separate sample to test each of these variants, one could use a
particular statistical technique known as Analysis of Variance, not just to
determine the contribution of each of the variables and their levels, but also to
determine the degree to which these interacted with each other. This would be a
much more efficient use ofthe data.
Extending this principle, we could examine many more variables than the two we
have looked at so far. However, the more variables we look at simultaneously, the
more the number of possible combinations to test. This poses the problem of
consumers being able to differentiate accurately between the combinations if too
many variants have to be tested. For example, with two variables each at two levels
we have 2 x 2 =4 possible combinations. But in an experiment with, say, 8
variables each at two levels, we would have 2 x 2 x 2 x 2 x 2x 2 x2 x 2 =256
possibilities.
Moreover, if some of the variables had more than two levels, this would lead to
even greater numbers ofpotential products, e.g, 2 x 2 x 3 x 2 x 4 x 2 x 3 x 2 =1152. This full number ofpossible combinations is known as a 'full design' for the
variables being considered. Unfortunately, many problems do have large numbers
ofvariables and levels that need to be quantified,leading to very large full designs.
In these circumstances, itisclearly impossible tomanufacture Oct alone test among
separate samples) this number of possibilities.
In order to cope with this problem, it is possible to test a reduced number of
combinations taken outofthe full design, known as a 'partial balanced design'. This
is a subset of the full design, but with combinations chosen in a very careful way
such that the representation of each variable level, and its pairing with other
variable levels, is balanced so that the analysis is not biased. This end result is
known as an 'orthogonally balanced reduced design'. The entire process of
examining the effect of more than one variable by testing combinations of them is
known as 'factorial testing' (Green and Srinivasan, 1990~ 3 -19).
s
In the late 60's and early 70's, experiments began to be conducted in which the
variables being tested in a factorial experiment were less 'hard' than the kind of
physical product composition type of variable described above, and which did not
require actual product testing by respondents. For example, motorists could be
asked to examine alternative automobile concepts described in tenns of variables
such as 'engine size', 'fuel economy', 'seatcomfort', and so on.
The assumption here was that, with this sort of variable, respondents could
themselves assess their likely level of liking orpreference from a simple description
of its composition, rather than test a complete physical example. Moreover, the
variables used need not even be so hard as to involve a physical issue (such as
engine size) - an example in the airlines sector might include variables such as
'quality of food', 'punctuality', 'pleasantness ofair-hostesses', and so on (Buros and
Blackall, 1992).
In terms of the analysis of such experiments, a further refinement was possible in
circumstances where it was not expected that any of the variables tested were
likely to interact with each other - a condition known as 'independence'. In these
circumstances the aim oftheanalysis is to measure the 'main effect' ofeach variable
and its levels, and the major benefit of this approach is that, with no interactions
between variables tomeasure, the number ofproduct concepts required to measure
the main effects can bevery much reduced (Green and Srininvasan, 1990: 3 - 19).
Another development dating from the 1970's involved the scope of the analysis
itself. In conventional factorial product testing, theaim of theanalysis is to identify
the main effects (and possibly interactions too) at the aggregate level - that is to
say, average values derived across the sample. In contrast, the aim ofthe reduced
design main-effects experiments is to identify the main effects values for each
individual in the sample. This approach has considerable implications, as will be
described below, since it makes possible not just the identification ofsegments of
individuals with similar values, but also the possibility of a wide range of modeling
activity.

6
• A reduced design is used (except on the simplest experiment),
• Analysis is for main effects only,
• The analysis isconducted for every individual in thesample,
• Modeling and segmentation analysis is commonly applied to the resulting
individual values.
Conjoint analysis is a particular method of analyzing experimental data in such a
way that the contributions of different experimental conditions can be
systematically separated and quantified. Its origins derive from a classical form of
statistical analysis known as •Analysis of Variance', and factorial designs (Alford et
aI.,1992).
2.1 Conjoint Importance
In many senses, therefore, conjoint analysis is the best technique for measuring
attribute importance's - partly because it is an 'indirect' method (that is, it does not
ask the respondent to think about what is important, only what is preferred) that
obtains a measure of importance by 'decomposing' stated preferences so that the
importance ofcontributory factors can beinferred (www.bb).
At the same time, conjoint analysis also scores over other methods of measuring
importance by specifically dealing with stated levels of attributes, rather than
dealing with them as complete entities. This is extremely important in customer
satisfaction measurement, where it is often insufficient to indicate that a particular
service area is important - it is also necessary to provide an operational definition
ofany breakpoints that apply. For example. it might not be enough to know that
opening hours is an important service dimension for banking • we also need to
know the relative appeal ofdifferent bands ofopening (www.bb).
1.2 Identification and Measunment ofKey Decision Criteria

7
In order to be able to understand the detenninants of consumer choice. of which
customer service is but one, we need to understand the fuJI range of variables
involved, and their hierarchical relationships. One way of classifying choice criteria
is to separate them into the macro issues that transcend the product, and the micro
issues that represent the specification of the product itself.
One of the most obvious criteria of consumer choice is that of the Branding
attached to the product or service. In market research, this is nonnaJly either the
traditional notion ofa manufacturer's brand (Marlboro, Persil, Sony) or the name
of an organization providing service (British Airways, Taco Bell). The
characteristics ofthe branding process have lent these names an equity based upon
their symbolic value, where the symbolism acts as a shorthand for other qualities
such as dependability, personality, advertising recall etc. (Green and Srinivasan,
1990).
Another macro issue must be price itself. This, after all, is a bottom line topic
against which all the other components must be weighed. Price can be simple and
unitary (e.g. the price tag attached to most grocery products), or can be complex
with elements that trade off against each other. Examples of the latter might be
many financial products. Another might be mobile phones, where at least three
pricing elements (handset cost, monthly charge, and call rates) operate (Wittink et
aI.,1994).
It is against these topics (or topics like them) that service stacks up. In research
terms, it is useful tokeep service separate from issues of product specification (the
micro variables) since service is often a context within which products (possibly
changing overtime) are evaluated (parasuraman et al., 1984).
In this study usc was made of four Macro issues, namely Brand level, Technical
Specifications, Support(Service)/Company and Price.

8
In addition to the macro issues that operate at a global level, the specific
characteristics of products must also be taken into account as variables that
consumers use for decision making. A wide variety of criteria are encountered in
product design, ranging from the emotional to the physical or functional. These
have a role to play even in service lndustriea- for example, type of aircraft for
airlines, or regularity ofstatements in banking.
2.3 Designing theeVA
The computer program identifies the unique set of importances (or utilities) for
each respondent by a series of iterative questions, the nature of which are
determined by the preceding answers. Aswell as providing accurate measures, the
task also has the benefit of sustaining interest among respondents (Alford et al.,
1992).
An example of the type ofquestion posed by the computer is shown in figure 1.
However, for many researchers, the most appealing feature ofconjoint analysis is
that it can be used as a model, in which different product configurations can be
simulated to provide a rich source of management information. Using a conjoint
simulation model, organizations can identify those strategies which appear to offer
the greatest benefit, in terms of providing customer satisfaction, product feature
optimization, or even optimal pricing. Moreover, given cost data from within the
organization, themodel output can be used as input into a costlbenefit analysis to
provide a shortlist for strategy options.

'8
Suppll.r ACOlt AArrlng.d In1wtlk
.tc.
'12
Suppll.r BCOltCArrlng.d In 2-3d8YI
ete.
9
1 .... 2 .... 3 .... 4 .... 5 .... 6 .... 7 .... 8 .... 9Strongly
prefer left
Indifferent
Indicate on the scale yourpreference between the two
items
Strongly
prefer right
Figure I: Semantic Differential Scale Used In Conjoint Analysis.
(Source: ResearchInlcmationnl.2(00)
Hitherto, conjoint analysis has been applied toa small part of the entire set of key
choice criteria (www.bb),
2.4 Applying Conjoint Analysis to Measure Key Choice Criteria
Historically, conjoint analysis has most often been applied to product features,
although other macro issues such as branding and price have sometimes been
included in studies. However, recent thinking has tended to move away from using
classical conjoint approaches in studies that mix macro and micro variables, on the
grounds that micro variables do not naturally trade-offagainst macro ones; and
that the process tends tounderestimate the importance of themacro issues, given
the many micro ones ina typical study.
This distortion can be quite severe, and has been shown to result in price
elasticities (for example) that are considerably lower than what might be expected
from the market from which they arc derived.
The solution to the problem, as pioneered by Research International, is known 8S
dual scaling. This essentially presents thetask to the respondent as two conjoints •

th fi r t Ifl nJ int m nu pr du t fe tur n11
tit n
-t, but in ludin 'unon I the rnond bein
d t rmin d bundle of micr
the utiliti
III th 111 ro ntin tit
pond nt, but with ut th dist rti n th I
produ f atur
attribut i thu
f d tn icro th ,t
uld
b incurr d ifth 'y hid be n in Iud d in a comm n I sk www.bb).
This i hown in figur 2:
'MICRO'
'MACRO'
PRODUCTFEATURES
BRAND
PRICE
SERVICE
Fi mre 2: Du: I lin hint m: ti ru1,2000)
2. D t olle tion
Alth u h Ih principl of th r imil r, f di r nt m th
i. t f r c II tin inf rill ti n r m r p nd nts.
Th principl on ar :

11
• Full concepts
• Pairwise grids
• Computer elicitation
The method used in this research is computer elicitation.
The most recent fonn ofelicitation to emerge is one where respondents are asked
to make choices between combinations of attributes and their levels which are
chosen bya computer (Alford et aI., 1992;www.bb).
It may seem at first sight that this is no more than a sophisticated recording method
where the underlying system is still a full concepts or a pairwise approach.
However, this isnot the case, since the computer need not administer a fixed list of
attribute choices by rote, but can be allowed to compute from previous answers
given the next attributes to present to the respondent. This can be done on the
basis of the 'information gain' that would arise from obtaining data on some
attributes rather than others.
Conjoint enables respondents to be given a much more appropriate task to
complete, namely stating their preferences between different packages of features.
Analysis is then able to decompose these preferences into measures of the value
attached to the features involved.
The major output from conjoint analysis is a measure of the value attached to
different items, which form part of a package. These items are levels, or different
options of a series of features or attributes, which arc the component parts of the
product or service under study. The value attached to each feature is what drives
customers' preferences for one combination of features relative to another. The
difference in thevalue attached to the levels ofeach feature, provide a measure of
the importance ofthat feature, in terms of its ability to drive customers' preference.
Because these measures arc calculated at the individual level, mean scores can be
run for anygiven group ofrespondents(www.bb).

12
2.6 Analysis
As previously stated, the main aim ofconjoint analysis is to obtain estimates of the
'main effects' of the variables being examined - which canbe regarded as measures
ofthecontribution or importance ofthem in determining preference.
The usual terminology for describing such conjoint importance weights is in terms
of'utilities'. Thefact that these are fractional numbers (i.e. they arcexpressed with
decimal places) may seem odd, especially since the elicitation procedures may ask
for nothing more than rank orders ofpreference (Burton, 1975).
The way in which this is done is illustrated in figure 3, taking as an example a
single pair-wise grid oftwoattributes: shape (square/round) and size (large/small).
SHAPE
SIZE Square Round
Large J 2
SmaJl 3 -I
Figure 3: Pairwise Grid ofAttributes. (Source: Research International, 2000)
In figure 3, the respondent has taken the Large-Square option as the most
preferred (i.e. rank I) and the Small-Round option as the least preferred
(i.e. rank 4) one.
Aconjoint analysis of this single pair-wisegrid might assign the following utilities:
Table 2: Pair-wise Utilities in Grid Format

Size ShapeLarge +100.0 Square 50.0Small -100.0 Round -50.0
The utility value have a numb ' f v 'ry lJ ·fiJl pr p rti
II) Reproducibility of datil - t ilit value ar d riv d by 'd mp In
re p ndent' tared pref r n into e timatc
tati tical m thods C<1n bud t do thi - of
(M NAN VA), multipi
few.
ion, and lin ir pro rarnrnin , to n m but
If th e timate are good, th y h v an important pr p rty - th can bud t
recon truct the original pr fercnc . Take for e mple tabl ' 2 above. n th
utility values calculated, it i po ibl to calculat th 'utili t urn' for ach f th
four choice , a follow (Table ):
Table 3: Rank Order of Prefere nce
'.Combinations ,Rank Utility SumLarge/square 1 +150.0Large/round 2 +50.0Small/square 3 -50.0Small/round 4 -150.0
A can b
orderin
n, th origin ) r n
urn . " hi
p<prVM in th
IIlC imul
ill
II
m htc , th
mi ht
, it mightIn p
arbitr , inc quit i nifi nt
th ir abilit to r
Ihattribut
of attribut r ws, th a tu I lu . thai would

14
system get more and more precise - in fact, turning rank values into 'real' fractional
values (Table 3 and Figure 3).
b) Scaling - As can beseen, the values within an attribute span both positive and
negative ranges. This is arbitrary, and indeed utility values are often expressed
purely as positive numbers. The main point is that they can be expressed in a
variety of ways (Table 3).
c) Relativity - However, although they can be scaled differently, they have one
important property in common: ratios between levels are preserved. Thus, the
utility values for Large and Small in the above example could have been
expressed as +100 and -100, +1000 and -1000, +1.0 and -1.0, or even 2 and O.
All these values preserve the central relationship, which is that the utility or
value ofLarge is twice that of Small Table 3).
Moreover, in the two attribute system, the value of going from Small to Large
(200 points) has twice the value ofgoing from Square to Round (100 points). This
is an extremely important point, since it means that importance measures derived
from conjoint exercises are not absolute, but have meaning only in a relative
context alongside other variables collected atthe sametime.
This type of relative value is known in the mathematical world as a 'ratio scale'
having no absolute start or end point. Another common example of such a scale
would be temperature. In the same way that we cannot really say that a
temperature of 60 degrees is 'twice as hot' as a temperature of 30 degrees, we
cannot say that a utility value of +60 is 'twice as important' as a value of +30.
However, in the same way that we can interpret ratios of temperatures, we can
interpret ratios ofutilities.
The best way to interpret utility values, therefore, is in terms of differences
between levels, rather than in absolute terms.

d) p n f tilit • II vin id thi , it i oil Il u ul t id nti th
of the ttributc a wh I , r th th n in t nil fi t Il titu nt I v I .
Thi n be d ne b find in th I P n f utilit
b'tw lue nd th
h ttribut
J h in th
p'f nt in th nt in th t m.
Thu , in ur two attribut
Table 4:Span ofUtilities
200.0 67%100.0 33%300.0
In fact, thi calculation can b don in two way - whieh mi htn t necessari
the am an wer,
The fir t way i to p norm th
m an utilit value . Thi giv
leulation a hown in figur 4, workin n th
umma of th n t em t f r th
itu tion wh r h Ifth m I
I. h
outcom
that f r
lik I t h pp n.
min th rd r
m utin th n
of utilit f r th

"Ihi \ ill pr vide
opini n . i 1.
in itu tion
The I pan of utility' n be a use ul umm ry OJ · ure, but n ~ t bud \ ith
d. n
ult in diller nt v lu , OJ U1 u h
chan ' to thi ( ueh
or cv n different lev I
ttribut
a comp ri on inv lid (Burton: I 7 Iford et I. , I 2).
2.7 Int rpreting Utility V lu
Having conducteda conjoint tud , nd h Yin bt in d th utility v lu d ri d
abov , th ta k of th rc earch r i n w to int rpr t th
In gen ral, th r are thre maj r w of u ing th m nid r,2000).
a) Pr -d fined ubgroup mean
In the arne way that ordinary urv data can b brok n down for ub- up
rag b nd , tc.),analy i (suc h a eompari on of
value can b grouped tog th r nd th m n valu
other roup . This provid
attribut and their I vel mon pr -d fin d r up of int r t - p
mark tin h vi ral r up .
Table 5: Mean Utility Valu
E&.- ~. :", ~ ~~W!) te'EN ,,L •-. ..,."',
•<;.\ Utlnty;~', ~ ....I" Utility•• r" I....\"·~pan
SizeLarge +35.6 46 % +26.4 47%Small -35.6 -26.4

17
ShapeSquare +24.8 32% +18.3 33°hRound -24.8 -18.3
ColourRed +15.4 22% +13.5 20%Green +3.7 -8.2Blue -19.1 -5.3
In table S (a hypothetical) example, despite similar levels of importance attached to
the attributes overall. considerable differences in preference between levels exist
between men and women. While both sexes tend to prefer Large sizes to Small,
this is a greater issue to men than women; and in the caseof Shape. the preference
is actually reversed. Finally. in the case of Colour, while both sexes prefer Red to
other colours. men clearly prefer Green to Blue as their second choice. while for
women bothGreen and Blue take second place toa similar extent.
b) Segmenting utility values
Looking at predefined subgroups of interest is one way to examine the way in
which individuals vary in terms of the importance that they attach to issues.
However, this depends by definition on identifying criteria beforehand for
specifying subgroups that are likely to prove discriminating, in the sense that the
different groups have different importance weights. Naturally. ifthe subgroups are
of no intrinsic marketing interest in themselves. but are merely used to expose
differences between individuals. the risk is that the prior definitions that are used
may not reveal the principle differences between individuals.
Another way is to approach the problem the other way around. Instead of pre
defining the groups of interest, why not approach the problem with a clear mind,
and search forgroupings ofindividuals who are similar in terms ofattaching similar
levels of importance to the sameattributes?

18
This can be done using a particular multivariate technique known as Cluster
Analysis. which searches through the utilities and identifies groups of individuals
having similar patterns of utility values. This can provide a very useful form of
segmentation in marketing terms, since it is essentially able to identify and define
'need groups' that exist in a market. which often provide a more actionable basis to
market studies than other forms of segmentation based on behavioral
characteristics or general attitudes (Snider, 2000).
c) Simulation modeling
The third. and some would consider the most appealing, way ofanalyzing conjoint
values is through the process ofsimulation modeling.
This is made possible by the property possessed by utility values referred to earlier
• that of being able to reconstitute the original order of preferences given by
respondents.
For example, in the case of reduced designs (where respondents were not exposed
toall possible combinations ofattribute levels), itwouldbe possible toestimate the
likely preferences that might be shown towards hypothetical combinations that had
not actually been tested. Moreover. this can be done at the individual level. As an
example, consider the following utility values generated bythree respondents, A, 8
andC.
Table 6: ThreeRespondent Utility Table
A B CSize
Large +55.6 +27.6 -16.9Small -55.6 -27.6 +16.9
ShapeSquare -23.8 +34.5 +48.3
Round +23.8 -34.5 -48.3

Colour
Red +37.1 -12.8 -0 .7Green -27.1 +15.9 -36.1Blue -10.0 -3.1 36 .8
ow, upp th I w w r int r t d in fiv p ibl
tabl 7. It i po ible 10 mputc th 'utilit nun' rr pond nt • n foil w :
Table 7: Utility Packages
described in
I h f the • f r u th
, R89kage, . A ', . 8 ~ C1 Large/square/red 68.9 49.3 31.72 Small/round/green 4.6 -57.5 -67.53 Large/round/blue 69.4 -10.0 -28.44 Large/square/green 4.7 78.0 -4.75 Small/square/blue -89.4 3.8 102.0
Taking the view that the it m with th high t utilit um will offi r a r p nd nt
the be t combination of de ir d pr p rti out of th fiv ndid t th n
a impl mod ling rule would b to t k
item 'ch n': i. . A chao 4, and eh 5.
th
th i
attribut e mbinations i 't t d' n
conjoint
th I bl
ch individu I, th 'b t' pti
umul I d th
Table 8 : Simulat d Choic Sh r
Sample ize =300
litem1 I 24% I

20
Item 2 13%Item 3 35%Item 4 7%Item 5 21%
This kind of modeling is an example of 'micro-modeling' • so called because the
decision process is modeled at the individual level. This makes the modeling
process of particular interest in situations where full account should be taken of
individual differences (e.g. in segmentation exercises). Since no average
importance values are calculated, there is much less danger of an average
misrepresenting the true diversity ofopinion on an issue(Snider, 2000).
In reality, the modeling process can be more sophisticated than the simple account
given above, and various techniques canbe used to mimic:
• Joint choice situations - such as with Respondent A in the example above,
where items 1and 3 have similar utility sums. In these cases, it isunrealistic to
assume that a respondent would radically prefer one to theother, given the very
small difference that might be within the precision of the method. It is possible
to define a resolution factor for a model, which would then take items with
utility sums within a certain band as ~oint choices'.
• Probabilistic choices - such as occur in markets where consumers purchase
from a repertoire of products. In these cases, the aim of the modeling is not to
predict a certain outcome, but the probability of purchase in agiven purchasing
situation. These can be estimated from the ratios ofthe relevant utility sums.
• Respondent weighting. for example in situations where it is advantageous to
weight people according to some criterion, such as heaviness ofconsumption in
the product field, level ofdisposable income, and so on (Snider, 2000~ www.bb;
Alford ct al 1992).
2.8 Using the Data

21
The data canbeexamined in three mainways, discussed below:
• Understanding importances. The apparently complex procedure described above
results in a common set of utilities for all the attributes. These can then be
compared, and an overall understanding of the relative impact ofservice and
otherattributes tothe choice itselfcan beunderstood.
• Customer segmentation: It is by no means necessary to restrict the use of
conjoint utilities to measuring the values attached to features by predefined
groups of respondents. This process can be reversed by using segmentation
analysis to identify groups of respondents who attach values to features in a
similar fashion, and then identifying who these groups are and profiling their
characteristics (Wittink et al., 1994).
•Since conjoint utilities are typically computed at the individual level, they can be
analyzed by various multivariate techniques such as Cluster Analysis to provide an
indication of the natural groupings or segments of consumers that occur within a
market. This approach is an example of benefit segmentation. Such segmentation
exercises are highly thought of, since they in effect map out thedemand groupsin a
market, and directly lead to the development of targeted products, and
optimization procedures in general.
This can often bea valuable means of identifying important market segments who
may have similar needs, but do not coincide exactly with pre-determined groupings
and are therefore difficult to find through conventional analysis (Wittink et ai,
1994).

' i turc 4: Dr akd wn of : R 'I h Inlcrn:llional.2
Th aim would b fir t1y t m nt a ampl on th b i or Ih m cr nj int
variabl a hown in figur , Thi would identif individu wh
than av rage en itivit on m cr pic , In th c
th n n thin cI - thi m nt i or inter t in it If
Other cgrn nt could b id ntifi d in
ervicc, or po ibly arc product fl ture driven. 110 groupin r t
crud to provide much in ight int o what cau d th ir n itivitv. on qu ntl ,
ccondary cgmentation can b applied, In the of th driv n b pr du t
featur , we would utilize th valu from th micr conjoint (\ .bb; lf rd
al, 19 2; Wittink et al., 19 4) ,
It hould b pointed out th t thi
oil n m i r), but that th ut
m nt tion ppro ch ,
particularl n t mpl (th real
m i m r fI u d th n c n
rid i
nti n 1
rim
t nu
n til
th t m
m nt ti n f r til r r h t
d m nd in m rk I,
(or ill-d fin link \ ith fu tur
nj int
nt
III I rin onn f r rmm
of til nj int
n th r. Thi
Th r n th r m r pr ti I r
utiliti , nd thi i b
to 'tr d - ff on attri ut

23
differentiation in the data than is often the case with attitude statements (for
example), and this can in tum lead to a 'cleaner', more understandable (and
ultimately, more actionable) segmentation outcome. It is probably true to say that
needs segmentation via conjoint analysis is one of the most useful applications of
the method.
• Simulation modeling: It is possible to take the use of conjoint utilities a stage
further than the basic analysis which identifies what is important, by
constructing specific scenarios for respondents to consider and simulating the
choices respondents would make when deciding between them (www.bb).
Research International has developed its own simulation program which is able to
use the conjoint data for every individual respondent. Within the model one
creates a scenario in which one can 'design' two (or more) different combinations
of all the features. The program will, for each individual, then calculate which
combination of features is preferred by calculating the total value they assign to
each package. The resultant shares of preference for one or another package can
then help identifY the optimum design.
The core of the simulation process involves constructing a set of decision rules
based upon the total sum ofutility generated by hypothetical product profiles. The
model computes the likely choice or preference of every individual in the sample,
and aggregates these to provide a summary of market share changes. This is an
example ofmicro-modeling sincedata is handled in this way at the individuaileveJ.
The power of this procedure lies in the ability to simulate the likely customer
reaction to a very large number of possible initiatives, which can be defined in
terms of the input variables. In this case, since we have all data on a common
metric, we can define our input variables to be the full range of key choice criteria
brand, price, product features, service features, and so on. A futl model of this sort
may well have 30-40 such variables.

In additi n, unlike m n
indi idu I im
njoint III d I , \ bl to in Iud th
th m d -I dat it elf Thi
curr nt m r t brand or
pini n,
of sirnul ting til
v ri bl , a c rnrn n uiven thi " in th ca
perform a
outcom in c nario wher
ti faction. At th
that, while currentl
rat . Mor v r, th
is ue (
area that lead to the greate t d gr
same time, the proce al 0 nable u to identify ar
performing w II, would cau gr
model allow u to quantify th
The modeling proce allow a large range of imulation po ibilitie - curr nt
market pecification can be creat d , new product introduced, and product n
be optimized (in the en e of finding the e act combination of attribut th t
maximally sati ties the greatc t numb r of cu tomer ).
1, 2 ).
....... .....,.--..
Imp m nt, (.i !\Ire
n b cr at d , n \ produ t intr du :d. nd pr du n
Th m pr
market p ifi tion.
allow - urr nt

25
be optimized (in the sense of finding the exact combination of attributes that
maximally satisfies the greatest number of customers) (Figure S)
3CONCLUSION ON CONJOINT ANALYSIS
Organizations undertaking quality programs invariably require feedback from the
customer base that changes initiated by management are impacting on customers.
At the same time, there is a continuous need to monitor customer expectations,
since it has been widely reported that the growth of a service culture in many
industries itself leads to a growth in customer expectations of service quality
(Parasuraman et aI., 1984).
Customers perceptions ofservice quality from suppliers are likely to change more
rapidly than their own intrinsic needs. Consequently, a continuous tracking
program can concentrate on measuring these perceptions, and only update on
measuring needs atplanned intervals (Buros and Blackall, 1992).
Conjoint analysis has proved over the years to be a very useful and reliable
research tool to organizational management, and its application in the area of
customer satisfaction represents a major enhancement of its appeal to both
researchers and marketing people alike (page and Rosenbaum, 1987).