Selective estrogen receptor modulators regulate reactive microglia after penetrating brain injury

Schizophrenia Research xxx (2014) xxx–xxx
SCHRES-06060; No of Pages 10
Contents lists available at ScienceDirect
Schizophrenia Research
j ourna l homepage: www.e lsev ie r .com/ locate /schres
The utility of P300 as a schizophrenia endophenotype and predictivebiomarker: Clinical and socio-demographic modulators in COGS-2
Bruce I. Turetsky a,⁎, Erich M. Dress a, David L. Braff b,c, Monica E. Calkins a, Michael F. Green d,e,Tiffany A. Greenwood b, Raquel E. Gur a, Ruben C. Gur a, Laura C. Lazzeroni f, Keith H. Nuechterlein d,Allen D. Radant g,h, Larry J. Seidman i,j, Larry J. Siever k,l, Jeremy M. Silverman k,l, Joyce Sprock b,William S. Stone i,j, Catherine A. Sugar m, Neal R. Swerdlow b, Debby W. Tsuang g,h,Ming T. Tsuang b,n,o, Gregory Light b,c
a Department of Psychiatry, University of Pennsylvania, Philadelphia, PA, USAb Department of Psychiatry, University of California San Diego, La Jolla, CA, USAc VISN-22 Mental Illness, Research, Education and Clinical Center (MIRECC), VA San Diego Healthcare System, USAd Department of Psychiatry and Biobehavioral Sciences, Geffen School of Medicine, University of California Los Angeles, Los Angeles, CA, USAe VA Greater Los Angeles Healthcare System, Los Angeles, CA, USAf Department of Psychiatry and Behavioral Sciences, Stanford University, Palo Alto, CA, USAg Department of Psychiatry and Behavioral Sciences, University of Washington, Seattle, WA, USAh VA Puget Sound Health Care System, Seattle, WA, USAi Department of Psychiatry, Harvard Medical School, Boston, MA, USAj Massachusetts Mental Health Center Public Psychiatry Division of the Beth Israel Deaconess Medical Center, Boston, MA, USAk Department of Psychiatry, The Mount Sinai School of Medicine, New York, NY, USAl James J. Peters VA Medical Center, New York, NY, USAm Department of Biostatistics, University of California Los Angeles School of Public Health, Los Angeles, CA, USAn Center for Behavioral Genomics and Institute for Genomic Medicine, University of California San Diego, La Jolla, CA, USAo Harvard Institute of Psychiatric Epidemiology and Genetics, Boston, MA, USA
⁎ Corresponding author at: 10th Floor, Gates BuildiPerelman School of Medicine, University of PennsylvaniaPhiladelphia 19104, USA. Tel.: +1 215 615 3607; fax: +1
E-mail address: [email protected] (B.I. Turetsky).
http://dx.doi.org/10.1016/j.schres.2014.09.0240920-9964/© 2014 Elsevier B.V. All rights reserved.
Please cite this article as: Turetsky, B.I., et al.,demographic modulators in COGS-2, Schizop
a b s t r a c t
a r t i c l e i n f oArticle history:Received 20 June 2014Received in revised form 9 September 2014Accepted 11 September 2014Available online xxxx
Keywords:P300SchizophreniaEndophenotypeBiomarkerEvent-related potential
Reduced auditory P300 amplitude is a robust schizophrenia deficit exhibiting the qualities of a viable geneticendophenotype. These include heritability, test–retest reliability, and trait-like stability. Recent evidence suggeststhat P300 may also serve as a predictive biomarker for transition to psychosis during the schizophrenia pro-drome. Historically, the utility of the P300 has been limited by its clinical nonspecificity, cross-site measurementvariability, and required EEG expertise. The Consortium on theGenetics of Schizophrenia (COGS-2) study provid-ed an opportunity to examine the consistency of the measure across multiple sites with varying degrees of EEGexperience, and to identify important modulating factors that contribute to measurement variability. AuditoryP300 was acquired from 649 controls and 587 patients at 5 sites. An overall patient deficit was observed witheffect size 0.62. Each site independently observed a significant patient deficit, but site differences also existed.In patients, site differences reflected clinical differences in positive symptomatology and functional capacity. Incontrols, site differences reflected differences in racial stratification, smoking and substance use history. Thesefactors differentially suppressed the P300 response, but only in control subjects. This led to an attenuatedpatient-control difference among smokers and among African Americans with history of substance use. Thesefindings indicate that the P300 can be adequately assessed quantitatively, across sites, without substantial EEGexpertise. Measurements are suitable for both genetic endophenotype analyses and studies of psychosis riskand conversion. However, careful attention must be given to selection of appropriate comparison samples toavoid misleading false negative results.
© 2014 Elsevier B.V. All rights reserved.
ng, Department of Psychiatry,, 3400 Spruce, Philadelphia, PA215 662 7903.
The utility of P300 as a schizohr. Res. (2014), http://dx.doi
1. Introduction
Underlying its clinical symptomatology, schizophrenia is character-ized by a disturbance in the regulated processing of environmentalinformation (Venables, 1964). Especially notable are impairments inidentifying and responding to stimuli that are either salient or novel.
phrenia endophenotype and predictive biomarker: Clinical and socio-.org/10.1016/j.schres.2014.09.024

2 B.I. Turetsky et al. / Schizophrenia Research xxx (2014) xxx–xxx
The P300 event-related potential (ERP) is a physiological index of thecognitive processes elicited by such task-relevant or novel deviant stim-uli (Regan, 1989). Generators of the P300 are widely distributed acrossboth cortex and subcortex. However, the scalp-recorded P300 responseto an auditory target stimulus – also referred to as P3b to differentiate itfrom the P3a orienting response to novelty (Light et al., in this issue;Polich, 2007; Squires et al., 1975) – arises primarily from inferior parie-tal and supramarginal cortical regions (Linden, 2005; Smith et al., 1990).Reduced amplitude of this response is one of themost robust physiolog-ical abnormalities associated with schizophrenia, being replicatedacross hundreds of studies with a relatively large (N0.80) effect size(Bramon et al., 2004; Jeon and Polich, 2003). Although P300 amplitudevaries to a certain extent with fluctuations in clinical symptomatology(Mathalon et al., 2000), it also exhibits characteristics of a trait-likedisease marker. The measure has relatively high test–retest reliability(Fabiani et al., 1986; Mathalon et al., 2000; Segalowitz and Barnes,1993; Turetsky et al., 1998b), and the patient deficit persists regardlessof the level of acute symptomatology or psychotropic medication(Duncan et al., 1987; Ford et al., 1994; Mathalon et al., 2000; Turetskyet al., 1998b). There is also strong evidence implicating a geneticcontribution to P300 amplitude in both healthy subjects (O'Connoret al., 1994; Polich and Burns, 1987) and patients (Frangou et al.,1997; Turetsky et al., 2000). Thus, P300 amplitude meets the essentialcriteria for a schizophrenia endophenotype (Braff et al., 2007;Gottesman and Gould, 2003; Turetsky et al., 2007).
Historically, an impediment to the utility of the P300 as a schizo-phrenia biomarker has been its lack of specificity. P300 is disrupted ina variety of neuropsychiatric disorders associated with cognitiveimpairment. These include, among others, Alzheimer's disease (Polichet al., 1990), alcoholism (Hesselbrock et al., 2001) and affective illness(Gangadhar et al., 1993; Salisbury et al., 1999). Additionally, the P300response is influenced by a variety of factors, independent of clinicaldiagnosis. Most notable among these are age and sex; P300 amplitudeis smaller, overall, in men (Turetsky et al., 1998a) and exhibits bothreduced amplitude and prolonged latency in the elderly (Knight,1987; Patterson et al., 1988). It is also altered by both the acute andchronic administration of various psychoactive substances. P300amplitude is smaller in active smokers compared to nonsmokers, andthis decrement reflects both the current number of cigarettes smokedper day and the number of years of continuous smoking (Hedges andBennett, 2014). It is similarly reduced following acute administrationof marijuana (Hart et al., 2010), alcohol (Wall and Ehlers, 1995), andcocaine (Herning et al., 1985), and among chronic users of thesesubstances (Campanella et al., 2014). In contrast, the effect of antipsy-chotic medications, among schizophrenia patients, appears to berelatively inconsequential (Bramon et al., 2004). Another potentiallyimportant factor that has only rarely been considered is race orethnicity, and the little evidence that exists concerning this has beeninconclusive (Ehlers et al., 1998; Lewis et al., 2008). Given the frequentco-occurrence of schizophrenia with other co-morbid neuropsychiatricand substance use disorders, as well as the differences in smokingprevalence and racial stratification that is often found in schizophreniapatient vs. healthy control samples, a comprehensive understanding ofthe impact of such modulating factors is critical to enhancing the utilityof P300 as a disease-specific schizophrenia biomarker.
Recently, with the advent of studies of the schizophrenia prodrome,the importance of the P300 as a putative biomarker has taken on addedsignificance. There is now substantial evidence that P300 amplitude isreduced in “high-risk” individuals with prodromal symptoms, prior toillness onset (Bramon et al., 2008; Frommann et al., 2008; Özgürdalet al., 2008; van der Stelt et al., 2005). Importantly, within a high-riskcohort, P300 appears to be a sensitive predictor of which individualswill, in fact, transition to frank psychosis. Moreover, the degree ofimpairment indicates the proximity of illness onset (Nieman et al.,2013; van Tricht et al., 2010). The greater the magnitude of theamplitude reduction, the more likely that psychosis onset is imminent.
Please cite this article as: Turetsky, B.I., et al., The utility of P300 as a schizodemographic modulators in COGS-2, Schizophr. Res. (2014), http://dx.doi
P300 amplitude assessment may, therefore, play an important partin the clinical evaluation of at-risk individuals. However P300 studieshave thus far been confined primarily to academic neurophysiologylaboratories, and data analyses have been limited primarily tobetween-group comparisons of measures acquired in one laboratoryunder identical conditions. It is thus unclear whether specific valuesobtained in one experimental setting can be compared or co-mingledwith values obtained in another setting under less-than-identicalconditions. The ability to aggregate quantitative data across multiplesites is critical to the strategy employed by the Consortium on theGenetics of Schizophrenia (COGS-2) to identify the genetic substratesof disease endophenotypes. It is also critical to the utility of thismeasureas a specific predictive biomarker of impending psychosis.
The purpose of the current analysis was therefore, first, to determineif a standardized P300 data acquisition system could be successfullydeployed to multiple settings without on-site electrophysiologyexpertise. We assessed the overall usability of the ERP data and theability to detect known schizophrenia deficits. We also considered theconsistency of measurements across five COGS-2 sites, and examinedvarious socio-demographic modulating factors (age, sex, race, smoking,medications) that can contribute to measurement variability. As noted,a careful understanding of the quantitative impact of these modulatingfactors is an important prerequisite to any interpretation of a specific setof measurements.
2. Materials and methods
2.1. Participants
Healthy control subjects (HCS) and schizophrenia patients (SZ)were enrolled in the COGS-2 endophenotype study at 5 sites, as detailedin the introductory article of this Special Issue (Swerdlow et al., in thisissue). Briefly, all participants were assessed using a modified versionof the Structured Clinical Interview for DSM-IV-TR (SCID), Modules A–E (First et al., 2007). All patients met criteria for either SZ orschizoaffective disorder, depressed subtype. HCS were excluded forany history of a psychotic disorder in either themselves or a 1st-degree relative, a current Axis I mood disorder, a Cluster A Axis IIdisorder, or current psychoactive medication use. Subjects were alsoexcluded for any medical or neurological condition that could interferewith endophenotype assessment, history of substance abuse in the pastmonth or substance dependence in the past 6 months, or a positivetoxicology screen at the time of testing. Clinical and demographiccharacteristics of the P300 sample are presented, by site, in Table 1.Specific past substance related diagnoses are detailed in Table 2.Adjunctive psychoactive medications used by patients are listed inTable 3. In addition to the Structured Clinical Interview and the variousendophenotype measures, all subjects were assessed with the Mini-Mental Status Examination (MMSE) (Folstein et al., 1975) and theGlobal Assessment of Functioning Scale (GAF) (Hall, 1995). Patientswere further assessed with two measures of functional capacity: the15-item clinician rated Scale of Functioning (Rapaport et al., 1996),and the UCSD Performance-based Skills Assessment-Brief (UPSA-B)(Mausbach et al., 2011), which directly assesses an individual's capacityin multiple domains of everyday functioning through the use of propsand standardized skill performance tests.
There were significant group differences in age (SZ older than HCS),sex (more male SZ) and racial composition (more African-AmericanSZ). There were also significant site differences for each of thesemeasures, and group × site interactions for age and sex. As expected,patients and controls differed on education, GAF, and MMSE scores.There were also significant main effects of site and group × site interac-tions for both GAF and MMSE. Site differences were also evident forrates of past substance use, major depressive disorder, and nicotineuse. Among patients, site differences were observed for duration ofillness, age of onset, and current symptomatology (SAPS and SANS
phrenia endophenotype and predictive biomarker: Clinical and socio-.org/10.1016/j.schres.2014.09.024

Table 1Patient sample composition.
Test site 1 — UCSD 2 — UCLA 3 — MSSM 4 — PENN 5 — UW
Subjects (N) 144 150 42 133 118Age (yrs ± sd)abc 45 ± 11 48 ± 11 45 ± 10 43 ± 11 47 ± 11Sex (% male)abc 76 73 52 68 77Race (%)ac
Caucasian 53 45 45 33 55African-Amer. 15 35 48 60 22Asian 4 7 0 2 5Pacific Islander 2 1 0 0 3Native American 3 0 0 1 1Mixed 22 11 5 4 14Not reported 0 0 2 0 0
Education (yrs ± sd)ac 12.4 ± 1.9 13.0 ± 1.9 11.7 ± 2.3 12.6 ± 2.4 13.3 ± 1.9GAF Score (±sd)abc 40.9 ± 5.5 45.5 ± 9.5 51.3 ± 9.5 44.3 ± 9.5 40.4 ± 4.1MMSE (±sd)abc 32.0 ± 2.9 31.5 ± 3.0 30.7 ± 3.1 31.3 ± 3.3 32.2 ± 2.3Past mood disorder (%)ab 28 35 17 46 37Past substance use Dx (%)abc 56 46 19 50 47Smoking history (%)abc
Never 28 38 38 50 62Past 19 7 2 1 0Current 53 55 60 50 38
Illness durationb 22.0 ± 10.6 25.5 ± 12.2 21.9 ± 10.3 21.5 ± 12.1 23.1 ± 12.1Age of onsetb 23.0 ± 7.3 22.3 ± 8.2 23.3 ± 5.7 21.4 ± 5.9 23.7 ± 7.8Antipsychotic medication
Atypical only (%) 67 79 67 68 69Typical only (%) 5 6 17 10 7Atypical + typical (%) 16 7 9 12 8No antipsychotic (%) 6 5 2 5 6Unknown (%) 6 3 5 5 9CPZ equivs (mgs ± sd)b 1037 ± 1423 709 ± 1017 927 ± 1205 641 ± 834 642 ± 972
Adjunctive medications (%)b 74 62 50 60 71SAPS global (±sd)b 7.5 ± 3.9 6.2 ± 4.1 4.7 ± 3.0 7.3 ± 4.1 6.5 ± 3.6SANS global (±sd)b 15.6 ± 4.2 9.2 ± 4.4 4.2 ± 4.1 9.8 ± 3.7 12.8 ± 3.5Scale of function (±sd)b 46.5 ± 5.6 48.6 ± 6.0 48.1 ± 5.1 48.4 ± 5.4 43.4 ± 4.6
Control sample compositionSubjects (N) 135 175 66 131 142Age (yrs ± sd)abc 39 ± 13 46 ± 8 36 ± 12 32 ± 12 37 ± 14Sex (% male)abc 44 61 48 47 54Race (%)ac
Caucasian 53 64 45 57 73African-Amer. 12 23 36 31 8Asian 12 6 14 5 6Pacific Islander 2 1 0 0 2Native American 1 0 0 0 0Mixed 20 6 5 8 12Not reported 0 0 0 0 0
Education (yrs ± sd)ac 15.0 ± 2.1 14.7 ± 1.7 15.2 ± 2.4 15.1 ± 2.2 15.1 ± 2.5GAF score (±sd)abc 90.6 ± 7.1 81.9 ± 7.9 90.5 ± 6.8 87.5 ± 6.1 82.7 ± 6.3MMSE (±sd)abc 33.6 ± 1.6 33.3 ± 1.8 34.1 ± 1.5 33.6 ± 2.0 33.8 ± 1.3Past mood disorder (%)ab 3 4 2 15 15Past substance use Dx (%)abc 8 18 2 15 21Smoking history (%)abc
Never 80 83 86 93 89Past 11 3 0 0 0Current 9 14 14 7 11
GAF: Global Assessment of Function Scale.MMSE: Mini-Mental Status Examination.CPZ Equivs: Chlorpromazine Equivalent Dosage.SAPS Global: Scale for Assessment of Positive Symptoms Global Items Sum.SANS Global: Scale for Assessment of Negative Symptoms Global Items Sum.
a Significant group difference.b Significant site difference.c Significant group × site interaction.
3B.I. Turetsky et al. / Schizophrenia Research xxx (2014) xxx–xxx
rating scales). This variability indicates that different sites drew theirsamples from different socio-demographic and clinical pools.
2.2. Procedure
The auditory P300 was conducted as the last task of the COGS-2battery, following completion of the Mismatch Negativity (MMN)experiment described by Light et al. (in this issue). A San Diego Instru-ments 2-channel ERP-LAB system with a pre-set P300 module was
Please cite this article as: Turetsky, B.I., et al., The utility of P300 as a schizodemographic modulators in COGS-2, Schizophr. Res. (2014), http://dx.doi
used for stimulus presentation and EEG recording. One channel record-ed EEG activity at the vertex (Cz) referenced to the left mastoid process(full scale setting 0.1, bandpass filter settings 0.5–100 Hz). A secondchannel recorded eye movement (EOG) activity from electrodes placedmid superior and lateral to the right orbit (full scale setting 0.25,bandpass filter settings 0.5–100 Hz). A ground electrode was placedon the right mastoid. All electrode impedances were below 5 kΩ. TheCz electrode location represented a compromise between the preferredelectrode placements forMMN (Fz) and P300 (Pz) recordings, given the
phrenia endophenotype and predictive biomarker: Clinical and socio-.org/10.1016/j.schres.2014.09.024

Table 2Substance use diagnoses.
Test Site 1 — UCSD 2 — UCLA 3 — MSSM 4 — PENN 5 — UW
Patients Controls Patients Controls Patients Controls Patients Controls Patients Controls
Substance AbuseAlcohol 6 6 8 10 5 0 9 8 10 9Opioid 1 0 2 1 0 0 1 0 3 1Anxiolytic/Sed-Hypn. 0 0 1 1 0 0 1 0 0 0Cocaine 2 0 3 1 3 0 4 0 4 0Cannabis 9 2 10 4 3 0 12 2 19 7Amphetamine 3 0 1 0 0 0 2 0 2 0Hallucinogen 1 0 2 1 0 0 1 0 1 1Phencyclidine 1 0 2 1 0 0 0 0 0 0
Substance DependenceAlcohol 28 2 18 4 17 2 23 3 24 6Opioid 4 0 2 0 0 0 1 1 2 1Anxiolytic/Sed-Hypn. 1 0 1 0 0 0 2 0 0 0Cocaine 9 1 21 2 3 0 14 1 15 2Cannabis 18 0 18 3 3 0 16 2 9 4Amphetamine 18 1 3 1 0 0 2 0 2 1Hallucinogen 1 0 2 0 0 0 0 0 0 0Phencyclidine 2 0 2 0 0 0 0 0 0 0Polysubstance 6 0 1 0 0 0 5 0 3 1
Entries represent % of total patient or control sample at each site having a specific past diagnosis.Subjects with different diagnoses at different points in time are included in more than one cell.
4 B.I. Turetsky et al. / Schizophrenia Research xxx (2014) xxx–xxx
limitations of the 2-channel recording system and the need to dedicateone of these to the EOG.
Subjects were seated in front of a computer monitor and directed tofixate their gaze on the center screen. A hearing test was conducted toensure N40 dB hearing threshold bilaterally at 1000 Hz. Subjects wereinstructed to press the button on a hand-held counter whenever theyheard a 1500 Hz target tone amid a stream of 1000 Hz tones. Theywere given a brief practice period to ensure initial task comprehensionand compliance. Unfortunately, the experimental hardware did notallow further real-time monitoring of button-press responses over thecourse of the experiment. Subjects were then presented a series of400 tones, including 62 random targets. The ERP system digitallysampled the EEG at 1000 Hz and wrote 1400 ms of data for each stimu-lus trial, beginning at 100 ms prior to stimulus onset. At the conclusionof the experiment, the number of button presseswas recorded from thecounter.
2.3. Electrophysiology data processing
RawEEG data from all 5 COGS-2 sites were uploaded to a centralizeddatabase. Quality assurance data review and analysis was then conduct-ed by a single investigator who was blind to all demographic anddiagnostic information. EEG data were processed using Brain VisionAnalyzer 1.5 (Brain Products GmbH). Data were digitally filteredbetween 0.1 and 30 Hz (24 dB/oct) and eye movement artifact wasremoved using an automated algorithm (Gratton et al., 1983). Intervalswith additional EEG artifact (activity exceeding +/−75 μV) wereexcluded from further analysis. Remaining trials were then sorted and
Table 3Patient adjunctive medication usage.
Test Site 1 — UCSD 2 — UCLA 3 — MSSM 4 — PENN 5 — UW
Antidepressant 52 37 21 40 49Benzodiazepine 16 9 7 20 27Anticholinergic 29 17 7 16 24Mood stabilizer 22 27 19 12 20Stimulant 0 1 0 0 0Opiate 4 4 0 0 6Steroid 0 0 0 0 1Other 1 1 0 0 3
Entries represent % of total patient sample at each site.Individual subjects using more than one medication are included in more than one cell.
Please cite this article as: Turetsky, B.I., et al., The utility of P300 as a schizodemographic modulators in COGS-2, Schizophr. Res. (2014), http://dx.doi
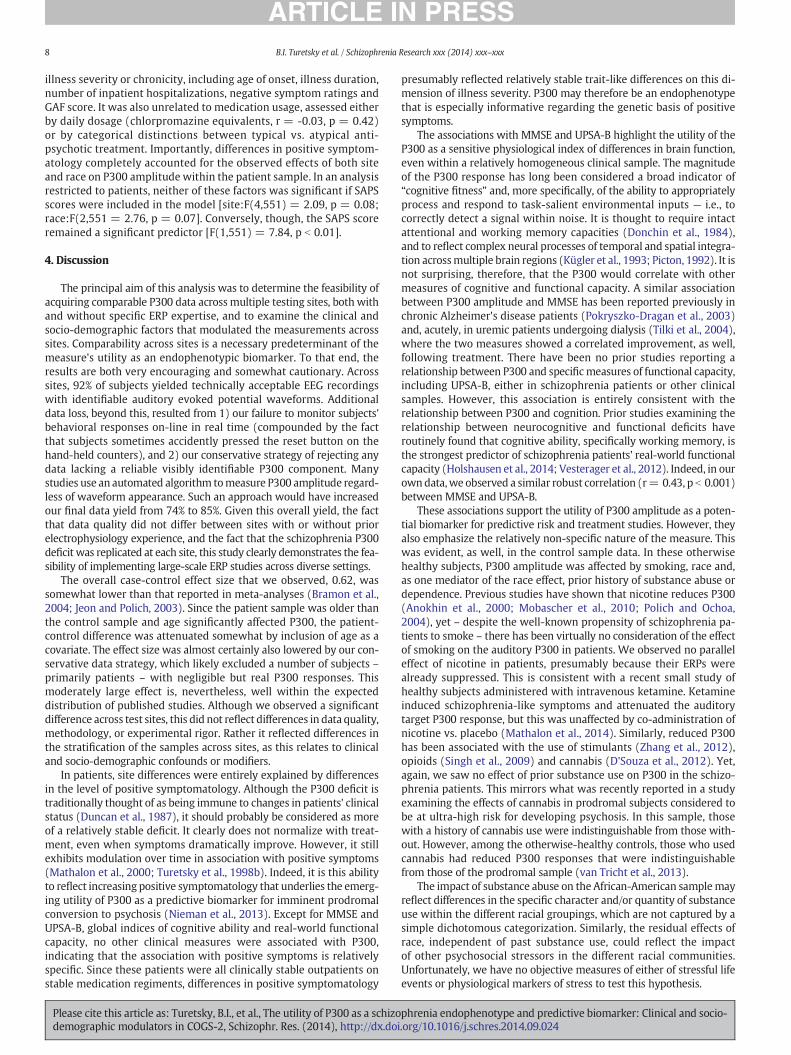
combined to form separate average ERP waveforms for the targetand frequent tone conditions. These were baseline corrected relativeto the 100 ms pre-stim interval and visually inspected to determinethe presence or absence of reliably identifiable ERP components. A high-ly conservative, stringent, approach to data inclusion was employed.Data without an unambiguous N100/P200 response to the frequenttone, or a reliably identifiable P300 response to the target (as agreedby two investigators) were excluded. Subjects were also excluded iftheir target count deviated by more than 20 from the actual numberof 62, regardless of the quality of EEG data, since appropriate taskengagement could not be documented. For the remaining subjects,P300 amplitude and latency were measured from the peak targetresponse between 250 and 400 ms. (See Fig. 1).
2.4. Statistical analysis
P300 amplitude and latency differences were analyzed in two sepa-rate general linear models (GLM), with diagnosis, sex and test site ascategorical factors and age as a continuous predictor. Significant maineffects and interactions were parsed with post-hoc paired contrasts.The effects of various modulating factors (e.g., race, substance use,mood diagnosis, cognitive measures) were then initially assessed byadding these individually as separate additional factors to the originalmodel. To rule out potential false positive results from multiple testsof different modulators, all significant modulating variables (p b 0.01)were then included in one omnibus regression model to evaluate thecollective and individual residual effects of these multiple factors.Associations between P300 and clinical factors, in the patient sample,were examined via Pearson correlation coefficients, with a significancethreshold of p b 0.01.
3. Results
3.1. Data quality and final sample composition
P300 data were uploaded to the COGS-2 database for 1677 subjects(789 HCS, 888 SZ). Of these, 1538 (752 HCS, 786 SZ) were deemed tohave complete electrophysiological recordings of sufficient quality tounambiguously identify the obligate N100/P200 response to thefrequent stimulus. From these, 119 (37 HCS, 82 SZ) were excludedbecause they failed to demonstrate adequate task engagement(incorrect target count). An additional 183 subjects (66 HCS, 117 SZ)
phrenia endophenotype and predictive biomarker: Clinical and socio-.org/10.1016/j.schres.2014.09.024

Fig. 1.Grand averagewaveforms showing evoked potential responses to frequent and target tones for control subjects (left) and schizophrenia patients (right). The P300 component elic-ited by the target tone is easily identified and shows a clear patient-control difference.
5B.I. Turetsky et al. / Schizophrenia Research xxx (2014) xxx–xxx
were deemed to not have an identifiable P300 response. The finalsample was thus 1236 (649 HCS, 587 SZ). At each stage, the loss ofdata was significantly greater for patients. Relative data loss alsodiffered significantly across sites, ranging from 13% to 29% for subjectswith acceptable N100/P200 auditory evoked potential responses butinvalid or unreliable P300s [Χ2(4) = 35.3, p b 0.0001]. On-site electro-physiology expertise, however, provided no advantage. At the twosites (1 and 4) with experienced electrophysiology investigators,this data loss parameter was 23.7%; at the three sites without priorexperience, the data loss was 16.1%.
3.2. P300 evoked potential response
GLM analysis of P300 amplitude revealed significant main effects fordiagnosis, age and site, with no significant interactions. Consistent withprevious literature, patients [F(1,1215) = 54.56, p b 0.000001] andolder subjects [F(1,1215) = 18.56, p b 0.0001] both had robust P300
Fig. 2. P300 amplitude distributions for schizophrenia patients and control subjects at each of thwith expertise in electrophysiology.
Please cite this article as: Turetsky, B.I., et al., The utility of P300 as a schizodemographic modulators in COGS-2, Schizophr. Res. (2014), http://dx.doi
amplitude reductions. The overall effect size for diagnosis was 0.62(Cohen's d). Despite previous reports of sex differences in P300(Turetsky et al., 1998a), no effect of sex was seen [F(1,1215) = 0.07,p = 0.79]. The effect of test site [F(4,1215) = 6.54, p b 0.0001]remained significant, in separate analysis, for both controls(p b 0.001) and patients (p b 0.01). However, despite this variabilityacross sites, each site independently observed a statistically significantdiagnostic difference, with site-specific effect sizes ranging from 0.36to 0.94. Notably, the two sites with greater electrophysiology expertisedid not observe more robust patient-control differences (Fig. 2).
A parallel analysis for P300 latency revealed significant effects of age[F(1,1215)= 28.28, p b 0.000001] and site [F(4,1215)= 3.53, p b 0.01],but no effect of diagnosis [F(1,1215) = 2.78, p = 0.10] or sex[F(1,1215)= 0.82, p= 0.36]. P300 latencywas prolongedwith increas-ing age but this effect was similar for patients and controls across sites,with no significant interactions. Given the absence of a diagnosis effect,no further analysis of P300 latency was conducted.
e five test sites. Effect size at each site is presented as Cohen's d. Site 1 and site 4 are those
phrenia endophenotype and predictive biomarker: Clinical and socio-.org/10.1016/j.schres.2014.09.024

Fig. 3. P300 amplitude (mean ± standard error) for schizophrenia patients and controlsubjects, separated according to current smoking status. Patient-control differences areonly observed within the non-smoking sample. Smoking differentially reduced P300 re-sponses in control subjects, which eliminated the patient-control difference.
6 B.I. Turetsky et al. / Schizophrenia Research xxx (2014) xxx–xxx
3.2.1. Modulating factorsWe examined the effects of several potential modulating variables,
to determine how they independently influenced P300 amplitude andwhether they contributed to observed site differences. Each variablewas added as a single additional factor to the original multi-factorialmodel. MMSE score [F(1,1139) = 4.79. p b 0.05] was positively associ-ated with P300 amplitude independent of diagnosis, but had no impacton observed site differences. Othermeasures of cognitive and functionalstatus – GAF score and education – were not significant predictors ofP300. Smoking, however, was found to be a robust modulator of P300amplitude [F(1,1195) = 10.34, p b 0.01]. Although the interaction
Fig. 4. P300 amplitude (mean± standard error) for schizophrenia patients and control subjectferences are observed within each racial grouping. However, diagnostic group differences are l
Please cite this article as: Turetsky, B.I., et al., The utility of P300 as a schizodemographic modulators in COGS-2, Schizophr. Res. (2014), http://dx.doi
between smoking and diagnosis was not significant [F(1,1195) =2.44, p = 0.12], separate within-group analyses of smokers and non-smokers revealed a significant patient-control difference only amongnonsmokers [F(1,1195) = 29.69, p b 0.00001]. Smoking differentiallyreduced P300 amplitude in healthy control subjects while having littleeffect in patients (Fig. 3), which eliminated all diagnostic differences[F(1,1195) = 1.09, p = 0.30]. However, site differences remained ro-bust even after controlling for smoking status. It should be noted,though, that only 70 control subjects (11%) were classified as smokers,compared to 50% of patients.
The observed site differences appeared to primarily reflect racialstratification differences. Inclusion of race as an additional predictorproduced a significant race effect [F(2,1175) = 16.29, p b 0.000001],which eliminated the site effectwhile leaving the effects of both diagno-sis [F(1,1175) = 20.64, p b 0.00001] and age [F(1,1175) = 15.56,p b 0.0001] intact. P300 amplitude was lower, overall, in the AfricanAmerican sample (3.68 ± 2.07) than in either the Caucasian (5.08 ±2.65) or “Other/Mixed” (4.67 ± 2.61) racial groupings. There was aclear trend towards an interaction of race × diagnosis, but it did notreach statistical significance [F(2,1175) = 2.85, p = .06]. In separateanalyses, significant patient-control differences were observed withineach racial subgroup, although the effect size was noticeably smallerwithin the African American sample (Fig. 4).
The differential impact of race on the association between schizo-phrenia and P300 was manifested primarily as an amplitude reductionamong African American controls, rather than patients. Furtherconsideration of potential modulating variables revealed that thisapparent racial difference was due, in part, to the differential impactacross the racial groupings of prior substance use disorders. When thesample was restricted to subjects with no history of substance use, theinteraction of race × diagnosis was insignificant [F(2,857) = 1.56,p = 0.21] and the magnitude of the patient-control difference wassimilar across racial categories (Fig. 5, left). However, among thosewith a past history of substance abuse or dependence, there was asignificant race × diagnosis interaction [F(2,367) = 6.77, p b 0.001].As illustrated (Fig. 5, right), P300 responses of otherwise-healthyAfrican American controls were indistinguishable from those ofAfrican American schizophrenia patients. Comparable attenuatingeffects of past substance use were not observed for the Caucasian orOther/Mixed control samples. (Note: although the control-patientcomparison in the Other/Mixed+ substance use subgroupwas not sta-tistically significant, this reflected the fact that therewere only 6 control
s, separated according to self-identified racial classification. Significant patient-control dif-ess robust among African Americans.
phrenia endophenotype and predictive biomarker: Clinical and socio-.org/10.1016/j.schres.2014.09.024

Fig. 5. P300 amplitude (mean ± standard error) for schizophrenia patients and control subjects, broken down by self-identified racial classification among those with (right) and thosewithout (left) a prior history of substance use disorders. Among African Americans, prior substance use attenuated control subjects' P300 responses and eliminated the patient-controldifference.
7B.I. Turetsky et al. / Schizophrenia Research xxx (2014) xxx–xxx
subjects in this subgroup, rather than the impact of substance use). Im-portantly, prior substance use appeared to have no impact on P300 re-sponses within the patient sample. A past history of mood disorderhad no observable effect on P300 in either patients or controls.
An omnibus multiple regression model examined the residualeffects of these modulators while adjusting for the presence of othersignificant modulators. Independent variables included diagnosis,race, smoking, substance use, the 2-way interactions with eitherdiagnosis or race, and 3-way interactions with both diagnosis andrace. Age was included as an additional predictor. The model explained15.5% of P300 variance. Significant main effects remained for eachindependent variable (Table 4). The only significant interaction was
Table 4Composite regression model.
Regression parameter Standard error −95.0
Intercept 6.56054 0.258635 6.05Diagnosis −1.26510 0.271908 −1.79Age −0.02106 0.005701 −0.03Race:AA −1.44469 0.271937 −1.97Race:Mixed −0.54668 0.262748 −1.06Smoking −0.92496 0.394829 −1.69Substances 0.89175 0.328165 0.24Dx × Race:AA 0.58481 0.451171 −0.30Dx × Race:Mixed 0.13794 0.492115 −0.82Dx × smoking 0.40892 0.491026 −0.55Dx × substances −0.88882 0.438312 −1.74Race:AA × substances −1.05947 0.676583 −2.38Race:AA × smoking 0.01508 0.719475 −1.39Race:Mixed × substances −0.28370 1.048818 −2.34Race:Mixed × smoking 0.49181 1.072009 −1.61Dx × AA × substances 1.48620 0.818152 −0.11Dx × AA × smoking 0.07123 0.856074 −1.60Dx × Mixed × Substances 0.78233 1.183324 −1.53Dx × Mixed × smoking −0.49866 1.203665 −2.86
Dx/diagnosis: 1 = schizophrenia, 0 = control.Race:AA: 1 = African American, 0 = Caucasian or Mixed/Other.Race:Mixed: 1 = Mixed/Other race, 0 = Caucasian or African American.Substances: 1 = past history of substance abuse or dependence, 0 = no past history.Smoking: 1 = current smoker, 0 is past or non smoker.
Please cite this article as: Turetsky, B.I., et al., The utility of P300 as a schizodemographic modulators in COGS-2, Schizophr. Res. (2014), http://dx.doi
diagnosis × substance use. The 3-way interaction of diagnosis× African American race × substance use just missed significancethreshold.
3.2.2. Clinical factorsWithin the patient sample, we also explored the effects of several
different indices of illness severity. P300 amplitude was positivelyassociated with patients' cognitive status as indexed by the MMSE(r = 0.13, p b 0.01), and with real-life functional capacity as indexedby the UPSA-B (r = 0.11, p b 0.01). It was also inversely associatedwith the total SAPS global ratings of positive symptomatology (r =-0.11, p b 0.01). P300 was unrelated to other indicators of either
0% confidence limit +95.00% confidence limit t p
312 7.067957 25.36603 0.000000856 −0.731641 −4.65269 0.000004224 −0.009872 −3.69357 0.000231821 −0.911176 −5.31260 0.000000217 −0.031185 −2.08060 0.037679958 −0.150335 −2.34268 0.019306792 1.535586 2.71740 0.006673035 1.469971 1.29621 0.195148755 1.103427 0.28030 0.779295443 1.372270 0.83279 0.405129875 −0.028891 −2.02783 0.042795687 0.267931 −1.56591 0.117630647 1.426624 0.02095 0.983287139 1.773990 −0.27050 0.786824138 2.595002 0.45877 0.646478895 3.091344 1.81653 0.069535832 1.750770 0.08320 0.933706925 3.103909 0.66113 0.508655015 1.862825 −0.41429 0.678736
phrenia endophenotype and predictive biomarker: Clinical and socio-.org/10.1016/j.schres.2014.09.024
8 B.I. Turetsky et al. / Schizophrenia Research xxx (2014) xxx–xxx
illness severity or chronicity, including age of onset, illness duration,number of inpatient hospitalizations, negative symptom ratings andGAF score. It was also unrelated to medication usage, assessed eitherby daily dosage (chlorpromazine equivalents, r = -0.03, p = 0.42)or by categorical distinctions between typical vs. atypical anti-psychotic treatment. Importantly, differences in positive symptom-atology completely accounted for the observed effects of both siteand race on P300 amplitude within the patient sample. In an analysisrestricted to patients, neither of these factors was significant if SAPSscores were included in the model [site:F(4,551) = 2.09, p = 0.08;race:F(2,551 = 2.76, p = 0.07]. Conversely, though, the SAPS scoreremained a significant predictor [F(1,551) = 7.84, p b 0.01].
4. Discussion
The principal aim of this analysis was to determine the feasibility ofacquiring comparable P300 data across multiple testing sites, both withand without specific ERP expertise, and to examine the clinical andsocio-demographic factors that modulated the measurements acrosssites. Comparability across sites is a necessary predeterminant of themeasure's utility as an endophenotypic biomarker. To that end, theresults are both very encouraging and somewhat cautionary. Acrosssites, 92% of subjects yielded technically acceptable EEG recordingswith identifiable auditory evoked potential waveforms. Additionaldata loss, beyond this, resulted from 1) our failure to monitor subjects'behavioral responses on-line in real time (compounded by the factthat subjects sometimes accidently pressed the reset button on thehand-held counters), and 2) our conservative strategy of rejecting anydata lacking a reliable visibly identifiable P300 component. Manystudies use an automated algorithm tomeasure P300 amplitude regard-less of waveform appearance. Such an approach would have increasedour final data yield from 74% to 85%. Given this overall yield, the factthat data quality did not differ between sites with or without priorelectrophysiology experience, and the fact that the schizophrenia P300deficit was replicated at each site, this study clearly demonstrates the fea-sibility of implementing large-scale ERP studies across diverse settings.
The overall case-control effect size that we observed, 0.62, wassomewhat lower than that reported in meta-analyses (Bramon et al.,2004; Jeon and Polich, 2003). Since the patient sample was older thanthe control sample and age significantly affected P300, the patient-control difference was attenuated somewhat by inclusion of age as acovariate. The effect size was almost certainly also lowered by our con-servative data strategy, which likely excluded a number of subjects –primarily patients – with negligible but real P300 responses. Thismoderately large effect is, nevertheless, well within the expecteddistribution of published studies. Although we observed a significantdifference across test sites, this did not reflect differences in data quality,methodology, or experimental rigor. Rather it reflected differences inthe stratification of the samples across sites, as this relates to clinicaland socio-demographic confounds or modifiers.
In patients, site differences were entirely explained by differencesin the level of positive symptomatology. Although the P300 deficit istraditionally thought of as being immune to changes in patients' clinicalstatus (Duncan et al., 1987), it should probably be considered as moreof a relatively stable deficit. It clearly does not normalize with treat-ment, even when symptoms dramatically improve. However, it stillexhibits modulation over time in association with positive symptoms(Mathalon et al., 2000; Turetsky et al., 1998b). Indeed, it is this abilityto reflect increasing positive symptomatology that underlies the emerg-ing utility of P300 as a predictive biomarker for imminent prodromalconversion to psychosis (Nieman et al., 2013). Except for MMSE andUPSA-B, global indices of cognitive ability and real-world functionalcapacity, no other clinical measures were associated with P300,indicating that the association with positive symptoms is relativelyspecific. Since these patients were all clinically stable outpatients onstable medication regiments, differences in positive symptomatology
Please cite this article as: Turetsky, B.I., et al., The utility of P300 as a schizodemographic modulators in COGS-2, Schizophr. Res. (2014), http://dx.doi
presumably reflected relatively stable trait-like differences on this di-mension of illness severity. P300 may therefore be an endophenotypethat is especially informative regarding the genetic basis of positivesymptoms.
The associations with MMSE and UPSA-B highlight the utility of theP300 as a sensitive physiological index of differences in brain function,even within a relatively homogeneous clinical sample. The magnitudeof the P300 response has long been considered a broad indicator of“cognitive fitness” and, more specifically, of the ability to appropriatelyprocess and respond to task-salient environmental inputs — i.e., tocorrectly detect a signal within noise. It is thought to require intactattentional and working memory capacities (Donchin et al., 1984),and to reflect complex neural processes of temporal and spatial integra-tion acrossmultiple brain regions (Kügler et al., 1993; Picton, 1992). It isnot surprising, therefore, that the P300 would correlate with othermeasures of cognitive and functional capacity. A similar associationbetween P300 amplitude and MMSE has been reported previously inchronic Alzheimer's disease patients (Pokryszko-Dragan et al., 2003)and, acutely, in uremic patients undergoing dialysis (Tilki et al., 2004),where the two measures showed a correlated improvement, as well,following treatment. There have been no prior studies reporting arelationship between P300 and specificmeasures of functional capacity,including UPSA-B, either in schizophrenia patients or other clinicalsamples. However, this association is entirely consistent with therelationship between P300 and cognition. Prior studies examining therelationship between neurocognitive and functional deficits haveroutinely found that cognitive ability, specifically working memory, isthe strongest predictor of schizophrenia patients' real-world functionalcapacity (Holshausen et al., 2014; Vesterager et al., 2012). Indeed, in ourowndata,we observed a similar robust correlation (r= 0.43, p b 0.001)between MMSE and UPSA-B.
These associations support the utility of P300 amplitude as a poten-tial biomarker for predictive risk and treatment studies. However, theyalso emphasize the relatively non-specific nature of the measure. Thiswas evident, as well, in the control sample data. In these otherwisehealthy subjects, P300 amplitude was affected by smoking, race and,as one mediator of the race effect, prior history of substance abuse ordependence. Previous studies have shown that nicotine reduces P300(Anokhin et al., 2000; Mobascher et al., 2010; Polich and Ochoa,2004), yet – despite the well-known propensity of schizophrenia pa-tients to smoke – there has been virtually no consideration of the effectof smoking on the auditory P300 in patients. We observed no paralleleffect of nicotine in patients, presumably because their ERPs werealready suppressed. This is consistent with a recent small study ofhealthy subjects administered with intravenous ketamine. Ketamineinduced schizophrenia-like symptoms and attenuated the auditorytarget P300 response, but this was unaffected by co-administration ofnicotine vs. placebo (Mathalon et al., 2014). Similarly, reduced P300has been associated with the use of stimulants (Zhang et al., 2012),opioids (Singh et al., 2009) and cannabis (D'Souza et al., 2012). Yet,again, we saw no effect of prior substance use on P300 in the schizo-phrenia patients. This mirrors what was recently reported in a studyexamining the effects of cannabis in prodromal subjects considered tobe at ultra-high risk for developing psychosis. In this sample, thosewith a history of cannabis use were indistinguishable from those with-out. However, among the otherwise-healthy controls, those who usedcannabis had reduced P300 responses that were indistinguishablefrom those of the prodromal sample (van Tricht et al., 2013).
The impact of substance abuse on the African-American samplemayreflect differences in the specific character and/or quantity of substanceuse within the different racial groupings, which are not captured by asimple dichotomous categorization. Similarly, the residual effects ofrace, independent of past substance use, could reflect the impactof other psychosocial stressors in the different racial communities.Unfortunately, we have no objective measures of either of stressful lifeevents or physiological markers of stress to test this hypothesis.
phrenia endophenotype and predictive biomarker: Clinical and socio-.org/10.1016/j.schres.2014.09.024

9B.I. Turetsky et al. / Schizophrenia Research xxx (2014) xxx–xxx
The fact thatmodulating factors such as nicotine and substance abusecan differential affect controls, but not patients, raises an important cau-tionary note about how to interpret study results, potential false negativefindings, andwhat constitutes the best comparison sample for genetic orbiomarker studies. A common recommended strategy is to recruit con-trol subjectswho are similar to the clinical sample on variousmodulatingfactors and co-morbid conditions. The results of this studywould seem totemper that recommendation, at least for P300. It suggests that, inmatching the samples, individual and group differences may be attenu-ated for reasons other than psychosis. Consequently, genetic associationswith the endophenotypemay be obscured and the ability of themeasureto predict transition to psychosis may be weakened. This is an issue thatclearly requires careful consideration in future analyses. However, thebroad utility of P300 as a robust marker for large multi-site studies isconfirmed, along with important associations with both positive symp-toms and decreased cognitive and functional capacity.
Role of funding sourceThis work was supported by collaborative R01 grants from the National Institute of
Mental Health: MH065571, MH065707, MH065554, MH065578, MH065558, MH86135.Other than providing financial support, the NIMH had no further role in this manuscript.
ContributorsBIT conducted quality assurance on all EEG data, performed the initial statistical
analyses and wrote the initial draft of the manuscript. EMD conducted quality assuranceon all EEG data, processed the EEG data and wrote draft sections of the manuscript. GLand BIT implemented the multi-site EEG hardware and software and conducted annualEEG training. All other authors contributed substantially to study design, data acquisitionand/or quality assurance. All authors reviewed and approved the final version of themanuscript.
Conflict of interestDr. Green has been a consultant to AbbVie, Biogen, DSP, EnVivo/Forum and Roche, and
he is on the scientific advisory board of Mnemosyne. He has received research funds fromAmgen.
Dr. Lazzeroni is an inventor on a patent application filed by Stanford University ongenetic polymorphisms associated with depression. Dr. Light has served as a consultantfor Astellas, Forum, and Neuroverse. Dr. Nuechterlein has received unrelated researchsupport from Janssen Scientific Affairs, Genentech, and Brain Plasticity, Inc., and hasconsulted to Genentech, Otsuka, Janssen, and Brain Plasticity, Inc. Dr. Swerdlow hasbeen a consultant for Genco Sciences, Ltd. All other authors declare that they have noconflict of interest.
AcknowledgmentsWe thank the research staff at all of the COGS-2 sites who contributed to subject
recruitment, assessment and data acquisition. We especially thank the patients andhealthy volunteers who made this study possible.
References
Anokhin, A.P., Vedeniapin, A.B., Sirevaag, E.J., Bauer, L.O., O'Connor, S.J., Kuperman, S.,Porjesz, B., Reich, T., Begleiter, H., Polich, J., Rohrbaugh, J.W., 2000. The P300 brainpotential is reduced in smokers. Psychopharmacology (Berlin) 149, 409–413.
Braff, D.L., Freedman, R., Schork, N.J., Gottesman, I.I., 2007. Deconstructing schizophrenia:an overview of the use of endophenotypes in order to understand a complexdisorder. Schizophr. Bull. 33, 21–32.
Bramon, E., Rabe-Hesketh, S., Sham, P., Murray, R.M., Frangou, S., 2004. Meta-analysis ofthe P300 and P50 waveforms in schizophrenia. Schizophr. Res. 70, 315–329.
Bramon, E., Shaikh, M., Broome, M., Lappin, J., Bergé, D., Day, F., Woolley, J., Tabraham, P.,Madre, M., Johns, L., Howes, O., Valmaggia, L., Pérez, V., Sham, P., Murray, R.M.,McGuire, P., 2008. Abnormal P300 in people with high risk of developing psychosis.Neuroimage 41, 553–560.
Campanella, S., Pogarell, O., Boutros, N., 2014. Event-related potentials in substance usedisorders: a narrative review based on articles from 1984 to 2012. Clin. EEG Neurosci.45, 67–76.
Donchin, E., Heffley, E., Hillyard, S.A., Loveless, N., Maltzman, I., Ohman, A., Rösler, F.,Ruchkin, D., Siddle, D., 1984. Cognition and event-related potentials. II. The orientingreflex and P300. Ann. N. Y. Acad. Sci. 425, 39–57.
D'Souza, D.C., Fridberg, D.J., Skosnik, P.D., Williams, A., Roach, B., Singh, N., Carbuto, M.,Elander, J., Schnakenberg, A., Pittman, B., Sewell, R.A., Ranganathan, M., Mathalon,D., 2012. Dose-related modulation of event-related potentials to novel and targetstimuli by intravenous Δ9-THC in humans. Neuropsychopharmacology 37,1632–1646.
Duncan, C.C., Morisha, J., Fawcett, R., Kirch, D., 1987. P300 in schizophrenia: state or traitmarker? Psychopharmacol. Bull. 23, 497–501.
Please cite this article as: Turetsky, B.I., et al., The utility of P300 as a schizodemographic modulators in COGS-2, Schizophr. Res. (2014), http://dx.doi
Ehlers, C.L., Garcia-Andrade, C., Wall, T.L., Sobel, D.F., Phillips, E., 1998. Determinantsof P3 amplitude and response to alcohol in Native American Mission Indians.Neuropsychopharmacology 18, 282–292.
Fabiani, M., Gratton, G., Karis, D., Donchin, E., 1986. Definition, identification and reliabilityof measurement of the P300 component of the event-related brain potential. In:Ackles, P.K., Jennings, J.R., Coles, M.G.H. (Eds.), Advances in Psychophysiology. JAIPress, London, pp. 1–78.
First, M.B., Williams, J.B.W., Spitzer, R.L., Gibbon, M., 2007. Structured Clinical Interviewfor DSM-IV-TR Axis I Disorders, Clinical Trials Version (SCID-CT). BiometricsResearch, New York State Psychiatric Institute, New York.
Folstein, M.F., Folstein, S.E., McHugh, P.R., 1975. “Mini-mental state”. A practical methodfor grading the cognitive state of patients for the clinician. J. Psychiatr. Res. 12,189–198.
Ford, J.M., White, P.M., Csernansky, J.G., Faustman,W.O., Roth, W.T., Pfefferbaum, A., 1994.ERPs in schizophrenia: effects of antipsychotic medication. Biol. Psychiatry 36,153–170.
Frangou, S., Sharma, T., Alarcon, G., Sigmudsson, T., Takei, N., Binnie, C., Murray, R.M.,1997. The Maudsley Family Study, II: endogenous event-related potentials in familialschizophrenia. Schizophr. Res. 23, 45–53.
Frommann, I., Brinkmeyer, J., Ruhrmann, S., Hack, E., Brockhaus-Dumke, A., Bechdolf, A.,Wölwer,W., Klosterkötter, J., Maier,W.,Wagner,M., 2008. Auditory P300 in individualsclinically at risk for psychosis. Int. J. Psychophysiol. 70, 192–205.
Gangadhar, B.N., Ancy, J., Janakiramaiah, N., Umapathy, C., 1993. P300 amplitude in non-bipolar, melancholic depression. J. Affect. Disord. 28, 57–60.
Gottesman, I.I., Gould, T.D., 2003. The endophenotype concept in psychiatry: etymologyand strategic intentions. Am. J. Psychiatry 160, 636–645.
Gratton, G., Coles, M.G., Donchin, E., 1983. A new method for off-line removal of ocularartifact. Electroencephalogr. Clin. Neurophysiol. 55, 468–484.
Hall, R.C., 1995. Global assessment of functioning. A modified scale. Psychosomatics 36,267–275.
Hart, C.L., Ilan, A.B., Gevins, A., Gunderson, E.W., Role, K., Colley, J., Foltin, R.W., 2010.Neurophysiological and cognitive effects of smoked marijuana in frequent users.Pharmacol. Biochem. Behav. 96, 333–341.
Hedges, D., Bennett, D.P., 2014. Cigarette smoking and P300 amplitude in adults: asystematic review. Nicotine Tob. Res. 9, 1157–1166.
Herning, R.I., Jones, R.T., Hooker, W.D., Tulunay, F.C., 1985. Information processingcomponents of the auditory event related potential are reduced by cocaine.Psychopharmacology (Berlin) 87, 178–185.
Hesselbrock, V., Begleiter, H., Porjesz, B., O'Connor, S., Bauer, L., 2001. P300 event-relatedpotential amplitude as an endophenotype of alcoholism — evidence from thecollaborative study on the genetics of alcoholism. J. Biomed. Sci. 8, 77–82.
Holshausen, K., Bowie, C.R., Mausbach, B.T., Patterson, T.L., Harvey, P.D., 2014.Neurocognition, functional capacity, and functional outcomes: the cost of inexperience.Schizophr. Res. 152, 430–434.
Jeon, Y.W., Polich, J., 2003. Meta-analysis of P300 and schizophrenia: paradigms, andpractical implications. Psychophysiology 40, 684–701.
Knight, R.T., 1987. Aging decreases auditory event-related potentials to unexpectedstimuli in humans. Neurobiol. Aging 8, 109–113.
Kügler, C.F., Taghavy, A., Platt, D., 1993. The event-related P300 potential analysis ofcognitive human brain aging: a review. Gerontology 39, 280–303.
Lewis, R.S., Goto, S.G., Kong, L.L., 2008. Culture and context: East Asian American andEuropean American differences in P3 event-related potentials and self construal.Personal. Soc. Psychol. Bull. 34, 623–634.
Light, L., Swerdlow, N.R., Thomas, M.L., Calkins, M.E., Green, M.F., Greenwood, T.A., Gur, R.E., Gur, R.C., Lazzeroni, L.C., Nuechterlein, K.H., Pela, M., Radant, A.D., Seidman, L.J.,Sharp, R.F., Siever, L.J., Silverman, J.M., Sprock, J., Stone, W.S., Sugar, C.A., Tsuang, D.W., Tsuang, M.T., Braff, D.L., Turetsky, B.I., 2014. Validation of mismatch negativityand P3a for use in multi-site studies of schizophrenia: characterization ofdemographic, clinical, cognitive, and functional correlates in the COGS-2. Schizophr.Res. (in this issue).
Linden, D.E.J., 2005. The P300: where in the brain is it produced and what does it tell us?Neuroscientist 11, 563–576.
Mathalon, D.H., Ford, J.M., Pfefferbaum, A., 2000. Trait and state aspects of P300 amplitudereduction in schizophrenia: a retrospective longitudinal study. Biol. Psychiatry 47,434–449.
Mathalon, D.H., Ahn, K.H., Perry Jr., E.B., Cho, H.S., Roach, B.J., Blais, R.K., Bhakta, S.,Ranganathan, M., Ford, J.M., D'Souza, D.C., 2014. Effects of nicotine on the neurophys-iological and behavioral effects of ketamine in humans. Front. Psychiatry 5, 3. http://dx.doi.org/10.3389/fpsyt.2014.00003 Jan 24.
Mausbach, B.T., Depp, C.A., Bowie, C.R., Harvey, P.D., McGrath, J.A., Thronquist, M.H., Luke,J.R., Wolyniec, P.S., Pulver, A.E., Patterson, T.L., 2011. Sensitivity and specificity of theUCSD performance-based skills assessment (UPSA-B) for identifying functionalmilestones in schizophrenia. Schizophr. Res. 132, 165–170.
Mobascher, A., Brinkmeyer, J., Warbrick, T., Wels, C., Wagner, M., Gründer, G.,Spreckelmeyer, K.N., Wienker, T., Diaz Lacava, A., Dahmen, N., Böttcher, M.,Thuerauf, N., Clepce, M., Kiefer, F., De Millas, W., Gallinat, J., Winterer, G., 2010.The P300 event-related potential and smoking—a population-based case–controlstudy. Int. J. Psychophysiol. 77, 166–175.
Nieman, D.H., Ruhrmann, S., Dragt, S., Soen, F., van Tricht, M.J., Koelman, J.H., Bour,L.J., Velthorst, E., Becker, H.E., Weiser, M., Linszen, D.H., de Haan, L., 2013.Psychosis prediction: stratification of risk estimation with information-processingand premorbid functioning variables. Schizophr. Bull. Oct 18, Epub ahead ofprint.
O'Connor, S., Morzorati, S., Christian, J.C., Li, T.-K., 1994. Heritable features of the auditoryoddball event-related potential: peaks, latencies, morphology and topography.Electroencephalogr. Clin. Neurophysiol. 92, 115–125.
phrenia endophenotype and predictive biomarker: Clinical and socio-.org/10.1016/j.schres.2014.09.024

10 B.I. Turetsky et al. / Schizophrenia Research xxx (2014) xxx–xxx
Özgürdal, S., Gudlowski, Y., Witthaus, H., Kawohl, W., Uhl, I., Hauser, M., Gorynia, I.,Gallinat, J., Heinze, M., Heinz, A., Juckel, G., 2008. Reduction of auditory event-related P300 amplitude in subjects with at-risk mental state for schizophrenia.Schizophr. Res. 105, 272–278.
Patterson, J.V., Michalewski, H.J., Starr, A., 1988. Latency variability of the components ofauditory event-related potentials to infrequent stimuli in aging, Alzheimer-typedementia, and depression. Electroencephalogr. Clin. Neurophysiol. 71, 450–460.
Picton, T.W., 1992. The P300 wave of the human event-related potential. J. Clin.Neurophysiol. 9, 456–479.
Pokryszko-Dragan, A., Slotwiński, K., Podemski, R., 2003. Modality-specific changes inP300 parameters in patients with dementia of the Alzheimer type. Med. Sci. Monit.9, CR130–CR134.
Polich, J., 2007. Updating P300: an integrative theory of P3a and P3b. Clin. Neurophysiol.118, 2128–2148.
Polich, J., Burns, T., 1987. P300 from identical twins. Neuropsychologia 25, 299–304.Polich, J., Ochoa, C.J., 2004. Alcoholism risk, tobacco smoking, and P300 event-related
potential. Clin. Neurophysiol. 115, 1374–1383.Polich, J., Ladish, C., Bloom, F.E., 1990. P300 assessment of early Alzheimer's disease.
Electroencephalogr. Clin. Neurophysiol. 77, 179–189.Rapaport, M.H., Bazzetta, J., McAdams, L.A., Patterson, T., Jeste, D.V., 1996. Validation of the
scale of functioning in older outpatients with schizophrenia. Am. J. Geriatr. Psychiatr.4, 218–228.
Regan, D., 1989. Human Brain Electrophysiology. Elsevier Science Publishing, New York.Salisbury, D.F., Shenton, M.E., McCarley, R.W., 1999. P300 topography differs in
schizophrenia and manic psychosis. Biol. Psychiatry 45, 98–106.Segalowitz, S.J., Barnes, K.L., 1993. The reliability of ERP components in the auditory
oddball paradigm. Psychophysiology 30, 451–459.Singh, S.M., Basu, D., Kohli, A., Prabhakar, S., 2009. Auditory P300 event-related potentials
and neurocognitive functions in opioid dependent men and their brothers. Am. J.Addict. 18, 198–205.
Smith, M.E., Halgren, E., Sokolik, M., Baudena, P., Musolino, A., Liegeois-Chauvel, C.,Chauvel, P., 1990. The intracranial topography of the P3 event-related potentialelicited during auditory oddball. Electroencephalogr. Clin. Neurophysiol. 76, 235–248.
Squires, N.K., Squires, K.C., Hillyard, S.A., 1975. Two varieties of long-latency positivewaves evoked by unpredictable auditory stimuli in man. Electroencephalogr. Clin.Neurophysiol. 38, 387–401.
Swerdlow, N.R., Gur, R.E., Braff, D.L., 2014. Consortium on the genetics of schizophrenia(COGS) assessment of endophenotypes for schizophrenia: an introduction to thisspecial issue of schizophrenia research. Schizophr. Res. (in this issue).
Please cite this article as: Turetsky, B.I., et al., The utility of P300 as a schizodemographic modulators in COGS-2, Schizophr. Res. (2014), http://dx.doi
Tilki, H.E., Akpolat, T., Tunali, G., Kara, A., Onar, M.K., 2004. Effects of haemodialysis andcontinuous ambulatory peritoneal dialysis on P300 cognitive potentials in uraemicpatients. Ups. J. Med. Sci. 109, 43–48.
Turetsky, B.I., Colbath, E.A., Gur, R.E., 1998a. P300 subcomponent abnormalities inschizophrenia: I. Physiological evidence for gender and subtype specific differencesin regional pathology. Biol. Psychiatry 43, 84–96.
Turetsky, B.I., Colbath, E.A., Gur, R.E., 1998b. P300 subcomponent abnormalities inschizophrenia: II. Longitudinal stability and relationship to symptom change. Biol.Psychiatry 43, 31–39.
Turetsky, B.I., Colbath, E.A., Gur, R.E., 2000. P300 subcomponent abnormalities inschizophrenia: III. Deficits in unaffected siblings of schizophrenic probands.Biol. Psychiatry 47, 380–390.
Turetsky, B.I., Calkins, M.E., Light, G.A., Olincy, A., Radant, A.D., Swerdlow, N.R., 2007.Neurophysiological endophenotypes of schizophrenia: the viability of selectedcandidate measures. Schizophr. Bull. 33, 69–94.
van der Stelt, O., Lieberman, J.A., Belger, A., 2005. Auditory P300 in high-risk, recent-onsetand chronic schizophrenia. Schizophr. Res. 77, 309–320.
van Tricht, M.J., Nieman, D.H., Koelman, J.H.T.M., van der Meer, J.N., Bour, L.J., de Haan, L.,Linszen, D.H., 2010. Reduced parietal P300 amplitude is associated with an increasedrisk for a first psychotic episode. Biol. Psychiatry 68, 642–648.
van Tricht, M.J., Harmsen, E.C., Koelman, J.H., Bour, L.J., van Amelsvoort, T.A., Linszen, D.H.,de Haan, L., Nieman, D.H., 2013. Effects of cannabis use on event related potentials insubjects at ultra high risk for psychosis and healthy controls. Int. J. Psychophysiol. 88,149–156.
Venables, P., 1964. Input dysfunction in schizophrenia. In: Maher, B.A. (Ed.), Progress inExperimental Personality Research. Academic Press, Orlando, pp. 1–47.
Vesterager, L., Christensen, T.Ø., Olsen, B.B., Krarup, G., Melau, M., Forchhammer, H.B.,Nordentoft, M., 2012. Cognitive and clinical predictors of functional capacity inpatients with first episode schizophrenia. Schizophr. Res. 141, 251–256.
Wall, T.L., Ehlers, C.L., 1995. Acute effects of alcohol on P300 in Asians with differentALDH2 genotypes. Alcohol. Clin. Exp. Res. 3, 617–622.
Zhang, Y., Zhong, B.L., Li, Y., Ma, Z.L., Tian, Y., Tang, J., 2012. Brain event-related potentialsassociated with psychiatric symptoms in amphetamine-type stimulant dependentpatients. Int. J. Psychiatry Med. 43, 189–196.
phrenia endophenotype and predictive biomarker: Clinical and socio-.org/10.1016/j.schres.2014.09.024
Copyright © 2022 FDOKUMEN