The Utility of a Rodent Model in Detecting Pediatric Drug-Induced Nephrotoxicity
22
The Utility of a Rodent Model in Detecting Pediatric Drug-Induced Nephrotoxicity Parvaneh Espandiari *,1 , Jun Zhang * , Barry A. Rosenzweig * , Vishal S. Vaidya † , Jinchun Sun ‡ , Laura Schnackenberg ‡ , Eugene H. Herman * , Alan Knapton * , Joseph V. Bonventre † , Richard D. Beger ‡ , Karol L. Thompson * , and Joseph Hanig * * Center for Drug Evaluation and Research, Silver Spring, Maryland 20993 † Brigham and Women’s Hospital, Harvard Medical School, Boston, Massachusetts 02115 ‡ National Center for Toxicological Research, Jefferson, Arkansas 72079 Abstract A multi-age rat model was used to identify potential age-related differences in renal injury following exposure to gentamicin (GM). In this study, 10-, 25-, 40-, and 80-day-old Sprague-Dawley rats were dosed with GM at 0, 50, or 100 mg kg -1 body weight per day (mkd) sc for 6 or 14 days. Urine samples were collected up to 72 h after initial dosing. The maximum tolerated dose was lower in 10-day-old rats than for other ages (none survived 11 days of treatment). Eighty-day-old rats given the highest dose showed a diminished rate of growth and an increase in serum creatinine, blood urea nitrogen (BUN), urinary kidney injury molecule-1 (Kim-1), and renal pathology. Ten- and 40-day-old rats given 100 mkd of GM for 6- or 14 days also had increased levels of serum BUN and Cr and renal pathology, whereas only mild renal alterations were found in 25-day-old rats. After 6 days of treatment with 100 mkd GM, significant increases in Havcr-1 (Kim-1) gene expression were detected only in 10- and 80-day-old rats. In urine samples, nuclear magnetic resonance and ultra performance liquid chromatography/mass spectrometry analysis detected changes related to GM efficacy (e.g., hippurate) and increases in metabolites related to antioxidant activity, which was greatest in the 80- day-old rats. The magnitude of the genomic, metabonomic, and serum chemistry changes appeared to correlate with the degree of nephropathy. These findings indicate that an experimental animal model that includes several developmental stages can detect age-related differences in drug-induced organ toxicities and may be a useful predictor of pediatric drug safety in preclinical studies. Keywords gentamicin; age-related nephrotoxicity; biomarkers; Kim-1 The spectrum and intensity of drug activity can be influenced by the level of organ development. In some instances responses are of sufficient magnitude to provoke an adverse drug reaction (ADR) (Makri et al., 2004; Stephenson, 2005). An ADR in pediatric patients may be different from that occurring in adults receiving the same drug. The incidence of ADRs in pediatric patients could be related to the nonlinear maturation of certain pathways responsible for drug absorption, distribution, metabolism, and excretion (ADME) (Faustman et al., 2000; Pirmohamed et al., 1998). The biological conditions present at a young age that 1 To whom correspondence should be addressed at Division of Applied Pharmacology Research (HFD-910), Center for Drug Evaluation and Research, Food and Drug Administration, Life Sciences Laboratory Building 64, Room 2086, 10903 New Hampshire Avenue, Silver Spring, MD 20993. Fax: (301) 796-9818. E-mail: [email protected]. The contents of this paper do not necessarily reflect any position of the Government or the opinion of the Food and Drug Administration. NIH Public Access Author Manuscript Toxicol Sci. Author manuscript; available in PMC 2009 August 20. Published in final edited form as: Toxicol Sci. 2007 October ; 99(2): 637–648. doi:10.1093/toxsci/kfm184. NIH-PA Author Manuscript NIH-PA Author Manuscript NIH-PA Author Manuscript
-
Upload
independent -
Category
Documents
-
view
1 -
download
0
Transcript of The Utility of a Rodent Model in Detecting Pediatric Drug-Induced Nephrotoxicity
The Utility of a Rodent Model in Detecting Pediatric Drug-InducedNephrotoxicity
Parvaneh Espandiari*,1, Jun Zhang*, Barry A. Rosenzweig*, Vishal S. Vaidya†, JinchunSun‡, Laura Schnackenberg‡, Eugene H. Herman*, Alan Knapton*, Joseph V. Bonventre†,Richard D. Beger‡, Karol L. Thompson*, and Joseph Hanig**Center for Drug Evaluation and Research, Silver Spring, Maryland 20993†Brigham and Women’s Hospital, Harvard Medical School, Boston, Massachusetts 02115‡National Center for Toxicological Research, Jefferson, Arkansas 72079
AbstractA multi-age rat model was used to identify potential age-related differences in renal injury followingexposure to gentamicin (GM). In this study, 10-, 25-, 40-, and 80-day-old Sprague-Dawley rats weredosed with GM at 0, 50, or 100 mg kg-1 body weight per day (mkd) sc for 6 or 14 days. Urine sampleswere collected up to 72 h after initial dosing. The maximum tolerated dose was lower in 10-day-oldrats than for other ages (none survived 11 days of treatment). Eighty-day-old rats given the highestdose showed a diminished rate of growth and an increase in serum creatinine, blood urea nitrogen(BUN), urinary kidney injury molecule-1 (Kim-1), and renal pathology. Ten- and 40-day-old ratsgiven 100 mkd of GM for 6- or 14 days also had increased levels of serum BUN and Cr and renalpathology, whereas only mild renal alterations were found in 25-day-old rats. After 6 days oftreatment with 100 mkd GM, significant increases in Havcr-1 (Kim-1) gene expression were detectedonly in 10- and 80-day-old rats. In urine samples, nuclear magnetic resonance and ultra performanceliquid chromatography/mass spectrometry analysis detected changes related to GM efficacy (e.g.,hippurate) and increases in metabolites related to antioxidant activity, which was greatest in the 80-day-old rats. The magnitude of the genomic, metabonomic, and serum chemistry changes appearedto correlate with the degree of nephropathy. These findings indicate that an experimental animalmodel that includes several developmental stages can detect age-related differences in drug-inducedorgan toxicities and may be a useful predictor of pediatric drug safety in preclinical studies.
Keywordsgentamicin; age-related nephrotoxicity; biomarkers; Kim-1
The spectrum and intensity of drug activity can be influenced by the level of organdevelopment. In some instances responses are of sufficient magnitude to provoke an adversedrug reaction (ADR) (Makri et al., 2004; Stephenson, 2005). An ADR in pediatric patientsmay be different from that occurring in adults receiving the same drug. The incidence of ADRsin pediatric patients could be related to the nonlinear maturation of certain pathwaysresponsible for drug absorption, distribution, metabolism, and excretion (ADME) (Faustmanet al., 2000; Pirmohamed et al., 1998). The biological conditions present at a young age that
1To whom correspondence should be addressed at Division of Applied Pharmacology Research (HFD-910), Center for Drug Evaluationand Research, Food and Drug Administration, Life Sciences Laboratory Building 64, Room 2086, 10903 New Hampshire Avenue, SilverSpring, MD 20993. Fax: (301) 796-9818. E-mail: [email protected] contents of this paper do not necessarily reflect any position of the Government or the opinion of the Food and Drug Administration.
NIH Public AccessAuthor ManuscriptToxicol Sci. Author manuscript; available in PMC 2009 August 20.
Published in final edited form as:Toxicol Sci. 2007 October ; 99(2): 637–648. doi:10.1093/toxsci/kfm184.
NIH
-PA Author Manuscript
NIH
-PA Author Manuscript
NIH
-PA Author Manuscript

could alter drug ADME include: differences in levels of drug metabolizing enzymes, stomachpH, gastrointestinal emptying time, levels of serum albumin, and in the nonadult body H2O:fatratio (Cresteil et al., 1985; Heyman, 1998). In addition, drug activities can also be affected bydevelopmental differences in the ratio of metabolites as well as lower levels of both biliaryactivity and renal excretion (Bates and Balistreri, 2004). One of the limiting factors inunderstanding ADRs in pediatric populations is the lack of appropriate animal models that canbe used to predict the possible consequences of exposure to drugs during the early years ofhuman development.
Gentamicin (GM), an aminoglycoside antibiotic, prescribed for the treatment of life-threatening infections (gram-negative and -positive bacilli) is associated with a 10-15%incidence of nephrotoxicity (acute renal failure [ARF] and increases in serum creatinine [Cr])(Ali, 1995; Mingeot-Leclercq and Tulkens, 1999). GM-induced nephrotoxicity is attributed toan accumulation of a small percentage (∼5%) of the administered dose in renal cortical tubularepithelial cells (Nagai and Takano, 2004; Wiland and Szechcinski, 2003). The exact pathgenicmechanism responsible for GM nephrotoxicity is not completely delineated. Severalhypotheses have been suggested including the generation of reactive oxygen species, renalcortical phospholipidosis, and inhibition of Na+--K+- ATPase (Ali, 1995).
There is a continuing need to develop specific and sensitive biomarkers for the early detectionof renal toxicity. At present, the most common means of detecting renal injury is to monitorlevels of blood urea nitrogen (BUN) and serum Cr. Detectable changes in the concentration ofthese two substances are observed only after a considerable amount of renal function is lost.This study was initiated to develop and characterize an animal model that could mimic thedifferent stages of human development and to use this model to evaluate potential age-relateddifferences in renal sensitivity to a nephrotoxic agent (GM).
MATERIALS AND METHODSAnimals
Sprague-Dawley rats (Harlan, Indianapolis, IN) that were 10, 25, 40, or 80 days old were usedin this study. The acclimation period was different for each age group to allow dosing at theyoungest age feasible; 7 days for 33- and 73-day-old rats and 2 days for 23-day-old rats. Inorder to obtain 10-day-old rats, pregnant females (gestation day 15) were allowed to deliver.After birth, both female and male pups were housed with their dams and were treated beginningat 10 days of age. Male rats were used in all age groups (n = 4) except for the 10-day old whereboth female and male pups were included (n = 12-15). In this age group, data from both genderswere combined when analysis showed no female or male treatment group differences. Theanimals were housed in plastic cages and maintained in a controlled environment (22°C witha 12-h light-dark cycle). Rats had access to Purina rodent laboratory chow (Purina Mills, StLouis, MO) and water ad libitum.
ChemicalsGM was purchased from Sigma Chemical Co. (St Louis, MO). The drug was dissolved innormal saline at concentrations (0, 10, and 20 mg ml-1) before use. High-performance liquidchromatography (HPLC) grade acetonitrile and water were purchased from Burdick & Jackson(Muskegon, MI). Formic acid and leucine enkephalin were from Sigma Aldrich (St Louis,MO). NMR (nuclear magnetic resonance) solvents trimethylsilyl-2,2,-3,3-tetradeuteropropionic acid (TMSP) and deuterium oxide were obtained from CambridgeIsotope Laboratories (Andover, MA).
Espandiari et al. Page 2
Toxicol Sci. Author manuscript; available in PMC 2009 August 20.
NIH
-PA Author Manuscript
NIH
-PA Author Manuscript
NIH
-PA Author Manuscript
Experimental ProtocolAnimals were placed in metabolism cages (25-day-old, two per cage and 40- and 80-day old,one per cage) 12 h before and up to 72 h after the first of three injections. Animals in themetabolism cages had free access to food and water. Rats were dosed once daily (early morningat the same time) with saline or GM at 50 or 100 mg kg-1 day-1 (mkd) (for 6 or 14 consecutivedays). The dose volume of the sc injections of GM was 5 ml kg-1 body weight. For metabonomicanalysis, urine samples were collected from all age groups at 0, 8, 24, 48, and 72 h after theinitial dosing except for 10-day-old rats because maternal and pup urine could not be separated.Twenty-four hours after the last injection, all groups were anesthetized with isoflurane andterminal blood samples collected from the abdominal vena cava. The animals were theneuthanized by exsanguination. At necropsy, liver, spleen, heart, intestine, and kidney wereremoved, weighed, and processed for pathology and other studies. All procedures performedduring the course of the study were approved by the Center for Drug Evaluation and ResearchInstitutional Animal Care and Use Committee and were in accord with the Guide for Care andUse of Laboratory Animals (Institute of Laboratory Animal Resources, 1996).
PathologyA portion of each tissue collected was fixed in neutral buffered formalin, embedded in paraffin(sectioned at 5 μm), and stained with hematoxylin-eosin. GM-induced renal lesions wereevaluated by light microscopy according to the severity of tubular cell alterations (necrosis,degeneration, regeneration), tubular dilatation, tubular protein casts, glomerular vacuolization,and interstitium mononuclear cell infiltration.
Clinical Chemistry AnalysisThe VetScan analyzer was used (Abaxis, Inc., Union City, CA) for all clinical chemistryanalysis. For the 10-day-old group, blood from three pups was pooled to obtain a sufficientvolume for the different assays.
Kim-1Kim-1 protein in urine was measured by Microsphere-based Luminex xMAP technology. Thistechnique is an adaptation of the recently developed and validated sandwich ELISA assay fromHarvard Medical School (Vaidya et al., 2005, 2006). For measurements, 30 μl of urine fromrespective control and treated groups was analyzed in duplicate.
NMR AnalysisSamples were prepared by combining 400 μl of urine, 200 μl of sodium phosphate buffer (pH7.4), and 60 μl of a mixture of 10mM TMSP (sodium 3-trimethyl-silyl-[2,2,3,3,-d4]propionate)and 100mM imidazole. Proton (1H) NMR spectra were acquired on a Bruker Advancespectrometer operating at 600.133 MHz. The NMR spectrometer was equipped with a tripleresonance cryoprobe. Water suppression was achieved through application of the Bruker“noesypresat” pulse sequence, which irradiates the water resonance during a delay time (d1 =2 s) and a mixing time (d8 = 100 ms). For each sample, 32 scans were collected into 65,536data points. A spectral width of 9615.39 Hz was utilized with an acquisition time of 3.41 s.
Liquid ChromatographyFor ultra performance liquid chromatography (UPLC)-mass spectrometry (MS) analysis, 100μl aliquots of each urine sample was centrifuged at 15,866 g for 12 min at room temperature,and the supernatant liquid was transferred to autosampler vials. Metabolites were separatedusing a Waters Acquity UPLC system by injecting 5 μl samples of urine onto a Waters BEHC18 (2.1 mm × 10 cm, 1.7 μm) column held at 40°C. The metabolites were eluted from the
Espandiari et al. Page 3
Toxicol Sci. Author manuscript; available in PMC 2009 August 20.
NIH
-PA Author Manuscript
NIH
-PA Author Manuscript
NIH
-PA Author Manuscript

column with a linear gradient of 0-30% B over 0-6 min, 30-50% B over 6-9 min, and 50-95%B over 9-11 min; the composition was constant for 1 min and then returned to 100% A at 12.1min at a flow rate 0.15 ml min-1 (A = 0.1% formic acid in water, B = 0.1% formic acid inacetonitrile). After each injection, a strong/weak wash cycle was employed on the autosamplerto minimize the carryover between analyses. The weak needle wash solvent was 0.1% formicacid, and the strong needle wash solvent was 50:50 acetonitrile/water.
Mass SpectrometryMass spectrometric data were obtained with a Waters LCT premier single time-of-flight massspectrometer equipped with an electrospray ion source. LCT premier was operated in W opticsmode with 11,000 resolution using dynamic range extension. The source temperature was setup to 120°C with a cone gas flow of 50 l h-1, a desolvation temperature of 200°C, and adesolvation gas flow of 550 l h-1. The capillary voltage was 3.2 kV for positive mode and 2.6kV for negative mode with a cone voltage of 40 V. A scan time of 0.5 s with an inter-scandelay of 0.05 s was used for all the analyses. Leucine enkephalin at a concentration of 250 pgμl-1 (in 50:50 acetonitrile:0.1% formic acid) was used as a lock-mass in positive mode ([M +H] = 556.2771) and 29 ng μl-1 for negative mode ([M - H] = 554.2615). The lock sprayfrequency was 5 s, and the lock mass data averaged over 10 scans for collection. A full scanmode from m/z 50 to 850 from 0 to 12 min was used for data collection, in both positive andnegative mode. Compounds detected by MS were confirmed by comparison with authenticstandards.
Renal Gene Expression Sample Processing and AnalysisFor RNA isolation, kidneys were resected and quickly dissected into 0.5 cm sections whilesubmersed in RNALater (Ambion, Austin, TX). Samples were stored in RNALater at 4°C fora minimum of 24 h and a maximum of 72 h. Kidney RNA was isolated using the Qiagen MaxiKit Protocol after homogenization of the whole organ tissue using a VirTis Tempest rotor-stator homogenizer. RNA quality was assessed on an Agilent 2100 Bioanalyzer. RNA sampleswere quantitated on a NanoDrop ND-1000 spectrophotometer, aliquoted, and frozen at - 70°C. Quantitative analysis of transcript levels in total RNA was determined using real timequantitative reverse transcription (qRT)-PCR with kits from Applied Biosystems (Foster City,CA) (ABI). cDNA was generated using random hexamer primers and ABI TaqMan ReverseTranscription Reagents kits. PCR was performed using ABI SYBR Green PCR Core Reagentskits on the ABI Prism 7900HT sequence detection system as described in User Bulletin #2(updated 10/2001). Five fourfold serial dilutions were used to prepare relative standard curvesfor each of the targets and an endogenous reference. Four replicate wells were performed oneach sample, with an average technical variation of less than 4.3% across the entire dataset.Delta Ct values for target genes were imputed from standard curves from four technicalreplicates per sample and normalized to the control gene average. The endogenous referencegene used in these experiments was 60s ribosomal protein L7 (Rpl7), based on its low signalvariance in microarray data from control and GM-treated kidney samples. Relative foldchanges in renal gene expression were calculated for individual animals by dividing the amountof normalized target mRNA by the mean of three control animals in a given age group andtime point. The statistical significance of differences in relative gene expression levels betweentime-matched control and treatment groups was calculated using a Student’s t-test comparisonof fold change values between age-matched GM-treated and control groups.
Forward (For) and reverse (Rev) primer sequences were designed for the selected targets usingABI Primer Express software. HPLC-purified oligonucleotide primers were obtained fromBioserve Biotechnologies (Laurel, MD) for the following targets: Havcr1(Kim-1): For-GTGAGTGGACCAGGCACACA, Rev-AATCCCTTGATCCATTGTTTTC; Tnfrsf12a: For-CCACCCACTCGGATGGACT, Rev-CCCAGGGCTAAAACTCAGGG; Lcn2: For-
Espandiari et al. Page 4
Toxicol Sci. Author manuscript; available in PMC 2009 August 20.
NIH
-PA Author Manuscript
NIH
-PA Author Manuscript
NIH
-PA Author Manuscript
ACAACGTCACTTCCATCCTCG, Rev-TGATCCAGTAGCGACAGCCC; Spp1: For-TGAACAGTATCCCGATGCCA, Rev-CTCTTCATGCGGGAGGTGA; Clu: For-GCTTCATTCCCTCCAGTCCA, Rev-TGTTCCAGCAGGGATGAGGT; Rpl7 (60sribosomal protein L7): For-CAGTACGCGAAGGACATAGGC, Rev-CATTCAGGTCGCTTAGTCCAACT.
Statistical AnalysisAll data from the serum, body, and organ weights were expressed as means ± SE and analyzedusing ANOVA. Data from female and male 10-day-old rats were combined for cases in whichthere were no differences between genders.
Data AnalysisNMR data—Spectra were processed using ACD/Labs 1D NMR Manager (Toronto, Canada).The raw free-induction decays were zero filled to 131,072 points, multiplied by a 0.3 Hzexponential function and Fourier transformed. The transformed spectra were then phased usingthe simple method and baseline corrected using the “SpAveraging” method with a box halfwidth of 61 points and a noise factor of 3. All spectra were autoreferenced to the TMSP peakat 0.0 ppm. The spectra were overlaid in the processing window and grouped. Regionscontaining the resonances for water, urea, and other solvent peaks were removed prior tointegration. The intelligent bucketing module was employed for integration with the bucketwidth set to 0.04 ppm and the looseness set to 50% for bin size optimization. The table ofintegrals was exported as a text file for statistical analysis. All statistical analyses of NMR datawere done using Statistica version 6.0 (Statsoft, Tulsa, OK). Principal component analysis(PCA) based on covariance of the data was applied to the bucketed intensities. Metaboliteidentification within the individual spectra was accomplished using the Chenomx NMR Suite(Chenomx, Calgary, Canada), which has a database of >250 compounds.
MS data—After data acquisition using UPLC-MS, the raw data were analyzed using theMicromass MarkerLynx Application version 4.0 (Waters Corporation, Milford, MA).MarkerLynx was employed for peak finding and peak alignment. The original data wereprocessed using the following parameters: initial retention time 0 min, final retention time 12min, mass tolerance 0.02 Da, retention time tolerance 0.1 min, 20 masses in a 0.2-min retentionwindow. The raw data were then transformed into a single matrix containing aligned peakswith the same mass/retention time pair along with peak normalized intensities and samplename. The resulting two-dimensional data were analyzed by PCA and evaluated for markersthat related to age, efficacy, and renal toxicity.
RESULTSMortality
GM-induced lethality was noted only in the 10-day-old pups. In this age group, all pups diedafter 10 or 11 days of 50 or 100 mkd GM treatments (data not shown).
Growth, Liver, Spleen, and HeartThe effects of GM on body weight and other major organ weights are summarized in Table 1.The rate of growth (final body weight to the initial body weight expressed as percent of control)was significantly decreased only in 80-day-old rats treated with 100 mkd GM for 14 days. Asa means of assessing GM-induced organ toxicity, the ratio of kidney, liver, heart, and spleenweights to the final body weights of the animals were determined (expressed as percent ofcontrol). Kidney weight was significantly increased in 40- and 80-day-old rats treated with 100mkd of GM for 14 days. A similar change was noted in the kidney of 10-day-old rats given a
Espandiari et al. Page 5
Toxicol Sci. Author manuscript; available in PMC 2009 August 20.
NIH
-PA Author Manuscript
NIH
-PA Author Manuscript
NIH
-PA Author Manuscript

100 mkd dose of GM for 6 days. Liver weights significantly decreased in 40-day-old ratsfollowing 6- or 14-day treatment with either 50 or 100 mkd GM. A similar decline in liverweight was observed in 80-day-old rats but only in those animals treated with 100 mkd GMfor 6 days. No changes in heart or spleen weight were found in any of the age or treatmentgroups (data not shown).
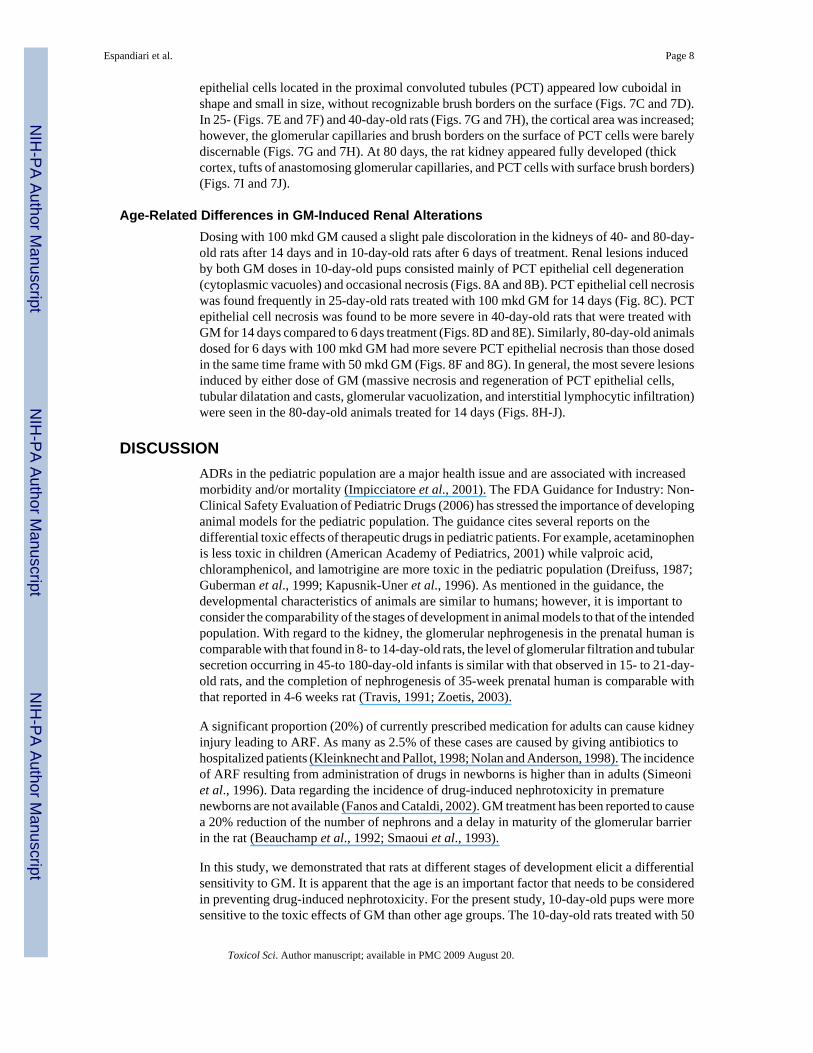
Clinical ChemistryDose levels of 100 mkd GM caused significant increases in serum BUN and Cr in 40- and 80-day-old rats after 14 days of treatment and in 10-day-old pups after 6 days of treatment (Figs.1 and 2). The 80-day-old rats that were given the highest dose of GM for 14 days had significantdeclines in certain clinical chemistry parameters. The average values of the following serummarkers in the control and treated groups, respectively, were alkaline phosphatase (266 ± 41ul-1 and 163 ± 31 ul-1), albumin (4.1 ± 0.2 g dl-1 and. 3.47 ± 0.1 g dl-1), and total protein (5.27± 0.1 mMol l-1 and. 1.4 ± 0.1 mMol l-1). In contrast, serum cholesterol levels were significantlyincreased (p < 0.05, n = 4) after 6 days of treatment with GM (71 ± 2.3 mg dl-1 at 50 mkd and73 ± 9.2 mg dl-1 at 100 mkd compared to 55 ± 3.3 mg dl-1 in controls). No significant changesin clinical chemistry concentrations were seen in the other age groups at any GM doses.
Kidney Injury Molecule-1Urine samples from 25-, 40-, and 80-day-old animals were collected in metabolism cages forup to 72 h after GM injection in order to detect early biomarkers of nephrotoxicity. For 25-day-old rats, samples were obtained by pooling the urine from two rats per cage (n = 4 pooledsamples). The levels of Kim-1 increased significantly only in 80-day-old rats treated with 100mkd GM at 48 and 72 h (386 ± 48 pg ml-1 vs. 140 ± 23 pg ml-1 at 48 and 271 ± 32 pg ml-1 vs.138 ± 16 pg ml-1 at 72 h). No significant changes were seen at either GM dose in the other agegroups.
Gene Expression Markers of NephrotoxicityTreatment with nephrotoxic drugs or ischemic injury induces the upregulation of a number ofgene transcripts in a dose- or time-dependent manner in kidney tissue, including Havcr1(named kidney injury molecule-1 [Kim-1] in rats and hepatitis A virus cellular receptor 1 inother species), clusterin (Clu), lipocalin2 (Lcn2), osteopontin (Spp1), and tweak receptor(Tnfrsf12a) (Amin et al., 2004; Davis and Kramer, 2006; Thompson et al., 2004). In this study,the age-dependent effects of GM on these five putative gene expression markers ofnephrotoxicity were assayed after 6 or 14 days of dosing with GM. The transcript levels of thefive genes in kidney tissue were measured in qRT-PCR assays relative to an endogenous controlgene and compared to age- and time-matched controls. After 6 days of dosing with 100 mkdGM, only the 10-day-old age group showed significant elevations in the levels of all fivenephrotoxicity marker genes (p < 0.01) (Fig. 3A). In the 80-day-old group, levels of Havcr1,Tnfrsf12a, and Spp1 transcripts were significantly increased (p < 0.05) at this dose and timepoint. In 25- and 40-day-old rats, significant treatment-related increases were observed for onlyone of the five markers (Tnfrsf12a and Spp1, respectively). Six days of treatment with 50 mkdGM also significantly increased all five indicator genes in 10-day-old rats (data not shown)but was not assayed in the older groups.
After 14 days of dosing with 50 mkd GM, Havcr1, Tnfrsf12a, and Clu were significantlyupregulated in the 25-, 40-, and 80-day-old age groups (Fig. 3B). No samples from 10-day-oldrats were available for this time point due to premature deaths. Lcn2 and Spp1 transcript levelswere significantly elevated in 40- and 80-day-old rats, but not in 25-day-old rats, at this doselevel. After 14 days of dosing with 100 mkd GM, a considerable amount of renal damage (Fig.8B) and significant upregulation of all five expression biomarkers of nephrotoxicity (Fig 3B)are observed in all three age groups (p < 0.01), except for Lcn2 expression in 25-day-old rats.
Espandiari et al. Page 6
Toxicol Sci. Author manuscript; available in PMC 2009 August 20.
NIH
-PA Author Manuscript
NIH
-PA Author Manuscript
NIH
-PA Author Manuscript

The observed effect of treatment on the level and significance of change in genes associatedwith nephrotoxicity suggests the following order of sensitivity to GM-induced renal damage:10-day-old ⪢ 80-day-old > 40-day-old > 25-day-old.
Metabonomics AnalysisNMR results—Figure 4A shows the three-dimensional PCA (3D PCA) of the NMR data ofurine samples from three age groups (25-, 40-, and 80-day-old rats), at both GM doses (50 and100 mkd), and all time points (0, 8, 24, 48, and 72 h). The PCA plot shows that the samplescluster primarily by age group in different regions of the plot. Closer inspection revealed thatwithin each age cluster, there are sub-clusters for the doses and the various time points. Thereis a clear time-dependent response to GM with the trajectory moving away from the predose(0 h) time points.
At both GM doses, urinary hippurate levels were significantly decreased in all age groups at48 and 72 h after dosing. Figure 5A shows the decrease of hippurate as detected by NMR onday 3 (72 h time point) of the 6-day study. Since GM is a known antibiotic, the decrease inhippurate is a drug efficacy effect as it decreases the total gut microflora content (Lenz et al.,2005). Urine glucose concentrations were significantly increased in all age groups 72 h afterdosing at the 50 and 100 mg kg-1 level when compared to age-matched controls except for thelow dose 25-day-old animals at 48 h after dosing (Fig. 5B). Glucosuria has been shownpreviously to be a potential marker of renal toxicity (Lenz et al., 2004, 2005; Williams et al.,2003).
UPLC/MS Analysis of UrineThe urinary metabonomic data obtained via UPLC/MS revealed marked metabolic alterationsrelated to animal age and GM treatment at all time points, in both positive and negative modes.Figure 4B shows the 3D PCA plot of the negative mode UPLC/MS data from all the urinesamples in the study. The three different age groups separate into distinct clusters similar tothe pattern seen with the NMR data. Additionally, a clear separation of the treated and controlgroups at each age group at 24, 48, and 72 h time points was observed in PCA analyses ofUPLC/MS data (data not shown). The spectra from the dosed animals began to deviate fromcontrols at the 24 h time point and were further separated at 48 and 72 h. Furthermore, UPLC/MS analysis also showed a decrease in the concentration of hippuric acid following GMadministration as was also noted by the NMR analysis. Many other unidentified UPLC/MSpeaks were detected that were decreased significantly by day 3 in all three age groups and couldbe GM efficacy markers. Other metabolites detected and identified by UPLC/MS will bereported in a separate publication. Figure 6A illustrates the trend view for 6-hydroxymelatoninfrom UPLC/MS analysis in negative mode ionization in 25-, 40-, and 80-day rats dosed with100 mkd GM. 6-Hydroxymelatonin appeared to increase at 48 h in both 40- and 80-day-oldgroups after treatment with 100 mkd GM, but not in the 25-day-old group. Figure 6B shows atypical positive ion trend plot for an ion with m/z 227.0983 and tR 6.73 min from urine analysisin 25-, 40-, and 80-day-old rats dosed with 100 mkd GM. This unknown ion at tR 0f 6.73 minand m/z 227.0983 sharply increases on day 3 in 80-day-old rats treated with 100 mkd GM andcould be a potential marker of GM-induced renal toxicity. The identifications of many of thedetected ions are still being elucidated. Further studies are needed to confirm the identity ofthe ion with m/z 227.0983 as well as to confirm it as a biomarker of GM toxicity.
Age-Related Differences in Normal Kidney HistopathologyLight microscopic examination revealed significant age differences in normal kidney histologybetween saline-treated controls. Kidneys from 10-day-old pups showed a very thin cortexcompared with the medulla and papilla (Figs. 7A and 7B). The glomerulus was seen as a denselyarranged group of cells, without distinguishable tufts of anastomosing capillaries. Cortical
Espandiari et al. Page 7
Toxicol Sci. Author manuscript; available in PMC 2009 August 20.
NIH
-PA Author Manuscript
NIH
-PA Author Manuscript
NIH
-PA Author Manuscript
epithelial cells located in the proximal convoluted tubules (PCT) appeared low cuboidal inshape and small in size, without recognizable brush borders on the surface (Figs. 7C and 7D).In 25- (Figs. 7E and 7F) and 40-day-old rats (Figs. 7G and 7H), the cortical area was increased;however, the glomerular capillaries and brush borders on the surface of PCT cells were barelydiscernable (Figs. 7G and 7H). At 80 days, the rat kidney appeared fully developed (thickcortex, tufts of anastomosing glomerular capillaries, and PCT cells with surface brush borders)(Figs. 7I and 7J).
Age-Related Differences in GM-Induced Renal AlterationsDosing with 100 mkd GM caused a slight pale discoloration in the kidneys of 40- and 80-day-old rats after 14 days and in 10-day-old rats after 6 days of treatment. Renal lesions inducedby both GM doses in 10-day-old pups consisted mainly of PCT epithelial cell degeneration(cytoplasmic vacuoles) and occasional necrosis (Figs. 8A and 8B). PCT epithelial cell necrosiswas found frequently in 25-day-old rats treated with 100 mkd GM for 14 days (Fig. 8C). PCTepithelial cell necrosis was found to be more severe in 40-day-old rats that were treated withGM for 14 days compared to 6 days treatment (Figs. 8D and 8E). Similarly, 80-day-old animalsdosed for 6 days with 100 mkd GM had more severe PCT epithelial necrosis than those dosedin the same time frame with 50 mkd GM (Figs. 8F and 8G). In general, the most severe lesionsinduced by either dose of GM (massive necrosis and regeneration of PCT epithelial cells,tubular dilatation and casts, glomerular vacuolization, and interstitial lymphocytic infiltration)were seen in the 80-day-old animals treated for 14 days (Figs. 8H-J).
DISCUSSIONADRs in the pediatric population are a major health issue and are associated with increasedmorbidity and/or mortality (Impicciatore et al., 2001). The FDA Guidance for Industry: Non-Clinical Safety Evaluation of Pediatric Drugs (2006) has stressed the importance of developinganimal models for the pediatric population. The guidance cites several reports on thedifferential toxic effects of therapeutic drugs in pediatric patients. For example, acetaminophenis less toxic in children (American Academy of Pediatrics, 2001) while valproic acid,chloramphenicol, and lamotrigine are more toxic in the pediatric population (Dreifuss, 1987;Guberman et al., 1999; Kapusnik-Uner et al., 1996). As mentioned in the guidance, thedevelopmental characteristics of animals are similar to humans; however, it is important toconsider the comparability of the stages of development in animal models to that of the intendedpopulation. With regard to the kidney, the glomerular nephrogenesis in the prenatal human iscomparable with that found in 8- to 14-day-old rats, the level of glomerular filtration and tubularsecretion occurring in 45-to 180-day-old infants is similar with that observed in 15- to 21-day-old rats, and the completion of nephrogenesis of 35-week prenatal human is comparable withthat reported in 4-6 weeks rat (Travis, 1991; Zoetis, 2003).
A significant proportion (20%) of currently prescribed medication for adults can cause kidneyinjury leading to ARF. As many as 2.5% of these cases are caused by giving antibiotics tohospitalized patients (Kleinknecht and Pallot, 1998; Nolan and Anderson, 1998). The incidenceof ARF resulting from administration of drugs in newborns is higher than in adults (Simeoniet al., 1996). Data regarding the incidence of drug-induced nephrotoxicity in prematurenewborns are not available (Fanos and Cataldi, 2002). GM treatment has been reported to causea 20% reduction of the number of nephrons and a delay in maturity of the glomerular barrierin the rat (Beauchamp et al., 1992; Smaoui et al., 1993).
In this study, we demonstrated that rats at different stages of development elicit a differentialsensitivity to GM. It is apparent that the age is an important factor that needs to be consideredin preventing drug-induced nephrotoxicity. For the present study, 10-day-old pups were moresensitive to the toxic effects of GM than other age groups. The 10-day-old rats treated with 50
Espandiari et al. Page 8
Toxicol Sci. Author manuscript; available in PMC 2009 August 20.
NIH
-PA Author Manuscript
NIH
-PA Author Manuscript
NIH
-PA Author Manuscript
or 100 mkd of GM for 6 days developed similar levels of mild tubular cell degeneration. Highlevels of BUN, Cr, and increased expression of Havcr1 were detectable in samples from thegroups of pups given 100 mkd GM. Further, treatment with either dose of GM for 10-11 dayswas lethal to all pups. The thinness of the cortex, the undeveloped glomerular capillaries, andthe limited brush borders of tubular epithelial cells could affect the renal distribution andultimately the toxicity of GM. The nephrotoxic effects of GM are thought to be due to selectiveaccumulation of drug in the PCT epithelial cells (an increased binding affinity on the luminalsurface and increased membrane permeability) (Kiyomiya et al., 2000). It was not determined,in the present study, whether there was significant accumulation of GM in the PCT epithelialcells after 6 days of treatment in the pups.
In 25-day-old rats given GM for 6 days, no significant changes were observed in the pathologyof the kidneys at either dose or in levels of the majority of renal injury biomarkers at the highdose. After 14 days treatment, the low dose of GM caused minimal effects on renal pathologybut a significant increase in Havcr1 expression. Only 14 days of treatment with the high doseof GM induced a mild dose-related renal alterations and significant elevations in the levels offour gene expression markers of nephrotoxicity (Havcr1, Tnfrsf12a, Spp1, and Clu) in the 25-day-old rats.
As rats matured (40- and 80-days-old), the histological appearance and function of the kidneybecame more adult like (broad cortex, tufts of anastomosing capillaries in the glomerulus,abundant brush borders on the surface of tubular cells). It is thought that at this age, glomerularfiltration and selective tubular reabsorption of GM was normal. From evidence provided bytraditional and novel biomarkers of renal injury (pathology and gene expression markers at 6and 14 days, serum BUN and Cr at 14 days), 40-day-old rats were more sensitive to GM-induced nephrotoxicity than 25-day-old rats but less sensitive than 80-day-old rats.
To determine whether the sensitivity of various nephrotoxic biomarkers is similar in differentage groups, we evaluated a variety of traditional as well as potential new nephrotoxicbiomarkers. Based on the serum level of BUN and Cr data in this study, nephrotoxicity wasmore severe in 80- and 10-day- old compared to 25- and 40-day-old rats. Detectable changesin the serum levels of BUN and Cr are reported when significant kidney function is lost (Star,1998). Consequently, if these two substances were used as sole biomarkers, some potentialnephrotoxic drugs might not be detected. A more recently identified protein Kim-1 (a type 1transmembrane protein, with an immunoglobulin and mucindomain) is markedly up-regulatedfollowing renal injury in both rats (postischemic) and human (acute tubular necrosis) (Ichimuraet al., 1998; Vaidya et al., 2005). Several studies have demonstrated that Kim-1 may be a moresensitive early detector of drug-induced nephrotoxicity (Vaidya and Bonventre, 2006). In thepresent study, the concentration of Kim-1 in the urine started to increase significantly after 48h only in GM-treated 80-day-old rats. Based on results from Kim-1 (urinary and mRNA), the80-day-old rats were more sensitive to GM compared to 40- and 25-day-old groups. With theapparatus available, we were not able to collect urine samples for 10-day-old rats. Although itcould not be directly assessed in this study, Kim-1 could be a useful biomarker for drug-inducednephrotoxicity in the youngest animals because we observed a large induction in Havcr1 geneexpression in response to GM-induced injury in 10-day-old rats and a good correlation betweenthe induction of Havcr1 mRNA in the kidney and increased levels of Kim-1 in urine afternephrotoxicant treatment in other studies.
PCA analysis of the NMR and UPLC/MS metabonomics data from different ages, time points,and GM doses indicated a distinctly separate and unique pattern for each of the different agegroups. These patterns in the 3D PCA plots represent urinary metabolic changes due to aging,GM efficacy, and early biomarkers of GM renal toxicity. Urine levels of glucose and 6-hydroxymelatonin correlated with GM toxicity and levels of hippurate correlated with the
Espandiari et al. Page 9
Toxicol Sci. Author manuscript; available in PMC 2009 August 20.
NIH
-PA Author Manuscript
NIH
-PA Author Manuscript
NIH
-PA Author Manuscript
known antibiotic action of GM. Many more metabolites detected by NMR and UPLC/MScorrelated with age, efficacy, and toxicity, and further analysis of the NMR and UPLC/MSmarkers will be published separately. The metabonomics study was able to detect GM toxicitymuch earlier than traditional clinical chemistry end-points. As such, metabonomics was onlyapplied to analyze urine samples from the first 3 days of the 6-day study where there was lesstoxicity than observed in the 14-day study. In this study, the urinary metabonomic bioindicatorsare all early markers that appear between days 1 and 3. The genomic markers were measuredat later time points (days 6 and 14), so a direct comparison of relative sensitivity between -omic markers could not be made. As mentioned in the results section, the identity of 6-hydroxymelatonin in urine indicated that GM-induced antioxidants appear as early as 3 daysafter initiating GM treatment. 6-Hydroxymelatonin is an oxidized product of melatonin, whichis a powerful antioxidant (Ma et al., 2006). Melatonin has been demonstrated to be a directscavenger of nitric oxide, which has been implicated in the tissue damage observed followingischemic and toxin-induced ARF. There is also some evidence that melatonin increases tissuearginase activity, which by consequence inhibits nitric oxide syntheses activity (Aydogdu etal., 2006). Melatonin supplementation has been shown to protect the kidney from GM andmercuric chloride-induced renal toxicities (Sener et al., 2002). Therefore, the increased levelsof the melatonin metabolite, 6-hydroxymelatonin may represent the body’s first defense againsttissue damage caused by a toxic dose of GM. This early toxicity marker may, therefore, permitintervention prior to irreversible renal damage. Glucose and the unknown ion with tR 6.73 minand m/z 227.0983 were also noted as possible early markers of GM-induced toxicity. Glucosehas been previously shown to be a general marker of renal toxicity (Lenz et al., 2004, 2005;Williams et al., 2003). Further studies are required in order to identify and qualify the unknownion m/z 227.0983 as a marker of GM toxicity.
In conclusion, 10- and 80-day-old rats were found to be more susceptible to GM nephrotoxicitythan 25- and 40-day-old rats. It is apparent that a multi-age animal model could be appropriateto more fully characterize the toxicity of potential agents across different stages ofdevelopment. This is of considerable significance since, at present, many drugs that are usedin the pediatric population are not sufficiently evaluated to determine the appropriate dosinglevel for efficacy and safety.
ACKNOWLEDGMENTSAuthors thank Dr Terry Miller for assistance during this project and Dr Ricky Holland for work on evaluating urinarymetabolites by LC/MS that were not reported in this manuscript.
FUNDING
This work was supported in part by Scientist Development Grant 0535492T from the American Heart Association toV.S.V. and NIH grant DK 074099 to J.V.B.
REFERENCESAli BH. Gentamicin nephrotoxicity in humans and animals: Some recent research. Gen. Pharmacol
1995;26(7):1477–1487. [PubMed: 8690234]American Academy of Pediatrics. Committee on Drugs. Acetaminophen toxicity in children. Pedistrics
2001;108(4):1020–1024.Amin RP, Vickers AE, Sistare F, Thompson KL, Roman RJ, Lawton M, Kramer J, Hamadeh HK, Collins
J, Grissom S, et al. Identification of putative gene based markers of renal toxicity. Environ. HealthPerspect 2004;112(4):465–479. [PubMed: 15033597]
Aydogdu N, Erbas H, Atmaca G, Erten O, Kaymak K. Melatonin reduces nitric oxide via increasingarginase in rhabdomyolysis-induced acute renal failure in rats. Ren. Fail 2006;28(5):435–440.[PubMed: 16825094]
Espandiari et al. Page 10
Toxicol Sci. Author manuscript; available in PMC 2009 August 20.
NIH
-PA Author Manuscript
NIH
-PA Author Manuscript
NIH
-PA Author Manuscript

Bates, MD.; Balistreri, WF. Development and function of the liver and biliary system. In: Behrman, RE.;Kliegman, RM.; Jenson, HM., editors. Nelson Textbook of Pediatrics. W.B. Saunders; Philadelphia:2004. p. 1304-1308.
Beauchamp D, Gourde P, Theriault G, Bergeron MG. Age-dependent gentamicin experimentalnephrotoxicity. J. Pharmacol. Exp. Ther 1992;260(2):444–449. [PubMed: 1738093]
Cresteil T, Beaune P, Kremers P, Celier C, Guengerich FP, Leroux JP. Immunoquantification of epoxidehydrolase and cytochrome P-450 isozymes in fetal and adult human liver microsomes. Eur. J. Biochem1985;151(2):345–350. [PubMed: 2411555]
Davis JW, Kramer JA. Genomic-based biomarkers of drug-induced nephrotoxicity. Expert. Opin. DrugMetab. Toxicol 2006;2(1):95–101. [PubMed: 16863471]
Dreifuss FE. Fatal liver failure in children on valproate. Lancet 1987;3(18523):47–48. [PubMed:2879132]
Fanos V, Cataldi L. Drug misadventuring in neonatal nephrology. Pediatr. Med. Chir 2002;24(2):150–156. [PubMed: 11987523]review
Faustman EM, Silbernagel SM, Fenske RA, Burbacher TM, Ponce RA. Mechanisms underlyingchildren’s susceptibility to environmental toxicants. Environ. Health Perspect 2000;108(1):13–21.[PubMed: 10698720]review
Pharmacology and Toxicology. U.S. Department of Health and Human Services, Food and DrugAdministration (FDA), Center for Drug Evaluation and Research (CDER); 2006. The FDA Guidancefor Industry: Non-clinical Safety Evaluation of Pediatric Drugs Products; p. 1-22.Available at:http://www.fda.gov/cder/guidance/index.htm
Guberman AH, Besag FM, Brodie MJ, Dooley JM, Duchowny MS, Pellock JM, Richens A, Stern RS,Trevathan E. Lamotrigine-associated rash: Risk/benefit considerations in adults and children.Epilepsia 1999;40(7):985–991. [PubMed: 10403224]
Heyman S. Gastric emptying in children Review. J. Nucl. Med 1998;39(5):865–869. [PubMed: 9591590]Ichimura T, Bonventre JV, Bailly V, Wei H, Hession CA, Cate RL, Sanicola M. Kidney injury molecule-1
(KIM-1), a putative epithelial cell adhesion molecule containing a novel immunoglobulin domain,is up-regulated in renal cells after injury. J. Biol. Chem 1998;13(2737):4135–4142. [PubMed:9461608]
Impicciatore P, Choonara I, Clarkson A, Provasi D, Pandolfini C, Bonati M. Incidence of adverse drugreactions in paediatric in/out-patients: A systematic review and meta-analysis of prospective studies.Br. J. Clin. Pharmacol 2001;52(1):77–83. [PubMed: 11453893]
Kapusnik-Uner, JE.; Sande, MA.; Chambers, HF. Antimicrobial agents. In: Hardman, JG.; Limbird, LE.;Molinoff, PB.; Ruddon, RW.; Gilman, AG., editors. Goodman & Gilman’s The PharmacologicalBasis of Therapeutics. Vol. 9th ed.. McGraw-Hill; New York: 1996. p. 1124-1153.
Kiyomiya K, Matsushita N, Matsuo S, Kurebe M. Differential toxic effects of gentamicin on culturedrenal epithelial cells (LLC-PK1) on application to the brush border membrane or the basolateralmembrane. J. Vet. Med. Sci 2000;62(9):971–975. [PubMed: 11039593]
Kleinknecht D, Pallot JL. Epidemiology and prognosis of acute renal insufficiency in 1997. Nephrologie1998;19(2):49–55. [PubMed: 9592773]
Lenz EM, Bright J, Knight R, Westwood FR, Davies D, Major H, Wilson ID. Metabonomics with 1H-NMR spectroscopy and liquid chromatography-mass spectrometry applied to the investigation ofmetabolic changes caused by gentamicin-induced nephrotoxicity in the rat. Biomarkers2005;10:173–187. [PubMed: 16076731]
Lenz EM, Bright J, Knight R, Wilson ID, Major J. A metabonomic investigation of the biochemicaleffects of mercuric chloride in the rat using 1H NMR and HPLC-TOF/MS: Time dependent changesin the urinary profile of endogenous metabolites as a result of nephrotoxicity. Analyst 2004;129:535–541. [PubMed: 15152332]
Ma X, Idle JR, Krausz KW, Tan DX, Ceraulo L, Gonzalez FJ. Urinary metabolites and antioxidantproducts of exogenous melatonin in the mouse. J. Pineal. Res 2006;40(4):343–349. [PubMed:16635022]
Makri A, Goveia M, Balbus J, Parkin R. Children’s susceptibility to chemicals: A review bydevelopmental stage. J. Toxicol. Environ. Health B. Crit. Rev 2004;7(6):417–435. [PubMed:15586877]
Espandiari et al. Page 11
Toxicol Sci. Author manuscript; available in PMC 2009 August 20.
NIH
-PA Author Manuscript
NIH
-PA Author Manuscript
NIH
-PA Author Manuscript

Mingeot-Leclercq MP, Tulkens PM. Aminoglycosides nephrotoxicity. Antimicrob. Agents Chemother1999;43(5):1003–1012. [PubMed: 10223907]
Nagai J, Takano M. Molecular aspects of renal handling of aminoglycosides and strategies for preventingthe nephrotoxicity. Drug Metab. Pharmacokinet 2004;19(3):159–170. [PubMed: 15499183]review
Nolan CR, Anderson RJ. Hospital-acquired acute renal failure. J. Am. Soc. Nephrol 1998;9(4):710–718.[PubMed: 9555674]review
Pirmohamed M, Breckenridge AM, Kitteringham NR, Park BK. Adverse drug reactions: Current status.Br. Med. J 1998;316(7140):1295–1298. [PubMed: 9554902]
Sener G, Sehirli AÖ, Altunbas HZ, Ersoy Y, Paskaloglu K, Arbak S, Ayanoglu-Dugler G. Melatoninprotects against gentamicin-induced nephrotoxicity in rats. J. Pineal. Res 2002;32:231–236.[PubMed: 11982792]
Simeoni, U.; Matis, J.; Messer, J. Clinical implications of renal immaturity in tiny premature infants. In:Cataldi, L.; Fanos, V.; Simeoni, U., editors. Neonatal Nephrotoxicity in Progress, Agora ed. 1996.p. 126
Smaoui H, Mallie JP, Schaeverbeke M, Robert A, Schaeverbeke J. Gentamicin administered duringgestation alters glomerular basement membrane development. Antimicrob. Agents. Chemother1993;37(7):1510–1517. [PubMed: 8363384]
Star RA. Treatment of acute renal failure. Kidney Int 1998;54(6):1817–1831. [PubMed: 9853246]reviewStephenson T. How children’s responses to drugs differ from adults. Br. J. Clin. Pharmacol 2005;59(6):
670–673. [PubMed: 15948930]reviewThompson KL, Afshari CA, Amin RP, Bertram TA, Car B, Cunningham M, Kind C, Kramer JA, Lawton
M, Mirsky M, et al. Identification of platform-independent gene expression markers of cisplatinnephrotoxicity. Environ. Health Perspect 2004;112:488–494. [PubMed: 15033599]
Travis, LB. The Kidney and Urinary Tract Morphogenic Development and Anatomy, Rudolph’sPediatrics. Vol. 19th ed.. Vol. 25. 1991. p. 1223-1236.
Vaidya VS, Bobadilla N, Bonventre JV. A microfluidics based assay to measure kidney injury molecule-1(Kim-1) in the urine as a biomarker for early diagnosis of acute kidney injury. J. Am. Soc. Nephrol2005;16:192A.
Vaidya VS, Bonventre JV. Mechanistic biomarkers for cytotoxic acute kidney injury. Expert. Opin. DrugMetab. Toxicol 2006;2:697–713. [PubMed: 17014390]
Vaidya VS, Ramirez V, Ichimura T, Bobadilla NA, Bonventre JV. Urinary kidney injury molecule-1(Kim-1): A sensitive quantitative biomarker for early detection of kidney tubular injury. Am. J.Physiol. Renal. Physiol 2006;290(2):F517–F529. [PubMed: 16174863]
Wiland P, Szechcinski J. Proximal tubule damage in patients treated with gentamicin or amikacin. Pol.J. Pharmacol 2003;55(4):631–637. [PubMed: 14581723]
Williams RE, Jacobsen M, Lock EA. 1H NMR pattern recognition and 31P NMR studies with D-serinein rat urine and kidney, time and dose-related metabolic effects. Chem. Res. Toxicol 2003;16:1207–1216. [PubMed: 14565762]
Zoetis T. Species comparison of anatomical and functional renal development. Birth Defects Res. B2003;68:111–120.
Espandiari et al. Page 12
Toxicol Sci. Author manuscript; available in PMC 2009 August 20.
NIH
-PA Author Manuscript
NIH
-PA Author Manuscript
NIH
-PA Author Manuscript

FIG. 1.Changes in BUN levels following treatment with 50 or 100 mg kg-1 day-1 GM in 10- (for 6days of treatment), 25-, 40-, or 80-day-old (for 6 and 14 days of treatment) Sprague-Dawleyrats. *Significantly higher than control group (p < 0.05).
Espandiari et al. Page 13
Toxicol Sci. Author manuscript; available in PMC 2009 August 20.
NIH
-PA Author Manuscript
NIH
-PA Author Manuscript
NIH
-PA Author Manuscript
FIG. 2.Changes in serum Cr levels following treatment with 50 or 100 mg kg-1 day-1 GM in 10- (for6 days of treatment), 25-, 40-, or 80-day-old (for 6 and 14 days of treatment) Sprague-Dawleyrats. *Significantly higher than control group (p < 0.05).
Espandiari et al. Page 14
Toxicol Sci. Author manuscript; available in PMC 2009 August 20.
NIH
-PA Author Manuscript
NIH
-PA Author Manuscript
NIH
-PA Author Manuscript
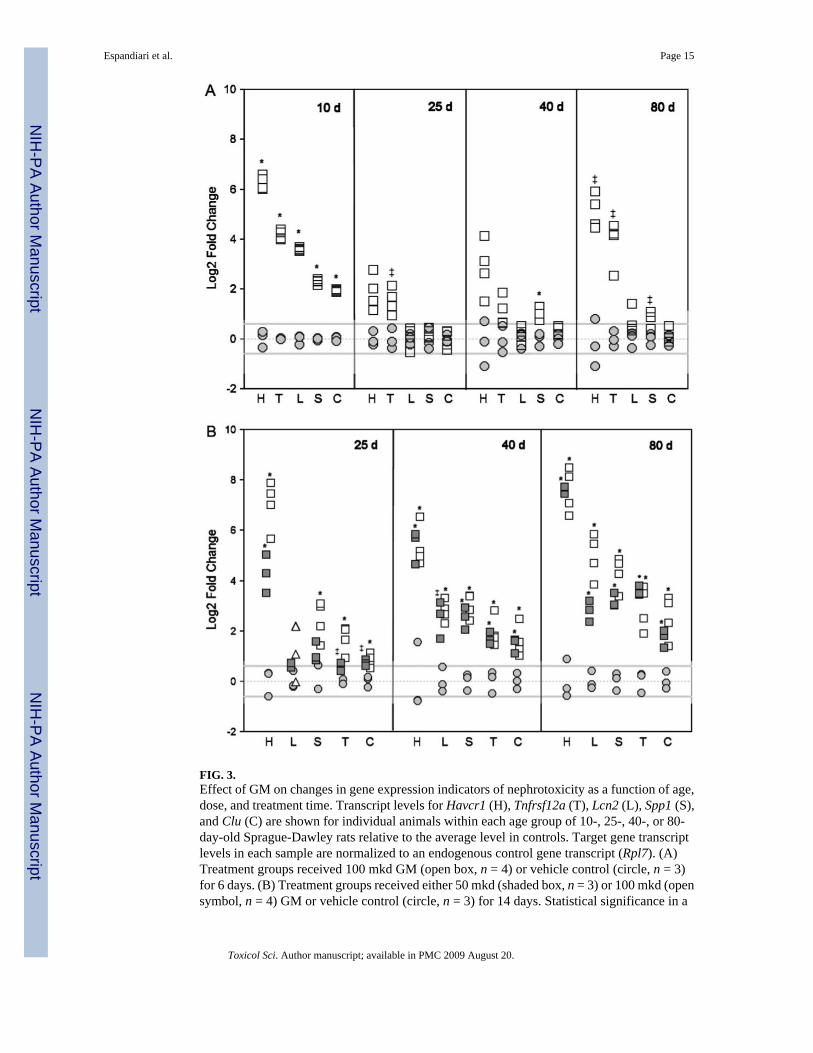
FIG. 3.Effect of GM on changes in gene expression indicators of nephrotoxicity as a function of age,dose, and treatment time. Transcript levels for Havcr1 (H), Tnfrsf12a (T), Lcn2 (L), Spp1 (S),and Clu (C) are shown for individual animals within each age group of 10-, 25-, 40-, or 80-day-old Sprague-Dawley rats relative to the average level in controls. Target gene transcriptlevels in each sample are normalized to an endogenous control gene transcript (Rpl7). (A)Treatment groups received 100 mkd GM (open box, n = 4) or vehicle control (circle, n = 3)for 6 days. (B) Treatment groups received either 50 mkd (shaded box, n = 3) or 100 mkd (opensymbol, n = 4) GM or vehicle control (circle, n = 3) for 14 days. Statistical significance in a
Espandiari et al. Page 15
Toxicol Sci. Author manuscript; available in PMC 2009 August 20.
NIH
-PA Author Manuscript
NIH
-PA Author Manuscript
NIH
-PA Author Manuscript

Student’s t-test comparison of age- and time-matched treated and control values is indicated(*p < 0.01; ‡p < 0.05). Solid gray lines demarcate 1.5-fold change levels.
Espandiari et al. Page 16
Toxicol Sci. Author manuscript; available in PMC 2009 August 20.
NIH
-PA Author Manuscript
NIH
-PA Author Manuscript
NIH
-PA Author Manuscript

FIG. 4.The scores plot for 3D PCA based on covariances of the NMR data from 25-, 40-, and 80-day-old Sprague-Dawley rats at all time points and doses (A). The scores plot for 3D PCA basedon covariances of the UPLC/MS negative data from 25-, 40-, and 80-day-old Sprague-Dawleyrats at all time points (B).
Espandiari et al. Page 17
Toxicol Sci. Author manuscript; available in PMC 2009 August 20.
NIH
-PA Author Manuscript
NIH
-PA Author Manuscript
NIH
-PA Author Manuscript

FIG. 5.Effects of treatment with 50 and 100 mg kg-1 day-1 GM on urinary hippurate (A) and urinaryglucose (B) determined by NMR in 25-, 40-, and 80-day-old (after 72 h of treatment) Sprague-Dawley rats.
Espandiari et al. Page 18
Toxicol Sci. Author manuscript; available in PMC 2009 August 20.
NIH
-PA Author Manuscript
NIH
-PA Author Manuscript
NIH
-PA Author Manuscript

FIG. 6.(A). Negative mode UPLC/MS trends plot for 6-hydroxymelatonin in individual 25-, 40-, and80-day-old Sprague-Dawley rats dosed with 100 mg kg-1 day-1 GM (A). Positive mode UPLC/MS trends plot of unknown ion with tR 6.73 min and m/z 227.0983 in individual 25-, 40-, and80-day old rats dosed with 100 mg kg-1 day-1 GM (B). Percent on y-axis represents the ion’srelative intensity.
Espandiari et al. Page 19
Toxicol Sci. Author manuscript; available in PMC 2009 August 20.
NIH
-PA Author Manuscript
NIH
-PA Author Manuscript
NIH
-PA Author Manuscript

FIG. 7.Micrographs showing age-related changes of the kidney in saline-treated rats. Hematoxylinand eosin (H&E) stain × 50 for A, C, E, G, I, and × 100 for B, D, F, H, and J. Ten-day-oldfemale rats (A and B) and 10-day-old male rats (C and D) have thin cortex and undevelopedglomerulus and tubules. Twenty-five-day-old male rats (E and F) and 40-day-old rats (G andH) show an increase in width of the cortex enlargement of the glomerulus and barely recognizedbrush borders on the surface of the PCT. Eighty-day-old male rats (I and J) show mature cortexof normal width, developed tufts of glomerular capillaries, and brush borders.
Espandiari et al. Page 20
Toxicol Sci. Author manuscript; available in PMC 2009 August 20.
NIH
-PA Author Manuscript
NIH
-PA Author Manuscript
NIH
-PA Author Manuscript
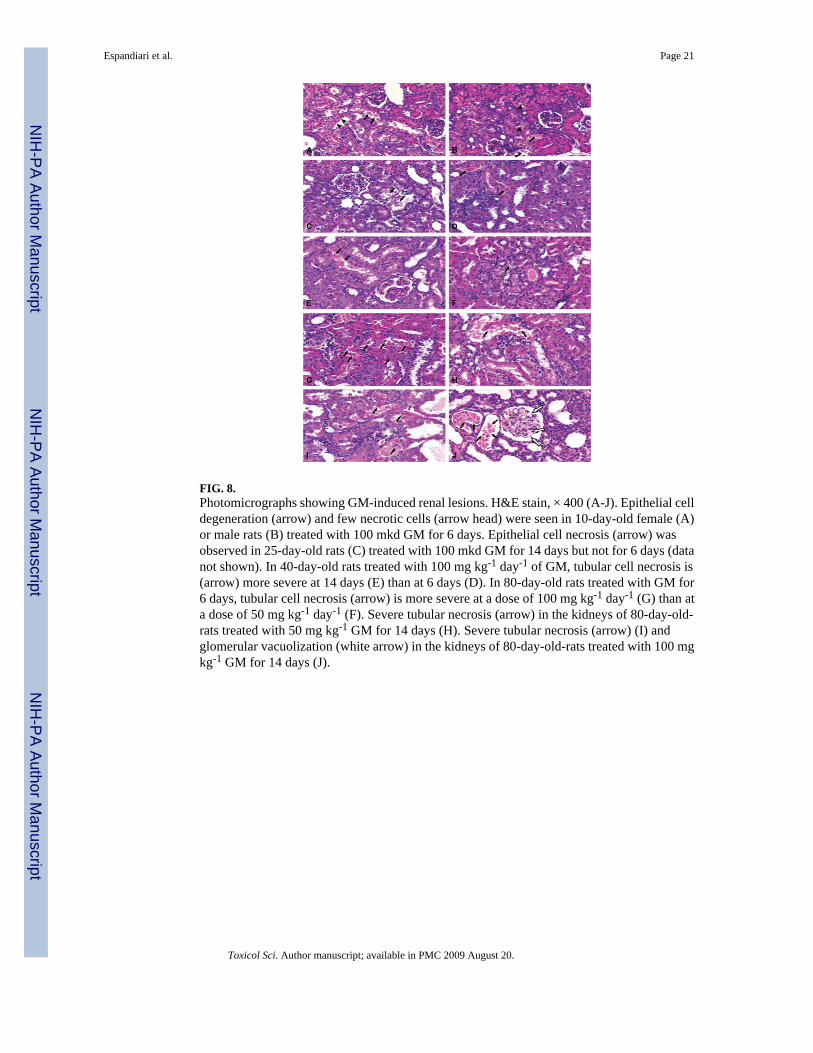
FIG. 8.Photomicrographs showing GM-induced renal lesions. H&E stain, × 400 (A-J). Epithelial celldegeneration (arrow) and few necrotic cells (arrow head) were seen in 10-day-old female (A)or male rats (B) treated with 100 mkd GM for 6 days. Epithelial cell necrosis (arrow) wasobserved in 25-day-old rats (C) treated with 100 mkd GM for 14 days but not for 6 days (datanot shown). In 40-day-old rats treated with 100 mg kg-1 day-1 of GM, tubular cell necrosis is(arrow) more severe at 14 days (E) than at 6 days (D). In 80-day-old rats treated with GM for6 days, tubular cell necrosis (arrow) is more severe at a dose of 100 mg kg-1 day-1 (G) than ata dose of 50 mg kg-1 day-1 (F). Severe tubular necrosis (arrow) in the kidneys of 80-day-old-rats treated with 50 mg kg-1 GM for 14 days (H). Severe tubular necrosis (arrow) (I) andglomerular vacuolization (white arrow) in the kidneys of 80-day-old-rats treated with 100 mgkg-1 GM for 14 days (J).
Espandiari et al. Page 21
Toxicol Sci. Author manuscript; available in PMC 2009 August 20.
NIH
-PA Author Manuscript
NIH
-PA Author Manuscript
NIH
-PA Author Manuscript

NIH
-PA Author Manuscript
NIH
-PA Author Manuscript
NIH
-PA Author Manuscript
Espandiari et al. Page 22TA
BLE
1Si
gnifi
cant
Cha
nges
in B
ody,
Kid
ney,
and
Liv
er W
eigh
ts in
Rat
s of D
iffer
ent A
ges f
ollo
win
g T
reat
men
t with
GM
Day
s old
GM
dos
e/du
ratio
nFi
nal b
ody
wei
ght/i
nitia
l bod
yw
eigh
t % c
ontr
ol (g
)K
idne
y w
eigh
t/Fin
al B
ody
wei
ght
% c
ontr
ol (g
)L
iver
wei
ght/f
inal
bod
y w
eigh
t%
con
trol
(g)
8050
mkd
/6N
SN
S82
± 2
.1*
100
mkd
/14
83 ±
6.5
*17
0 ±
34*
NS
4050
mkd
/6N
SN
S91
± 3
.0*
50 m
kd/1
4N
SN
S87
± 6
.5*
100
mkd
/14
NS
128
± 4.
8*81
± 2
.5*
1010
0 m
kd/6
NS
187
± 15
*N
S
The
resu
lts a
re m
ean
± SE
, n =
4 fo
r 25-
, 40-
, and
80-
day-
old
rats
. N =
12-
15 fo
r 10-
day-
old
pups
. NS
1/4
not s
igni
fican
t.
* Sign
ifica
ntly
diff
eren
t fro
m c
ontro
l ( p
< 0
.05)
. Bod
y, k
idne
y, a
nd li
ver w
eigh
ts fr
om 2
5-da
y-ol
d ra
ts w
ere
not s
igni
fican
tly a
ffec
ted
by G
M tr
eatm
ent.
Toxicol Sci. Author manuscript; available in PMC 2009 August 20.