The Tweet and the City: Comparing Twitter Activities in Informational World Cities
18
101 3. DGI-Konferenz 2014 The Tweet and the City: Comparing Twitter Activities in Informational World Cities Thorsten Förster, Lennart Lamerz, Agnes Mainka & Isabella Peters This paper informetrically monitors Twitter activities that are related to 31 Informational World Cities. It is a big data analysis of 18 million tweets that have been downloaded via Twitter’s Search API (content-based approach) and Twitter’s Streaming API (location-based approach). The Tweets have been filtered either by search terms (i. e. the city’s name) or geo-locations (coor- dinates of a city). The analysis was made by mainly using quantitative statistic methods endorsed by several qualitative investigations. It shows that tweet activity related to Informational World Cities varies from city to city. A city’s area or its size of population does not necessarily affect these activities. Factors like the penetration rate of smart phones, number of tourists etc. influences the amount of tweets that are produced in or about a city. Topics are mostly event-driven or related to sports and politics. City names are popular in spam tweets and they are often chained to draw the attention to messages which are not city-related at all (e. g., religious comments). The paper presents an approach for quantitatively analysing tweeting behaviour in Information World Cities to prospectively find distinct indicators of how Twitter activities in Informational World Cities can be classified and how they vary between the different cities. Introduction Social media has become a communication tool which is used by millions of people in their everyday live. From the beginning of the internet until today there has been a huge shift in using mass media. People, who traditionally consume mass media products like newspapers, radio, TV or even the internet, now are prosumers (Toffler, 1980), who consume and produce content for the masses (Ritzer and Jurgenson 2010). According to Bruns (2008) we are not talking about users who “use” and producers who “produce” anymore but rather about produsage. This is manifested in social media tools, like the microblogging platform Twitter, where it is not possible to separate users and producers anymore as almost every active user produces content, e. g. when commenting and retweeting other users’ tweets (Java et al., 2007). As Informational World Cities are hubs in a global network (Castells, 1989; 1994) it could be assumed that their citizens, companies and others (e. g. tourists) who are located in one of those cities produce a high amount of social media content. Furthermore, people from other places can mention those cities and “talk” about city-focused topics. Therefore we analyse the tweets which mention a city and/or are produced in an Informational World City in terms of quantity, discussed topics, and relation to city-specific properties like size or population. City-related research has already been carried out for different World Cities which visualised tweet creation times and investigated user behaviour (Rios and Lin, 2013), compared the spread of topics on Twitter with that in traditional media (Zhao et al., 2011) or analysed Twitter streams for crisis communication in the 2011 South East Queensland floods (Bruns et al., 2012). The latter work showed that Twitter quickly links people and improves communication among them resulting in a strong connectedness of users. Accordingly, Twitter forms a network which is on the one hand developed in urban
-
Upload
uni-duesseldorf -
Category
Documents
-
view
0 -
download
0
Transcript of The Tweet and the City: Comparing Twitter Activities in Informational World Cities
101 3. DGI-Konferenz 2014
The Tweet and the City: Comparing Twitter Activities in Informational World Cities
Thorsten Förster, Lennart Lamerz, Agnes Mainka & Isabella Peters
This paper informetrically monitors Twitter activities that are related to 31 Informational World Cities. It is a big data analysis of 18 million tweets that have been downloaded via Twitter’s Search API (content-based approach) and Twitter’s Streaming API (location-based approach). The Tweets have been filtered either by search terms (i. e. the city’s name) or geo-locations (coor-dinates of a city). The analysis was made by mainly using quantitative statistic methods endorsed by several qualitative investigations. It shows that tweet activity related to Informational World Cities varies from city to city. A city’s area or its size of population does not necessarily affect these activities. Factors like the penetration rate of smart phones, number of tourists etc. influences the amount of tweets that are produced in or about a city. Topics are mostly event-driven or related to sports and politics. City names are popular in spam tweets and they are often chained to draw the attention to messages which are not city-related at all (e. g., religious comments). The paper presents an approach for quantitatively analysing tweeting behaviour in Information World Cities to prospectively find distinct indicators of how Twitter activities in Informational World Cities can be classified and how they vary between the different cities.
Introduction
Social media has become a communication tool which is used by millions of people in their everyday live. From the beginning of the internet until today there has been a huge shift in using mass media. People, who traditionally consume mass media products like newspapers, radio, TV or even the internet, now are prosumers (Toffler, 1980), who consume and produce content for the masses (Ritzer and Jurgenson 2010). According to Bruns (2008) we are not talking about users who “use” and producers who “produce” anymore but rather about produsage. This is manifested in social media tools, like the microblogging platform Twitter, where it is not possible to separate users and producers anymore as almost every active user produces content, e. g. when commenting and retweeting other users’ tweets (Java et al., 2007). As Informational World Cities are hubs in a global network (Castells, 1989; 1994) it could be assumed that their citizens, companies and others (e. g. tourists) who are located in one of those cities produce a high amount of social media content. Furthermore, people from other places can mention those cities and “talk” about city-focused topics. Therefore we analyse the tweets which mention a city and/or are produced in an Informational World City in terms of quantity, discussed topics, and relation to city-specific properties like size or population. City-related research has already been carried out for different World Cities which visualised tweet creation times and investigated user behaviour (Rios and Lin, 2013), compared the spread of topics on Twitter with that in traditional media (Zhao et al., 2011) or analysed Twitter streams for crisis communication in the 2011 South East Queensland floods (Bruns et al., 2012). The latter work showed that Twitter quickly links people and improves communication among them resulting in a strong connectedness of users. Accordingly, Twitter forms a network which is on the one hand developed in urban
Thorsten Förster, Lennart Lamerz, Agnes Mainka & Isabella Peters
102 3. DGI-Konferenz 2014
spaces and on the other hand expanded in digital spaces by social communities (Hartley et al., 2012) both driven by a shared topic.
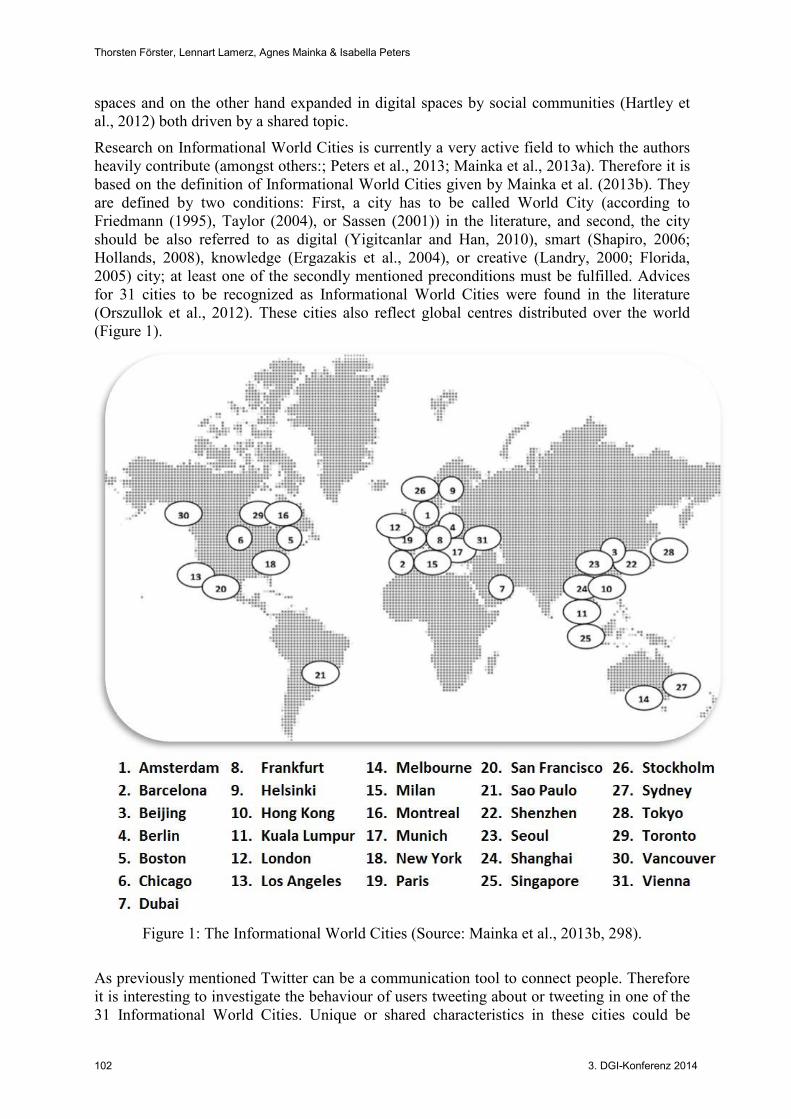
Research on Informational World Cities is currently a very active field to which the authors heavily contribute (amongst others:; Peters et al., 2013; Mainka et al., 2013a). Therefore it is based on the definition of Informational World Cities given by Mainka et al. (2013b). They are defined by two conditions: First, a city has to be called World City (according to Friedmann (1995), Taylor (2004), or Sassen (2001)) in the literature, and second, the city should be also referred to as digital (Yigitcanlar and Han, 2010), smart (Shapiro, 2006; Hollands, 2008), knowledge (Ergazakis et al., 2004), or creative (Landry, 2000; Florida, 2005) city; at least one of the secondly mentioned preconditions must be fulfilled. Advices for 31 cities to be recognized as Informational World Cities were found in the literature (Orszullok et al., 2012). These cities also reflect global centres distributed over the world (Figure 1).
Figure 1: The Informational World Cities (Source: Mainka et al., 2013b, 298).
As previously mentioned Twitter can be a communication tool to connect people. Therefore it is interesting to investigate the behaviour of users tweeting about or tweeting in one of the 31 Informational World Cities. Unique or shared characteristics in these cities could be
The Tweet and the City: Comparing Twitter Activities in Informational World Cities
3. DGI-Konferenz 2014 103
compared to other cities. Since Twitter allows indexing of tweets with geo-coordinates (i.e. the location from where the user sent the tweet) there are several studies which analyse these geo-tags downloaded via the Twitter API. Takhteyev et al. (2012) examined the impact of geographic distance, national boundaries, language or frequency of air travel and analysed the formation of Twitter ties. However, Weidemann (2013) showed that only 6 percent (about 30 million) of Twitter-users broadcast their GPS-information. Instead of using geo-codes you can also follow a content-based approach to determine the location of users to estimate geographical centres (Cheng et al., 2010). While guided by following research questions we aim at contributing to the ongoing research and examine tweets related to the 31 Informational World Cities:
RQ1 How many tweets mention the city (content-based approach)?
RQ2 How many tweets are sent from within the city (geo-tag approach)?
RQ3 What relation does tweet activity have to population or area?
RQ4 Where do users originally come from when tweeting about or from within a city?
RQ5 Do users only tweet about the city where they are actually located?
RQ6 What are the main topics in tweets related to Informational World Cities?
Methods
To examine the tweet characteristics and the relationship between Twitter-usage and the predicate of being an Informational World City, we extracted tweets from Twitter, which have one or both of the following criteria:
1. One or more city names where mentioned in the tweet, with or without hashtag.
2. A tweet was tagged with geo-information from one of the defined squares representing the cities’ areas.
At least one of these criteria is necessary to establish a valid connection between a tweet and a city. For downloading tweets, we used both the Search API and the Streaming API provided by Twitter. By using the Search API tweets were collected which contained one of the names of the Informational World Cities. In order to retrieve a corpus as exhaustive as possible, all cities were searched in the respective national language and in the nine most spoken languages using the Latin alphabet: Spanish, English, Portuguese, German, French, Italian, Polish, Romania and Dutch (Lewis, 2009). This is advisable since the APIs often have problems with non-Latin alphabets (cf. various discussions in Twitters developer fora). To overcome this Twitter-specific problem, the queries containing non-Latin symbols, like the query for Hong Kong, were divided into two queries:
1. "Hong Kong" OR Hongkong OR #Hongkong
2. Hēunggóng OR #Hēunggóng OR Xiānggǎng OR #Xiānggǎng OR 香港 OR #香港
This method assured that queries containing only Latin symbols were not affected by this problem. For example the query for Vienna has no non-Latin symbols so all search terms could be searched through one query (Wien OR #Wien OR Viena OR #Viena OR Vienna OR #Vienna OR Vienne OR #Vienne OR Wenen OR #Wenen OR Wiedeń OR #Wiedeń).
Thorsten Förster, Lennart Lamerz, Agnes Mainka & Isabella Peters
104 3. DGI-Konferenz 2014
The restriction to Latin alphabet-based languages also allowed us to read and translate languages more easily. Considering that in countries without Latin alphabet-based languages many tweets are in English anyway – according to Semiocast (2011) about 40 percent of all tweets are written in English – the amount of tweets which were not collected although they contain one of the cities names should be within acceptable limits. In addition, some popular abbreviations like #la for Los Angeles and #nyc for New York City were included in queries, if a well-known abbreviation existed. Other city-specific nicknames like #bigapple or attractions like #eiffeltower have not been taken into account yet but might be included in further research.
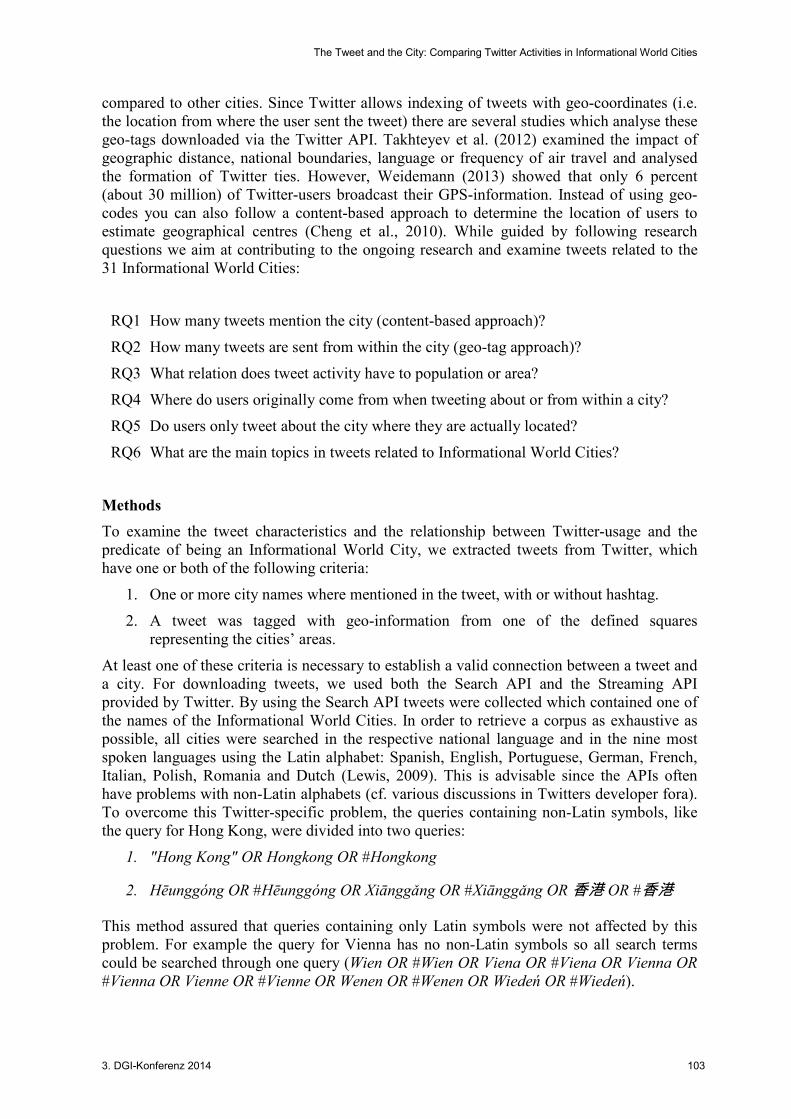
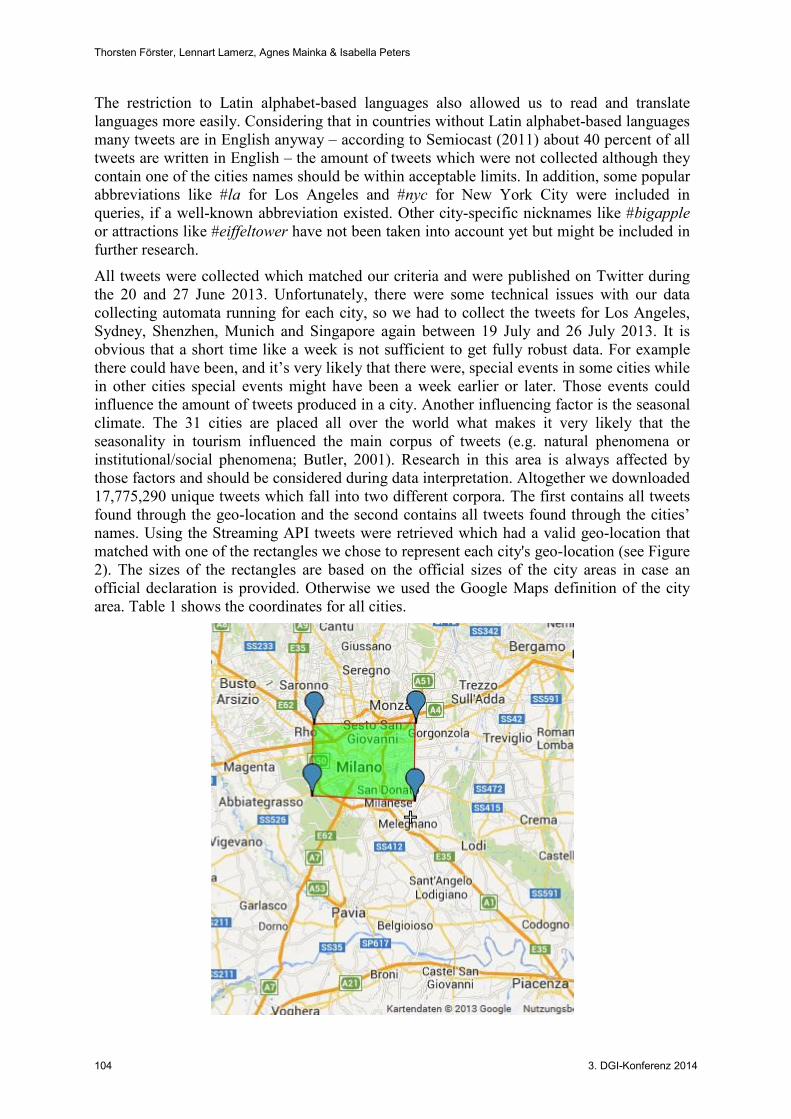
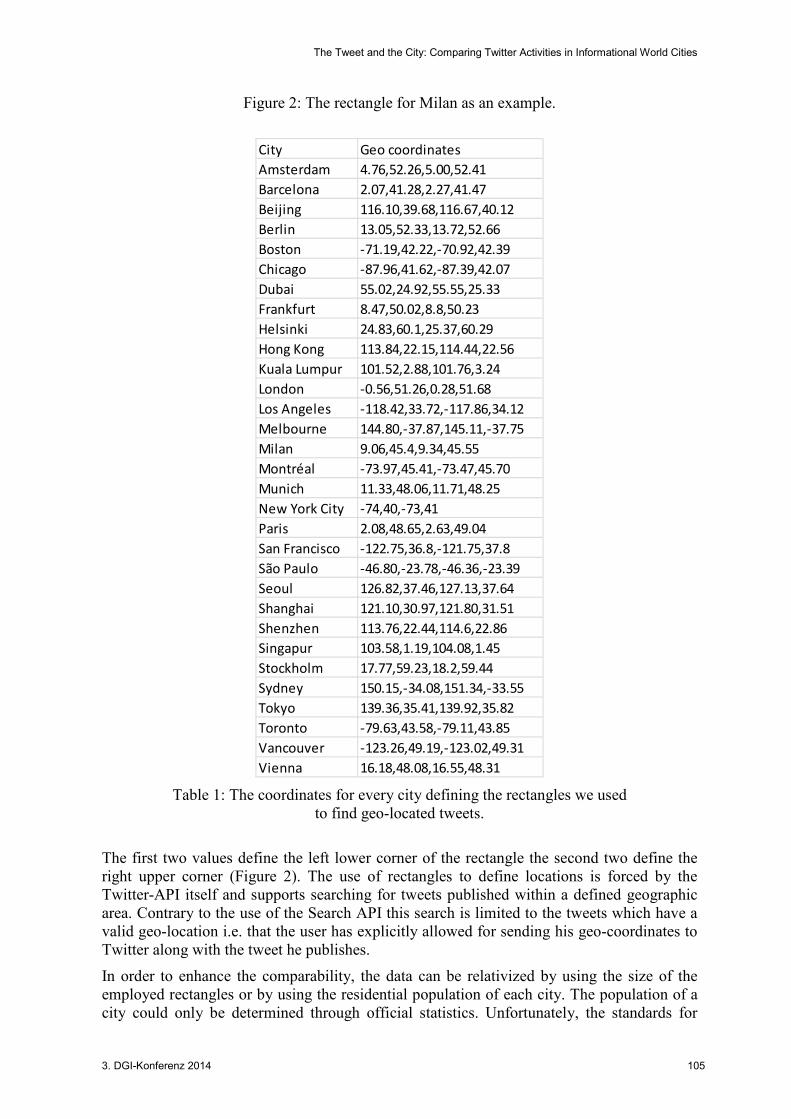
All tweets were collected which matched our criteria and were published on Twitter during the 20 and 27 June 2013. Unfortunately, there were some technical issues with our data collecting automata running for each city, so we had to collect the tweets for Los Angeles, Sydney, Shenzhen, Munich and Singapore again between 19 July and 26 July 2013. It is obvious that a short time like a week is not sufficient to get fully robust data. For example there could have been, and it’s very likely that there were, special events in some cities while in other cities special events might have been a week earlier or later. Those events could influence the amount of tweets produced in a city. Another influencing factor is the seasonal climate. The 31 cities are placed all over the world what makes it very likely that the seasonality in tourism influenced the main corpus of tweets (e.g. natural phenomena or institutional/social phenomena; Butler, 2001). Research in this area is always affected by those factors and should be considered during data interpretation. Altogether we downloaded 17,775,290 unique tweets which fall into two different corpora. The first contains all tweets found through the geo-location and the second contains all tweets found through the cities’ names. Using the Streaming API tweets were retrieved which had a valid geo-location that matched with one of the rectangles we chose to represent each city's geo-location (see Figure 2). The sizes of the rectangles are based on the official sizes of the city areas in case an official declaration is provided. Otherwise we used the Google Maps definition of the city area. Table 1 shows the coordinates for all cities.
The Tweet and the City: Comparing Twitter Activities in Informational World Cities
3. DGI-Konferenz 2014 105
Figure 2: The rectangle for Milan as an example.
City Geo coordinates
Amsterdam 4.76,52.26,5.00,52.41
Barcelona 2.07,41.28,2.27,41.47
Beijing 116.10,39.68,116.67,40.12
Berlin 13.05,52.33,13.72,52.66
Boston -71.19,42.22,-70.92,42.39
Chicago -87.96,41.62,-87.39,42.07
Dubai 55.02,24.92,55.55,25.33
Frankfurt 8.47,50.02,8.8,50.23
Helsinki 24.83,60.1,25.37,60.29
Hong Kong 113.84,22.15,114.44,22.56
Kuala Lumpur 101.52,2.88,101.76,3.24
London -0.56,51.26,0.28,51.68
Los Angeles -118.42,33.72,-117.86,34.12
Melbourne 144.80,-37.87,145.11,-37.75
Milan 9.06,45.4,9.34,45.55
Montréal -73.97,45.41,-73.47,45.70
Munich 11.33,48.06,11.71,48.25
New York City -74,40,-73,41
Paris 2.08,48.65,2.63,49.04
San Francisco -122.75,36.8,-121.75,37.8
São Paulo -46.80,-23.78,-46.36,-23.39
Seoul 126.82,37.46,127.13,37.64
Shanghai 121.10,30.97,121.80,31.51
Shenzhen 113.76,22.44,114.6,22.86
Singapur 103.58,1.19,104.08,1.45
Stockholm 17.77,59.23,18.2,59.44
Sydney 150.15,-34.08,151.34,-33.55
Tokyo 139.36,35.41,139.92,35.82
Toronto -79.63,43.58,-79.11,43.85
Vancouver -123.26,49.19,-123.02,49.31
Vienna 16.18,48.08,16.55,48.31
Table 1: The coordinates for every city defining the rectangles we used to find geo-located tweets.
The first two values define the left lower corner of the rectangle the second two define the right upper corner (Figure 2). The use of rectangles to define locations is forced by the Twitter-API itself and supports searching for tweets published within a defined geographic area. Contrary to the use of the Search API this search is limited to the tweets which have a valid geo-location i.e. that the user has explicitly allowed for sending his geo-coordinates to Twitter along with the tweet he publishes.
In order to enhance the comparability, the data can be relativized by using the size of the employed rectangles or by using the residential population of each city. The population of a city could only be determined through official statistics. Unfortunately, the standards for
Thorsten Förster, Lennart Lamerz, Agnes Mainka & Isabella Peters
106 3. DGI-Konferenz 2014
surveying the statistics differ from country to country and influence the results of our analysis. Eurostat mentions in its Reference Guide for the European Regional and Urban Statistics (2010) that the “'Administrative City' does not always yield comparable spatial units“. Paris for example has an official resident population from only about 2.2 million, while London has an official resident population from over 8 million since Paris counts only the population of the inner core, while London also counts the population of the urban area called Greater London. Similar problems occur with statistics about tourism. However, statistics like residential population and tourism help determining the reasons why the extent of tweeting-activities in Informational World Cities is different.
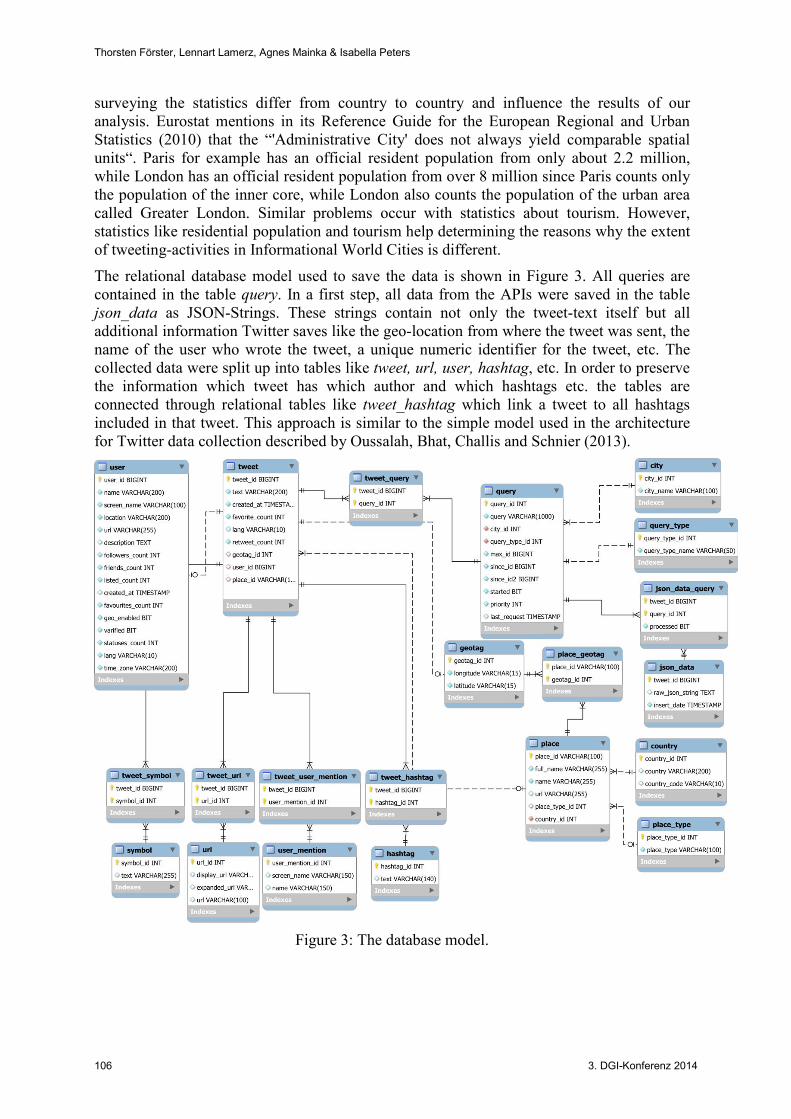
The relational database model used to save the data is shown in Figure 3. All queries are contained in the table query. In a first step, all data from the APIs were saved in the table json_data as JSON-Strings. These strings contain not only the tweet-text itself but all additional information Twitter saves like the geo-location from where the tweet was sent, the name of the user who wrote the tweet, a unique numeric identifier for the tweet, etc. The collected data were split up into tables like tweet, url, user, hashtag, etc. In order to preserve the information which tweet has which author and which hashtags etc. the tables are connected through relational tables like tweet_hashtag which link a tweet to all hashtags included in that tweet. This approach is similar to the simple model used in the architecture for Twitter data collection described by Oussalah, Bhat, Challis and Schnier (2013).
Figure 3: The database model.
The Tweet and the City: Comparing Twitter Activities in Informational World Cities
3. DGI-Konferenz 2014 107
Data description
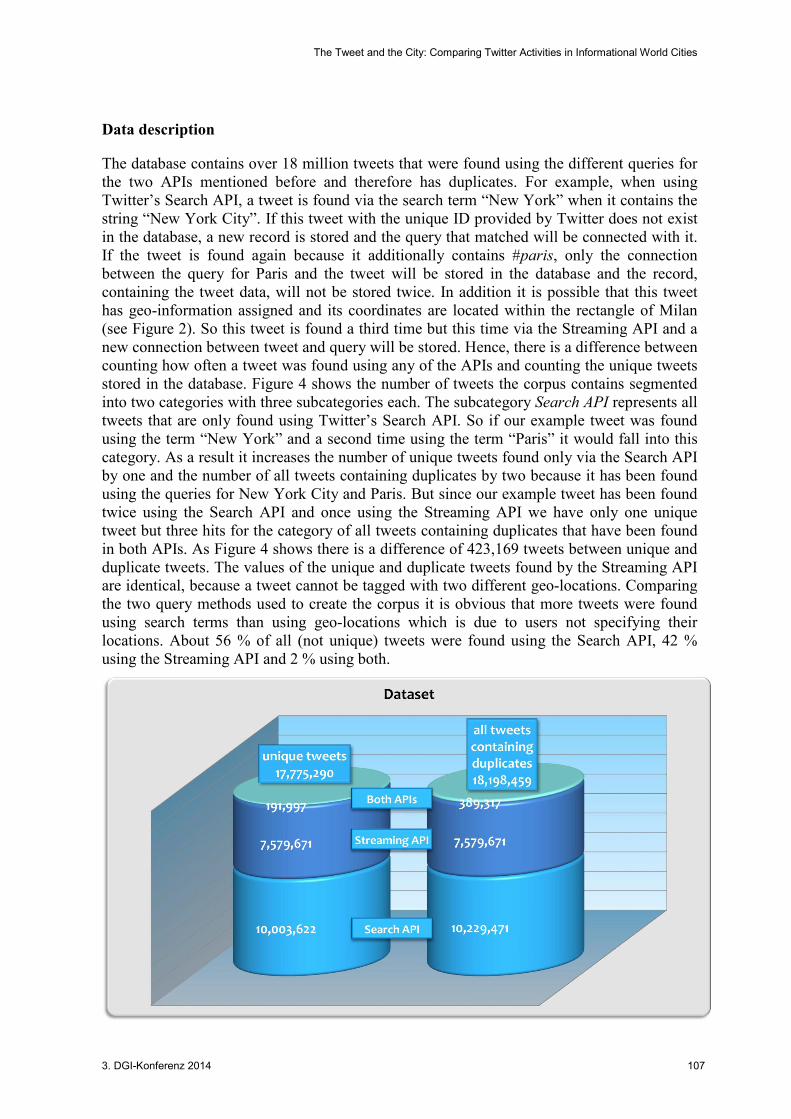
The database contains over 18 million tweets that were found using the different queries for the two APIs mentioned before and therefore has duplicates. For example, when using Twitter’s Search API, a tweet is found via the search term “New York” when it contains the string “New York City”. If this tweet with the unique ID provided by Twitter does not exist in the database, a new record is stored and the query that matched will be connected with it. If the tweet is found again because it additionally contains #paris, only the connection between the query for Paris and the tweet will be stored in the database and the record, containing the tweet data, will not be stored twice. In addition it is possible that this tweet has geo-information assigned and its coordinates are located within the rectangle of Milan (see Figure 2). So this tweet is found a third time but this time via the Streaming API and a new connection between tweet and query will be stored. Hence, there is a difference between counting how often a tweet was found using any of the APIs and counting the unique tweets stored in the database. Figure 4 shows the number of tweets the corpus contains segmented into two categories with three subcategories each. The subcategory Search API represents all tweets that are only found using Twitter’s Search API. So if our example tweet was found using the term “New York” and a second time using the term “Paris” it would fall into this category. As a result it increases the number of unique tweets found only via the Search API by one and the number of all tweets containing duplicates by two because it has been found using the queries for New York City and Paris. But since our example tweet has been found twice using the Search API and once using the Streaming API we have only one unique tweet but three hits for the category of all tweets containing duplicates that have been found in both APIs. As Figure 4 shows there is a difference of 423,169 tweets between unique and duplicate tweets. The values of the unique and duplicate tweets found by the Streaming API are identical, because a tweet cannot be tagged with two different geo-locations. Comparing the two query methods used to create the corpus it is obvious that more tweets were found using search terms than using geo-locations which is due to users not specifying their locations. About 56 % of all (not unique) tweets were found using the Search API, 42 % using the Streaming API and 2 % using both.
Thorsten Förster, Lennart Lamerz, Agnes Mainka & Isabella Peters
108 3. DGI-Konferenz 2014
Figure 4: The database contains tweets fount via Twitter’s Streaming API and Search API. Results
In this section we visualise and interpret the results of our analysis by dividing it into sub-sections that relate to the research questions we asked in our introduction.
Location of users and tweet content
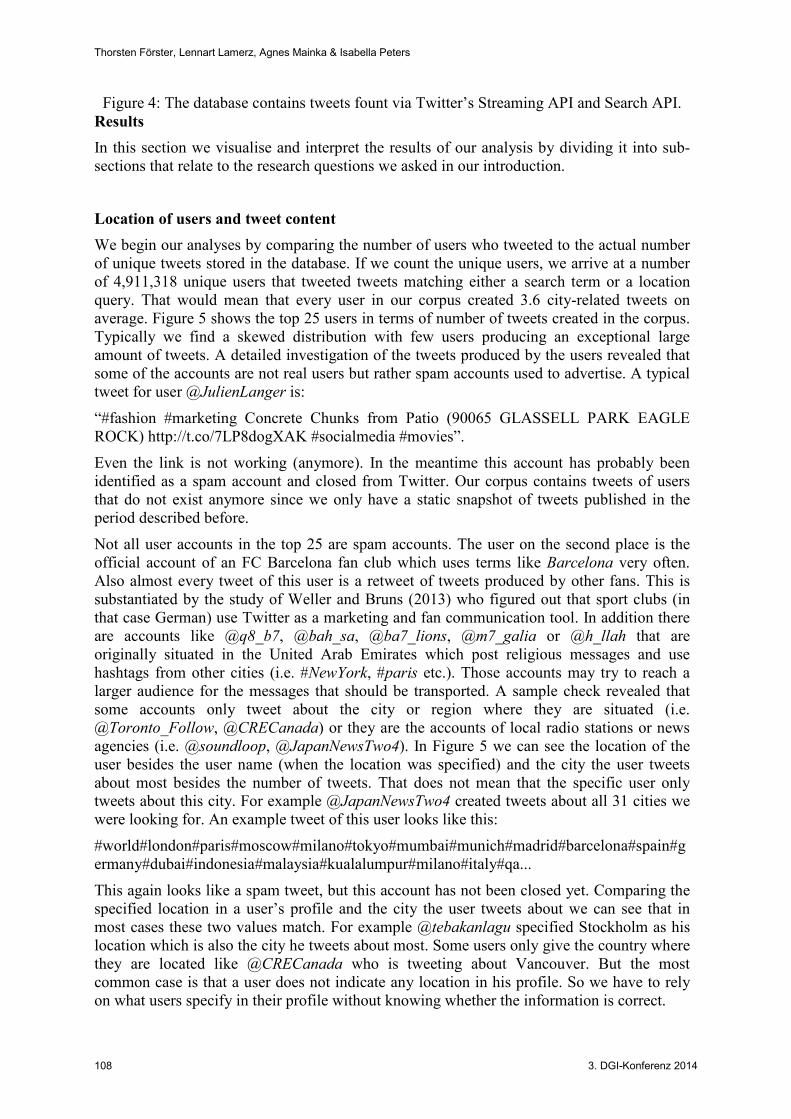
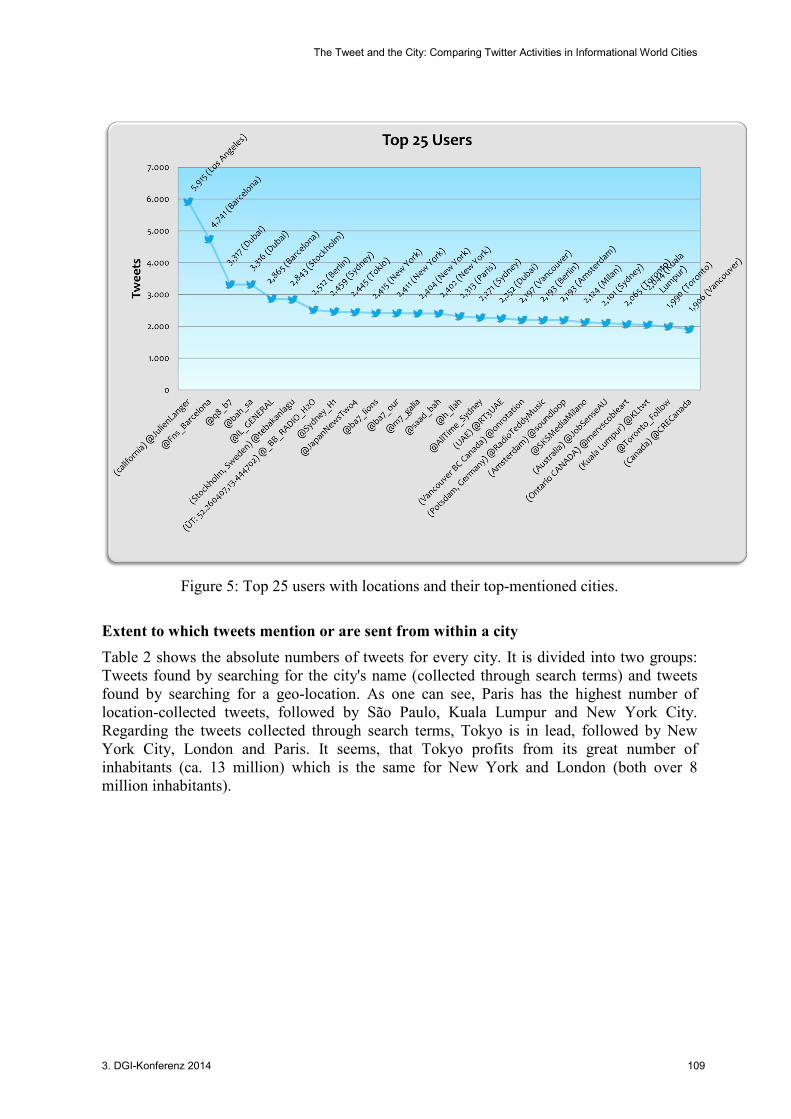
We begin our analyses by comparing the number of users who tweeted to the actual number of unique tweets stored in the database. If we count the unique users, we arrive at a number of 4,911,318 unique users that tweeted tweets matching either a search term or a location query. That would mean that every user in our corpus created 3.6 city-related tweets on average. Figure 5 shows the top 25 users in terms of number of tweets created in the corpus. Typically we find a skewed distribution with few users producing an exceptional large amount of tweets. A detailed investigation of the tweets produced by the users revealed that some of the accounts are not real users but rather spam accounts used to advertise. A typical tweet for user @JulienLanger is:
“#fashion #marketing Concrete Chunks from Patio (90065 GLASSELL PARK EAGLE ROCK) http://t.co/7LP8dogXAK #socialmedia #movies”.
Even the link is not working (anymore). In the meantime this account has probably been identified as a spam account and closed from Twitter. Our corpus contains tweets of users that do not exist anymore since we only have a static snapshot of tweets published in the period described before.
Not all user accounts in the top 25 are spam accounts. The user on the second place is the official account of an FC Barcelona fan club which uses terms like Barcelona very often. Also almost every tweet of this user is a retweet of tweets produced by other fans. This is substantiated by the study of Weller and Bruns (2013) who figured out that sport clubs (in that case German) use Twitter as a marketing and fan communication tool. In addition there are accounts like @q8_b7, @bah_sa, @ba7_lions, @m7_galia or @h_llah that are originally situated in the United Arab Emirates which post religious messages and use hashtags from other cities (i.e. #NewYork, #paris etc.). Those accounts may try to reach a larger audience for the messages that should be transported. A sample check revealed that some accounts only tweet about the city or region where they are situated (i.e. @Toronto_Follow, @CRECanada) or they are the accounts of local radio stations or news agencies (i.e. @soundloop, @JapanNewsTwo4). In Figure 5 we can see the location of the user besides the user name (when the location was specified) and the city the user tweets about most besides the number of tweets. That does not mean that the specific user only tweets about this city. For example @JapanNewsTwo4 created tweets about all 31 cities we were looking for. An example tweet of this user looks like this:
#world#london#paris#moscow#milano#tokyo#mumbai#munich#madrid#barcelona#spain#germany#dubai#indonesia#malaysia#kualalumpur#milano#italy#qa...
This again looks like a spam tweet, but this account has not been closed yet. Comparing the specified location in a user’s profile and the city the user tweets about we can see that in most cases these two values match. For example @tebakanlagu specified Stockholm as his location which is also the city he tweets about most. Some users only give the country where they are located like @CRECanada who is tweeting about Vancouver. But the most common case is that a user does not indicate any location in his profile. So we have to rely on what users specify in their profile without knowing whether the information is correct.
The Tweet and the City: Comparing Twitter Activities in Informational World Cities
3. DGI-Konferenz 2014 109
Figure 5: Top 25 users with locations and their top-mentioned cities.
Extent to which tweets mention or are sent from within a city
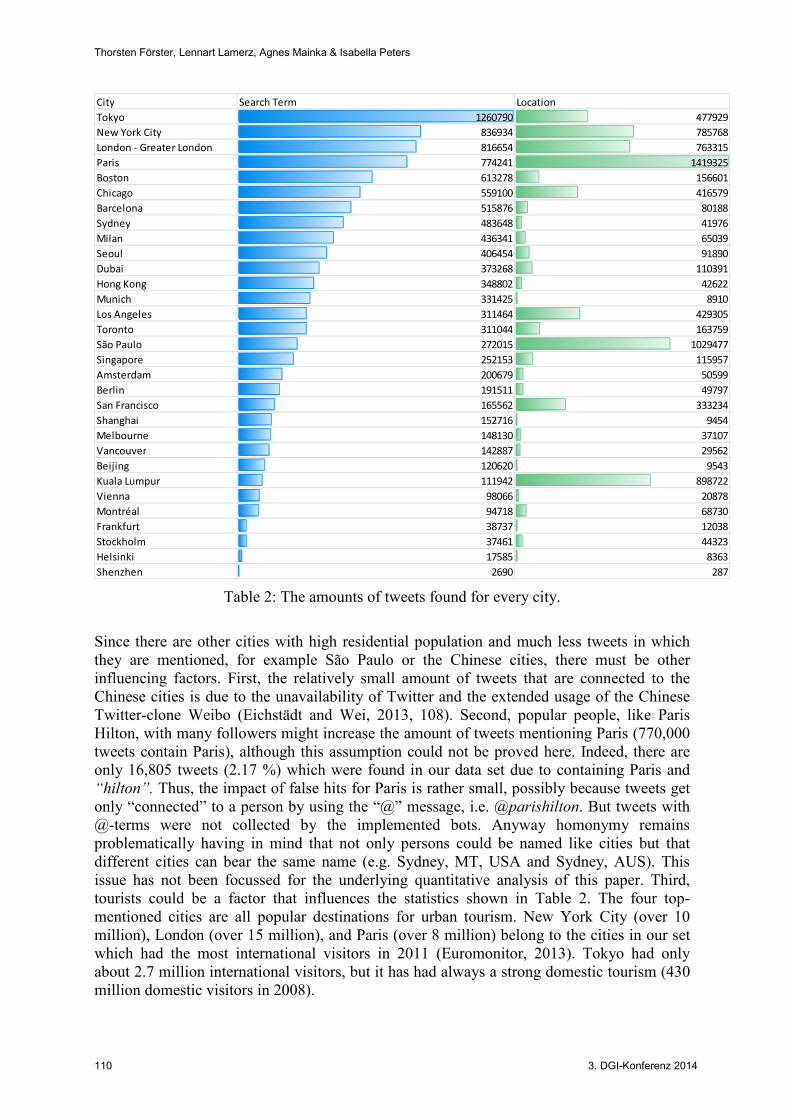
Table 2 shows the absolute numbers of tweets for every city. It is divided into two groups: Tweets found by searching for the city's name (collected through search terms) and tweets found by searching for a geo-location. As one can see, Paris has the highest number of location-collected tweets, followed by São Paulo, Kuala Lumpur and New York City. Regarding the tweets collected through search terms, Tokyo is in lead, followed by New York City, London and Paris. It seems, that Tokyo profits from its great number of inhabitants (ca. 13 million) which is the same for New York and London (both over 8 million inhabitants).
Thorsten Förster, Lennart Lamerz, Agnes Mainka & Isabella Peters
110 3. DGI-Konferenz 2014
City Search Term Location
Tokyo 1260790 477929
New York City 836934 785768
London - Greater London 816654 763315
Paris 774241 1419325
Boston 613278 156601
Chicago 559100 416579
Barcelona 515876 80188
Sydney 483648 41976
Milan 436341 65039
Seoul 406454 91890
Dubai 373268 110391
Hong Kong 348802 42622
Munich 331425 8910
Los Angeles 311464 429305
Toronto 311044 163759
São Paulo 272015 1029477
Singapore 252153 115957
Amsterdam 200679 50599
Berlin 191511 49797
San Francisco 165562 333234
Shanghai 152716 9454
Melbourne 148130 37107
Vancouver 142887 29562
Beijing 120620 9543
Kuala Lumpur 111942 898722
Vienna 98066 20878
Montréal 94718 68730
Frankfurt 38737 12038
Stockholm 37461 44323
Helsinki 17585 8363
Shenzhen 2690 287
Table 2: The amounts of tweets found for every city.
Since there are other cities with high residential population and much less tweets in which they are mentioned, for example São Paulo or the Chinese cities, there must be other influencing factors. First, the relatively small amount of tweets that are connected to the Chinese cities is due to the unavailability of Twitter and the extended usage of the Chinese Twitter-clone Weibo (Eichstädt and Wei, 2013, 108). Second, popular people, like Paris Hilton, with many followers might increase the amount of tweets mentioning Paris (770,000 tweets contain Paris), although this assumption could not be proved here. Indeed, there are only 16,805 tweets (2.17 %) which were found in our data set due to containing Paris and “hilton”. Thus, the impact of false hits for Paris is rather small, possibly because tweets get only “connected” to a person by using the “@” message, i.e. @parishilton. But tweets with @-terms were not collected by the implemented bots. Anyway homonymy remains problematically having in mind that not only persons could be named like cities but that different cities can bear the same name (e.g. Sydney, MT, USA and Sydney, AUS). This issue has not been focussed for the underlying quantitative analysis of this paper. Third, tourists could be a factor that influences the statistics shown in Table 2. The four top-mentioned cities are all popular destinations for urban tourism. New York City (over 10 million), London (over 15 million), and Paris (over 8 million) belong to the cities in our set which had the most international visitors in 2011 (Euromonitor, 2013). Tokyo had only about 2.7 million international visitors, but it has had always a strong domestic tourism (430 million domestic visitors in 2008).
The Tweet and the City: Comparing Twitter Activities in Informational World Cities
3. DGI-Konferenz 2014 111
There are some immense differences between the amounts of tweets collected through searching for geo-locations and collected through search terms. Especially São Paulo and Kuala Lumpur have a very high number of tweets sent from within the city and a rather small amount of tweets containing the city's name. On the contrary, the three German cities, Berlin, Frankfurt and Munich have only few tweets with geo-locations. When trying to explain this phenomenon we can only rely on hypotheses. Possible impact could be based in different levels of awareness of data privacy protection in different countries – e.g. in Germany private data on the internet is a highly sensitive subject which is discussed quite often in the general public (see Unisys (2013) for general privacy concerns in Germany regarding the internet). In fact, the least tweets with a geo-location were sent from Munich. Only 2.61 % of all tweets that are linked with Munich in both corpora are coming from the corpus that contains the tweets with geo-locations. Another influencing factor could be the penetration rate of smartphones in the different countries. Obviously, it rather makes sense to send tweets with geo-locations when the user is moving and uses a mobile device like a smartphone for tweeting and informing followers where he is. According to Rowinski (2013) there are about 70 million smartphone users in Brazil and only 32 million in Germany. However, the rate of smartphone users in France (33 million) is nearly the same as in Germany but the most tweets with geo-locations have been sent from Paris. One could speculate again that tourism has an impact on these statistics. To fully understand these characteristics a deeper subject analysis of the tweets as well as a user survey is needed.
The impacts of events hosted in a city during the period of data collection can be particularly shown by the extensive use of hashtags combined with city names. In the data for Amsterdam #rihanna is the hashtag appearing most often which is most likely because the pop singer Rihanna had a concert on June 23rd in Amsterdam. Another popular hashtag is #ziggo referring to the location the concert took place.
The relation between tweet activity and size of population and area
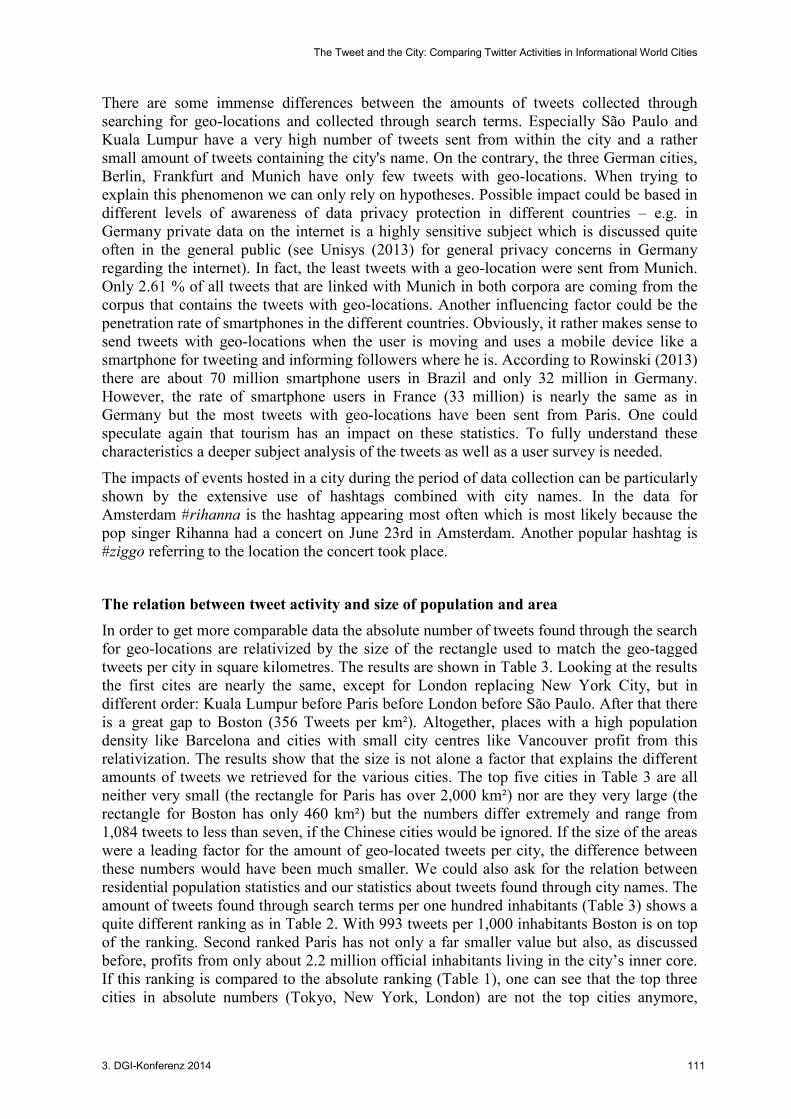
In order to get more comparable data the absolute number of tweets found through the search for geo-locations are relativized by the size of the rectangle used to match the geo-tagged tweets per city in square kilometres. The results are shown in Table 3. Looking at the results the first cites are nearly the same, except for London replacing New York City, but in different order: Kuala Lumpur before Paris before London before São Paulo. After that there is a great gap to Boston (356 Tweets per km²). Altogether, places with a high population density like Barcelona and cities with small city centres like Vancouver profit from this relativization. The results show that the size is not alone a factor that explains the different amounts of tweets we retrieved for the various cities. The top five cities in Table 3 are all neither very small (the rectangle for Paris has over 2,000 km²) nor are they very large (the rectangle for Boston has only 460 km²) but the numbers differ extremely and range from 1,084 tweets to less than seven, if the Chinese cities would be ignored. If the size of the areas were a leading factor for the amount of geo-located tweets per city, the difference between these numbers would have been much smaller. We could also ask for the relation between residential population statistics and our statistics about tweets found through city names. The amount of tweets found through search terms per one hundred inhabitants (Table 3) shows a quite different ranking as in Table 2. With 993 tweets per 1,000 inhabitants Boston is on top of the ranking. Second ranked Paris has not only a far smaller value but also, as discussed before, profits from only about 2.2 million official inhabitants living in the city’s inner core. If this ranking is compared to the absolute ranking (Table 1), one can see that the top three cities in absolute numbers (Tokyo, New York, London) are not the top cities anymore,
Thorsten Förster, Lennart Lamerz, Agnes Mainka & Isabella Peters
112 3. DGI-Konferenz 2014
because of their large population. Other cities with large residential populations, like Seoul or São Paulo, do not to profit since they are less often mentioned in tweets. Vice versa cities with small populations, like Helsinki or Frankfurt, are not automatically high listed in the ranking.
City (Size of the rectangle in km², residential population) Tweets found through geo location per km² Tweets found through search terms per 1000 inhabitants
Kuala Lumpur (864, 1.887.674) 1084 59
Paris (2.145, 2.257.981) 679 343
London - Greater London (1.176, 7.400.000) 677 110
São Paulo (1.716, 11.253.503) 615 24
Boston (459, 617.594) 356 993
Barcelona (380, 1.615.448) 220 319
Tokyo (2.296, 13.189.000) 215 93
Los Angeles (2.240, 3.863.839) 192 104
Chicago (2.565, 2.695.598) 170 207
Seoul (558, 10.442.426) 170 39
Milan (420, 1.367.733) 161 36
Amsterdam (360, 820.500) 147 245
Toronto (1.404, 2.744.000) 120 113
Vancouver (288, 2.313.328) 106 62
Melbourne (372, 4.169.103) 104 319
Singapore (1.300, 3.818.200) 90 101
New York City (10.000, 8.336.697) 81 100
Dubai (2.173, 1.870.000) 53 197
Stockholm (903, 863.100) 51 43
Montréal (1.450, 1.613.260) 49 59
San Francisco (10.000, 825.111) 34 201
Vienna (851, 1.757.353) 25 56
Berlin (2.211, 3.292.400) 23 58
Frankfurt (693, 682.854) 18 54
Hong Kong (2.460, 7.173.900) 18 48
Munich (722, 1.447.614) 14 90
Helsinki (1.026, 603.968) 9 29
Sydney (6.307, 4.605.992) 7 84
Beijing (2.508, 17.400.000) 4 7
Shanghai (3.780, 23.470.000) 3 6
Shenzhen (3.528, 10.470.000) 0 0
Table 1: The amount of tweets denominated through the size of the defined areas respectively the residential population1
The relationship between geo-locations and city mentions
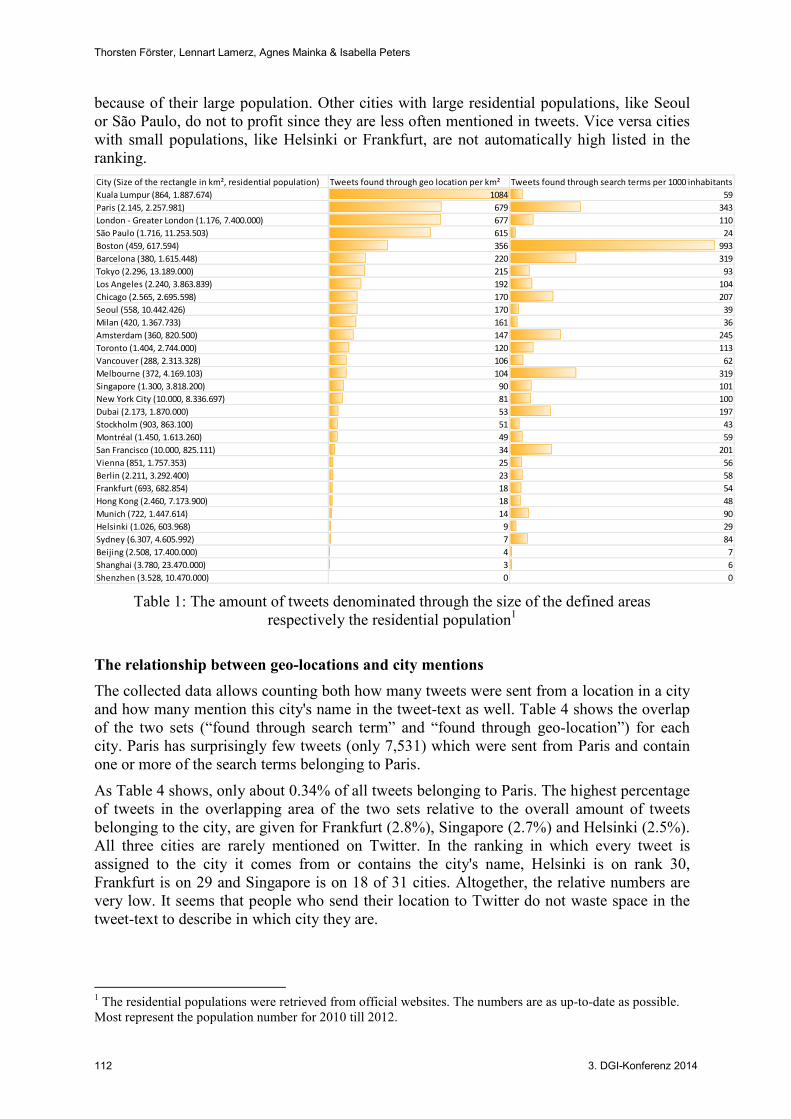
The collected data allows counting both how many tweets were sent from a location in a city and how many mention this city's name in the tweet-text as well. Table 4 shows the overlap of the two sets (“found through search term” and “found through geo-location”) for each city. Paris has surprisingly few tweets (only 7,531) which were sent from Paris and contain one or more of the search terms belonging to Paris.
As Table 4 shows, only about 0.34% of all tweets belonging to Paris. The highest percentage of tweets in the overlapping area of the two sets relative to the overall amount of tweets belonging to the city, are given for Frankfurt (2.8%), Singapore (2.7%) and Helsinki (2.5%). All three cities are rarely mentioned on Twitter. In the ranking in which every tweet is assigned to the city it comes from or contains the city's name, Helsinki is on rank 30, Frankfurt is on 29 and Singapore is on 18 of 31 cities. Altogether, the relative numbers are very low. It seems that people who send their location to Twitter do not waste space in the tweet-text to describe in which city they are.
1 The residential populations were retrieved from official websites. The numbers are as up-to-date as possible. Most represent the population number for 2010 till 2012.
The Tweet and the City: Comparing Twitter Activities in Informational World Cities
3. DGI-Konferenz 2014 113
City Overlap search term and geo location Number of all tweets linked to the city
Tokyo 20412 1733253
São Paulo 15179 1312107
New York City 13370 1629775
Kuala Lumpur 11626 1036942
London - Greater London 11465 1601618
Chicago 10388 984149
Singapore 9767 359492
Dubai 7639 480861
Paris 7531 2223166
Los Angeles 6680 735237
San Francisco 6596 501950
Toronto 6247 472797
Boston 5662 771075
Amsterdam 4680 248763
Barcelona 4539 594960
Berlin 4484 238965
Melbourne 3248 500877
Hong Kong 2848 390324
Seoul 2556 498739
Montréal 2476 162745
Sydney 2443 524421
Vancouver 1921 171364
Milan 1670 185238
Munich 1483 340001
Frankfurt 1403 49898
Shanghai 1221 161260
Vienna 1128 118399
Beijing 953 129631
Stockholm 890 82199
Helsinki 644 25717
Shenzhen 49 4077
Table 4: Number of all tweets per city found through search term and geo-location.
The main topics of tweets represented by hashtags
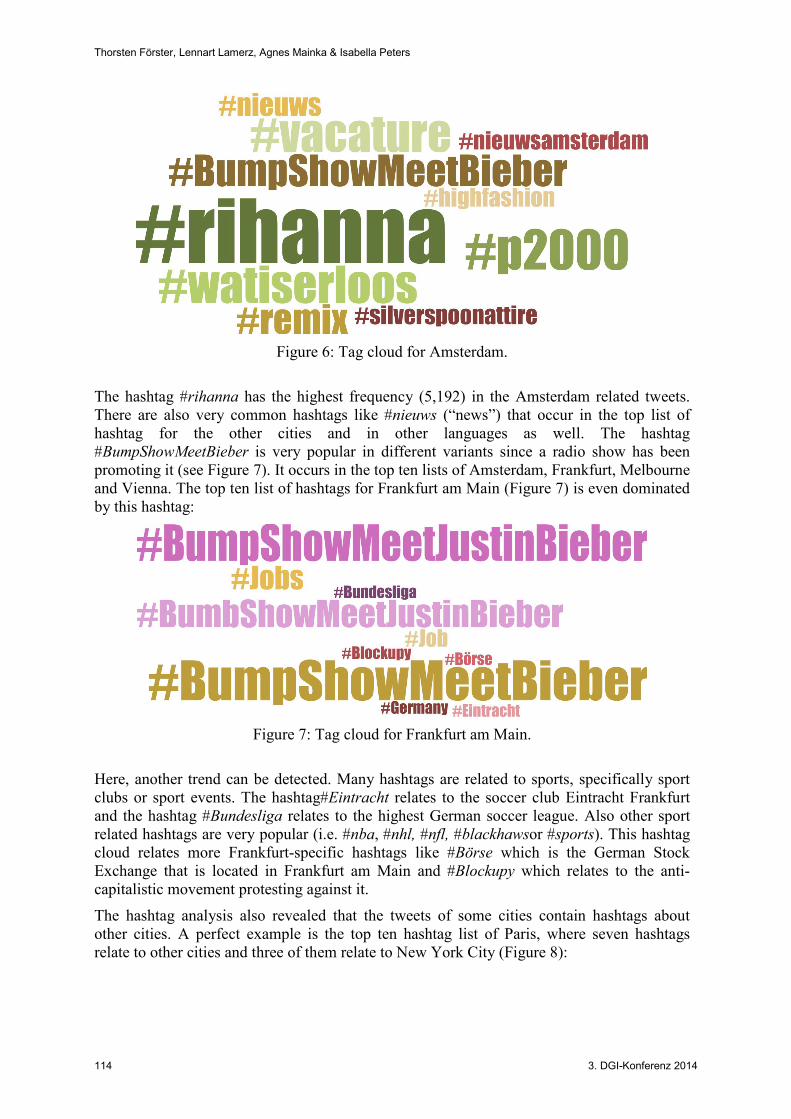
To determine the main topics of the tweets that were collected, using either the Search API or the Streaming API, we investigated the hashtags in the tweets related to every city. Hashtags represent a method how users can index their tweets. We filtered out hashtags which are built from city names since they were already used to find those tweets and would automatically be the hashtags with the highest frequency in our corpus. As shown in Figure 6 the hashtags are ranked according to their frequency of occurrence which is also visualised by font size. For some cities the main topics in the collection period were specific events like concerts as it is shown in the hashtag cloud for Amsterdam:
Thorsten Förster, Lennart Lamerz, Agnes Mainka & Isabella Peters
114 3. DGI-Konferenz 2014
Figure 6: Tag cloud for Amsterdam.
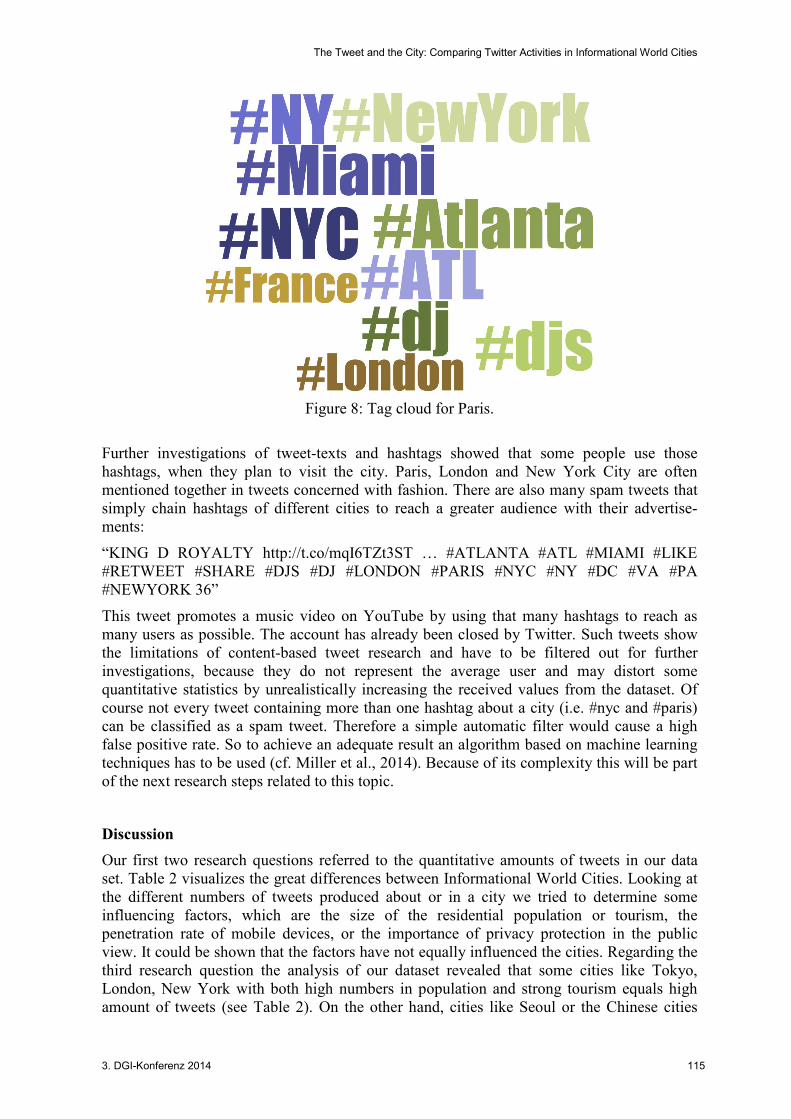
The hashtag #rihanna has the highest frequency (5,192) in the Amsterdam related tweets. There are also very common hashtags like #nieuws (“news”) that occur in the top list of hashtag for the other cities and in other languages as well. The hashtag #BumpShowMeetBieber is very popular in different variants since a radio show has been promoting it (see Figure 7). It occurs in the top ten lists of Amsterdam, Frankfurt, Melbourne and Vienna. The top ten list of hashtags for Frankfurt am Main (Figure 7) is even dominated by this hashtag:
Figure 7: Tag cloud for Frankfurt am Main.
Here, another trend can be detected. Many hashtags are related to sports, specifically sport clubs or sport events. The hashtag#Eintracht relates to the soccer club Eintracht Frankfurt and the hashtag #Bundesliga relates to the highest German soccer league. Also other sport related hashtags are very popular (i.e. #nba, #nhl, #nfl, #blackhawsor #sports). This hashtag cloud relates more Frankfurt-specific hashtags like #Börse which is the German Stock Exchange that is located in Frankfurt am Main and #Blockupy which relates to the anti-capitalistic movement protesting against it.
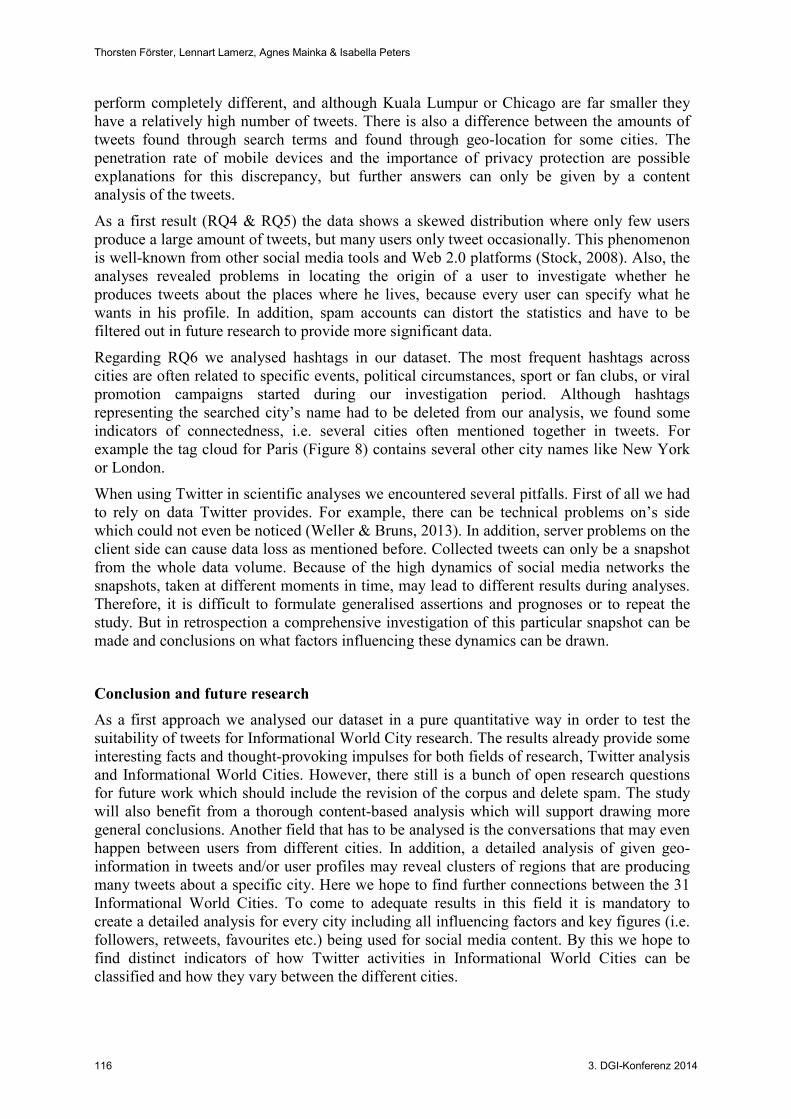
The hashtag analysis also revealed that the tweets of some cities contain hashtags about other cities. A perfect example is the top ten hashtag list of Paris, where seven hashtags relate to other cities and three of them relate to New York City (Figure 8):
The Tweet and the City: Comparing Twitter Activities in Informational World Cities
3. DGI-Konferenz 2014 115
Figure 8: Tag cloud for Paris.
Further investigations of tweet-texts and hashtags showed that some people use those hashtags, when they plan to visit the city. Paris, London and New York City are often mentioned together in tweets concerned with fashion. There are also many spam tweets that simply chain hashtags of different cities to reach a greater audience with their advertise-ments:
“KING D ROYALTY http://t.co/mqI6TZt3ST … #ATLANTA #ATL #MIAMI #LIKE #RETWEET #SHARE #DJS #DJ #LONDON #PARIS #NYC #NY #DC #VA #PA #NEWYORK 36”
This tweet promotes a music video on YouTube by using that many hashtags to reach as many users as possible. The account has already been closed by Twitter. Such tweets show the limitations of content-based tweet research and have to be filtered out for further investigations, because they do not represent the average user and may distort some quantitative statistics by unrealistically increasing the received values from the dataset. Of course not every tweet containing more than one hashtag about a city (i.e. #nyc and #paris) can be classified as a spam tweet. Therefore a simple automatic filter would cause a high false positive rate. So to achieve an adequate result an algorithm based on machine learning techniques has to be used (cf. Miller et al., 2014). Because of its complexity this will be part of the next research steps related to this topic.
Discussion
Our first two research questions referred to the quantitative amounts of tweets in our data set. Table 2 visualizes the great differences between Informational World Cities. Looking at the different numbers of tweets produced about or in a city we tried to determine some influencing factors, which are the size of the residential population or tourism, the penetration rate of mobile devices, or the importance of privacy protection in the public view. It could be shown that the factors have not equally influenced the cities. Regarding the third research question the analysis of our dataset revealed that some cities like Tokyo, London, New York with both high numbers in population and strong tourism equals high amount of tweets (see Table 2). On the other hand, cities like Seoul or the Chinese cities
Thorsten Förster, Lennart Lamerz, Agnes Mainka & Isabella Peters
116 3. DGI-Konferenz 2014
perform completely different, and although Kuala Lumpur or Chicago are far smaller they have a relatively high number of tweets. There is also a difference between the amounts of tweets found through search terms and found through geo-location for some cities. The penetration rate of mobile devices and the importance of privacy protection are possible explanations for this discrepancy, but further answers can only be given by a content analysis of the tweets.
As a first result (RQ4 & RQ5) the data shows a skewed distribution where only few users produce a large amount of tweets, but many users only tweet occasionally. This phenomenon is well-known from other social media tools and Web 2.0 platforms (Stock, 2008). Also, the analyses revealed problems in locating the origin of a user to investigate whether he produces tweets about the places where he lives, because every user can specify what he wants in his profile. In addition, spam accounts can distort the statistics and have to be filtered out in future research to provide more significant data.
Regarding RQ6 we analysed hashtags in our dataset. The most frequent hashtags across cities are often related to specific events, political circumstances, sport or fan clubs, or viral promotion campaigns started during our investigation period. Although hashtags representing the searched city’s name had to be deleted from our analysis, we found some indicators of connectedness, i.e. several cities often mentioned together in tweets. For example the tag cloud for Paris (Figure 8) contains several other city names like New York or London.
When using Twitter in scientific analyses we encountered several pitfalls. First of all we had to rely on data Twitter provides. For example, there can be technical problems on’s side which could not even be noticed (Weller & Bruns, 2013). In addition, server problems on the client side can cause data loss as mentioned before. Collected tweets can only be a snapshot from the whole data volume. Because of the high dynamics of social media networks the snapshots, taken at different moments in time, may lead to different results during analyses. Therefore, it is difficult to formulate generalised assertions and prognoses or to repeat the study. But in retrospection a comprehensive investigation of this particular snapshot can be made and conclusions on what factors influencing these dynamics can be drawn.
Conclusion and future research
As a first approach we analysed our dataset in a pure quantitative way in order to test the suitability of tweets for Informational World City research. The results already provide some interesting facts and thought-provoking impulses for both fields of research, Twitter analysis and Informational World Cities. However, there still is a bunch of open research questions for future work which should include the revision of the corpus and delete spam. The study will also benefit from a thorough content-based analysis which will support drawing more general conclusions. Another field that has to be analysed is the conversations that may even happen between users from different cities. In addition, a detailed analysis of given geo-information in tweets and/or user profiles may reveal clusters of regions that are producing many tweets about a specific city. Here we hope to find further connections between the 31 Informational World Cities. To come to adequate results in this field it is mandatory to create a detailed analysis for every city including all influencing factors and key figures (i.e. followers, retweets, favourites etc.) being used for social media content. By this we hope to find distinct indicators of how Twitter activities in Informational World Cities can be classified and how they vary between the different cities.
The Tweet and the City: Comparing Twitter Activities in Informational World Cities
3. DGI-Konferenz 2014 117
References
Bruns, A. (2008). Blogs, Wikipedia, Second Life, and Beyond. From Production to Produsage. New York: Peter Lang.
Bruns, A., Burgess, J., Crawford, K., & Shaw, F. (2012). .#qldfloods and @QPSMedia: Crisis Communication on Twitter in the 2011 South East Queensland Floods. Brisbane: ARC Centre of Excellence for Creative Industries and Innovation.
Butler, R. (2001). Seasonality in tourism: issues and implications. Seasonality in tourism, pp. 5-22.
Castells. (1994). European cities, the informational society, and the global economy. New Left Review, 204, pp. 18-32.
Castells, M. (1989). The Informational City. Information Technology, Economic Restructuring, and the Urban-Regional Process. Oxford, UK: Basil Blackwell.
Cheng, Z., Caverlee, J.& Lee, K. (2010). You Are Where You Tweet: A Content-Based Approach to Geo-locating Twitter Users. CIKM '10 Proceedings of the 19th ACM international conference on Information and knowledge management, pp. 759-768.
Eichstädt, B.& Wei, C. (2013). Im Social Web der Mitte. In R. Leinemann (Ed.), Social Media (pp. 107-110). Berlin Heidelberg: Springer.
Euromonitor. (2013). Top 100 cities destination ranking. Retrieved August 23, 2013, from http://blog.euromonitor.com/2013/01/top-100-cities-destination-ranking.html
Eurostat. (2010). European Regional and Urban Statistics. Luxembourg: Publications Office of the European Union.
Hartley, J., Potts, J., MacDonald, T., Erkunt, C.& Kufleitner, C. (2012). CCI-CCI Creative City Index 2012. Queensland University of Technology: ARC Centre of Excellence for Creative Industries and Innovation.
Java, A., Song, X., Finin, T. & Tseng, B. (2007). Why we twitter: Understanding microblogging usage and communities. In Proceedings of the 9th WebKDD and 1st SNA-KDD 2007 Workshop on Web Mining and Social Network Analysis at ACM SIGKDD, San Jose, CA (S. 56-65). New York: ACM.
Lewis, M. P. (2009). Ethnologue: Languages of the World, Sixteenth edition. Dallas, Texas: SIL International. (M. P. Lewis, Ed.) Retrieved from http://www.ethnologue.com/16
Mainka, A.& Khveshchanka, S. (2012). Digital Libraries as Knowledge Hubs in Informational Cities. Libraries in the Digital Age (LIDA) Proceedings Vol. 12, 18 - 22 June 2012. Zadar, Croatia: University of Zadar.
Mainka, A., Fietkiewicz, K., Kosior, A., Pyka, S.& Stock, W. G. (2013a). Maturity and usability of e-government in informational world cities. In F. E, & C. W, Proceedings of the 13th European Conference on e-Government. University of Insubria Varese, Italy, 13-14 June 2013 (pp. 292-300). Reading, UK: Academic Conferences and Publishing International (ACPI).
Mainka, A., Hartman, S., Orszullok, L., Peters, I., Stallmann, A. & Stock, W. G. (2013b). Public Libraries in Informational World Cities. Libri, 63(4), 295-319.
Miller, Z., Dickinson, B., Deitrick, W., Hu, W.&Wang, H. A. (2014). Twitter spammer detection using data stream clustering. Information Sciences 260, 64-73.
Thorsten Förster, Lennart Lamerz, Agnes Mainka & Isabella Peters
118 3. DGI-Konferenz 2014
Oussalah, M., Bhat, F., Challis, K.& Schnier, T. (2013). A software architecture for Twitter collection, search and geolocation services. Knowledge-Based Systems (37), pp. 105-120.
Peters, I., Hartmann, S.& Mainka, A. (2013). Social Media Use and Outreach of Selected Public Libraries in Informational World Cities. Proceedings of the Second Association for Information Science and Technology ASIS&T European Workshop (pp. 79-93). Åbo/Turku, Finland: Skrifter utgivna av Informationsvetenskap vid Åbo Akademi Vol. 2. Åbo: Åbo Akademi University.
Rios, M. & Lin, J. (2013). Visualizing the “Pulse” of World Cities on Twitter. Proceedings of the Seventh International AAAI Conference on Weblogs and Social Media.
Ritzer, G. & Jurgenson, N. (2010). Production, Consumption, Prosumption: The nature of capitalism in the age of the digital “prosumer”. Journal of Consumer Culture, pp. 13-36.
Rowinski. (2013, May 29). Think Mobile Is Big Now? Here's Proof That It's Just Getting Started. Retrieved August 23, 2013, from http://readwrite.com/2013/05/29/huge-potential-only-15-of-global-internet-traffic-is-mobile#awesm=~ofKwdMIxymYk5E
Semiocast. (2011, November 24). Arabic highest growth on Twitter. http://semiocast.com/publications/2011_11_24_Arabic_highest_growth_on_Twitter [23.08.2013]
Stock, W.& Stock, M. (2008). Wissensrepräsentation. München: Oldenbourg Verlag.
Takhteyev, Y., Gruzd, A.& Wellman, B. (2012). Geography of Twitter networks. Social Networks 34, pp. 73-81.
Toffler, A. (1980). The Third Wave. New York: Morrow.
Unisys. (2013). Unisys Security Index. http://www.unisyssecurityindex.com/usi/germany [23.08.2013]
Weidemann, C. (2013). Social Media Location Intelligence: The Next Privacy Battle - An ArcGIS add-in and Analysis of Geospatial Data Collected from Twitter.com. International Journal of Geoinformatics, 9(2), pp. 21-27.
Weller, K.& Bruns, A. (2013). Das Spiel dauert 140 Zeichen: Wie deutsche Fußballvereine Twitter für Marketing und Fan-Kommunikation entdecken. In J. Griesbaum, B. Heuwing, J. Ruppenhofer & K. Werner (Eds.), HiER 2013. Proceedings des 8. Hildesheimer Evaluierungs- und Retrievalworkshop (pp. 119-131). Hildesheim: Universität Hildesheim.
Zhao, W. X., Jiang, J., Weng, J., He, J., Lim, Ee-Peng, . . . Li, X. (2011). Comparing twitter and traditional media using topic models. ECIR'11 Proceedings of the 33rd European conference on Advances in information retrieval, pp. 338-349.