The tip of the iceberg Tests of indirect measures of tourism in Alghero
12
The tip of the iceberg Tests of indirect measures of tourism in Alghero by Cristian Cannaos and Giuseppe Onni 1 The tip of the iceberg is a small evident part or aspect of something largely hidden 2 . Nowadays the knowledge of tourism is like this tip. The official data just make a picture of emerged part, but what is the submerged one? The aim of the research is to try to give some suggestion for the inves- tigation of submerged dimension of tourism using the experience of the Tourism Observatory of the Faculty of Architecture of Alghero. The intent is to illustrate methodologies and issues relevant for tourism in general and replicable in other situations. We try to assess the submerged size of the tourism phenomenon both on the supply side (specifically the size of the receptive target) and on the demand side (the actual number of atten- dances). Introduction Tourism is one of the most important tools of territorial transformation, and its effects open a huge field of research both in quantitative and qualita- tive dimensions. The majority of official investigation are quantitative, and partials, just showing the tip of the iceberg. For instance the data from the ISTAT annual survey "skills and movements of the accommodation" are completely lacking in presence and arrivals in unofficial structures (the so- called second houses), and being poor measures for non-hotel structures. 1 Architecture at Alghero, Department of Architecture, Design and Urbanism, University of Sassari, Italy. 2 http://www.thefreedictionary.com/tip+of+the+iceberg
Transcript of The tip of the iceberg Tests of indirect measures of tourism in Alghero
The tip of the iceberg
Tests of indirect measures of tourism in Alghero
by Cristian Cannaos and Giuseppe Onni1
The tip of the iceberg is a small evident part or aspect of something
largely hidden2. Nowadays the knowledge of tourism is like this tip. The
official data just make a picture of emerged part, but what is the submerged
one? The aim of the research is to try to give some suggestion for the inves-
tigation of submerged dimension of tourism using the experience of the
Tourism Observatory of the Faculty of Architecture of Alghero. The intent
is to illustrate methodologies and issues relevant for tourism in general and
replicable in other situations. We try to assess the submerged size of the
tourism phenomenon both on the supply side (specifically the size of the
receptive target) and on the demand side (the actual number of atten-
dances).
Introduction
Tourism is one of the most important tools of territorial transformation,
and its effects open a huge field of research both in quantitative and qualita-
tive dimensions. The majority of official investigation are quantitative, and
partials, just showing the tip of the iceberg. For instance the data from the
ISTAT annual survey "skills and movements of the accommodation" are
completely lacking in presence and arrivals in unofficial structures (the so-
called second houses), and being poor measures for non-hotel structures.
1Architecture at Alghero, Department of Architecture, Design and Urbanism, University of
Sassari, Italy.
2 http://www.thefreedictionary.com/tip+of+the+iceberg
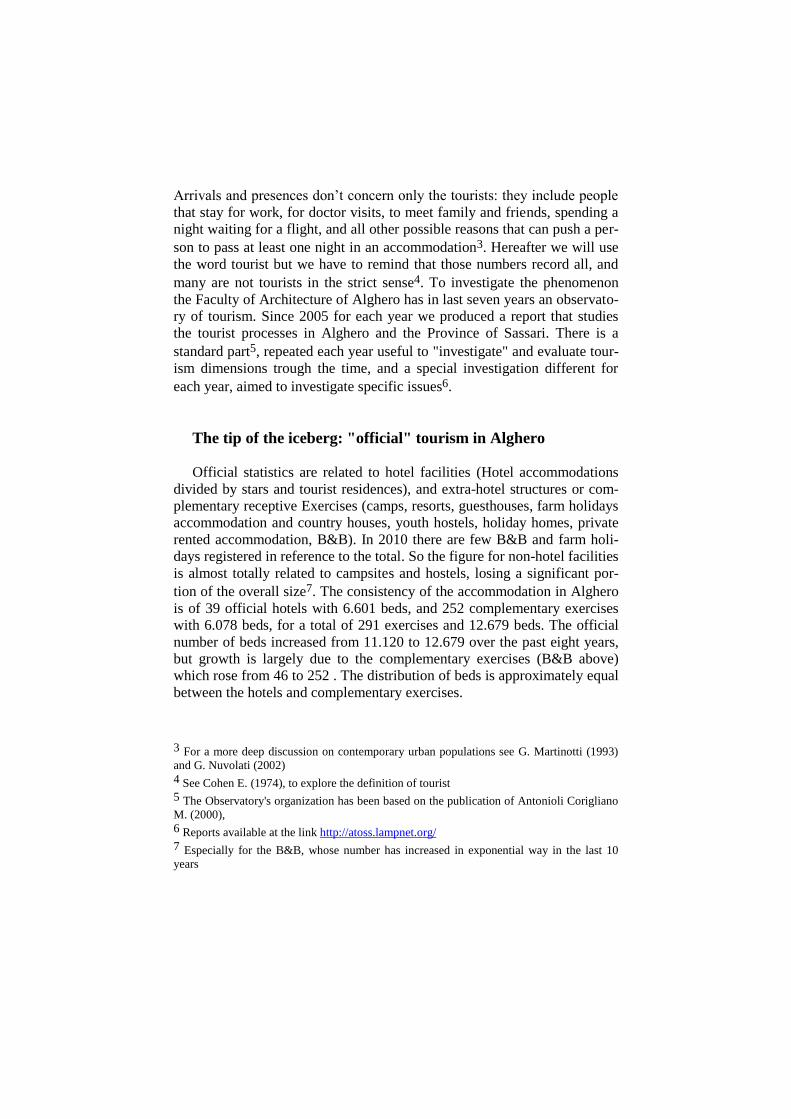
Arrivals and presences don’t concern only the tourists: they include people
that stay for work, for doctor visits, to meet family and friends, spending a
night waiting for a flight, and all other possible reasons that can push a per-
son to pass at least one night in an accommodation3. Hereafter we will use
the word tourist but we have to remind that those numbers record all, and
many are not tourists in the strict sense4. To investigate the phenomenon
the Faculty of Architecture of Alghero has in last seven years an observato-
ry of tourism. Since 2005 for each year we produced a report that studies
the tourist processes in Alghero and the Province of Sassari. There is a
standard part5, repeated each year useful to "investigate" and evaluate tour-
ism dimensions trough the time, and a special investigation different for
each year, aimed to investigate specific issues6.
The tip of the iceberg: "official" tourism in Alghero
Official statistics are related to hotel facilities (Hotel accommodations
divided by stars and tourist residences), and extra-hotel structures or com-
plementary receptive Exercises (camps, resorts, guesthouses, farm holidays
accommodation and country houses, youth hostels, holiday homes, private
rented accommodation, B&B). In 2010 there are few B&B and farm holi-
days registered in reference to the total. So the figure for non-hotel facilities
is almost totally related to campsites and hostels, losing a significant por-
tion of the overall size7. The consistency of the accommodation in Alghero
is of 39 official hotels with 6.601 beds, and 252 complementary exercises
with 6.078 beds, for a total of 291 exercises and 12.679 beds. The official
number of beds increased from 11.120 to 12.679 over the past eight years,
but growth is largely due to the complementary exercises (B&B above)
which rose from 46 to 252 . The distribution of beds is approximately equal
between the hotels and complementary exercises.
3 For a more deep discussion on contemporary urban populations see G. Martinotti (1993)
and G. Nuvolati (2002)
4 See Cohen E. (1974), to explore the definition of tourist
5 The Observatory's organization has been based on the publication of Antonioli Corigliano
M. (2000),
6 Reports available at the link http://atoss.lampnet.org/
7 Especially for the B&B, whose number has increased in exponential way in the last 10
years
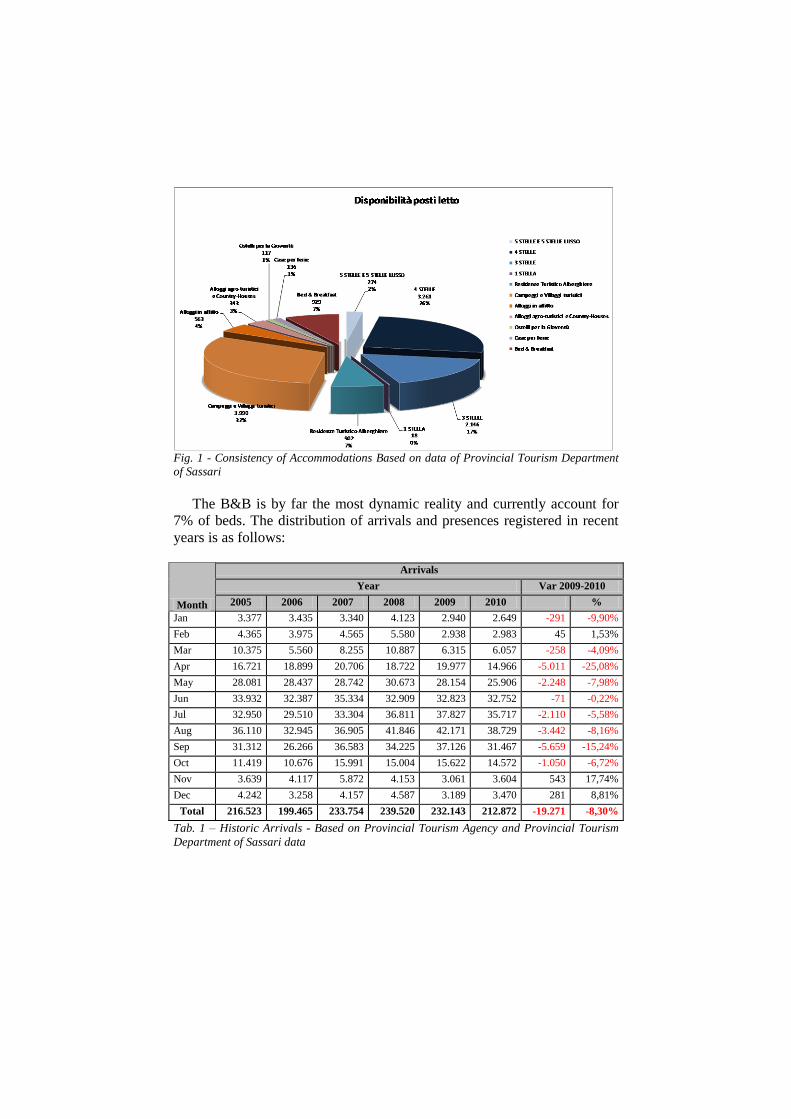
Fig. 1 - Consistency of Accommodations Based on data of Provincial Tourism Department
of Sassari
The B&B is by far the most dynamic reality and currently account for
7% of beds. The distribution of arrivals and presences registered in recent
years is as follows:
Month
Arrivals
Year Var 2009-2010
2005 2006 2007 2008 2009 2010 %
Jan 3.377 3.435 3.340 4.123 2.940 2.649 -291 -9,90%
Feb 4.365 3.975 4.565 5.580 2.938 2.983 45 1,53%
Mar 10.375 5.560 8.255 10.887 6.315 6.057 -258 -4,09%
Apr 16.721 18.899 20.706 18.722 19.977 14.966 -5.011 -25,08%
May 28.081 28.437 28.742 30.673 28.154 25.906 -2.248 -7,98%
Jun 33.932 32.387 35.334 32.909 32.823 32.752 -71 -0,22%
Jul 32.950 29.510 33.304 36.811 37.827 35.717 -2.110 -5,58%
Aug 36.110 32.945 36.905 41.846 42.171 38.729 -3.442 -8,16%
Sep 31.312 26.266 36.583 34.225 37.126 31.467 -5.659 -15,24%
Oct 11.419 10.676 15.991 15.004 15.622 14.572 -1.050 -6,72%
Nov 3.639 4.117 5.872 4.153 3.061 3.604 543 17,74%
Dec 4.242 3.258 4.157 4.587 3.189 3.470 281 8,81%
Total 216.523 199.465 233.754 239.520 232.143 212.872 -19.271 -8,30%
Tab. 1 – Historic Arrivals - Based on Provincial Tourism Agency and Provincial Tourism
Department of Sassari data
Month
Presences
Year Var 2009-2010
2005 2006 2007 2008 2009 2010 %
Jan 7.477 6.355 5.934 7.084 5.126 5.119 -7 -0,14%
Feb 8.391 7.901 8.571 10.582 4.701 5.452 751 15,98%
Mar 30.577 14.214 18.435 25.613 13.108 12.295 -813 -6,20%
Apr 36.584 56.672 50.036 46.935 44.972 35.773 -9.199 -20,45%
May 82.216 87.356 86.788 90.179 75.984 74.825 -1.159 -1,53%
Jun 151.722 151.919 142.527 149.863 131.337 130.190 -1.147 -0,87%
Jul 183.333 163.747 170.743 201.392 192.887 189.145 -3.742 -1,94%
Aug 218.366 204.325 197.785 218.730 214.981 216.190 1.209 0,56%
Sep 136.051 112.530 145.228 146.286 143.501 135.217 -8.284 -5,77%
Oct 36.702 32.819 50.315 42.722 52.252 50.375 -1.877 -3,59%
Nov 7.613 7.761 10.962 7.103 4.681 6.682 2.001 42,75%
Dec 7.514 6.335 7.399 7.606 4.867 5.565 698 14,34%
Total 906.546 851.934 894.723 954.095 888.397 866.828 -21.569 -2,43%
Tab 2 - Historic Presences - Based on Provincial Tourism Agency and Provincial Tourism
Department of Sassari data
The total for 2007 and 2009 (later we will find them in indirect mea-
surements) are very similar, we talk about 230.000 arrivals and 890.000
presences. In the 2010 instead there's a decrease (an effect of the interna-
tional crisis) and we have 212.000 arrivals and 866.000 presences. Both
presences and arrivals reached a peak in August. The total presences rec-
orded in this month are about 1/6 of the ones of resident population
(40.803*31 = 1.264.893). The tourists hosted in official facilities weigh (on
average) like 7.000 inhabitants more. Around the 15th of August we have
the presence of a population approximately equivalent to 14.000 residents.
The number of arrivals is large (30.000) and varies slowly between May
and September, October and April have more or less the same numbers
(15.000). The first three months and the last two of the year are evidently
"off season". However, it means that in the off season Alghero has in its
streets about 170 people more.
The underwater part: unofficial tourism in Alghero
As in most European tourist destinations, alongside the official offer there
is a market of houses not occupied by residents and available for temporary
uses. Whole cities or neighborhoods consist of houses used essentially for

tourism, with all the problems for the city and its stable populations8. But
the available statistic data does not provides data about these so-called
"second houses". The lack is double, namely we do not know neither their
number, nor what is the flow of people during the year in this type of ac-
commodations.
The unofficial accommodation capacity
In Alghero the official accommodation facilities have 12.679 beds. To
estimate the number of houses available for temporary uses, we used two
indirect indicators: the number of ENEL contracts for electricity supply for
domestic use and the ICI (Municipality Property Tax). Unfortunately they
were used on different years and has not been possible a direct comparison.
Contracts for electricity supply for domestic uses: The starting principle
is that if someone pays the electrical power supply, the house is available to
be used (permanently or occasionally).
Year Residents (by ISTAT) Resident’s contracts Non-resident’s contracts Total contracts
2005 40.320 17.472 7.438 24.910
2006 40.400 18.460 8.020 26.480
2007 40.700 18.951 8.602 27.552
Tab. 3 - Contracts for electricity supply for domestic uses 2005- 2007, ENEL data
In 2007 we had 8.602 contracts for residents. But there is a phenomenon
that regards “absent residents”, people who, essentially for tax reasons9, re-
side in a city, but actually live elsewhere. To try to assess how many houses
were used by real residents, we referenced to the 2001 ISTAT Census that
recorded that we have 2,7 permanent residents per residential unit.
Year Residents (by ISTAT) Total energy suplly
contracts Houses of real resi-dents
(Res/2,7)
Available Houses (Ut.Att-Ab.occ)
2005 40.320 24.910 14.933 9.977
2006 40.400 26.480 14.963 11.517
2007 40.700 27.552 15.074 12.352
Tab. 4 – Active ENEL contracts 2005 - 2007, ENEL data,
The phenomenon of absent residents is significant. Estimated in first ap-
8I.e. Torres and Momsen (2005),
9 ENEL also practice different prices for residents and non-resident, encouraging the phe-
nomenon
proximation is about 3.700 units10, 9% of residents in 2007 (the nucleus of
absent residents it is usually individual). In 2007 we had 27.552 houses
with electricity supply contracts of which 12.352 (44.8%) were available to
temporary uses. After we tried to estimate the accommodation capacity
(number of beds) considering the following extreme situations:
1. Assign to the second houses the same density of the resident
population (2,7 inh/RU)
2. Assign for each RU available 2 beds for each room useful. The
reference is therefore of 2.4 rooms per unit11.
YEAR Beds Range
Same density of residents
(2,7 inh/RU*n°RU avai)
2 beds per avaible room
(2,4 roo/RU*n°Ru avai*2)
2005 26.937 47.888
2006 31.096 55.282
2007 33.691 59.895
Tab. 5 – Number of beds in houses not occupied by residents
The accommodation capacity in second houses is dominant, since their
number of beds (at least) is almost three times that of the official structures.
Unfortunately, following the liberalization of energy market (July 2007) in
the same city we can find a variety of operators and is no longer easy obtain
the overall figure of contracts.
ICI Data: Another useful data is the ICI tax. Namely we know how
many second houses are declared for the payment of this tax. In 2009 they
were 10.447. The ICI data are different from the previous ones. In fact, we
have to pay the ICI tax also on houses not available for use (closed, aban-
doned, ruins, etc.). Moreover, the foreign owners of one house on the Ital-
ian territory do not pay the ICI12. In first approximation, however, given
that this two variations are in contrast, we can assume that compensate (in
fact Alghero is a town with a thriving real estate market, so unused houses
10 We can verified this number, considering the number of houses without central heating
and fix phone in the 2001(enough important given the limited diffusion of mobiles at the
time) and crossing them with the number of single-family houses.
11 Census 2001 population and services The average size of housing units not used regular-
ly by the resident population was 3.4 rooms. The number of rooms is calculated by taking
the average number of rooms per house minus one, which generally represents the only
available common space.
12 The ICI data report only 38 foreigners who pay in Alghero but the number of foreigners
who have a house in the town is surely higher For example the foreign residents were 914 in
2009.

are fewer of the number of foreigner owners).We have also to correct the
ICI data with the phenomenon of absent residents adding at least 3.700
units. In this way we arrive to estimated 14.150 empty units. The finding is
consistent with the growth data measured by ENEL. In fact Alghero is a
town where the number of houses used grew about 1.200 units per year and
of these 800 used as temporary residences. The definitive picture is as fol-
lows:
Year ICI second Hoses + absent resi-
dents
Beds Range
Same density of residents
(2,7 inh/RU*n°RU avai)
2 beds per avaible room
(2,4 roo/RU*n°Ru avai*2)
2009 14150 38.205 67.920
Tab. 6 – Number of beds in houses not occupied by residents
We're studying for the next years new methods of indirect estimation.
I.e. the recent tax reform that reintroduces the first house tax (IMU) will be
useful to have a more detailed picture of the size of our cities.
Indirect measure of the presence
The official data provide statistics away from the actual affluence of
people in Alghero, especially in high season. In the absence of relevant data
we identified indirect indicators, not to provide certain accuracy, but orders
of magnitude. The used data are the monthly production of municipal solid
waste and the bread consumption13. Each reference is available for each
month, so it can be used to estimate the average presences in Alghero.
Production of Municipal Solid Waste (MSW)
This is a useful indicator to assess the total number of presences. These
data register residents, tourists, excursionists and persons who are in the
city and produce waste. Therefore, the estimate of the present population is
linked to the environmental impact in the different months rather than a
count of single units. Of course the type of waste varies throughout the year
and depending on the weather14. Based on the principle that the months
from November to February are to Alghero almost "zero tourism", we con-
13 Source Supermarket Deltapiù - Alghero
14 Similar method is used by ARPAS in the annual report on the management of municipal
waste in Sardinia (10th report, year 2008).
sidered the daily average of MSW produced in these months as the exclu-
sive production of the physiological and permanent residents, in all other
months, we thus obtain a surplus of waste which is then considered product
by floating inhabitants. Since the end of 2007 is active in the territory of
Alghero the separate waste collection. This allows to have for each month
the data collection of the various materials. It may be associated with esti-
mate assessments, then, only for those types of waste whose correlation
with the phenomenon of tourism is high, such as dry undifferentiated
(MSW), the wet waste, paper and glass. By estimating through the monthly
production of these components of waste the graph obtained was the fol-
lowing:
GennaioFebbraio Marzo Aprile Maggio Giugno Luglio AgostoSettembreOttobreNovembreDicembre
Popolazione residente 40802 40811 40823 40841 40862 40865 40871 40888 40914 40947 40969 40970
umido 40794 40410 46769 48958 46543 52046 53002 82594 47354 41926 40568 41782
vetro 42669 24266 41422 41145 46952 69277 75915 88263 74820 47201 35089 44374
carta 41101 43233 47875 48301 44985 54269 55015 57869 53274 41658 40699 38508
Totale RD 40902 41391 47154 48731 46004 52819 53702 74019 49409 41838 40614 40643
0
10000
20000
30000
40000
50000
60000
70000
80000
90000
100000
Stima popolazione presente base produzione rif iuti dif ferenziati
Popolazione residente
umido
vetro
carta
Totale RD
Figure 2 - Estimate of present population based on the production of separated waste
The glass is the indicator that gives the highest numbers. This is certain-
ly to be related to greater consumption of drinks in the summer, either at
home or in public places. The months of February and November show an
anomalous trend compared to the rest of the year. The figure was repeated
in a similar way in all the years when the survey was carried out. The most
plausible explanation is that the two months "abnormal" are those where
the majority of public houses closed for holidays. The trend in 2010, how-
ever it is clear and in line with the official attendance. For the month of
August we can see the biggest differences between the waste collections
evaluated, it depends by the season. On the positive side glass and wet, the
first for the hot,, the second to the greater weight of fruit (especially water-
melon and melon). The paper decreases because of the closure of many
public and private offices that masks so many tourist presence. To try to re-
duce this seasonal impact we preferred to use an aggregate indicator for
waste collection. This was then compared with the undifferentiated waste
product.
41760
39649
4462848803
50096
60257
72259
79398
58624
46641
41616
4052740902
41391
47154 48731
46004
5281953702
74019
49409
4183840614 40643
41651
39898
46201 49554
49195
58059
65849
74503
56460
4633742447
40473
0
10000
20000
30000
40000
50000
60000
70000
80000
90000
Gennaio Febbraio Marzo Aprile Maggio Giugno Luglio Agosto Settembre Ottobre Novembre Dicembre
popolazione rif iuti
R.S.U.
Totale RD
Totale raccolte
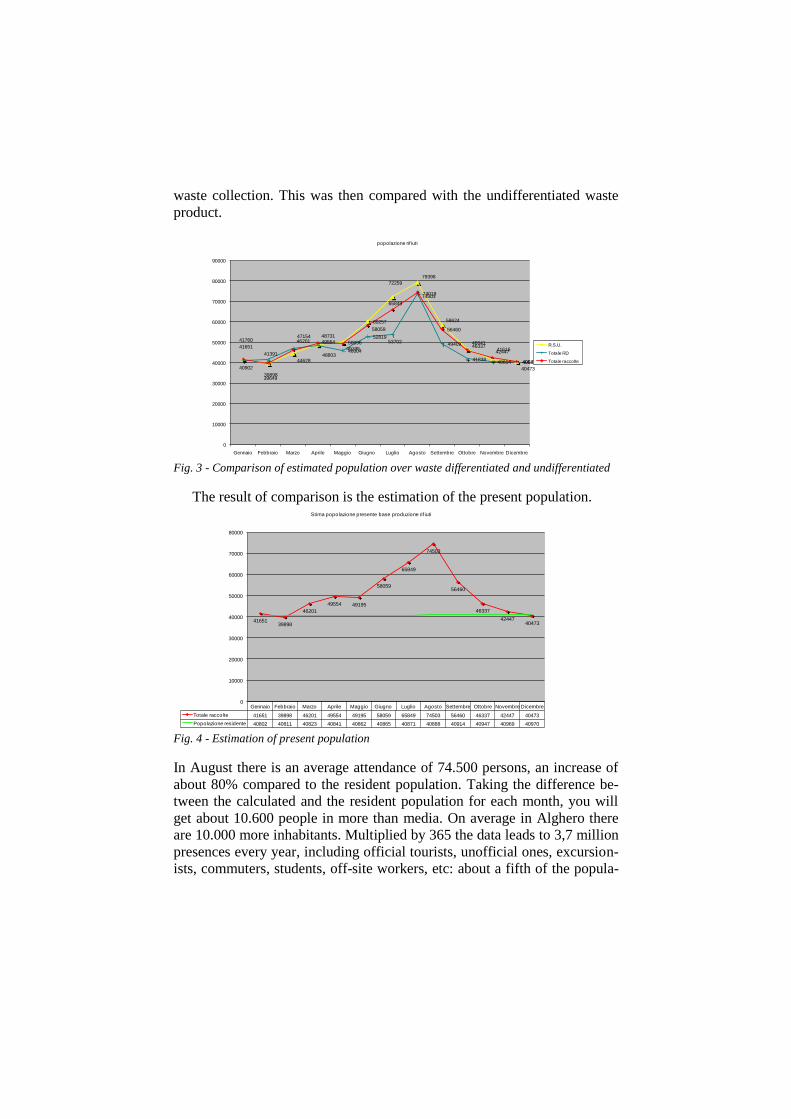
Fig. 3 - Comparison of estimated population over waste differentiated and undifferentiated
The result of comparison is the estimation of the present population.
Gennaio Febbraio Marzo Aprile Maggio Giugno Luglio Agosto Settembre Ottobre Novembre Dicembre
Totale raccolte 41651 39898 46201 49554 49195 58059 65849 74503 56460 46337 42447 40473
Popolazione residente 40802 40811 40823 40841 40862 40865 40871 40888 40914 40947 40969 40970
4165139898
46201
49554 49195
58059
65849
74503
56460
46337
4244740473
0
10000
20000
30000
40000
50000
60000
70000
80000
Stima popolazione presente base produzione rif iuti
Fig. 4 - Estimation of present population
In August there is an average attendance of 74.500 persons, an increase of
about 80% compared to the resident population. Taking the difference be-
tween the calculated and the resident population for each month, you will
get about 10.600 people in more than media. On average in Alghero there
are 10.000 more inhabitants. Multiplied by 365 the data leads to 3,7 million
presences every year, including official tourists, unofficial ones, excursion-
ists, commuters, students, off-site workers, etc: about a fifth of the popula-
tion of Alghero is not resident. The key management problem is that the
distribution is not homogeneous. For the months of January, February, No-
vember and December we have just the residents. In April, May and Octo-
ber on average we have 10.000 more inhabitants. In June and September
the inhabitants amounted to more than 17.000 (i.e. 40% more than the resi-
dents). In July, they are 25.000 (62.5% more), and in August we have the
peak of 34.000 units more (85% more), we are close to the doubling of the
city. Close to the 15th of August, the city really duplicate its inhabitants.
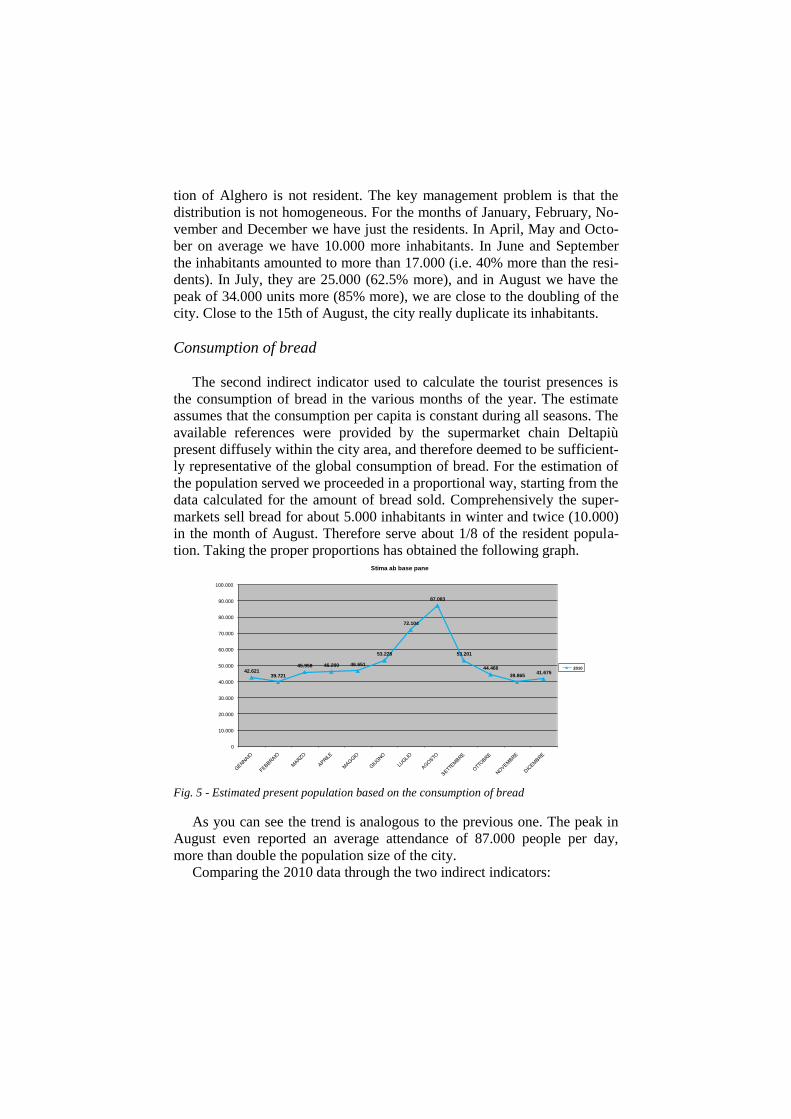
Consumption of bread
The second indirect indicator used to calculate the tourist presences is
the consumption of bread in the various months of the year. The estimate
assumes that the consumption per capita is constant during all seasons. The
available references were provided by the supermarket chain Deltapiù
present diffusely within the city area, and therefore deemed to be sufficient-
ly representative of the global consumption of bread. For the estimation of
the population served we proceeded in a proportional way, starting from the
data calculated for the amount of bread sold. Comprehensively the super-
markets sell bread for about 5.000 inhabitants in winter and twice (10.000)
in the month of August. Therefore serve about 1/8 of the resident popula-
tion. Taking the proper proportions has obtained the following graph.
Fig. 5 - Estimated present population based on the consumption of bread
As you can see the trend is analogous to the previous one. The peak in
August even reported an average attendance of 87.000 people per day,
more than double the population size of the city.
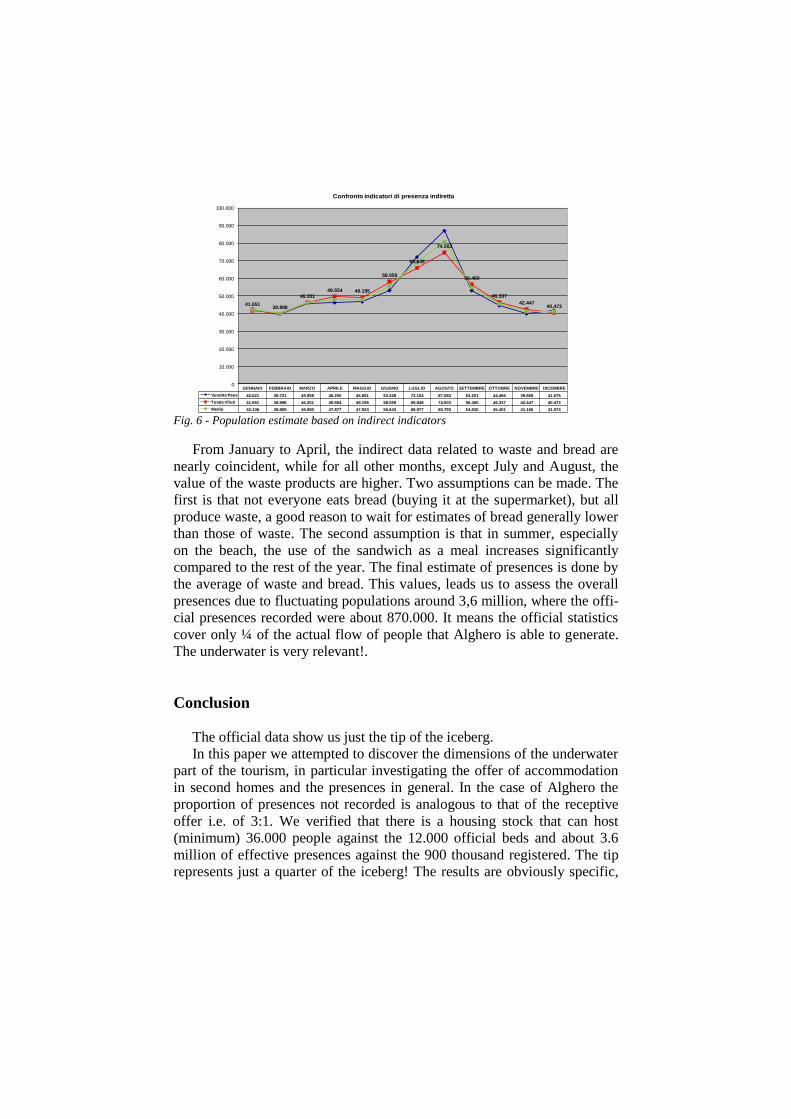
Comparing the 2010 data through the two indirect indicators:
42.62139.721
45.958 46.200 46.651
53.228
72.104
87.083
53.201
44.466
39.86541.675
0
10.000
20.000
30.000
40.000
50.000
60.000
70.000
80.000
90.000
100.000
Stima ab base pane
2010
GENNAIO FEBBRAIO MARZO APRILE MAGGIO GIUGNO LUGLIO AGOSTO SETTEMBRE OTTOBRE NOVEMBRE DICEMBRE
Vendite Pane 42.621 39.721 45.958 46.200 46.651 53.228 72.104 87.083 53.201 44.466 39.865 41.675
Totale rifiuti 41.651 39.898 46.201 49.554 49.195 58.059 65.849 74.503 56.460 46.337 42.447 40.473
Media 42.136 39.809 46.080 47.877 47.923 55.643 68.977 80.793 54.830 45.401 41.156 41.074
41.65139.898
46.201
49.554 49.195
58.059
65.849
74.503
56.460
46.337
42.44740.473
0
10.000
20.000
30.000
40.000
50.000
60.000
70.000
80.000
90.000
100.000
Confronto indicatori di presenza indiretta
Fig. 6 - Population estimate based on indirect indicators
From January to April, the indirect data related to waste and bread are
nearly coincident, while for all other months, except July and August, the
value of the waste products are higher. Two assumptions can be made. The
first is that not everyone eats bread (buying it at the supermarket), but all
produce waste, a good reason to wait for estimates of bread generally lower
than those of waste. The second assumption is that in summer, especially
on the beach, the use of the sandwich as a meal increases significantly
compared to the rest of the year. The final estimate of presences is done by
the average of waste and bread. This values, leads us to assess the overall
presences due to fluctuating populations around 3,6 million, where the offi-
cial presences recorded were about 870.000. It means the official statistics
cover only ¼ of the actual flow of people that Alghero is able to generate.
The underwater is very relevant!.
Conclusion
The official data show us just the tip of the iceberg.
In this paper we attempted to discover the dimensions of the underwater
part of the tourism, in particular investigating the offer of accommodation
in second homes and the presences in general. In the case of Alghero the
proportion of presences not recorded is analogous to that of the receptive
offer i.e. of 3:1. We verified that there is a housing stock that can host
(minimum) 36.000 people against the 12.000 official beds and about 3.6
million of effective presences against the 900 thousand registered. The tip
represents just a quarter of the iceberg! The results are obviously specific,

but the methodology can be easily replicated in other tourist places. The
difficulty is to find the right indirect measure of presences. In fact not al-
ways there are available data to describe the universe. In these cases the
better way of investigation is a specific survey.
However for a more complete picture of the tourism reality we have to
relate our investigations to the qualitative dimensions of tourism too. To
fully understand the effects of the impact it is interesting to know how great
is the iceberg, but we also need to understand how and of what is done.
References
Amendola, G. (1997), La città postmoderna. Magie e paure della metropoli con-
temporanea, Ed. Laterza, Roma.
Antonioli Corigliano M. (2000), L'Osservatorio turistico. Obiettivi, metodologie,
strumenti. EGEA
Bernardi U., Filippi V. (2004), “Dal Turismo ai turismi: trasformazioni sociali e
sfide culturali”, in A. Savelli (a cura di) Turismo, territorio, identità. Ricerche
ed esperienze nell’area mediterranea, Angeli, Milano.
Choi H.C., Sirakaya E. (2006), Sustainability indicators for managing community
tourism, Tourism Management 27 1274–1289
Cohen E. (1974), “Who is a tourist? A conceptual clarification”, The Sociological
Review, n. 22, pagg. 527-55.
Ejarque J. (2003), La destinazione turistica di successo, Hoepli, Milano,
La Rocca R.A. (2005); “Mass Tourism and Urban System: Some Suggestions to
Manage the Impacts on the City”; E-Review of Tourism Research (eRTR), Vol.
3, n. 1; pagg. 8-17.
Martinotti G. (1993), Metropoli, La nuova morfologia sociale della città, Il Mulino
Nuvolati G., Popolazioni in movimento nella città in trasformazione: abitanti,
pendolari, city users, uomini d'affari e flâneurs, Il Mulino, Bologna, 2002
Pigliaru F. e Lanza A. (2000), Why are tourism countries small and fast-growing?,
in (a cura di) A. Fossati and G. Panella, Tourism and Sustainable Economic
Development, Kluwer Academic Publishers, Dordrecht.
Price R. (1983), Una geografia del turismo: paesaggio e insediamenti umani sulle
coste della Sardegna, Ed. Formez.
Torres R. M. and Momsen J. D. (2005), “Gringolandia: The Construction of a New
Tourist Space in Mexico”, Annals of the Association of American Geographers,
95, 2: 314-335.
Usai S., Paci R. (2002), L'ultima Spiaggia, Turismo, sostenibilità ambientale e cre-
scita in Sardegna, Cagliari CUEC (2002).