
THE THEORY AND PRACTICE OF THIRD WAVE REGIONAL ...
341
Clemson University TigerPrints All Dissertations Dissertations 8-2011 THE THEORY AND PCTICE OF THIRD WAVE REGIONAL ECONOMIC DEVELOPMENT STTEGIES Lori Dickes Clemson University, [email protected] Follow this and additional works at: hps://tigerprints.clemson.edu/all_dissertations Part of the Public Affairs, Public Policy and Public Administration Commons is Dissertation is brought to you for free and open access by the Dissertations at TigerPrints. It has been accepted for inclusion in All Dissertations by an authorized administrator of TigerPrints. For more information, please contact [email protected]. Recommended Citation Dickes, Lori, "THE THEORY AND PCTICE OF THIRD WAVE REGIONAL ECONOMIC DEVELOPMENT STTEGIES" (2011). All Dissertations. 796. hps://tigerprints.clemson.edu/all_dissertations/796
-
Upload
khangminh22 -
Category
Documents
-
view
1 -
download
0
Transcript of THE THEORY AND PRACTICE OF THIRD WAVE REGIONAL ...

Clemson UniversityTigerPrints
All Dissertations Dissertations
8-2011
THE THEORY AND PRACTICE OF THIRDWAVE REGIONAL ECONOMICDEVELOPMENT STRATEGIESLori DickesClemson University, [email protected]
Follow this and additional works at: https://tigerprints.clemson.edu/all_dissertations
Part of the Public Affairs, Public Policy and Public Administration Commons
This Dissertation is brought to you for free and open access by the Dissertations at TigerPrints. It has been accepted for inclusion in All Dissertations byan authorized administrator of TigerPrints. For more information, please contact [email protected].
Recommended CitationDickes, Lori, "THE THEORY AND PRACTICE OF THIRD WAVE REGIONAL ECONOMIC DEVELOPMENT STRATEGIES"(2011). All Dissertations. 796.https://tigerprints.clemson.edu/all_dissertations/796

THE THEORY AND PRACTICE OF THIRD WAVE REGIONAL ECONOMIC
DEVELOPMENT STRATEGIES
_______________________________________________________________
A Dissertation
Presented to
the Graduate School of
Clemson University
_______________________________________________________________
In Partial Fulfillment
of the Requirements for the Degree
Doctor of Philosophy
Policy Studies
_______________________________________________________________
by
Lori A. Dickes
August 2011
_______________________________________________________________
Accepted by:
Dr. David Lamie, Committee Chair
Dr. William Gartner
Dr. David Hughes
Dr. Kenneth Robinson
Dr. Holley Ulbrich

i
ABSTRACT
In an environment of globalization and rapid technological change,
entrepreneurship and innovation have become important objectives of state, regional, and
local economic development policy. Entrepreneurial focused economic development
strategies target state and regional efforts towards policies –such as cluster development,
business incubators, regional trade associations, and developing local entrepreneurs and
small businesses. If it is imperative that states and regions pursue these strategies,
researchers must begin to classify the types of programs that states and localities are
using, as well as analyze and document the impact of these policies on knowledge
economy variables. This research proposes to add three new and additional elements to
this relatively young research stream. This dissertation will address three distinct
components of entrepreneurial development policy effort.
Manuscript one clarifies and defines a research agenda on business incubators.
Applying the incubator concept to the economic theories of network and agglomeration
economies offers new insights concerning incubators and local economic growth. From
this a research agenda based on a framework of applied economic theories is developed,
along with a detailed outline of important future research questions. The second
manuscript explores the scope of local and regional entrepreneurial development efforts
across South Carolina. This paper reviews the relevant entrepreneurial literature and
discusses the entrepreneurial landscape in South Carolina. A statewide survey and
appropriate statistical modeling techniques are used to better understand the factors that

ii
influence the probability of a community having/not having an entrepreneurial
development program. The third paper begins with a review of the literature on the
economic benefits of municipal investment in advanced ICT infrastructure investment,
small business uptake of advanced ICT and e-business technology, and an overview of
the legal barriers that states have enacted that restrict local and regional investments in
advanced ICT infrastructure. Further, a series of panel regressions are used to estimate
the impact of ICT policy restrictions on state small business growth and entrepreneurial
activity. Overall, if our nation and each state are to fully embrace a ―knowledge-
economy,‖ understanding the impact the policy environment may have on a variety of
economic development indicators is important for the ongoing research agenda.

iii
DEDICATION
This dissertation is dedicated to the following people:
My husband, Keith P. Housand, who has been an unfailing source of love,
comfort, therapy, and encouragement. He has been my biggest cheerleader.
My children, Ally, Tim and Sam, who have sacrificed six years of time and
experiences with their mother but have remained my constant cheerleaders in
spite of it. They have also grown into three wonderful young people—I am
honored to be their mom.
In memory of my grandmother, Bonnie Jordan Dickes, who emphasized the
importance of education for men and women and led the way by being
valedictorian of her 1942 Coleridge, Nebraska high school class.
My father, Allen L. Dickes, who has been my academic role model and who has
always encouraged and supported my intellectual pursuits. I could not have done
this without his on-call professional and academic advice.
My mother, Jeannette K. Suber, who was the only women on scholarship in her
1961 pharmacy class at Drake University. Her professionalism and dignity in a
man‘s world has always inspired me. I am grateful for her steadfast love and
support of my pursuits.
My aunt, Barbara D. Halgren, who has been a constant source of love, support,
and words of encouragement. She is always willing to be my on-call therapist.
Her love anchors and sustains me.

iv
Numerous friends---but especially Elizabeth Crouch, Alyson Osef, and Jennifer
Watne—who have helped me in more ways than I can mention. They have been
babysitters, cooks, housekeepers, daughters, and most of all friends who have
constantly supported me.

v
ACKNOWLEDGMENTS
I would like to thank all of those people who helped make this dissertation possible.
First, I would like to thank my advisor, Dr. Dave Lamie, for his guidance,
encouragement, and support. I am grateful for your steady support and advice, as the road
was at times bumpy. I would also like to thank my committee members Dr. Bill Gardner,
Dr. David Hughes, Dr. Kenneth Robinson, and Dr. Holley Ulbrich for their helpful
insights, comments, and suggestions. I am grateful for all of their expertise and the time
they committed to my dissertation.
Additionally, I would like to thank Dr. Billy Bridges for his ongoing statistics
expertise and tutoring. His technical expertise and academic encouragement have been
invaluable. I could not have done this without him.
I would also like to acknowledge the faculty and staff of the Strom Thurmond
Institute and the Policy Studies program for their encouragement and support. Many
thanks to Dr. Jeff Allen who has been an incredible mentor, friend, and truly the best boss
I have ever had. Additional thanks to the South Carolina Water Resources Center for
assisting me with professional editing and formatting support.
Many, many thanks to Sandra for being the best dissertation editor a girl could
want. Her tireless work until the final hour helped me to get to the end of this road.
Finally, thanks to fellow graduate students in the Applied Economics, Economics
and Policy Studies programs for their ideas and suggestions throughout this process.
There are too many to name here but your intellectual curiosity, humor, problem solving

vi
ability, and most importantly, friendship, inspire me every day!

vii
TABLE OF CONTENTS
ABSTRACT ......................................................................................................................... i
DEDICATION ................................................................................................................... iii
ACKNOWLGMENTS ........................................................................................................ v
TABLE OF CONTENTS .................................................................................................. vii
LIST OF TABLES .............................................................................................................. x
LIST OF FIGURES ......................................................................................................... xiii
CHAPTER ONE: INTRODUCTION ................................................................................. 1
Entrepreneurship ........................................................................................................... 15
Research Description .................................................................................................... 15
Manuscript One ......................................................................................................... 15
Manuscript Two ........................................................................................................ 18
Manuscript Three ...................................................................................................... 19
CHAPTER TWO: A THEORY CENTERED APPROACH FOR BUSINESS
INCUBATORS: A RESEARCH AGENDA FOR THE FUTURE .................................. 24
Introduction ................................................................................................................... 24
A Conceptual Model of Incubation ............................................................................... 25
The Landscape of Business Incubators ......................................................................... 32
Examining Business Incubators .................................................................................... 37
Spatial Economics and Networks ................................................................................. 52
The Incubator as a Network .......................................................................................... 55
O-Ring Theory Viewed from a Network Lens ............................................................. 59
Incubators using an O-Ring Application ...................................................................... 61

viii
Agglomeration and Information Spillover .................................................................... 64
Incubators as ―Quasi-clusters‖ ...................................................................................... 67
Networks and Agglomeration ....................................................................................... 72
A Research Agenda for Incubation ............................................................................... 75
CHAPTER THREE: THE IMPACT OF POLICY PERCEPTIONS ON LOCAL
ENTREPRENEURIAL DEVELOPMENT IN SOUTH CAROLOINA .......................... 84
Introduction ................................................................................................................... 84
Literature Review.......................................................................................................... 86
Local Economic Development and Entrepreneurship .................................................. 91
Entrepreneurial Policy .................................................................................................. 94
The Status of Business Recruitment ........................................................................... 106
Community Development Corporations ..................................................................... 113
Entrepreneurial Development ..................................................................................... 115
Pages and Poole‘s Understanding Entrepreneurship as an Economic Development
Strategy: A Three State Survey................................................................................... 119
State Entrepreneurial Policy ....................................................................................... 125
South Carolina Entrepreneurial Profile ....................................................................... 133
Methodology and Survey Summary ........................................................................... 136
Model Estimation and Results .................................................................................... 148
Conclusions ................................................................................................................. 169
CHAPTER FOUR: PARALYZED STATE TECHNOLOGY INVESTMENTS AND
THE IMPACT ON STATE SMALL BUSINESS AND ENTREPRENEURIAL
ACTIVITY: A FIRST LOOK ......................................................................................... 172
Introduction ................................................................................................................. 172
Evidence of the Benefits of Broadband Investment ................................................... 176
Advanced ICT and Utilization by Small and Medium Sized Enterprises (SMEs) ..... 195
Methodology ............................................................................................................... 204
South Carolina Telecommunications Legal and Policy Environment ........................ 204
Local Interviews.......................................................................................................... 208

ix
A Survey of South Carolina Electric Cities (MEUs) .................................................. 209
Cross Sectional/Panel State Regression Model .......................................................... 218
Regression Results ...................................................................................................... 231
Conclusions ................................................................................................................. 242
CHAPTER FIVE: SUMMARY, CONCLUSIONS, AND FUTURE RESEARCH ...... 244
Business Incubators .................................................................................................... 246
Policy Perceptions and Local Entrepreneurial Development In South Carolina ........ 249
State Technology Investments .................................................................................... 256
Conclusions and Future Research ............................................................................... 262
APPENDICES ................................................................................................................ 265
APPENDIX ONE: Entrepreneurship and Community Based Economic Development
Survey ......................................................................................................................... 266
APPENDIX TWO: Entrepreneurial Development Survey Correlation Matrix .......... 274
APPENDIX THREE: Overview of State Policy Restrictions .................................... 285
APPENDIX FOUR: MEU Survey Results ................................................................. 286
APPENDIX FIVE: Bivariate Relationship between State Policy Restrictions and
Dependent Variable .................................................................................................... 287
APPENDIX SIX: Additional Regression Models ...................................................... 291
REFERENCES ............................................................................................................... 295

x
LIST OF TABLES
Table 1.1: Rural Entrepreneurial Types ............................................................................ 10
Table 2.1: Allen and McCluskey's (1990) Continuum of Incubator Development .......... 42
Table 2.2: Industrial Clusters ............................................................................................ 74
Table 2.3: Hackett and Dilts Research Agenda ................................................................ 76
Table 2.4: Research Questions Using a Network Economies Approach .......................... 76
Table 2.5: Research Questions Using an Agglomeration Economies Approach.............. 78
Table 2.6: Research Questions Using an Economic Impact Approach ............................ 81
Table 3.1: Economic Development Assets in Affluent and Low-Income
Communities ............................................................................................................. 88
Table 3.2: Participants in Local Government Economic Development Activities ......... 111
Table 3.3: Local Government Incentive Offerings ......................................................... 112
Table 3.4: Local Government Small Business Assistance.............................................. 113
Table 3.5: 2008 State Technology and Science Index: Georgia, North Carolina,
and South Carolina .................................................................................................. 129
Table 3.6: 2007 Development Report Card: South Carolina .......................................... 131
Table 3.7: 2008 State New Economy Index: South Carolina ......................................... 133
Table 3.8: Percentage Change of Firms, Establishments, Employment and Payroll
by South Carolina Firm Size ................................................................................... 134
Table 3.9: South Carolina‘s Top Business Churning Counties ...................................... 135
Table 3.10: Survey Sample Organization Types, Average Budgets and Numbers
of Employees. ......................................................................................................... 139
Table 3.11: Largest County Survey Respondents ........................................................... 141
Table 3.12: Future Community Issues Ranked as Most Important ................................ 142

xi
Table 3.13: Local and/or Regional Access to Entrepreneurial Programs ....................... 147
Table 3.14: Entrepreneurial Summary Statistics ............................................................ 153
Table 3.15: Entrepreneurial Development: Significant Independent Variables ............. 155
Table 3.16: Model Tests: Sub-Sample Economic Developers excluding CDC‘s .......... 156
Table 3.17: Likelihood Ratio Tests and Parameter Estimates: Sub-Sample Economic
Developers excluding CDC‘s ................................................................................. 156
Table 3.18: Model Tests: Sub-Sample CDC‘s ................................................................ 157
Table 3.19: Likelihood Ratio Tests and Parameter Estimates: Sub-Sample CDC‘s ...... 157
Table 3.20: Odds/Ratios: Sub-Sample Economic Developers excluding CDC‘s ........... 159
Table 3.21: Odds/Ratios: Sub-Sample CDC‘s ................................................................ 160
Table 3.22: Model Tests: Full Model ............................................................................. 162
Table 3.23: Likelihood Ratio Tests and Parameter Estimates: Full Model .................... 163
Table 3.24: Odds/Ratios: Full Sample ............................................................................ 165
Table 3.25: Equation 1 Estimates with 𝑿𝒊, = Organizational Dummy ........................... 166
Table 4.1: States Lagging in Broadband Accessibility ................................................... 189
Table 4.2: Home Broadband Adoption Trends ............................................................... 191
Table 4.3: Internet Access for Manufacturing Plants, 2000 (Percent) ............................ 200
Table 4.4: SME e-business adoption rates in 2001 – selected countries ........................ 201
Table 4.5: Summary Statistics for Dependent Variables ................................................ 220
Table 4.6: Small Business/Entrepreneurial Independent Variables ................................ 224
Table 4.7: Individual Regression Model of ICT Restrictions and the Number of
New Companies ...................................................................................................... 233

xii
Table 4.8: Individual Regression Model of ICT Restrictions and the Number of
Patents ..................................................................................................................... 234
Table 4.9: Patent Covariate Tests: Dillon/Home Rule................................................... 235
Table 4.10: New Company Covariate Tests: Dillon/Home Rule .................................. 235
Table 4.11: New Company Covariate Tests: Household Computers and General ICT
Restrictions ............................................................................................................. 235
Table 4.12: New Company Covariate Tests: Household Computers and Specific
Policy Restrictions .................................................................................................. 236
Table 4.13: Individual One-tailed T-tests of Significant Independent Variables by
State and Rule Type ................................................................................................ 237
Table 4.14: Regression Estimates for New Business Activity ....................................... 239
Table 4.15: Marginal Effects of ICT Restrictions in Dillon or Home Rule States
Percentage of State Household with computers...................................................... 240
Table 4.16: Regression Estimates for New Business Job Growth .................................. 241
Table A4.1: Question: How important is ICT to the future of these different
community sectors. ................................................................................................. 286
Table A4.2: Question: Rate the importance of using Information Communications
Technology (ICT) to advance the following community strategies as they relate to
business and economic development.. .................................................................... 286
Table A6.1: Regression Estimates for Technology Companies ..................................... 291
Table A6.2: Regression Estimates for State Patent Activity .......................................... 293
Table A6.3: Regression Estimates for the Number of New Companies ......................... 294

xiii
LIST OF FIGURES
Figure 1.1: Early Stage Entrepreneurs as GDP Per Capita Rises. .................................... 14
Figure 2.1: Firm Life Cycle and Business Incubators ...................................................... 28
Figure 2.2: Position of the Business Incubator. ................................................................ 30
Figure 3.1: Number of States Using Specific State Economic Development
Incentives; 1976-1996 ............................................................................................. 108
Figure 3.2: State Tax Incentives for Business: Changes between
1977-1998 ............................................................................................................... 109
Figure 3.3: State Financial Incentives for Business Attraction: Changes between
1977-1998 ............................................................................................................... 110
Figure 3.4: Respondents Service Areas .......................................................................... 140
Figure 3.5: Odds/Ratio of Organizational Dummy vs. Seed Capital Value ................... 166
Figure 4.1: State Policy Restrictions to Local Involvement in Advanced ICT
Infrastructure. .......................................................................................................... 194
Figure 4.2: Community ICT Planning Efforts ................................................................ 213
Figure 4.3: Critical or Very Important Barriers to Municipal Involvement in ICT
Infrastructure Investments ...................................................................................... 215
Figure 4.4: Bivariate Relationship between State Policy Restrictions and New
Companies............................................................................................................... 232
Figure 4.5: Bivariate Relationship between State Policy Restrictions and Change
in New Companies .................................................................................................. 233
Figure A5.1: Bivariate Relationship between State Policy Restrictions and New
Business Job Growth............................................................................................... 287
Figure A5.2: Bivariate Relationship between State Policy Restrictions and Number
of Technology Companies ...................................................................................... 288

xiv
Figure A5.3: Bivariate Relationship between State Policy Restrictions and Number
of IPOS.................................................................................................................... 289
Figure A5.4: Bivariate Relationship between State Policy Restrictions and Number
of Patents ................................................................................................................. 290

1
CHAPTER ONE
INTRODUCTION
In today‘s global marketplace, evidence continues to mount that economic
development models emphasizing industrial recruitment, or ―smokestack chasing‖, do not
provide the benefits that states and communities hope for (Shaffer et al., 2004). Further,
there is increasing evidence that these strategies are a ―zero-sum‖ game as states and
communities compete to provide the ―best‖ incentive‖ packages for new firm
recruitment. The rapid pace of technological change, the competitiveness of the global
marketplace, and unique qualities of individual communities and regions further suggest
that a community cannot depend on one economic development program. In order to
achieve long-run sustainable economic development, most communities will require a
combination of key development strategies, a boutique approach, where the development
plan is tailored to individual community needs and assets.
Historical drivers of economic development focused on improving a region‘s
export base through industrial restructuring and/or enhancing firm scale economies
through cost competition. Strategies of economic development from the 1950‘s to the
1990s focused on financial incentives, industrial consolidation, industrial parks and other
forms of cost reduction. In the 1970‘s and 1980‘s economic development strategies
largely emphasized ―tax abatements, investment credits, low-interest loans, land write-
downs, and labor-training grants to reduce labor and operating costs and lure
manufacturing plants (Turner, 2003).‖ Bradshaw and Blakely (1999) call this period of

2
―smokestack chasing‖ the first wave of industrial recruitment efforts. As the 1980‘s wore
on, ―second wave‖ development strategies, including business creation support,
development of business incubators, increasing investment capital, and providing other
types of technical assistance to local, existing businesses increased in popularity
(Bradshaw and Blakely, 1999). As second wave development approaches have taken
hold, industrial recruitment strategies have continued to evolve and remain a popular
policy tool.
As the 1980‘s ended and the 1990‘s began, economic development strategies
adopted a more entrepreneurial spirit (Turner, 2003). Regional scientists argue the forces
of industrial restructuring and globalization precipitated a new wave of economic
development, the so called ―third wave‖ of economic development. In today‘s third wave
of economic development all communities must create and maintain a competitive
advantage in the face of dynamic, persistent change. Innovation and entrepreneurship are
argued to be the major drivers of regional economic growth and development. Strategies
for achieving regional competiveness emphasize business creation, firm clustering and
innovative research and development. Eisinger (1988) observes that this shift in
economic development policy generated additional support for research and development
facilities, export promotion, technology transfer programs, and investment in venture
capital funds.
Entrepreneurial focused economic development strategies target state and regional
efforts towards policies –such as cluster development, business incubators, regional trade
associations, and developing local entrepreneurs and small businesses. Moreover,

3
traditional indicators of regional economic competitiveness (e.g. natural resource
endowments, labor costs, taxing policy, cheap capital, and traditional infrastructure) are
giving way to new innovation-focused indicators (e.g. number of patents, research and
development expenditures, and the availability of knowledge workers). The keys to
success in this new era of development highlight the importance of leveraging unique
regional assets, including human capital, educational resources, and/or natural amenities
among others. Dabson argues that ―competitiveness is not the exploitation of location,
natural resources, or low-cost workers; rather, it is converting these assets into
intellectual capital and added value (2007, p.27).‖
The importance of intellectual capital, or knowledge, in this economic era is one
of the reasons it has also been classified as the ―knowledge economy.‖ This economic
environment rewards individuals and firms that leverage knowledge resources in to value
added production of goods and services. Moreover, knowledge, or intellectual capital, has
potential spillover impacts across firms and regions as individuals and firms interact in
informal and formal networks. The emphasis on intellectual capital and knowledge
spillovers has the potential to further stimulate an environment of innovation and
entrepreneurial activity.
One of the critical features of the new economy is that there is not a one size fits
all strategy for local and regional economic development. Regional scientists and policy
makers are increasingly advocating locally-based or ―home-grown‖ innovative solutions
to local and regional challenges. The notion of locally centered, community economic
development is backed by a growing body of theory and research that critically examines

4
the ―bigger is better‖ model and emphasizes the organizational depth and breadth of
small-scale, locally controlled economic enterprises (Piore and Sabel, 1984; Tolbert et al.
1998: Robinson, Lyson, and Christy, 2002). The ideas of asset-based community
development supports similar conclusions concerning the strength and importance of
local assets for successful economic development efforts (Kretzmann and McKnight,
1993). Entrepreneurs have always been an important component in a community‘s
economic profile, but their move to the front and center of local economic development is
a paradigm shift. This thinking suggests that locally driven entrepreneurship development
efforts are critical for reversing stagnant economic conditions and sustaining long term
economic growth and development by creating wealth and jobs through locally owned
and operated firms.
The role of entrepreneurs throughout United States (U.S.) economic history has
been well documented (Suarez Villa, 1989). Academic research on entrepreneurship can
be traced back to Schumpeter‘s (1934) ideas on the dynamic nature of economic growth.
In Schumpeter‘s model of creative destruction, entrepreneurs destroy a market‘s static
equilibrium as they introduce new ideas, products, and processes into the marketplace.
Interest in entrepreneurship continued at Harvard University in the 1920‘s with business
history studies (Soltow, 1968) and the creation of the Research Center in
Entrepreneurship History in 1948. With the exception of Schumpeter‘s early work, much
of the work on entrepreneurship throughout the first half of the twentieth century was
focused on the role of individual entrepreneurs and less on the relationship of
entrepreneurship to economic growth and development.

5
The dramatic increase in entrepreneurship research is driven by growing evidence
that entrepreneurs are critical sources of local economic growth and innovation. Reynolds
et al. (1999) argues that entrepreneurship explains one third of the difference in the
economic growth rates between countries. The OECD (2003) reports that high-growth
small and medium-sized businesses create the majority of new jobs throughout the world.
Autio and Hancock (2005), as a part of the Global Entrepreneurship Monitor (GEM),
define and analyze High Expectation Entrepreneurial activity (HEE). HEE‘s are defined
as new businesses that expect to have a minimum of 20 employees within 5 years. In
their analysis, these firms represented 9.8 percent of the total sample, however, they are
estimated to be responsible for 75 percent of the total jobs created by all new start-up
firms. However, these studies also caution that the wealth and income benefits of
entrepreneurship will only come from approximately 1 in 10 or 1 in 20 new ventures.
Davis et al. (2005) indicate that entrepreneurial firms are a critical part of U.S.
business activity. They argue these firms are the nexus of future employment
opportunities and are often the fastest growing firms in the economy. From 1990-2003,
the U.S. Census Bureau reports that small firms with fewer than 20 employees created
almost 80 percent of net new jobs and employed 18.4 percent of all U.S. workers. Small
business start-ups over this same time period represented approximately 13 percent of
total new job growth among small firms (Edmiston, 2007). Similarly, the Council of State
Policy and Planning Agencies (CSPA) estimates that ―88 percent of net new job growth
in the rural U.S. came from new businesses‖ (CSPA, 1989, p1).
However, the nature of small business growth is not as clear as this research

6
indicates. In 2000, of the 21 million employer and nonemployer firms in the U.S.,
approximately 76% were nonemployer firms, but these firms only represented 4 percent
of total business revenues (Dabson, 2007). Similarly, small business represented 25
percent of total employer firms and less than 5 percent of business revenues, while young
businesses (less than four years old) represented approximately 35 percent of employer
business and less than 20 percent of revenues. From a job quality perspective, the
evidence is unequivocal; large firms offer better jobs and higher wages than small firms
(Bureau of Labor Statistics, www.bls.gov, 2006). Mills and Bhandari (2003) find that
small business owners and their employees are considerably less likely to have employer-
based health insurance policies. The Bureau of Labor Statistics National Compensation
Survey (2006) reports that workers at small firms are generally likely to receive lower
retirement benefits, reduced insurance benefits, and reduced eligibility for disability and
worker‘s compensation insurance (www.bls.gov). Research also reveals that small firms
often experience greater volatility in their job offerings, which results in greater turnover
and more job separations or dissolutions (Anderson and Meyer, 1994; Davis,
Haltiwanger, and Schuh, 1996; Groothuis, 1994).
While job creation and job growth are often the main priorities of economic
development, one of the identified benefits of entrepreneurship is the resulting innovation
that can be stimulated in an entrepreneurial environment. This is the classical
Schumpterian (1942) argument of entrepreneurship. It is through the process of creative
destruction that old goods and services, tired businesses and inefficient or ineffective
organizations are swept away and in their place the forces of innovation create new

7
products, services, businesses and organizations. Edmiston (2007) reports that small
businesses are often held to be more innovative than larger companies because they have
less bureaucracy and more flexible employment, operate in more competitive markets,
and may provide stronger personal rewards to entrepreneurs and their employees. Vossen
(1998) contends the productivity benefits from small firm production can be substantial
when compared against medium and large firm counterparts. Confirming this, the
research concludes that small businesses produce more innovation per given amount of
research and development than large firms.
Research supports that both small and large firms are innovative but in different
ways and in different industries. Schumpeter (1942) asserted that in industries with high
degrees of concentration (pharmaceuticals, automotive, etc.), larger firms would be better
positioned to invest in innovations. This largely stems from the ability of these firms to
invest substantial resources in research and development. However, large firms are often
more effective at leveraging innovations to a final product and generating network
synergies because of easier access to the people and technology that support an
innovative environment (Vossen, 1998). The reality is that all sizes of firms are critical to
business dynamics. There are also important synergies between large and small firms that
are critical to enhanced innovative activity and small and large firm productivity.
Entrepreneurs in the Silicon Valleys of the world leave big firms to start spin off
companies; large firms buy innovative ideas and products from small firms and create
marketable products and services; and small firms often benefit enormously from the
basic or foundation research and development of large firms that allow for specific types

8
of spin-off innovative activity. Just as Schumpeter described, the process of creative
destruction, at its best, generates a synergistic, virtuous cycle of both large and small firm
innovative activity.
At an individual level, being a successful entrepreneur is largely determined by
wealth, education, and age (Bates, 1993). Psychologists indicate that entrepreneurs
exhibit Type A characteristics, and have a high tolerance for risk taking and ambiguity
(Gladwin, et al, 1989). While every population contains some proportion of
entrepreneurs, the extent of entrepreneurship in any community or region is also
dependent on the cultural, financial, and educational support that entrepreneurs receive
within a community. Friedman (1986) upholds that state and local support of any or all of
these key variables can impact local and regional entrepreneurial development.
Every location has entrepreneurs and each segment of the population has a
percentage of individuals that are entrepreneurial. However, entrepreneurship clearly
varies across states and regions and not all places are equally able to support and enhance
the cultural, educational, financial, and institutional needs of local entrepreneurs (Birch,
1987). Moreover, individuals have different motivations and goals in becoming
entrepreneurs. There are several different models that examine why individuals become
entrepreneurs. According to Sherrard Sherrarden et al. (2004), traditional human capital
theory does not adequately explain why individuals become entrepreneurs. Friedman
(1986) argues that individuals become entrepreneurs because of some critical need or
unrecognized opportunity. The argument is often made that people become entrepreneurs
when they have lost a job or had some other major life change. Those who seek to

9
become entrepreneurs because of an unrecognized opportunity often do so for a variety of
reasons including the desire for personal autonomy, flexibility, personal satisfaction and
growth, and professional freedom (Sherrard Sherrarden et al., 2004). In addition, there
are also local-hero entrepreneurs who take an unrecognized opportunity and turn it into
the next ―big idea.‖ These individuals start new business to ―appropriate the expected
value of their new ideas, or potential innovations (Audretsch, 2002, p26).‖ No matter the
reasons, every entrepreneur can make a substantial positive impact on their local and
regional community.
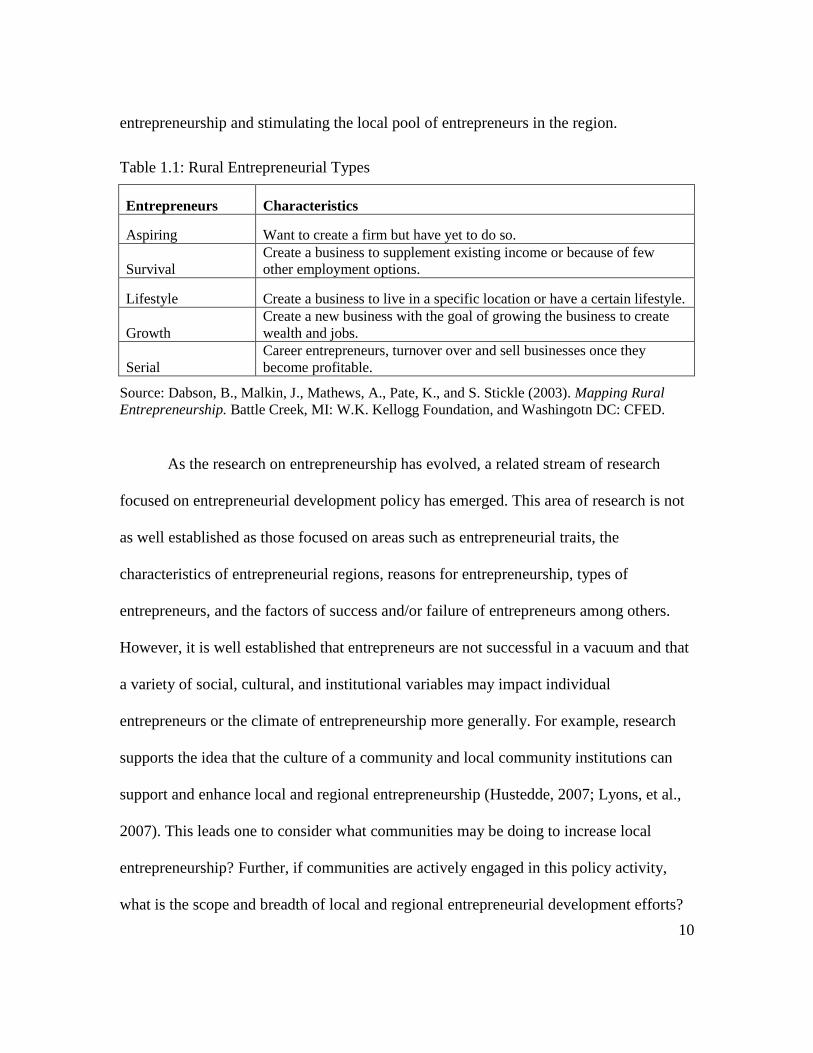
There have been a variety of classifications describing the types of entrepreneurs
and their related goals and motivations for entrepreneurship. Table 1.1 describes the five
different types of entrepreneurs highlighted by Dabson et al. (2003) in their description of
rural entrepreneurs. Even though these are descriptions of rural entrepreneurs, these types
can be identified in any community or region. It is important not to disregard the impact
of ‗aspiring‘, ‗survival‘, or ‗lifestyle‘ entrepreneurs, but it is ‗growth‘ and ‗serial‘
entrepreneurs who are of the most interest to economic development professionals.
Growth and serial entrepreneurs have the potential to yield the Schumpeterian benefits of
innovation, high growth, and high return on investment. Moreover, these are the
entrepreneurs who have the potential to generate the most substantial benefits to the
community and region. No matter what the type or reason for entrepreneurship, the
objective for policy development is to encourage entrepreneurs who will participate in
promoting and sustaining regional growth and development. As well, all entrepreneurs
have the potential to be important contributors to creating a local climate of
10
entrepreneurship and stimulating the local pool of entrepreneurs in the region.
Table 1.1: Rural Entrepreneurial Types
Entrepreneurs Characteristics
Aspiring Want to create a firm but have yet to do so.
Survival Create a business to supplement existing income or because of few
other employment options.
Lifestyle Create a business to live in a specific location or have a certain lifestyle.
Growth Create a new business with the goal of growing the business to create
wealth and jobs.
Serial Career entrepreneurs, turnover over and sell businesses once they
become profitable.
Source: Dabson, B., Malkin, J., Mathews, A., Pate, K., and S. Stickle (2003). Mapping Rural
Entrepreneurship. Battle Creek, MI: W.K. Kellogg Foundation, and Washingotn DC: CFED.
As the research on entrepreneurship has evolved, a related stream of research
focused on entrepreneurial development policy has emerged. This area of research is not
as well established as those focused on areas such as entrepreneurial traits, the
characteristics of entrepreneurial regions, reasons for entrepreneurship, types of
entrepreneurs, and the factors of success and/or failure of entrepreneurs among others.
However, it is well established that entrepreneurs are not successful in a vacuum and that
a variety of social, cultural, and institutional variables may impact individual
entrepreneurs or the climate of entrepreneurship more generally. For example, research
supports the idea that the culture of a community and local community institutions can
support and enhance local and regional entrepreneurship (Hustedde, 2007; Lyons, et al.,
2007). This leads one to consider what communities may be doing to increase local
entrepreneurship? Further, if communities are actively engaged in this policy activity,
what is the scope and breadth of local and regional entrepreneurial development efforts?

11
There is considerable publicity and discussion about entrepreneurship at the state and
federal levels, but entrepreneurship is local and regional; what is happening from a policy
perspective at these lower levels? If there is a place for public policy in entrepreneurial
development, a related corollary asks how local economic development policy can
contribute to local entrepreneurship and moreover, what policy efforts yield the highest
private and social returns.
A burgeoning research stream has begun focusing on types of entrepreneurial
development policies, along with assessing the strengths and potential outcomes of these
policy efforts. Pages and Poole (2003) define entrepreneurial development as ―the
practice of encouraging the creation and growth of start-up companies (2003, p1).‖ As
states and regions have pursued entrepreneurial oriented policies, they have utilized a
diverse spectrum of policy tools. As a result, there is not a well defined core of
entrepreneurial development best practices. However, Pages (2006) upholds that most
entrepreneurial development programs share one, or some combination, of policy
objectives: 1) increasing new businesses; 2) increasing the rate of growth of new
businesses; and 3) enhancing the entrepreneurial climate. Additionally, several policy
areas have emerged as major themes for entrepreneurial policy: 1) access to financial
capital; 2) business incubators; 3) reform of business regulations; 4) technology
development and infrastructure and 5) education and entrepreneurial awards (Pages,
2006). With this said there remains no clear definition of entrepreneurial policy and little
understanding of policy best practices.
If it is imperative that as states and regions pursue these strategies, researchers

12
begin to classify the types of programs that states and localities are using. Additionally, it
is imperative to begin to analyze and document the impact of these policies on knowledge
economy variables. This research proposes to add three new and additional elements to
this relatively young research stream. This dissertation will address three distinct
components of entrepreneurial development policy efforts through the three manuscripts
described below.
This manuscript helps address these questions by exploring the scope of local and
regional entrepreneurial development efforts across South Carolina. The first section of
the paper reviews a wide and diverse range of literature on entrepreneurship,
entrepreneurship policy, and industrial recruitment policy. This is followed by a
comparison and discussion of how South Carolina fares in state rankings of
entrepreneurship and innovation. While state rankings have their methodological
problems, they provide a basic foundation for understanding how states are faring in the
new economy relative to other states and regions. The third section of the paper outlines
the methodology and reviews statewide survey results. The final section of the paper
presents a logit model and discusses results of factors that influence the probability of a
community having/not having an entrepreneurial development program. This research
begins to clarify the nature of entrepreneurial economic development policy in local
communities. Equally as important, this research begins to describe the types of barriers
that may exist for local and regional communities in implementing ―new economy‖
development strategies.
The overwhelming majority of states have invested substantial time, financial and

13
human capital resources towards the development of organizational capacity to manage
state and regional business incentives. As well, the competition for firms among states
often takes on a game theoretic framework which makes many states reluctant to give up
the game. State and local development officials confirm they are increasingly concerned
with the effectiveness of business incentive policy but the nature of interstate competition
makes these policies difficult to reduce or eliminate. As a result, industrial recruitment
continues to play an important role in state economic development policy. However,
paradigm shifts in economic development have resulted in substantial policy transitions
over the past several decades. Old fashioned industrial recruitment continues to remain an
important part of a state‘s economic development profile but a whole range of additional
policy approaches are now held to be an important part of a region‘s economic
development toolbox.
Industrial restructuring over the past several decades has resulted in a dramatic
shift away from large scale manufacturing and traditional natural resource-based
industries. At the same time, globalization and technological change have created
opportunities for increased specialization within and across industries. Globalization has
led to intense worldwide competition for profit and market share. It has also forced a
transition in the way that economic activity is organized. This new industrial order is
characterized by smaller, flexible manufacturing, smaller production runs, and increased
specialization. The utilization of technological business processes in increasingly
specialized, niche manufacturing markets is rewarded. The nature of this economic
activity is arguably more conducive to small flexible firms that can rapidly meet the
14
changing demands of consumers and suppliers.
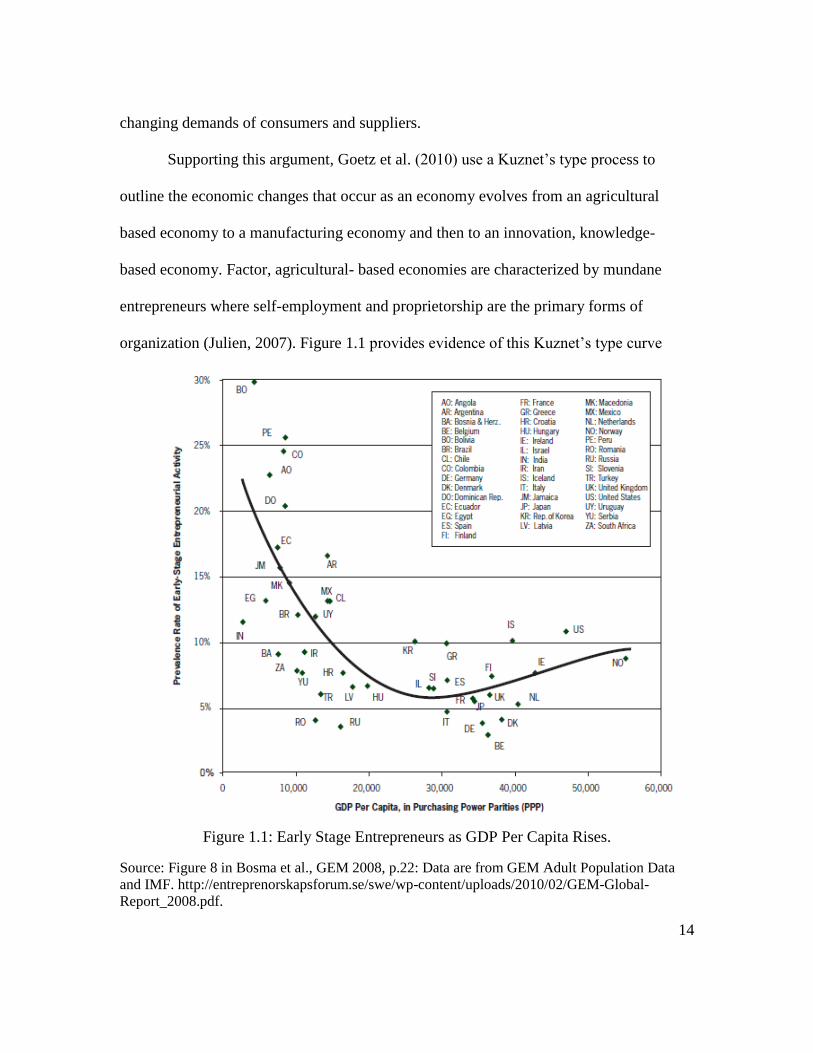
Supporting this argument, Goetz et al. (2010) use a Kuznet‘s type process to
outline the economic changes that occur as an economy evolves from an agricultural
based economy to a manufacturing economy and then to an innovation, knowledge-
based economy. Factor, agricultural- based economies are characterized by mundane
entrepreneurs where self-employment and proprietorship are the primary forms of
organization (Julien, 2007). Figure 1.1 provides evidence of this Kuznet‘s type curve
Figure 1.1: Early Stage Entrepreneurs as GDP Per Capita Rises.
Source: Figure 8 in Bosma et al., GEM 2008, p.22: Data are from GEM Adult Population Data
and IMF. http://entreprenorskapsforum.se/swe/wp-content/uploads/2010/02/GEM-Global-
Report_2008.pdf.

15
Entrepreneurship
Since the early 1970‘s, the changing economic landscape of communities across
the nation has led to an increase in entrepreneurship research. Walzer and Athuyaman
(2007) indicate that from 1969 to 2007 a general search for entrepreneurship on the
EconLit database yields 1388 records. Moreover, research on entrepreneurship runs
across academic disciplines; economics, management, psychology, sociology, and others.
Low (2001) classifies entrepreneurship research as a potpourri of themes and orientations
that ultimately makes consistent classification difficult.
Research Description
Manuscript One
With dramatic changes in regional and national economies around the world,
Pulver‘s (1986) community economic development strategies remain unchanged; ―attract
outside investment, improve the efficiency and competitiveness of existing business, and
encourage the creation of new enterprises (Markley and McNamara, 1995, p.1259).‖
However, industrial restructuring and globalization have put increasing pressure on
regions to find the economic development panacea of the day. Industrial recruitment and
other popular development strategies of the past remain in widespread use, but there is
increasing emphasis placed on a new generation of policy tools. These policy measures
continue to emphasize traditional economic development goals like job creation,
economic diversity, competitive advantage, workforce development and others but seek
to achieve these goals through policies that emphasize entrepreneurship and innovation as

16
opposed to [a] relying exclusively on business attraction and/or retention efforts. The
policy efforts that are increasingly used to support and enhance entrepreneurial activity
and innovation include, but are not limited to, business incubators, cluster development,
specific educational training programs and technology infrastructure investments.
Business incubators are one of the development approaches that are increasingly
used to facilitate new venture formation, job creation, and an enhanced entrepreneurial
climate. The idea of firm incubation is not new, but the systematic and often, public
investment in business incubation is a relatively new phenomenon. Business incubators
seek to capture the potential benefits of localization and/or agglomeration economies
within the business incubator itself. Additional benefits of business incubators include job
creation, an enhanced local entrepreneurial climate, the formation of formal and informal
networks, increased local specialization depending on the type of incubator, increased
local economic diversity and competitive advantage. While, incubators may yield
substantial economic benefits to a region, they are long-term investments and often do
not yield the returns that communities hope for in the short term. As well, because
incubators are often recipients of short and/or long term public investment, it is important
to understand the potential economic returns that these investments can provide to a
community.
Existing research on business incubators is limited in several important ways. The
National Business Incubator Association (NBIA) has sponsored and completed a number
of studies characterizing and assessing the performance of incubators (www.nbia.org).
However, as the NBIA is an international organization whose revenue depends upon the

17
promotion of this policy tool, their research results should not be exclusively relied upon
and should be considered in the context of a larger research agenda. Third party research
is also critical to ensure a more complete, unbiased picture of incubator performance and
assessment. Even taking account of NBIA studies, there remains a significant void in the
quantitative analysis of incubator performance. Additionally, Bergek and Norrman
(2008) argue there is a missing theoretical base from the literature on incubator
performance and evaluation. The literature has also lacked an appropriate foundation in
economic theory. As a result, there are ongoing research gaps in the incubator literature;
gaps that with a thorough research agenda could be filled by future research on business
incubation.
Manuscript one will clarify and define a research agenda on business incubators.
The first section of the paper provides an introduction to the concept of incubators,
followed by a review of the relevant literature. Next, key literature on the economic
theories of network and agglomeration economies is reviewed. These two approaches
offer opportunities for new insights concerning incubators and local economic growth.
Finally, a research agenda based on a framework of applied economic theories is
developed. Conclusions give further thought to these theoretical approaches and the
research agenda that could result. The primary objective of this effort is to enhance the
existing understanding of this economic development option and lay the groundwork for
an improved understanding in the future.

18
Manuscript Two
As evidence continues to mount regarding the characteristics of successful
communities and related development, it has become increasingly evident that regional
economic development necessitates a boutique approach; one that utilizes a variety of
measures deemed most appropriate for a specific community or region. Research also
supports the idea that economic development must be targeted to the local assets and
liabilities of each individual community and region. Even though the majority of
communities will continue to engage in traditional industrial recruitment strategies; what
additional policy measures are included in a state and region‘s economic development
portfolio remains an increasingly pertinent research question. For example, are
communities actively engaged in other economic development strategies such as business
retention efforts, entrepreneurial development, labor training programs, or small business
development?
As communities, states and regions have attempted to fully embrace the
knowledge economy, entrepreneurial economic development strategies have become
recognized as a legitimate and distinct regional development approach. These are
strategies that are increasingly considered a primary component of state and regional
economic development efforts. As a result, many states now have a variety of
entrepreneurial initiatives, networks, and centers to promote this development strategy
(National Governors Association (NGA), 2004; Williams, 2004). While states may have
entrepreneurial programming in place, questions remain concerning what type of
entrepreneurial programming takes place at a local and regional level. Local development

19
officials may view entrepreneurship strategies as too difficult or out of reach for their
community. As well, if communities already have access to small business development
centers or other small business related organizations, they may view additional measures
as unnecessary or redundant.
Additionally, the perceptions of local economic development officials with
respect to state policy emphasis and economic development resource allocation may
impact the practice of local entrepreneurial development. Policy perceptions and their
influence on policy practice may be instructive as there is ongoing evidence that many
communities continue to engage in traditional industrial recruitment even as evidence
mounts that these approaches may not provide the benefits that communities believe they
will. For example, if local and regional development officials perceive a strong bias
towards industrial recruitment at the state or federal levels, there may be little incentive to
pursue alternative development strategies with much vigor. If the ―new economy‖
demands that communities shift their economic development focus, understanding
whether communities are doing so and if they are not, why, is critical for a more
complete understanding of the policy landscape and the incentives behind it.
Manuscript Three
The adoption and use of advanced Information Communications Technology
(ICT) has permeated modern society and the academic literature in many fields for
several decades. New growth theory economists brought to the forefront the importance
of the addition of technology to the traditional factors of production of land, labor, and

20
capital for regional economic growth. More recently, studies dealing with the adoption,
use, and access to information communication technologies (ICTs) have come into the
forefront. Broadband access, in particular, is receiving much attention since most
computing applications with promise to deliver competitive advantage to firms and
regions require it. It is argued that affordable high-speed Internet access and a tech-savvy
workforce are essential elements, even prerequisites, to knowledge economy economic
development strategy success.
As community, regional, and state economic development professionals begin to
recognize the importance of advanced ICT infrastructure for their long-term economic
success, there remain ongoing concerns of a national, regional, and local digital divide.
Broadband access and use has dramatically expanded since the late 1990‘s but there
remain un-served and underserved communities all across America. The digital divide
exists within and across regions, among income groups, across educational attainment,
and across race and ethnic groups. Part of the reason for this digital divide is that
incumbent providers of these services often find it difficult or impossible to provide
adequate service, or service at all, to areas that may not meet their estimated revenue
requirements. It is argued that the duopolistic or monopolistic characterization of these
markets will result in many communities remaining un-served or underserved without
additional community options for Broadband infrastructure.
As a result, many communities, reeling from the effects of the twin forces of
globalization and urbanization, are beginning to consciously take steps toward enhancing
their access to advanced ICT infrastructure and enhancing the human skills to effectively

21
use this technology. These communities have begun to explore and undertake substantial
ICT investments believing that this is a requirement for their community to remain
competitive in the twenty first century. While, there are examples of successful
community Broadband projects, there continue to be substantial state barriers to these
investments. To date, there are sixteen states that have existing barriers to community
investments in advanced ICT and in some cases, states prohibit them outright.
Additionally, each year for the past several years, states without these restrictions have
proposed new restrictive legislation and states with existing legislation have sought to
increase restrictions. If this technology is critical to the success of states and regions, this
leads one to question the impact of these restrictive state policies. Further, how do these
restrictive state policies impact the ability of communities to leverage this technology to
realize the benefits from entrepreneurship, small business activity, innovation, and other
―knowledge economy‖ variables? Do states that have restrictive technology realize less
activity or reduced growth of knowledge economy variables? All of these questions and
many others are important for current and future research.
This manuscript begins by reviewing the current literature on the economic
benefits of municipal investment in advanced ICT infrastructure investment. This is
followed by an overview of the legal barriers that states have enacted that restrict local
and regional investments in advanced ICT infrastructure. A case study of the unique legal
and policy environment in South Carolina is presented as an example. The final section
of the literature review is a discussion of small business uptake of advanced ICT and e-
business technology. The second section of the paper presents a brief case study of the

22
policy implications of South Carolina‘s technology restrictions on local municipal
investments. This case study is based on a survey of South Carolina‘s electric cities. The
third and final section of the paper presents a model and results of a state level regression
analysis estimating the impact of ICT policy restrictions on state small business growth
and entrepreneurial activity. In conclusion, this research hopes to clarify the impact of the
state policy environment on a state‘s ability to realize success with new economy
indicators like small business growth, patent activity, and technology companies. If our
nation and each state are to fully embrace a ―knowledge-economy,‖ understanding the
impact and relationship between the policy environment and these variables is critical to
the ongoing research agenda.
Each of these three manuscripts begins to address critical issues related to
entrepreneurial economic development policy. The first paper outlines a research agenda
for business incubation that is well grounded in economic theory. The research seeks to
lay the groundwork for future research on the types of economic benefits generated from
the entrepreneurial environment of business incubations. The second manuscript
describes the results of a state case study on the scope and breadth of local
entrepreneurial development efforts. Additionally, the analysis of survey results begins to
provide evidence of the variables that increase the probability of local entrepreneurial
development efforts along with potential barriers to these efforts. Finally, the third
manuscript summarizes the results of a case study concerning the potential impact of
state policy on municipal investments in advanced ICT infrastructure. This research also
begins to address the potential outcomes of state policy restrictions on state small

23
business and entrepreneurial activity. Overall, these three manuscripts highlight the
importance of understanding a variety of theoretical and policy variables in our search to
further understand the potential of entrepreneurial economic development. This research,
and others like it, has the potential to increase our knowledge of the costs and benefits of
entrepreneurial policy efforts and their ability to increase local economic growth and
development.

24
CHAPTER TWO:
A THEORY CENTERED APPROACH FOR BUSINESS INCUBATORS:
A RESEARCH AGENDA FOR THE FUTURE
Introduction
Industrial restructuring and globalization have put increasing pressure on regions
to find the economic development panacea of the day. While development approaches of
the past remain in widespread use, increasing emphasis has been placed on a new
generation of policy tools. This set of policy tools emphasizes job creation through
entrepreneurship and innovation as opposed to job creation exclusively through business
attraction and/or retention. With increasing emphasis placed on the importance of small
business development and entrepreneurship, policy options to facilitate this process have
become increasingly popular. Business incubators are one of the development approaches
that are increasingly used to facilitate new venture formation, job creation, and an
enhanced entrepreneurial climate.
To fully understand which development approaches are most successful across
communities, it is necessary to have a well-developed body of literature on each
development program alternative. The current body of literature on incubator programs is
limited in several important ways. While there is a significant void in the quantitative
analysis of incubator performance, Bergek and Norrman (2008) argue there is also
missing theoretical base from the literature on incubator performance and evaluation.
More generally, incubator analysis has lacked appropriate foundations in economic
theory. Presented here is a theory-based research agenda for business incubator programs.

25
Ultimately, we hope for improved understanding of this economic development option.
The first section of the paper provides a brief introduction to the concept of
incubators, followed by a review of the relevant literature. Next, key literature concerning
network and agglomeration economies is reviewed. These two approaches offer
opportunities for new insights concerning incubators and local economic growth.
Conclusions give further thought to these theoretical approaches and the resulting
research agenda that could result.
A Conceptual Model of Incubation
The idea of business incubation is not new. It has its roots in ideas like the
planned industrial districts of the 1920's and 30's in large cities across the United States
(Lewis, 2004). However, by the 1970's, the concept of business incubation, as it is known
today, took hold in the United States (www.nbia.org). While there is much agreement
concerning the fundamental objectives of business incubators, there continues to be
definitional ambiguity over the concept of business incubation itself. Hackett and Dilts
arguably provide one of the better and more thorough definitions:
A business incubator is a shared office-space facility that seeks to provide its
incubatees (i.e. ―portfolio‖ or ―client‖ or ―tenant-companies‖) with a strategic,
value-adding intervention system (i.e. business incubation) of monitoring and
business assistance. This system controls and links resources with the objective of
facilitating the successful new venture development of the incubatees while
simultaneously containing the cost of their potential failure (Hackett and Dilts,
2004, p.57).
Since the 1970‘s, the use of business incubators as a tool for economic
development and new firm creation has spread across the U.S. and to other countries

26
around the world. As business incubators have become more popular, so to have other
similar organizational types such as science /research parks and business innovation
centers. As a result some research has treated incubators synonymously with these other
organizational types (Lindelof and Lofsten, 2004; Tamasy, 2007). At the same time there
appears to be confusion over whether an incubator is a distinct organizational unit or a
general entrepreneurial milieu. Phan et al. (2005, p.168) argues ―there has been a
recurring problem of definitions in which science parks and incubators can encompass
almost anything from distinct organizations to amorphous regions.‖ Given the ambiguous
distinction between an incubator and other similar organization types, it is important to
distinguish between the role of science/research parks and business incubators.
The majority of research assumes that business incubators are primarily used as
economic development tools for job creation, often with additional goals of stimulating
entrepreneurial and innovative activity. However, new firms are created everyday and the
majority of these will never use an incubator. We could find no research to confirm this
but we hypothesize that very few new or young firms, relative to the total number of
firms created in year, ever go through the incubation process. Given this, why is business
incubation a popular development tool and one even worth considering for future
research? As communities across the country continue to recover from the ongoing
effects of industrial restructuring, globalization, and recessionary impacts, development
tools, like incubators, clusters and innovation centers, that have the potential to yield
long-term, sustainable employment, income, and community benefits are increasingly
popular. As such, incubators are seen as one method of enhancing an already established
27
local entrepreneurial climate. Or, for communities with a weak entrepreneurial climate,
incubators are held as an important tool to jump state local and regional entrepreneurship.
One of the primary assumptions is that business incubators add value to their
communities by creating an environment for enhanced start-up firm activity and fewer
business failures. The baseline assumption is that incubators can be support organizations
for young firms (typically up to three years old) that will facilitate and encourage their
business success. Figure 2.1 provides an illustration of the role of business incubation
relative to the life-cycle of a firm. Research supports the idea that most incubators take
clients whose firms are in the early or start-up phase of the life cycle of a business (see
e.g. Aernoudt, 2004; Bhabra-Remedios and Cornelius, 2003; Grimaldi and Grandi, 2005;
Hackett and Dilts, 2004a; Lindelof and Lofsten, 2004). One of the rationales given for
incubators is grounded in the knowledge that the majority of small, new firms will fail.
According to Brooks (1986), incubators can be used to bridge the gap between the
idea phase of a young firm and the formal start-up phase. Arguably, incubators can
provide the appropriate platform for new firms to succeed by providing the needed
support mechanisms through the difficult start up phases of a business. Overall, a
business incubator‘s main objective is to support successful incubatees by improving
their chances of long term success and growth (Allen and Rahman, 1985).
The same cannot be consistently said for science and research parks or business
innovation centers. While these organizations may have fledgling start-up firms, they
often include firms that could be classified across the full spectrum of a business life

28
Figure 1.1: Firm Life Cycle and Business Incubators
Source: Vadim Kotelnikov, Ten3 Business e-Coach,
http://www.1000ventures.com/business_guide/business_incubators_main.html
cycle. Chan and Lau (2005) make no mention of the size or life cycle orientation of the
firm in their definition of a science park. Specifically, three of the six firms included in
their case studies are at least four years old, with one eight years old. They further define
a Science Park ―as an area that allows agglomeration of technological activities, leading
to positive externality benefits to individual firms located on the park (2005, p.1216).‖
Further, Westhead (1997) argues that the role of science parks is to create an
entrepreneurial environment such that basic science research can be transformed into
commercially viable innovations. As further clarification, Westhead (1997) argues that
the implication of Science Parks is that technological innovation and related
entrepreneurship originates from ―pure‖ scientific research. A European Commission

29
(EC) study (2002a) classifies science parks as either development tools for technology
transfer and enhanced production systems or property development ventures that
comprise both a real estate function along with a scientific relationship with a university.
While these characterizations indicate the importance of entrepreneurship, they make no
mention of the size and/or life cycle phase of the firm.
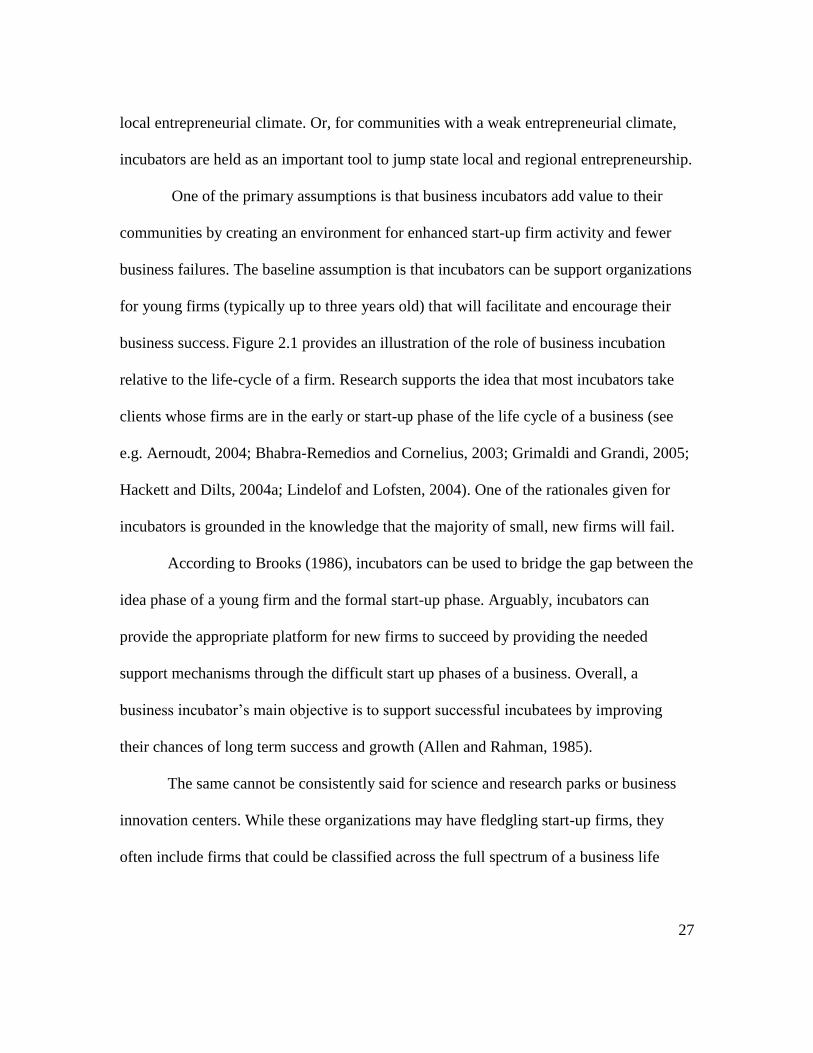
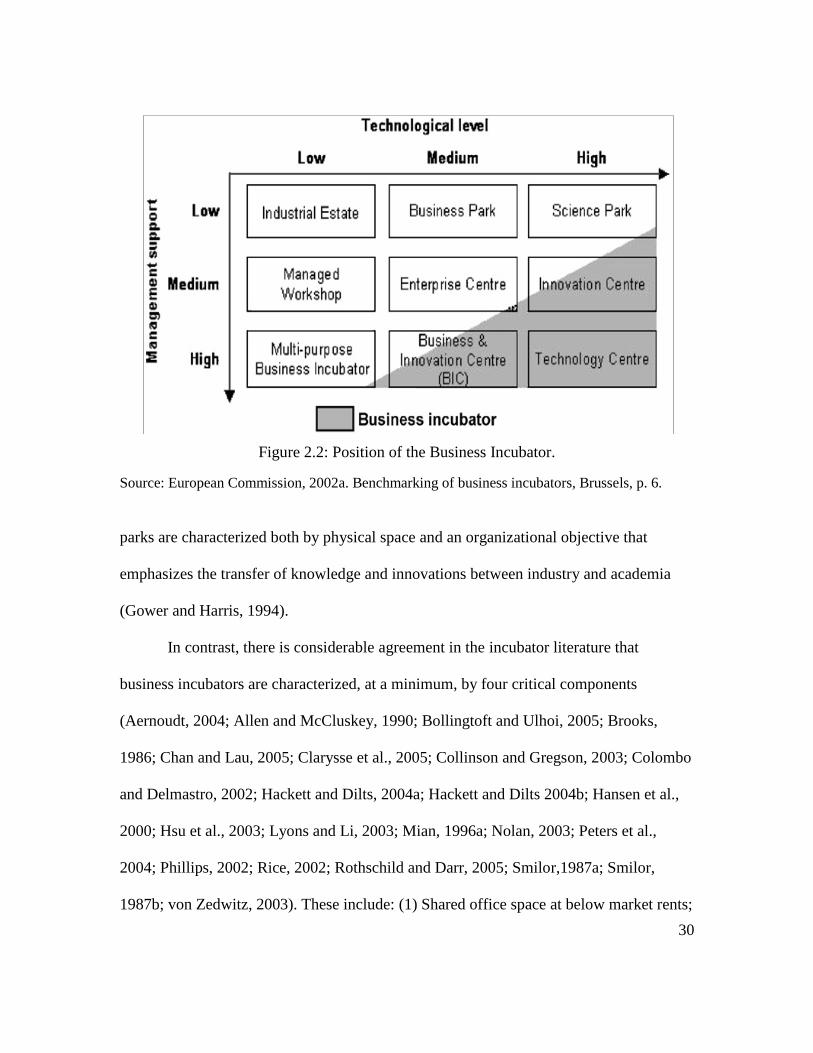
As these different organizations have gained popularity as policy tools for
promoting regional development and innovation, additional clarification of their
differences and type of use was outlined in a 2002 study by the European Commission
(EC). Figure 2.2 illustrates a two dimensional characterization of different business
organizational units based on technological level and management support. This
framework classifies an incubator as one where the technological level of the firms and
the management support provided by the incubator is high. Based on this typology,
Innovation Centers, Business and Innovation Centers, and Technology Centers can all be
classified as business incubators.
Based on the European Commission‘s description, science parks are generally not
business incubators, while other organizational types might be considered as such.
Hansson et al. (2005) review the three primary characteristics of science parks as outlined
by the UK Science Park Associations: (1) A formal organizational relationship to a
university or other institution of advanced research; (2) Intended to promote and support
innovative and knowledge based businesses; and (3) Has a management objective to
actively advance technology transfer and advanced business skills to science park firms.
With this background, there does appear to be enough agreement to conclude that science
30
Figure 2.2: Position of the Business Incubator.
Source: European Commission, 2002a. Benchmarking of business incubators, Brussels, p. 6.
parks are characterized both by physical space and an organizational objective that
emphasizes the transfer of knowledge and innovations between industry and academia
(Gower and Harris, 1994).
In contrast, there is considerable agreement in the incubator literature that
business incubators are characterized, at a minimum, by four critical components
(Aernoudt, 2004; Allen and McCluskey, 1990; Bollingtoft and Ulhoi, 2005; Brooks,
1986; Chan and Lau, 2005; Clarysse et al., 2005; Collinson and Gregson, 2003; Colombo
and Delmastro, 2002; Hackett and Dilts, 2004a; Hackett and Dilts 2004b; Hansen et al.,
2000; Hsu et al., 2003; Lyons and Li, 2003; Mian, 1996a; Nolan, 2003; Peters et al.,
2004; Phillips, 2002; Rice, 2002; Rothschild and Darr, 2005; Smilor,1987a; Smilor,
1987b; von Zedwitz, 2003). These include: (1) Shared office space at below market rents;

31
(2) Shared office support services; (3) Professional business mentoring and specialized
support services; and (4) Opportunities for professional networking1. The most common
business support services offered include general entrepreneurial training, business
development assistance, and specific business services like accounting, legal, marketing,
advertising, and financial management (Bollingtoft and Ulhoi, 2005; Chan and Lau,
2005; Lalkalka, 2003; Lyons and Li, 2003; Mian, 1996a). A survey of fifteen U.S. rural
business incubators (Adkins, 2002) indicates that over 70% of incubators provided the
following services: federal procurement assistance, assistance with noncommercial loan
access, personnel training, access to resources at higher education facilities, marketing
and advertising assistance, accounting and financial management, assistance with
accessing commercial bank loans, and general business planning basics.
Additionally, an important function of incubators is facilitating networking both
among client businesses and between clients and the business community in general.
Networking can range in form from formal market buying and selling linkages to
informal cross-firm exchanges of information. In fact, many successful incubators create
an environment with strong interaction (market or nonmarket) between incubator clients
(Adkins, 2004). However, the interaction between clients is a function of the type of
incubator and the client mix2. Connecting clients to appropriate sources of financing is,
of course, critical to growth and the continued existence of clients as well as the
1 One noteable exception are virtual incubators where number one and possibly number two are eliminated
( vonZedtwitz and Grimaldi, 2006). 2 There is anecdotal evidence that certain types of incubators where clients are in similar industries or in
direct competition do not exhibit this cooperative, collegial environment. For example, as later discussed
certain high technology incubator clients may see each other as ―non-trusted‖ rivals.

32
incubator. Thus, successful incubators have relationships with both collateral (e.g.,
traditional bank loans) and equity-based sources of capital such as venture capital or
angel network funds. Some incubators even provide seed capital directly, such as through
a revolving loan program.
While the incubator literature continues to lack agreement on a consistent
definition, we contend that the four primary characteristics mentioned prior must be in
place for an organization to be classified as an incubator. Equally as important is the idea
that the primary function of an incubator is to take on business ventures that are in the
early stages of development and assist them as they develop into viable young firms.
While, it is true that some science/research parks may have characteristics that could
classify them as incubators, we generally do not believe that science/research parks or
business innovation centers are synonymous with business incubators.
The Landscape of Business Incubators
Even given the above distinctions between business incubators and other
organizational types, it is true that incubators come in a variety of organizational
structures, management types, size, focus, and served business clients. Some argue that
―no two incubators are alike (Allen and McCluskey, 1990, p. 64).‖ Business incubators
are both private, public, or even public/private partnerships. Many also have close ties to
universities, small business development centers, or other community development
organizations. The National Business Incubation Association (NBIA) is an international
organization with over 1,900 members, whose goal is to advance business incubation and

33
entrepreneurship through education, research, advocacy, and access to networks of
resources and information (NBIA website, www.nbia.org). The NBIA estimates that, in
the U.S., forty-nine percent of incubators are public or private non-profits, thirteen
percent are affiliated with an institution of higher learning, eighteen percent are hybrid
efforts among government, non-profits, or private developers, and twelve percent are
private for profit enterprises (NBIA, 2005).
Many incubators focus on specific sectors of the economy. For example, various
business incubators specialize in serving clients in areas such as food processing, medical
technologies, space and ceramics technologies, tourism, and software development
(Adkins et al., 2001). Alternatively, other incubators have a diverse set of business
clients. In some, mostly rural regions, such as west Texas (Terry, 2006), incubator
networks have been established, with incubator facilities in different towns in the region
sharing management expertise and other resources. As the use of incubators has spread,
regions and localities have customized incubators to fit their needs in an attempt to
maximize the probability of their success.
Hackett and Dilts (2004b) note that much of the current literature on incubation
can be divided into taxonomies that allow for an easier comparison of incubates to non-
incubated firms. Research at the incubator level (Kuratko and LaFollette, 1987; Smilor,
1987b; Temali and Campbell, 1984) has focused on the primary financial sponsorship of
the incubator, as well as the business focus of the incubator. The literature (Plosila and
Allen, 1985; Sherman, 1999) at the incubator firm level has emphasized either the
business focus of the incubatee or the type of firm (spin-offs or new start-ups).

34
The popularity of incubator programs has ebbed and flowed over the past forty
years. During this period, information has been gleamed about the characteristics of
successful incubators. The National Business Incubation Association (NBIA), has
supported several incubator surveys over the years to determine challenges and assess
successes and failures. Survey results indicate the success of various types of incubators
(those found in rural and urban areas, those owned by public and private entities, and
those with or without a target niche). What makes incubators successful are strong
community support, appropriate partners, proper financial plans, and a clear idea and plan
of executable objectives.3
An important contribution to the incubation research has been the recognition that
the incubator itself is a firm with its own developmental life-cycle. Allen (1988) advances
the incubator life-cycle theory in more detail. The start-up phase begins as a community
seriously considers an incubator and continues until the incubator is fully occupied. As
the incubator matures, the incubator manager and incubatees have increasing interaction
and the incubator has stable and consistent demand for incubator space. If the incubator
reaches a point where the demand for space outstrips what it can supply, the incubator
has reached a mature business development stage. It is this stage that some research
identifies incubators as real estate development efforts. Ultimately as incubators grow
and change, they make important contributions to their communities and the
entrepreneurs within those communities.
3 Methodologically there are always ongoing questions of selection bias in these studies: 1) failed (closed)
incubators are not included in the analysis of operating incubators; 2) NBIA has strong vested interested to
promote the concept and its potential for success.

35
One of the ongoing concerns of business incubation is whether incubators can
become self-supporting. Incubators are relatively expensive to develop, the development
phase may take as long as five to six years (Weinberg, 1987). Thus, communities should
consider incubators a long run economic development tool at the outset. Moreover, the
nature of business incubation has made the evaluation of success or failure quite difficult.
Most studies have used traditional measures of job and/or firm creation as the primary
measures of success. Evaluation of programs after two, three, or even five years may find
these measures to be positive but small and as a result may not adequately capture the
potential long run benefits of the incubator. There are potentially positive spillover
benefits (improved entrepreneurial climate, enhanced community social capital,
knowledge spillovers, and others) associated with incubators that are not properly
accounted for in the existing research. As well, given the nature of the incubation
process, incubators may not be self-supporting in the short-term.
There is considerable agreement that business incubators can generate direct
employment and income impacts from the creation of new small business activity
(Markley and McNamara, 1995, Sherman and Chappell, 1998). Where public investment
is involved, the generation of small impacts and concern over the timing of self-support
lead to questions concerning the net benefits of incubation. However, incubator firms can
also generate positive indirect and induced economic impacts on their local economies
over time (Markley and McNamara, 1995, Sherman and Chappell, 1998). Campbell and
Allen (1987) argue that broader measures of incubator success are likely to capture a
more complete picture of incubator benefits. Measures like the development of incubator-

36
related networks, the percentage of startups related to existing businesses in the
incubator, and the nature of incubatee synergistic relationships among others could be
instructive. Exploring additional measures of incubator success may begin to capture a
wider scope of net benefits related to business incubation.
In the end, the issue of self-sufficiency is not absolute. Incubators in larger,
economically diverse regions are more likely to be self-supporting, while incubators in
smaller, rural regions are likely to require ongoing subsidization. However, given the
diversity of communities and the nature of the measurement of net benefits of business
incubation, each community must carefully evaluate the potential of this economic
development tool.
Given the potential of business incubators, there is increasingly a renewed interest
in incubation type programs as an economic development policy tool. Nations and
individual communities around the world have enthusiastically supported incubation
programs.4 The OECD (1999) informs that communities around the world are using
incubators as a policy instrument to promote local and regional economic development,
innovation, and entrepreneurship. As this development tool gains popularity there is an
opportunity to evaluate the success of incubators as a development tool with a clearly
defined research agenda. We begin by outlining a picture of the current body of literature
on incubator performance and evaluation.
4 Tamasy (2007) reports that there are over 200 incubation ―environments in the UK and approximately
180 incubator facilities in Germany. As well, many Asian nations have begun to use incubator programs as
a policy tool.

37
Examining Business Incubators
The number of incubators grew ten-fold from 1984 to 1991, with a substantial
increase in the number of rural incubators (Stenberg, 1993). The National Business
Incubation Association (NBIA) estimates there are over 900 incubators in North America
and 3,500 operating globally (NBIA, 2005). The NBIA further notes that these programs
have served over 13,000 clients, affiliates, and graduates (ibid).
The literature on business incubators can be classified into three categories: (1)
descriptive research focusing on definition and characterization; (2) prescriptive research
emphasizing the role of incubators in economic development and possible best practices;
and (3) evaluative research concentrating on incubator performance measurement and
evaluation of incubator effectiveness (Albert and Gaynor, 2001). Hackett and Dilts
(2004b) review of the incubator literature highlight five incubator research streams: (1)
incubator development studies; (2) incubator configuration studies; (3) incubate or client
development studies; (4) studies analyzing the potential impact of the incubator on the
potential success of clients; and (5) theoretical analysis of the incubator/incubation
process.
As incubator research has evolved, a number of qualitative studies have attempted
to characterize the nature of evaluating incubator performance. A handful of studies have
also attempted to quantify incubator performance by first clarifying the critical outcome
measurements necessary for incubator success. Research has identified the following
outcome measurements as important for determining incubator success; firm occupancy,
jobs created, firms graduated, tenant revenues, number of patent applications per firm,

38
effectiveness of management policies, effectiveness of value added service, and number
of discontinued businesses (Allen and McCluskey, 1990; Chan and Lau, 2005; Colombo
and Delmastro, 2002; Mian, 1996a; Phillips, 2002; OECD, 1997).
Sherman and Chappell's (1998) research illustrates the challenges inherent in
evaluating the outcomes or effectiveness of business incubators. They argue that current
research has not gone far enough in evaluating these impacts. They present several key
challenges to incubation research. Because the entrepreneurial process is complex and
new businesses have diverse needs, assessing outcomes in a standardized manner is
difficult. Standardized assessments are in part problematic because incubators do not
operate in a standardized fashion, as each incubator must cater to specific regional
characteristics and needs. Moreover, there is inherent selection bias in research the
compares the performance of incubator tenants with non-tenants. As a result, research to
date has focused more on process than on measurable outcomes. They suggest quasi
experimental, macroeconomic modeling, and stakeholder analysis as possible ways to
assess the impacts of business incubators on local economies.5
Tamasy (2007) also confirms the challenges in quantifying incubator outcomes.
One of the main challenges cited is that there has not been a widely accepted method or
set of variables used to test and measure the overall effectiveness of business incubators.
Phan et al. (2005) cautions that variables like firm survival rate have little methodological
value because of intrinsic enodogeneity. The incubator is created with the primary
purpose of enhancing individual firm survival. Tamasy summarizes that, to date,
5 Hackett and Dilts set form a research agenda in their synthesis (2004) of the literature. We discuss their
approach in detail in the final section.

39
empirical incubator analysis can generally be divided into studies that quantify
performance at an organizational level and studies that analyze the performance of
businesses located within the incubator. There are also very few studies where there is a
designated treatment group, with firms that have been incubated, compared against a
control group, firms that have not been incubated. Without this type of analysis it is very
difficult to accurately quantify the potential benefits of business incubation. Another
important consideration with incubation research is the focus on intended versus
unintended outcomes. It is critical to clearly identify the intended measures of incubator
success and further, to compare the intended (predicted) impacts of an incubator against
any positive or negative unintended outcomes.
An additional dilemma is that incubators often communicate different goals and
objectives depending upon their sponsor‘s interests or other identified priorities (Mian,
1996b; Bollingtoft and Ulhoi, 2005). Bergek and Norman (2008) argue that ongoing
weaknesses in the evaluation literature are that models measure incubator performance
without relating these measures to the goals and objectives of the incubator. As a result,
their research defines ―incubator performance as the extent to which incubator outcomes
correspond to incubator goals (Bergek and Norman, 2008, p. 22).‖ Incubators often have
a diversity of stakeholders each with their own unique interests and objectives for the
incubator. As well, because different goals correspond to different performance measures
it is imperative to understand the priority objectives of each incubator.
Keeping the unique goals of each incubator in mind, (Bergek and Norman, 2008)
have developed a framework characterizing three key incubator model components;
40
selection, business support and mediation. Research has confirmed the importance of
incubatee selection in relation to the success of the overall incubator (Colombo and
Delmastro, 2002; Lumpkin and Ireland, 1998; Peters et al., 2004). Hackett and Dilts
(2004a) indicate that incubator managers must have an advanced knowledge of the
entrepreneurial process to successfully identify promising new or young firms.
Bergek and Norrman (2008) propose a two dimensional/four field selection
matrix to explain different incubator selection approaches. They argue that most
incubator selection processes fall into one of four categories; ―picking the winners and
idea, picking the winners and entrepreneur, survival of the fittest and idea, and survival of
the fittest and entrepreneur (2008, p. 26).‖ These different categorizations characterize
the overall approach for selecting incubatees (idea versus entrepreneur) and also the
stringency of the selection process for incubatees (winners versus survival of the fittest).
Business support services are generally agreed to be a critical component of the incubator
model. However, the business support services offered varies and use by incubatees
appears to vary as much as services offered.
Bhabra-Remedios and Cornelius (2003) argue that client success is determined
not only by what services are offered but also on how those services are supplied. Hackett
and Dilts (2004a) also note that the intensity of time, comprehensiveness, and level of
quality of business service provision differ greatly among incubators. Given this
understanding, Bergek and Norrman (2008) simplify the component of business support
as a variable that classifies the incubator‘s role in the process of business incubation.
They define business support as strong intervention where incubator staff provides

41
substantial support and interaction in the incubation process and as laissez-faire support
where incubatees have significant autonomy and are provided minimal assistance in the
incubation process (2008, p. 24).
Research also clearly agrees that incubators provide varying degrees of access to
internal and/ or external networks for incubates. Peters et al. (2004) classifies this role for
the incubator as a mediator or intermediary. Mediation may also include access to
networks of information and knowledge, as well as internal or external actors (Collinson
and Gregson, 2003.) The importance of both internal and external networking for new
firm success is documented by a variety of researchers (Aernoudt, 2004; Bhabra-
Remedios and Cornelius, 2003; Bollingtoft and Ulhoi, 2005; Brooks, 1986; Clarysse et
al., 2005; Collinson and Gregson, 2003; Colombo and Delmastro, 2002). Hackett and
Dilts (2004a or b) also indicate that incubators may help incubatees maneuver the
complex institutional demands and processes of venture formation. There is additional
evidence that the mediation activities of incubators can be characterized by geographic
scope; local, regional and even international mediation activities (Carayannis and von
Zedwitz, 2005; Clarysse et al., 2005). Bergek and Norman (2008) classify different
incubator models according to the type of innovation system they are intermediaries for;
regional/national innovation systems (RIS), technological innovation systems (TIS), or
general clusters of economic activity.
While the specific objectives of incubators can be varied, most research assumes
that the main purpose is to serve as an economic development tool for job creation,
although they may additionally allow for greater small business success (Fry, 1985;
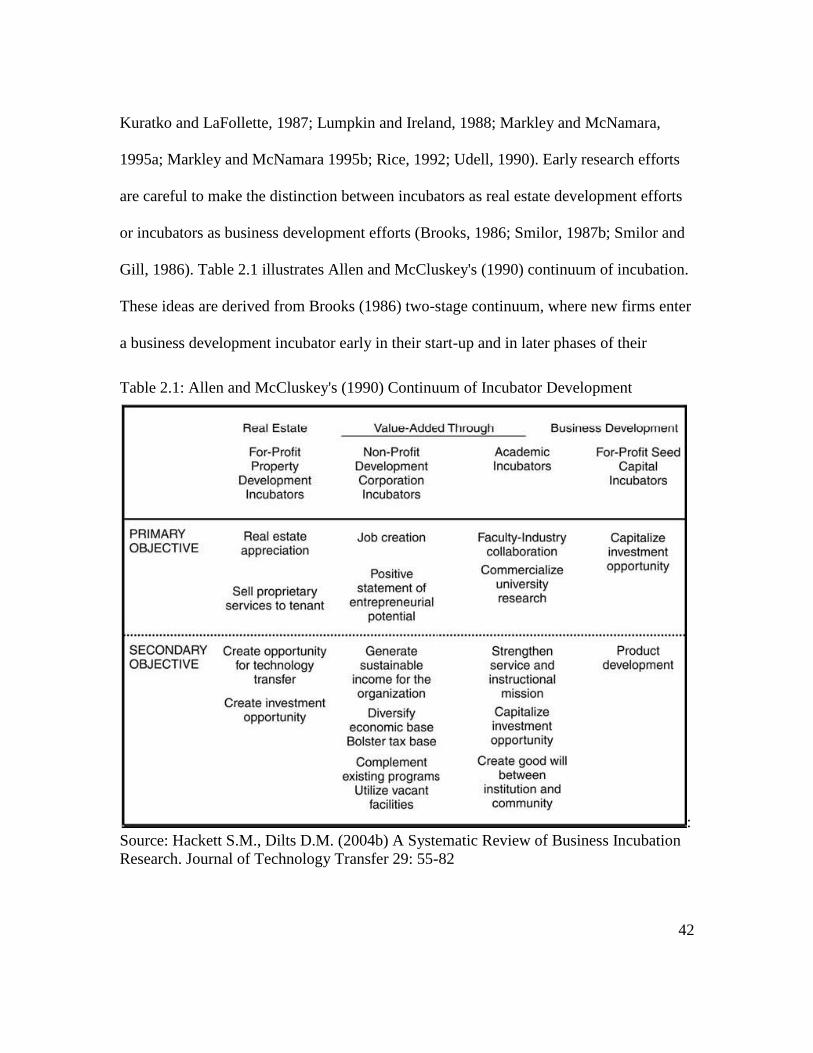
42
Kuratko and LaFollette, 1987; Lumpkin and Ireland, 1988; Markley and McNamara,
1995a; Markley and McNamara 1995b; Rice, 1992; Udell, 1990). Early research efforts
are careful to make the distinction between incubators as real estate development efforts
or incubators as business development efforts (Brooks, 1986; Smilor, 1987b; Smilor and
Gill, 1986). Table 2.1 illustrates Allen and McCluskey's (1990) continuum of incubation.
These ideas are derived from Brooks (1986) two-stage continuum, where new firms enter
a business development incubator early in their start-up and in later phases of their
Table 2.1: Allen and McCluskey's (1990) Continuum of Incubator Development
:
Source: Hackett S.M., Dilts D.M. (2004b) A Systematic Review of Business Incubation
Research. Journal of Technology Transfer 29: 55-82

43
business development enter a real estate incubator. Allen and McCluskey argue that the
incubation continuum is clearly centered on the value added provided by incubators,
which they examine in four major categories of incubator organizational structure.
Campbell et al. (1985) create a framework that examines the areas in which
incubators create value. This research illustrates that incubators have the ability to
diagnose business needs, recommend and/or provide key business services, provide
access to financing opportunities, and provide access to an incubator network. Additional
research (Smilor and Gill, 1986; Smilor, 1987a; Smilor, 1987b; Hisrich, 1988) cites the
importance of incubators for developing a climate of entrepreneurship and innovation.
Incubators also improve the credibility of incubates and reduce the entrepreneurial
learning curve. The entrepreneurial learning curve can be reduced by facilitating
improved access to a network of entrepreneurs that allows for a more efficient solution to
business problems.
More specifically, Sherman and Chappell (1998) indicate that incubators can
make a significant impact on local employment, income, and sales. While early research
(Campbell and Allen, 1987) suggests that incubators are not very good job creators,
Markley and McNamara (1995b) argue that incubators are particularly well suited to the
goal of new job creation. Existing small and medium size firms are major sources of job
creation and incubators may be particularly well suited to assist these firms in their
development. Markley and McNamara used input-output analysis to demonstrate that
business incubation programs can induce significant positive employment and income
effects. While these results are positive, Tamasy (2007) points out that studies have

44
estimated gross net job changes due to incubators programs but accurate depictions of net
job changes across a wide range of skill types are rare. This may be especially
problematic when incubators are being sold by politicians as critical pieces in a
communities economic development plan.
Science park6 research confirms this mixed review of performance outcomes in
organizations of this type. Monck et al. (1988) find that, even after taking the age of firms
into account, off-park firms generate a higher level of employment than on-park firms.
Westhead (1997) conducted a similar study of UK science park firms. This analysis
found no statistically significant difference between on and off-park firms in terms of the
ability to introduce new patents and products, spending on research and development, and
intensity of research and development focus. In contrast, Lofsten and Lindelhof (2002)
find that the job creation of Swedish on-park technology firms is significantly better than
off-park firms. Lofsten and Lindelhof, however, argue that the difference in performance
cannot be attributed to any unique science park characteristics but instead are attributable
to the nature of the sample of science park entrepreneurs. Their results confirm that
selection bias in incubation research is an area of ongoing concern.
Additional research (Weinberg, 1986; Tamasy, 2007) has focused on the general
challenges faced in developing a business incubator. Major constraints on success can
include a limited client pool (especially in rural areas), a lack of professional services
available to clients, and difficulties in obtaining client financing, especially in the form of
seed capital. Financial support for the incubator itself can also be a major constraint.
6 While we do not believe that science parks can necessarily be considered incubators, the similarity of
these organizational types makes the research important for comparison.

45
Stenberg (1993) argues that the start up costs for incubators can be prohibitive and, as of
the early 1990's, few had achieved self-sufficiency. In this regard, self sufficiency leading
to adequate operating funds is an important factor for incubation success.
Weinberg and Burnier's (1991) research on the role of community colleges in
supporting business incubators provides additional insight into why incubators succeed or
fail. Reasons for failure include rushed implementation without appropriate planning; an
inability to locate and hire an appropriate manager (a prerequisite for success); and an
inability to demonstrate the value (direct and indirect) that incubators provide to clients.
Tamasy (2007) concludes that businesses in ―science park‖ type incubators are not
necessarily better informed about university level research. Evidence also indicates that
science parks have not been effective in establishing network relationships between
university researchers and science park firms (Bakouros et al., 2002; Monsted, 2003).
Hansson et al. (2005) confirms that ―first generation‖ science parks may have weak
systematic ties to universities and has thus led a number of researchers to question the
importance of proximity to these institutions as a value added measure.
In contrast, there is considerable research documenting the potential importance
of university proximity and access for the success of incubators. Generally, research has
found that universities make an important contribution to employment and economic
activity in their regions (Bleaney et al., 1992; Brownrigg, 1973). More specifically,
cooperation with university professionals can provide access to the most up to date
knowledge and information, which may further reduce development costs and stimulate
innovation (Lockett and Wright, 2005; Markman et al., 2005; Nouria et al., 2005). Access

46
to a variety of skilled labor is an added advantage of university proximity (Barrow,
2001).
Additional research (Westhead and Storey, 1994; Colombo and Delmastro, 2002)
indicates that access to university services and facilities (computers, libraries) and
cooperative research and development efforts is utilized at a higher rate by incubator
firms generally, compared to similar non-incubator firms. There is also evidence that
universities/incubator relationships may provide an intangible benefit in that they provide
enhanced credibility to associated incubatees (McAdam and McAdam, 2006). Weinburg
and Burnier (1991) argue that institutions of higher education should consider developing
incubators in partnership with other community development groups. In general,
incubators with substantial and effective community and regional support have a greater
likelihood of success.
Likewise, Honadle (1990) argues that community extension services also have a
role to play in developing incubators. Especially in rural communities, the extension
service may be able to provide assistance in the form of feasibility studies, management
analysis, and marketing analysis for specific projects. Perhaps more important, extension
personnel can often provide links to key internal and external resources and stakeholders.
In their 2004 survey of the literature, Hackett and Dilts (2004b) focused on the
source of incubator financing, the approach of the incubator to business niches, and
whether the incubators primarily supported spin-offs from existing firms or completely
independent start-ups. They found successful incubators in a variety of support systems
and business niches and types. The results indicate that incubators can succeed as these

47
variables change. Some researchers argue that given the potential for economic growth
and development due to incubators, there should be a strong public role in helping to
provide capital and other forms of support. The research, however, is mixed at whether
public support is warranted and if it is, in what types of circumstances.
Almost fifty percent of U.S. incubators are at least, in part, publicly supported.
For European incubators, the most important sources (eighty-one percent) of funds are
tenant service fees and rent. However, national and regional governments financially
support over sixty percent of all incubators (K. Aerts et al., 2007). Moreover, the
European Union or some other international organization sponsor one-third of incubators.
Given the large public investment in incubators as an economic development tools,
clarifying the costs and benefits associated with these programs is an important public
policy objective.
Allen and Weinberg's (1988) research illustrates two simple models concerning
possible public support of incubators. Government can be a catalyst by encouraging local
action through incentives and partial financing in partnership with local development
authorities and community stakeholders. The alternative model of public support is a
more comprehensive approach, covering the full scope of incubator development of
activities. Among other things, this may include ongoing operating funds, management
assistance, development of regional or local networks, and other types of government
involvement. Even in states or regions where this approach is unlikely, it is possible that
governments may provide more comprehensive resources in the initial development
phase of an incubator.

48
As early as 1985 in the United States, a number of state governments supported
incubator development as an important economic development tool (Allen and Weinberg,
1988). Tamasy (2007) reveals from a study of largely European incubators that
municipalities are often involved in the introductory phase of an incubator and have a key
sponsorship role towards the incubator as well. Earlier research (2001) by Tamasy further
illustrates that in approximately one-third of German technology oriented incubators the
municipality is the sole shareholder.
The literature further suggests that business incubators can prove to be a cost
effective economic development tool, when compared to alternative economic
development options that are available to communities (Markley and McNamara, 1995b;
Sherman, 1998; Sherman and Chappell, 1998). A recent joint study (2005) by the NBIA,
the University of Michigan, Ohio University, and the Southern Technology Council
estimate that business incubation programs create jobs at an average cost of $1,109 per
job. Yenerall states that ―each new job created with the assistance of a publicly supported
incubator saves about $1,000 as compared to other strategies‖ (2008, p.6). Compared to
other economic development programs, this cost estimate is an encouraging sign of the
effectiveness of these programs. However, critics reply that many business incubators,
especially those in rural and inner city areas, struggle to attract business clients and are
either forced to close or continue to seek large levels of permanent public support
(Barkley 2003). Research also reinforces that development policies must reflect the
strengths and weaknesses of the local area, region and possibly even the entire state. This
allows regions to further clarify the potential costs and benefits of any economic

49
development program, including business incubators.
Tamasy (2007) argues that technology-oriented incubators in particular should not
receive public support and should be self-supporting private organizations. This research
reports that these incubators are poor public investments as they appear to have a low
motivating effect on the creation of new business establishments. As well, empirical
results raise questions as to whether incubators increase the likelihood of firm survival,
innovativeness, and growth. There is additional evidence that the level of incubator
funding is positively correlated with costs. An earlier study (Tamasy, 2001) reported that
public funding of incubator facilities in Germany appeared to generate incentives for
expensive buildings. Given this evidence and ongoing questions about incubator
outcomes, Tamasy (2007) concludes that there is no reason to support the use of public
monies for incubator projects.
Alternatively, many authors (Sherman and Chappell, Markley and McNamara, for
example) support the idea that incubators can create an enhanced entrepreneurial climate
in a region. For example, Rushing (1995) notes that as incubator firms mature and
graduate or move out, the incubator can continue to be an important training ground for
effective management and the mature knowledge of business operations. Supporting this
idea, Sternberg et al. (1997) finds that approximately two-thirds of incubator graduates
relocate in the same city as the business incubator and another twenty-three percent
locate within thirty kilometers from the city where the incubator is located. Thus,
activities such as periodic trainings and seminars can be used to maintain linkages with
clients who have graduated and with the local business community in general. Further

50
anecdotal evidence suggests that a strong local business incubator helps enhance the
appeal of outside firms to a region even though the majority of these firms have no plans
to locate in the incubator. Rather, the existence of the incubator demonstrates the area‘s
commitment to business support in general and entrepreneurial support in particular.
In sum, the value of business incubation lies in its ability to provide benefits to
local, young firms, the incubator itself, and the community at large. If incubators are
successful at least some of their incubatees must also be (have been) successful. There is
a mutually beneficial, symbiotic nature with the incubator/incubate relationship.
Incubators themselves derive value from the rents they charge clients, their direct and
indirect local employment and income impacts, and additional services they offer the
larger business community. If the incubator is successful in retaining graduating firms to
remain in the local community and grow their business, it also derives value from its
ability to ensure the retention of local firms. Accurately measuring this value may be
challenging as it requires knowing of which firms would have left the community without
the incubators‘ presence. The symbiotic relationship with incubatees makes measurement
of benefits more complicated, but there is little doubt that a successful incubator has the
potential to generate positive value for itself and the community at large.
It is the incubatee where research has traditionally focused on the value created by
the incubator process. If the incubator provides a valuable process and service then
incubated firms should have a higher survival rate than similar non-incubated firms.
Thus, the value of the incubatee is the additional employment and income effects
generated relative to similar non-incubated firms. As well, if the incubatee graduates

51
from the incubator and chooses to stay in the community as it grows, the incubatee
derives value from these additional employment and income impacts. Each incubatee is
unique and may therefore possess unique characteristics that further add to the value the
firm provides. For example, incubator environments with dynamic incubatees may realize
important knowledge and/or innovation spillover benefits that are critical to the success
of other incubator clients. While these benefits are more difficult to measure, this remains
an additional benefit that incubatees may provide in an incubator environment.
Finally, the incubation process has the potential to generate benefits (and
therefore, derive value) for the community at large. The most obvious and, measureable,
benefits are derived from indirect and induced employment and income effects from the
incubator and incubatees. The employment and income generated by the incubator and
incubatees, generates indirect employment from the resource and input needs of these
firms. This indirect employment generates induced income benefits to the community at
large as these employees spend their money in the local economy. If the incubator
provides business services to the community at large there are also positive, knowledge
spillover and networking benefits the incubator may generates. These benefits may
improve the local social capital environment and the general entrepreneurial climate of
the region at large. It is further hypothesized that successful incubatees who graduate and
stay within the community have the potential to enhance the business and entrepreneurial
climate of the region. These positive spillover benefits may be more challenging to
quantify, but, once again, the incubation process has the potential to bring substantive
benefits to the local community and region.

52
Spatial Economics and Networks
Insights about networks first arose from ideas about the nature of the firm. Ronald
Coase (1937) proposed that in certain cases it may be more efficient for an organization
to operate as smaller subunits in a market, as opposed to one larger organization. This is
arguably the case due to the importance of transactions costs in evaluating the efficient
size of the firm. Both Coase and Williamson (1981) explored the idea of transactions
costs in great detail. Cheung (1987) argues that transactions costs are those that arise
simply due to the existence of institutions. Search costs, bargaining costs, and
enforcement costs are all examples of the kinds of transaction costs that firms may
experience due to the existence and nature of institutions. Currently, transactions costs
are seen as key in determining when a highly integrated organization is more efficient
than smaller market based units. When transactions costs are too high, it is advantageous
for a firm to organize as a larger unit to minimize these costs. For example, firms form as
hierarchical units because the transactions cost of repeatedly negotiating between labor
and capital in a market setting would be highly inefficient (Alchian and Demsetz (1972)
and Williamson (1979)). Willamson (1975) also proposes that outsources functions of a
firm may minimize transaction costs.
Johansson and Quigley (2004) argue that economic transactions have exclusion
and interaction costs. It is these interactions costs that drive the integration of firms and
the formation of networks. Interaction costs can involve a variety of issues across buyers
or sellers, including legal, technological, search, and contractual issues, many of which
involve information costs of some magnitude. They define ―an economic network is an

53
organization of interlinked agents combining some features of a firm and of the pure
market. It internalizes some interaction costs and includes, at least implicitly, contingency
agreements of the kind we find in market contracts (p.169).‖ Under their definition,
partners in a network are not anonymous; they have repeated interactions with one
another. Examples of such inter-firm networks include wholesale producers and their
suppliers, industrial supply chain systems, and networks formed for just in time delivery
systems. If buyers and sellers organize in an effort to reduce transaction costs, they have
formed an external or ―inter-firm‖ network.
McCann and Shefer (2004) indicate ―that the spatial transaction costs faced by
modern firms are primarily of two types, namely transportation and information costs‖
(p. 183) Under these conditions, intra-firm networks may efficiently operate on a global
basis because of widespread adoption of information technologies, which has, for
example helped drive the process of global out-sourcing. In such situations, face-to-face
contact through co-location may not be necessary or even very important (McCann and
Shefer, 2004). However, it remains an open question as to the degree of co-location or
―near‖ location required for intra-firm or inter-firm cooperation.
A more relevant concept for incubators is the previously mentioned inter-firm
networks, especially when such networks are informal. Marshall (1919) describes the
importance of direct and unplanned interaction among firms in his early discussion of
industrial districts. For less formal networks, co-location probably remains a key element
for success, because interactions rely on trust and reciprocal actions rather than formal
contact-based relationships. Storper and Venables (2004) maintain that face to face (F2F)

54
contact continues to be a critical component in the transfer of knowledge among firms
and individuals in our economy. Even as communications technology appears to reduce
the importance of F2F interaction, new innovations and activities develop that require
F2F contact for the transmission of complex and unique information.
F2F contact allows for multidimensional communication, verbal, physical,
intentional, that provides for a more efficient and profound transfer of complex, tacit
knowledge. Tacit knowledge is argued to be an critical prerequisite to the growth of a
firm (Dettwiler, 2006). F2F interaction also plays a critical role in building trusting
relationships, thereby reducing free rider and incentive difficulties among individuals
and/or firms. Inter-firm networks, in theory, allow for more consistent observation of
individuals and firm behavior, which therefore creates low-cost, ―multi-layered‖, trusting
relationships. Co-location of firms or individuals in a business setting further enhances
this socialization effect. (Storper and Venables, p325, 2006)
Storper and Venables (2004) further argue that F2F contact also provides
screening opportunities for individuals and firms to identify exactly those parties with
which they want to establish relationships. While formal screening procedures exist
across society (examinations, degrees, certifications, etc), less formal procedures exist in
the form of informal networks. As informal networks are created, members develop
trusting relationships that allow for formal and informal screening of current and future
members. These informal networks create and environment where relationships are based
on reciprocal actions or ―trading favors‖. With these informal arrangements co-location
(as provided by incubators) is critical. Unless trust is very well established, firms have to

55
be physically close to monitor the behavior of the other party. If firms are not physically
close, the transactions cost of interaction are often prohibitively high. If sufficient social
capital is established, informational links between clients who are not co-located can be
maintained. In the case of market transactions, social capital is much less important as
transactions are based on established contract law.
The Incubator as a Network
A network model of incubators can be approached on several different levels.
First the incubator itself can, in effect, be considered a ―quasi-firm.‖ or, using
Williamson‘s term, a hybrid organization. Information and resource sharing among
incubator clients lowers transaction costs for individual firms. (Williamson, 1975).
Moreover, transactions costs are further reduced as the incubator serves as the
outsourcing agent for a variety of firm functions. An incubator establishes direct links
with its clients and with other community and regional resources. This quasi-firm thus
becomes an incubation network when it successfully supports an environment of
innovation and commercialization of ideas.
Successful incubators strongly encourage interaction or network formation
between clients through facility design (forcing the use of common entrances, exits,
elevators, and break facilities for example) and through joint activities (such as business
seminars) (Adkins, 2004). Research by Nohria and Eccles (1992) argues that the critical
contribution of incubators is the organizational structure and processes that create the
environment for these types of network formation. An incubator facility that

56
systematically encourages the co-location of expertise and enterprise creates and
environment that encourages network formation.
The incubator facilities role in enhancing network economies should not be
underestimated. Horgren (2001) highlights the importance of transforming workspaces as
the needs of firms change over time. Dettwiler (2006) propose that the facilities
management structure of business incubators and science parks encourages the
interaction and effective use of necessary services for entrepreneurial firms. Their
comparison of Swedish on-park and off-park firms reveals that facilities management and
differences in contractural agreements are important contributors to the superior
performance of on-park firms. The unique facilities solutions that an incubator provide,
create a network opportunity for start-up firms that further enhances the prospect of firm
success.
Studies (Adkins) indicate that client interaction is a sign of incubator success.
This research and the behavior of successful incubators provide empirical evidence that
client interaction (or network formation) in part explains the higher survival rate of
incubator firms over other new and small businesses. Rothschild and Darr (2005) confirm
that both informal and formal networks are critical for entrepreneurial success. Additional
research (Lichtenstein, 1992) cites intra-network relationship building as one of the most
important contributions of incubators. Interactions can range from mentorship and idea
sharing to market-based buying and selling of services or products between clients. The
key, however, is that incubator client interaction builds linkages that would likely not
form otherwise and which, more importantly, contribute to client firm success.

57
An additional way to approach incubators as networks is to focus on network
building between incubators that facilitate information exchange. Network creation and
information spillovers are enhanced with F2F communication and co-location of firms.
Storper and Venables (2006) describe a model of a ―buzz‖ city or a ―buzz‖ environment
that is a useful framework for understanding the network effects of incubation. In a buzz
environment people ―interact and co-operate with other high-ability people, are well
placed to communicate complex ideas with them, and are highly motivated. To be able to
reap these benefits in full almost invariably requires co-location, rather than occasional
interludes of F2F contact (Storper and Venables, 334, 2006).‖ Individuals and firms in
these environments are productive, cooperative, and interact more frequently with
universities and businesses in their region. They argue further that there is likely a
―super-additivity‖ effect of these interactions in a buzz environment.
Incubators have the potential to create a buzz environment as described by Storper
and Venables (2004) and thus to become a buzz incubator. Incubators have the benefit of
co-location and an organizational structure that encourages cooperation and interaction.
These network environments provide a platform for new firms to leverage new
technologies and knowledge competencies (Ford et al., 1998; Lorenzoni and Lipparini;
1999). As this interaction improves knowledge spillovers and cross fertilization of ideas
among incubates, there is the potential for the creation of new marketable solutions and
enhanced firm productivity.
To fully leverage these benefits, incubators, like buzz environments, are often
affiliated with or collaborate with universities or other specialized professional networks.

58
These interactions can further enhance the potential of the incubator and its incubatees.
Incubators and their clients may also derive an important intangible benefit from the
enhanced credibility that university sponsorship and/or access provides. Proximity to a
university or other specialized professional networks can lower firm development costs,
provide access to skilled labor, and improve the flow of the most up to date knowledge
and technology (Barrow, 2001; Lockett and Wright, 2005; Markman et al., 2005; Nouira
et al., 2005). If the nature of incubation is meant to improve economies of scale through,
among other things, shared space and services, all of the aforementioned additional
characteristics have the potential to enhance agglomeration economies. The
organizational structure, alone, also has the potential to create this ―additive‖ effect
described by Storper andVenables.
Today, some rural incubators are regional, with several small incubation facilities
linked together through shared resources and management.7 This arrangement is
analogous to an intra-firm network. It has the potential for increasing the efficiency of
incubator operations through obtaining scale economies, and hence boosting incubator
and client survival rates. Networked incubators can also share established and/or best
management practices, with better managed incubators serving as mentors for new or less
successful efforts. Luger and Goldstein (1991) argue that incubators can overcome
locational disadvantages with effective leadership, careful planning, and a little good
luck. In addition, the NBIA serves as a type of formal inter-firm network for business
incubators, where information is exchanged through conferences, workshops, their
7 The West Texas A&M Enterprise Network is multi-site business incubator serving 32 counties in the
Texas Panhandle.

59
website, and printed materials. Less formal networking between incubators at the
regional level may also be occurring, although this remains a topic for future research.
O-Ring Theory Viewed from a Network Lens
Another potential application of network behavior can be described with O-ring
theory. O-ring theory originates from the idea that labor productivity can explain large
differences in income between nations. The O-ring production function (Kremer, 1993) is
a tool by which small differences in worker productivity generate substantial differences
in wages and productivity of complementary inputs. The model assumes that it is the way
in which resources are utilized that is critical to production and innovation. Alchian and
Demstez (1972) argued that ―efficient production using heterogeneous resources is not a
result of having better resources but knowing more accurately the relative performance of
these resources‖ (Oerlemans et al., 2001, p. 344).
The results of the model illustrate that high skilled workers will be matched with
other high skilled workers, while low skilled workers will also cluster together. Another
important implication of the theorem is that the productivity (value) of a given level of
skill in a particular task goes up if the other tasks are done by more skilled workers. This
result indicates that the productivity of an individual performing a certain task is
enhanced if other tasks are performed by workers possessing greater skills. Hence, if a
worker migrants to an area where skill sets are generally greater, their own productivity
(and rewards) can be enhanced, even though their own innate abilities remain the same.
The models results imply that firms that hire high (low)-skilled workers in one

60
occupational category will also hire high (low) skilled workers in other occupational
categories. For example, more-skilled computer support personnel will tend to work at
the same firm as more skilled secretaries (Basu, 1997). These same results can also hold
in a geographical context. Thus, if a worker migrates to an area where other workers are
highly skilled, the migrants productivity will be higher, even though their own skill level
stays the same. The knowledge spillover theory of entrepreneurship also maintains that
human capital is a geographically bounded variable that may influence local
entrepreneurial activity (Lee et al., 2004 Acs and Armington, 2006). This theory may
explain income differences not only between countries but also between regions within a
given country. In particular, the model may help provide an explanation for differences in
real earnings between rural and urban areas and why industries experiencing more
dynamic growth tend to locate in more densely populated areas.
O-ring theory has also been used to explain the importance of entrepreneurs in a
regional economic development setting. Fabel (2003) uses the O-ring theory to explain
the organizational structure of new spin-off entrepreneurial firms. This approach is
especially relevant in the so called ―New Economy,‖ which witnessed a surge in the
number of spin-off technology/internet firms. Much has been written about the
importance of entrepreneurial interaction; thus, a better understanding of the
organizational structure that supports this interaction is important. Similar to the outcome
implied by traditional O-ring theory, high skilled employees or team members will be the
ones to leave traditional firms for new entrepreneurial start-up firms. Fable concludes that
after accounting for risk, information and enforcement problems, groups of individuals

61
with superior entrepreneurial ability will be the creators of entrepreneurial firms.
Entrepreneurs that are not identified in this process are left to work in traditionally
managed firms. Overall, Fable's identifies a relationship between agglomeration in urban
areas and the increased likelihood of high productivity, entrepreneurial start-up firms.
Finally, this research also reveals the dynamic nature of these firms in further attracting
and creating additional high skilled entrepreneurs and new spin-off firms.
O-ring theory illustrates a type of network formation that gives additional insight
into local, regional, and national, agglomerations of skills and/or industries. Networks of
individuals with specific skills and abilities are attracted to locations that have people and
industries that support these types of skills and talents. It is likely that much of the
interaction among professionals in these locations can be viewed as a classic network.
One where agents are not anonymous has repeated interaction, and through face to face
contact establishes trusting, low-cost relationships. Further, O-ring theories appear to
assume that F2F interaction of workers and entrepreneurs creates an opportunity for
knowledge transfers and productivity improvements. In sum, O-ring is an important
extension of network theory that may explain concentrations of skilled and non-skilled
workers, high productivity/high wage workers, and dynamic entrepreneurial regions
around the world.
Incubators using an O-Ring Application
Viewing the incubator from an O-ring/network lens highlights additional key
characteristics of the incubator. It is also useful to recall the incubator as a ―quasi-firm‖

62
where the incubator, itself, needs to succeed along with the clients it serves. In order for
an incubator to be successful it must first hire an experienced business manager. Many of
the case studies published by the NBIA highlight the critical need for an experienced,
knowledgeable incubator business manager. Incubator managers who clearly understand
the entrepreneurial process and the unique issues that tenant firms face can play a crucial
role in the success of the incubator, as well as tenant firms.
According to O-ring theory, a highly skilled incubator manager would tend to
attract a highly skilled board of directors. The board of directors can serve as champions
for the incubator involving the local business community and local government in policy
formation and incubator support. Working with the board, a skilled incubator manager
will be more likely to attract high quality service providers (attorneys, accountants,
management, etc.) for their incubator clients with a greater likelihood of obtaining
services on concessionary terms for incubator clients. In addition, the more dynamic and
experienced incubator management is, the more likely that incubator clients will be
dynamic firms with sound business ideas. One of the most important objectives of an
incubator manager is to bring in solid incubator clients. Incubator management must
ensure that client firms have sound business ideas with real possibilities for business
growth. The success of the incubator is directly tied to the success of their incubator
clients. Thus, incubators that have the strongest and most productive management,
support staff, and service professionals are likely to attract the most dynamic and
experienced incubator clients.
Using O-Ring theory as a lens to explain the business incubator process also

63
highlights the importance of interaction among incubator client firms along with
interaction between incubator management, client firms, and incubator service providers.
However, the critical factor in an O-ring approach is not just interaction, but also the skill
and productivity among all of the actors. It is the dynamic interaction of highly skilled
and productive entrepreneurial firms that will, in theory, continue to attract similar
skilled, new firms to the incubator. If these firms are concentrated in a specific industry
or skill area, it is likely that new firms with these specialties will be attracted to the
incubator. Hansen et al. (2000) claim that incubator specialization increases the potential
for individual firm success.
O-ring theory also reveals that the skill and productivity of current incubator
clients will likely determine the skill and productivity of future clients. In this
environment, what we would expect to see is that the most successful, dynamic
incubators are filled with highly effective incubator management, skilled and experienced
service professionals, and innovative, young, entrepreneurial client firms. While
individual firms in an incubator setting are faced with the same challenges as any new
firm, incubator specialization is argued to increase the proficiency of incubator personnel
and therefore enhance the value added to individual entrepreneurs (K. Aerts et al., 2007)
An additional inference from O-Ring theory is that incubator clients should work
together in a shared, collaborative work environment. In a specialized incubator
cooperative resource sharing has the potential to improve the competitive advantage of
tenant firms over non-incubator firms (Chan and Lau, 2005). From this, a testable
hypothesis from this inference is the conditions under which cooperation occurs and the

64
degree to which it determines client growth and survival. While results from the NBIA
indicate that intra-client cooperation is key, anecdotal evidence and theory indicates that
clients who are competitors may be limited in their cooperative efforts. O-Ring theory
provides a theoretical prism in which to examine this hypothesis concerning client
behavior.
Agglomeration and Information Spillover
The traditional idea of external agglomeration economies lies in Marshall‘s
emphasis on information spillovers, local inputs, and a skilled local labor supply.
Agglomeration economies exist where there is a set of unique factors that improve
business growth and productivity when firms are physically close. The traditional model
assumes that a spatial competitive advantage is obtained when firms and consumers have
frequent contact within an urban space, which further allows for reductions in
transportation and information costs. Firms benefit from agglomeration in areas with high
population density, where concentration allows for increasing returns and improved
growth and productivity (Krugman, 1991).
Agglomeration economies also form the basis for industry clusters. Porter (2000)
defines a cluster as ―geographic concentrations of interconnected companies, specialized
suppliers, service providers, firms in related industries, and associated institutions in a
particular field that compete but also cooperate in producing similar products‖ (p.15).
Porter also emphasizes the concept of a ―thickener‖ between clusters; as more firms with
shared competencies are clustered together, the flow of knowledge and information is

65
―thickened‖ in such a way to maximize the productive potential of individual firms (K.
Aerts et al., 2007). As such, one of the main arguments used in support of clusters is
improved access to specialized inputs, information, knowledge transfers, and publicly
provided goods. Within industry clusters, groups of interconnected firms obtain
agglomeration economies through critical linkages and networks. The locational
concentration of related firms allows for readily available access to key factors of
production and thus reduced barriers to entry for new firms. Finally, clustering of similar
firms may help generate innovative ideas leading to innovative products and even firms.
Information transfers and exchange of ideas may occur more rapidly in clustering
as compared to industries that are not geographically close (Oerlemans, et al., 2001).
Audretsch (1995) and Acs et al. (2009) both propose that where there are clusters of
entrepreneurial firms, knowledge spillovers can be important sources of entrepreneurial
opportunities. Likely causes for this difference include the already discussed reasons
concerning monitoring and other transactions cost and because employees with
specialized knowledge can more easily move between firms that are geographically close.
Knowledge spillovers improve the individual firms‘ ability to create and sustain a
competitive position. Van der Panne et al. (2003) argue that knowledge spillovers are
critical to new and young firms as they allow for the dissemination of tacit knowledge, as
opposed to the more readily accessible codified knowledge. Tacit knowledge is acquired
through social interaction as it is largely un-codified and ill-documented. The critical
relationship between knowledge spillovers and regional innovation dynamics has been
established in the literature (Karlsson and Manduchi, 2001).

66
This relationship between agglomeration and knowledge spillovers is well
documented in the Marshall-Arrow-Romer (MAR) model, where similar firms, especially
new firms, benefit from locations in business clusters in large part due to the exchange of
ideas and business information (Dumas, et al., 2002). This model also supports the idea
that small cluster arrangements can benefit from information transfers in large clusters.
Glaeser et al. (1992) describes the MAR model as one where industrial
concentration within a city or geographic region facilitates knowledge spillovers between
firms. Loescsh (1954) refers to this type of industry concentration as industry
localization. This model assumes that knowledge spillovers between firms are exclusive
to firms within the same industry, while knowledge transmission across industries is
assumed to be minimal or non-existent. Intra-industry knowledge externalities facilitate
local and regional innovation, supported by regional concentrations of similar industries.
The MAR model also upholds that local monopolies are superior to competitive models
in relation to innovative firm behavior. While local monopolies will limit the
transmission of new ideas, they will also generate the maximum value from their own
innovations and ideas.
The MAR assumption that knowledge spillovers are restricted to firms within an
industry disregards the potential importance of inter-industry knowledge spillovers and
the importance of firm complementarities. This can occur due to generalized urban
effects which enhance positive externalities resulting from a variety of firm and industry
interaction. Jacobs (1969) argues that the key source of innovative activity is through
knowledge spillovers across a variety of firms and industries in a region. Jacobs makes

67
the argument that ―the exchange of complementary knowledge across diverse firms and
economic agents facilitates search or research and experimentation in innovation (van der
Panne et al., 2003, p. 879).‖ This model further assumes that diverse firms interact across
complementary industries with a common knowledge base that allows for the efficient
transfer of ideas and the generation of new ones. Thus, the Jacobs model assumes that a
diversity of firms, as opposed to specialization of firms, in a specialized urban
environment is the primary driver of economic growth.
Jacobs‘ model further alludes to the importance of unplanned and chance
interaction among firms. It is in this competitive environment of ideas and innovation that
knowledge externalities are maximized. With this type of firm, interaction co-location
can be especially important if firms are to realize the full benefits of these relationships.
Proximity with respect to universities and specialized business services can be also
critical to innovation. Oerlemans et al. (2001) uphold that ―spatial concentration is related
to the level of university and industry R&D spending, as proxies for knowledge
spillovers‖ (2001, p. 340). Overall, co-location and/or proximity to key resources have
the potential to further reduce the costs of knowledge transmissions and improves access
for new and young firms by lowering screening costs of new entrants.
Incubators as ―Quasi-clusters‖
In the discussion of networks, it was noted that incubators are effectively ―quasi-
firms.‖ An additional conceptualization is the incubator as a ―quasi-cluster‖ organization.
First, an incubator is a highly concentrated spatial cluster of firms. As well, many

68
incubators are firms that share specializations or competencies across fields. Specialized
incubators may provide this innovative thickening agent that Porter describes. Hence, the
potential for agglomerative economies exist, especially if the incubator is targeted
towards specific industrial or technology firms. It is in these specialized incubators that
firms may benefit from Jacob‘s type innovation and knowledge spillovers.
As previously indicated, incubators replicate internal (to the firm) economies of
scale through the use of shared services, such as office support activities and shared
space. Subsidies that clients receive, such as below average market rents for space,
simulate economies of scale as these subsidies lower firm costs and increase the potential
of firm success. Arguably, the mentoring that clients receive from incubator staff is also a
form of internal scale economies. Additionally, the incubator provides access to external
specialized business services that further reduce firm costs as compared to other young
entrepreneurial firms. Many of the services provided by the incubator and related firms
are offered at a subsidized rate. However, even if some are offered at the market rate,
young firms may still benefit from the resulting reduction in transactions costs that an
incubator can provide.
As stated in the discussion on networks, one of the main arguments given for
incubation is that client interaction can induce a variety of information spillovers effects.
It is argued that the direct and indirect interaction of client firms will result in intentional
and unintentional knowledge transfers. The incubator may also yield additional benefits
of clustering. These may accrue if the credibility of this environment is such that outside
professional service providers, like venture capitalists or other entrepreneurial resources,

69
find these firms more attractive than non-incubator firms (Hannon and Chaplin, 2003;
Hannon, 2005; Rothschild and Darr, 2005)
The importance of knowledge spillovers is critical in both the MAR‘s and Jacob‘s
descriptions of industrial concentration. A growing body of research on the impacts of the
MAR‘s and Jacob‘s models provides evidence that suggest potential impacts in a
business incubation environment. Three studies examining the relative impact of
productivity on urbanization and localization across cities find that while urbanization
and localization economies are both present, localization is more significant (Nakamura
1985; Henderson, 1986; Henderson, 2003).
On the other hand, research that views this debate through the lens of diversity of
firms and employment as opposed to city size yields different conclusions. Results
indicate that employment diversity encourages growth in a region, stimulates new firm
births and growth of high-technology firms (Glaeser et al., 1992; Henderson et al., 1995;
Rosenthal and Strange, 2003). However, the prevalence of localization versus
urbanization economies also varies among industries and may also change with product
development or life-cycle of the firm (Duranton and Puga, 2001). As incubators are
focused on the birth and early growth phases of a firm‘s life-cycle, further research
should consider the importance of MAR and Jacob‘s economies at these specific life-
cycle phases. Additionally, understanding the relevance of MAR and Jacob‘s economies
within specific industry and firm types may be important for differentiating the benefits
that accrue from specialized incubators versus incubators that service, young new firms
more generally.

70
Much of this research implies that both MAR‘s and Jacob‘s economies can be
useful for explaining the value in certain types of incubator/incubatee relationships. As
noted earlier, incubators come in all shapes and sizes. Moreover, there does not appear to
be a common or exact recipe for incubation success. Thus, incubators that accept clients
in specific market niches are just as likely to succeed as those that accept incubatees from
a diversity of firm types. Incubators that focus on firm within a specific type of industry
may yield strong localization effects for locating firms. These MAR‘s effects are likely to
maximize industry innovation and value. Moreover, business incubators that support an
environment conducive to localization economies are not precluded from the benefits of
Jacobs type knowledge spillovers. Incubator firms within an industry could potentially
generate important knowledge spillovers but this is largely dependent on the nature of the
industry and competitive environment surrounding these firms.
The Jacob‘s model, however, would argue that incubators that accept a diversity
of firms have stronger potential for knowledge spillovers and maximizing firm value.
Furthermore, these incubators may provide a more generally enhanced entrepreneurial
climate and culture such that new firm activity and cross-fertilization of knowledge is
enhanced. One of the potential downsides to more diverse incubation is that localization
economies within the incubator are largely precluded.
There are several testable hypotheses that can be generated from the MAR‘s
versus Jacob‘s debate. One testable hypothesis is the degree to which and under what
conditions the MAR‘s and Jacob‘s theories provide explanations of agglomeration type
effects, such as knowledge spillovers, for business incubators. Additionally, testing a

71
hypothesis that clarifies the prevalence of MAR‘s economies in diverse incubators and
Jacob‘s economies in industry specific incubators would provide evidence of preclusion
or reduced economies in these specific environments.
In addition, the nature of an incubator provides an environment that can facilitate
personal ties among tenant firms. Hu and Korneliussen (1997) find that the impact of
personal ties on the cooperation and performance of small competing firms is significant.
In smaller incubators, informal networks may be easier to manage and in this regard may
be important for individual tenant firms (Rothschild and Darr, 2005). The economies of
scale derived from large incubator type organizations have been documented
(Williamson, 1975). A potential hypothesis to be examined is the comparative
performance between small, medium, and large incubators.
In an incubator environment, the knowledge effects for new and young firms can
provide invaluable information transfers. The interaction of dynamic entrepreneurs has
been described as a potentially synergistic, cooperative, and trusting environment. These
information spillovers could be simple water cooler advice or as important as direct
mentorship in the areas of marketing or management issues. What is critical is that these
knowledge spillovers would likely not occur, or at least not to the same degree, without
the formal organization of the incubator. This interaction is a form of agglomeration
economies completely analogous to information spillovers between co-located firms in
standard models such as Porter‘s cluster theory, the MAR model, or Jacobs‘s model.
Thus, the jury is still out as to whether similar incubatees or a diversity of
incubatees will provide the most value to the firm. As noted earlier, there is anecdotal

72
evidence that there are incubator environments where there is more competition and less
cooperation. A potential hypothesis for further analysis is that firms with similar markets
(especially high-technology firms) will tend to be less cooperative. If this holds, the
incubator client/cooperation model will not explain the success of these incubators. The
synergistic effects of incubation that have long been held as a key benefit may in fact be a
weakness in some incubators. What is known is that among the many different models of
incubation, both the MAR and Jacob‘s theories have relevance in the effort to furthering
our understanding of incubation success.
Networks and Agglomeration
The research on networks and agglomeration reveals similarities and
complementarities among these different theoretical approaches. McCann and Shefer
(2004) present three ideal types of geographical firm relationships and organization. This
model allows for further development of agglomeration and network theory. The first
model is illustrative of the Marshallian model of agglomeration, where firms choose to
establish clusters in a typical urban location with relatively no market power for any one
firm. These firms, in general, do not establish long-term relationships and derive benefit
from the cluster due to the physical proximity of the other firms. That is, agglomeration
economies exist, but not because firms network or act as a Porter-type cluster.
The second model is characterized by firms that require significant investments in
physical capital and thus are often characterized by high entry and exit costs. Clustering
in this second example does not demand proximity in the same region but requires

73
networking of related firms within and across regions to minimize transportation costs
(hence, this is more of a network model with little, if any, agglomerative effects).
The last model flows from the work of Granovetter (1973) and Williamson
(1975). This social network model is built on a foundation of trusting relationships
between key agents among firms. McCann and Shefer (2004) note that ―these trust
relations will become manifest by a variety of features, such as joint lobbying, joint
ventures, informal alliances, and reciprocal arrangements regarding trading relationships
(p.190).‖ These relationships develop over time and there is generally a common history
and experience among firms and decision makers.
Synthesizing this approach with the theoretical constructs of agglomeration and
networks has the potential for generating a richer understanding of a new approach to
modeling incubation. Based on the analysis of McCann and Shefer (2004) and others,
Table 2.2 illustrates that incubators have several of the characteristics of the social
network approach. Incubators especially seem to fit this approach with regard to
characteristics of relations, membership, and firm rent. An incubator is partially open in
the sense that new firms must apply to belong to the incubator. Moreover, in theory, this
process would be competitive with only the ―best‖ young firms obtaining membership.
As well, ideally the incubator is attempting to build an environment of cooperation and
mentorship to maximize the potential of individual firm success.
However, as it relates to firm size, incubators and their client firms are a better fit
for the agglomeration model. As described in Table 2.2, firm size in the agglomeration
model is atomistic. Given the nature of firms attracted to business incubators, this is
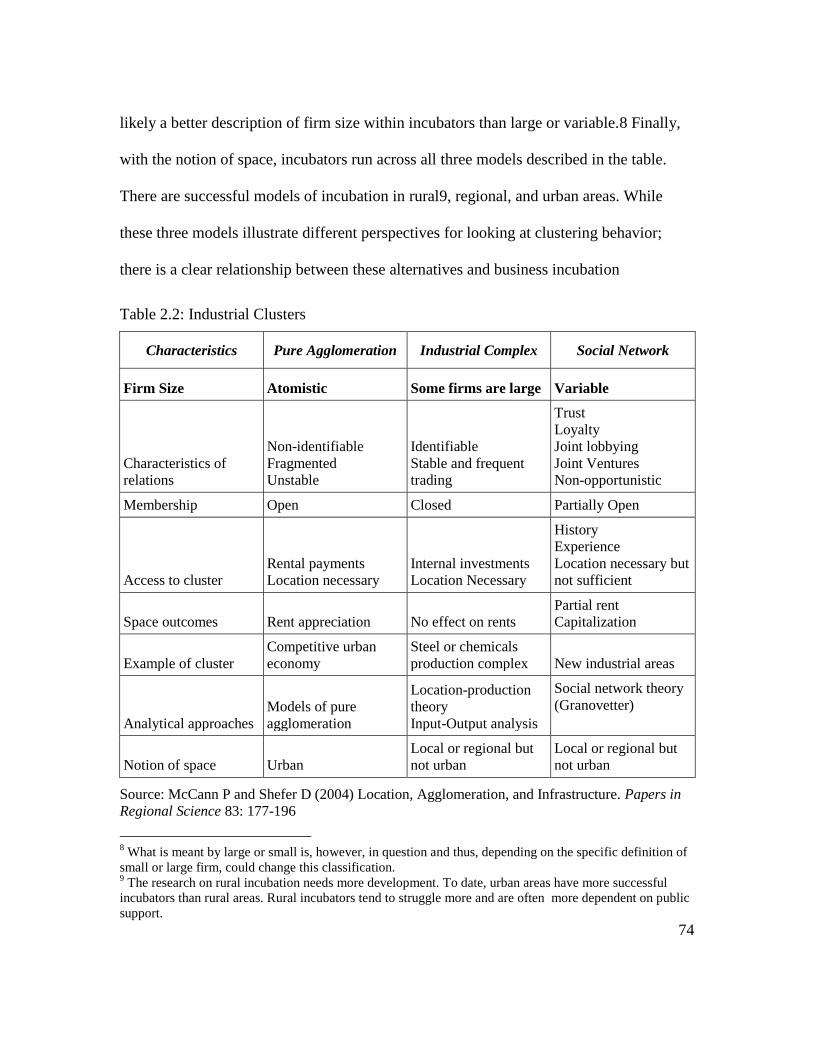
74
likely a better description of firm size within incubators than large or variable.8 Finally,
with the notion of space, incubators run across all three models described in the table.
There are successful models of incubation in rural9, regional, and urban areas. While
these three models illustrate different perspectives for looking at clustering behavior;
there is a clear relationship between these alternatives and business incubation
Table 2.2: Industrial Clusters
Characteristics Pure Agglomeration Industrial Complex Social Network
Firm Size Atomistic Some firms are large Variable
Characteristics of
relations
Non-identifiable Fragmented Unstable
Identifiable Stable and frequent
trading
Trust Loyalty Joint lobbying Joint Ventures Non-opportunistic
Membership Open Closed Partially Open
Access to cluster Rental payments Location necessary
Internal investments Location Necessary
History Experience Location necessary but
not sufficient
Space outcomes Rent appreciation No effect on rents Partial rent Capitalization
Example of cluster Competitive urban
economy Steel or chemicals
production complex New industrial areas
Analytical approaches Models of pure
agglomeration
Location-production
theory Input-Output analysis
Social network theory
(Granovetter)
Notion of space Urban Local or regional but
not urban Local or regional but
not urban
Source: McCann P and Shefer D (2004) Location, Agglomeration, and Infrastructure. Papers in
Regional Science 83: 177-196
8 What is meant by large or small is, however, in question and thus, depending on the specific definition of
small or large firm, could change this classification. 9 The research on rural incubation needs more development. To date, urban areas have more successful
incubators than rural areas. Rural incubators tend to struggle more and are often more dependent on public
support.

75
and an apparent inter-relatedness between these approaches and incubation.
A Research Agenda for Incubation
As shown in Table 3, Hackett and Dilts (2004b) provide an excellent delineation
concerning further research needs in the area of incubators as an economic development
tool. Further, Sherman and Chappell (1998) suggest quasi-experimental approaches,
stakeholder analysis, and macroeconomic modeling are ways to carry the incubator
research agenda forward. Combining the research agenda of Hackett and Dilts, the
method-based suggestions of Sherman and Chappell, and the insights gleamed from the
literature on networks and agglomeration economies a more complete research agenda
can be developed. Using the outline given in Table 2.3, a future research agenda should
focus on topic areas B through E. Any future research agenda should also use theoretical
approaches as the nexus for additional research on incubators. A theoretical grounding is
a critical starting point from which to frame the potential strengths and weaknesses of this
and other economic development approaches.
Tables 2.4-2.6 summarize potential business incubation research questions that
could be generated within specific theoretical frameworks. The additional categories of
incubator configuration, incubator development, and impact studies are modeled after
Hackett and Dilts (2004) descriptions. However, we propose impact studies should be
more broadly defined to include incubator‘s impacts on general economic activity in a
community, not just how incubators impact new firm survival. Table 2.4 highlights
hypotheses that could be explored using a network economy approach. A formal

76
Table 2.3: Hackett and Dilts Research Agenda
A
Incubator
Development
Studies
B
Incubator
Configuration
Studies
C
Incubatee
Development
Studies
D
Impact Studies
E
Theoretical
Approaches to
Incubation
There needs to be
additional clarity
of definitions and
concepts.
Move focus away
from
configurations of
incubators to how
and why the
configurations
work together
Develop a model
to explain how
and why
incubation
facilitates the
development of
client firms.
Focus research
efforts on whether
incubation
impacts new firm
survival rates.
Formalize a
theoretical
approach to
incubation.
Source: Hackett S.M., Dilts D.M. (2004b) A Systematic Review of Business Incubation
Research. Journal of Technology Transfer 29: 55-82
Table 2.4: Research Questions Using a Network Economies Approach
Network Economies
Incubator
Configuration Incubatee
Development Impact
Studies
Research Questions
Do incubators mimic scale economies
due to shared incubator services? Yes Yes No
Does client interaction or incubator
management contribute more to
agglomeration benefits? Yes yes No
Do incubator graduates have greater
business success than other small
business program graduates? No no Yes
What is the mentoring contribution to
incubatee graduate success as opposed to
general business training programs? Yes yes Yes
Do highly skilled and successful
incubator managers and/or boards of
directors have more successful incubator
firms? Yes no Yes
Does the type of incubator increase
client interaction and cooperation? Yes yes No
Does the type of incubator increase
client success? Yes no Yes

77
network-based modeling approach may be a fruitful method for exploring how and why
clients network (Borgatti and Foster, 2003). Tables 2.5 and 2.6 summarize potential
research questions using an agglomeration economies and economic impact analysis
framework. Each of these hypotheses potentially explores incubator configuration,
incubator development, and the general impact of incubators through a specific
theoretical lens. Each of these theoretical approaches have benefits; however, each
approach yields answers to specific types of questions. The rest of this section highlights
specific questions and potential methodological approaches for future research.
More specifically, both networks and agglomeration economies hold promise for
developing a model to explain how and why incubators support client development.
Based on our previous discussions, a testable hypothesis is that incubators provide
economies in two forms: 1) scale type economies, such as shared services and, arguably,
subsidies that mimic scale economies in that costs of production are reduced and 2)
agglomeration economies, which primarily occur through knowledge transfers between
clients and from the incubator staff to clients. Given that such information is available,
client level data could be used in testing these hypotheses. Such information could be
used to calculate cost savings due to shared services in comparison to matched (similar)
firms that are not incubator residents. Results would provide an indication of how much
shared-services contribute to incubator support. Arguably, any residual difference in
productivity between the matched pairs (incubator firms versus non-incubator firms)
could be attributable to the advice from staff and from client interaction. Teasing out the

78
effect of these two factors may require surveying clients to obtain at least an ordinal
ranking concerning which two factors tend to be most important. While we would expect
advice from incubator staff to be more important, situations can be envisioned where
client interaction could be the greatest benefit from belonging to an incubator.
Such a research approach could also be used to explore whether business
incubation impacts firm survival rates. Using a matched pair or quasi-experimental
approach, a comparison could be made between similar firms that belonged to an
incubator versus counterparts that did not. Differences in survival rates could then be
calculated. Of course, the issue of selection bias still remains in that firms which are
Table 2.5: Research Questions Using an Agglomeration Economies Approach
Agglomeration Economies
Incubator
Configuration Incubatee
Development Impact
Studies
Research Questions
Do incubators generate agglomeration
economies? Yes yes No
What is the primary source of these
economies? Knowledge transfers? Yes yes No
Do different types of incubators result in
a prevalence of MAR or Jacob type
economies? Yes yes No
What is the success rate of different types
of incubators, assuming some type of
agglomeration economies? No no Yes
What is the success rate of different types
of incubator firms, assuming some type
of agglomeration economies? No no Yes
Is co-location of clients and management
important to the success rate of the
incubator and its clients? Yes no Yes

79
better managed to begin with may seek out the opportunity provided by business
incubators.10
A related issue concerns when certain aspects of business incubators are
replicated by other programs, such as entrepreneurial group type systems (see Lyons,
2002), business training programs, such as Fastrac, and business resource centers. For
example, entrepreneurial league type systems likely provide networking type
opportunities and some of the mentoring provided by business incubators. Business
training programs are potentially rich in mentoring activities and provide some
networking opportunities (typically between members of the same training class). A
comparison of graduates (similar backgrounds) of business training programs versus
incubator graduates could provide the starting point for evaluating the contribution of
mentoring versus client networking to business survival and growth. Likewise,
comparing the growth and survival rates of participants in entrepreneurial league type
systems to that of incubator graduates could provide a similar starting point for
evaluating the relative benefits of strong mentoring versus networking.11
Given the
strength of results and number of participants involved, it might be possible to apply
simple quantitative tests in comparing such matched outcomes.
Related to a research agenda focused on mentoring, one that considers the impact
of the skills and talents of incubator clients, management, and boards of directors could
10
In fact, businesses almost always must meet certain basic good business practices, such as having a solid
business plan, to be allowed into an incubator. Such requirements impose at least a basic element of good
management. 11
Of course, a potentially compounding problem would be formal business training programs and
entrepreneurial league-type systems in which incubator clients (past and current) are often at least strongly
encouraged to participate.

80
answer important research questions. For example, a national or regional analysis of
incubator and client success, given the experience of incubator management and staff
could provide evidence of O-ring network type economies. Network economies and more
specifically, O-ring theory, could also be used to test the relative importance of
cooperation within specific types of incubators. Both of these could be accomplished
with a mixed methods approach using surveys of incubator management and clients,
followed by a quantitative logit or probit modeling of results.
O-Ring network economies could be further explored with the application of a
longitudinal study of a series of incubators. The primary research question focuses on
whether successful incubators and incubator clients are able to continue to attract highly
productive and successful new incubator clients. If this is the case, the O-ring theory
would be able document a ―virtuous cycle‖ of entrepreneurship. Both of these could also
be accomplished through a series of surveys over time (approximately 5-10 years),
followed by specific quantitative analysis. However, given the data limitations of this
analysis, it is likely that the incubator/client sample would not be large.
Another area of potentially fruitful research could be stakeholder analysis. If
incubators do actually improve the overall local entrepreneurial climate, stakeholder
analysis through focus groups, surveys, and other appropriate means may be able to
―tease-out‖ whether this contribution to an improved entrepreneurial environment is
perceived to be occurring and further, how the incubator is making such a contribution.
This research could also provide an important foundation for general economic impact
studies as well as provide possible evidence of any social benefits from business

81
incubation.
In addition, more studies indicating the overall contribution of business incubators
to local communities would be helpful. If conducted across different types of
communities (and incubator structures) these studies could give policy makers
considering incubators as part of a regional development plan a general idea of the
potential contributions to local economic growth. Integrated input-output, labor market,
and public service provision type models (Fannin et al., 2008) would be particularly
instructive in providing policy makers with estimates of the net returns in net revenue to
local governments (often funders of incubator development and continued support
efforts). Such studies could be used to empirically test the recent assertion (Tamasy,
2007) that questionable public benefits do not warrant public sector involvement in
incubator development and support.
Table 2.6: Research Questions Using an Economic Impact Approach
Economic Impact
Incubator
Configuration Incubatee
Development Impact
Studies
Research Questions
Do incubators increase general
employment and income in a region? No no yes
Do incubators increase small business
activity in a region? No no yes
What are the indirect and induced
benefits of incubators? No no yes
What are the net returns of incubators on
local governments? No no yes
All of the above theoretical approaches could also be used to further develop the

82
research agenda on rural incubation. As noted earlier, there continues to be evidence that
urban incubators are more successful than rural incubators. Moreover, there is at least
anecdotal evidence that rural incubators may require longer periods of public funding
than their urban counterparts. Among the ongoing empirical problems are that much of
the incubation research suffers from selection bias and that there continues to be a lack of
dynamic analysis in the current literature. For example, it is difficult to get data on
incubator failures, but this is critical to understanding the potential costs and benefits of
incubators as an economic development tool. Moreover, using some of the research
questions above to explore differences between rural and urban incubators could clarify
the appropriateness of this development tool across different geographies.
Finally, a simple national tracking system concerning incubators would be
instructive. For example, the overall batting average concerning incubator survival, say,
five or ten years after inception, is not known because efforts to gather data tend to be
piecemeal and rather ad hoc. A simple system sponsored by the NBIA and perhaps others
with a few short questions (for example, when did the incubator close its doors and why)
would be instructive.
In conclusion, using Hackett and Dilts (2004b) Objective E in Table 2.3, a formal
theory-based approach to business incubation has been developed. Using their additional
categories of research, each theory-based approach details whether it covers incubator
configuration, incubator development, or general impact studies. Additionally, a variety
of specific research approaches are described, along with potential methodologies for
exploring these. Together, we believe that all of the potential efforts mentioned here, as

83
well as other similar efforts, would help in meeting the objectives outlined by Hackett
and Dilts (2004b) and the hypotheses detailed here.
Business incubation appears to be a development tool that will continue to have a
presence on the development landscape for the foreseeable future. With a consistent set
of best practices, coupled with a theoretical underpinning, business incubators have the
potential to be one of the most comprehensive economic development strategies. By
doing so, the cause of regional economic development in general can be advanced
through more insightful applications of regional science. Additionally, incubators have
the potential to enhance the core objectives of economic development; job creation,
business diversification, new venture creation and broader community development.

84
CHAPTER THREE
THE IMPACT OF POLICY PERCEPTIONS ON LOCAL ENTREPRENEURIAL
DEVELOPMENT IN SOUTH CAROLOINA
Introduction
The field of regional economic development, and the policy landscape associated
with it, has undergone a number of transitions over the past several decades. Economic
development policies of the past focused almost exclusively on industrial recruitment
and, to some extent, business retention. As evidence continues to mount regarding the
characteristics of successful communities and related development, it has become
increasingly clear that a one-size-fits-all development strategy is not a sustainable or wise
development approach for most communities and regions. It has also become evident that
a mixed basket of development strategies that includes business recruitment, business
retention, and entrepreneurship is preferable for sustainable economic growth in most
communities.
Over the past decade, entrepreneurship has become recognized as a legitimate and
distinct regional development approach, one that is increasingly considered a primary
component of state and regional economic development efforts. As a result, many states
now have a variety of entrepreneurial initiatives, networks, and centers to promote this
development strategy (NGA, 2004; William, 2004). The proliferation of different
approaches has made them difficult to define and classify but the trend is clear. One
ongoing area of concern is that local development practitioners may view
entrepreneurship strategies as too difficult or out of reach for their community. Moreover,

85
if a community already has access to small business development centers or other small
business related organizations, local officials may believe small business development
efforts in this area are redundant and not within their policy purview.
Furthermore, there is increasing confirmation that many communities, especially
small and rural communities, continue to engage in traditional economic development
practices even in the face of mounting evidence that these approaches may not provide
the benefits that communities believe they do. If the ―new economy‖ demands that
communities shift their economic development focus, why are communities not doing so?
Moreover, it is important to clarify what types of development approaches communities
believe are most important, along with understanding what they actually implement in
practice.
Research continues to verify that entrepreneurial focused economic development
is a critical driver for regional economic growth, while industrial recruitment policy
continues to remain the most popular development approach for many communities. Such
industrial recruitment strategies often result in net losses to communities when all of the
incentives are balanced against the benefits from job creation, workforce development,
and others.
This research explores the scope of local and regional entrepreneurial
development efforts across South Carolina. This research begins to analyze the
importance of policy perceptions of state and local policymakers on the implementation
of entrepreneurial development policy. The first section of the paper reviews a wide and
diverse range of literature on entrepreneurship, entrepreneurship policy, and industrial

86
recruitment policy. This is followed by a comparison and discussion of how South
Carolina fares in state rankings of entrepreneurship and innovation. The third section of
the paper reviews the methodology and reviews statewide survey results. Finally, the last
section of the paper presents and discusses logit model results of significant factors that
influence the probability of a community having/not having an entrepreneurial-focused
development program. In conclusion, this research hopes to clarify the role of
entrepreneurial economic development policy in communities with diverse economic and
social characteristics and to understand the barriers that exist for communities in
implementing ―new economy‖ development strategies.
Literature Review
Research has documented the importance of entrepreneurship for national
economic growth and innovation (Reynolds et al., 1999). The U.S. Small Business
Administration (2005) highlights the importance of entrepreneurs for the generation of
new ideas and innovations. The OECD (2003) and the U.S. Census Bureau (Edmiston,
2007) report that the majority of new jobs created in the U.S. and around the world are in
small and/or medium sized firms. Reynolds et al. (1999) argue that as much as one third
of the variation in global rates of economic growth may be accounted for by differing
rates of entrepreneurship among nations.
The dynamic nature of entrepreneurial activity allows for the creation of local
jobs, wealth, the innovative use of local assets and resources, and enhanced local and
regional economic growth. Research documents the importance of entrepreneurship for

87
local and regional employment growth (Birch, 1987; Shaffer, 2002 and 2006). Acs and
Armington (2003) find a strong correlation between entrepreneurship and long-term
regional employment growth. This relationship is confirmed for rural areas as well
(Birch, 1987). Acs and Armington (2005) find an association between firm formation
rates and differences in human capital, local population growth, local income growth, and
industry specialization. Acs and Storey (2004) uphold the premise that entrepreneurship
also improves the allocation of resources throughout an economy.
Basic regional development theories, whether demand side or supply side, assume
that regions possess strong social capital (Porter, 1998; Rubin, 1994) and a regulatory
environment that ensures well-functioning markets (Deininger, 2003). Acs questions
whether the growing body of research confirming the role of entrepreneurship and
innovation in local and regional economic growth and development applies equally to
affluent communities and low-income and/or rural communities. Compared to low-
income communities, affluent communities have high quality human capital, adequate
financial capital, and appropriate social capital (Acs and Armington, 2006; Acs and
Plummer, 2005; Bresnahan and Gambardella, 2004; Florida, 2002; Acs and Varga, 2005,
Acs and Storey, 2004) Table 3.1 illustrates Acs description of the supply and demand
side of development policy in affluent versus low-income communities.
This comparison indicates that low income communities have substantially
weaker assets when compared against affluent communities for the use of demand or
supply side economic development approaches. This raises questions of causality with
regard to which came first, affluence and successful development policy or vice versa. ,

88
The question that Acs and others have raised is whether entrepreneurship-focused
economic development strategies deliver successful economic development outcomes for
communities without the strong assets that many affluent communities possess.
Table 3.1: Economic Development Assets in Affluent and Low-Income Communities
Community
Affluent Low-Income
Theory
Supply
Quality human capital
Financial capital
Infrastructure
Leadership
Low-quality human capital
Limited financial capital
Poor infrastructure
Limited leadership
Demand
Strong export demand
Backward linkages
Tradable goods
Weak export demand
Weak backward linkages
Few tradable goods
Source: Acs, Zoltan, State of Literature on Small and Medium Size Enterprises And
Entrepreneurship in Low-Income Communities,
Research on social capital and civic infrastructure concurs with some of the
conclusions made by Acs. Burt (1992) and Granovetter (1973) argue that weak social ties
are one of the weakest areas of community and economic development. In many
communities this weakness restricts local entrepreneurship and business expansion as
business opportunities are missed or overlooked. The World Bank (1999) defines social
capital as the ―institutions, relationships, and norms that shape the quality and quantity of
a society‘s social interactions…Social capital is not just the sum of the institutions which
underpin a society—it is the glue that holds them together (www.worldbank.org).‖
Research documents both the direct and indirect role of social capital in improving
community and economic development. Social capital can influence political institutions

89
and policymakers, improve local organizational capacity, and enhance internal and
external connections that promote entrepreneurial and other business opportunities
(Gittell and Thompson, 1999; Vidal, 1992). Social capital can also enhance community
access to financial capital through peer lending programs, credit unions, and other local
and regional credit and loan programs (Gittell and Thompson, 1999). Halpern (2009)
argues that communities with a good stock of social capital are likely to benefit from a
wide range of community and economic strengths, like lower crime, better health,
improved educational outcomes, and stronger overall economic performance.
Woolcock (2001) further distinguishes between three types of social capital;
bonding, bridging, and linking. Bonding social capital characterizes ties between people
that are related, close friends, or neighbors. Bonding tends to be more protective and
inward-looking but can also enhance the communication and informal cooperation
necessary to pursue common objectives (Van Oorschot et al., 2006). The nature of
bonding social capital is that individuals and groups share personal, social and/or cultural
characteristics like race, class, ethnicity, religion, etc. While these shared qualities can
enhance community relationships, they can also be used to exclude community members
that do not share these characteristics.
Bridging social capital occurs through loose social networks of friends,
acquaintances, and work colleagues. Van Oorschot et al. (2006) describes bridging
networks as those that encourage relationships among those with more distant ties via
outward looking, civic oriented organizations and institutions. Bridging social capital is
crucial for building relationships that support community problem solving, information

90
sharing, and management of community resources. Finally, linking social capital refers to
reaching ―out to unlike people in dissimilar situations, such as those who are entirely
outside of the community, thus enabling members to leverage a far wider range of
resources than are available in the community (Woolcock, 2001, p.13-14).‖ Linking
social capital includes networks of individuals and organizations that have ties across
states or nations. Moreover, and possibly most important, linking social capital includes
members of diverse social and cultural standing, as well as different positions of power
and influence.
The three types of social capital serve different functions in different community
settings and impact whether social capital has a positive or negative influence on
economic and community development. While bonding can be an important community
social safety net, it can also serve to perpetuate dysfunctional and nepotistic community
relationships. Similarly, bridging networks allows communities a broad range of access
to institutions and organizations that they would normally be unable to access. Strong
bridging networks provides communities with access to resources and institutions that
otherwise would not be available. While Putnam (2000) describes bonding social capital
as ―a kind of sociological superglue, whereas bridging social capital provides a
sociological WD-40 (p.22-23).‖ Woolcock (2002) explains that rural communities often
have high bonding, low bridging, and no linking. Similarly, poor communities often have
significant bonding with no bridging or linking. Thus, similar to Acs, Burt (1992), Gittell
and Thompson (1999), Granovetter (1973), Halpern (2009), Woolcock (2001) and others
are likely to argue that rural and poor communities often have a weaker asset base as it

91
relates to the implementation of economic development policy.
Local Economic Development and Entrepreneurship
There is a growing research stream documenting the importance of critical
regional drivers of local and regional entrepreneurship and the public policy measures
that can be important contributors to entrepreneurial development success. Several key
studies highlight the relationship between local economic development and
entrepreneurship. All of these studies verify the important relationship between local
entrepreneurship and local economic development activity. An analysis commissioned by
the U.S. Small Business Administration (2006) by Innovation and Information
Consultants (IIC) finds that changes in the number of small businesses is related to
population, per capita income, diploma recipients per 1000 residents, real wages, share of
non-farm proprietors‘ income, density of urban establishments, urban jobs per 1000
residents, and region of the country. Papadaki and Chami‘s (2002) examination of
Canadian microbusiness finds that the level of high school completion of owners, the
propensity of an owner to take risks, and the use of informal networks were all
significantly related to business growth.
One of the ongoing questions in the entrepreneurial literature is how public policy
can encourage and/or support an enhanced entrepreneurial culture in a community.
Christofides, Behr, and Neelakantan (2001) analyzed the types of state programs that
delivered the most significant local gains in employment, income, and number of
establishments. Their results reveal that local business structure is largely the result of
local and regional economic conditions. Walzer et al. (2007) define three variables as

92
proxies for business structure; business density12
, growth in large businesses, and rural
urban continuum codes13
. These measures attempt to capture the endogenaeity of local
and regional business activity. Business density and rural-urban continuum codes signify
access and availability to local and regional markets. Business density may also signal
opportunities for entrepreneurs to network and build relationships with other local
businesses. Finally, growth in large business is an indication of the potential for
entrepreneurial spin-off and the dynamic nature of the local business community. The
current literature suggests the following causal sequence; entrepreneurship is affected by
business structure in a region, where business structure is largely a determinant of overall
regional economic conditions (IIC, 2006; Acs and Armington, 2005; Christofides et al.,
2001).
Walzer et al. (2007) use these earlier studies as the foundation to build a model of
the effects of contextual factors on entrepreneurship. The main objective of their research
is to highlight the strength of the relationships between variables such as, economic
climate, business structure, natural amenities and the potential for entrepreneurial activity
in a given county. Their sample includes six Midwestern states representing a range of
urban and rural settings, a diversity of economic bases represented, and different regional
economic climates. Their results indicate that approximately sixty percent of the
variability in county business structure is due to the economic climate of a region;
12
Business density is often measured as the number of firms per unit, such as 1,000, of the population.
However, Walzer et al. defines business density as the number of microenterprises per 10,000 residents. 13
Rural-Urban continuum codes are a classification system of the U.S. Department of Agriculture‘s,
Economic Research Service characterizing metropolitan areas by the population size of their metro area
and nonmetropolitan counties by their degree of urbanization and adjacency.

93
wealthier counties had higher business density and business growth rates. The economic
climate of a region is composed of tax effort14
, housing value, the wage rate, the
unemployment rate, poverty, and population density. Their analysis further confirms that
changes in natural amenities and perceptions of quality of life issues are positively related
to the pool of potential entrepreneurs in a region. Additional research supports that
amenity-based development strategies may also attract ―creative class‖ workers to rural
regions (McGranahan and Wojan, 2006; Florida, 2005; Dabson, 2007). In addition, the
strong and positive link between business structure and entrepreneurship is confirmed.
When business structure is combined with the pool of potential entrepreneurs, this
variable accounts for over eighty percent of the variability in regional entrepreneurship.
Overall, this research further confirms the importance of regional business structure and
economic climate to the formation and success of new firms. (Walzer et al., 2007)
Henderson et al. (2007) provides additional evidence of the drivers of regional
entrepreneurship in rural and metropolitan areas. By creating variables representing
entrepreneurial depth and breadth, this research clarifies regional characteristics that
determine spatial variation in the quantity of entrepreneurs and quality of entrepreneurial
activity. Human capital, as measured by educational attainment, has a positive
relationship with a region‘s ability to produce entrepreneurs that generate high incomes
and high value-added in the region. Metropolitan areas have a strong relationship
between human capital and high value entrepreneurial activity, while human capital in
rural areas is strongly related to the breadth (variety) of entrepreneurs in a region. There
14
Per capita taxes paid relative to income per capita.

94
are more entrepreneurs, as well as more high value added entrepreneurial activity in
counties with higher densities of natural and scenic amenities. Rural entrepreneurial
development appears to be especially sensitive to local and regional amenities.
Overall, this analysis finds that high-value entrepreneurial activity continues to be
largely concentrated in metropolitan areas. High value entrepreneurs are critical resources
for enhanced regional employment, income and growth. As such, clarifying policy
measures that improve the ability of rural and/or micropolitan areas to leverage their
entrepreneurial assets is important for long-term regional economic growth and
development. (Henderson et al., 2007)
Entrepreneurial Policy
Pages (2006) argues the Chinese proverb ―Let a thousand flowers bloom‖ may be
the most appropriate way to describe the current landscape of entrepreneurial policy
across the United States. While there appears to be widespread support for policies aimed
at business formation and growth, there is little consensus concerning the policy
measures necessary to achieve these objectives. Pages (2006) argues that the ―dominant
trend is that there is no dominant trend (p. 4).‖ The range of policy measures is
astounding. There is concern that some policy measures are introduced under the guise of
entrepreneurship but provide little or no measurable business development assistance.
There is also concern that some states and localities may support entrepreneurship policy
largely in words and less in actual deeds, or in substantive policy efforts.
Malecki (1994) describes the characteristics of an entrepreneurial region as

95
largely intangible. Acs (2005) further argues that entrepreneurial activity is influenced by
specific local and regional characteristics. For example, policies targeted towards labor
force skill improvements may be more effective in regions with high take-up rates of skill
based programming, such as urban or medium sized communities but will be less
effective in rural areas with lower density. Additional research supports the idea that local
economic development policy is more successful when it takes into account the size
distribution of local and regional firms (Loveridge and Nizalov, 2007). Other research
indicates that entrepreneurship policy may be less successful at creating new firms than
helping them to grow and mature (Utterbeck et al., 1988; Weaver, 1986). Malecki (1994)
further argues that entrepreneurship is greatly influenced by local culture, history, and
infrastructure, among other variables. Successful entrepreneurship policy must therefore
consider the unique strengths and weaknesses of each community and may thus
necessitate the development of a unique set of policy measures for each community.
It is well documented that the development and success of entrepreneurs depends
on a complex list of factors, including some that communities may have little or no
ability to control. However, there is a wide range of policy measures that state
government, federal government, and local communities can use to influence
entrepreneurship development. The OECD (1997) reports that policies geared towards
inner city and rural microenterprise creation and development have become popular
policy options. Klein and Hadjimichale (2003) document a long list of policy measures
that governments have used in an effort to encourage business creation; financing
options, management assistance, marketing advice, mentoring programs and networking

96
linkages, technology development programs, the development of business clusters or
incubators, and others. Pages (2006) finds that the following entrepreneurial program
areas appear to be receiving the most policy attention among states and localities; access
to capital, business incubators and technology development, regulation, education, and
entrepreneurial awards.
For the purposes of this research, public policy geared towards entrepreneurial
support are grouped into four main classifications: human capital policy; policy focused
on financial gaps; policies that address infrastructure needs; and policies that focus on
internal/external network improvements (Malecki, 1994). Research has documented the
positive role of human capital characteristics on new firm formation and local and
regional economic growth and development more generally (Glaeser, 1995, Acs and
Armington, 2004a, Acs and Armington, 2005). Birch (1987) proposes that improving
educational resources generally is important for encouraging an entrepreneurial
environment, but specific emphasis on higher education attainment and quality labor
programs may yield the most significant benefits for local communities. Additionally,
there is a significant positive relationship between states with a higher proportion of high
school graduates and the level of small business creation (Bartik, 1989). Acs and
Armington (2005) confirm a significant relationship between firm formation and the
proportion of college graduates and the share of high school dropouts in a region.
The importance of technical or skill based education policy has also been
documented in the research. Brusco (1989) argues that technical education may be more
important than university education for new firm creation, especially considering the

97
potential scope of its impact. Policy efforts that support human capital improvements in
skill-based competencies have the potential to make a broader economic impact (Brusco
1989; Cooke and Imrie, 1989; Vartiainen, 1988). Maillat and Vasserot (1988) confirm
that regions that invest in workforce skills across the full range of production will be
more successful than regions that simply invest in research and technology. Henderson et
al. (2007) make this same argument. Henderson (2004) compares the educational
attainment of the self-employed to that of government and private sector workers. He
finds that self-employed workers have more education than private sector workers but
less than government sector workers. Self-employed workers are less likely than the
general workforce to hold graduate or professional degrees but are more likely to have a
technical education or some college. Research further suggests that a broad base of
educational levels in a region may lead to greater entrepreneurial activity when compared
against regions with a higher percentage of residents with higher education degrees (Acs
and Armington, 2005). As a result, policy efforts geared towards increasing the overall
level of education may be more successful than policy efforts aimed at increasing the
level of college education (Acs, 2005).
Kayne‘s (1999) survey of state entrepreneurship policy finds that the majority of
U.S. states have higher education programs in entrepreneurship. However, state support
of K-12 entrepreneurship education programs is not as well developed. Forty percent of
states indicate that entrepreneurship is mentioned in state standards or guidelines, while
only thirteen states actually provide funding in support of entrepreneurship educational
programming. Several non-profit organizations are also involved in the provision of K-12

98
entrepreneurship programming. The National Federation for Independent Business has
created the Youth Entrepreneur Foundation to assist K-12 teachers with curriculum and
instruction (Adkins, 2006b). The Kauffman Center for Entrepreneurial Leadership, Junior
Achievement, and 4-H are all national organizations involved in some area of K-12
entrepreneurship education programming. Davis (2002) concludes that youth
entrepreneurship programs are more effective if they are ―integrated with educational
policies, including the structure and content of school curricula, extracurricular activities,
and after school programs. Vocational needs of young people should be central (p.19).‖
Higher education institutions are increasingly involved in the provision of
entrepreneurial education. The Harvard Business School reports that in 1967 only six
business schools offered any entrepreneurship courses but by 1997 370 business schools
offered some type of entrepreneurship coursework (Henderson, 2002). Solomon et al.
(2002) (Inc.com) reports that more than 1,600 colleges and universities offer
programming and courses in entrepreneurship (Adkins, 2006a). Today many colleges and
universities also have centers for entrepreneurship that house both degree programs and
entrepreneurial programming. The extension services of land grant universities are also
working to improve the technical skills of entrepreneurs in their state. While the
programming varies, it is generally geared towards small business training and/or
technology training programs. Related to this, small business development centers
(SBDCs) are one of the most common small business development programs in the
United States and have a presence in every state in the nation (Henderson, 2002).
SBDC‘s increasingly have working relationships with universities and community

99
colleges in providing a range of business assistance from business planning to financial
and market analysis.
Access to financing and sources of capital are well documented constraints for
entrepreneurship. There is strong evidence of a spatial concentration of venture capital
across the country (Florida and Kenney 1988a, 1988c; Malecki, 1990). A 1999 national
survey of the states confirms the spatial discrepancies of capital for entrepreneurs
(Kayne, 1999). Several states have noted there may be sufficient venture capital resources
nationally, but the majority of venture capital firms are located in major urban centers
and are not as inclined to make investments outside of their region. Evidence from Freear
et al. (1996) confirms that most angel investors invest within a day‘s drive of their
residence. These spatial discrepancies remain an ongoing entrepreneurial challenge and
one that states and policymakers have begun to directly address.
To better meet the needs of rural and other underserved populations,
nontraditional venture capital funds have been created to operate outside traditional
venture capital markets. These funds are both publicly and privately managed but many
of them ―will accept lower rates of return on investment in exchange for social and
economic benefits to the service area (Henderson, 2002, p59).‖ Barkley et al. (2001) find
that the success of these nontraditional funds has been mixed.
Angel capital funds are another popular and increasingly common way to
stimulate venture capital. Angel capital is start-up business capital, typically provided by
a wealthy individual or group of individuals. This source of financing is often used by
firms as a second round of financing, after seed capital funding from friends, family, and

100
individual funds. Angel funding is typically less available than traditional venture capital
funding but can be critical seed money for startup companies. While angel investing
remains highly concentrated in areas like Silicon Valley and New England, other states
have begun to establish their own angel networks focused on state entrepreneurship
(Henderson, 2002).
Florida and Kenney (1988b) find that the ability to access and acquire venture
capital largely lies in the ability to access local, regional and/or national networks of
financial institutions, institutional investors, corporations, universities, and other
entrepreneurial networks.
Malecki argues (1994) that it is difficult for the public sector to create and/or
support such networks. Eisinger (1991) reveals that state level involvement in venture
capital programs has met with only modest success when compared against private
venture capital activity.
The inability to access venture capital may also be a function of a firm‘s
inadequate capital readiness. Kauffman Foundation (1999) proposes that states may have
more success with policy efforts that focus on enhancing a firm‘s capital readiness than
on the creation of public financing programs. This research reveals that the majority of
state financial assistance programs are focused on loan guarantees and direct loans, while
less than ten percent of state programs involve any type of equity investment.
Related to entrepreneurial financing, state tax policy is another tool that states and
regions may use to encourage entrepreneurial behavior. State tax policy in support of
entrepreneurship is generally either a part of the state‘s general tax structure or targeted

101
as tax incentives that encourage specific business practices. The National Governor‘s
Association (NGA) 1999 survey found the following six tax policies were most often
used in support of entrepreneurship: general tax reductions, targeted tax credits, research
and development tax credit, capital investment tax credits, sales tax exemptions, and
absence of income tax. Kayne (1999) reports that the majority of tax incentives offered
by states do little to support entrepreneurial firms but most often benefit established firms
with existing revenue and investment streams. States may also consider the impact on and
incentives for entrepreneurs as they modify capital gains, inheritance taxes, estate taxes
and tax compliance policy. However, the Kauffman Foundation further confirms that tax
polices across most states do not differentiate between entrepreneurs and other types of
firms. Kayne (1999) argues that as the United States economy continues to evolve
towards one based on knowledge and innovation, current tax policies may constrain
entrepreneurial growth and overall economic activity.
Public infrastructure investments (roads, sewers, power, and others) have long
been important tools for business recruitment, as well as providing important benefits to
existing firms in the region. Today, much of this physical infrastructure is assumed.
However, with the rapid pace of technological change there is increasing evidence that
advanced telecommunication infrastructure is an additional necessity for regional
economic growth and development (Cohen and Zysman, 1987). Research from the Italian
industrial districts in the late 1980‘s confirms that advanced technology opens up access
to regional firms, suppliers, buyers, and wider access to regional and global markets
(Fornengo, 1988, Mazzonis, 1989, Rullanu and Zanfei, 1988; Scott, 1988a).

102
Many entrepreneurial firms struggle with access to and affordability of physical
infrastructure and services. Business incubators are one of the tools that can be utilized to
assist new and young firms in overcoming some physical and service infrastructure
barriers (Acs, 2001). Incubators provide firms with access to office space, often at below
market cost, a variety of business services like copy and fax facilities, conference and
meetings rooms, secretarial support, personal computers, business and consulting
services, and specialized business services like accounting, finance and others. Access to
a range of business infrastructure and services at a subsidized rate allows young firms the
opportunity to focus more on business growth and development and less on the costs of
operation and related search costs.
Lichtenstein and Lyons (2006) argue that incubators can assist in the
transformation of entrepreneurs and can therefore increase the flow of entrepreneurs
within a given region. Incubators can induce positive changes in individual entrepreneurs
as well as in a region‘s entrepreneurial climate. In rural communities, incubator networks
have emerged as an additional tool to enhance entrepreneurship. These networks seek to
reduce the barriers of distance and location by improving the economies of scale and
scope of both the incubator and the entrepreneurial climate.
Similar to business incubators are the development of university science and/or
research parks. These organizations often call themselves business incubators, but have
some distinct qualities. Science/research parks can be effective incubators for high-
technology firms and the formation of informal networking relationships with university
researchers (Gibb, 1985; Monk et al., 1988). A number of states have also made

103
substantive public investments in university-based centers for excellence focused on
specific industrial technology areas and/or faculty cooperative research policies. As one
example, the Kentucky Science and Technology Corporation manages the Innovation
Group, a network of six Innovation and Commercialization Centers located in
universities across the state (Dabson, 2007). Efforts like these generally have the dual
objective of enhancing innovation and increasing the commercialization of research. An
additional goal of these organizations is to encourage spin-off firms that have promising
ideas for commercializable research.
Public investment in traditional business incubators, science/research parks, and
other higher education programming has increased dramatically over the past twenty
years. As such, they have become an accepted policy method for encouraging and
supporting the formation of local and regional small businesses (Goldstein and Luger,
1990).
An additional area of policy focus has been on the creation and/or support of
external business networks. Research documents that developing a climate of
entrepreneurship often lays in the effectiveness of business support networks (Dabson,
2001; National Commission in Entrepreneurship, 2001a; Malecki, 1994). Studies of
microbusiness growth confirm the importance of informal networks for the success of the
smallest entrepreneurial firms (Papadaki and Chami, 2002). Malecki (1994) argues that,
while development policy may not be able to create these networks, public policy can
help facilitate and support them. Policy can be used ―to improve the external economies
of the local system strengthening the network among local firms (Garfoli, 1990, p. 430).‖

104
The importance of networks for business growth and development underscores the
importance of access to information and knowledge spillovers. Firms that operate in
dense, agglomerative environments are more likely to receive these benefits, but regions
without these benefits can utilize community and economic development policy to
improve external networks and related agglomeration economies (Malecki, 1994).
A number of states and regions have developed their own organizations in an
effort to enhance internal and external business networks. The Appalachian Regional
Council (ARC) developed the Entrepreneurial Initiative which focuses in part on the
development of entrepreneurial networks and clusters (Dabson, 2001). Research on this
initiative (Brandow, 2001) reveals that since the program began business retention rates
have improved and survival rates of new firms are higher than the national average.
Minnesota has created several network building programs that may be important models
for enhancing statewide entrepreneurship. The Minnesota Rural Angel Investor Networks
(RAIN) seeks to find and encourage angel investors in rural areas of the state. The
Minnesota Rural Partners created a Virtual Entrepreneurial Network with the purpose of
creating an online entrepreneurial network with access to advanced technology and
communication tools (Henderson, 2001).
Rural business development may be especially dependent on the creation of
external networks. Acs (2001) reports that Farmington, New Mexico generated the third-
highest share of high-growth entrepreneurs in the nation in the early 1990s. This success
can be largely attributed to the cooperation of surrounding community and business
leaders who were able to collaborate to overcome labor market challenges and business

105
obstacles to rural economic development. Rural communities that work together to create
and enhance networks improve economies of scale, access to resources and technology,
and local and regional cooperation and communication (Anesi et al., 2002).
Portugal and the United Kingdom have had positive experiences with community
business liaisons that provide technical expertise to area businesses and thereby enhance
the knowledge base in the region (Andrade, 1989; Britton, 1989a, 1989b). The Japanese
Kohsetsushi centers provide regional expertise for small and medium firms on a range of
technical, training and research issues (Shapira, 1991). Malecki (1994) argues that local
and/or regional governments may be important facilitating agents for the creation of local
networks. Government agencies can sponsor local business events for informal meet and
greets, topical business sessions, and other business related events. Local and/or regional
agencies can be important gatekeepers and intermediaries in encouraging the
development of community networks.
Internal or informal networks can be equally as important to an entrepreneur‘s
success as external networks. These networks are critical to improving the transfer of
knowledge and overall flow of information for entrepreneurs (Malecki, 1994). It is
understood that informal networks and the information environment of an area can vary
substantially across a state or region. Malecki (1994) argues that government policy
cannot create these important interpersonal networks but proposes that policy efforts can
be used to facilitate these connections. Thus, local governments may encourage local
strategies that support the creation of networks by facilitating local small business events
and gatherings of people. These types of efforts may not require explicit policy changes

106
and may provide a cost effective mechanism for enhancing local networks.
Public policy can also be used to provide intermediaries or business liaisons to
improve small business access to business services and advice (Hull, 1990; Britton,
1989a; Kelly and Brooks, 1989; Sweeney, 1987). Portugal and the United Kingdom have
both had a positive experience with the use of business liaisons (Andrade, 1989; Britton,
1989a; Britton, 1989b). Turok and Richardson (1991) argue that when compared against
other European and/or Asian developed nations these types of policy efforts are weaker
in the United States, the United Kingdom, and Canada. From a policy perspective
creating and/or supporting ―creative‖ regions is difficult. However, there are a number of
―network oriented‖ public policy measures that have been used successfully to enhance
and support regional innovation and entrepreneurship.
The Status of Business Recruitment
Even with apparent paradigm shifts in economic development policy, old
fashioned industrial recruitment remains a substantial tool in states economic
development tool boxes. The 2000 State Business Incentives Report by the Council of
State Governments describes current and future trends in state and local business
incentives. This report is based on a national survey of economic developers and business
leaders in all fifty U.S. states. Over the five year period from 1994-1999, thirty-two states
saw an increase in the number of business incentives offered to new firms, only two
states reported a decrease , and sixteen states reported no change. Thirteen states also
reported that over the next five year period, from 2000-2005, they expect to see an

107
increase in business incentives offered to new firms. Thirty-five states indicated business
incentive offerings would stay approximately the same and only two indicated a probable
decrease in business incentives offered over the next five years.
Figures 3.2 and 3.3 break down business incentive policy into the more detailed
categories of financial and tax incentives. These figures support the conclusions from
Figure 3.1 and confirm the broad trend of increasing business incentives across all types
of incentive categories. Chi (1997) documents a long list of policies that states use for
industrial recruitment efforts. Examples include reduced taxes, changes to tax codes,
creation of enterprise zones, special tax policies for manufacturing inventories, job
training, tax credits for business investment, state/local bond financing programs, direct
loans for construction, equipment, and machinery, guaranteed loans, venture capital
programs, and special financial incentives for poor and distressed communities, among
others. The reality of incentive policy is that firms are usually offered an incentive
package, which may include incentives from state, local or county governments, local or
regional development agencies, community colleges or universities and others. Table 3.2
provides evidence of the broad range of economic development organizations involved in
development activities.
To gain a broader picture of incentives it is important to also characterize the
incentive trends for local and/or regional governments. The International City/County
Management Association (ICMA) surveyed 3703 municipalities and counties in the fall
of 2004 and spring of 2005 to gain a broader understanding of economic development
policy and practice in communities around the country.
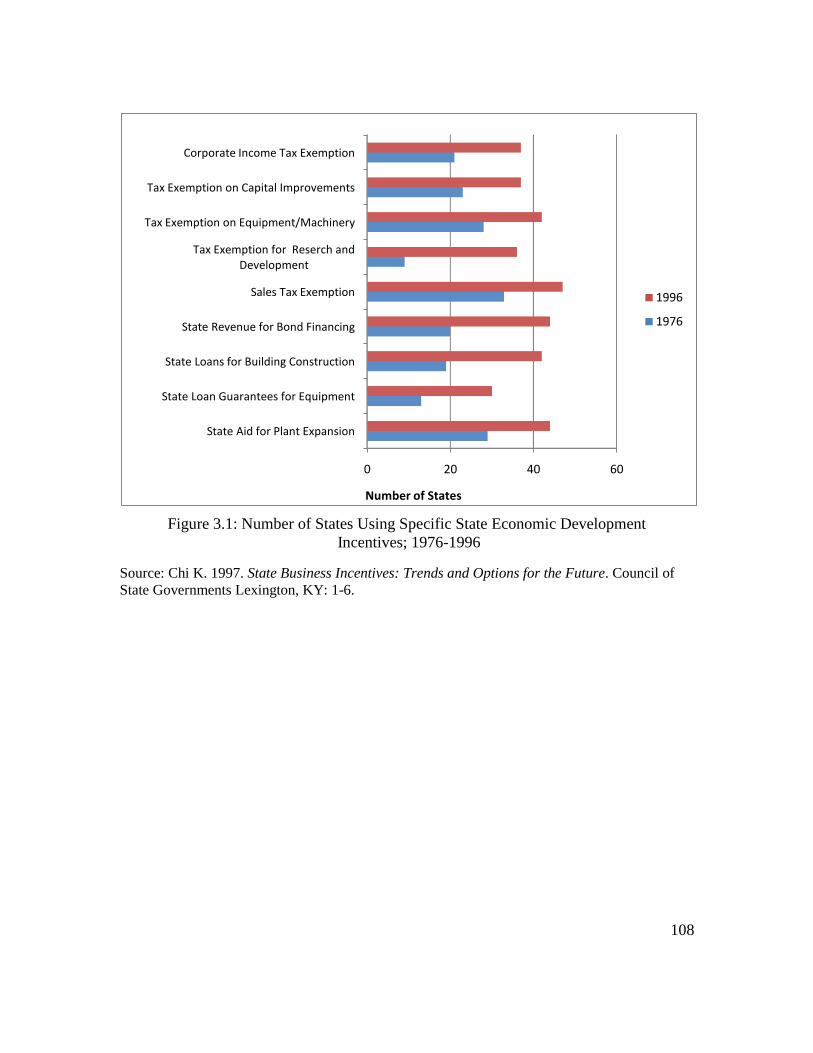
108
Figure 3.1: Number of States Using Specific State Economic Development
Incentives; 1976-1996
Source: Chi K. 1997. State Business Incentives: Trends and Options for the Future. Council of
State Governments Lexington, KY: 1-6.
0 20 40 60
State Aid for Plant Expansion
State Loan Guarantees for Equipment
State Loans for Building Construction
State Revenue for Bond Financing
Sales Tax Exemption
Tax Exemption for Reserch and Development
Tax Exemption on Equipment/Machinery
Tax Exemption on Capital Improvements
Corporate Income Tax Exemption
Number of States
1996
1976
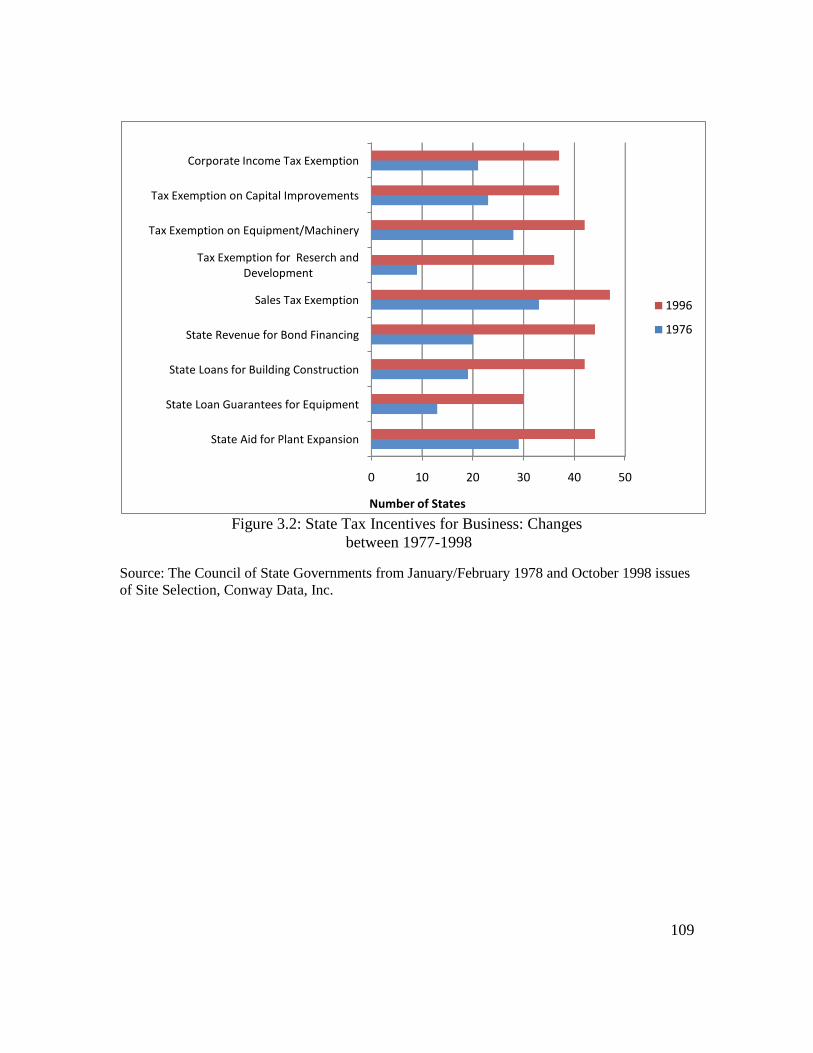
109
Figure 3.2: State Tax Incentives for Business: Changes
between 1977-1998
Source: The Council of State Governments from January/February 1978 and October 1998 issues
of Site Selection, Conway Data, Inc.
0 10 20 30 40 50
State Aid for Plant Expansion
State Loan Guarantees for Equipment
State Loans for Building Construction
State Revenue for Bond Financing
Sales Tax Exemption
Tax Exemption for Reserch and Development
Tax Exemption on Equipment/Machinery
Tax Exemption on Capital Improvements
Corporate Income Tax Exemption
Number of States
1996
1976
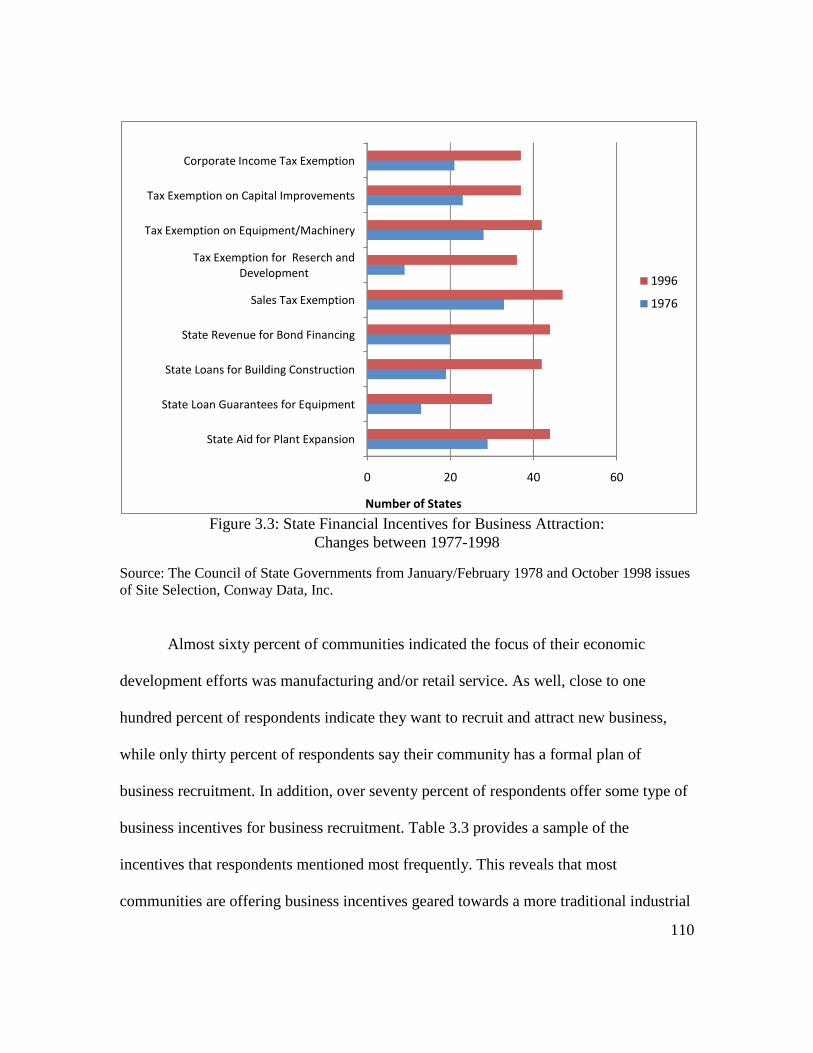
110
Figure 3.3: State Financial Incentives for Business Attraction:
Changes between 1977-1998
Source: The Council of State Governments from January/February 1978 and October 1998 issues
of Site Selection, Conway Data, Inc.
Almost sixty percent of communities indicated the focus of their economic
development efforts was manufacturing and/or retail service. As well, close to one
hundred percent of respondents indicate they want to recruit and attract new business,
while only thirty percent of respondents say their community has a formal plan of
business recruitment. In addition, over seventy percent of respondents offer some type of
business incentives for business recruitment. Table 3.3 provides a sample of the
incentives that respondents mentioned most frequently. This reveals that most
communities are offering business incentives geared towards a more traditional industrial
0 20 40 60
State Aid for Plant Expansion
State Loan Guarantees for Equipment
State Loans for Building Construction
State Revenue for Bond Financing
Sales Tax Exemption
Tax Exemption for Reserch and Development
Tax Exemption on Equipment/Machinery
Tax Exemption on Capital Improvements
Corporate Income Tax Exemption
Number of States
1996
1976
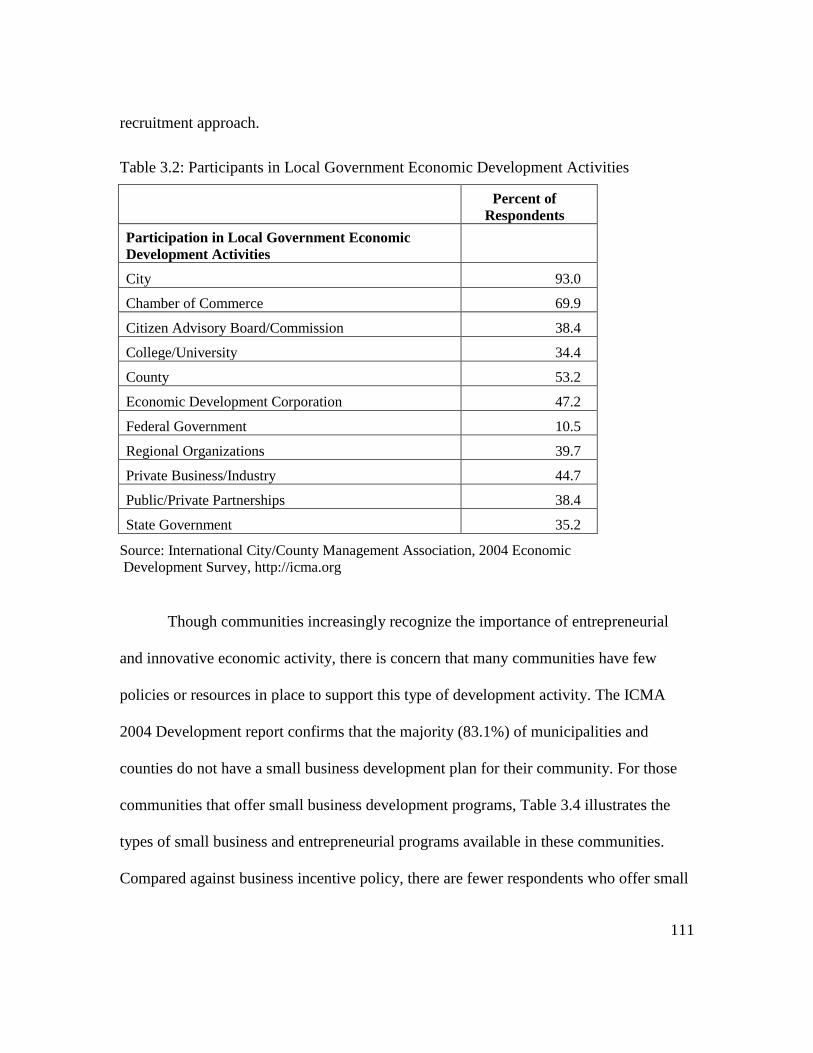
111
recruitment approach.
Table 3.2: Participants in Local Government Economic Development Activities
Percent of
Respondents
Participation in Local Government Economic
Development Activities
City 93.0
Chamber of Commerce 69.9
Citizen Advisory Board/Commission 38.4
College/University 34.4
County 53.2
Economic Development Corporation 47.2
Federal Government 10.5
Regional Organizations 39.7
Private Business/Industry 44.7
Public/Private Partnerships 38.4
State Government 35.2
Source: International City/County Management Association, 2004 Economic
Development Survey, http://icma.org
Though communities increasingly recognize the importance of entrepreneurial
and innovative economic activity, there is concern that many communities have few
policies or resources in place to support this type of development activity. The ICMA
2004 Development report confirms that the majority (83.1%) of municipalities and
counties do not have a small business development plan for their community. For those
communities that offer small business development programs, Table 3.4 illustrates the
types of small business and entrepreneurial programs available in these communities.
Compared against business incentive policy, there are fewer respondents who offer small

112
business oriented incentive programs.
Table 3.3: Local Government Incentive Offerings
Percent of
Respondents
Local Government Incentive Offerings
Zoning/Permit Assistance 68.4
Infrastructure Improvements 66.9
Tax Increment Financing 58.3
Tax Abatement 57.1
One-stop permit Issuance 41.4
Grants 38.1
Low-Cost Loans 33.6
Federal/State Enterprise Zones 33.1
Free Land or Land Write Downs 30.8
Training support 29.3
Source: International City/County Management Association, 2004 Economic
Development Survey, http://icma.org
In addition, over three quarters of respondents indicated their community does not
have a formal business retention plan. While communities mentioned a number of
business retention efforts, these results reveal that the business retention policy focus is
geared more towards mentoring and network building and less on providing concrete
(financial, infrastructure, equipment) types of business assistance. While generalizations
from this report and others like them maybe misleading, they may still serve as an
instructive tool for regional scientists in understanding and clarifying the economic
development policy profile of our nation‘s cities and counties. Overall, states, regions,
and localities continue to actively practice industrial recruitment and do not appear to be

113
making substantial reductions in industrial recruitment efforts or significant
improvements to alternative development programs. States have invested substantial
time, financial, and human capital resources towards the development of organizational
capacity to manage state and regional business incentives. Additionally, there are often
individual benefits to third parties involved in these negotiations and little accountability
to the public as to how these public dollars are spent. As a result, it is difficult to imagine
that incentive policy for industrial recruitment will be reduced and/or eliminated anytime
soon.
Table 3.4: Local Government Small Business Assistance
Percent of
Respondents
Local Government Small Business Assistance
Small Business Development Center 54.9
Revolving Loan Fund 48.3
Marketing Assistance 33.8
Business Incubator 28.9
Matching Involvement Grants 28.3
Management Training 20.8
Microenterprise Program 18.2
Executive Mentors 10.1
Vendor/Supplier Matching 8.4
Source: International City/County Management Association, 2004 Economic
Development Survey, http://icma.org
Community Development Corporations
Many communities are now also influenced by the economic development
activities of Community Development Corporations (CDCs). Historically, most CDC‘s

114
began their work in the area of community housing development, the past decade has
witnessed a dramatic expansion in service activities of these community non-profit
organizations (Glickman and Servon, 2009). Yin (1998) states that ―Over the last three
decades, the story of CDC‘s has progressed from that of the single organization doing
specific work in the community to that of participation in a complex web of partnerships
(p.138).‖ While housing services still dominate CDC efforts, they have expanded into
general economic development activities, community organizing, and other social
services.
Glickman and Servon (2009) survey 218 CDCs nationwide to better understand
the scope and breadth of CDC funding and development activity. They classify three
groups of survey respondents; community development partner funded CDCs (P-CDCs),
CDCs without development partner funding (NP-CDCs) and a control group of
community development organizations. Overall, they find that eighty percent of both
types of CDC‘s are actively engaged in economic development activities. Over half of
both types of CDC‘s are providing some kind of technical assistance or training to small
businesses. As well, thirty eight percent of P-CDC‘s provide entrepreneurial training to
firms, while thirty-five percent of NP-CDC‘s provide this type of business assistance. P-
CDC‘s are also more likely to provide business lending services (24 percent as opposed
to 15 percent) and microenterprise lending/development (25 percent versus 18 percent).
On average, each P-CDC‘s reported the creation of nine new firms from 1995 to 1997,
while each NP-CDC‘s reported the creation of six new firms over the period.
In addition to business development services, both types of CDC‘s are actively

115
engaged in job training and job placement activities. Almost fifty percent of both P-
CDC‘s and NP-CDC‘s provided some type of job training program. As well, almost fifty
percent of both types of organizations have job placement programming. In 1997, the
average CDC had over 100 job placements within their communities. Glickman and
Servon‘s (2009) research documents the increasing role of CDC‘s in community
economic development policy and implementation. Moreover, this research documents
that CDC‘s are increasingly active in community entrepreneurship efforts. With respect
to local entrepreneurship, CDC‘s may have unique insight into local business and
community strengths and weaknesses. As such, it is important to understand the impact
that CDC‘s may have on community entrepreneurship policy and its implementation.
Entrepreneurial Development
One of the criticisms of entrepreneurial policy is that it is often piecemeal and
ignores important components of the entrepreneurial process.. Based on this criticism
Lichtenstein and Lyon‘s (2004) research proposed a more holistic approach to
entrepreneurship policy through the creation of Entrepreneurial Development Systems
(EDS). Lichtenstein and Lyons (2010) suggest that the problem with the current climate
of entrepreneurship policy is that it almost exclusively focuses on the provision of
services and little on the development of actual entrepreneurs. Entrepreneurial
development implies that entrepreneurs are made not born (Shefsky, 1996). Lichtenstein
and Lyons acknowledge that entrepreneurship takes place in a diversity of settings, with
entrepreneurial talent unevenly distributed across regions. They argue the most useful

116
way to classify a region‘s entrepreneurs is by their unique skills and their individual firm
development and growth. However, very few entrepreneurial development programs
classify entrepreneurial clients by estimates of ability, size and type. Current
programming efforts generally fall into one of two categories: cookie cutter or
individualized. Lichtenstein and Lyons advise that these two kinds of policy efforts
represent a tradeoff between efficiency (cookie cutter) and effectiveness (individualized).
A more holistic policy effort is one that systematically focuses on the unique qualities of
entrepreneurs and acknowledges the transformative nature of the entrepreneurship
process.
A successful EDS recognizes that entrepreneurship is a long term process
requiring ongoing community support, enhanced interaction and mentorship between
entrepreneurs and community and business professionals, and the creation of a favorable
business climate and entrepreneurial culture. Lichtenstein and Lyons use quality
management research over the past fifteen years to underscore the importance of clearly
understanding a given process before one can improve a specific outcome (Crosby, 1987;
Deming, 1986). As such, they argue that an EDS ―must be organized around a set of
processes and practices that can be implemented in a methodical, controllable, and
reproducible fashion (Lichtenstein and Lyons, 2010, p.10).‖ The ultimate objective of
this entrepreneurial system would be to create a steady supply, or pipeline, of
entrepreneurs for a given region.
Using sports metaphors, Lichtenstein and Lyons characterize their EDS as a ―farm
system‖ for the ongoing creation of regional entrepreneurs. Entrepreneurs are classified

117
into one of five categories; Majors, Triple A, Double A. Single A, and Rookie, based on
their skill classification within four key characterization; technical skills, managerial
skills, entrepreneurial skills, and personal maturity (Gerber, 1995; Lichtenstein and
Lyons, 1996). Entrepreneurs in the same ―league‖ are grouped together into teams that
allow for efficiently addressing similar needs and problems, as well as permitting
relevant peer mentoring and support (Sher and Gottlieb, 1989). The EDS customizes a
plan for each entrepreneur based on the individual‘s level of personal and business
development. In this way entrepreneurs are provided with a map to guide their business
to higher levels of business growth and performance.
Goetz et al. (2010, p.26) succinctly summarizes the primary objectives of an EDS
system:
EDSs are designed to further economic development in lagging communities by:
1) developing and expanding the pipeline of entrepreneurs; 2) building
institutional and other support systems for entrepreneurs (including coaching,
access to capital and market information, etc); and 3) influencing state and local
policies.
Additionally, EDS‘s attempt to be inclusive by supporting and encouraging the
entire pool of a particular community‘s entrepreneurial base. EDS‘s also provide a
method to overcome the current diverse and fragmented application of entrepreneurial
development policy (Reynolds and White, 1997).
EDSs have been implemented in a number of locations across the country which
allows for a preliminary investigation of their successes and failures. In 2004, the
Kellogg Foundation funded six EDS‘s nationwide with a $2 million grant each over a

118
three year period. Edgcomb et al., (2008) conclude that these investments enhanced
community understanding and support of entrepreneurship. Their research also found that
a statewide approach to these efforts is more successful than individual, community
efforts. Arguably one of the most important conclusions is that these EDSs were able to
develop the appropriate structure and solutions to ensure the sustainability of these
systems (Edgcomb et al., 2008). However, entrepreneurship policy efforts are long term
endeavors. Without additional support for these EDSs, $2 million is not likely to be
enough to effect long term entrepreneurial change (Goetz et al., 2010).
The Appalachian Regional Commission (ARC) has also been investing heavily in
policy efforts to improve the entrepreneurial climate across the Appalachian region. Since
1997, the ARC has invested $43 million towards entrepreneurial policy efforts (Goetz et
al., 2010). Markley et al. (2008) find that, over this time period, these programs have
increased the number of firms and jobs in the region. Moreover, new business sectors
have emerged and overall, the entrepreneurial pipeline has improved and expanded.
Additionally, several important lessons are highlighted in this research. Markley et al.
(2008) stress the importance of local champions and leveraging local knowledge to
improve the opportunities for success of these programs. The ARC‘s efforts also
underscore the importance of a region‘s entrepreneurial climate and point to potential
challenges that regions may have in improving the entrepreneurial climate. Finally, these
researchers argue that standard economic development metrics should be reconsidered
when evaluating entrepreneurial policy (Markley et al., 2008). Incorporating different
entrepreneurial measures into these metrics could broaden our understanding of the
119
success and failure of these policies, along with understanding when public support may
be justified.
Similar to EDS‘s, regional innovation initiatives may be an important framework
from which states and regions can include entrepreneurship policy (Pages, 2006). Placing
entrepreneurship in the broader context of a regional innovation strategy may allow for
entrepreneurship to be seen as the outcome of a broader set of inter-related strategies
related to innovation, human capital, physical capital, and technology investment.
Viewing entrepreneurship as a part of a regional innovation strategy may avoid
unrealistic policy expectations. As one example, elected officials and other community
stakeholders may understand that regional innovation initiatives, of which
entrepreneurship is a part, require long-term community investment.
Pages and Poole‘s Understanding Entrepreneurship as an Economic
Development Strategy: A Three State Survey
Research by Pages and Poole (2003) provides critical background for this and
related research efforts. As the field of economic development has changed over the past
several decades, economic developers have been asked to incorporate a wider set of
approaches into their development tool kits. Entrepreneurial development activities have
taken on greater importance for state, local and regional development professionals.
Pages and Poole (2003) begin by defining entrepreneurial development as ―the practice of
encouraging the creation and growth of start-up companies (2003, p. 1).‖ Their three state
(Maine, Nevada and Pennsylvania) survey begins to clarify the scope and breadth of
local, regional and state entrepreneurial development programs. The economic

120
development organizations surveyed in this analysis include state and local economic
development agencies, small business development centers, regional technology councils,
chambers of commerce, business incubators, university sponsored entrepreneurship
programs, and other related non-profit agencies. The survey focused on entrepreneurial
development programs that emphasize non-financial assistance and/or direct financial
assistance. Examples include programs aimed at supporting new business development
efforts through access to education, business counseling, and facilities and equipment.
They also include programs that assist with the acquisition of equipment, technology,
seed and/or venture capital programs.
There are a number of key findings that are important for the current research.
Organizations that rate entrepreneurship as their highest priority are more likely to have
entrepreneurial development programs and invest in them at higher levels. In addition,
states and organizations with a longer and more substantial commitment to
entrepreneurial development type programs are more likely to rate these policies and
programs as a top priority compared to business attraction or business retention policies.
In Pennsylvania, which has had active involvement in public sector economic
development activities since the 1950s, over half of the organizations surveyed rated
entrepreneurial development as their top priority. Comparatively, over two-thirds of
Maine‘s organizations ranked business retention as their top priority, while Nevada
respondents were split, respectively ranking 50 % business attraction and 50% business
retention as the top priority. While these results may not be surprising, they do confirm
that the level of actual and perceived importance a state places on entrepreneurial

121
development policy may influence the local and regional practice of economic
development15
. Their research also confirms that entrepreneurial development continues
to be a relatively new policy focus as over half of the programs documented here have
been created since 1990.
Program services provided by these organizations vary depending on the type of
organization and how they rate entrepreneurial development as an organizational priority.
Those organizations that rate entrepreneurial development as their highest priority are
more likely to implement business training and management/marketing assistance
programs. Those that did not rate it as the highest priority were more likely to offer space
and/or business permitting or regulatory assistance for new business. Pages and Poole
provide evidence that most development organizations, even those that rate
entrepreneurship development highly, utilize programming that is relatively lower cost
and is focused on more technical, as opposed to capital intensive, activities.
Funding continues to be a significant barrier to the implementation of
entrepreneurial development programs. States continue to remain the most important
source of funding for these organizations. In an era of accountability, the majority of
organizations surveyed practice at least a minimum assessment of their programmatic
efforts. For entrepreneurial program evaluation, job creation remains the primary
measurement used to track program success and/or failure. However, program managers
and funders indicate they expect to see program results within 16 months. This reveals an
15
There is an underlying causality question here. This relationship could also be working in the other
direction; successful local and regional development policy influences the actual and perceived importance
of entrepreneurial development policy.

122
underlying policy concern. Entrepreneurship is a long-term process; for those businesses
that make it beyond the first few years, it may still take five years or more to turn a profit.
Moreover, employment growth is likely to be small and gradual for new firms and may
not properly reveal the potential long-term benefits of local entrepreneurship
development. Unrealistic policy expectations could ultimately encourage both managers
and customers to make choices that are not in the best interest of local economic
development or the entrepreneurial firm.
Pages and Poole (2003) classify the majority of entrepreneurial development
programs described in this research as adolescent in their development. The more
formalized and institutionalized these programs are, the more likely the development
organization is to make these programs a priority. In order for current programs to
mature, Pages and Poole call for a number of changes to existing program operation and
design. States should first consider regional policy efforts to enhance economies of scale
and increase the opportunities for external funding. Organizations should continue to
diversify their funding base. Researchers and organizations should consider collaborating
to continue improving evaluation and performance measures. In addition, organizations
would benefit from enhanced professional development efforts focused specifically on
entrepreneurial programming efforts.
These researchers, and others, have stressed the importance of a revised system of
performance metrics that can be used to evaluate entrepreneurship programming more
effectively. As one researcher notes, short term job creation should not be the primary
objective of entrepreneurial policy efforts (Pages, 2006). Moreover, simply ensuring the

123
appropriate business climate is also not enough. Revising performance measures must be
comprehensive by incorporating measures related to innovation, human capital,
investment capital, and quality of life variables. Lessons can be learned from the
European Union and the OECD, who have each undertaken a comprehensive analysis of
best practice tools and measurement for regional innovation and entrepreneurship.
Researchers continue to caution that each region is unique and performance metrics
should be developed in close collaboration with regional or local professionals.
Moreover, measurements should be useful to a range of stakeholders; the entrepreneurs,
community leaders, as well as local community members.
The diverse assortment of policy measure aimed at entrepreneurship reveals the
fragmented nature of the field and the diversity of opinion concerning the most effective
policy measures in promoting regional entrepreneurship. Some professionals argue that
regional development policy should first focus on providing the necessary public
infrastructure (energy, water, telecommunications, etc.) and social services (education,
health, etc) for businesses to be successful (Audretsch, 2002; Glaeser, 1998). Along these
same lines, Bates (1993) argues the most effective policy measures are those that focus
on capital gains tax incentives, encouraging immigration of educated individuals, and
preferential public procurement.
Klein and Hadjmichael (2003) argue that ―lasting subsidies are undesirable and
that business development service should be market oriented and privately provided (p.
82).‖ The implication of this research is that public policy can and should consider
focusing on basic and market infrastructure but public institutions should not intervene if

124
they cannot perform their function better than the private market (Acs 2005; Bates,
1993). More generally, public policy in support of local and regional entrepreneurship
should emphasize competitiveness, a level playing field for all firms, and active
promotion of entrepreneurial activity (Parker, 2002; Mody, 1999).
OECD (1997) confirms the most important role of public policy in entrepreneurial
development is in creating a supportive business environment for small business and
entrepreneurial growth. Moreover, this research argues that entrepreneurship policy
should consider the unique regional context of each effort and should be implemented by
local professionals who have the knowledge of local conditions and needs. For example,
workforce development efforts may be more effective in dense urban areas with greater
population density, while firm creation policies maybe more effective in rural regions as
there are fewer displacement effects when compared against urban locations (OECD,
1997). Overall, the OECD proposes five conditions for entrepreneurial policy best
practices. They include: access to financing, market access, a supportive business
environment, the existence of skilled business managers, and the availability of necessary
technology.
It is tempting for communities to target their policy efforts towards sectors they
believe have the greatest probability of success. Even given this temptation, a ―picking
winners‖ approach in economic development policy can be risky and is not recommended
as a basis for public policy (Autio and Hancock, 2005; Edmiston, 2007). For example, it
could be a policy mistake to narrow the definition of entrepreneurship to specific kinds of
high-growth, high-tech firms. While all communities naturally want high growth, serial

125
(repetitive) entrepreneurs in their communities, they should not discount the value-added
of aspiring, survival and/or lifestyle entrepreneurs. Dabson (2007) argues that the policy
goal should be to encourage a diverse range of individuals who want to create and grow
new businesses from which a stream of local and regional entrepreneurs will continue to
enhance local and regional economic growth, now and in the future.
In sum, while there continues to be debate over the correct policy approach to
encourage and support entrepreneurship, there is considerable evidence that communities
must start with creating an attractive and supportive business environment. From a macro
level, federal and state government can do much to support an entrepreneurial friendly
environment. However, as the Economist magazine (2008) notes, ―Siliconitis‖ is the
disease that many policy makers have and one that is a mistake for many communities. It
is a mistake for most communities to think that they can recreate a ―Silicon Valley.‖
Communities should, however, consider a broad range of policy efforts that enhance
workforce development and general education levels, maintains and supports high-quality
physical infrastructure, provides evidence of good governance and civic infrastructure,
and supports local and regional natural amenities and assets (Edmiston, 2007). While no
two communities are the same, all of the above policy measures could work in any
community to improve the creation and support of local entrepreneurs.
State Entrepreneurial Policy
There is little question that state and local government can play a role in the
success of regional entrepreneurship. What remains unclear is what the policy landscape

126
for entrepreneurship looks like across states and regions. Entrepreneurial development
efforts are an increasingly important part of state policy, but the scope and breadth of
these efforts remain quite mixed (Kayne, 1999). State policy and programs generally fall
into 2 categories. In one category are states with well defined objectives for the
development and success of state entrepreneurs, while in the second category states
encourage entrepreneurship under a general umbrella of economic development
programming. As an example, 13 of the 37 state survey respondents do not differentiate
between entrepreneurs and small businesses16
in state development programs. The
Kauffman Foundation‘s research indicates that states that have a better understanding of
the unique contribution of entrepreneurs to state economic growth are more likely to have
policy measures in place that support the specific needs of entrepreneurs.
The National Association of State Development Agencies (NASDA) 1998 survey
of state economic development agencies reports that only $19 million of the $26.7 billion
spent on economic development was targeted towards entrepreneurial development.
NASDA defines entrepreneurial development as ―state activities that support start up
businesses or provide seed capital to emerging companies (Kayne, 1999, p. 11).‖
Moreover, 25 states reported no state funding towards entrepreneurial development. This
is not to say that entrepreneurs do not creatively take advantage of other state economic
development programs that are available to all businesses operating in the state.
16
The Small Business Administration (1978, p.121.1) indicates a ―small business concern shall be deemed
to be one which is independently owned and operated and which is not dominant in its field of operation."
Entrepreneurs are generally characterized as taking on greater risk, incorporating more innovation in their
endeavors, and potentially having higher growth potential than the average small business owner.
Entrepreneurs may be small business owners but they may also be a part of much larger organizations and
many small business owners are not entrepreneurs.

127
However, the Kauffman Foundation observes that state programs falling into this
category, such as labor force development, infrastructure investment, competitive tax
policies, and regulatory changes, are often used within a traditional business retention and
industrial recruitment framework and may do little to impact entrepreneurship.
Research by the National Commission on Entrepreneurship (Kauffman Center for
Entrepreneurial Leadership, 1998) holds that state policy can have a substantial impact on
where entrepreneurs choose to locate new businesses and whether these ventures will
succeed. The National Governors‘ Association (NGA) reports that state policy can create
an entrepreneurial-friendly environment by nurturing the following policy efforts:
Integrate entrepreneurship into state economic development efforts.
Use education to nurture and encourage future entrepreneurs.
Incubate entrepreneurial companies
Invest in diverse sources of risk capital.
Streamline the regulatory environment that impacts entrepreneurial firms.
One method of benchmarking and comparing state performance on economic
development strategies is through the use of state rankings and comparative indices. The
use of these rankings has become quite commonplace as states classify themselves across
a range of indicators meant to capture innovative and entrepreneurial economies. While
these indices have methodological drawbacks, they can provide insight into possible
performance trends within a state.
A review of the range of entrepreneurial programming offered in South Carolina,

128
reveals that the state fits the model of states and regions that support entrepreneurship
under a mantle of general economic development programs. This would indicate that
South Carolina does not acknowledge the unique characteristics of entrepreneurs and is
more likely to implement general economic development policies and programs to
benefit entrepreneurs along with all businesses in the state.
The following review of South Carolina indices of development and
entrepreneurial activity provide insight into the scope and breadth of entrepreneurial
policy across the state. Table 3.5 illustrates the 2008 rankings of the State Technology
and Science Index from the Milken Foundation. This table includes South Carolina and
its two closest neighbors, Georgia and North Carolina. This index provides an overall
score and five other component indices, three of which are described here. The Research
and Development Inputs Index is meant to embody the ability of a region to capture a
range of federal, industry and academic research and development inputs. The Human
Capital Investment Index is meant to measure the stock of human capital, with particular
emphasis on the science and engineering fields. Finally, the Risk Capital and
Entrepreneurial Infrastructure Index addresses the stock of entrepreneurs and risk capital
within a state. South Carolina is lower in all indices than its neighbors and in some
instances substantially lower. The state‘s overall ranking improved from 2004 to 2008,
rising from 44th
to 42nd
. According to this set of indices, South Carolina appears to be
weakest in the area of human capital investment and has experienced the most
improvement in the area of risk capital and entrepreneurial infrastructure.
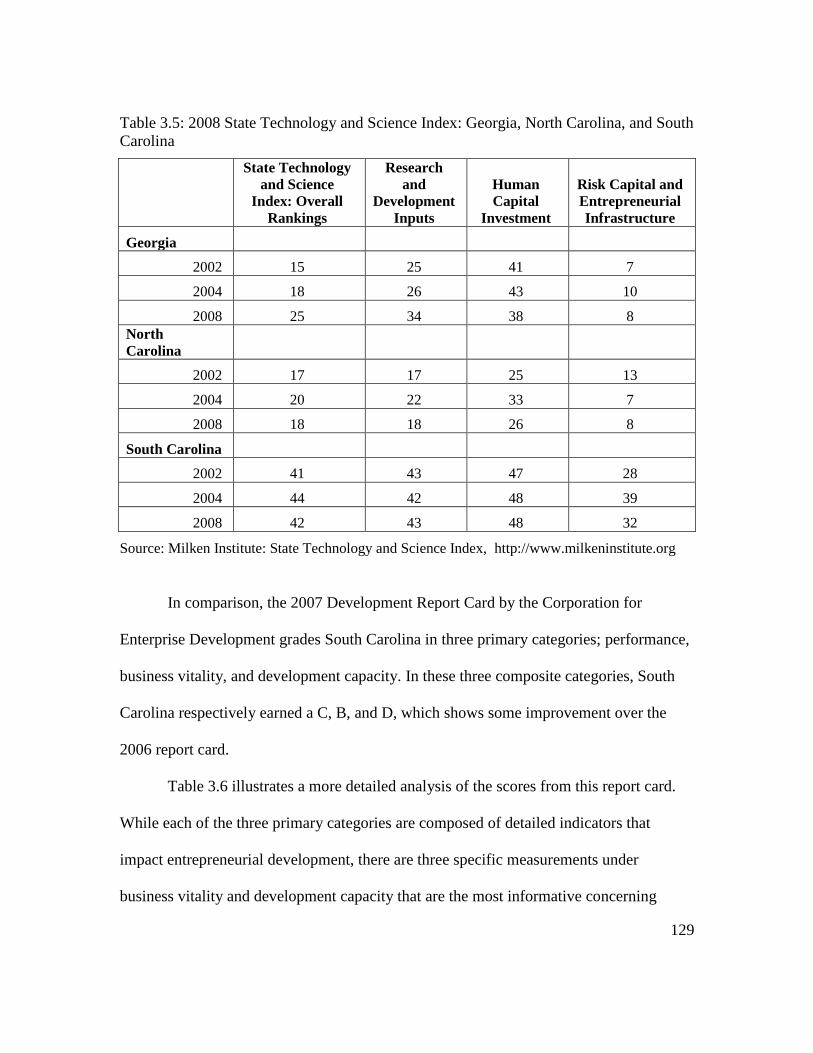
129
Table 3.5: 2008 State Technology and Science Index: Georgia, North Carolina, and South
Carolina
State Technology
and Science
Index: Overall
Rankings
Research
and
Development
Inputs
Human
Capital
Investment
Risk Capital and
Entrepreneurial
Infrastructure
Georgia
2002 15 25 41 7
2004 18 26 43 10
2008 25 34 38 8 North
Carolina
2002 17 17 25 13
2004 20 22 33 7
2008 18 18 26 8
South Carolina 2002 41 43 47 28
2004 44 42 48 39
2008 42 43 48 32
Source: Milken Institute: State Technology and Science Index, http://www.milkeninstitute.org
In comparison, the 2007 Development Report Card by the Corporation for
Enterprise Development grades South Carolina in three primary categories; performance,
business vitality, and development capacity. In these three composite categories, South
Carolina respectively earned a C, B, and D, which shows some improvement over the
2006 report card.
Table 3.6 illustrates a more detailed analysis of the scores from this report card.
While each of the three primary categories are composed of detailed indicators that
impact entrepreneurial development, there are three specific measurements under
business vitality and development capacity that are the most informative concerning

130
entrepreneurship in South Carolina. These categories, entrepreneurial energy, human
resource development, and innovative asset development respectively earned grades of C,
D, and F. Each of these measurements is also composed of a variety of indices where
each state is ranked and compared against other states. For example, within
entrepreneurial energy there are five different components, including new companies,
change in new companies, job creation in start up businesses, technology industry
employment, and initial public offerings. South Carolina is ranked from a high of 8 in job
creation by start-up businesses to a low of 43rd
in technology industry employment.
Within the categories of human resources and innovation assets, South Carolina
fares considerably worse. The highest ranking in these categories is 29th
for teacher
salaries, while the lowest ranking, 49th
, for graduate students in science and engineering.
According to the Development Report Card, South Carolina has seen overall
improvements in the competitiveness of existing business and entrepreneurial energy, but
has considerable room for improvement in access to financial and human resources and
innovation assets.
The Corporation for Enterprise Development discontinued the Development
Report Card for the States in 2007. In its place it now publishes an annual publication, the
Assets and Opportunities Scorecard, for each state. According to their website, this new
report card is ―a comprehensive look at wealth, poverty, and the financial security of
families.‖ To capture this there are six key issue areas in which composite indices are
calculated: financial assets and income, businesses and jobs, housing and
homeownership, health care, education, and community investment and

131
Table 3.6: 2007 Development Report Card: South Carolina
Source: Corporation for Enterprise Development, 2007 Development Report Card for the States,
http://www.cfed.org
accountability policies. While all of these have relevance for economic development, the
issue areas of businesses and jobs and education have the most direct impact on economic
development and entrepreneurship. South Carolina received a grade of F on its overall
2009-2010 Assets and Opportunities Scorecard and an F on each of the aforementioned
issue areas. According to this report, South Carolina must develop policies that facilitate
asset building for all income earners, make education across all grade levels a priority,
and curb predatory lending practices.
The 2008 State New Economy Index published by the Kauffman Foundation
provides additional insight into a state‘s entrepreneurial capacity. This index uses twenty-
nine indicators to represent the capacity of a state to be firmly grounded in the new
economy. These indicators consist of variables that represent one or some combination of
Grade
Grade
Grade Overall
Performance
Ranking C Overall Business
Vitality Ranking B
Overall
Development
Capacity Ranking D
Employment C Competitiveness of
Existing Businesses B Human Resources D
Earnings and Job
Quality D Entrepreneurial
Energy C Financial Resources D
Equity D
Infrastructure
Resources C
Quality of Life B
Amenity Resources
and Natural Capital B
Resource
Efficiency C
Innovation Assets F

132
characteristics of a new economy region. Variables representing knowledge, or new
economy, characteristics focus on the global economy, information technology sectors,
and an emphasis on classic representations of entrepreneurship and innovative
economies. These indicators are meant to represent either directly or indirectly an
entrepreneurial, innovative, and dynamic economic environment.
This analysis gives South Carolina an overall ranking of 34. Table 3.7 provides a
sample of these indicators for South Carolina. The rankings range from a high of 28th in
industry investment in research and development and venture capital to a low of 45th in
entrepreneurial activity and inventor patents. Based on The Kaufman Foundation‘s prior
rankings, South Carolina has seen modest improvement in some of these indicators.
However, all of these indicators17
indicate that South Carolina continues to be ranked in
the bottom half of states across a wide range of new economy oriented variables. In some
instances South Carolina is in the lowest twenty percent of states. In sum these three
indices highlight the possibility of significant gaps in South Carolina‘s ability to
effectively compete in the new economy. To obtain a more complete picture of the
entrepreneurial landscape in South Carolina, the next section uses publicly available firm
and establishment data to further characterize the small business and entrepreneurial
environment across the state.
17
These indicators are not directly comparable. They are simply instructive.

133
Table 3.7: 2008 State New Economy Index: South Carolina
Rank
"Gazelle Jobs" 39
Entrepreneurial Activity 45
Inventor Patents 45
High-Tech Jobs 39
Scientists and Engineers 35
Patents 42
Industry Investment in R & D 28
Venture Capital 28
Source: The Information Technology & Innovation Foundation,
Ewing Marion Kauffman Foundation, The 2007 State New Economy Index.
South Carolina Entrepreneurial Profile
One of the first places to begin measuring state level entrepreneurship is by
carefully profiling firm and establishment data by employee size. It is true that medium
and large firms can have entrepreneurial characteristics, but for the purpose of this
analysis the focus will be on entrepreneurial firms defined as those with twenty of fewer
employees. Table 3.8 reveals the percentage change in firms, establishments, employees
and annual payroll by employee size from 1990-2000 and 1990-2007. The Bureau of
Labor Statistics defines firms as ―a legal business, either corporate or otherwise, and may
consist of one establishment, a few establishments, or even a very large number of
establishments (www.bls.gov).‖ Further, establishments are defined as ―an economic unit
that produces goods or services, usually at a single physical location, and engaged in one
or predominately one activity (www.bls.gov).‖ For periods, 1990-2000 and 1990-2007,

134
medium and large employers had larger percentage changes in every category except
annual payroll.
Table 3.8: Percentage Change of Firms, Establishments, Employment and Payroll by
South Carolina Firm Size
Firms (%) Establishments
(%) Employment
(%) Annual Payroll
(000 %)
0-4 Employees
1990-2000 15.67 15.61 13.02 75.48
1990-2007 26.15 25.90 26.14 126.89 20 or less
Employees
1990-2000 16.99 16.63 18.63 73.02
1990-2007 24.49 23.89 24.36 109.61
20 -99 Employees
1990-2000 26.79 25.08 27.59 88.36
1990-2007 38.47 43.46 38.87 156.87 100 or more
Employees
1990-2000 33.94 41.36 28.49 85.73
1990-2007 43.37 66.60 28.16 122.91 500 or more
Employees
1990-2000 37.85 41.82 30.00 86.77
1990-2007 43.69 70.85 27.25 116.75
Source: United States Small Business Administration, Employer Firms, Establishments,
Employment, and Annual Payroll by Firm Size, (Annual payroll in thousands of dollars),
http://www.sba.gov/sites/default/files/st_totals.pdf.
Another measure of entrepreneurial activity can be captured by firm births and
firm deaths in a state or region. This indicator is often called business churning.
According to Table 3.9, twenty-three of South Carolina‘s forty six counties have birth to
death ratios of over 1 (indicating that for every firm death, more than one additional firm

135
is born). This data confirms much of the research on entrepreneurship and business
churning. There is considerably more business churning in the metropolitan or near
metropolitan regions of the state. From this list of twenty-three counties, fourteen are
Table 3.9: South Carolina‘s Top Business Churning Counties
Ratio of Births
to Deaths Metro Status
Orangeburg 1.01 Micropolitan
Anderson 1.04 Metropolitan
Sumter 1.04 Metropolitan
Florence 1.06 Metropolitan
Williamsburg 1.07 Rural
Barnwell 1.14 Rural
Hampton 1.16 Rural
Cherokee 1.18 Micropolitan
Lancaster 1.19 Metropolitan
Spartanburg 1.19 Metropolitan
Dorchester 1.22 Metropolitan
Greenville 1.22 Metropolitan
Oconee 1.22 Micropolitan
Lexington 1.27 Metropolitan
Kershaw 1.29 Metropolitan
Richland 1.30 Metropolitan
Charleston 1.31 Metropolitan
Beaufort 1.32 Micropolitan
Georgetown 1.34 Micropolitan
Horry 1.35 Metropolitan
York 1.46 Metropolitan
Newberry 1.50 Micropolitan
Berkeley 1.63 Metropolitan
Source: U.S. Bureau of Labor Statistics, Business Employment Dynamics,
http://www.bls.gov/bdm/bdmstate.

136
metropolitan counties, six are micropolitan counties and three are rural counties. Of the
ten counties with the highest ratio of churning, seven are metropolitan areas and three are
micropolitan areas.
Overall, these data reveal that small firms across South Carolina are not growing
as quickly as medium and large firm and that business churning is positive in half of
South Carolina counties. Firm growth is based on a variety of factors but one contributor
is certainly the public policy environment. The literature and background presented
provides evidence that South Carolina remains a state heavily invested in industrial
recruitment and encourages entrepreneurship under a broad mantel of general business
support programs. The next section begins to explore how local and regional
policymakers across the state view industrial recruitment and entrepreneurial
development as policy priorities.
Methodology and Survey Summary
Evidence presented in the literature review reveals that many states continue to
practice incentive-based economic development policy. A number of reasons have been
put forth to explain this seeming policy paradox (Burnier, 1992). One view is that
policymakers feel pressure to make this type of development policy top priority (Wilson,
1989). This pressure may originate from voters, existing businesses, or other states. When
these policies are successful, development officials can potentially tout job gains,
enhanced infrastructure investment, and improvements to local revenue among other
benefits. The benefits from these policies are questionable and there is ongoing concern

137
that potential costs or losses to the community are omitted or downplayed in the
discussion. Chi (1989) argues that states are not about to reverse their course of action in
offering tax and financial incentive programs. There is a path-dependent element to this
investment; states are reluctant to disavow programs in which they have invested
substantial time and financial resources.
This analysis uses a statewide survey of local and regional economic developers
to gain a more comprehensive understanding of the local and regional commitment to
entrepreneurship policy efforts. The objective of this research is to sample a wide range
of community and economic development practitioners who could provide insights
regarding entrepreneurship and other economic development policy priorities across the
state. Economic development is carried out in most states by a variety of organizations
and professionals, and South Carolina is no exception. As a result, the survey sample
included as many different types of organizations that we understood to have an active
role in economic development policy and practice across the state. In addition, because of
the expanding economic development role of Community Development Corporations,
these organizations are also included in this analysis.
The South Carolina Economic Developers Association database and the South
Carolina Community Developers Association directory were used to define an
appropriate sample of economic development professionals. The survey was not meant to
be a random sample but to capture a range of input from different development
professionals and organizations across the state that have an active role in economic
development policy. The hypothesis was that any organization with a functional role in

138
economic development may also be involved in entrepreneurial policy efforts and, if not,
they may still have relevant knowledge and feedback for a survey of this nature. As such,
survey results should represent a broad measure of the awareness of respondents
regarding economic development in their area. In consultation with Clemson University
economic development and extension professionals, a sample of 160 organizations were
chosen representing the following different types of organizations; Community
Development Corporations, Chambers of Commerce, Council of Governments,
Community Colleges/Workforce Development; and Economic Development Agencies.
An online survey platform was chosen to disseminate and manage survey
responses. In March 2008 test surveys were sent to twenty-nine economic and
community development professionals. The week of October 22 emails were sent to 160
potential respondents. Follow up emails were sent two weeks later, with a final reminder
sent in the first week of January. It was evident early in the survey process that some
CDC‘s did not all have the capacity18 to respond by email. As a result, a number of CDC
surveys were conducted over the phone. A total of 99 surveys were completed, a response
rate of almost 62 percent. Table 3.10 describes summary statistics of survey respondents.
The largest number of respondents were CDCs (36), Local/Regional or Planning
Organizations (i.e. Council of Governments) (22), and Chamber of Commerce or Local
Business Development Organizations (14).
While the breadth of organizations appears to be well represented, it was also
18
Reasons varied but some examples were that individuals did not have adequate access to a computer with
internet, the CDC had no paid staff and relied on volunteer support, and individuals travelled a lot and as
such conducting the survey over the phone was easier.

139
important to have representation from organizations that have a long tradition of being
directly involved with local and regional economic development. Both Chamber of
Commerce/ Local Business Development Organizations and Local/Regional or Planning
Organizations (i.e. Council of Governments) are generally the organizations that many
individuals consider the ―local economic development‖ practitioner in their area. In total,
these groups had 36 respondents. The average budget and number of employees varied
significantly among these groups.
Table 3.10: Survey Sample Organization Types, Average Budgets and Numbers of
Employees.
Sample Organizations Respondents Average
Budget*
Average
Number of
Employees**
Community Development Corporation
or Local Non Profit Organization 36 589,875 4.16
Chamber of Commerce or Local
Business Development Organization 14 510,692 6.27
Educational Institution 8 145,000 145.43
Local Elected Official 2 1,450,000 6.50
Local/Regional or Planning
Organization (i.e. Council of
Governments) 22 399,000 15.85
Municipal or County Staff 9 352,707 2.38
Other 8 866,250 5.00
* CDC's had three outliers (2 @ $0 and 1 @ $25,000,000) that were not used to determine the
average budget; Educational Institutions also had one outlier ($1,700,000) that was not used to
determine the average budget.
** CDC's had one outlier (350) that was not used to determine the average number of employees;
Educational Institutions also had two outliers (600 and 1500) that was not used to determine the
average number of employees
In addition, survey respondents represented a range of service areas and
represented a majority of South Carolina counties. Figure 3.4 indicates that the majority
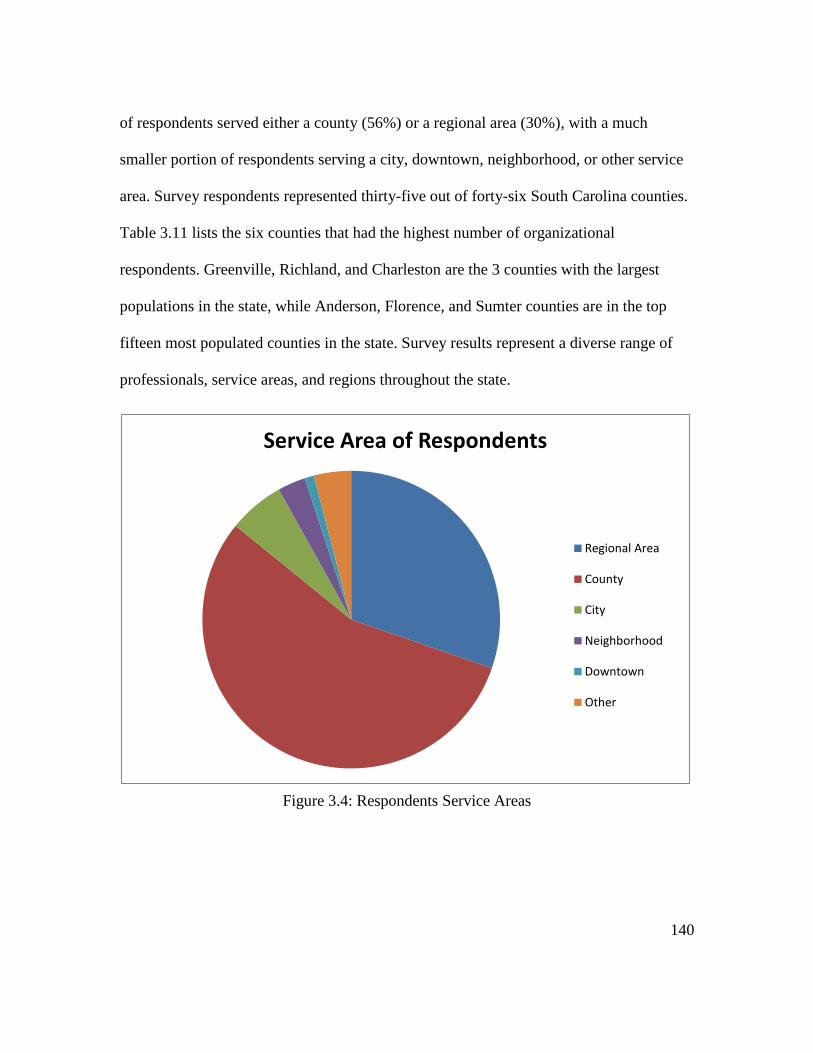
140
of respondents served either a county (56%) or a regional area (30%), with a much
smaller portion of respondents serving a city, downtown, neighborhood, or other service
area. Survey respondents represented thirty-five out of forty-six South Carolina counties.
Table 3.11 lists the six counties that had the highest number of organizational
respondents. Greenville, Richland, and Charleston are the 3 counties with the largest
populations in the state, while Anderson, Florence, and Sumter counties are in the top
fifteen most populated counties in the state. Survey results represent a diverse range of
professionals, service areas, and regions throughout the state.
Figure 3.4: Respondents Service Areas
Service Area of Respondents
Regional Area
County
City
Neighborhood
Downtown
Other

141
Table 3.11: Largest County Survey Respondents
Counties Number of
Respondents Percent of
Respondents
Richland 9 25.71%
Greenville 7 20.00%
Sumter 6 17.14%
Anderson 5 14.29%
Charleston 5 14.29%
Florence 5 14.29%
Over 80% of respondents have had specific training in economic development.
Further, the majority of respondents both live and work in the same community. The
average length of time living in the local community was over twenty years. This time
span indicates a level of both knowledge of and commitment to the local community.
While this longevity can serve a community well in determining policies that best-serve
local strengths and weaknesses, it can also represent entrenched interests or a negative
group think orientation.
There are a number of similarities across responses concerning the issues that are
most important for communities in the near future. The following responses were ranked
by at least one respondent as one of the five most important issues facing their
community.
Adequate housing
Business Attraction
Business Retention
Education/skill development

142
Entrepreneurial development
Environmental Quality and Awareness
Job Creation and development
Providing Community Recreation and Culture
Public Safety
Telecommunications Infrastructure
Transportation/Roads.
Almost 40% of respondents mentioned job creation as the number one issue
facing their communities. Every respondent included this issue in their ranking of the five
most important future issues. The issues ranked as most important, followed by the
number of respondents indicating as such, are outlined in Table 3.12. Only one
respondent mentioned entrepreneurial development as the most critical issue facing their
community in the near future. However, entrepreneurial development was mentioned by
39 respondents as one of the five most important issues facing their community in the
future.
Table 3.12: Future Community Issues Ranked as Most Important
Most Important Community Issues
Number of
Respondents Job Creation and Development 39 Education/Skill Development 18 Business Attraction 16 Adequate Housing 10 Business Retention 8 Entrepreneurial Development 1 Public Safety 1 Telecommunications Infrastructure 1

143
Over 80% of respondents indicate their community has an economic development
plan, but only 52% of respondents affirmed that any type of entrepreneurship
development and/or support policy was included in this economic development plan. In
terms of specific development efforts, only 27% of responding agencies operate any type
of entrepreneurial development program. Twelve of 36 CDCs surveyed stated that they
had some type of entrepreneurial development program, while 15 out of 63 economic
development organizations stated that they operate some type of entrepreneurial
development program. Over half of respondents agreed or strongly agreed that their
communities recognize the importance of entrepreneurs to the overall economic
development of the region. When asked whether their community has well-developed
programs in place that support and encourage entrepreneurial activity, the responses were
mixed. There were not any respondents who strongly agreed, 22% agreed, and over 50%
either disagreed or strongly disagreed that their community had well developed
entrepreneurial programs in place. However, over 90% of respondents indicate they have
local or regional access to a Small Business Development Center (SBDC). This response
reveals that access to SBDC programs and services does not provide enough
entrepreneurial infrastructure to characterize the community as having well developed
programs in support of entrepreneurship.
If local developers understand the value of entrepreneurial development efforts,
this research attempts to clarify the reasons that development officials would consider
pursuing these efforts. The survey asked respondents to specify their top four reasons
(from a list of eight) for advancing entrepreneurship efforts. The following reasons were

144
mentioned by at least one respondent.
Building community and family wealth
Community downtown revitalization
Diversification of the local economic base
Enhancing workforce development
Improving local business retention
Improving new business recruitment
Increasing competitiveness
Increasing employment opportunities.
However, increasing employment opportunities, building community and family
wealth and the diversification of the local economic base were mentioned respectively by
27, 24, and 22 respondents.
One critical component in understanding the implementation of local
entrepreneurship development efforts is clarifying the perceptions of local and regional
developers with regard to state policy priorities and incentives. When asked which type
of economic development approach they believed was the highest priority for state and
local policymakers, at least one respondent indicated one of the following:
Business clusters
Business incubators
Downtown revitalization
Entrepreneurship development
Local business expansion

145
Local tourism initiative
New business recruitment.
However, almost 70%of respondents believe industrial and business recruitment
efforts have the highest economic development priority for state policymakers and over
50% of respondents perceive this as the highest priority of local policymakers.
In addition to priority constraints, it is also recognized that many communities
face additional barriers to developing and implementing entrepreneurial focused
economic development policy. At least one respondent mentioned the following
constraints to the successful implementation of entrepreneurial development policy.
Availability of skilled, local professionals
Alternative local or regional projects take greater priority
Inadequate support from state/federal agencies
Lack of funding
Locational factors (e.g. market access)
Not considered a local or regional responsibility
Weak base of local entrepreneurs.
The majority of respondents rated a lack of funding as their biggest barrier in
implementing entrepreneurship policy. The next two most substantive barriers are the
priority of alternative local or regional projects and inadequate support from state and/or
federal agencies.
Finally, Table 3.13 provides the results of respondents ratings of local access to a

146
range of entrepreneurial services and programs. The results are not surprising but they are
discouraging. None of these examples of entrepreneurial programming resulted in a
majority of responses being above average or excellent. Four of these areas, local hiring
initiatives, local infrastructure assistance (e.g. buildings, Broadband), networking and
mentoring opportunities for community businesses, and small business and
entrepreneurial training courses received a score of average by more respondents than
any other ranking in that category. Access to six of these entrepreneurial service areas
were ranked as poor by most respondents in those categories. These results paint a bleak
picture of entrepreneurial service access and support in communities across South
Carolina. As a result, communities appear to face substantial obstacles to implementing
and encouraging successful local entrepreneurial development programs.
With this background, it is not surprising that over 65% of respondents either
agree or strongly agree that industrial recruitment policy is more important for their
community than entrepreneurial development policy. This response is undoubtedly
influenced by several variables that this survey highlights. The majority of respondents
indicate that industrial recruitment is the most important development policy priority of
state and local policymakers. Additionally, every respondent mentioned job creation as a
critical issue for their community in the future. Industrial recruitment strategies are often
perceived as a more effective job creation tool than entrepreneurship, coupled with the
aforementioned policy perceptions, industrial recruitment strategies would naturally be
the preferred choice of policymakers. Survey results further highlight that most of these
communities face substantial barriers in their access to a range of entrepreneurial support

147
programs. Combined with the fact that the majority of respondents indicate weaknesses
in local programming to support entrepreneurship, it is not surprising that only 27% of
respondents indicate their community has any type of entrepreneurial development
programming. Overall, these results begin to clarify the scope and breadth of
Table 3.13: Local and/or Regional Access to Entrepreneurial Programs
Extremely
Poor (%) Poor(%) Average
(%)
Above
Average
(%) Excellent
(%)
A local business
incubator 16.83 40.59 25.74 8.91 7.92
Access to venture
capital or angel
investors 27.00 56.00 14.00 3.00 0.00
Access to start up or
seed capital 25.00 52.00 21.00 2.00 0.00
Advertising/marketi
ng assistance 11.22 44.90 38.78 5.10 0.00
An organized buy
local‘ program 8.16 40.82 32.65 14.29 4.08
Local hiring
initiatives 6.06 35.35 43.43 14.14 1.01
Local infrastructure
assistance (e.g.
buildings,
Broadband) 10.10 27.27 41.41 16.16 5.05
Micro-lending
programs 17.35 46.94 30.61 5.10 0.00
Networking and
mentoring
opportunities for
community
businesses 5.10 23.47 50.00 20.41 1.02
Small business and
entrepreneurial
training 5.05 18.18 51.52 20.20 5.05

148
entrepreneurial development programming across South Carolina. However, a
quantitative examination of the survey may provide additional understanding of variables
that influence the likelihood of communities engaging in entrepreneurial development
programming. The next section describes the logit model and results from a detailed
examination of the relationship between entrepreneurial development programming and
related survey questions.
Model Estimation and Results
Logit models are binary outcome models in which a dependent variable is
modeled as one of two mutually exclusive outcomes. Logistic regression models are used
to predict the probability of an occurrence by fitting the data to a logistic function. The
probability of one outcome is p; while the probability of the other outcome must be (1-p).
As a function of regressors, the probability p will differ greatly across individuals being
sampled. (Cameron and Trivedi, 2005).
Standard OLS regression is not appropriate to model binary outcome models
because dependent variables are not continuous and would thus, result in heteroscedastic
error terms. In standard OLS regression, x’β cannot be constrained to the 0-1 interval
(Greene, 2000). These models would produce nonsensical probabilities and variances.
Thus, another model is needed. A continuous probability distribution should work to
meet the expectations of
limx‘β→∞ 𝑃𝑟𝑜𝑏 𝑌 = 1 𝑥) = 1 (1)
limx‘β→−∞ 𝑃𝑟𝑜𝑏 𝑌 = 1 𝑥) = 0. (2)

149
The normal distribution is used with the probit model:
𝑃𝑟𝑜𝑏 (𝑌 = 1| 𝑥) = 𝛷 𝑡 𝑑𝑡 = 𝜙 𝑥 ′𝛽 𝑥 ′𝛽
−∞. (3)
The logistic distribution is given by
𝑃𝑟𝑜𝑏 (𝑌 = 1| 𝑥) = 𝑒𝑥 ′𝛽
1+𝑒𝑥 ′𝛽 = ∧ (𝑥 ′𝛽). (4)
The logit model and probit models both have symmetric distributions. For
intermediate values of 𝑥 ′𝛽, the distributions give probabilities that are comparable
(Greene, 2000). It is argued that these models result in widely different predictions in
studies with small samples. In samples with less than approximately 500 responses
logistic regression may systematically overestimate the 𝛽 -coefficients or the predicted
odds ration. However, statistical theory indicates that overestimation in a single study
may have little to no impact on interpretation as overestimation is much lower than the
standard error of the estimate. When several small samples are pooled together, however,
estimation of the result may be compromised by systematic overestimation (Nemes et al.,
2009). A minimum of ten events per independent variable has been suggested as the
optimum (Peduzzi et al., 1996; Agresti, 2007).
This logit model is defined by the Bernoulli model and thus is estimated by
maximum likelihood. The model with success probability 𝑭 𝑥 ′𝛽 and independent
observations leads to the likelihood function:
𝑃𝑟𝑜𝑏 𝑌1 = 𝑦1, 𝑌2 = 𝑦2, … . , 𝑌𝑛 = 𝑦𝑛 X = [1 − 𝑭 𝑥𝑖′𝛽
𝑦𝑖=0
] 𝑭 𝑥𝑖′𝛽 .
𝑦𝑖=1
The likelihood function for n observations can be written as

150
𝐿 𝛽 𝑑𝑎𝑡𝑎 = [𝑭 𝑥𝑖′𝛽 ]𝑦𝑖
𝑛
𝑖=1
[1 − 𝑭 𝑥𝑖′𝛽 ]1−𝑦𝑖
After taking logs,
ln 𝐿 = {𝑦𝑖
𝑛
𝑖=1
ln 𝑭 𝑥𝑖′𝛽 + 1 − 𝑦𝑖 ln [1 − 𝑭 𝑥𝑖
′𝛽 ]}.
The likelihood equations are
𝑑𝑙𝑛 𝐿
𝑑𝛽= [
𝑦𝑖𝑓𝑖𝐹𝑖
𝑛
𝑖=1
+ 1 − 𝑦𝑖 – 𝑓𝑖
1 − 𝐹𝑖 ] 𝑥𝑖 = 0.
The density is 𝑓𝑖 .
For the logit model, the first order conditions are
𝑑𝑙𝑛 𝐿
𝑑𝛽= (
𝑛
𝑖=1
𝑦𝑖 −∧)𝑥𝑖 = 0.
For the normal distribution, the probit model log-likelihood equation is
ln 𝐿 = ln[1 − 𝛷
𝑦𝑖 =0
𝑥𝑖′𝛽 ] + ln 𝛷 𝑥𝑖
′𝛽 .
𝑦𝑖 =0
The first order conditions are
𝑑𝑙𝑛 𝐿
𝑑𝛽= 𝜆𝑂𝑖
𝑦𝑖 =0
𝑥𝑖 + 𝜆1𝑖
𝑦𝑖 =1
𝑥𝑖 .
This reduces to
𝑑𝑙𝑛 𝐿
𝑑𝛽= 𝜆𝑖
𝑦𝑖 =0
𝑥𝑖 = 0.
The second derivatives for the logit model are:
H = − ∧i (1 −i ∧i)xixi ′.
Newton‘s method of scoring can be used since the random variable 𝑦𝑖 is not
included in the second derivatives for the logit model. The log-likelihood is globally
concave and this method will normally converge to the log-likelihood maximum in

151
minimal iterations (Greene, 2000).
This model is intended to estimate the marginal effect of a change in the regressor
on the conditional probability that y is equal to zero, which represents the existence of
any type of entrepreneurial development program. Typical binary outcome models are
single-index, which allow the ratio of coefficients for two regressors to equal the ratio of
the marginal effects. The sign of the marginal effect is given by the sign of the coefficient
(Cameron and Trivedi, 2005). The marginal effects of the logit model can be obtained
from the coefficients, with
𝑑𝑝𝑖
𝑑𝑥𝑖𝑗= 𝐵𝑖𝑗𝑝𝑖 1 − 𝑝𝑖 ,𝑤ℎ𝑒𝑟𝑒 𝑝𝑖 = ⋀𝑖 = ⋀ 𝐱′𝛃 .
Interpreting the coefficients is frequently done in terms of the marginal effects on the
odds ratio. For the logit model:
𝑝 = exp( 𝒙′𝛽)/(1 + exp(𝒙′𝛽)
Which implies:
ln𝑝
1 − 𝑝= 𝒙′𝛽.
The odds ratio, or relative risk measures the probability of y being equal to one in
relation to the probability of y being equal to zero, this is p/ (1-p). The log-odds ratio is
linear for the logit model (Cameron and Trivedi, 2005).
The dependent variable tested in this research is whether a community has any
type of entrepreneurial development program. In order to capture the broadest measure of
respondent‘s knowledge of local entrepreneurial development programming, the
definition of entrepreneurial development was left as wide as possible. One of the

152
potential challenges with this research is in clarifying the causality of entrepreneurship
and entrepreneurial development programming. Communities with an existing base of
dynamic entrepreneurship are more likely to have entrepreneurial development
programming in support of these efforts. This virtuous cycle of policy and related
entrepreneurial outcomes makes it difficult for researchers to clarify which came first;
development policy or entrepreneurs themselves. However, this research is an important
attempt to understand how entrepreneurial development fits within the priorities of local
and regional policymakers.
Table 3.14 illustrates summary statistics for the dependent variable and all
independent variables tested in this analysis. Appendix One provides the complete survey
used in this research and Appendix Two includes a correlation matrix of all examined
variables. The correlation results provide initial evidence that many of the variables
tested have little correlation with the odds of a community having an entrepreneurial
development program. All of the independent variables were individually tested against
the probability of having a local entrepreneurial development program. The variables that
were significant either individually or in models with multiple independent variables are
included in Table 3.15.
Individual logit models were performed testing the relationships between each
independent variable and the likelihood of having a local entrepreneurial development
program. Early examination of a model incorporating the full sample population
suggested that the model may be missing important interactions or variables related to
these organizations specific characteristics. It is hypothesized that this model may suffer
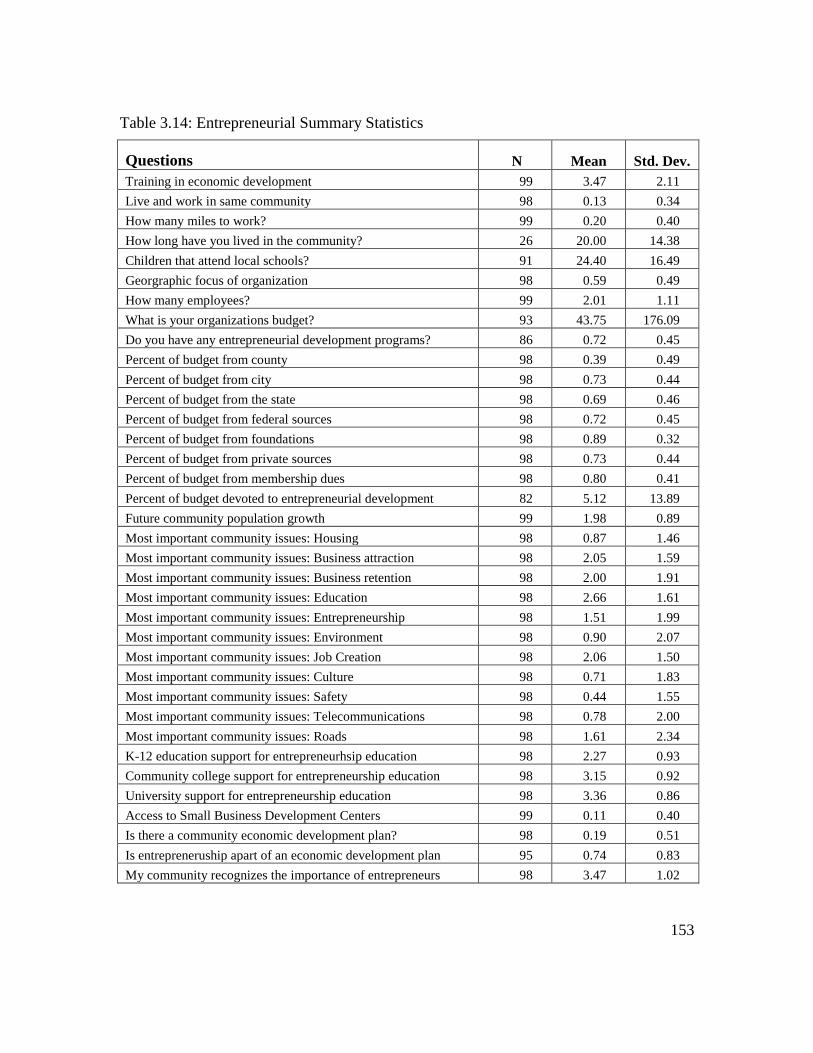
153
Table 3.14: Entrepreneurial Summary Statistics
Questions N Mean Std. Dev.
Training in economic development 99 3.47 2.11
Live and work in same community 98 0.13 0.34
How many miles to work? 99 0.20 0.40
How long have you lived in the community? 26 20.00 14.38
Children that attend local schools? 91 24.40 16.49
Georgraphic focus of organization 98 0.59 0.49
How many employees? 99 2.01 1.11
What is your organizations budget? 93 43.75 176.09
Do you have any entrepreneurial development programs? 86 0.72 0.45
Percent of budget from county 98 0.39 0.49
Percent of budget from city 98 0.73 0.44
Percent of budget from the state 98 0.69 0.46
Percent of budget from federal sources 98 0.72 0.45
Percent of budget from foundations 98 0.89 0.32
Percent of budget from private sources 98 0.73 0.44
Percent of budget from membership dues 98 0.80 0.41
Percent of budget devoted to entrepreneurial development 82 5.12 13.89
Future community population growth 99 1.98 0.89
Most important community issues: Housing 98 0.87 1.46
Most important community issues: Business attraction 98 2.05 1.59
Most important community issues: Business retention 98 2.00 1.91
Most important community issues: Education 98 2.66 1.61
Most important community issues: Entrepreneurship 98 1.51 1.99
Most important community issues: Environment 98 0.90 2.07
Most important community issues: Job Creation 98 2.06 1.50
Most important community issues: Culture 98 0.71 1.83
Most important community issues: Safety 98 0.44 1.55
Most important community issues: Telecommunications 98 0.78 2.00
Most important community issues: Roads 98 1.61 2.34
K-12 education support for entrepreneurhsip education 98 2.27 0.93
Community college support for entrepreneurship education 98 3.15 0.92
University support for entrepreneurship education 98 3.36 0.86
Access to Small Business Development Centers 99 0.11 0.40
Is there a community economic development plan? 98 0.19 0.51
Is entrepreneruship apart of an economic development plan 95 0.74 0.83
My community recognizes the importance of entrepreneurs 98 3.47 1.02
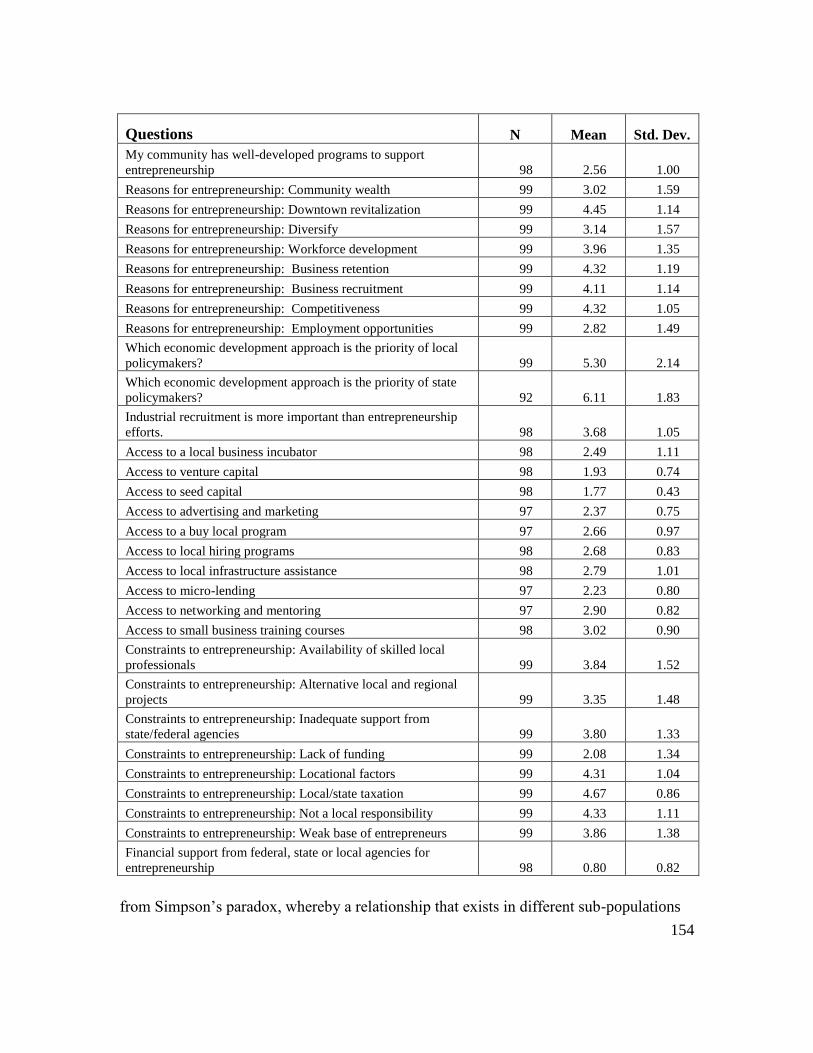
154
Questions N Mean Std. Dev.
My community has well-developed programs to support
entrepreneurship 98 2.56 1.00
Reasons for entrepreneurship: Community wealth 99 3.02 1.59
Reasons for entrepreneurship: Downtown revitalization 99 4.45 1.14
Reasons for entrepreneurship: Diversify 99 3.14 1.57
Reasons for entrepreneurship: Workforce development 99 3.96 1.35
Reasons for entrepreneurship: Business retention 99 4.32 1.19
Reasons for entrepreneurship: Business recruitment 99 4.11 1.14
Reasons for entrepreneurship: Competitiveness 99 4.32 1.05
Reasons for entrepreneurship: Employment opportunities 99 2.82 1.49
Which economic development approach is the priority of local
policymakers? 99 5.30 2.14
Which economic development approach is the priority of state
policymakers? 92 6.11 1.83
Industrial recruitment is more important than entrepreneurship
efforts. 98 3.68 1.05
Access to a local business incubator 98 2.49 1.11
Access to venture capital 98 1.93 0.74
Access to seed capital 98 1.77 0.43
Access to advertising and marketing 97 2.37 0.75
Access to a buy local program 97 2.66 0.97
Access to local hiring programs 98 2.68 0.83
Access to local infrastructure assistance 98 2.79 1.01
Access to micro-lending 97 2.23 0.80
Access to networking and mentoring 97 2.90 0.82
Access to small business training courses 98 3.02 0.90
Constraints to entrepreneurship: Availability of skilled local
professionals 99 3.84 1.52
Constraints to entrepreneurship: Alternative local and regional
projects 99 3.35 1.48
Constraints to entrepreneurship: Inadequate support from
state/federal agencies 99 3.80 1.33
Constraints to entrepreneurship: Lack of funding 99 2.08 1.34
Constraints to entrepreneurship: Locational factors 99 4.31 1.04
Constraints to entrepreneurship: Local/state taxation 99 4.67 0.86
Constraints to entrepreneurship: Not a local responsibility 99 4.33 1.11
Constraints to entrepreneurship: Weak base of entrepreneurs 99 3.86 1.38
Financial support from federal, state or local agencies for
entrepreneurship 98 0.80 0.82
from Simpson‘s paradox, whereby a relationship that exists in different sub-populations

155
may be reversed or not be found when the groups are combined. Simpson‘s paradox can
be corrected when a confounding or interaction variable is identified and included in the
model (Simpson, 1951).
Table 3.15: Entrepreneurial Development: Significant Independent Variables
Dependent Variable Survey Question
Does your agency operate an entrepreneurship development program?
Independent Variables Survey Question
Which of the following best describes your organization and responsibilities?
How many employees does your organization/office employ?
Percent of budget from the state
Most important community issues: Business retention
Most important community issues: Entrepreneurship
Reasons for entrepreneurship: Diversify
Reasons for entrepreneurship: Workforce development
For my community, industrial and new business recruitment efforts are more important
economic development tools than entrepreneurship efforts.
Access to seed capital
Constraints to entrepreneurship: Inadequate support from state/federal agencies
Financial support from federal, state or local agencies for entrepreneurship
One of the ongoing challenges with data that suffers from Simpson‘s paradox is
clarifying the most appropriate manner of partitioning the data. As probability relations
will vary widely given different groupings of data, appropriately partitioning the data is
critical for accurately determining causation. In data sets that exhibit Simpson‘s paradox,
analysis of the entire data set or inaccurate partitioning of the data may support the

156
Table 3.16: Model Tests: Sub-Sample Economic Developers excluding CDC‘s
Model -LogLikelihood ChiSquare
Difference 13.405259 26.81052
Full 20.619789 Prob>ChiSq
Reduced 34.025048 <.0001
Measure
RSquare (U) 0.394
AICc 52.3305
BIC 61.7939
Observations 61
Table 3.17: Likelihood Ratio Tests and Parameter Estimates: Sub-Sample Economic
Developers excluding CDC‘s
Term Estimate Std Error ChiSquare Prob>ChiSq.
Intercept 4.7615361 2.5924798 3.37 0.0663
Percent of budget from the
state 1.6349244 0.5981136 7.47 0.0063
Most important community
issues: Business retention 0.6259304 0.2965396 4.46 0.0348
Industrial recruitment is more
important than
entrepreneurship efforts -0.915824 0.3821059 5.74 0.0165
Access to seed capital -2.58161 0.991933 6.77 0.0093
For log odds of 0/1
Effect Likelihood Ratio Tests
Source
L-R
ChiSquare Prob> ChiSq
Percent of budget from the
state 10.2086024 0.0014 Most important community
issues: Business retention 5.57986998 0.0182 Industrial recruitment is more
important than
entrepreneurship efforts 6.84499366 0.0089
Access to seed capital 11.5157006 0.0007

157
Table 3.18: Model Tests: Sub-Sample CDC‘s
Model -LogLikelihood ChiSquare
Difference 7.752037 15.50407
Full 15.162473 Prob>ChiSq
Reduced 22.91451 0.0014
Measure
RSquare (U) 0.3383
AICc 39.6153
BIC 44.659
Observations 36
Table 3.19: Likelihood Ratio Tests and Parameter Estimates: Sub-Sample CDC‘s
Term Estimate Std Error ChiSquare Prob>ChiSq
Intercept -1.6408524 1.8255805 0.81 0.3688 Most important community
issues: Entrepreneurship -1.3652996 0.5804278 5.53 0.0187 Reasons for
entrepreneurship: Diversify -0.6944201 0.3441571 4.07 0.0436 Financial support from
federal, state or local
agencies for
entrepreneurship 0.83488682 0.3902418 4.58 0.0324
For log odds of 0/1
Effect Likelihood Ratio Tests
Source L-R
ChiSquare Prob>ChiSq Most important community
issues: Entrepreneurship 7.6523793 0.0057 Reasons for
entrepreneurship: Diversify 5.00076482 0.0253 Financial support from
federal, state or local
agencies for
entrepreneurship 6.18877633 0.0129
absence or prevent the determination of significant effects.

158
There was concern early in this analysis that CDC‘s and other economic
development organizations were different populations and may therefore require different
models to estimate the relationship between the dependent and independent variables.
Historically, CDCs have engaged in different objectives than traditional economic
development organizations, and their organizational structures have often been
considerably different as well. For example, CDCs often rely on volunteers and have few
paid professional staff to operate and manage the organization. As well, CDCs have
historically focused heavily on adequate and affordable housing as critical organizational
objectives. The larger sample of economic development organizations is also composed
of a mix of organizational structures with differing functions. However, these
organizations all have some professional staff and are focused on a broader set of
community and economic development goals beyond housing.19
As a result, this mix of
organizations arguably has more in common than the larger group has with CDCs. As a
result, separate models were estimated for both sub-populations. Tables 3.16 – 3.19
illustrate the results for two sub-populations of the data; CDC‘s and the rest of the
population.
The goodness of fit measures indicate that the models are significant and
adequate. The AIC, BIC, and -2LogLikelihood values are an indication that the selected
covariates are better than the model with the intercept only. The R-squared reported for
logistic regression can be interpreted in a similar fashion as a traditional OLS R-squared.
In both sub-samples over 30% of the variation in the likelihood of having a local or
19
Many of these organizations may not be involved with local housing issues at all.

159
regional entrepreneurial development program can be explained by these models.
Table 3.24: Odds/Ratios: Sub-Sample Economic Developers excluding CDC‘s
Unit Odds Ratios
Per unit change in regressor
Term Odds Ratio Lower 95% Upper 95% Most important community
issues: Business retention 1.869985 1.104714 3.667237 Industrial recruitment is more
important than entrepreneurship
efforts. 0.400187 0.17099 0.801658
Access to seed capital 0.075652 0.007014 0.390961
Range Odds Ratios
Per change in regressor over entire range
Term Odds Ratio Lower 95% Upper 95% Most important community
issues: Business retention 22.86602 1.645313 663.2769 Industrial recruitment is more
important than entrepreneurship
efforts. 0.025648 0.000855 0.413007
Access to seed capital 0.000433 3.45E-07 0.059759
Odds Ratios for percent of budget from the state
Level1 /Level2 Odds Ratio Prob>ChiSq Lower 95% Upper 95%
1 0 0.0380122 0.0014 0.0026106 0.3112996
Overall, these logistic regression models were highly significant at the 5% level as
indicated by the Likelihood ratio testing the global null hypothesis that the model
parameters are significant.
The interpretation of the coefficients for logistic regression can be awkward.
Thus, the odds ratio from these models is used for additional interpretation. The odds

160
Table 3.21: Odds/Ratios: Sub-Sample CDC‘s
Unit Odds Ratios
Per unit change in regressor
Term Odds Ratio Lower 95% Upper 95% Financial support from federal,
state or local agencies for
entrepreneurship 2.304553 1.174726 5.743178 Reasons for entrepreneurship:
Diversify 0.499364 0.226545 0.922346
Range Odds Ratios
Per change in regressor over entire range
Term Odds Ratio Lower 95% Upper 95% Financial support from federal,
state or local agencies for
entrepreneurship 28.20635 1.90435 1087.95 Reasons for entrepreneurship:
Diversify 0.062183 0.002634 0.723729
Odds Ratios for most important community issues: Entrepreneurship
Level1 /Level2 Odds Ratio Prob>ChiSq Lower 95% Upper 95%
1 0 15.342078 .0057 2.0575535 219.63091
ratios are given in Tables 3.20 and 3.21 for the respective subpopulations. An odds ratio
larger than one indicates growth in the odds of having an entrepreneurial development
program, while less than one indicates a reduced likelihood of having an entrepreneurial
development program. In the sub-sample excluding CDCs, the following variables tested
significant at the five percent level or higher ; the importance of business retention,
whether industrial or business recruitment is more important than entrepreneurial
development, and access to seed capital for local or regional entrepreneurship. For a 1
unit increase in the importance of business retention, the probability of having an

161
entrepreneurial development program changes by a factor of 1.86. As well, for a 1 unit
change in how a community values business recruitment in comparison to
entrepreneurship efforts, the odds of having an entrepreneurial development program
changes by a factor of .400. As a community‘s access to seed capital changes the odds of
having an entrepreneurial development program changes by a factor of .076. Finally, as
organizational funding shifts towards additional state funding, the odds of having an
entrepreneurial development program changes by a factor of .038
In the CDC sub-sample the following variables tested significant at the five
percent level or higher; the stated importance of entrepreneurship to the future of the
local community, whether a community believes entrepreneurship is a valuable method
of diversifying the local economic base, and whether a lack of government support is
ranked as one of the primary reasons for the inability to support local entrepreneurship
efforts. A 1 unit change in how a community values entrepreneurship as a valuable
method of diversifying the local economic base results in the odds of having an
entrepreneurial development program changing by a factor of .499. The odds of having
an entrepreneurial development program will change by a factor of 2.3 when a lack of
government support is ranked as one of the primary reasons for the inability to support
local entrepreneurship efforts. Finally, if communities rank entrepreneurship as a variable
that is important to their future the odds of having an entrepreneurial development
program will change by a factor of 15.34.
One way to manage data with different sub-population‘s suffering from
Simpson‘s paradox is to ―normalize‖ the data across the sub-populations and then to pool

162
Table 3.22: Model Tests: Full Model
Model -LogLikelihood ChiSquare
Difference 19.517893 39.0358
Full 37.518589 Prob>ChiSq
Reduced 57.036482 <.0001
Measures
RSquare (U) 0.3422
AICc 90.3099
BIC 106.988
the normalized data. Normalizing the data reduces the skewness effects. However, as
discussed earlier, it is important to seriously consider the method of portioning and
normalizing the data set. One standard method is to determine variables of significance in
individual sub-populations and then test these variables in the full population model with
the addition of a dummy variable representing the conditioned or indicator variable.
Interacting all significant variables with the indicator dummy variable in the pooled data
set may correct for Simpson's paradox.
The goodness of fit measures indicates that the model is significant and adequate.
The AIC, BIC, and -2LogLikelihood values are an indication that the selected covariates
are better than the model with the intercept only. The R-squared reported for the full
model logistic regression indicates over 30% of the variation in the likelihood of having a
local or regional entrepreneurial development program can be explained by the full
model. Overall the full model logistic regression was highly significant at the 5% level as
indicated by the Likelihood ratio testing the global null hypothesis that the model
parameters are significant.

163
Table 3.23: Likelihood Ratio Tests and Parameter Estimates: Full Model
Parameter Estimates
Term Estimate Std Error ChiSquare Prob>ChiSq
Intercept -.6765089 1.3849874 .24 .6252
Percent of budget from the state 1.00856971 .3666404 7.57 .0059* Most important community
issues: Business retention .56350951 .2069923 7.41 .0065* Industrial recruitment is more
important than entrepreneurship
efforts. 1.09968583 .3600222 9.33 .0023*
Access to seed capital -1.7735581 .7198392 6.07 .0137*
Organizational dummy -4.6298454 2.3068806 4.03 .0448* Access to seed capital
*Organizational dummy 2.5873346 1.1604417 4.97 .0258*
For log odds of 0/1: Effect
Likelihood Ratio Tests
Source L-R
ChiSquare Prob>ChiSq
Percent of budget from the state 8.9790776 0.0027* Most important community
issues: Business retention 8.73870389 0.0031* Industrial recruitment is more
important than entrepreneurship
efforts 10.4439445 0.0012*
Access to seed capital 8.29831592 0.0040*
Organizational dummy 4.69127041 0.0303* Access to seed capital
*Organizational dummy 5.95237678 0.0147*
The odds ratios for the full model are illustrated in Tables 3.24. In the full sample
the following variables tested significant; whether an organization receives any funding
from the state, the importance of business retention, whether industrial or business
recruitment is more important than entrepreneurial development, access to seed capital
for local or regional entrepreneurship, the dummy variable for organization, and the

164
interaction of access to seed capital and the organizational dummy. For a 1 unit increase
in the importance of business retention, the odds of having an entrepreneurial
development program changes by a factor of 1.76. For a 1 unit change in how a
community values business recruitment in comparison to entrepreneurship efforts, the
odds of having an entrepreneurial development program changes by a factor of 3.003. For
organizations that acquire any state level funding, the probability of having an
entrepreneurship development program changes by .133.
The odds ratios reported for the organization dummy and the seed capital variable
do not account for the interaction term of these variables in the model. As a result,
interpretation of the unit changes should be considered with caution. The main effect of
having an entrepreneurial development program changes by a factor of .170 as
communities‘ access to seed capital for entrepreneurship changes by one unit. The
organizational dummy only results in a minor shift, .0098, in the odds of having an
entrepreneurial development program.
However, odds ratios, inclusive of interaction terms, can be interpreted using
Equation One:
𝑒𝐵𝑖+𝐵𝑖𝑗 𝑋𝑖
Where 𝐵 𝑖 = The individual coefficients for the organizational dummy or the seed
capital variable
𝐵𝑖𝑗 = The coefficient of the interaction term; organizational dummy
and seed capital

165
𝑋𝑖= The observed values of the organizational dummy or seed
capital
Table 3.24: Odds/Ratios: Full Sample
Unit Odds Ratios
Per unit change in regressor
Term Odds Ratio Lower 95% Upper 95% Most important community
issues: Business retention 1.756827 1.199495 2.731192 Industrial recruitment is more
important than entrepreneurship
efforts 3.003222 1.526508 6.370153
* Access to seed capital .169728 .033624 .596692
* Organizational dummy .009756 6.736E-5 0.659361
Range Odds Ratios
Per change in regressor over entire range
Term Odds Ratio Lower 95% Upper 95% Most important community
issues: Business retention 16.73576 2.483089 151.9712 Industrial recruitment is more
important than entrepreneurship
efforts 9.019345 2.330227 40.57885
* Access to seed capital .004889 .000038 .212447
* Organizational dummy 0.009756 6.736E-5 .659361
Odds Ratios for percent of budget from the state
Level1 /Level2 Odds Ratio Prob>ChiSq
1 0 0.1330355 0.0027*
Ratios marked with '*' are not interpretable due to interaction effects.
Table 3.25 provides an estimate of the odds of a community having an
entrepreneurial development program given different levels of seed capital where 𝑋𝑖,=
Organizational Dummy. This table and Figure 3.5 illustrate that, as organizations

166
perceive there is greater availability of seed capital in their local community, the odds of
having an entrepreneurial development program increase substantially. In fact, those
communities that indicate an above average level of entrepreneurship are 22 times more
likely to have a program, while those that perceive a low level of local seed capital are
unlikely to have any local entrepreneurial development programming. This provides
further evidence that access to seed capital may not only be a barrier to individual
entrepreneurship but also to local entrepreneurial development programs.
Table 3.25: Equation One Estimates with 𝑿𝒊,= Organizational Dummy
Seed Capital Value Odds/Ratio of Entrepreneurial
Development Program
1 0.1297026
2 1.72430453
3 22.9234
Figure 3.5: Odds/Ratio of Organizational Dummy vs. Seed Capital Value
-5
0
5
10
15
20
25
0 0.5 1 1.5 2 2.5 3 3.5
Odds Ratio of
Organizational
Dummy
Seed Capital Value

167
Overall, these results suggest that the relationship between the probability of local
or regional entrepreneurial development programming and a variety of organizational and
community characteristics is complex and dependent on the type of organization involved
in economic development. While these results are instructive, this research highlights
several opportunities for additional research. This research underscores questions related
to the nexus of entrepreneurship and local entrepreneurial development programming.
For instance, communities that have an existing base of entrepreneurship with a culture
that supports these efforts will likely have more entrepreneurial development
programming compared to other communities. This underscores a which came first,
chicken/egg question. As a result, those communities that do not have a solid base of
local/regional entrepreneurs may not have entrepreneurial development programming.
However, communities may remain weak in this area as local developers do not
facilitate this programming because of a perceived local weakness in the area. If this is
the case, communities without an existing base and culture of entrepreneurship will
undoubtedly remain weak in this area without programming efforts that begin to redirect
the community‘s development focus. Disentangling this relationship is not easy;
however, future research utilizing information on levels and types of local entrepreneurs
may improve our understanding.
Selection bias is an area of ongoing concern with surveys and samples of this
nature. By including a wide range of local and regional development professionals,
sampling bias in this analysis is minimized. Self-selection bias in the survey sample is an
additional area of concern. This research minimizes self-selection bias by surveying a

168
broad sample of representative organizations and localities. Similar research may have
broader applicability and generalizable conclusions by sampling across states or even
nations.
Additionally, a larger and broader sample may detect statistical significance of
additional variables and relationships. A number of independent variables in this analysis
tested significant individually but not in the full model. The importance of business
attraction and entrepreneurship development to your community in the nearby future, and
the policy priorities of both local and state policymakers were all variables that tested
significant individually. Future research and a larger sample of communities could further
test these relationships as well as allow for exploration of potential interaction of these
and other variables. A considerable body of research describes the importance of
community characteristics on local entrepreneurship. None of the community variables
tested in this analysis was significant. A larger sample size with a more diverse set of
communities may allow for additional clarification of the relationship between
community characteristics and the probability of having an entrepreneurial development
program.
One of the primary relationships this research sought to highlight was the
relationship between policy priorities and the probability of a community having a local
economic development program. The policy priorities of local economic developers do
appear to play a significant role in the probability of having local entrepreneurship policy
and programs. While this is not surprising, the policy priorities of local developers are
influenced by the policy signals from state and federal authorities, as well as other

169
community and business leaders in the region. If a state wants to prioritize
entrepreneurship efforts it must send clear signals to local and regional leaders so that
they will also consider shifting economic development priorities. Additionally, the value
placed on local and regional business retention efforts is significantly related to an
enhanced entrepreneurial development approach. For many communities there may be
the perception that focused business retention efforts have the potential to benefit local
entrepreneurial efforts across all sizes of firms. Business retention may thus be viewed as
directly related or almost synonymous to entrepreneurial efforts. Business retention
efforts in many communities may be used to encourage and support local
entrepreneurship, however, future research would benefit from a better understanding of
the nature of these policies across different types of communities. Finally, barriers to
entrepreneurship, access to seed capital specifically, significantly influence local and
regional support of entrepreneurship. This confirms earlier research on barriers to
financing but provides further documentation on the importance of this barrier to
preventing entrepreneurship efforts at the local and regional level.
Conclusion
South Carolina has long relied on a development model that emphasizes free
trade, minimal regulation, low taxes, and a competitive environment as the best
prescription for economic growth. This model has resulted in ongoing efforts to recruit
new business based on the business-friendly environment that South Carolina provides.
However, in the face of globalization and the loss of many of South Carolina‘s traditional

170
textile and manufacturing jobs, communities across the state find themselves struggling
to compete.
In an effort to assess South Carolina‘s potential for supporting new economy
models of development, this research has begun to examine the state‘s development
policy landscape. These results illustrate several key issues that constrain local
communities from implementing entrepreneurial oriented policy efforts. One key finding
is that South Carolina policymakers do not appear to have clearly articulated
entrepreneurial development as a primary policy priority for the state. If policymakers
have made statements regarding the importance of entrepreneurship in the state, local and
regional officials continue to see other economic development initiatives (e.g. industrial
recruitment, business retention) ,as more of a priority than entrepreneurship development
efforts. Surveyed communities remain highly focused on issues related to job creation
and policy initiatives like industrial recruitment that are perceived to most effectively
meet this objective. This research also indicates that South Carolina communities have
poor access to entrepreneurial resources and support. Overall, these results indicate that
South Carolina communities continue to favor traditional economic development policy
efforts. Additionally, communities perceive a number of substantive barriers and
constraint to moving forward with entrepreneurial policy efforts.
There is much work to be done to move communities away from traditional
development models towards models that emphasize innovative and entrepreneurial
policy approaches. Research reveals these efforts need to begin with a focused and
concerted entrepreneurial policy effort from the state. They also must be about more than

171
words on a website and more about substantive change resulting in robustly funded
programs. If local and regional community leaders witness a concerted policy effort from
the state, accompanied with resources and support to facilitate this effort, local
communities might begin to embrace entrepreneurial development policy within their
own local and regional economies.

172
CHAPTER FOUR
PARALYZED STATE TECHNOLOGY INVESTMENTS AND THE IMPACT ON
STATE SMALL BUSINESS AND ENTREPRENEURIAL ACTIVITY:
A FIRST LOOK
Introduction
A substantial body of research documents a shift in regional economic
development research and policy from one focused on traditional resource variables, like
land and labor, to an approach that creates an appealing environment to facilitate local
business retention and the creation and expansion of existing local business. The so-
called third wave of economic development policies are often referred to as ―high-road‖
or knowledge- based policies. These encompass a broad range of policy efforts aimed at
entrepreneurship and technology-based economic development efforts, projects such as
Information and Communications Technology20
(ICT) infrastructure investment, business
incubators, developing and nurturing industry clusters, and education and technology
training programs.
For these economic development strategies to be successful, states and regions are
recognizing that core infrastructure must be in place to support innovation and
entrepreneurial activity. In today‘s technology-driven marketplace, it can be assumed that
advanced ICT infrastructure is a prerequisite to developing a tech-savvy workforce,
developing local competitive advantage, and, generally, ensuring economic development
20 For the purposes of this research we define ICT as all forms of technology used to create, store, exchange, and use information. It can include any communication
device or application, including telephones, cellular phones, computer and network hardware and software, and regular and advanced bandwidth infrastructure.
Additionally, we assume that advanced ICT incorporates Broadband technology and can thus be viewed synonymously throughout this research.

173
success (European Commission, 2002b; Department of Trade and Industry (DTI), 2001).
High-speed Internet access, in particular, has received much recent attention since most
computing applications with promise to deliver competitive advantage to firms and
regions, require this access (Eberts, et al, 2005). This vision is described as one that:
consists of strong non-inflationary growth arising out of the increasing influence
of information and communications technology and the associated restructuring
of economic activity…{embracing features such as}…the growth of small high-
tech (businesses), the increasing importance of mobile and highly skilled talent,
the rise of entrepreneurship and the centrality of venture capital. (Thirft, 2001,
p.414)
While firms and regions may require this technology, it is not ubiquitous. In the
United States there continues to be an ongoing digital divide across geographies, regions,
racial groups, age groups, and income classifications. Further, uptake and use of
advanced ICT infrastructure and applications vary considerably across type and size of
firm, with smaller firms more often lagging (Buckley and Montes, 2002; Dun and
Bradstreet, 2001; Varian, 2001). If one of the foundations of the knowledge economy is
entrepreneurial activity and advanced technology infrastructure, understanding
differences in ICT uptake and use patterns across different sizes and types of firms is
important. If both the spatial concentration of entrepreneurs and advanced ICT
infrastructure and applications are factors important to economic development, we need
to better understand the relationship between these factors.
In acknowledging the importance of advanced ICT investments to economic and
social development, many communities and regions are beginning to consciously take
174
steps towards enhancing their access to Broadband21
infrastructure. In most communities,
incumbent local exchange carriers (ILECs) and/or competitive local exchange carriers
(CLECs) --- created after the breakup of the regional Bell incumbents and largely the
result of the Federal Communication Commission‘s (FCC‘s) attempts to deregulate and
create competition in the industry --- are thought to be the only viable options for
providing the necessary bandwidth at reasonable prices. However, nearly all ILECs and
many CLECs are publicly-traded business concerns whose operations are driven by
maximizing profit and increasing shareholder value. Deploying advanced networks to
sparsely-populated rural regions or disadvantaged urban areas often does not allow these
firms to meet articulated revenue and profit objectives. As the expectations of many
economic development professionals are that even greater bandwidth will be required for
economic success in the future, communities feel increasing pressure to take this issue
into their own hands by creating municipal-owned and/or operated ICT facilities (Eberts
et al., 2005).
In response to increasing municipal interest and involvement in deployment of
ICTs, traditional private sector providers of these services have responded with their own
legislative efforts, mainly at the state policy level, to restrict municipal involvement in
21
There is not a single, standard definition of Broadband as the concept deals with several different
technologies, platforms, and service speeds. For the purposes of this research we rely on a basic
understanding of Broadband technology as the ability to transmit data at high-speeds over a single cable or
fiber network. The most common platforms for this technology are cable, DSL, fiber optic, wireless, and
satellite. The FCC defines Broadband as follows: Broadband or high-speed Internet access allows users to
access the Internet and Internet-related services at significantly higher speeds than those available through
―dial-up‖ Internet access services. Broadband speeds vary significantly depending on the particular type
and level of service ordered and may range from as low as 200 kilobits per second (kbps), or 200,000 bits
per second, to six megabits per second (Mbps), or 6,000,000 bits per second. Some recent offerings even
include 50 to 100 Mbps. (http://www.fcc.gov/cgb/consumerfacts/highspeedinternet.html).

175
the industry. These efforts have often been undertaken even when existing providers do
not have any near-term plans to provide this service. Barriers range from legislative
constraints that prevent all municipal investment in advanced ICT infrastructure,
provision, and/ or service to a variety of administrative, financial, and/or procedural
barriers. There are a variety of stated reasons for these policy measures, mostly focused
on defining the provision of advanced networks as the exclusive domain of the private
sector. However, many policy makers, researchers, and local leaders are increasingly
concerned that these restrictions place underserved communities and regions at risk of
falling further behind other communities in relation to technology infrastructure
investment, making them less attractive places to start or expand a business. There is also
concern that the unhindered ability of communities to develop or operate their own
infrastructure represents a ―viable threat‖ to existing providers, encouraging them to
deploy networks, enhance service, and/or reduce prices in heretofore relatively un-served
regions. In fact, there is much anecdotal evidence indicating that communities need only
begin to make serious plans about deployment of Broadband services in order to induce
existing providers to take the needs of these communities seriously.
This paper will begin by exploring the current literature on the economic benefits
of Broadband, including the potential benefits from local municipal investment in
advanced ICT infrastructure. This will be followed with an overview of current national
Broadband trends and legal barriers that states have enacted in an effort to hamper local
and regional investments in advanced ICT infrastructure. Next is a discussion of the
research on small business access and adoption of advanced ICT and e-business

176
technology. This is followed with a presentation of the unique legal and policy
environment in South Carolina as one example. The second section of the paper presents
results from interviews of South Carolina municipal leaders and surveys from 10 of
South Carolina‘s municipal electric cities. The last section of the paper describes a model
and results from a state level regression analysis estimating the impact of ICT policy
restrictions on state-level small business growth. In conclusion, this research hopes to
clarify the impact of the state policy environment on a state‘s ability to realize success
with new economy indicators like small business growth. If our nation and each state are
to fully embrace a ―knowledge-economy,‖ understanding the full scope of opportunities
and constraints to this development is critical to the ongoing research agenda.
Evidence of the Benefits of Broadband Investment
Katz and Rice (2002) argue that one of the reasons that Broadband is perceived to
have the potential to generate substantial economic benefits is the analogous association
with the growth potential of historical investments in other technologies that had done so.
The transformative benefits that Broadband can provide are elaborated by Commissioner
Copps (2002) of the Federal Communications Commission (FCC).
In this new century we will work differently, play differently, and probably each
govern ourselves differently, all because of the transformative power of
telecommunications. Broadband is already becoming key to our nation‘s system
of education and commerce and jobs and therefore, key to America‘s future.
Broadband is going to be front and center in America‘s 21st century
transformation. Those who do have access to advanced communications like
Broadband will win; those who don‘t will lose.

177
Generally, Broadband has the potential to improve the access and quality of
education and health services, government communication, jobs, and overall economic
well-being (Firth and Mellor, 2005). For consumers Broadband enhances educational
opportunities, access to peers and networks, access to entertainment options, and
generally improves consumer information and networking choices (Wales et al., 2003).
For businesses and organizations, Broadband potentially offers efficiency and
productivity enhancing benefits through specific applications that allow for the adoption
of new business models (Precursor Group, 2001). The OECD (2001) has argued that ICT
infrastructure has the potential to influence firm location decisions just as transportation
networks did in the 20th
century. Additionally, as technology marches onward, there is
evidence that consumers and businesses will require more bandwidth, not less, in order to
effectively leverage the most up to date technologies. Overall, the estimated benefits have
generated ongoing interest and the belief that Broadband technology should be actively
promoted in the public arena (Xavier, 2003).
Theoretically, the specific benefits that arise from Broadband related activities
can be measured in relation to the increase in private and/or social surplus (Katz &
Shapiro, 1986; DiMaggio, Harigittai, Neumann, and Robinson, 2001). Katz et al. (2010)
discuss four primary economic effects generated by an increase in Broadband availability
and/or penetration. The first effect is generated by the construction of Broadband
infrastructure. This creates direct, indirect and induced effects from employment and
industrial relationships impacted by economic multipliers. The second effect occurs from
positive spillovers or externalities created from the use of a Broadband network. For

178
firms, effective leveraging of this technology can enhance resource productivity, while
consumers may experience positive income effects from economic multipliers. Both of
these impacts may be important contributors to enhanced GDP growth. Additionally,
consumers may realize an increase in their consumer surplus, calculated as the difference
between what consumers would be willing to pay and the actual Broadband price. Taken
together, all of these benefits are hypothesized to make a positive impact on GDP growth
now and in the near future.
Many researchers have hypothesized about the potential net private and social
benefits to be gained from an increase in nationwide and/or regional Broadband
availability and deployment. However, only one study has attempted to estimate the
national consumer and producer surplus generated by Broadband access over narrowband
access (dial-up). Greenstein and McDevitt (2009) estimate a $28 billion total surplus
from Broadband availability in the US in 2006. Consumer surplus was 27% of the total,
or $7.5 billion, and producer surplus was estimated to be $20.5 billion. A 2010 study
(Greenstein and McDevitt) estimating Broadband surplus in Canada, the United
Kingdom, Spain, Mexico, Brazil and China finds that a nation‘s total Broadband surplus
is directly related to Broadband penetration. Crandall et al. (2003) estimate a $300 billion
annual increase in US consumers‘ surplus generated from new services that Broadband
deployment enables22
. While this research stream continues to evolve, Foster and
Neuberger (1999) argue that estimating consumer and producer surplus in complex and
imperfectly competitive markets, such as telecommunications markets, remains difficult.
22
This assumes universal adoption of current Broadband technologies such as DSL and cable
modem service. Benefits are based on residential usage.

179
Challenges notwithstanding, the first available studies on the nationwide impact
of Broadband adoption began appearing by 2001. A Verizon-commissioned study by
Criterion Economics (Crandall and Jackson, 2001) estimated that Broadband would
contribute an extra $500 billion in GDP by 2006. The New Millenium Research Council
(Pociask, 2002) estimated that 1.2 million jobs would be created from the construction
and use of a nationwide Broadband network. Similarly, Ferguson (2002) argued that
without improving Broadband networks and performance the U.S. could see substantial
productivity losses. These early studies provided important forecasts of the nationwide
potential of Broadband technology, however, additional work clarifying the full scope of
benefits to the national economy has only occurred more recently.
Since the early 2000s a number of national studies have further evaluated the
economic impact of a national Broadband network. All of these (Crandall et al., 2003;
Katz et al., 2008; Atkinson et al., 2009; Liebenau et al., 2009; Katz et al., 2009; and Katz
et al., 2010) used input-output analysis to estimate the impact of a nationwide network on
job creation. Given specific assumptions about the value of this national investment, each
study found significant employment impacts from the creation of a nationwide
Broadband network. These studies assume that the buildout of a nationwide network
would generate direct employment impacts from the actual building and deployment of
the physical infrastructure, along with indirect and induced effects. Indirect effects are
created from the additional employment created by firms selling to those involved in
network construction while induced effects are generated from the additional
employment created from household spending generated by the income earned and spent

180
from direct and indirect effects. Three studies (Crandall et al., 2003; Atkinson et al.,
2009; and Katz et al., 2009) estimate total U.S. employment impacts of respectively
140,000, 180,000, and 127,800 annual jobs. Additionally, the U.S. studies estimate Type
II23
multipliers of 2.17, 3.60, and 3.42 respectively. The estimated multipliers provide
additional confirmation of the potential strength of national Broadband investments.
Regression analyses and top-down multipliers24
have also been used to estimate
the employment impact of Broadband externalities. Using a sample of 48 states from
2003-2005, Crandall et al. (2007) estimate a 1% point increase in state Broadband
penetration will generate employment growth of 0.2 to 0.3 % per year, assuming the state
is not already at full employment. Thompson and Garbacz (2008) use a sample of 48
states over the period 2001-2005 to confirm a statistically significant positive relationship
between Broadband penetration and employment. Their research further confirms that the
strength of this relationship varies by industrial sector. Similarly, Gillett, et al. (2006)
estimates the economic impact of Broadband deployment at the zip code level. They
conclude that an increase in nationwide Broadband deployment would result in an
increase in employment of 1.5%. In conclusion, all of these studies provide additional
evidence that a nationwide Broadband deployment will provide positive employment
effects across the nation. These studies highlight the importance of differential impacts
23
Type II multipliers estimate the impact of direct, indirect and induced effects divided by the direct effect.
24 Top-down multipliers are distinguished from those that are used in a bottoms-up approach. A top-down
approach uses macroeconomic models, state or U.S. models, to estimate aggregate impacts generated by a
specific policy shock. These models use state or national multiplier estimates to determine employment and
income impacts.

181
across industries and also potential methodological issues in estimating local and regional
impacts.
Recent research has also focused on the impact of Broadband on gross domestic
product (GDP) growth. The majority of these studies find a statistically significant
relationship between Broadband penetration and GDP growth but the results vary widely.
Two U.S. studies (Crandall et al., 2007; Thompson and Garbacz, 2008) estimate this
relationship using the majority of U.S. states, covering the periods 2003-2005 and 2001-
2005 respectively. Crandall et al. (2007) do not find a statistically significant relationship
between Broadband and GDP growth, while Thompson and Garbacz (2009) estimate a
10% increase in Broadband penetration increases efficiency by 3.6%25. In an
international analysis of low, middle, and high income countries, Qiang and Rossotto
(2009) find a 10% increase in Broadband increases GDP growth respectively by 1.38% in
low and middle income countries and 1.21% in high income countries. Two studies
(Czernich et al., 2009; Koutroumpis, 2009) on OECD nations also yield mixed results.
Koutroumpis (2009) estimates an increase in GDP growth of .25% for a 10% increase in
Broadband penetration, while Czernich et al. (2009) estimate an increase of 1.9 -2.5 %.
These studies provide further confirmation of the potential significance of Broadband on
economic activity but the variation in these estimates highlights underlying methodology
problems with highly aggregated data and potential weaknesses in the model
specifications or the data itself.
Several studies have specifically addressed the potential benefits of rural
25
Katz et al (2010) indicate that the standard assumption is a 1% increase in productivity or efficiency
results in a 1% increase in GDP.

182
Broadband deployment. Katz et al. (2010) estimate that rural wireless Broadband will
result in the creation or retention of 117,000 jobs in the nineteen states with the lowest
Broadband access and adoption rates in the United States. Approximately 38,500 would
be new jobs concentrated in trade, health, and financial service sectors. This study uses
this same methodology to estimate the economic impacts of rural wireless Broadband in
three relatively underserved states; Kentucky, Ohio, and West Virginia. If Broadband
availability were to increase to 100 % through deployment of 700 MHz wireless
technology in these states, between 2011 and 2014, 10,235 jobs are estimated to be saved
or created in Kentucky, 5,744 in Ohio, and 4,793 in West Virginia. In Kentucky the
majority of jobs would be concentrated in rural areas adjacent to metropolitan areas,
while in Ohio and West Virginia the majority of jobs saved or created would be
concentrated in isolated, rural communities. The authors speculate that these different
impacts are largely due to differences in regional Broadband supply gaps. Thus, states
with larger rural supply gaps will experience a greater benefit proportionately in rural
areas than other regions in the state. Enhancing Broadband availability is also estimated
to increase the growth of median income in states counties by 2.1 % in Kentucky, 0.8%
in Ohio, and 3.43% in West Virginia. Overall, with 100% Broadband deployment these
three states are estimated to create or save 116, 863 jobs from 2011-2014 and to increase
the median per capita income by $1201.
Individual state or regional studies have not been as common as national level
research. However, several studies point to the significance of increased Broadband
access for regions, as well as the potential of municipal deployments to generate positive

183
economic benefits. Shideler et al. (2007) estimates the impact of increasing Broadband
penetration across counties in Kentucky. Their analysis reveals that for every 1% increase
in Broadband penetration, total employment growth increases from 0.14% to 5.32%,
depending on the industry. One early, small regional study (Strategic Networks Group,
2001) found significant predicted positive impacts from the local deployment of a
Broadband network in South Dundas, Ontario. Following this, two studies (Kelley 2004;
Ford and Koutsky, 2005) began to further clarify the benefits of local public investment
in technology infrastructure. Kelley (2004) compared the economic effects of a municipal
Broadband deployment in Cedar Falls, Iowa with nearby Waterloo, Iowa. Ford and
Koutsky‘s (2005) study compared Lake County, Florida with similar counties where
advanced telecommunications networks were not deployed. All of these studies indicated
that investments in advanced ICT systems have a positive influence on economic growth
and development.
With the possibility of substantial private and social benefits at stake, there is
pressure on local, state and national governments to participate in these investments. As a
result, research has also explored various alternatives for public involvement in ICT
infrastructure investment. Gillett et al. (2004) describe four possible roles of government
involvement in Broadband infrastructure; 1) stimulator of demand, 2) rule-maker, 3)
source of funds, and/or 4) developer of infrastructure. This research also begins to clarify
the role of municipally based electric utilities (MEUs) in the provision of this
infrastructure. Gillett et al. (2006) follow up this research with a more in-depth analysis
of the role of local municipal electric utilities in providing ICT infrastructure. Their
184
results reveal that MEUs are more likely to invest in ICT infrastructure if they can exploit
scope economies in supporting their own electric utility operations and if they perceive
themselves to be underserved by private competitors. This research also indicates that
MEU‘s closer to metropolitan areas and less constrained by state regulatory barriers are
also more inclined to make these investments.
In 2004 there were 2,007 municipalities that provided municipal electric service
to their local communities (Gillett et al., 2004). Of these, 616 utilities provided some type
of communication service for their region, a 37% increase since 200126
. There is
evidence that larger cities and even those municipalities without MEU‘s have begun
considering wireless Broadband networks as important investments for the long-term
success of their communities. However, there is ongoing criticism of the government‘s
involvement in supplying these types of communications services. The ―crowding out
effect‖ is one of the primary criticisms used to argue against these types of public
investments (Ford, 2005). The simple version of the argument is that within any region
the market is only capable of supporting so many suppliers and government entry into
any given the market causes some private firms to be crowded out of these markets.
However, critics uphold there are several problems with this argument.
Contradictions to the crowding out theory include the following:
ICT investments require large, upfront investments in fixed assets that have
the potential to result in scale economy benefits.
26
Also see Electric Power Statistics at www.appanet.org.

185
In some regions the start-up costs and projected revenues of these
investments are such that private firms may be precluded from entering the
market.
In some regions a government provider may be the only provider willing to
enter the market or may be an additional competitor to an existing local
monopoly firm.
Cities and regions already have examples of infrastructure investments with
these characteristics within their own communities; fire, police, water, sewer,
and other public services.
Moreover, Ford‘s (2005) analysis of the state of Florida provides no evidence that
the crowding out effect is at work in communities with MEUs. Rather, Ford‘s model
supports the possibility that MEUs may actually increase the competitive environment
and stimulate private telecommunications provision and investment. Specifically, in
Florida communities without a municipal Broadband provider there were 13% fewer
competitors (ibid,). One Verizon representative acknowledged that community networks
make ―people more aware of the benefits of Broadband‖ (Williams, 2005). Sutton (1995)
and Beard and Ford (2003) argue that municipal service provision could be the catalyst
for additional private firms in the market if municipal provision creates an environment
for the market to expand. Overall, this research supports the ability of MEU‘s to make
these investments in order to ensure that the supply and demand conditions of a
nationwide telecommunications market are met.
The idea of government involvement in ICT infrastructure investment continues
to generate strong debate over the potential benefits and costs of this infrastructure.
Papacharissi and Zaks (2006) note that, in the U.S., a number of groups view the

186
discussion of any government regulation or involvement as a threat to the foundations of
capitalism. Patek (1992) argues that this type of regulation will not only bring
cumbersome bureaucracy but also will discourage technological innovation. However,
Papacharissi and Zaks note that the government has and continues to be an important
investor in nationwide research and development efforts across a wide range of
infrastructure and technology related areas. Ironically, it is because of government
investment from the Department of Defense, National Science Foundation, and several
institutions of higher education that the United States (and the world) has the nationwide
technology backbone (Internet) that allows for the current development of local and
regional technology networks. Moreover, the government has a long history of making
investments in infrastructure that have the potential to serve the public at large and result
in community wide positive externalities.
The ongoing question continues to be what is the public role for ICT
infrastructure development? If, as a number of researchers have argued, market
incentives are not likely to eliminate all of the gaps in access and service, some form of
government intervention is necessary to ensure adequate deployment and uptake of
Broadband infrastructure. Feser (2007) calls for a bottom-up approach to Broadband
investment, whereby the government is a catalyst for these investments and possibly a
partner in developing local initiatives. Feser (2007) argues the locally-driven nature of a
bottom-up approach increases the likelihood that the unique needs of diverse geographies
can be met with unique and creative solutions, rather than top-down standardized
solutions.

187
This issue has been further complicated by the regulatory and reporting
requirements of the 1996 Federal Telecommunications Act. As a part of this Act, the
1999 First Broadband Development Report defined ―Broadband‖ as 200 kilobytes per
second in either or both upstream or downstream data transmission. As Broadband
penetration has increased and the types of applications requiring enhanced bandwidth has
grown, this definition has been increasingly criticized as severely inadequate for
competitive communities of the Twenty First century. However, until 2010, any supplier
meeting this service requirement, no matter how inadequate, was technically providing
Broadband service by FCC standards. It could be argued that the failure of the FCC to
update this definition as the technology rapidly changed has contributed to a slower
growth of competitive, high speed service options across the country.
The 2010 National Broadband Plan and ongoing criticism from industry experts
led to a revised FCC definition of ―Broadband.‖ The National Broadband Plan sets a
benchmark for every household to have affordable Broadband service of at least 4
Megabytes per second (Mbps) download speed and upload speeds of at least 1Mbps.
These service benchmarks represent the minimum requirement to stream high-quality
video while continuing to support basic email and web browsing. While updating
minimum specifications, the sixth Broadband deployment report (FCC, July 2010) also
acknowledges that 14 to 24 million Americans remain without adequate access to
Broadband. Despite the forgoing, the FCC further reports that ensuring adequate access
and penetration of Broadband, based on the National Broadband Plan, is proceeding in a
―reasonable and timely fashion (FCC, July 2010, p.5).‖

188
An additional challenge to ensuring adequate access and adoption of this
technology, that is arguably a result of the 1996 Telecommunications Act, concerns the
FCC reporting requirements of national Broadband coverage. The FCC considers an area
as served by Broadband if the telecommunications industry reports that at least one FCC-
defined subscriber resides there. Historically, the FCC did not require any additional
information beyond the location of providers; information such as the type of service,
speed, or pricing options, all of which are important in confirming the breadth and scope
of national Broadband coverage. As a result, incumbent telecommunications providers
have been able to legally claim much higher penetration rates than more detailed data
would likely reveal. Partly in response to ongoing criticism of the weakness of FCC
reporting data, the 2009 American Recover and Reinvestment Act (ARRA) provided
$350 million for the creation of a nationwide Broadband map. The map27
was released in
February, 2011. It is a searchable database of over 25 million records that provide
information on service, service providers, speed of service, and type of service
technology. The 2009 stimulus bill and the resulting National Broadband Plan have
improved the landscape for nationwide Broadband deployment and penetration, but there
remain ongoing concerns about the regional and national impact from the business and
consumer Broadband gaps that remain.
27
The map can be accessed at Broadbandmap.gov
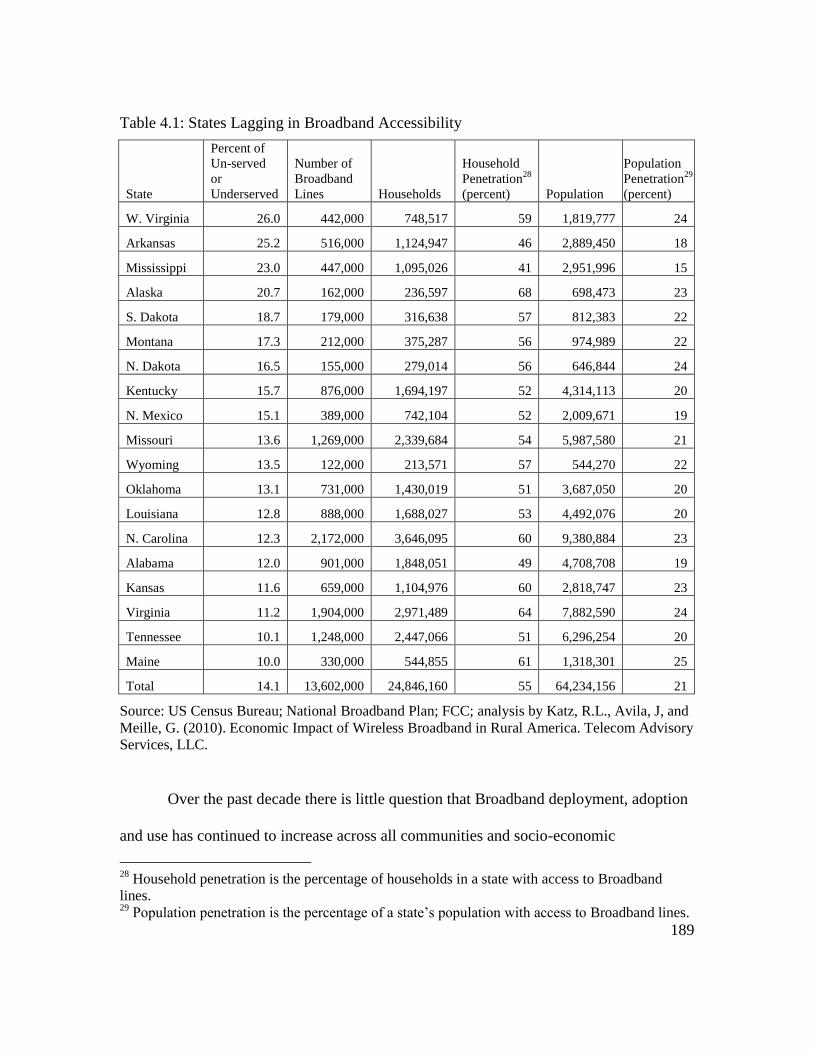
189
Table 4.1: States Lagging in Broadband Accessibility
State
Percent of
Un-served
or
Underserved
Number of
Broadband
Lines Households
Household
Penetration28
(percent) Population
Population
Penetration29
(percent)
W. Virginia 26.0 442,000 748,517 59 1,819,777 24
Arkansas 25.2 516,000 1,124,947 46 2,889,450 18
Mississippi 23.0 447,000 1,095,026 41 2,951,996 15
Alaska 20.7 162,000 236,597 68 698,473 23
S. Dakota 18.7 179,000 316,638 57 812,383 22
Montana 17.3 212,000 375,287 56 974,989 22
N. Dakota 16.5 155,000 279,014 56 646,844 24
Kentucky 15.7 876,000 1,694,197 52 4,314,113 20
N. Mexico 15.1 389,000 742,104 52 2,009,671 19
Missouri 13.6 1,269,000 2,339,684 54 5,987,580 21
Wyoming 13.5 122,000 213,571 57 544,270 22
Oklahoma 13.1 731,000 1,430,019 51 3,687,050 20
Louisiana 12.8 888,000 1,688,027 53 4,492,076 20
N. Carolina 12.3 2,172,000 3,646,095 60 9,380,884 23
Alabama 12.0 901,000 1,848,051 49 4,708,708 19
Kansas 11.6 659,000 1,104,976 60 2,818,747 23
Virginia 11.2 1,904,000 2,971,489 64 7,882,590 24
Tennessee 10.1 1,248,000 2,447,066 51 6,296,254 20
Maine 10.0 330,000 544,855 61 1,318,301 25
Total 14.1 13,602,000 24,846,160 55 64,234,156 21
Source: US Census Bureau; National Broadband Plan; FCC; analysis by Katz, R.L., Avila, J, and
Meille, G. (2010). Economic Impact of Wireless Broadband in Rural America. Telecom Advisory
Services, LLC.
Over the past decade there is little question that Broadband deployment, adoption
and use has continued to increase across all communities and socio-economic
28
Household penetration is the percentage of households in a state with access to Broadband
lines. 29
Population penetration is the percentage of a state‘s population with access to Broadband lines.

190
characteristics. The FCC National Broadband Plan estimates there are 7,035,613 United
States housing units identified as un-served or underserved. As stated earlier, the FCC
defines a region as un-served or under-served if housing units do not have access to
service of 4 Mbps download speed. The largest portions of these households are in rural
areas and remain un-served or under-served because of lower population densities and/or
economically distressed populations. Katz et al. (2010) identified US states where less
than 90% of the population are served by the 4Mbps service requirement. Table 4.1
illustrates their estimation of those states that have the most substantial gaps in
Broadband deployment. Katz et al. (2010) and Atkinson and Shultz (2009) argue that
these areas are likely to remain under-served because current incumbent providers lack
the incentives to invest in rural fixed or mobile capital investment.
Even with the growth of Broadband deployment and use, there also continue to be
persistent gaps in both the adoption and use of Broadband across demographic and
socioeconomic categories. There is anecdotal evidence that widespread, lower-cost
bandwidth is available in wealthier urban and suburban areas but spotty availability
remains in rural and poorer urban markets. The Pew Internet and American Life Poll
regularly reports on home Broadband adoption and use trends. Table 4.2 summarizes data
from the 2009 Pew Internet and the American Life project. In 2009 there remains a rural-
urban gap of 21 %, a 31 % gap from the lowest educational attainment to the highest, a
19% and 22% gap respectively between black Americans and White and Hispanic
Americans, and a gap ranging from 6-53% among different income groups.

191
Table 4.2: Home Broadband Adoption Trends
2006 (%)
2007
(%) 2008
(%) 2009
(%)
Yearly Adoption
All Adults 42 47 55 63
Income
Under $20K 18 28 25 35
$20K-$30K 27 34 42 53
$30K-$40K 40 40 49 54
$40K-$50K 47 52 60 71
$50K-$75K 48 58 67 80
$75-$100K 67 70 82 82
Over $100K 68 82 85 88
Educational Attainment
High School Grad 31 34 40 52
Some college 47 58 66 71
College + 62 70 79 83
Age
18-29 55 63 70 77
30-49 50 59 69 72
50-64 38 40 50 61
65+ 13 15 19 30
Race/Ethnicity
White (not Hispanic) 42 48 57 65
Black (not Hispanic) 31 40 43 46 Hispanic (English
Speaking) 41 47 56 68
Community Type
Non-rural 45 50 59 67
Rural 25 31 38 46
Sources: 2006 data from the Pew Internet Projects survey February 15-April 6 survey;
2007 from the March survey, 2008 from the April-May survey and 2009 from the April survey.

192
Though progress is being made, there continues to be evidence of a digital divide across
the nation.
With the ongoing lag in Broadband deployment, persistent digital divide
disparities and efforts by the telecommunication industry to protect their monopoly
power, many communities have investigated the possibility of making these advanced
ICT investments on their own behalf. One early advocate of community Broadband
efforts, Baller-Herbst Law, has been actively involved in a number of state and federal
legislative battles over government restrictions on public investment in advanced
networks. Tracking these policy battles over time documents that municipally-led
investments are diverse in terms of the scope of their ownership, funding and service
expectations (http://www.baller.com/comm_Broadband.html). However, many are of a
public/private nature and may reflect an understanding and appreciation of the perceived
economic and social development potential of such investments.
Municipalities with locally-owned municipal electric utilities are, probably, more
likely than other municipalities to take local initiative and serve as early adopters of
advanced cyber-infrastructure projects. Such municipalities can often justify investments
in network infrastructure (fiber optic routes, routers, and switches) simply to reduce the
cost of providing cost-saving internal-to-the-utility administrative services (e.g.
automated meter reading, internal communications, and system controls). Ford (2005)
argues that for most Florida communities these investments have often been undertaken
only after a direct request for high quality service provision was denied by incumbent
providers. Although, once these investments are made, a case can often be made for

193
leveraging these public investments to exploit scale and scope economies associated with
converting the closed internal network to a public open network.
Even though an argument can be made for some municipalities to make such
investments, there are several factors that seem to affect the probability of municipalities
taking local initiative on such telecommunications infrastructure projects. Gillett, et al.
(2006) describes these factors as geo-demographics, the regulatory framework,
competition, and internal infrastructure. Geo-demographic factors center on the
demographics that shape demand (e.g. income and education levels) as well as those that
influence the cost of providing services (e.g. population density, proximity to
metropolitan areas). The regulatory framework centers on the existence of or lack of
state-level policies that might hamper or encourage municipal provision of
telecommunications services. Among other things, traditional private sector providers
have lobbied for the promulgation of policies that create supposed ―level playing fields‖
between private and public providers. Notwithstanding attempts at the federal level to
negate state level policies restricting the entry of municipalities into the
telecommunications service market, a host of state-level policies exist across the country.
30 These state laws have often been created at the request of the telecommunications
industry to erect barriers to entry against municipalities as well as other providers.
Figure 4.1 illustrates that in 2010 eighteen states had some type of policy
restriction concerning municipal involvement in advanced ICT infrastructure projects.
This map documents the range of these restriction; from explicit bans on any direct or
30
Baller-Herbst Law group at www.baller.com keeps an up to date list of restrictive state policies
and links to the specific legislation within the state.
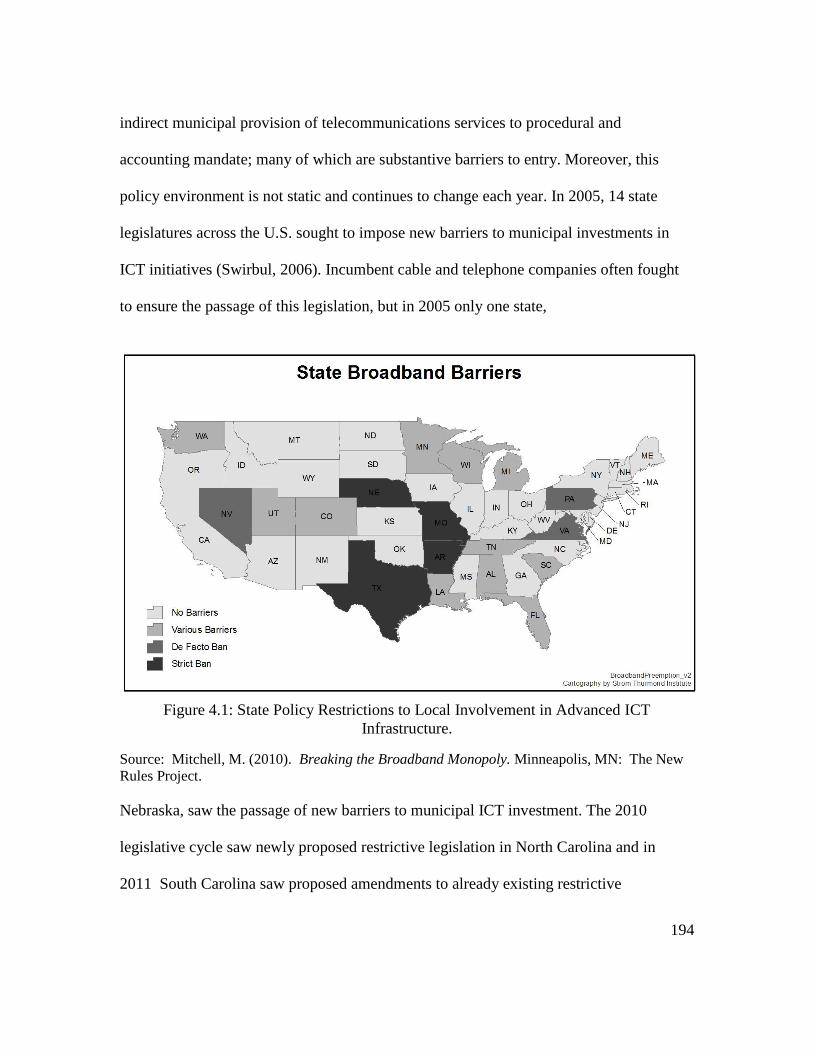
194
indirect municipal provision of telecommunications services to procedural and
accounting mandate; many of which are substantive barriers to entry. Moreover, this
policy environment is not static and continues to change each year. In 2005, 14 state
legislatures across the U.S. sought to impose new barriers to municipal investments in
ICT initiatives (Swirbul, 2006). Incumbent cable and telephone companies often fought
to ensure the passage of this legislation, but in 2005 only one state,
Figure 4.1: State Policy Restrictions to Local Involvement in Advanced ICT
Infrastructure.
Source: Mitchell, M. (2010). Breaking the Broadband Monopoly. Minneapolis, MN: The New
Rules Project.
Nebraska, saw the passage of new barriers to municipal ICT investment. The 2010
legislative cycle saw newly proposed restrictive legislation in North Carolina and in
2011 South Carolina saw proposed amendments to already existing restrictive
195
legislation. While neither piece of legislation passed, both of these legislative efforts
would have put additional constraints on local involvement in advanced ICT projects. A
brief summary of the restrictive policies in each of the eighteen states are provided in
Appendix three. Overall, the unique policy environment of each state, along with Federal
telecommunications policy and regulation, appear to constrain the ability of communities
to create locally driven solutions for their advanced ICT infrastructure and service needs.
Advanced ICT and Utilization by Small and Medium Sized Enterprises (SMEs)
There is an implicit assumption in the idea that advanced ICT investment is a
critical factor to the entrepreneurial, innovative economy and that SMEs will adopt and
use this technology in productivity-enhancing ways. Within the last few decades,
technology in general has dramatically transformed the way businesses are created,
managed and operated (Keen and McDonald, 2002). Advanced ICT service and
applications are critical variables in relation to the transformative potential of technology.
Rayport and Sviokla (1996) argue that today firms almost inhabit two worlds; a virtual,
―Internet‖ world and the physical, tangible world of ―days gone by.‖ Broadband
technology has the potential to generate a wide range of benefits for all sizes and types of
firms. For SMEs in particular this technology can provide access to customers and
markets never before accessible (Ritchie and Brindley, 2000; Quayle, 2002; Raymond,
2001; and Vescovi, 2000). This may allow firms to increase the scope of their marketing
efforts and improve existing marketing techniques (Sparkes and Thomas, 2001). The
networking potential of this technology can provide SMEs with greater access to supplier
196
networks and potential business partners. Poon and Swatman (1999) document this
technology‘s ability to improve business relations of business partners in SME firms.
With the potential to generate substantial benefits there is increasing pressure on
SME firms to fully adopt and utilize this technology (Spurge and Roberts, 2005). The
European Commission (2002c) upholds that SME‘s use of e-business applications is
―critical‖ to the EU nations being full participants in the entrepreneurial, knowledge
economy. Taylor and Murphy (2004) see SMEs as the crux of the new economy because
they can be substantial innovators, buyers of technology, and ultimately the creator of
new jobs. As national and state governments proclaim the importance of this investment
for SMEs and the economy at large, Standford (2005) indicates that the majority of
SME‘s have not made Broadband central to their operations. As well, there are ongoing
questions regarding the most effective methods for SME‘s to leverage this technology
(Southern and Tilley, 2000). Different sizes and types of firms will also use this
technology differently (Buckley and Montes, 2002; Taylor and Murphy, 2004).
Moreover, some of the hardware and software applications necessary for the effective
leveraging of this technology may be out of reach financially for SME‘s or may require
economies of scale in use that SME‘s do not have, unless they find appropriate
mechanisms to work cooperatively.
Theoretically, advanced ITC resources can be used to enhance the competitive
and strategic position of any size firm (King et al. 1988). Barkley et al. (2007) document
over thirty e-commerce case studies briefly summarizing the uses of and barriers to E-
commerce activities in SMEs. Markley et al. (2007) further describe twenty-five short
197
case studies of rural E-commerce utilization, barriers, and possible best practices. Barker
(1994) has identified the following categories as best uses of Broadband technology for
small businesses.
Enlarging a firm‘s customer base and general geographic reach
Improved access to information for marketing and advertising
Improved and reduced cost of firm communications
More productive communications and improved access to suppliers and
customers
Opportunity to improve supplier and customer support networks
Developing new sources for markets and business ideas
Expanding opportunities for networking
Fuller and Jenkins (1995) confirm similar categories from their research of small
firms in the UK. Time and resources are often the major constraints for SME‘s. This
technology allows SMEs to use less time and fewer resources to gather and disseminate a
larger selection of information. Poon and Swatman (1995) argue that advanced ICT
provides opportunities for SMEs to interact with a much broader range of suppliers and
customers. Several studies document the importance of E-commerce activities as a
marketing method and tool for enhancing market access (Adirondack North Country
Association, 2005; Cordeiro, 2003). Moreover, in a globalized marketplace research
confirms the importance of this technology in extending the global reach of small
businesses (Dent, 1990; Welsh and Cummings, 1991).
Several case studies have documented that many small firms, especially those in

198
rural settings, do not experience a significant increase in revenues due to increasing
online sales (Cordeiro, 2003; Papandrea and Wade, 2000). Cordeiro‘s (2003) case study
of a small retail firm notes that on-line sales are generally not high-profit margin sales.
Thus, on-line sales do not yield the same profit margins as in-store sales. This could be a
dilemma experienced to a greater degree by retail firms as customers may need to see,
touch and/or try on an item before they purchase it. However, Papandrea and Wade
(2000) reveal that firms may experience costs savings in document and information
delivery and may experience lower transaction costs in establishing contact with potential
customers.
A considerable body of research has documented the importance of small
business networks or cooperative alliances as it relates to firm success and growth
(Curran et al., 1993; Furukawa et al., 1990; Golden et al., 1993; Johannisson, 1987;
Stephenson and Duncan, 1993; and Yarnell and Peterson, 1993). The internet expands the
geographic reach of these networks with the creation of ―virtual alliances.‖ These groups
can trade and share information, develop cooperative research and/or advertising efforts,
create supplier and/or customer networks across an industry, along with many other
possibilities. Alliances that span international boundaries have the potential to enhance
market and information access in ways that dramatically improve small firm competitive
advantage at only a fraction of the cost. Several case studies also document the
importance of the network characteristics of regional e-commerce networks on small firm
success (Adirondack North Country Association, 2005; Henderson, 2001). The idea of
forming regional e-commerce alliances borrows from research on network economics and

199
the idea that networks, properly leveraged, can improve firm scale economies.
Participation in these networks may theoretically assist firms in their adoption and use of
this technology in such a way that they fully capture the benefits it can provide. While
identifying potential best uses of Broadband technology for small firms is important,
confirming the adoption and use of the technology is a critical pre-requisite to its use. If
SMEs are not adopting and/or using advanced ICT applications and services then
identifying best uses is an exercise in hypothesis building. Moreover, there continues to
be ongoing questions as to how SMEs are engaged in the adoption and use of this
technology.
A 2002 study by Buckley and Montes for the Economics and Statistics
Administration documents how SMEs in the United States are using advanced ITC tools
and applications. Overall, 70 percent of SMEs use computers in their businesses. They
spend approximately one-quarter of their capital expenditure budgets on computers and
communications technology. SMEs and large firms spend roughly the same percentage of
their investment budgets on this technology, but SMEs spend less on a per employee
basis. In 1998, firms with more than 500 employees spent 4 times as much as firms with
100 or fewer employees. Dun and Bradstreet (2001) report that over 80 percent of small
firms with 25 or fewer employees have computers in the workplace and approximately 70
percent have Internet connectivity. Table 4.3 below reports Internet access among
manufacturing plants by employment size categories in 2000. This data confirms the
trend that small firms are less likely to have internet access in relation to larger firms but
that overall Internet penetration across firms is high.
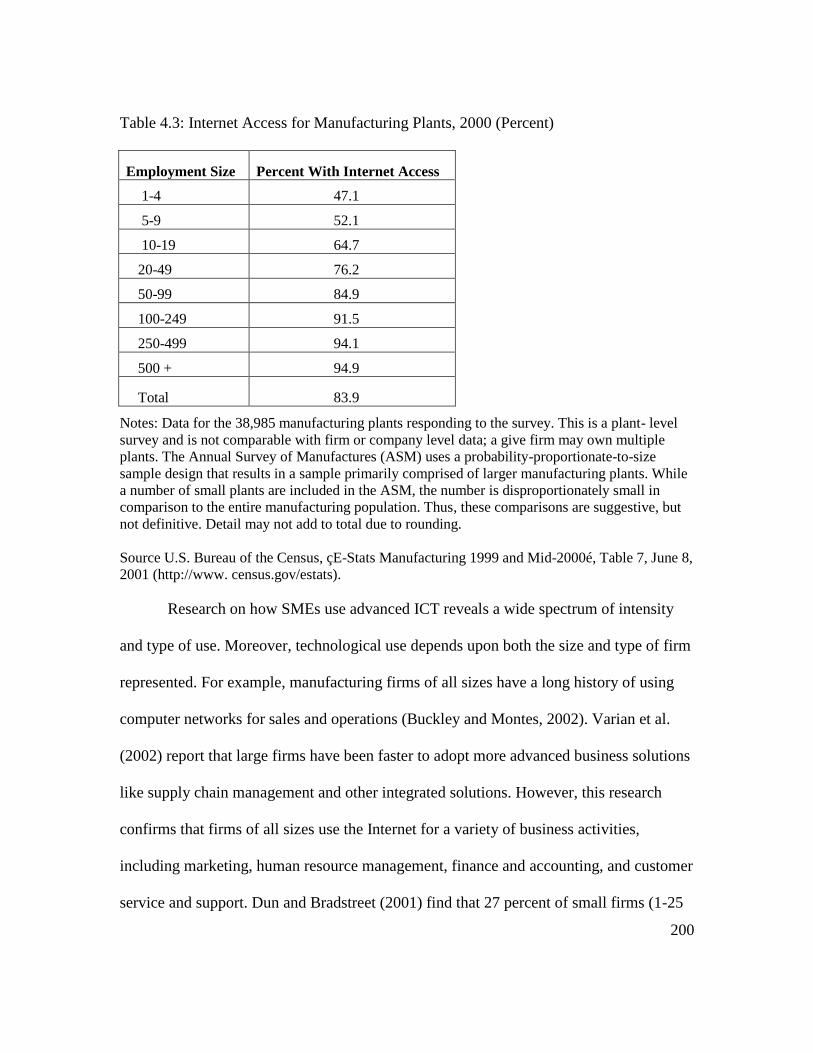
200
Table 4.3: Internet Access for Manufacturing Plants, 2000 (Percent)
Employment Size Percent With Internet Access
1-4 47.1
5-9 52.1
10-19 64.7
20-49 76.2
50-99 84.9
100-249 91.5
250-499 94.1
500 + 94.9
Total 83.9
Notes: Data for the 38,985 manufacturing plants responding to the survey. This is a plant- level
survey and is not comparable with firm or company level data; a give firm may own multiple
plants. The Annual Survey of Manufactures (ASM) uses a probability-proportionate-to-size
sample design that results in a sample primarily comprised of larger manufacturing plants. While
a number of small plants are included in the ASM, the number is disproportionately small in
comparison to the entire manufacturing population. Thus, these comparisons are suggestive, but
not definitive. Detail may not add to total due to rounding.
Source U.S. Bureau of the Census, çE-Stats Manufacturing 1999 and Mid-2000é, Table 7, June 8,
2001 (http://www. census.gov/estats).
Research on how SMEs use advanced ICT reveals a wide spectrum of intensity
and type of use. Moreover, technological use depends upon both the size and type of firm
represented. For example, manufacturing firms of all sizes have a long history of using
computer networks for sales and operations (Buckley and Montes, 2002). Varian et al.
(2002) report that large firms have been faster to adopt more advanced business solutions
like supply chain management and other integrated solutions. However, this research
confirms that firms of all sizes use the Internet for a variety of business activities,
including marketing, human resource management, finance and accounting, and customer
service and support. Dun and Bradstreet (2001) find that 27 percent of small firms (1-25

201
employees) use the Internet for sales and 44 percent use the Internet to purchase business
supplies and inputs. A study in the same year by the National Association of Purchasing
Managers (NAPM)/Forrester Research finds that small firms were only in the very early
stages of adopting and using Internet tools for sales and online purchasing.
The European Commission (2002c) provides evidence of similar advanced ICT
adoption and use trends across Europe. Table 4.4 illustrates SME uptake of both
technology and e-business applications. Similar to U.S. figures, the majority of EU SMEs
are likely to use ICT and have Internet access. However, considerably fewer EU SMEs
are likely to use e-business applications of this technology. Taylor and Murphy (2004)
report that these numbers are considerably overstated for the UK. Foley and Ram (2002)
report that for UK small and micro firms less than six percent of the value of firm orders
and purchases are made online. Given the low application use rates of UK small firms,
Taylor and Murphy question how widespread both technology uptake and e-business
applications are across other nations.
Table 4.4: SME e-business adoption rates in 2001 – selected countries
SMEs (%) UK Austria Sweden Italy Nether-
lands Norway
Using ICT 92 92 96 86 87 93
Web access 62 83 90 71 62 73
Own Website 49 53 67 9 31 47 Making e-commerce
purchases 32 14 31 10 23 43
Making e-commerce sales 16 11 11 3 22 10
Source: European Commission, 2002c, p. 4

202
As this research has evolved it has become evident that there is not a simple linear
relationship between the level and type of ICT adoption and firm size. Moreover, it is
well documented that SMEs are very diverse. SME firms will also have very different
needs for technology and related applications. With this said, research has documented a
number of general barriers to SME adoption of advanced ICT (Dixon et al., 2002; The
European Commission, 2002c; and Buckley and Montes, 2002).
The initial costs to set up systems and the ongoing maintenance costs may be
perceived as too high for these firms or may not be cost-effective for firms to
manage in-house.
SMEs do not have the ability to quickly change existing IT investments.
Adopting new and more innovative business solutions requires that any
technology changes work within an existing IT framework.
Many SMEs do not have the staff to properly implement and/or manage
advanced ICT resources.
There are ongoing questions of security and privacy with Internet sales and
purchases.
Many SME firms are not fully aware of the potential costs savings and
productivity benefits that this technology and its applications could provide.
Even those firms that have adequate technology in place often do not have the
proper skills or level of engagement with the technology to fully leverage its use (Spurge
and Roberts, 2005; Taylor and Murphy, 2004).
Survey research of SMEs in the UK identifies training and skill gaps as
significant barriers to the widespread use of advanced ICT. Taylor and Murphy (2004)
support the conclusion that current advanced ICT uptake is rudimentary when compared
against larger firms. The National Federation of Small Business indicates that SMEs may

203
not be at a competitive disadvantage if they have little or no business-to-business
commerce activities (cited in Standford). The cost/benefit of making these investments
may not be prudent for many SMEs.
In conclusion, research reveals that the majority of SMEs have not fully
leveraged advanced ICT technology. If this is the case, it is questionable whether state
level restrictions on investments in municipal ICT infrastructure and/or service will
impact state level small business and entrepreneurial activity. The argument can also be
made that if advanced networks are built and access to service is enhanced, residents and
businesses will demand these services. This is a ―build it and they will come‖ philosophy,
not unlike Say‘s Law, where supply creates its own demand. What is certain is that SMEs
will not be able to leverage advanced ICT tools and applications if the networks are not in
place. Moreover, the implementation of this infrastructure is influenced by local, state
and federal policy measures.
Overall, given the diversity of state small business environments, entrepreneurial
activity, economic and policy climates, and other demographic characteristics, clarifying
these relationships between state telecommunications policy variables and state small
business and entrepreneurial activity remains an important area of research and one that
is pursued in the remainder of this publication. The following section reviews the mixed
methods approach used in this research to clarify the impact of state telecommunications
policy restrictions on local investments of advanced telecommunications infrastructure
and ultimately on state small business and entrepreneurial activity.

204
Methodology
This research uses a mixed methods approach to document the potential impact of
state level restrictions on municipal Broadband investments. To lay the groundwork for
this analysis, we begin with a brief description of the legal and policy environment
surrounding municipal ICT investments in South Carolina. This is followed by a
summary of the results from a series of interviews with representatives from South
Carolina state and regional organizations that are knowledgeable about these issues and
their potential impact on municipalities. Next, a survey was employed to develop a case
study of the potential impact of these restrictions and the perceived importance of this
technology to South Carolina cities that have their own electric utilities (electric cities).
Finally, a national, state-wide data base for the years 1997-2005 was created to test the
hypothesis that state level ICT restrictions impact state level small business and
entrepreneurial indicators. Overall, this mixed methods approach highlights important
ICT related issues across organizations, local governments, and state governments more
generally. The lessons learned are varied and will be discussed in the results to follow.
South Carolina Telecommunications Legal and Policy Environment
South Carolina is an interesting case study of the potential impacts of state policy
restrictions on local and regional technology investments. South Carolina has many of the
characteristics (rural, poor, high percentage of minorities, elderly) that make the digital
divide a very real issue. In addition, South Carolina has a complicated legal and policy
history surrounding municipal involvement in ICT investments. To date, only a small

205
number of municipalities have attempted to make advanced telecommunications
investments across the state, though many communities continue to express interest in
making investments that would enhance their community‘s access to high-quality, high-
bandwidth competitive telecommunications service31
.
The slow pace of ICT infrastructure investment and deployment in South Carolina
originates, in part, with a South Carolina Supreme Court case that dates from the early
1990s. The City of Orangeburg, South Carolina chose to pursue building and offering its
own public cable service after numerous consumer complaints over quality and service of
the local franchised monopoly. As the city pursued its plans, the local cable company
sued the city. The city claimed it had the right to build cable infrastructure and offer cable
service under Articles eight and sixteen of the state constitution, claiming that local
municipalities ―may acquire or purchase and operate gas, water, sewer, electric,
transportation, or other public utility systems and plants upon majority vote of the
electors (South Eastern Reporter, 1994, p.602).‖
The lower court decision held that a local, public referendum could be held to
determine whether this local investment could be made. On January 28, 1992, a public
referendum on the issue was held and a majority of citizens voted to authorize the City of
Orangeburg to construct, purchase, and operate a cable television system. Even with
overwhelming local support, the local cable company continued to pursue a legal case
against the city. The case went to the South Carolina Supreme Court where a decision in
31
Most recently Oconee and Orangeburg Counties received federal stimulus funds to improve
service and access to rural communities in the region. However, incumbent providers have called
on the state legislature to increase policy restrictions, which threatens the viability of these
projects.

206
favor of the local, incumbent cable company resulted. The SC Supreme Court argued the
enumerated utilities described in Article eight and sixteen are of the same general kind or
class of utilities that provide essential services to the public.
―We do not believe that the value and necessity of cable television is so self-
evident that this court should declare that cable television system provides an
essential service…moreover, we do not find that the supplying of cable television
is necessary for the security, general welfare, and convenience of the municipality
or for preserving health, peace, order, and good government as required by
section 5-7-30 (South Eastern Reporter, 1994, p.602).‖
The court effectively decided that providing cable services was not within the purview of
municipal service provision. As a result, this ruling left many communities cautious of
using Articles eight and/or sixteen to justify the provision of additional public services
outside those explicitly outlined in South Carolina law and currently provided by
municipalities.
In addition to the Orangeburg case, the South Carolina 2001-2002 legislative
session saw the passage of what has come to be referred to as ―level playing field
legislation.‖ Specifically, this legislation broadly regulates telecommunications provision
by any South Carolina state or local agency, excluding the State Budget and Control
Board. The definition of provision is broadly interpreted as:
Any state or local political subdivision or person or entity providing
telecommunications service to the public for hire over a facility, operation, or
system that is directly or indirectly owned by, operated by, or a financial benefit
obtained by or derived from, an agency or entity of the State or any local
government. (South Carolina Legislature Online, Session 114 (2001-2002),
S1151).
Key features of this legislation indicate that a government-owned
communications provider must:

207
Be subject to the same local, state, and federal regulatory, statutory, and other
legal requirements to which nongovernment-owned communications service
providers are subject to
Not receive a financial benefit for which a nongovernment-owned
communications service provider is not a recipient
Not be permitted to subsidize the cost of providing a communications service
with funds from another communications service, operation, or other revenue
source.
Impute, in calculating the cost incurred and in the rates to be charged for the
provision of a communications service, the following: cost of capital
component that is equivalent to nongovernment-owned communications service
providers in the same state or locality; and an amount equal to all taxes, licenses,
fees, and other assessments to a nongovernment-owned communications provider.
(South Carolina Legislature Online, S483, http://www.scstatehouse.gov)
Amendments to this legislation were proposed in the 2011-2012 legislative
session. The amendments increase existing barriers to municipal provision of advanced
telecommunications service and make the applicability of the legislation broader by
replacing the word ―telecommunications‖ with ―communications‖ throughout the entire
law. The kinds of financial benefits that municipal providers are precluded from
receiving include tax exemptions or government subsidies of any kind. As well, if the
state determines that a direct or indirect subsidy has been applied, the government
telecommunications provider is required to change the pricing structure such that there is
no effective subsidy. The original legislation and its current amendments also place
substantial constraints on publicly-owned telecommunications providers in the collection
and payment of taxes. As an example, government owned providers are mandated to pay
all property taxes, including property that would otherwise be exempt, if it is utilized in

208
any manner towards the provision of telecommunications services. This legislation has
sparked widespread criticism that South Carolina‘s level playing field legislation
effectively blocks municipal provision of telecommunications services. The argument can
be made that similar burdens are not applied to local governments in the provision of
public services like police, fire, or education; all services where private sector alternatives
exist. As well, it begs the question of what benefits or advantages should be allowed for
public goods and/or services that are argued to be important for the ongoing economic
development of regions. Finally, similar restrictions on cross subsidization of private
sector enterprises are not suggested or enforced, leading many to question just how level
the field is between private and public sector enterprises with this legislation in place.
Between the Orangeburg Supreme Court case and more recently, the level playing
field legislation, South Carolina‘s municipalities face considerable constraints in any
effort to pursue public involvement in ICT infrastructure investments. Anecdotal reports
from officials across the state seem to be in agreement that the Orangeburg case was a
defining moment for municipalities in determining the types of services that cities could
deliver (Dickes and Lamie, 2007). This court case appears to have instilled a sort of
―chilling effect‖ on the willingness of municipalities to engage in projects that are not
explicitly defined as within their legal purview.
Local Interviews
In the fall of 2007 several interviews were conducted with representatives from
the Municipal Association of South Carolina (MASC) and the Piedmont Municipal

209
Power Association (PMPA). These agencies were chosen because of their extensive
recent and historical contact with South Carolina municipalities on ICT issues. These
representatives confirmed that many municipalities across the state remain concerned
with the legal ramifications of any municipal involvement that is not already a well-
defined municipal activity. In addition, representatives from MASC uphold that for the
smallest communities across the state, ICT infrastructure investment is not a priority.
Further, there are ongoing questions concerning how best to leverage and deploy this
technology given the uniqueness of each community and region in the state. The variance
among communities inhibits the direct replication of telecommunications solutions across
communities.
Representatives of both the PMPA and MASC emphasized that a large part of the
public policy problem is that there is not a ―one size fits all‖ strategy for local Broadband
access. With a diversity (size, economics, infrastructure, geography, etc.) of communities
across the state, policy proposals that attempt to standardize technology policy are,
according to the PMPA executive, doomed to failure. Thus, the state must have a better
understanding of different policy options that can work across a range of communities.
Further, the rapid pace of technological change makes it imperative that state and local
leaders begin to clarify and resolve any barriers that currently exist for local and regional
participation in ICT infrastructure investment.
A Survey of South Carolina Electric Cities (MEUs)
In South Carolina, very few cities state have engaged in any component of a

210
municipal Broadband project. Those that have are one of the twenty-one 32
electric
cities33
. Electric cities (Gillett et al., 2006) can often make these types of investments
more efficiently as they already have much of the physical infrastructure and staff
expertise in place to do so. To date, the most comprehensive municipal project is a
community that built out a network for its own municipal use and is not providing, nor
planning on providing access to non-municipal customers (households, institutions,
businesses). At the time of this survey, the researchers were aware of one small city that
was able to deploy a local Wi-Fi network as part of a downtown revitalization program
and another that began the planning phase for a community Broadband network but has
not gone any further with this effort. A number of other cities have tried to get involved
in municipally led Broadband, but to date no city has been successful in planning,
building, and/or deploying a community network. More recently, after this survey was
conducted, both Orangeburg and Oconee Counties received federal Broadband stimulus
funding to deploy advanced networks. Orangeburg County received $18.65 million and
Oconee County received $9.6 million to improve access and service to rural residents,
emergency and law enforcement services, healthcare facilities, and other community
institutions across these counties (Chandler, 2010; Sarata, 2010). However, the nature of
the state telecommunications policy environment threatens the viability of these and other
projects.
Given the purported nature of the South Carolina political climate for municipal
32
The 21 electric cities are Abbeville, Bamberg, Bennesttsville, Camden, Clinton, Due West, Easley,
Gaffney, Georgetown, Greenwood, Greer, Laurens, McCormick, Newberry, Orangeburg, Prosperity, Rock
Hill, Seneca, Union, Westminster, and Winnsboro. 33
Electric cities are municipally owned and operated, not-for-profit, electric suppliers.

211
investments in ICT projects, a survey instrument was developed to learn more about local
municipal and utility leaders‘ experiences with ICT planning and investments. The
survey had three primary objectives: first, to clarify which communities were
participating in ICT projects and to what degree; second, to gain an understanding of the
perceptions of local leadership with respect to the political climate surrounding ICT
investments; and finally, to ascertain how local policymakers view the relationship
between ICT investments and community and economic development.
The survey instrument was sent to South Carolina local municipal and utility
leaders of the ten electric cities represented by the Piedmont Municipal Power
Association (PMPA). An online survey platform, QuestionPro, was used in place of a
traditional mail survey. An initial cover letter was e-mailed to a list of twenty-three
municipal and utility leaders from the ten electric cities.34
This was followed
approximately a week later by a reminder email. 35
Out of the original twenty-three
leaders surveyed, fourteen individuals (61%), from nine of the ten electric cities,
responded to the online survey.
The nature of much survey work lends itself to questions of selection bias. With
this topic, it could be argued that those with prior interests in ICT issues will be more
likely to respond. However, the goal of this analysis is not to generate a random sample
of responses but to build a case study of results from informed local representatives.
Thus, the notion that individuals will self-select to complete the survey because of their
34
This list was comprised of municipal utility directors and executive managers of the municipalities. The
list was provided by PMPA. 35
Several browser compatibility issues were brought to our attention by survey participants, which resulted
in an additional follow-up email and reminder to all participants approximately two weeks later.

212
interest in ICT issues is potentially beneficial. This has the potential to allow for a more
complete understanding of the issues that these communities face with regard to ICT
investments and state level restrictions. It can also be argued that these individuals may
have a much stronger bias and thus, their responses are potentially influenced by a
specific policy bias. This is plausible but it is also true that if responses come from
generally more knowledgeable individuals with regard to communication and technology
issues, coupled with an effective survey instrument, a strong case study can be developed
that enhances our understanding of the impact of state level ICT restrictions on cities and
regions.
The first objective of the survey was to clarify which communities were
participating in ITC projects and to what degree. Several interesting conclusions can be
drawn from these questions. Over sixty percent of respondents revealed that their city
does not have an ICT master plan. When asked if ICT development efforts were included
in other areas of city planning, there was considerable uncertainty where, if at all, ICT
planning and development would be included. Figure 4.2 illustrates where survey
participants identified ICT planning and investment in community planning efforts. A
few local leaders indicated they recognize the importance of ICT planning in relation to
their communities‘ overall planning efforts, but specific local planning with respect to
deployment or service provision of ICT investments is rare. From this sample, only two
communities indicated that they were actively engaged in any aspect of locally-initiated
ICT projects.

213
Figure 4.2: Community ICT Planning Efforts
Communities that have undertaken any type of ICT project, or that were seriously
considering a community project, indicated that the primary motivation for these efforts
was the effective provision of a public service. Other reasons given for community
involvement in ICT infrastructure investment included local economic development
initiatives, provision of a key government service, increase the regional/national
competitiveness of the community, and the lack of adequate private sector provision. In a
separate question, survey results also reveal that the majority of participants believed ICT
investments are important for the future development of local community sectors. The
vast majority of respondents indicated that ICT investments were either critical or very
important to the future of their main street/small business environment, their
industrial/large business environment; and for the government, health, and education
0
5
10
15
20
25
30
35
40
45
Master Land Use Plan
Strategic Plan Economic Development
Plan
Zoning Ordinances
Indicate where ICT development is formally addressed in your community’s official planning efforts?
Percent

214
sectors of their communities. In terms of specific economic development areas,
approximately three-quarters of respondents indicated these investments as important or
very important for improving new business recruitment efforts, increasing employment
opportunities and enhancing workforce development skills and training. Appendix Four
includes data tables for each of the above questions.
One of the hypotheses considered for this analysis is that the political climate in
South Carolina is such that local policymakers have been conditioned to view issues
related to ICT investments as beyond their local purview. However, the majority of
respondents strongly support the idea that ICT planning and implementation is within the
purview of local community responsibilities. If this is the case, and if communities
remain underserved with advanced ICT as many say they are, what are the constraints to
local ICT planning and investment opportunities?
Figure 4.3 highlights the barriers that respondents identified as the most
significant obstacles to local community participation in ICT planning and investment.
The fact that funding and alternative city projects were the most significant constraint
confirmed earlier responses from PMPA and MASC representatives. These
representatives noted that many small communities do not have the appropriate resources
for locally driven ICT investments and most have other city projects that are considered a
much greater priority. For example, many communities do not have ICT staff even for
city functions and thus would be unable to accommodate the demands of a municipally
driven ICT project. As well, many communities have water, sewer or road projects that
always take priority over a variety of other projects, including technology projects. As

215
local government resources are increasingly scarce, this does not bode well for un-served
or underserved communities across the state.
Figure 4.3: Critical or Very Important Barriers to Municipal Involvement
in ICT Infrastructure Investments
One of the related hypotheses of this analysis is that local communities interested
in these issues may face substantial pushback from incumbent local providers.
Approximately one-third of respondents indicated that local opposition to local
government involvement in a community ICT project was moderate or strong. This
opposition originated from a local telephone company and a local cable company. This
type of opposition is challenging for small communities, as these providers are often
positioned as entrenched, exclusive gatekeepers in the provision of this key service.
0102030405060708090
Rate the importance of the following constraints as they relate to your community's ability to improve telecommunications
infrastructure?
Percent Critical/Very Important

216
These providers often have the advantage of political influence that allows them to
discourage or even block municipalities from entering this market.
One respondent used the open-ended response section to comment on the political
barriers of local ICT infrastructure investments. This respondent indicated that the
political dynamic in dealing with local incumbent providers was a powerful barrier for
local community involvement in these issues. Another respondent revealed that effective
cooperation between government entities was a primary barrier to ICT investments, while
another indicated that a lack of knowledge by state legislators was also a significant
barrier. Finally, two participants mentioned that a lack of public knowledge and/or
awareness of these issues were potential barriers.
While this survey provides only a limited sample from which to analyze the stated
survey objectives, it does provide insight into these issues and further, provides a useful
foundation from which to do additional research. Further, the survey begins to answer
and clarify the three primary objectives laid out earlier in this section. This sample
reveals that municipal leaders recognize the importance of ICT planning efforts and, in a
few cases, have been involved in the implementation or deployment of this service to
enhance local development and services. Additionally, the majority of respondents see
value in ICT investments as they relate to community and economic development. The
results also reveal that several communities feel constrained by ongoing questions
concerning the purview of municipal responsibility with these issues. Overall it appears
that funding constraints and the uncertainty surrounding the political and legal climate of
municipal ICT investments creates a disincentive for communities that are interested in

217
undertaking ICT investments.
In conclusion, while these survey results have only shed partial light on the ICT
situation in South Carolina, it does begin to provide insight into the kinds of issues that
cities may face if they involve themselves in advanced ICT projects. Furthermore, these
results generate important questions for future research. Given the paucity of municipal
ICT projects in the state, the development of municipal ICT case studies could provide a
more complete understanding of the complexities and nuances specific to different
communities across the state. Additional case studies could allow for generalizations that
would be instructive for state and local policy, eventually leading to a better decision-
making environment for other communities across the state. In addition, state-wide
comparisons of the breadth and scope of municipally led ICT projects could allow for a
more detailed quantitative analysis of community and state characteristics that drive
locally driven ICT investments.
There is considerable room for additional quantitative analysis surrounding a
broad range of issues within the telecommunications policy environment. One area of
research that is important for further exploration is the nature of these investments as a
pre-requisite to full participation in the knowledge economy. If advanced ICT
infrastructure is a necessary, but not sufficient input for full participation in an
entrepreneurial, innovation-focused economy, then it is plausible that a lack of these
investments or barriers to these investments could hinder local and state economic
activity. The next section of this research begins to explore this hypothesis with a series
of state panel regressions testing the impact of state ICT policy restrictions on a variety of

218
state small business and entrepreneurial variables.
Cross Sectional/Panel State Regression Model
The empirical structure of this research is a series of panel regressions of state
business, economic and demographic parameters measured against state small business
and entrepreneurial activity. The analysis uses publicly available data for all fifty states
from 1999-2007 (excluding 200536). Six dependent variables are examined to increase
the robustness and reliability of the results; the number of new companies, the change in
the number of new companies, new business job growth, technology industry
employment, the proceeds of initial public offerings, per 1000 firms within a state, and
the number of patents.
One of the ongoing dilemmas in entrepreneurship research is a lack of agreement
concerning defining and measuring entrepreneurship. Researchers have used
measurements like sole proprietorships, new businesses, patent activity, technology
companies, and other measures of innovation. One of the ongoing questions concerns
which variable best represents the entrepreneurial, innovative climate that research is
often trying to capture. With this in mind, this analysis makes use of both traditional
Small Business Administration measures like new business startups along with arguably
more innovative measurements represented by patent activity, technology industry
employment, and IPOs.
The new company variable is measured by the U.S. Small Business
36
The majority of data came from the Center for Enterprise Development‘s, Development Report
Card for the States. There was no Development Report Card in 2005 and thus, too many variables
would have been missing in an analysis of 2005.

219
Administration as the number of companies applying for new employment identification
numbers, per 1,000 workers in a given year. Change in new companies is measured as the
percentage change in the new company variable from one year to the next. Also
measured by the U.S. Small Business Administration, new business job growth is
calculated as the annual number of jobs per new establishment with fewer than 500
employees. These dependent variables capture elements of small business activity and job
growth but may not capture elements of a high-growth, entrepreneurial, innovative
activity.
Technology industry employment, proceeds of initial public offerings, and the
number of patents each may provide insight into the nature of entrepreneurship and
innovation within a given state. The Bureau of Labor Statistics calculates technology
industry employment as a percent of the total wage and salary jobs in high technology
industries in a given year. Technology industry jobs are those that fall within specific
NAICS codes defined as high technology industries. Proceeds of initial public offerings
per 1000 firms within a state, in a given year come from Thomson Financial Securities
Data. Patents are measured by the U.S. Patent and Trademark Office as the number of
patents issued per 1 million population in a given year. Summary statistics for all
dependent variables are provided in Table 4.5.
The causal links of entrepreneurial activity have been explored in a wide body of
research. Individuals become entrepreneurs and create new firms for different reasons
and under many different circumstances. There is evidence that entrepreneurial decision
making is influenced by the state and local policy environment, the local and regional

220
Table 4.5: Summary Statistics for Dependent Variables
Variables Mean Standard
Deviation Minimum Maximum Number of New
Companies 6.3890825 1.936310443 3.149 13.77 Change in Number of
New Companies 408.0 10.83700845 -28.9 87.37 New Business Job
Growth 2.137175 48.46213398 -1 484.5 Technology Industry
Employment 28.30025 3.063270364 0.02 11.72
IPO Proceeds 4.3168 3144.761751 0 23847.45
Number of Patents 954.62615 210.9962874 43.48 1399.56
Source: Corporation for Enterprise Development, Development Report Card for the States, 1999-
2007 (excluding 2005), www.cfed.org.
business climate, formal and informal networks, and local and regional financial
infrastructure among other things. As a result, a broad set of thirty-two continuous and
seven discrete independent variables were chosen for inclusion in this analysis. These
variables are divided into six primary categories; employment, wages and income,
demographics and equity, education, measure of innovation, and business climate. The
following section describes how each variable was measured and its source.
All of the employment variables come from the U.S. Bureau of Labor Statistics.
Long-term employment growth is measured as the percent change in annual average
employment, by place of residence, over the preceding ten years. Short-term employment
growth is the percent change in annual average employment. The unemployment rate is
the annual average, state unemployment rate.
Average annual pay and average annual pay growth both come from the U.S.
Bureau of Labor Statistics. State average annual pay is measured in thousands of dollars

221
for all workers covered by unemployment insurance, by location of establishment. Pay
growth is measured as the percent change in annual pay for all workers covered by
unemployment insurance, by location of establishment. Median income comes from the
U.S. Bureau of the Census and is measured in thousands of dollars.
The percent of business closings comes from the U.S. Small Business
Administration and is measured as the annual rate of firm terminations in a state. The
variables, working poor, population density, net migration, poverty rate, homeownership
rate, and the percentage of businesses offering health care benefits all come from the U.S.
Census Bureau. Working poor is calculated as the percent of household with at least one
person working whose combined income is not more than 150% of the poverty line. State
population density is calculated as the number of people per square mile and net
migration is net domestic migration, per 1,000 people. The poverty rate is measured as
the percent of the state population living in households with incomes below the poverty
level. The homeownership rate is the percent of families in a state that are homeowners
and the percentage of businesses offering health care benefits is measured as the percent
of a state‘s non-elderly population covered by employer health-plans is the measure.
Income distribution and Income distribution change come from Jon Haveman‘s
calculations based on the annual U.S. Current Population Survey. Income distribution is
the ratio of mean income of families in the top quintile to mean income of families in the
bottom quintile. The percent change in income distribution is the annual change in the
ratio of mean income of families in the top quintile to mean income of families in the
bottom quintile.

222
High school graduation is the high school completion rate of 18-24 years in a
given year. This data is from the U.S. Census Bureau. Both high school and college
attainment are from Jon Haveman‘s calculations based on the annual U.S. Current
Population Survey. High school attainment is measured as the percent of head of
households with at least 12 years of education. College attainment is the percent of
households with at least four years of college.
Venture capital investments are measured as the annual value of venture capital
measured in dollars per worker. This measurement comes from Dow Jones VentureOne,
Venture Capital Industry Report. SBIC Financing is measured as total SBIC financing,
per worker and comes from the U.S. Small Business Administration. Royalties and
Licenses are measured as the annual gross license income per worker in a given state.
This comes from the Association of University Technology Managers, Inc., AUTM
Licensing Survey.
PhD Scientists and Engineers are measured as the annual number of employed
doctoral scientists and engineers per 1,000 workers. Graduate students in sciences and
engineering are measured as the annual number of scientists and engineering graduate
students in doctorate granting institutions per 1,000,000 population. Both of these
variables come from the National Science Foundation, Division of Science Resources
Statistics. The National Telecommunications and Information Administration report the
annual state percentage of households with computers.
University research and development is the annual amount of state expenditures at
universities and colleges. Federal research and development dollars is the amount of

223
annual, state federal obligations for research and development per capita. Private research
and development is measured as the annual amount of private research and development
dollars per worker, per year. All three of these measures come from the National Science
Foundation, Division of Science Resources Statistics. The number of university spin-offs
is reported as the number of spin-off firms per $1 billion University R&D spending. This
measure comes from the Association of University Technology Managers Inc., AUTM
Licensing Survey.
Finally, the business climate variables include the lowest and highest corporate
tax rate and the state income tax rate. The variables come respectively from the
Federation of Tax Administrators and the National Bureau of Economic Research.
Overall, these variables represent a range of economic, business, and demographic
preconditions and/or controls that are recognized in the entrepreneurial literature as
potential considerations when evaluating small business and entrepreneurial activity.
Table 4.6 provides the summary statistics for each of the continuous independent
variables.
The primary objective of this research is to clarify the relationship between state
policy restrictions on small business and entrepreneurial activity. To measure this policy
effect, a dummy variable for state level ICT restrictions is used to address this component
of the analysis. The variable is coded as 1= ICT restrictions and 0=no state level
restrictions. To further test the sensitivity of policy restrictions an additional set of
discrete policy variables were tested. These variables further specified that a state has one
of three ICT policy states: a policy ban (ban), general policy restrictions but no ban

224
Table 4.6: Small Business/Entrepreneurial Independent Variables
Employment Mean Standard
Deviation Minimum Maximum Long-term Employment
Growth 15.105184 9.756762699 -3.9 60.36 Short-term Employment
Growth 1.4450875 1.724216331 -3.99 6.9
Unemployment Rate 4.7405 1.147956559 2.2 8.2
Wages and Income
Average Pay 32277.913 5742.231623 20925 51007
Pay Growth 3.587575 1.571939998 -4.3 9.8
Median Income 51310.515 7766.331568 35004 72403
Demographic and
Equity Percentage of Business
Closings 11.763145 5.075568323 0.0714 22.8
Working Poor 13.870233 4.558078236 3.99 26.08
Population Density 180.378 250.7321604 1.1 1144.2
Net Migration 0.6745 4.154756884 -12.1 28.4
Poverty 11.7395 3.114504792 5.5 23.4
Income Distribution 10.12295 1.674369458 6.62 15.83 Income Distribution
Change 5.037875 12.00237175 -30.72 46.02
Homeownership Rate 69.9005 5.197078392 52.8 81.3 Percentage of Businesses
Offering Health Care
Benefits 65.933 6.111213326 51.1 79.9
Education
High School Graduation 78.93625 11.05366998 50.4 96.8
High School Attainment 85.6403 4.126197787 74.1 93.44
College Attainment 25.45335 4.834917564 14.6 40.81
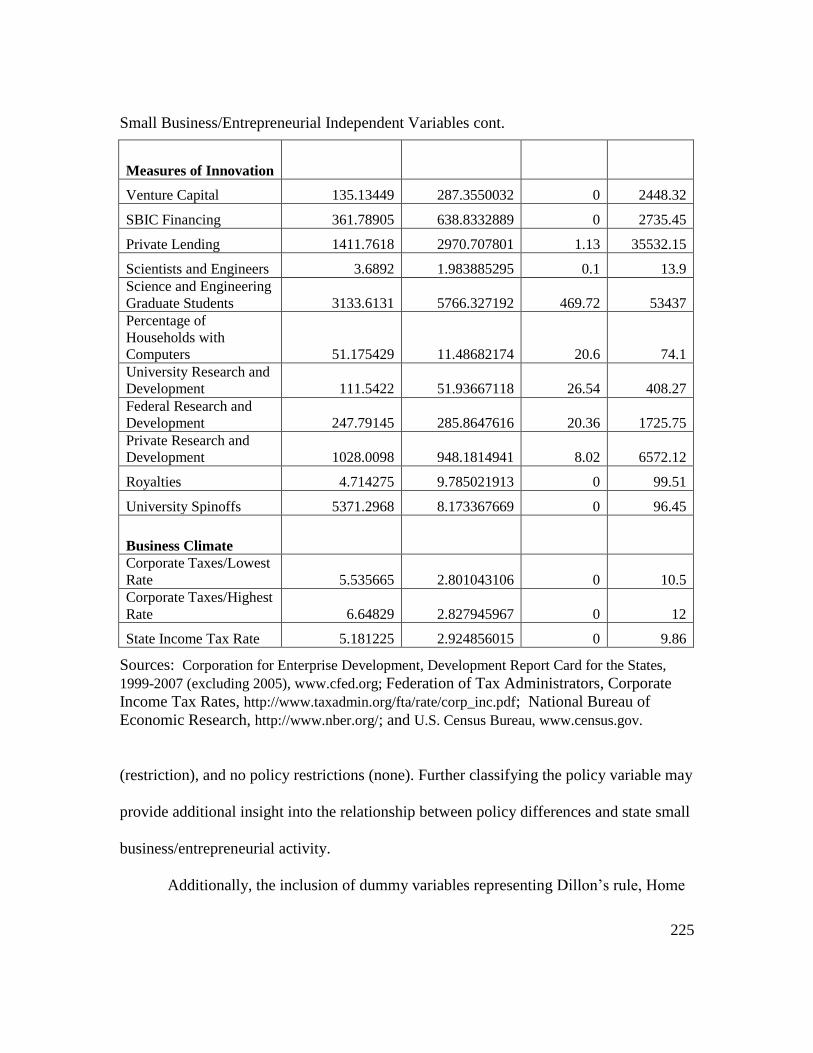
225
Small Business/Entrepreneurial Independent Variables cont.
Measures of Innovation
Venture Capital 135.13449 287.3550032 0 2448.32
SBIC Financing 361.78905 638.8332889 0 2735.45
Private Lending 1411.7618 2970.707801 1.13 35532.15
Scientists and Engineers 3.6892 1.983885295 0.1 13.9 Science and Engineering
Graduate Students 3133.6131 5766.327192 469.72 53437 Percentage of
Households with
Computers 51.175429 11.48682174 20.6 74.1 University Research and
Development 111.5422 51.93667118 26.54 408.27 Federal Research and
Development 247.79145 285.8647616 20.36 1725.75 Private Research and
Development 1028.0098 948.1814941 8.02 6572.12
Royalties 4.714275 9.785021913 0 99.51
University Spinoffs 5371.2968 8.173367669 0 96.45
Business Climate
Corporate Taxes/Lowest
Rate 5.535665 2.801043106 0 10.5 Corporate Taxes/Highest
Rate 6.64829 2.827945967 0 12
State Income Tax Rate 5.181225 2.924856015 0 9.86
Sources: Corporation for Enterprise Development, Development Report Card for the States,
1999-2007 (excluding 2005), www.cfed.org; Federation of Tax Administrators, Corporate
Income Tax Rates, http://www.taxadmin.org/fta/rate/corp_inc.pdf; National Bureau of
Economic Research, http://www.nber.org/; and U.S. Census Bureau, www.census.gov.
(restriction), and no policy restrictions (none). Further classifying the policy variable may
provide additional insight into the relationship between policy differences and state small
business/entrepreneurial activity.
Additionally, the inclusion of dummy variables representing Dillon‘s rule, Home

226
rule, and Mixed rule reflect the possibility of additional constraints on local/regional
government‘s ability to leverage their own investments in advanced ICT. With regard to
governance, a state has one of three policy states; Dillon‘s rule, Home rule, or Mixed
rule. Dillon‘s rule for state governance of municipalities was formalized in 1872 when
U.S. Supreme Court Judge John Dillon said:
It is a general and undisputed proposition of law that a municipal corporation
possess, and can exercise, the following powers, and no other: First, those granted
in express words; second, those necessarily or fairly implied in, or incident to, the
powers expressly granted; third, those essential to the declared objects and
purposes of the corporation not simply convenient, but indispensible. Any fair,
reasonable doubt concerning the existence of power is resolved by the courts
against the corporation, and the power is denied (U.S. Advisory Commission on
Intergovernmental Relations (ACIR), 1968)
In effect, Dillon‘s rule upholds that local and municipal governments derive all of their
powers from the state and only those expressly given to them or implied by the powers
granted are their powers to exercise. Dillon‘s rule arose in response to widespread local
corruption and abuse of political power in the late 1800‘s. Local governments were
known to issue bonds to finance large projects like railroads and would then fail to honor
their bonding obligations when projects failed. With Dillon‘s rule, any government
powers in question are resolved against the municipality and calls into question whether
local government has inherent rights of local self-governance.
Dillon‘s rule states are contrasted against those that are considered Home rule
states. Dillon‘s rule assumes a city does not have a particular power or authority unless it
is explicitly granted by the state; home rule assumes the opposite. Pure home rule is a

227
transfer of all powers not specifically prohibited in a state‘s constitution or statutory law
from the state to local government units. States that have adopted home rule have often
modified pure home rule by providing varying degrees of freedom for local/municipal
governance as well as the scope of power granted to these units. Home rule has the
potential to allow local authorities to respond more expediently and efficiently to local
problems and needs. It is often argued that local authorities understand their community
needs more clearly than state officials. As such, home rule potentially allows local
authorities to respond with creative and innovative solutions to local problems without
waiting for state approval.
With regard to advanced ICT solutions, it is hypothesized that states governed by
home rule exhibit policy environments that allow for more effective local solutions in
meeting local ICT service and infrastructure needs. Additionally, the interaction of the
Dillon/Home rule designation and state level ICT restrictions may also impact state level
small business growth. Research documents the importance of an entrepreneurial culture
for creating and sustaining local and regional entrepreneurial activity. Thus, the policy
environment surrounding the balance of local and state powers may be an additional
component of a state‘s culture that may or may not support a more innovative small
business and entrepreneurial environment.
Methods of analysis for a panel study of this nature include constant coefficients
models, fixed effects models, and random effects models. A constant coefficient model,
also called a pooled regression model, assumes that state and temporal effects are
insignificant and do not have to be considered in the modeling framework. In these

228
models, standard Ordinary Least Squares (OLS) analysis is used to test the significance
of model parameters (Yaffee, 2003).
However, when there are cross sectional and/or temporal parameters of
significance, additional specification issues are dependent on whether these effects are
characterized as fixed or random. Helms (1985) argues that it is both logical and
statistically necessary with research of this nature to treat state and time effects as fixed.
A model with both state and time fixed effects controls for the average differences across
states and years in any observable or unobservable variables. This approach controls for
across state and time variation. This can be very instructive if the purpose of the analysis
is to better understand within state and/or time differences. Moreover, this method
substantially reduces omitted variable bias. However, Yaffee (2003) notes that fixed
effects models may suffer from multi-collinearity which increases standard errors and
reduces the statistical power of model parameters. An additional limitation of fixed
effects is that each state parameter must have a reasonable amount of variation over each
time period. Without this variation, fixed effects modeling should be reconsidered, as the
resulting estimated parameters may be imprecise.
Greene (2003) refers to random effects as regression models with a random
constant term. Random effects models with a cross sectional and time component are
sometimes referred to as two-way random effects models (SAS, 1999). Random effects
models assume unobserved variables are uncorrelated with observed parameters. These
models use information from both within a state and time period as well as across states
and years. These models are particularly informative when there is little variation of

229
parameters within states over time.
In addition to questions of modeling, the nature of this research generates concern
over causality. These concerns arise when there is a question over the extent of
endogeneity and simultaneity of the independent variables. In this instance, regression
coefficients may be biased and therefore provide inaccurate parameter estimates. In this
case, an estimation strategy accounts for potential endogeneity of entrepreneurial activity
and state and economic and business activity by lagging all dependent variables in the
panel regression by one year (Bruce, 2009). Specifically, each state‘s annual measures of
entrepreneurial activity are therefore a function of the previous year‘s economic,
business, and demographic characteristics.37
In the end, a fixed time and random state effects model, or mixed model, was
chosen as the best set of assumptions for this analysis. Tests for normality of the error
terms and multicollinearity among the Xs were executed. Variance inflation factors were
used to test for multicollineartiy. A random effects model was chosen because it allows
for the estimation of stable covariates. As well, random effects models generally have
less sample variation, as the variation both between and within states is estimated
(Allison, 2005). As the primary policy variable of interest is unchanging within states
over time, a fixed effects model may yield estimates that are unreliable.
The model is illustrated below:
𝑦𝑖 𝑡+1 = 𝜇𝑡 + 𝛽𝑥𝑖𝑡 + 𝛾𝑧𝑖 + 𝑠𝑖 + 𝜀𝑖𝑡
37
This data set includes 7 years of data (1999-2007; without 2005) which limits the inclusion of
longer lag times for this analysis. However, future research should explore the use of longer lag
times in data sets with additional years of data.

230
Where 𝑦𝑖𝑡 is one of the six, lagged dependent variables representing small
business and/or entrepreneurial activity, 𝑥𝑖𝑡 represents a vector of independent variables
that vary over time and 𝑧𝑖 represents a vector of variables that do not vary over time. The
variable 𝑠𝑖 represents random state effects with a specific probability distribution and an
assumed normal distribution. This variable represents the total effect on the dependent
variable of unobserved state characteristics. The error terms, 𝜀𝑖𝑡 , represents the random
variation across time and geography. By using a model with both fixed and random
effects parameter, estimates will be more robust and reliable than a standard OLS or
purely fixed effects approach.
However, it is important to acknowledge that this model will not confirm
causation of these parameters. Causation could be tested with the use of an instrumental
variable approach and/or Granger causality tests. Granger causality occurs when a
variable X ―Granger causes‖ Y if Y can be better predicted using the histories of both X
and Y than it can using the history of Y alone. This concept highlights three important
characteristics of these models: 1) the temporal assumption that only past values of X can
cause Y; 2) If X is exogenous of Y, X fails to Granger-cause Y (Sims, 1972); and 3) X
and Y are independent only if both fail to Granger-cause the other. By regressing each
variable on lagged values of itself and the other, F tests can be used to examine Granger
causality. This was not within the scope of this research but future research would benefit
from the exploration of causality of policy variables.

231
Regression Results
A first glance at the possible impacts of different levels of ICT policy restrictions
on small business and entrepreneurial activity are illustrated in Figures 4.4 and 4.5 These
graphs illustrate the relationship between two dependent variables, the number of new
companies and the number of patents and the three general policy options; ban, general
restrictions, and no restrictions. Graphs representing the relationship between the
additional dependent variables are provided in the appendices. From a visual inspection
the only relationships that stand out are those between the number of new companies and
patent activity. Individual OLS regression estimates of ICT restrictions on each of the
dependent variables confirm that new companies and patent activity are the only
relationships that yield statistically significant results. Tables 4.7 and 4.8 illustrate the
individual regression estimates of the impact of state level restrictions on new companies
and patent activity Moreover, the relationship between new companies and ICT
restrictions only yields significant results with the inclusion of the broader set of policy
dummies. There is a statistically significant relationship between general policy
restrictions and new companies. The positive regression coefficient indicates a possible
counter intuitive relationship, that policy restrictions may positively influence new small
businesses activity. However, fuller models should be explored in depth before this
conclusion is made.
Additionally, two individual OLS models yielded statistically significant results
between the number of patents and ICT restrictions. Model I illustrates that general
policy restrictions have a negative, statistically significant relationship with new patent
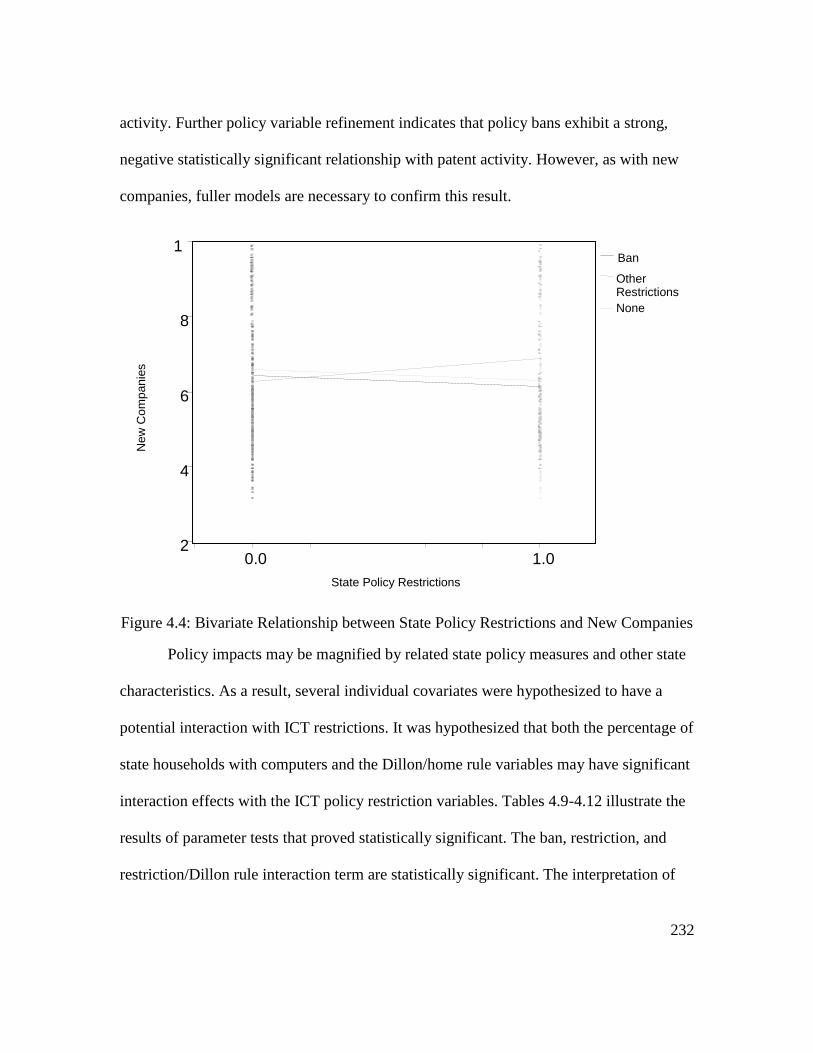
232
activity. Further policy variable refinement indicates that policy bans exhibit a strong,
negative statistically significant relationship with patent activity. However, as with new
companies, fuller models are necessary to confirm this result.
Figure 4.4: Bivariate Relationship between State Policy Restrictions and New Companies
Policy impacts may be magnified by related state policy measures and other state
characteristics. As a result, several individual covariates were hypothesized to have a
potential interaction with ICT restrictions. It was hypothesized that both the percentage of
state households with computers and the Dillon/home rule variables may have significant
interaction effects with the ICT policy restriction variables. Tables 4.9-4.12 illustrate the
results of parameter tests that proved statistically significant. The ban, restriction, and
restriction/Dillon rule interaction term are statistically significant. The interpretation of
2
4
6
8
10
0.0
1.0
Ban
Other Restrictions
None
State Policy Restrictions
New
Co
mp
an
ies
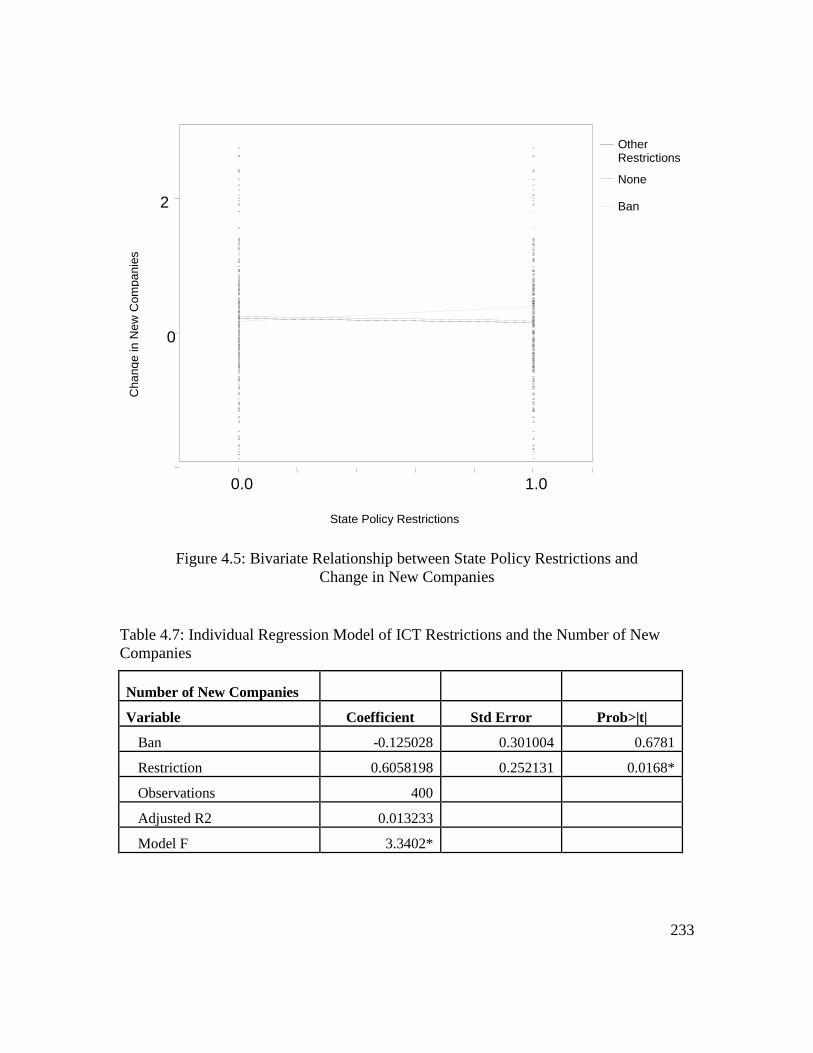
233
Figure 4.5: Bivariate Relationship between State Policy Restrictions and
Change in New Companies
Table 4.7: Individual Regression Model of ICT Restrictions and the Number of New
Companies
Number of New Companies
Variable Coefficient Std Error Prob>|t|
Ban -0.125028 0.301004 0.6781
Restriction 0.6058198 0.252131 0.0168*
Observations 400
Adjusted R2 0.013233
Model F 3.3402*
0
20
0.0 1.0
Other Restrictions
None
Ban
Cha
ng
e in
Ne
w C
om
pa
nie
s
State Policy Restrictions

234
these parameters indicates a negative impact on patent activity in states with a policy ban
and a positive impact on patent activity in Dillon rule states with a policy restriction.
Similarly, the Dillon rule/broad ICT restriction interaction term has a negative
coefficient and is strongly statistically significant against the number of new companies.
However, the interpretation of the marginal effects reveals a small, negative impact of
these restrictions in Dillon rule states. The relationship between the number of new
companies and the percentage of households with computers also reveals potentially
important covariates and interaction terms. Tables 4.11 and 4.12 reveal that an ICT
interaction term with the percentage of household computers is an additional variable for
consideration when clarifying the relationship between ICT restrictions and the number
of new companies in a state. Overall, these results highlight the potential importance of
Table 4.8: Individual Regression Model of ICT Restrictions and the Number of Patents
Model I: Number of Patents
Variable Coefficient Std Error Prob>|t|
ICT restrictions -63.91994 24.08118 0.0083*
Observations 400
Adjusted R2 0.017028
Model F 0.0083*
Model II: Number of Patents
Variable Coefficient Std Error Prob>|t|
Ban -107.06 34.07525 0.0018*
Restriction -16.8328 28.54261 0.5557
Observations 400
Adjusted R2 0.022077
Model F 0.0077*

235
Table 4.9: Patent Covariate Tests: Dillon/Home Rule
Patents
Term Estimate Std Error Prob>|t|
Ban -107.06 33.20308 0.0014*
Restriction -108.5001 38.26581 0.0048*
Restriction*Dillon Rule 234.25379 53.37973 <.0001*
Restriction*Home Rule 35.662714 66.57622 0.5925
Observations 400 Adjusted R2 0.071497
Model F 7.7184*
additional covariates and testing for hypothesized interaction relationships in these
models. However, additional analysis of more complete models is necessary to confirm
these relationships.
Table 4.10: New Company Covariate Tests: Dillon/Home Rule
New Companies
Term Estimate Std Error Prob>|t|
Dillon Rule 0.7989581 0.392223 0.0424*
Home Rule 0.8315357 0.438256 0.0586
ICT Restrictions 1.3714048 0.477113 0.0043*
Dillon Rule*ICT Restrictions -1.70097 0.547715 0.0021*
Home Rule*ICT Restrictions -0.295405 0.740102 0.69
Observations 400
Adjusted R2 0.028795
Model F 3.0695*
Additionally, separate t-tests of each independent variable against the policy
restriction variable were estimated. Table 4.13 illustrates each independent variable with
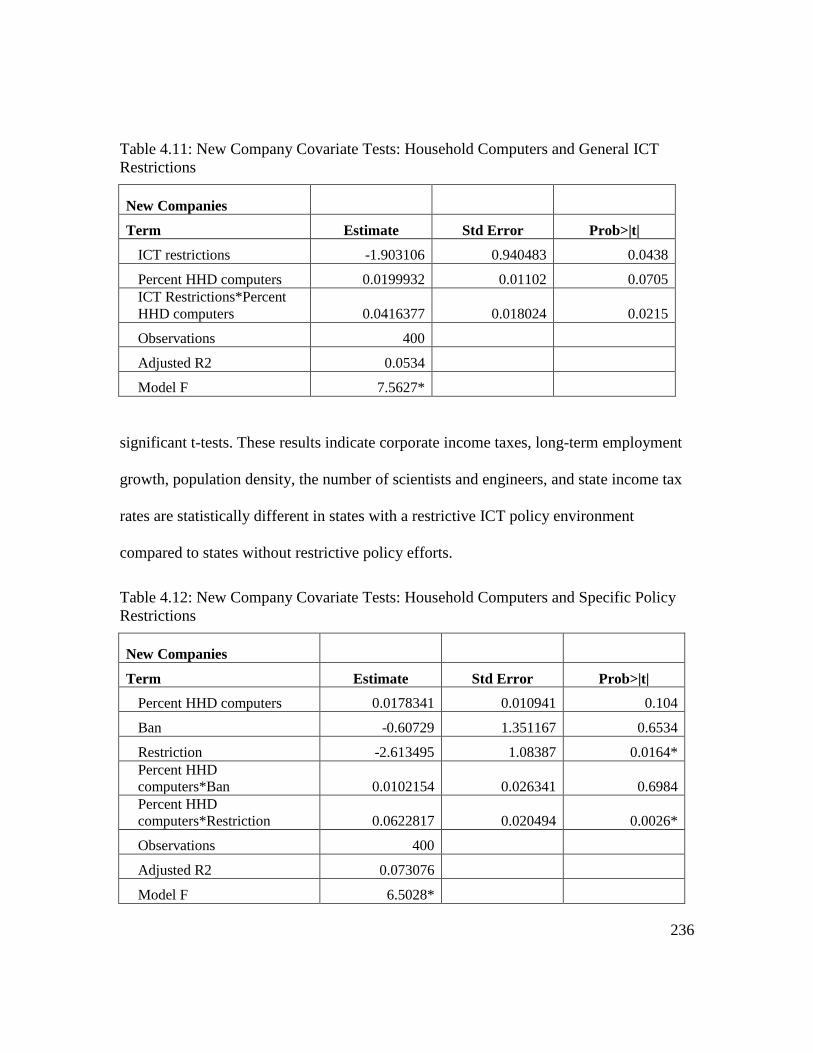
236
Table 4.11: New Company Covariate Tests: Household Computers and General ICT
Restrictions
New Companies
Term Estimate Std Error Prob>|t|
ICT restrictions -1.903106 0.940483 0.0438
Percent HHD computers 0.0199932 0.01102 0.0705 ICT Restrictions*Percent
HHD computers 0.0416377 0.018024 0.0215
Observations 400
Adjusted R2 0.0534
Model F 7.5627*
significant t-tests. These results indicate corporate income taxes, long-term employment
growth, population density, the number of scientists and engineers, and state income tax
rates are statistically different in states with a restrictive ICT policy environment
compared to states without restrictive policy efforts.
Table 4.12: New Company Covariate Tests: Household Computers and Specific Policy
Restrictions
New Companies
Term Estimate Std Error Prob>|t|
Percent HHD computers 0.0178341 0.010941 0.104
Ban -0.60729 1.351167 0.6534
Restriction -2.613495 1.08387 0.0164* Percent HHD
computers*Ban 0.0102154 0.026341 0.6984 Percent HHD
computers*Restriction 0.0622817 0.020494 0.0026*
Observations 400 Adjusted R2 0.073076
Model F 6.5028*

237
Table 4.13: Individual One-tailed T-tests of Significant Independent Variables by State
and Rule Type
Corporate Income Tax Prob < t 0.007
Long-term Employment Growth Prob > t 0.0457
Population Density Prob < t 0.0236
Phd Scientists and Engineers Prob < t 0.0181
State Income Tax Prob < t 0.0126
With these preliminary estimates, a variety of both random and fixed effects
models were estimated to confirm the best fit and most reliable estimates. Tables 4.14
and 4.15 present the results of models where the ICT policy variable showed
significance. The ICT policy variable has a significant impact in models of new business
activity and new business job growth. The ICT Policy variable does not show up in
relationships with change in new businesses, technology companies, patent activity, or
IPOs. Results of additional models with these dependent variables, without the ICT
policy variables are presented in the Appendix.
Table 4.14 presents the results for a random state/time fixed effects model with
the number of new companies as the dependent variable. The adjusted R-squared is .904
which indicates a significant amount of the variation in the number of new firms across
states is explained by this set of parameters. This model uses the general ICT restriction
dummy and interaction terms for percentage of household computing, Dillon rule, and
Home rule. Taking the partial derivative of the ICT restriction parameter results in the
estimation of the marginal effects illustrated in Table 4.15. This reveals that a Dillon Rule

238
state with general ICT restrictions, given some assumed percentage of state households
with computers, will result in lower numbers of new businesses in a given year. For
Home Rule states, there is a positive relationship with new businesses activity even
though the Home rule/ICT restriction interaction parameter is not statistically significant.
These results underscore the complexities of modeling and understanding the impact of
policy variables on other demographic, economic, or social variables. The intended and
unintended consequences that result from the implementation of any policy make
hypothesizing and modeling these potential relationships challenging. Additional
exploration of the kinds of economic impacts that may occur in this policy environment is
an area for future research. Additionally, high school attainment, the percentage of
households with computers, income distribution, patents, and venture capital all have a
positive statistically significant relationship with the annual number of new companies in
states. However, the percentage of firms that offer health care to their employees, and the
percentage of residents in poverty exhibit a negative statistical relationship with new
business activity.
Table 4.16 presents the results for a random state/time fixed effects model with
the annual amount of new business employment as the dependent variable. The adjusted
R-squared is .646, which indicates a significant amount of the variation in the number of
new firms across states is explained by this set of parameters. This model uses the general
ICT restriction dummy and interaction terms were not found to be significant. The ICT
restriction coefficient is negative and statistically significant at the .10 confidence level
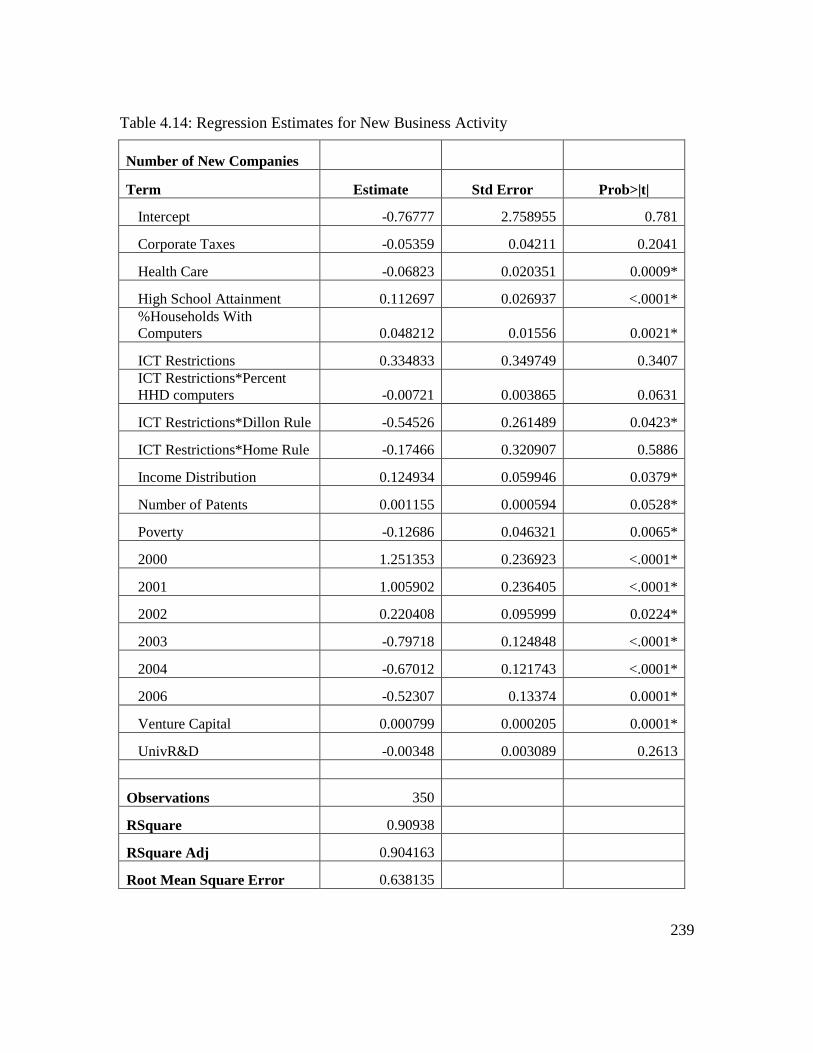
239
Table 4.14: Regression Estimates for New Business Activity
Number of New Companies
Term Estimate Std Error Prob>|t|
Intercept -0.76777 2.758955 0.781
Corporate Taxes -0.05359 0.04211 0.2041
Health Care -0.06823 0.020351 0.0009*
High School Attainment 0.112697 0.026937 <.0001* %Households With
Computers 0.048212 0.01556 0.0021*
ICT Restrictions 0.334833 0.349749 0.3407 ICT Restrictions*Percent
HHD computers -0.00721 0.003865 0.0631
ICT Restrictions*Dillon Rule -0.54526 0.261489 0.0423*
ICT Restrictions*Home Rule -0.17466 0.320907 0.5886
Income Distribution 0.124934 0.059946 0.0379*
Number of Patents 0.001155 0.000594 0.0528*
Poverty -0.12686 0.046321 0.0065*
2000 1.251353 0.236923 <.0001*
2001 1.005902 0.236405 <.0001*
2002 0.220408 0.095999 0.0224*
2003 -0.79718 0.124848 <.0001*
2004 -0.67012 0.121743 <.0001*
2006 -0.52307 0.13374 0.0001*
Venture Capital 0.000799 0.000205 0.0001*
UnivR&D -0.00348 0.003089 0.2613
Observations 350
RSquare 0.90938
RSquare Adj 0.904163
Root Mean Square Error 0.638135

240
Table 4.15: Marginal Effects of ICT Restrictions in Dillon or Home Rule States
Percentage of State Household with computers
50% 60% 70% 80% 90%
Dillon Rule -0.21403 -0.21475 -0.21547 -0.21619 -0.21691
Home Rule 0.156567 0.155845 0.155124 0.154403 0.153682
These results indicate that ICT policy restrictions have a strong, negative relationship
with new business job growth. Additionally, average pay, the state homeownership rate,
science and engineering graduate students, and private research expenditures all have a
positive, statistically significant relationship with the annual amount of new business job
growth in states. The corporate tax rate and the number of technology companies both
result in a negative, statistically significant relationship with new business job growth.
Overall, these preliminary estimates reveal that future research efforts should
consider further clarification of the impact of these policy measures on a state‘s economic
and business environment. These initial models provide insight into the kinds of state
variables that may be impacted by a restrictive ICT policy. Based on these results,
restrictive ICT policy measures appear to have a negative relationship on general new
business and employment activity but not on measures of entrepreneurship and
innovation. However, these models also underscore the potential importance of the way
these policies interact with other state level characteristics. Thus, it may be that these
policies do not make a significant impact unless another set of state characteristics are in
place.
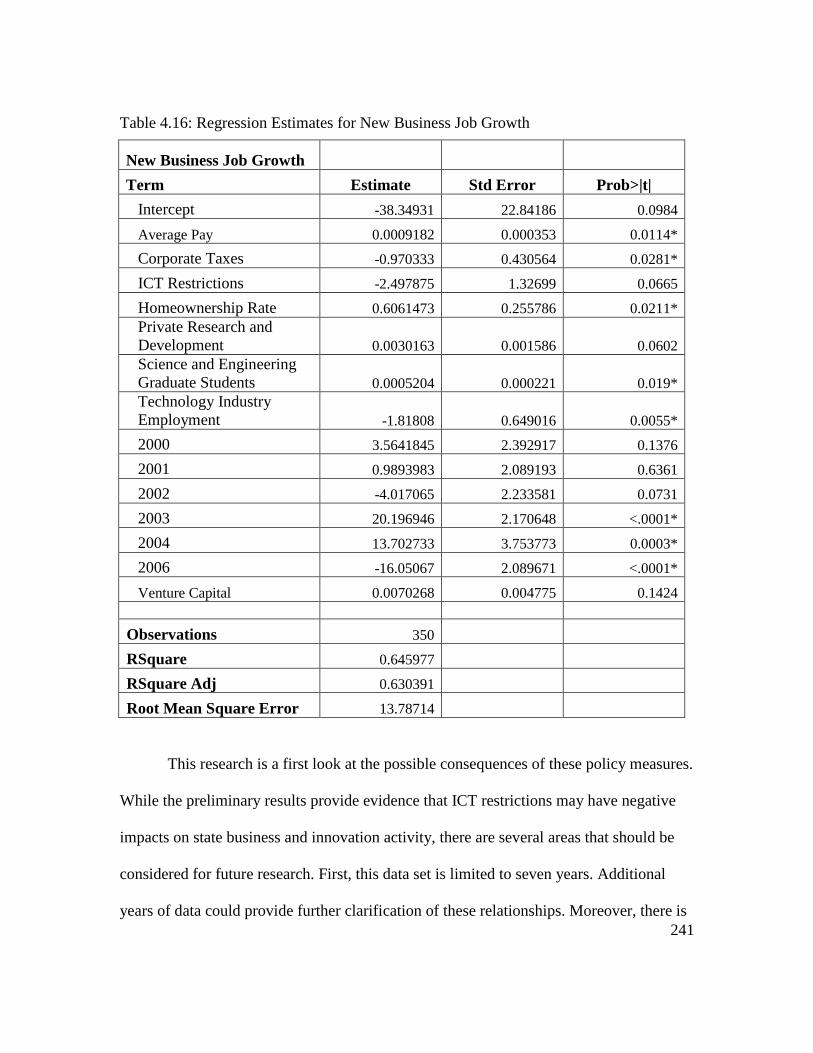
241
Table 4.16: Regression Estimates for New Business Job Growth
New Business Job Growth
Term Estimate Std Error Prob>|t|
Intercept -38.34931 22.84186 0.0984
Average Pay 0.0009182 0.000353 0.0114*
Corporate Taxes -0.970333 0.430564 0.0281*
ICT Restrictions -2.497875 1.32699 0.0665
Homeownership Rate 0.6061473 0.255786 0.0211*
Private Research and
Development 0.0030163 0.001586 0.0602
Science and Engineering
Graduate Students 0.0005204 0.000221 0.019*
Technology Industry
Employment -1.81808 0.649016 0.0055*
2000 3.5641845 2.392917 0.1376
2001 0.9893983 2.089193 0.6361
2002 -4.017065 2.233581 0.0731
2003 20.196946 2.170648 <.0001*
2004 13.702733 3.753773 0.0003*
2006 -16.05067 2.089671 <.0001*
Venture Capital 0.0070268 0.004775 0.1424
Observations 350 RSquare 0.645977
RSquare Adj 0.630391
Root Mean Square Error 13.78714
This research is a first look at the possible consequences of these policy measures.
While the preliminary results provide evidence that ICT restrictions may have negative
impacts on state business and innovation activity, there are several areas that should be
considered for future research. First, this data set is limited to seven years. Additional
years of data could provide further clarification of these relationships. Moreover, there is

242
always concern with a complex issue like small business activity and/or innovation
activity with causation and omitted variable bias. Considering and testing additional
variables is also important for future research. As well, future research should explore the
use of instrumental variables or incorporate a direct Granger test for causality. However,
if states hope to leverage new economy resources to remain competitive in the twenty
first century they should understand the potential impacts of these kinds of policy
restrictions.
Conclusions
There is little question that any state policy measure has both intended and
unintended consequences. It is also likely that states that pass ICT restrictions do not
intend to limit new company activity or patent activity with these policy actions. While
the reasons vary, it is highly unlikely that states intend to restrict economic activity with
the passage of this type of legislation. However, in a more competitive, global business
environment there may be a required set of technological infrastructure elements that
must be in place for many new firms to be successful and existing ones to be innovative.
As a result, efforts that limit the potential growth of this infrastructure may indeed have
substantial short and long-term consequences.
In conclusion, if states hope to remain viable and competitive in the twenty-first
century, understanding the pre-requisite infrastructure necessary for this is critical. The
days are likely over when water, sewer, power, and access to a railroad are the primary
infrastructure pre-requisites for new businesses to get started. Does a business have

243
access to sufficient bandwidth to be competitive in a global context? Can individuals
work from home with the most advanced ICT technology? These are infrastructure
questions that may be equally as important today. Beginning to consider these questions
and how we can ensure that local and regional communities have access to advanced ICT
infrastructure and service is important for the future of all of our communities across the
nation.

244
CHAPTER FIVE:
SUMMARY, CONCLUSIONS, AND FUTURE RESEARCH
As research confirms the importance of third wave economic development
policies; entrepreneurship and innovation are promoted as the missing puzzle pieces to
improving regional economic growth and community development. To promote these
efforts, policymakers have created a diverse array of federal, state and local programs to
spur entrepreneurship and innovative activity. However, there has been little research
focused on reconciling and documenting the best practices of this diverse and fragmented
policy environment. Moreover,
Hallberg questions whether ―In reality the desire of governments to promote
SMEs is often based on social and political consideration rather than on economic
grounds (2000, p.5).‖ However, if the objective is to build local assets and create
community wealth, entrepreneurship and local firm expansion may be the most effective
manner in which to accomplish these goals (Lichtenstein and Lyons, 2001; Sherraden,
1991).
There are no simple answers and ―canned‖ development strategies that will ensure
development success for all communities. However, evidence continues to mount that
states and localities must undertake policies to promote entrepreneurship and innovation
in order to remain competitive and to encourage sustainable economic development in the
twenty first century. Throughout the 1990‘s, the majority of new jobs in the economy
―were created by small and medium sized entrepreneurs operating high-growth

245
businesses (Henderson, 2002, p.45).‖ There is a positive relationship between national
GDP growth and entrepreneurial activity. Reynolds et al. (1999) report that one-third of
the difference in economic growth among nations can be attributed to entrepreneurial
activity. Moreover, while state and local governments have historically relied on
recruiting medium and large industrially firms to create new jobs and economic activity,
there is increasing evidence that this traditional approach will not yield the sustainable,
healthy, wealth creating communities of the future.
Lichtenstein and Lyons (2001) call for a new paradigm in entrepreneurial
development policy. They argue for a systems type approach to the development of
regional entrepreneurship, one that focuses policy efforts towards a more comprehensive
and holistic approach to developing local entrepreneurs. However, entrepreneurship
policy continues to remain diverse and fragmented across states and regions. Some
state‘s38
have a history of making investments in innovation and entrepreneurial policy
efforts, but the majority of states continue to practice traditional development approaches
focused largely on industrial recruiting. Many politicians and economic developers admit
that ensuring regional success in the future requires entrepreneurial development policy
as an essential component of every community‘s development portfolio. However, the
impetus for the research presented here is the ongoing concern of a divergence between
policy practice and the public discourse on the importance of entrepreneurship and
innovation policy.
This research has explored three critical research questions surrounding the issue
38
Pennsylvania‘s Ben Franklin Partnership is one example of a state-wide program that has been in place
for over two decades.

246
of entrepreneurship and entrepreneurial development policy. However, as with any
research there is always an opportunity for improvement of existing research methods as
well as opportunities for future research. This chapter will review the conclusions of each
of these papers and discuss opportunities for improvement within the existing research
framework. Additionally, within the context of each paper, ideas for future research are
explored.
Business Incubators
Business incubators have become an increasingly popular development tool
across a wide range of communities around the world. Business incubators can be
considered a type of entrepreneurial development policy as two of the primary objectives
are to encourage local business creation and ongoing small business success. The
majority of business incubators also advance job creation as a fundamental goal,
however, as this development tool has evolved, a variety of additional goals have been
promoted by specific types of incubators. Moreover, the idea of business incubation has
been transformed into a variety of related development tools such as technology centers,
science parks, innovation centers, virtual incubators and others. Many of these policy
descendents share some of the characteristics of business incubators but often cannot be
classified as traditional business incubators. What these variations highlight, however, is
the ongoing desire of policymakers to encourage entrepreneurship, small business
success, innovation, and high value-added research among other things.
The first paper attempted to lay the groundwork for a future research agenda on

247
business incubation. Three theoretical frameworks were explored as potential tools for
future research; network models; O-ring theory; and agglomeration economics and
information spillovers. Both network models and O-ring theory frame incubators as
quasi-firms, where the primary objective is to lower transactions costs to enhance firm
survival and profitability. A network approach to business incubators focuses on client
interaction through both formal and informal interaction, facilities design and workspace,
and the spillover benefits from client co-location among other things. O-ring theory,
however, highlights the importance of the skill and productivity of incubator management
and support staff, along with the experience and specialization of incubator clients. This
research stream hypothesizes that dynamic incubators are filled with highly effective
incubator management, skilled and experienced service professionals, and innovative,
young, entrepreneurial client firms.
Instead of viewing incubators as quasi-firms, an agglomeration economies
paradigm frames business incubators as quasi-clusters. Using this theory as a framework
for future research would emphasize the cost savings to client firms from the internal
scale economies achieved through shared service provision and/or lower transaction costs
due to enhanced access to a wide range of business services. Both the MAR‘s and Jacobs
models of knowledge spillovers can also be used to model the process of business
incubators. Thus, strong MAR‘s type localization economies may be experienced in
incubators that specialize and support specific industrial or market niches. However,
knowledge spillovers in Jacobs‘ model may be greater in incubators that encourage and
support a wide variety of entrepreneurial firms. Ultimately, cluster theory, the MARs

248
model, and the Jacobs model emphasize the potential of agglomeration economies that
can result when co-located firms create an environment that generates internal scale
economies and information spillover benefits.
These three theoretical approaches yield a series of specific research questions
that are a useful basis for a research agenda. Much of this work would be focused on
clarifying and quantifying the types of public benefits and costs that may occur as a result
of public investment in creating a business incubator environment. Answering these
questions is important as many business incubators, and similar organizations, require a
range of public support; from start-up funds to ongoing operational funding. The research
on business incubation has not yet quantified the costs and benefits sufficiently to
confirm when and where public support may be warranted. In many cases, communities
have made these investments because they are perceived as the development panacea of
the day, while the benefits of incubation are not a certainty. In an environment of
increasing fiscal constraint and where policy makers demand proof of outcomes, research
that justifies the potential benefits of public investment is valuable.
An additional complication to answering the questions posed in this research is
the expected time line in which benefits may be expected to accrue. Many policymakers
expect relatively fast results from any development policy, and incubators are no
exception. However, any entrepreneurial development policy is likely to be more of a
long run investment that may take five or more years to begin to yield expected returns.
The benefits, especially if the focus is on employment and income, that may accrue from
successful entrepreneurial firms may be small compared to the short-term results that

249
recruiting an industrial firm could provide. The longer term results, five or more years
out, for communities that make these and similar investments may be substantial but
require research on the longer-term impacts of business incubators. However, a
considerable body of research questions both the short and long term benefits of these
investments when communities carefully document the employment, income,
infrastructure, and local finance costs and benefits. Although, if the successful
communities of the future are those that are relatively more innovative and
entrepreneurial then these types of strategic investments may be critical to the health and
sustainability of regions. Thus, further analysis of experience with business incubators is
critical to begin to understand the potential of these policy efforts for the short and long
term growth and development of regions.
Policy Perceptions and Local Entrepreneurial Development In South Carolina
The second paper offers another approach to evaluating current local and regional
entrepreneurial policy efforts. No policy will be successful without the support and
commitment of those whose task it is to implement that policy. Despite lip service to
entrepreneurship, it is clear that industrial recruitment still dominates most regions‘
economic development efforts. However, additional evidence indicates the emerging
importance of entrepreneurial development policy across all types of geographies. While
communities across the globe are beginning to realize the importance of local
entrepreneurs for creating local wealth and long-term economic viability for their region,
research regarding the impact of these policy efforts is limited. This paper explores the

250
extent to which local and regional developers in South Carolina are engaged in this
development policy area. As well, when communities are engaged in these efforts, what
is the nature of involvement and what kinds of successes and/or failures have
communities experienced?
A 2009 survey of over 100 economic and community development professionals
in South Carolina confirms that many local communities do not have locally or regionally
sponsored entrepreneurial development efforts. However, slightly more than half of the
respondents report that fostering entrepreneurship is part of their community‘s economic
development plan and that their region recognizes the value and importance of
entrepreneurs. Additionally, entrepreneurship is recognized as a valuable development
tool for increasing employment opportunities, building community and family wealth,
and diversifing the local economic base, among other reasons.
One of the main objectives of this paper was to explore the impact of policy
perceptions at different levels of government on the implementation of entrepreneurial
programming. Thus, if local economic developers perceive a particular policy effort to be
in/out of favor with state and federal policymakers, does this influence the probability of
local implementation? Survey results confirm that almost three-quarters of respondents
believe industrial and business recruitment efforts have the highest economic
development priority for state policymakers and fifty percent believe this is also true for
local officials. Nevertheless, respondents further indicated that there are substantive
barriers to implementing entrepreneurial policy and a lack of local or regional access to a
wide range of entrepreneurial services and programs.

251
To further test these conflicting results, logit modeling was used to clarify the
probability of local entrepreneurial development programming. Creating sub-samples of
economic developers and CDC respondents was one method used to begin to correct for
the possibility of Simpson‘s paradox. Individual models were significant and further
highlighted the importance of several hypothesized variables. Moreover, each sub-sample
yielded unique sets of significant variables, providing some evidence of the differences
among these populations. Testing the full model with the inclusion of an organizational
dummy and appropriate interaction terms reveals the model is significant and better than
the intercept only model.
Overall, these survey results highlight several important factors that influence the
probability that a community has a local entrepreneurial development program. First,
whether a community receives any state funding is an important predictor. This result is
not surprising as financial barriers to development programming, in general, are likely to
be ongoing concerns for many communities. For federal and state policymakers, these
results highlight the importance of ―putting your money where your mouth is.‖ If
policymakers want the development focus to shift towards entrepreneurial-oriented
programming, funding sources may need to be redirected.
Another predictor of entrepreneurial development policy is how important a
respondent rates business retention as an important community goal. This question
highlights the potential policy overlap of business retention and entrepreneurial
development efforts. In many communities, business retention can be as much about
retaining regionally grown entrepreneurial firms as it is about retaining satellite branch

252
plants. Policymakers may consider refocusing business retention efforts on younger,
entrepreneurial firms so that this policy program becomes an additional tool of
entrepreneurial development programming.
Finally, the influence of seed capital on the probability of local entrepreneurial
development efforts is confirmation of other research findings about factors that
influence levels of entrepreneurship in a state or region. These related studies indicate
that entrepreneurship levels are likely to be higher in regions with higher levels of
venture capital, seed capital, angel investors, and other sources of financing. This
highlights ongoing questions of causality, as it is difficult to clarify which came first, the
entrepreneurs or the policy? However, if seed capital is low or non-existent, local
development officials may perceive that entrepreneurship policy is not feasabile.
Exploring the impact of alternative sources of entrepreneurial financing and financing
gaps on the success or failure of entrepreneurial development policies in different types
of communities should provide some useful policy direction for ensuring that resources
are used to best effect.
These results underscore the importance of several policy related issues. First,
while local communities often see the value in entrepreneurial development, these
communities often have more immediate needs and may lack key pre-requisite
entrepreneurial infrastructure. If states want to emphasize local entrepreneurial
development activities, policymakers may need to help these communities first address
other local priorities. For example, a community with a high school dropout rate or a
housing shortage may need to address these more immediate needs before they will

253
consider entrepreneurial development policy as a viable option.
Additionally, this research confirms that the majority of local communities know
when they have weak entrepreneurial support mechanisms. Entrepreneurial support
mechanisms like access to a local business incubator, venture capital, seed capital, micro-
lending, and networking and mentoring may all be important pre-requisites to the success
of local entrepreneurial development programming. Local policymakers may understand
the likelihood of successful entrepreneurial development programming is low without
this kind of infrastructure already in place.
If state and local policymakers want to emphasize entrepreneurial development
programming, as opposed to other development tools, they must consider the whole
landscape of entrepreneurial infrastructure. For example, state and local policy may not
be able to financially support venture or seed capital programs but the state could lead the
way in facilitating private regional and state networks of venture or seed capital
organizations and/or individuals. The same is true for networking and mentoring
programs. While state or local government cannot create the networks, they can
programmatically support and facilitate network creation. From a policy perspective, if
states and regions want to support the creation of entrepreneurial communities, the policy
environment must create an incentive structure for local communities to also invest in
these approaches. As long as communities perceive the state and federal development
policy focus is elsewhere, they will be less inclined to make investments in
entrepreneurial development policy approaches.

254
One of the potential weaknesses of survey work, in general, is that much of this
work may suffers from sample bias, in this case due to the small sample size and
professional affiliation of the respondents. One additional area of weakness in this
research concerns the lack of specificity in defining what is meant by entrepreneurial
development programs. The objective of this approach was to capture the broadest
sample of communities contending to have some type of entrepreneurial development
program. On the positive side this sample potentially represents the fullest range of policy
efforts occurring within these communities. However, this sample could also overstate
regional entrepreneurial development efforts. As a result, future research should consider
more specifically defining the types of programs that are considered entrepreneurial
development efforts. Further research could additionally focus on reducing sample bias
with multi-state or national surveys and enlarging the scope of development professionals
included in the analysis. A multi-state or national inventory of policy efforts would be an
important step in understanding how local and regional governments are specifically
engaged in entrepreneurial development efforts. An inventory that included, among other
things, the types of programs, their objectives, strengths and weaknesses would begin to
provide a set of best practice policy measures for local communities.
Policy entrepreneurship and policy diffusion is an additional research extension
related to this work. As policy programs become popular, policy entrepreneurs at
different levels of government experiment with different policy measures. Policy
measures that are perceived as innovative and successful are then adopted by other
regions. This process of policy diffusion could provide important insights into the scope,

255
breadth, and possible successes of different entrepreneurial development programming
efforts. For example, are some programs more successful in rural or disadvantaged
regions? Another research question could focus on whether policy efforts, generally,
exhibit path dependent characteristics. Thus, regions with a historical legacy of
entrepreneurship or innovation may create a policy environment where entrepreneurship
is inherently more valued than other regions. For example, Pages and Poole‘s (2003)
research indicates that the state of Pennsylvania has a long history of supporting
innovation investments. This kind of policy environment may create a path-dependent
process for some regions whereby entrepreneurial policy efforts are perceived as more
important or beneficial, relative to other development policy efforts.
In conclusion, this paper highlights that South Carolina communities are not
heavily invested in entrepreneurial development programming. Only a small percentage
of communities have any programming efforts at all in this area. Moreover, it documents
the importance of identifying barriers that may prevent the local implementation of these
types of policies, including policy perceptions of those involved in local development
policy. Additional research in this and related areas may provide evidence for
policymakers that their words and actions contribute to how policies are perceived, and
ultimately whether they are implemented at the local level. A research agenda which
continues to clarify the scope and breadth of entrepreneurial development programming
is important for ensuring that communities understand the range of policy choices, along
with the potential costs and benefits of these programs

256
State Technology Investments
The third paper highlighted additional state variables that may impact state-wide
entrepreneurship and small business activity. Further, this paper raises a critical research
question for economic development practitioners in the twenty-first century: what are the
infrastructure pre-requisites for communities to successfully implement third wave
economic development policy? It is hypothesized that advanced ICT infrastructure,
specifically Broadband networks, are necessary, but not sufficient, infrastructure in order
for regions to take full advantage of an entrepreneurial, innovation-focused economic
development environment. The foundation of this hypothesis is that advanced ICT
technology and applications potentially offer productivity, efficiency, networking, and
quality of life improvements for consumers and businesses. Thus, communities and
regions that are fully engaged in providing the most up to date ICT infrastructure, service,
and delivery options will be those that have more rapid economic growth and
development compared to regions that do not.
While the research on the benefits of Broadband is still in its infancy, it has begun
to yield important confirmation of the benefits of Broadband to nations, states and
regions. However, even as Broadband infrastructure, service, and uptake have greatly
expanded in the past decade there continues to be evidence of a digital divide across
geographies, ethnicity, income, and age. Middle and higher income suburban and urban
markets are more competitively served by existing telecommunications providers than
rural and low-income markets, where there is evidence of both under-served and un-
served communities. Moreover, across all geographies, many advanced

257
telecommunications markets are characterized by duopoly39
markets, with two
competitors largely controlling the supply of services. As states and communities have
begun to realize the potential benefits of this technology, many communities that have
felt inadequately served by existing providers have taken provision into their own hands.
These projects are characterized by different ownership structures, but communities with
their own municipal electric utility (MEUs) were involved relatively early in providing
this infrastructure for their communities. MEU‘s already have physical infrastructure in
place from which they can leverage improved infrastructure for increased utility
efficiency and cost savings. However, as communities recognize the value and
importance of advanced telecommunications infrastructure, a wide range of community
efforts have been undertaken to improve access to advanced ICT service and delivery.
As communities have begun to involve themselves in the planning, deployment,
delivery, and /or service of advanced ICT, existing commercial providers of this service
have felt threatened by public involvement in this market. Moreover, many states have
restrictions on local public involvement in telecommunications, provisions often left over
from the regulation of the telephone and cable industries. Unfortunately, as the trend
toward community involvement has increased, a number of states have enhanced existing
legislation and developed new legislation for the purpose of preventing or restricting
local public involvement in the provision of advanced ITC infrastructure, service and/or
delivery. Currently, eighteen states have bans or other barriers in place to prevent or
discourage local involvement in the telecommunications industry. Additionally, survey
39
There are also cases of pure local monopolies as there have been in the cable industry.

258
results from ten South Carolina electric cities confirms that some communities are
concerned about undertaking community investments in advanced ICT for fear of legal
repercussions. However, if this infrastructure is critical to twenty-first century community
growth and development, what kind of impact do these restrictive policies have on
economic activity across states and regions? If communities would benefit from these
investments, what are the specific community and/or economic benefits that regions
sacrifice when states have these policies?
Ultimately, the gaps in telecommunications service and access are market failure
questions. Generally, communities remain un-served or underserved by adequate
Broadband because these investments do not meet the profit and revenue expectations of
private sector providers. This infrastructure requires substantive fixed-costs investments,
which makes private sector provision unlikely in regions and communities where the
return on investment is long term and/or low. In economic environments with these
characteristics, underserved and un-served communities are likely to remain so without
additional policy intervention and possibly subsidization.
The telephone and interstate highway system are historical examples of
infrastructure with characteristics similar to the current Broadband environment. In these
cases, it was argued that positive external benefits generated from this infrastructure were
large enough to justify large federal and state investments. In the case of both of these
investments, it is argued that substantive network benefits were created by the public
subsidization of universal telephone service and investments in a national interstate
highway system. Additionally, positive spillover benefits were created by reduced

259
information and transportation costs just to name a few.
Many have called Broadband the interstate highway system of the twenty-first
century. They speculate it has the potential to realize the kinds of benefits that other
major historical public investments have made. This is certainly possible but the jury is
still out. To leverage the positive externalities and network effects of Broadband
infrastructure requires access, adoption, and effective use by a large number of both
consumers and businesses. Given this, where do policymakers begin to assess the
potential of this infrastructure in an environment of fiscal uncertainty and unclear
benefits?
Today, there are numerous examples of small and medium scale public
investments in Broadband infrastructure. National and state policymakers could benefit
from large scale studies documenting the nature of these investments and their outcomes
to date. Communities where these public investments have been made may provide a type
of ―incubator‖ environment for understanding the uptake and use patterns of businesses
and consumers. As well, if policymakers see the potential of this technology, these
communities may also be important ―testing‖ grounds for business and consumer
education programs that facilitate enhanced uptake and use of advanced technology
services. While there have been considerable public monies invested in Broadband
projects, before Broadband becomes the telephone or interstate of this century
policymakers will likely need more substantive evidence of the network and spillover
benefits to the larger community and region. However, if Broadband has the potential
that many argue, policymakers may want to encourage and support these types of

260
analyses.
This paper explores how these restrictive infrastructure investment policies may
impact small business and entrepreneurial activity within states. It is understood that in
order for restrictive telecommunications policies to impact small business and
entrepreneurial activity, SMEs would have to use advanced ICT services. However,
research presented in this paper indicates that SMEs use advanced ICT services
differently depending on the size of firm and type of industry a firm represents. Rather
than generalize, further research needs to explore the impact of these policy measures on
specific industry types in order to understand differential impacts across industries, given
different industry ICT uptake and service requirements.
The cross sectional/panel regression analysis presented here is an important first
step to understanding the impact of restrictive telecommunications policy on state
economic activity. These results provide initial evidence that restrictive policies
negatively impact state small business activity but do not appear to impact indicators of
innovative, entrepreneurial activity. However, these results should be treated with caution
as these results do not confirm causation. Moreover, as with any analysis of this nature,
there is always the concern of omitted variable bias. This is certainly true when trying to
capture a wide range of the variables that influence small business activity and
entrepreneurship. There are ongoing questions concerning the correct methodological
approach to estimating panel models of this sort. Much of the statistical concern
originates from the use of highly aggregated data. Thus, additional research focused on
less aggregated units, for example, county variables might provide additional information

261
concerning the relationship between these policy measures and county small business
activity. This approach would allow for the inclusion of less aggregated population
density variables and measures or urban/rurality that are highly correlated with levels of
advanced ICT infrastructure, small business activity and entrepreneurship. Additionally,
incorporating a broader range of business climate variables and the major business
sectors represented in a state could also be instructive. An additional method of analysis
could use a matched pair‘s type approach for counties or states to compare outcomes in
communities with restrictive policies against similar communities or regions that do not
have these policy measures.
It is important for states to understand the costs and benefits of these restrictive
policy measures. If states understand both the intended and unintended consequences of
these measures, a more accurate assessment of the costs and benefits of these policy
efforts can be made. For example, it may be that the intended consequences of these
restrictive policies for a state are perceived as positive and outweigh any potentially
negative intended or unintended consequences. For example, lobbying efforts by private
sector providers may allow legislators to bargain for additional infrastructure investments
in underserved communities or technology education programs in schools or businesses.
As well, rational choice models would argue that if private sector lobbying efforts result
in additional campaign funds and reelection of state legislators, these policies may
―rationally‖ be perceived as positive. Focusing on the rational choice elements of
legislative interest in these policies is another area of future research. Overall, this and
similar future research efforts, could begin to make a more accurate assessment, separate

262
from the perceptions of benefits and costs, of the true impact of these policy measures.
Conclusions and Future Research
Each of these three papers highlights a different but related area of economic
development policy. Moreover, one of the common threads that run across these
difference development approaches is the likelihood that public dollars are invested in the
project. Whenever public dollars are invested, it is imperative to understand both the
rationale for the investment, as well as its costs and benefits.
Additionally, each of these development approaches all share the characteristic of
being long-run investments that may take five or more years to yield positive expected
benefits. New-firm development, whether it is in an incubator environment or through
other entrepreneurial development programs is a long-term process. Moreover, large
infrastructure investments, like Broadband, may also take years to yield projected
positive benefits. Investments that have a longer or more uncertain return on investment
are problematic for private sector providers. In the current economic and fiscal
environment, policymakers must also be cautious about public investments without well
documented benefits to a community or region.
These three papers begin to lay the groundwork for further research that may
provide additional evidence on the costs and benefits of these development strategies.
Future business incubation research, framed in the economic theories of agglomeration
and network economies, has the potential to provide a more accurate picture of the
benefits that an incubator environment may or may not provide. Further research

263
documenting the scope and nature of local and regional entrepreneurial development
programming can provide an opportunity to characterize best practices with this
economic development approach. Documenting best practices across a variety of states
and regions should provide insight into the kinds of programs that have the potential to
generate the most return for local communities. Finally, there is much discussion about
the potential of municipal and community Broadband investments. Carefully,
documenting the current and projected benefits of a number of the existing public
investments will begin to provide evidence of the potential of this infrastructure at a state
and national level. This research could also provide supporting evidence as to whether
restrictive state policies for these investments impact other state economic and
community development indicators.
―The ultimate goal of economic development is to build assets and create wealth
(Lichtenstein and Lyons, 2001, p.3).‖ As such, it is unlikely that communities can hang
their hat on one economic development approach and be successful in meeting this goal.
Thus individual communities, with supporting federal and state policymakers, must
consider a wider range of development approaches, thereby taking a more holistic
approach to individual community and economic development needs now and in the
future. From an economic development perspective, this would include business
recruitment, but would also acknowledge the potential of entrepreneurial and business
retention efforts. Focusing on community development could incorporate a much wider
set of indicators, including traditional economic variables along with areas like civic
infrastructure, community leadership, social capital, job quality, human capital

264
investment and others. However, understanding the full scope of economic and
community benefits from the range of economic development strategies is important for
the future success of communities and regions.
In order to accomplish this, a wide and diverse research agenda is necessary to
fully capture the range of issues that economic development policy includes. While the
appearance of simple answers has great appeal to politicians and policymakers, the reality
is there are not simple answers or unique solutions to community and regional
entrepreneurial development. Thus, it is hoped that research practitioners will continue to
ask creative questions and add to the future theory and practice of regional community
and economic development efforts.

265
APPENDICES

266
APPENDIX ONE:
Entrepreneurship and Community Based Economic Development
Introduction
We appreciate your participation in our survey. The major objective of this research is to
learn more about the public policy environment surrounding entrepreneurship and local
economic development. Throughout this survey you will see the terms entrepreneurship
and economic development frequently. For the purposes of this survey please consider
the following definitions for these terms. Entrepreneurship is the term frequently used to
refer to the rapid growth of new and innovative businesses and is associated with
individuals who create or seize business opportunities and pursue them without regard for
resources under their control. (Kauffman Center for Entrepreneurial Leadership 1999).
Economic development refers to policy efforts designed to enhance overall economic
well-being and quality of life for a community. This can involve creating or retaining
employment, policies to improve local income, improving education, enhancing
environmental protection, and better health coverage among other things. This survey
should take approximately 15-20 minutes and we, once again, are appreciative of your
support!
Part I: Professional/Organizational
1. Which of the following best describes your organization and responsibilities?
1.Chamber of Commerce or Local Business Development Organization
2.Community Development Corporation or Local Non-profit Organization
3.Local Elected Official
4.Local/Regional or Planning Organization (e.g. COGs)
5.Municipal or County Staff
6.Workforce Development Agency
7.Other
2. Have you had personal training in economic development?
1.yes
2.no
3. Do you live and work in the same community?
1.yes
2.no
3a. If you answered no above, approximately how many miles do you travel to work?

267
4. How long have you lived in the area?
5. Do you have children that attend local schools?
1.yes
2.no
6. What is the geographic focus for your organizations economic development activities?
1.Downtown
2.Specific Neighborhood
3.City-wide
4.Entire County
5.Regional Area
6.Other
7. How many employees does your organization employ?
8. What is your organizations approximate budget for all economic development
efforts/projects?

268
9. Does your organization operate an entrepreneurship development program?
1.yes
2.no
10. If yes, what services do you provide?
11. What percent (should total to 100%) of your organizations operating budget comes
from the following?
Local government __________
County government __________
State government __________
Federal government __________
Foundations __________
Private business __________
Membership dues __________
Other __________
12. Approximately what percent of your agencies budget is devoted to entrepreneurship
development?
Part II: Community: For the following questions please use the term COMMUNITY to
describe your organizations service area.
13. What is the zip code of your city/town?

269
14. What is your expectation for your community‘s population growth over the next 5
years?
1.Major decline
2.Slight decline
3.No change
4.Slight Increase
5.Rapid Growth
15. Please rank (1-5) the top five issues that you believe are most important for your
community in the near future. (1=most important and 5=least important)
Adequate housing __________
Business attraction __________
Business retention __________
Education/skill development __________
Entrepreneurship development __________
Environmental quality and awareness __________
Job creation and development __________
Providing community recreation, culture, and the arts __________
Public safety __________
Telecommunications infrastructure (e.g. high-speed Broadband) __________
Transportation/Roads __________
Other __________
16. Please consider the following questions concerning educational issues and
entrepreneurship development.
Poor Below
Average
Average Above
Average
Excellent
How do you perceive the level of K-12 educational
support for entrepreneurship education in your
community?
❏ ❏ ❏ ❏ ❏
How do you perceive the level of community and
technical college support for entrepreneurship
education within the state?
❏ ❏ ❏ ❏ ❏
How do you perceive the level of college or
university support for entrepreneurship education
within the state?
❏ ❏ ❏ ❏ ❏

270
17. Does your community have access to small business training opportunities through
organizations like Small Business Development Centers (SBDC) or County Extension
Offices?
1.yes
2.no
18. Does your community have a specific economic development plan?
1.yes
2.no
19. If yes, is support for entrepreneurship a component of this economic development
plan?
1.yes
2.no
Part III: Economic Development Priorities
20. Please consider the importance of entrepreneurship as it relates to overall community
economic development priorities.
Strongly
disagree
Disagree Neither
agree or
disagree
Agree Strongly
agree
My community recognizes the importance of
entrepreneurs to the overall economic development of
the region.
❏ ❏ ❏ ❏ ❏
My community has well-development programs in
place to encourage and support entrepreneurial
activity.
❏ ❏ ❏ ❏ ❏
21. Rank (1-4) the top four reasons for advancing entrepreneurship development as a tool
to improve the following community business and economic development issues.
(1=most important and 4=least important)
Building community and family wealth __________
Community/downtown revitalization __________
Diversification of local economic base __________
Enhancing workforce development skills __________
Improving local business retention __________
Improving new business recruitment __________
Increasing competitiveness __________
Increasing employment opportunities __________

271
22. Of the following economic development approaches, which ONE do you perceive is
the highest priority for LOCAL policymakers?
1.Business clusters
2.Business incubators
3.Downtown revitalization
4.Entrepreneurship development
5.Local business expansion
6.Local tourism initiatives
7.New business recruitment
8.Other
23. Of the following economic development approaches, which ONE do you perceive is
the highest priority for STATE policymakers?
1.Business clusters
2.Business incubators
3.Downtown revitalization
4.Entrepreneurship development
5.Local business expansion
6.Local tourism initiatives
7.New business recruitment
8.Other
24. For my community, industrial and new business recruitment efforts are more
important economic development tools than entrepreneurship efforts.
1.Strongly disagree
2.Disagree
3.Neither agree nor disagree
4.Agree
5.Strongly agree

272
Part IV: Entrepreneurship Support
25. Rate your community‘s access to the following methods of entrepreneurial support.
Extremely
Poor
Poor Average Above
Average
Excellent
A local business incubator ❏ ❏ ❏ ❏ ❏ Access to venture capital or angel investors ❏ ❏ ❏ ❏ ❏ Access to start up or seed capital ❏ ❏ ❏ ❏ ❏ Advertising/marketing assistance ❏ ❏ ❏ ❏ ❏ An organized buy local program ❏ ❏ ❏ ❏ ❏ Local hiring initiatives ❏ ❏ ❏ ❏ ❏ Local infrastructure assistance (e.g. buildings,
Broadband) ❏ ❏ ❏ ❏ ❏ Micro-lending programs ❏ ❏ ❏ ❏ ❏ Networking and mentoring opportunities for
community businesses ❏ ❏ ❏ ❏ ❏ Small business and entrepreneurial training courses
❏ ❏ ❏ ❏ ❏ Others ❏ ❏ ❏ ❏ ❏
26. Rank (1-4) the top four constraints that your community faces in its ability to support
and enhance local entrepreneurship. (1=biggest constraint; 4=least constraint)
Availability of skilled, local professionals __________
Alternative local or regional projects take greater priority __________
Inadequate support from state/federal agencies __________
Lack of funding __________
Locational factors (e.g. market access) __________
Local/state taxation __________
Not considered a local or regional responsibility __________
Weak base of local entrepreneurs __________
27. Does your community receive financial support from local, state, or federal agencies
in support of entrepreneurship efforts?
1.yes
2.no

273
27a. If yes, how much and specify the nature of this support?
28. Would you be interested in survey results?
1.yes
2.no
29. Name, address, email
Thank you for your time and your support of Clemson research!

274
APPENDIX TWO: CORRELLATION MATRIX

275
Questions
Training in
economic
development
Georgraphic focus
of organization
How many
employees
Training in economic development 1.000 0.047 0.202
Georgraphic focus of organization 0.047 1.000 -0.097
How many employees 0.202 -0.097 1.000
Do you have any entrepreneurial development programs? -0.161 -0.009 -0.277
Percent of budget from county 0.127 0.181 -0.106
Percent of budget from city 0.101 -0.140 0.019
Percent of budget from the state -0.272 0.225 -0.289
Percent of budget from federal sources -0.093 0.170 -0.092
Percent of budget from foundations -0.146 -0.113 -0.075
Percent of budget from private sources -0.035 0.193 0.049
Percent of budget devoted to entrepreneurial development 0.039 0.014 -0.006
Future community population growth 0.043 -0.175 -0.029
Most important community issues: Housing 0.098 0.127 -0.089
Most important community issues: Business attraction -0.127 -0.232 0.005
Most important community issues: Business retention 0.097 -0.193 0.014
Most important community issues: Education -0.216 -0.101 0.001
Most important community issues: Entrepreneurship 0.079 0.002 0.003
Most important community issues: Entrepreneurship 0.120 -0.044 0.143
Most important community issues: Environment 0.157 0.055 -0.178
Most important community issues: Culture 0.192 0.223 -0.075
Most important community issues: Safety 0.161 -0.104 0.053
Most important community issues: Telecomm. 0.270 -0.031 -0.074
Most important community issues: Roads -0.041 -0.018 0.085
K-12 education support for entrepreneurhsip edu. -0.241 -0.023 -0.038
Community coll. support for entrepreneurship edu. -0.161 0.048 0.030
University support for entrepreneurship education -0.055 -0.036 0.058
Access to Small Business Development Centers 0.116 -0.140 0.041
Is there a community economic development plan? 0.027 0.138 -0.076
Is entrepreneruship apart of an economic dev. plan 0.136 0.154 -0.059
Community recognizes importance of entrepreneurs 0.029 -0.064 0.073
Community has progs. to support entrepreneurship -0.068 -0.047 0.206
Reasons for entrepreneurship: Community wealth -0.210 -0.133 0.058
Reasons for entrepreneurship: Downtown revitalization 0.018 -0.125 0.083
Reasons for entrepreneurship: Diversify 0.201 0.011 -0.100
Reasons for entrepreneurship: Workforce dev. -0.242 -0.109 0.132
Reasons for entrepreneurship: Business retention 0.016 0.082 0.118
Reasons for entrepreneurship: Business recruitment 0.018 0.063 -0.088
Reasons for entrepreneurship: Competitiveness -0.061 0.041 -0.316
Reasons for entrepreneurship: Employ. opportunities 0.092 0.168 0.036
Econ. dev. approach is priority of local policymakers? -0.122 0.016 -0.207
Econ. dev. approach is priority of state policymakers? 0.050 0.042 0.116
Industrial recruit. more important than entre. dev. 0.033 -0.243 -0.129
Access to a local business incubator -0.154 0.021 0.206
Access to venture capital -0.003 -0.049 0.025
Access to seed capital 0.077 0.070 0.111
Access to advertising and marketing -0.232 -0.041 0.019
Access to a buy local program -0.206 -0.045 -0.112
Access to local hiring programs -0.291 -0.030 -0.020
Access to local infrastructure assistance -0.281 0.066 0.026
Access to micro-lending -0.120 0.172 0.029
Access to networking and mentoring -0.290 0.058 0.159
Access to small business training courses -0.178 0.010 0.142
Constraints: Availability of skilled local professionals -0.035 -0.047 0.109
Constraints: Alternative local and regional projects 0.115 0.078 -0.070
Constraints: Inadequate support from gov. -0.188 0.043 0.134
Constraints: Lack of funding 0.018 -0.021 -0.125
Constraints: Locational factors -0.190 -0.012 0.125
Constraints: Local/state taxation -0.022 -0.093 -0.248
Constraints: Not a local responsibility 0.157 0.047 -0.091
Constraints: Weak base of entrepreneurs 0.081 -0.066 0.066
inancial support from gov. agencies for entre. 0.131 0.083 0.187

276
Entrepreneurial
development
programs?
Percent of budget
from county
Percent of budget
from city
Percent of budget
from the state
Percent of budget
from federal
sources
Percent of budget
from foundations
-0.161 0.127 0.101 -0.272 -0.093 -0.146
-0.009 0.181 -0.140 0.225 0.170 -0.113
-0.277 -0.106 0.019 -0.289 -0.092 -0.075
1.000 -0.175 -0.064 0.298 0.247 0.141
-0.175 1.000 -0.233 -0.062 -0.165 0.018
-0.064 -0.233 1.000 -0.148 -0.008 0.079
0.298 -0.062 -0.148 1.000 0.631 0.325
0.247 -0.165 -0.008 0.631 1.000 0.504
0.141 0.018 0.079 0.325 0.504 1.000
-0.116 0.099 0.267 -0.098 -0.060 0.079
-0.525 -0.018 0.151 -0.287 -0.395 -0.074
-0.193 -0.099 0.038 -0.015 -0.040 0.101
-0.021 0.217 -0.055 -0.061 -0.198 -0.144
-0.015 0.001 -0.024 -0.062 0.020 -0.029
0.104 -0.099 -0.073 0.058 0.120 -0.068
0.230 -0.225 -0.054 0.109 0.155 -0.034
-0.216 0.102 -0.090 -0.142 -0.072 -0.039
-0.006 -0.083 -0.176 0.042 -0.008 -0.175
-0.216 0.122 -0.177 -0.062 -0.143 -0.116
-0.132 0.079 -0.246 0.151 -0.034 -0.003
0.044 0.004 -0.084 0.017 -0.076 -0.046
-0.156 0.100 -0.056 0.059 -0.035 -0.024
0.028 -0.110 -0.179 0.070 -0.034 -0.129
0.180 -0.050 0.094 0.146 0.304 0.209
0.154 0.140 -0.080 0.233 0.254 0.130
0.119 0.105 0.055 0.125 0.100 0.036
0.116 -0.014 0.111 -0.035 -0.055 0.019
-0.077 0.064 -0.041 0.213 0.013 0.010
-0.040 0.159 0.169 -0.057 -0.027 -0.083
-0.113 0.062 -0.107 -0.116 -0.153 -0.057
-0.059 0.052 -0.170 -0.058 0.111 0.106
0.132 -0.119 0.000 0.140 0.116 0.102
-0.067 -0.186 0.156 -0.088 -0.058 0.055
-0.086 0.112 0.225 -0.090 -0.025 -0.138
0.181 -0.188 -0.109 0.304 0.249 0.251
0.049 0.052 -0.054 -0.195 -0.105 -0.068
-0.085 0.186 0.013 -0.135 -0.125 -0.053
-0.048 0.060 0.160 0.032 -0.054 -0.140
0.070 0.125 -0.162 0.028 0.039 0.061
0.146 -0.205 0.048 0.266 0.201 0.093
0.024 -0.104 -0.065 0.035 0.251 0.098
0.322 -0.145 0.104 0.009 0.074 0.170
-0.013 -0.012 -0.300 0.034 0.088 0.041
0.088 0.078 -0.185 0.056 0.127 0.142
-0.227 0.045 0.104 -0.054 -0.126 -0.197
0.057 0.082 -0.104 -0.085 0.154 0.220
0.096 0.086 -0.238 0.227 0.163 0.178
-0.010 -0.025 -0.034 0.174 0.123 0.176
0.232 -0.143 -0.128 0.278 0.301 0.150
0.173 -0.070 -0.150 0.135 0.207 0.184
0.005 0.024 -0.304 0.106 0.231 0.074
-0.011 -0.042 -0.245 0.090 0.065 0.008
0.159 -0.047 -0.114 0.099 0.125 0.023
0.061 -0.011 0.043 0.077 0.157 -0.072
-0.073 -0.108 0.060 -0.041 0.107 0.113
0.077 0.226 -0.012 -0.025 -0.098 0.088
-0.082 0.007 -0.135 0.025 0.006 -0.020
-0.056 -0.005 0.061 -0.003 -0.162 -0.102
-0.107 0.068 0.115 -0.164 -0.107 -0.070
0.052 -0.003 -0.067 -0.042 -0.102 0.125
-0.209 0.058 0.026 -0.101 -0.031 -0.006

277
Percent of budget
from private
sources
Percent of budget
devoted to entre.
dev.
Future community
population growth
Most important
community issues:
Housing
Most important
community issues:
Business attraction
Most important
community issues:
Business retention
-0.035 0.039 0.043 0.098 -0.127 0.097
0.193 0.014 -0.175 0.127 -0.232 -0.193
0.049 -0.006 -0.029 -0.089 0.005 0.014
-0.116 -0.525 -0.193 -0.021 -0.015 0.104
0.099 -0.018 -0.099 0.217 0.001 -0.099
0.267 0.151 0.038 -0.055 -0.024 -0.073
-0.098 -0.287 -0.015 -0.061 -0.062 0.058
-0.060 -0.395 -0.040 -0.198 0.020 0.120
0.079 -0.074 0.101 -0.144 -0.029 -0.068
1.000 0.055 -0.040 0.120 0.034 -0.158
0.055 1.000 0.253 0.051 -0.089 -0.213
-0.040 0.253 1.000 0.258 -0.014 0.060
0.120 0.051 0.258 1.000 -0.218 -0.155
0.034 -0.089 -0.014 -0.218 1.000 0.240
-0.158 -0.213 0.060 -0.155 0.240 1.000
-0.097 -0.107 -0.069 -0.006 -0.057 0.050
-0.090 0.082 0.081 -0.033 0.047 -0.008
-0.041 -0.041 -0.073 0.149 -0.033 -0.021
-0.223 0.280 0.185 0.282 -0.148 -0.004
-0.183 0.044 0.047 0.128 -0.217 0.085
-0.144 -0.101 0.207 0.122 0.041 0.429
-0.196 0.021 0.228 0.142 -0.148 0.127
-0.160 0.043 0.080 -0.006 -0.188 0.254
-0.101 -0.237 -0.165 -0.128 -0.002 -0.097
0.051 -0.299 -0.220 -0.047 0.016 0.043
-0.017 -0.137 -0.039 0.125 -0.156 0.099
-0.235 -0.098 0.006 0.061 -0.041 0.067
0.041 -0.024 0.166 0.171 -0.129 0.063
0.003 -0.095 -0.102 0.089 0.035 0.091
0.008 0.190 -0.052 0.168 -0.008 -0.101
-0.053 -0.019 0.043 0.208 0.020 -0.110
-0.073 -0.200 -0.072 -0.133 0.061 0.082
-0.129 0.074 0.120 -0.131 0.055 0.009
0.018 0.192 0.104 -0.060 0.059 -0.045
0.029 -0.291 -0.137 -0.066 -0.099 0.032
0.140 0.022 -0.147 0.042 -0.025 -0.086
0.074 0.177 0.012 0.051 0.003 -0.113
0.138 -0.024 0.040 0.095 0.236 -0.026
0.042 0.008 -0.026 0.078 -0.275 -0.117
-0.071 -0.104 0.035 -0.001 0.135 0.068
0.114 -0.055 0.079 -0.238 -0.095 0.082
0.037 -0.148 0.019 -0.012 0.161 0.094
-0.090 -0.146 -0.063 -0.023 -0.003 0.015
-0.027 -0.157 -0.237 -0.047 -0.094 -0.051
-0.006 0.137 0.041 -0.051 0.170 0.114
-0.180 -0.135 -0.056 -0.043 0.096 -0.019
0.037 -0.195 -0.112 0.198 -0.217 -0.182
-0.034 -0.138 -0.092 -0.035 0.160 -0.071
-0.059 -0.297 -0.085 -0.138 0.020 0.064
0.079 -0.195 -0.099 0.051 -0.189 -0.142
-0.074 -0.200 -0.072 -0.028 0.059 0.105
-0.090 -0.042 -0.038 0.002 -0.044 -0.018
0.007 -0.292 -0.123 -0.043 -0.051 0.131
-0.067 -0.070 0.098 -0.122 -0.112 -0.047
0.234 -0.007 0.194 0.117 0.073 -0.040
-0.065 0.076 -0.033 0.009 0.033 -0.070
-0.023 -0.007 -0.236 -0.102 -0.034 -0.016
-0.047 0.068 0.165 0.103 0.020 0.025
0.220 0.154 0.090 0.014 -0.015 -0.131
-0.151 0.096 -0.052 -0.005 -0.001 0.047
-0.003 0.042 -0.075 -0.055 0.027 -0.004

278
Most important
community issues:
Education
Most important
community issues:
Entrepreneurship
Most important
community issues:
Entrepreneurship
Most important
community issues:
Environment
Most important
community issues:
Culture
Most important
community issues:
Safety
-0.216 0.079 0.120 0.157 0.192 0.161
-0.101 0.002 -0.044 0.055 0.223 -0.104
0.001 0.003 0.143 -0.178 -0.075 0.053
0.230 -0.216 -0.006 -0.216 -0.132 0.044
-0.225 0.102 -0.083 0.122 0.079 0.004
-0.054 -0.090 -0.176 -0.177 -0.246 -0.084
0.109 -0.142 0.042 -0.062 0.151 0.017
0.155 -0.072 -0.008 -0.143 -0.034 -0.076
-0.034 -0.039 -0.175 -0.116 -0.003 -0.046
-0.097 -0.090 -0.041 -0.223 -0.183 -0.144
-0.107 0.082 -0.041 0.280 0.044 -0.101
-0.069 0.081 -0.073 0.185 0.047 0.207
-0.006 -0.033 0.149 0.282 0.128 0.122
-0.057 0.047 -0.033 -0.148 -0.217 0.041
0.050 -0.008 -0.021 -0.004 0.085 0.429
1.000 -0.197 0.021 0.034 -0.040 0.056
-0.197 1.000 0.083 0.162 -0.010 0.010
0.021 0.083 1.000 0.128 0.221 0.320
0.034 0.162 0.128 1.000 0.329 0.193
-0.040 -0.010 0.221 0.329 1.000 0.354
0.056 0.010 0.320 0.193 0.354 1.000
-0.008 0.027 0.249 0.266 0.444 0.399
0.124 -0.154 0.239 0.142 0.257 0.341
0.016 -0.054 -0.084 -0.167 -0.260 -0.133
-0.071 -0.039 -0.182 -0.193 -0.231 -0.156
0.024 -0.020 -0.074 0.002 -0.086 -0.097
0.011 -0.149 -0.122 -0.080 -0.040 0.251
-0.015 0.020 0.320 0.207 0.554 0.308
0.008 -0.069 0.170 0.037 0.230 0.256
-0.090 0.009 0.080 0.018 0.043 -0.075
0.075 -0.025 0.151 0.115 -0.061 -0.050
0.061 -0.294 -0.028 -0.061 0.021 -0.092
-0.180 -0.020 0.063 -0.113 -0.175 -0.060
-0.151 0.089 -0.152 -0.021 -0.056 -0.052
0.248 -0.101 0.006 -0.218 -0.260 -0.172
0.077 0.109 0.080 -0.223 -0.005 -0.026
-0.155 0.167 0.004 -0.076 -0.035 -0.066
0.045 0.011 -0.246 0.151 -0.033 0.053
-0.033 -0.062 0.121 0.178 0.168 0.085
0.196 -0.076 0.051 -0.121 -0.063 -0.020
0.119 -0.030 -0.030 -0.175 -0.140 -0.155
0.027 -0.078 -0.014 0.080 0.072 0.081
0.076 0.054 0.202 -0.074 -0.001 -0.031
0.093 -0.158 0.029 0.032 0.191 -0.027
-0.011 0.155 -0.004 0.055 -0.060 0.064
0.074 -0.020 -0.157 -0.125 -0.180 -0.097
0.130 0.013 0.119 -0.040 -0.118 -0.100
0.020 0.036 -0.103 -0.067 -0.114 -0.027
0.101 0.004 -0.025 -0.148 -0.078 0.068
-0.091 -0.108 0.113 -0.197 0.129 0.145
0.067 0.014 0.104 -0.196 -0.212 -0.037
0.012 0.006 0.040 -0.254 -0.059 -0.125
0.135 -0.106 -0.006 -0.009 -0.128 -0.059
-0.056 -0.126 -0.151 -0.079 0.066 -0.056
0.072 0.003 0.014 -0.019 -0.139 0.106
-0.045 0.006 -0.025 0.004 0.053 -0.001
-0.055 0.058 0.029 -0.204 0.009 -0.110
0.021 0.041 -0.199 0.128 0.004 -0.004
-0.105 -0.016 -0.026 -0.130 -0.060 -0.030
-0.172 0.089 0.059 0.069 0.052 -0.031
-0.213 0.211 0.160 0.020 0.108 0.003

279
Most important
community issues:
Telecom.
Most important
community issues:
Roads
K-12 education
support for entre.
edu.
Community college
support for entre.
education
University support
for entre. education
Access to Small
Business Dev.
Centers
0.270 -0.041 -0.241 -0.161 -0.055 0.116
-0.031 -0.018 -0.023 0.048 -0.036 -0.140
-0.074 0.085 -0.038 0.030 0.058 0.041
-0.156 0.028 0.180 0.154 0.119 0.116
0.100 -0.110 -0.050 0.140 0.105 -0.014
-0.056 -0.179 0.094 -0.080 0.055 0.111
0.059 0.070 0.146 0.233 0.125 -0.035
-0.035 -0.034 0.304 0.254 0.100 -0.055
-0.024 -0.129 0.209 0.130 0.036 0.019
-0.196 -0.160 -0.101 0.051 -0.017 -0.235
0.021 0.043 -0.237 -0.299 -0.137 -0.098
0.228 0.080 -0.165 -0.220 -0.039 0.006
0.142 -0.006 -0.128 -0.047 0.125 0.061
-0.148 -0.188 -0.002 0.016 -0.156 -0.041
0.127 0.254 -0.097 0.043 0.099 0.067
-0.008 0.124 0.016 -0.071 0.024 0.011
0.027 -0.154 -0.054 -0.039 -0.020 -0.149
0.249 0.239 -0.084 -0.182 -0.074 -0.122
0.266 0.142 -0.167 -0.193 0.002 -0.080
0.444 0.257 -0.260 -0.231 -0.086 -0.040
0.399 0.341 -0.133 -0.156 -0.097 0.251
1.000 0.314 -0.142 -0.150 -0.020 0.006
0.314 1.000 0.101 -0.090 -0.001 0.003
-0.142 0.101 1.000 0.531 0.267 0.030
-0.150 -0.090 0.531 1.000 0.551 0.036
-0.020 -0.001 0.267 0.551 1.000 0.032
0.006 0.003 0.030 0.036 0.032 1.000
0.386 0.265 -0.125 -0.195 -0.012 -0.057
0.189 0.148 -0.050 -0.128 -0.125 0.248
0.046 -0.031 0.193 0.137 0.255 -0.130
0.083 0.110 0.418 0.318 0.330 -0.082
-0.120 0.056 0.169 0.179 0.119 0.076
-0.014 -0.119 -0.114 -0.154 -0.185 0.000
-0.021 -0.192 -0.137 -0.025 0.025 0.104
-0.257 0.043 0.223 0.186 0.109 -0.124
-0.211 -0.026 -0.058 -0.259 -0.220 -0.140
0.073 -0.039 0.096 0.070 -0.045 -0.027
-0.049 -0.201 -0.151 -0.072 -0.023 -0.038
0.250 0.039 -0.022 0.029 0.070 0.000
-0.033 -0.111 -0.127 -0.171 -0.137 0.008
0.019 0.045 0.051 0.159 0.022 -0.090
-0.072 -0.051 0.007 -0.006 0.055 -0.013
-0.048 0.042 0.163 0.238 0.191 -0.078
0.108 0.056 0.193 0.137 0.150 0.097
0.034 -0.123 -0.205 -0.169 -0.076 -0.145
-0.077 -0.088 0.398 0.268 0.275 0.064
-0.108 -0.083 0.225 0.101 0.158 -0.089
-0.087 -0.101 0.202 0.144 0.080 -0.077
-0.101 0.047 0.217 0.202 0.137 0.060
-0.093 0.092 0.265 0.167 0.060 0.035
-0.115 0.097 0.305 0.340 0.280 -0.180
-0.026 0.033 0.184 0.274 0.276 -0.121
-0.138 -0.022 0.215 0.297 0.344 -0.037
0.033 -0.156 -0.023 0.089 0.071 0.122
-0.189 -0.027 0.013 -0.107 -0.112 -0.053
0.154 0.091 -0.231 -0.125 -0.164 -0.093
-0.175 0.054 0.181 0.145 -0.026 -0.085
-0.032 -0.147 -0.107 -0.207 -0.128 0.049
0.103 0.065 -0.095 -0.049 -0.026 -0.015
0.103 0.001 -0.096 -0.058 -0.093 0.029
0.090 0.039 -0.157 -0.026 -0.116 0.008

280
Community
economic
development plan?
Entrepreneruship a
part of an econ.
development. plan
Community
recognizes import.
of entrepreneurs
Comm. has well-
developed progrs to
support entre.
Reasons for
entrepreneurship:
Community wealth
Reasons for entre.:
Downtown
revitalization
0.027 0.136 0.029 -0.068 -0.210 0.018
0.138 0.154 -0.064 -0.047 -0.133 -0.125
-0.076 -0.059 0.073 0.206 0.058 0.083
-0.077 -0.040 -0.113 -0.059 0.132 -0.067
0.064 0.159 0.062 0.052 -0.119 -0.186
-0.041 0.169 -0.107 -0.170 0.000 0.156
0.213 -0.057 -0.116 -0.058 0.140 -0.088
0.013 -0.027 -0.153 0.111 0.116 -0.058
0.010 -0.083 -0.057 0.106 0.102 0.055
0.041 0.003 0.008 -0.053 -0.073 -0.129
-0.024 -0.095 0.190 -0.019 -0.200 0.074
0.166 -0.102 -0.052 0.043 -0.072 0.120
0.171 0.089 0.168 0.208 -0.133 -0.131
-0.129 0.035 -0.008 0.020 0.061 0.055
0.063 0.091 -0.101 -0.110 0.082 0.009
-0.015 0.008 -0.090 0.075 0.061 -0.180
0.020 -0.069 0.009 -0.025 -0.294 -0.020
0.320 0.170 0.080 0.151 -0.028 0.063
0.207 0.037 0.018 0.115 -0.061 -0.113
0.554 0.230 0.043 -0.061 0.021 -0.175
0.308 0.256 -0.075 -0.050 -0.092 -0.060
0.386 0.189 0.046 0.083 -0.120 -0.014
0.265 0.148 -0.031 0.110 0.056 -0.119
-0.125 -0.050 0.193 0.418 0.169 -0.114
-0.195 -0.128 0.137 0.318 0.179 -0.154
-0.012 -0.125 0.255 0.330 0.119 -0.185
-0.057 0.248 -0.130 -0.082 0.076 0.000
1.000 0.418 0.000 -0.052 -0.030 -0.169
0.418 1.000 -0.176 -0.279 -0.076 -0.155
0.000 -0.176 1.000 0.562 -0.006 0.110
-0.052 -0.279 0.562 1.000 0.096 0.039
-0.030 -0.076 -0.006 0.096 1.000 -0.050
-0.169 -0.155 0.110 0.039 -0.050 1.000
-0.127 0.009 -0.153 -0.262 -0.132 -0.008
-0.180 -0.176 -0.031 0.078 0.043 -0.121
0.084 0.081 -0.047 0.022 -0.321 -0.019
0.001 0.060 -0.042 0.094 -0.220 -0.149
0.073 0.189 -0.044 -0.253 -0.114 -0.048
0.029 0.036 0.129 -0.037 -0.119 -0.265
0.034 0.013 -0.197 -0.147 0.070 0.262
0.001 -0.131 -0.106 -0.017 0.032 0.066
0.136 -0.026 -0.103 -0.032 0.105 -0.009
0.051 -0.166 0.387 0.542 -0.006 0.184
-0.072 -0.060 0.387 0.390 0.115 0.039
0.071 0.120 -0.026 -0.218 -0.076 -0.057
-0.192 0.020 0.009 0.355 0.033 -0.016
-0.161 -0.119 0.242 0.290 -0.052 0.103
-0.241 -0.134 0.121 0.260 -0.125 0.140
0.006 -0.007 0.031 0.186 -0.194 -0.014
0.016 -0.104 0.236 0.359 -0.054 0.069
-0.130 -0.178 0.188 0.385 0.126 0.116
-0.059 -0.059 0.210 0.270 -0.051 0.021
-0.155 -0.141 0.021 0.147 0.233 -0.034
-0.024 0.131 -0.061 -0.239 0.066 -0.133
0.092 0.010 -0.130 0.092 0.079 0.095
0.089 0.112 -0.078 -0.138 -0.068 0.049
-0.171 -0.109 -0.112 0.006 0.039 0.034
0.103 0.122 -0.100 -0.150 -0.055 -0.010
0.039 0.140 0.201 -0.037 -0.160 0.024
-0.172 -0.259 0.191 0.138 -0.013 0.152
0.092 0.084 0.077 0.039 -0.199 0.148

281
Eco. Dev approach
is priority of local
policymakers?
Econ. dev approach
is priority of state
policymakers?
Indust. recruit.more
important than
entre. efforts.
Access to a local
business incubator
Access to venture
capital
Access to seed
capital
-0.122 0.050 0.033 -0.154 -0.003 0.077
0.016 0.042 -0.243 0.021 -0.049 0.070
-0.207 0.116 -0.129 0.206 0.025 0.111
0.146 0.024 0.322 -0.013 0.088 -0.227
-0.205 -0.104 -0.145 -0.012 0.078 0.045
0.048 -0.065 0.104 -0.300 -0.185 0.104
0.266 0.035 0.009 0.034 0.056 -0.054
0.201 0.251 0.074 0.088 0.127 -0.126
0.093 0.098 0.170 0.041 0.142 -0.197
-0.071 0.114 0.037 -0.090 -0.027 -0.006
-0.104 -0.055 -0.148 -0.146 -0.157 0.137
0.035 0.079 0.019 -0.063 -0.237 0.041
-0.001 -0.238 -0.012 -0.023 -0.047 -0.051
0.135 -0.095 0.161 -0.003 -0.094 0.170
0.068 0.082 0.094 0.015 -0.051 0.114
0.196 0.119 0.027 0.076 0.093 -0.011
-0.076 -0.030 -0.078 0.054 -0.158 0.155
0.051 -0.030 -0.014 0.202 0.029 -0.004
-0.121 -0.175 0.080 -0.074 0.032 0.055
-0.063 -0.140 0.072 -0.001 0.191 -0.060
-0.020 -0.155 0.081 -0.031 -0.027 0.064
-0.033 0.019 -0.072 -0.048 0.108 0.034
-0.111 0.045 -0.051 0.042 0.056 -0.123
-0.127 0.051 0.007 0.163 0.193 -0.205
-0.171 0.159 -0.006 0.238 0.137 -0.169
-0.137 0.022 0.055 0.191 0.150 -0.076
0.008 -0.090 -0.013 -0.078 0.097 -0.145
0.034 0.001 0.136 0.051 -0.072 0.071
0.013 -0.131 -0.026 -0.166 -0.060 0.120
-0.197 -0.106 -0.103 0.387 0.387 -0.026
-0.147 -0.017 -0.032 0.542 0.390 -0.218
0.070 0.032 0.105 -0.006 0.115 -0.076
0.262 0.066 -0.009 0.184 0.039 -0.057
0.027 -0.030 -0.031 -0.326 -0.296 0.198
0.192 0.247 -0.055 0.141 0.059 -0.057
-0.063 -0.055 -0.133 0.092 0.014 -0.116
-0.114 -0.131 -0.210 0.042 0.119 -0.183
0.047 -0.085 0.201 -0.294 -0.157 0.167
-0.265 -0.026 -0.035 0.037 0.129 -0.011
1.000 0.304 0.111 -0.025 -0.183 0.006
0.304 1.000 0.115 0.087 -0.135 0.001
0.111 0.115 1.000 0.047 -0.057 -0.031
-0.025 0.087 0.047 1.000 0.411 -0.147
-0.183 -0.135 -0.057 0.411 1.000 -0.515
0.006 0.001 -0.031 -0.147 -0.515 1.000
-0.133 -0.040 -0.014 0.200 0.163 -0.159
0.029 -0.077 -0.105 0.349 0.470 -0.345
0.161 -0.147 0.076 0.271 0.316 -0.241
0.000 0.018 -0.046 0.364 0.327 -0.335
-0.054 -0.095 0.048 0.375 0.425 -0.497
0.057 0.037 -0.090 0.457 0.144 -0.038
-0.003 0.084 -0.201 0.427 0.237 -0.122
0.109 0.086 0.158 0.185 -0.002 0.000
-0.105 0.042 0.009 -0.152 0.032 0.094
0.384 0.280 -0.093 -0.103 -0.163 -0.089
0.002 0.019 -0.052 -0.231 -0.060 0.059
-0.126 -0.017 -0.071 0.227 0.258 -0.139
0.123 -0.098 0.075 -0.107 -0.120 0.063
-0.199 -0.048 -0.135 0.011 0.041 -0.098
-0.121 -0.137 -0.074 0.219 0.101 0.008
-0.250 -0.067 -0.117 0.153 -0.044 0.111

282
Access to
advertising and
marketing
Access to a buy
local program
Access to local
hiring programs
Access to local
infrastructure
assistance
Access to micro-
lending
Access to
networking and
mentoring
-0.232 -0.206 -0.291 -0.281 -0.120 -0.290
-0.041 -0.045 -0.030 0.066 0.172 0.058
0.019 -0.112 -0.020 0.026 0.029 0.159
0.057 0.096 -0.010 0.232 0.173 0.005
0.082 0.086 -0.025 -0.143 -0.070 0.024
-0.104 -0.238 -0.034 -0.128 -0.150 -0.304
-0.085 0.227 0.174 0.278 0.135 0.106
0.154 0.163 0.123 0.301 0.207 0.231
0.220 0.178 0.176 0.150 0.184 0.074
-0.180 0.037 -0.034 -0.059 0.079 -0.074
-0.135 -0.195 -0.138 -0.297 -0.195 -0.200
-0.056 -0.112 -0.092 -0.085 -0.099 -0.072
-0.043 0.198 -0.035 -0.138 0.051 -0.028
0.096 -0.217 0.160 0.020 -0.189 0.059
-0.019 -0.182 -0.071 0.064 -0.142 0.105
0.074 0.130 0.020 0.101 -0.091 0.067
-0.020 0.013 0.036 0.004 -0.108 0.014
-0.157 0.119 -0.103 -0.025 0.113 0.104
-0.125 -0.040 -0.067 -0.148 -0.197 -0.196
-0.180 -0.118 -0.114 -0.078 0.129 -0.212
-0.097 -0.100 -0.027 0.068 0.145 -0.037
-0.077 -0.108 -0.087 -0.101 -0.093 -0.115
-0.088 -0.083 -0.101 0.047 0.092 0.097
0.398 0.225 0.202 0.217 0.265 0.305
0.268 0.101 0.144 0.202 0.167 0.340
0.275 0.158 0.080 0.137 0.060 0.280
0.064 -0.089 -0.077 0.060 0.035 -0.180
-0.192 -0.161 -0.241 0.006 0.016 -0.130
0.020 -0.119 -0.134 -0.007 -0.104 -0.178
0.009 0.242 0.121 0.031 0.236 0.188
0.355 0.290 0.260 0.186 0.359 0.385
0.033 -0.052 -0.125 -0.194 -0.054 0.126
-0.016 0.103 0.140 -0.014 0.069 0.116
-0.196 -0.298 -0.175 -0.322 -0.278 -0.264
0.155 0.239 0.151 0.265 0.110 0.116
0.126 0.057 0.039 0.193 0.194 -0.039
0.080 0.029 -0.031 0.109 0.091 -0.056
-0.143 -0.135 0.127 -0.013 -0.140 -0.190
-0.030 0.057 -0.095 0.088 0.051 -0.001
-0.133 0.029 0.161 0.000 -0.054 0.057
-0.040 -0.077 -0.147 0.018 -0.095 0.037
-0.014 -0.105 0.076 -0.046 0.048 -0.090
0.200 0.349 0.271 0.364 0.375 0.457
0.163 0.470 0.316 0.327 0.425 0.144
-0.159 -0.345 -0.241 -0.335 -0.497 -0.038
1.000 0.318 0.273 0.359 0.153 0.415
0.318 1.000 0.418 0.413 0.304 0.361
0.273 0.418 1.000 0.496 0.344 0.285
0.359 0.413 0.496 1.000 0.468 0.186
0.153 0.304 0.344 0.468 1.000 0.258
0.415 0.361 0.285 0.186 0.258 1.000
0.349 0.365 0.327 0.359 0.318 0.567
0.112 0.130 0.151 0.096 0.036 0.215
-0.014 -0.033 -0.197 -0.034 -0.080 -0.127
0.046 -0.006 0.050 0.104 0.064 0.104
-0.082 -0.174 -0.155 -0.124 -0.150 -0.187
0.157 0.198 0.185 0.191 0.228 0.062
-0.076 -0.040 -0.064 -0.037 -0.098 -0.211
-0.105 -0.043 -0.010 -0.038 0.047 -0.066
-0.041 0.012 0.101 -0.031 0.025 0.095
0.083 -0.031 0.032 0.048 0.098 0.016

283
Access to small
business training
courses
Constraints:
Availability of loc.
professionals
Constraints:
Alternative local &
regional projects
Constraints:
Inadequate support
from gov. agencies
Constraints: Lack
of funding
Constraints:
Locational factors
-0.178 -0.035 0.115 -0.188 0.018 -0.190
0.010 -0.047 0.078 0.043 -0.021 -0.012
0.142 0.109 -0.070 0.134 -0.125 0.125
-0.011 0.159 0.061 -0.073 0.077 -0.082
-0.042 -0.047 -0.011 -0.108 0.226 0.007
-0.245 -0.114 0.043 0.060 -0.012 -0.135
0.090 0.099 0.077 -0.041 -0.025 0.025
0.065 0.125 0.157 0.107 -0.098 0.006
0.008 0.023 -0.072 0.113 0.088 -0.020
-0.090 0.007 -0.067 0.234 -0.065 -0.023
-0.042 -0.292 -0.070 -0.007 0.076 -0.007
-0.038 -0.123 0.098 0.194 -0.033 -0.236
0.002 -0.043 -0.122 0.117 0.009 -0.102
-0.044 -0.051 -0.112 0.073 0.033 -0.034
-0.018 0.131 -0.047 -0.040 -0.070 -0.016
0.012 0.135 -0.056 0.072 -0.045 -0.055
0.006 -0.106 -0.126 0.003 0.006 0.058
0.040 -0.006 -0.151 0.014 -0.025 0.029
-0.254 -0.009 -0.079 -0.019 0.004 -0.204
-0.059 -0.128 0.066 -0.139 0.053 0.009
-0.125 -0.059 -0.056 0.106 -0.001 -0.110
-0.026 -0.138 0.033 -0.189 0.154 -0.175
0.033 -0.022 -0.156 -0.027 0.091 0.054
0.184 0.215 -0.023 0.013 -0.231 0.181
0.274 0.297 0.089 -0.107 -0.125 0.145
0.276 0.344 0.071 -0.112 -0.164 -0.026
-0.121 -0.037 0.122 -0.053 -0.093 -0.085
-0.059 -0.155 -0.024 0.092 0.089 -0.171
-0.059 -0.141 0.131 0.010 0.112 -0.109
0.210 0.021 -0.061 -0.130 -0.078 -0.112
0.270 0.147 -0.239 0.092 -0.138 0.006
-0.051 0.233 0.066 0.079 -0.068 0.039
0.021 -0.034 -0.133 0.095 0.049 0.034
-0.266 -0.067 0.281 -0.084 0.014 -0.065
0.239 0.221 -0.192 0.058 0.053 0.323
0.032 -0.021 -0.140 0.189 0.022 0.016
0.129 -0.189 -0.066 0.089 0.128 0.074
-0.204 -0.050 0.103 0.069 0.185 -0.160
0.011 0.018 0.183 -0.184 0.054 -0.075
-0.003 0.109 -0.105 0.384 0.002 -0.126
0.084 0.086 0.042 0.280 0.019 -0.017
-0.201 0.158 0.009 -0.093 -0.052 -0.071
0.427 0.185 -0.152 -0.103 -0.231 0.227
0.237 -0.002 0.032 -0.163 -0.060 0.258
-0.122 0.000 0.094 -0.089 0.059 -0.139
0.349 0.112 -0.014 0.046 -0.082 0.157
0.365 0.130 -0.033 -0.006 -0.174 0.198
0.327 0.151 -0.197 0.050 -0.155 0.185
0.359 0.096 -0.034 0.104 -0.124 0.191
0.318 0.036 -0.080 0.064 -0.150 0.228
0.567 0.215 -0.127 0.104 -0.187 0.062
1.000 0.070 -0.013 -0.014 -0.124 0.104
0.070 1.000 -0.142 -0.097 -0.364 -0.006
-0.013 -0.142 1.000 -0.186 -0.107 -0.179
-0.014 -0.097 -0.186 1.000 0.089 -0.235
-0.124 -0.364 -0.107 0.089 1.000 -0.085
0.104 -0.006 -0.179 -0.235 -0.085 1.000
-0.231 0.052 -0.131 0.057 -0.092 -0.111
0.086 -0.252 0.127 -0.189 -0.074 -0.172
0.061 -0.089 -0.361 -0.305 0.001 0.124
0.034 -0.122 -0.022 -0.251 0.057 0.038

284
Constraints:
Local/state taxation
Constraints: Not a
local responsibility
Constraints: Weak
base of
entrepreneurs
Financial support
from gov. agencies
for entre.
-0.022 0.157 0.081 0.131
-0.093 0.047 -0.066 0.083
-0.248 -0.091 0.066 0.187
-0.056 -0.107 0.052 -0.209
-0.005 0.068 -0.003 0.058
0.061 0.115 -0.067 0.026
-0.003 -0.164 -0.042 -0.101
-0.162 -0.107 -0.102 -0.031
-0.102 -0.070 0.125 -0.006
-0.047 0.220 -0.151 -0.003
0.068 0.154 0.096 0.042
0.165 0.090 -0.052 -0.075
0.103 0.014 -0.005 -0.055
0.020 -0.015 -0.001 0.027
0.025 -0.131 0.047 -0.004
0.021 -0.105 -0.172 -0.213
0.041 -0.016 0.089 0.211
-0.199 -0.026 0.059 0.160
0.128 -0.130 0.069 0.020
0.004 -0.060 0.052 0.108
-0.004 -0.030 -0.031 0.003
-0.032 0.103 0.103 0.090
-0.147 0.065 0.001 0.039
-0.107 -0.095 -0.096 -0.157
-0.207 -0.049 -0.058 -0.026
-0.128 -0.026 -0.093 -0.116
0.049 -0.015 0.029 0.008
0.103 0.039 -0.172 0.092
0.122 0.140 -0.259 0.084
-0.100 0.201 0.191 0.077
-0.150 -0.037 0.138 0.039
-0.055 -0.160 -0.013 -0.199
-0.010 0.024 0.152 0.148
0.051 0.131 -0.085 0.048
0.024 -0.244 -0.020 -0.084
0.106 0.118 -0.090 -0.007
0.028 -0.046 0.081 -0.054
0.133 0.196 -0.279 -0.196
-0.080 0.118 0.117 0.067
0.123 -0.199 -0.121 -0.250
-0.098 -0.048 -0.137 -0.067
0.075 -0.135 -0.074 -0.117
-0.107 0.011 0.219 0.153
-0.120 0.041 0.101 -0.044
0.063 -0.098 0.008 0.111
-0.076 -0.105 -0.041 0.083
-0.040 -0.043 0.012 -0.031
-0.064 -0.010 0.101 0.032
-0.037 -0.038 -0.031 0.048
-0.098 0.047 0.025 0.098
-0.211 -0.066 0.095 0.016
-0.231 0.086 0.061 0.034
0.052 -0.252 -0.089 -0.122
-0.131 0.127 -0.361 -0.022
0.057 -0.189 -0.305 -0.251
-0.092 -0.074 0.001 0.057
-0.111 -0.172 0.124 0.038
1.000 -0.151 -0.170 -0.011
-0.151 1.000 -0.016 0.074
-0.170 -0.016 1.000 0.209
-0.011 0.074 0.209 1.000

285
APPENDIX THREE: OVERVIEW OF STATE POLICY RESTRICTIONS
State Policy Restriction
Alabama
Municipalities are forbidden from using local funds or taxes to pay for start up
expenses on capital intensive projects until the project is constructed and revenues
can cover expenses.
Arkansas Municipalities are forbidden from providing local exchange services.
Colorado
Must hold a referendum if municipalities want to provide cable, telecommunications
or Broadband services unless incumbents will not provide the services in questions at
the request of the community.
Florida
Imposes ad-valorem taxes on municipal telecommunications unlike other public
municipal services.
Louisiana
Must hold a referendum if municipalities want to provide cable, telecommunications
or Broadband services. The municipality must also impute the various costs that a
private provider might pay if they provided the service.
Michigan
May provide telecommunications services if the municipality has requested at least
three qualified private bids for the service.
Minnesota
Municipalities must obtain a super majority (65%) of all local voters before providing
local exchange services or facilities.
Missouri
Municipalities are forbidden from selling or leasing telecommunications services
unless it is for internal purposes or for educational, health, or emergency purposes.
Nebraska
Generally prohibits public agencies from providing wholesale or retail Broadband,
Internet, telecommunications or cable service.
Nevada
Municipalities with populations of 25,000 or more or counties of 50,000 or more are
forbidden from telecommunications services as defined by federal law.
Pennsylvania
Municipalities are forbidden from providing telecommunications services unless the
local telephone company refuses to provide the service within 14 months of the initial
request. The only criteria under consideration for whether the community is un-
served are data speed on any kind.
South Carolina
Imposes substantial and burdensome procedural requirements. Among other things,
municipal providers must impute into their rates all costs that private firms would
incur, including income taxes.
Tennessee
Municipal provision in only allowed after public disclosure of anti-competitive
assurances, and public hearing and voting requirements.
Texas
Municipalities are forbidden from providing telecommunications services either
directly or indirectly.
Utah Imposes substantial and burdensome procedural and accounting requirements.
Virginia
Municipal utilities can become municipal local exchange carriers and offer all
communications services as long as they do not subsidize services, do not charge
rates lower than incumbents, impute private sector costs into their rates, and meet
other procedural, reporting and financing requirements.
Washington
Public utility districts may not provide communications services directly to
consumers
Wisconsin
Feasibility studies and public hearings are all requirements before municipalities can
consider providing telecom, cable, or internet services. It also prohibits subsidization
of most cable and telecom services.

286
APPENDIX FOUR: MEU SURVEY RESULTS
Table A4.1: Question: How important is ICT to the future of these different community sectors (% of respondents)?
Main
Street/Small
Businesses
Industrial
Businesses
Health
Sector
Education
Sector Govt Sector Households
Workforce
development
Critical 18.18 16.67 33.33 41.67 33.33 0.00 27.27
Very Important 54.55 75.00 41.67 41.67 58.33 33.33 36.36 Somewhat
Important 27.27 8.33 25.00 16.67 8.33 58.33 36.36 Not at all
Important 0.00 0.00 0.00 0.00 0.00 8.33 0.00
Do Not Know 0.00 0.00 0.00 0.00 0.00 0.00 0.00
Table A4.2: Question: Rate the importance of using Information Communications Technology (ICT) to advance the
following community strategies as they relate to business and economic development (% of respondents).
Increasing
competitiveness
Enhancing
workforce
development-
education and
skills
Improving
ready
access to
suppliers
Improving
communicatio
n with
consumers
Enhancing
regional
marketing
Increasing
employment
opportunities
Improving
new business
recruitment
Critical 25.00 8.33 8.33 16.67 18.18 25.00 25.00
Very Important 58.33 50.00 66.67 33.33 54.55 41.67 41.67 Somewhat
Important 16.67 41.67 16.67 41.67 9.09 16.67 16.67 Not at all
Important 0.00 0.00 8.33 0.00 9.09 8.33 8.33
Don't Know 0.00 0.00 0.00 8.33 9.09 8.33 8.33
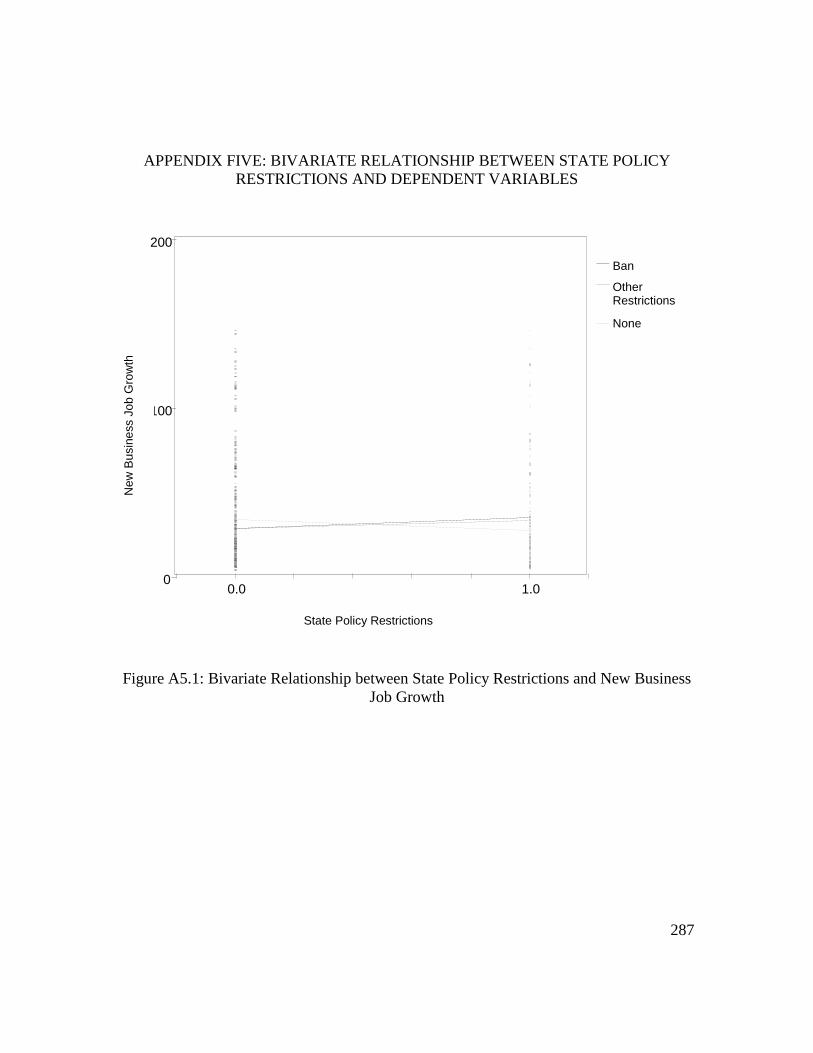
287
APPENDIX FIVE: BIVARIATE RELATIONSHIP BETWEEN STATE POLICY
RESTRICTIONS AND DEPENDENT VARIABLES
Figure A5.1: Bivariate Relationship between State Policy Restrictions and New Business
Job Growth
0
100
200
0.0 1.0
Ban
Other Restrictions
None
New
Bu
sin
ess J
ob G
row
th
State Policy Restrictions
New
Bu
sin
ess J
ob
Gro
wth
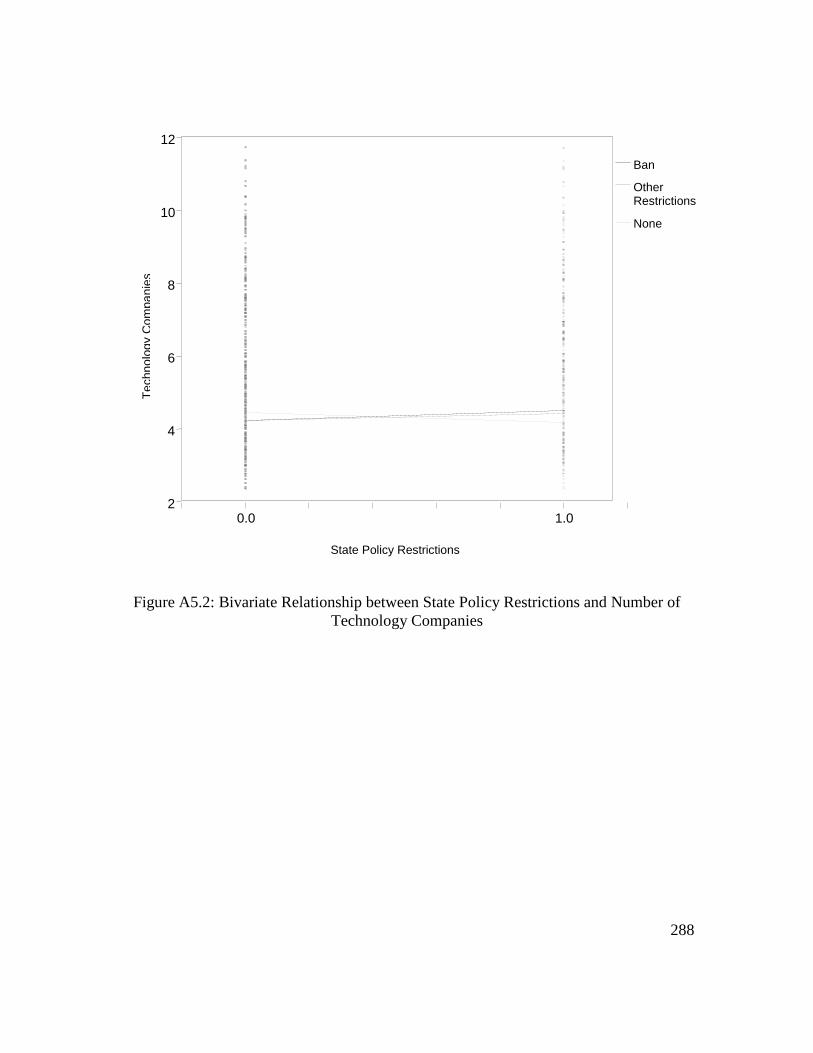
288
Figure A5.2: Bivariate Relationship between State Policy Restrictions and Number of
Technology Companies
2
4
6
8
10
12
0.0 1.0
Ban
Other Restrictions
None
Te
chn
olo
gy C
om
pa
nie
s
State Policy Restrictions
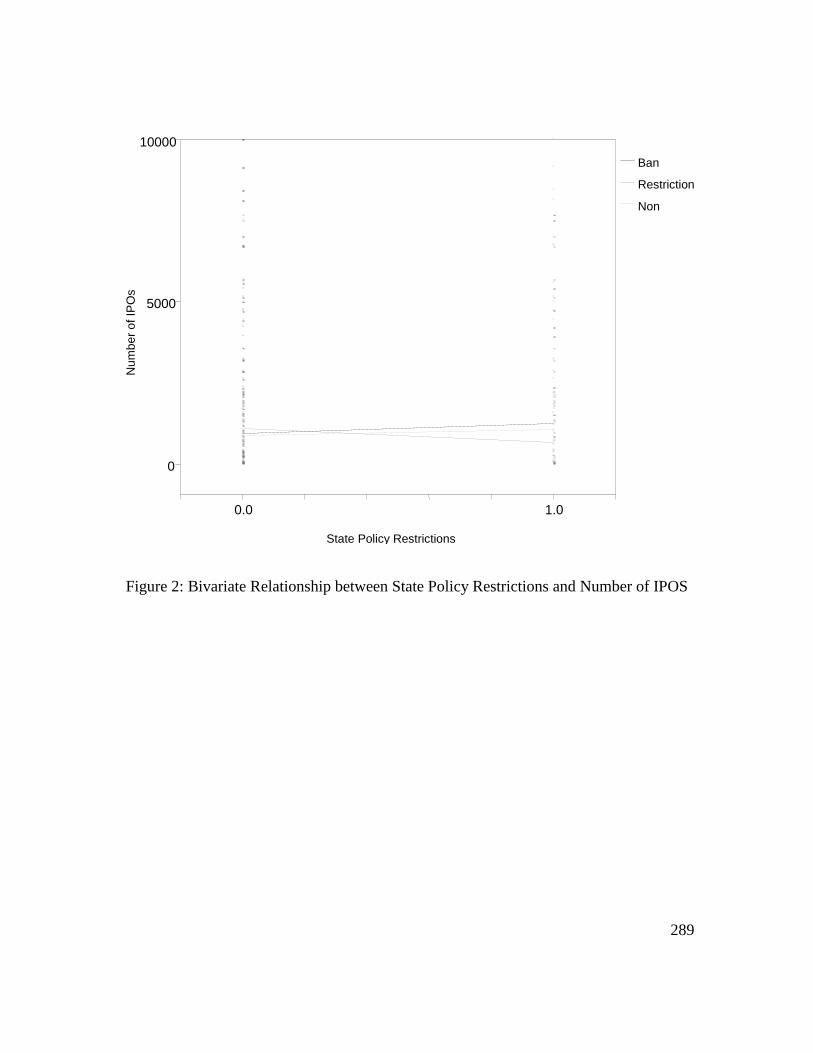
289
Figure 2: Bivariate Relationship between State Policy Restrictions and Number of IPOS
0
5000
10000
0.0 1.0
Ban
Restriction
None
State Policy Restrictions
Nu
mb
er
of
IPO
s
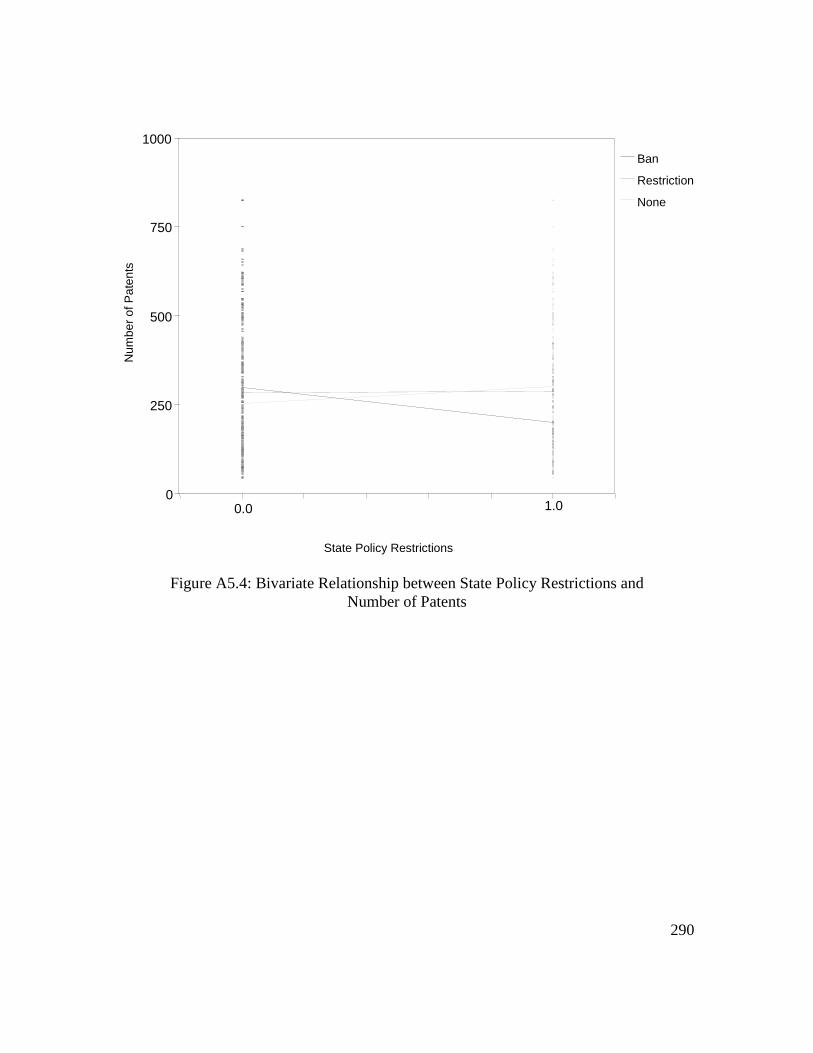
290
Figure A5.4: Bivariate Relationship between State Policy Restrictions and
Number of Patents
0
250
500
750
1000
0.0 1.0
Ban
Restriction
None
State Policy Restrictions
Nu
mb
er
of
Pa
ten
ts

291
APPENDIX SIX: ADDITIONAL REGRESSION MODELS
Table A6.1 presents the results for a random state/time fixed effects model with
the number of technology companies in a state as the dependent variable. The adjusted R-
squared is .879, which indicates a significant amount of the variation in the number of
technology companied is explained by this set of parameters. College attainment, federal
research and development, the percentage of households with computers, the number of
Table A6.1: Regression Estimates for Technology Companies
Term Estimate Std Error Prob>|t|
Intercept -1.522413 0.996572 0.1324
College Attainment 0.1955295 0.041455 <.0001*
Federal R&D 0.0010875 0.000444 0.0179* Percent Household
Computers 0.0555602 0.024518 0.0248*
Median Income -6.68E-05 2.42E-05 0.0067*
Patents 0.0015775 0.000679 0.0239*
Population Density -0.000794 0.000621 0.2063
Private Lending -4.13E-05 2.75E-05 0.1343
Private R&D 0.0003646 0.000163 0.0274*
2001 3.5038867 0.440564 <.0001*
2002 2.7369853 0.177374 <.0001*
2003 -4.177705 0.183189 <.0001*
2004 1.4616275 0.187313 <.0001*
2006 1.0797689 0.188726 <.0001*
Observations 350
RSquare 0.879279
RSquare Adj 0.873792
Root Mean Square Error 1.255211

292
patents, and private research and development all have a positive, statistically significant
relationship with the number of technology companies in a state. However, the median
income has a very small but negative, statistically significant relationship with the
number of technology companies in a state.
Table A6.2 presents the results for a random state/time fixed effects model with
the number of annual patents in a state as the dependent variable. The adjusted R-squared
is .982, which indicates a significant amount of the variation in the number of patents in a
state is explained by this set of parameters. The lowest state corporate tax rate, population
density, private research and development, royalties, and state income distribution are all
positive and statistically significant with the number of annual patents in a state.
However, the highest state corporate tax rate and long-term employment growth have
negative, statistically significant relationships with patent activity in a state.
Table A6.3 presents the results for a random state/time fixed effects model with
the number of new companies as the dependent variable. The adjusted R-squared is .905,
which indicates a significant amount of the variation in the number of new companies in
a state is explained by this set of parameters. This model uses the Ban ICT restriction
dummy and the interaction term of ban with the percentage of households with computers
was found to be significant. The results of these marginal effects reveal that a state with a
ban on local involvement in ICT policy efforts has a very small decrease in the number of
new companies reported annually compared to state without this ban. This confirms that
the ICT policy issue has layers of complexity that future research should consider
exploring. In this model high school attainment, the percentage of households with

293
computers, state income distribution, the number of patents, and venture capital all have a
positive, statistically significant relationship with the number of new companies in a
state. However, the percentage of businesses that provide health care for their employees
Table A6.2: Regression Estimates for State Patent Activity
Term Estimate Std Error Prob>|t|
Intercept 244.89954 46.14469 <.0001
Percent Business closings -1.884311 0.995342 0.0595
Corporate Taxes/Lowest 10.537066 3.300212 0.0016*
Corporate Taxes/ Highest -10.12506 3.341278 0.0027*
IPOs 0.0007235 0.000508 0.156
Long term employment growth -1.22708 0.46191 0.0084*
Median Income 0.0004373 0.000717 0.5423
Population Density 0.1965981 0.075954 0.0128*
Private R&D 0.0128863 0.004569 0.0052*
Royalties 0.3717055 0.176547 0.0363*
Income Distribution 0.129453 0.058989 0.0289*
2000 18.272607 3.633997 <.0001*
2001 11.627379 3.852948 0.0028*
2002 14.556268 3.38676 <.0001*
2003 1.6640595 3.630256 0.6471
2004 7.4899059 3.666752 0.0422*
2006 -11.49771 3.385501 0.0008*
University spinoffs -0.626514 0.628544 0.3199
Observations 350
RSquare 0.983363
RSquare Adj 0.982451
Root Mean Square Error 22.82213

294
and the state percentage in poverty have a negative, statistically significant relationship
with the number of new companies in a state.
Table A6.3: Regression Estimates for the Number of New Companies
Term Estimate Std Error Prob>|t|
Intercept -0.275889 2.753028 0.9202
Ban 0.5387665 0.398923 0.1794 Ban*Percent HHD with
Computers -0.009913 0.005137 0.0546
Corporate Taxes -0.05842 0.041525 0.1606
Health Care -0.069918 0.020225 0.0006*
High School Attainment 0.1017319 0.026301 0.0001*
Percent HHD With Computers 0.0498426 0.015817 0.0018*
Income Distribution 0.129453 0.058989 0.0289*
Patents 0.0011246 0.000604 0.0638
Poverty -0.117679 0.0463 0.0115*
2000 -0.275889 2.753028 0.9202
2001 1.2440028 0.228281 <.0001*
2002 0.9920806 0.228885 <.0001*
2003 0.2605217 0.090712 0.0044*
2004 -0.744619 0.123768 <.0001*
2006 -0.655601 0.120672 <.0001*
Venture Capital 0.0007716 0.000205 0.0002*
Observations 350
RSquare 0.909326
RSquare Adj 0.904969
Root Mean Square Error 0.637356

295
REFERENCES
Acs ZJ (2005) State of Literature on Small to Medium-Size Enterprises and
Entrepreneurship in Low-Income Communities. Paper Presentation at:
Entrepreneurship in Low and Moderate -Income Communities. The Federal
Reserve Bank of Kansas City and the Ewing Marion Kauffman Foundation,
Kansas City, MO: November 3-4.
Acs ZJ (2001) Endogenous Technological Change, Entrepreneurship and Regional
Growth, in Knowledge, Complexity, and Innovation Systems, eds. MM Fisher, J
Frohlich. Heibelberg. New York: Springer, Chapter 12: 228–247.
Acs ZJ, Armington C (2003) Endogenous Growth and Entrepreneurial Activities in
Cities. U.S. Bureau of the Census.
Acs ZJ, Armington C (2004a) The Geographic Differences in New Firm Formation and
Human Capital. Journal of Urban Economics 56(2): 244–329.
Acs ZJ, Armington C (2004b) Employment Growth and Entrepreneurial Activity in
Cities. Regional Studies 38: 879–877.
Acs ZJ, Armington C (2005) Using Census Bits to Explore Entrepreneurship,
Geography, and Economic Growth, Small Business Research Summary, No. 248.
Washington, DC: SBA, Office of Advocacy.
Acs ZJ, Armington C (2006) Entrepreneurship, Geography and American Economic
Growth. Cambridge: Cambridge University Press.
Acs ZJ, Braunerhjelm P, Audretsch DB, Carlsson B (2009) The Knowledge Spillover
Theory of Entrepreneurship. Small Business Economics 32(1):15–30.
Acs ZJ, Plummer LA (2005) Penetrating the ‗Knowledge Filter‘ in Regional Economies,
Annals of Regional Science 38: 1–18.
Acs ZJ, Storey DJ (2004) Entrepreneurship and Economic Development. Regional
Studies 38: 871–877.
Acs ZJ, Varga A (2005) Entrepreneurship, Agglomeration, and Technological Change
Small Business Economics 24(3) the ‗Knowledge Filter‘ in Regional Economies:
323–334.
Adirondack North Country Association (2005). Final Report: Enhanced Marketing and
Sale of Special Forest Products. NY, Saranac Lake. (November). 1–17.
Available at: [email protected]

296
Adkins D (2002) A Brief History of Business Incubation in the United States. Athens,
Ohio: NBIA Publications.
Adkins D (2004) “Focus on Synergy in Incubator.” A Comprehensive Guide to Business
Incubation. eds. M Erlewine, E Gerl. 2nd
edition, Athens, Ohio: NBIA
Publications, 81–83.
Adkins J (2006a) Study: Entrepreneurship Programs Continue to Expand. Inc.com,
www.inc.com/criticalnews/articles/200606/colleges.html (June 2, 2006).
Adkins J (2006b) New Curriculum Focuses on High-School Entrepreneurs. Inc.com,
www.inc.com/criticalnews/articles/200606/courses.html (June 1, 2006).
Adkins D, Sherman H, Yost CA (2001) Incubating in Rural Areas: Challenges and Keys
To Success. Athens, Ohio: NBIA Publications.
Aernoudt R (2004) Incubators: Tool for Entrepreneurship? Small Business Economics 23:
127–135.
Aerts K, Matthyssens P, Vandenbempt K (2007) Critical Role and Screening Practices of
European Business Incubators. Technovation 27(5): 254–267.
Agresti A (2007) An Introduction to Categorical Data Analysis. Hoboken, NJ: Wiley-
Interscience.
Alchian AA, Demsetz (1972) Production, Information Cost and Economic Organization.
American Economic Review 62: 777-795.
Allen DN (1988) Business Incubator Life Cycles. Economic Development Quarterly,
2(1): 19–29.
Allen DN, McCluskey R (1990) Structure, Policy, Services, and Performance in the
Business Incubator Industry. Entrepreneurship Theory & Practice 15: 61–77.
Allen DN, Rahman S (1985) Small Business Incubators: A Positive Environment for
Entrepreneurship. Journal of Small Business Management 23 (3):12–22.
Allen DN, Weinberg ML (1988) State Investment in Business Incubators. Public
Administration Quarterly 12: 196–215.
Anderson PM, Meyer BD (1994) The Extent and Consequence of Job Turnover.
Brookings Papers on Economic Activity: Microeconomics 177–248.

297
Andrade MH (1989) Promotion of Industrial Liaisons. In Partnership between Large
and Small Firms, ed. Commission of the European Communities. London:
Grahamand Trotman.
Anesi G, Eppich D, Taylor T (2002) Lines in the Sand: Four Corners Regional
Cooperation. In The New Power of Regions: A Policy Focus for Rural America,.
Proceedings of a conference sponsored by Federal Reserve Bank of Kansas City,
Center for the Study of Rural America, May 9-10.
Association of University Technology Managers, Inc., AUTM Licensing Surveys for
1999, 2000, 2001, 2002, 2003, 2004, 2006 and 2007. http://www.autm.net/Home.htm
Atkinson R, Castro D, Ezell SJ (2009) The Digital Road to Recovery: A Stimulus
Plan to Create Jobs, Boost Productivity and Revitalize America. Washington, DC:
The Information Technology and Innovation Foundation.
Audretsch D (1995) Innovation and Industry Evolution. Cambridge, MA: MIT Press.
Audretsch D (2002) The Dynamic Role of Small Firms: Evidence from the U.S. Small
Business Economics 18(1-3): 13–40.
Autio E, Hancock M (2005) Global Entrepreneurship Monitor High Expectation
Entrepreneurship 2005 Summary Report. London: Mazars, London Business
School and Babson College.
www.manzars.de/download/studien/GEM%20full%20report.pdf (Dec.19, 2006).
Bakouros YL, Marda DC, Varsakelia NC (2002) Science Park, A High Tech Fantasy? An
Analysis of the Science Parks of Greece. Technovation 22: 123–128.
Bar F, Cohen S, Cowhey P, DeLong B, Kleeman M, Zysman J (2000) Access and
Innovation Policy for the Third-Generation Internet. Telecommunications Policy,
24: 489–518.
Barker N (1994) The Internet as a Reach Generator for the Small Business. Dissertation
for Masters of Business Administration, School of Business, Durham University,
UK.
Barkley D (2003) Policy Options for Equity Financing for Rural Entrepreneurs. Main
Streets of Tomorrow: Growing and Financing Rural Entrepreneurs. Center for
the Study of Rural America, Federal Reserve Bank of Kansas City, 107–127.

298
Barkley DL, Henry MS, Lee D (2006) Innovative Activity in Rural Areas: The Role of
Local and Regional Characteristics. REDRL Research 05-2006-01, Regional
Economic Development Research Laboratory, Clemson University, Clemson, SC.
Available at http://cherokee.agecon.clemson.edu/re_e-pub.htm.
Barkley D L, Lamie RD, Markley DM (2007) Case Studies of E-Commerce Activity in
Small and Medium Sized Enterprises: A Review of the Literature. UCED
Working Paper 10-2007-01, EDA University Center for Economic Development.
Barkley DL, Markley DM, Freshwater D, Rubin JS, Shaffer R (2001) Establishing
Nontraditional Venture Capital Institutions: Lessons Learned. Rural Policy
Research Institute (RUPRI): 2001-11A.
Barrow, C., (2001) Incubators: A Realist’s Guide to the World’s Business Accelerators.
Chichester: Wiley.
Bartik TJ (1989) Small Business Start-Ups in the United States: Estimates of the Effects
of Characteristics of States, Southern Economic Journal 55(4): 1004–1018.
Basu S (1997) The conservatism principle and the asymmetric timeliness of earnings.
Journal of Accounting and Economics 24(1) 3–37.
Bates T (1993) ―Theories of Entrepreneurship.‖ In Theories of Local Economic
Development: Perspectives from Across Disciplines, eds. RD Bingham, R Mier.
London: Newbury Park and New Delhi: Sage, 248–264.
Beard TR, Ford GS (2003) ―Competition in Local and Long Distance
Telecommunications Markets.‖ In The International Handbook of
Telecommunications Economics, Vol. I: Traditional Telecommunications
Networks, ed. G Madden, (120–141). Cheltenham, UK: Edward Elgar.
Beck T, Demirgüç-Kunt A (2004) SMEs, Growth, and Poverty: Do Pro-SMEPolicies
Work? The World Bank. Public Policy for the Private Sector, Note No. 268.
http://rru.worldbank.org/Documents/PublicPolicyJournal/268-private.pdf.
Bergek A, Norman C (2008) Incubator Best Practice: A Framework. Technovation 28:
20–28.
Bhabra-Remedios RK Cornelius B (2003) ―Cracks in the Egg: Improving Performance
Measures in Business Incubator Research.‖ In: Small Enterprise Association of
Australia and New Zealand 16th
Annual Conference, Ballarat.
Birch DL (1987) Job Creation in America. New York: Free Press.

299
Bleaney M, Binks M, Greenaway D, Reed G, Whynes D (1992) What Does a University
Add to its Local Economy? Applied Economics 24: 305–311.
Bollingtoft A, Ulhoi JP (2005) The Networked Business Incubator—Leveraging
Entrepreneurial Agency? Journal of Business Venturing 20(2): 265–290.
Borgatti SP, Foster PC (2003) The Network Paradigm in Organizational Research: A
Review and Typology. Journal of Management 29(6): 991–1013.
Bosma N, Acs Z, Autio E, Coduras A, Levie J (2008) Global Entrepreneurship Monitor,
2008 Executive Report. Babson College, Universidad del Desarrallo, and London
Business School.
Bradshaw TK, Blakely EJ (1999) What are the ―Third-Wave‖ State Economic
Development Efforts? From Incentives to Industrial Policy. Economic
Development Quarterly 13(3): 229–244.
Brandow Company, Inc. (2001) Analysis of Business Formation, Survival, and Attrition
Rates of New and Existing Firms and Related Job Flows in Appalachia.
Appalachian Regional Commission.
http://www.arc.gov/images/reports/bizform/analysis-final.pdf.
Bresnahan T, Gambardella A (2004) Building High-Tech Clusters: Silicon Valley and
Beyond. Cambridge, UK: Cambridge University Press.
Bridgland J (2007) Personal Interview. Representative Piedmont Municipal Power
Association. 5 September.
Britton JNH (1989a) Innovation Policies for Small Firms. Regional Studies 23: 167–173.
Britton JNH (1989b) A Policy Perspective on Incremental Innovation in Small and
Medium Sized Enterprises. Entrepreneurship and Regional Development 1: 179–
190.
Brooks OJ (1986) Economic Development through Entrepreneurship: Incubators and the
Incubation Process. Economic Development Review 4: 24–29.
Brownrigg M (1973) The Economical Impact of A New University. Scottish Journal of
Political Economy 20(2): 123–139.
Brusco S (1989) A Policy for Industrial Districts. In Small Firms and Industrial Districts
in Italy, eds. E Goodman, J Bamford, P Saynor. London: Routledge.

300
Buckley P, Montes S (2002) Main Street in the Digital Age: How Small and Medium-
Sized Businesses Are Using the Tools of the New Economy. Economics and
Statistics Administration, U.S. Department of Commerce. Available at:
http://usinfo.org/enus/economy/technology/docs/DigitalAgePub.R1.pdf
Bureau of Labor Statistics, U.S. Department of Labor (2004) ―Low Pay and
Establishment Size,‖ Monthly Labor Review: The Editor‘s Desk, February 3.
Bureau of Labor Statistics, U.S. Department of Labor (2006) ―National Compensation
Survey: Employee Benefits in Private Industry in the United States,‖ March 2006,
/August.
Burnier D (1992) Becoming Competitive: How Policy Makers View Incentive-Based
Development Policy. Economic Development Quarterly 6: 14–24.
Burt RS (1992) Structural Holes: The Social Structure of Competition. Cambridge, MA:
Harvard University Press.
Cameron AC, Trivedi PK (2005) Microeconometrics, Methods and Applications. New
York, NY: Cambridge.
Campbell C, Allen DN (1987) The Small Business Incubator Industry: Micro-level
Economic Development. Economic Development Quarterly 1(2): 178–191.
Campbell C, Kendrick RC, Samuelson DS (1985) Stalking the Latent Entrepreneur:
Business Incubators and Economic Development. Economic Development Review
3(2): 43–49.
Carayannis EG, von Zedwitz M (2005) Architecting gloCal (global–local), Real–Virtual
Incubator Networks (G-RVINs) as Catalysts and Accelerators of Entrepreneurship
in Transitioning and Developing Economies: Lessons Learned and Best Practices
from Current Development and Business Incubation Practices. Technovation 25
(2): 95–110.
Chan KF, Lau T (2005) Assessing Technology Incubator Programs in the Science Park:
the Good, the Bad and the Ugly. Technovation 25(10): 1215–1228.
Chandler R (2010) ―Oconee County to Get $9.6 Million in Federal Funds for
Broadband.‖ Anderson (S.C.) Independent Mail.com (Aug. 18)

301
Chi K (1989) The States and Business Incentives: An Inventory of Tax and Financial
Incentive Programs, Washington, DC: Council of State Governments Lexington,
KY Vol. 3.
Chi K (1997) State Business Incentives: Trends and Options for the Future. Lexington,
KY: Council of State Governments, 1–6.
Christofides CA, Behr T, Neelakantan P (2001) A Retrospective of Pennsylvania’s
Economic Development Programs. Harrisburg, PA: Center for Rural
Pennsylvania.
Clarysse B, Wright M, Lockett A, Velde EVD, Vohora A (2005) Spinning Out New
Ventures: a Typology of Incubation Strategies from European Research
Institutions. Journal of Business Venturing 20(2): 183–216.
Coase R (1937) The Nature of the Firm. Economica 4:13–16.
Cohen SS, Zysman J (1987) Manufacturing Matters: The Myth of the Post-industrial
Economy, New York: Basic Books.
Collinson S, Gregson G (2003) Knowledge Networks for New Technology-based Firms:
an International Comparison of Local Entrepreneurship Promotion. R&D
Management 33 (2): 189–208.
Colombo MG, Delmastro M (2002) How Effective are Technology Incubators?:
Evidence from Italy. Research Policy 31(7): 1103–1122.
Colombo MG, Grilli L (2007) Technology Policy for the Knowledge Economy: Public
Support to Young ICT Service Firms. Telecommunications Policy, 31: 573–591.
Cooke P, Imrie R (1989) Little Victories: Local Economic Development in European
Regions. Entrepreneurship and Regional Development 1: 313–327.
Copps M (2002) Remarks of Michael Copps, Commissioner, FCC, at the Indian Training
Initiative, Phoenix, Arizona, September 19. Available at:
http://www.fcc.gov/Speeches/Copps/2002/spmjc212.html (August 5, 2003).
Cordeiro WP (2003) A Case Study: How a Retail Jewelry Store Learned to Compete in
the E-Commerce Market Place. Journal of Internet Commerce 2(1): 19-28.
Cordell A, Romanov PA (2005) Community Networking and Public Benefits. The
Journal of Community Informatics, 2(2).

302
Corporation for Enterprise Development. Development Report Card for the States, data
for 1999, 2000, 2001, 2002, 2003, 2004, 2006 and 2007. Available at:
www.cfed.org.
Cortright J (2001) New Growth Theory, Technology, and Learning: A Practitioner’s
Guide. Reviews of Economic Development Literature and Practice, No. 4,
Economic Development Administration, U.S. Department of Commerce.
Council of State Policy and Planning Agencies (CSPA) (1989. 101 Ideas for Stimulating
Rural Entrepreneurship and New Business Development. Washington, DC:
Council of State Policy and Planning Agencies.
Crandall R, Jackson, C (2001) The $500 Billion Opportunity: The Potential Economic
Benefit of Widespread Diffusion of Broadband Internet Access. Criterion
Economics, Washington, DC.
Crandall R, Jackson C, Singer H (2003) The Effects of Ubiquitous Broadband
Adoption on Investment, Jobs, and the U.S. Economy. Criterion Economics,
L.L.C. for the New Millennium Research Council, Washington D.C.
Crandall R, Lehr W, Litan R (2007) The Effects of Broadband Deployment on
Output and Employment: A Cross-sectional Analysis of U.S. Data. Issues in
Economic Policy, No. 6. Washington, DC: Brookings Institution (June).
Cummings S (1980) Self-help in Urban America: Patterns of Minority Economic
Development, Port Washington, NY: Kennikat.
Curran J, Jarvis R, Blackburn RA, Black S (1993) Networks and Small Firms:
Constructs, Methodological Strategies and Some Findings. International Small
Business Journal, 11(2):13–25.
Czernich N, Falck O, Kretschmer T, Woessman L (2009) Broadband
Infrastructure and Economic Growth (CESifo Working Paper No. 2861).
(December). Retrieved from www.ifo.de/DocCIDL/cesifo1_wp2861.pdf
Dabson B (2001) Supporting Rural Entrepreneurship. Exploring Policy Options for a
New Rural America, Conference Proceedings. Center for the Study of Rural
America, Federal Reserve Bank of Kansas City: 35–48.
Dabson B (2007) Entrepreneurship as a Rural Economic Development Policy: A
Changing Paradigm. In Entrepreneurship and Local Economic Development, ed.
N Walzer. Plymouth, UK: Lexington Books.
303
Dabson B, Malkin J, Mathews A, Pate K, Stickle S (2003) Mapping Rural
Entrepreneurship. Battle Creek, MI: Corporation for Enterprise Development for
the W. K. Kellogg Foundation.
Davis SJ (2002) Social Entrepreneurship: Towards an Entrepreneurial Culture for Social
and Economic Development, Ashoka: Innovators for the Public. Available at:
http://www.ashoka.com/global/yespaper.pdf.
Davis SJ, Haltiwanger JA, Jarmin, RS (2005) Understanding US Business Dynamics:
What Can Young, Small Firms Add? In Understanding Entrepreneurship: A
Research and Policy Report, 34–38. Kansas City, MO: Ewing Marion Kauffman
Foundation.
Davis SJ, Haltiwanger JA, Schuh S (1996) Small Business and Job Creation: Dissecting
the Myth and Reassessing the Facts. Small Business Economics 8(4): 297–315.
Deininger K (2003) Land Policies for Growth and Poverty Reduction, The World Bank
Policy Research Report No. 26384 (June 30).
Deming WE (1986) Out of the Crisis. Cambridge, MA: MIT Press.
Dent Jr. HS, (1990) Corporation of the Future - How Strategic Alliances and Networking
Will Reshape the 90s. Small Business Reports, May: 55–63.
Dettwiler P, Lindelvf P, Lvfsten H (2006) Utility of Location: A Comparative Survey
Between Small New Technology-based Firms Located on and off Science Parks:
Implications of Facilities Management. Technovation 26(4): 506–517.
DiMaggio P, Hargittai E, Neumann W, Robinson J (2001) Social Implications of the
Internet. Annual Review of Sociology 27: 307–336.
Dixon T, Thompson B, McAllister P (2002b) The value of ICT for SMEs in the UK: A
Critical Review of Literature, Report for the Small Business Service Research
Programme. College of Estate Management, UK.
Dow Jones VentureOne. Venture Capital Industry Reports for 1999, 2000, 2001, 2002,
2003, 2004, 2006 and 2007. San Francisco, California.
Drabenstott M, Henderson J (2006) A New Rural Economy: A New Role for Public
Policy. The Main Street Economist, The Federal Reserve Bank of Kansas City,
1(4): 1–6.

304
DTI (Department of Trade and Industry) (2001) Business in the Information Age:
International Benchmarking Report. London, UK, Department of Trade and
Industry.
DTI (2003) Economic Impact Study of the South Dundas Township Fibre Network.
London, UK, Department of Trade and Industry.
Dumas G, Ellison G, Glaeser E (2002) Geographic Concentration as a Dynamic Process.
The Review of Economics and Statistics LXXXIV (2): 193–204.
Dun & Bradstreet (2001) 20th Annual Small Business Survey Summary Report, August
14. Available at: www.dnb.com/smallbusiness.
Duranton, G, Puga D (2001) Nursery Cities. American Economic Review 91: 1454–1477.
Eberts R, Erickcek G, Kleinhenz J (2005) Dashboard Indicators for the Northeast Ohio
Economy: Prepared for the Fund for Our Economic Future. Working Paper 06/05,
Federal Reserve Bank of Cleveland. Available at: www.clevelandfed.org/research
Economist Magazine (2009) Global Heroes: A Special Report on Entrepreneurship, May
14, print edition, 20 pp.
Edgcomb EL, Klein JA, Black D (2008) Revitalizing Rural Economies through
Entrepreneurship Development Systems, Microenterprise FIELD, The Aspen
Institute, December, 127 pp.
Edmiston K (2007) The Role of Small and Large Businesses in Economic Development,
Kansas City, MO: The Federal Reserve Bank of Kansas City.
http://www.kc.frb.org/PUBLICAT/ECONREV/PDF/2q07edmi.pdf
Eisinger P (1991) The State of State Venture Capitalism, Economic Development
Quarterly 5: 64–76.
Eisinger P (1998) The Rise of the Entrepreneurial State: State and Local Economic
Development Policy in the United States. Madison,WI: University of Wisconsin
Press.
European Commission, E.G. (2002a) Benchmarking of Business Incubators. (February)
Brussels. 47 pp.
European Commission (2002b) Towards a Knowledge-based Europe: The European
Union and the Information Society. Brussels.

305
European Commission (2002c) Benchmarking National and Regional E-Business
Policies for SMEs, Final Report of the E-Business Policy Group of the European
Union, 28 June. 44 pp.
Fabel O (2003) Spin-offs of Entrepreneurial Firms: An O-ring approach,
Diskussionspapier Nr. 03/03, Centre for European Economic Research.
Fannin J, Matthew DW, Hughes WK, Williams O, Jimine G (2008) Deepwater Energy
Industry Impacts on Economic Growth and Public Service Provision in Lafourche
Parish, Louisiana. Socio-Economic Planning Sciences 42(3): 190–205.
Federal Communications Commission (2010). The Sixth Broadband Deployment Report.
Washington, DC (July). Available at:
http://transition.fcc.gov/Daily_Releases/Daily_Business/2010/db0720/FCC-10-
129A1.pdf
Federation of Tax Administrators, Corporate Income Tax Rates. Available at:
http://www.taxadmin.org/fta/rate/corp_inc.pdf
Feldman MP, Audretsch DB (1999) Innovation in Cities: Science-based Diversity,
Specialization, and Localized Competition. European Economic Review 43:409–
429.
Feser E (2007) Encouraging Broadband Deployment from the Bottom Up. Regional
Analysis and Policy, 37(1): 69–72.
Ferguson C (2002) The United States Broadband Problem: Analysis and
Recommendations. Washington, DC: Brookings Institution.
Firth L, Mellor D (2002) The Importance of ICT Visions for Information Society in
South East Asia. ACIS Conference, Melbourne, December 4–6.
Firth L, Mellor D (2005) Broadband: Benefits and Problems. Telecommunications Policy
29 (2-3): 223–236.
Florida R (2002) The Rise of the Creative Class. New York: Basic Books.
Florida R, Kenney M (1988a) Venture Capital, High Technology and Regional
Development. Regional Studies 22: 33–48.
Florida R, Kenney M (1988b) Venture Capital Financed Innovation and Technological
Change in the USA. Research Policy 17: 119–137.

306
Foley P, Ram M (2002) The Use of Online Technology by Ethnic Minority Businesses: A
Comparative Study of the West Midlands and UK. De Montfort University,
Leicester. Available at: www.sbs.gov.uk/content/research/EMB_IT.pdf
Ford D, Gadde L, Hakansson H, Lundgren A, Turnbull P, Wilson D, Snehota I (1988). In
Managing Business Relationships, ed. D. Ford, Chichester: Wiley.
Ford GS (2005) Does Municipal Supply of Communications Crowd-Out Private
Communications Investment? An Empirical Study. Applied Economic Studies,
February, 1–12.
Ford GS, Koutsky TM (2005) Municipal Broadband Networks and Economic
Development: A Case Study from Florida. Applied Economic Studies, April: 1–
17.
Fornengro G (1988) Manufacturing Networks. Telematics in the Automotive Industry. In
New Information Technology: The Italian Case, ed. C. Antonelli. Dordrecht,
Netherlands: Kluwer.
Foster C, Neuburger H (1999) The Ambiguity of the Consumer‘s Surplus Measure of
Welfare Change. In Public Intervention in Entrepreneurial Innovation and
Opportunism: Short Cuts or Detours to The Information Superhighway? Eds. J
Creedy, T Fuller, A Jenkins. Babson Entrepreneurship Conference, London
Business School, London, U.K., 9-13 April 1995.
Fox WF, Murray MN (1990) Local Public Policies and Interregional Business
Development. Southern Economic Journal 57(2): 413–427.
Freear J, Sohl JE, Wetzel WE (1996) Creating New Capital Markets for Emerging
Ventures. U.S. Small Business Administration, Office of Advocacy, June.
Friedman RE (1986) Entrepreneurial Renewal in the Industrial City. Annals of the
American Academy of Political and Social Science 488: 35–46.
Fry, FL (1987) The Role of Incubators in Small Business Planning. American Journal of
Small Business 12(1): 51–61.
Fuller T, Jenkins A (1995) Public Intervention in Entrepreneurial Innovation and
Opportunism: Short Cuts or Detours to The Information Superhighway? Babson
Entrepreneurship Conference, London Business School, London, U.K., 9-13
April.

307
Furukawa K, Teramoto Y, Kanda M (1990) Network Organization for Inter-firm R & D
Activities: Experiences of Japanese Small Businesses. International Journal of
Technology Management 5(1): 27–40.
Garfoli G (1990) Local Development: Patterns and Policy Implications. In Technological
Development at the Local Level, eds. RCappellin, P Nijkamp. Aldershot:
Avebury.
Gerber ME (1995) The E-Myth Revisited: Why Most Small Businesses Don’t Work and
What to Do about It. New York: HarperCollins.
Gibb JM, ed. 1985 Science Parks and Innovation Centers: Their Economic and Social
Impact. Amsterdam: Elsevier.
Gillett SE, Lehr WH, Osorio CA (2004) Local Government Broadband Initiatives.
Telecommunications Policy 28: 537–558.
Gillett SE, Lehr WH, Osorio CA (2006) Municipal Electric Utilities Role in
Telecommunications Services. Telecommunications Policy 30: 464–480.
Gillett SE, Lehr WH, Osorio CA, Sirbu MA (2006) Measuring the Economic Impact of
Broadband Deployment; Final Report, National Technical Assistance, Training,
Research, and Evaluation. Project #99-07-13829, Economic Development
Administration, U.S. Department of Commerce, Washington, DC.
Gittell R, Thompson P (1999) Inner City Business Development and Entrepreneurship:
New Frontiers for Policy and Research. In Urban Problems and Community
Development, eds. R Ferguson, WT Dickens. Washington, DC: Brookings
Institution Press.
Gladwin CH and others (1989) Rural Entrepreneurship: One Key to Rural Revitalization.
American Journal of Agricultural Economics, 71(5): 1305–1314.
Glaeser EL (2000) ―The New Economics of Urban and Regional Growth.‖ Chapter 5:
83-98 in The Oxford Handbook of Economic Geography.
Glaeser EL, Kallal HD, Scheinkman JA, Shleifer A (1992) Growth in Cities. Journal of
Political Economy 100(6), 1126–1152.
Glaeser EL, Scheinkman JA, Shleifer A (1995) Economic Growth in a Cross-Section of
Cities. Journal of Monetary Economics 36: 117–143.

308
Glickman NJ, Servon LJ (2009) By the Numbers: Measuring Community Development
Corporations‘ Capacity. Journal of Planning Education and Research 22: 240–
256.
Goetz SJ, Partridge M., Deller SC, Fleming DA (2010) Evaluating U.S. Rural
Entrepreneurship Policy. Journal of Regional Analysis and Policy 40(1): 20–33.
Golden PA, Dollinger M (1993) Cooperative Alliances and Competitive Strategies in
Small Manufacturing Firms. Entrepreneurship Theory and Practice, Summer:
43–56.
Goldstein HA, Luger MI (1990) Science/Technology Parks and Regional Development
Theory. Economic Development Quarterly 4: 64–78.
Gower SM, Harris FC (1994) The Funding of, and Investment in, British Science Parks:
A Review. Journal of Property Finance 5(3): 7–18.
Granovetter MS (1973) The Strength of Weak Ties, The American Journal of Sociology
78(6): 1360-80.
Greene WH (2000) Econometric Analysis. Upper Saddle River, NJ: Prentice-Hall.
Grimaldi R, Grandi A (2005) Business Incubators and New Venture Creation: An
Assessment of Incubating Models. Technovation 25(2): 111–121.
Groothuis PA (1994) Turnover: The Implications of Establishment Size and
Unionization‖ Quarterly Journal Of Business and Economics 33(2) 41–53.
Hackett SM, Dilts DM (2004) A Systematic Review of Business Incubation Research.
Journal of Technology Transfer 29: 55–82.
Hallberg K (2000) A Market-Oriented Strategy for Small and Medium-Scale Enterprises.
Discussion Paper No. 40. The World Bank—International Finance Corporation,
Washington, DC.
Halpern D (2009) The Hidden Wealth of Nations. Cambridge, UK: Polity.
Hannon PD (2005) Incubation Policy and Practice: Building Practitioners and
Professional Capability. Journal of Small Business and Enterprise Development
12(1): 57–78.

309
Hannon PD, Chaplin P (2003) Are Incubators Good for Business? Understanding
Incubation Practice-The Challenges for Policy. Environment and Planning C21:
861–881.
Hansen MT, Chesborough HW, Nohira N, Sull DN (2000) Networked Incubators:
Hothouses of the New Economy. Harvard Business Review 78(5): 74–84.
Hansson MT, Husted K, Vestergaard J (2005) Second Generation Science Parks: From
Structural Holes Jockeys to Social Capital Catalysts of the Knowledge Economy.
Technovation 25: 1039–1049.
Henderson, JV (1986) Efficiency of Resource Usage and City Size. Journal of Urban
Economics 19: 47–70.
Henderson JV (2002) Building the Rural Economy with High Growth Entrepreneurs,
Economic Review (3rd
Quarter): 45–70. Kansas City, MO: Federal Reserve Bank
of Kansas City.
Henderson JV (2003) Marshall‘s Scale Economies. Journal of Urban Economics 53:1–
28.
Henderson JV (2004) Who Are the Rural Entrepreneurs? Paper presented to the North
American Regional Science Association International Meeting. Seattle, WA. November
11-13.
Henderson JV, Kuncoro A, Turner M (1995) Industrial development of cities. Journal of
Political Economy 103: 1067–1090.
Henderson J, Low SA, Weiler S (2007) ―The Drivers of Regional Entrepreneurship in
Rural and Metro Areas.‖ In Entrepreneurship and Local Economic Development,
ed. N Walzer. Plymouth, UK: Lexington Books.
Hisrich RD (1988) New Business Formation through the Enterprise Development Center:
A Model for New Venture Creation. IEEE Transactions on Engineering
Management EM 35(4): 221–231.
Honadle BW (1990) Business Incubators as An Economic Development Tool:
Cooperative Extension Programming Responds. Economic Development Review
Winter: 42–43.
Horgren T (2001) Briefing for the Changing Workplace, Using a Process Architecture to
Transform the Work Environment, Managing the Brief for a Better Design.
London: Spon.

310
Hsu P, Shyu JZ, Yu H, Yuo C, Lo T (2003) Exploring the Interaction between Incubators
and Industrial Clusters: The Case of the Itri Incubator in Taiwan. R&D
Management 33(1): 79–90.
Hu Y, Korneliussen T (1997) The effects of personal ties and reciprocity on the
performance of small firms in horizontal strategic alliances. Scandinavian Journal
of Management 13(2): 159–173.
Hull CJ (1990) Information and Consulting as Instruments of Regional Development
Policy: The Role of Public Agencies. In Innovation and Regional Development:
Strategies, Instruments and Policy Coordination, eds. HJ Ewers, J Allesch.
Berlin: Walter de Gruyter.
Hustedde R (2007) What‘s Culture Got to Do With It? Strategies for Strengthening an
Entrepreneurial Culture. In Entrepreneurship and Local Economic Development,
ed. N Walzer. Plymouth, UK: Lexington Books.
Innovation and Information Consultants (IIC), Inc. (2006) An Empirical Approach to
Characterize Rural Small Business Growth and Profitability. Prepared for the
SBA, Office of Advocacy, Concord, MA: IIC, Inc.
International City/County Management Association (2004) 2004 Economic Development
Survey. Available at: http://icma.org.
IPO Activity by State, Thomson Financial Securities Data, 1999, 2000, 2001, 2002, 2003,
2004, 2006 and 2007. Available at: http://thomsonreuters.com/
Jacobs J (1969) The Economy of Cities. New York: Random House.
Johannisson B (1987) 'Network Strategies: Management Technology for
Entrepreneurship and Change. International Small Business Journal,(5)1:19–30.
Johansson B, Quigley JM (2004) Agglomeration and Networks in Spatial Economies.
Papers in Regional Science 83:165–176.
Julian PA (2007) A Theory of Local Entrepreneurship in the Knowledge Economy.
Northampton, MA: Edward Elgar Publishing.
Karlsson C, Manduchi A (2001) ―Knowledge Spillovers in a Spatial Context.‖ In
Knowledge, Complexity and Innovation Systems,eds. M Fischer, J Fröhlich.
Berlin: Springer-Verlag.

311
Katz RL, Avila J, Meille G (2010) Economic Impact of Wireless Broadband in Rural
America. Telecom Advisory Services, LLC.
Kayne J (1999) State Entrepreneurship Policies and Programs, Kauffman Center for
Entrepreneurial Leadership. The Ewing Marion Kauffman Foundation, Kansas
City, Missouri.
Kelly MR, Brooks H (1989) From Breakthrough to Follow Through. Issues in Science
and Technology 5(3): 42–47.
King W, Hufnagel E, Grover V (1988) ―Using Information Technology for Competitive
Advantage.‖ In Information Management: The Strategic Dimension, ed. M Earl.
Oxford, UK: Clarendon Press, 75–86.
Klein MU, Hadjimichael B (2003) The Private Sector in Development: Entrepreneurship,
regulation, and competitive disciplines. Washington, DC: The World Bank. Also
available online at
http://wwwwds.worldbank.org/servlet/WDSContentServer/WDSP/IB/2003/07/26/
000094946_03071204032945/Rendered/PDF/multi0page.pdf.
Kotelnikov V. Ten3 Business e-Coach.
http://www.1000ventures.com/business_guide/business_incubators_main.html
Kremer M (1993) The O-ring Theory of Economic Development. Quarterly Journal of
Economics 108(3):551–556.
Kretzman JP, McKnight JL (1993) Building Communities from the Inside Out: A Path
Toward Finding and Mobilizing Communities Assets. Chicago, IL: ACTA
Publications.
Krugman P (1991) Geography and Trade. Cambridge, MA: MIT Press.
Kuratko DF, La Follette WR (1987) Small Business Incubators for Local Economic
Development, Economic Development Review 5(2) 49–55.
Lalkalka D (2003) ―Current Trends in Business Incubation.‖ In: The Africa Regional
Conference on Business Incubation, Bagamayo, Tanzania, 2-4 December.
Lee SY, Florida R, Acs ZJ (2004) Creativity and Entrepreneurship: A Regional Analysis
of New Firm Formation. Regional Studies 38(8), 879–891.
Lewis R (2004) Planned Industrial Districts in Chicago: Firms, Networks, and
Boundaries. Journal of Planning History 3:29–49.

312
Lichtenstein GA (1992) The Significance of Relationships in Entrepreneurship: A Case
Study of the Ecology of Enterprise in Two Business Incubators, Unpublished
Dissertation, and Philadelphia: University of Pennsylvania.
Lichtenstein GA, Lyons TS (2001) The Entrepreneurial Development System:
Transforming Business Talent and Community Economies. Economic
Development Quarterly 15(3): 3–20.
Lichtenstein GA, Lyons T (2006) Managing the Community‘s Pipeline of Entrepreneurs
and Enterprises: A New Way of Thinking About Business Assets. Economic
Development Quarterly 20(4): 377–386.
Lichtenstein GA, Lyons T (2010) Investing in Entrepreneurs. Santa Barbara, CA:
Greenwood.
Lichtenstein GA, Lyons TS, Kutzhanova N (2004) Building Entrepreneurial
Communities: The Appropriate Role of Enterprise Development Activities.
Journal of the Community Development Society 35(1): 5–24.
Lockett A, Wright M (2005) Resources, Capabilities, Risk Capital, and the Creation of
University Spin-out Companies. Research Policy 34:1043–1057.
Loesch A (1954) The Economics of Location. New Haven: Yale University Press.
Lofsten H, Lindelof P (2004) Utility of Location: A Comparative Survey Between Small
New Technology-based Firms Located on and off Science Parks—Implications
for Facilities Management. Technovation 26(4): 506–517.
Lofsten H, Lindelof P ( 2001) Science Parks in Sweden—Industrial Renewal and
Development? R&D Management 17: 25–38.
Lorenzoni G, Lipparini A (1999) The leveraging of interfirm relationships as a distinctive
organizational capability: A longitudinal study. Strategic Management Journal
20(4): 317–338.
Loveridge S, Nizalov D (2007) Operationalizing the Entrepreneurial Pipeline Theory: An
Empirical Assessment of the Optimal Size Distribution of Local Firms. Economic
Development Quarterly 21(3): 244–262.
Low M (2001) The Adolescence of Entrepreneurship Research: Specification of Purpose.
Entrepreneurship Theory and Practice 25(4): 17–25.

313
Luger MI, Goldstein, A. (1991) Technology in the Garden: Research Parks in Regional
Economic Development. Chapel Hill: University of North Carolina Press
Lumpkin JR, Ireland RD (1988) Screening Practices of New Business Incubators: The
Evaluation of Critical Success Factors. American Journal of Small Business 12
(4): 59–81.
Lundström A, Stevenson L (2005) Entrepreneurship Policy: Theory and Practice.
Boston: Kluwer Academic Publishers.
Lyons, TS (2002) The Entrepreneurial League System: Transforming Your Community‘s
Economy through Enterprise Development. Washington, DC: Appalachian
Regional Commission.
Lyons TS, Li S (2003) The State of the Wisconsin Incubation Industry in 2002: An
Analysis of the Results of the Survey of Membership. Report prepared for The
Wisconsin Business Incubator Association, August 2003.
Lyons TS, Lichtenstein GA, Kutzhanova N (2007) What Makes a Successful
Entrepreneur? In Entrepreneurship and Local Economic Development, ed. N
Walzer, Plymouth, UK: Lexington Books.
Maillat D, Vasserot JY (1988) Economic and Territorial Conditions for Indigenous
Revival in Europe‘s Industrial Regions. In High Technology Industry and
Innovative Environments: The European Experience, eds. P Aydalot, D Keeble.
London: Routledge.
Malecki EJ (1990) New Firm Formation in the USA: Coporate Structure, Venture
Capital, and Local Environment. Entrepreneurship and Regional Development 2:
247–265.
Malecki EJ (1994) Entrepreneurship in Regional and Local Development. International
Regional Science Review 16: 119–153.
Malecki EJ (2004) Jockeying for Position: What it Means and Why it Matters to Regional
Development Policy When Places Compete. Regional Studies 38(9): 1101–1120.
Markley DM, McNamara KT (1995a) Business Incubators: A Local Development
Option. Choices 3rd Quarter: 13–16.
Markley DM, McNamara KT (1995b) Economic and Fiscal Impacts of a Business
Incubator. Economic Development Quarterly 9(3): 273–278.

314
Markley D, Pages E, Dabson B, Johnson T, Lawrence S, Yanosy S, Dabson K (2008)
Creating an Entrepreneurial Appalachian Region: Findings and Lessons from an
Evaluation of the Appalachian Regional Commission‘s Entrepreneurship
Initiative: 1997–2005, RUPRI Center for Rural Entrepreneurship, December,
17pp.
Markman G, Phillip P, Balkan D, Ganoids P (2005) Entrepreneurship and University-
based Technology Transfer. Journal of Business Venturing 20(2): 241–263.
Marshall A (1919) Industry and Trade. London, Macmillan.
Mayer HJ, Greenberg MR (2008) Coming Back From Economic Despair: Case Studies
of Small and Medium-Size American Cities. Economic Development Quarterly,
15(3), 203–216.
Mazzonis D (1989) Networking Cooperation and Innovation Among Small Firms in
Italy: The view from the agency engaged in action for stimulating the
technological upgrading of industry. Entrepreneurship and Regional Development
1: 61–74.
McAdam M, McAdam R (2006) The Networked Incubator: The Role and Operation of
Entrepreneurial Networking with the University Science Park Incubator (USI).
International Journal of Entrepreneurship and Innovation 7(2): 87–97.
McCann P, Shefer D (2004) Location, Agglomeration, and Infrastructure. Papers in
Regional Science 83: 177–196.
McMahan K, Salant P (1999) Strategic Planning for Telecommunications in Rural
Communities. Rural Development Perspectives 14(3), USDA Economic Research
Service, Washington DC. Available at:
http://www.ers.usda.gov/publications/rdp/rdpoct99/rdpoct99a.pdf.
Mian SA (1996a) Assessing Value-added Contributions of University Technology
Business Incubators to Tenant Firms. Research Policy 25(3): 325–335.
Mian SA (1996b) The University Business Incubator: A Strategy for Developing New
Research/Technology-based Firms. The Journal of High Technology Management
Research 7(2): 191–208.
Mills RJ, Bhandari S (2003) Health Insurance Coverage in the United States: 2002, US
Census Bureau. Current Population Reports, September.

315
Mitchell, M. (2010). Breaking the Broadband Monopoly. Minneapolis, MN: The New
Rules Project.
Mody A (1999) ―Industrial Policy after the East Asian Crisis: From Outward Orientation
to New Internal Capabilities?‖ The World Bank, Policy Research Working Paper
Series 2112.
Monck CSP, Porter RB, Quintas P, Storey DJ, Wynarczyk P (1988) Science Parks and
the Growth of High Technology Firms. London: Croom Helm.
Monsted M (2003) Strategic Networking in Small High-Tech Firms. Copenhagen:
Samfundslitteratur.
Nakamura R (1985) Agglomeration Economies in Urban Manufacturing Industries: A
Case Study of Japanese Cities. Journal of Urban Economics 17:108–124.
National Association of State Development Agencies (1998) State Economic
Development Expenditure Survey. Washington, DC: NASDA.
National Business Incubation Association (NBIA) (2005) Business Incubators' Role in
Local and Regional Economic Development. Athens, Ohio: NBIA Publications.
NBIA website: http://www.nbia.org
National Commission on Entrepreneurship (NCOE) (2001a) Building Entrepreneurial
Networks. December.
National Commission on Entrepreneurship (NCOE) (2001b) High Growth Companies:
Mapping America’s Entrepreneurial Landscape, July.
National Governors Association (NGA) (2004) A Governor’s Guide to Strengthening
State Entrepreneurship Policy. Washington, DC: NGA.
National Science Foundation, Division of Science Resources Statistics. Characteristics of
Doctoral Scientists and Engineers in the United States. Data reviewed for 1999,
2000, 2001, 2002, 2003, 2004, 2006 and 2007.
National Science Foundation, Division of Science Resources Statistics. NSF-NIH Survey
of Graduate Students and Post doctorates in Science and Engineering. Data
reviewed for 1999, 2000, 2001, 2002, 2003, 2004, 2006 and 2007.
Nelson A (1993) Theories of Regional Development. In Theories of Local Economic
Development, eds. R Bingham, R Mier. California or London??? :Sage: 27–79.

316
Nemes S, Jonasson JM, Genell A, Steineck G (2009) Bias in Odds Ratios by Logistic
Regression Modeling and Sample Size, BMC Medical Research Methodology
9:56, BioMedCentral. http://www.biomedcentral.com/1471-2288/9/56.
Nohria N, Eccles R (1992) Networks and Organizations: Structure, Form and Action.
Boston: Harvard Business School Press.
Nouria S, Klofsten M, Dahlstrand A (2005) The Logic of the Entrepreneur: Implications
of the Entrepreneur‘s Perception of Early-Stage Financing. International Journal
of Entrepreneurship and Innovation 6(2): 85–96.
Nugent JB, Yhee S-J (2002) Small and Medium Enterprises in Korea: Achievements,
Constraints, and Policy Issues. Small Business Economics 18(1-3): 85–119.
Oerlemans L, Meeus M, Boekema F (2001) Firms Clustering and Innovation:
Determinants and Effects. Papers in Regional Science 80: 337–356.
Organisation for Economic Co-operation and Development (OECD) (1993) Small and
Medium-sized Enterprises: Technology and Competitiveness. Paris: OECD.
Organisation for Economic Co-operation and Development (OECD) (1997) Small
Businesses, Job Creation, and Growth: Facts, Obstacles, and Best Practices,
Paris: OECD. http://www.oecd.org/dataoecd/10/59/2090740.pdf.
Organisation for Economic Co-operation and Development (OECD) (1997) Technology
Incubators: Nurturing Small Firms. OCDE/GD (97) 202. Paris: OECD.
Organisation for Economic Co-operation and Development (OECD) (1999) Business
Incubation, International Case Studies. Paris: OECD.
Organisation for Economic Co-operation and Development (2003) Entrepreneurship and
Local Economic Development: Programme and Policy Recommendations. Paris:
OECD.
Organisation for Economic Co-operation and Development (OECD) (2008) Measuring
Entrepreneurship: A Digest of Indicators. OECD Eurostat Entrepreneurship
Program, Paris: OECD, 28pp.
Pages ER (2006) Entrepreneurship Policy Innovation and Performance Measurement in
the States. Paper Presented at: Exploring Rural Entrepreneurship: Imperatives and
Opportunities for Research, Washington, DC.

317
Pages ER, Poole K (2003) Understanding Entrepreneurship as an Economic
Development Strategy: A Three State Survey. A Joint Project of the National
Commission on Entrepreneurship and The Center for Regional Competitiveness,
Washington, DC.
Papacharissi Z, Zaks A (2006) Is Broadband the Future? An Analysis of Broadband
Technology Potential and Diffusion. Telecommunications Policy 30: 64–75.
Papadaki E, Chami B (2002) Growth Determinants of Micro-Businesses in Canada.
Small Business Policy Branch (July): 1–50.
Parker R (2002) Coordination and Competition in Small Business Policy: a Comparative
Analysis of Australia and Denmark. Journal of Economic Issues 36(4): 935–52.
Patek V (1992) Broadband Convergence: A View of the Regulatory Barriers.
Telecommunications Policy 16(2): 98–104.
Peduzzi P, Concato J, Kemper E, Holford TR, Feinstein AR (1996) A Simulation Study
of the Number of Events per Variable in Logistic Regression Analysis. Journal of
Clinical Epidemiology 49(2): 1373–1379.
Peters L, Rice M, Sundararajan M (2004) The Role of Incubators in the Entrepreneurial
Process. Journal of Technology Transfer 29(1): 83–91.
Pew Research Center, The Pew Internet and American Life Project (2009) Home
Broadband Adoption (June) Available at:
http://www.pewinternet.org/Reports/2009/10-Home-Broadband-Adoption-
2009.aspx.
Phan PH, Siegel DS, Wright M (2005) Science Parks and Incubators: Observations,
Synthesis and Future Research. Journal of Business Venturing 20(2) 165–182.
Phillips RG (2002) Technology Business Incubators: How Effective as Technology
Transfer Mechanisms? Technology in Society 24(3): 299–316.
Picot A, Wernick C (2007) The Role of Government in Broadband Access.
Telecommunications Policy 31: 660–674.
Piore MJ, Sabel CF (1984) The Second Industrial Divide. New York: Basic Books.
Plosila W, Allen DN (1985) Small Business Incubators and Public Policy: Implications
for States and Local Development Strategies. Policy Studies Journal 13:729–734.

318
Pociask S (2002) Building a Nationwide Broadband Network: Speeding Job Growth.
White paper prepared for New Millenium Research Council by TeleNomic
Research, FILL IHN.
Porter ME (1998) ―The Competitive Advantage of the Inner City‖ in On Competition.
Boston: Harvard Business School Publishing, 377–408.
Porter ME (2000) Location, Competition, and Economic Development: Local Clusters in
a Global Economy. Economic Development Quarterly 14:15–34.
Porter ME (2001) Clusters of Innovations: Regional Foundations of U.S.
Competitiveness. Washington, DC: Council on Competitiveness.
Prieger J (2003) The Supply Side of the Digital Divide: Is There Equal Availability in the
Broadband Internet Access Market? Economic Inquiry 41(2): 346–363.
Pulver GC (1986) Community Economic Development Strategies. Madison WI:
Department of Agricultural Journalism, University of Wisconsin-Madison.
Putnam RD (2000) Bowling Alone; The collapse and revival of American community.
New York: Simon and Schuster.
Reynolds PD, Hay M, Camp SM (1999) Global Entrepreneurship Monitor. Kansas City,
MO: Kauffman Center for Entrepreneurial Leadership.
Reynolds PD, White SB (1997) The Entrepreneurial Process. Westport, CT: Quorum
Books.
Reynolds PD, Hay M, Camp SM (1999) Global Entrepreneurship Monitor. Kansas City,
MO: Kauffman Center for Entrepreneurial Leadership.
Rice MP (1992) Intervention Mechanisms Used to Influence the Critical Success Factors
of New Ventures: An Exploratory Study. Troy, NY: Rensselaer Polytechnic
Institute.
Rice MP (2002) Co-production of Business Assistance in Business Incubators: An
Exploratory Study. Journal of Business Venturing 17(2): 163–187.
Rosenthal SS, Strange WC (2003) Geography, Industrial Organization, and
Agglomeration. The Review of Economics and Statistics 85(2): 377–393.
Rothschild L, Darr A (2005) Technological Incubators and the Social Construction of
Innovation Networks: an Israeli Case Study. Technovation 25(1), 59–67.

319
Rubin H (1994) There Aren‘t Going to Be Any Bakeries Here If There Is No Money to
Afford Jellyrolls: The Organic Theory of Community-Based Development. Social
Problems 41(3): 401–424.
Rullani E, Zanfei A (1988) Networks Between Manufacturing and Demand: Cases from
textile and clothing industries. In New Information Technology and Industrial
Change: The Italian Case, ed. C Antonelli. Dordrecht, Netherlands: Kluwer.
Rushing RW (1995) Business Incubator: A Rural Development Tool. Blueprints for
Economic Development 5: 1259–1260.
SBA Rules and Regulations (1978) Washington, D.C.: Small Business Administration
Schumpeter JA (1942) Capitalism, Socialism, and Democracy. New York: Harper and
Row.
Schumpeter JA (1934) The Theory of Economic Development: An Inquiry Into Profits,
Capital, Credit, Interest, and the Business Cycle. Harvard Economic Studies, Vol.
XLVI. Cambridge, MA: Harvard University Press.
Scott AJ (1988a) New Industrial Spaces. London: Pion.
Shaffer R, Deller S, Marcouiller D (2004) Community Economics: Linking Theory and
Practice, 2nd
ed. Ames, IA: Blackwell Publishing.
Shaffer S (2006) Establishment Size and Local Employment Growth. Small Business
Economics 26: 439–54.
Shaffer S (2002) Firm Size and Economic Growth. Economics Letters 76: 195–203.
Shapira, P (1991) Modernizing Small Manufacturers in Japan: The Role of Local Public
Technology Centers. The Journal of Technology Transfer 17(1): 40–57.
Shefsky L E (1996) Entrepreneurs Are Made Not Born. New York: McGraw-Hill.
Sheppard E (2000) ―The New Economics of Urban and Regional Growth.” Chapter 6:
99-117 in The Oxford Handbook of Economic Geography.
Sher B, Gottlieb A. (1989) Teamworks! New York: Warner Books.
Sherman H (1998) Comments on Peter Bearse‘s ―A Question of Evaluation.‖ Economic
Development Quarterly 12(4) 334–335.

320
Sherman H (1999) Assessing the Intervention Effectiveness of Business Incubation
Programs on New Business Start-ups. Journal of Developmental
Entrepreneurship 4(2): 117–133.
Sherman H, Chappell DS (1998) Methodological Challenges in Evaluating Business
Incubator Outcomes. Economic Development Quarterly 12: 313–321.
Sherraden M (1991) Assets and the Poor. Armonk, NY: Sharpe.
Sherrard Sherraden M, Sanders CK, Sherraden M (2004) Kitchen Capitalism:
Microenterprise in Low-Income Households. Albany, NY: SUNY Press.
Siegel B, Waxman A (2001) Third-tier Cities: Adjusting to the New Economy. EDA
Reviews of Economic Development Literature and Practice, No. 6. (June)
Summerville, MA.
Simon C, Nardinelli C (2002) Human Capital and the Rise of American Cities, 1900-
1990. Regional Science and Urban Economics 32: 59–96.
Simpson EH (1951) The Interpretation of Interaction in Contingency Tables. Journal of
the Royal Statistical Society 13: 238–241.
Smilor RW (1987a) Commercializing Technology through New Business Incubators,
Research Management 30(5): 36–41.
Smilor RW (1987b) Managing the Incubator System: Critical Success Factors to
Accelerate New Company Development. IEEE Transactions on Engineering
Management EM 34(4):146–156.
Smilor RW, Gill MD (1986) The New Business Incubator: Linking Talent, Technology,
Capital, and Know-How. Lexington, MA: Lexington Books.
Solomon G, Duffy S, Tarabishy A (2002) The State of Entrepreneurship Education in the
United States: A Nationwide Survey and Analysis. International Journal of
Entrepreneurship Education 1(1): 65–86.
Soltow JH (1968) The Entrepreneur in Economic History. American Economic Review
58(2): 84–92.
South Eastern Reporter (1994) South Carolina Supreme Court Records, p.602
321
Stenberg P (1993) ―Rural Business Incubators and Economic Development.‖ In Issues
for the 1990's: Rural Economy. Economic Research Service, Agriculture
Information Bulletin No. 664-50: 139–140.
Stephenson H, Duncan E (1993) Effective Paradigms for Small Business in the Changing
Global Economy: A Case Study of a Flexible Manufacturing Network [online].
Available at: http://161.31.2.174/docs/proceedings/93sbi311.txt.
Sternberg R, Behrendt H, Seeger H, Tamasy C (1997) Bilanz eines Booms-
Wirkungsanalyse von Technologie-und Gruenderzentren in Deutschland, 2nd
ed.
Dortmund, Germany: Dortmunder Vertrieb fur Bau-und Planungsliteratur.
Storper M, Venables J (2004) Buzz: Face-to-Face Contact and the Economy. Journal of
Economic Geography. 4: 351–370.
Storper M, Venable J (2006) ―Buzz: Face-to- Face Contact and the Economy.‖ In
Clusters, Networks and Innovation. Eds S. Breschi and F. Malerba. Oxford:
Oxford University Press.
Strategic Networks Group (2003) Economic Impact Study of the South Dundas
Township Fibre Network. Prepared for the Department of Trade and Industry,
UK. Available at http://www.dti.gov.uk/industries/telecoms/sdcsfi270603.pdf.
Suarez-Villa L (1989) The Evolution of Regional Economies: Entrepreneurship and
Macroeconomic Change. New York: Praeger.
Sweeney GP (1987) Innovation, Entrepreneurs, and Regional Development. New York:
St. Martin‘s Press.
Swirbul C (2006) State Broadband Battles. Public Power, September-October. Available
at: www.APPA.net.org.
Tamasy C (2001) ―Evaluating Innovation Centres in Germany: Issues of Methodology,
empirical Results, and International Comparison.‖ In Promoting Local Growth;
Process, Practice and Policy, ed. D Felsenstein, M Taylor. Aldershot: Ashgate:
109–126.
Tamasy C (2007) Rethinking Technology-Oriented Business Incubators: Developing a
Robust Policy Instrument for Entrepreneurship, Innovation, and Regional
Development? Growth and Change 38(3): 460–473.

322
Temali M, Campbell C (1984) Business Incubator Profiles: A National Survey.
Minneapolis: University of Minnesota, Hubert H. Humphrey Institute of Public
Affairs.
Terry D (2006) ―Best Practices in Rural Incubation Success.‖ Presentation at National
Business Incubation Association 16th
Fall Training Institute: Entrepreneurship
Support through Business Incubation. October 24-27, Denver, CO.
Tolbert CM, Lyson TA, Irwin M (1998) Local Capitalism, Civic Engagement, and
Socioeconomic Welfare. Social Forces 77:401–27.
Trkman P, Blazic BJ, Turk T (2008) Factors of Broadband Deployment and the Design of
a Strategic Policy Framework. Telecommunications Policy 32: 101-115.
Turner RC (2003) The Political Economy of Gubernatorial Smokestack Chasing: Bad
Policy and Bad Politics. State Politics and Policy Quarterly 3(3): 270–293.
Turok I, Richardson P (1991) New Firms and Local Development: Evidence from West
Lothian. Regional Studies 25: 71–83.
Udell GG (1990) Are Business Incubators Really Creating New Jobs by Creating New
Businesses and New Products? Journal of Product Innovation Management
7:108–122.
U.S. Bureau of Economic Analysis, Regional Economic Information Systems,
Washington D.C. http://www.bea.gov/.
U.S. Census Bureau. Annual Current Population Survey. http://www.census.gov/cps/
U.S. Department of Commerce (2002) Understanding Broadband Demand: A Review of
Critical Issues. Office of Technology Policy, U.S. Department of Commerce,
Washington DC. Available at:
http://www.technology.gov/reports/TechPolicy/p_Broadband_020921.htm
U.S. Department of Commerce. U.S. Patent and Trademark Office. www.uspto.gov.
U.S. Department of Labor, Bureau of Labor Statistics, Business Employment Dynamics.
http://www.bls.gov/bdm/bdmstate.
U.S. Small Business Administration, Office of Advocacy. http://www.sba.gov.

323
Utterback JM, Meyer M, Roberts E, Reitberger G (1988) Technology and Industrial
Innovation in Sweden: A Study of Technology Based Firms Formed between
1965 and 1980. Research Policy 17: 15–26.
Van Der Panne G, Dolfsma W (2003) The Odd Role of Proximity in Knowledge
Relations: High-Tech in the Netherlands. Tijdschrift voor economische en sociale
geografie 94(4): 453–462.
Van Oorschot W, Arts W, Gelissen J (2006) Social Capital in Europe: Measurement and
Social and Regional Distribution of a Multifaceted Phenomena, Acta Sociologica:
Journal of the Nordic Sociological Association: Special Issue on Social Capital
49(2): 149–166.
Vartiainen HJ (1988) Entrepreneurship and Local Government Strategies in Finland: A
Regional Perspective. In Regional Cultures, Managerial Behavior, and
Entrepreneurship: An International Perspective, ed. JW Weiss. New York:
Quorum Books.
Vidal AC (1992) Rebuilding Communities: A National Study of Urban Community
Development Corporations. New York: New School for Social Research,
Graduate School of Management and Urban Policy, Community Development
Research Center.
von Zedwitz M (2003) Classification and Management of Incubators: Aligning Strategic
Objectives and Competitive Scope for New Business Facilitation. International
Journal of Entrepreneurship and Innovation Management 3(1/2): 176–196.
Vossen RW (1998) Combining Small and Large Firm Advantages in Innovation: Theory
and Examples, SOM Research Report 98B21. Research School Systems
Organisation and Management, Universiteitsbibliotheek Groningen.
Walzer N, Athiyaman A (2007) ―Introduction and Overview.‖ In Entrepreneurship and
Local Economic Development, ed. N Walzer, Plymouth, UK: Lexington Books.
Walzer N, Athiyaman A, Hamm GF (2007) Entrepreneurship and Small Business
Growth. In Entrepreneurship and Local Economic Development, ed. N Walzer.
Plymouth, UK: Lexington Books.
Ward MR (2007) Rural Telecommunications Subsidies Do Not Help. Regional Analysis
and Policy 37(1): 66–68.
Weinberg ML (1987) Business Incubators Give New Firms in Rural Areas a Head Start.
Rural Development Perspectives 3(2): 6–10.

324
Weinberg ML (1986) Business Incubator Development in Rural Areas. ERIC:
ED265983.
Weinberg ML, Burnier D (1991) Developing Rural Business Incubators. New Directions
for Community Colleges 75: 31–39.
Welsh DHB, Cummings LL (1991) Applying Computer Technology for the 1990s and
Beyond [online]. Available at: http://161.31.2.174/docs/proceedings/93sbi042.txt
Westhead P (1997) R&D Inputs and Output of Technology-based Firms Located on and
off Science Parks in the United Kingdom R&D Management 27(1): 45–62.
Westhead P, Storey DJ (1994) An Assessment of Firms Located On and Off Science
Parks in the United Kingdom. London: HMSO.
Westhead P, Storey DJ (1995) Links Between Higher Education Institutions and High
Technology Firms. Omega International Journal of Management Science 23(4),
345–360.
Wever E (1986) New Firm Formation in the Netherlands. In New Firms and Regional
Development in Europe, eds. D Keeble, E Wever. London: Croom Helm.
Williams LE (2004) Entrepreneurial Education: Creating a Usable Economic Base. Rural
Research Report 15(8). Macomb, IL: Illinois Institute for Rural Affairs
Williamson OE (1975) Markets and Hierarchies. New York: Free Press.
Williamson OE (1979) Transaction-Cost Economics: The Governance of Contractual
Relations. The Journal of Law and Economics 22: 233–261.
Wilson R (1989) State Business Incentives and Economic Growth: Are They Effective? A
Review of the Literature. Washington: Council of State Governments Vol 1.
Woolcock M (2002) 'Social Capital and Development: Concepts, Evidence and
Applications. Presentation to World Bank Workshop on Understanding and
Building Social Capital in Croatia. Available at: www.worldbank.org.
World Bank (1999) What is Social Capital? PovertyNet. Availbable at:
http://www.worldbank.org/poverty/scapital/whatsc.htm.

325
Yarnell D, Peterson M (1993) Networking in the Mid-1990. Journal of Management
Development 12 (4): 37–48.
Yenerall J (2008) ―What Entrepreneurs Mean for Your Community and How
Entrepreneurship can be Fostered.‖ Rural Development Paper No. 40. The
Northeast Regional Center for Rural Development, Pennsylvania State University.
Yin JS (1998) The Community Development Industry System: A Case Study of Politics
and Institutions in Cleveland, 1967-1997. Journal of Urban Affairs 20: 137–157.