The Tax Incidence of Lotteries: Evidence from Five States
13
A Longitudinal Analysis of Income-Based Tax Regressivity of State-Sponsored Lotteries Author(s): Anthony D. Miyazaki, Ann Hansen, David E. Sprott Source: Journal of Public Policy & Marketing, Vol. 17, No. 2 (Fall, 1998), pp. 161-172 Published by: American Marketing Association Stable URL: http://www.jstor.org/stable/30000768 Accessed: 21/07/2009 17:19 Your use of the JSTOR archive indicates your acceptance of JSTOR's Terms and Conditions of Use, available at http://www.jstor.org/page/info/about/policies/terms.jsp. JSTOR's Terms and Conditions of Use provides, in part, that unless you have obtained prior permission, you may not download an entire issue of a journal or multiple copies of articles, and you may use content in the JSTOR archive only for your personal, non-commercial use. Please contact the publisher regarding any further use of this work. Publisher contact information may be obtained at http://www.jstor.org/action/showPublisher?publisherCode=ama. Each copy of any part of a JSTOR transmission must contain the same copyright notice that appears on the screen or printed page of such transmission. JSTOR is a not-for-profit organization founded in 1995 to build trusted digital archives for scholarship. We work with the scholarly community to preserve their work and the materials they rely upon, and to build a common research platform that promotes the discovery and use of these resources. For more information about JSTOR, please contact [email protected]. American Marketing Association is collaborating with JSTOR to digitize, preserve and extend access to Journal of Public Policy & Marketing. http://www.jstor.org
Transcript of The Tax Incidence of Lotteries: Evidence from Five States

A Longitudinal Analysis of Income-Based Tax Regressivity of State-Sponsored LotteriesAuthor(s): Anthony D. Miyazaki, Ann Hansen, David E. SprottSource: Journal of Public Policy & Marketing, Vol. 17, No. 2 (Fall, 1998), pp. 161-172Published by: American Marketing AssociationStable URL: http://www.jstor.org/stable/30000768Accessed: 21/07/2009 17:19
Your use of the JSTOR archive indicates your acceptance of JSTOR's Terms and Conditions of Use, available athttp://www.jstor.org/page/info/about/policies/terms.jsp. JSTOR's Terms and Conditions of Use provides, in part, that unlessyou have obtained prior permission, you may not download an entire issue of a journal or multiple copies of articles, and youmay use content in the JSTOR archive only for your personal, non-commercial use.
Please contact the publisher regarding any further use of this work. Publisher contact information may be obtained athttp://www.jstor.org/action/showPublisher?publisherCode=ama.
Each copy of any part of a JSTOR transmission must contain the same copyright notice that appears on the screen or printedpage of such transmission.
JSTOR is a not-for-profit organization founded in 1995 to build trusted digital archives for scholarship. We work with thescholarly community to preserve their work and the materials they rely upon, and to build a common research platform thatpromotes the discovery and use of these resources. For more information about JSTOR, please contact [email protected].
American Marketing Association is collaborating with JSTOR to digitize, preserve and extend access toJournal of Public Policy & Marketing.
http://www.jstor.org

A Longitudinal Analysis of Income-Based Tax
Regressivity of State-Sponsored Lotteries
Anthony D. Miyazaki, Ann Hansen, and David E. Sprott
Government-sponsored lotteries have been criticized for disproportionately generating revenues from lower-income consumers. Prior academic research on this aspect of government-sponsored lotteries reveals a set of conflicting findings: Many studies conclude that lotteries represent a form of regressive revenue production, whereas others conclude that lotteries represent proportional or even progressive revenue generation. Examination of the overall body of prior research suggests that lottery regressivity levels are not constant over time. With this research, the authors provide a more focused exploration of this issue by analyzing longitudinal sales data from six lottery states to determine patterns of change in lottery tax regressivity. The analyses provide preliminary evidence that lotteries become less regressive as they progress through their individual life cycles and as new marketing efforts-such as anonymous methods of play--become more prevalent. The authors explore implications for further lottery-related policy research, with particular emphasis on likely contributions from a relatively unexplored marketing perspective.
Since their reintroduction to the United States in 1964, government-sponsored lotteries have become a major source of government revenue, both domestically and
abroad (Clotfelter and Cook 1989; Petty 1996; Selinger 1993; Slingsby 1994). With sales in 37 states and the Dis- trict of Columbia, annual revenues in the United States were $31.7 billion in 1996 (Cordtz 1990; Johnson 1996; U.S. Bureau of the Census 1996), which makes lotteries the lead- ing product produced and sold by state governments to the public (Clotfelter and Cook 1990). The increased marketing of these lotteries (Advertising Age 1993; Clotfelter and Cook 1987; Phillips 1996; Radding and Hume 1991) has been accompanied by a growing interest in several public policy issues related to the promotion of this product by the government and its consumption by the populous (cf. Clot- felter and Cook 1987). One issue of particular relevance is that lottery marketers have been accused of promoting lot- teries in a fashion that encourages a disproportionately large amount of play by consumers of relatively low income and/or education (Clotfelter and Cook 1989; U.S. Senate 1985; cf. Miyazaki, Sprott, and Langenderfer 1996).
Policymakers' interest in this aspect of lottery revenue generation typically is twofold. First, some researchers have suggested that certain lottery promotions may be misunder-
stood by what have been labeled as "disadvantaged" con- sumer groups (Clotfelter and Cook 1989; Steams and Borna 1995; cf. Hill 1995). Second, there is concern that, if lotter- ies are overpurchased by lower-income consumer groups, revenue generated by lottery sales disproportionately taxes these consumers (U.S. Senate 1985).
To determine what, if any, marketer or government actions should be taken to address these issues, it is first nec- essary to assess whether state-sponsored lotteries actually constitute a regressive form of revenue production. Unfortu- nately, previous studies that have examined lottery regres- sivity have resulted in conflicting findings, with studies reporting lotteries as regressive (lower-income consumers spend a higher proportion of their income on lotteries than higher-income consumers), proportional (lower-income and higher-income consumers spend the same proportion of their income on lotteries), or progressive (higher-income consumers spend proportionately more). Considering the importance of determining whether lotteries are regressive, it is critical to resolve this apparent disparity of results. We address this issue first by examining previous lottery regres- sivity studies that have resulted in various findings between states and over time. We then analyze longitudinal lottery sales data to test for regressivity over time, across states, and in relation to various marketing and nonmarketing factors.
Lotteries and Revenue Generation The primary governmental objective of state lotteries is rev- enue generation; indeed, the mission statements of many lot- teries explicitly state that the goal of the lottery commission or state-owned lottery corporation is to generate the maxi- mum amount of revenue for the legislated funding purpose. For example, the Michigan lottery has a "statutory mandate to maximize revenues" (Lotto World 1996c); the Florida lot- tery denotes its mission as maximizing funding for educa-
ANTHONY D. MIYAZAKI is Assistant Professor of Marketing, School of Business Administration, University of Miami. ANN HANSEN is Professor of Economics, Westminster College of Salt Lake City. DAVID E. SPROTT is Assistant Professor of Marketing, College of Business & Economics, Washington State University. The authors gratefully acknowledge constructive comments from Bill Bearden, Randy Rose, JPP&M editor Debbie Scammon, and four anonymous JPP&M reviewers on previous drafts of the arti- cle. This research benefited in part from a James W. McLamore Summer Award in Business and Social Sciences, which was granted to the first author.
Vol. 17 (2) Fall 1998, 161-172 Journal of Public Policy & Marketing 161

162 State-Sponsored Lotteries
tion, which primarily entails maximizing lottery revenue (Florida Lottery 1996); and the Montana lottery pursues a mission to "maximize revenues as well as transfers and ensure that policies and rules adopted further revenue max- imization" (Montana Lottery 1994).
There is disagreement among researchers whether rev- enues generated by lottery purchases represent true taxation. The voluntary nature of lottery purchases seemingly is counter to general perceptions of what constitutes a tax. Clotfelter and Cook (1989) refer to lotteries as a "painless tax," in that lottery taxation is voluntary, as opposed to excise or income taxes. Because most lotteries are regulated as to the percentage of revenue that can be spent on prize money, retailer commissions, and administrative costs, the state's portion may be viewed as an explicit tax on revenue that must be reflected in the selling price of the good. At the very least, there is reasonable acceptance among researchers that lotteries are a consumer good with a relatively high implicit tax rate (Borg, Mason, and Shapiro 1993; Brinner and Clotfelter 1975; Pitcher 1994). Irrespective of this debate (which cannot be addressed fully here), lottery rev- enues may be analyzed appropriately using techniques com- monly employed to study taxation issues.
Overall, revenue production from state-sponsored lotter- ies continues to grow relatively quickly; without consider- ing new lotteries, the average annual growth rate of state lot- tery sales from 1992 to 1996 was more than 8% (see Table 1 for U.S. state lottery revenues for this time period). This surpasses the average annual growth rate for personal income and total tax revenues for the same states during the same time period. Although lottery purchases might not rep- resent a large portion of consumers' personal income (cf. Heavey 1978), on an aggregate basis, the lottery represents a significant source of state revenue (Mikesell and Zomrn 1988). For example, lottery revenues constitute the fourth- largest source of revenue for New Jersey and Maryland, and at least the fifth- or sixth-largest source for eight other states (Mikesell and Zorn 1988; New Jersey Lottery 1996).
The nature of the revenue-generating function of lotteries has been an issue of debate in both academic and practi- tioner circles for many years (Brinner and Clotfelter 1975; Clotfelter and Cook 1987; Hansen 1995; Jackson 1994; Langenderfer 1996; Szakmary and Szakmary 1995). In par- ticular, the use of lotteries as a means to generate income for state governments has been scrutinized by policymakers for the following reasons: (1) increases in lottery revenues sometimes result in decreases of other tax revenues (Borg, Mason, and Shapiro 1993; Suits 1977a; Szakmary and Sza- kmary 1995), (2) lottery revenues might not be allocated appropriately to specified programs (Borg and Mason 1988), (3) the allocation of lottery revenues to certain pro- grams (e.g., education) might result in a decrease of funding for those programs from other revenue sources (Spindler 1995), (4) lotteries might be inefficient as revenue produc- ers (Alm, McKee, and Skidmore 1993; Borg and Mason 1988; Brinner and Clotfelter 1975; Rodgers and Stuart 1995; Thiel 1991), and (5) lottery revenues might be gener- ated disproportionately across various groups of consumers (e.g., Clotfelter 1979; Clotfelter and Cook 1989; Hansen 1995; Spiro 1974). This final concern--lottery tax regres- sivity-is the focus of our research.
Regressivity of Government-Sponsored Lotteries
Regressivity typically refers to the condition wherein a par- ticular revenue source (e.g., a tax) accumulates funds in a disproportionate manner, such that lower-income groups bear a greater burden of revenue production than higher- income groups. I A lottery is considered a regressive revenue producer if the ratio of personal lottery expenditures to per- sonal income is inversely correlated with personal income level. Consider the following equation:
(1) LOTEXPEND/INCOME = a + P(INCOME),
where LOTEXPEND represents per capita lottery expendi- tures for a specified period of time and INCOME repre- sents per capita income during the same time period. For a lottery to be regressive, P must be less than zero. (The lot- tery is deemed proportional when 1 = 0, and progressive when p > 0.)
The preceding approach enables a direct determination of whether a particular lottery is regressive merely by examin- ing the estimated beta coefficient. A common mistake, how- ever, is to view the income-lottery relationship as the sim- ple association between income and lottery expenditures, using an equation such as the following:
(2) LOTEXPEND = a' + P'(INCOME).
The problem, as compared with Equation 1, is that the infor- mation contained in p' is not always sufficient to determine whether the lottery is regressive, proportional, or progres- sive. If 1' < 0, p (in Equation 1) must be less than zero (pro- vided that o' 2 0, which normally is true because individual income, on average, will exceed individual lottery expendi- tures). Yet, if 1' > 0, it can be shown that 13 (in Equation 1) may be greater than, less than, or equal to zero. The key implication of this is that the 1' coefficient in Equation 2 is not as useful in determining regressivity as it first might appear.
An Examination of Prior Lottery Research To understand the nature of lottery revenue generation, we examine the tax incidence-the degree to which lottery rev- enue generation (or taxation) affects particular income groups-reported in prior academic lottery research. In par- ticular, we assess whether substantial evidence exists to des- ignate each study's findings as regressive, proportional, or
progressive.
IWe focus here on regressivity based on income. Previous research also has examined regressivity based on education, with the majority of studies indicating a negative relationship between education and lottery purchases (e.g., Borg and Mason 1988; Clotfelter and Cook 1989; Jackson 1994; Lan-
genderfer 1996; McConkey and Warren 1987; Meinert, Lumpkin, and Reich 1989; Miyazaki, Sprott, and Langenderfer 1996), though there are some that have found null (e.g., Borg, Mason, and Shapiro 1993; Kaplan 1987) or positive (e.g., Kallick et al. 1977) relationships. There are argu- ments and some evidence that education as a demographic predictor should be the focal point of lottery policy research, rather than income (cf. Lan-
genderfer 1996; Miyazaki, Sprott, and Langenderfer 1996).

Journal of Public Policy & Marketing 163
Table 1. Lottery Revenues in the United States, 1992-1996a
State Start Date 1992 1993 1994 1995 1996
Alabama n/a 0 0 0 0 0 Alaska n/a 0 0 0 0 0 Arizona 1981 234,150 242,920 233,355 268,772 243,503 Arkansas n/a 0 0 0 0 0 California 1985 1,278,103 1,655,133 1,816,321 2,025,415 2,144,503 Colorado 1983 224,920 247,575 269,355 329,665 310,343 Connecticut 1972 515,826 524,048 523,749 636,294 669,936 Delaware 1975 74,513 85,266 95,890 108,770 126,773 Florida 1988 2,071,868 2,015,835 2,043,587 2,126,423 1,962,014 Georgia 1993 0 0 1,010,159 1,291,509 1,434,785 Hawaii n/a 0 0 0 0 0 Idaho 1989 51,980 57,152 72,515 87,969 91,162 Illinois 1974 1,475,813 1,405,927 1,373,554 1,467,854 1,473,813 Indiana 1989 359,491 467,475 526,800 562,934 572,925 Iowa 1985 150,988 186,169 185,653 186,121 169,998 Kansas 1987 73,077 108,679 144,448 162,791 167,506 Kentucky 1989 401,850 453,946 448,982 479,884 509,175 Louisiana 1991 355,965 458,317 324,655 279,473 265,852 Maine 1974 114,055 118,074 145,197 153,204 148,690 Maryland 1973 770,780 836,021 932,327 984,180 1,052,673 Massachusetts 1972 1,610,939 1,890,841 2,306,091 2,628,555 2,850,344 Michigan 1972 1,120,927 1,142,614 1,249,917 1,271,655 1,329,265 Minnesota 1990 279,934 310,566 311,691 317,527 355,632 Mississippi n/a 0 0 0 0 0 Missouri 1986 207,516 241,249 329,970 387,151 396,371 Montana 1987 26,312 34,704 35,417 30,957 29,997 Nebraska 1993 0 0 52,853 79,021 81,830 Nevada n/a 0 0 0 0 0 New Hampshire 1964 99,378 99,351 104,423 132,477 153,097 New Jersey 1970 1,287,001 1,290,096 1,353,623 1490,539 1,501,768 New Mexico 1997 0 0 0 0 0 New York 1967 1,880,983 2,161,473 2,176,356 2,773,997 3,295,255 North Carolina n/a 0 0 0 0 0 North Dakota n/a 0 0 0 0 0 Ohio 1974 1,700,595 1,857,007 1,803,079 2,048,888 2,234,615 Oklahoma n/a 0 0 0 0 0 Oregon 1985 244,417 532,343 703,437 885,486 944,940 Pennsylvania 1972 1,315,054 1,334,659 1,462,426 1,487,887 1,585,279 Rhode Island 1974 57,512 117,472 167,711 286,542 395,992 South Carolina n/a 0 0 0 0 0 South Dakota 1987 60,538 77,481 92,290 83,905 118,858 Tennessee n/a 0 0 0 0 0 Texas 1992 0 1,685,784 2,471,555 2,743,061 3,101,735 Utah n/a 0 0 0 0 0 Vermont 1978 48,608 47,358 49,856 71,696 74,741 Virginia 1988 825,964 822,847 854,889 879,926 901,212 Washington 1982 302,190 364,956 314,580 400,926 389,881 West Virginia 1986 85,861 110,110 131,452 155,366 171,709 Wisconsin 1988 425,900 469,529 470,160 492,194 457,323 Wyoming n/a 0 0 0 0 0
Total 19,733,008 23,452,977 26,588,320 29,799,014 31,713,277
aTicket sales excluding commissions; in thousands of U.S. dollars. Sources: U.S. Bureau of the Census (1996) and Wulf (1997).

164 State-Sponsored Lotteries
A total of 27 studies (published in 14 articles and books) were identified in our review of the literature.2 The studies were based on lotteries in 11 states, ranging from new to mature lotteries. The majority of the studies examined the relationship between income and lottery purchases without regard for other potentially explanatory variables, though some studies did consider the impact of education (which typically is correlated positively with income) and other demographic variables.
Individual studies were designated as regressive if they were reported specifically as such or if the researchers orig- inally reported a negative or null relationship between income and lottery spending. As we discussed previously, positive relationships between these two variables cannot always be classified without additional information because of the ambiguity in this situation. Finally, proportional or progressive incidence levels were reported as stated in the original studies.
In Table 2, we present the findings from the 27 identified studies. In addition to presenting the specific results reported by the various authors, we provide the designated tax incidence for each study. Twenty studies were classified as regressive, five were proportional, and one was progres- sive; one study was not classifiable with the given data.
The studies in Table 2 are ordered by the age of the lot- tery at the time of data collection. The purpose of this for- mat is to make evident any potential longitudinal changes in the lottery tax incidence. The most striking finding from this analysis is that lotteries in their earlier years appear to be more regressive than more mature lotteries. Specifically, when the studies in Table 2 are categorized into a 2 ("10 or fewer years since the lottery's inception" versus "1 1 or more years") x 2 ("regressive" versus "proportional or progres- sive") matrix, the data indicate that lotteries in their first decade are more likely to be regressive than lotteries in their I Ith year and beyond (X2df = I = 9.58, p < .0 1). This suggests that the potential for lottery tax incidence, as measured by these various researchers, becomes less regressive over time.
A problem with examining these data, however, is that they consist of tax incidence studies for different states, which makes comparisons of regressivity over time poten- tially meaningless if apparent changes in lottery regressivity are actually due to differences across states. This situation can be remedied to some degree by selecting only those studies that examine a particular state. For example, a more detailed look at the Massachusetts lottery is possible because there have been several published studies of this state's lottery tax incidence (see Table 2). Consistent with the findings across multiple states, the reported tax inci- dence for Massachusetts has changed over time, moving
from reports of regressivity in the early 1970s to more mixed results through the 1990s. Unfortunately, the differ- ences in incidence across the Massachusetts studies could be due to variation in the type of data and the analyses employed in those studies.
To assess whether lottery regressivity changes over time, longitudinal research is needed that uses the same states, type of data, and type of analysis. Unfortunately, previous studies of lottery tax incidence typically have examined cross- sectional data and neglected to address how regressivity may change over time. Only two published studies have examined playing behavior over time for the same state lottery. Mike- sell (1989) examines Illinois lottery data from 1985 to 1987 and finds that the tax incidence based on income became more progressive each year. However, none of the income elasticities was significantly different than one, which indi- cates that, though the tax incidence became more progres- sive, the tax was proportional for each year across this time period. In the other study, Jackson (1994) finds that the Mass- achusetts lottery tax was progressive in 1983 but regressive in 1990 for total lottery sales. (Unfortunately, the trends between these years are not reported.) These studies suggest that, in addition to varying methodologies and differences across states, differences in tax incidence (as presented in Table 2) might be due to factors associated with the lottery and not entirely due to the research method, an issue we examine in the following section.
Influences of Longitudinal Changes in Lottery Regressivity There are several factors that may influence whether and to what degree a particular state lottery represents regressive, progressive, or proportional revenue generation. These fac- tors may be inherent (e.g., the type of lottery game or related promotional strategies) or extrinsic (e.g., demographic, geo- graphic, or economic variables) to the lottery. If factors that affect the lottery demand structure (particularly with respect to buyer income) vary from state to state, or change over time, the changes would cause variations in the calculated tax incidence. Also, the combination of these various factors likely contributes to how state lotteries proceed through their product life cycles-life cycles that potentially exist at both an overall (national) industry level and an individual (state) level (cf. Clotfelter and Cook 1989; Hansen 1995; Mikesell 1989).
Lottery Factors Factors intrinsic to the promotion of or participation in games offered by state-sponsored lotteries may increase or decrease the income-based tax regressivity of those lottery games. For example, Hansen (1995) proposes that lotteries may start out more regressive and become less regressive because of increased popularity among higher-income con- sumers (as opposed to decreased popularity among lower- income consumers). Because lottery authorities often are criticized for promoting, or at least supporting, regressive lotteries, such a shift in tax incidence would seem to reduce such criticism. As lottery marketers work to abrogate certain stigmas often associated with lottery play-for example, that only poor or uneducated people play (Koza 1982)-it is
zOnly studies that provide tax incidence for individual U.S. state lotter- ies were included in this review. Studies were excluded that (1) combined data from more than one state (Meinert, Lumpkin, and Reich 1989) or used a national sample (Kaplan 1987; McConkey and Warren 1987; Mikesell 1994; Suits 1977a; Vasche 1985), (2) examined lotteries from other coun- tries (Livernois 1987; Vaillancourt and Grignon 1988), or (3) did not report any analysis of income-based tax incidence as part of the research (Blakey 1979; Calmus 1981; Gulley and Scott 1993; Kinsey 1963; Koza 1982; McCaffery 1994; Redifer 1996; Stearns and Borna 1995; Williams, Mizer- ski, and Straughn 1994).

Journal of Public Policy & Marketing 165
Table
2.
Tax
Incidence
of State-Sponsored
Lotteries
Lottery Age
Year
of
start
of
Sample
Specific
Tax
Incidence
(years)
Research
Study
StudYa
State
Lottery
Data
Type
Size
Resultsb
Implications
0
Spiro
1974
1972
PA
1972
survey
of winners
271
S = -.20c
Regressive
1
HeaveY
1978
1973
PA
1972
Winners
by census
tract
919
nsad
Regressive
1
Brinner
and
Clotfelter
1975
1973
CT
1972
Telephone
survey
of residents
750
S = -.36c
Regressive
1
Brinner
and Clotfelter
1975
1973
MA
1972
50K+
winners
by census
tract
108
nsad
Regressive
1
Brinner
and Clotfelter
1975
1973
MI
1972
25+
winners
by county
900,431
nsad
Regressive
1
Clotfelter
and Cook
1987
1986
CA
1985
Instant
game
survey
unreported
S = -.32
Regressive
1
Burns
et al. 1990
1989
FL
1988
Telephone
survey
of residents
235
Mixed
Unknown
1
Miyazaki,
Sprott,
and
Langenderfer
1996
1994
GA
1993
In-Person
survey
of residents
233
rartial
= -.06e
Regressive
2
Brinner
and
Clotfelter
1975
1974
MA
1972
Telephone
survey
of residents
1000
S = -.40c
Regressive
2
Langenderfer
1996
1995
GA
1993
In-Person survey
of residents
136
r = -.10e
Regressive
5
Clotfelter
1979
1978
MD
1973
Daily
numbers
sales
by zip code
139
S = -.41
Regressive
5
Clotfelter
1979
1978
MD
1973
Weekly
lotto
sales
by zip code
139
S = -.24
Regressive
5
Brown,
Kaldenberg,
and
Browne
1992
1990
OR
1985
Telephone
survey
of residents
3200
b = +.42d
Regressive
6
Hansen
1995
1989
CO
1983
Instant
game
sales
by county
62
S = -.095
Regressive
11
Jackson
1994
1983
MA
1972
Sales
by city
104
n Y = 2.44
Progressive
11
Bor
and
Mason
1988
1985
IL
1974
Survey
of $600+
winners
518
ny = .25
Regressive
11
Clotfelter
and Cook
1987
1984
MD
1973
Telephone
survey
of residents
1247
Ave.
S = -.42
Regressive
11
Mikesell
1989
1985
IL
1974
Sales
by county
58
ny = 1.02
ProPortionalf
12
Mtkesell
1989
1986
IL
1974
Sales
by county
58
ny = -1.27
ProPorttonalf
13
Mikesell
1989
1987
IL
1974
Sales
by county
58
ny = 1.49
ProPortionalf
13
Clotfelter
and Cook
1987
1986
MD
1973
Numbers
winners by zip
code
211
nsa
Regressive
13
Clotfelter
and
Cook
1987
1986
MD
1973
Instant
winners
by zip code
66
nsa
Regressive
13
Clotfelter
and
Cook
1987
1986
MD
1973
Lotto
winners
by zip code
582
nsa
Proportional
14
Clotfelter and
Cook
(1987)
1986
MA
1972
Lotto
winners by zip
code
425
nsa
Proportional
14
Clotfelter and
Cook
(1987)
1986
MA
1972
$5mil+
lotto
winners by zip
code
123
nsa
Progressive
18
Jackson
(1994)
1990
MA
1972
Sales by
city
113
ny= .49
Regressive
19
Herring
and
Bledsoe
1994
1991
MI
1972
Telephone
survey of
residents
1500
nsad
Regressive
aYear of
Study
represents the
approximate
year of data
collection.
Results are
presented as
they
appear in
each
article
using a
correlation
coefficient (r), a
multiple
Regression
coefficient (b), a
measure of
income
elasticity
(nY), a
calculated
Suits
index (S; see
Suits
1977b),
or
general,
nonstatistical
trends for
which no
statistic is
available
(nsa).
Income
elasticities less than 1 are
regressive,
equal to 1 are
proportional, and
greater
than 1 are
progressive. The
Suits
index
(explained
further in the
text)
ranges
from -1 to l,
with
negative
numbers
being
regressive and
positive
being
progressive.
cReported in
Vaillancourt and
Grignon
(1988).
dThe
research
clearly
exhibits that
lottery
expenditures as a
percentage of
income
decrease as
income
increases.
This also
holds true for
Brown,
Kaldenberg, and
Browne
(1992),
even in the
presence of a
pos-
itive
regression
coefficient.
eA
partial
correlation
between
income and
lottery
purchases,
controlling for
education, was
essentially
zero: r =
-.06, p = .17 for
Miyazaki,
Sprott, and
Langenderfer
(1996), and r = .01, p > .50 for
Langender-
fer
(1996).
fThe
income
elasticity
(nY) was not
found to be
significantly
different
from 1.0.
166 State-Sponsored Lotteries
likely that higher-income consumers' attitudes will become more favorable, thus facilitating changes in aggregate lot- tery demand for these consumers.
In addition, as prizes grow larger for lotto games (due to increased participation, the formation of multistate lottery consortiums, and more frequent rollovers caused by decreased odds of winning), higher-income consumers are more attracted to the consequences of winning than when lotto jackpots are relatively small. Various weighted utility theories (cf. Lopes 1995) suggest that a higher ratio of win- nings-to-income or winnings-to-wealth will increase partic- ipation by higher-income (or wealthier) consumers. This often is cited as one of the reasons weekly lotto games have been found to be less regressive than daily numbers games (Clotfelter 1979). From an overall tax incidence perspective, the establishment of a high-jackpot lotto game should make the lottery more progressive (or at least, less regressive).
Finally, new methods of playing current lottery-type games allow for more anonymous consumption (through telephone, mail, Internet, vending machines, and so on). For example, California introduced vending machine play for numbers games in 1989, vending machine play for instant games in 1991, and play by mail in 1994 (California Lottery 1996). Anonymous consumption removes barriers for high- income consumers who may have avoided lotteries because of the stigma associated with playing them (cf. Clotfelter and Cook 1989; Wagman 1986) and, thus, may tend to raise lottery consumption for these consumers who previously were less likely to play. In addition, some of these alterna- tive playing methods may result in lower transaction costs (e.g., a time savings), which, from an economic perspective, would be more valuable to higher-income versus lower- income consumers. Again, this would likely result in a greater increase in play for higher-income people and thus a trend toward less tax regressivity.
Conversely, critics have questioned whether some new types of lottery-related products (such as continuous play keno, video poker, and video lottery terminals) are more attractive to lower-income consumers (cf. Pitcher 1994; Stearns and Borna 1995). If this is true, the introduction of these products would tend to drive the tax incidence of lot- teries to more regressive levels.
Nonlottery Factors Changes in demographic or economic conditions that are extrinsic to the lottery also may shift the tax incidence of a particular state lottery. For example, in a study using state- level lottery data, Vasche (1985) finds that higher unem- ployment rates were associated with higher amounts of lot- tery play. If changes in unemployment disproportionately affect various income groups, the propensity for each group to change lottery purchase behavior would change as well, thereby leading to overall changes in lottery tax incidence rates.
General attitudes toward gambling also are likely to affect attitudes and behaviors related to lottery play. For example, the increasing legalization of casino, riverboat, and reserva- tion gambling may serve to enhance or inhibit consumer attitudes toward gambling in general and lotteries in partic- ular (cf. Johnson 1996). The degree to which changes in atti-
tudes differ across income groups would influence any changes in income-based lottery regressivity.
To test for changes in lottery tax incidence over time, we now examine longitudinal county-level lottery sales data from six lottery states. In addition, we examine several of the factors proposed previously that may influence changes in income-based lottery tax incidence.
A Longitudinal Analysis of Lottery Regressivity Data Six state lottery commissions (California, Florida, Indiana, Minnesota, Nebraska, and Oregon) provided total annual sales data for all counties in each state during a period of several years (the years analyzed depended on both the year of lottery inception for the state and the availability of the data). In addition, annual per capita income and population data for each county were obtained from a variety of public sources, including CACI (1993, 1996), Florida Estimates of Population (1988-95), Florida Statistical Abstract (see Pierce 1994-1995; Shermyen 1989-1993), Hall and Slater (1993), U.S. Bureau of Economic Analysis (1995, 1996), and U.S. Bureau of the Census (1988, 1990, 1994).
Past researchers have used similar county-based data (e.g., Brinner and Clotfelter 1975; Hansen 1995; Mikesell 1989), as well as state-based data (Mikesell 1994; Vasche 1985), for the study of lottery purchase behavior in general and to measure tax incidence in particular. Although some concerns exist regarding the homogeneity of income and lottery purchase distribution across counties in a particular state, the use of county-by-county data (1) eliminates response biases that likely exist in individual-level survey data; (2) allows for the calculation of tax incidence on the basis of the entire population rather than just on players, as is the case when surveys use lottery winners as subjects; and (3) presents a measure that is closer to permanent income, which, being less likely to include transitory elements, will result in less measured regressivity than the use of individ- ual income, thereby representing a conservative measure of regressivity (cf. Hansen 1995; Suits 1977a, b).3
Measuring Regressivity Using the Suits Index Economics and finance literature offer various methods for assessing the tax incidence of a particular revenue source. Considering the nature of the available data, we chose to use the Suits tax concentration index (Suits 1977b) because it allows a summary measure of tax incidence that, when used with county-level data, accounts for differences in popula- tion across counties. The index has been used in prior lottery research (e.g., Clotfelter 1979; Clotfelter and Cook 1987; Livernois 1987; Hansen 1995; Vaillancourt and Grignon 1988).
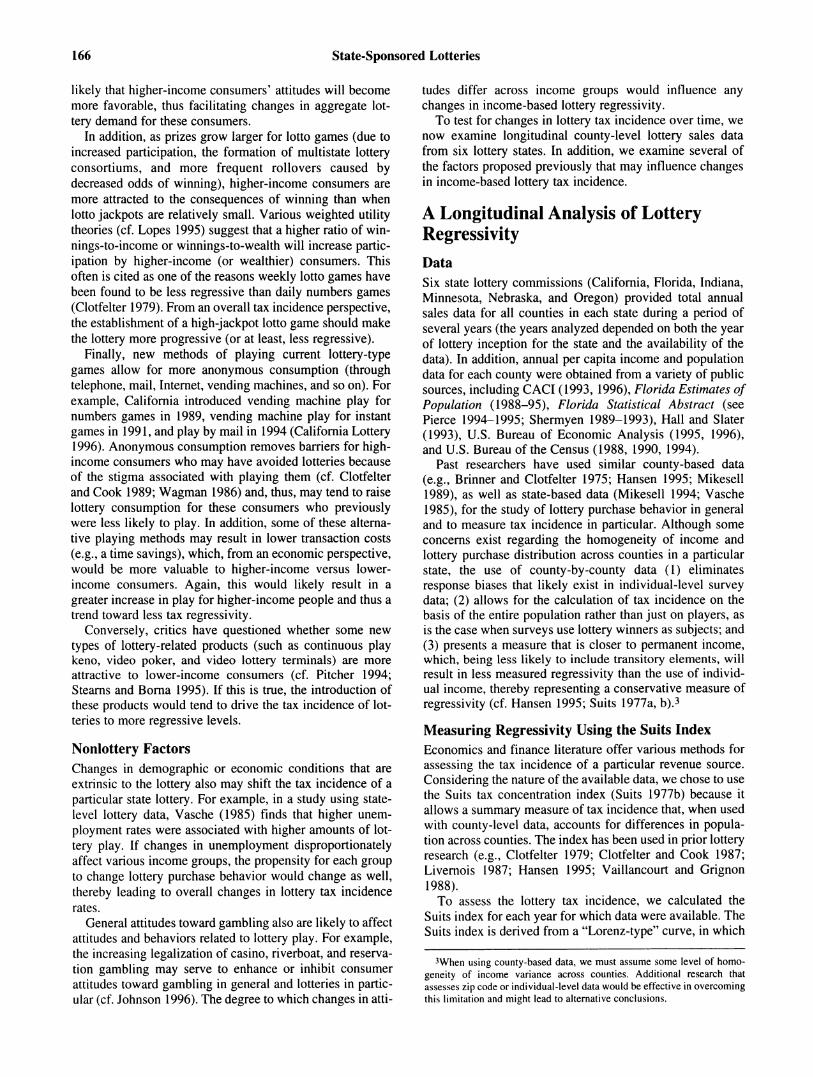
To assess the lottery tax incidence, we calculated the Suits index for each year for which data were available. The Suits index is derived from a "Lorenz-type" curve, in which
3When using county-based data, we must assume some level of homo-
geneity of income variance across counties. Additional research that assesses zip code or individual-level data would be effective in overcoming this limitation and might lead to alternative conclusions.

Journal of Public Policy & Marketing 167
the accumulated percentage of a state's total lottery sales (and hence lottery tax revenue) is plotted on the vertical axis, and the accumulated percentage of total state income is plotted on the horizontal axis. Each county is represented by a point on the curve after the counties have been ranked from poorest to richest in terms of per capita income.
The Suits index is equal to the ratio of the area of the region between the Lorenz curve and the diagonal line to the area of the triangle below the diagonal. Areas below the diagonal are counted as positive, and areas above the diago- nal are counted as negative. In equation form, the Suits index (S) can be defined as
(3) S = (K - L)/K,
or
(4) S = 1 - (L/K),
where L is equal to the area under the Lorenz-type curve for a particular set of data, and K is equal to the area under the diagonal.
If a lottery tax is proportional to income, the accumulated percentage of lottery sales equals the accumulated percent- age of state income, and the Lorenz curve coincides with the diagonal. The Suits index in this case is zero. With a regres- sive lottery tax, the accumulated percentage of lottery sales exceeds the accumulated percentage of state income for each county, and the Lorenz curve arches above the diago- nal. For a more regressive lottery tax, the extent to which the curve deviates from the diagonal is greater and the absolute value of the negative Suits index is larger. If a lottery tax is progressive, the accumulated percentage of lottery sales (and hence tax revenues) is less than the accumulated per- centage of state income, and the Lorenz curve lies below the diagonal. The more progressive the lottery tax, the greater the extent to which the Lorenz curve will dip below the diag- onal and the greater the positive value of the Suits index is.
The Suits index ranges from -1 (representing perfect regressivity) to +1 (indicating perfect progressivity). A Suits index of 0 represents a perfectly proportional tax. Because the Suits index represents population data, no statistical test is needed to determine whether one value differs from another. Also, the shape of the curve may determine the nature of a particular degree of regressivity or progressivity (Calmus 1981).
We illustrate two Lorenz-type curves for the state of Ore- gon in Figure 1. Note that the 1986 data portray a Lorenz curve that is above the diagonal line, because lottery sales are accumulating faster than income, an indication of regres- sive revenue production. Indeed, the calculated Suits index is -. 130. The Lorenz curve for the 1995 data, however, lies close to the diagonal, dipping slightly below because income is accumulating slightly faster than lottery sales, indicating slightly progressive revenue production (and a Suits index of +.007).
Analyzing Changes in Regressivity Measures were acquired for several of the previously dis- cussed factors likely to affect lottery tax incidence. The measures corresponded (by year and state) with the sales and income data collected for each of the state lotteries. Lot- tery commissions from the six states provided data for those
Figure 1. Lottery Tax Incidence Curves for Oregon
Accumulated
Lottery
Sales
1986
1.00
.75
.50
.25
.00 .00 .25 .50 .75 1.00
Accumulated State Income
Accumulated
Lottery
Sales
1995
1.00
.75
.50
.25
.oo00 .00 .25 .50 .75 1.00
Accumulated State Income
factors inherently associated with the lottery, including starting dates of particular game types (instant scratch-off, daily numbers, and lotto), availability of "anonymous" play- ing mechanisms that eliminate face-to-face purchases (e.g., mail, telephone, numbers games vending machines, instant games vending machines), and general sizes of lotto prizes. The only nonlottery factor-annual state unemployment- was obtained from multiple editions of the Statistical Abstract of the United States.
Using the aforementioned factors as predictors of lottery tax incidence, we tested whether and how each factor relates to the Suits measure of tax regressivity for our sample. The unit of measurement for the analyses was annual data for each state. Because of the small sample sizes within states (i.e., the number of calculated Suits indices for each state), all tests were conducted on the full six-state data set. Analy- ses were conducted to examine the predictive ability of lot- tery and nonlottery factors with respect to the measured tax incidence calculations. Additional individual tests were con- ducted to determine longitudinal changes in lottery tax inci- dence, using as independent variables the actual calendar year (representing the national lottery industry life cycle since the reintroduction of lotteries in the United States in 1964) and the number of years of operation for each partic- ular lottery (representing individual state lottery life cycles).

168 State-Sponsored Lotteries
Table 3. Tax Incidence for Six State Lotteriesa
State (Year Lottery Began)
California Florida Indiana Minnesota Nebraska Oregon Year (1985) (1988) (1989) (1990) (1993) (1985) 1986 -.130 1987 -.135 1988 -.086 -.086 1989 -.110 -.106 1990 -.130 -.092 1991 -.143 +.000 +.006 1992 -.152 -.004 -.125 -.013 1993 -.085 -.134 +.003 -.135 -.102 -.031 1994 -.090 -.136 -.008 -.125 -.087 -.001 1995 -.081 -.131 -.025 -.135 -.093 +.007 1996 -.062 -.056 -.165
aEach number is the calculated Suits index, based on aggregated county data.
The initial set of analyses involved individual tests of each factor as a predictor variable and tax incidence levels (i.e., the Suits index) as the criterion variable. The results of these analyses are described subsequently. A second set of analyses-which involved multiple regression and analysis of covariance--considered various sets of predictor vari- ables to reduce error variance and improve sensitivity of each analysis. As a whole, the second set of analyses offered no significant results beyond what were found in the inde- pendent tests. Because they provided no additional informa- tion and are more cumbersome to report, they are not dis- cussed further.
Results In Table 3, we display the calculated Suits index for each year of data for the six states examined. The pattern of tax incidence over time is noticeably different across states. For example, the tax incidence of the Nebraska state lottery was fairly consistent during its first three years of existence. This pattern of tax incidence contrasts with the Florida, Indiana, and Minnesota lotteries, which appear to shift toward more regressivity as time passes. Finally, the tax incidence in Ore- gon and California has become less regressive over time. Indeed, the Oregon lottery has moved from a regressive to a relatively consistent proportional revenue generator.4
The Suits indices presented in Table 3 demonstrate that, even when methodological procedures are held constant, variation in income-based lottery tax incidence is present not only across states, but also over time. Therefore, though the examination of lottery information from just one locale and at just one point in time may be useful for an under- standing of buyer behavior, it is limited in its ability to pre- dict the general state of affairs regarding lottery phenomena, particularly with respect to aspects such as tax incidence.
For example, a statement that the Oregon lottery constitutes a regressive form of taxation would be accurate in 1986 but not in 1995.
Regarding the analyses of potential predictor variables, the tests for unemployment, general jackpot size (repre- sented as the presence or absence of a multimillion-dollar lotto prize), and inception of various games showed no rela- tion to the level of tax incidence. Likewise, actual calendar year (representing overall industry changes) was found to be unrelated to changes in the Suits indices. However, the num- ber of years since the lottery began was related positively to the Suits index (r = .34, p = .045), similar to the findings reported by the data in Table 2. In addition (and as expected), the availability of some type of anonymous play (meaning at least one of the types listed previously) was associated with less regressive tax incidence (Mean S = -.636) than when no anonymous types of play were avail- able (Mean S = -.963; t = 1.85, Pone-tail = .036). The number of anonymous play options available was correlated mar- ginally with the tax incidence (r = .29, p = .086), which sug- gests that, as opportunities for anonymous play increase, income-based regressivity decreases. This provides prelimi- nary evidence that at least one marketing factor-the provi- sion of anonymous play in this case-may influence not only lottery sales, but also the distribution of lottery pur- chases over groups of varying incomes.
Discussion and Conclusions The research presented here provides the most extensive examination of lottery tax incidence to date. Although pre- vious research (presented in Table 2) consists of 27 assess- ments of lottery tax incidence across 11 states (in 14 differ- ent academic presentations), we present here (in Table 3) 36 lottery tax incidence calculations across 6 states. A primary benefit of this research versus prior work is that all tax inci- dence calculations can be compared easily because they are based on similar data and analyses. Although the data set used is not exhaustive, the analyses illustrate that income- based regressivity of state-sponsored lotteries can change over time. Although the pattern of change varies from state
4Hansen (1995) notes that the use of aggregated county data may result in lower magnitude calculations of regressivity or progressivity as mea- sured by the Suits index because there typically will be a more equal dis- tribution of income and lottery expenditures across counties than across individuals. This essentially serves to make the current effort a conserva- tive analysis of the effect over time.

Journal of Public Policy & Marketing 169
to state, both past and present research findings suggest that lotteries in general become less regressive as they mature. Interpretation of these findings should be made with some caution, however, because the relatively short time periods used in the longitudinal analysis leave open the possibility of cyclical trends that are not captured in this data set. In addi- tion, because it is unclear what factors are driving this effect, further research is needed to clarify the nature of these trends. At the very least, our research demonstrates the need for a shift from single time period research to research that involves multiple time periods, so that changes in lottery phenomena can be tracked and interpreted appropriately.
The results of the predictor variable analysis provide pre- liminary evidence that marketer-controlled factors may affect the level of income-based lottery tax regressivity. Again, the implications of these results must be considered with respect to other factors. For example, though it may appear that the introduction of anonymous types of play leads to less income-based regressivity, we have no infor- mation regarding the potential for this type of marketing channel to result in increases in illegal play (i.e., by minors) or compulsive consumption.
It should be noted that the determination of how income- based tax incidence will change is a complex matter that must consider multiple factors. The addition of a lotto game might occur as state unemployment of lower-income citi- zens increases, which causes (hypothetically) simultaneous decreases and increases in regressivity (cf. Vasche 1985). The combination of multiple influencing factors might result in positive, negative, or null effects on ultimate tax incidence. Therefore, the null findings of certain factors explored in our research do not suggest necessarily that they have no effect on regressivity.
Lottery Policy Research from a Marketing Perspective A large majority of lottery studies has been published in economics, policy management, and finance journals; rela- tively few can be found in the marketing literature. This is not due to a shortage of marketing-related policy issues regarding government-sponsored lotteries. Indeed, researchers have raised issues such as the potential for com- pulsive consumption (Bums et al. 1990; Cordtz 1990; Lorenz 1990; Steams and Borna 1995; Wagman 1986), the effects of marketing practices on subjective odds probabili- ties (Bohm and Lind 1993; Browne and Brown 1994; Cole and Hastie 1978; Holtgraves and Skeel 1992; Shapira and Venezia 1992; Sprott, Hardesty, and Miyazaki 1998), and the viability of privately run lotteries (Clotfelter and Cook 1989; Seligman 1994). Other researchers have suggested that current marketing practices may be in violation of pre- sent legislation, particularly regarding the potential for deceptive advertising (Clotfelter and Cook 1989; Petty 1996; Steams and Borna 1995). Similarly, some have pro- posed that lottery advertising may promote misunderstand- ings of lottery odds (Herring and Bledsoe 1994), even to the point that certain information may affect consumers' sub- jective probabilities of winning (Sprott, Miyazaki, and Brumbaugh 1997; Steams and Borna 1995; Taylor and Kopp 1991).
Many state governments (particularly when lottery earn- ings are less than anticipated) use a variety of what some researchers consider aggressive marketing practices (Clot- felter and Cook 1987, 1989; Herring and Bledsoe 1994). Some of these practices include online keno games that are sold every five minutes from 6:00 A.M. to past midnight in Kansas (Lotto World 1996b); lottery tickets sold in vending machines in Florida, Iowa, and Pennsylvania (Lotto World 1996a; Pennsylvania Lottery 1993); and the Illinois "Play Lotto By Mail" program wherein subscribers can charge lot- tery ticket purchases to credit cards and order by mail or by using a toll-free number (Illinois Lottery 1995).
Finally, the policy issue of concern here-the distribution of lottery sales across various income groups-typically has been studied from a strict economic perspective. Yet the effects of lotteries on consumers, in many ways, are influ- enced by marketing and policy decisions made at both state and national levels. The conceptual and methodological strengths of consumer behavior research could be employed to understand these issues further. For example, researchers have just begun to determine the underlying reasons some consumers are willing to purchase a gamble that, from a strict monetary perspective, typically has an expected value about one-half its price (cf. McCaffery 1994; Miyazaki, Langenderfer, and Sprott 1999).
Conclusions In the United States, lotteries are unique in that the same state government that regulates the product also develops, produces, and promotes the product and its image. This sit- uation has led to many debates between those interested in promotion and those concerned with regulation. Participants of these two groups include legislators, marketing and advertising practitioners, government (i.e., lottery commis- sion) personnel, academicians, consumers, and consumer groups. As lotteries broaden their distribution in the United States and abroad, they are likely to become an even greater policy concern than they currently are. Much has been learned since the reintroduction of lotteries to the United States in 1964. However, further research is needed as state lotteries grow and progress through their various stages.
Although our research has not been conclusive regarding the direction that marketers or policymakers should take with respect to lottery revenue generation and related mar- keting practices, the findings do provide evidence that mar- keting activities have at least some impact on the purported regressivity that many lotteries experience. As lottery rev- enues increase, so will the motivation for marketing researchers to investigate further the influence of marketer- related factors, such as product and distribution innovations, image management, and prize structure manipulations on lottery purchase behavior. As this body of research grows, both marketers and policymakers will be better equipped to discuss policy and legislation related to the marketing of government-sponsored lotteries.
References Advertising Age (1993), "Clean Up Lottery Ads," 64 (May 17), 20.

170 State-Sponsored Lotteries
Aim, James, Michael McKee, and Mark Skidmore (1993), "Fiscal Pressures, Tax Competition, and the Introduction of State Lot- teries," National Tax Journal, 46 (December), 463-73.
Blakey, G. Robert (1979), "State Conducted Lotteries: History, Problems, and Promises," Journal of Social Issues, 35 (3), 62-86.
Bohm, Peter and Hans Lind (1993), "Preference Reversal, Real- World Lotteries, and Lottery-Interested Subjects," Journal of Economic Behavior and Organization, 22 (December), 327-48.
Borg, Mary 0. and Paul M. Mason (1988), "The Budgetary Inci- dence of a Lottery to Support Education," National Tax Journal, 41 (March), 75-85.
-, -, and Stephen L. Shapiro (1993), "The Cross Effects of Lottery Taxes on Alternative State Tax Revenue," Public Finance Quarterly, 21 (April), 123-40.
Brinner, Roger E. and Charles T. Clotfelter (1975), "An Economic Appraisal of State Lotteries," National Tax Journal, 28 (Decem- ber), 395-404.
Brown, Daniel J., Dennis O. Kaldenberg, and Beverly A. Browne (1992), "Socioeconomic Status and Playing the Lotteries," Soci- ology and Social Research, 76 (April), 161-67.
Browne, Beverly A. and Daniel J. Brown (1994), "Predictors of Lottery Gambling Among American College Students," Journal of Social Psychology, 134 (3), 339-47.
Burns, Alvin C., Peter L. Gillett, Marc Rubinstein, and James W. Gentry (1990), "An Exploratory Study of Lottery Playing, Gam- bling Addiction and Links to Compulsive Consumption," in Advances in Consumer Research, Vol. 17, Marvin E. Goldberg, Gerald Gorn, and Richard W. Pollay, eds. Provo, UT: Associa- tion for Consumer Research, 298-305.
CACI (1993), The Sourcebook of County Demographics, 6th ed. Arlington, VA: CACI Marketing Systems.
- (1996), The Sourcebook of County Demographics, 9th ed. Arlington, VA: CACI Marketing Systems.
California Lottery (1996), 1996 Annual Report. Sacramento, CA: California Lottery.
Calmus, Thomas W. (1981), "Measuring the Regressivity of Gam- bling Taxes," National Tax Journal, 34 (June), 267-70.
Clotfelter, Charles T. (1979), "On the Regressivity of State-Oper- ated 'Numbers' Games," National Tax Journal, 32 (March), 546-47.
- and Philip J. Cook (1987), "Implicit Taxation in Lottery Finance," National Tax Journal, 40 (December), 533-46.
- and - (1989), Selling Hope: State Lotteries in Amer- ica. Cambridge, MA: Harvard University Press.
- and - (1990), "Redefining 'Success' in the State Lottery Business," Journal of Policy Analysis and Management, 9 (Winter), 99-104.
Cole, William R. and Reid Hastie (1978), "The Effects of Lottery Play Game Structure and Format on Subjective Probability and Attractiveness of Gambles," Personality and Social Psychology Bulletin, 4 (4), 608-11.
Cordtz, Dan (1990), "Betting the Country," FW, (February 20), 22-26.
Florida Estimates of Population (1988, 1989, 1990, 1991, 1992, 1993, 1994, 1995), prepared by the Population Program, Bureau of Economic and Business Research, College of Business Administration, University of Florida.
Florida Lottery (1996), "Educational Support," (World Wide Web Internet site, accessed December 12, 1996), [http://www.flalot- tery.com/edu/flotedu.stm].
Gulley, O. David and Frank A. Scott Jr. (1993), "The Demand for
Wagering on State-Operated Lotto Games," National Tax Jour- nal, 46 (March), 13-22.
Hall, George E. and Courtenay M. Slater, eds. (1993), 1993 County and City Extra, Annual Metro, City, and County Data Book, 2d ed. Lanham, MD: Bernan Press.
Hansen, Ann (1995), "The Tax Incidence of the Colorado State
Lottery Instant Game," Public Finance Quarterly, 23 (July), 385-98.
Heavey, Jerome F. (1978), "The Incidence of State Lottery Taxes," Public Finance Quarterly, 6 (October), 415-26.
Herring, Mary and Timothy Bledsoe (1994), "A Model of Lottery Participation: Demographics, Context, and Attitudes," Policy Studies Journal, 22 (2), 245-57.
Hill, Ronald Paul (1995), "Researching Sensitive Topics in Mar-
keting: The Special Case of Vulnerable Populations," Journal of Public Policy & Marketing, 14 (1), 143-48.
Holtgraves, Thomas and James Skeel (1992), "Cognitive Biases in
Playing the Lottery: Estimating the Odds and Choosing the Numbers," Journal of Applied Social Psychology, 22 (12), 934-52.
Illinois Lottery (1995), Illinois Lottery 1995 Annual Report. Springfield, IL: Illinois Lottery.
Jackson, Raymond (1994), "Demand for Lottery Products in Mass- achusetts," Journal of Consumer Affairs, 28 (Winter), 313-25.
Johnson, George (1996), "Dispute over Indian Casinos in New Mexico Produces Quandary on Law and Politics," New York Times, (August 18), 24L.
Kallick, Maureen, Daniel Suits, Ted Dielman, and Judith Hybels (1977), A Survey of American Gambling Attitudes and Behavior, Appendix 2 to Gambling in America. Washington, DC: U.S. Government Printing Office, 052-003-00254-0. (Reprinted in Research Report Series [1979], Ann Arbor, MI: Institute for Social Research, University of Michigan.)
Kaplan, H. Roy (1987), "Lottery Winners: The Myth and Reality," Journal of Gambling Behavior, 3 (Fall), 168-78.
Kinsey, Robert K. (1963), "The Role of Lotteries in Public Finance," National Tax Journal, 16 (March), 1 1-19.
Koza, John R. (1982), "The Myth of the Poor Buying Lottery Tick- ets," Public Gaming, (January), 31-50
Langenderfer, Jeff (1996), "Lotteries and Education: The Mediat-
ing Effect of Illusion of Control," in Marketing and Public Pol- icy Conference Proceedings, Vol. 6, Ronald Paul Hill and Charles Ray Taylor, eds. Chicago: American Marketing Associ- ation, 190-98.
Livernois, John R. (1987), "The Redistributive Effects of Lotteries: Evidence From Canada," Public Finance Quarterly, 15 (July), 339-51.
Lopes, Lola L. (1995), "Algebra and Process in the Modeling of Risky Choice," in Decision Making from a Cognitive Perspec- tive, Vol. 32 of The Psychology of Learning and Motivation, Jerome Busemeyer, Reid Hastie, and Douglas L. Medin, eds. 177-220.
Lorenz, Valerie C. (1990), "State Lotteries and Compulsive Gam- bling," Journal of Gambling Studies, 6 (Winter), 383-96.

Journal of Public Policy & Marketing 171
Lotto World (1996a), "Iowa Lottery Information: One on One Interview," (World Wide Web Internet site, accessed December 12, 1996), [http://www.lottoworldmagazine.com/0_ial.html].
- (1996b), "Kansas Lottery Information: One on One Inter- view," (World Wide Web Internet site, accessed December 12, 1996), [http://www.lottoworldmagazine.com/0_ks l.html].
- (1996c), "Michigan Lottery Information: One on One Interview," (World Wide Web Internet site, accessed December 12, 1996), [http://www.lottoworldmagazine.com/0_mil.html].
McCaffery, Edward J. (1994), "Why People Play the Lotteries and Why It Matters," Wisconsin Law Review, 1994 (1), 71-122.
McConkey, C. William and William E. Warren (1987), "Psycho- graphic and Demographic Profiles of State Lottery Ticket Pur- chasers," Journal of Consumer Affairs, 21 (Winter), 314-27.
Meinert, David B., James R. Lumpkin, and Robert V. Reich (1989), "Public Opinions Toward State Lotteries: A Comparison of Non-Player and Player Views," Journal of Social Behavior and Personality, 4 (5), 481-90.
Mikesell, John L. (1989), "A Note on the Changing Incidence of State Lottery Finance," Social Science Quarterly, 70 (June), 513-21.
- (1994), "State Lottery Sales and Economic Activity," National Tax Journal, 47 (March), 165-71.
- and Kurt Zorn (1988), "State Lotteries for Public Rev- enue," Public Budgeting and Finance, 8 (Spring), 38-47.
Miyazaki, Anthony D., Jeff Langenderfer, and David E. Sprott (1999), "The Consumption of Government-Sponsored Lotteries: Exploring Purchase and Nonpurchase Motivations," Psychology & Marketing, forthcoming.
-, David E. Sprott, and Jeff Langenderfer (1996), "Method- ological Issues in Public Policy Research: The Case of Educa- tion and Lottery Purchase Behavior," in Marketing and Public Policy Conference Proceedings, Vol. 6, Ronald Paul Hill and Charles Ray Taylor, eds. Chicago: American Marketing Associ- ation, 181-89.
Montana Lottery (1994), 1994 Annual Report. Helena, MT: Mon- tana Lottery.
New Jersey Lottery (1996), New Jersey Lottery 1995-96 Annual Report. Trenton, NJ: New Jersey Lottery.
Pennsylvania Lottery (1993), Pennsylvania Lottery Annual Report 1992-1993. Middletown, PA: Pennsylvania Lottery.
Petty, Ross D. (1996), "Federalism and the Regulation of State Lot- tery Marketing Practices," in Marketing and Public Policy Con- ference Proceedings, Vol. 6, Ronald Paul Hill and Charles Ray Taylor, eds. Chicago: American Marketing Association, 180.
Phillips, Frank (1996), "Malone Orders Lottery to Pull Ad," Boston Globe, (March 13), 21.
Pierce, Ann C., ed. (1994-1995), Florida Statistical Abstract, 28th-29th editions, Bureau of Economic and Business Research. Gainesville, FL: Univeristy Press of Florida.
Pitcher, George (1994), "A Tax by Any Other Name," Marketing Week, (November 18), 29.
Radding, Alan and Scott Hume (1991), "Old Lotteries Freshen Up," Advertising Age, 62 (March 25), 12.
Redifer, John D. (1996), "By the Numbers: State Lotteries Under Scrutiny," Public Administration Review, 56 (1), 108-109.
Rodgers, William M. and Charles Stuart (1995), "The Efficiency of a Lottery as a Source of Public Revenue," Public Finance Quarterly, 23 (April), 242-54.
Seligman, Daniel (1994), "Legalizing Raymond," Fortune, 129 (May 30), 173.
Selinger, Iris Cohen (1993), "The Big Lottery Gamble," Advertis- ing Age, 64 (May 10), 22-28.
Shapira, Zur and Itzhak Venezia (1992), "Size and Frequency of Prizes as Determinants of the Demand for Lotteries," Organiza- tional Behavior and Human Decision Processes, 52 (July), 307-18.
Shermyen, Anne H., ed. (1989-1993), Florida Statistical Abstract, 23d-27th editions, Bureau of Economic and Business Research. Gainesville, FL: University Press of Florida.
Slingsby, Helen (1994), "A Big Hand for the National Lottery," Marketing Week, 17 (November 11), 23-24.
Spindler, Charles J. (1995), "The Lottery and Education: Robbing Peter to Pay Paul?" Public Budgeting and Finance, 15 (Fall), 54-62.
Spiro, Michael H. (1974), "On the Incidence of the Pennsylvania Lottery," National Tax Journal, 27 (March), 57-61.
Sprott, David E., David M. Hardesty, and Anthony D. Miyazaki (1998), "Disclosure of Odds Information: An Experimental Investigation of Odds Format and Numeric Complexity," Jour- nal of Public Policy & Marketing, 17 (Spring), 11-23.
-, Anthony D. Miyazaki, and Anne M. Brumbaugh (1997), "A Psychological Approach to Lottery Consumption: The Role of Psychological Control," in Marketing and Public Policy Pro- ceedings, Vol. 7, Easwar S. Iyer and George R. Milne, eds. Chicago: American Marketing Association, 61.
Stearns, James M. and Shaheen Borna (1995), "The Ethics of Lot- tery Advertising: Issues and Evidence," Journal of Business Ethics, 14 (January), 43-51.
Suits, Daniel B. (1977a), "Gambling Taxes: Regressivity and Rev- enue Potential," National Tax Journal, 30 (March), 19-35.
- (1977b), "Measurement of Tax Progressivity," American Economic Review, 67 (September), 747-52.
Szakmary, Andrew and Carol Matheny Szakmary (1995), "State Lotteries as a Source of Revenue: A Re-Examination," Southern Economic Journal, 61 (April), 1167-81.
Taylor, Charles R. and Steven W. Kopp (1991), "Games, Contests, and Sweepstakes Run Afoul: A State of Legal Disorder," Jour- nal of Public Policy & Marketing, 10 (1), 199-213.
Thiel, Stuart E. (1991), "Policy, Participation, and Revenue in Washington State Lotto," National Tax Journal, 44 (June), 225-35.
U.S. Bureau of Economic Analysis (1995), "Total Personal Income and Per Capita Personal Income by County," Survey of Current Business, (April), U.S. Department of Commerce, Economics and Statistics Administration. Washington, DC: United States Government Printing Office.
- (1996), "Total Personal Income and Per Capita Personal Income by County," Survey of Current Business, (June), U.S. Department of Commerce, Economics and Statistics Adminis- tration. Washington, DC: United States Government Printing Office.
U.S. Bureau of the Census (1988), County and City Data Book, A Statistical Abstract Supplement. Washington, DC: United States Government Printing Office.

172 State-Sponsored Lotteries
--- (1990), 1990 Census of the Population: Social and Eco- nomic Characteristics-Oregon. Washington, DC: United States Government Printing Office, CP-2-39.
--- (1994), County and City Data Book, A Statistical Abstract Supplement. Washington, DC: United States Government Print- ing Office.
--- (1996), "Income and Apportionment of State-Adminis- tered Lottery Funds," (World Wide Web Internet site, accessed November 11, 1996), [http://www.census.gov/ftp/pub/govs/ state/94stlott.txt].
U.S. Senate (1985), State Lotteries: An Overview, hearing before the Subcommittee on Intergovernmental Relations of the Com- mittee on Governmental Affairs, 98th Congress, 2d Session, (October 3, 1984). Washington, DC: U.S. Government Printing Office.
Vaillancourt, Franqois and Julie Grignon (1988), "Canadian Lot- teries as Taxes: Revenues and Incidence," Canadian Tax Jour- nal (Revue Fiscale Canadienne), 36 (March-April), 369-88.
Vasche, Jon David (1985), "Are Taxes on Lotteries Too High?" Journal of Policy Analysis and Management, 4 (Winter), 269-71.
Wagman, Robert J. (1986), Instant Millionaires: Cashing in on America's Lotteries. Bethesda, MD: Woodbine House.
Williams, Jackie, Richard Mizerski, and Katherine Straughn (1994), "Ethnic Differences in State Lottery Play," paper pre- sented at the 1994 Association for Consumer Research Confer- ence, Boston, MA.
Wulf, Henry S. (1997), personal e-mail correspondence (with attachments for 1995 and 1996 lottery data), October 30 ([email protected]).