Incidence of diabetes in Asian-Indian subjects: A five year follow-up study from Bangladesh
8
p r i m a r y c a r e d i a b e t e s 5 ( 2 0 1 1 ) 117–124 Contents lists available at ScienceDirect Primary Care Diabetes j o u r n a l h o m e p a g e : h t t p : / / w w w . e l s e v i e r . c o m / l o c a t e / p c d Original research Incidence of diabetes in Asian-Indian subjects: A five year follow-up study from Bangladesh Shaheen Asghar a , Abul Kalam Azad Khan b , Sha Mohammed Keramat Ali c , Mohammed Abu Sayeed b , Bishwajit Bhowmik a,b , My Lien Diep d , Zumin Shi a , Akhtar Hussain a,∗ a Inst of Health and Society/Dept. of International Health, University of Oslo, Oslo, Norway b Bangladesh Institute of Research and Rehabilitation in Diabetes, Endocrine & Metabolic Disorders (BIRDEM), Dhaka, Bangladesh c Inst. for Nutrition and Food Sciences, University of Dhaka, Bangladesh d Aker University Hospital, Research Centre, Oslo, Norway a r t i c l e i n f o Article history: Received 28 July 2009 Received in revised form 11 May 2010 Accepted 7 January 2011 Available online 9 February 2011 Keywords: Asian-Indian Bangladesh Diabetes Follow-up Incidence a b s t r a c t Aims: To determine the incidence of Type 2 diabetes and its risk factors. Further, to examine the effect of relative changes in obesity (BMI and waist circumference). Methods: A sample of 2011 non-diabetic adults aged 20 and above were randomly selected and followed from 1999 to 2004. Fasting blood glucose including biophysical and anthropometric measures was measured. Results: The overall 5 year cumulative incidence of diabetes was 16.4 per 1000 person-years and 65.1 per 1000 person-years in those with impaired fasting glucose adjusted for age and sex. Among obesity measures, only waist >85 in. increased the risk for diabetes in males (RR = 3.0). Relative changes stratified by loss in BMI and WC ≥5% or gain of BMI >15% from the baseline values for men were significantly associated with the incidental cases of diabetes. Increased hip circumference for men was significantly associated with a protective effect while an opposite association was observed for women. Conclusion: Relative change in both loss and excessive gain of BMI were risks for increased diabetes. Targeted intervention in those with impaired fasting blood glucose will expectedly reduce the incidental cases. Further investigations are needed for non obese related diabetes in Asian Indian subjects. © 2011 Primary Care Diabetes Europe. Published by Elsevier Ltd. All rights reserved. 1. Introduction Current projections estimate that the absolute number of cases of diabetes worldwide may double over the next two decades, leading to a commensurate increase in the human, ∗ Corresponding author at: Dept. of International Health, University of Oslo, Fredrik Holsts House, Ullevål Terrace, P.O. Box 1130 Blindern, 0317 Oslo, Norway. Tel.: +47 22850641/22850643; fax: +47 22850672. E-mail address: [email protected] (A. Hussain). social, and economic costs of the disease [1]. The correspond- ing number of subjects with diabetes would then increase from 171 million to 366 million by the year 2030 [2]. Asia is emerging as the epicentre of this epidemic [3]. This is due to the fact that the region contains most of the populous countries in the world, with most pronounced demographic, epidemiologic, and socio-economic changes in recent times. 1751-9918/$ – see front matter © 2011 Primary Care Diabetes Europe. Published by Elsevier Ltd. All rights reserved. doi:10.1016/j.pcd.2011.01.002
-
Upload
independent -
Category
Documents
-
view
2 -
download
0
Transcript of Incidence of diabetes in Asian-Indian subjects: A five year follow-up study from Bangladesh
Journal Identification = PCD Article Identification = 201 Date: June 13, 2011 Time: 3:42 pm
O
If
SMAa
b
c
d
a
A
R
R
1
A
A
K
A
B
D
F
I
1
Ccd
0
1d
p r i m a r y c a r e d i a b e t e s 5 ( 2 0 1 1 ) 117–124
Contents lists available at ScienceDirect
Primary Care Diabetes
j o u r n a l h o m e p a g e : h t t p : / / w w w . e l s e v i e r . c o m / l o c a t e / p c d
riginal research
ncidence of diabetes in Asian-Indian subjects: A five yearollow-up study from Bangladesh
haheen Asghara, Abul Kalam Azad Khanb, Sha Mohammed Keramat Ali c,ohammed Abu Sayeedb, Bishwajit Bhowmika,b, My Lien Diepd, Zumin Shia,khtar Hussaina,∗
Inst of Health and Society/Dept. of International Health, University of Oslo, Oslo, NorwayBangladesh Institute of Research and Rehabilitation in Diabetes, Endocrine & Metabolic Disorders (BIRDEM), Dhaka, BangladeshInst. for Nutrition and Food Sciences, University of Dhaka, BangladeshAker University Hospital, Research Centre, Oslo, Norway
r t i c l e i n f o
rticle history:
eceived 28 July 2009
eceived in revised form
1 May 2010
ccepted 7 January 2011
vailable online 9 February 2011
eywords:
sian-Indian
angladesh
iabetes
ollow-up
a b s t r a c t
Aims: To determine the incidence of Type 2 diabetes and its risk factors. Further, to examine
the effect of relative changes in obesity (BMI and waist circumference).
Methods: A sample of 2011 non-diabetic adults aged 20 and above were randomly selected and
followed from 1999 to 2004. Fasting blood glucose including biophysical and anthropometric
measures was measured.
Results: The overall 5 year cumulative incidence of diabetes was 16.4 per 1000 person-years
and 65.1 per 1000 person-years in those with impaired fasting glucose adjusted for age and
sex. Among obesity measures, only waist >85 in. increased the risk for diabetes in males
(RR = 3.0). Relative changes stratified by loss in BMI and WC ≥5% or gain of BMI >15% from the
baseline values for men were significantly associated with the incidental cases of diabetes.
Increased hip circumference for men was significantly associated with a protective effect
while an opposite association was observed for women.
ncidence Conclusion: Relative change in both loss and excessive gain of BMI were risks for increased
diabetes. Targeted intervention in those with impaired fasting blood glucose will expectedly
reduce the incidental cases. Further investigations are needed for non obese related diabetes
in Asian Indian subjects.
ry Ca
© 2011 Prima. Introduction
urrent projections estimate that the absolute number ofases of diabetes worldwide may double over the next twoecades, leading to a commensurate increase in the human,
∗ Corresponding author at: Dept. of International Health, University of O317 Oslo, Norway. Tel.: +47 22850641/22850643; fax: +47 22850672.
E-mail address: [email protected] (A. Hussain).751-9918/$ – see front matter © 2011 Primary Care Diabetes Europe. Puoi:10.1016/j.pcd.2011.01.002
re Diabetes Europe. Published by Elsevier Ltd. All rights reserved.
social, and economic costs of the disease [1]. The correspond-ing number of subjects with diabetes would then increasefrom 171 million to 366 million by the year 2030 [2]. Asia is
slo, Fredrik Holsts House, Ullevål Terrace, P.O. Box 1130 Blindern,
emerging as the epicentre of this epidemic [3]. This is dueto the fact that the region contains most of the populouscountries in the world, with most pronounced demographic,epidemiologic, and socio-economic changes in recent times.
blished by Elsevier Ltd. All rights reserved.

Journal Identification = PCD Article Identification = 201 Date: June 13, 2011 Time: 3:42 pm
e t e s
118 p r i m a r y c a r e d i a bThis estimate for the rate and risk factors is based primar-ily on projections of prevalence data, because of the paucityof population-based Type 2 diabetes incidence data. The het-erogeneity of type 2 diabetes and its recognized polygenicbasis and dependence on environmental factors all call forpopulation-based, ethnically focused, and country/continent-specific studies of type 2 diabetes incidence.
Body mass index (BMI), waist circumference (WC), andwaist/hip ratio (WHR) have been shown to be associated withType 2 diabetes. However, this association was found to behighly enthnically sensitive. Nevertheless, all these informa-tion were derived from cross-sectional data. Previous reportshave shown that central adiposity is a better indicator of thedevelopment of diabetes in Asian Indian and Bangladeshi sub-jects [4–6].
Incidence rates and risk factors for Type 2 diabetes inlean populations are not well documented. We investigatedthe incidence of diabetes and assessed its relative risk ina lean rural population of Bangladesh, age 20 years andabove. Furthermore, the impact of changed central obesity(WHR), general obesity (BMI) and blood pressure (BP) were alsoassessed.
2. Methods
2.1. Population and participation rates
The sample was selected from a rural community 35 milesnorth of Dhaka city called “Chandra”. This is an agrarian com-munity, largely engaged in manual labour activities, typicalfor rural population. Ten villages were randomly selected fromfive areas with a population of approximately 20,000. All theindividuals were then given an identification number includ-ing a household number. Among those, 5000 subjects, age >20years, were selected following a simple random procedure. Ofthese 4757 (95%) subjects agreed to participate and were inves-tigated. A detailed description of the sample population wasdescribed elsewhere [7].
In brief, all those who were considered diabetic by theWorld Health Organization criteria, n = 108 were excluded,leaving 4649 individuals. Among those, 2800 individuals wereselected based on their duration of residence in the village for 5or more years. They were then followed for 5 years (1999–2004).No significant difference was found for the demographic oranthropometric variables (age, BMI, WHR) between those whowere selected for follow-up (n = 2800) and those who wereexcluded from follow-up (n = 1849). The selection criteria wereused to secure a follow-up period of 5 years. Of these, 2011were again participated in a study in 2004 (follow-up rate 72%).Incident cases of diabetes were ascertained by a fasting wholeblood capillary glucose following the WHO new diagnosticcriteria [8]. Identical procedure was followed at inclusionin 1999.
2.2. Diabetes and IFG
All the participants (n = 2011) visited a nearby field centre afteran overnight fast of 8–12 h. On arrival, initial blood glucose (BG)
5 ( 2 0 1 1 ) 117–124
from capillary whole blood was measured to estimate the fast-ing blood glucose (FBG) using a HEMOCUE glucose analyzer.Those with fasting whole blood glucose level >6.1 mmol/L(>110 mg/100 mL) were considered to have diabetes. IFG wasdefined as fasting whole blood glucose level of >5.6–6.0 mmol/L(>100 to <110 mg/100 mL). An identical procedure was alsoapplied in 1999 at inclusion.
2.3. Interview
During the 2-h waiting period the respondents wereinterviewed for socio-demographic information and anthro-pometric measurements including height, weight, hip andwaist circumference, were taken. In addition, blood pres-sure was measured. Both anthropometric measures and bloodpressure were recorded in the same procedure described pre-viously [4].
2.4. Ethics
Verbal consent was received from all subjects prior to inclu-sion in the study. A procedure was adopted to includerandomly selected subjects. However, since a large numberof the subjects were illiterate this may have potentially intro-duced a bias. Verbal orientation of the objectives and theprocedure were read aloud to the subjects, including theirright to refuse and to withdraw at any stage of the study to bartheir data from analyses. The protocol was approved both bythe Norwegian and Bangladesh Ethical Committee for MedicalResearch.
2.5. Data analysis
Data were registered using Microsoft Access data entry pro-gram. The incidence rates of Type-2 diabetes and impairedfasting glucose (IFG) were determined by simple percent-ages. Paired sample t-tests were used to test for thedifferences between 1999 and 2004 in age, body massindex, waist circumference, and waist-hip ratio, systolicand diastolic blood pressure (SBP and DBP). Associationsbetween two continuous variables were estimated by Pearsoncorrelations.
Relative changes of the covariates BMI, WC, WHR, andSBP were assessed by taking into consideration the differencebetween the base-line (1999) and evaluation (2004) values,dividing this by the base-line values of the covariates and mul-tiplying by 100. The relative changes were categorized into 4groups before analysis: ≤ to −5% (loss), −5% to +5% (stable),+5% to +10% (gain) and >10% (high gain).
In men, the correlation coefficients between the relativechanges were 0.45 for waist and BMI, 0.58 for waist and hip,0.70 for waist and WHR, 0.35 (BMI and hip), 0.25 (BMI and WHR),−0.11 (hip and WHR). In women, the correlation coefficientsbetween the relative changes were 0.53 for waist and BMI, 0.58for waist and hip, 0.73 for waist and WHR, 0.41 (BMI and hip),0.31 (BMI and WHR), −0.08 (hip and WHR).
Multivariate analyses of general linear models for thebinary outcome with log link function were used to estimatethe effects of the risk factors in 1999 and the relative changeson diabetes. Relative risks and 95% confidence intervals are

Journal Identification = PCD Article Identification = 201 Date: June 13, 2011 Time: 3:42 pm
p r i m a r y c a r e d i a b e t e s 5 ( 2 0 1 1 ) 117–124 119
Table 1 – Description of the study variables of interest for 1999 and 2004.
Variables Mean 1999 95% CI Mean 2004 95% CI p-Value for difference 95% CI for difference
WomenBMI 19.6 19.5–19.8 20.7 20.6–20.9 <0.0001 1.1 (1.1–1.4)WC (in cm) 66.7 66.3–67.1 72.7 72.2–73.2 <0.0001 6.0 (5.7–6.4)Hip (in cm) 81.2 80.9–81.6 85.7 85.3–86.1 <0.0001 4.5 (4.2–4.8)WHR 0.841 0.838–0.844 0.862 0.859–0.865 <0.0001 0.021 (0.018–0.024)Systolic BP 119.8 119.0–120.6 121.3 120.5–122.1 0.0004 1.5 (0.7–2.4)Diastolic BP 77.6 77.0–78.2 77.8 77.2–78.4 0.522 0.2 (−0.5–0.9)FBG 4.66 4.61–4.71 4.94 4.87–5.01 <0.0001 0.28 (0.22–0.35)
MenBMI 19.7 19.5–19.9 20.5 20.3–20.8 <0.0001 0.8 (0.7–1.0)WC (in cm) 71.4 70.8–72.0 74.8 74.1–75.4 <0.0001 3.4 (2.9–3.8)Hip (in cm) 80.9 80.5–81.4 83.7 83.2–84.2 <0.0001 2.8 (2.4–3.1)WHR 0.882 0.877–0.886 0.892 0.887–0.897 <0.0001 0.010 (0.006–0.015)Systolic BP 119.3 118.0–120.6 121.6 120.3–123.0 0.0006 2.4 (1.0–3.7)
74
ptotTm
Sc
Diastolic BP 77.7 76.9–78.5 78.2
FBG 4.73 4.65–4.81 4.96
resented. Likelihood ratio tests were used to assess whetherhe effects of BMI, waist, hip and WHR depending on levelsf sex. We found significant interaction effects between rela-ive changes in hip and sex (p = 0.034), BMI and sex (p = 0.045).herefore we performed separate multivariate analyses foren and women.
The analyses were performed in statistical softwaretata/SE version 9.2 for Windows [9]. Two sided p-values wereonsidered for statistical significance.
Table 2 – Incidence rate of diabetes per 1000 person years with
Variables n Diabetescases p
Total
Age20–30 545 21
31–40 647 59
41–50 374 30
>50 445 55
SexWomen 1333 100
Men 678 65
BMI<18.4 548 41
18.5–23.0 1018 77>23.0 445 47
WHR≤0.8 women and <0.9 men 1255 86
>0.8 women and >0.9 men 756 79
DBP≤90 mmHg 1845 142
>90 mmHg 166 23
SBP≤140 mmHg 1796 130
>140 mmHg 215 35
WC≤65.0 439 31
65.1–75.0 809 51
75.1–85.0 533 46
>85 230 37
FBG mmol/L (1999)<5.6 1885 124
≥5.6 126 41
7.4–79.0 0.296 0.5 (−0.4–1.4).85–5.07 <0.0001 0.23 (0.13–0.34)
3. Results
BMI, WC, WHR, systolic blood pressure and fasting blood glu-cose values increased significantly between 1999 and 2004 forboth genders (Table 1). Women appeared to have gained more
for BMI, waist and WHR compared to male subjects. The meanage of the total population in 2004 was 41.2 years, for males44.8 years, and for females 33.9 years.95% CI.
Incidence rate/1000erson years with 95% CI
n Diabetescases
Women
7.7 (5.0–11.8) 416 1518.2 (14.1–23.5) 460 4416.0 (11.2–22.9) 211 1424.7 (18.2–33.6) 246 27
15.0 (11.05–20.4)19.2 (14.1–26.0)
15.0 (11.0–20.3) 353 2315.3 (11.1–20.5) 670 4821.1 (15.6–28.7) 310 29
13.7 (10.1–18.6) 705 4120.9 (15.4–28.4) 628 59
15.4 (13.1–18.1) 1227 8627.7 (18.4–41.7) 106 14
14.4 (12.2–17.2) 1187 7732.6 (23.4–45.3) 146 23
14.1 (10.4–19.2) 332 2012.6 (9.3–17.1) 522 3217.3 (12.7–23.4) 337 2832.2 (23.7–43.7) 142 20
13.2 (11.0–15.7) 1253 7465.1 (47.9–88.4) 80 26

Journal Identification = PCD Article Identification = 201 Date: June 13, 2011 Time: 3:42 pm
120 p r i m a r y c a r e d i a b e t e s 5 ( 2 0 1 1 ) 117–124
Table 3 – Estimated relative risks with 95% CI for incidence of diabetes adjusted for age, sex, physical activity, SBP, DBP,monthly expenses and education at baseline (1999).
Variables Adjusted RR (95% CI) p-Value Adjusted RR (95% CI) Adjusted RR (95% CI)Total Total Men Women
Age 9920–30 1 1 131–40 2.1 (1.4–3.1) <0.001 2.4 (1.1–5.0) 2.0 (1.2–3.2)41–50 2.2 (1.4–3.6) 0.001 3.5 (1.7–7.4) 1.6 (0.8–3.1)>50 2.7 (1.7–4.2) <0.001 2.4 (1.1–5.4) 2.9 (1.7–5.2)
SexWomen 1Men 0.9 (0.7–1.3) 0.629
BMI 99<18.4 0.9 (0.6–1.4) 0.808 1.2 (0.6–2.5) 0.8 (0.5–1.4)18.5–23.0 1 1 1>23.0 1.4 (0.9–2.2) 0.125 1.6 (0.9–2.6) 1.5 (0.8–2.7)
WHR 99≤0.8 women and ≤0.9 men 1 1 1>0.8 women and >0.9 men 1.1 (0.8–1.7) 0.504 0.9 (0.5–1.8) 1.3 (0.8–2.2)
DBP 99≤90 mmHg 1 1 1>90 mmHg 1.6 (1.0–2.5) 0.031 0.7 (0.3–1.4) 2.0 (1.1–3.5)
SBP 99≤140 mmHg 1 1 1>140 mmHg 1.2 (0.8–1.9) 0.356 3.1 (1.7–5.7) 1.0 (0.6–1.9)
WAIST 99≤65.0 0.8 (0.5–1.2) 0.269 0.8 (0.4–1.6) 0.8 (0.4–1.3)65.1–75.0 1 1 175.1–85.0 1.1 (0.7–1.7) 0.745 1.4 (0.7–2.5) 0.8 (0.4–1.5)>85 1.9 (1.0–3.5) 0.048 3.0 (1.3–6.9) 1.0 (0.3–3.1)
Physical activity>4 h a week 1 1 13–4 h a week 1.0 (0.6–1.8) 0.975 0.4 (0.1–1.3) 1.5 (0.8–3.1)1–2 h a week 1.1 (0.7–1.7) 0.696 0.8 (0.4–1.6) 1.4 (0.8–2.4)Irregular 0.9 (0.4–1.9) 0.765 0.8 (0.2–2.3) 0.9 (0.3–2.6)
Monthly expenses in BDTa
≤3000 1 1 13001–4000 0.8 (0.5–1.3) 0.376 0.6 (0.3–1.5) 0.9 (0.5–1.5)4001–6000 0.7 (0.4–1.0) 0.059 1.1 (0.6–2.1) 0.5 (0.3–0.8)>6000 0.9 (0.6–1.4) 0.713 1.4 (0.8–2.5) 0.7 (0.4–1.2)
Educationb
Illiterate 1 1 11–5 years 1.3 (0.9–1.8) 0.178 0.9 (0.5–1.5) 1.6 (1.0–2.6)6–10 years 1.9 (1.1–3.3) 0.018 1.5 (0.8–2.7) 1.4 (0.3–5.4)11 years and above 2.3 (0.9–5.7) 0.077 1.4 (0.6–3.5) 4.8 (0.7–32.9)
atten
a US $ = 70 BDT.b Number of years for school attendance (1–5 years indicate subjects
3.1. Incidence of diabetes
At follow-up, 165 individuals had developed diabetes, corre-sponding to a population-standardized incidence rate of 16.4per 1000 person-years (Table 2). Sex- and age-adjusted inci-dence rates elevated to 49.2 per 1000 person-years. Individualswith impaired fasting glucose at baseline had approximately4-fold (65.1 per 1000 person years) higher risk for the develop-ment of diabetes.
Age, impaired fasting glucose, waist >85 cm and diastolicblood pressure (DBP) >90 mm of Hg significantly increasedthe relative risk for diabetes overall, whereas systolic blood
pressure (SBP) >140 mm of Hg but not DBP, were found tobe significantly associated with the incidental cases of dia-betes for men in the multivariate model. Among femalesubjects, relative risk for diabetes increased with age, DBPding years of school is between 1 and 5 years).
and impaired fasting blood glucose at baseline in 1999(Table 3).
We further evaluated relative changes in BMI, WC andWHR, between the years 1999 and 2004 in relation to RR ofdiabetes (Table 4). In a multivariate model including, age, gen-der, monthly expense and education at base line, loss of BMIand WC (<5%) had an increased risk for diabetes. Furthermore,a gain in BMI >15% from the initial value was also significantlyassociated with an increased risk of diabetes for male mem-bers. For male subjects, an increase in hip circumference of5–10% from the baseline values was found to have a protec-tive effect, whereas the same change was found to have an
increased the risk of diabetes in female subjects. There wasno significant interaction between the relative changes andsex before and after adjusting for age, monthly expenses andeducation at baseline.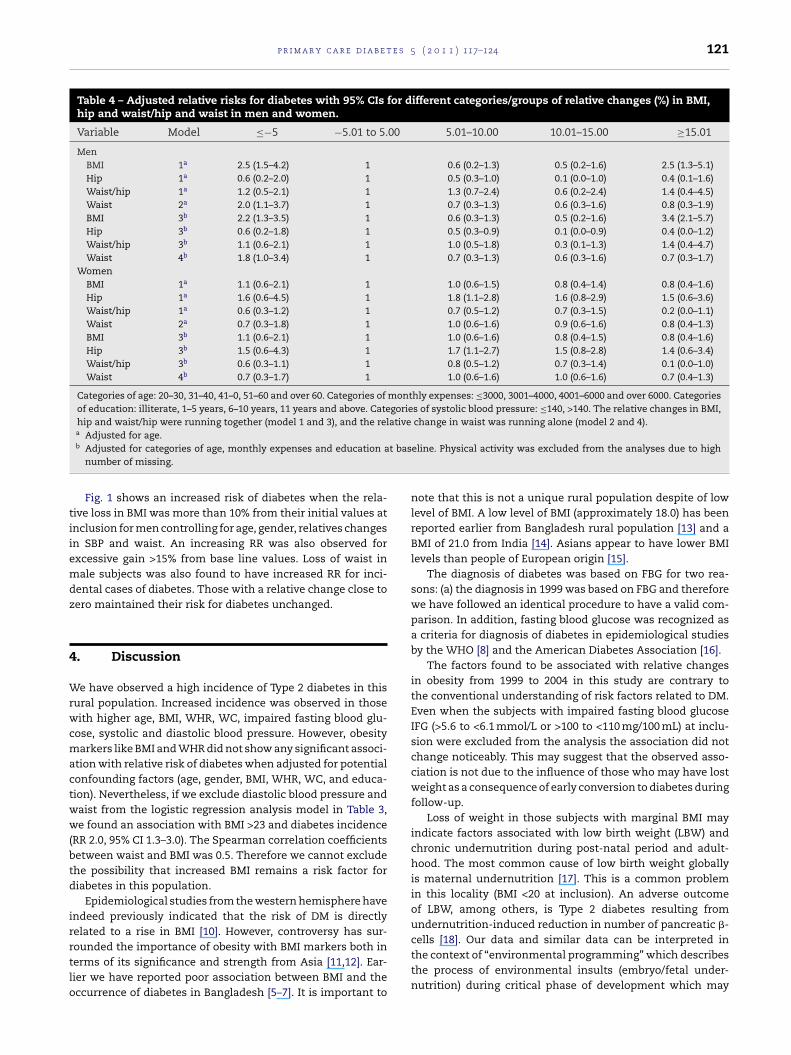
Journal Identification = PCD Article Identification = 201 Date: June 13, 2011 Time: 3:42 pm
p r i m a r y c a r e d i a b e t e s 5 ( 2 0 1 1 ) 117–124 121
Table 4 – Adjusted relative risks for diabetes with 95% CIs for different categories/groups of relative changes (%) in BMI,hip and waist/hip and waist in men and women.
Variable Model ≤−5 −5.01 to 5.00 5.01–10.00 10.01–15.00 ≥15.01
MenBMI 1a 2.5 (1.5–4.2) 1 0.6 (0.2–1.3) 0.5 (0.2–1.6) 2.5 (1.3–5.1)Hip 1a 0.6 (0.2–2.0) 1 0.5 (0.3–1.0) 0.1 (0.0–1.0) 0.4 (0.1–1.6)Waist/hip 1a 1.2 (0.5–2.1) 1 1.3 (0.7–2.4) 0.6 (0.2–2.4) 1.4 (0.4–4.5)Waist 2a 2.0 (1.1–3.7) 1 0.7 (0.3–1.3) 0.6 (0.3–1.6) 0.8 (0.3–1.9)BMI 3b 2.2 (1.3–3.5) 1 0.6 (0.3–1.3) 0.5 (0.2–1.6) 3.4 (2.1–5.7)Hip 3b 0.6 (0.2–1.8) 1 0.5 (0.3–0.9) 0.1 (0.0–0.9) 0.4 (0.0–1.2)Waist/hip 3b 1.1 (0.6–2.1) 1 1.0 (0.5–1.8) 0.3 (0.1–1.3) 1.4 (0.4–4.7)Waist 4b 1.8 (1.0–3.4) 1 0.7 (0.3–1.3) 0.6 (0.3–1.6) 0.7 (0.3–1.7)
WomenBMI 1a 1.1 (0.6–2.1) 1 1.0 (0.6–1.5) 0.8 (0.4–1.4) 0.8 (0.4–1.6)Hip 1a 1.6 (0.6–4.5) 1 1.8 (1.1–2.8) 1.6 (0.8–2.9) 1.5 (0.6–3.6)Waist/hip 1a 0.6 (0.3–1.2) 1 0.7 (0.5–1.2) 0.7 (0.3–1.5) 0.2 (0.0–1.1)Waist 2a 0.7 (0.3–1.8) 1 1.0 (0.6–1.6) 0.9 (0.6–1.6) 0.8 (0.4–1.3)BMI 3b 1.1 (0.6–2.1) 1 1.0 (0.6–1.6) 0.8 (0.4–1.5) 0.8 (0.4–1.6)Hip 3b 1.5 (0.6–4.3) 1 1.7 (1.1–2.7) 1.5 (0.8–2.8) 1.4 (0.6–3.4)Waist/hip 3b 0.6 (0.3–1.1) 1 0.8 (0.5–1.2) 0.7 (0.3–1.4) 0.1 (0.0–1.0)Waist 4b 0.7 (0.3–1.7) 1 1.0 (0.6–1.6) 1.0 (0.6–1.6) 0.7 (0.4–1.3)
Categories of age: 20–30, 31–40, 41–0, 51–60 and over 60. Categories of monthly expenses: ≤3000, 3001–4000, 4001–6000 and over 6000. Categoriesof education: illiterate, 1–5 years, 6–10 years, 11 years and above. Categories of systolic blood pressure: ≤140, >140. The relative changes in BMI,hip and waist/hip were running together (model 1 and 3), and the relative change in waist was running alone (model 2 and 4).a Adjusted for age.
t bas
tiiemdz
4
Wrwcmactww(btd
irrtlo
b Adjusted for categories of age, monthly expenses and education anumber of missing.
Fig. 1 shows an increased risk of diabetes when the rela-ive loss in BMI was more than 10% from their initial values atnclusion for men controlling for age, gender, relatives changesn SBP and waist. An increasing RR was also observed forxcessive gain >15% from base line values. Loss of waist inale subjects was also found to have increased RR for inci-
ental cases of diabetes. Those with a relative change close toero maintained their risk for diabetes unchanged.
. Discussion
e have observed a high incidence of Type 2 diabetes in thisural population. Increased incidence was observed in thoseith higher age, BMI, WHR, WC, impaired fasting blood glu-
ose, systolic and diastolic blood pressure. However, obesityarkers like BMI and WHR did not show any significant associ-
tion with relative risk of diabetes when adjusted for potentialonfounding factors (age, gender, BMI, WHR, WC, and educa-ion). Nevertheless, if we exclude diastolic blood pressure andaist from the logistic regression analysis model in Table 3,e found an association with BMI >23 and diabetes incidence
RR 2.0, 95% CI 1.3–3.0). The Spearman correlation coefficientsetween waist and BMI was 0.5. Therefore we cannot excludehe possibility that increased BMI remains a risk factor foriabetes in this population.
Epidemiological studies from the western hemisphere havendeed previously indicated that the risk of DM is directlyelated to a rise in BMI [10]. However, controversy has sur-
ounded the importance of obesity with BMI markers both inerms of its significance and strength from Asia [11,12]. Ear-ier we have reported poor association between BMI and theccurrence of diabetes in Bangladesh [5–7]. It is important toeline. Physical activity was excluded from the analyses due to high
note that this is not a unique rural population despite of lowlevel of BMI. A low level of BMI (approximately 18.0) has beenreported earlier from Bangladesh rural population [13] and aBMI of 21.0 from India [14]. Asians appear to have lower BMIlevels than people of European origin [15].
The diagnosis of diabetes was based on FBG for two rea-sons: (a) the diagnosis in 1999 was based on FBG and thereforewe have followed an identical procedure to have a valid com-parison. In addition, fasting blood glucose was recognized asa criteria for diagnosis of diabetes in epidemiological studiesby the WHO [8] and the American Diabetes Association [16].
The factors found to be associated with relative changesin obesity from 1999 to 2004 in this study are contrary tothe conventional understanding of risk factors related to DM.Even when the subjects with impaired fasting blood glucoseIFG (>5.6 to <6.1 mmol/L or >100 to <110 mg/100 mL) at inclu-sion were excluded from the analysis the association did notchange noticeably. This may suggest that the observed asso-ciation is not due to the influence of those who may have lostweight as a consequence of early conversion to diabetes duringfollow-up.
Loss of weight in those subjects with marginal BMI mayindicate factors associated with low birth weight (LBW) andchronic undernutrition during post-natal period and adult-hood. The most common cause of low birth weight globallyis maternal undernutrition [17]. This is a common problemin this locality (BMI <20 at inclusion). An adverse outcomeof LBW, among others, is Type 2 diabetes resulting fromundernutrition-induced reduction in number of pancreatic �-cells [18]. Our data and similar data can be interpreted in
the context of “environmental programming” which describesthe process of environmental insults (embryo/fetal under-nutrition) during critical phase of development which may
Journal Identification = PCD Article Identification = 201 Date: June 13, 2011 Time: 3:42 pm
122 p r i m a r y c a r e d i a b e t e s 5 ( 2 0 1 1 ) 117–124
Fig. 1 – Estimated RR with 95% CI for relative change in BMI and waist circumference from 1999 to 2004. BMI was adjustedfor age in 1999, relative change in hip and relative change in waist while waist was adjusted for age, relative changes BMI in
Bangladesh.be responsible for permanent changes in physiology andmetabolism of the adult offspring [19,20]. We have observeda higher prevalence rate of DM (8.2%) defined by FBG and3.8% by OGTT values. Previously, we have also published datafrom 2004 comprising subjects (n = 3981) where the prevalencedetected by FBG was 6.8% and by OGTT it was 3.6% [4]; this maysuggest that the primary cause of diabetes in this population is�-cell dysfunction as a predominant pathogenic mechanism.
Chronic undernutrition is also linked to protein energymalnutrition and beta cell dysfunction or can be a conse-quence of nutrition related pancreatitis known as tropicalpancreatitis. The glucose intolerance of protein energy malnu-trition is known to be associated with structural changes in thebeta cell. Chronic undernutrition over a lifetime may, there-
fore, be an important determinant of diabetes in an individual,either through progressively impairing beta cell function or byincreasing the susceptibility of the individual to other geneticand environmental diabetogenic influences. It is also knownthat ongoing damage to enzyme-producing tissue in chronicpancreatitis leads to poor absorption of nutrients, especiallyof fats, leading to weight loss.
Other factors like chronic infection (e.g. H. pylori, hepatitis Band C) or chronic diseases may also lead to weight loss, how-ever due to the limitations of the study we were not able tocontrol for these conditions. Loss of muscle mass other thanfat mass may also play an important role. The increase in Type2 diabetes in Asia differs from that reported in other partsof the world: it has developed in a much shorter time, in ayounger age group, and in people with much lower body-massindex (BMI) [21]. However, there is also dissimilar incidenceand risk factors among and within the Asian countries. What
these populations have in common though, is that the meanor median BMI is lower than that observed for non-Asian pop-ulations.
Journal Identification = PCD Article Identification = 201 Date: June 13, 2011 Time: 3:42 pm
e s 5
ejits+odhsh<aivoeslahttwi
t[omwttkubiad
C
T
A
WeBi
r
p r i m a r y c a r e d i a b e t
Therefore, this may suggest that obesity alone may notxplain the increased occurrence of diabetes in Asian sub-ects. We found a reverse association between relative changesn BMI and the incidence of diabetes for those who lostheir BMI from initial values and those who gained exces-ively. In general, those who maintained a stable BMI (−5% to5%) had a lower risk for diabetes. It is known that althoughbesity is an important component of insulin resistance syn-rome, many people who are not obese according to standardeight and weight criteria (i.e., body mass index – BMI) maytill display features of the syndrome [22]. Indeed, studiesave indicated that normal-weight subjects, whose BMI is25 kg/m2, may have as much as 40% fat in the abdominal area,
level that correlates closely with decreased insulin sensitiv-ty and an atherogenic dyslipidemic state [23,24]. Increasedisceral fat in Asian-Indians is not apparent from their non-bese body mass index. We have also observed a protectiveffect with increased hip girth for males while the oppo-ite was noted for women. Variation in risks by anatomicocation of fat could reflect differences in metabolic char-cteristics between peripheral and abdominal body fat. Sexormones, growth hormones, corticosteroids and genetic fac-ors contribute to fat patterning [25]. Therefore, describinghe nature of the association between adiposity and diabetesith the use of different models in different populations
s important.Our data may suggest that an Asian-Indian rural popula-
ion with typically low BMI may still carry a risk for diabetes26]. These communities may be experiencing double burdenf the diabetes epidemics. The urban affluent may experienceetabolic disturbances due to obesity and related lifestylehile the rural poor, who constitute approximately 70% of the
otal population may experience the same phenomena relatedo undernutrition and LBW. Comprehensive assessment of theey determinants of diabetes incidence drawn at the pop-lation level is likely to be the most appropriate feature toe incorporated into prevention programs, which should take
nto account gender difference in the risk of diabetes and pay special attention to the special characteristics of non obeseiabetes in Asian-Indian subjects.
onflict of interest
he authors state that they have no conflict of interest.
cknowledgements
e acknowledge the important contribution of the interview-rs, village leaders and volunteers to make this work possible.ut most of all we are grateful to the subjects who participated
n the study.
e f e r e n c e s
[1] H. King, R.E. Aubert, W.H. Herman, Global burden ofdiabetes, 1995–2025: prevalence, numerical estimates, andprojections, Diabetes Care 21 (1998) 1414–1431.
( 2 0 1 1 ) 117–124 123
[2] S. Wild, G. Roglic, A. Green, et al., Global prevalence ofdiabetes: estimates for the year 2000 and projections for2030, Diabetes Care 27 (2004) 1047–1053.
[3] R. Sicree, J.E. Shaw, P.Z. Zimmet, The Global Burden OfDiabetes. International Diabetes Federation (IDF), 2nd ed.,Diabetes Atlas, Brussels, 2003, p. 71.
[4] M.A. Rahim, A. Hussain, A.K. Azad Khan, et al., Risingprevalence of type 2 diabetes in rural Bangladesh: apopulation based study, Diabetes Res. Clin. Pract. 77 (2007)300–305.
[5] A. Hussain, M.A. Rahim, S.M.K. Ali, et al., Differences in type2 diabetes in Bangladesh: rural urban differences, Diabet.Med. 22 (2005) 931–936.
[6] P.R. Rao, R. Shobhana, A. Lavanya, et al., Development of areliable and valid psychosocial measure of self-perception ofhealth in type 2 diabetes, J. Assoc. Physicians India 53 (2005)689–692.
[7] A. Hussain, S. Vaaler, M.A. Sayeed, et al., Type 2 diabetes andimpaired fasting blood glucose in rural Bangladesh: apopulation based study, Eur. J. Public Health 17 (2007)291–296.
[8] Definition, Diagnosis and Classification of Diabetes Mellitusand its Complications. Part 1. Diagnosis and Classification ofDiabetes Mellitus, World Health Organization, Geneva, 1999,WHO/NCD/NCS/99.2.
[9] Sata/SE version 9.2 for windows: StataCorp LP, 4905 LakewayDrive, College Station, TX 77845, USA.
[10] C.L. Leibson, D.F. Williamson, L.J. Melton, et al., Temporaltrends in BMI among adults with diabetes, Diabetes Care 24(2002) 1584–1589.
[11] Appropriate body-mass index for Asian populations and itsimplications for policy and intervention strategies, Lancet363 (2004) 157–163.
[12] K.-H. Yoon, J.-H. Lee, J.-W. Kim, H.-Y. Son, et al., Epidemicobesity and type 2 diabetes in Asia, Lancet 368 (2006)1681–1688.
[13] V. Hosegood, O.N.R. Campbell, Body mass index, height,weight, arm circumference, and mortality in ruralBangladeshi women: a 19-y longitudinal study, Am. J. Clin.Nutr. 77 (2) (2003) 341–347.
[14] N.K. Mungreiphy, S. Kapoor, Socio economic changes ascovariates of overweight and obesity among Tangkhul nagatribal women of Manipur, North-East India, J. Biosoc. Sci.(2010), page 1 of 17 (doi:10.1017/S0021932009990587).
[15] Y.W. Park, D.B. Allison, S.B. Heymsfield, et al., Larger amountof visceral adipose tissue in Asian Americans, Obesity Res. 9(2001) 381–387.
[16] Diagnosis and classification of diabetes mellitus. AmericanDiabetes Association, Diabetes Care 31 (2008) 55–60.
[17] G.V. Iyengar, P.P. Nair, Global outlook on nutrition and theenvironment: meeting the challenges of the nextmillennium, Sci. Total Environ. 249 (2000) 331–346.
[18] H.O. Lithell, P.M. McKeigue, L. Berglund, R. Mohsen, Lithell,D.A. Leon, Relation of size at birth to non-insulin dependantdiabetes and insulin concentrations in men aged 50–60years, BMJ 312 (1996) 406–410.
[19] P.D. Gluckman, M.A. Hanson, Developmental and epigeneticpathways to obesity: an evolutionary-developmentalperspective, Int. J. Obes. (Lond.) 32 (Suppl. 7) (2008) S62–S71.
[20] S.C. Langley-Evans, Nutritional programming of disease:unravelling the mechanism, J. Anat. 15 (2009) 36–51.
[21] G.T. Ko, J.C. Chan, C.S. Cockram, et al., Prediction ofhypertension, diabetes, dyslipidaemia or albuminuria usingsimple anthropometric indexes in Hong Kong Chinese, Int. J.Obes. Relat. Metab. Disord. 23 (1999) 1136–1142.
[22] C. Hollenbeck, G.M. Reaven, Variations in insulin-stimulatedglucose uptake in healthy individuals with normal glucosetolerance, J. Clin. Endocrinol. Metab. 64 (1987) 1169–1173.

Journal Identification = PCD Article Identification = 201 Date: June 13, 2011 Time: 3:42 pm
e t e s
124 p r i m a r y c a r e d i a b[23] D.G. Carey, A.B. Jenkins, L.V. Campbell, et al., Abdominal fatand insulin resistance in normal and overweight women:direct measurements reveal a strong relationship in subjects
at both low and high risk of NIDDM, Diabetes 45 (5) (1996)633–638.[24] R. Retnakaran, J.G. Anthony, Hanley, et al., Doeshypoadiponectinemia explain the increased risk of diabetes
5 ( 2 0 1 1 ) 117–124
and cardiovascular disease in South Asians? Diabetes Care29 (2006) 1950–1954.
[25] P. Bjørntrop, The regulation of adipose tissue distribution in
humans, Int. J. Obes. Relat. Metab. Disord. 20 (1996) 291–302.[26] M.A. Banerji, N. Faridi, R. Atluri, et al., Body composition,visceral fat, leptin, and insulin resistance in Asian Indianmen, J. Clin. Endocrinol. Metab. 84 (1) (1999) 137–144.