Determinants of the Incidence of Loan Modifications
51
Determinants of the Incidence of Loan Modifications Vicki Been and Mary Weselcouch*; Ioan Voicu and Scott Murff** October 2011 * Furman Center for Real Estate and Urban Policy, New York University. * * Office of the Comptroller of the Currency. The views expressed in this paper are those of the authors alone and do not necessarily reflect those of the Office of the Comptroller of the Currency or the Department of the Treasury. We thank Sewin Chan, Kostas Tzioumis, Michael Gedal, and participants at the OCC Economics Seminar, NYU Law School’s Law and Economics Brown Bag Lunch series, the Furman Center’s Brown Bag Lunch series, the 2011 Federal Reserve Community Affairs Research Conference, and the American Real Estate and Urban Economics 2011 Mid-year Conference for their comments and suggestions, and the OCC Economics Department for their hospitality and financial support for Vicki Been and Mary Weselcouch. Professor Been is grateful for the support of the Filomen D’Agostino and Max E Greenberg Research Fund at New York University School of Law. We are also grateful to Andrew Tschirhart at the OCC and Ken Adler at the Furman Center for excellent research assistance
-
Upload
khangminh22 -
Category
Documents
-
view
0 -
download
0
Transcript of Determinants of the Incidence of Loan Modifications
Determinants of the Incidence of Loan Modifications
Vicki Been and Mary Weselcouch*; Ioan Voicu and Scott Murff**
October 2011
* Furman Center for Real Estate and Urban Policy, New York University. * * Office of the Comptroller of the Currency. The views expressed in this paper are those of the authors alone and do not necessarily reflect those of the Office of the Comptroller of the Currency or the Department of the Treasury. We thank Sewin Chan, Kostas Tzioumis, Michael Gedal, and participants at the OCC Economics Seminar, NYU Law School’s Law and Economics Brown Bag Lunch series, the Furman Center’s Brown Bag Lunch series, the 2011 Federal Reserve Community Affairs Research Conference, and the American Real Estate and Urban Economics 2011 Mid-year Conference for their comments and suggestions, and the OCC Economics Department for their hospitality and financial support for Vicki Been and Mary Weselcouch. Professor Been is grateful for the support of the Filomen D’Agostino and Max E Greenberg Research Fund at New York University School of Law. We are also grateful to Andrew Tschirhart at the OCC and Ken Adler at the Furman Center for excellent research assistance
2
1. Overview Loan modifications give borrowers in default1
Policymakers have put considerable emphasis on the desirability of modifications to help
borrowers avoid losing their homes through foreclosures. A chronology of the modification
programs lenders and the federal government have adopted over the past few years is attached as
Appendix A. Modifications play a central role in the federal Making Home Affordable Plan the
Obama administration announced in February 2009 (U.S. Department of Treasury, 2009a). The
plan includes financial incentives for servicers to complete modifications of delinquent loans,
principal reduction rewards for borrowers who stay current, incentive payments to servicers and
borrowers for modifying at-risk loans before they become delinquent, and an insurance fund to
the opportunity to reduce their interest rate,
extend the term of their loan, reduce their principal balance, or add missed payments to the principal
(Adelino, Gerardi, and Willen, 2009; Mason, 2007). If a loan modification helps a borrower to stay
current on his or her loan, the modification may allow the borrower to avoid both the financial
costs of foreclosure and the disruption and social and psychological costs of moving, and may save
the borrower’s credit record (Kingsley, Smith, and Price, 2009; Schloemer, Li, Ernst, and Keest,
2006). Successful modifications help the neighborhood as well, by avoiding vacancies and high rates
of turnover (and the crime and other negative impacts that they may cause), avoiding decreases in
neighboring property values associated with foreclosures, and promoting stability (and the social
cohesion it produces) (Ellen, Lacoe, and Sharygin, 2011; Harding, Rosenblath, and Yao, 2009;
Immergluck and Smith, 2006; Schuetz, Been, and Ellen, 2008). Lenders may benefit from
modifications by avoiding the costs associated with foreclosure, such as reduced property values,
loss of income and deterioration in quality as the property sits vacant and legal and administrative
fees (Gerardi and Li, 2010; Pennington-Cross, 2006).
1 Some modifications are arranged before default, but such loans are excluded from the analysis in this paper for reasons we discuss in the Data section.
3
encourage lenders to modify loans even if they fear that home prices will fall in the future. Through
the Home Affordable Modification Program (HAMP), the U.S. Department of the Treasury
partnered with banks and other regulatory agencies to issue guidelines to standardize loan
modification practices throughout the mortgage industry(U.S. Department of Treasury, 2009b).
For policymakers as well as lenders, understanding the determinants of successful
modifications – those that allow the homeowner to stay current over the long-term – is crucial. Yet
too little is known even about the most basic questions that would help us understand why some
modifications are successful and others are not: Which borrowers receive what kinds of
modifications? Are certain loan provisions associated with the likelihood that the loan will be
modified? Do the characteristics or identity of lenders or servicers affect the propensity of
borrowers to receive modifications? How do characteristics of the property, or the neighborhood in
which it is located, affect the propensity of loans to be modified? What role, for example, does
residential segregation – the concentration of minorities in a neighborhood – play (if any) in the
propensity of borrowers to get modifications?
In this paper, we shed new light on these issues about the borrowers and loans receiving
modifications by using a unique combination of data on borrowers in New York City. In a
subsequent paper, we will use that information to examine the features of the borrower, loan, lender,
neighborhood and property that predict which modifications will succeed in keeping borrowers in
their homes over the long term.
This paper will build upon the existing literature by combining a dataset the Furman Center
for Real Estate and Urban Policy has built on borrower, neighborhood, and property characteristics
for loans originated in New York City with the OCC’s Mortgage Metrics dataset to examine the
determinants of loan modifications. Identifying the features of borrowers, loans, lenders, servicers,
properties and neighborhoods that are associated with loan modifications will allow lenders and

4
policy-makers to target modification programs for distressed mortgage borrowers more effectively.
The unusually rich combination of data also will shed some light on whether borrowers and
servicers are acting rationally in deciding whether to modify a loan, and whether there are any
characteristics of loans, borrowers or neighborhoods that make modifications especially challenging
given the current economic and regulatory framework.
2. Background and Literature Review
When a borrower falls behind on her home mortgage payments, a variety of resolutions or
outcomes are possible. First, if the borrower is delinquent or in default , but has not yet received a
notice of foreclosure (lis pendens), the borrower and/or lender have several options: (i) the borrower
can cure the delinquency or default by making some or all of the missed payments; (ii) the borrower
and the lender can agree to modify the loan; (iii) the borrower can refinance the mortgage; (iv) the
borrower can sell the property either for enough to pay off the balance remaining on the mortgage,
or through a “short sale,” whereby the lender agrees to accept a purchase price of less than the
balance remaining in satisfaction of the mortgage; (v) the borrower can pre-pay the mortgage by
drawing on other resources; or (vi) the borrower can continue to be delinquent or in default, but the
lender can choose to forbear on the delinquency or default without beginning foreclosure, or set a
repayment plan in which the borrower typically pays back any late payments in small installments on
top of the existing mortgage installments. Second, if the lender (or servicer acting on behalf of the
lender or on behalf of the investors in securitized mortgages) has begun the foreclosure process,
either by filing a lis pendens in a judicial foreclosure state or by sending a Notice of Default to the
borrower in a non-judicial foreclosure state2
2 In this paper, we focus only on loans in New York, a judicial foreclosure state where a lis pendens can be filed if a borrower is at least 90 days delinquent.
, the borrower can pursue any of those six paths, and in
addition may: (vii) give the lender/servicer a deed in lieu of foreclosure; (viii) lose the property to the

5
lender/servicer in the foreclosure auction (“REO” property); or (ix) lose the property to a third
party in a foreclosure auction.
The lender/servicer and borrower accordingly may reach an agreement to modify the terms
of the loan either before or after the foreclosure process has officially begun. We will refer to the
borrower’s counter-party as the servicer. The servicer is, of course, acting on behalf of the lender or
investors, and presumably is seeking to minimize losses to the investors or lender. The servicer’s
interests are unlikely, however, to be perfectly aligned with the lender’s or investors’ interests. The
servicer may lack sufficient information about the lender’s or investors’ interests to serve those
interests well, or may lack the technology or other resources to serve those interests even when they
are clear (Cordell et al., 2008). Further, the payment structure for servicing may provide incentives
for servicers to forego a modification even if modification would serve the lender’s or investors’
interests. (Cordell et al., 2009; Levitin and Twomey, 2011; Magder, 2009; Mason, 2007; Thomson,
2009). We cannot separate the decision of the servicer from that of the lender or investors in this
paper, however, except indirectly by analyzing the outcomes of securitized loans versus those held in
the lender’s portfolio. We therefore will refer to the decision maker as the servicer, and assume that
the servicer generally, though not perfectly, is acting to minimize losses to the lender or investors.
According to U.S. Department of Treasury (2008, 2009, 2010, 2011), the number of loan
modifications issued has been consistently increasing since November 2007 (the inception of the
OCC data collection), with over 2.1 million permanent modifications completed nationally as of
March 2011. Nearly 400,000 of these modifications have been achieved through HAMP (U.S.
Department of Treasury, 2011).
Despite the importance of modifications to both the Bush and Obama Administration’s
efforts to limit the effects of the foreclosure crisis, the literature on modifications is relatively thin. A
series of papers offer a theoretical framework for assessing how lenders will view the decision to

6
modify. Ambrose and Capone (1996), for example, posit that lenders will modify a loan when the
benefits of not losing principal and interest payments outweigh the costs of making the
modification. Similarly, Adelino, Gerardi, and Willen (2009) theorize that low rates of modifications
result from lenders determining that foreclosure is more profitable for them than modification.
Riddiough and Wyatt (1994) postulate that lenders will only consider options other than foreclosure
when the cost of foreclosure exceeds the cost of encouraging more defaults by displaying a
willingness to negotiate workouts, and Wang, Young, and Zhou (2002) build on that insight. Foote,
Gerardi, and Willen (2008) explain that because all borrowers, regardless of the amount of equity in
their homes, have an incentive to seek modifications to lower their mortgage costs, it becomes
difficult for lenders to determine which applicants legitimately need modifications to avoid default
and which have the ability to pay their mortgage without a modification.
Several researchers have theorized about subprime borrowers’ decisions about whether to
suffer a foreclosure or prepay a delinquent mortgage. Danis and Pennington-Cross (2005a; 2005b),
for example) explain the delinquent subprime borrower’s concerns, drawing in part on the option
value theory of mortgages -- borrowers can exercise the call option to prepay when interest rates
fall, and exercise the put option to allow the loan to be foreclosed when the balance of the loan
exceeds the underlying asset.
A variety of research explores empirically the factors that determine whether or not a loan is
modified. The most robust debate in the literature concerns the effect of securitization. Piskorski,
Seru, and Vig (2009) find that, controlling for differences in securitized and retained loans,
delinquent loans held in the lenders’ portfolios were less likely to enter foreclosure. They infer from
that finding that servicers are better able to renegotiate loan terms for portfolio loans, and theorize
that servicers are restricted in their ability to renegotiate securitized loans due to the contractual
constraints of securitization servicing. Agarwal et al. (2011) use more direct evidence about

7
modifications and find that loans held in portfolio are between 4.2 and 5.8 percent more likely to be
modified often than securitized loans.
Foote, Gerardi, Goette, and Willen (2009) and Adelino, Gerardi, and Willen (2009), on the
other hand, find that that the rate of modification is similar for loans retained in the lender’s
portfolio and those that are securitized. Adelino, Gerardi, and Willen (2010) detail their
disagreement with the methodology and interpretation of the Piskoriski, Seru, and Vig research.
Researchers agree, however, that the identity of a loan’s servicer is a significant determinant
of whether it is modified. Abt Associates (2009) finds wide variation among servicers’ propensity to
modify loans in five mid-Atlantic states and the District of Columbia. Agarwal et al. (2011) and
Chan, Sitgraves, Been and Haughwout (2011) also find significant variation in the number and type
of modifications different servicers enter into.
Recent empirical work examines the association between loan characteristics and post-
default outcomes. Adelino, Gerardi, and Willen (2009) find that loans with higher LTVs are less
likely to be modified. Agarwal et al. (2010) explore how the combination of borrower credit score
and LTV affect post-default outcomes. Ambrose and Capone (1998) find that the LTV of
delinquent FHA loans is a major predictor of whether the loan is reinstated, sold, assigned to HUD,
or foreclosed. Capozza and Thomson (2006) find that foreclosure is more likely on loans with high
LTVs.
Evidence is mixed about how the type of interest rate (fixed or adjustable rate) affects post-
default outcomes. Capozza and Thomson (2006) find that foreclosure is more likely to occur on
properties encumbered by fixed rate mortgages. Haughwout, Okah, and Tracy (2009) and Voicu,
Jacob, Rengert, and Fang (2011), on the other hand, determine that adjustable rate mortgages are
more likely to receive modifications than fixed rate mortgages. But Chan, Sitgraves, Been and
Haughwout (2011) find that fixed rate mortgages are more likely to receive modifications.
8
Cordell, Dynan, Lehnert, Liang, and Masukopf (2008) argue that subprime loans are
especially challenging to modify because such mortgages are harder than prime mortgages to make
affordable and because subprime loans are more often paired with junior liens. Data that cover both
subprime and prime loans are limited, however. Gerardi, Shapiro, and Willen (2007), analyzing
loans originated between 1990 and 2007 in Massachusetts, find that subprime borrowers are
significantly more likely to have their homes foreclosed upon than prime loans. Capozza and
Thomson (2005) find that among loans 90 days or more delinquent, subprime loans are twice as
likely as prime loans to end up as REO.
The literature also has examined the effect borrower characteristics have on the likelihood of
modification. Chan, Sitgraves, Been and Haughwout (2011) and Adelino, Gerardi, and Willen
(2009) find that, other things being equal, borrowers with lower credit scores are more likely to
receive modifications. Piskorski, Seru, and Vig (2009) determine that borrowers with higher credit
scores are more likely to be foreclosed upon, and Pennington-Cross (2010) finds that high credit
scores are associated with a greater propensity to become REO.
Capozza and Thomson (2006) find that borrowers that have made more payments are less
likely to become REO. Adelino, Gerardi, and Willen (2009) similarly find that a lender is also more
likely to forebear where the borrower has a high payment to income ratio.
Studies have generally found that the borrower’s race does not predict the likelihood of
receiving a modification. Ambrose and Capone (1996) present descriptive statistics suggesting that
minorities and whites are roughly equally likely to receive a modification once in default. Collins and
Reid (2011) find no differences in the number or nature of modification received across races. The
authors note, however, that there may be differences in the rates of modifications given to
minorities and whites among those who applied, but cannot test that hypothesis because they do not
have data on the number of borrowers actually applying for modifications, Cotterman (2001) finds

9
no significant difference between blacks and Hispanics in the proportion receiving modifications
after default. Capozza and Thomson (2006), however, find that non-Hispanic Asians are more likely
than non-Hispanic whites to terminate their loans as REO if they enter foreclosure, and are less
likely to cure at all stages of the process. Voicu, Jacobs, Rengert and Fang (2011) also find some
racial differences in the propensity to remain in default, enter foreclosure or cure.
There are a few researchers who have examined the role of neighborhood characteristics in
post-default outcomes. Collins and Reid (2011) find that the unemployment rate in an area is not a
significant factor in predicting modifications. Agarwal et al. (2010), however, find that defaults are
more likely to result in foreclosure where unemployment rates are high. Voicu, Jacob, Rengert and
Fang (2011) and Pennington-Cross and Ho (2010), on the other hand, find that higher area
unemployment rates are associated with lower propensity to enter foreclosure.
Agarwal et al. (2010) and Chan, Sitgraves, Been and Haughwout (2011) find foreclosure to
be more likely in areas with house price depreciation or lower rates of appreciation. Collins and
Reid (2011), on the other hand, find that the modification rate is not significantly affected by the
area’s current house price index.
The research to date is difficult to reconcile and incomplete, for several reasons. Some
studies rely on data from just one servicer or lender, and therefore may be of limited generalizability.
Others study outcomes of defaults that occurred prior to the current housing crisis, and may not be
applicable to defaults in the rapidly falling market or for the types of loans that characterized the
current crisis. Most face serious data limitations -- some infer modifications in the absence of direct
data, for example, and others are missing key controls, such as the presence of junior liens.
Because of data limitations or methodological choices, many studies focus on one or just a few post-
default outcomes (which the various researchers also define quite differently) or model the outcomes
as independent events. While findings about the predictors of, for example, foreclosure may shed
10
some light on the propensity of a loan to be modified, modifications are likely to be influenced by
somewhat different factors, both because modifications require more interaction between the
borrower and lender than many of the other outcomes studied, and because the political and
economic climate of the foreclosure crisis may be leading to modifications that would not take place
in less difficult times. While various researchers have studied the factors associated with the
probability of modifications and other post-default outcomes, therefore, the results are divergent,
hard to reconcile and plagued with data and methodological problems.
3. Empirical Model
This paper provides an empirical analysis of the factors that determine the outcomes of
seriously delinquent loans (loans at least 60 days delinquent). Our empirical strategy employs
multinomial logit models in a hazard framework to explain how loan, borrower, and neighborhood
characteristics affect which of the following four outcomes, as depicted in Figure 1, results from a
seriously delinquent loan: (1) the borrower cures the delinquency (all past due amounts are paid by
the borrower or the loan balance is paid off via a regular sale or refinance); (2) the borrower and
lender agree to modify the loan or agree to some other non-liquidation workout (i.e., forbearance,
repayment plan, FHA partial claim,3 loan reaged/deferred/extended,4 other5
3 An FHA partial claim might be used if the Federal Housing Administration (FHA) insured the loan. A one-time payment is made by the FHA to the lender to cover all or a portion of the default; the borrower is required to sign an interest free note for the amount of the advance claim payment payable to the FHA; the promissory note is not due and payable until the homeowner either pays off the first mortgage or no longer owns the property
); (3) the borrower
suffers a liquidation (short sale, deed in lieu, foreclosure auction sale or REO); or (4) the loan
4 "Reaged/Deferred/Extended" includes, according to the data provider, workouts where there has been an agreement between servicer and borrower to defer principal and interest but with no other terms to enhance affordability. 5 "Other" typically includes, according to the data provider, alternative loss mitigation strategies designed to provide temporary help, such as partial claims and Fannie Mae’s HomeSaver Advance. The former is similar to the FHA partial claim except that the insurer is a private entity. The latter is designed for the borrower who is otherwise capable of meeting his obligations and will be able to resume timely payments once the arrearage is brought current; under the program, Fannie Mae authorizes its servicers to offer an unsecured personal loan that will enable a qualified borrower to cure the payment default on a Fannie Mae owned or securitized loan; this personal loan has fewer up-front costs and can be put in place more quickly than many other options.
11
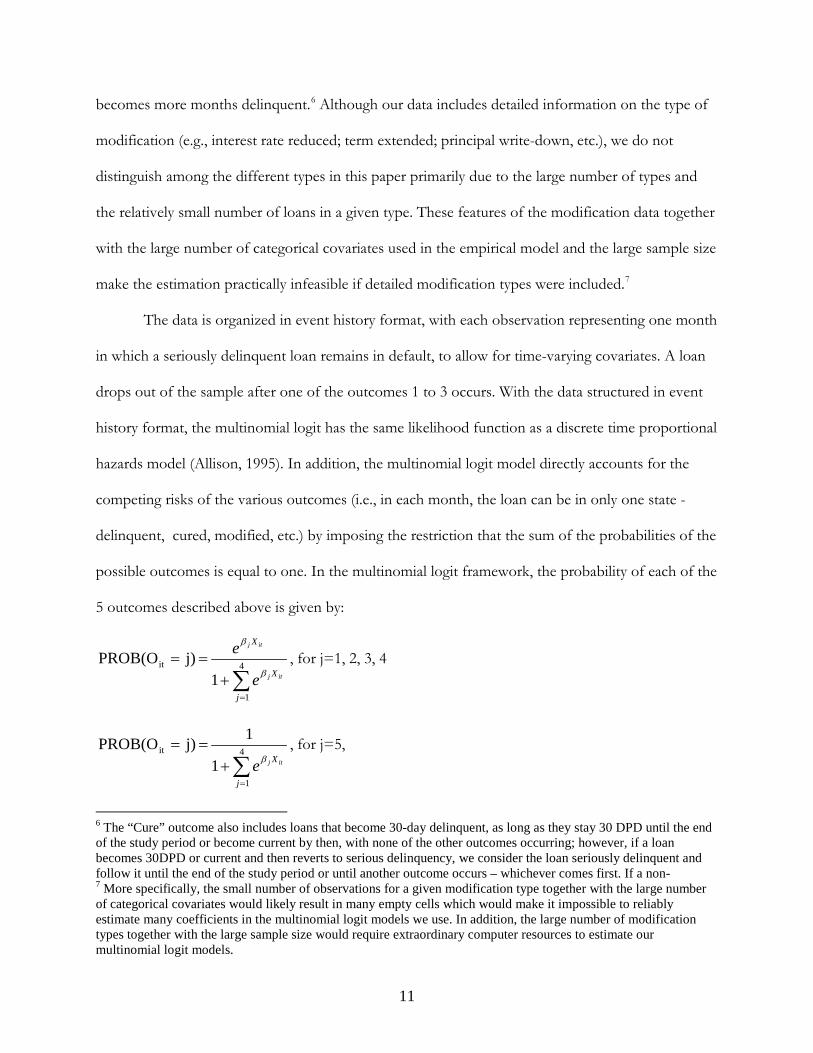
becomes more months delinquent.6 Although our data includes detailed information on the type of
modification (e.g., interest rate reduced; term extended; principal write-down, etc.), we do not
distinguish among the different types in this paper primarily due to the large number of types and
the relatively small number of loans in a given type. These features of the modification data together
with the large number of categorical covariates used in the empirical model and the large sample size
make the estimation practically infeasible if detailed modification types were included.7
The data is organized in event history format, with each observation representing one month
in which a seriously delinquent loan remains in default, to allow for time-varying covariates. A loan
drops out of the sample after one of the outcomes 1 to 3 occurs. With the data structured in event
history format, the multinomial logit has the same likelihood function as a discrete time proportional
hazards model (Allison, 1995). In addition, the multinomial logit model directly accounts for the
competing risks of the various outcomes (i.e., in each month, the loan can be in only one state -
delinquent, cured, modified, etc.) by imposing the restriction that the sum of the probabilities of the
possible outcomes is equal to one. In the multinomial logit framework, the probability of each of the
5 outcomes described above is given by:
∑=
+== 4
1
it
1 j)PROB(O
j
X
X
itj
itj
e
eβ
β
, for j=1, 2, 3, 4
∑=
+== 4
1
it
1
1 j)PROB(O
j
X itjeβ, for j=5,
6 The “Cure” outcome also includes loans that become 30-day delinquent, as long as they stay 30 DPD until the end of the study period or become current by then, with none of the other outcomes occurring; however, if a loan becomes 30DPD or current and then reverts to serious delinquency, we consider the loan seriously delinquent and follow it until the end of the study period or until another outcome occurs – whichever comes first. If a non- 7 More specifically, the small number of observations for a given modification type together with the large number of categorical covariates would likely result in many empty cells which would make it impossible to reliably estimate many coefficients in the multinomial logit models we use. In addition, the large number of modification types together with the large sample size would require extraordinary computer resources to estimate our multinomial logit models.

12
where PROB(Oit = j) is the probability that the ith loan will have outcome j in month t, outcome (5),
the loan becoming additional months delinquent, is the reference outcome, Xit are the explanatory
variables, and βj are the coefficients to be estimated. To put this notation in the hazard framework,
Prob(Oit=j) is the hazard rate for outcome j. For example, if outcome j is (1), cure, then Prob(Oit=j)
is the conditional probability that the loan will leave delinquency through cure in month t
conditional on the loan “surviving” in delinquency until then.
We include time since default among the covariates to allow the hazard rate to be time-
dependent. The coefficient estimates are used to calculate the marginal effects of the explanatory
variables on the probability of each outcome. To control for city-, state-, or nation-wide
macroeconomic factors, we include quarterly fixed effects. To control for systematic changes in
mortgage lending over time, we include origination year fixed effects.
To control for unobserved heterogeneity and possible dependence among observations for
the same loan, we use a cluster-robust variance estimator that allows for clustering by loan. The
independence of irrelevant alternatives (IIA) assumption8
the IIA assumption for our data.
- a main drawback of the multinomial logit
model - is not a concern in our case, because the Small-Hsiao test cannot reject
4. Data Description
To investigate the determinants of modifications, we analyze outcomes between January
2008 and November 30, 2010 for all first lien mortgages originated in New York City from 2004 to
2008 and still active as of January 1, 2008 in OCC Mortgage Metrics. OCC Mortgage Metrics is a
special extract of the LPS Applied Analytics database that includes detailed information about loan
8 This assumption implies that the odds ratio of a pair of outcomes is independent of any of the alternative outcomes.

13
modifications not usually reported in LPS.9 As with the standard LPS database, Mortgage Metrics
includes loans serviced by 12 large mortgage servicers covering approximately two-thirds of all
mortgages outstanding in the United States and includes all types of mortgages serviced, including
subprime mortgages.10
An observation in the data set is a loan in a given month. Although we look at
Nationally, the loans in the OCC Mortgage Metrics dataset represent a large
share of the overall mortgage industry, but they do not represent a statistically random sample of all
mortgage loans. For example, only the largest servicers are included in the OCC Mortgage Metrics,
and a large majority of the included servicers are national banks. Thus, the characteristics of these
loans may differ from the overall population of mortgages in the United States. Indeed, subprime
mortgages are underrepresented and conforming loans sold to the GSEs are overrepresented in the
OCC Mortgage Metrics data (U.S. Department of Treasury, 2008).
originations between 2004 and 2008, monthly performance history for those loans is only available
from January 2008 through January 2010. If a loan was originated in 2004 and went through
foreclosure proceedings in 2007, therefore, we will never see that loan. Although OCC Mortgage
Metrics provides detailed information on borrower characteristics, loan terms, payment history, and
modifications, it contains no information on borrower race or gender and provides little information
about property or neighborhood characteristics. We therefore supplement the loan level data with
information from multiple sources.
To match loan level information from the OCC Mortgage Metrics database to other sources,
we relied on mortgage deeds contained within the Automated City Register Information System 9 In addition, the quality of OCC Mortgage Metrics data is likely higher than that of the LPS data because the OCC and OTS went to great lengths to standardize the reporting of the variables across lenders and to correct data entry errors. On the other hand, the LPS data follows loan performance since origination, while the OCC Mortgage Metrics follows loan performance only since the beginning of 2008. 10 The number of servicers in the OCC Mortgage Metrics has varied over time since the onset of the data collection in 2007, primarily due to mergers and acquisitions among the initial servicers that provided the data. As of the end of 2009, the servicers in the OCC Mortgage Metrics included nine national banks and three thrifts with the largest mortgage-servicing portfolios among national banks and thrifts (U.S. Department of Treasury, 2010). The OCC Mortgage Metric extract for New York City includes 11 servicers.

14
(ACRIS) of the New York City Department of Finance (DOF). Using a hierarchical matching
algorithm, we were able to match 65 percent of the loans in the OCC Mortgage Metrics database
back to the deeds records, which thus gave us the exact location of the mortgaged property.11
After we had a unique parcel identifier matched to each loan record, we were able to match
on many other sources. First, we attach some additional borrower characteristics, including race and
ethnicity, from Home Mortgage Disclosure Act (HMDA) data.
This
65 percent sample is not significantly different from the full universe in terms of the loan and
borrower characteristics that we use in the analyses below.
12
11 Our procedure for matching OCC Mortgage Metrics to ACRIS is similar to the method used by Chan et al. (2010) to match LoanPerformance to ACRIS. Our data from ACRIS do not include Staten Island and thus we had to drop this borough from our analysis. We merged OCC Mortgage Metrics loans to ACRIS mortgage deeds using three common fields: origination or deed date, loan amount and zip code, using six stages of hierarchical matching. At the end of each stage, loans and deeds that uniquely matched each other were set aside and considered matched, while all other loans and deeds enter the next stage. Stage 1 matched loans and deeds on the raw values of date, loan amount and zip code. Stage 2 matched the remaining loans and deeds on the raw values of date and zip code, and the loan amount rounded to $1,000. Stage 3 matched on the raw values of date and zip code, and the loan amount rounded to $10,000. Stage 4 matched on the raw values of zip code and loan amount, and allowed dates to differ by up to 60 days. Stage 5 matched on the raw value of zip code, loan amount rounded to $1,000, and allowed dates to differ by up to 60 days. Stage 6 matched on the raw value of zip code, loan amount rounded to $10,000, and allowed dates to differ by up to 60 days. We believe it is valid to introduce a 60-day window because in ACRIS, there may be administrative lags in the recording of the deeds data. The chance of false positive matching is low because we are matching loans to the full universe of deed records, and only considering unique matches. The relatively low match rate of 65 percent is due to the fact that we were unable to match loans made on coop units in the OCC Mortgage Metrics data to ACRIS deeds because coop mortgages are recorded differently in ACRIS and do not list a loan amount. During our study period, 28.2% of residential property sales in the four boroughs studied were coops. Further, our match rate was lowest (44%) in Manhattan where 48% of sales during the study period were of coop units. This evidence suggests that had we been able to exclude coop loans from our original OCC Mortgage Metrics dataset prior to matching to ACRIS, our final match rate would have been much higher (around 90%).
Second, we incorporate
information on whether the borrower took on additional mortgage debt following loan origination,
obtained from DOF’s ACRIS. Third, we merge information from the DOF’s Real Property
Assessment Database (RPAD) on building characteristics. Fourth, we merge information on
whether the borrower received foreclosure prevention counseling or other assistance (including legal
12 We merged HMDA records to ACRIS deeds based on date, loan amount and census tract, using the same six stage hierarchical matching technique as for the OCC Mortgage Metrics-ACRIS match. We then paired each of the OCC Mortgage Metrics records with HMDA records based on the unique deed identification number from ACRIS. In the end, we were able to match 73 percent of the OCC Mortgage Metrics-ACRIS matched loans (or 48 percent of all OCC Mortgage Metrics loans) to the HMDA records. While other researchers have matched loan level data (such as OCC Mortgage Metrics) directly to HMDA by using the zip code as a common geographic identifier, our matching strategy is likely more reliable as it uses a more precise common geographical identifier (census tract).

15
services) from any of the non-profit organizations coordinated by the Center for New York City
Neighborhoods (CNYCN)13. Fifth, we merge in repeat sales house price indices the Furman Center
for Real Estate and Urban Policy compiles to track appreciation in 56 different community districts
of New York City.14 Sixth, we link information on the demographic characteristics of census tracts
using the 2000 Census. Seventh, we add the rate of mortgage foreclosure notices (lis pendens) at the
census tract level.15
When available, we matched data at the observation level to show information about the
specific property being studied. When observation level data was not available (e.g., educational
attainment) or was not appropriate (e.g., the neighborhood lis pendens rate in the prior 6 months) we
used neighborhood level data instead. For neighborhood level data, we used census tract level data,
the smallest geographic level available, whenever possible. Census tract data was not available for
,the unemployment rate and the rate of house price appreciation, which we calculated instead at the
community district level,
Finally, using all loans in the LPS data (not just the seriously delinquent ones),
we construct each servicer’s share of the loans which were originated in the zip code between 2004
and 2008 and were outstanding and serviced by one of the LPS servicers at some point in 2008 or
2009.
16
13 CNYCN is a non-profit organization, funded by grants from government, foundations, and financial institutions, to coordinate foreclosure counseling, education, ,and legal services from a variety of non-profit providers throughout New York City to homeowners and tenants at risk of losing their home to foreclosure. CNYCN directs borrowers facing trouble with their mortgages who call 311 to local foreclosure counseling or legal services. Each of its partner organizations then reports back to CNYCN on which borrowers received foreclosure prevention counseling or legal services.
and the servicer’s share of the outstanding loans, which we computed at
the zip code level. To illustrate the relative size of each jurisdiction, Figure 2 shows census tract
14 See Armstrong et al. (2009) for a description. We transform quarterly indices into monthly series by linear interpolation. 15 The lis pendens are from Public Data Corporation. The rate is computed as the number of lis pendens per 1000 housing units recorded over the 6-month period preceding the month of loan performance. 16 Community districts are political units unique to New York City. Each of the 59 community districts has a Community Board whose members are appointed by the Borough President of that district; half of the members are nominated by the City Council members who represent the district. The Community Boards review applications for zoning changes and other land use proposals, and make non-binding recommendations about those proposals. They also recommend budget priorities.

16
boundaries, community district boundaries and foreclosures in the four boroughs of New York City
in 2009.17
4.1 Descriptive Statistics
Table 1 presents descriptive statistics for the dataset used in the estimation, organized in four
panels: A – distribution of outcomes; B – loan characteristics; C – borrower and property
characteristics; and D – neighborhood characteristics. Panel A shows that almost 32 percent of the
seriously delinquent loans in our data received a modification. About 17 percent of the loans were
cured through the borrower’s own efforts, about 8 percent experienced liquidation, and the
remaining loans (43 percent of the total) remained in serious delinquency during the whole study
period. The shares of loans going into particular outcomes may differ between New York City and
other cities or the nation as a whole for two reasons: 1) house prices in New York City peaked later
and have fallen less precipitously than in many other cities and 2) New York State has a longer, more
protracted judicial foreclosure process than most states.
Panel B presents descriptive statistics for the characteristics of the loans in our dataset. Our
dataset covers a range of loan products. Of the 28,956 seriously delinquent loans in our dataset,
there is a nearly even split between prime and non-prime loans, 60% have fixed interest rates while
the remainder have adjustable rate mortgages, 19% were interest only at origination and 78% are
conventional mortgages. Home purchase loans make up 43% the loans in our sample, while 35%
are refinances. Our sample also includes a mix of loans that have been privately securitized, bought
by the GSEs and held in portfolio. This robust mix of loan products, uses and investors allows us
to advance the literature because our conclusions are not limited to only one loan type or group of
17 For readability purposes, we do not show zip code boundaries in this map. We note however that the typical zip code size, both in terms of area and population, is larger than the typical census tract size but smaller than the typical community district size.

17
loans. The servicers in our sample serviced an average of 19% of the outstanding loans in each zip
code in which loans in our sample were originated.
The relative interest rate at origination for FRMs is calculated as the interest rate minus the
Freddie Mac average interest rate for prime 30-year fixed rate mortgages during the month of
origination. For ARMs, it is the interest rate minus the six-month London Interbank Offered Rate
(LIBOR) at origination. In our sample, over 47% of the fixed rate loans have relative interest rates
between 0 and 1 percent and nearly 45% of the adjustable rate loans have relative interest rates
between 2 and 4 percent at origination.
Because certain characteristics of the loans change over time, we construct loan-months for
every month during our study period in which a loan was active, for a total of 413,985 loan-months.
The last two descriptives in Panel B are measured across all loan-months in our sample, and show
that in 33% of the loan months, the borrower had a junior lien on the property, originated either at
the same time as the first lien or after the first lien but prior to the loan-month. The average LTV
for all of the loan months in our sample was 99.7%.18
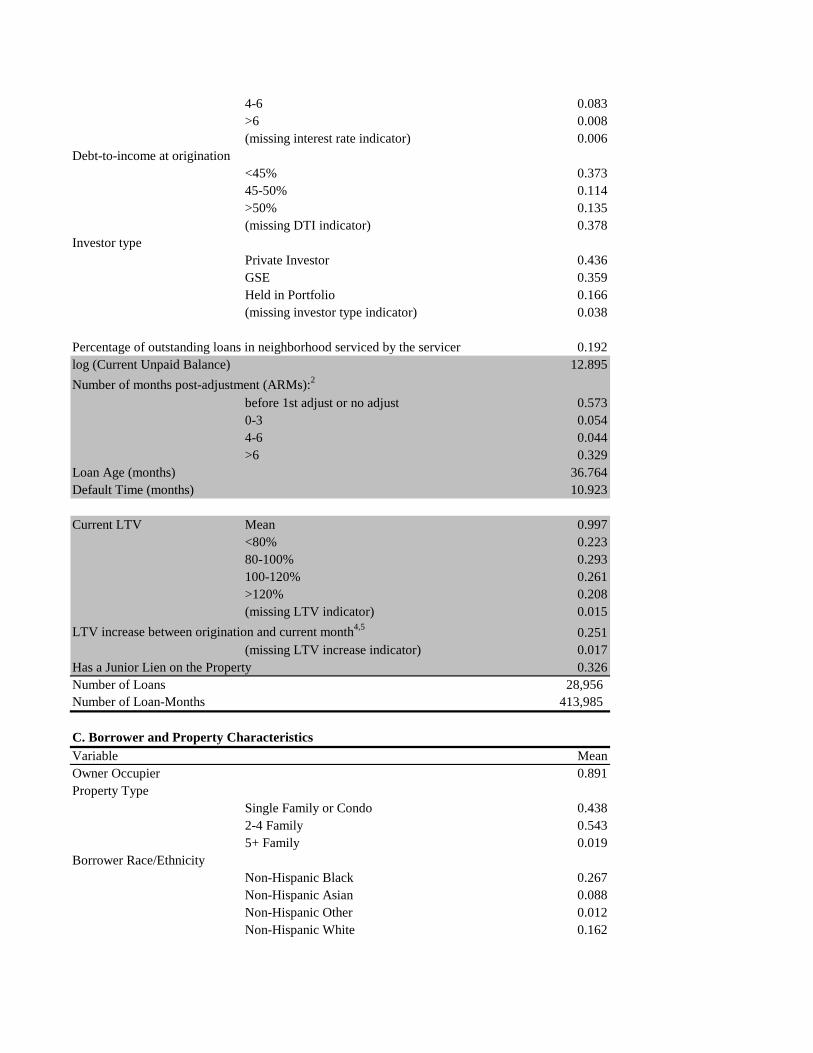
As Panel C shows, 89% of the borrowers in our sample report that they are owner-
occupiers. About 44 percent of the mortgages in the sample are secured by single family homes or
condominium units while 54 percent are secured by 2-4 family homes. That mix is fairly reflective
of the owner-occupied housing stock in New York City. According to the 2009 American
Community Survey, just 42 percent of homeowners in New York City live in single-family homes,
compared to 88 percent nationwide. The remainder of homeowners in New York City live in one
unit of a two to four unit building or own a condominium or cooperative apartment in a larger
building.
This reflected an average 25 percentage point
increase in LTV since origination.
18 LTV is based on the first lien only. We do not have data on outstanding balances, delinquencies or other outcomes for junior liens.

18
We constructed borrower months for those borrower level variables that change over time.
The current FICO score (reported quarterly for each borrower) has a mean of 556 across all
borrower-months, and almost 80% of borrower-months have FICO scores of 620 or less. On
average, FICO scores of delinquent borrowers in out sample declined by 115 points from
origination to the month being studied. Foreclosure counseling is also measured in loan-months to
ensure that we are capturing counseling that occurred prior to the outcome; 2.4 percent of all
borrowers received counseling at some point prior to the outcome (or the end of the study period if
no resolution occurred).19
The characteristics of the neighborhoods in which the properties in our sample are located
(shown in Panel D) largely mirror the neighborhood characteristics of the four boroughs of New
York City included in our analysis, except that properties in our sample are: (1) more likely to be
located in neighborhoods with high concentrations of non-Hispanic blacks; (2) less likely to be
located in neighborhoods with high concentrations of Hispanics; and (3) more likely to be in
neighborhoods with median incomes between $40,000 and $60,000 and less likely to be in
neighborhoods with median incomes less than $20,000 or more than $60,000.
20
Panel D also reveals some interesting neighborhood shifts from loan origination to loan
month studied. On average, the community district unemployment rate increased by two percentage
points.
21
Our model also includes servicer fixed effects. Panel E shows the range of FICO scores and
LTV ratios at the time of loan origination for the delinquent loans in our sample across the 11
Further, in the neighborhoods where the loans in our sample are located, house prices
decreased by an average of 20.2 percent between origination and the loan month being studied.
19 Note, however, that our counseling data only records counseling received between 01/01/2008 and 05/05/2010. 20 Not surprisingly, given that owner-occupier borrowers are by definition homeowners, properties in our sample are located in neighborhoods with higher homeownership rates than the average neighborhood in the four boroughs we studied. 21 The change in unemployment rate – not shown in Panel D - is based on the authors’ calculations.

19
servicers covered in the OCC Mortgage Metrics Data for New York City.22
For this analysis, we chose to focus on seriously delinquent loans because borrowers who
receive modifications without ever being seriously delinquent may differ from seriously delinquent
borrowers who receive modifications in several ways. First, those borrowers who receive
modifications without ever being seriously delinquent may be savvier and better able to negotiate the
modification process than the seriously delinquent borrowers who receive modifications. Second,
borrowers who have never been seriously delinquent may receive modifications because loan
servicers target certain borrowers for modifications (e.g., borrowers for whom the default is deemed
imminent due to a forthcoming lay-off or other event that will affect the ability to pay in the
foreseeable future). Third, borrowers who receive modifications without being seriously delinquent
may have loans that are systematically different in ways that made those loans easier or more
attractive for servicers to modify. Although we are unable to empirically explore the first and second
hypotheses, Table 2 presents descriptive evidence that supports the third hypothesis.
Average FICO scores
range from 658.5 to 704. LTVs range from .30 to .80.
5. Results
Table 3 presents odds ratio estimates for the multinomial logistic regression described above.
Below, we review in detail the results on the determinants of loan modifications (which are the focus
of this paper) and provide an overview of the results for the other default outcomes included in the
analysis.
5.1 Determinants of Modifications
Loan characteristics. The first set of rows in Table 3 show the impact the loan type has 22 Note, however, that our models only have 9 servicer dummy variables (one of which is excluded as the reference servicer) because two servicers had too few loans to be accounted for with separate indicators..
20
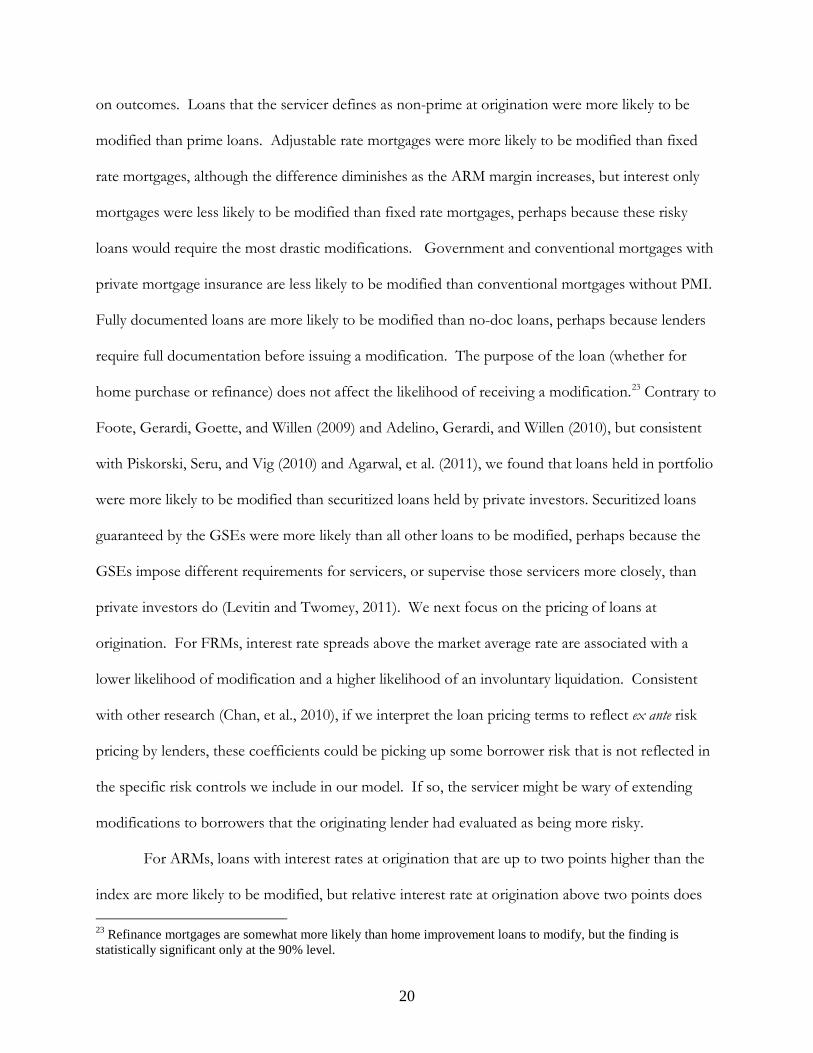
on outcomes. Loans that the servicer defines as non-prime at origination were more likely to be
modified than prime loans. Adjustable rate mortgages were more likely to be modified than fixed
rate mortgages, although the difference diminishes as the ARM margin increases, but interest only
mortgages were less likely to be modified than fixed rate mortgages, perhaps because these risky
loans would require the most drastic modifications. Government and conventional mortgages with
private mortgage insurance are less likely to be modified than conventional mortgages without PMI.
Fully documented loans are more likely to be modified than no-doc loans, perhaps because lenders
require full documentation before issuing a modification. The purpose of the loan (whether for
home purchase or refinance) does not affect the likelihood of receiving a modification.23
For ARMs, loans with interest rates at origination that are up to two points higher than the
index are more likely to be modified, but relative interest rate at origination above two points does
Contrary to
Foote, Gerardi, Goette, and Willen (2009) and Adelino, Gerardi, and Willen (2010), but consistent
with Piskorski, Seru, and Vig (2010) and Agarwal, et al. (2011), we found that loans held in portfolio
were more likely to be modified than securitized loans held by private investors. Securitized loans
guaranteed by the GSEs were more likely than all other loans to be modified, perhaps because the
GSEs impose different requirements for servicers, or supervise those servicers more closely, than
private investors do (Levitin and Twomey, 2011). We next focus on the pricing of loans at
origination. For FRMs, interest rate spreads above the market average rate are associated with a
lower likelihood of modification and a higher likelihood of an involuntary liquidation. Consistent
with other research (Chan, et al., 2010), if we interpret the loan pricing terms to reflect ex ante risk
pricing by lenders, these coefficients could be picking up some borrower risk that is not reflected in
the specific risk controls we include in our model. If so, the servicer might be wary of extending
modifications to borrowers that the originating lender had evaluated as being more risky.
23 Refinance mortgages are somewhat more likely than home improvement loans to modify, but the finding is statistically significant only at the 90% level.
21
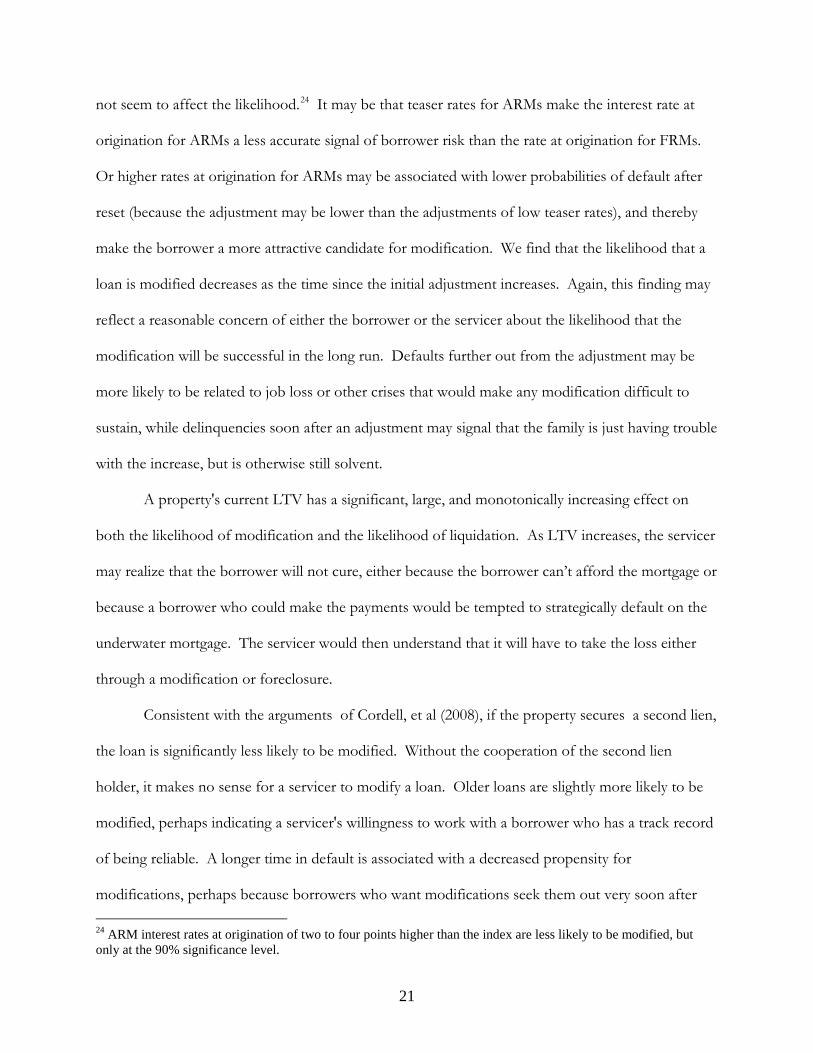
not seem to affect the likelihood.24
A property's current LTV has a significant, large, and monotonically increasing effect on
both the likelihood of modification and the likelihood of liquidation. As LTV increases, the servicer
may realize that the borrower will not cure, either because the borrower can’t afford the mortgage or
because a borrower who could make the payments would be tempted to strategically default on the
underwater mortgage. The servicer would then understand that it will have to take the loss either
through a modification or foreclosure.
It may be that teaser rates for ARMs make the interest rate at
origination for ARMs a less accurate signal of borrower risk than the rate at origination for FRMs.
Or higher rates at origination for ARMs may be associated with lower probabilities of default after
reset (because the adjustment may be lower than the adjustments of low teaser rates), and thereby
make the borrower a more attractive candidate for modification. We find that the likelihood that a
loan is modified decreases as the time since the initial adjustment increases. Again, this finding may
reflect a reasonable concern of either the borrower or the servicer about the likelihood that the
modification will be successful in the long run. Defaults further out from the adjustment may be
more likely to be related to job loss or other crises that would make any modification difficult to
sustain, while delinquencies soon after an adjustment may signal that the family is just having trouble
with the increase, but is otherwise still solvent.
Consistent with the arguments of Cordell, et al (2008), if the property secures a second lien,
the loan is significantly less likely to be modified. Without the cooperation of the second lien
holder, it makes no sense for a servicer to modify a loan. Older loans are slightly more likely to be
modified, perhaps indicating a servicer's willingness to work with a borrower who has a track record
of being reliable. A longer time in default is associated with a decreased propensity for
modifications, perhaps because borrowers who want modifications seek them out very soon after 24 ARM interest rates at origination of two to four points higher than the index are less likely to be modified, but only at the 90% significance level.

22
defaulting on their loan or because servicers target modifications to borrowers who have only
recently become delinquent.
Finally, we find that the propensity to modify loans and to reach other workouts varies
substantially across servicers.25
Property and Borrower characteristics. Consistent with prior literature and the current
regulatory framework, loans on owner-occupied properties are more likely to be modified than
investor-owned properties. Further, loans on 2-4 unit or 5+ unit rental apartment buildings are less
likely to be modified than loans on single-family buildings or condominium units. A greater decline
in a borrower’s FICO score from loan origination to the first delinquency (so, before the
delinquency itself had an impact on the score) is correlated with a lesser likelihood of the loan being
modified. Servicers may see borrowers whose FICO scores had declined significantly as bad
candidates for modifications because they appear to be undergoing some other financial hardship.
However, controlling for this decline, borrowers with higher current FICO scores were less likely to
receive modifications, perhaps indicating that servicers were unwilling to modify loans of a
borrowers who the servicer is particularly concerned may be strategically defaulting. The race or
ethnicity of the borrower had no significant impact on the likelihood that a loan would be modified.
We find a significant relationship between a borrower's receipt of foreclosure counseling and the
likelihood that their loan will be modified.
Additionally, we find that the probability of modification increases as
the percentage of outstanding loans in the neighborhood serviced by a particular servicer increases,
but only at a 10 percent significance level. .
Neighborhood characteristics. Table 3 also explores how the housing market conditions
in a neighborhood affect the likelihood that a loan on a property within the neighborhood will be
modified. Loans on properties in neighborhoods with high foreclosure rates in the six months
25 For confidentiality purposes, we cannot show the specific estimates for the servicer fixed effects.

23
prior to the loan month being studied are less likely to be modified, and the likelihood decreases as
the foreclosure rate increases. One of the strongest predictors of modification in our model is how
the rate of house price depreciation compares to rates in other neighborhoods.26
We find that higher area unemployment rates are associated with lower propensity to
modify, although this effect is only significant at the 10 percent level. Perhaps servicers are reluctant
to offer modifications to the unemployed because modified loans still require monthly payments and
these may not be affordable without a steady income stream.
The probability of
getting a modification is higher in those neighborhoods that are losing value, but at lower rates than
other neighborhoods. Curiously, borrowers in appreciating neighborhoods with relatively higher
rates of appreciation are less likely to cure on their own. These findings suggest that servicers acting
to minimize lender/investors’ losses may be wary of offering modifications in the hardest hit
neighborhoods because those may have little chance of recovering in the short term. The lower the
depreciation rate in markets with falling prices, the stronger the servicer’s incentives to modify in
order to minimize lender/investor’s losses. In appreciating neighborhoods, on the other hand,
servicers are unlikely to want to modify the loan because they may be able to sell the property with
minimal loss, and because they will not want to encourage strategic defaults. Struggling borrowers
in those neighborhoods should have options to cure on their own, such as selling the home for the
full amount of the loan or refinancing, so the borrowers may be less likely to seek modifications.
Loans on properties in neighborhoods that are greater than 40% black are more likely to be
modified than loans on properties in other neighborhoods. One possible explanation is that
26 The results pertain to house price appreciation since origination. We also experimented with recent house price appreciation (appreciation over the four quarters preceding the performance quarter) and the effects are consistent (similar significance levels and slightly lower magnitude)

24
foreclosure outreach efforts are targeted to primarily African American neighborhoods, which are
thought to be more vulnerable to foreclosure.
Several findings suggest that servicers are less likely to modify loans of borrowers who the
servicers fear may be especially likely to strategically default. Loans in neighborhoods with high
educational attainment, for example, are less likely to be modified. Neighborhood educational
attainment is likely to be a rough proxy for borrower educational attainment, and lenders may
suspect that those borrowers may be more financially sophisticated and therefore more likely to
strategically default. Loans in neighborhoods where many households have children also are less
likely to be modified, which may reflect servicers’ assumptions that those families are unlikely to
actually walk away from their homes but may default strategically in order to reduce their payments
through modifications. It turns out, however, that households in those neighborhoods also are less
likely to cure on their own. On the other hand, in neighborhoods with homeownership rates above
60% (a very high rate for New York City) borrowers are more likely to receive modifications. The
percentage of a neighborhood’s population that is foreign-born is significant only for neighborhoods
with 40 to 60 percent foreign born. The percentage of a neighborhood’s population over 65 years
old is not a significant predictor of modification, nor is the median household income of the
neighborhood.
5.2 Determinants of Other Outcomes
Cure by borrower. In general our findings regarding the determinants of a borrower curing
the delinquency themselves are consistent with prior literature. Borrowers who are more financially
stable (as indicated by higher FICO scores or FICO scores that have declined less) and live in
neighborhoods whose residents have higher incomes and greater educational attainment, are more
likely to cure the delinquency through their own actions, a sale or a refinance. Borrowers who took

25
out loans that were less risky at origination – those with fixed rate, full documentation, lower relative
interest rates, or lower current LTVs, and those without junior liens – also were more likely to cure
their delinquencies themselves. Those findings may indicate that savvier borrowers may be able to
refinance their loans or otherwise catch up on missed payments. Borrowers in neighborhoods with
higher foreclosure rates in the 6 months prior to the loan month were less likely to cure on their
own, possibly indicating that they had lost one of the options for curing: the ability to sell.
Borrowers who received foreclosure counseling were less likely to cure on their own, but this may
be a selection effect: borrowers may seek counseling only when they have run out of other options
and cannot cure on their own.
Liquidation. Our findings on the likelihood that a servicer will complete foreclosure of a
property through liquidation support some of the findings of prior research. We find that fully
documented loans are less likely to be liquidated. As the relative interest rate at origination for
FRMs increases, the probability of liquidation increases. As current LTV increases, the probability
of liquidation increases. We found little difference in the liquidation rate based on the race or
ethnicity of the borrowers, affirming the descriptive findings of Ambrose and Capone (1996). . We
also find that mortgages held in the lender’s portfolio are more likely to be liquidated. Borrowers
with FICO score that declined from origination to delinquency were slightly more likely to have
their property liquidated. A FICO score that already declined prior to the delinquency probably
indicates that the borrower was suffering from financial hardship beyond just the cost of the
mortgage payments. Such borrowers were probably not good candidates for modifications or other
non-liquidation workouts. Loans on properties in neighborhoods with higher concentrations of
non-Hispanic blacks or Hispanics are less likely to be liquidated than loans on properties in
neighborhoods with lower percentages of such minorities. Servicer fixed effects are very strong
predictors of liquidation. Finally, the borough fixed effects in our model indicate that properties in
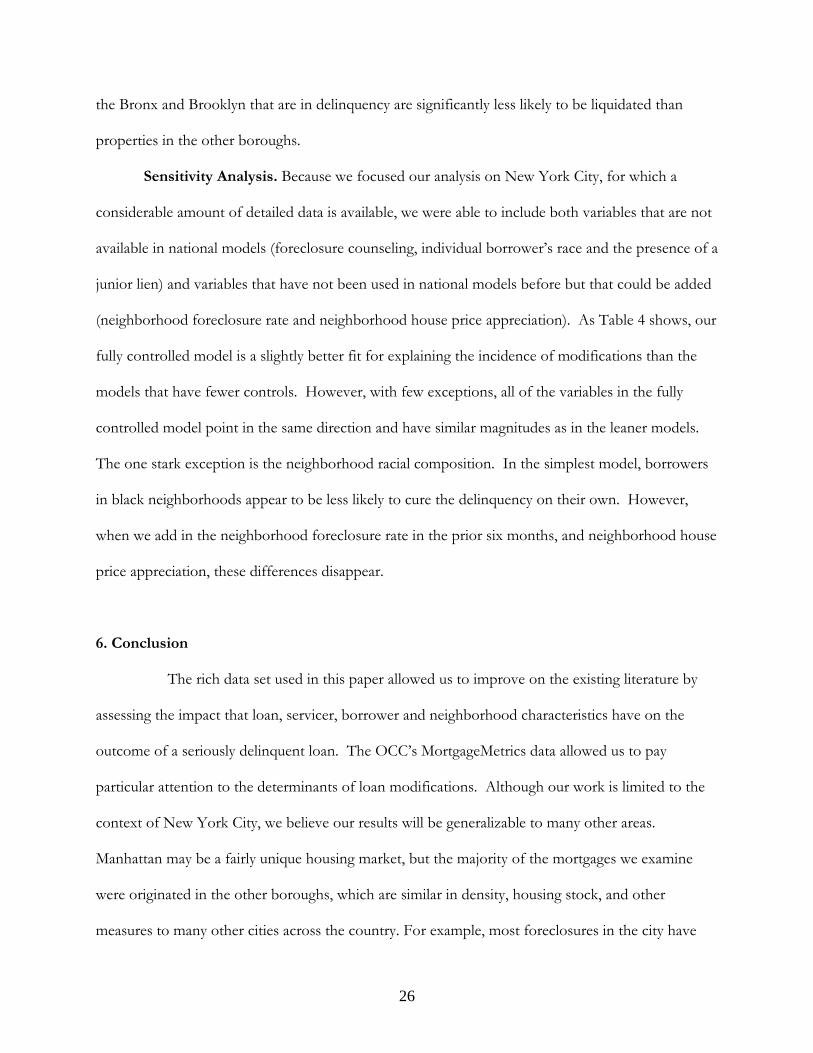
26
the Bronx and Brooklyn that are in delinquency are significantly less likely to be liquidated than
properties in the other boroughs.
Sensitivity Analysis. Because we focused our analysis on New York City, for which a
considerable amount of detailed data is available, we were able to include both variables that are not
available in national models (foreclosure counseling, individual borrower’s race and the presence of a
junior lien) and variables that have not been used in national models before but that could be added
(neighborhood foreclosure rate and neighborhood house price appreciation). As Table 4 shows, our
fully controlled model is a slightly better fit for explaining the incidence of modifications than the
models that have fewer controls. However, with few exceptions, all of the variables in the fully
controlled model point in the same direction and have similar magnitudes as in the leaner models.
The one stark exception is the neighborhood racial composition. In the simplest model, borrowers
in black neighborhoods appear to be less likely to cure the delinquency on their own. However,
when we add in the neighborhood foreclosure rate in the prior six months, and neighborhood house
price appreciation, these differences disappear.
6. Conclusion
The rich data set used in this paper allowed us to improve on the existing literature by
assessing the impact that loan, servicer, borrower and neighborhood characteristics have on the
outcome of a seriously delinquent loan. The OCC’s MortgageMetrics data allowed us to pay
particular attention to the determinants of loan modifications. Although our work is limited to the
context of New York City, we believe our results will be generalizable to many other areas.
Manhattan may be a fairly unique housing market, but the majority of the mortgages we examine
were originated in the other boroughs, which are similar in density, housing stock, and other
measures to many other cities across the country. For example, most foreclosures in the city have
27
taken place in the outer borough neighborhoods with a high concentration of one- and two-family
housing, and most of the homes affected by foreclosure are one- to four- family homes. More
importantly perhaps, we cannot think of strong reasons why the more distinct economic
environment of New York City would affect the relationships between post-default outcomes and
their determinants.27
We find that both borrowers and servicers appear to be acting to minimize their (or their
lender/investors’) losses in their propensity to cure, modify or come to another non-liquidation
workout or liquidate the property. As we would expect, current LTV is one of the strongest and
most statistically significant predictors of either cure or modification, with the likelihood of curing
falling and the likelihood of modification or liquidation rising as the LTV rises. Our evidence
suggests that borrowers who live in highly educated, high income neighborhoods and have high
credit scores or FICO scores that have declined less since loan origination are likely to find a way to
cure on their own.
Indeed, our analysis on New York City confirms the basic findings with respect
to the relatively narrow set of variables used in national-level analyses, even when controlling for
data which are difficult to incorporate or have not been previously used in national models.
The neighborhood's housing price appreciation also is a strong predictor of outcomes. Our
findings suggest that servicers may be wary of offering modifications in neighborhoods with high
house price depreciation rates because those neighborhoods may have little chance of recovering in
the short term.
Especially risky loan characteristics, including junior liens, ARMs with high margins, interest
only loans, very high interest rate FRMs, and loans without full documentation result in bad
outcomes for both the borrowers and the servicers. Unsurprisingly, having these high risk (and now
relatively unavailable) characteristics on a loan made a borrower less likely to be able to cure the 27 Housing and labor market variables may have smaller variation in the stronger housing and labor markets of New York City, however this would only affect the precision of the coefficients on those variables.

28
default on their own. Most of these characteristics also made it less likely that a loan would be
modified, either because the cost of modification would be too high for the most exotic loans (such
as interest only) or because the actual process of modifying is more difficult, as in the case of junior
liens that would require coordination with another servicer or in the case of loans originated without
the full documentation necessary to complete a modification.
Additional evidence that servicers are acting to minimize lender’s or investors’ losses in their
modification decisions can be gleaned from the finding that adjustable rate loans are less likely to be
modified many months after the rate adjustment. As more time passes from adjustment, a
borrower’s delinquency likely has less to do with the payment shock at adjustment and more to do
with some unobserved financial difficulty such as the loss of a job. Taking this into account, it
appears that servicers are modifying loans when the borrower could afford payments were it not for
the big payment shocks.
We find no evidence that servicers are discriminating by race in their decisions about
whether to modify loans, or foreclose. In this analysis, we cannot, however, rule out the possibility
that the terms of modifications or other workouts might differ by race or some other characteristics
of borrowers. Although an individual borrower's race is not a good predictor of the outcome of
delinquency, the race of the neighborhood in which the property is located is a good predictor of
loan modifications and liquidations. Our model includes controls for many demographic
characteristics of a neighborhood, as well as the recent foreclosure rate in the neighborhood, but
even controlling for those factors, neighborhoods with large shares of black residents are more likely
to get modifications and to avoid foreclosure. This could be because foreclosure prevention efforts
are concentrated in African American neighborhoods. We find that foreclosure counseling
significantly increases the likelihood of a loan being modified or coming to some other workout, and
decreases the probability of liquidation.

29
Finally, servicers vary considerably in their granting of modifications, and especially vary in
their propensity to liquidate mortgages. This may reflect some unobservable factors about the loans
or staffing, training, or incentive differences among servicers.
Our study suggests that modification programs may need to be refined in several ways.
First, modification programs should learn from counseling programs. We find that borrowers who
receive counseling services are more likely to reach a modification or come to some sort of workout
agreement with the servicer.
Further, we found that local house price dynamics are a good predictor of whether a loan
will be modified. Although the Furman Center neighborhood level repeat sales indices in New York
City are more detailed than indices available in other areas, there are opportunities to include house
price dynamics in the criteria to determine eligibility for a modification. Case-Shiller sells zip code
level house price appreciation indices and makes tiered indices available at the MSA level for free.
Finally, our findings suggest a need for additional attention to certain servicers. Even
controlling for characteristics of the loan, borrower, property and neighborhood, servicers have
pursued modifications and especially liquidations at wildly different rates. This suggests that some
servicers may need additional incentives or penalties to avoid liquidation or need more time and
assistance to build the capacity to do so.
We plan to extend this study by analyzing the default rate and determinants of outcomes for
borrowers who have gotten modifications. That extension will reveal the characteristics of a
modification that are most correlated with success while controlling for characteristics of the
borrower, the neighborhood and the original loan.
7. Bibliography
Abt. Associates. (2009). Loan Modifications as a Response to the Foreclosure Crisis: An Examination of Subprime Loan Outcomes in Maryland and Surrounding States.

30
Adelino, Manuel, Gerardi, Kristopher, and Willen, Paul. “What Explains Differences in
Foreclosure Rates? A Response to Piskorski, Seru, and Vig.” FRB of Boston Working Paper No. 10-2 (2010).
Adelino, Manuel, Gerardi, Kristopher, Willen, Paul. “Why Don’t Lenders Renegotiate More
Home Mortgages? Redefaults, Self-Cures, and Securitization.” FRB of Atlanta Working Paper No. 2009-17 (2009).
Ambrose, B. W. and Capone, C. A. (1996a). Cost-Benefit Analysis of Single Family Foreclosure Alternatives. Journal of Real Estate Finance and Economics, 13(2), 105-120.
Ambrose, Brent A.., Capone, Jr., Charles A. “Do Lenders Discriminate in Processing Defaults?,” Cityscape, Vol. 2, No. 1 (1996b).
Capozza, Dennis., and Thomson, Thomas. “Optimal Stopping and Losses on Subprime Mortgages.”
Journal of Real Estate Finance and Economics, 30(2) (2005): 115-131. Capozza, D. R., and Thomson, T. A. (2006). Subprime Transitions: Lingering or
Malingering in Default? The Journal of Real Estate Finance and Economics, 33(3), 241-258.
Chan, Sewin, Sharygin, Claudia, Been, Vicki, Haughwout, Andrew F. “What happens to seriously
delinquent mortgage borrowers and their homes?” Unpublished manuscript (2011). Collins, J. Michael and Reid, Carolina. Who Receives a Mortgage Modification? “Race and Income
Differentials in Loan Workouts.” (2011). Available at SSRN: http://ssrn.com/abstract=1743159
Cordell, L., Dynan, Karen, Lehnert Andreas, Liang, Nellie, Mauskopf, Eileen. “Designing Loan
Modifications to Address the Mortgage Crisis and the Making Home Affordable Program.” Finance and Economics Discussion Series, Federal Reserve Board, Washington, D.C. 2009-43 (2009).
Cordell, L., Dynan, K., Lehnert, A., Liang, N., and Mauskopf, E. (2008). The Incentives
of Mortgage Servicers: Myths and Realities. Finance and Economics Discussion Series, Working Paper No. 2008-46, Divisions of Research and Statistics and Monetary Affairs, Federal Reserve Board, Washington, D.C.
Cotterman, Robert F. “Neighborhood Effects in Mortgage Default Risk.” Office of Policy Development and Research, U.S. Department of Housing and Urban Development (2001).
Danis, Michelle A. and Pennington-Cross, Anthony N. “The Delinquency of Subprime Mortgages.”
FRB of St. Louis Working Paper No. 2005-022A (2005). Available at SSRN: http://ssrn.com/abstract=761804

31
Danis, Michelle A. and Pennington-Cross, Anthony (2005), “A Dynamic Look at Subprime Mortgage Performance” The Journal of Fixed Income [](): 28-39.
Ellen, Ingrid, Lacoe, Johanna, and Sharygin, Claudia (2011). "Do Foreclosures Cause Crime?" Draft Manuscript.
Foote, C., Gerardi, K., Willen, P. “Negative equity and foreclosure: Theory and evidence.”
Journal of Urban Economics, 64(2) (2008): 234-245 Foote, C., Gerardi, K., Goette, L., and Willen, P. (2009). Reducing Foreclosures: No
Easy Answers. National Bureau of Economic Research, Working Paper No. 15063. http://www.nber.org/papers/w15063.
Gerardi, Kristopher and Li, Wenli (2010), Mortgage Foreclosure Prevention Efforts, Federal Reserve Bank of Atlanta Economic Review 95(2): 1-13.
Harding, J.P., Rosenblath, E., and Yao, V.W. (2009). The contagion effect of foreclosed
properties. Journal of Urban Economics, 66, 164-178.
Haughwout, Andrew F., Okah, Ebiere and Tracy, Joseph S. “Second Chances: Subprime Mortgage Modification and Re-Default.” FRB of New York Staff Report No. 417 (2009).
Immergluck, D. and Smith, G. (2006). The Impact of Single-Family Mortgage
Foreclosures on Neighborhood Crime. Housing Studies, 21(6), 851-866. 18
Kingsley, G. T., Smith, R., and Price, D. (2009). The Impacts of Foreclosures on Families
and Communities. The Urban Institute.
Levitin, Adam J. and Twomey, Tara, “Mortgage Servicing.” Yale Journal on Regulation Vol. 28, No. 1 (2011).
Magder, Dan. “Mortgage Loan Modifications: Program Incentives and Restructuring Design.”
Working Paper (2009). Mason, J. R. (2007). Mortgage Loan Modification: Promises and Pitfalls. Available at
SSRN: http://ssrn.com/abstract=1027470.
Pennington-Cross, A. (2006). The Duration of Foreclosures in the Subprime Mortgage Market: A Competing Risks Model with Mixing. Federal Research Bank of St. Louis Working Paper No. 2006-027A, April 2006.
Pennington-Cross, A. and Ho, G. (2010) The Termination of Subprime Hybrid and Fixed-Rate
Mortgages. Real Estate Economics 38(3), 399-426 Piskorski, T., Seru, A., and Vig, V. (2010). Securitization and Distressed Loan
Renegotiation: Evidence from the Subprime Mortgage Crisis. Journal of Financial Economics, 97(3), 369-397.
32
Riddiough, Timothy J., and Steve B. Wyatt. “Strategic Default, Workout, and Commercial
Mortgage Valuation.” Journal of Real Estate Finance and Economics 9 (1994): 5-22. Schuetz, J., Been, V., and Ellen, I. G. (2008). Neighborhood Effects of Concentrated
Mortgage Foreclosures. Journal of Housing Economics, 17(4), 306-319. Schloemer, E., Li, W., Ernst, K., and Keest, K. (2006). Losing Ground: Foreclosures in
the Subprime Market and Their Cost to Homeowners. The Center for Responsible Lending. http://www.centralvalleybusinesstimes.com/links/foreclosure%20report. pdf
U.S. Department of Treasury. (2008). OCC Mortgage Metrics Report for the First Quarter of
2008. June 11, 2008. http://www.occ.gov/publications/publications-by-type/other-publications-reports/mortgage-metrics-q1-2008/mortgage-metrics-q1-2008-pdf.pdf
U.S. Department of Treasury. (2010). OCC Mortgage Metrics Report for the First Quarter of 2010.
June 23, 2010. http://www.occ.gov/publications/publications-by-type/other-publications-reports/mortgage-metrics-q1-2010/mortgage-metrics-q1-2010-pdf.pdf
U.S. Department of Treasury. (2009). OCC Mortgage Metrics Report for the First Quarter of 2009.
June 30, 2009. http://www.occ.gov/publications/publications-by-type/other-publications-reports/mortgage-metrics-q2-2009/mortgage-metrics-q2-2009-pdf.pdf
U.S. Department of Treasury. (2011). OCC Mortgage Metrics Report for the First Quarter of
2011. June 29, 2011. http://www.occ.gov/publications/publications-by-type/other-publications-reports/mortgage-metrics-q1-2011/mortgage-metrics-q1-2011.pdf
Voicu, I., Jacob, M., Rengert, K., and Fang, I. 2011. Subprime Loan Default Resolutions: Do
They Vary across Mortgage Products and Borrower Demographic Groups? The Journal of Real Estate Finance and Economics, doi:10.1007/s11146-011-9305-4, 1-26.
Wang, Ko, Leslie Young, and Yuqing Zhou. 2002. Nondiscriminating foreclosure and voluntary liquidating costs. Review of Financial Studies 15(3), 959–85.

Table 1. Descriptive Statistics
A. Outcomes of Seriously Delinquent LoansOutcome % of all loansCure 17.3Modification 31.7Liquidation 8.1Delinquency Continues 42.9
B. Loan CharacteristicsVariable MeanCredit Class
Prime 0.463Non-Prime 0.476(missing credit class indicator) 0.061
Product DescriptionFRM 0.601ARM 2/28 0.110ARM 3/27 0.041ARM (other) 0.205Other 0.043
ARM * Margin at Origination1 1.970(ARM * missing margin at origination indicator)2 0.305
Interest Only at Origination 0.192(missing interest only indicator) 0.047
Full Documentation 0.362(missing full documentation indicator) 0.006
Product GroupGovernment (FHA, VA) 0.067Conventional with PMI 0.132Conventional 0.775Other 0.026
Loan PurposeHome Purchase 0.428Refinance 0.350Home Improvement 0.020(missing loan purpose indicator) 0.202
Relative interest rate at origination (FRMs):3
<0 0.2420-1 0.4741-2 0.1602-3 0.037>3 0.016(missing interest rate indicator) 0.070
Relative interest rate at origination (ARMs):2
<0 0.1080-2 0.3482-4 0.447
4-6 0.083>6 0.008(missing interest rate indicator) 0.006
Debt-to-income at origination<45% 0.37345-50% 0.114>50% 0.135(missing DTI indicator) 0.378
Investor typePrivate Investor 0.436GSE 0.359Held in Portfolio 0.166(missing investor type indicator) 0.038
Percentage of outstanding loans in neighborhood serviced by the servicer 0.192log (Current Unpaid Balance) 12.895Number of months post-adjustment (ARMs):2
before 1st adjust or no adjust 0.5730-3 0.0544-6 0.044>6 0.329
Loan Age (months) 36.764Default Time (months) 10.923
Current LTV Mean 0.997<80% 0.22380-100% 0.293100-120% 0.261>120% 0.208(missing LTV indicator) 0.015
LTV increase between origination and current month4,5 0.251(missing LTV increase indicator) 0.017
Has a Junior Lien on the Property 0.326Number of Loans 28,956 Number of Loan-Months 413,985
C. Borrower and Property CharacteristicsVariable MeanOwner Occupier 0.891Property Type
Single Family or Condo 0.4382-4 Family 0.5435+ Family 0.019
Borrower Race/EthnicityNon-Hispanic Black 0.267Non-Hispanic Asian 0.088Non-Hispanic Other 0.012Non-Hispanic White 0.162

Hispanic 0.142(missing race/ethnicity indicator) 0.329
Received Foreclosure Counseling6 0.024Current FICO Score4 555.560
<560 0.537560-620 0.261620-650 0.066650-680 0.037680-720 0.024>720 0.021(missing FICO score indicator) 0.054
FICO Score decline between origination and current month4 115.132(missing FICO Score decline indicator) 0.119
Number of Loans 28,956 Number of Loan-Months 413,985
D. Neighborhood CharacteristicsEstimation Sample NYC (4 boroughs)
Variable Mean MeanNeighborhood Racial Composition% Non-Hispanic Black
<20% 0.397 0.58420-40% 0.092 0.11740-60% 0.086 0.08560-80% 0.141 0.089>80% 0.284 0.125
% Hispanic<20% 0.621 0.55120-40% 0.201 0.203>40% 0.178 0.246
% Non-Hispanic Asian<20% 0.878 0.84020-40% 0.105 0.124>40% 0.017 0.036
Other Neighborhood Characteristics% Foreign Born
<20% 0.139 0.18120-40% 0.455 0.41440-60% 0.327 0.307>60% 0.078 0.098
% >65 Years Old<10% 0.494 0.44310-20% 0.458 0.462>20% 0.048 0.095
% of households with Children<25% 0.089 0.34525-50% 0.835 0.605>=50% 0.076 0.049

Median Household Income (1999)<$20,000 0.057 0.121$20,000-40,000 0.407 0.435$40,000-60,000 0.445 0.312>$60,000 0.091 0.132
% of adults with a Bachelor's degree or higher<20% 0.648 0.53020-40% 0.293 0.30940-60% 0.037 0.082>60% 0.021 0.079
Homeownership Rate<20% 0.167 0.33320-40% 0.265 0.31240-60% 0.245 0.182>60% 0.322 0.173
Origination Year2004 0.0892005 0.1922006 0.3222007 0.2912008 0.107
BoroughManhattan 0.033Bronx 0.135Brooklyn 0.328Queens 0.505
Quarter of Loan Performance2008 - 1 0.0312008 - 2 0.0542008 - 3 0.0522008 - 4 0.0612009 - 1 0.0782009 - 2 0.0892009 - 3 0.1052009 - 4 0.1252010 - 1 0.1332010 - 2 0.1172010 - 3 0.0992010 - 4 0.058
Unemployment Rate 0.090Recent Foreclosure Rate
<1% 0.2751-2% 0.2672-3% 0.228>3% 0.230
Positive HP Appreciation 0.112HP Appreciation -0.202Number of Loans 28,956 Number of Loan-Months 413,985
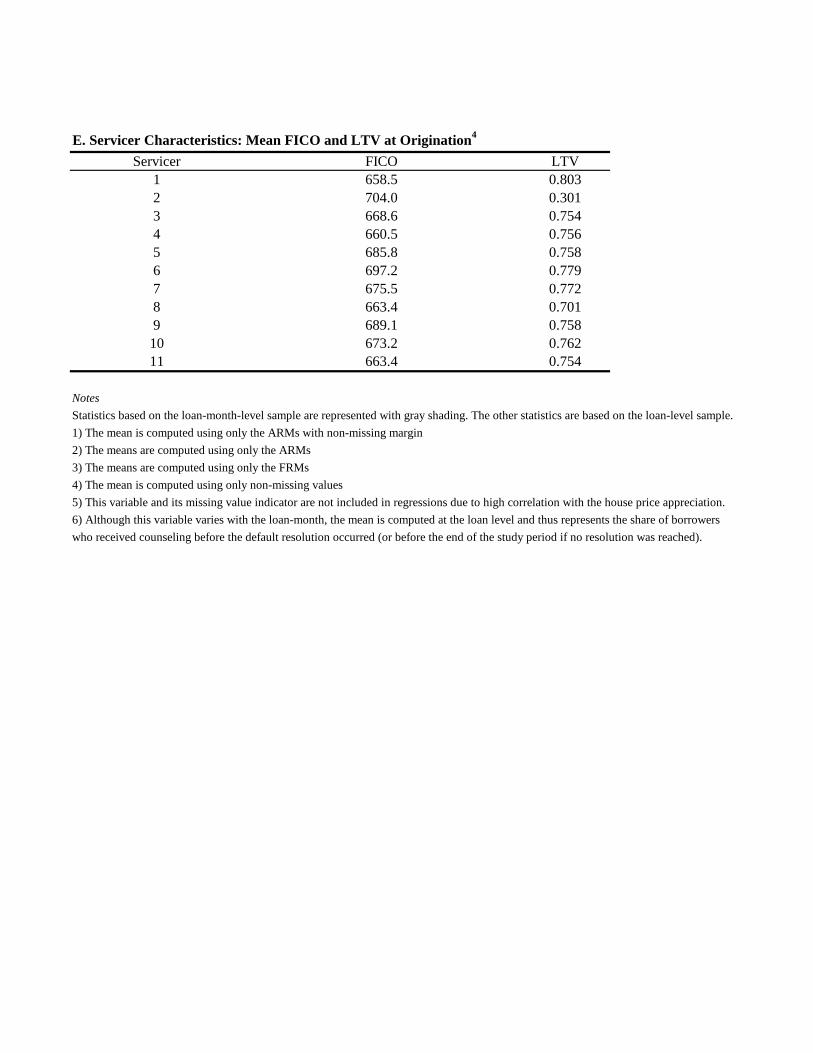
E. Servicer Characteristics: Mean FICO and LTV at Origination4
Servicer FICO LTV1 658.5 0.8032 704.0 0.3013 668.6 0.7544 660.5 0.7565 685.8 0.7586 697.2 0.7797 675.5 0.7728 663.4 0.7019 689.1 0.75810 673.2 0.76211 663.4 0.754
NotesStatistics based on the loan-month-level sample are represented with gray shading. The other statistics are based on the loan-level sample.1) The mean is computed using only the ARMs with non-missing margin2) The means are computed using only the ARMs3) The means are computed using only the FRMs4) The mean is computed using only non-missing values5) This variable and its missing value indicator are not included in regressions due to high correlation with the house price appreciation.6) Although this variable varies with the loan-month, the mean is computed at the loan level and thus represents the share of borrowerswho received counseling before the default resolution occurred (or before the end of the study period if no resolution was reached).
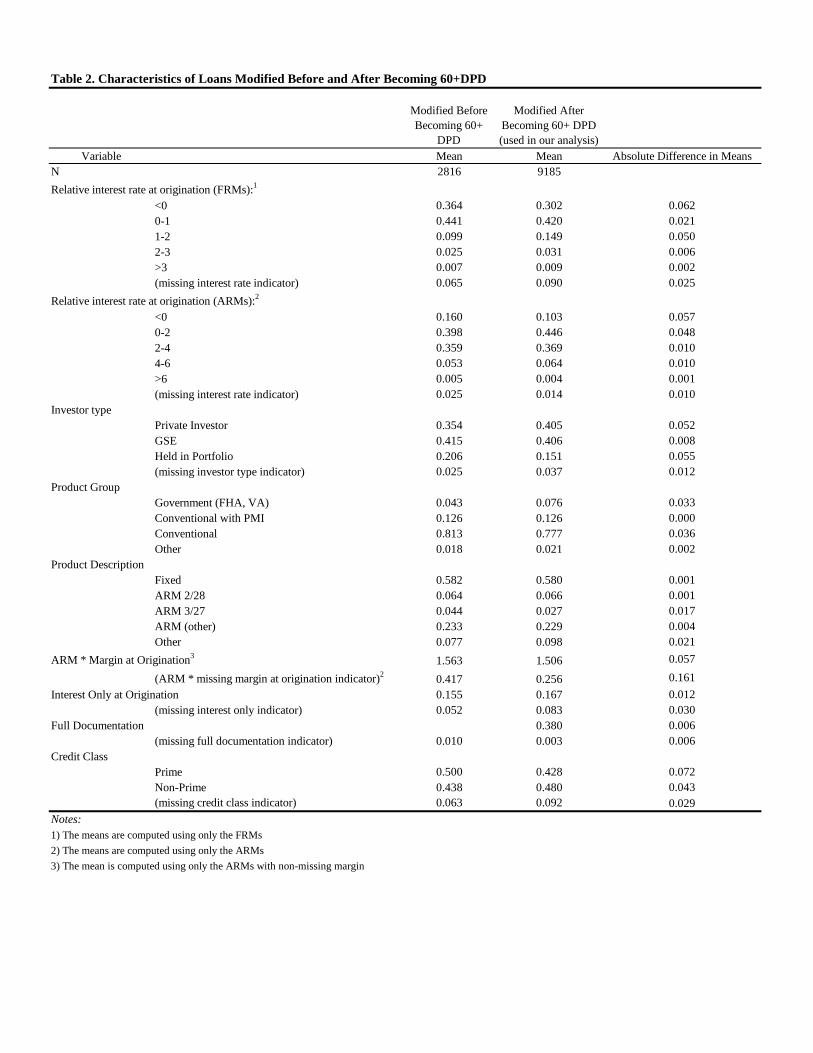
Table 2. Characteristics of Loans Modified Before and After Becoming 60+DPD
Modified Before Becoming 60+
DPD
Modified After Becoming 60+ DPD (used in our analysis)
Variable Mean Mean Absolute Difference in MeansN 2816 9185Relative interest rate at origination (FRMs):1
<0 0.364 0.302 0.0620-1 0.441 0.420 0.0211-2 0.099 0.149 0.0502-3 0.025 0.031 0.006>3 0.007 0.009 0.002(missing interest rate indicator) 0.065 0.090 0.025
Relative interest rate at origination (ARMs):2
<0 0.160 0.103 0.0570-2 0.398 0.446 0.0482-4 0.359 0.369 0.0104-6 0.053 0.064 0.010>6 0.005 0.004 0.001(missing interest rate indicator) 0.025 0.014 0.010
Investor typePrivate Investor 0.354 0.405 0.052GSE 0.415 0.406 0.008Held in Portfolio 0.206 0.151 0.055(missing investor type indicator) 0.025 0.037 0.012
Product GroupGovernment (FHA, VA) 0.043 0.076 0.033Conventional with PMI 0.126 0.126 0.000Conventional 0.813 0.777 0.036Other 0.018 0.021 0.002
Product DescriptionFixed 0.582 0.580 0.001ARM 2/28 0.064 0.066 0.001ARM 3/27 0.044 0.027 0.017ARM (other) 0.233 0.229 0.004Other 0.077 0.098 0.021
ARM * Margin at Origination3 1.563 1.506 0.057
(ARM * missing margin at origination indicator)2 0.417 0.256 0.161Interest Only at Origination 0.155 0.167 0.012
(missing interest only indicator) 0.052 0.083 0.030Full Documentation 0.380 0.006
(missing full documentation indicator) 0.010 0.003 0.006Credit Class
Prime 0.500 0.428 0.072Non-Prime 0.438 0.480 0.043(missing credit class indicator) 0.063 0.092 0.029
Notes:1) The means are computed using only the FRMs2) The means are computed using only the ARMs3) The mean is computed using only the ARMs with non-missing margin
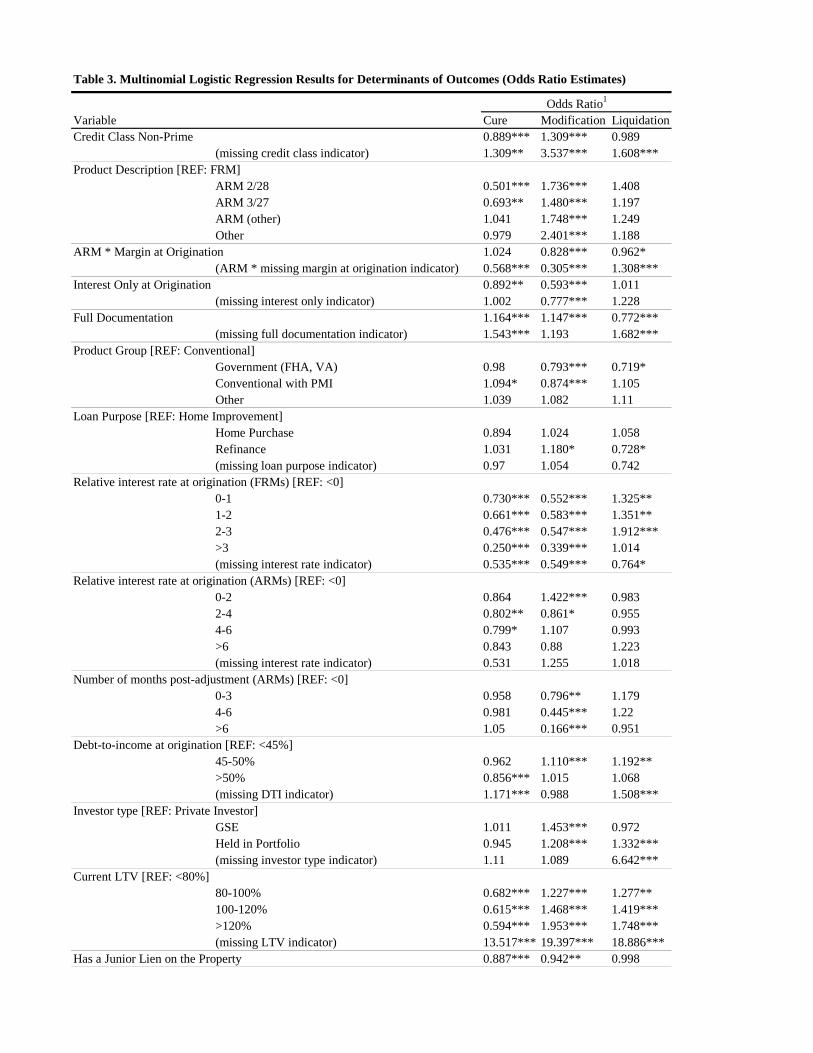
Table 3. Multinomial Logistic Regression Results for Determinants of Outcomes (Odds Ratio Estimates)
Variable Cure Modification LiquidationCredit Class Non-Prime 0.889*** 1.309*** 0.989
(missing credit class indicator) 1.309** 3.537*** 1.608***Product Description [REF: FRM]
ARM 2/28 0.501*** 1.736*** 1.408ARM 3/27 0.693** 1.480*** 1.197ARM (other) 1.041 1.748*** 1.249Other 0.979 2.401*** 1.188
ARM * Margin at Origination 1.024 0.828*** 0.962*(ARM * missing margin at origination indicator) 0.568*** 0.305*** 1.308***
Interest Only at Origination 0.892** 0.593*** 1.011(missing interest only indicator) 1.002 0.777*** 1.228
Full Documentation 1.164*** 1.147*** 0.772***(missing full documentation indicator) 1.543*** 1.193 1.682***
Product Group [REF: Conventional]Government (FHA, VA) 0.98 0.793*** 0.719*Conventional with PMI 1.094* 0.874*** 1.105Other 1.039 1.082 1.11
Loan Purpose [REF: Home Improvement]Home Purchase 0.894 1.024 1.058Refinance 1.031 1.180* 0.728*(missing loan purpose indicator) 0.97 1.054 0.742
Relative interest rate at origination (FRMs) [REF: <0]0-1 0.730*** 0.552*** 1.325**1-2 0.661*** 0.583*** 1.351**2-3 0.476*** 0.547*** 1.912***>3 0.250*** 0.339*** 1.014(missing interest rate indicator) 0.535*** 0.549*** 0.764*
Relative interest rate at origination (ARMs) [REF: <0]0-2 0.864 1.422*** 0.9832-4 0.802** 0.861* 0.9554-6 0.799* 1.107 0.993>6 0.843 0.88 1.223(missing interest rate indicator) 0.531 1.255 1.018
Number of months post-adjustment (ARMs) [REF: <0]0-3 0.958 0.796** 1.1794-6 0.981 0.445*** 1.22>6 1.05 0.166*** 0.951
Debt-to-income at origination [REF: <45%]45-50% 0.962 1.110*** 1.192**>50% 0.856*** 1.015 1.068(missing DTI indicator) 1.171*** 0.988 1.508***
Investor type [REF: Private Investor]GSE 1.011 1.453*** 0.972Held in Portfolio 0.945 1.208*** 1.332***(missing investor type indicator) 1.11 1.089 6.642***
Current LTV [REF: <80%]80-100% 0.682*** 1.227*** 1.277**100-120% 0.615*** 1.468*** 1.419***>120% 0.594*** 1.953*** 1.748***(missing LTV indicator) 13.517*** 19.397*** 18.886***
Has a Junior Lien on the Property 0.887*** 0.942** 0.998
Odds Ratio1

log (Current Unpaid Balance) 0.509*** 1.111*** 0.701***Loan Age 1.011** 1.007* 0.978***Default Time 0.880*** 0.972*** 1.136***Percentage of outstanding loans in neighborhood serviced by the servicer 1.143 1.905* 0.985
Borrower and Property CharacteristicsOwner Occupier 0.942 1.288*** 0.718***Property Type [REF: Single Fam & Condo]
2-4 Family 0.968 0.887*** 1.0375+ Family 0.882 0.831* 1.127
Current FICO Score [REF: <560]560-620 1.003 0.879*** 1.318***620-650 1.039 0.790*** 1.555***650-680 1.306*** 0.655*** 1.295*680-720 1.284*** 0.688*** 1.304>720 1.298*** 0.602*** 1.35(missing FICO score) 1.371*** 0.553*** 3.516***
FICO Score decline between origination and delinquency 0.998*** 0.997*** 1.003***(missing FICO Score decline indicator) 0.628*** 0.667*** 1.064
Borrower Race/Ethnicity [REF: Non-Hispanic White]Non-Hispanic Black 0.909* 0.98 0.92Non-Hispanic Asian 0.895* 0.985 0.911Non-Hispanic Other 0.797 0.885 1.346Hispanic 0.771*** 0.94 1.005(missing race/ethnicity) 0.942 0.976 1.016
Received Foreclosure Counseling 0.534*** 1.299*** 0.430***
Neighborhood CharacteristicsRecent Foreclosure Rate [REF: <1]
1-2% 0.917** 0.971 1.0042-3% 0.841*** 0.921** 0.99>3% 0.769*** 0.865*** 0.99
Positive HP Appreciation 1.077 0.917 1.026Positive HP Appreciation * HP Appreciation 0.571** 1.573 1.483Negative HP Appreciation * HP Appreciation 0.999 3.132*** 1.221Neighborhood Racial Composition [REF: 0-20%]% Non-Hispanic Black 20-40% 0.99 1.015 0.915
40-60% 0.94 1.196*** 0.789**60-80% 0.984 1.115** 0.731***>80% 0.951 1.165*** 0.651***
% Hispanic 20-40% 0.958 1.02 0.790***>40% 1.081 1.056 0.785**
% Non-Hispanic Asian 20-40% 0.956 1.005 1.084>40% 1.111 0.942 1.249
% Foreign Born [REF: 0-20%]20-40% 0.935 1.018 1.07740-60% 0.987 1.096** 0.887>60% 0.958 1.032 0.86
% >65 Years Old [REF: 0-10%]10-20% 0.984 0.997 1.051>20% 1.036 0.928 1
% of households with Children [REF: 0-25%]25-50% 0.826*** 0.897** 1.309**>=50% 0.738*** 0.925 1.452**
Median Household Income (1999) [REF: 0-$20,000]
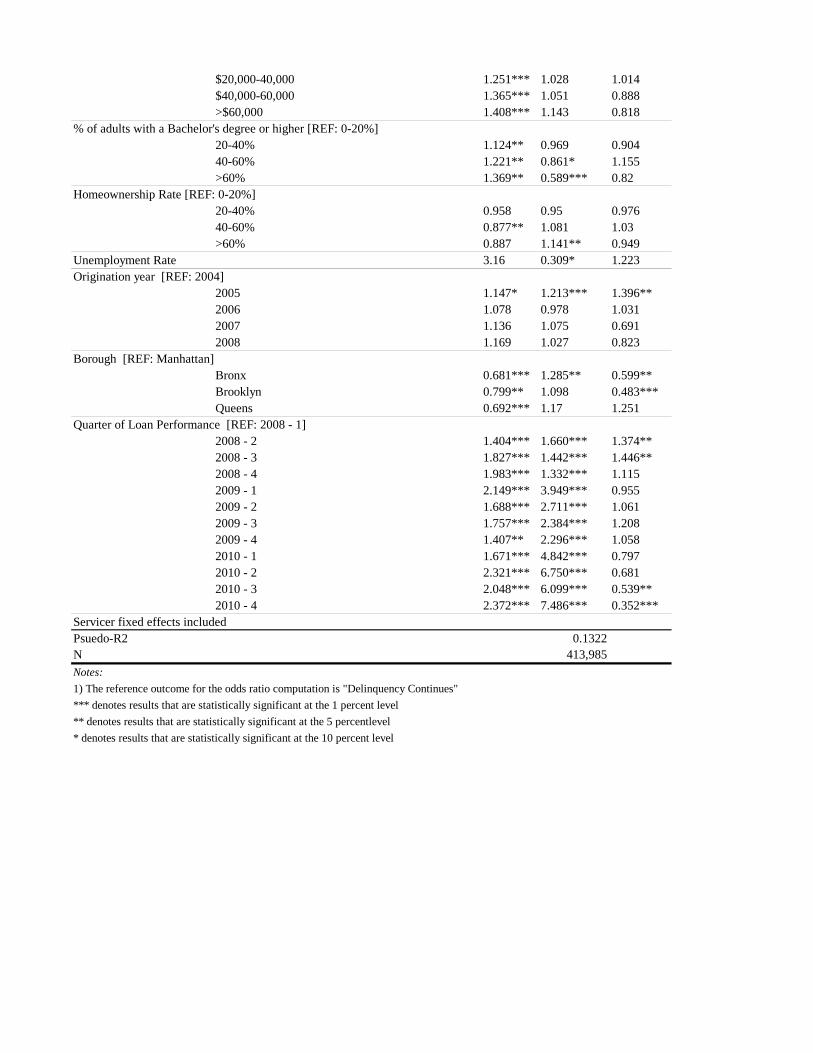
$20,000-40,000 1.251*** 1.028 1.014$40,000-60,000 1.365*** 1.051 0.888>$60,000 1.408*** 1.143 0.818
% of adults with a Bachelor's degree or higher [REF: 0-20%]20-40% 1.124** 0.969 0.90440-60% 1.221** 0.861* 1.155>60% 1.369** 0.589*** 0.82
Homeownership Rate [REF: 0-20%]20-40% 0.958 0.95 0.97640-60% 0.877** 1.081 1.03>60% 0.887 1.141** 0.949
Unemployment Rate 3.16 0.309* 1.223Origination year [REF: 2004]
2005 1.147* 1.213*** 1.396**2006 1.078 0.978 1.0312007 1.136 1.075 0.6912008 1.169 1.027 0.823
Borough [REF: Manhattan]Bronx 0.681*** 1.285** 0.599**Brooklyn 0.799** 1.098 0.483***Queens 0.692*** 1.17 1.251
Quarter of Loan Performance [REF: 2008 - 1]2008 - 2 1.404*** 1.660*** 1.374**2008 - 3 1.827*** 1.442*** 1.446**2008 - 4 1.983*** 1.332*** 1.1152009 - 1 2.149*** 3.949*** 0.9552009 - 2 1.688*** 2.711*** 1.0612009 - 3 1.757*** 2.384*** 1.2082009 - 4 1.407** 2.296*** 1.0582010 - 1 1.671*** 4.842*** 0.7972010 - 2 2.321*** 6.750*** 0.6812010 - 3 2.048*** 6.099*** 0.539**2010 - 4 2.372*** 7.486*** 0.352***
Servicer fixed effects includedPsuedo-R2 0.1322N 413,985Notes:1) The reference outcome for the odds ratio computation is "Delinquency Continues"*** denotes results that are statistically significant at the 1 percent level** denotes results that are statistically significant at the 5 percentlevel* denotes results that are statistically significant at the 10 percent level
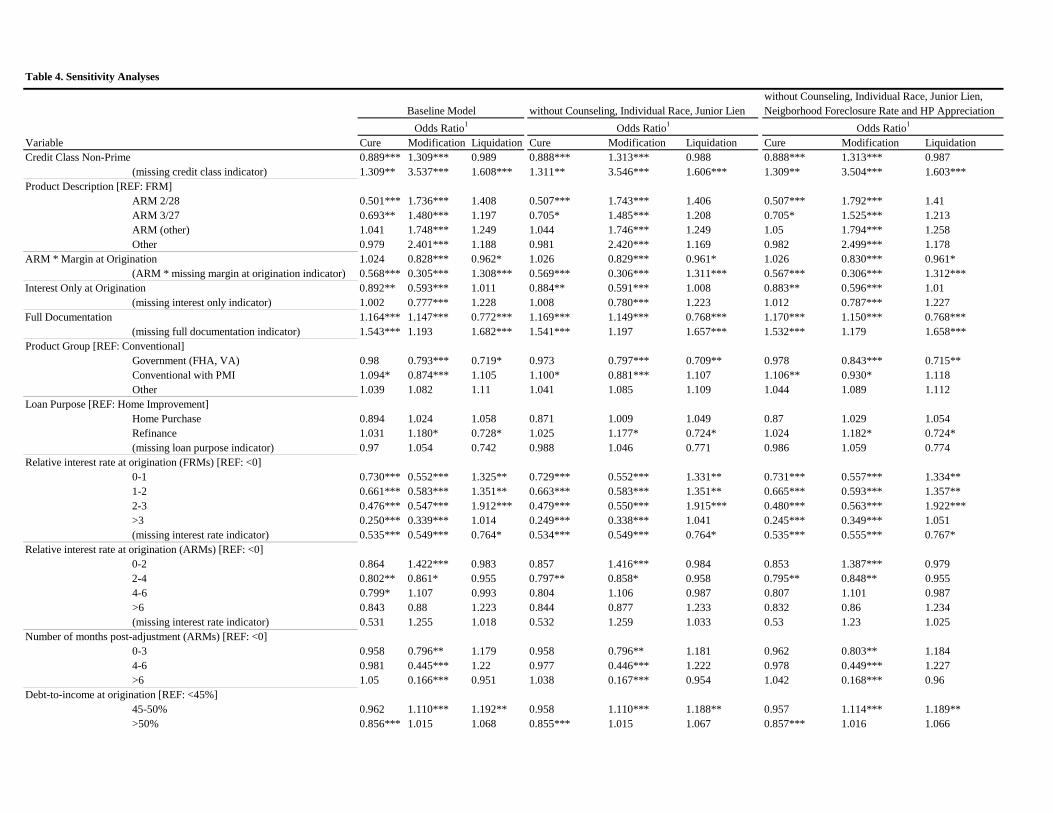
Table 4. Sensitivity Analyses
without Counseling, Individual Race, Junior Lien, without Counseling, Individual Race, Junior Lien Neigborhood Foreclosure Rate and HP Appreciation
Variable Cure Modification Liquidation Cure Modification Liquidation Cure Modification LiquidationCredit Class Non-Prime 0.889*** 1.309*** 0.989 0.888*** 1.313*** 0.988 0.888*** 1.313*** 0.987
(missing credit class indicator) 1.309** 3.537*** 1.608*** 1.311** 3.546*** 1.606*** 1.309** 3.504*** 1.603***Product Description [REF: FRM]
ARM 2/28 0.501*** 1.736*** 1.408 0.507*** 1.743*** 1.406 0.507*** 1.792*** 1.41ARM 3/27 0.693** 1.480*** 1.197 0.705* 1.485*** 1.208 0.705* 1.525*** 1.213ARM (other) 1.041 1.748*** 1.249 1.044 1.746*** 1.249 1.05 1.794*** 1.258Other 0.979 2.401*** 1.188 0.981 2.420*** 1.169 0.982 2.499*** 1.178
ARM * Margin at Origination 1.024 0.828*** 0.962* 1.026 0.829*** 0.961* 1.026 0.830*** 0.961*(ARM * missing margin at origination indicator) 0.568*** 0.305*** 1.308*** 0.569*** 0.306*** 1.311*** 0.567*** 0.306*** 1.312***
Interest Only at Origination 0.892** 0.593*** 1.011 0.884** 0.591*** 1.008 0.883** 0.596*** 1.01(missing interest only indicator) 1.002 0.777*** 1.228 1.008 0.780*** 1.223 1.012 0.787*** 1.227
Full Documentation 1.164*** 1.147*** 0.772*** 1.169*** 1.149*** 0.768*** 1.170*** 1.150*** 0.768***(missing full documentation indicator) 1.543*** 1.193 1.682*** 1.541*** 1.197 1.657*** 1.532*** 1.179 1.658***
Product Group [REF: Conventional]Government (FHA, VA) 0.98 0.793*** 0.719* 0.973 0.797*** 0.709** 0.978 0.843*** 0.715**Conventional with PMI 1.094* 0.874*** 1.105 1.100* 0.881*** 1.107 1.106** 0.930* 1.118Other 1.039 1.082 1.11 1.041 1.085 1.109 1.044 1.089 1.112
Loan Purpose [REF: Home Improvement]Home Purchase 0.894 1.024 1.058 0.871 1.009 1.049 0.87 1.029 1.054Refinance 1.031 1.180* 0.728* 1.025 1.177* 0.724* 1.024 1.182* 0.724*(missing loan purpose indicator) 0.97 1.054 0.742 0.988 1.046 0.771 0.986 1.059 0.774
Relative interest rate at origination (FRMs) [REF: <0]0-1 0.730*** 0.552*** 1.325** 0.729*** 0.552*** 1.331** 0.731*** 0.557*** 1.334**1-2 0.661*** 0.583*** 1.351** 0.663*** 0.583*** 1.351** 0.665*** 0.593*** 1.357**2-3 0.476*** 0.547*** 1.912*** 0.479*** 0.550*** 1.915*** 0.480*** 0.563*** 1.922***>3 0.250*** 0.339*** 1.014 0.249*** 0.338*** 1.041 0.245*** 0.349*** 1.051(missing interest rate indicator) 0.535*** 0.549*** 0.764* 0.534*** 0.549*** 0.764* 0.535*** 0.555*** 0.767*
Relative interest rate at origination (ARMs) [REF: <0]0-2 0.864 1.422*** 0.983 0.857 1.416*** 0.984 0.853 1.387*** 0.9792-4 0.802** 0.861* 0.955 0.797** 0.858* 0.958 0.795** 0.848** 0.9554-6 0.799* 1.107 0.993 0.804 1.106 0.987 0.807 1.101 0.987>6 0.843 0.88 1.223 0.844 0.877 1.233 0.832 0.86 1.234(missing interest rate indicator) 0.531 1.255 1.018 0.532 1.259 1.033 0.53 1.23 1.025
Number of months post-adjustment (ARMs) [REF: <0]0-3 0.958 0.796** 1.179 0.958 0.796** 1.181 0.962 0.803** 1.1844-6 0.981 0.445*** 1.22 0.977 0.446*** 1.222 0.978 0.449*** 1.227>6 1.05 0.166*** 0.951 1.038 0.167*** 0.954 1.042 0.168*** 0.96
Debt-to-income at origination [REF: <45%]45-50% 0.962 1.110*** 1.192** 0.958 1.110*** 1.188** 0.957 1.114*** 1.189**>50% 0.856*** 1.015 1.068 0.855*** 1.015 1.067 0.857*** 1.016 1.066
Odds Ratio1 Odds Ratio1 Odds Ratio1Baseline Model

(missing DTI indicator) 1.171*** 0.988 1.508*** 1.174*** 0.988 1.515*** 1.176*** 0.987 1.512***Investor type [REF: Private Investor]
GSE 1.011 1.453*** 0.972 1.015 1.455*** 0.969 1.015 1.448*** 0.968Held in Portfolio 0.945 1.208*** 1.332*** 0.947 1.212*** 1.330*** 0.945 1.214*** 1.331***(missing investor type indicator) 1.11 1.089 6.642*** 1.124 1.088 6.665*** 1.116 1.094 6.670***
Current LTV [REF: <80%]80-100% 0.682*** 1.227*** 1.277** 0.674*** 1.226*** 1.276** 0.665*** 1.131*** 1.223**100-120% 0.615*** 1.468*** 1.419*** 0.607*** 1.469*** 1.421*** 0.594*** 1.240*** 1.343***>120% 0.594*** 1.953*** 1.748*** 0.587*** 1.959*** 1.748*** 0.570*** 1.488*** 1.624***(missing LTV indicator) 13.517*** 19.397*** 18.886*** 13.384*** 19.396*** 18.707*** 13.342*** 18.054*** 18.118***
Has a Junior Lien on the Property 0.887*** 0.942** 0.998log (Current Unpaid Balance) 0.509*** 1.111*** 0.701*** 0.504*** 1.106** 0.702*** 0.505*** 1.153*** 0.708***Loan Age 1.011** 1.007* 0.978*** 1.010** 1.006* 0.978*** 1.010** 1.008** 0.979***Default Time 0.880*** 0.972*** 1.136*** 0.880*** 0.972*** 1.137*** 0.880*** 0.972*** 1.137***Percentage of outstanding loans in neighborhood serviced by 1.143 1.905* 0.985 1.146 1.855* 0.968 1.113 1.708 0.942 the servicerBorrower and Property CharacteristicsOwner Occupier 0.942 1.288*** 0.718*** 0.925 1.288*** 0.715*** 0.927 1.301*** 0.716***Property Type [REF: Single Fam & Condo]
2-4 Family 0.968 0.887*** 1.037 0.963 0.886*** 1.036 0.954 0.869*** 1.0325+ Family 0.882 0.831* 1.127 0.898 0.830* 1.136 0.907 0.827* 1.134
Current FICO Score [REF: <560]560-620 1.003 0.879*** 1.318*** 1 0.879*** 1.318*** 0.999 0.883*** 1.318***620-650 1.039 0.790*** 1.555*** 1.031 0.791*** 1.551*** 1.03 0.797*** 1.553***650-680 1.306*** 0.655*** 1.295* 1.296*** 0.653*** 1.303* 1.299*** 0.659*** 1.304*680-720 1.284*** 0.688*** 1.304 1.272*** 0.688*** 1.3 1.272*** 0.694*** 1.298>720 1.298*** 0.602*** 1.35 1.295*** 0.601*** 1.348 1.299*** 0.610*** 1.344(missing FICO score) 1.371*** 0.553*** 3.516*** 1.369*** 0.552*** 3.548*** 1.367*** 0.556*** 3.558***
FICO Score decline between origination and delinquency 0.998*** 0.997*** 1.003*** 0.998*** 0.997*** 1.002*** 0.998*** 0.997*** 1.002***(missing FICO Score decline indicator) 0.628*** 0.667*** 1.064 0.625*** 0.666*** 1.055 0.626*** 0.668*** 1.054
Borrower Race/Ethnicity [REF: Non-Hispanic White]Non-Hispanic Black 0.909* 0.98 0.92Non-Hispanic Asian 0.895* 0.985 0.911Non-Hispanic Other 0.797 0.885 1.346Hispanic 0.771*** 0.94 1.005(missing race/ethnicity) 0.942 0.976 1.016
Received Foreclosure Counseling 0.534*** 1.299*** 0.430***
Neighborhood CharacteristicsRecent Foreclosure Rate [REF: <1]
1-2% 0.917** 0.971 1.004 0.910** 0.973 1.0032-3% 0.841*** 0.921** 0.99 0.837*** 0.922** 0.99>3% 0.769*** 0.865*** 0.99 0.763*** 0.866*** 0.991
Positive HP Appreciation 1.077 0.917 1.026 1.08 0.917 1.027Positive HP Appreciation * HP Appreciation 0.571** 1.573 1.483 0.556** 1.575* 1.505Negative HP Appreciation * HP Appreciation 0.999 3.132*** 1.221 0.989 3.139*** 1.226

Neighborhood Racial Composition [REF: 0-20%]% Non-Hispanic Black 20-40% 0.99 1.015 0.915 0.985 1.017 0.906 0.956 1.001 0.905
40-60% 0.94 1.196*** 0.789** 0.928 1.200*** 0.764** 0.866** 1.143*** 0.759**60-80% 0.984 1.115** 0.731*** 0.962 1.114** 0.705*** 0.877** 1.039 0.699***>80% 0.951 1.165*** 0.651*** 0.935 1.165*** 0.627*** 0.854*** 1.105** 0.623***
% Hispanic 20-40% 0.958 1.02 0.790*** 0.939 1.013 0.792*** 0.928 0.995 0.789***>40% 1.081 1.056 0.785** 1.023 1.038 0.785** 0.975 1.01 0.783**
% Non-Hispanic Asian 20-40% 0.956 1.005 1.084 0.949 1.002 1.077 0.958 1.012 1.08>40% 1.111 0.942 1.249 1.096 0.938 1.234 1.124 0.993 1.245
% Foreign Born [REF: 0-20%]20-40% 0.935 1.018 1.077 0.934 1.018 1.082 0.938 1.031 1.08540-60% 0.987 1.096** 0.887 0.982 1.099** 0.884 1.001 1.127*** 0.887>60% 0.958 1.032 0.86 0.95 1.029 0.857 0.965 1.05 0.857
% >65 Years Old [REF: 0-10%]10-20% 0.984 0.997 1.051 0.983 0.997 1.047 0.996 1.003 1.048>20% 1.036 0.928 1 1.03 0.93 1.006 1.056 0.924 1.004
% of households with Children [REF: 0-25%]25-50% 0.826*** 0.897** 1.309** 0.821*** 0.896** 1.317** 0.818*** 0.871*** 1.310**>=50% 0.738*** 0.925 1.452** 0.733*** 0.925 1.454** 0.711*** 0.876* 1.439**
Median Household Income (1999) [REF: 0-$20,000]$20,000-40,000 1.251*** 1.028 1.014 1.250*** 1.03 1.016 1.255*** 1.044 1.018$40,000-60,000 1.365*** 1.051 0.888 1.359*** 1.052 0.891 1.385*** 1.073 0.893>$60,000 1.408*** 1.143 0.818 1.402*** 1.145 0.82 1.463*** 1.182* 0.823
% of adults with a Bachelor's degree or higher [REF: 0-20%]20-40% 1.124** 0.969 0.904 1.128** 0.97 0.902 1.156*** 0.99 0.90540-60% 1.221** 0.861* 1.155 1.232** 0.864* 1.156 1.276*** 0.884 1.162>60% 1.369** 0.589*** 0.82 1.373** 0.589*** 0.828 1.367** 0.600*** 0.833
Homeownership Rate [REF: 0-20%]20-40% 0.958 0.95 0.976 0.95 0.95 0.973 0.952 0.938 0.96940-60% 0.877** 1.081 1.03 0.868** 1.078 1.025 0.864** 1.074 1.023>60% 0.887 1.141** 0.949 0.881* 1.138** 0.944 0.881* 1.142** 0.942
Unemployment Rate 3.16 0.309* 1.223 3.306 0.302* 1.276 2.548 0.129*** 1.132Origination year [REF: 2004]
2005 1.147* 1.213*** 1.396** 1.136 1.210*** 1.378** 1.159* 1.150** 1.340*2006 1.078 0.978 1.031 1.06 0.977 1.01 1.078 0.911 0.9792007 1.136 1.075 0.691 1.121 1.076 0.676 1.135 1.014 0.6612008 1.169 1.027 0.823 1.164 1.032 0.805 1.164 1.03 0.803
Borough [REF: Manhattan]Bronx 0.681*** 1.285** 0.599** 0.667*** 1.282** 0.596** 0.687*** 1.367*** 0.598**Brooklyn 0.799** 1.098 0.483*** 0.796** 1.095 0.479*** 0.787** 1.058 0.470***Queens 0.692*** 1.17 1.251 0.677*** 1.162 1.25 0.658*** 1.094 1.219
Quarter of Loan Performance [REF: 2008 - 1]2008 - 2 1.404*** 1.660*** 1.374** 1.406*** 1.662*** 1.374** 1.402*** 1.628*** 1.366**2008 - 3 1.827*** 1.442*** 1.446** 1.829*** 1.445*** 1.445** 1.829*** 1.379*** 1.421**2008 - 4 1.983*** 1.332*** 1.115 1.987*** 1.339*** 1.113 2.049*** 1.263** 1.084
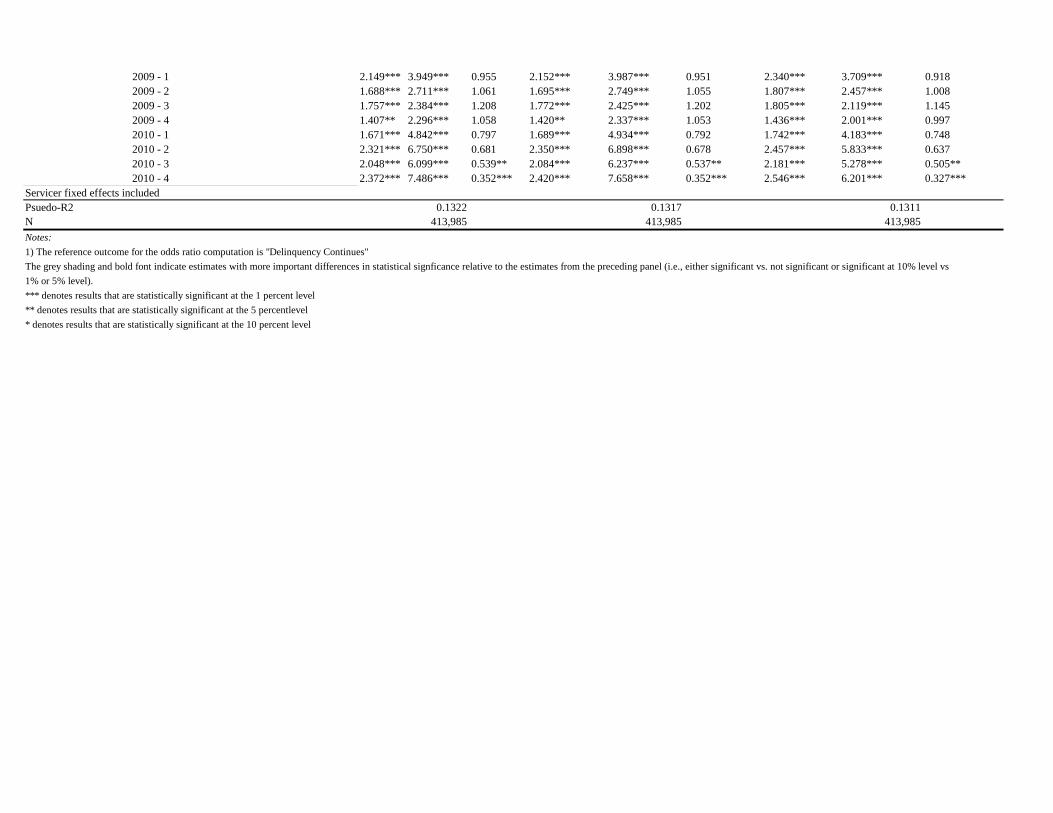
2009 - 1 2.149*** 3.949*** 0.955 2.152*** 3.987*** 0.951 2.340*** 3.709*** 0.9182009 - 2 1.688*** 2.711*** 1.061 1.695*** 2.749*** 1.055 1.807*** 2.457*** 1.0082009 - 3 1.757*** 2.384*** 1.208 1.772*** 2.425*** 1.202 1.805*** 2.119*** 1.1452009 - 4 1.407** 2.296*** 1.058 1.420** 2.337*** 1.053 1.436*** 2.001*** 0.9972010 - 1 1.671*** 4.842*** 0.797 1.689*** 4.934*** 0.792 1.742*** 4.183*** 0.7482010 - 2 2.321*** 6.750*** 0.681 2.350*** 6.898*** 0.678 2.457*** 5.833*** 0.6372010 - 3 2.048*** 6.099*** 0.539** 2.084*** 6.237*** 0.537** 2.181*** 5.278*** 0.505**2010 - 4 2.372*** 7.486*** 0.352*** 2.420*** 7.658*** 0.352*** 2.546*** 6.201*** 0.327***
Servicer fixed effects includedPsuedo-R2 0.1322 0.1317 0.1311N 413,985 413,985 413,985Notes:1) The reference outcome for the odds ratio computation is "Delinquency Continues"The grey shading and bold font indicate estimates with more important differences in statistical signficance relative to the estimates from the preceding panel (i.e., either significant vs. not significant or significant at 10% level vs1% or 5% level).*** denotes results that are statistically significant at the 1 percent level** denotes results that are statistically significant at the 5 percentlevel* denotes results that are statistically significant at the 10 percent level
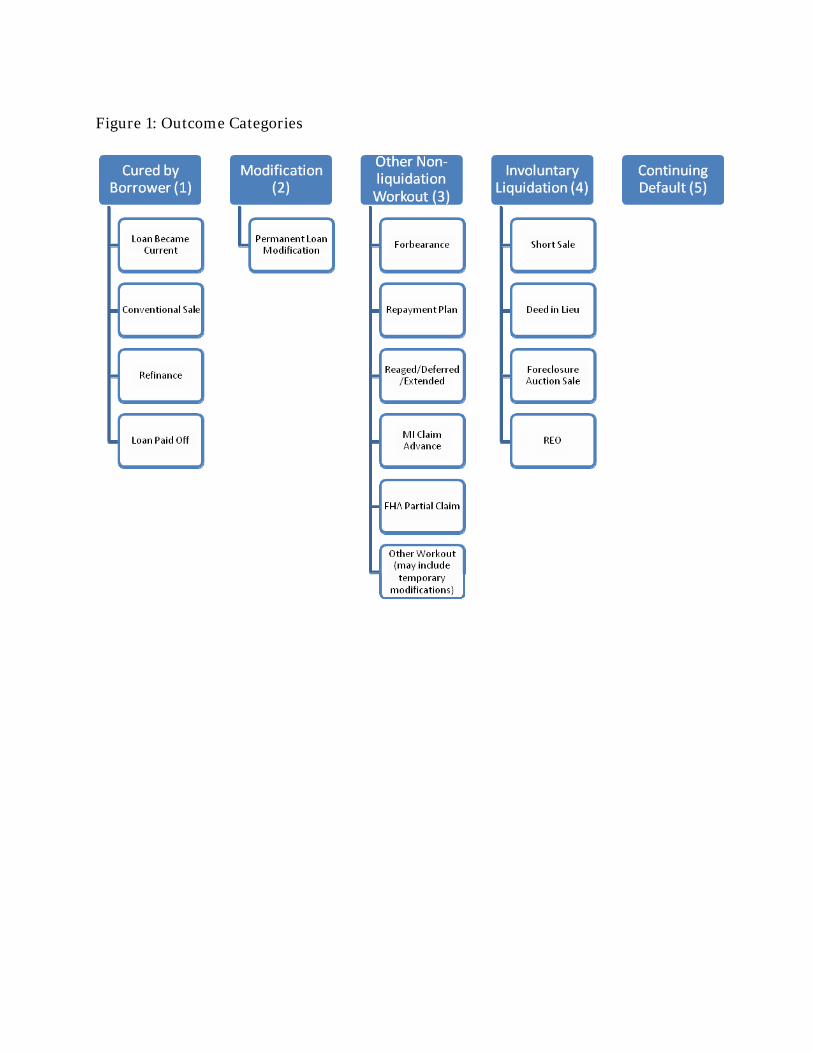
Figure 1: Outcome Categories

!
!
!! !
!!!
!
!
!!!!!!
!!!!!
!
!
!!!
!!
!
!
!
!!!
!!
!!
!!!!
!
!!
!
!
!!
!
! !
!
!!!
!!
!!
!!!!
!!
!
!
!
!!
!!!!
!
!
!!
!!
!!
!
!!
!
!!!
!
! !!
!!!!
!
! !!!
!
!
!
!!
!
!
!
!
!
!!
!
!
!!
!!!!
!
!!!
!!!!
!!!
!!
!
!!
!
!
!
!
!!
!!!
!
!!
!!
!!!!
!!
!!
!!
!
!!
!!!
!
!!
!!
!
!!
!!!
!
!!!!
!
!!!!
!
!!!!!!
!!!
!
!!!!!!!!! !
!
!
!!!!
!!!!
!
!
!
!!!!
!!!
!
!!!
!
!!!
!
!! !
!
!
!
!!!!
!!
!
!
!!!
!
!!
!!!!
!
!
!
!!!
! !!!
!!
!
!
!!
!!!
!
!
!!!
!!!
!!
!
!
!!!
!!!
!
!!
!! !!
!!!
!!
!!
!
!
! !
!!
!!!
!!
!!
!
!!
!
!
!
!!
!
!!!!
!!
!
!
!!!!
!!
!!! !
!
!
!
!
!!!
!
!
!!!
!
!!!
!! !!
!
!! !!
!
!!!!
! !
!
!!!!
!
!!
!
!
!
!!
!
!
!
!!!!!
!
!!!
!!!!
!
!!
!
!!
!
!
!
!!!
!!
!
!!
!
!
!
!
!!
!
!
!!!
!!!!
!
!
!
!
!
!
!!
!!
!!
!!
!!
!!!!
!!!!!
!
!
!
!
!!
!
!!
!
!!
!!
!!
!!
!
!!
!
!!
!
!!
!!
!!
!!!!!
!
!!
!
!
!!
!
!
!!!
!!
!!
!
!
!!!
!
!!
!!
!!!!!!
!
!!!
! !!!!!
!!
!!
!
!
!!!!!!!!!!
!!
!
!
!!
!!!
!
!!!
! !
!!!
!!
! !!
!
!!!! !
!!
!!!!!!
!
!
!! !
!!!
!!
!!
!
!! !!
!!!!
!
!!!!!
!!!
!!
!!
!!!!!!!!!
!!!
!!!!
!!!!!!! !
!!
!!
!!!! !
!!!!
!! !
!!!!!!!
!!
!!
! !!!!! !
!!
!!!!!
!
! !!!!!!!
!! !
!
!
!!
!
!! !
!!
!
!
!
!
!!!!
!
!!
!!
!!
!! !!!!!
!
!
!!
!! !!
!
!!!
!!!!!! !
!! !!!
!! ! !!
!! ! !!!!
! !!
!!!
!!!! !!!
! !!
! ! !!!
!
!
!!
!!!!
!
!!!
!!!!!!!
!! !!
!!!!
!!!
!!!!!
!!!!!
!!!!
! !!!!
!
!!!!!!
!!
!!
!!! ! !!
!!!
!
!!!
!
!! !
!!
!
!!
!!
!!!
!!
!!
!!!!
!
!
!
!!
!
!
!
!!
!!
!!!!! !
!!!!!!!
!
! !!!!
!
!!!
!
! !
!
!
!!!!!! !
!!! !
!
!
!! !!
! !
!
!!
!!
!!!
!!
!!!
!!
!
! !
!
!
!!!!
!!
!!
!!!!
!
!!! !
!!
!
!! !
!!!!
!!!
! !!!!!!!!!!
!! !!
! !
!!!
!!
!
!!!
! ! !!!!
!! !
! !!! !!!
!!!
!!!
!
!!!!!
!
!
!
!!!
!!
!! !
!
!
! !!
!! !!!
!
!!!!!!!!
!!!!
!!!!!
!!!!!
!!
!
!!
!!!
!!
!!!!
!!!!! !!
!
!!!
!! !!!
!! !!!
!! !
!!!!!! !
! !!!!!
!!!!!!
! !
!!!!!!!!!!! !!
!!!!!!
!!!!!
!!!!!!!!!!!
!!!!! !
!
!
!
!!!!!
!!
!!!
!!
!!
!! !!
!!!
!!!!
!!
!!!
!!
!!
!
!
!!!! !!
!!! !!
!!
!
!!!
!!!
!!
!!!!
!!
!!
!
! !! !!
!!
!!!!
!!!!
!
!!
!
!!
!!
! !!! !!!!
!!!
!!!!!!!!!!!
!
!!!!!
!!
! !
!
!! !!!
!
!!!!! !!
!!
!!!! !! !!!!!!!
!!
!!!
! !!! !!!!
!!!!!!!!!!!
! !!!! !!!
!!!
!!!!
!!!! !
!!!
!!
!!
!!!!!! !!!
!!
!
!!!!!! !
!
!
!!!!!!
!!!! !!
!!!!! !
!
!!
!
!!
! !
!
!
!
!
!!
!
!!!!!!
!
!!!
!!!! !
!!!
!!
!
!
!!
!!!
!!!!
!
!!!
!
!!!
!!!!!!!
!
!! !!
! !
!!!!
!! !!!
!!
!
!
!!!!!
!
!!
!
!!!!!!
!! ! !!
!!!!!!
!!
!!
!!!!! !
!!!!!
!!
!!
!!
!
!
!!!!
!
!! !
!!!
!!!
!
!!
!!
!!!!!
!
!!
!!
!!!
!!
!!
!!!!!!!!!!
!
!!!
!!
!!!
!
!
!!
!!
!
!!
!
! ! !!!
!!
!!!!
! !!!
!
!!!
!
!!! !
!
! !
!
! !
!
! !
!!!!
!!
!
!!
!
!!
!!!
!
!!
!
!
!!!!!!
!!
! !
!!
!
!!
!
!!
!!!!
!!! !
!
!
!!!
!!
!
!
!
!
!!!
!
!
!!
!!
!!!!
!
!!
!!!!
!
!! !!
!!
!
!!
!!!
!!!
!!!
!
!
!
!!!!
!!
!
!!!!
!!
!
!!
!!
!
!
!
!
!
!
!!!!!
!
!
!
!
!
!
!!
!
!!
!!
!
!
!
!!
!
!!
!!!
!!!
!
!
!
!
!!
!!
!!
!
!
!!
!!
!
!!!!!
!!
!!!
!!
!!!!!
!
!
!
!!!
!
!
!!!!
!!!!
!
!!
!!
!
!
!
!!
!
!!
!
!!
!
!
!!
!
!
!!!
!
!
!!
!!!
!!!!
!!!
!!!!
!!!
!!
!!
!
!
!!!
!
!
!!!!
!
!
!!
!!
!
!
!
!
!
!
!!!!!
!
!
!!!!
!
!!!
!!!
!
!
!!!!!!
!!!
!!! !
!
!
!!
!
! !
!!
!
!!!
!
!
!
!
!!
!!!
!
!
!
!
!!
!!
!!!
!!
!!! !
!!! !!
!!!
!!!!
!!
!
!! ! !!!! !
! !!
!
!
!!! !!!!
!
!
! ! !!! ! !!! !!!!!!!
! !!!!! !
!! !! ! !!! !!!!!! !!!!!! ! !!
!!! !!! !!!!
!!!
!!!!!! !! ! !!!!!!!!!!! !
!! ! !!!!!!
!! !! !! !!!
!!!!!! ! !!!! !!!!
!!! !! !! !!!!
! ! !!!!!! !!! ! !
!!!!!!!! !!!! ! ! !
!! !!!!! !!!!!!! !! !! !
!!! !
!!
! ! !
! !!
! !! ! !!!
!! !!
! !
! !!! !! !! !!!!!!!!!!!! !! ! !!!! !! !! !!! ! !!! !
!!!!
!!!
! !!!!!!!!!!! !!! !! !!!!!
! !!!!!!!! ! !
! ! !!!
!! !!!
!!!!!! !!!!! ! !! !! !!
!!! ! !! !!!! ! ! !! ! !!! !! ! ! !!! !!! !!!!!!! !!!!!!!
!
! !!!! !!!!!!!!! !!!!! !!!!!!
!!!!!!! !!!!!!!!!
! ! !!!!! ! !! !!
!!!!!!!
!!!
!
! !!!!!!!! !!!!!!! !! !!!
!!!!! !!!
!!!!!!!!!!!
!!
!!!! !!!!
! !!!!
!! ! !!!!!!!
!!!!!!
!!!! !!!!
!!!!!!!
!!!!!
!!!!! !!!!!!
!! !! ! !
! !! !!!!!!! !!!
!!! !!!!!!!!! !!
!!!!
! !!! !! !!!!! !!!!!!! !
!!!!!!!!!!!!!
!!!!! !!
!!!!
!
! !!!!!!!!
! ! ! !!!
!!!!!!!!!!!!
!!!! !!!!!!
!!! !! !!
!!!!!!!! !!!
!!!!!! !!!!!!!!!!
!!!! !!
!! !!!!!
!!!!!!!!
!!! !!
!!! ! !!! !!!!
!!! !!!!!!!
!!!!!!!! !!!!! !!!
!!!!! !
!
!!!
!!! !!!!!!!
!!!!!!!!!!!
!!!!!!!!!!!!!!
!!!!!
!!!!!!!!!! !
!!! ! !! !!! !!
!!!
!! !
! !!!!
!!! !!!!!! ! !!!!
!!!!!!!!
! !!!! !!!!!!!!!
!!!!!!!! !
!!! ! !!!! !!
! !!
!!!
!!!!!!!!!!
! !!!
!! !!!!!!!
! !!!!!
!!!!
! ! !!! !!!!!!
!! !!
!! ! !
!!! ! !!!!!!!!!
!!!!!
!
!
!!!!
!!!!!
! !!
!!
!!
! !!!!!! ! !!!!!!!! !!!!
!!!!!!
!!!!!!!!!!! !!!
!
!!!!
!! !!! !!
!!!! !!!!!
!
! !!!!!!!!!!!!!!!
!
!! ! !!!
!
!!! !!!
!!!!!!!! !
!!!!!
!! !! !
! !!!!!!!!!!!!!!
!!!!
!!!!!
!!! !
! !!!!!!!!!
! !!!!!!!!
!!!!!
!!!!!!!!! !
!!!!!
!!!
! !!!!!!! !!
!!
!!!!!
! !! !!!!!
!!!!!!! !!!!!
!!! ! !! !
!!!!! !!! !
!!!! !!!!!
!!
!!! !!!!!! !!!
!!
! !!! ! !!! !
!!!!!!!!
!!
!!!!! !!!
!!
!!!!!!
!!!!
!!!!!!
! !!
!!!
!!
!!! ! !! !!!!! !! !!! !
!!!!
!!
!! !!!
!!!
!! !!
!
!!!
!!
!!!!!!
!
!!!!!
!!!!!!!!
!!! !
!!!!!!
! !!! !!!
! ! !!
! !!
!!!
!! !! ! !!
!
!!
!!!!!
!!!!
!!!
! ! !!!
!!!!! !
!!
!!!
!
!!
!!
!
!!!
!!
!!!
!! !
!
!!! !!!!!!
!!!!!!
!!!
!!
!
!!!
!! !!
!!!
!
!!!!
!!
!!!!
!
!!
!!
!!
!
!!
!!
!
!!!
!
!!
!
!!
!!!!
!!
! !
!!
!!
! !!!!
!
!
!
!
!
!!!
!
!!!!
!!!
!
!
!
!!
!!!!
!!!
!
!
!!
!!
!
!
!! !
!
!!
!!!
!
!!
!!!
!!
! !
!
!!
!!!!
!
!!!!!!! !
!!!
!
!! !
! !!!
!
!!!!!
!
!!
!
!
!!
!
!
!!!
!!
!
!
!
!
!
!
!!
!
!!
!!
!!!!
!
!
!!
!
!!!!!
!!!!
!
!!
!!
!
!
!
!
!
!!!
!!!!!
!
!!!!
!!
!
!!
!!!!!
!
!!
!!!
!
!!!
!!!!!!!!!!!!!
!
!
!!!
!
!!!
!!!!!!!!!!!
!
!
!
!
!!!!
!!
!!
!!!!
!!!!!
!!
!!
!!
!!
!
!!!!
!
!
!!
!
!!
!
!
!
!!!
!
!
!
!
!!!!!!!
!!!!!!
!!
!!
!
!
!!!!!!
!!
!!
!!
!!
!
!!
!!!!!!!
!!
!
!
!
!
!
!!!!!
!!!!!!!
!!!!!!!!
!!!!!!
!!!
!!!
!!
!!
!!!!!!
!
!!!!
!!!
!!!!
!!!!!!!!!!!!!!!!!!
!!
!!
!!!!!
!!!!
!!!!
!!
!
!!!!!!!!
!!!!
!!!!!
!!!!!!!!
!!!
!!!!!!!
!!!
!!
!!!!!
!!!
!!!!!!!!!!!
!!!
!
!!!!
!!!!
!!!
!!!
!!
!!
!!!!
!!!!
!!!
!!!!
!!!!
!!!!
!
!!!
!
!!!
!!
!!
!
!!!!!!
!!!!!!!
!!
!
!!!
!
!
!
!!!!!
!!!
!!!
!!!!!!!!!!
!! !!
!!
!!
!
!!
!!!!
! !!
!
!!!!! !!
!!!
!
!! !!!!!!!
!!!!!!!!!
!
!!!!!
!!!!
!
!!!!!!!!! !!
!!!!!!!
!
!!!!
!!!!!
!!!
!
!!!! !!!
!!!!!
!! !!!!!!
!
!
!!!
!!!
!!!!!
!!
!!!!!
!!!!
!
!!!!!!
!
!!
!!!
!!
!
!!!!
!
!!!!!!
!!!!!
!!!!!!!!!
!
!!!
!
!!!!!
!!!!!!
!!!!!!!!!
!!!!!!! !
!!!
!! !!
! !!!!!!! !
!!!!
!!!! !!!!!!!!!!!
!!!!
!
!!
!!!
!!!!
!!!!
!!!! !
! !!
!
! !!!
!!
!!!
!!!!
!!!!
!!!
!!!
! !!!!
!
!!!!
!!!! !!!!!!!!!!!!!!!!!!!!!
!!!!!!!!!
!!
! !!!!
!!! !!!
!!!!!!
!!!!!!
! !!!!!
!!!!!!
!
!!!
!!!!!!
! !!!!!!!!!!!!!!
!!!!!!!
!
! !! !!
!!!!!
!!!!
!!!!!!
!!!!!!!!!!
!!!! !
!!!!!
! !
!!!!
!!!!!!!!!!!!
!!!!!! !!!!
!!!!!!!!!
!!!
!!!!!
!!!!!!!
!!! !!!!!!!!
!!!
!!!!!!
!!!!
!! !
! !!!!!!!
!!!
!! !
!!!!!!!!
!!!
!!
!!!!!!!!!!!! !!!
!!!!!!!!
!
!!!!
!!
!!!!!!!!!!
!!!!!!!!! !!!!
!!!
!!!!!!!!!!
!!!!!!!!!
!! !!!!
!! !!!!
!
!!
!!
!!!!!!
!!!!!
!
!
!!!!
! !!!!!!!!!
!!!!!!!
!!!!!!!!!!!
!
!!!!!
!!!!
!!!!! !
!!!!!
!!!!!!!!!!!!!!!!
!!!!!!
!! !! !
!!!!!!!!!!!!!!!!!!!!!
! !!
!!!!!!!!!!!!!!
!!!!!!
!!
!
!
!!!!!!
!!!!!
!!! !
!!!!!!!!!
!!!!!!!! !!!
!!! !
!!
!!!!!!! !
!
!!!!
!!
!!
!!!!!! !!!
!!!!!!!!
!! !
!!!!!!! !
!!!!!! !!
!!!!!
!!!!!!
!!!!!! !!
!!!
!
!!
!!!!!!!!!!!
!!!!!!!!!
! !! !!!
! !!!!!!!
!!!!!!!!!!!!!!!! !!!!!
!!!!
!!! !!
! !!!!!
!!
!!
!!!!! !!!
!!
!!!
!!!!
!!!!!!!!!!!!! !!
!!!!!!!
!!!!!
!!
! !
!
!!!
!!
!!
!!
!
!!
!!!!!!!!
!!! !!
!
!! !!!!
!
!!
!!!! !
!! ! !!!! !!
!! !!!
!
!
!!! !!!
!!
!!! !!!!!
!!!
!!!!
!!!!
!!!!!!!!
!!!!!!!
!!!!
!!
!!
!!!
! !!!
!
!
!!!!!!!!
!! !!
!!!!
!! !!!!! !! !!
!
!!! !!!
!!!!
!!!!!!!!!!!!! !!
!
!!!!!
!! !
!!!!
!!!
! !
!!!!!
!!!
!!
!!
!!!
!!!
!!
!! !
!!!!!
!
!!!
!!
!!!!
!!!!! !!
!!!! !
!! !
!!!!!
!
!!!!!
!!
!!! !
! !!!!
!!!!
!! !!!
!!
!!!!
!!
!!!!! !
!!!!!
!!!
! !!! !
!!!!
!
!! !!
!!!
!!!!!
!!! ! !
!!!
!!!
!! !!!!
!
!!!!
!!
!
!!!
! !!!!!!
! !! ! ! !!!!!
!!!!!
!! !!! !!!
!!
!! !!
!!
!!!!! !
!!
!!
!!
!!! !
!
!!
!!!!!!!
!!!
!!!!
!!!!!!!! ! !
!!!
!
!!!!!
!! !!!
!!! !!
!!! !
!! !!
!!!!!
!!!
!!
!!! !!
!! ! !
!!!!
!!!
!!
!!!! !!
!!! !
!
!!!!
!!!!!!
!
!!!!
!!!!! !
!!
!!!!!!!!!
!!!!!
!
!!!
!!!
!! ! !!! ! !
!!!!
!!!!
!!!
!!!!
!!
!
!!!!!!!
!!
!!
! !!!!!! !!!!!!!!
!!!!
!
!!!!
!!!!!!!
!!
!!!!
!! !! !
!!
!!!!!!
!!!!! !!!!! !!
!!!!
!!!!!
!
!
!!!!!!!!!!!
!!!!
!
!!!!!
!!! !!! !
! !!!! !!
!! ! !!!!!! !!! !
!!! ! ! !!
!!
!!
!!!
!
!
!
!!
! ! !!!!
! !!!
! !!
! !!!!
!
!!
!!!!!!!! !! !!
!!!
!!!!
!!
!!!!!!!!!
!
!!
!
!!
!
!
!!
!!!
!!!!!!!!!!! !
!!!!!!!!!
!
!!
!
!
!
!
!!
!
!!
! !!!!!
!!!!!!!
!
!
!
!!!!
!
!
!
! !
!!!! !!
!
!!!!
!!!!!
!
!!
!
! !!!
!!!
!
!!!!
!
!! !!!!! !
!
!
!
!
!!!!!
!!
!!
!
!!
!!!
!
!!
!!
!!!
!!
!!
!
!!
!
!! !!
!
!!!! !!!!!!! !!!!
!
!!
!!
!!! !!!!
!
!!!!!
!!
!!!!!!
!!!! !
!!
!!
!!!
!!!!!!
!!
! !!
!
!
!!
!
!!
!!
!!!
!!! !!!
!!
!
!!!
!!
!!!
!!
!!
!!
!!
!!
!
!
!
!!
!
!!!
!
!
!!
!
!!! !!
!
!
!!
!!!
!!
!!
!
!!
!
!!
!!!!!
!
!
!
!!
!
!!
!
!!
!!
!!
!
!
!!
!
!!
!
!
!
!!
!!!
!
!!!!!!
!
!
!!!!!
!!
!!
!
!
!!
!
!!
!!!!!!!
!!!
!!!!
!
!
!
!
!!!
!
!!
!
!
!
!
!
!!!
!!
!
!
!
!!
!
!!!!!!!
!
!
!
!
!!
!!!!!
!!
!
!!
!!!
!
!!
!!
!!
!
!
!!!
!
!!
!
!
!!!
!
!
!
!
!
!
!!
!
!
!
!
! !!
!
!!
!!!
!
!
!!!
!
!
!!!
!!
!
!
!
!!
!!!
!
!!
!!!!!
!
!
!!
!!
!
!
!
!
!
!
!
!
!
!
!
!
!
!
!!
!
!
!!
!
!!!! !
!!!!!! !
!
!!
!
!
!
!
!
!
!
!!
!
!
!
!
!!!!
!!
!
!
!!!
!
!
!
!
!
!
!
!
!
!
!
!
!!
!
!
!
!
!!
!
!!
!!
!
!
!
!
!
!
!
!
!
!
!!
!!! !
!!!!
!
!
!
!!!!
!
!!!
!
!
!!
!! !
!
!!!
!
!
!
!!!
!!
! !!! !! !!!
! !!!!!!
!
!
!!!!
!!!!
!!!
!!
!!!!
!
!
!! !!
! !!!
! !
!!!!
!!
!! !!!
! !!!!!
!
!
!!! !
!
!! !
!!
!
! !!! !!
! !!
!
!!
!!
!!!
!!!!
! !!
!
!!!
! !!
!!!
! !!! !
!
!!
!! !!
!!!
!
! !!!!!
!
! ! !! ! !!
!
!!!!
!!!!
!!
!!
!
!!
!!! !
!!!!!!
!! !! !
!
!!
!!
!!!
! !!
!!!!
!
!!
!
!
!
!!
!
! !
!!
! !!
!
!!
!! !
!!!!!!!
!!
! !!!!!
!! !!!
!! ! !!
!!
!!!!
!!
!!!!
!! !!
!
!
!!
!
!!
!!
!!
!
!!
!
!
!
!!!! !
!!! !!
!!
! !!
!
!
! !!!!!!!!
!!!
! !!!
!
!!
!!
!!!!
!!!!!!
!
!!
! !!
!
!!
!!!! !
!
!!!!!
!! !!!!
!!
!
!
!
!!
! !
!!!
!
!
!!!
!!!! ! ! !! !
!! ! !
! ! !!
!
!
!!
! !!
!
!
!
! !
!!
!!!
!
!
!
!
!
! !!
! !
!!
!!
! !
!
!!!!
!!!! !
!!
!!
!
!!!!!
!
!
!
!!
!!
!! !!
!
!!
!!
!!
!
!
!!
!!
! !!!!! !!
!
!!
!!!
!!!!!
!
!
!!!!
!!!
!
!
!
!
!! !!!!!
!!!
!!
!!!!!!!!!
!!!!!!!
!
!!
!
!!
!!! !
!!!
!!!!
!!! !
!!!!!
! !!
!!
!
!
!!
!! !!!
!
!
!
!!!
!
!!
!
!!
!!!!!! !!!
!!!!!!!
!!!
!!
!
! !!
!!
!!
!!
!!
!!
!!!
! !!!!!! !
!!!!!!!
!!!!!!
!
!
!!!!
!!
!!!!!!!!
!!!
!!
!!
!!!
!
!!!!!
!
!!!
!!
!!
!!!!
!!!!
!!!
!! !!
!!!!
!
!!!
!!
!!
!!!
!!!!
!!
!! !!
!!
! !!!!
!! !
!!
!!!!
!!!
!
!!
!!!!
!!
!
!!
!
!!!!!!!
!
!
!!! !!!!
!
!
!
!!
!!!!
!!!!
!!!!!
!!!!!!!!!!
!! !!!
!!!!!!
!!!!!!!!!!! !
!!!
!
! !!
!!!!!!!
!
!!!
! !!!
!!!!
!!!!
!!
!!
!!
!!
!!!! !!
!!!
!
!
!!!!!!!!
!
! !!
! !!!
!
!!
!!
!!
!!
!!!
!!!!!!!!!
!!!!!!
!!
!!
!!
!!
!!!!!!!!
!!!!!!! !!!
!
!!! !!
!!!!!
!! !!
!!!!!!!!!!!!! !!!!
! !!!
!!!!!!
!!!!! !
!!!
!!
!!!!!!!!!!!!
!
!!!
!!!!
!!!!!!
!
!
! !!!!!!!!!
!!!!!!! !
!!!
!
!
!!!! !
!!!!!!!!!!!!
!!!!!!!
!!! !!
!
!!!!!!!!!! !
!!!!
!!
!!
!!!
!
!!
!!
!!!!!!!!
!!!!!!
!!
!!!
!!!! !
!! !
! !
!
!!!!!!
!!!!!!
!!
!! !!!
!!
!!!!
!!!!!!!!
!
!!
!
!
!!!!! !
!!!!!!!!!! ! !
!
!!!!
!!!!!
!!!!!
!
!!!!
!!!!!!!!!
!!!!!!!!!!!!!
!!!
!
!!
!!!!!!
!!!!!!!!!!
!!!
!!
!!!!!!!!!!!
!!!!!!!!!!
!
!
!
!!!!
!!!!!!!!!!!!!!
!!
!!!!!!!!!!
!!!!!!!! !!
!!!!
!
!!!!!!!
!!!!
!!!!!!!!!!!!!!!!!!!! !
!!!!!!
!
!
! !!!!
!!!!
!!!
!!! !
!!!!!!!
!!!
!!!!!!!!!!!!
!!! !
! !!
!!!!
!!! !!
! !
!!
!!!!!!
! !
!
!!!
!
!!!
! !!!!!!
!
!!!!!!
!
!!!!
!!
!!
!
!!
!!
!
!!
!!
! !
!!!!!
!!!!!
! !!!
!
!!
!!
!!!!!!
!!!!
!!!
! !! !
!
!!!
! !
!!
!
!
!!
!!!!!
!!
!!
!
!!!
!!!!
!!!
!!!
!!
! !
!! !
! !!! !
!!!!
!!
!
!
!!!
!
!
!!
!!!!!!!!
!
!
!
!
!
!!!
!!!
!
!!
!!!!
!!!!!!
!
!
!!!!!
!!!!!
!!!!!!
!!!!!!!!!
!!!
!
!!
! !
!!!
!!!
!
!!!!!
!!
! !
!
!!!!!!
!!!
! !
! !
!
! !!!
!!
!!
!!!!
!!!!
!!!
!!
!
!
!!
!
!!
!
!
!!
!
!
!
!
!!!
!
!
!
!
!
!
!
!
!!!!!!
!
!
!
!
!
!
!
!
!
!!!
!
!!!
!! !!!!!
!
!
!
!!
!
!
!!
!
!!!!
!
!
!!!!!!!!!!!!!
!
!!
!!
!!!!!
!!!!!!
!!!!
!!!
!!
!!
!!!!!!!!
!!
!!!
!!
!!!!!!
!!!
!! !
!
!
!
!
!!
!!
!
!
!
!
!!!
!
!! !
!!!
!!
!
!!
!!!!
!!
!
!
!!!!!
!
!!!
!
! !! !!
!! !!!!!
!
!
!
!
!!!! !
!
!!
!!
!
!!
!!
!
!
!
!!
!
!!
!!
!!!!
!!
!
!!
!
!!
!
!!!!
!!!
!!
!
!
!
!
!
!!!!
!
!!
!!
!
!!
!! !!
!!
!!
!
!!
!
!!!!!
!
!!
!
!!
!!! !
!
!!!
!!
!
!
!!
!
!
!
!!
!
!!
! !
!
!
!!
!
!!
!
!!!!
!
!
!
!
!
!
!
!!!!
!
!
!
!
!
!!
!
!
!!
!!!
!
!
!!
!!!
!
!
!!!!
!!
!
!
!
!
!!
!!
!!!
!
!!
!
!!!!
!!
!!
!
!
!
!
!!!
!!
!
!!!
!!!!! !
!!
!
!!!!
!!!
!!!!!!!!!
!!
! !
!!!!!!!! !!!!
!!
!! !!!
!!!
!
!! !
!!!!!!
!!!!!!!
!
!!!!!!!
!!!!
!!
!! !!!!!!
!!
!! !!!
!!!! !
!!!!!!
!
!!
!!!
!!!!
!!! !!
!!!!!!! !
!!!!
!!
!!!!!!!!!
!!!! !!!
!
! !
!!
! ! !!!
!
!!!
!
!
!!!!!!!!!!
!
!!!
!
!!!!!! !
!
!!!!
!! !!!!
!! !!
!!!
!!
!!!
!
!!!!!!! !
!!!!
!!!
!!!!
!!!!!
!!!
!!
!
!!
!!
!
!
!!!!!!
!!!!
!!!
!!! !
!!!!!
!!
!! !!!!!!!!
!!!!
!
!!!!!!!!!
!!!!!!
!!!!!!!
!!! !
!
!
!!!
!!!!! !!!
!! !
!!!! !
!!!!!!
!!! !!! !!
!!! !!
!!
!!!!!
!!!!!
!
!
!!!!!
!!! !
! !!
!!!
!!
!
!!!
!!!!
!
!! !
!
!!!!!
!!
!!
!!!! !
!!
!
! !!!!!!!!!!
!
!!
!
!
!!!!!
!!! !
!
!
!!!
!
!!
!!
!!!
!!
!!!!!
!!!
!
!
!!!
!!!
!!!!!!!!!
!
!!!!!
!!!
!
!
!
!!!!
!!! !!!!!! !
!!
!!!!!!!
!!!! !
!!!!
!!!!!!! !!!! !
! !!!
!!!!
!!!!!
!!
!
!!!!!!!!!
! !
!
!!!!!!!!!!!!! !!
!!! !
!!!!!!!!!!!!
!!!!
!!!!! !!!!!!!!!!!!!!!!
!
!!!
!!!!
!!!!!!!!! !!!!
!!!!!!!! !
!! !
!!!!!
!! !!!!!!!
!
!!!!!!
!!
! !!!
!
!
! !! !
!!! !!
!!!
!!!!!!!
!
!!!!! !!!!!!
!
!!!!!!!!!
!!!!!
!!!!!! !
!
!!
!
!!!!!
!!!!!!
!!!!! !! !
!! !!! !!
!!!
!!!! !!
!!
!
!
!!!!!
!
!
!!
!
!!
!!!
!
!!!!!!
! !!!
!
!!!!
!!!
!!
!! !
!!
!!!! !!
!!!!!!!!
!
!
!
!!!
!!!! !
!!!!
! !!!!!!!!
!!!!
!
!
!!
!
!!!
!!
!
!! !
! !!
!
!! !!!!
!!!!
!!!!
!! !!!!!!
!!!! !!!!
!!!!
!
!!
!
!!!! !!
! !
!
!
!!!
!
!
!
!!
!
!
!!
! !!!!!
!!!
!!!
!!
! !!
!!!
!
!
!
! !!
!
!!
!
!
!!
!
!
! !
!
!!
!
!
!
!
!
!!!
!!
!!
!
!
! !
!!
!!
!! !
!
!
!
!!!!
!
!!!!!!!
!
!!
!!
!
!!!
!!
! !!!!
!!
!!!
!!! !!!!!
!!! !!!!
!!!!
!!
!!!
!!
!
!
!!!
!
!
!!
!
!
!
!
!
! !
!
!
!! !!
!
!!
!
!
!!
!!
!!!
!!
!!
!!
!!!
!
!
!
!
!
!
!
!
! !!
!
!!
!! !
!
!!!
!!!
!!
!
!!
!!
!!
!!
!
!
!
!
!!
!!!
!!
!
!!!!
!!!!
!
!!
!
!!
!
!
!
!
!!
!
!
!
! !
!
!
!
!
!!!
!!
!!
!!!
!!!!!!!
!!!
!! !
!! !!!
!!
!
! !
!
!!
!!!
!!!
!! !
!
!!
!
!
!
!
!
!
!
!
!!
!!!!
!
!!
!!!!!
!!!
!!
!!!!!
!!!!!! !!
!!!!
!!
!
!!
!!
!!!!!
!
!
!!!
!! !
!!
!!!
!
!!!
!
!
!!!
!
!! !
!
!!! ! !!
!!!
!
!!!!!
!
!
!!
! !!
! ! !
!!!!!!
!!!
!
! !!
! ! !!!
!!
!
!! !
!!
!!!!
! !
! !!!
!! !!
! !!
!!!
!!
!!!!
!
!
!!
!
!! !
!
!!
!
!!!
! !!
!!
!!!!
!!
!!!! !
!!!!!!!
!!!!!
!
!
!!!
!!!
!!
!!
!!!!!!
!
!!!
!!!
!! !
!!!!
!! !!
! !
!
!!
!! !!!
!!
!! !!!! !!! !
! !!
!
! !!
! !!
!
! !
!
!
!!!
!!
!
!
!!
!
!
!
!!
!
!
!
!
!
!!!
!
!
!
!!!!
!
!
!
!
!
!
!!
!
!
!
!
!
!
!!
!
!
!
!
!
!
! !!
!
!!
!
!!
!!
!
!
!
!!
!
!
!
! !! !
!
!!!!
!
!
!!!
!!!
! !!
!!
!!
!! !
!
! ! !
!
!! !! !
!!!!
!
!!
!!
!
!!!
!
!!
!
!
!! !
!
!!
!!
!! !
!
!! !!
!
!! !!!! !
!
!!! !
!
!
!
!
!!
!
!!
!
!
!!
!
!! !
!
!
!!!
! !
!!
!!
!!
!
!
!
!!!!
!!
!
!
!
!
!!!
!
!
!!
!
!!
!!
! !
!!!!
!!
!!
!
!!
!
!!
!!
!
!!
!
!!
!
!! !
!!
!
!
!
!!
!
!! !
!!
!!
!
! !
! ! !
!!
!!
!!
!
!
!
!
!
!!!!
!!
!!!!!!
!!
!!
!
!
!!
!
!!
!!!
!!!
!!
!
!
!
!!
!
!!
!! ! !
!!
!!!!!!
!
!!
!!!!
!!! !
!!!!!!
!
!!
!!
!!!! !!
!!!
!!!
!
!
!!!!
!!!!!
!!
!
!
!!!
! !
!!
!
!! !
!
!
!!
!!!!!
!
!
!
!! !
!
!!
!
!!
!!!
!!
!
!
! !
!
!
!
!!
!!
!!
!!
!
!
!
!
!
!
!
!
!!
!
!!
!!
!
!
!!!
!!
!!
!!
!
!
!!!
!
!
!
!
!
!
!!
!!
!
!
!
!
!
!!
!!
!
!! !!
!
!
!
!!! !
!
!!!
!
!
!! !
!!
! !
!
!!
!!
!
!
! !!
!!!!
!
!!!!!!
!
!
! !!!!!!!
!! !
! !!
!
!
!
!
!!!
!
!
!!
!!
!
!!
!
!
!!
!
!!!!
!
!! !
!
!
!
!
!
!
!
!!
! !
!
! !
!
!!!
!! !
!
! !!
!!!
!!
!!
!
!
! !
!!
!!!
!!!
!
!
!! !
! !!!
!
!!
!!
!
!
! !
!!
!
!!
!! !!! !
!!
!!!
!
!
!
!
!!
!
!!!!!!!
!!!!!
!!!!
!!!
! !!!!
!!
!
!!
!!!!!
!
!!!
!!! !!!!!
!!
!!!
!!!!!!!!!!!!
!!!!!!
!!
!!!
!!!!!!!!!!!!!!!!
!!!
!!
!
!!
!!!!!
!!
!!!!!
!!!!
!
!
!!!!!!!!
!!!!!! !!!!
!!
!!!!
!!
!!!!!
!
!!!
!! !!! !!
!!!
!
!!
!!
!!!!!!
!!!!!!!
!
!!!!!!!!
!!!!
!!
!!!!!!
!! !!!!!!
!!!!!!
!!!!!!
!!!!!!
!!!!!!!
!!!! !!!!
!!!!!!!
!
!!!!!!!!!!
!!!!!
!!
! !!!!!!!!!
!
!!
!
!!
!!!
! !!!!!!!!!!
!!!!!!!!!!
!!!!!
!!!!
!!
!!
!
!!!!
!!!
!!
!!!!!!
!! !!!
!
!!!!!!!!
!!
!!!
!!!!!!!!!
!!!!
!!
!!!
! !!!!
!!!!
!!!!!! !!!!!!!
!!!!
!!!!!!!!!
!!
!!
!
! !!
!!
! !!
!!
!
!!!!!!!
!!
!!
! !!!!!!
!!!
!!!! !!
!!
!!!!!
!
!!!
!
!!!!
!
!!
! !
!!!
!! !!!
!
!
!
!!
!
!
!!
!!!!
!!!
!
!! !!!!! !! !!!!!!!!!!!
!
! !!!
!
!!!!
!!
!!
!!
!!!!!!
!!!
!!!
!!!
!!
!
!!
!!
!
!!!
!!
!!!
!!!
! !!!!!!
!!!!
!!
!!! !
!!!
! !!!
!!!!! !
!!
! !!!! !
!! !!
!!!!!
!!!!!!!!
!!!!!
!! !!!
!!!
!!!!!!!
!! !!!!!
!!!
!!!!!!
!
!
!
!!
!!!!!!!! !
!!!
!!!
!!!!!!
! !
!!!!
!
!
!!! !
!!!!!
!!!!!!
!!!
!!!
!
!
!
!!!
!!!!!!!
!!!
!!!!
!!!!!! !
!
!!!!!! ! !
!!! !
!
!!
!!
!
!!
!!
! !!!!
!!
!!!!!! !!
!!!!!!!!!!
!!!
!
!
!!!!!
!
!!!!!!!!
!
!!!!!
!! !!
!!!
!!!!! !!!
!
!!!
!!! !
!!
!
!!!!
!!
!!
!
!!!
!!
!!!!!!
!
!! !!!!
! ! !!
!!
!!!! !
! !!!
!! !
!!
!!!!!!!!
!!
!!!!!
! !
!!!!!!
!
!!!
!!!!!!!
!!! !!!!
!!!
!!!
!!!!!!!
!!
!!
!
!
!!! !!
! !
!!!
!!!
!!!!!!
!!!
!!!!
!!!
!!
!!
!!
!!
!!!
!!!!
!!!! !
!!!!
!!!
!!
!!!!!
!!!!!
! !!!!!!! !
!
!!!!!!
!
!!!
!! !!!
!!!!
!!!!!
!!
!!!
!!!
!!! !!!
!
!!!!!
! !
!
!!
!!!
!
!!!!!
!!!!
!!!!!!
!! !!
!
!!
!!
!
! !!!!!!!!
!
!!!
!!!
!! !!
!
!!
!
!!!
!!
!!!
!
!!!!
! !! !!!
!!!!!
!
!!
!!!!
!
!!!
!!!
!!!
!!! !!
!!!!!!
!!!! !
!!!!! !
!! !!!! !!
!
!!!
!!!!!! !
!!!!!!
!!!!!
!!!
!!!!!!
!
!
!!!
!!!
!!
!
!
!
!!!
!!!
!!!
!!!
!
!!!! !! !!!!
!!
!! !!
! !!!!
!
!!
!
!
!!!!
!
!
!
! !!!!
!!!!!!!
!!!!
!!
!!!! !
!!!!!!
!!
!
!!
!
!!
!!!!
!!!
!!!!!
!!!
!!!
!!
!!
!!!
!
!
!!!!
!!!!! !!!!
!
!!!!!!!!
!
!!!!!! !
!!!!!
!!!!
!
!!!
!!!!!!
!!!!!!!!!!
!
!
!!!
!
!!!!!!!! !!
!!!
!!!!!
!!!!! !!!!!!!!!!!!!!
!!!
!!!!!
!
!
!!
!!!! !!!!!
!
!!!!!!!!!
!!!! !
!
!!
!
!!!
!!!!!!
!
!!!
!!!!!!!!!!!!!
!!!
!!!!!
!!!
!!!!!!! !!
!!!
!! !!
!!!! !
!
!!!!!
!
!!!!! !
!!!!
!! !!!!!!!
!!!!!
!!!!!!!!!
!!
! !!!!!!
!!!
!!!!!!!
!!!!!
!!!!!!
!!!!!!!!!!
!!!!!!!
!!!!
!!!!!!!!!
!!
!! !!!!!
!!!
!!
!!!!!!!
!
!!
!!
!!!!
!!
!! !
!
! !!
! !!!!!!!!!!!!!!!
!!
!!!!!
!
!!!!!!!
!!! !!
!!!!!
!!!!!!
!!!
!!!!!
!
!!!!!!!
!! !
!!!!
!!!!!! !! !
!!!
!! !
!!
!!!! !!! !
!
!!!!
!!!!!
!
! !!
!!! !
!!
!
!!!!
!
!
!!
!!
!!
!!!!
!
!
!!!
!!!
!
!!!
!!!!! !
!!!
!! !!
!!
!!!!!!
!!! !
!!
!
!
!
!!
!!!
!
!
!
!!!
!
!
!
!!!! !!
!!!!!
!!!
!! !
! ! !!!!
!
!!! !!
!!
! !!!
!!!
!!
!
!!
!!
!!!!!
!!!
!
!! !
! !!
!!
!!
!!!!!!
!
!!
!!
!!!!! !!
!!!
!!!!!
!
!!!
!!!!!!
!!!
!!
!!!!!! !
!
!!!!
!!
!!
!
!!
!!
!
!
!
!
! !!
!!
!!!!!!!
!!!
!
!!!!!!
!
!!!!
!
!
!
!
! !!!!!!!!! !
!!!
! !!
!!!
!
!
!!!
!
!!
!!!
! ! !!! !!!!!
!!!!
!!
!
!!!!!!
! !!!
! !! !!
! ! !! !
!!
!!!!
!!!!!!!!! !!
!!!! !!!
!!!!
!!!!!!
!!!!!!!! !!
!
!!! !!
!
!
!!!!
!
!!! !
!!!!
!!!!!
!!!
!
!!
!!!
!!!!!
!!!!!
!!!
!! !!!
! !!
!!!!!!
!!
!!!
!!!!
!!!!
!
!!!
!!!!!!
!
!!!
!!!!!!!! !!!! !!!
!!
!!
!!!
!!!!!!!
!!!!!
!
!!!!!!!!!! !
!!!!!
!!!!!!!
!!!!!!!!
!!!!!
! !!!!!!!
! !!! !
!!!!!!!!!!!!!
!!!!!!!!
!!!! !
!!! !!
!!
!!!!!!!!!!!
! !!
!!!!!!!!
!!!!!!! !
!!!
!!!
!!
!!!!!!!!!!!!!!
!!
!!!
!
!!!!!!!!
!
!!!!
!!!!
!!
!
!!!! !
!!!!!
! !!! !
! !!
!!!
!!!!!!!!!!!
!!
!!!
!!!!!!!! !!
!!!
!!!
!!!
!!!
!!!!
! !!! !!
!
!!
!!!!!
!!!!!
!!
!!!!
!!!
!
!!!!!
!
! !!!! !
!!!!
!!
!
!!!!!!!!
!!
!
!!!! !! !
!!!
!
!!!!
!!!!
!!!! !!
! !!
!!!!!!
! !!! !
!!
!!
!
!!
!!!!
! !!!
!!!
!!!
!
!!! !
!
!!!
!!
!!!!
!! !
!
! !!
!!!
!!!
!!
!!
!! !!
!!!! !!!!!!!
!!
!!!!!!!!!
!! !
!!
!!!!!
!
!
!!
!!!! ! !
!!!
!!
!
!!!!
! ! !!!!!
!!
!!!!!
!!!!!! !!!
!!
!!! !!
!! !!!
!!!
!!!!
!!!!!
!!
!!!!!
!
!
!
!!!
!!!
! !
!!
!
!!!!
!
!!!
!!!
!! !!
!!!
!!!!
!!
!!!!
!!!!!!!!
! !!!
!
!!!!!!!!
!!!
!!!!
! !!!!!!!!
!
!
!! !
!!!!!!!
!!
!!!
!!!!
!!! !!!
!!!
!!!!
!!!!!!!
!!!!!
!
!!!
!!!!!!! !
!!!!!!
!!
!!
!!
!
!!
!! !! !!!
!!!!!
!!!
! !!!!!
!!!!
!
!!!!!!
!! !!!!!!!!
! !!
!!!!!!!
!!!!!
! !!
!!
!!!!!
!!
!!!!!
!!!!!!!!!!
!!
!!!!!!!!!!
!!!!!!! !!
!!!!
!!!!!!
!! !!!
!
!!
!
!!
!!!
!!!!!
!! !
!!! !!!!
!!
!!!!
!!!
!!!
!!
!
!!!
!!!!
!!!!
!
!!
!
!!
! !!
!!!
!!!!!!
!
!! !!!
!
!!!!!! !!!
!!!!
!!!!!
!
!!!!!!!!!
!!
!!!
!
!!!
!!
!! ! !!!!
! !!!!!
!!!!!!!
!!!
!
!! ! !!!
!
!!!
! !!
!!!!!!!
!
!! !!
!!!
!!!!!!
!!!
!!!!! !!!!
!!!!!
!!!
!!!
!!!!!
!!!
!!!!!!!
!!!!!! !
!
!
!!!
!!!!
! !!!!!!!!!!!!!
!!!!!!! !!
!!!!!!!!!!!!!!!!!!!!
!
!!!!
!!!!!!
!!!
!!!!!!!
!!!!!
!!!!!!!
!!! !
! !!!!!!
!!! !!
!
!! !!!!
!!!!!
!
!
!
!!!!!!!!
!!!!!!
!!!!!!!!
!!!!!!!
!!!!!!
!!
!!!!
!!!
!!!!
!!
!
!
!!!!!!!
!!
!
!!!!
!!!!!!!!
!!!!!!!!!!!
!!
!!!
!!!!!!!!
!!!!!
!!!!!
!!!!
!!!
!!!!!!!
!! !!!!!!
!!!!!!!!!!!! !!
!!!
!!!! !
!!!
!!
!!!
!
!!!!!
!!
!!!!!!!!!
!!!!!!!!!
!!! !!
!
!!!!!!
!!! !!!!!!
!!
!!!!!!!
!!!!!! !
!!!!!!
!
! !!!!
!!!!!
!!!!!!!!!
!!!
!
!!!
!!!!
!!!
!!!
!!!
!!
!!!!
!
!
!!!!!!
!!!!!!!!!
!
!! !!
!!!!!!!!!
!!!!!!!!!
!!!!!!!!!!!
! !!!!!!!!!!!!!!!!!
!!!!!!!
!!!!!!!
!
!!!!!!!!!
!!!!
!!!!
!!!!!!
!!!!!!
!!! !
!!
!!!!!
!
!
!!!
!!
!!
!!
!!!!!
!!!
!!!!!!!!
!!!!
!!!!!!
!!
!!!
!
!
!!!!
!!
!!!
!!
!!!
!!!!
!!!!!!
!!!
!!! !!
!
!!!
!
!!!!
!!!!
!!!!
!!!
!!!! !!!
!! !!!!!
!!!!!! !
!!!!
!! !!
!!!!
!
!
!!
!!!
!!!
!!!!
!!!!
!!!!!!
!!!
!!
!!!!!!!!
!
!!
!!! !!!!
!!
!
!!
!
!!
!!!
!!!
!!!!
!!
!!!!!!!!!
!!!
!! !!
!!!!!!!
!!!
!!!! !!!
!! !! !
!!!! !!!
!!!!!!
!!!!!!!!! !
!!!
!
!!!!
! !
!! !!!
!
!!!!
!!!!!!!!! !
!!!!
!! !!
!!!!!!!!
!!!!!
!!
!!!
!!!!!!! !!!!
!
!
!!
!! !
!
!!!
!
!!
!!!!!!
!!!!!!!!
!!!!!!
!!!
!!!!
!!!!! !!! !
!!!!!!
!!!!!
!!!! !
!!!!!
!!!! !!
!!!!!
!!!!
!!
!!!!!
!!
!!!!
!
!
!!
!!!!
!!!
!
!
!!!!
!! !!
!!
!
!
!!!!!
!!
!!! !
!!
!
!!!!!
!!!!!!
!!!
! !
!!!
!!!
!! !!!
!! !!
!!!! !!
! !!!!! !!
!!!
!!
! !!!!!! !
!!
! !!!! !
!
!
!!!
!!!
!!!!!!
!!!!
!
!!!
!
! !!!! !
!!
! !!
!
!!!
!!!
!!!!!!!!
!!!
!!!
!!
!!!!
!!
!!!
!!!!
!
! !!! !!
!!!!
!!!!!!!
!!!!!!
!!!
!!
! ! !!
!! !!
!!!
!!!!
!!
!!! !
!!
!!!!
!!!!!
!
!!!!
! !
!
!!!!!
!!
!!
!
!
!!!!!!
!!!!
!!!!
!!
!!!!!!!!!!!!!!!!!!!
!
!!!
!!! !!!!!!!
!!!!!!!
!!!
!!!!
!!
!
! !!
! !!!
!!!!!!
!!!! !!! !!
!!!!!!!!!!!
!!!
!!!!!!
! !
!! !!!!!!! !
! !!!
!! !
!
!
!!
!
!
!!!
!!!!!!
!! !!
!!!!!
! !
!!!!!!
!!
!
!!!!!!
!
!!!!!!!!!
!!
!!!
!
!!!
!!
!!!!
!
!! !!!!!
!!!
!!
! !!!
! !
!!!
!
!!
!!
!!!
!
!
!!!
! !!!!
!
!!
!!!!
!!
!
!!!
!!!!!
!
!!!!!!
!!!
!!!!
!!!
!!
!!!!!!! !!
!!!
!! ! !
!!!!!!
!!!
!!!!
! !!!
!
!!!!
!!
!! !
!!! !!!!!!
!!
!!!
!
!!
!!!!!!!!!
!!
!!
!!!
!!!
!!
!!!!
!! !!!!!!
! !!!!
! !!!! !
!
!!!!!!!!! !
!!
!!!
!
!!!
!!! !!
!
!!!!
!!!!
!!!!!
!!!!!
!!!!!!!
!!!!!!!!!!!
!!!!!
!!
!!!
!!!! ! !
!!!! !!!!
!!!
!
!!!!!!
!! !
!!!!!!!
!!!! !!
!!
!
!
! !!!!
! !! !!!
!!!
!!!!
!!!! !!!!!!
!! !!!!
!!
!
!!!!
!!!!
!!!!
!!!!
!!!!!
!!
!!
! !
! !
!!! !!!! !!!!!
!!!
!!!
!
!!!
!!!
!!! !
!!
!!
!!!!!
!! !!!
!! ! !!
!! !!!!
!!
!
!
!!
! !!
!
! !
!
! !
!
!
! !
!! ! !
!
!!
!
!
!
!
!!
!
!
!
!
!
!!!
!
!
!!
!! !!!
!
!!
!!!!!
!!!
! !!!
!
!!
!
!
!
!!
!
!
!
!!!!!
!
! !!!!!!
!!!
!!!!!
!
!
!
!!!
!
!!!
! !!
!!!!!
!!
!!!!!
!!!
!
!!!!
!!!!!!!
!!!!!
!
!!!!
!!!!!
!
!!!!!!!
!!!!
!!
!!
!
!!!!
!!!!!!
!!!! !
!
!!
!
!!
!!
!!!
!
!
!
!
!!
!!
!!!!
!
!
!
!!!
!!!!
!!!
!!!
!!!
!!!!!
! !!
!!!
!!!!!!!
!!!!!!
!!!!
!!!!!
!
!!
!!!!!!
!
!!!!!
!!!!!!!!
!!!!!!
!!!!!!!!!!!!!!!!!!! !!!!
!!!!!
!!!!!!!!
!!
!!!!!!!!!!!!
!
!!!!
!!!!!!!!
!!!!!!
!!!
!!!
!!!!
!
!!!!
!!
!!!
!!!!!!!!!!
!
!!
!
! !!
!!!!
!!!!!!!!!
!
!!!!!
!!!!!!!!!!!!!!!!!!!
!!! !!!!!!!!!!!!
!! !!!!!!!!
!
!!!!!!
!!!!!!!
!!!
!
!!!! !!!
!!!!!!!
!
!
!!!!!
!
!!
!!
!!! !
!!! !
!!
!!!
!
!
!
!
!
!
!
!!!
!!!!
!!
!!!
! !
!
!
!!!!!!!!
!!!
!!!!
!
!
!! !
!
!
!
!
!
!!
! !!
Legend! Foreclosure Filings
Census TractsCommunity Districts
weselcouch
Text Box
Figure 2: Map of Census Tract Boundaries, Community District Boundaries, and 2009 Foreclosure Filings in New York City
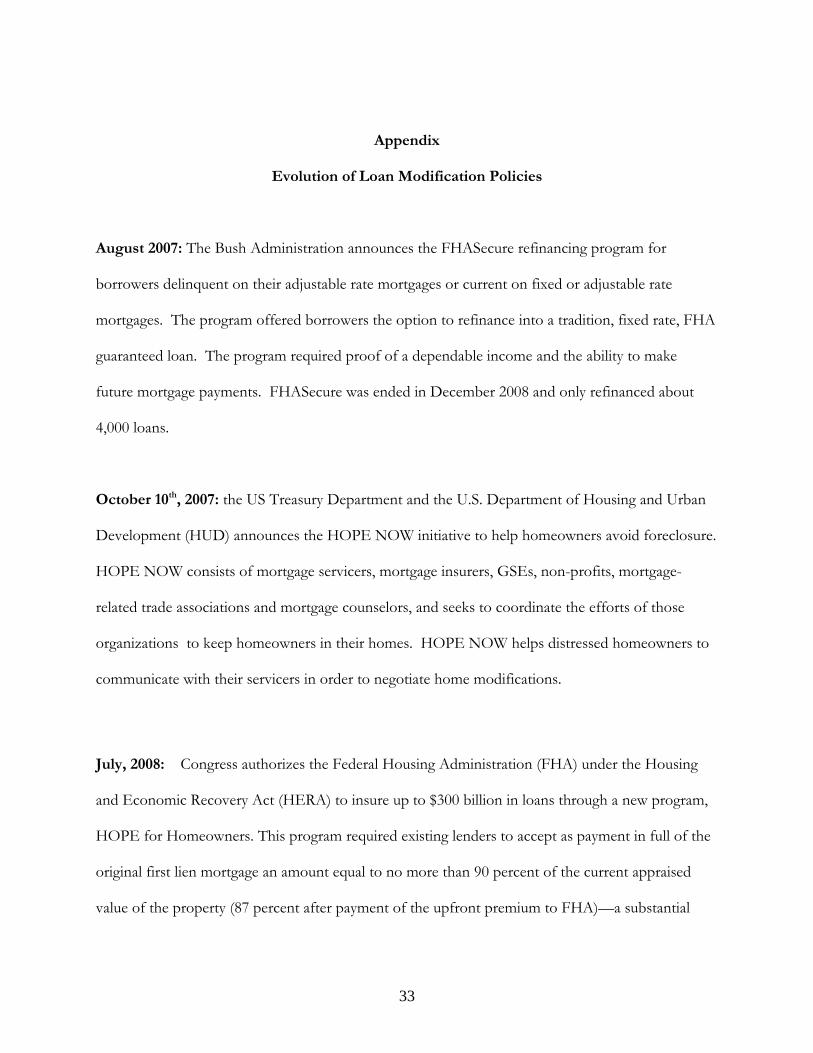
33
Appendix
Evolution of Loan Modification Policies
August 2007: The Bush Administration announces the FHASecure refinancing program for
borrowers delinquent on their adjustable rate mortgages or current on fixed or adjustable rate
mortgages. The program offered borrowers the option to refinance into a tradition, fixed rate, FHA
guaranteed loan. The program required proof of a dependable income and the ability to make
future mortgage payments. FHASecure was ended in December 2008 and only refinanced about
4,000 loans.
October 10th, 2007: the US Treasury Department and the U.S. Department of Housing and Urban
Development (HUD) announces the HOPE NOW initiative to help homeowners avoid foreclosure.
HOPE NOW consists of mortgage servicers, mortgage insurers, GSEs, non-profits, mortgage-
related trade associations and mortgage counselors, and seeks to coordinate the efforts of those
organizations to keep homeowners in their homes. HOPE NOW helps distressed homeowners to
communicate with their servicers in order to negotiate home modifications.
July, 2008: Congress authorizes the Federal Housing Administration (FHA) under the Housing
and Economic Recovery Act (HERA) to insure up to $300 billion in loans through a new program,
HOPE for Homeowners. This program required existing lenders to accept as payment in full of the
original first lien mortgage an amount equal to no more than 90 percent of the current appraised
value of the property (87 percent after payment of the upfront premium to FHA)—a substantial

34
principal write-down in many cases. Hope for Homeowners was voluntary for both borrowers and
lenders, and resulted in very few modifications.
November 11th, 2008: The Federal Housing Finance Agency announces a new streamlined loan
modification program, modeled largely on the FDIC’s IndyMac protocol (IndyMac was a mortgage
company taken over by the FDIC). The program encourages servicers to restructure loans for
eligible borrowers so that monthly mortgage payments are no more than 38% of a borrower’s
monthly gross income. Servicers can reduce monthly mortgage payments by lowering the interest
rate, extending the life of the loan, deferring the payment of some of the principal, or a mix of these
actions. Eligible loans include Fannie Mae and Freddie Mac loans along with portfolio loans by
participating servicers. Borrowers under this program must be at least 90 days delinquent, owe
more than 90% of the value of their homes, must have not filed for bankruptcy, and must certify
that they are suffering some sort of economic hardship. Servicers are awarded $800 by the
government for each loan that they modify.
February 18th, 2009: The Obama administration announces the Homeowner Affordability and
Stability Plan, which includes a plan to help financially distressed homeowners. Two weeks later, the
details of this plan, the Making Home Affordable (MHA) plan, are announced. MHA has many
components, including the Home Affordable Refinance Program (HARP), the Home Affordable
Unemployment Program (UP), the Second Lien Modification Program (2MP), and the Home
Affordable Foreclosure Alternatives Program (HAFA). The key component of MHA regarding loan
modifications, however, is the Home Affordable Modification Program (HAMP). . HAMP provides
a streamlined structure for modifications and financial incentives for servicers to modify loans. The
program requires that servicers reduce monthly payments to 38% of gross monthly income, after

35
which Treasury will match the servicer dollar-for-dollar for the cost of further reducing the monthly
payment to 31% of gross income. Servicers also receive an upfront payment of $1,000 for each
modification, and a further $1,000 per year for three years if the borrower remains in the HAMP
program.
In order to receive a modification under HAMP, a borrower must meet the following
conditions: (1) the property must be owner-occupied and the borrower’s primary residence, (2) the
property must be a single-family property with a maximum unpaid principal balance of s $729,750 or
less, (3) the loan must have originated on Jan. 1, 2009 or before, and (4) the monthly payment must
be more than 31% of the homeowner’s gross monthly income.
If a borrower is eligible, a servicer will adjust the monthly mortgage payment to 31% of a
borrower’s total monthly income by first reducing the interest rate to as low as 2%, then if
necessary, extending the loan term to 40 years, and finally, if necessary, forbearing a portion of the
principal until the loan is paid off and waiving interest on the deferred amount.
If these conditions are met, a servicer will then apply a Net Present Value (NPV) test to
determine whether the value of the loan to the investor will be greater if the loan is modified
(http://makinghomeaffordable.gov/borrower-faqs.html#18). The incentives provided by HAMP
will be included in this figure. If the modified loan is worth more than the loan without the
modification, the servicer is required to provide the modification on a (usually three month) trial
basis (http://makinghomeaffordable.gov/borrower-faqs.html#18). If the modified loan is not
worth more than the loan in its original state, it is at the servicer’s discretion whether to modify the
loan.
The purpose of the trial period is to provide immediate relief for the borrower while
providing a check that the modification is sustainable for the borrower and that the borrower indeed
meets the qualification requirement of HAMP. If the borrower makes timely payments for the
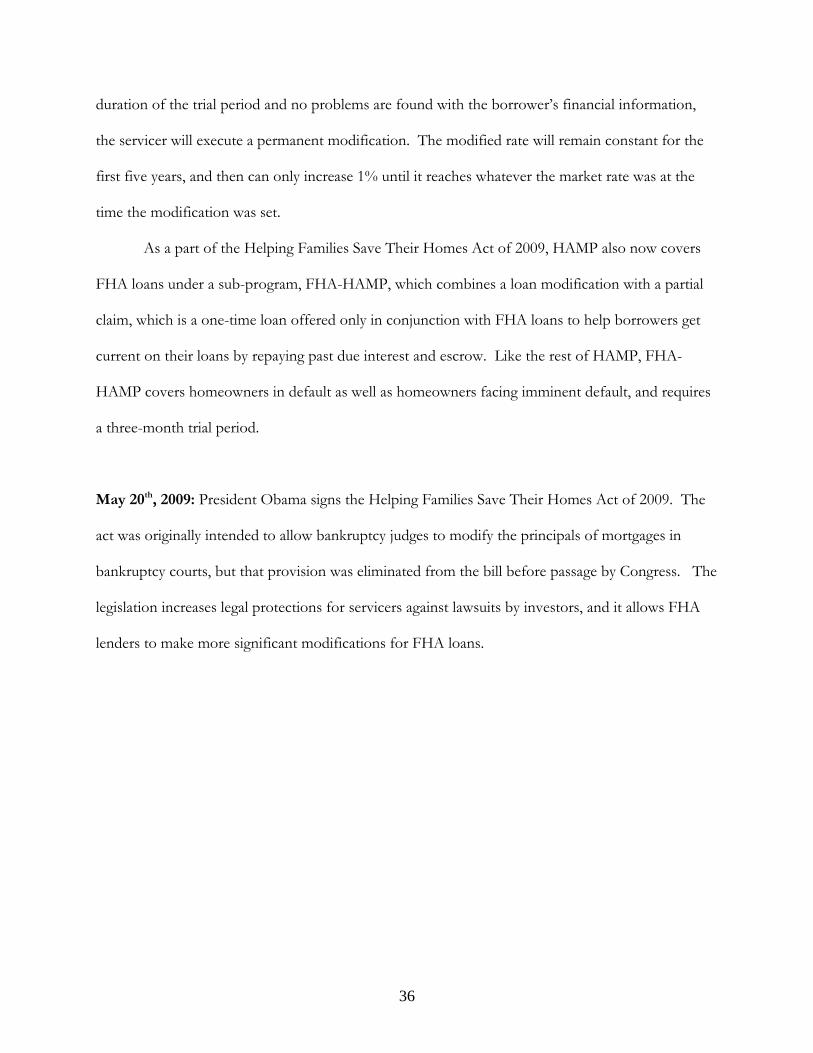
36
duration of the trial period and no problems are found with the borrower’s financial information,
the servicer will execute a permanent modification. The modified rate will remain constant for the
first five years, and then can only increase 1% until it reaches whatever the market rate was at the
time the modification was set.
As a part of the Helping Families Save Their Homes Act of 2009, HAMP also now covers
FHA loans under a sub-program, FHA-HAMP, which combines a loan modification with a partial
claim, which is a one-time loan offered only in conjunction with FHA loans to help borrowers get
current on their loans by repaying past due interest and escrow. Like the rest of HAMP, FHA-
HAMP covers homeowners in default as well as homeowners facing imminent default, and requires
a three-month trial period.
May 20th, 2009: President Obama signs the Helping Families Save Their Homes Act of 2009. The
act was originally intended to allow bankruptcy judges to modify the principals of mortgages in
bankruptcy courts, but that provision was eliminated from the bill before passage by Congress. The
legislation increases legal protections for servicers against lawsuits by investors, and it allows FHA
lenders to make more significant modifications for FHA loans.