TWO-WEEK LOAN COPY - eScholarship.org
16
LBL-12151 Preprint c. Submitted to the Journal of Vacuum Science and Technology OXYGEN INDUCED DISSOLUTION AND SEGREGATION OF SILICON IN PLATINUM SINGLE CRYSTALS M. Salmeron and G.A. Somorjai January 1981 5 1981 TWO-WEEK LOAN COPY This is a Library Circulating Copy which may be borrowed for two weeks. For a personal retention copyy call Tech. Info. Divisiony Ext. 6782. Prepared for the U.S. Department of Energy under Contract W-7405-ENG-48 ION
-
Upload
khangminh22 -
Category
Documents
-
view
1 -
download
0
Transcript of TWO-WEEK LOAN COPY - eScholarship.org
LBL-12151 Preprint c.
Submitted to the Journal of Vacuum Science and Technology
OXYGEN INDUCED DISSOLUTION AND SEGREGATION OF SILICON IN PLATINUM SINGLE CRYSTALS
M. Salmeron and G.A. Somorjai
January 1981
M:~R 5 1981
TWO-WEEK LOAN COPY
This is a Library Circulating Copy
which may be borrowed for two weeks.
For a personal retention copyy call
Tech. Info. Divisiony Ext. 6782.
Prepared for the U.S. Department of Energy under Contract W-7405-ENG-48
ION

DISCLAIMER
This document was prepared as an account of work sponsored by the United States Government. While this document is believed to contain c01rect information, neither the United States Government nor any agency thereof, nor the Regents of the University of California, nor any of their employees, makes any warranty, express or implied, or assumes any legal responsibility for the accuracy, completeness, or usefulness of any information, apparatus, product, or process disclosed, or represents that its use would not infringe privately owned rights. Reference herein to any specific commercial product, process, or service by its trade name, trademark, manufacturer, or otherwise, does not necessarily constitute or imply its endorsement, recommendation, or favoring by the United States Government or any agency thereof, or the Regents of the University of California. The views and opinions of authors expressed herein do not necessarily state or reflect those of the United States Government or any agency thereof or the Regents of the University of California.
LBL 12151
OXYGEN INDUCED DISSOLUTION AND SEGREGATION OF SILICON
IN PLATINUM SINGLE CRYSTALS
M. Salmeron 1 and G.A. Somorjai
Materials and Molecular Research Division, Lawrence Berkeley Laboratory, and Department of Chemistry, University of
Californfa, Berkeley, CA 94720
ABSTRACT
The segregation of silicon in platinum flat (111), stepped (553)
and (332) surfaces is studied as a function of crystal temperature. Silicon
segregates below 1000°C with an activation energy between 17 and 20 Kcal/
mole. In the retarding field mode, the maximum amount of segregated Si
corresponds to a Si (93 eV)/ Pt (242 eV) Auger peak ratio of about 5.
In the presence of 0 2 , Si dissolves into the bulk at T 3t 600°C. The rate
of Si dissolution increases with 0 2 pressure and crystal temperatures.
For P = 2.5xl0-7 Torr, the activation energy for the dissolution process 02
is 16+2 Kcal/mole. Continued exposure to 0 2 results in the reapparance
of Si at the Pt surface as a new phase, SiO , characterized by Auger X
peaks of Si (84 eV) and 0 (515 eV).
1 Permanent Address: ,
Instituto de Fisica del Estado Solido del CSIC Universida'd Aut6noma de Madrid, Spain
This work was partially supported by the Spanish-American Cooperation Program which the authors gratefully acknowledge, and the Division of Materials Sciences, Office of Basic Energy Sciences of the U.S. Department of Energy under Contract W-7405-ENG-48.


1.
Intruduction
Therehavebeen a considerable number of studies on the interaction
of oxygen and platinum single crystals (1-10). On Pt(lll) crystal sur-
faces a physisorbed molecular state was observed below -150°C (8,9),and
two forms of atomically bound oxygen. One is a chemisorbed species that
desorbs in the range of 300-500°C, and the other is a more strongly bound
oxygen desorbing at temperatures in excess of 900°C. This last form of
oxygen was shown to be located below the Pt surface by the use of ion
scattering spectroscopy (13). This strongly bound oxygen has also been
associated with the formation of surface platinum oxide (4) that exhibits
novel chemisorption and catalytic properties (7,8,14,15).
The presenceofoxygen at the platinum surface may also have profound
effects on the surface concentration and solubility of other elements such
as Si, C, Al, Mg, and Ca. Since these elements are often present in
important platinum catalyst systems, as constituents of the high surface
area supports for the finely dispersed patticles of the noble metal,
their behavior, when dissolved in platinum, is of considerable interest.
Oxygen is also an important component of these catalysts systems as part
of the oxide support. It is also utilized often for the catalyst preparation
and 'activation' to obtain optimum reactivity and selectivity.
In this report we explore the dissolution and surface segregation of
Si in Pt single crystals, and show how its behavior is profoundly influ-
enced by the presence of oxygen. The solubility of Si is increased, in the
-6 presence of low partial pressures of oxygen (~10 Torr), by the simul-
taneous dissolution of oxygen in platinum, followed by the precipitation
2.
of SiO at the surface under appropriate experimental conditions. X
Strongly bound oxides at the surface of noble metals have been reported
for Pt(4-8), Rh (20), Ir (21), and Pd (22). While the conditions of
their formation can be stronly influenced by the presence of other elements
as Si and Ca, that are often present in these metals in small amounts,
their properties are distinctly different from the properties of Si0 2 and
CaO that can segregate to the surface of the noble metals under proper
conditions.
The reason for the thermodynamic stability, structure and composition
of these noble metal surface oxides will be discussed in a subsequent
paper.
Experimental
The Pt single crystals used in this study were cut from Pt single
crystal rods furnished by Metals Research Corp. The crystals cut from
these rods showed large concentration of Si segregated on the. surface after
heating in vacuum (16).
All the experiments were performed in standard UHV chambers evacuated
with ion pumps. The surface analysis techniques used were low energy
electron diffraction (LEED), and Auger electron spectroscopy (AES). The
latter was performed with the LEED optics operated in the retarding
field mode (RFA).
Results
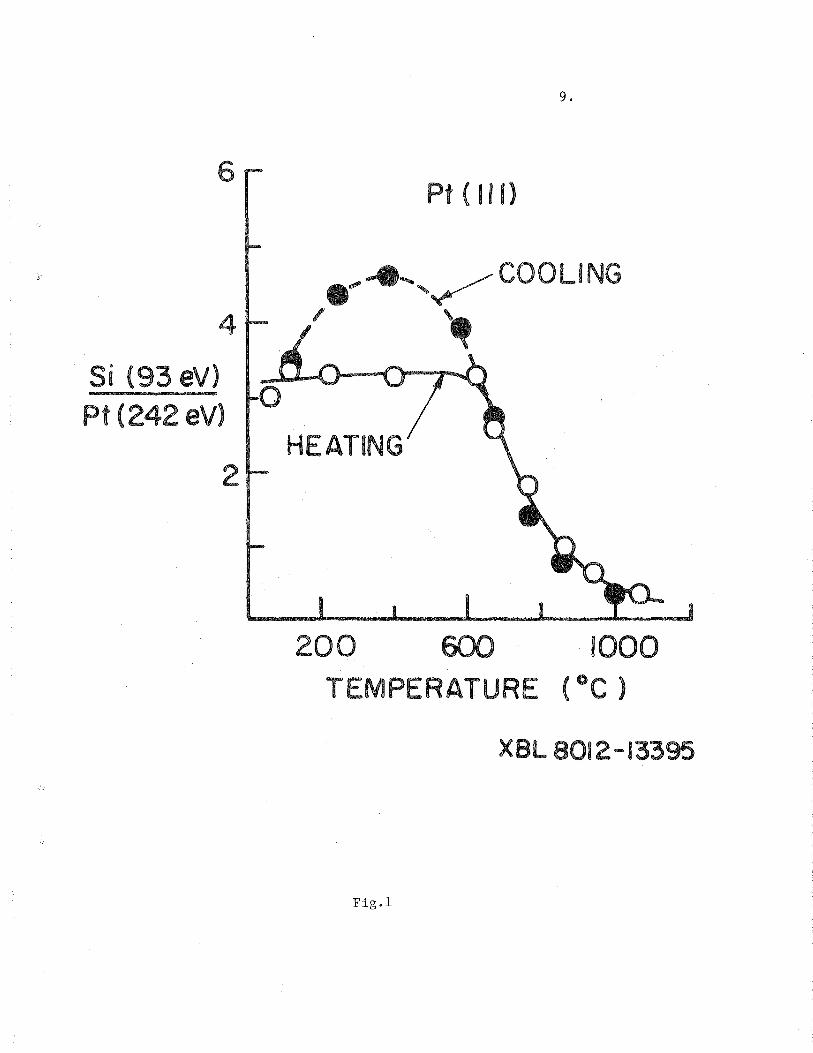
In Figure 1 the amount of Si is shown detected by AES at 93 eV on
the surface of a Pt(lll) crystal as a function of temperature. Segregation

3.
of Si is observed to occur on cooling below 1000°C, while dissolution
into the bulk occurs on heating above 600°C. The hysteresis effect observed
is due to imperfect equilibration of Si in the surface and bulk of platinum,
especially at the lower temperatures. If the Pt crystal was heated long
enough to permit equilibration of Si between the surface and the bulk, the
hysteresis is eliminated. From the data obtained by experiments of the
type shown in the figure, a segregation energy can be obtained by use of
the Langmuir-McLean isotherm (19). Its value varied between 17 and 20
Kcal/mole, depending on the value taken for the Si/Pt Auger peak ratio that
corresponds to 9=1. This peak ratio varies in the range of 4.6 to 5.6,
depending on the crystal studied (see Figures 1 and 3). An important
observation is the inhomogeneity of the surface concentration of segregated
Si. A scanning AES map of the Si peak intensity shows important varia-
tions as a function of position in the surface of the crystal.
To study the effect of oxygen on the surface concentration of silicon,
we exposed the platinum samples that show various Si surface concentrations
to a given partial pressures of 02. The effects of 'oxygen exposures are
shown in Figure 2 in the case of a Pt(553) surface. The absolute peak-
to-peak height of the Si (93 eV) Auger transition is plotted, in arbitrary
units, as a function of time for two different 0 2 partial pressures. The
Si peak intensity decreases exponentially with time and the rate of this
decrease depends both on the 02 pressure and on the substrate temperatur~.
The temperature dependence is illustrated in Figure 3 in the case of a
-7 Pt(332) crystal for a fixed 02 partial pressure of 2.5xl0 Torr. As we
can see, the rate of decrease of the Auger peak intensity at 93 eV that
4.
is proportional to the Si dissolution rate, increases with sample
temperature. From the three curves of Figure 3, an activation energy of
16±2 Kcaltmole for this process can be obtained. During this stage, no
oxygen peak could be detected with our AES system, indicating the simul-
taneous dissolution of oxygen in the bulk of platinum. The removal of
the 02 molecules from the gas phase resulted in the reappearance of the
Si (93 eV) peak.
Once all the Si disappeared from the Pt surface by dissolution in
the bulk of the crystal, the surface can be maintained free of Si if the
sample is rapidly quenched to room temperature, even after the removal of
oxygen from the gas phase. The diffusion rate of Si in the Pt bulk is
slow enough at low temperatures to prevent reequilibration of Si between
the bulk and the surface of the metal. Continued heating of the Pt crystal
in oxygen, however, causes the sudden reappearance of Si at the surface
that is accompanied by the appearance of oxygen as well, as indicated
in Figure 3. ~-
~,The Si Auger peak is at 84 eV, however, instead of at 93 eV, and
the oxygen Auger peak is at about 515 eV. These Auger peak energies
indicate that this new species is silicon oxide, SiOx (1 ~ x < 2)that has
been detected by other studies as well (23,24). The induction time for
the appearance of the segregated SiO , after complete oxygen induced dissox
lution of the Si increases with decreasing temperature as shown in Figure 3.
If the gas phase 0 2 is removed, while maintaining the crystal at the same
high temperature, the SiO phase undergoes marked changes. It appears that X
&t decomposes as indicated by the increase of the elemental Si Auger peak ,,
at 93 eV and the simultaneous decrease of the peaks at 84 eV and 515 eV

due to SiO • X
5.
The rate of this decomposition process depends on the
crystal temperature being faster at the higher temperatures.
Discussion
The segregation of Si to the surface of Pt single crystals was re-
proted by the authors in a previous paper (16) and also by others (17,18,25).
There is good agreement in the reported segregation temperatures in all
these studies. Also, the total amount of segregated Si below 600°C is
similar if allowance is made for the different sensitivities of the RAF
and cylindrical mirror analyzer detection technique (for detection using
CMA the sensitivity increases linearly with electron energy).
Although the measured activation energies for the segregation (17-20
Kcal/mole)(Figure 1) arld oxygen induced dissolution (16±2Kcal/mole)(Figs.
2 and 3) are similar, they are not the result of the same process, we
believe. In the segregation experiments every point of the experimental
curve of Figure 1 corresponds to an equilibrium value, except those
corresponding to temperatures below 600°C, where the cooling and heating
curves are dissimilar due to incomplete equilibration between segregated
and bulk dissolved Si as explained in the previous section. On the other
hand, even at the high temperatures used in the oxygen induced dissolution
of Si, the times involved are much longer than those required for equili-
bration during the segregation of Si in the absence of oxygen. Moreover,
as seen in Figure 2, this time depends strongly on the oxygen pressure.
This seems to indicate that processes other than the diffusion of Si are
determining the dissolution rate. One such process may be a reaction of
the type Si+O+SiO or Si+O+Pt+SiO Pt • This would provide a sink for Si X X y

6.
in the bulk that decreases its concentration and therefore more Si from
the surface could dissolve to keep the new equilibrium concentration values.
Accumulation of SiO would finally result in its segregation to the surface, X
as observed by the appearance of the 84 eV Auger peak of Si and the Auger
peak of oxygen at 515 eV.
Our value for the activation energy for Si surface segregation differs
markedly from that reported by Bonzel et al.(l7). This discrepance is not
understood at present.
Conclusions
1. Silicon, when present in Pt crysals, segregates to the metal
surface at temperatures in the range of 600-1000°C. The measured segrega-
tion energy is found to be between 17 and 20 Kcal/mole. The maximum ratio
of Auger intensities of Si at 93 eV and Pt at 242 eV is found to be close
to 5.
2. Heating the Pt crystal with segregated Si on its surface in 0 2
at temperatures above 600°C results in an oxygen induced dissolution of
Si and later on in the segregation of an oxidized species, SiO , with X
Auger peaks at 84 eV and 515 eV, the activation energy for this process
-7 being 16+2 Kcal/mole at an 0 2 pressure of 2.5xl0 Torr.
Acknowledgement
This work was partially supported by the Spanish-American Cooperation
Program which the authors gratefully acknowledge, and the Division of
Materials Sciences, Office of Basic Energy Sciences of the U.S. Department
of Energy under Contract W-7405-ENG-48.

7.
References
B. Lang, R.W. Joyner, and G.A. Somorjai, Surface Sci. 30, 440 (1972).
B. Lang, R.W. Joyner, and G.A. Somorjai, Surface Sci. 30, 454 (1972).
H.P. Bonzel and R. Ku, Surface Sci. 40, 85 (1973).
1.
2.
3.
4. B. Carriere, P. Legar~, and G. Maire, J. Chim. Phys. 71, 355 (1974).
5. G. Kneringer, F.P. Netzer, Surface Sci. 49, 125 (1975).
6. R. Ducros, R.P. Merrill, Surface Sci.22, 227 (1976).
7. R.W. McCabe and L.D. Schmidt, Surface Sci. 60, 85 (1976).
8. R. W. McCabe and L.D. Schmidt, Surface Sci. 65, 189 (1977).
9. G. Maire, P. Legare, and G. Lindauer, Surface Sci.80, 238 (1979).
10. M. Salmeron and G.A. Somorjai, Surface Sci. 91, 373 (1980).
11. J.L. Gland, B.A. Sexton, and G.B. Fisher, Surface Sci. 95, 587 (1980)
12. J.L. Gland, Surface Sci. 2}, 487 (1980).
13. H. Niehus, and G. Comsa, Surface Sci. 2}, Ll47 (1980).
14. C.E. Smith, J.P. Biberian, and G.A. Somorjai, J. Catal. 1I• 426 (1979).
15. S.M. Davis and G.A. Somorjai, Surface Sci. 91, 73 (1980).
16. M. Salmeron, R.J. Gale, and G.A. Somorjai, J. Chem. Phys. 70, 2807 (1979).
17. H.P. Bonze1, A.M. Franken and G. Pirug, Surface. Sci. (to be published).
18. H Niehus and G. Comsa, Surface Sci. 102, Ll4 (1981).
19. J.M. Blakely, in Chemistry and Physics of Solid Surfaces, Vol. 2
(R. Vanselow, ed. CRC Press, Boca Raton, FL, 1979).
20. D.G. Castner and G.A. Somorjai, Appl. of Surf. Sci. .§_, 129 (1980).
21. H. Conrad, J. KUppers, F. Nitschke, and A. Plagge, Surface Sci. 69,
668 (1977).
22. H. Conrad, G. Ertl. K. Kuppers and E.E.Latta, Surface Sci. 65,
245 (1977).

8.
23. M. Salmeron, Ph.D. Thesis, Universidad Autonoma, Madrid, Spain, 1974.
24. B. Carriere and J.P. Veville, Surface Sci. 80, 278 (1979).
25. M. J. Cardillo and G.E. Becker, Surface Sci. 99, 269 (1980).
Figure Captions
Figure 1. Concentration of surface silicon in a Pt(lll) sample, as
measured by the ratio of Si to Pt Auger peaks. Hysteresis is observed
at low temperatures due to insufficient equilibration time.
Figure 2. Decrease of surface Si concentration as a function of time,
for two different 02 partial pressures. The crystal is Pt(553) at a
fixed temperature of 650°C.
Figure 3. Decrease of surface Si in a Pt(332) crystal as a function of
time and for three different crystal temperatures. The 0 2 partial
pressure is fixed at 2.5xl0-7 Torr. After an induction time, which
is short at 750°C and too long to be seen here at 600°V, SiO X
segregates with continued exposure to oxygen.
6
4
Si (93 eV)
Pt (242 eV)
2
9.
Pt ( I I I)
,~COOLING
200 1000 TEMPERATURE ( °C )
XBL 8012 ... 13395
Fig.l

20
10.
Pt (553)
T5 = 650°C
P0 = 6.5 x 10⁻⁸ Torr 2
40 60 80 100 TIME (min.)
120
XBL 8012-13396
Fig.2

4
Si(93 eV) Pt (242eV)
2
Si (93eV) Pt (242 eV)
2
2
Si (93 eV)
Pt (242 eV) I
5
Pt ( 3 32)
Po2 :: 2. 5 X I o-7 Torr
15 TIME (min.}
11.
20
5 10 15 2.0 25 30 TIME (min.)
10 15 20 Tl ME (min.)
Fig.3
Si(84eV) Pt(242eV)
1.0
Si (84eV) Pt(242eV)
1.0
XBL8012-13397