qt3jh9d5xd.pdf - eScholarship.org
13
Lawrence Berkeley National Laboratory Recent Work Title Comparative study of commercial building energy-efficiency retrofit policies in four pilot cities in China Permalink https://escholarship.org/uc/item/3jh9d5xd Journal Energy Policy, 88(C) ISSN 0301-4215 Authors Hou, J Liu, Y Wu, Y et al. Publication Date 2016 DOI 10.1016/j.enpol.2015.10.016 Peer reviewed eScholarship.org Powered by the California Digital Library University of California
-
Upload
khangminh22 -
Category
Documents
-
view
0 -
download
0
Transcript of qt3jh9d5xd.pdf - eScholarship.org

Lawrence Berkeley National LaboratoryRecent Work
TitleComparative study of commercial building energy-efficiency retrofit policies in four pilot cities in China
Permalinkhttps://escholarship.org/uc/item/3jh9d5xd
JournalEnergy Policy, 88(C)
ISSN0301-4215
AuthorsHou, JLiu, YWu, Yet al.
Publication Date2016
DOI10.1016/j.enpol.2015.10.016 Peer reviewed
eScholarship.org Powered by the California Digital LibraryUniversity of California

Energy Policy 88 (2016) 204–215
Contents lists available at ScienceDirect
Energy Policy
http://d0301-42
Abbrenese YuEducatiEMC, EnMOC, MDevelop
n CorrE-m
yshliu1@nzhou@
journal homepage: www.elsevier.com/locate/enpol
Comparative study of commercial building energy-efficiency retrofitpolicies in four pilot cities in China
Jing Hou a,n, Yisheng Liu a, Yong Wub, Nan Zhou c, Wei Feng c
a Beijing Jiaotong University, No. 3 Shangyuancun, Haidian District, Beijing 100044, Chinab Ministry of Housing and Urban-Rural Development, No. 9 Sanlihe Road, Haidian District, Beijing 100835, Chinac Lawrence Berkeley National Laboratory, 1 Cyclotron Road, Berkeley, CA 94720 United States
H I G H L I G H T S
� Data and information were collected through site surveys to the four pilot cities.
� Policy design and effectiveness in four cities were comparatively analyzed.� Well-designed policy increases market response, energy savings and EMC adoption.� Lighting is the most common retrofit while envelope is the least common one.� Subsidy incentive is greatest for educational buildings due to the utility tariff.a r t i c l e i n f o
Article history:Received 23 June 2015Received in revised form14 October 2015Accepted 15 October 2015
Keywords:Existing commercial buildingEnergy efficiency retrofitIncentive policyTechnical solutionCost-benefitBarrier
x.doi.org/10.1016/j.enpol.2015.10.01615/& 2015 Elsevier Ltd. All rights reserved.
viations: CBEER, Commercial Building Energyan; DRC, Development and Reform Commission; EUI, Energy Usage Intensity; EIA, Energy Iergy Management Company; GOA, Governmeinistry of Construction; MOHURD, Ministry oment; M&V, Measurement and Verificationesponding author.ail addresses: [email protected], houjinbjtu.edu.cn (Y. Liu), [email protected] (lbl.gov (N. Zhou), [email protected] (W. Feng).
a b s t r a c t
The energy efficiency of existing commercial buildings is more challenging to regulate and improve thanthe energy efficiency of new constructions. In 2011 and 2012, the Chinese Government selected fourcities- Shanghai, Tianjin, Shenzhen, and Chongqing- to implement pilot commercial building energyefficiency retrofit program. Based on site surveys and expert interviews in these pilot cities, this researchconducted a comparative analysis on incentive policies of local city level. The analysis results show thatpolicy designs of existing commercial buildings should be further improved. The aspects that influencethe implementation effect in the future, such as subsidy level, installments, and business model pro-motion, should be specified in the policy clauses. Referring to the technical solution and cost-benefit inChongqing, we found that lighting system is the most common retrofit objects while envelope system isthe least common one. And the subsidy incentive is greatest for educational buildings, followed by officebuildings. In the end, we further discussed the problems and obstacles in commercial building retrofitmarket, and provided a series of recommendations.
& 2015 Elsevier Ltd. All rights reserved.
1. Introduction
1.1. Commercial building sector development overview
As a result of rapid, steady economic growth in the past two
Efficiency Retrofit; CNY, Chi-on; DOE, Department ofnformation Administration;nt Offices Administration;f Housing and Urban-Rural
[email protected] (J. Hou),Y. Wu),
decades, China has become the largest energy consumer and car-bon dioxide (CO2) emitter in the world (BP Group, 2010). Rapidurbanization can also be seen in the same period. From 1980 to2014, the population of permanent residents in Chinese cities andtowns increased from 191 million to 749 million, and at the sametime, the urbanization rate grew roughly by 1.02% annually, from19.4% to 54.8% (Fig. 1) (CGPRC, 2014). As a result, a large number ofcommercial buildings1 have been constructed in cities all overmainland China. The growing number of commercial buildingsalso indicates that commercial building energy demand is growing
1 In this article, commercial buildings refer to both governmental buildings andbuildings used in service sector, which are not used as residences, nor part of in-dustrial facilities. By building functions, commercial buildings mainly include office,retail, hospital, school, hotel and other building types.

Fig. 1. Urbanization levels in China, 1980–2014 (Source: National Bureau of Statistics data and China's New Urbanization Plan (2014–2020)).
J. Hou et al. / Energy Policy 88 (2016) 204–215 205
rapidly.From 1996 to 2012, total commercial floor space in China in-
creased from 2.8 billion square meters (m2) to 8.3 billion m2 (NBS,2013; BECRC, 2014). The average EUI of China's commercialbuildings is three to five times more than that of residentialbuildings. Large-scale, high-end commercial buildings can be asmuch as 10 to 20 times more EUI than typical commercial build-ings (CGPRC, 2007; Liu, 2012; Xu et al., 2012). In 2012, China'scommercial buildings consumed more than 182 million tonnescoal equivalent, accounting for 26.4% of overall energy consump-tion in the building-sector (BECRC, 2014). A study conducted bythe EIA projects reveals that commercial building energy use willincrease by 2.7% per year in developing countries between 2007and 2035 (EIA, 2010). These values make clear that commercialbuilding energy efficiency should be kept increasing to help reducegrowth in energy consumption.
1.2. Energy efficiency of new construction commercial buildings
In an effort to achieve large scale energy savings, the govern-ments typically rely on energy policy tools which can help con-serve energy in thousands of commercial buildings such asbuilding energy standards and codes (Azar and Menassa, 2014). Inthe past two decades, the Chinese Government had implementedenergy-efficiency policies for new constructed commercial build-ings. In 1993, the MOC2 issued a building energy-efficiency stan-dard for hotels (GB501893). In this phase, the criteria of the stan-dard were not rigid enough. Besides, the standard enforcementscope was not comprehensively included for all types of com-mercial buildings (MOC, 1993). In 2005, the GB 50189 was revisedto include other types of commercial buildings. The standard re-quired that all new buildings should be 50% more efficient thanthe baseline defined with 1980s building characteristics (Fenget al., 2014)4. The latest revision to this standard has been issuedby the MOHURD on May 15th 2015 and taken effect in October 1st2015, which sets the efficiency level at approximately 30% morethan that of the 2005 standard (Hong et al., 2015a), i.e., equivalentto 65% more efficient than the 1980s baseline. Therefore, alongwith the constant update of the mandatory efficiency standard-GB50189, energy-efficiency in new constructed commercialbuilding sector has been effectively controlled and improved stepby step.
2 The MOHURD was founded in 2008. Its predecessor was the MOC.3 GB 50189 is a national standard named “design standard for energy efficiency
of public buildings”. GB, in Chinese pinyin “Guo Biao” means national standard.4 The 1980s characteristics (baseline) assumes that buildings in China were
constructed without rudimentary energy efficiency measures.
1.3. Energy efficiency of existing commercial buildings
Most commercial building energy efficiency policies target atnew construction, whereas technical specification for energy effi-ciency improvement in existing commercial buildings are stillunderdeveloped due to inadequate financial and technical capa-cities (Li and Shui, 2015). In addition, energy efficiency in existingcommercial buildings is more challenging to regulate and improvethan the energy efficiency of new constructions. Most commercialbuildings that were built before GB50189-2005 are in need ofretrofitting. In addition, some large-scale and high-end ones thatwere built according to GB50189-2005 still have a high EUI. Theirenergy efficiencies need to be improved through retrofit as well.
A lot of energy statistics, energy audit and energy-saving di-agnosis revealed that all kinds of commercial buildings have highenergy consumption, low energy efficiency issues, in different le-vels. Jiang et al. (2010) estimated that the average energy savingpotential in most large scale commercial buildings are generallyover 30%. While Hong (2009) thought the potential is about 50%by combining energy conservation measures with improved op-erations. Although some researchers have noticed the big energysaving potential in China's existing commercial building sector,further in-depth research or energy efficiency retrofit practice isvery limited. Only a few researchers analyzed commercial buildingretrofit of one single type or one single climate zone by usingeQuest or DeST software (Xing et al., 2015; Peng et al., 2014). Somedeveloped countries go faster than China, apart from a lot of ret-rofit practice, researchers even developed some energy efficiencyperformance database and energy retrofit analysis toolkits tosupports commercial building retrofit (Hong et al., 2015b; Leeet al., 2015a; Lee et al., 2015b). However, the experiences fromthese researches that China can learn are limited. Because thereare many differences exist in not only commercial building type,scale, energy consumption behaviour, etc., but also the CBEERmarket maturity, data foundation, national promote pattern, etc..Therefore, a comprehensive study about China CBEER is very ne-cessary and helpful.
This research studied a large number of existing commercialbuilding retrofit projects within a four-pilot-city program in China.With a comparative study of the incentive policies in differentcities, this research also aimed at comprehensively probing intosome other important aspects associated with existing commercialbuilding retrofit industry. Technical solution, cost-benefit, businessmodel, and barrier and obstacle are focused on in this paper.
2. Methodology
Fig. 2 shows the process, method, and objective of this

Fig. 2. Research process, method, and objective.
Table 1Four-city pilot commercial-building energy-efficiency retrofit program.
Policy details
RequirementsFloor area target ✓Minimum 4 million m2
floor areaTime schedule target ✓Completed within 2 yearsEnergy saving target ✓Energy performance enhanced by 20%
SubsidySubsidy amount ✓20 CNY/m2 for 4 million m2 (80 million CNY/city)Subsidy payment ✓60% prepaid, 40% after inspection
J. Hou et al. / Energy Policy 88 (2016) 204–215206
research. Throughout the research, we conducted site survey, ex-pert interview, and literature analysis.
It is difficult but critical to obtain first-hand information anddata. In order to gather detailed policy design information, im-plementation effect, and precise data of the pilot program pro-gress, we first conducted site surveys in the four pilot cities-Tianjin, Chongqing, Shenzhen, and Shanghai–in December 2013,January 2014, March 2014, and April 2014, respectively. During thesite survey in each city, we convened several symposiums invol-ving local construction government, commercial building owners,EMCs, and a few financial institutes like banks.
To have a deeper understanding of CBEER in China, we alsoconducted expert interviews to acquire further knowledge of theindustry. We selected many renowned experts who are familiarwith CBEER based on their professionalism, experience, capability.On the whole, experts can be divided into two categories, one isexperienced front-line staff from construction agency in bothcentral government and local government; the other is from re-search institutes, colleges, associations, and enterprises. Con-sidering that the experts with different background can providesuggestions from different views on each aspect of retrofits, weconducted interviews in an open-ended way. Interview frameworkincluded policy, market, technical solution, cost-benefit, businessmodel, obstacle and suggestion.
Indispensably, literature analysis and document review wereused for supportive and referable information inquiry throughoutthe research process.
3. Materials
3.1. Program background and progress in the pilot cities
The energy-efficiency policies promulgated during China's 12thFive-Year-Plan aimd to retrofit 60 million m2 of commercialbuildings by the end of 2015. The retrofit task will reduce energyintensity in ordinary commercial buildings (floor space less than20,000 m2) by 10% and in large-scale commercial buildings (floorspace equal to or more than 20,000 m2) by 15% (MOF and MO-HURD, 2012). To accelerate energy-efficiency improvements andmaximize the energy-saving potential in existing commercialbuildings, the Chinese Government selected four cities which re-present a range of climate zones and other local conditions-Tian-jin, Shenzhen, Chongqing, and Shanghai–to carry out pilot com-mercial-building energy-efficiency retrofit program. The pilotprogram is to support deep retrofits that will maximize energysavings with subsidies. In total, the programs in the four citiesmust finish retrofit of 4 million m2 buildings within two years,improving energy performance by 20%, with a central-governmentfinancial subsidy of 20 CNY5/m2 (Table 1) (MOF and MOHURD,
5 In this paper, 1 U.S. dollar E 6.20 CNY. Besides the 20 CNY/m2 subsidy from
2011).
3.1.1. Background of the four pilot citiesThe four pilot cities are all economically developed with rela-
tively mature market systems, including available human re-sources, financial instruments, and quality building technologies.In recent years, the four pilot cities received financial support fromthe Chinese Central Government to establish commercial buildingenergy consumption monitoring platforms. Those monitoringplatforms are able to collect and analyze real-time energy use dataon buildings’ primary energy-consuming systems. All major ser-vice sector commercial buildings are included in the pilot pro-gram: government office buildings, commercial office buildings,educational facilities (schools and colleges), hospitals, hotels,shopping malls, and mixed-use buildings.
Fig. 3 shows the locations of the four cities carrying out pilotCBEER activities. Tianjin is a coastal city in the cold climate zone inChina where most commercial buildings were built after 1949.Chongqing is located in the hot summer, cold winter climate zone;most of the commercial buildings in Chongqing were also builtafter 1949. Shenzhen, situated in the hot summer, warm winter
Fig. 3. China’s building climate zones and the location of the four cities in thecommercial-building energy-efficiency pilot program.

Table 2Basic information on pilot cities and progress of energy-efficiency efforts.
Program details Tianjin Chongqing Shenzhen Shanghai
1 Location north southwest south east2 Climate zone cold hot summer
cold winterhot summerwarm winter
hot summercold winter
3 Planned retrofitfloor area (mil-lion m2)
5.80 4.44 7.78* 4.00
4 Current percentprogress
64% 78% 60% 58%
5 Energy-savingthreshold
20% 20% 10%* 20%
6 Average energysavings achieved
Z20% Z20% E14%* Z20%
* Shenzhen’s average retrofit energy savings of 14% is less than 20%, in partbecause the buildings there are more recently constructed and already relativelyenergy efficient compared to the buildings in the other three cities. Shenzhentargeted lower energy savings (10%) compared to the targets in the other cities butover floor area of 7.78 million m2, which is almost double the area required by thecentral government and targeted in the other cities. Saving at least 10% over pre-retrofit energy over this floor area in Shenzhen would reduce energy use by anamount equivalent to what would be saved if energy use was reduced by 20% over afloor area of 4.05 million m2.
Table 3Program organizational structure in the four pilot cities.
Tianjin Chongqing Shenzhen Shanghai
Dominant influence onprogress-market vs.government
government market government market
Dominant channel for col-lecting demonstrationprojects
government market market market
Dominant retrofit entity owner EMC EMC EMC
Fig. 4. Demonstration project source.
Fig. 5. Retrofit entity distribution.
Fig. 6. Demonstration projects source and retrofit model distribution.
J. Hou et al. / Energy Policy 88 (2016) 204–215 207
climate zone, is a newly developed city; all of its buildings werebuilt after 1980. Shanghai, in the same climate zone as Chongqing,has a combination of buildings built before 1980 (dating back asfar as the 1930s) and new constructions (Xu et al., 2013).
3.1.2. Progress in the pilot citiesIn June of 2014, the programs in the four pilot cities were still in
the implementation phase, but the fundamental elements of theprograms, such as development of local supportive policies andidentification of demonstration projects had been established,enabling us to assess progress and make recommendations for thefuture.
Each pilot city has selected its demonstration projects as de-scribed in detail in the next section of this paper. Table 2 presentsthe basic information of the pilot cities and the progress of theirCBEER activities.
Thus far, based on the current program status in the four pilotcities, Chongqing is the most successful one in achieving the tar-geted results. Not only the retrofit program in Chongqing has beencarried out with the most rapid speed, but also the commercialbuilding retrofit market has been incentivized and cultivatedsuccessfully. An additional 3 million m2
floor area commercialbuildings are likely to be retrofitted in the near future inChongqing after the pilot program. The other three cities have alsoachieved inspiring results, and their experiences should be com-prehensively studied so that lessons can be learned for im-plementation in other cities in the future.
3.2. Organizational structures and implementation procedures in thepilot cities
Although all four cities use the same central-government policyframework, each city has devised slightly different organizationalstructures and implementation procedures (Table 3, Figs. 4–7).
3.2.1. Program organizational structureThe pilot cities have each developed a management structure
(footnote continued)the central government, local government were asked to develop supportive policyfor the pilot program too.
for retrofit projects as well as technical guidance and reportingprotocols. They have also worked with other government agenciesin carrying out the pilot program. Specific activities have included:
� Setting up and staffing retrofit project management offices incity level.
� Developing institutional support, including local technical
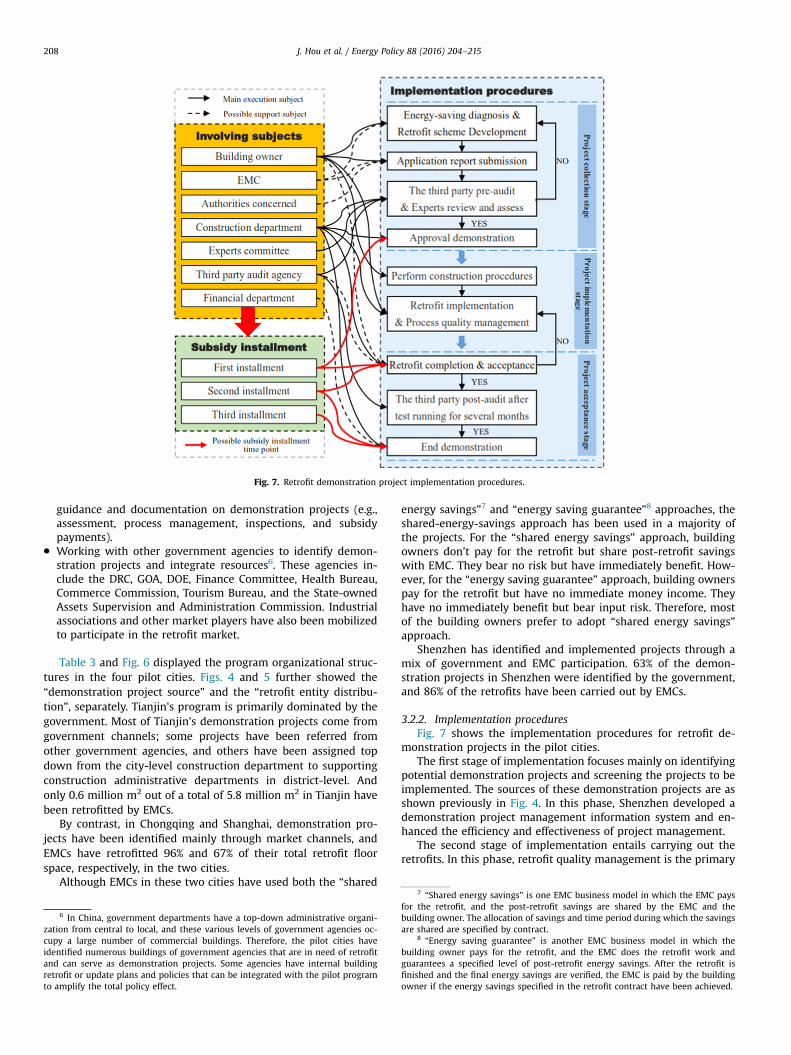
Fig. 7. Retrofit demonstration project implementation procedures.
J. Hou et al. / Energy Policy 88 (2016) 204–215208
guidance and documentation on demonstration projects (e.g.,assessment, process management, inspections, and subsidypayments).
� Working with other government agencies to identify demon-stration projects and integrate resources6. These agencies in-clude the DRC, GOA, DOE, Finance Committee, Health Bureau,Commerce Commission, Tourism Bureau, and the State-ownedAssets Supervision and Administration Commission. Industrialassociations and other market players have also been mobilizedto participate in the retrofit market.
Table 3 and Fig. 6 displayed the program organizational struc-tures in the four pilot cities. Figs. 4 and 5 further showed the“demonstration project source” and the “retrofit entity distribu-tion”, separately. Tianjin's program is primarily dominated by thegovernment. Most of Tianjin's demonstration projects come fromgovernment channels; some projects have been referred fromother government agencies, and others have been assigned topdown from the city-level construction department to supportingconstruction administrative departments in district-level. Andonly 0.6 million m2 out of a total of 5.8 million m2 in Tianjin havebeen retrofitted by EMCs.
By contrast, in Chongqing and Shanghai, demonstration pro-jects have been identified mainly through market channels, andEMCs have retrofitted 96% and 67% of their total retrofit floorspace, respectively, in the two cities.
Although EMCs in these two cities have used both the “shared
6 In China, government departments have a top-down administrative organi-zation from central to local, and these various levels of government agencies oc-cupy a large number of commercial buildings. Therefore, the pilot cities haveidentified numerous buildings of government agencies that are in need of retrofitand can serve as demonstration projects. Some agencies have internal buildingretrofit or update plans and policies that can be integrated with the pilot programto amplify the total policy effect.
energy savings”7 and “energy saving guarantee”8 approaches, theshared-energy-savings approach has been used in a majority ofthe projects. For the “shared energy savings” approach, buildingowners don’t pay for the retrofit but share post-retrofit savingswith EMC. They bear no risk but have immediately benefit. How-ever, for the “energy saving guarantee” approach, building ownerspay for the retrofit but have no immediate money income. Theyhave no immediately benefit but bear input risk. Therefore, mostof the building owners prefer to adopt “shared energy savings”approach.
Shenzhen has identified and implemented projects through amix of government and EMC participation. 63% of the demon-stration projects in Shenzhen were identified by the government,and 86% of the retrofits have been carried out by EMCs.
3.2.2. Implementation proceduresFig. 7 shows the implementation procedures for retrofit de-
monstration projects in the pilot cities.The first stage of implementation focuses mainly on identifying
potential demonstration projects and screening the projects to beimplemented. The sources of these demonstration projects are asshown previously in Fig. 4. In this phase, Shenzhen developed ademonstration project management information system and en-hanced the efficiency and effectiveness of project management.
The second stage of implementation entails carrying out theretrofits. In this phase, retrofit quality management is the primary
7 “Shared energy savings” is one EMC business model in which the EMC paysfor the retrofit, and the post-retrofit savings are shared by the EMC and thebuilding owner. The allocation of savings and time period during which the savingsare shared are specified by contract.
8 “Energy saving guarantee” is another EMC business model in which thebuilding owner pays for the retrofit, and the EMC does the retrofit work andguarantees a specified level of post-retrofit energy savings. After the retrofit isfinished and the final energy savings are verified, the EMC is paid by the buildingowner if the energy savings specified in the retrofit contract have been achieved.

Fig. 8. Relationship between subsidy and energy savings in the four pilot cities.
Fig. 9. Subsidy installments in the four pilot cities.
J. Hou et al. / Energy Policy 88 (2016) 204–215 209
challenge. Both building owners and the local construction agencyare responsible for retrofit quality management. For quality as-surance, EMCs that perform retrofits under the program inChongqing, Tianjin, and Shanghai must register with local gov-ernment agencies. Shenzhen has stricter requirement with stipu-lating specific qualifications for construction enterprises that wishto participate in the program.
The third stage of implementation focuses on inspection andapproval of demonstration projects. Chongqing and Shenzhenhave established a post-retrofit energy audit policy for this phase.The audit periods are 3 months in Chongqing and 1 year inShenzhen. It helps to ensure that retrofits are completed as plan-ned by connecting the last subsidy installment with the post-ret-rofit audit results.
Both of Chongqing and Shenzhen used third-party auditors forM&V of energy savings in retrofitted buildings. Shenzhen selectedthe Shenzhen Institute of Building Research Co. Ltd as its third-party auditor, and Chongqing hired three-third party auditors toensure market competition. And through random cross-verifica-tion among the three auditors, the quality and accuracy of theM&V work in Chongqing can be compared and improved.
The financial agency in each city pays the retrofit subsidy. Toensure retrofit quality and achievement of energy savings, thesubsidy was designed to be paid in two or three installments. Theinstallments are linked to acceptance of the retrofit project intothe pilot program, completion of the retrofit and successful in-spection, and operation of the retrofitted building for a definedperiod with verification of energy savings. We will discuss thisfurther in the following Section 3.3.
3.3. Supportive local-government policies
Supportive local policies are vital to the success of the pilotcities’ demonstration projects. In response to the central
Table 4Subsidy policies in the four pilot cities
Tianjin Chongqing Shenzhen Shanghai
SubsidyTotal local finance matching (mil-lion CNY)
20 80 120 80
Central subsidy : local subsidy 1:0.25 1:1 1:1.5 1:1Energy-saving thresholdDemonstration apply threshold 20% 20% 10% 20%Actual subsidy threshold 20% 10% 10% 20%Total subsidy intensity (CNY/m2)Minimum amount 20 17.5 21 20Maximum amount 20 40 42 80Subsidy installments 3 2 3 2First installment 30% 50% 30% 50%Second installment 30% 50% 50% 50%Third installment 40% 20%
government subsidy of 20 CNY/m2 retrofitted, the four cities eachdeveloped individual incentive policies (Table 4, Figs. 8, 9).
3.3.1. Tianjin
I. In Tianjin, the local government matched the central gov-ernment financing of 20 million CNY in total, which wereused for capacity building, including development of stan-dards and institutions to support the pilot program, and foradministrative expenses. The direct subsidy for the demon-stration retrofit projects only comes from the central gov-ernment fund of 20 CNY/m2 (Fig. 8).
II. No particular incentive policies were formulated in Tianjin to
encourage EMCs to carry out retrofit projects or to enhancethe energy savings. As a result, the market response in Tianjinhas not been very strong. Only 15% of projects had beenidentified through the market channel with retrofits im-plemented by EMCs. The majority of projects–up to 85%–hadcome through the government administration channel, withretrofits carried out by building owners (Figs. 4 and 5).
III. The subsidies in Tianjin are paid in three installments: 30%when a project is approved as a demonstration project, 30%when the retrofit is finished and 40% when the energy sav-ings are verified by a third-party auditor (Table 4, Fig. 9).
3.3.2. ChongqingChongqing's policy linked the subsidy intensity directly to en-
ergy saving rate, and designed to promote EMCs’ participation.
I. The subsidy was designed to give larger incentives to de-monstration projects that pursue greater energy savings, asdescribed by Eqs. (1) and (2) (Fig. 8):
⎧
⎨
⎪⎪⎪⎪
⎩
⎪⎪⎪⎪
subsidy amount
0, when energy saving rate 10%
17.5, when 10%
when energy saving rate 20%
35, when 20%
when energy saving rate 25%
40, when energy saving rate 25% 1
mCNY/ 2
=
<
≤ <
≤ <≥ ( )
( )
Where:
2
when energy saving rate
annual energy consumption before retrofit annual energy consumption after retroannual energy consumption before retrofit ( )
=−
When we surveyed Chongqing's pilot program, 68 retrofitprojects has been completed and passed government

J. Hou et al. / Energy Policy 88 (2016) 204–215210
inspection. Of these, 67 had saved more than 20% over pre-retrofit energy use; the only project that fell below the 20%mark had saved 14%.
II. To encourage adoption of EMC models for retrofit im-plementation, Chongqing designed to allocate subsidies in amanner that benefits owners financially when EMCs carry outretrofits. That is, when an owner carries out a retrofit, theowner pays all of the retrofit cost and receives all of thegovernment subsidy. However, when an EMC carries out aretrofit, the EMC pays all of the retrofit cost and receives 80%of the government subsidy with the remaining 20% given tothe building owner. As a result of this subsidy design, as manyas 96% of demonstration projects in Chongqing were carriedout by EMCs (Fig. 5).
III. The Chongqing subsidy was designed to be paid in two in-stallments of 50% each. The first 50%, 35 CNY/m2, is paid afterthe completed retrofit floor area and energy savings are ver-ified by a third-party auditor. The second 50% is paid after theretrofitted building has operated for at least 3 months (Ta-ble 4, Fig. 9).
The second installment is paid at a tiered rate. There are four tiers.Tier 1 applies when the retrofit energy saving rates are greaterthan 25% compared to pre-retrofit energy use; in this tier, thesubsidy intensity is relatively high, 40 CNY/m2. Tier 2 applieswhen the retrofit’s energy saving rates are between 20% and 25%;this subsidy is 35CNY/m2. The tier 3 subsidy applies when theretrofit's energy saving rates are less than 20% but more than 10%.In this tier, the subsidy is 17.5 CNY/m2. Tier 4 applies when theretrofit's energy saving rates are less than 10%. In this tier, thesecond subsidy installment is zero, and the initial 50% subsidy willbe revoked.
3.3.3. ShenzhenShenzhen is one of the newest cities in China, with most
buildings constructed after 1980. In recent years, a package ofbuilding energy-efficiency measures has been implemented inShenzhen, resulting in baseline commercial-building energy usethat is much more efficient than in other Chinese cities. As a result,achieving the retrofit program's 20% energy-saving target posed agreater challenge in Shenzhen than in the other three pilot cities.
Shenzhen's innovative approach to the program includes set-ting the energy-savings threshold at 10%, which is only half of thethreshold in the other three pilot cities; however Shenzhen tar-geted 7.78 million m2 of floor area for retrofit, much more than inthe other three pilot cities and almost twice the city-level targetrequired by the Central Government. Meeting these targets willresult in a total energy savings in Shenzhen that is the same as inthe other pilot cities (Gong et al., 2014).
Shenzhen's supportive policy was designed as the following:
I. To promote greater energy savings, Shenzhen's subsidy wasdesigned as described in Eqs. (3), (4) and (5):
m msubsidy amount 42 CNY/ retrofit floor area 32 2 α= ( )* ( )* ( )
Where: α is the conversion coefficient of retrofit floor areaand can be calculated as described in Eq. (4):
⎧⎨⎪⎪
⎩⎪⎪
when energy saving rate20%
, when 10%
when energy saving rate 20%
1, when energy saving rate 20% 4
α =≤ <
≥ ( )
Therefore:
⎧
⎨⎪⎪⎪
⎩
⎪⎪⎪
subsidy amount
0, when energy saving rate 10%
21, when energy saving rate 10%
21, 42 , when 10% energy saving rate
20%42, when energy saving rate 20% 5
mCNY/ 2
=
<=
( ) <
<≥ ( )
( )
This design encourages demonstration projects to pursuegreater savings by offering larger subsidy intensity for higherenergy saving rate. To date, all of the demonstrations projectscompleted in Shenzhen have achieved their target energysavings, with an average energy saving rate of 14%. Mostprojects achieved energy saving rate in the range of 10–20%,with proportional subsidies (Fig. 8).
II. With regard to EMC promotion, local government of Shenz-hen required that all government office building demonstra-tion projects be carried out by EMCs. As a result, of the ret-rofits completed in Shenzhen, 86% were implemented byEMCs (this includes both government and non-governmentbuildings) (Fig. 5).
III. Subsidies in Shenzhen are paid in three installments. The firstinstallment of 30% and the second of 50% are paid at similarmilestones as for the first two subsidies in Tianjin. The final20% installment is paid after a retrofit project operates for1 year, and savings are verified by a third-party auditor. Thisinstallment plan makes Shenzhen the most rigorous of thepilot cities in terms of project quality management (Table 4,Fig. 9).
3.3.4. ShanghaiMetered data from the commercial-building real-time energy-
use monitoring system have been used in Shanghai’s pilotprogram.
Shanghai's supportive policy scheme is designed as the fol-lowing (Eq. (6)):
I. To promote greater energy savings, Shanghai's subsidy is asshown in Eq. (5) (Fig. 8). Shanghai compares retrofit projectenergy performance to its local commercial building energy-efficiency standard for new construction (DGJ08-107-2012).Its subsidy can be as much as 80 CNY/m2 when the demon-stration project meets or exceeds the energy efficiencyrequirements of the standard. However, it is difficult to meetthe standard requirements because of the high retrofit costs.No project thus far has met the standard. All of the retrofitprojects have received the 35 CNY/m2 or 40 CNY/m2 subsidyup to now (Zhang and Wang, 2014).
⎧
⎨
⎪⎪⎪⎪
⎩
⎪⎪⎪⎪
subsidy amount
0, when energy saving rate 20%
35, when energy saving rate 20%
and not EMC
40, when energy saving rate 20%
and EMC80,when retrofit according DGJ08-107-2012 6
mCNY/ 2
=
<
≥
≥
( )
( )
II. Shanghai's approach to promote EMC is slightly differentfrom the approaches adopted in Chongqing or Shenzhen. Forprojects that achieve the same level of energy savings, thoseimplemented retrofit by an EMC will receive a subsidy of 40CNY/m2 and those not implemented retrofit by an EMC willreceive 35 CNY/m2 only. As of the date of our site survey, 67%

Fig. 10. Energy-saving potential distribution and retrofit cost.
Fig. 11. Building systems receiving energy-efficiency retrofits in Chongqing.
9 Our calculation and analysis here is based on some initial cost-benefit datacollection and analysis conducted by Chongqing's local MOHURD. They reservedthe right of final explanation.
J. Hou et al. / Energy Policy 88 (2016) 204–215 211
of the demonstration projects completed in Shanghai hadbeen implemented by EMCs (Fig. 5).
III. Shanghai's subsidy is paid in two equal amounts. The first50% is paid after the retrofit application is approved, and thesecond 50% is paid after completion of the retrofit and M&Vby a third party (Table 4, Fig. 9).
3.4. Technical solution and cost-benefits
Fig. 10 shows a general distribution of energy-saving potentialand their retrofit cost from previous researches (Hou et al., 2014).
I. Tier oneImprove energy efficiency up to 5–10% through measures in-
clude energy management measures, operation optimization, andhuman behaviour improvement. Retrofit cost for this tier is low,basically below 50 CNY/m2 in average with a static payback periodof less than 3 years.
II. Tier twoImprove energy efficiency up to 20–30% through building en-
ergy consumption system retrofit in addition to the measures intier one. The building energy consumption systems include light-ing, air-conditioning, power, plug, and domestic hot water (Zhaoet al., 2009). The retrofit costs for these measures are approxi-mately 100–150 CNY/m2 with a static payback period of 3–5 years.
III. Tier threeImprove energy efficiency up to 30–50% through measures of
envelope system in addition to the measures in tier two. The en-velope system basically includes external wall, window, door, androof. The retrofit costs for these measures are approximately 300CNY/m2 with a static payback period of more than 5 years.
In the CBEER pilot program, each pilot city developed slightlydifferent local technical solutions. For example, in Tianjin, retrofitstargeted four primary building elements: envelope, heating sys-tem, central air-conditioning system, and renewable-energy sys-tem. Although technical solutions in the other three pilot citiesaddressed the building envelope and heating system to some de-gree, they focused primarily on lighting, power supply and dis-tribution, and elevators.
In this study, we took Chongqing as an example for quantitativeanalysis its technical solution and cost-benefit. The dataset camefrom 68 demonstration projects which completed retrofit andapproved energy savings (He et al., 2014).
3.4.1. Retrofit technical solutionsFig. 11 shows the building systems that have been retrofitted in
the projects studied in Chongqing. Lighting systems were retro-fitted in 97% of cases, making this the most common retrofit. Thesecond most common retrofit, 84%, was of air conditioning sys-tems. The least-common retrofit was to domestic hot water andenvelope systems because of the technical and economic
challenges associated with retrofitting these building systems.
3.4.2. Cost-benefitsOur investigation of the retrofit projects in the four pilot cities
shows that subsidies (from both central government and localgovernment) cover approximately 20–40% of total retrofit cost inaverage. However, this proportion varies substantially among ci-ties and projects. In Tianjin, for example, building envelope retrofitcosts are approximately 100 to 150 CNY/m2 with a static paybackperiod of more than 10 years. Because of these economics, fewdemonstration projects included building envelope retrofits. Incontrast, the retrofit cost for air conditioning systems is lower, 50CNY/m2, with a static payback period of 3 years. As a result, thepenetration of air-conditioning retrofits is much greater than thatof envelope system retrofits.
68 demonstration projects were used as a database to quanti-tatively assess the impact of government subsidies on the retrofiteconomy and static payback periods for the demonstrationprojects9. Figs. 12 and 13 show the average retrofit cost and theaverage annual savings for building systems in three typicalbuildings in Chongqing (He et al., 2013).
We can see from Fig. 12 that educational buildings have thelowest retrofit cost among the three building types, and shoppingmalls have the highest. The average retrofit cost for a shoppingmall is more than three times that of the cost for a retrofit of aneducational building. When comparing the retrofit costs for dif-ferent building systems, we found that lighting systems in edu-cational buildings have the highest retrofit costs (29.7 CNY/m2)but provide significant post-retrofit savings (2.4 CNY/m2) (Fig. 13).For shopping malls, retrofits of air-conditioning and of powersupply and distribution systems have the two highest costs, andlighting systems provide the highest post-retrofit savings. In officebuildings, the retrofit cost for air-conditioning systems is 44.8CNY/m2, higher than for other systems, and lighting system ret-rofits are the most economical.
These data also allow us to calculate the static payback periodfor retrofits of different building systems as well as the wholebuilding (Fig. 14). Retrofits of power systems in the three types ofbuildings have the shortest payback period, 1.5–3.2 years, andpower supply and distribution system retrofits in shopping mallsand educational buildings have the longest static payback periods,16.6 years and 13.8 years, respectively. In office buildings, air-conditioning system retrofits have the longest payback period,8.3 years.
The whole-building static payback period is 7.6 years for officebuildings, 8.7 years for shopping malls, and 13.7 years for educa-tional buildings. However, when the subsidy is taken into account,the static payback periods are shortened to 4.0 years, 7.4 years, and0.3 years, respectively. Thus, we can see that the subsidy effec-tively reduces the payback period for all three building types. Thereduction is most significant for educational buildings, from 13.7years to 0.3 years. This is strongly correlated with the preferentialutility tariff (e.g., for electricity and natural gas) in educational

Fig. 12. Retrofit cost for five building systems in three typical buildings in Chongqing.
J. Hou et al. / Energy Policy 88 (2016) 204–215212
buildings. Therefore, the economic incentive is greatest for edu-cational buildings, followed by office buildings. Shopping mallshave the smallest incentive. Even so, commercial buildings likemalls still have incentives to undertake retrofits because thesebuildings are not eligible for the same levels of governmentfunding that the government office buildings and public buildingslike schools, hospitals, etc. are eligible to receive.
4. Results and discussions
4.1. Subsidy level (subsidy intensity)
� Subsidy levels affect policy's attraction to motivate relevantmarket players to perform CBEER. Higher subsidy level leads tostronger market response.
� Linking the subsidy level proportionally to energy savings iseffective to encourage CBEER projects to pursue greater energysavings within one-time retrofit.
� Same central-government-subsidy impacts differently in eachpilot city because of variations in local economic conditions andretrofit costs.
4.2. Subsidy installments
� Subsidy paid in several installments is good to retrofit qualitymanagement.
� Critical milestones for subsidy installments include: when theretrofit start (can provide start-up capital for carrying out ret-rofit); when the retrofit is completed and approved (ensure theretrofit is implemented as plan); when the retrofit project hasoperated for defined period with verification of energy savings(guarantee the actual energy savings).
� Installments are not the more the better due to the increase of
Fig. 13. Annual savings from retrofits of five syst
the policy implementation cost. It needs to be designed rea-sonably according to the actual circumstance.
4.3. Subsidy encourage EMC
� Connecting subsidy level or subsidy allocation with EMC ap-plication can vigorously promote market mechanisms.
� Administrative requirements can promote EMC application di-rectly and quickly within government-owned office buildings.
� Difference between Chongqing and Shanghai in policy designfor encouraging EMC leads to differences not only in incentivemechanism but also in government fiscal expenditure. InChongqing’s design, the subsidy rate is the same no matter EMCparticipating or not, but the benefit sharing between the ownerand the EMC differ. However in Shanghai, the subsidy rate dif-fers by 5 CNY/m2 depending on whether an EMC is involved.Therefore, building owners got greater motivation in Chongqingthan Shanghai; and Chongqing’s design saves money for thelocal government.
4.4. Policy strategy adoption
� Combined central government policies with local governmentpolicies
� All of the four pilot cities combined the central governmentpolicy with their local government policies. In this way, thecentral government policy was customized to achieve localimpacts and the local government policies became a goodsupplement and refinement.
� Integrated policies from different government agencies
The pilot cities effectively integrated policy resources from dif-ferent government agencies. As different government agencies inChina always have their own policies about some relevant topics,
ems in three typical buildings in Chongqing.

Fig. 14. Static payback period analysis for retrofits in three types of commercial buildings in Chongqing.
J. Hou et al. / Energy Policy 88 (2016) 204–215 213
for the same time period. For existing commercial building retrofit,besides subsidy policy from MOHURD, other departments likeDRC, GOA, and DOE have their own retrofit or building-updatepolicies as well. These policies have been more or less consideredby pilot cities to integrate resources, amplify incentives, and betterachieve their common goals.
4.5. Technical solution and cost-benefits
� From the perspective of single technical measureLighting system and air-conditioning system are the first andsecond common retrofit; envelope system is the least-commonretrofit. Lighting system has the highest retrofit cost in educa-tional buildings; air-conditioning system has the highest retrofitcost in both shopping malls and office buildings.
� From the perspective of building typeEducational buildings have the lowest retrofit cost but thelongest whole-building static payback period before subsidydue to the preferential utility tariff; shopping malls have thehighest retrofit cost; office buildings have a medium retrofitcost between educational buildings and shopping malls.
� From the perspective of policy effectiveness
The incentive is greatest for educational buildings, followed byoffice buildings, and shopping malls the smallest. Even so, private-owned commercial buildings like shopping malls are very sensi-tive to financial incentives to decrease retrofit cost.
5. Problem and obstacle
5.1. Difficult to organize and coordinate
Firstly, different commercial building types have different en-ergy consumption characteristics and energy efficiency retrofitdemands. It is a complicated system which needs further studyand explore. Secondly, CBEER involves multi-stakeholders, in-cluding property owners, operators, users, property managementcompanies, EMCs, financial institutes, different governmentagencies, etc. Neither the energy conservation rights and obliga-tions of all parties are clear, nor are the interests of these partieseasy to coordinate and unify. Thirdly, retrofit implementationwould cause interference to the normal use of buildings, more orless, especially for private-owned commercial buildings (such asshopping malls, hotels, etc.). This decreases owner’s willingness toretrofit but increases the difficulty in coordination. Last but notleast, relationship between different government regulationsneeds to be further straightened out. For example, besides thefactor of high retrofit incremental cost, strict fire prevention policyfor building envelope system gives constraints to implementbuilding envelope system retrofit, results in a limitation to max-imize the retrofit benefits.
5.2. Imperfect market mechanism
Market mechanisms application in CBEER market is insufficientand imperfect. Firstly, public-service buildings have most in-itiatives to use market business models because the lacking of bothtechnical ability and financial strength. However, the willingnessfor EMCs to conduct retrofit for these buildings is relatively lowbecause of the payback period without subsidy is too long. Sec-ondly, although the willingness for EMCs to conduct retrofit forgovernment-owned office buildings is very high due to the fiscalguaranteed payment ability, there are some institutional obstacleswhich include the inflexible accounting system and the energy-saving-sharing barriers, for these buildings to adopt EMC models.Thirdly, the other commercial building owners have very limitedinformation or knowledge to select a capable EMC or develop asuitable business model when they want to perform the retrofitthrough EMCs. Fourthly, when using EMC model to perform theretrofit, the negotiation period is very long because the substantialdivergence of opinions about capital efficiency, income shareproportion, contract period, and the energy savings verification,between the owners and the EMCs. Fifthly, building owners andEMCs do not trust each other enough. Sixthly, EMCs are still hardto obtain loan from financial institutes like banks and the loanthreshold is always too high for them. Furthermore, EMCs’ capa-city is not enough to perform comprehensive retrofit in a integrateway, but the substandard competition among EMCs is quite gen-eral and retrofit quality varies, etc.
5.3. Hard to assess the energy savings
It is challenging to quantify operation-related energy savingspotential (Azar and Menassa, 2014). The retrofit energy savings arehard to assess and verify either. On the one hand, commercialbuilding energy use is closely related to the factors of climateconditions, energy-use habits and human behaviour, operationand management, etc. These factors are critical but hard to controlor measure to impartially calculate the energy savings get from theretrofit. This indirectly influences the application of the EMCmodels. On the other hand, since there are no uniform nationalenergy-efficiency verification technical standards or guidelines forCBEER projects, energy savings assessments in different projects ordifferent places conducted by different third party auditors are notcomparable.
5.4. Other barriers
There are several other barriers for the Chinese CBEER. Firstly,government-owned buildings have no enough energy efficiencyretrofit initiatives because their energy expenditure are totallypaid with government fiscal and energy savings cannot be sharedby staff. Secondly, building retrofit quality is hard to control be-cause the CBEER quality management system has not been con-structed yet. Thirdly, the lack of sufficiency, transparency and

J. Hou et al. / Energy Policy 88 (2016) 204–215214
availability of relevant information and data influence CBEERmarket a lot.
6. Conclusions and policy implications
The pilot program has achieved its initial purposes in identi-fying the market characteristic, technical solution, and cost bene-fits of Chinese CBEER. All of the valuable experiences get from thisprogram should be learned for better implementing CBEER in thefuture.
First of all, as policy maker, government should take availablemeasures to maximize both the efficiency and effectiveness ofpolicies with limited budget. Drivers for different commercialbuildings to improve their energy efficiency are different. Policymakers should choose the most appropriate way and policy toolsto achieve more energy savings, for instance, applying adminis-trative policy to government-owned office buildings, fiscal subsidyto private-owned commercial buildings and a combination ofthese two to public buildings such as schools. Besides applyingpolicy tools appropriately and flexibly, strategies including com-bining central government policies with local government policies,integrating policies from different government agencies should becomprehensively used in the future.
Next, with regard to the subsidy policy design, the governmentshould craft policies taking into account not only the local eco-nomic conditions and local fiscal capacity but also local commer-cial building energy-efficiency baseline and energy saving poten-tial, and linking subsidy level to the real energy savings. Further-more, policy design should always take sustainable market culti-vation into consideration. It’s necessary and helpful to have gov-ernment support at the beginning of CBEER, but market-orientedand market-based mechanisms are more sustainable in the longrun. Therefore, policies should serve the purpose of sustainablemarket cultivation, including contributing to creation and main-tenance of a healthy market environment, establishment of op-eration rules and performing of supervision responsibilities.
Thirdly, with regard to the technical solutions, measures likeenergy management, operation optimization, human behaviourimprovement, lighting system retrofit, and air conditioning systemretrofit could be done without subsidy. However, envelope systemneeds incentive policy to improve its retrofit economy. In addition,comprehensive retrofit solutions, which integrate multi energyuse systems should be incentive to maximum retrofit savings andminimum retrofit cost. Integrate retrofit technical solutions fordifferent commercial building types located in different climatezones should be preliminarily developed as soon as possible bygovernment.
Fourthly, with regard to business models, CBEER market has ahuge space and prospect for business model application and in-novation. Besides private-owned commercial buildings, public-service buildings like schools will still need subsidies in the nearfuture to shorten its payback period to attract EMCs, and govern-ment-owned buildings need to overcome the institutional ob-stacles by revising its energy expenditure accounting system andenergy-saving-sharing limitation to make business models moreapplicable.
Fifthly, to better overcome the interrelated and interacted ob-stacles and barriers, different government agencies should worktogether and enhance coordination. Relevant laws, regulations,standards, and guidelines should be refined or developed. Socialcredit system should be built gradually.
Chinese CBEER market potential is huge. The coming 10–15years is an important opportunity for Chinese commercial buildingsector to improve its entire energy efficiency. Chinese governmentshould draw up a plan or a roadmap and implement step by step
to realize energy conservation and emission reduction.
Acknowledgments
This work was supported by the National Natural ScienceFoundation of China, and the Ministry of Housing and Urban-RuralDevelopment under Contracts No. 71173011 and No. 10401020908,respectively. The authors express their gratitude for the support ofthe China Scholarship Council, File No. 201407090017. Further-more, the authors express sincere appreciation to the governmentofficials and industry experts from both MOHURD and the fourpilot cities for their help and contributions during the investiga-tion for this report.
References
Azar, E., Menassa, C.C., 2014. A comprehensive framework to quantify energy sav-ings potential from improved operations of commercial building stocks. EnergyPolicy 67, 459–472.
BECRC (Building Energy Conservation Research Center, Tsinghua University), 2014.Annual Report on the Development of Building Energy Saving in China 2014.Building Energy Research Center, Beijing, China.
BP Group, 2010. BP statistical review of world energy.CGPRC (Central Government of People's Republic of China), 2007. Regulations on
Reinforcing Energy-efficiency for Public Institutions and Large-sized Commer-cial Buildings. ⟨http://www.gov.cn/zwgk/2007-10/29/content_788896.htm⟩
(accessed 26.09.15).CGPRC (Central Government of People's Republic of China), 2014. China's New
Urbanization Plan (2014–2020). ⟨http://www.gov.cn/zhengce/2014-03/16/content_2640075.htm⟩ (accessed 26.09.15).
EIA (Energy Information Administration), 2010. International Energy Outlook,World Energy Demand and Economic Outlook. Energy Information Adminis-tration. Department of Energy.
Feng, W., Huang, K., Levine, M., Zhou, N., Zhang, S., 2014. Evaluation of EnergySavings of the New Chinese Commercial Building Energy Standard, the Amer-ican Council for An Energy-Efficient Economy (ACEEE) 2014 Summer Study onEnergy Efficiency. The American Council for an Energy-Efficient Economy,Pacific Grove, CA.
Gong, C., Wang, Y., Tang, Z., Luo, C., Liu, Q., 2014. Progress of energy-efficiencyworks in pilot city Shenzhen. Constr. Sci. Technol. 10, 51–54.
He, D., Dong, M., Huang, Y., Ding, Y., 2013. Analysis on energy saving reconstructionefficiency of typical public buildings in Chongqing. Chongqing Architecture, vol.6, pp. 45–48.
He, D., Huang, Y., Ding, Y., 2014. Systematically Analysis and Study on TechnicalMeasures of Energy Savings for Typical Public Buildings in Chongqing Journal ofChongqing University of Science and Technology (Natural Sciences Edition),Vol. 16, pp. 112–116.
Hong, T., 2009. A close look at the China design standard for energy efficiency ofpublic buildings. Energy Build 41, 426–435.
Hong, T., Li, C., Yan, D., 2015a. Updates to the China design standard for energyefficiency in public buildings. Energy Policy 87, 187–198.
Hong, T., Chen, Y., Lee, S.H., et al., 2015b. Commercial building energy saver: anenergy retrofit analysis toolkit. Appl. Energy 159, 298–309.
Hou, J., Wu, Y., Liu, Y., 2014. Research on the Marketization ways of Existing PublicBuildings’ Energy Efficiency Retrofit. 6. Urban Development Studies, China, pp.1–6.
Jiang, Y., Huang, Z., Wei, Q., 2010. Energy management in large public buildings andenergy-saving diagnosis technique. Constr. Sci. Technol. 22, 20–23.
Lee, S.H., Hong, T., Piette, M.A., et al., 2015a. Energy retrofit analysis toolkits forcommercial buildings: a review. Energy 89, 1087–1100.
Lee, S.H., Hong, T., Piette, M.A., et al., 2015b. Accelerating the energy retrofit ofcommercial buildings using a database of energy efficiency performance. En-ergy, Available online 22.08.15.
Li, J., Shui, B., 2015. A comprehensive analysis of building energy efficiency policiesin China: status quo and development perspective. J. Clean. Prod. 90, 326–344.
Liu, H., 2012. Research on Incentive Policy for Energy Efficiency Reconstruction inLarge Public Buildings. Chongqing University,, China.
MOC (Ministry of Construction, China), 1993. Energy Conservation Design Standardon Building Envelope and Air Conditioning for Tourist Hotels. China Archi-tecture and Building Press, Beijing.
MOF (Ministry of Finance, China), MOHURD (Ministry of Housing and Urban-RuralDevelopment), 2011. Guidance for Further Promoting Building Energy Effi-ciency in Public Buildings. ⟨http://www.gov.cn/zwgk/2011-05/11/content_1861716.htm⟩ (accessed 03.10.15).
MOF (Ministry of Finance, China), MOHURD (Ministry of Housing and Urban-RuralDevelopment), 2012. The 12th Five-Year-Plan of China Building Energy Effi-ciency Plan.
NBS (National Bureau of Statistics, China), 2013. China Statistical Yearbook 2013.

J. Hou et al. / Energy Policy 88 (2016) 204–215 215
China National Bureau of Statistics.Peng, C., Wang, L., Zhang, X., 2014. DeST-based dynamic simulation and energy
efficiency retrofit analysis of commercial buildings in the hot summer/coldwinter zone of China: A case in Nanjing. Energy Build. 78, 123–131.
Xing, J., Ren, P., Ling, J., 2015. Analysis of energy efficiency retrofit scheme for hotelbuildings using eQuest software: a case study from Tianjin, China. Energy Build.87, 14–24.
Xu, P., Huang, J., Shen, P., et al., 2013. Commercial building energy use in six cities in
Southern China. Energy Policy 53, 76–89.Xu, Q., Zhuang, Z., Zhang, B., Jiang, Y., 2012. Shanghai Large-Sized Public Building
Energy Use Quota Research. Constr. Sci. Technol. 10, 28–31.Zhang, D., Wang, J., 2014. Effectively promote energy-saving retrofit works of ex-
isting public buildings in Shanghai. Constr. Sci. Technol. 10, 41–43.Zhao, J., Zhu, N., Wu, Y., 2009. The analysis of energy consumption of a commercial
building in Tianjin, China. Energy Policy 37, 2092–2097.