The SuperCOSMOS Sky Survey. Paper I: Introduction and Description
18
arXiv:astro-ph/0108286v1 17 Aug 2001 Mon. Not. R. Astron. Soc. 000, 000–000 (0000) Printed 1 February 2008 (MN L A T E X style file v1.4) The SuperCOSMOS Sky Survey. Paper I: Introduction and Description N.C. Hambly 1 , H.T. MacGillivray 1 , M.A. Read 1 , S.B. Tritton 1 , E.B. Thomson 1 , B.D. Kelly 2 , D.H. Morgan 3 R.E. Smith 3 , S.P. Driver 4 , J. Williamson 1 , Q.A. Parker 1 , M.R.S. Hawkins 1 , P.M. Williams 1 , A. Lawrence 3 1 Wide Field Astronomy Unit, Institute for Astronomy, University of Edinburgh, Blackford Hill, Edinburgh, EH9 3HJ 2 UK ATC, Royal Observatory, Blackford Hill, Edinburgh, EH9 3HJ 3 Institute for Astronomy, University of Edinburgh, Blackford Hill, Edinburgh, EH9 3HJ 4 School of Physics and Astronomy, University of St. Andrews, North Haugh, St. Andrews, Fife, KY16 9SS Accepted —. Received —; in original form — ABSTRACT In this, the first in a series of three papers concerning the SuperCOSMOS Sky Survey (SSS), we give an introduction and user guide to the survey programme. We briefly describe other wide–field surveys and compare with our own. We give examples of the data, and make a comparison of the accuracies of the various image parameters available with those from the other surveys providing similar data; we show that the SSS database and interface offer advantages over these surveys. Some science applications of the data are also described and some limitations discussed. The series of three papers constitutes a comprehensive description and user guide for the SSS. Key words: astronomical databases: miscellaneous – catalogues – surveys – stars: general – galaxies: general – cosmology: observations 1 INTRODUCTION This is the first paper in a series of three concerning the SuperCOSMOS Sky Survey (hereafter SSS) programme ⋆ . This ambitious project aims to digitise the sky in three colours (BRI), one colour (R) at two epochs, via automatic scans of sky atlas photographs. The source photographic material comes from Schmidt telescopes, observations be- ing taken during the second half of the twentieth century (see later). Ultimately we aim to digitise the entire sky, but due to the time required to do so data are being ‘released’ to the community as they become available. The first re- lease of data consisted of 5000 square degrees of the south- ern sky at high Galactic latitude (|b| > 60 ◦ ). This became known as the South Galactic Cap (hereafter SGC) survey. All three papers in this series make reference to data from the SGC survey, but are generally relevant to the SSS as a whole. This paper (Paper I) is intended as a general intro- duction and user guide to the SSS. Paper II (Hambly, Irwin & MacGillivray 2001a) describes image detection, param- eterisation, classification and photometry while Paper III (Hambly et al. 2001b) is concerned with astrometry. These latter two papers contain much technical information about the SSS. This paper summarises that information and com- ⋆ database available online at http://www-wfau.roe.ac.uk/sss pares with similar data from other survey programmes. We also describe how to access the data and give examples of results from the SSS. Astronomical photography, which revolutionised as- tronomy in the late nineteenth and early twentieth cen- turies, has a history almost as long as that of photography itself (Lankford 1984 and references therein). Digitised pho- tographic sky surveys revolutionised astronomy in the late twentieth century; their evolution over the last few decades has been dictated by developments in microdensitometry and digital electronics (e.g. Klingsmith 1984; MacGillivray & Thomson 1992). Of course, in the modern era the sky is being digitised directly, bypassing photography altogether. This brings many advantages, not the least of which are the ability to survey faster, deeper and at wavelengths other than the optical – e.g. the Sloan Digital Sky Survey (SDSS, York et al. 2000) and the Two–Micron All–Sky Survey (2MASS, Kleinmann et al. 1994). However, it must be em- phasised that for time–dependent phenomena for example (e.g. object position and brightness) photographic sky at- lases represent a vast archive of invaluable measurements for billions of objects. This has been suitably demonstrated recently by the addition of Astrographic Catalogue measure- ments of the Carte du Ciel plates to Tycho positions from the Hipparcos mission (Urban, Corbin & Wycoff 1998; Høg et al. 2000 and references therein). This juxtaposition of c 0000 RAS
Transcript of The SuperCOSMOS Sky Survey. Paper I: Introduction and Description

arX
iv:a
stro
-ph/
0108
286v
1 1
7 A
ug 2
001
Mon. Not. R. Astron. Soc. 000, 000–000 (0000) Printed 1 February 2008 (MN LATEX style file v1.4)
The SuperCOSMOS Sky Survey. Paper I:
Introduction and Description
N.C. Hambly1, H.T. MacGillivray1, M.A. Read1, S.B. Tritton1, E.B. Thomson1,
B.D. Kelly2, D.H. Morgan3 R.E. Smith3, S.P. Driver4, J. Williamson1,
Q.A. Parker1, M.R.S. Hawkins1, P.M. Williams1, A. Lawrence3
1Wide Field Astronomy Unit, Institute for Astronomy, University of Edinburgh, Blackford Hill, Edinburgh, EH9 3HJ2UK ATC, Royal Observatory, Blackford Hill, Edinburgh, EH9 3HJ3Institute for Astronomy, University of Edinburgh, Blackford Hill, Edinburgh, EH9 3HJ4School of Physics and Astronomy, University of St. Andrews, North Haugh, St. Andrews, Fife, KY16 9SS
Accepted —. Received —; in original form —
ABSTRACTIn this, the first in a series of three papers concerning the SuperCOSMOS Sky Survey(SSS), we give an introduction and user guide to the survey programme. We brieflydescribe other wide–field surveys and compare with our own. We give examples ofthe data, and make a comparison of the accuracies of the various image parametersavailable with those from the other surveys providing similar data; we show thatthe SSS database and interface offer advantages over these surveys. Some scienceapplications of the data are also described and some limitations discussed. The seriesof three papers constitutes a comprehensive description and user guide for the SSS.
Key words: astronomical databases: miscellaneous – catalogues – surveys – stars:general – galaxies: general – cosmology: observations
1 INTRODUCTION
This is the first paper in a series of three concerning theSuperCOSMOS Sky Survey (hereafter SSS) programme⋆.This ambitious project aims to digitise the sky in threecolours (BRI), one colour (R) at two epochs, via automaticscans of sky atlas photographs. The source photographicmaterial comes from Schmidt telescopes, observations be-ing taken during the second half of the twentieth century(see later). Ultimately we aim to digitise the entire sky, butdue to the time required to do so data are being ‘released’to the community as they become available. The first re-lease of data consisted of 5000 square degrees of the south-ern sky at high Galactic latitude (|b| > 60). This becameknown as the South Galactic Cap (hereafter SGC) survey.All three papers in this series make reference to data fromthe SGC survey, but are generally relevant to the SSS as awhole. This paper (Paper I) is intended as a general intro-duction and user guide to the SSS. Paper II (Hambly, Irwin& MacGillivray 2001a) describes image detection, param-eterisation, classification and photometry while Paper III
(Hambly et al. 2001b) is concerned with astrometry. Theselatter two papers contain much technical information aboutthe SSS. This paper summarises that information and com-
⋆ database available online at http://www-wfau.roe.ac.uk/sss
pares with similar data from other survey programmes. Wealso describe how to access the data and give examples ofresults from the SSS.
Astronomical photography, which revolutionised as-tronomy in the late nineteenth and early twentieth cen-turies, has a history almost as long as that of photographyitself (Lankford 1984 and references therein). Digitised pho-tographic sky surveys revolutionised astronomy in the latetwentieth century; their evolution over the last few decadeshas been dictated by developments in microdensitometryand digital electronics (e.g. Klingsmith 1984; MacGillivray& Thomson 1992). Of course, in the modern era the sky isbeing digitised directly, bypassing photography altogether.This brings many advantages, not the least of which arethe ability to survey faster, deeper and at wavelengths otherthan the optical – e.g. the Sloan Digital Sky Survey (SDSS,York et al. 2000) and the Two–Micron All–Sky Survey(2MASS, Kleinmann et al. 1994). However, it must be em-phasised that for time–dependent phenomena for example(e.g. object position and brightness) photographic sky at-lases represent a vast archive of invaluable measurementsfor billions of objects. This has been suitably demonstratedrecently by the addition of Astrographic Catalogue measure-ments of the Carte du Ciel plates to Tycho positions fromthe Hipparcos mission (Urban, Corbin & Wycoff 1998; Høget al. 2000 and references therein). This juxtaposition of
c© 0000 RAS

2 N.C. Hambly et al.
century–old photographic astrometry with a state–of–the–art space–based mission has yielded stellar proper motionson an unprecedented scale: millions of objects have propermotions measured to a precision of 2.5 mas yr−1.
It was the development of the Schmidt telescope in the1930s that revolutionised wide–angle photographic surveys(e.g. Cannon 1995). Along with developments in fast pho-tographic emulsions, these enabled sky atlas production tofaint limiting magnitudes. The 1.2m Palomar Oschin, 1.0mESO and 1.2m UK Schmidt Telescopes have been systemati-cally photographing the whole sky over the last half–century.Photographs have been taken in the blue, red and near–infrared passbands, with both blue and red passbands hav-ing observations at two epochs per field. For a concise sum-mary of these photographic survey programmes, see Mor-gan (1995). Given the vast numbers (> 10, 000) of plates inthese sky atlases, it is clear that it is only through digitisa-tion that these surveys can be fully exploited.
There are several major digitisation programmes com-pleted or currently in progress. These projects consist ofscanning various subsets of the available sky survey atlasphotographs (in some cases glass or film copies of the orig-inal Schmidt photographs) and release of various data tothe community. The scope of the various projects and theiremphasis is different in each case. We now consider each inturn:
1.1 APM (Cambridge, UK)
The Automatic Plate Measuring (APM) machine is a‘flying–spot’ microdensitometer with pixel size of 7.5µm(or 0.5 arcsec at the Schmidt plate scale of ∼ 67 arc-sec mm−1). For details concerning the APM hardware, seeKibblewhite et al. (1984); more information is also availableat http://www.ast.cam.ac.uk/~mike/casu/apm/apm.html.The APM facility has produced the APM Northern Sky Cat-alogue (Irwin & McMahon 1992) which is based on scansof the first epoch Palomar (POSS–I) O and E glass copyatlases and covers the northern sky down to Galactic lat-itudes |b| ≥ 20. This programme is currently being ex-tended into the southern hemisphere using the SERC–J/EJand SERC–ER/AAO–R surveys. The APM sky cataloguesprovide paired lists of blue and red objects with morpholog-ical parameters and image classification. Currently, they donot include pixel data, object proper motions or any infor-mation in the near–infrared. For more details, see the webpages accessed via the above URL.
1.2 APS (Minneapolis, USA)
The Automated Plate Scanner (APS) machine is de-scribed by Pennington et al. (1993) and is similar in de-sign to the APM. This machine is also undertaking ascanning programme based on the POSS–I glass copies,but supplemented by the corresponding second epoch redplates obtained for the Luyten proper motion surveys(e.g. Luyten 1979 and references therein) and ultimatelyPOSS–II. All 664 POSS–I fields having Galactic latitude|b| > 20 have been included. The APS object cataloguedatabase (see http://aps.umn.edu/) is similar in contentto that of the APM; proper motions will additionally be
available in the future. Also, restricted numbers of plateshave thresholded pixel data available online (the pixel sizeof the APS scans is 0.8 arcsec). These thresholded imageshave all sky areas set to zero intensity. Once again, no near–infrared data are available. For more information concerningthe APS database, see Cornuelle et al. (1997).
1.3 COSMOS (Edinburgh, UK)
The COSMOS machine (e.g. MacGillivray & Stobie 1984),also a ‘flying–spot’ microdensitometer, was a development ofthe original GALAXY plate measuring machines (e.g. Mur-ray & Nicholson 1975). COSMOS ceased operation in late1993 and has now been superseded by SuperCOSMOS (seeSection 1.6). The older machine had pixel size 1.1 arcsecand undertook a single colour (BJ) survey of the south-ern sky using the SERC–J/EJ atlas glass copies and UKSchmidt ‘short’ red (SR) originals at low Galactic latitude.The resulting database, the COSMOS/UKST Catalogue ofthe Southern Sky, included all fields at or south of the equa-tor and having Galactic latitude |b| > 10 (J) or |b| < 10
(SR). For more details, see Yentis et al. (1992) and alsoDrinkwater, Barnes & Ellison (1995); an online databaseis available at http://xip.nrl.navy.mil/. The object cat-alogue contains position, morphological, photometric andclassification information for each object in one colour (BJ
or R depending on Galactic latitude). No pixel data, propermotions or near–infrared data are available.
1.4 DSS (Baltimore, USA)
Probably the greatest in scope of all the digitisation pro-grammes is the Digitised Sky Survey at the Space TelescopeScience Institute (Lasker 1992). This project was originallyset up to provide guide stars for use with the Hubble SpaceTelescope (Jenker, Russell & Lasker 1988). Two modifiedPDS machines (known as Guide Star Automatic MeasuringMAchines, or GAMMAs) were constructed for the purposeof scanning the photographic material, and the first genera-tion scanning programme was implemented with 1.7 arcsecpixels. The surveys scanned consisted of the SERC–J/EJ,the POSS–I E and short exposure plates for fields havinglow Galactic latitude. The original Guide Star Catalogue(GSC–I, e.g. Lasker et al. 1990; Russell et al. 1990; Jenkeret al. 1990) has since proven to be a major astronomicalresource, far beyond its original goal of supporting HSToperations. In addition, it was quickly realised that therewas a large demand for the pixel data from the GSC–Iscans, and the DSS has also become a major astronomi-cal resource (for more information and online database ac-cess, see http://archive.stsci.edu/dss/). The volume ofraw pixel data in the DSS–I necessitated the use of im-age compression techniques in order to make distributionpossible (see Section 3.1.1). The second generation survey(DSS–II) is now nearly complete. This includes modifiedscanning hardware (the major change from DSS–I is thatthe pixel size is now 1 arcsec) and the addition of multi-ple colours and epochs from the POSS–II material in thenorthern hemisphere, and SERC–I/SERC–ER/AAO–R ma-terial in the south. A number of survey databases are inproduction. The second generation Guide Star Catalogue
c© 0000 RAS, MNRAS 000, 000–000

SuperCOSMOS Sky Survey I: Introduction & Description 3
(GSC–II) is under construction (McLean et al. 1997) andwill include BRI colours as well as proper motion informa-tion, for all objects down to m ∼ 18. This catalogue is en-visaged as being important for supporting various ground–and space–based instruments (e.g. Lasker et al. 1995). Com-pressed pixel data in the R band are being made availableonline at the above URL to supplement that available fromDSS–I. Moreover, the Palomar–STScI Digital Sky Survey(DPOSS) is a project to archive and analyse the raw pixeldata in each of the three colours (BRI) to the plate limitsin every POSS–II survey field (e.g. Weir 1995 and referencestherein; Djorgovski et al. 1997). Once complete, the three–colour northern sky catalogue is expected to be released tothe astronomical community.
1.5 PMM (Flagstaff, USA)
The Precision Measuring Machine (PMM) programme is op-erated at the United States Naval Observatory (USNO).The PMM uses CCD detectors to image (with 0.9 arcsecpixels) large regions of pairs of photographs simultaneouslyand very quickly; the machine and programme have beendesigned primarily with astrometric applications in mind.In addition to the CD–ROM stellar object catalogue prod-ucts (containing paired lists of objects between blue andred plates with position and colour information only) –e.g. USNO–A1.0 (Canzian 1997), now superseded by USNO–A2.0 (Monet 1998) – the project now provides ‘near–line’access to all the raw pixel data from the plate scans (seehttp://www.nofs.navy.mil/data/FchPix/cfra.html). Fu-ture products will include updated CD–ROM sets with ob-ject lists containing galaxies as well as stars, morphologicalinformation and proper motion data (e.g. USNO–B)
1.6 SuperCOSMOS (Edinburgh, UK)
The SuperCOSMOS machine is operated at Edinburgh andis the successor to COSMOS. SuperCOSMOS is a fast, highprecision plate scanning facility with 0.67 arcsec pixels, 15–bit digitisation and accurate positional capability (e.g. seeMiller et al. 1992 and Hambly et al. 1998). The origins of thesurvey programme (SSS) can be traced back several years(e.g. Hawkins 1992), and the SSS is the subject of this seriesof papers. Online database access and much additional in-formation is available at http://www-wfau.roe.ac.uk/sss.In setting up the SSS programme, our intention has been tocombine the best features of all of the above programmesto produce a versatile and easily used survey product withobject parameter accuracy limited, as far as possible, by thesource photographic material.
The above provides a very brief introduction to the enor-mous subject of digitised photographic sky surveys. Formuch more information, the reader is referred to con-ference proceedings by Capaccioli (1984), MacGillivray &Thomson (1992), MacGillivray et al. (1994), Chapman etal. (1995) and McLean et al. (1997a). For a general intro-duction to the subject of digitised sky surveys from Schmidtplates in particular, see Lasker (1995) and references therein.
2 DESCRIPTION
2.1 Summary of photographic material
For a complete description of the UK/ESO/PalomarSchmidt photographic atlases, see Morgan (1995) and ref-erences therein. In Table 1 we show the surveys which cur-rently comprise the southern hemisphere SSS; in addition weshow the corresponding northern hemisphere surveys thatmay be scanned. Note that, in some cases, glass or film copieshave been scanned as opposed to glass originals; note alsothat some fields have a recent non–atlas plate or glass copyplate of the original atlas plate substituted where the orig-inal was unmeasurable (e.g. because of severe degradationdue to ‘microspots’ – see Morgan 1995). All of the scanningprogrammes listed in Section 1 have made use of copy mate-rial for some areas/passbands. Although no rigorous quan-titative assessment has been done, it is generally thoughtthat the use of copy material is not significantly detrimen-tal to the accuracy of the scanned data. The system of fieldnumbers used by the UK and ESO Schmidt telescopes is de-scribed in Tritton (1983) and consists of uniformly–spacedfield centres at a 5 pitch with ∼ 0.5 overlap at all bound-aries (for the UK Schmidt plates); this survey system was re-flected into the northern hemisphere and adopted for the sec-ond epoch Palomar Sky Survey (POSS–II). The first epochPalomar Sky Survey (POSS–I) used 6 field spacing on adifferent grid (see Minkowski & Abell 1963) resulting in lit-tle overlap between each field. A description of the scanningprocedure used to digitise the photographic material is givenin Paper II and references therein.
2.2 Database organisation and access
SSS data are available in the form of pixel images and/or ob-ject catalogues. Figure 1 gives a schematic illustration of theuser interface, summarising the main features. The databaseorganisation and modes of access are quite general, and allowspecification of the colour of interest for image queries, andequivalently the ‘master’ colour (or colour of most interest)for object catalogue queries. Object catalogue informationfrom other colours for the same objects/areas is given forboth image and object catalogue queries. The concept of auser–specified master (or reference) colour allows an objectcatalogue query aimed at studying blue objects, for exam-ple, to specify the bluest plates in the collection as the dataof most interest. In this way, objects not appearing on theredder plates will not be rejected if they are detected on theblue plates only. Presently, complete lists of objects appear-ing in all colours are not generated, although it will of coursebe possible to do this once the photography and scanning arecomplete. For a ‘cookbook’–style introduction to access andbrowsing, the reader is referred to Hambly & Read (2000).
2.2.1 Image data
Each digitised Schmidt plate produces ∼ 2 Gbyte of 10 µm(∼ 0.7 arcsec) pixel data (Paper II). A full–sky survey inthree colours, one colour at two epochs results in > 10 Tbyteof raw pixel data. In order to be able to store the pixel dataand the associated multi–parameter object catalogues on-line for fast access, we have employed the H–compress algo-
c© 0000 RAS, MNRAS 000, 000–000
4 N.C. Hambly et al.
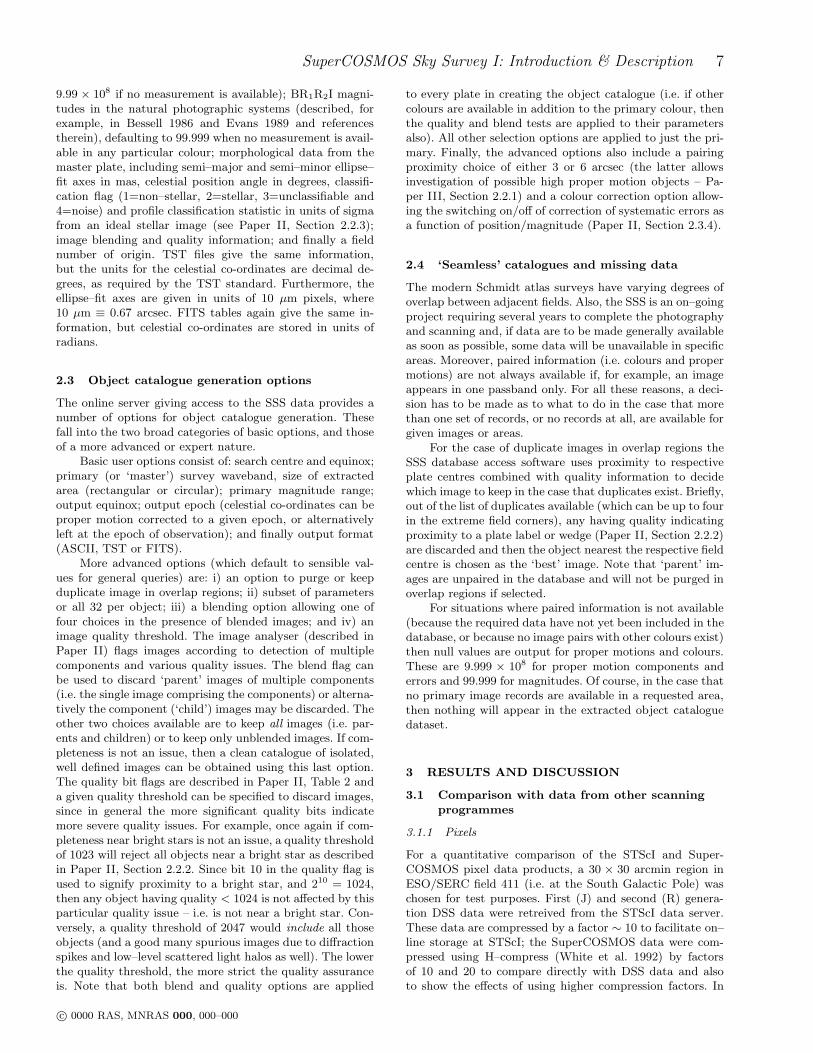
Survey Dec Plate Dates of Referencecentres limit observation
Southern hemisphere survey:
SERC–J/EJ1 δ ≤ 0 BJ ∼ 23 1974 to 1994 Cannon (1984)SERC–ER/AAO–R2 δ ≤ 0 R ∼ 22 1984 to 2000 Cannon (1984); Morgan et al. (1992)SERC–I δ ≤ 0 I ∼ 19 1978 −→ Hartley & Dawe (1981)ESO–R3 δ ≤ −20 R ∼ 22 1978 to 1990 West (1984)POSS–I E3 −18 ≤ δ ≤ 0 R ∼ 20 1949 to 1958 Minkowski & Abell (1963)
Putative northern hemisphere survey:
POSS–II B3 δ ≥ 0 BJ ∼ 22.5 1987 to 1999 Reid et al. (1991)POSS–II R3 δ ≥ 0 R ∼ 20.8 1987 to 1999 Reid et al. (1991)POSS–II I4 δ ≥ 0 I ∼ 19.5 1989 −→ Reid et al. (1991)POSS–I E3 δ ≥ 0 R ∼ 20 1949 to 1958 Minkowski & Abell (1963)
Notes:1Original glass survey plates scanned with the exception of the following 6 fields: 31, 102, 167, 330, 555,575 (replacement glass originals).2Original glass survey plates scanned with the exception of the following 32 field numbers: 52, 54, 111, 114, 119,244, 296, 298, 355, 412, 413, 472, 473, 476, 483, 540, 541, 549, 550, 611, 619, 632, 679, 686, 691, 758, 760,765, 828, 831, 837, 838 (film originals).3Glass atlas copies of survey glass originals.4Film atlas copies of survey glass originals.
Table 1. Photographic atlases comprising the SSS (after Morgan 1995); note that, at the time of writing, the I–band surveys are togetherincomplete at a total of ∼60 fields.
rithm developed at STScI (White et al. 1992) to compressthe pixel data by a factor ∼ 20. Note that SSS object cata-logue data are derived from the raw pixel data before theseare archived to tape for offline storage; however White etal. (1992) demonstrate the effect of image compression onastrometric and photometric performance. Furthermore, inFigure 3 (see Section 3.1 later) we show how image detec-tion performs relative to uncompressed data as a functionof compression factor to show quantitatively the effects ofusing H–compress. Clearly, there is no loss in ‘depth’ as mea-sured by this test even for the relatively high compressionfactor of ×20.
Pixel data extracted from the SSS database are cur-rently provided in density units (Paper II, Equation 1) ar-bitrarily scaled to maximise use of the range of 16–bit inte-gers per pixel. No photometric calibration is provided withthe images since the dynamic range of the data are image–morphology dependent, and generally limited to around afactor ∼ 2.1 in density (e.g. Hambly et al. 1998) which cor-responds to a factor of ∼ 10 in incident intensity; howeverapproximate relative intensities for pixel values are given byI ∝ 100.4D where the exponent 0.4 takes into account thespecularity of the SuperCOSMOS imaging optics.
Each image extracted from the database is outputin standard Flexible Image Transport System format (seehttp://heasarc.gsfc.nasa.gov/docs/heasarc/fits.html)with comprehensive FITS header information giving detailsof the source photographic material, measurement and as-trometric calibration. Additionally, FITS World Co-ordinateSystem keywords describing the local astrometry are in-cluded (see Paper III).
Each image extracted from the database also comeswith an associated object catalogue so that the image data
can be examined in conjunction with the detected sources inthat area (e.g. by using GAIA/SkyCAT, Draper 1999). Twoobject lists are attached as binary table extensions to theimage. The first table consists of the ‘most useful’ subset ofall the image parameters available from the field/colour inquestion along with proper motion and colour informationfrom other colours of the same field; the second table givesthe remainder of the full 32 parameters set for each imagefrom the plate of the specified colour. The equinox of theco-ordinates in object catalogues associated with images isalways J2000.0 while the epoch is always that of the platefrom which the positions are derived (as given in the FITSimage header).
Presently, images up to 30 arcmin in size can be ex-tracted online. Given an input position, the access softwaredetermines from which field the best image can be obtained(taking into account field overlaps and proximity to respec-tive field centres).
2.2.2 Object catalogues
Image detection and parameterisation are described in Pa-per II. Each individual plate’s pixel dataset has a raw objectcatalogue associated with it; each detected image has 32 pa-rameters describing such quantities as position, brightness,morphology and image class. Photometric calibration is de-scribed in Paper II while astrometric calibration is describedin Paper III. Object catalogue formats currently supportedin the SSS are ASCII (i.e. plain text, the most human–readable format), the so–called tab–separated table (TST,Davenhall 2000 and references therein) and FITS binary ta-ble extensions. Paper II gives details of the internal storageunits for object catalogue data (Table 1, Section 2.1.4). At
c© 0000 RAS, MNRAS 000, 000–000

SuperCOSMOS Sky Survey I: Introduction & Description 5
Image query results page:
FITSimage(gzipped) catalogue
objectTST Info
forbrowsing
Batch image query resultspage:
http://www-wfau.roe.ac.uk/sss
Catalogue query results page:
Batch catalogue query resultspage
Cataloguelist
Finderchart
Guide tothe data
BatchSingleBatch Single
Query parameters, eg:
RA(s) & Dec(s) Equinox Image size, or catalogue area Survey/waveband: SERC-J/EJ SERC-ER/AAO-R SERC-I ESO-R POSS-I E
FITS images& TST cats(tar files)
Image chartplots (gzippostscript)
Cataloguelists intar file
Finder charts (gzippostscript)
Introduction Release history
Documentation Current sky coverage
Get an image Get a catalogue
SuperCOSMOS Sky Survey
Figure 1. Schematic diagram illustrating the user interface to the SSS database.
access time, data are translated into more conventional unitsdepending on which type of output file is being written. Notethat for the TST and FITS formats, browsers and manip-ulation software may translate units internally for displaypurposes (for example, SSS FITS binary tables use double–precision floating point numbers in units of radians for ce-
lestial co-ordinates, and these will often be translated intosexagesimal for display).
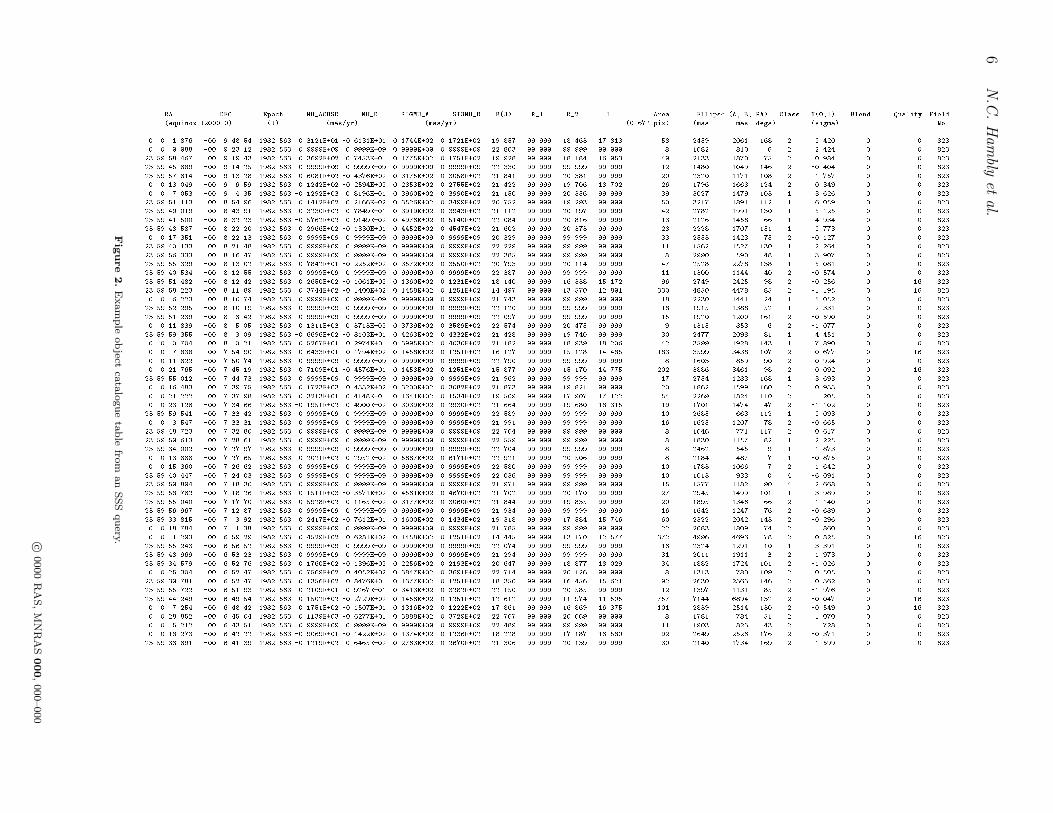
ASCII format object catalogues (e.g. Figure 2) consistof object lists with sexagesimal celestial co-ordinates at theequinox/epoch specified by the user; proper motion mea-sures and error estimates in units of mas yr−1 (defaulting to
c© 0000 RAS, MNRAS 000, 000–000
6N
.C.H
am
blyet
al.
RA DEC Epoch MU_ACOSD MU_D SIGMU_A SIGMU_D B(J) R_1 R_2 I Area Ellipse (A, B, PA) Class N(0,1) Blend Quality Field(equinox J2000.0) (J) (mas/yr) (mas/yr) (0.67" pix) (mas mas degs) (sigma) No.0 0 1.876 -00 9 48.54 1982.563 0.3121E+01 -0.6131E+01 0.1744E+02 0.1721E+02 19.857 99.999 18.463 17.813 58 2459 2061 168 2 2.420 0 0 8230 0 9.988 -00 9 23.12 1982.563 0.9999E+09 0.9999E+09 0.9999E+09 0.9999E+09 22.803 99.999 99.999 99.999 8 1682 810 6 2 2.424 0 0 82323 59 58.467 -00 9 19.43 1982.563 0.3692E+02 0.7453E+01 0.1775E+02 0.1751E+02 19.928 99.999 18.184 16.953 49 2133 1870 75 2 -0.984 0 0 82323 59 45.689 -00 9 14.25 1982.563 0.9999E+09 0.9999E+09 0.9999E+09 0.9999E+09 22.330 99.999 99.999 99.999 12 1480 1049 146 2 -0.404 0 0 82323 59 57.614 -00 9 13.28 1982.563 0.6081E+02 -0.4376E+02 0.3175E+02 0.3058E+02 21.841 99.999 20.381 99.999 20 2320 1171 108 2 1.757 0 0 8230 0 13.049 -00 9 6.59 1982.563 0.1242E+02 -0.2594E+02 0.2853E+02 0.2755E+02 21.422 99.999 19.706 18.702 26 1796 1668 124 2 0.349 0 0 8230 0 7.053 -00 9 4.35 1982.563 -0.1292E+03 0.8196E+01 0.3960E+02 0.3990E+02 21.150 99.999 20.356 99.999 39 3027 1479 103 1 3.626 0 0 82323 59 51.113 -00 8 54.96 1982.563 0.1412E+02 0.2166E+02 0.3526E+02 0.3499E+02 20.752 99.999 19.293 99.999 50 3217 1891 112 1 6.059 0 0 82323 59 49.019 -00 8 43.91 1982.563 0.3230E+02 0.7849E+01 0.3919E+02 0.3943E+02 21.112 99.999 20.197 99.999 42 2782 1991 130 1 5.125 0 0 82323 59 41.500 -00 8 32.23 1982.563 -0.5762E+02 0.9149E+02 0.4976E+02 0.5140E+02 22.084 99.999 20.816 99.999 13 2126 1458 66 1 4.934 0 0 82323 59 48.587 -00 8 22.20 1982.563 0.2966E+02 -0.1330E+01 0.4452E+02 0.4547E+02 21.602 99.999 20.373 99.999 28 2228 1707 151 1 2.773 0 0 8230 0 17.351 -00 8 22.13 1982.563 0.9999E+09 0.9999E+09 0.9999E+09 0.9999E+09 20.329 99.999 99.999 99.999 33 2553 1423 75 2 -0.127 0 0 82323 59 40.133 -00 8 21.48 1982.563 0.9999E+09 0.9999E+09 0.9999E+09 0.9999E+09 22.229 99.999 99.999 99.999 11 1562 1527 130 1 2.264 0 0 82323 59 56.333 -00 8 16.47 1982.563 0.9999E+09 0.9999E+09 0.9999E+09 0.9999E+09 22.385 99.999 99.999 99.999 8 2990 590 48 1 3.907 0 0 82323 59 55.329 -00 8 13.02 1982.563 0.7842E+01 -0.2252E+02 0.3572E+02 0.3550E+02 20.793 99.999 20.114 99.999 47 2528 2278 138 1 5.081 0 0 82323 59 40.534 -00 8 12.55 1982.563 0.9999E+09 0.9999E+09 0.9999E+09 0.9999E+09 22.387 99.999 99.999 99.999 11 1300 1144 40 2 -0.574 0 0 82323 59 51.482 -00 8 12.42 1982.563 0.2650E+02 -0.1061E+02 0.1360E+02 0.1231E+02 18.140 99.999 16.338 15.172 96 2749 2425 98 2 -0.256 0 16 82323 59 58.223 -00 8 11.89 1982.563 0.3744E+02 -0.1400E+02 0.1458E+02 0.1251E+02 14.497 99.999 13.570 12.891 330 4850 4478 85 2 -1.195 0 16 8230 0 6.223 -00 8 10.74 1982.563 0.9999E+09 0.9999E+09 0.9999E+09 0.9999E+09 21.743 99.999 99.999 99.999 18 2230 1441 24 1 5.052 0 0 82323 59 52.295 -00 8 10.19 1982.563 0.9999E+09 0.9999E+09 0.9999E+09 0.9999E+09 22.120 99.999 99.999 99.999 18 1915 1388 52 1 2.331 0 0 82323 59 51.239 -00 8 6.42 1982.563 0.9999E+09 0.9999E+09 0.9999E+09 0.9999E+09 22.097 99.999 99.999 99.999 15 1920 1200 161 2 -0.590 0 0 8230 0 11.839 -00 8 5.05 1982.563 0.1311E+03 0.3713E+02 0.3739E+02 0.3589E+02 22.574 99.999 20.475 99.999 9 1315 853 6 2 -1.077 0 0 82323 59 59.355 -00 8 3.09 1982.563 -0.6696E+02 -0.8103E+01 0.4263E+02 0.4332E+02 21.428 99.999 19.740 99.999 30 2477 2098 81 1 4.451 0 0 8230 0 0.704 -00 8 0.21 1982.563 -0.5267E+01 -0.2974E+01 0.3995E+02 0.4030E+02 21.182 99.999 18.939 18.206 42 3599 1928 143 1 7.890 0 0 8230 0 7.838 -00 7 54.90 1982.563 -0.6433E+01 -0.1794E+02 0.1458E+02 0.1251E+02 16.127 99.999 15.128 14.485 183 3599 3438 107 2 -0.677 0 16 8230 0 11.822 -00 7 50.74 1982.563 0.9999E+09 0.9999E+09 0.9999E+09 0.9999E+09 22.790 99.999 99.999 99.999 8 1603 859 90 2 0.924 0 0 8230 0 21.765 -00 7 45.19 1982.563 0.7109E+01 -0.4576E+01 0.1458E+02 0.1251E+02 15.877 99.999 15.170 14.775 202 3886 3461 98 2 0.092 0 16 82323 59 55.012 -00 7 44.73 1982.563 0.9999E+09 0.9999E+09 0.9999E+09 0.9999E+09 21.962 99.999 99.999 99.999 17 2754 1283 168 1 3.693 0 0 8230 0 16.483 -00 7 39.75 1982.563 -0.1723E+03 -0.4332E+02 0.3200E+02 0.3082E+02 21.873 99.999 19.821 99.999 20 1862 1599 160 2 0.933 0 0 8230 0 21.222 -00 7 37.98 1982.563 0.3213E+01 0.4148E+01 0.1641E+02 0.1534E+02 19.509 99.999 17.907 17.122 54 2269 1824 110 2 -1.205 0 0 8230 0 23.126 -00 7 34.66 1982.563 -0.1951E+02 0.4900E+02 0.3039E+02 0.2930E+02 21.664 99.999 19.680 18.315 19 1701 1474 47 2 -1.102 0 0 82323 59 59.541 -00 7 33.42 1982.563 0.9999E+09 0.9999E+09 0.9999E+09 0.9999E+09 22.589 99.999 99.999 99.999 10 2685 663 112 1 2.093 0 0 8230 0 3.547 -00 7 33.31 1982.563 0.9999E+09 0.9999E+09 0.9999E+09 0.9999E+09 21.991 99.999 99.999 99.999 16 1625 1207 78 2 -0.665 0 0 82323 59 48.723 -00 7 32.80 1982.563 0.9999E+09 0.9999E+09 0.9999E+09 0.9999E+09 22.764 99.999 99.999 99.999 8 1646 771 117 2 0.617 0 0 82323 59 59.613 -00 7 28.61 1982.563 0.9999E+09 0.9999E+09 0.9999E+09 0.9999E+09 22.559 99.999 99.999 99.999 8 1830 1157 82 1 2.225 0 0 82323 59 34.002 -00 7 27.97 1982.563 0.9999E+09 0.9999E+09 0.9999E+09 0.9999E+09 22.704 99.999 99.999 99.999 8 2462 545 9 1 1.873 0 0 8230 0 13.888 -00 7 27.65 1982.563 0.2021E+02 0.2952E+02 0.5887E+02 0.6171E+02 22.921 99.999 20.506 99.999 8 2184 487 7 1 -0.875 0 0 8230 0 15.360 -00 7 26.62 1982.563 0.9999E+09 0.9999E+09 0.9999E+09 0.9999E+09 22.580 99.999 99.999 99.999 10 1783 1066 7 2 1.642 0 0 82323 59 40.447 -00 7 24.03 1982.563 0.9999E+09 0.9999E+09 0.9999E+09 0.9999E+09 22.036 99.999 99.999 99.999 10 1013 933 0 4 -6.091 0 0 82323 59 59.894 -00 7 18.30 1982.563 0.9999E+09 0.9999E+09 0.9999E+09 0.9999E+09 21.971 99.999 99.999 99.999 15 1577 1182 90 4 -2.668 0 0 82323 59 58.762 -00 7 18.26 1982.563 0.1511E+03 -0.3571E+02 0.4561E+02 0.4670E+02 21.702 99.999 20.170 99.999 27 2945 1499 101 1 3.989 0 0 82323 59 55.040 -00 7 17.70 1982.563 0.5928E+02 0.1165E+02 0.3177E+02 0.3060E+02 21.844 99.999 19.835 99.999 20 1895 1346 66 2 1.140 0 0 82323 59 56.967 -00 7 12.87 1982.563 0.9999E+09 0.9999E+09 0.9999E+09 0.9999E+09 21.934 99.999 99.999 99.999 16 1642 1247 76 2 -0.689 0 0 82323 59 33.815 -00 7 3.92 1982.563 0.2417E+02 -0.7612E+01 0.1600E+02 0.1434E+02 19.318 99.999 17.584 15.746 60 2322 2042 143 2 -0.296 0 0 8230 0 18.784 -00 7 1.38 1982.563 0.9999E+09 0.9999E+09 0.9999E+09 0.9999E+09 21.785 99.999 99.999 99.999 22 2083 1809 74 2 1.860 0 0 8230 0 1.293 -00 6 59.29 1982.563 -0.4529E+02 -0.6281E+02 0.1458E+02 0.1251E+02 14.445 99.999 13.170 12.577 372 4996 4696 78 2 0.825 0 16 82323 59 55.243 -00 6 56.52 1982.563 0.9999E+09 0.9999E+09 0.9999E+09 0.9999E+09 22.074 99.999 99.999 99.999 16 2324 1291 10 1 3.391 0 0 82323 59 48.969 -00 6 53.23 1982.563 0.9999E+09 0.9999E+09 0.9999E+09 0.9999E+09 21.294 99.999 99.999 99.999 31 2011 1911 3 2 1.973 0 0 82323 59 34.579 -00 6 52.76 1982.563 0.1760E+02 -0.1396E+02 0.2256E+02 0.2193E+02 20.647 99.999 18.877 18.029 34 1882 1724 101 2 -1.026 0 0 8230 0 25.304 -00 6 52.47 1982.563 -0.7569E+02 -0.4052E+02 0.3847E+02 0.3691E+02 22.714 99.999 20.126 99.999 8 1313 780 109 2 -0.505 0 0 82323 59 39.781 -00 6 52.47 1982.563 0.1356E+02 -0.8476E+01 0.1377E+02 0.1251E+02 18.350 99.999 16.456 15.621 92 2630 2363 146 2 -0.362 0 0 82323 59 55.722 -00 6 51.93 1982.563 0.2109E+01 0.9267E+01 0.3413E+02 0.3282E+02 22.150 99.999 20.585 99.999 12 1397 1131 85 2 -1.976 0 0 82323 59 44.249 -00 6 49.54 1982.563 0.1502E+02 -0.2729E+02 0.1458E+02 0.1251E+02 12.612 99.999 11.974 11.505 757 7144 6894 132 2 -0.047 0 16 8230 0 7.254 -00 6 48.42 1982.563 0.1751E+02 -0.1507E+01 0.1316E+02 0.1222E+02 17.861 99.999 16.869 16.375 101 2839 2514 130 2 -0.549 0 16 8230 0 28.852 -00 6 45.04 1982.563 0.1139E+03 -0.6277E+01 0.3888E+02 0.3729E+02 22.767 99.999 20.669 99.999 8 1781 784 51 2 1.070 0 0 8230 0 5.212 -00 6 43.51 1982.563 0.9999E+09 0.9999E+09 0.9999E+09 0.9999E+09 22.489 99.999 99.999 99.999 11 1903 823 43 2 1.728 0 0 8230 0 18.273 -00 6 42.22 1982.563 -0.9069E+01 -0.1422E+02 0.1374E+02 0.1236E+02 18.228 99.999 17.187 16.580 92 2649 2526 176 2 -0.371 0 0 82323 59 38.691 -00 6 41.39 1982.563 -0.1219E+02 0.6465E+02 0.2763E+02 0.2670E+02 21.306 99.999 20.139 99.999 30 2140 1734 169 2 1.599 0 0 823
Fig
ure
2.E
xam
ple
object
cata
logue
table
from
an
SSS
query.c©
0000
RA
S,M
NR
AS
000,000–000
SuperCOSMOS Sky Survey I: Introduction & Description 7
9.99 × 10⁸ if no measurement is available); BR1R2I magni-tudes in the natural photographic systems (described, forexample, in Bessell 1986 and Evans 1989 and referencestherein), defaulting to 99.999 when no measurement is avail-able in any particular colour; morphological data from themaster plate, including semi–major and semi–minor ellipse–fit axes in mas, celestial position angle in degrees, classifi-cation flag (1=non–stellar, 2=stellar, 3=unclassifiable and4=noise) and profile classification statistic in units of sigmafrom an ideal stellar image (see Paper II, Section 2.2.3);image blending and quality information; and finally a fieldnumber of origin. TST files give the same information,but the units for the celestial co-ordinates are decimal de-grees, as required by the TST standard. Furthermore, theellipse–fit axes are given in units of 10 µm pixels, where10 µm ≡ 0.67 arcsec. FITS tables again give the same in-formation, but celestial co-ordinates are stored in units ofradians.
2.3 Object catalogue generation options
The online server giving access to the SSS data provides anumber of options for object catalogue generation. Thesefall into the two broad categories of basic options, and thoseof a more advanced or expert nature.
Basic user options consist of: search centre and equinox;primary (or ‘master’) survey waveband, size of extractedarea (rectangular or circular); primary magnitude range;output equinox; output epoch (celestial co-ordinates can beproper motion corrected to a given epoch, or alternativelyleft at the epoch of observation); and finally output format(ASCII, TST or FITS).
More advanced options (which default to sensible val-ues for general queries) are: i) an option to purge or keepduplicate image in overlap regions; ii) subset of parametersor all 32 per object; iii) a blending option allowing one offour choices in the presence of blended images; and iv) animage quality threshold. The image analyser (described inPaper II) flags images according to detection of multiplecomponents and various quality issues. The blend flag canbe used to discard ‘parent’ images of multiple components(i.e. the single image comprising the components) or alterna-tively the component (‘child’) images may be discarded. Theother two choices available are to keep all images (i.e. par-ents and children) or to keep only unblended images. If com-pleteness is not an issue, then a clean catalogue of isolated,well defined images can be obtained using this last option.The quality bit flags are described in Paper II, Table 2 anda given quality threshold can be specified to discard images,since in general the more significant quality bits indicatemore severe quality issues. For example, once again if com-pleteness near bright stars is not an issue, a quality thresholdof 1023 will reject all objects near a bright star as describedin Paper II, Section 2.2.2. Since bit 10 in the quality flag isused to signify proximity to a bright star, and 210 = 1024,then any object having quality < 1024 is not affected by thisparticular quality issue – i.e. is not near a bright star. Con-versely, a quality threshold of 2047 would include all thoseobjects (and a good many spurious images due to diffractionspikes and low–level scattered light halos as well). The lowerthe quality threshold, the more strict the quality assuranceis. Note that both blend and quality options are applied
to every plate in creating the object catalogue (i.e. if othercolours are available in addition to the primary colour, thenthe quality and blend tests are applied to their parametersalso). All other selection options are applied to just the pri-mary. Finally, the advanced options also include a pairingproximity choice of either 3 or 6 arcsec (the latter allowsinvestigation of possible high proper motion objects – Pa-per III, Section 2.2.1) and a colour correction option allow-ing the switching on/off of correction of systematic errors asa function of position/magnitude (Paper II, Section 2.3.4).
2.4 ‘Seamless’ catalogues and missing data
The modern Schmidt atlas surveys have varying degrees ofoverlap between adjacent fields. Also, the SSS is an on–goingproject requiring several years to complete the photographyand scanning and, if data are to be made generally availableas soon as possible, some data will be unavailable in specificareas. Moreover, paired information (i.e. colours and propermotions) are not always available if, for example, an imageappears in one passband only. For all these reasons, a deci-sion has to be made as to what to do in the case that morethan one set of records, or no records at all, are available forgiven images or areas.
For the case of duplicate images in overlap regions theSSS database access software uses proximity to respectiveplate centres combined with quality information to decidewhich image to keep in the case that duplicates exist. Briefly,out of the list of duplicates available (which can be up to fourin the extreme field corners), any having quality indicatingproximity to a plate label or wedge (Paper II, Section 2.2.2)are discarded and then the object nearest the respective fieldcentre is chosen as the ‘best’ image. Note that ‘parent’ im-ages are unpaired in the database and will not be purged inoverlap regions if selected.
For situations where paired information is not available(because the required data have not yet been included in thedatabase, or because no image pairs with other colours exist)then null values are output for proper motions and colours.These are 9.999 × 10⁸ for proper motion components anderrors and 99.999 for magnitudes. Of course, in the case thatno primary image records are available in a requested area,then nothing will appear in the extracted object cataloguedataset.
3 RESULTS AND DISCUSSION
3.1 Comparison with data from other scanningprogrammes
3.1.1 Pixels
For a quantitative comparison of the STScI and Super-COSMOS pixel data products, a 30 × 30 arcmin region inESO/SERC field 411 (i.e. at the South Galactic Pole) waschosen for test purposes. First (J) and second (R) genera-tion DSS data were retreived from the STScI data server.These data are compressed by a factor ∼ 10 to facilitate on–line storage at STScI; the SuperCOSMOS data were com-pressed using H–compress (White et al. 1992) by factorsof 10 and 20 to compare directly with DSS data and alsoto show the effects of using higher compression factors. In
c© 0000 RAS, MNRAS 000, 000–000

8 N.C. Hambly et al.
order to assess quantitatively and objectively the informa-tion content of the images, the data were run through PISA(Draper & Eaton 1999) which is an isophotal pixel analy-sis package similar to the COSMOS image analyser (Beard,MacGillivray & Thanisch 1990) that both ROE and STScIuse to generate object catalogues (note of course that bothgroups provide object catalogues derived from uncompresseddata; running decompressed images through object detec-tion software is done here for illustrative purposes only).The data were thresholded (in density space) at 2.3σ abovethe mean sky level (Paper II, Section 2.1.4) and a minimumof 6 pixels was required to define an image in all cases. Notethat this minimum pixel area cut was kept the same for thetests despite the fact that the STScI data have larger pixelsizes (25µm and 15µm for first and second generation datarespectively), since reducing the cut for the coarser sampleddata to an area equivalent to that of the higher resolutionSuperCOSMOS data results in large numbers of spuriousnoise images being detected — it is fair to say that the factthat the SuperCOSMOS data has higher spatial resolutionallows fainter detection limits, and this should be reflectedin any test.
Figure 3 shows the results of the image detection testswhen compared against a CCD image of the same field whichreaches much fainter limits than the photographs. From theplots, it can be seen immediately that the SuperCOSMOSpixel data are superior (in this test, they reach ∼ 1 magdeeper) than the DSS–I data, while the DSS–II and Su-perCOSMOS data are broadly similar. Interestingly (andcounter–intuitively), the image detection is deeper for highercompression factors. This has been noted before (e.g. Whiteet al. 1992) and can be understood in terms of the compres-sion algorithm smoothing the background which results in alower detection threshold when computing nσ.
3.1.2 Astrometry
In Paper III, we demonstrate the external accuracy ofthe SSS data for |b| ≥ 30 using the test described byDeutsch (1999) based on standard positions from the In-ternational Celestial Reference Frame (ICRF) sources listedin Ma et al. (1998). Table 2 summarises the results fromDeutsch (1999) along with similar results from Paper III. Inthe Table, the columns < ∆α >, < ∆δ > give the averageoffsets of the survey data from the ICRF sources; N is thenumber of sources used while ∆α, ∆δ and ∆R are estimatesof the scatter in the distributions in RA, Dec and radially(see Deutsch 1999 for more details).
Comparing figures in Table 2, the SSS data are as goodas, or better than, all the other survey data. It should per-haps be emphasised that a mixture of reference catalogueshave been used to astrometrically reduce the survey datasetsused in Table 2 – e.g. Tycho–2 for APM and SSS data (Pa-per III); Tycho–AC for USNO–A2.0. Nonetheless, at thetime of writing, these data were the best available.
Direct comparison of proper motion errors between thevarious surveys described in Section 1 was not possible at thetime of writing due to the unavailability of the GSC–II andUSNO–B catalogues. SSS proper motions are determinedto be typically accurate to ∼ 10 mas yr−1 in an absolutesense at m ∼ 18 (e.g. Paper III). GSC–II proper motions areexpected to be accurate to better than 4 mas yr−1 (McLean
et al. 1997b); however it remains to be seen whether thisis possible in the southern hemisphere, and whether it isa true absolute error (i.e. including any zeropoint errors) ormerely a relative error under the most favourable conditions.As yet, there is no indication as to proper motion accuracyfor USNO–B.
3.1.3 Photometry
Comparisons of catalogue photometry are even less clearthan those for astrometric parameters. The absolute accu-racy of photographic photometry will always be limited byposition– and magnitude–dependent errors (Paper II); how-ever as we have shown in the same paper, colours can beadjusted to remove such systematic errors from indices suchas (BJ − R) or (R − I). Once again, it is as yet unclearwhether such procedures will be used for many of the othersurveys detailed in Section 1. In broad terms, GSC–II pho-tometry is predicted to be accurate to 0.1–0.2 mag whereasGSC–I was only good to 0.4 mag (McLean et al. 1997b);an idea of the accuracy of colours for DPOSS may be ob-tained from Kennefick et al. (1995) – e.g. their Figures 1compared with Paper II, Figure 10. SSS data are accuratein an absolute sense to σB,R,I ∼ 0.3 (Paper II). However wenote that SSS colours (e.g. BJ − R) are much more precise:σB−R ∼ 0.07 mag at BJ ∼ 17 rising to σB−R ∼ 0.16 magat BJ ∼ 20. Colour indices are not susceptible to system-atic errors (which dominate the single–passband precisionof 0.3 mag) due to the calibration procedure described inPaper II, Section 2.3.4. The USNO catalogues are primarilyfor astrometric purposes, so a comparison of their photo-metric properties is inappropriate.
3.2 Science examples using SSS data
Applications of the SSS data are many and varied, rang-ing from the small–scale (e.g. finding–chart generation, sec-ondary astrometric standards for deep images from other in-struments/wavebands) through intermediate angular scales(e.g. statistical studies of the clustering properties of galaxiesover degree scales) to the widest areas (e.g. statistical stud-ies of the properties of galaxies averaged over large fractionsof the whole sky).
Examples of small–scale applications of SSS data in-clude optical identification of sources and registration ofimages from different wavebands (e.g. Galama et al. 1998;Jonker et al. 2000; Stairs et al. 2001). Degree–scale exam-ples include identification of stellar samples from photom-etry (e.g. Preibisch & Zinnecker 1999) and the use of sur-vey plate astrometry to provide a precise astrometric ref-erence frame for fibre spectroscopy, for example open clus-ter work in IC 2391 (Barrado–y–Navascues et al. 2001) andNGC 2547 (Jeffries et al. 2000). In the remainder of thisSection, we discuss some results from wide–angle studiesemploying SSS data.
3.2.1 Intrinsic alignments of galaxies at low redshift
The SGC subset of the SSS data has been used to attemptto detect the large scale structure of the universe via distor-tions in the shapes of background galaxies caused by gravita-
c© 0000 RAS, MNRAS 000, 000–000

SuperCOSMOS Sky Survey I: Introduction & Description 9
Figure 3. Number–magnitude histograms for (a) DSS–I, and (b) DSS–II with corresponding SuperCOSMOS data compared againstdeep CCD data in the SGP.
Database < ∆α > < ∆δ > N ∆α ∆δ ∆R Note(arcseconds) (arcseconds)
SSS (J) −0.05 −0.04 110 0.12 0.12 0.17 1SSS (R) −0.09 +0.07 103 0.14 0.23 0.27 1
USNO–A2.0 +0.04 +0.04 283 0.17 0.18 0.26 2DSS–II(+1,−1) −0.26 +0.07 235 0.63 0.52 0.85 3
DSS–I −0.08 +0.03 274 0.53 0.48 0.75A2.0→DSS–I +0.02 +0.03 104 0.18 0.19 0.32 4A2.0→DSS–II +0.04 +0.13 108 0.21 0.26 0.35 4APM (UKST) −0.06 +0.06 126 0.18 0.22 0.28 5APM (POSS–I) −0.05 +0.05 231 0.27 0.31 0.41 5
Notes:1: SSS data from Paper III
2: USNO–A2.0 are the average of positions from J & R plates3: results allowing for a 1 pixel offset in DSS–II image WCS (see Deutsch 1999)4: results from using USNO–A2.0 to rereduce astrometry for DSS images5: data from http://www.ast.cam.ac.uk/∼mike/apmcat
Table 2. Empirical uncertainty estimates in survey astrometry relative to the ICRF (after Deutsch 1999; see also Paper III).
tional lensing by the intervening mass distribution. It turnsout that the variance of galaxy ellipticities, σ2
e over some an-gular scale is a measure of this ‘cosmic shear’ effect over thesame scale assuming that the background galaxies are ini-tially randomly orientated (e.g. Kaiser 2000 and references
therein). If this is not the case and there is some intrinsicpreferential alignment of the background galaxies, then σ2
e
will give an estimate of the size of this intrinsic alignment.Brown et al. (2001) have shown that, for a magnitude cutof BJ < 20.5 corresponding to a median galaxy redshift of
c© 0000 RAS, MNRAS 000, 000–000
10 N.C. Hambly et al.
z ≈ 0.1, the galaxy ellipticities exhibit a non–zero correla-tion over scales between 1 and 100 arcmin. The variance ofmean galaxy ellipticities is ∼ 10−2 at scales of ∼ 10 arcminand falls rapidly to ∼ 10−4 at scales of > 30 arcmin. Becauseof the low median redshift of the galaxies in the sample andthe size of the signal it is concluded that the intrinsic align-ment of galaxies has been measured, rather than the ‘weak’lensing signal due to dark matter.
3.2.2 A survey for candidate Halo cool white dwarfs
Recently, there has been renewed interest in the possibilitythat a significant fraction of the Galactic Halo dark mattermay be in the form of cool, ancient Halo white dwarfs (eg.Hodgkin et al. 2000; Ibata et al. 2000 and references therein).Wide–field, multi–epoch Schmidt data are ideal for search-ing for such objects, since they should have large intrinsicspace motions and therefore large proper motions. The SGCsubset of the SSS data have been analysed for high propermotion stars using the B and two R epochs to provide aclean, three–epoch sample with quantifiable completeness(see Hambly 2001 for more details). Follow–up spectroscopyon a large sample of objects subluminous in reduced propermotion has uncovered a significant number of new cool whitedwarfs; a preliminary analysis indicates that the contribu-tion to the ‘standard’ dark matter Halo from these objectsis at least ∼ 2% (Oppenheimer et al. 2001).
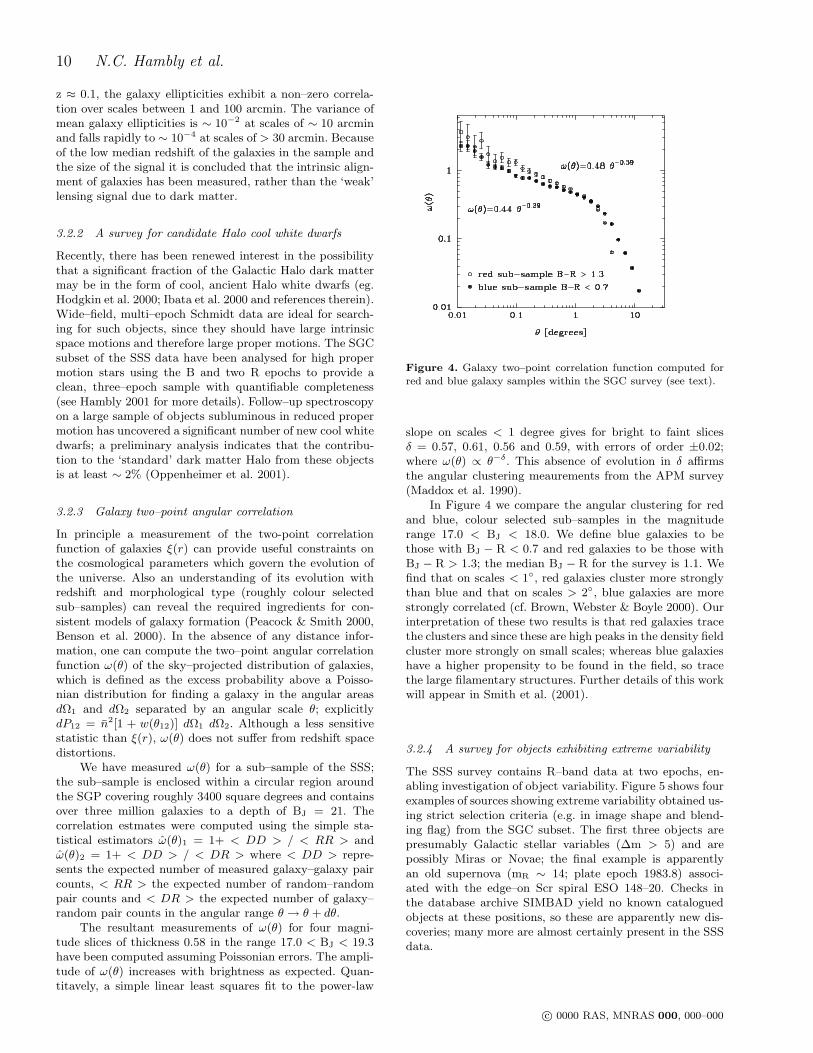
3.2.3 Galaxy two–point angular correlation
In principle a measurement of the two-point correlationfunction of galaxies ξ(r) can provide useful constraints onthe cosmological parameters which govern the evolution ofthe universe. Also an understanding of its evolution withredshift and morphological type (roughly colour selectedsub–samples) can reveal the required ingredients for con-sistent models of galaxy formation (Peacock & Smith 2000,Benson et al. 2000). In the absence of any distance infor-mation, one can compute the two–point angular correlationfunction ω(θ) of the sky–projected distribution of galaxies,which is defined as the excess probability above a Poisso-nian distribution for finding a galaxy in the angular areasdΩ1 and dΩ2 separated by an angular scale θ; explicitlydP12 = n2[1 + w(θ12)] dΩ1 dΩ2. Although a less sensitivestatistic than ξ(r), ω(θ) does not suffer from redshift spacedistortions.
We have measured ω(θ) for a sub–sample of the SSS;the sub–sample is enclosed within a circular region aroundthe SGP covering roughly 3400 square degrees and containsover three million galaxies to a depth of BJ = 21. Thecorrelation estmates were computed using the simple sta-tistical estimators ω(θ)1 = 1+ < DD > / < RR > andω(θ)2 = 1+ < DD > / < DR > where < DD > repre-sents the expected number of measured galaxy–galaxy paircounts, < RR > the expected number of random–randompair counts and < DR > the expected number of galaxy–random pair counts in the angular range θ → θ + dθ.
The resultant measurements of ω(θ) for four magni-tude slices of thickness 0.58 in the range 17.0 < BJ < 19.3have been computed assuming Poissonian errors. The ampli-tude of ω(θ) increases with brightness as expected. Quan-titavely, a simple linear least squares fit to the power-law
Figure 4. Galaxy two–point correlation function computed forred and blue galaxy samples within the SGC survey (see text).
slope on scales < 1 degree gives for bright to faint slicesδ = 0.57, 0.61, 0.56 and 0.59, with errors of order ±0.02;where ω(θ) ∝ θ−δ. This absence of evolution in δ affirmsthe angular clustering meaurements from the APM survey(Maddox et al. 1990).
In Figure 4 we compare the angular clustering for redand blue, colour selected sub–samples in the magnituderange 17.0 < BJ < 18.0. We define blue galaxies to bethose with BJ − R < 0.7 and red galaxies to be those withBJ − R > 1.3; the median BJ − R for the survey is 1.1. Wefind that on scales < 1, red galaxies cluster more stronglythan blue and that on scales > 2, blue galaxies are morestrongly correlated (cf. Brown, Webster & Boyle 2000). Ourinterpretation of these two results is that red galaxies tracethe clusters and since these are high peaks in the density fieldcluster more strongly on small scales; whereas blue galaxieshave a higher propensity to be found in the field, so tracethe large filamentary structures. Further details of this workwill appear in Smith et al. (2001).
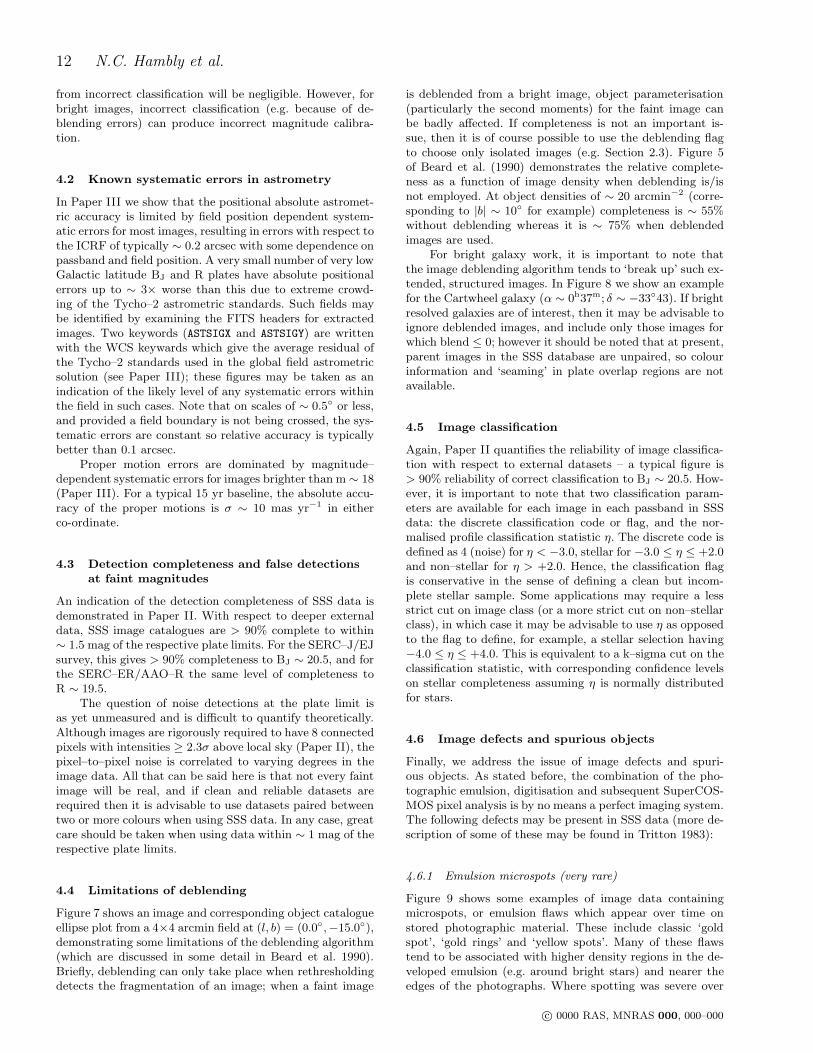
3.2.4 A survey for objects exhibiting extreme variability
The SSS survey contains R–band data at two epochs, en-abling investigation of object variability. Figure 5 shows fourexamples of sources showing extreme variability obtained us-ing strict selection criteria (e.g. in image shape and blend-ing flag) from the SGC subset. The first three objects arepresumably Galactic stellar variables (∆m > 5) and arepossibly Miras or Novae; the final example is apparentlyan old supernova (mR ∼ 14; plate epoch 1983.8) associ-ated with the edge–on Scr spiral ESO 148–20. Checks inthe database archive SIMBAD yield no known cataloguedobjects at these positions, so these are apparently new dis-coveries; many more are almost certainly present in the SSSdata.
c© 0000 RAS, MNRAS 000, 000–000
SuperCOSMOS Sky Survey I: Introduction & Description 11
Figure 5. Four examples of objects showing extreme variabilitybetween the SSS R–band observation epochs (∆m > 5).
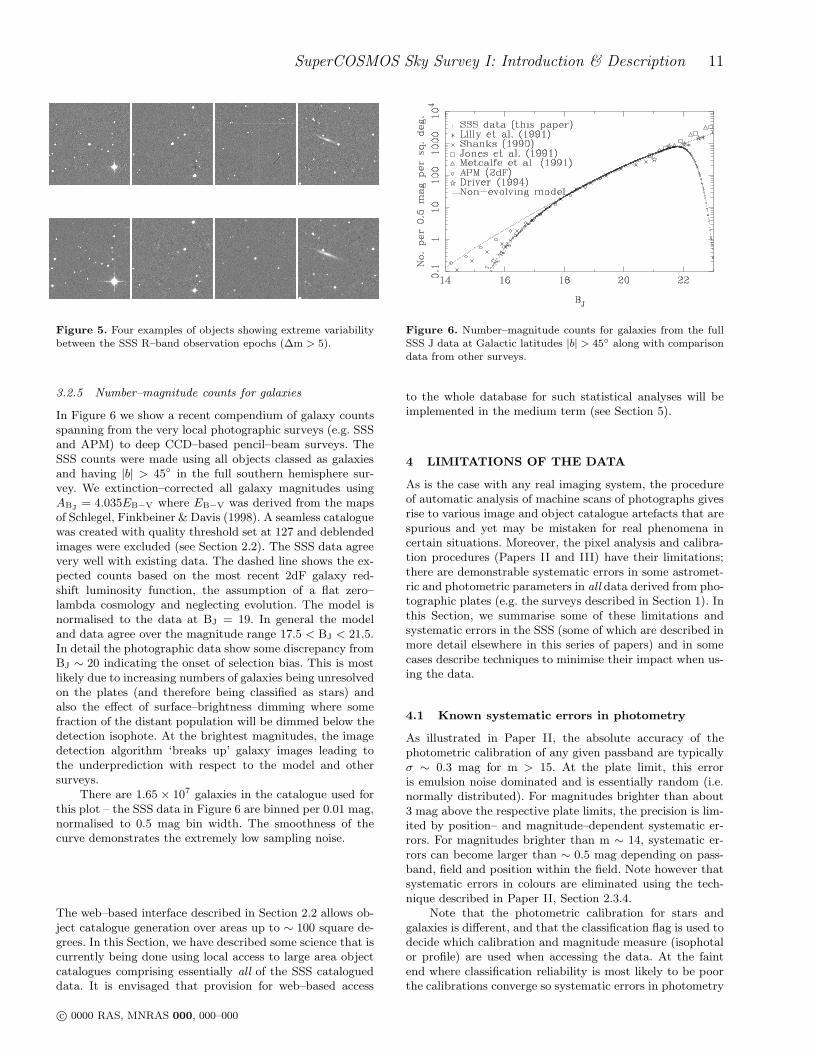
3.2.5 Number–magnitude counts for galaxies
In Figure 6 we show a recent compendium of galaxy countsspanning from the very local photographic surveys (e.g. SSSand APM) to deep CCD–based pencil–beam surveys. TheSSS counts were made using all objects classed as galaxiesand having |b| > 45 in the full southern hemisphere sur-vey. We extinction–corrected all galaxy magnitudes usingABJ
= 4.035EB−V where EB−V was derived from the mapsof Schlegel, Finkbeiner & Davis (1998). A seamless cataloguewas created with quality threshold set at 127 and deblendedimages were excluded (see Section 2.2). The SSS data agreevery well with existing data. The dashed line shows the ex-pected counts based on the most recent 2dF galaxy red-shift luminosity function, the assumption of a flat zero–lambda cosmology and neglecting evolution. The model isnormalised to the data at BJ = 19. In general the modeland data agree over the magnitude range 17.5 < BJ < 21.5.In detail the photographic data show some discrepancy fromBJ ∼ 20 indicating the onset of selection bias. This is mostlikely due to increasing numbers of galaxies being unresolvedon the plates (and therefore being classified as stars) andalso the effect of surface–brightness dimming where somefraction of the distant population will be dimmed below thedetection isophote. At the brightest magnitudes, the imagedetection algorithm ‘breaks up’ galaxy images leading tothe underprediction with respect to the model and othersurveys.
There are 1.65 × 10⁷ galaxies in the catalogue used forthis plot – the SSS data in Figure 6 are binned per 0.01 mag,normalised to 0.5 mag bin width. The smoothness of thecurve demonstrates the extremely low sampling noise.
The web–based interface described in Section 2.2 allows ob-ject catalogue generation over areas up to ∼ 100 square de-grees. In this Section, we have described some science that iscurrently being done using local access to large area objectcatalogues comprising essentially all of the SSS catalogueddata. It is envisaged that provision for web–based access
Figure 6. Number–magnitude counts for galaxies from the fullSSS J data at Galactic latitudes |b| > 45 along with comparisondata from other surveys.
to the whole database for such statistical analyses will beimplemented in the medium term (see Section 5).
4 LIMITATIONS OF THE DATA
As is the case with any real imaging system, the procedureof automatic analysis of machine scans of photographs givesrise to various image and object catalogue artefacts that arespurious and yet may be mistaken for real phenomena incertain situations. Moreover, the pixel analysis and calibra-tion procedures (Papers II and III) have their limitations;there are demonstrable systematic errors in some astromet-ric and photometric parameters in all data derived from pho-tographic plates (e.g. the surveys described in Section 1). Inthis Section, we summarise some of these limitations andsystematic errors in the SSS (some of which are described inmore detail elsewhere in this series of papers) and in somecases describe techniques to minimise their impact when us-ing the data.
4.1 Known systematic errors in photometry
As illustrated in Paper II, the absolute accuracy of thephotometric calibration of any given passband are typicallyσ ∼ 0.3 mag for m > 15. At the plate limit, this erroris emulsion noise dominated and is essentially random (i.e.normally distributed). For magnitudes brighter than about3 mag above the respective plate limits, the precision is lim-ited by position– and magnitude–dependent systematic er-rors. For magnitudes brighter than m ∼ 14, systematic er-rors can become larger than ∼ 0.5 mag depending on pass-band, field and position within the field. Note however thatsystematic errors in colours are eliminated using the tech-nique described in Paper II, Section 2.3.4.
Note that the photometric calibration for stars andgalaxies is different, and that the classification flag is used todecide which calibration and magnitude measure (isophotalor profile) are used when accessing the data. At the faintend where classification reliability is most likely to be poorthe calibrations converge so systematic errors in photometry
c© 0000 RAS, MNRAS 000, 000–000
12 N.C. Hambly et al.
from incorrect classification will be negligible. However, forbright images, incorrect classification (e.g. because of de-blending errors) can produce incorrect magnitude calibra-tion.
4.2 Known systematic errors in astrometry
In Paper III we show that the positional absolute astromet-ric accuracy is limited by field position dependent system-atic errors for most images, resulting in errors with respect tothe ICRF of typically ∼ 0.2 arcsec with some dependence onpassband and field position. A very small number of very lowGalactic latitude BJ and R plates have absolute positionalerrors up to ∼ 3× worse than this due to extreme crowd-ing of the Tycho–2 astrometric standards. Such fields maybe identified by examining the FITS headers for extractedimages. Two keywords (ASTSIGX and ASTSIGY) are writtenwith the WCS keywards which give the average residual ofthe Tycho–2 standards used in the global field astrometricsolution (see Paper III); these figures may be taken as anindication of the likely level of any systematic errors withinthe field in such cases. Note that on scales of ∼ 0.5 or less,and provided a field boundary is not being crossed, the sys-tematic errors are constant so relative accuracy is typicallybetter than 0.1 arcsec.
Proper motion errors are dominated by magnitude–dependent systematic errors for images brighter than m ∼ 18(Paper III). For a typical 15 yr baseline, the absolute accu-racy of the proper motions is σ ∼ 10 mas yr−1 in eitherco-ordinate.
4.3 Detection completeness and false detectionsat faint magnitudes
An indication of the detection completeness of SSS data isdemonstrated in Paper II. With respect to deeper externaldata, SSS image catalogues are > 90% complete to within∼ 1.5 mag of the respective plate limits. For the SERC–J/EJsurvey, this gives > 90% completeness to BJ ∼ 20.5, and forthe SERC–ER/AAO–R the same level of completeness toR ∼ 19.5.
The question of noise detections at the plate limit isas yet unmeasured and is difficult to quantify theoretically.Although images are rigorously required to have 8 connectedpixels with intensities ≥ 2.3σ above local sky (Paper II), thepixel–to–pixel noise is correlated to varying degrees in theimage data. All that can be said here is that not every faintimage will be real, and if clean and reliable datasets arerequired then it is advisable to use datasets paired betweentwo or more colours when using SSS data. In any case, greatcare should be taken when using data within ∼ 1 mag of therespective plate limits.
4.4 Limitations of deblending
Figure 7 shows an image and corresponding object catalogueellipse plot from a 4×4 arcmin field at (l, b) = (0.0,−15.0),demonstrating some limitations of the deblending algorithm(which are discussed in some detail in Beard et al. 1990).Briefly, deblending can only take place when rethresholdingdetects the fragmentation of an image; when a faint image
is deblended from a bright image, object parameterisation(particularly the second moments) for the faint image canbe badly affected. If completeness is not an important is-sue, then it is of course possible to use the deblending flagto choose only isolated images (e.g. Section 2.3). Figure 5of Beard et al. (1990) demonstrates the relative complete-ness as a function of image density when deblending is/isnot employed. At object densities of ∼ 20 arcmin−2 (corre-sponding to |b| ∼ 10 for example) completeness is ∼ 55%without deblending whereas it is ∼ 75% when deblendedimages are used.
For bright galaxy work, it is important to note thatthe image deblending algorithm tends to ‘break up’ such ex-tended, structured images. In Figure 8 we show an examplefor the Cartwheel galaxy (α ∼ 0h37m; δ ∼ −3343). If brightresolved galaxies are of interest, then it may be advisable toignore deblended images, and include only those images forwhich blend ≤ 0; however it should be noted that at present,parent images in the SSS database are unpaired, so colourinformation and ‘seaming’ in plate overlap regions are notavailable.
4.5 Image classification
Again, Paper II quantifies the reliability of image classifica-tion with respect to external datasets – a typical figure is> 90% reliability of correct classification to BJ ∼ 20.5. How-ever, it is important to note that two classification param-eters are available for each image in each passband in SSSdata: the discrete classification code or flag, and the nor-malised profile classification statistic η. The discrete code isdefined as 4 (noise) for η < −3.0, stellar for −3.0 ≤ η ≤ +2.0and non–stellar for η > +2.0. Hence, the classification flagis conservative in the sense of defining a clean but incom-plete stellar sample. Some applications may require a lessstrict cut on image class (or a more strict cut on non–stellarclass), in which case it may be advisable to use η as opposedto the flag to define, for example, a stellar selection having−4.0 ≤ η ≤ +4.0. This is equivalent to a k–sigma cut on theclassification statistic, with corresponding confidence levelson stellar completeness assuming η is normally distributedfor stars.
4.6 Image defects and spurious objects
Finally, we address the issue of image defects and spuri-ous objects. As stated before, the combination of the pho-tographic emulsion, digitisation and subsequent SuperCOS-MOS pixel analysis is by no means a perfect imaging system.The following defects may be present in SSS data (more de-scription of some of these may be found in Tritton 1983):
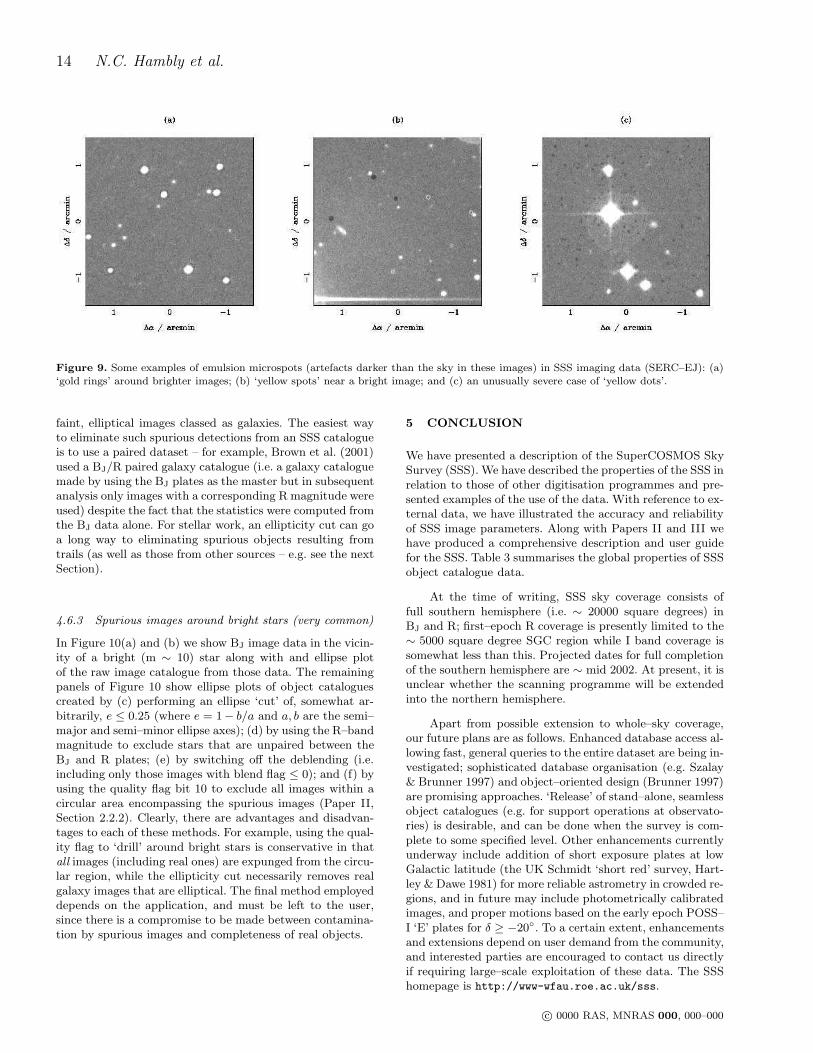
4.6.1 Emulsion microspots (very rare)
Figure 9 shows some examples of image data containingmicrospots, or emulsion flaws which appear over time onstored photographic material. These include classic ‘goldspot’, ‘gold rings’ and ‘yellow spots’. Many of these flawstend to be associated with higher density regions in the de-veloped emulsion (e.g. around bright stars) and nearer theedges of the photographs. Where spotting was severe over
c© 0000 RAS, MNRAS 000, 000–000

SuperCOSMOS Sky Survey I: Introduction & Description 13
Figure 7. Illustration of the deblending algorithm at Galactic co-ordinates (l, b) = (0.0,−15.0): (a) pixel data; (b) resulting imagedetections. Filled shapes are isolated images or images not detected as blends by the algorithm; solid line ellipses are parent images ofblends while the deblended child images are shown as dotted ellipses. When faint images are blended with bright images, the imageparameters can be adversely affected (see Beard et al. 1990).
Figure 8. Example of image ‘break–up’ from deblending of the relatively bright Cartwheel galaxy: (a) J–band pixel data; (b) imagedetections employing deblended images; and (c) image detections with deblended images ignored.
large areas of the original atlas plates we have substituteda copy plate (made soon after the original was taken anddeveloped) – see Table 1. Hence, the online digital data maydiffer from previously issued film atlases for example. Notethat in the interests of a uniform survey we have limitedsubstitution of originals by copies, and note also that whereany spotting is present at the edges of fields, the adjacentplate overlap object data are generally available. Moreover,as shown in Figure 9, because microspots for the most parttend to produce higher transmission values than the skylevel (i.e. apparent emulsion ‘holes’) they do not give riseto spurious object detections. However, one effect that has
been noticed in the data is that bright images affected by‘gold rings’ tend to be flagged as noise images by the imageclassifier, so in the very rare instances that microspots arepresent, image parameters may be affected.
4.6.2 Satellite trails (fairly common)
As an inevitable consequence of long exposures over wideangles in the modern age, many satellite trails are present onSchmidt atlas photographs. Moreover, trails resulting frommeteors and other atmospheric phenomena can be present.Under pixel analysis, trails tend to fragment into a series of
c© 0000 RAS, MNRAS 000, 000–000
14 N.C. Hambly et al.
Figure 9. Some examples of emulsion microspots (artefacts darker than the sky in these images) in SSS imaging data (SERC–EJ): (a)‘gold rings’ around brighter images; (b) ‘yellow spots’ near a bright image; and (c) an unusually severe case of ‘yellow dots’.
faint, elliptical images classed as galaxies. The easiest wayto eliminate such spurious detections from an SSS catalogueis to use a paired dataset – for example, Brown et al. (2001)used a BJ/R paired galaxy catalogue (i.e. a galaxy cataloguemade by using the BJ plates as the master but in subsequentanalysis only images with a corresponding R magnitude wereused) despite the fact that the statistics were computed fromthe BJ data alone. For stellar work, an ellipticity cut can goa long way to eliminating spurious objects resulting fromtrails (as well as those from other sources – e.g. see the nextSection).
4.6.3 Spurious images around bright stars (very common)
In Figure 10(a) and (b) we show BJ image data in the vicin-ity of a bright (m ∼ 10) star along with and ellipse plotof the raw image catalogue from those data. The remainingpanels of Figure 10 show ellipse plots of object cataloguescreated by (c) performing an ellipse ‘cut’ of, somewhat ar-bitrarily, e ≤ 0.25 (where e = 1− b/a and a, b are the semi–major and semi–minor ellipse axes); (d) by using the R–bandmagnitude to exclude stars that are unpaired between theBJ and R plates; (e) by switching off the deblending (i.e.including only those images with blend flag ≤ 0); and (f) byusing the quality flag bit 10 to exclude all images within acircular area encompassing the spurious images (Paper II,Section 2.2.2). Clearly, there are advantages and disadvan-tages to each of these methods. For example, using the qual-ity flag to ‘drill’ around bright stars is conservative in thatall images (including real ones) are expunged from the circu-lar region, while the ellipticity cut necessarily removes realgalaxy images that are elliptical. The final method employeddepends on the application, and must be left to the user,since there is a compromise to be made between contamina-tion by spurious images and completeness of real objects.
5 CONCLUSION
We have presented a description of the SuperCOSMOS SkySurvey (SSS). We have described the properties of the SSS inrelation to those of other digitisation programmes and pre-sented examples of the use of the data. With reference to ex-ternal data, we have illustrated the accuracy and reliabilityof SSS image parameters. Along with Papers II and III wehave produced a comprehensive description and user guidefor the SSS. Table 3 summarises the global properties of SSSobject catalogue data.
At the time of writing, SSS sky coverage consists offull southern hemisphere (i.e. ∼ 20000 square degrees) inBJ and R; first–epoch R coverage is presently limited to the∼ 5000 square degree SGC region while I band coverage issomewhat less than this. Projected dates for full completionof the southern hemisphere are ∼ mid 2002. At present, it isunclear whether the scanning programme will be extendedinto the northern hemisphere.
Apart from possible extension to whole–sky coverage,our future plans are as follows. Enhanced database access al-lowing fast, general queries to the entire dataset are being in-vestigated; sophisticated database organisation (e.g. Szalay& Brunner 1997) and object–oriented design (Brunner 1997)are promising approaches. ‘Release’ of stand–alone, seamlessobject catalogues (e.g. for support operations at observato-ries) is desirable, and can be done when the survey is com-plete to some specified level. Other enhancements currentlyunderway include addition of short exposure plates at lowGalactic latitude (the UK Schmidt ‘short red’ survey, Hart-ley & Dawe 1981) for more reliable astrometry in crowded re-gions, and in future may include photometrically calibratedimages, and proper motions based on the early epoch POSS–I ‘E’ plates for δ ≥ −20. To a certain extent, enhancementsand extensions depend on user demand from the community,and interested parties are encouraged to contact us directlyif requiring large–scale exploitation of these data. The SSShomepage is http://www-wfau.roe.ac.uk/sss.
c© 0000 RAS, MNRAS 000, 000–000

SuperCOSMOS Sky Survey I: Introduction & Description 15
Figure 10. Spurious objects near a bright (m=10) star: (a) J–band pixel data; (b) all images detected; (c) images left after an ellipticitycut e ≤ 0.25; (d) images having an R–band pair; (e) images left when deblending is not used; and (f) images left when using the qualityflag to exclude all detections in the vicinity of the bright star. In (b), (c), (d) and (f) deblending is used (i.e. child images of blends areshown).
c© 0000 RAS, MNRAS 000, 000–000

16 N.C. Hambly et al.
Astrometric properties: Absoluteaccuracy units
α, δ (BJ < 19) 0.1 arcsecα, δ (faint images) 0.3 arcsec
proper motion µα,δ (R < 17) 10.0 mas yr−1
µα,δ (faint images) 50.0 mas yr−1
zeropoint error µα,δ (R < 17) < 10.0 mas yr−1
zeropoint error µα,δ (R > 17) ≤ 1.0 mas yr−1
Photometric properties: Accuracyabsolute relative units
σB,R,I (< 19, 18, 17) 0.3 0.05 magσB,R,I (faint images) 0.3 0.3 magσ(B−R) (BJ < 17) 0.07 0.07 mag
σ(B−R) (faint images) 0.16 0.16 mag
Image detection/ external externalcompleteness completeness reliability
BJ < 19.5 ∼ 100% ∼ 100%BJ ∼ 21, R ∼ 19 ∼ 75% ∼ 90%
Table 3. Global properties of SSS object catalogue data (for these purposes, ‘relative’ means within restricted position and magnituderanges). For more detailed information see Papers II and III.
ACKNOWLEDGEMENTS
The SuperCOSMOS Sky Survey project owes its existenceand success to a large number of individuals. On the hard-ware side, many people at the former Royal Observatory atEdinburgh (now the United Kingdom Astronomy Technol-ogy Centre) were involved; particular thanks are due to BillCormack, Lance Miller, Magnus Paterson, Jim Herd, JanetteJameson, Tom Paul, Richard Bennett and Joel Sylvester.On the software side, we acknowledge the support of StevenBeard, Clive Davenhall, Bernard McNally and Mike Irwin.Obviously, the surveys would have been impossible withoutthe diligence of many observers at the Schmidt telescopes,and many talented photographers in the development andcopying laboratories. On the UK Schmidt side, we acknowl-edge the efforts of Malc Hartley, Ken Russell, Russell Can-non, Debi Allan, Fenella Stuart–Hamilton and Jason Cowan.Funding for the Wide Field Astronomy Unit at the Institutefor Astronomy at the University of Edinburgh is providedby the UK PPARC. We acknowledge the use of Starlink
computing facilities at the Institute for Astronomy. We areindebted to the referee, Sean Urban, for a prompt and thor-ough review of these manuscripts.
The National Geographic Society–Palomar ObservatorySky Survey (POSS–I) was made by the California Instituteof Technology with grants from the National Geographic So-ciety. The UK Schmidt Telescope was operated by the RoyalObservatory Edinburgh, with funding from the UK Scienceand Engineering Research Council (later the UK ParticlePhysics and Astronomy Research Council), until 1988 June,and thereafter by the Anglo–Australian Observatory. Theblue plates of the southern sky atlas and its equatorial ex-tension (together known as the SERC–J/EJ) as well as theEquatorial Red (ER), the second epoch (red) Survey (SESor AAO–R) and the infrared (SERC–I) Survey were taken
with the UK Schmidt Telescope. All data retrieved from theURLs described herein are subject to the copyright given inthis copyright summary. Copyright information specific toindividual plates is provided in the downloaded FITS head-ers.
REFERENCES
Barrado–y–Navascues D., Stauffer J.R., Briceno C., Patten B.,Hambly N.C., Adams J.D., 2001, ApJS, 134, 103
Beard S.M., MacGillivray H.T., Thanisch P.F., 1990, MNRAS,247, 311
Benson A.J., Cole S., Frenk C.S., Baugh C.M., Lacey C.G., 2000,MNRAS, 311, 793
Bessell M.S., 1986, PASP, 98, 1303Brown M.J.I., Webster R.L., Boyle B.J., 2000, MNRAS, 317, 782Brown M.L., Taylor A.N., Hambly N.C., Dye S., 2000, MNRAS,
submitted (astro–ph/0009499)Brunner R.J., 1997, in McLean B.J., Golombek D.A., Hayes
J.J.E., Payne H.E., eds, Proc. IAU Symp. 179, New Horizons
from Multi–wavelength Sky Surveys. Kluwer, Dordrecht, p.471
Cannon R.D., 1984, in Capaccioli M., ed., Proc. IAU Colloq.78, Astronomy with Schmidt–type Telescopes. Kluwer, Dor-drecht, p. 25
Cannon R.D., 1995, in Chapman J., Cannon R.D., Harrison S.,Hidayat B., eds, ASP Conf. Ser. Vol. 84, The Future Utilisa-tion of Schmidt Telescopes. Astron. Soc. Pac., San Francisco,p. 8
Canzian B., 1997, in McLean B.J., Golombek D.A., Hayes J.J.E.,Payne H.E., eds, Proc. IAU Symp. 179, New Horizons fromMulti–wavelength Sky Surveys. Kluwer, Dordrecht, p. 422
Capaccioli M. (ed.), 1984, Proc. IAU Colloq. 78, Astronomy withSchmidt–type Telescopes. Kluwer, Dordrecht
Chapman J., Cannon R.D., Harrison S., Hidayat B. (eds), 1995,ASP Conf. Ser. Vol. 84, The Future Utilisation of SchmidtTelescopes. Astron. Soc. Pac., San Francisco
c© 0000 RAS, MNRAS 000, 000–000
SuperCOSMOS Sky Survey I: Introduction & Description 17
Cornuelle C.S., Aldering G., Sourov A., Humphreys R.M., Larsen
J.A., Cabanela J., 1997, in McLean B.J., Golombek D.A.,Hayes J.J.E., Payne H.E., eds, Proc. IAU Symp. 179, NewHorizons from Multi–wavelength Sky Surveys. Kluwer, Dor-drecht, p. 467
Davenhall A.C., 2000, Starlink System Note No. 75.1: Writ-ing Catalogue and Image Servers for GAIA and CURSA.CCLRC/Rutherford Appleton Laboratory, PPARC
Deutsch E.W., 1999, AJ, 118, 1882Draper P.W., Eaton, N., 1999, Starlink User Note No. 109.10:
PISA – Position, Intensityand Shape Analysis. CCLRC/Rutherford Appleton Labora-
tory, PPARCDraper P.W., 1999, Starlink User Note No. 214.5: GAIA – Graph-
ical Astronomy & Image Analysis Tool. CCLRC/Rutherford
Appleton Laboratory, PPARCDjorgovski S.G., de Carvalho R.R., Gal R.R., Pahre M.A.,
Scaramella R., Longo G., 1997, in McLean B.J., GolombekD.A., Hayes J.J.E., Payne H.E., eds, Proc. IAU Symp. 179,
New Horizons from Multi–wavelength Sky Surveys. Kluwer,Dordrecht, p. 424
Drinkwater M.J., Barnes D.G., Ellison S.L., 1995, PASA, 12, 248
Driver S.P., 1994, PhD Thesis, Univ. Cardiff
Evans D.W., 1989, A&AS, 78, 249
Galama T.J. et al., 1998, Nature, 395, 670
Hambly N.C., Miller L., MacGillivray H.T., Herd J.T., CormackW.A., 1998, MNRAS, 298, 897
Hambly N.C., Read M.A., 2000, Anglo–Australian ObservatoryNewsletter No. 92. Anglo–Australian Observatory, Sydney, p.16
Hambly N.C., 2001, in Shipman H., Provencal J.L., eds, ASPConf. Ser. Vol. 226, Proceedings of the 12th European Work-shop on White Dwarfs. Astron. Soc. Pac., San Francisco, p.381
Hambly N.C., Irwin M.J., MacGillivray H.T., 2001a, MNRAS,submitted (Paper II)
Hambly N.C., Davenhall A.C., Irwin M.J., MacGillivray H.T.,2001b, MNRAS, submitted (Paper III)
Hartley M., Dawe J.A., 1981, PASA, 4, 251
Hawkins M.R.S., 1992, in MacGillivray H.T., Thomson E.B., eds,Digitised Optical Sky Surveys. Kluwer, Dordrecht, p. 147
Hodgkin S.T., Oppenheimer B.R., Hambly N.C., Jameson R.F.,Smartt S.J., Steele I.A., 2000, Nature, 403, 57
Høg E., Fabricius C., Makarov V.V., Urban S.E., Corbin T.E.,Wycoff G.L., Bastian U., Schwekendiek P., Wicenec A., 2000,A&A, 355 L27
Ibata R., Irwin M.J., Bienayme O., Scholz R., Guibert J., 2000,ApJ, 532, L41
Irwin M.J., McMahon R., 1992, in MacGillivray H.T., ed., IAUWorking Group on Wide–Field Imaging, Newsletter No. 2, p.31
Jeffries R.D., Totten E.J., Stauffer J.R., Barrado–y–NavascueesD., Hambly N.C., 2000, in Pallavicini R., Micela G., SciortinoS., eds, ASP Conf. Ser. Vol. 198, Proceedings of the conferenceon Stellar Clusters and Associations: Convection, Rotationand Dynamos. Astron. Soc. Pac., San Francisco, p. 281
Jenkner H., Russell J.L., Lasker B.M., 1988, in Barbat D., EddyJ.A., Eichhorn H.K., Upgren A.R., eds., IAU Symp. 133, Map-ping the Sky. Kluwer, Dordecht, p. 239
Jenkner H., Lasker B.M., Sturch C.R., McLean B.J., Shara M.M.,Russell J.L., 1990, AJ, 99, 2082
Jones L.R., Fong R., Shanks T., Ellis R.S., Peterson B.A., 1991,MNRAS, 249, 481
Jonker P.G., Fender R.P., Hambly N.C., van der Klis M., 2000,MNRAS, 315, L57
Kaiser N., 2000, ApJ, 537, 555
Kennefick J.D., de Carvalho R.R., Djorgovski S.G., Wilber M.M.,Dickson E.S., Weit N., Fayyad U., Roden J., 1995, AJ, 110,
78
Kibblewhite E.J., Bridgeland M.T., Bunclark P., Irwin M.J.,1984, in Klingsmith, D.A., ed., Proceedings of the Astro-nomical Microdensitometry Conference. NASA Scientific andTechnical Information Branch, Washington, p. 277
Kleinmann S.G., et al., 1994, Ap&SS, 217, 11
Klingsmith D.A. (ed.), 1984, Proceedings of the Astronomical Mi-crodensitometry Conference. NASA Scientific and TechnicalInformation Branch, Washington
Lankford J., 1984, in Gingerich O., ed., The General History ofAstronomy, Part 4A: Astrophysics & Twentieth Century As-tronomy to 1950. Cambridge Univ. Press, Cambridge, p. 16
Lasker B.M., Sturch C.R., McLean B.J., Russell J.L., Jenkner H.,Shara M.M., 1990, AJ, 99, 2019
Lasker B.M., 1992, in MacGillivray H.T., Thomson E.B., eds,Digitised Optical Sky Surveys. Kluwer, Dordrecht, p. 87
Lasker B.M., McLean B.J., Jenkner H., Lattanzi M.G., SpagnaA., 1995, in ESA SP–379, Future Possibilities for Astronomyin Space. ESA Scientific & Technical Publications Branch,Noordwijk, p. 137
Lasker B.M., 1995, PASP, 107, 763
Lilly S.J., Cowie L.L., Gardener J.P., 1991, ApJ, 369, L79
Luyten W.J., 1979, NLTT Catalog, Univ. Minnesota Press, Min-neapolis
Ma C., Arias E.F., Eubanks T.M., Fey A.L., Gontier A.-M., Ja-cobs C.S., Sovers O.J., Archinal B.A., Charlot P., 1998, AJ,116, 516
MacGillivray H.T., Stobie R.S., 1984, Vistas in Astronomy, 27,433
MacGillivray H.T., Thomson E.B. (eds.), 1992, Digitised OpticalSky Surveys. Kluwer, Dordrecht
MacGillivray H.T., Thomson E.B., Lasker B.M., Reid I.N., MalinD.F., West R.M., Lorenz H. (eds.), 1994, IAU Symp. 161:Astronomy From Wide–Field Imaging, Kluwer, Dordrecht
Maddox S.J., Efstathiou G., Sutherland W.J., Loveday J., 1990,MNRAS, 242, 43P
McLean B.J., Golombek D.A., Hayes J.J.E., Payne H.E. (eds.),1997a, Proc. IAU Symp. 179, New Horizons from Multi–Wavelength Sky Surveys. Kluwer, Dordrecht
McLean B.J., Hawkins G., Spagna A., Lattanzi M., Lasker B.M.,Jenkner H., White R.I., 1997b, in McLean B.J., GolombekD.A., Hayes J.J.E., Payne H.E., eds, Proc. IAU Symp. 179,New Horizons from Multi–wavelength Sky Surveys. Kluwer,Dordrecht, p. 431
Metcalfe N., Shanks T., Fong R., Jones L.R., 1991, MNRAS, 249,498
Miller L., Cormack W.A., Paterson M.G., Beard S.M., LawrenceL., 1992, in MacGillivray H.T., Thomson E.B., eds, DigitisedOptical Sky Surveys. Kluwer, Dordrecht, p. 133
Minkowski R.L., Abell G.O., 1963, in Strand K.A., ed., Starsand Stellar Systems Vol. III: Basic Astronomical Data. Univ.Chicago Press, Chicago, p. 481
Monet D.G., 1998, BAAS, 30, 1427
Morgan D.H., Tritton S.B., Savage A., Hartley M., Cannon R.D.,1992, in MacGillivray H.T., Thomson E.B., eds, Digitised Op-tical Sky Surveys. Kluwer, Dordrecht, p. 11
Morgan D.H., 1995, in Chapman J., Cannon R.D., Harrison S.,Hidayat B., eds, ASP Conf. Ser. Vol. 84, The Future Utilisa-tion of Schmidt Telescopes. Astron. Soc. Pac., San Francisco,p. 137
Murray C.A., Nicholson W., 1975, in de Jager C., NieuwenhuijzenH., eds, Image Processing Techniques in Astronomy. Reidel,Dordrecht, p. 171
Oppenheimer B.R., Hambly N.C., Digby A.P., Hodgkin S.T.,2001, Science, 292, 698
Peacock J.A., Smith R.E., 2000, MNRAS, 318, 1144
Pennington R.L., Humphreys R.M., Odewahn S.C., Zumach W.,Thurmes P.M., 1993, PASP, 105, 521
c© 0000 RAS, MNRAS 000, 000–000
18 N.C. Hambly et al.
Preibisch T., Zinnecker H., 1999, AJ, 117, 2381
Reid I.N., Brewer C., Brucato R.J., McKinley W.R., Maury A.,Mendenhall D., Mould J.R., Mueller J., Neugebeuer G., Phin-ney J., Sargent W.L.W., Schombert J., Thicksten R., 1991,PASP, 103, 661
Russell J.L., Lasker B.M., McLean B.J., Sturch C.R., Jenkner H.,1990, AJ, 99, 2059
Schlegel D., Finkbeiner D., Davis M., 1998, ApJ, 500, 525Shanks T., 1990, Bowyer S.C., Leinert C., Proc. IAU Symp. 139,
Galactic and Extragalactic Background Radiation. Kluwer,Dordrecht, p. 269
Smith R.E. et al., 2001, in preparationStairs I.H. et al., 2001, MNRAS, 325, 979Szalay A.S., Brunner R.J., 1997, in McLean B.J., Golombek D.A.,
Hayes J.J.E., Payne H.E., eds, Proc. IAU Symp. 179, NewHorizons from Multi–wavelength Sky Surveys. Kluwer, Dor-drecht, p. 455
Tritton S.B., 1983, United Kingdom Schmidt Telescope Hand-book. ROE, Edinburgh
Urban S.E., Corbin T.E., Wycoff G.L., 1998, AJ, 115, 2161Weir N., 1995, PhD Thesis, JPL/CaltechWest R.M., 1984, in Capaccioli M., ed., Proc. IAU Colloq. 78, As-
tronomy with Schmidt–type Telescopes. Kluwer, Dordrecht,p. 13
White R.L., Postman M., Lattanzi M.G., 1992, in MacGillivrayH.T., Thomson E.B., eds, Digitised Optical Sky Surveys.Kluwer, Dordrecht, p. 167
Yentis D.G., Cruddace R.G., Gursky H., Stuart B.V., Wallin J.F.,MacGillivray H.T., Collins C.A., 1992, in MacGillivray H.T.,Thomson E.B., eds, Digitised Optical Sky Surveys. Kluwer,Dordrecht, p. 67
York D.G. et al., 2000, AJ, 120, 1579
This paper has been produced using the Royal AstronomicalSociety/Blackwell Science LATEX style file.
c© 0000 RAS, MNRAS 000, 000–000